Ward County, TX Map & Demographics
Ward County Map
Ward County Overview
$30,854
PER CAPITA INCOME
$72,233
AVG FAMILY INCOME
$70,771
AVG HOUSEHOLD INCOME
58.8%
WAGE / INCOME GAP [ % ]
41.2¢/ $1
WAGE / INCOME GAP [ $ ]
$12,578
FAMILY INCOME DEFICIT
0.42
INEQUALITY / GINI INDEX
11,347
TOTAL POPULATION
5,732
MALE POPULATION
5,615
FEMALE POPULATION
102.08
MALES / 100 FEMALES
97.96
FEMALES / 100 MALES
35.2
MEDIAN AGE
3.1
AVG FAMILY SIZE
2.6
AVG HOUSEHOLD SIZE
5,409
LABOR FORCE [ PEOPLE ]
64.3%
PERCENT IN LABOR FORCE
5.5%
UNEMPLOYMENT RATE
Ward County Area Codes
Income in Ward County
Income Overview in Ward County
Per Capita Income in Ward County is $30,854, while median incomes of families and households are $72,233 and $70,771 respectively.
| Characteristic | Number | Measure |
| Per Capita Income | 11,347 | $30,854 |
| Median Family Income | 3,225 | $72,233 |
| Mean Family Income | 3,225 | $93,345 |
| Median Household Income | 4,264 | $70,771 |
| Mean Household Income | 4,264 | $89,224 |
| Income Deficit | 3,225 | $12,578 |
| Wage / Income Gap (%) | 11,347 | 58.79% |
| Wage / Income Gap ($) | 11,347 | 41.21¢ per $1 |
| Gini / Inequality Index | 11,347 | 0.42 |
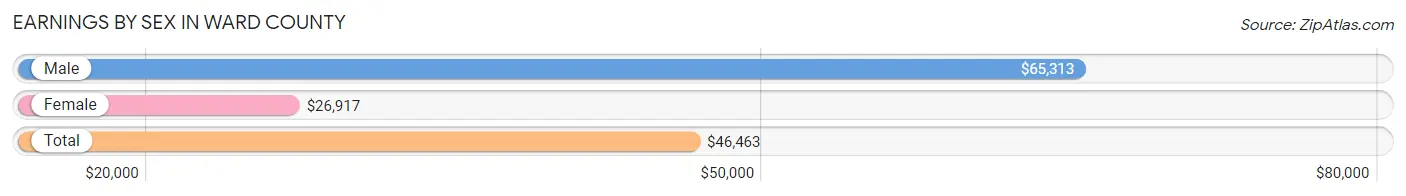
Earnings by Sex in Ward County
Average Earnings in Ward County are $46,463, $65,313 for men and $26,917 for women, a difference of 58.8%.
| Sex | Number | Average Earnings |
| Male | 3,165 (58.8%) | $65,313 |
| Female | 2,222 (41.2%) | $26,917 |
| Total | 5,387 (100.0%) | $46,463 |
Earnings by Sex by Income Bracket in Ward County
The most common earnings brackets in Ward County are $75,000 to $99,999 for men (711 | 22.5%) and $2,499 or less for women (231 | 10.4%).
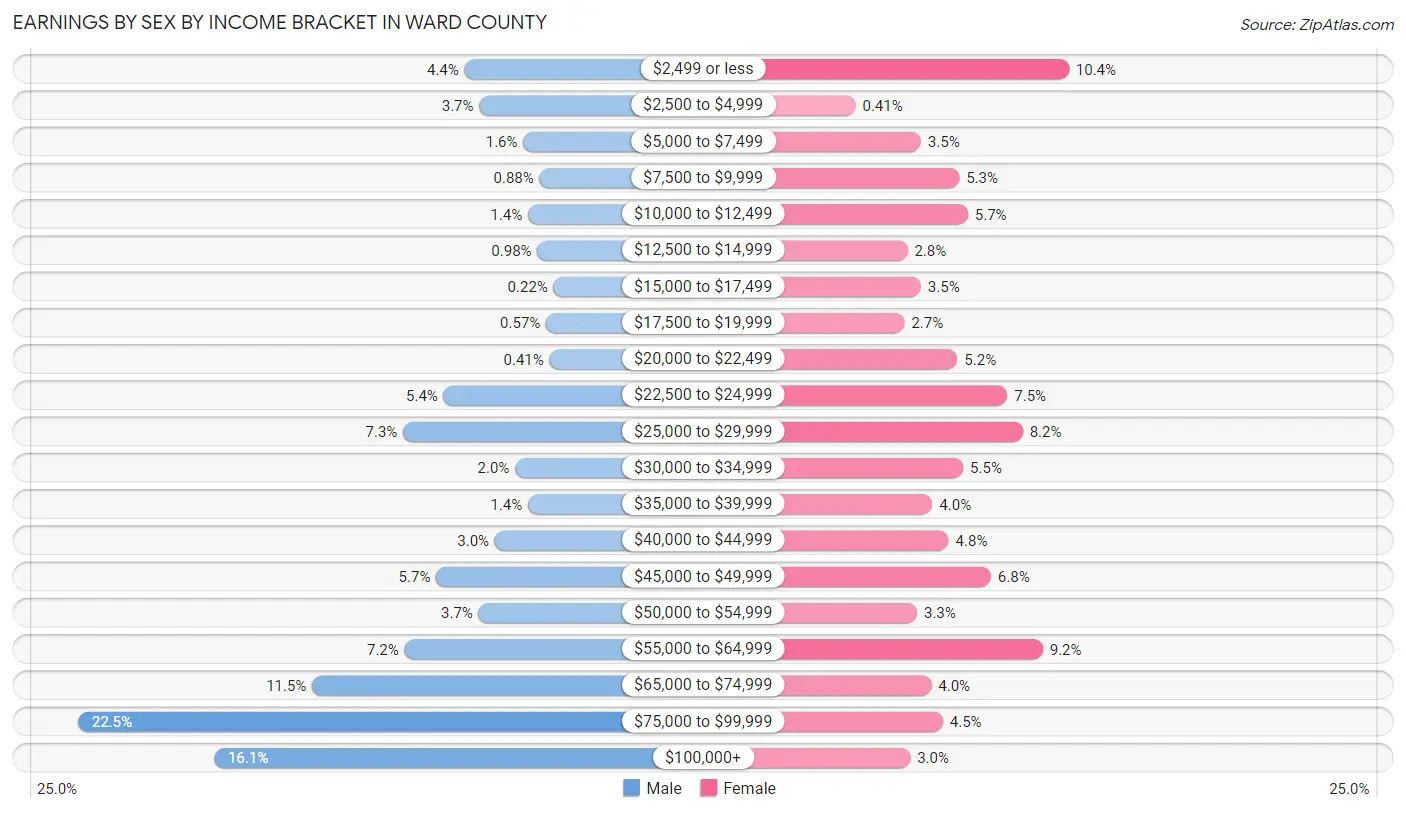
| Income | Male | Female |
| $2,499 or less | 139 (4.4%) | 231 (10.4%) |
| $2,500 to $4,999 | 117 (3.7%) | 9 (0.4%) |
| $5,000 to $7,499 | 52 (1.6%) | 77 (3.5%) |
| $7,500 to $9,999 | 28 (0.9%) | 117 (5.3%) |
| $10,000 to $12,499 | 45 (1.4%) | 126 (5.7%) |
| $12,500 to $14,999 | 31 (1.0%) | 63 (2.8%) |
| $15,000 to $17,499 | 7 (0.2%) | 77 (3.5%) |
| $17,500 to $19,999 | 18 (0.6%) | 60 (2.7%) |
| $20,000 to $22,499 | 13 (0.4%) | 115 (5.2%) |
| $22,500 to $24,999 | 170 (5.4%) | 167 (7.5%) |
| $25,000 to $29,999 | 230 (7.3%) | 183 (8.2%) |
| $30,000 to $34,999 | 64 (2.0%) | 121 (5.4%) |
| $35,000 to $39,999 | 45 (1.4%) | 89 (4.0%) |
| $40,000 to $44,999 | 94 (3.0%) | 106 (4.8%) |
| $45,000 to $49,999 | 181 (5.7%) | 150 (6.8%) |
| $50,000 to $54,999 | 118 (3.7%) | 73 (3.3%) |
| $55,000 to $64,999 | 228 (7.2%) | 204 (9.2%) |
| $65,000 to $74,999 | 365 (11.5%) | 88 (4.0%) |
| $75,000 to $99,999 | 711 (22.5%) | 100 (4.5%) |
| $100,000+ | 509 (16.1%) | 66 (3.0%) |
| Total | 3,165 (100.0%) | 2,222 (100.0%) |
Earnings by Sex by Educational Attainment in Ward County
Average earnings in Ward County are $69,312 for men and $33,428 for women, a difference of 51.8%. Men with an educational attainment of college or associate's degree enjoy the highest average annual earnings of $88,076, while those with high school diploma education earn the least with $48,494. Women with an educational attainment of graduate degree earn the most with the average annual earnings of $101,111, while those with high school diploma education have the smallest earnings of $21,654.
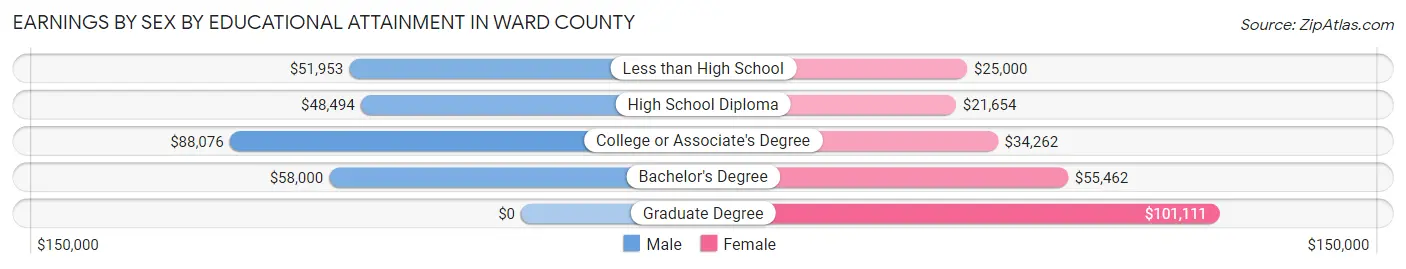
| Educational Attainment | Male Income | Female Income |
| Less than High School | $51,953 | $25,000 |
| High School Diploma | $48,494 | $21,654 |
| College or Associate's Degree | $88,076 | $34,262 |
| Bachelor's Degree | $58,000 | $55,462 |
| Graduate Degree | - | - |
| Total | $69,312 | $33,428 |
Family Income in Ward County
Family Income Brackets in Ward County
According to the Ward County family income data, there are 671 families falling into the $100,000 to $149,999 income range, which is the most common income bracket and makes up 20.8% of all families. Conversely, the $10,000 to $14,999 income bracket is the least frequent group with only 90 families (2.8%) belonging to this category.
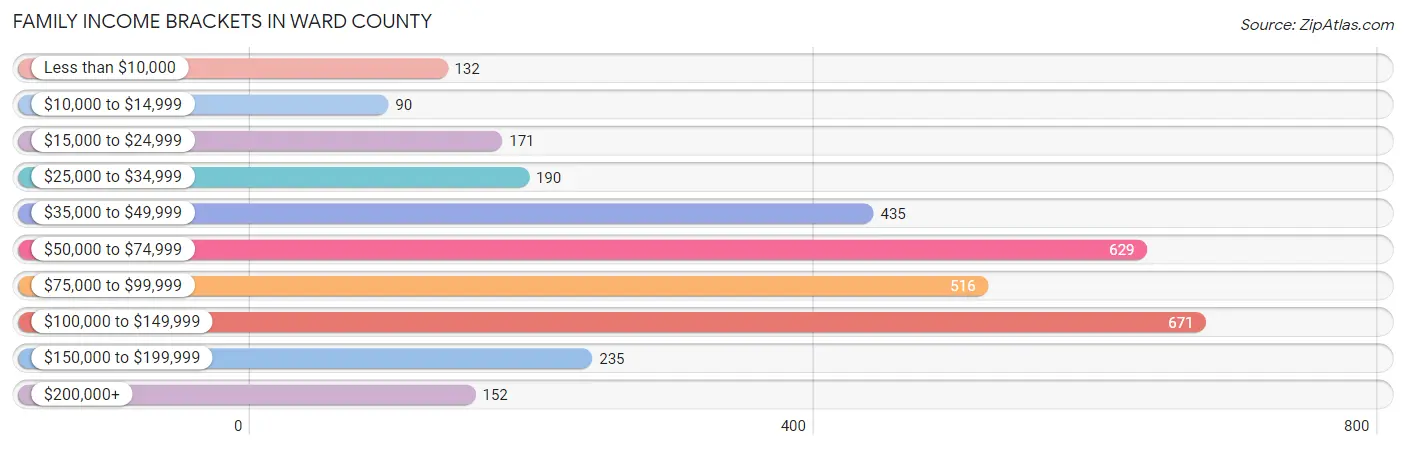
| Income Bracket | # Families | % Families |
| Less than $10,000 | 132 | 4.1% |
| $10,000 to $14,999 | 90 | 2.8% |
| $15,000 to $24,999 | 171 | 5.3% |
| $25,000 to $34,999 | 190 | 5.9% |
| $35,000 to $49,999 | 435 | 13.5% |
| $50,000 to $74,999 | 629 | 19.5% |
| $75,000 to $99,999 | 516 | 16.0% |
| $100,000 to $149,999 | 671 | 20.8% |
| $150,000 to $199,999 | 235 | 7.3% |
| $200,000+ | 152 | 4.7% |
Family Income by Famaliy Size in Ward County
5-person families (359 | 11.1%) account for the highest median family income in Ward County with $108,080 per family, while 2-person families (1,285 | 39.8%) have the highest median income of $29,819 per family member.
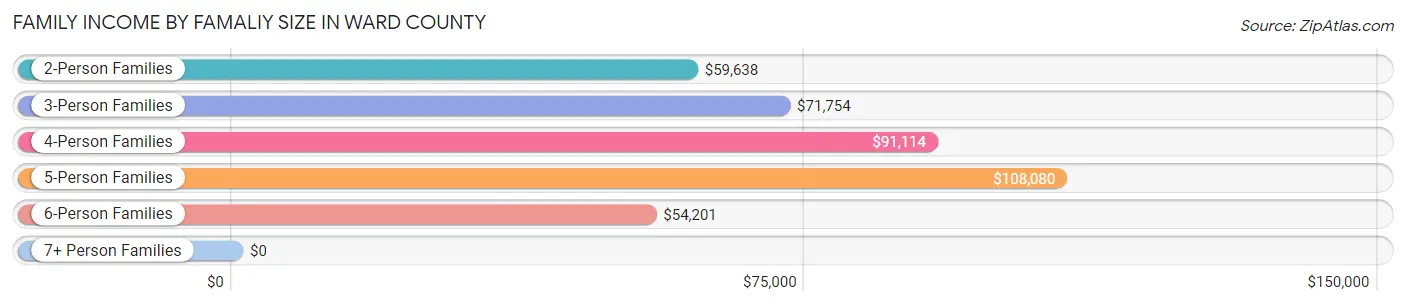
| Income Bracket | # Families | Median Income |
| 2-Person Families | 1,285 (39.8%) | $59,638 |
| 3-Person Families | 707 (21.9%) | $71,754 |
| 4-Person Families | 659 (20.4%) | $91,114 |
| 5-Person Families | 359 (11.1%) | $108,080 |
| 6-Person Families | 83 (2.6%) | $54,201 |
| 7+ Person Families | 132 (4.1%) | $0 |
| Total | 3,225 (100.0%) | $72,233 |
Family Income by Number of Earners in Ward County
The median family income in Ward County is $72,233, with families comprising 3+ earners (374) having the highest median family income of $138,322, while families with no earners (472) have the lowest median family income of $43,459, accounting for 11.6% and 14.6% of families, respectively.

| Number of Earners | # Families | Median Income |
| No Earners | 472 (14.6%) | $43,459 |
| 1 Earner | 1,119 (34.7%) | $54,087 |
| 2 Earners | 1,260 (39.1%) | $96,513 |
| 3+ Earners | 374 (11.6%) | $138,322 |
| Total | 3,225 (100.0%) | $72,233 |
Household Income in Ward County
Household Income Brackets in Ward County
With 831 households falling in the category, the $100,000 to $149,999 income range is the most frequent in Ward County, accounting for 19.5% of all households. In contrast, only 136 households (3.2%) fall into the $10,000 to $14,999 income bracket, making it the least populous group.
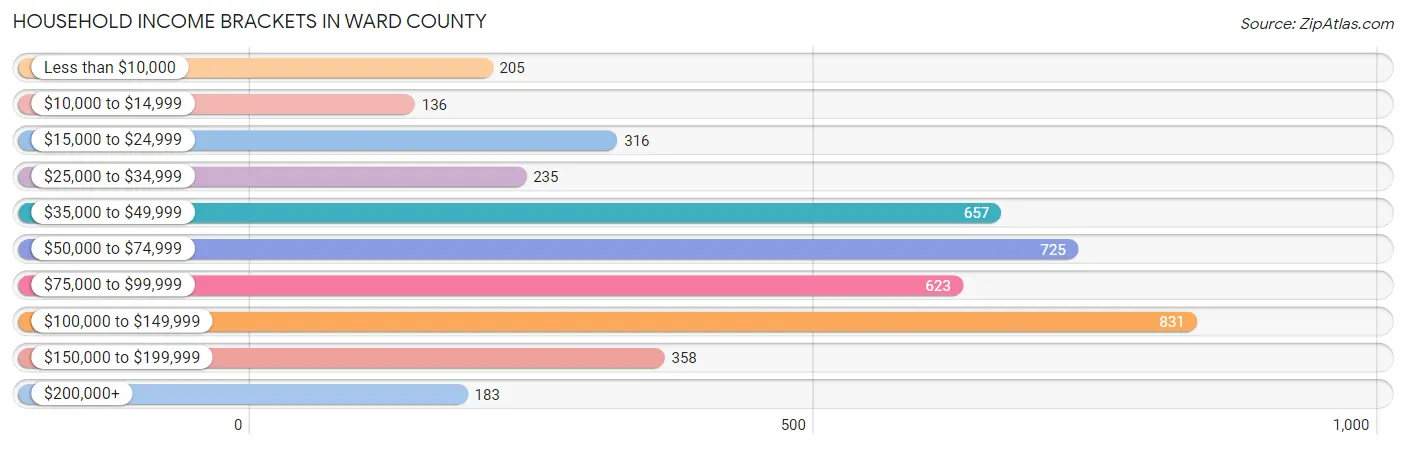
| Income Bracket | # Households | % Households |
| Less than $10,000 | 205 | 4.8% |
| $10,000 to $14,999 | 136 | 3.2% |
| $15,000 to $24,999 | 316 | 7.4% |
| $25,000 to $34,999 | 235 | 5.5% |
| $35,000 to $49,999 | 657 | 15.4% |
| $50,000 to $74,999 | 725 | 17.0% |
| $75,000 to $99,999 | 623 | 14.6% |
| $100,000 to $149,999 | 831 | 19.5% |
| $150,000 to $199,999 | 358 | 8.4% |
| $200,000+ | 183 | 4.3% |
Household Income by Householder Age in Ward County
The median household income in Ward County is $70,771, with the highest median household income of $90,463 found in the 45 to 64 years age bracket for the primary householder. A total of 1,439 households (33.8%) fall into this category. Meanwhile, the 15 to 24 years age bracket for the primary householder has the lowest median household income of $0, with 137 households (3.2%) in this group.
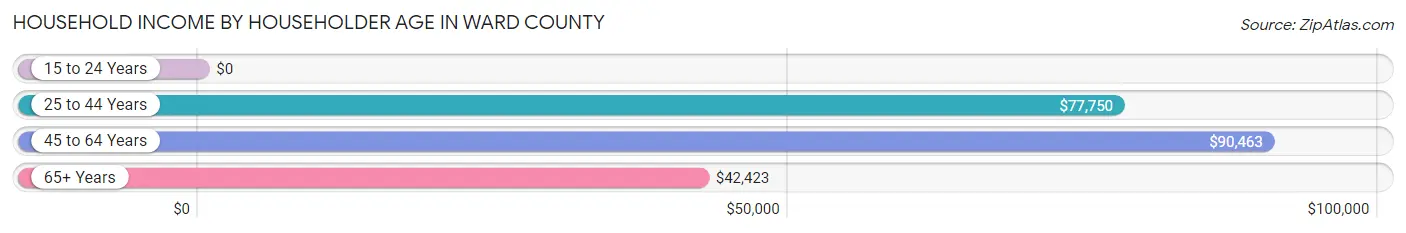
| Income Bracket | # Households | Median Income |
| 15 to 24 Years | 137 (3.2%) | $0 |
| 25 to 44 Years | 1,714 (40.2%) | $77,750 |
| 45 to 64 Years | 1,439 (33.8%) | $90,463 |
| 65+ Years | 974 (22.8%) | $42,423 |
| Total | 4,264 (100.0%) | $70,771 |
Poverty in Ward County
Income Below Poverty by Sex and Age in Ward County
With 12.5% poverty level for males and 14.8% for females among the residents of Ward County, 6 to 11 year old males and 6 to 11 year old females are the most vulnerable to poverty, with 179 males (27.6%) and 184 females (35.1%) in their respective age groups living below the poverty level.
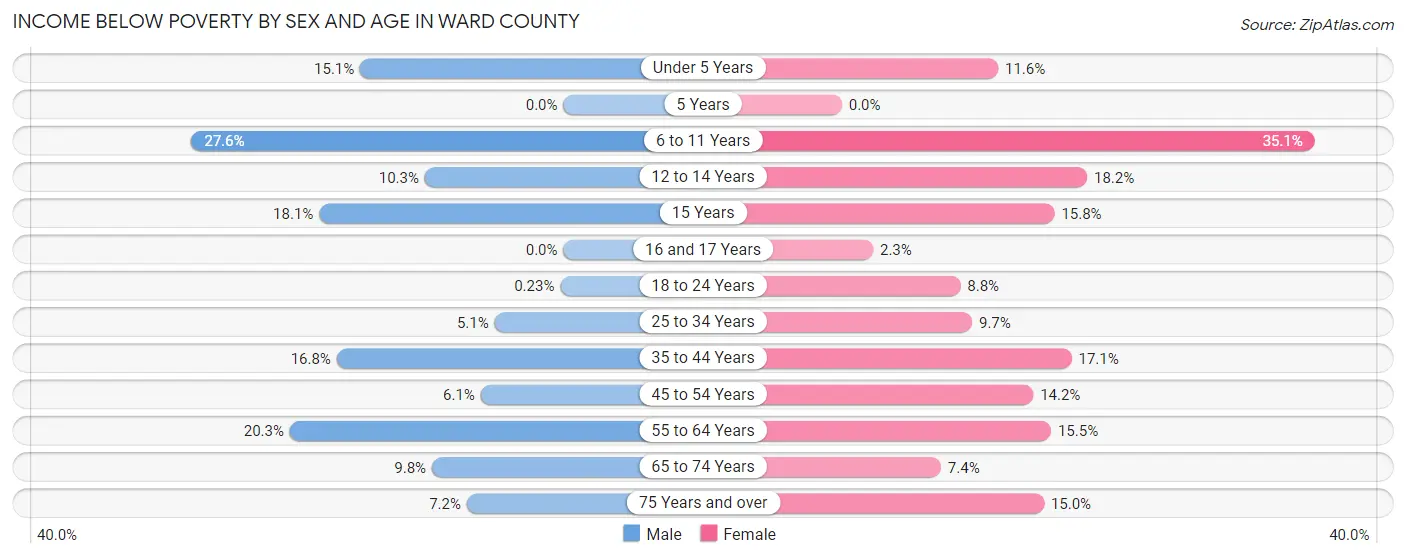
| Age Bracket | Male | Female |
| Under 5 Years | 62 (15.1%) | 53 (11.6%) |
| 5 Years | 0 (0.0%) | 0 (0.0%) |
| 6 to 11 Years | 179 (27.6%) | 184 (35.1%) |
| 12 to 14 Years | 21 (10.3%) | 71 (18.2%) |
| 15 Years | 31 (18.1%) | 9 (15.8%) |
| 16 and 17 Years | 0 (0.0%) | 6 (2.3%) |
| 18 to 24 Years | 1 (0.2%) | 36 (8.8%) |
| 25 to 34 Years | 41 (5.1%) | 65 (9.7%) |
| 35 to 44 Years | 151 (16.8%) | 131 (17.1%) |
| 45 to 54 Years | 44 (6.1%) | 79 (14.2%) |
| 55 to 64 Years | 119 (20.3%) | 98 (15.5%) |
| 65 to 74 Years | 37 (9.8%) | 31 (7.4%) |
| 75 Years and over | 19 (7.2%) | 62 (15.0%) |
| Total | 705 (12.5%) | 825 (14.8%) |
Income Above Poverty by Sex and Age in Ward County
According to the poverty statistics in Ward County, males aged 5 years and females aged 5 years are the age groups that are most secure financially, with 100.0% of males and 100.0% of females in these age groups living above the poverty line.
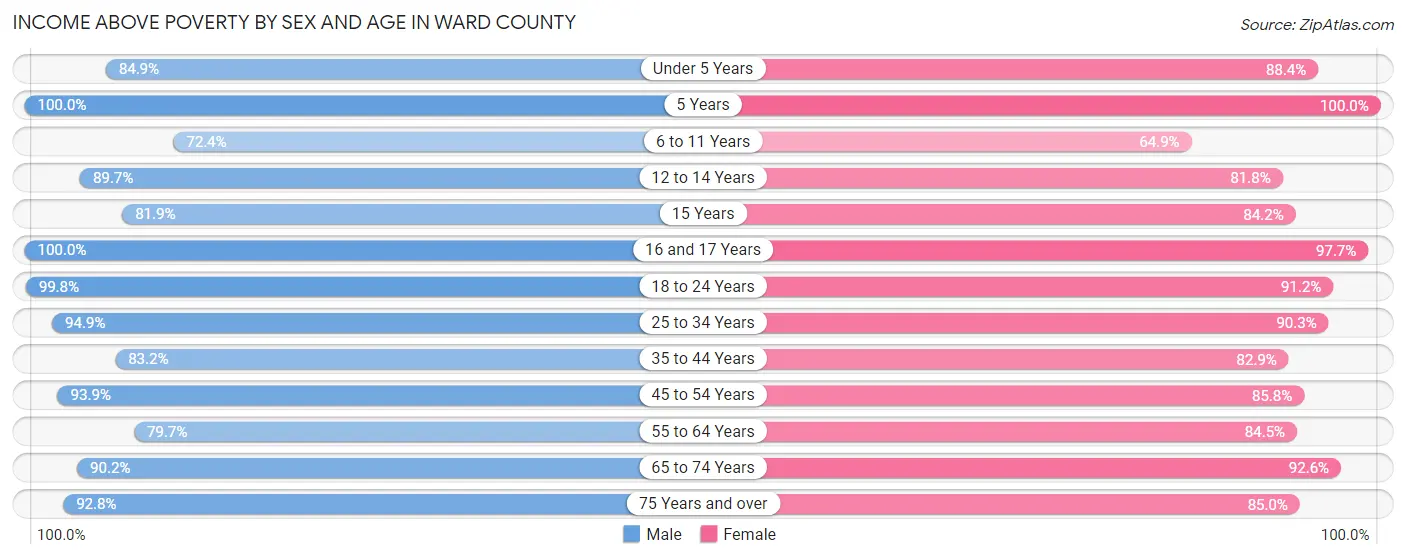
| Age Bracket | Male | Female |
| Under 5 Years | 349 (84.9%) | 404 (88.4%) |
| 5 Years | 47 (100.0%) | 22 (100.0%) |
| 6 to 11 Years | 469 (72.4%) | 340 (64.9%) |
| 12 to 14 Years | 183 (89.7%) | 319 (81.8%) |
| 15 Years | 140 (81.9%) | 48 (84.2%) |
| 16 and 17 Years | 94 (100.0%) | 253 (97.7%) |
| 18 to 24 Years | 435 (99.8%) | 373 (91.2%) |
| 25 to 34 Years | 761 (94.9%) | 607 (90.3%) |
| 35 to 44 Years | 746 (83.2%) | 637 (82.9%) |
| 45 to 54 Years | 673 (93.9%) | 477 (85.8%) |
| 55 to 64 Years | 467 (79.7%) | 533 (84.5%) |
| 65 to 74 Years | 342 (90.2%) | 390 (92.6%) |
| 75 Years and over | 246 (92.8%) | 351 (85.0%) |
| Total | 4,952 (87.5%) | 4,754 (85.2%) |
Income Below Poverty Among Married-Couple Families in Ward County
The poverty statistics for married-couple families in Ward County show that 6.0% or 141 of the total 2,361 families live below the poverty line. Families with 5 or more children have the highest poverty rate of 49.1%, comprising of 28 families. On the other hand, families with 1 or 2 children have the lowest poverty rate of 1.5%, which includes 12 families.
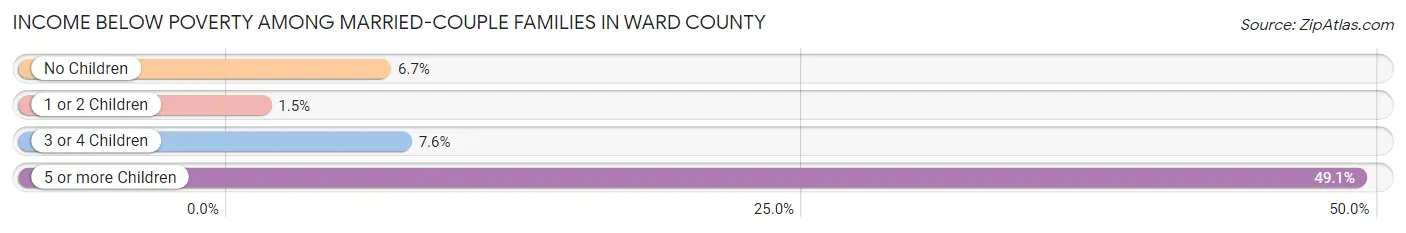
| Children | Above Poverty | Below Poverty |
| No Children | 1,107 (93.3%) | 79 (6.7%) |
| 1 or 2 Children | 815 (98.6%) | 12 (1.5%) |
| 3 or 4 Children | 269 (92.4%) | 22 (7.6%) |
| 5 or more Children | 29 (50.9%) | 28 (49.1%) |
| Total | 2,220 (94.0%) | 141 (6.0%) |
Income Below Poverty Among Single-Parent Households in Ward County
According to the poverty data in Ward County, 17.2% or 65 single-father households and 31.4% or 153 single-mother households are living below the poverty line. Among single-father households, those with no children have the highest poverty rate, with 16 households (20.5%) experiencing poverty. Likewise, among single-mother households, those with 3 or 4 children have the highest poverty rate, with 91 households (63.2%) falling below the poverty line.
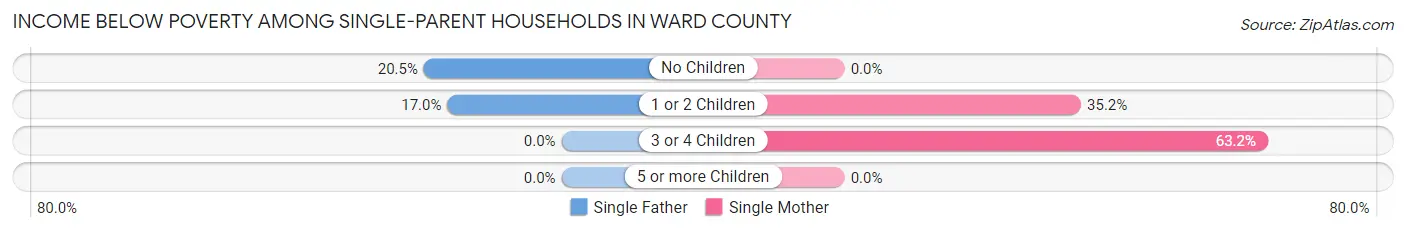
| Children | Single Father | Single Mother |
| No Children | 16 (20.5%) | 0 (0.0%) |
| 1 or 2 Children | 49 (17.0%) | 62 (35.2%) |
| 3 or 4 Children | 0 (0.0%) | 91 (63.2%) |
| 5 or more Children | 0 (0.0%) | 0 (0.0%) |
| Total | 65 (17.2%) | 153 (31.4%) |
Income Below Poverty Among Married-Couple vs Single-Parent Households in Ward County
The poverty data for Ward County shows that 141 of the married-couple family households (6.0%) and 218 of the single-parent households (25.2%) are living below the poverty level. Within the married-couple family households, those with 5 or more children have the highest poverty rate, with 28 households (49.1%) falling below the poverty line. Among the single-parent households, those with 3 or 4 children have the highest poverty rate, with 91 household (58.7%) living below poverty.
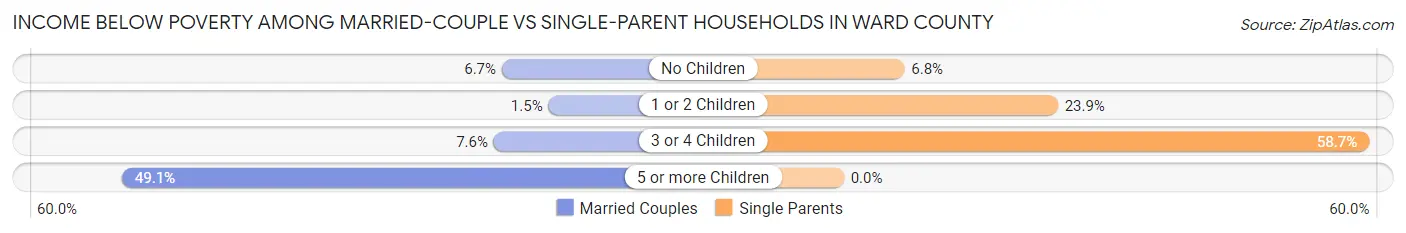
| Children | Married-Couple Families | Single-Parent Households |
| No Children | 79 (6.7%) | 16 (6.8%) |
| 1 or 2 Children | 12 (1.5%) | 111 (23.9%) |
| 3 or 4 Children | 22 (7.6%) | 91 (58.7%) |
| 5 or more Children | 28 (49.1%) | 0 (0.0%) |
| Total | 141 (6.0%) | 218 (25.2%) |
Race in Ward County
The most populous races in Ward County are White / Caucasian (8,498 | 74.9%), Hispanic or Latino (6,317 | 55.7%), and Some other Race (1,247 | 11.0%).
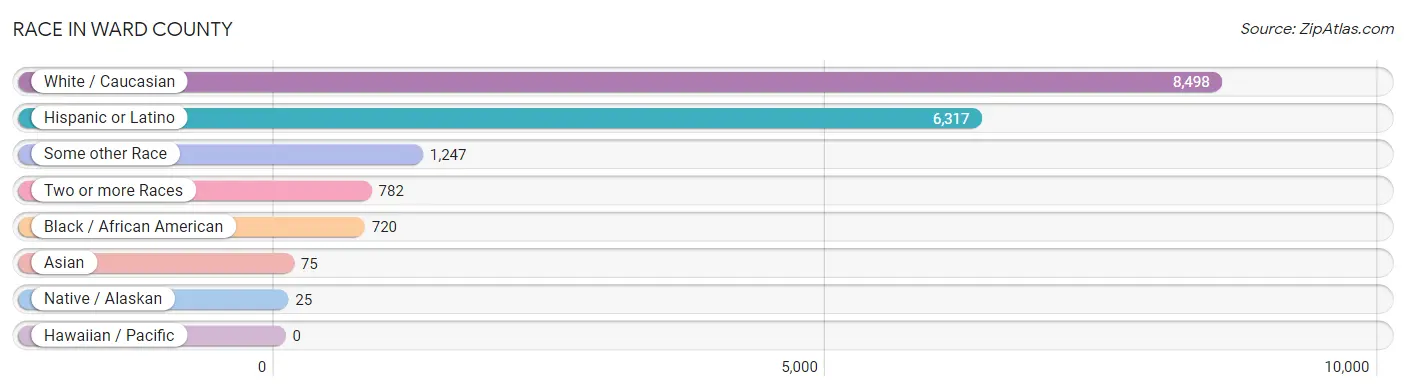
| Race | # Population | % Population |
| Asian | 75 | 0.7% |
| Black / African American | 720 | 6.4% |
| Hawaiian / Pacific | 0 | 0.0% |
| Hispanic or Latino | 6,317 | 55.7% |
| Native / Alaskan | 25 | 0.2% |
| White / Caucasian | 8,498 | 74.9% |
| Two or more Races | 782 | 6.9% |
| Some other Race | 1,247 | 11.0% |
| Total | 11,347 | 100.0% |
Ancestry in Ward County
The most populous ancestries reported in Ward County are Mexican (5,990 | 52.8%), English (858 | 7.6%), American (411 | 3.6%), Irish (384 | 3.4%), and German (320 | 2.8%), together accounting for 70.2% of all Ward County residents.
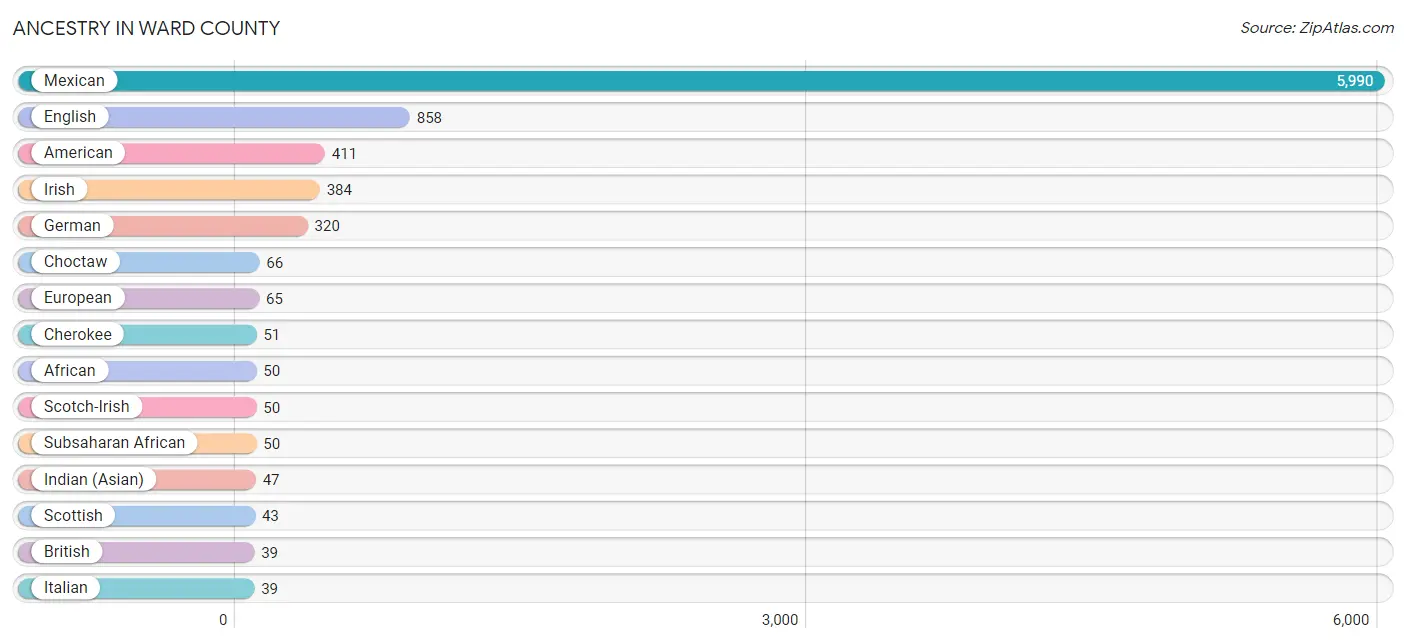
| Ancestry | # Population | % Population |
| African | 50 | 0.4% |
| American | 411 | 3.6% |
| Armenian | 4 | 0.0% |
| British | 39 | 0.3% |
| Burmese | 2 | 0.0% |
| Cherokee | 51 | 0.4% |
| Choctaw | 66 | 0.6% |
| Czech | 21 | 0.2% |
| Danish | 8 | 0.1% |
| Dutch | 21 | 0.2% |
| English | 858 | 7.6% |
| European | 65 | 0.6% |
| French | 38 | 0.3% |
| French Canadian | 10 | 0.1% |
| German | 320 | 2.8% |
| Indian (Asian) | 47 | 0.4% |
| Irish | 384 | 3.4% |
| Italian | 39 | 0.3% |
| Korean | 14 | 0.1% |
| Mexican | 5,990 | 52.8% |
| Northern European | 9 | 0.1% |
| Norwegian | 39 | 0.3% |
| Polish | 9 | 0.1% |
| Portuguese | 5 | 0.0% |
| Puerto Rican | 9 | 0.1% |
| Scotch-Irish | 50 | 0.4% |
| Scottish | 43 | 0.4% |
| Sri Lankan | 10 | 0.1% |
| Subsaharan African | 50 | 0.4% |
| Swedish | 10 | 0.1% |
| Welsh | 14 | 0.1% | View All 31 Rows |
Immigrants in Ward County
The most numerous immigrant groups reported in Ward County came from Central America (742 | 6.5%), Latin America (742 | 6.5%), Mexico (742 | 6.5%), Asia (58 | 0.5%), and China (34 | 0.3%), together accounting for 20.4% of all Ward County residents.
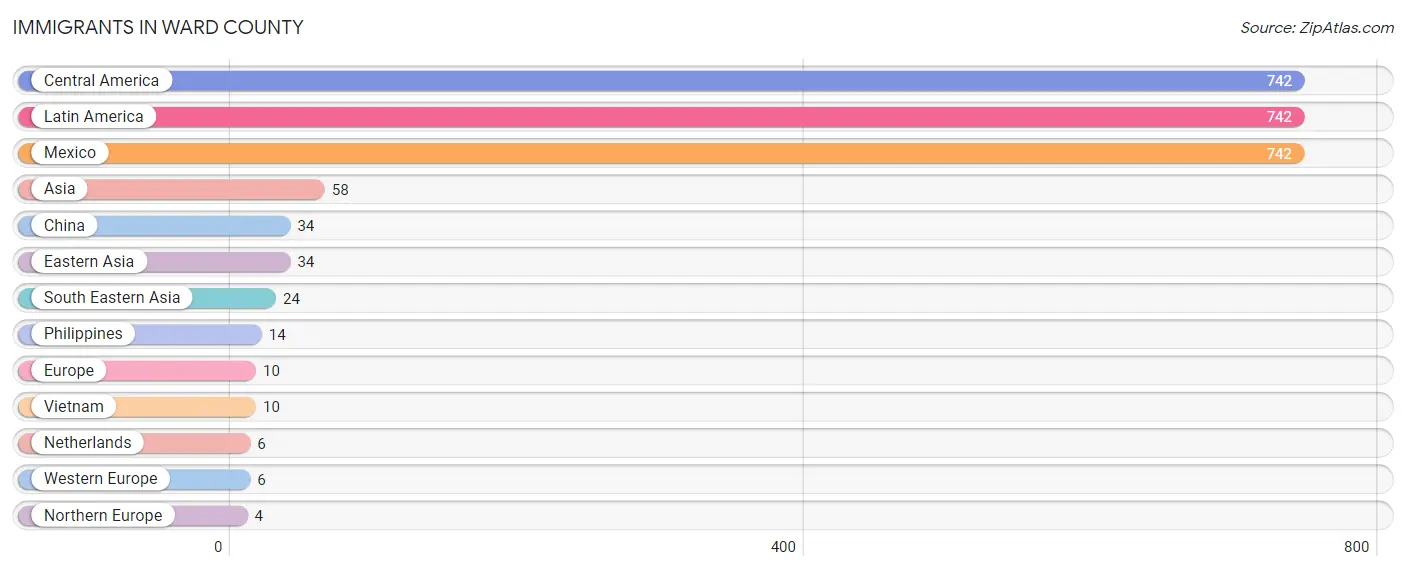
| Immigration Origin | # Population | % Population |
| Asia | 58 | 0.5% |
| Central America | 742 | 6.5% |
| China | 34 | 0.3% |
| Eastern Asia | 34 | 0.3% |
| Europe | 10 | 0.1% |
| Latin America | 742 | 6.5% |
| Mexico | 742 | 6.5% |
| Netherlands | 6 | 0.1% |
| Northern Europe | 4 | 0.0% |
| Philippines | 14 | 0.1% |
| South Eastern Asia | 24 | 0.2% |
| Vietnam | 10 | 0.1% |
| Western Europe | 6 | 0.1% | View All 13 Rows |
Sex and Age in Ward County
Sex and Age in Ward County
The most populous age groups in Ward County are 35 to 39 Years (542 | 9.5%) for men and 10 to 14 Years (484 | 8.6%) for women.
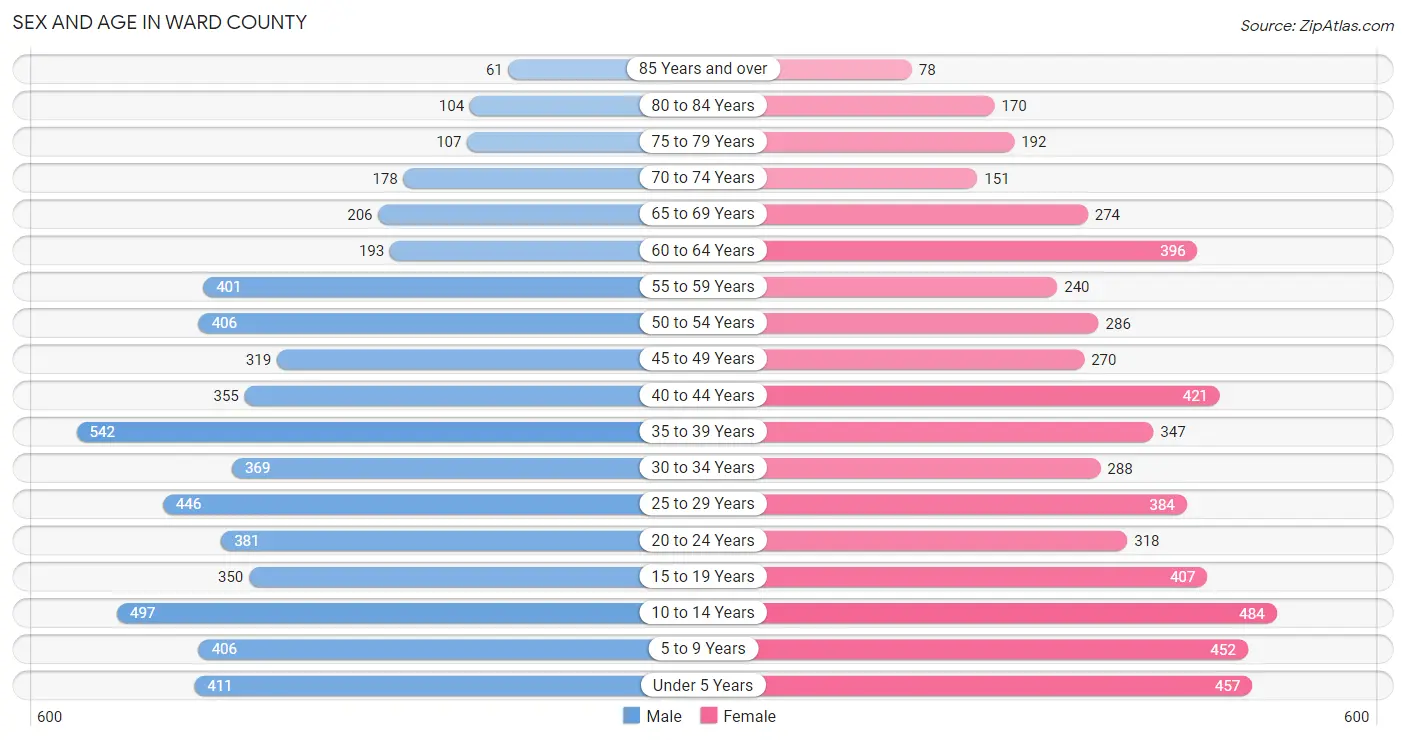
| Age Bracket | Male | Female |
| Under 5 Years | 411 (7.2%) | 457 (8.1%) |
| 5 to 9 Years | 406 (7.1%) | 452 (8.1%) |
| 10 to 14 Years | 497 (8.7%) | 484 (8.6%) |
| 15 to 19 Years | 350 (6.1%) | 407 (7.2%) |
| 20 to 24 Years | 381 (6.7%) | 318 (5.7%) |
| 25 to 29 Years | 446 (7.8%) | 384 (6.8%) |
| 30 to 34 Years | 369 (6.4%) | 288 (5.1%) |
| 35 to 39 Years | 542 (9.5%) | 347 (6.2%) |
| 40 to 44 Years | 355 (6.2%) | 421 (7.5%) |
| 45 to 49 Years | 319 (5.6%) | 270 (4.8%) |
| 50 to 54 Years | 406 (7.1%) | 286 (5.1%) |
| 55 to 59 Years | 401 (7.0%) | 240 (4.3%) |
| 60 to 64 Years | 193 (3.4%) | 396 (7.0%) |
| 65 to 69 Years | 206 (3.6%) | 274 (4.9%) |
| 70 to 74 Years | 178 (3.1%) | 151 (2.7%) |
| 75 to 79 Years | 107 (1.9%) | 192 (3.4%) |
| 80 to 84 Years | 104 (1.8%) | 170 (3.0%) |
| 85 Years and over | 61 (1.1%) | 78 (1.4%) |
| Total | 5,732 (100.0%) | 5,615 (100.0%) |
Families and Households in Ward County
Median Family Size in Ward County
The median family size in Ward County is 3.06 persons per family, with married-couple families (2,361 | 73.2%) accounting for the largest median family size of 3.24 persons per family. On the other hand, single male/father families (377 | 11.7%) represent the smallest median family size with 2.11 persons per family.
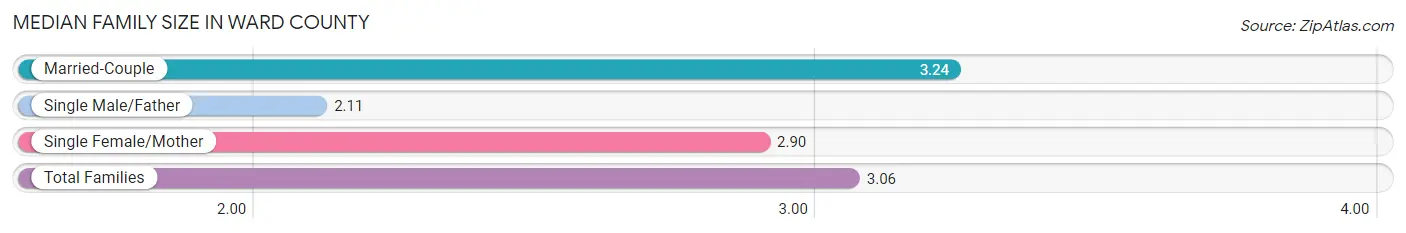
| Family Type | # Families | Family Size |
| Married-Couple | 2,361 (73.2%) | 3.24 |
| Single Male/Father | 377 (11.7%) | 2.11 |
| Single Female/Mother | 487 (15.1%) | 2.90 |
| Total Families | 3,225 (100.0%) | 3.06 |
Median Household Size in Ward County
The median household size in Ward County is 2.63 persons per household, with married-couple households (2,361 | 55.4%) accounting for the largest median household size of 3.26 persons per household. non-family households (1,039 | 24.4%) represent the smallest median household size with 1.10 persons per household.
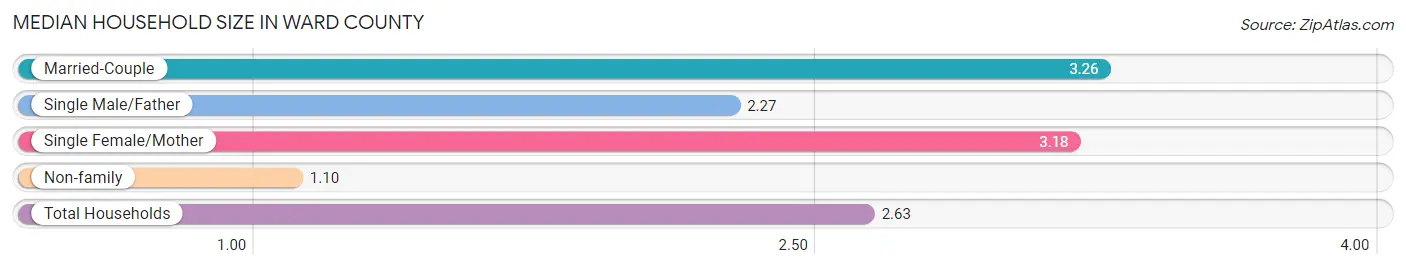
| Household Type | # Households | Household Size |
| Married-Couple | 2,361 (55.4%) | 3.26 |
| Single Male/Father | 377 (8.8%) | 2.27 |
| Single Female/Mother | 487 (11.4%) | 3.18 |
| Non-family | 1,039 (24.4%) | 1.10 |
| Total Households | 4,264 (100.0%) | 2.63 |
Household Size by Marriage Status in Ward County
Out of a total of 4,264 households in Ward County, 3,225 (75.6%) are family households, while 1,039 (24.4%) are nonfamily households. The most numerous type of family households are 2-person households, comprising 1,220, and the most common type of nonfamily households are 1-person households, comprising 944.
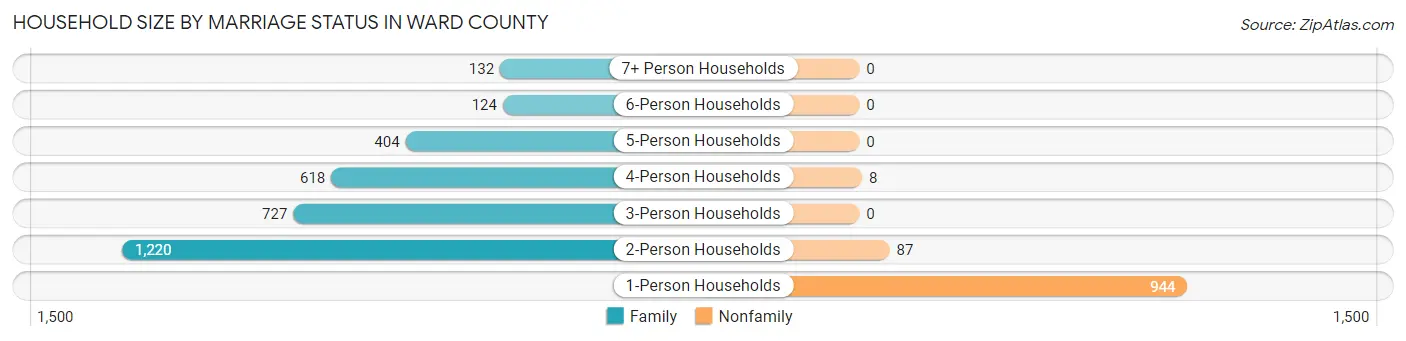
| Household Size | Family Households | Nonfamily Households |
| 1-Person Households | - | 944 (22.1%) |
| 2-Person Households | 1,220 (28.6%) | 87 (2.0%) |
| 3-Person Households | 727 (17.1%) | 0 (0.0%) |
| 4-Person Households | 618 (14.5%) | 8 (0.2%) |
| 5-Person Households | 404 (9.5%) | 0 (0.0%) |
| 6-Person Households | 124 (2.9%) | 0 (0.0%) |
| 7+ Person Households | 132 (3.1%) | 0 (0.0%) |
| Total | 3,225 (75.6%) | 1,039 (24.4%) |
Female Fertility in Ward County
Fertility by Age in Ward County
Average fertility rate in Ward County is 68.0 births per 1,000 women. Women in the age bracket of 20 to 34 years have the highest fertility rate with 158.0 births per 1,000 women. Women in the age bracket of 20 to 34 years acount for 92.3% of all women with births.
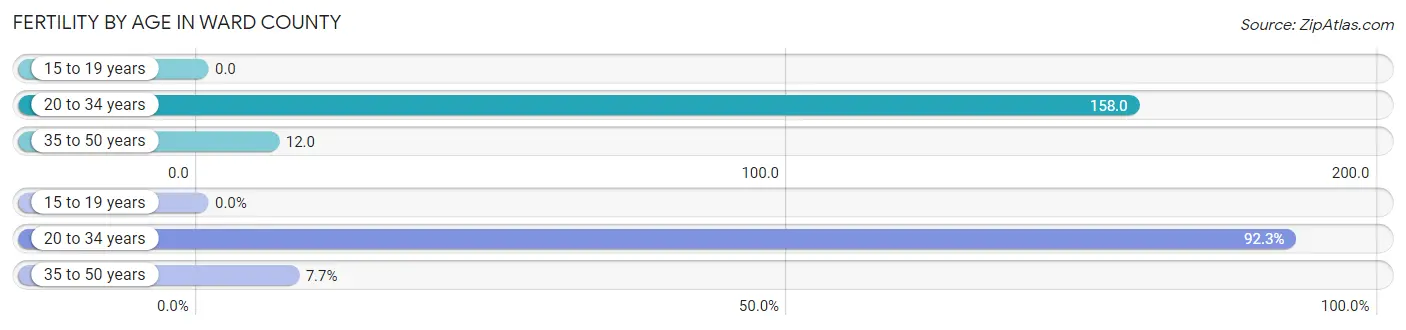
| Age Bracket | Women with Births | Births / 1,000 Women |
| 15 to 19 years | 0 (0.0%) | 0.0 |
| 20 to 34 years | 156 (92.3%) | 158.0 |
| 35 to 50 years | 13 (7.7%) | 12.0 |
| Total | 169 (100.0%) | 68.0 |
Fertility by Age by Marriage Status in Ward County
94.7% of women with births (169) in Ward County are married. The highest percentage of unmarried women with births falls into 35 to 50 years age bracket with 69.2% of them unmarried at the time of birth, while the lowest percentage of unmarried women with births belong to 20 to 34 years age bracket with 0.0% of them unmarried.
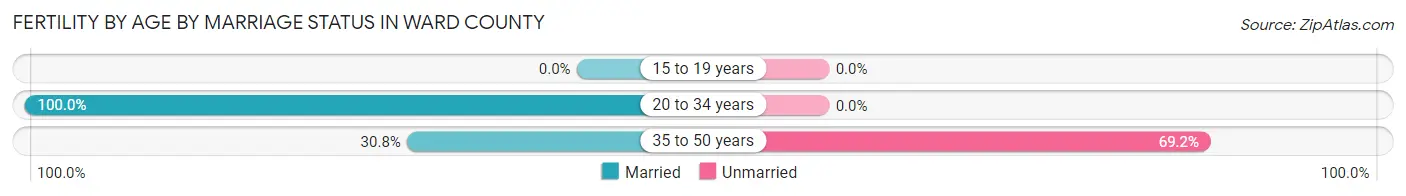
| Age Bracket | Married | Unmarried |
| 15 to 19 years | 0 (0.0%) | 0 (0.0%) |
| 20 to 34 years | 156 (100.0%) | 0 (0.0%) |
| 35 to 50 years | 4 (30.8%) | 9 (69.2%) |
| Total | 160 (94.7%) | 9 (5.3%) |
Fertility by Education in Ward County
Average fertility rate in Ward County is 68.0 births per 1,000 women. Women with the education attainment of college or associate's degree have the highest fertility rate of 152.0 births per 1,000 women, while women with the education attainment of high school diploma have the lowest fertility at 20.0 births per 1,000 women. Women with the education attainment of college or associate's degree represent 58.0% of all women with births.
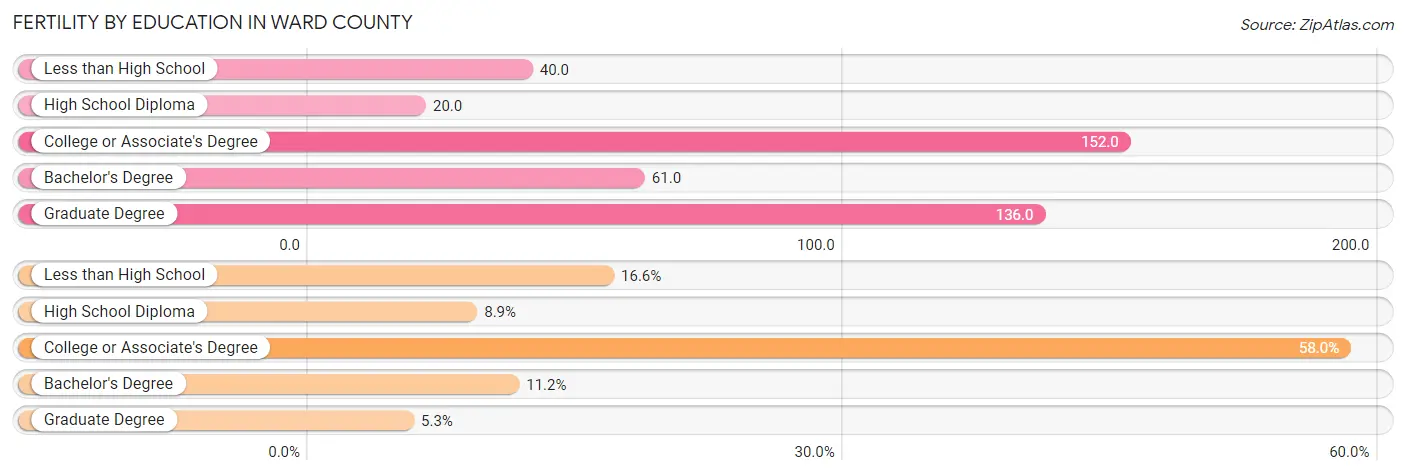
| Educational Attainment | Women with Births | Births / 1,000 Women |
| Less than High School | 28 (16.6%) | 40.0 |
| High School Diploma | 15 (8.9%) | 20.0 |
| College or Associate's Degree | 98 (58.0%) | 152.0 |
| Bachelor's Degree | 19 (11.2%) | 61.0 |
| Graduate Degree | 9 (5.3%) | 136.0 |
| Total | 169 (100.0%) | 68.0 |
Fertility by Education by Marriage Status in Ward County
5.3% of women with births in Ward County are unmarried. Women with the educational attainment of less than high school are most likely to be married with 100.0% of them married at childbirth, while women with the educational attainment of graduate degree are least likely to be married with 100.0% of them unmarried at childbirth.
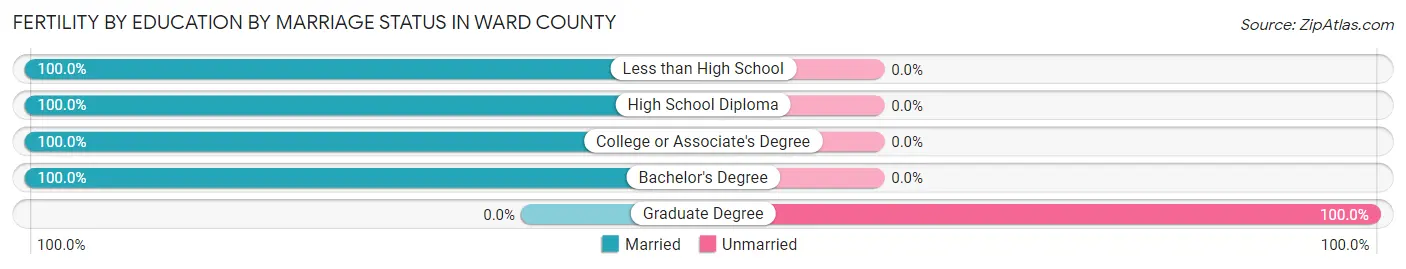
| Educational Attainment | Married | Unmarried |
| Less than High School | 28 (100.0%) | 0 (0.0%) |
| High School Diploma | 15 (100.0%) | 0 (0.0%) |
| College or Associate's Degree | 98 (100.0%) | 0 (0.0%) |
| Bachelor's Degree | 19 (100.0%) | 0 (0.0%) |
| Graduate Degree | 0 (0.0%) | 9 (100.0%) |
| Total | 160 (94.7%) | 9 (5.3%) |
Employment Characteristics in Ward County
Employment by Class of Employer in Ward County
Among the 5,042 employed individuals in Ward County, private company employees (3,504 | 69.5%), local government employees (701 | 13.9%), and not-for-profit organizations (275 | 5.4%) make up the most common classes of employment.
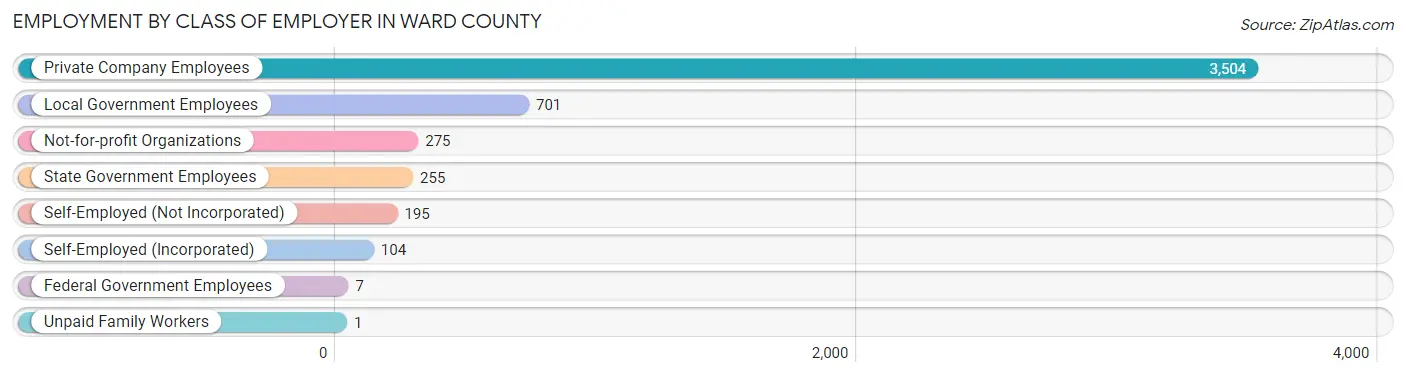
| Employer Class | # Employees | % Employees |
| Private Company Employees | 3,504 | 69.5% |
| Self-Employed (Incorporated) | 104 | 2.1% |
| Self-Employed (Not Incorporated) | 195 | 3.9% |
| Not-for-profit Organizations | 275 | 5.4% |
| Local Government Employees | 701 | 13.9% |
| State Government Employees | 255 | 5.1% |
| Federal Government Employees | 7 | 0.1% |
| Unpaid Family Workers | 1 | 0.0% |
| Total | 5,042 | 100.0% |
Employment Status by Age in Ward County
According to the labor force statistics for Ward County, out of the total population over 16 years of age (8,412), 64.3% or 5,409 individuals are in the labor force, with 5.5% or 297 of them unemployed. The age group with the highest labor force participation rate is 35 to 44 years, with 88.5% or 1,474 individuals in the labor force. Within the labor force, the 16 to 19 years age range has the highest percentage of unemployed individuals, with 23.7% or 32 of them being unemployed.
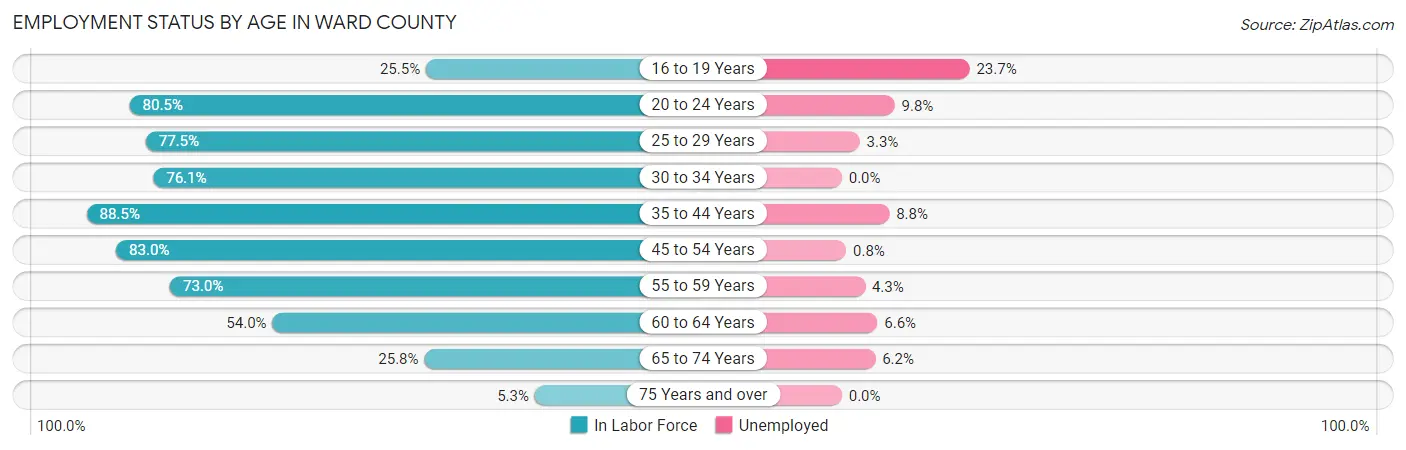
| Age Bracket | In Labor Force | Unemployed |
| 16 to 19 Years | 135 (25.5%) | 32 (23.7%) |
| 20 to 24 Years | 563 (80.5%) | 55 (9.8%) |
| 25 to 29 Years | 643 (77.5%) | 21 (3.3%) |
| 30 to 34 Years | 500 (76.1%) | 0 (0.0%) |
| 35 to 44 Years | 1,474 (88.5%) | 130 (8.8%) |
| 45 to 54 Years | 1,063 (83.0%) | 9 (0.8%) |
| 55 to 59 Years | 468 (73.0%) | 20 (4.3%) |
| 60 to 64 Years | 318 (54.0%) | 21 (6.6%) |
| 65 to 74 Years | 209 (25.8%) | 13 (6.2%) |
| 75 Years and over | 38 (5.3%) | 0 (0.0%) |
| Total | 5,409 (64.3%) | 297 (5.5%) |
Employment Status by Educational Attainment in Ward County
According to labor force statistics for Ward County, 78.8% of individuals (4,462) out of the total population between 25 and 64 years of age (5,663) are in the labor force, with 4.5% or 201 of them being unemployed. The group with the highest labor force participation rate are those with the educational attainment of college / associate degree, with 82.3% or 1,580 individuals in the labor force. Within the labor force, individuals with less than high school education have the highest percentage of unemployment, with 16.4% or 114 of them being unemployed.
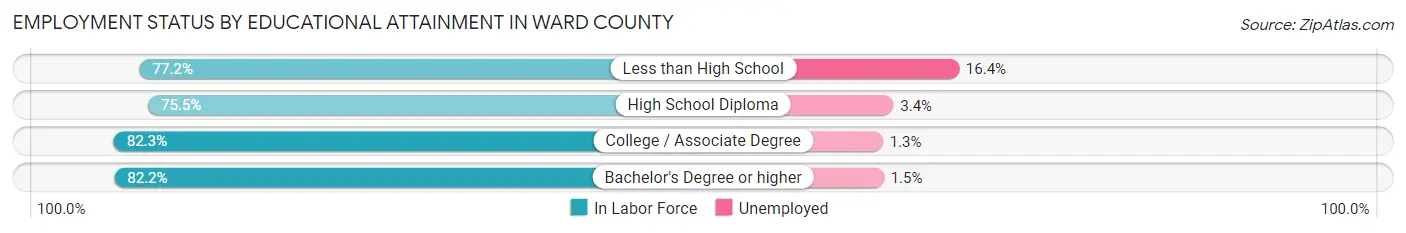
| Educational Attainment | In Labor Force | Unemployed |
| Less than High School | 695 (77.2%) | 148 (16.4%) |
| High School Diploma | 1,659 (75.5%) | 75 (3.4%) |
| College / Associate Degree | 1,580 (82.3%) | 25 (1.3%) |
| Bachelor's Degree or higher | 531 (82.2%) | 10 (1.5%) |
| Total | 4,462 (78.8%) | 255 (4.5%) |
Employment Occupations by Sex in Ward County
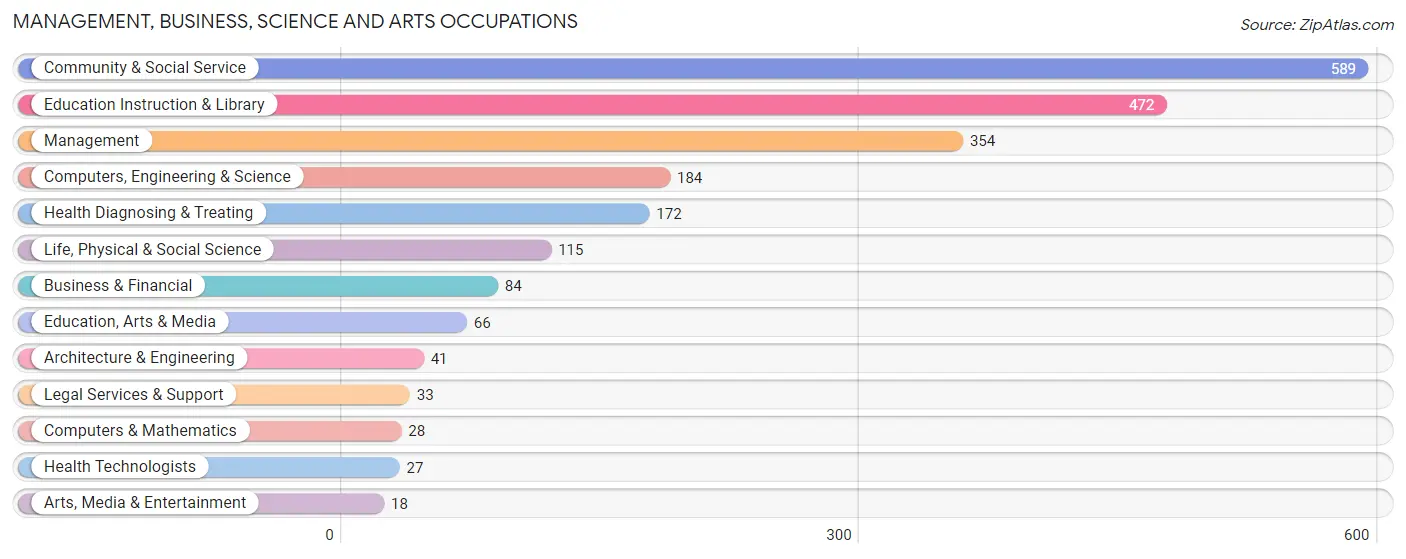
Management, Business, Science and Arts Occupations
The most common Management, Business, Science and Arts occupations in Ward County are Community & Social Service (589 | 11.5%), Education Instruction & Library (472 | 9.2%), Management (354 | 6.9%), Computers, Engineering & Science (184 | 3.6%), and Health Diagnosing & Treating (172 | 3.4%).
Management, Business, Science and Arts Occupations by Sex
Within the Management, Business, Science and Arts occupations in Ward County, the most male-oriented occupations are Computers & Mathematics (100.0%), Life, Physical & Social Science (100.0%), and Arts, Media & Entertainment (100.0%), while the most female-oriented occupations are Legal Services & Support (100.0%), Health Technologists (100.0%), and Education Instruction & Library (91.1%).
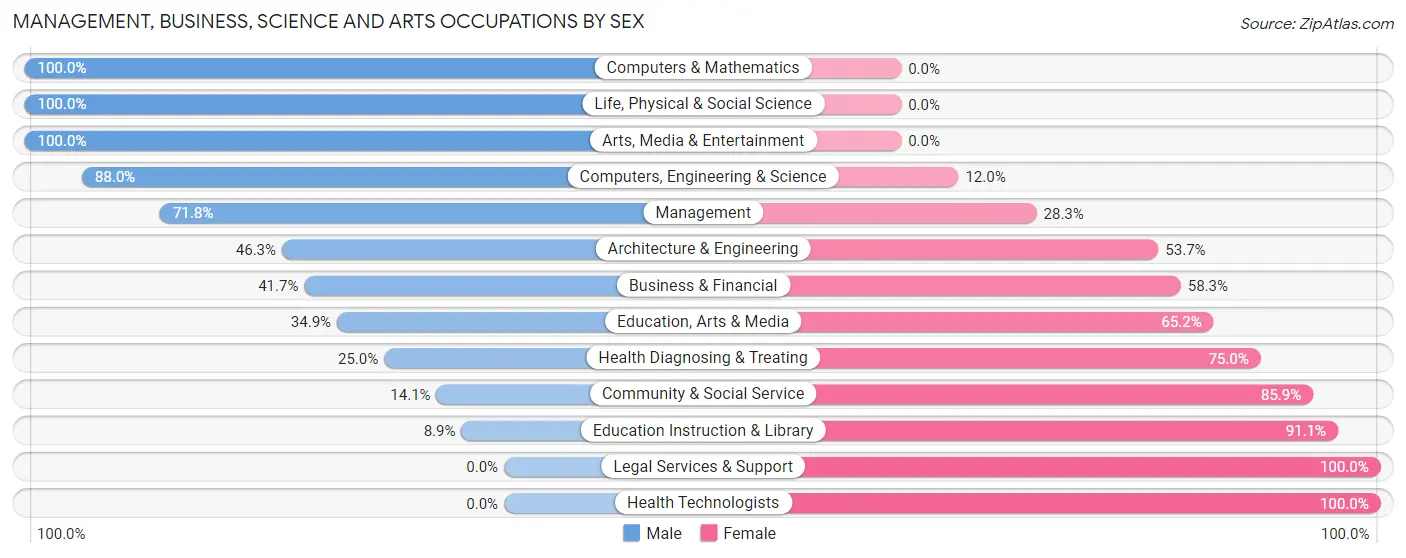
| Occupation | Male | Female |
| Management | 254 (71.8%) | 100 (28.2%) |
| Business & Financial | 35 (41.7%) | 49 (58.3%) |
| Computers, Engineering & Science | 162 (88.0%) | 22 (12.0%) |
| Computers & Mathematics | 28 (100.0%) | 0 (0.0%) |
| Architecture & Engineering | 19 (46.3%) | 22 (53.7%) |
| Life, Physical & Social Science | 115 (100.0%) | 0 (0.0%) |
| Community & Social Service | 83 (14.1%) | 506 (85.9%) |
| Education, Arts & Media | 23 (34.8%) | 43 (65.1%) |
| Legal Services & Support | 0 (0.0%) | 33 (100.0%) |
| Education Instruction & Library | 42 (8.9%) | 430 (91.1%) |
| Arts, Media & Entertainment | 18 (100.0%) | 0 (0.0%) |
| Health Diagnosing & Treating | 43 (25.0%) | 129 (75.0%) |
| Health Technologists | 0 (0.0%) | 27 (100.0%) |
| Total (Category) | 577 (41.7%) | 806 (58.3%) |
| Total (Overall) | 3,009 (58.9%) | 2,102 (41.1%) |
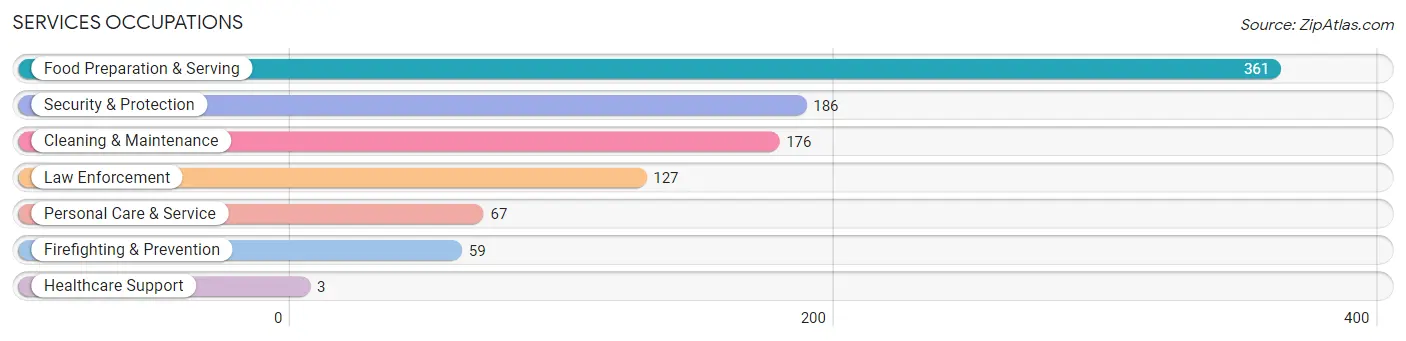
Services Occupations
The most common Services occupations in Ward County are Food Preparation & Serving (361 | 7.1%), Security & Protection (186 | 3.6%), Cleaning & Maintenance (176 | 3.4%), Law Enforcement (127 | 2.5%), and Personal Care & Service (67 | 1.3%).
Services Occupations by Sex
Within the Services occupations in Ward County, the most male-oriented occupations are Law Enforcement (100.0%), Security & Protection (68.3%), and Cleaning & Maintenance (46.6%), while the most female-oriented occupations are Healthcare Support (100.0%), Firefighting & Prevention (100.0%), and Personal Care & Service (82.1%).
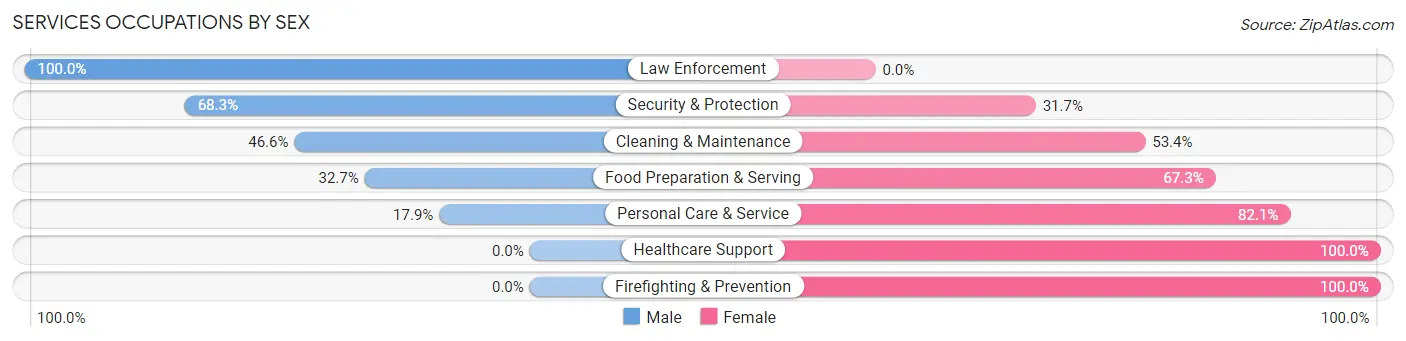
| Occupation | Male | Female |
| Healthcare Support | 0 (0.0%) | 3 (100.0%) |
| Security & Protection | 127 (68.3%) | 59 (31.7%) |
| Firefighting & Prevention | 0 (0.0%) | 59 (100.0%) |
| Law Enforcement | 127 (100.0%) | 0 (0.0%) |
| Food Preparation & Serving | 118 (32.7%) | 243 (67.3%) |
| Cleaning & Maintenance | 82 (46.6%) | 94 (53.4%) |
| Personal Care & Service | 12 (17.9%) | 55 (82.1%) |
| Total (Category) | 339 (42.7%) | 454 (57.3%) |
| Total (Overall) | 3,009 (58.9%) | 2,102 (41.1%) |
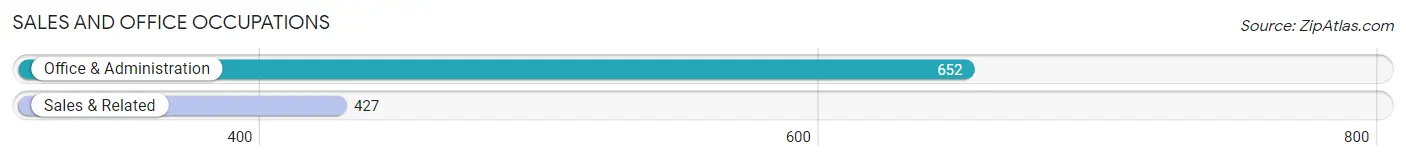
Sales and Office Occupations
The most common Sales and Office occupations in Ward County are Office & Administration (652 | 12.8%), and Sales & Related (427 | 8.4%).
Sales and Office Occupations by Sex
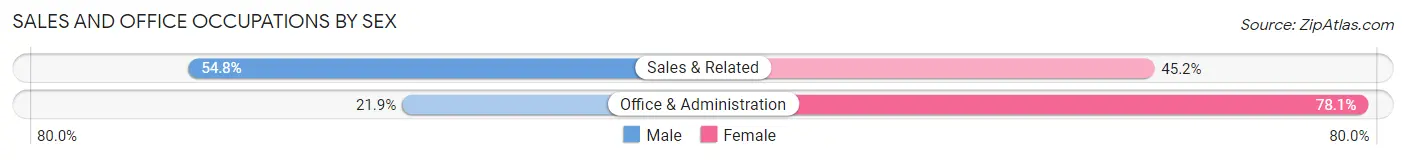
| Occupation | Male | Female |
| Sales & Related | 234 (54.8%) | 193 (45.2%) |
| Office & Administration | 143 (21.9%) | 509 (78.1%) |
| Total (Category) | 377 (34.9%) | 702 (65.1%) |
| Total (Overall) | 3,009 (58.9%) | 2,102 (41.1%) |
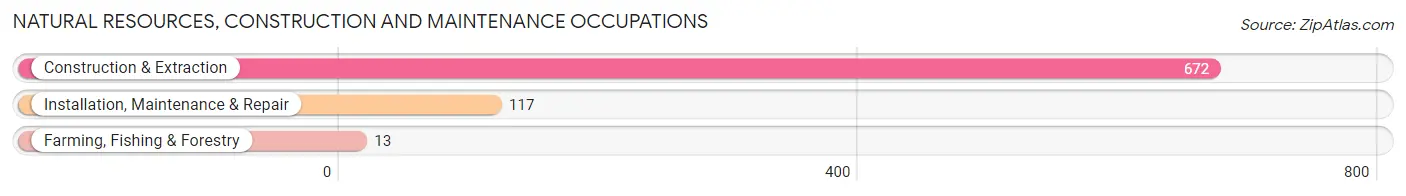
Natural Resources, Construction and Maintenance Occupations
The most common Natural Resources, Construction and Maintenance occupations in Ward County are Construction & Extraction (672 | 13.2%), Installation, Maintenance & Repair (117 | 2.3%), and Farming, Fishing & Forestry (13 | 0.3%).
Natural Resources, Construction and Maintenance Occupations by Sex
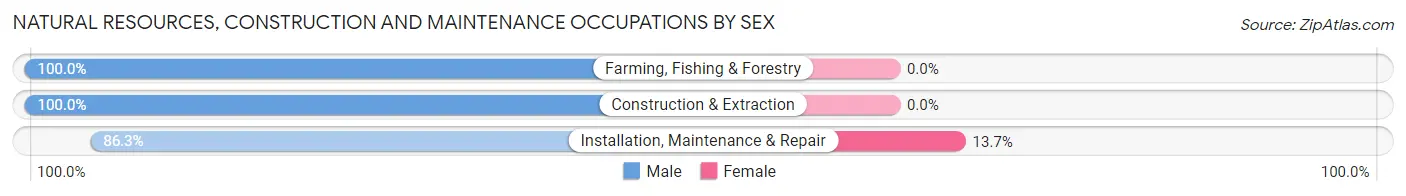
| Occupation | Male | Female |
| Farming, Fishing & Forestry | 13 (100.0%) | 0 (0.0%) |
| Construction & Extraction | 672 (100.0%) | 0 (0.0%) |
| Installation, Maintenance & Repair | 101 (86.3%) | 16 (13.7%) |
| Total (Category) | 786 (98.0%) | 16 (2.0%) |
| Total (Overall) | 3,009 (58.9%) | 2,102 (41.1%) |
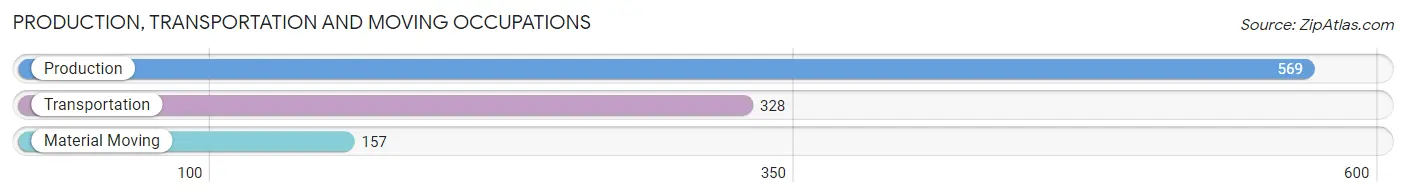
Production, Transportation and Moving Occupations
The most common Production, Transportation and Moving occupations in Ward County are Production (569 | 11.1%), Transportation (328 | 6.4%), and Material Moving (157 | 3.1%).
Production, Transportation and Moving Occupations by Sex
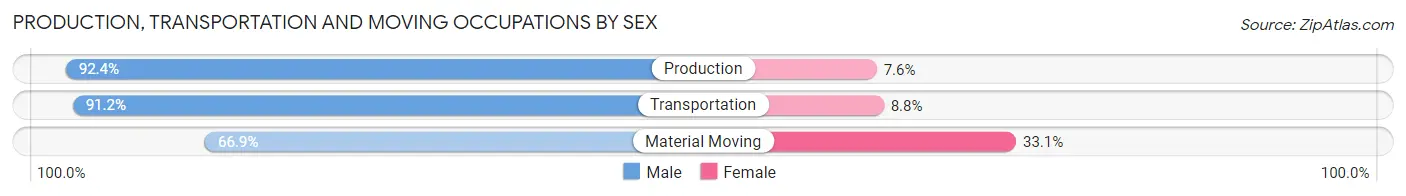
| Occupation | Male | Female |
| Production | 526 (92.4%) | 43 (7.6%) |
| Transportation | 299 (91.2%) | 29 (8.8%) |
| Material Moving | 105 (66.9%) | 52 (33.1%) |
| Total (Category) | 930 (88.2%) | 124 (11.8%) |
| Total (Overall) | 3,009 (58.9%) | 2,102 (41.1%) |
Employment Industries by Sex in Ward County
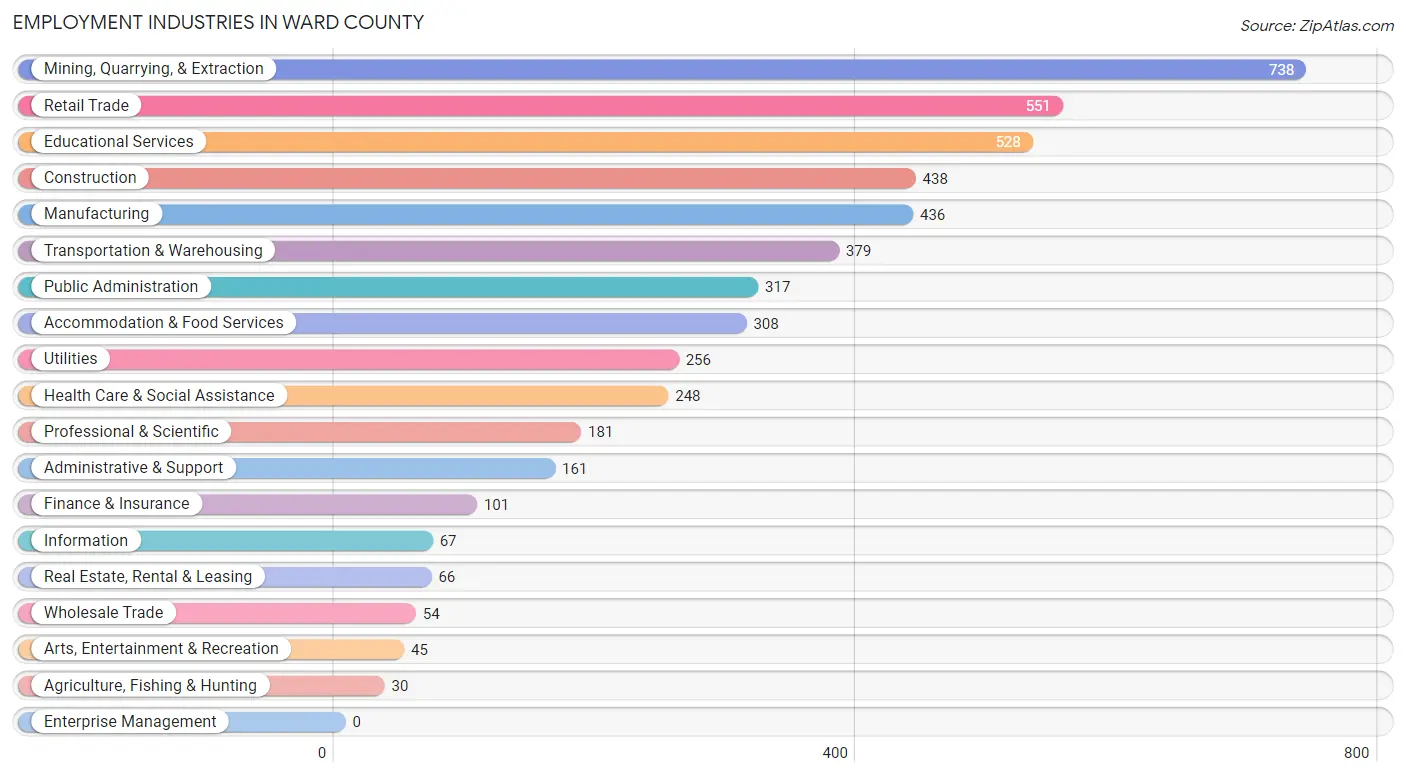
Employment Industries in Ward County
The major employment industries in Ward County include Mining, Quarrying, & Extraction (738 | 14.4%), Retail Trade (551 | 10.8%), Educational Services (528 | 10.3%), Construction (438 | 8.6%), and Manufacturing (436 | 8.5%).
Employment Industries by Sex in Ward County
The Ward County industries that see more men than women are Utilities (100.0%), Real Estate, Rental & Leasing (93.9%), and Transportation & Warehousing (93.4%), whereas the industries that tend to have a higher number of women are Arts, Entertainment & Recreation (100.0%), Educational Services (85.2%), and Professional & Scientific (82.3%).
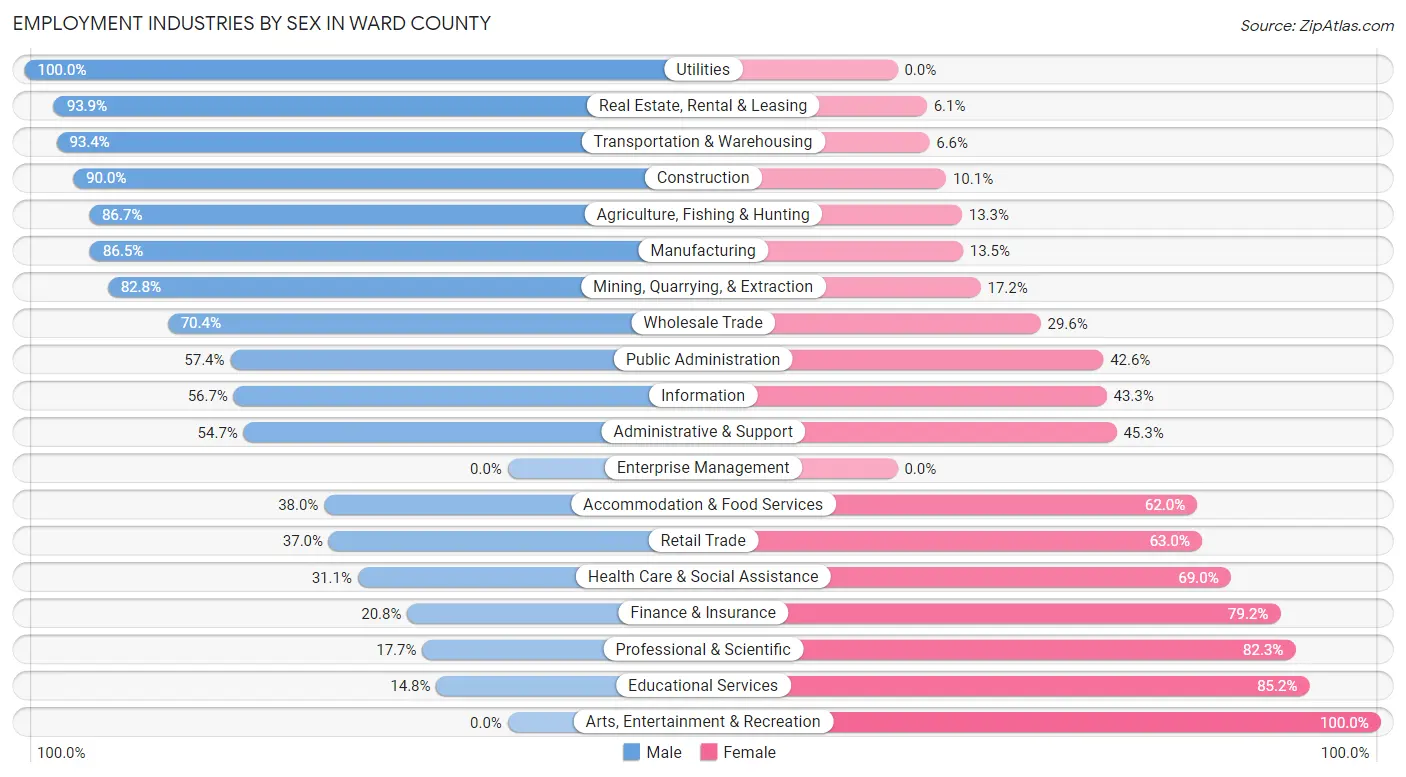
| Industry | Male | Female |
| Agriculture, Fishing & Hunting | 26 (86.7%) | 4 (13.3%) |
| Mining, Quarrying, & Extraction | 611 (82.8%) | 127 (17.2%) |
| Construction | 394 (89.9%) | 44 (10.1%) |
| Manufacturing | 377 (86.5%) | 59 (13.5%) |
| Wholesale Trade | 38 (70.4%) | 16 (29.6%) |
| Retail Trade | 204 (37.0%) | 347 (63.0%) |
| Transportation & Warehousing | 354 (93.4%) | 25 (6.6%) |
| Utilities | 256 (100.0%) | 0 (0.0%) |
| Information | 38 (56.7%) | 29 (43.3%) |
| Finance & Insurance | 21 (20.8%) | 80 (79.2%) |
| Real Estate, Rental & Leasing | 62 (93.9%) | 4 (6.1%) |
| Professional & Scientific | 32 (17.7%) | 149 (82.3%) |
| Enterprise Management | 0 (0.0%) | 0 (0.0%) |
| Administrative & Support | 88 (54.7%) | 73 (45.3%) |
| Educational Services | 78 (14.8%) | 450 (85.2%) |
| Health Care & Social Assistance | 77 (31.0%) | 171 (69.0%) |
| Arts, Entertainment & Recreation | 0 (0.0%) | 45 (100.0%) |
| Accommodation & Food Services | 117 (38.0%) | 191 (62.0%) |
| Public Administration | 182 (57.4%) | 135 (42.6%) |
| Total | 3,009 (58.9%) | 2,102 (41.1%) |
Education in Ward County
School Enrollment in Ward County
The most common levels of schooling among the 2,742 students in Ward County are elementary school (834 | 30.4%), middle school (742 | 27.1%), and high school (730 | 26.6%).
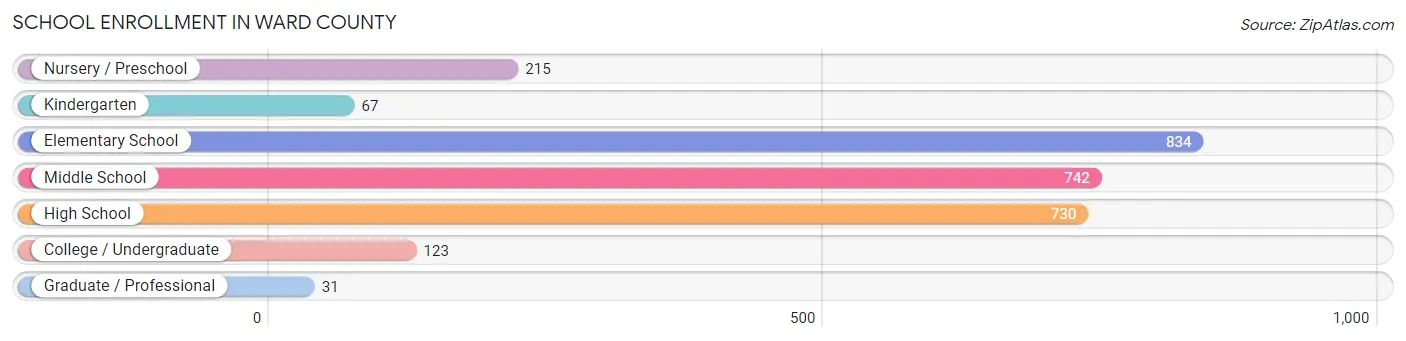
| School Level | # Students | % Students |
| Nursery / Preschool | 215 | 7.8% |
| Kindergarten | 67 | 2.4% |
| Elementary School | 834 | 30.4% |
| Middle School | 742 | 27.1% |
| High School | 730 | 26.6% |
| College / Undergraduate | 123 | 4.5% |
| Graduate / Professional | 31 | 1.1% |
| Total | 2,742 | 100.0% |
School Enrollment by Age by Funding Source in Ward County
Out of a total of 2,742 students who are enrolled in schools in Ward County, 167 (6.1%) attend a private institution, while the remaining 2,575 (93.9%) are enrolled in public schools. The age group of 3 to 4 year olds has the highest likelihood of being enrolled in private schools, with 84 (46.4% in the age bracket) enrolled. Conversely, the age group of 18 to 19 year olds has the lowest likelihood of being enrolled in a private school, with 81 (100.0% in the age bracket) attending a public institution.
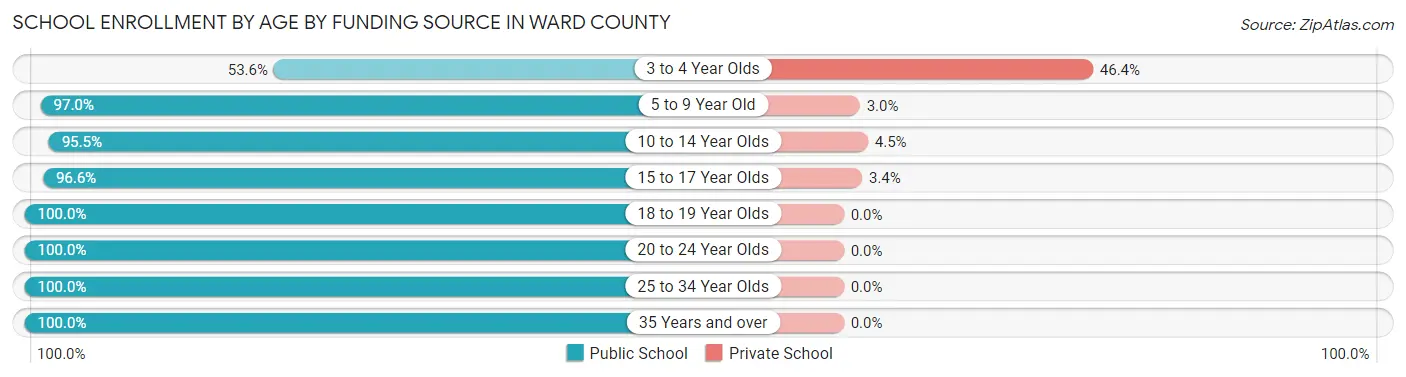
| Age Bracket | Public School | Private School |
| 3 to 4 Year Olds | 97 (53.6%) | 84 (46.4%) |
| 5 to 9 Year Old | 811 (97.0%) | 25 (3.0%) |
| 10 to 14 Year Olds | 828 (95.5%) | 39 (4.5%) |
| 15 to 17 Year Olds | 565 (96.6%) | 20 (3.4%) |
| 18 to 19 Year Olds | 81 (100.0%) | 0 (0.0%) |
| 20 to 24 Year Olds | 141 (100.0%) | 0 (0.0%) |
| 25 to 34 Year Olds | 27 (100.0%) | 0 (0.0%) |
| 35 Years and over | 24 (100.0%) | 0 (0.0%) |
| Total | 2,575 (93.9%) | 167 (6.1%) |
Educational Attainment by Field of Study in Ward County
Arts & humanities (209 | 24.2%), business (132 | 15.3%), bio, nature & agricultural (93 | 10.8%), science & technology (72 | 8.3%), and education (71 | 8.2%) are the most common fields of study among 864 individuals in Ward County who have obtained a bachelor's degree or higher.
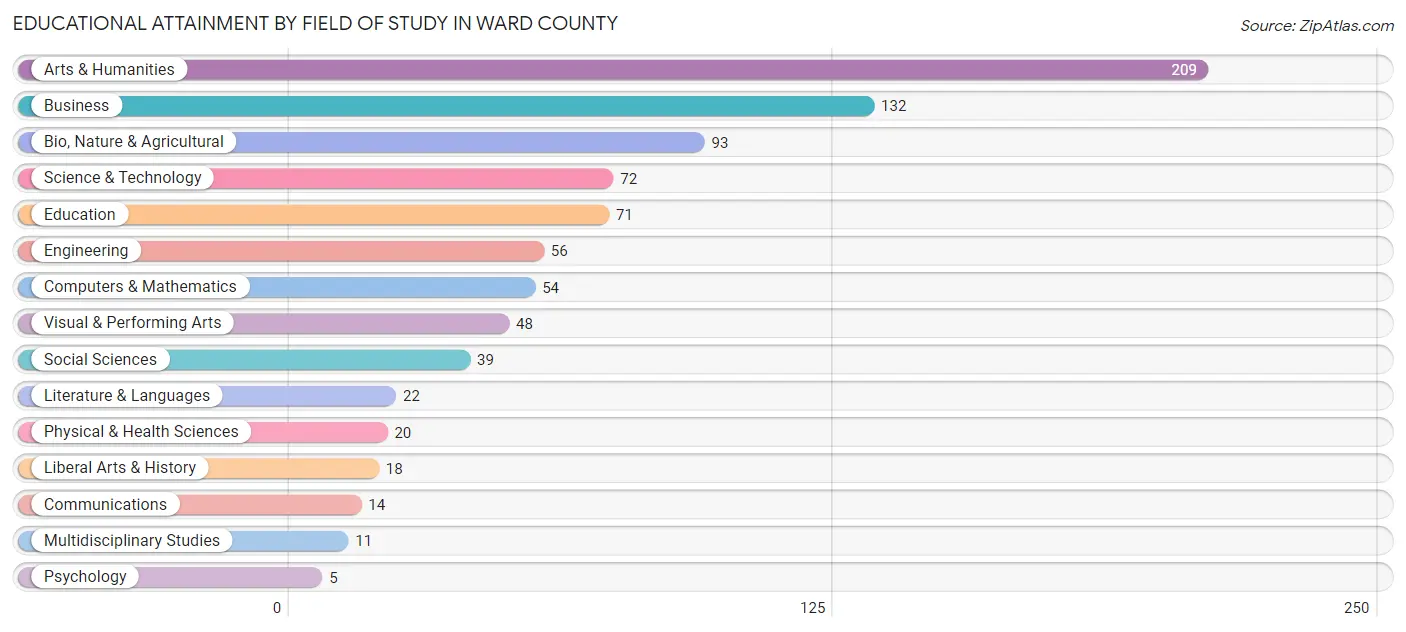
| Field of Study | # Graduates | % Graduates |
| Computers & Mathematics | 54 | 6.2% |
| Bio, Nature & Agricultural | 93 | 10.8% |
| Physical & Health Sciences | 20 | 2.3% |
| Psychology | 5 | 0.6% |
| Social Sciences | 39 | 4.5% |
| Engineering | 56 | 6.5% |
| Multidisciplinary Studies | 11 | 1.3% |
| Science & Technology | 72 | 8.3% |
| Business | 132 | 15.3% |
| Education | 71 | 8.2% |
| Literature & Languages | 22 | 2.5% |
| Liberal Arts & History | 18 | 2.1% |
| Visual & Performing Arts | 48 | 5.6% |
| Communications | 14 | 1.6% |
| Arts & Humanities | 209 | 24.2% |
| Total | 864 | 100.0% |
Transportation & Commute in Ward County
Vehicle Availability by Sex in Ward County
The most prevalent vehicle ownership categories in Ward County are males with 2 vehicles (1,187, accounting for 39.6%) and females with 2 vehicles (795, making up 58.1%).
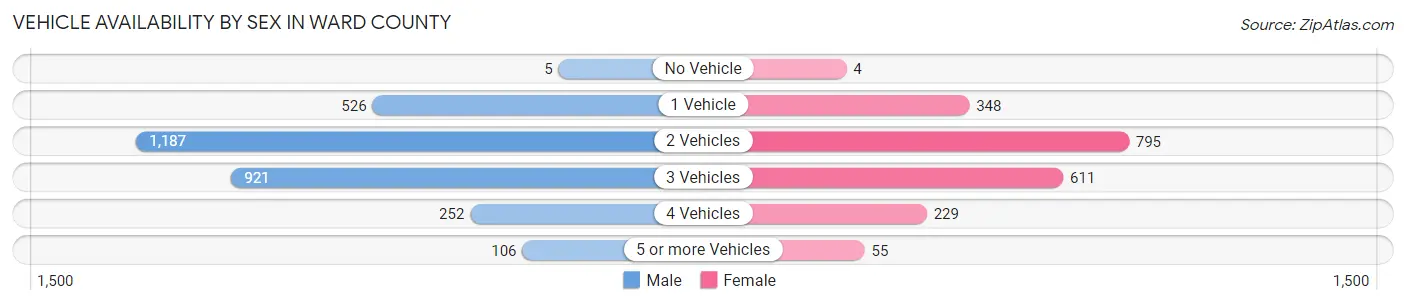
| Vehicles Available | Male | Female |
| No Vehicle | 5 (0.2%) | 4 (0.2%) |
| 1 Vehicle | 526 (17.5%) | 348 (17.0%) |
| 2 Vehicles | 1,187 (39.6%) | 795 (38.9%) |
| 3 Vehicles | 921 (30.7%) | 611 (29.9%) |
| 4 Vehicles | 252 (8.4%) | 229 (11.2%) |
| 5 or more Vehicles | 106 (3.5%) | 55 (2.7%) |
| Total | 2,997 (100.0%) | 2,042 (100.0%) |
Commute Time in Ward County
The most frequently occuring commute durations in Ward County are 10 to 14 minutes (1,221 commuters, 24.5%), 5 to 9 minutes (1,015 commuters, 20.4%), and 45 to 59 minutes (588 commuters, 11.8%).
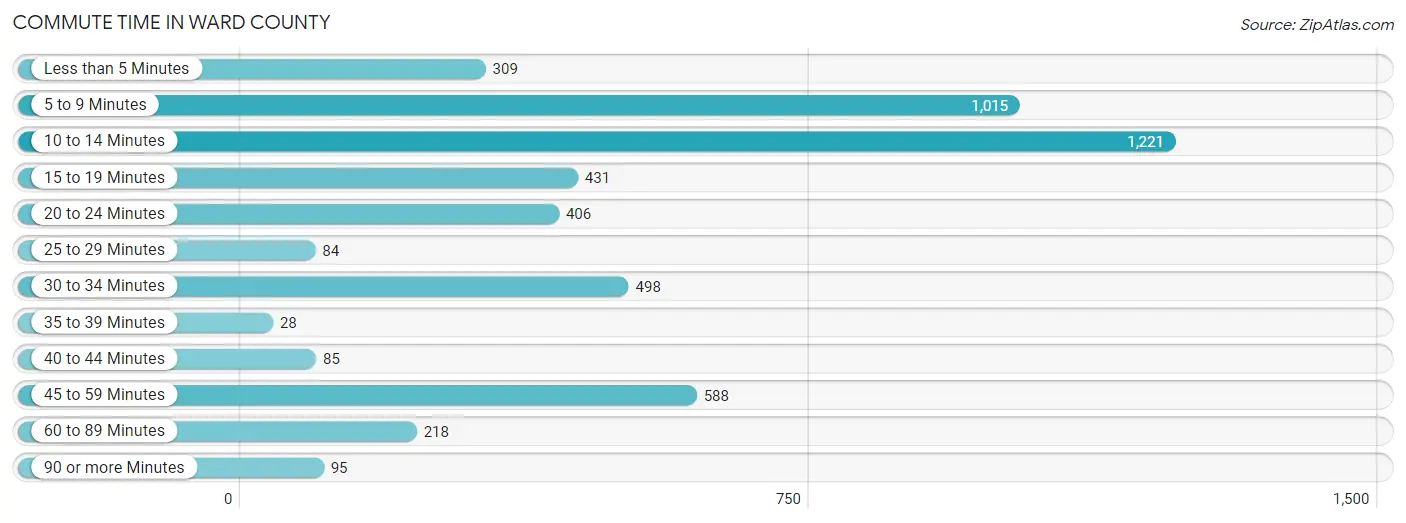
| Commute Time | # Commuters | % Commuters |
| Less than 5 Minutes | 309 | 6.2% |
| 5 to 9 Minutes | 1,015 | 20.4% |
| 10 to 14 Minutes | 1,221 | 24.5% |
| 15 to 19 Minutes | 431 | 8.7% |
| 20 to 24 Minutes | 406 | 8.2% |
| 25 to 29 Minutes | 84 | 1.7% |
| 30 to 34 Minutes | 498 | 10.0% |
| 35 to 39 Minutes | 28 | 0.6% |
| 40 to 44 Minutes | 85 | 1.7% |
| 45 to 59 Minutes | 588 | 11.8% |
| 60 to 89 Minutes | 218 | 4.4% |
| 90 or more Minutes | 95 | 1.9% |
Commute Time by Sex in Ward County
The most common commute times in Ward County are 10 to 14 minutes (676 commuters, 22.8%) for males and 5 to 9 minutes (607 commuters, 30.1%) for females.
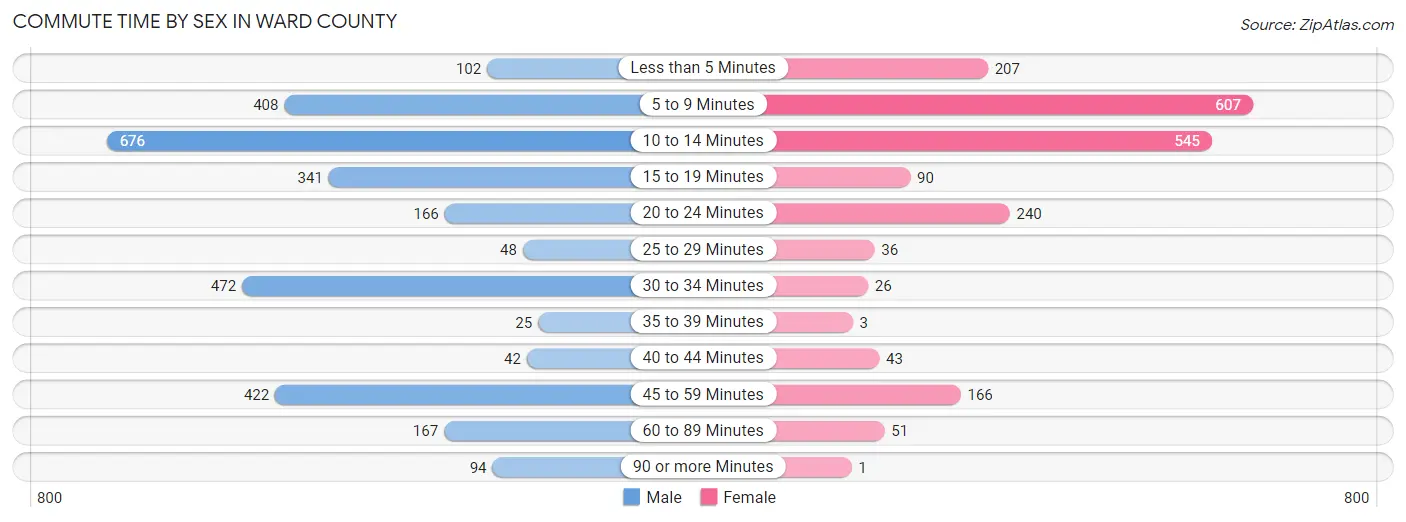
| Commute Time | Male | Female |
| Less than 5 Minutes | 102 (3.4%) | 207 (10.3%) |
| 5 to 9 Minutes | 408 (13.8%) | 607 (30.1%) |
| 10 to 14 Minutes | 676 (22.8%) | 545 (27.1%) |
| 15 to 19 Minutes | 341 (11.5%) | 90 (4.5%) |
| 20 to 24 Minutes | 166 (5.6%) | 240 (11.9%) |
| 25 to 29 Minutes | 48 (1.6%) | 36 (1.8%) |
| 30 to 34 Minutes | 472 (15.9%) | 26 (1.3%) |
| 35 to 39 Minutes | 25 (0.8%) | 3 (0.2%) |
| 40 to 44 Minutes | 42 (1.4%) | 43 (2.1%) |
| 45 to 59 Minutes | 422 (14.2%) | 166 (8.2%) |
| 60 to 89 Minutes | 167 (5.6%) | 51 (2.5%) |
| 90 or more Minutes | 94 (3.2%) | 1 (0.1%) |
Time of Departure to Work by Sex in Ward County
The most frequent times of departure to work in Ward County are 6:30 AM to 6:59 AM (606, 20.4%) for males and 7:30 AM to 7:59 AM (449, 22.3%) for females.
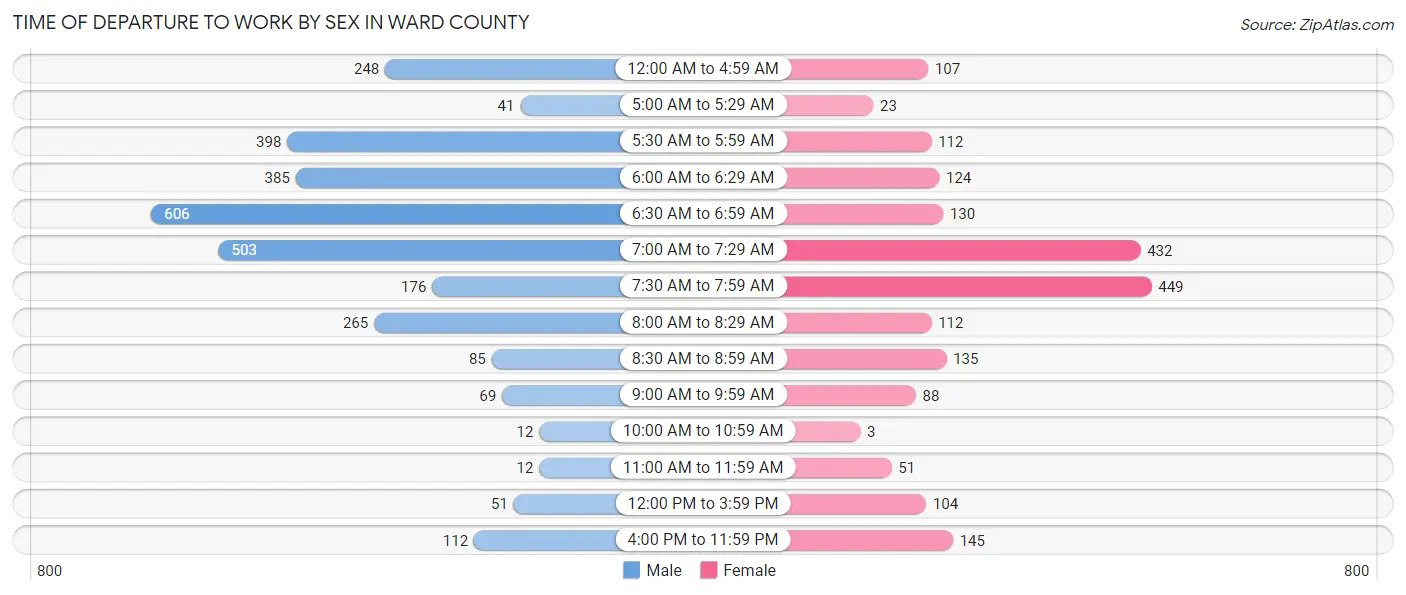
| Time of Departure | Male | Female |
| 12:00 AM to 4:59 AM | 248 (8.4%) | 107 (5.3%) |
| 5:00 AM to 5:29 AM | 41 (1.4%) | 23 (1.1%) |
| 5:30 AM to 5:59 AM | 398 (13.4%) | 112 (5.6%) |
| 6:00 AM to 6:29 AM | 385 (13.0%) | 124 (6.1%) |
| 6:30 AM to 6:59 AM | 606 (20.4%) | 130 (6.5%) |
| 7:00 AM to 7:29 AM | 503 (17.0%) | 432 (21.4%) |
| 7:30 AM to 7:59 AM | 176 (5.9%) | 449 (22.3%) |
| 8:00 AM to 8:29 AM | 265 (8.9%) | 112 (5.6%) |
| 8:30 AM to 8:59 AM | 85 (2.9%) | 135 (6.7%) |
| 9:00 AM to 9:59 AM | 69 (2.3%) | 88 (4.4%) |
| 10:00 AM to 10:59 AM | 12 (0.4%) | 3 (0.2%) |
| 11:00 AM to 11:59 AM | 12 (0.4%) | 51 (2.5%) |
| 12:00 PM to 3:59 PM | 51 (1.7%) | 104 (5.2%) |
| 4:00 PM to 11:59 PM | 112 (3.8%) | 145 (7.2%) |
| Total | 2,963 (100.0%) | 2,015 (100.0%) |
Housing Occupancy in Ward County
Occupancy by Ownership in Ward County
Of the total 4,264 dwellings in Ward County, owner-occupied units account for 3,430 (80.4%), while renter-occupied units make up 834 (19.6%).
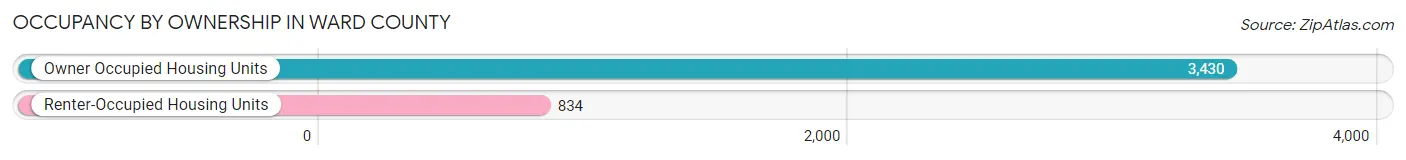
| Occupancy | # Housing Units | % Housing Units |
| Owner Occupied Housing Units | 3,430 | 80.4% |
| Renter-Occupied Housing Units | 834 | 19.6% |
| Total Occupied Housing Units | 4,264 | 100.0% |
Occupancy by Household Size in Ward County
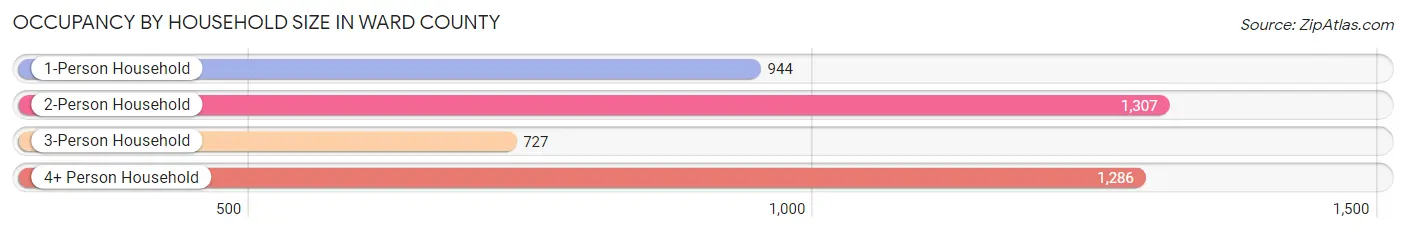
| Household Size | # Housing Units | % Housing Units |
| 1-Person Household | 944 | 22.1% |
| 2-Person Household | 1,307 | 30.6% |
| 3-Person Household | 727 | 17.1% |
| 4+ Person Household | 1,286 | 30.2% |
| Total Housing Units | 4,264 | 100.0% |
Occupancy by Ownership by Household Size in Ward County
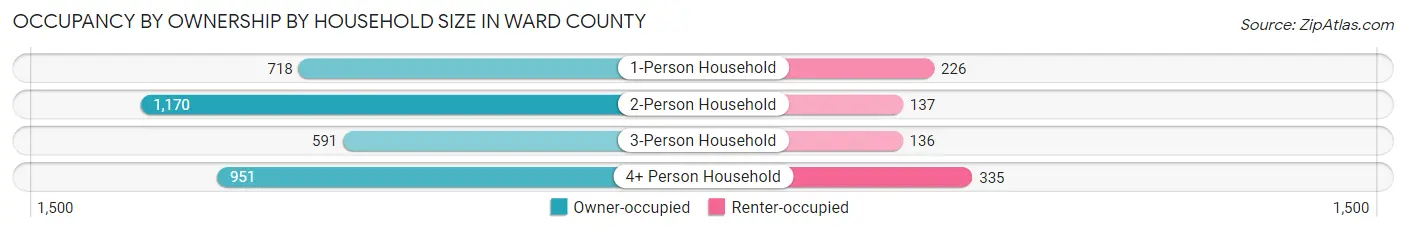
| Household Size | Owner-occupied | Renter-occupied |
| 1-Person Household | 718 (76.1%) | 226 (23.9%) |
| 2-Person Household | 1,170 (89.5%) | 137 (10.5%) |
| 3-Person Household | 591 (81.3%) | 136 (18.7%) |
| 4+ Person Household | 951 (74.0%) | 335 (26.1%) |
| Total Housing Units | 3,430 (80.4%) | 834 (19.6%) |
Occupancy by Educational Attainment in Ward County
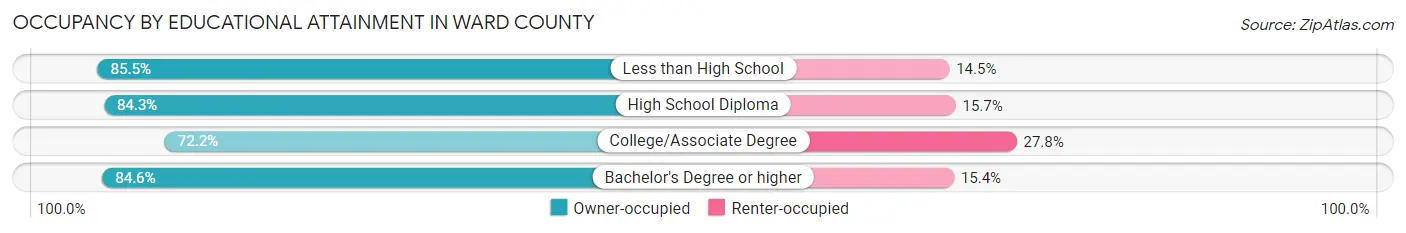
| Household Size | Owner-occupied | Renter-occupied |
| Less than High School | 590 (85.5%) | 100 (14.5%) |
| High School Diploma | 1,424 (84.3%) | 266 (15.7%) |
| College/Associate Degree | 1,032 (72.2%) | 398 (27.8%) |
| Bachelor's Degree or higher | 384 (84.6%) | 70 (15.4%) |
Occupancy by Age of Householder in Ward County
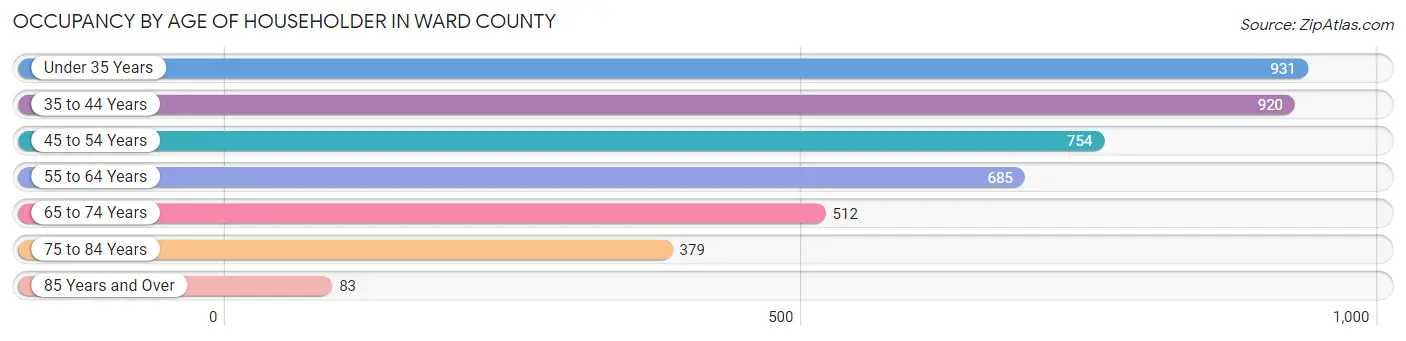
| Age Bracket | # Households | % Households |
| Under 35 Years | 931 | 21.8% |
| 35 to 44 Years | 920 | 21.6% |
| 45 to 54 Years | 754 | 17.7% |
| 55 to 64 Years | 685 | 16.1% |
| 65 to 74 Years | 512 | 12.0% |
| 75 to 84 Years | 379 | 8.9% |
| 85 Years and Over | 83 | 1.9% |
| Total | 4,264 | 100.0% |
Housing Finances in Ward County
Median Income by Occupancy in Ward County
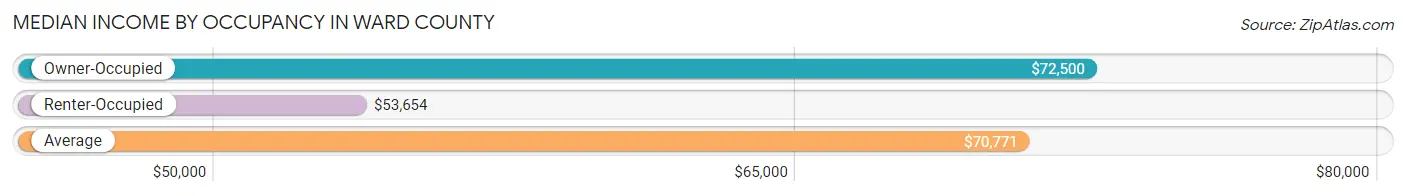
| Occupancy Type | # Households | Median Income |
| Owner-Occupied | 3,430 (80.4%) | $72,500 |
| Renter-Occupied | 834 (19.6%) | $53,654 |
| Average | 4,264 (100.0%) | $70,771 |
Occupancy by Householder Income Bracket in Ward County
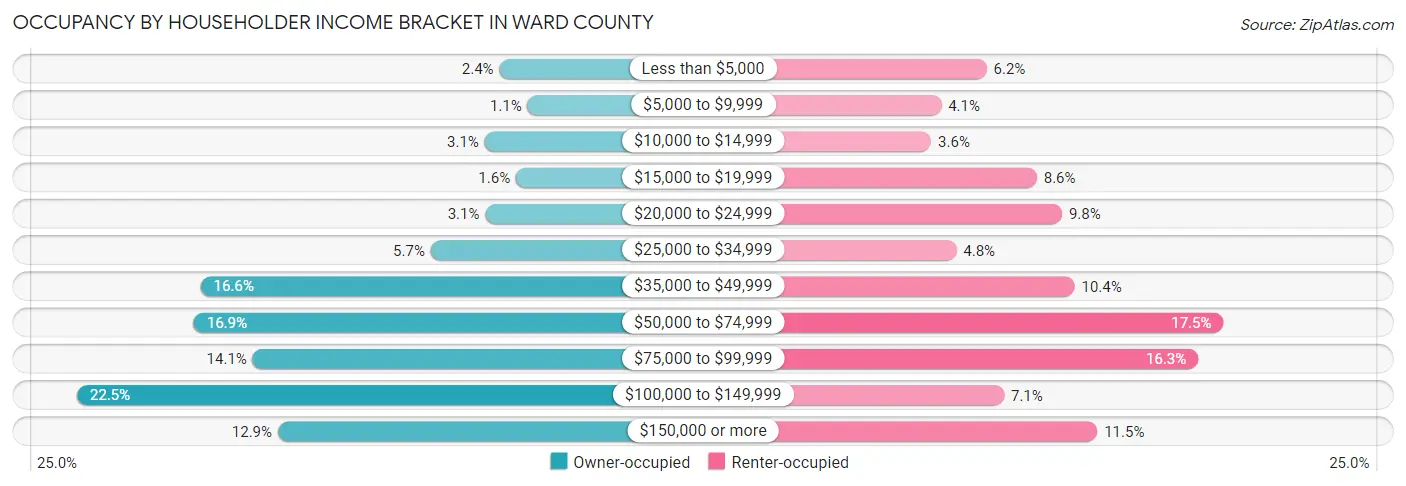
| Income Bracket | Owner-occupied | Renter-occupied |
| Less than $5,000 | 82 (2.4%) | 52 (6.2%) |
| $5,000 to $9,999 | 36 (1.1%) | 34 (4.1%) |
| $10,000 to $14,999 | 106 (3.1%) | 30 (3.6%) |
| $15,000 to $19,999 | 55 (1.6%) | 72 (8.6%) |
| $20,000 to $24,999 | 105 (3.1%) | 82 (9.8%) |
| $25,000 to $34,999 | 194 (5.7%) | 40 (4.8%) |
| $35,000 to $49,999 | 570 (16.6%) | 87 (10.4%) |
| $50,000 to $74,999 | 581 (16.9%) | 146 (17.5%) |
| $75,000 to $99,999 | 485 (14.1%) | 136 (16.3%) |
| $100,000 to $149,999 | 772 (22.5%) | 59 (7.1%) |
| $150,000 or more | 444 (12.9%) | 96 (11.5%) |
| Total | 3,430 (100.0%) | 834 (100.0%) |
Monthly Housing Cost Tiers in Ward County
| Monthly Cost | Owner-occupied | Renter-occupied |
| Less than $300 | 480 (14.0%) | 27 (3.2%) |
| $300 to $499 | 1,009 (29.4%) | 47 (5.6%) |
| $500 to $799 | 795 (23.2%) | 180 (21.6%) |
| $800 to $999 | 186 (5.4%) | 73 (8.7%) |
| $1,000 to $1,499 | 524 (15.3%) | 254 (30.5%) |
| $1,500 to $1,999 | 323 (9.4%) | 156 (18.7%) |
| $2,000 to $2,499 | 73 (2.1%) | 0 (0.0%) |
| $2,500 to $2,999 | 6 (0.2%) | 0 (0.0%) |
| $3,000 or more | 34 (1.0%) | 4 (0.5%) |
| Total | 3,430 (100.0%) | 834 (100.0%) |
Physical Housing Characteristics in Ward County
Housing Structures in Ward County
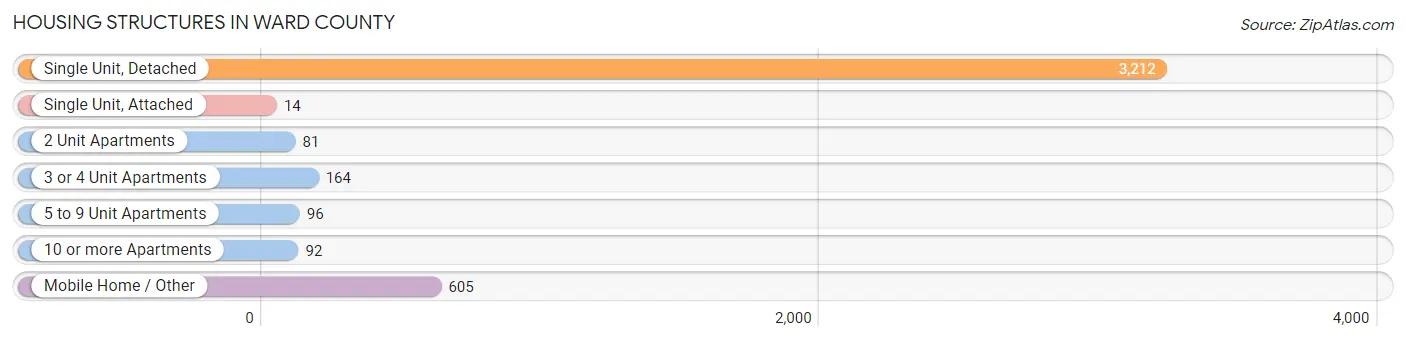
| Structure Type | # Housing Units | % Housing Units |
| Single Unit, Detached | 3,212 | 75.3% |
| Single Unit, Attached | 14 | 0.3% |
| 2 Unit Apartments | 81 | 1.9% |
| 3 or 4 Unit Apartments | 164 | 3.8% |
| 5 to 9 Unit Apartments | 96 | 2.2% |
| 10 or more Apartments | 92 | 2.2% |
| Mobile Home / Other | 605 | 14.2% |
| Total | 4,264 | 100.0% |
Housing Structures by Occupancy in Ward County
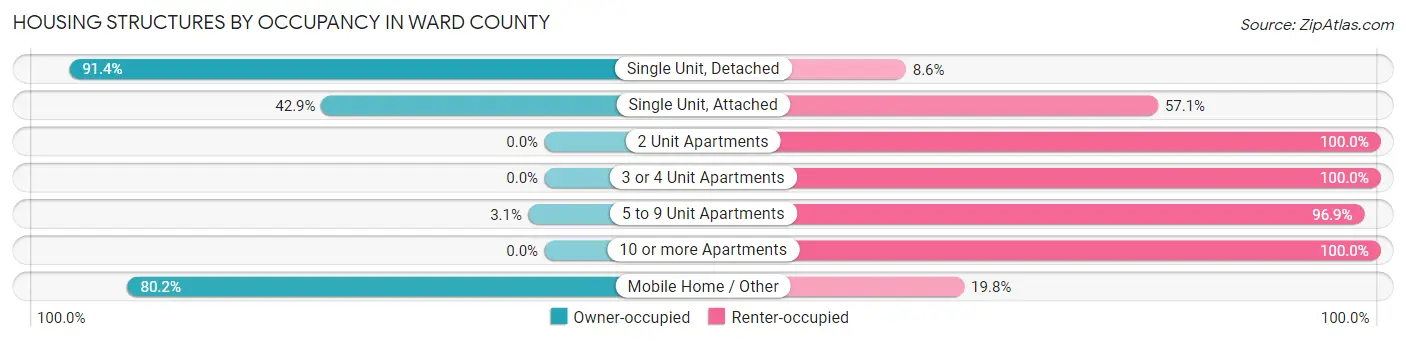
| Structure Type | Owner-occupied | Renter-occupied |
| Single Unit, Detached | 2,936 (91.4%) | 276 (8.6%) |
| Single Unit, Attached | 6 (42.9%) | 8 (57.1%) |
| 2 Unit Apartments | 0 (0.0%) | 81 (100.0%) |
| 3 or 4 Unit Apartments | 0 (0.0%) | 164 (100.0%) |
| 5 to 9 Unit Apartments | 3 (3.1%) | 93 (96.9%) |
| 10 or more Apartments | 0 (0.0%) | 92 (100.0%) |
| Mobile Home / Other | 485 (80.2%) | 120 (19.8%) |
| Total | 3,430 (80.4%) | 834 (19.6%) |
Housing Structures by Number of Rooms in Ward County
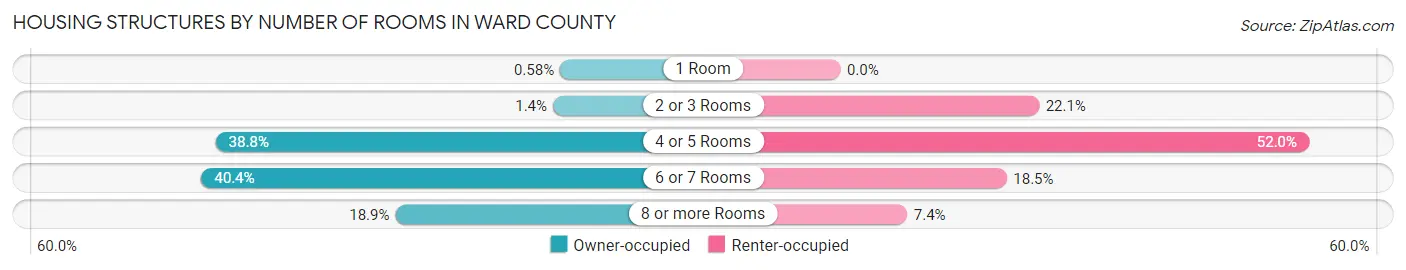
| Number of Rooms | Owner-occupied | Renter-occupied |
| 1 Room | 20 (0.6%) | 0 (0.0%) |
| 2 or 3 Rooms | 47 (1.4%) | 184 (22.1%) |
| 4 or 5 Rooms | 1,331 (38.8%) | 434 (52.0%) |
| 6 or 7 Rooms | 1,385 (40.4%) | 154 (18.5%) |
| 8 or more Rooms | 647 (18.9%) | 62 (7.4%) |
| Total | 3,430 (100.0%) | 834 (100.0%) |
Housing Structure by Heating Type in Ward County
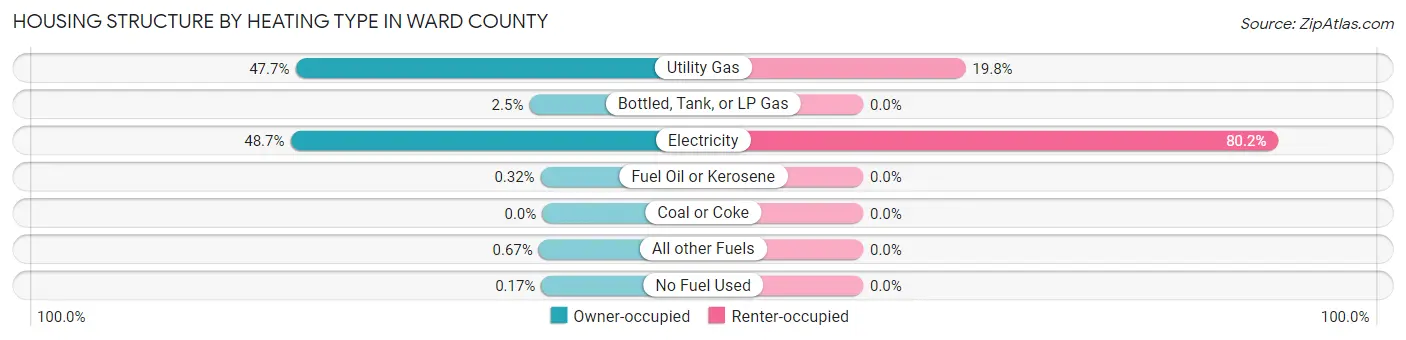
| Heating Type | Owner-occupied | Renter-occupied |
| Utility Gas | 1,636 (47.7%) | 165 (19.8%) |
| Bottled, Tank, or LP Gas | 85 (2.5%) | 0 (0.0%) |
| Electricity | 1,669 (48.7%) | 669 (80.2%) |
| Fuel Oil or Kerosene | 11 (0.3%) | 0 (0.0%) |
| Coal or Coke | 0 (0.0%) | 0 (0.0%) |
| All other Fuels | 23 (0.7%) | 0 (0.0%) |
| No Fuel Used | 6 (0.2%) | 0 (0.0%) |
| Total | 3,430 (100.0%) | 834 (100.0%) |
Household Vehicle Usage in Ward County
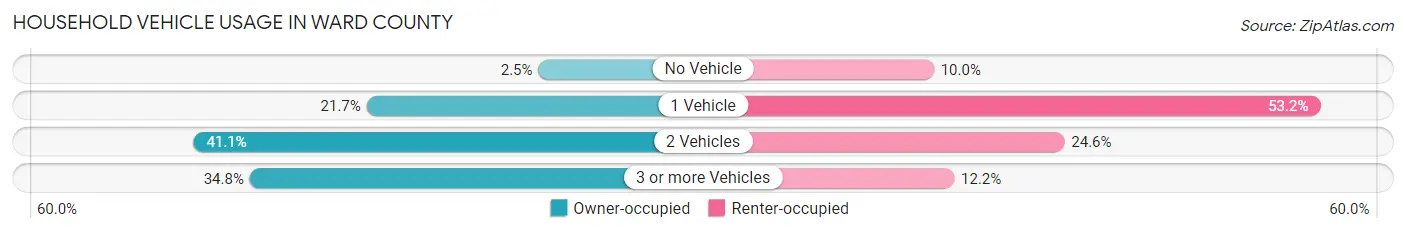
| Vehicles per Household | Owner-occupied | Renter-occupied |
| No Vehicle | 84 (2.5%) | 83 (10.0%) |
| 1 Vehicle | 744 (21.7%) | 444 (53.2%) |
| 2 Vehicles | 1,409 (41.1%) | 205 (24.6%) |
| 3 or more Vehicles | 1,193 (34.8%) | 102 (12.2%) |
| Total | 3,430 (100.0%) | 834 (100.0%) |
Real Estate & Mortgages in Ward County
Real Estate and Mortgage Overview in Ward County
| Characteristic | Without Mortgage | With Mortgage |
| Housing Units | 2,355 | 1,075 |
| Median Property Value | $94,700 | $160,700 |
| Median Household Income | $59,004 | $106 |
| Monthly Housing Costs | $458 | $34 |
| Real Estate Taxes | $449 | $26 |
Property Value by Mortgage Status in Ward County
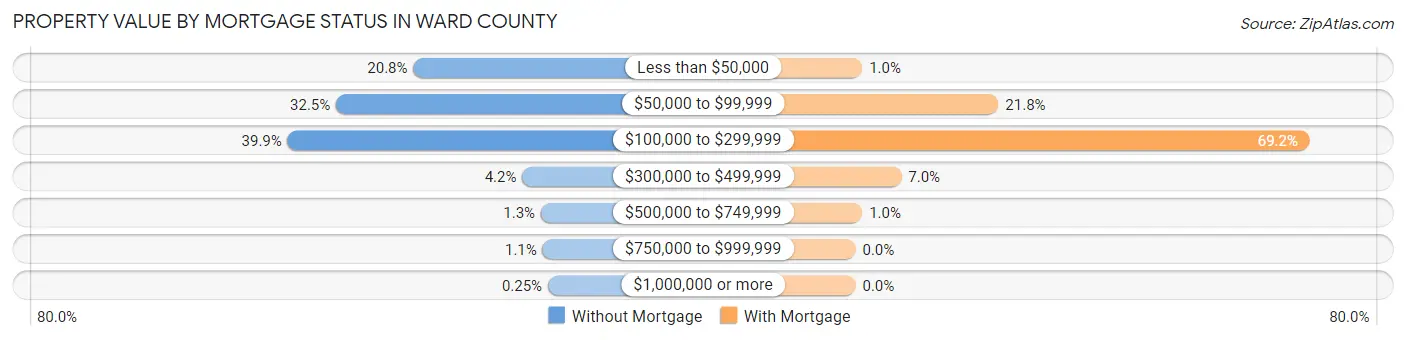
| Property Value | Without Mortgage | With Mortgage |
| Less than $50,000 | 489 (20.8%) | 11 (1.0%) |
| $50,000 to $99,999 | 766 (32.5%) | 234 (21.8%) |
| $100,000 to $299,999 | 940 (39.9%) | 744 (69.2%) |
| $300,000 to $499,999 | 98 (4.2%) | 75 (7.0%) |
| $500,000 to $749,999 | 31 (1.3%) | 11 (1.0%) |
| $750,000 to $999,999 | 25 (1.1%) | 0 (0.0%) |
| $1,000,000 or more | 6 (0.3%) | 0 (0.0%) |
| Total | 2,355 (100.0%) | 1,075 (100.0%) |
Household Income by Mortgage Status in Ward County
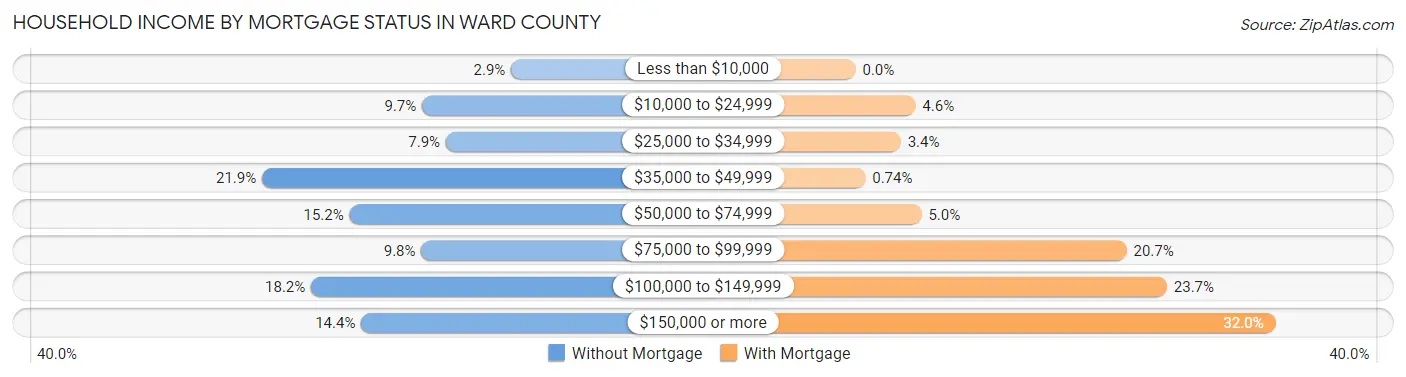
| Household Income | Without Mortgage | With Mortgage |
| Less than $10,000 | 69 (2.9%) | 0 (0.0%) |
| $10,000 to $24,999 | 229 (9.7%) | 49 (4.6%) |
| $25,000 to $34,999 | 186 (7.9%) | 37 (3.4%) |
| $35,000 to $49,999 | 516 (21.9%) | 8 (0.7%) |
| $50,000 to $74,999 | 359 (15.2%) | 54 (5.0%) |
| $75,000 to $99,999 | 230 (9.8%) | 222 (20.6%) |
| $100,000 to $149,999 | 428 (18.2%) | 255 (23.7%) |
| $150,000 or more | 338 (14.3%) | 344 (32.0%) |
| Total | 2,355 (100.0%) | 1,075 (100.0%) |
Property Value to Household Income Ratio in Ward County
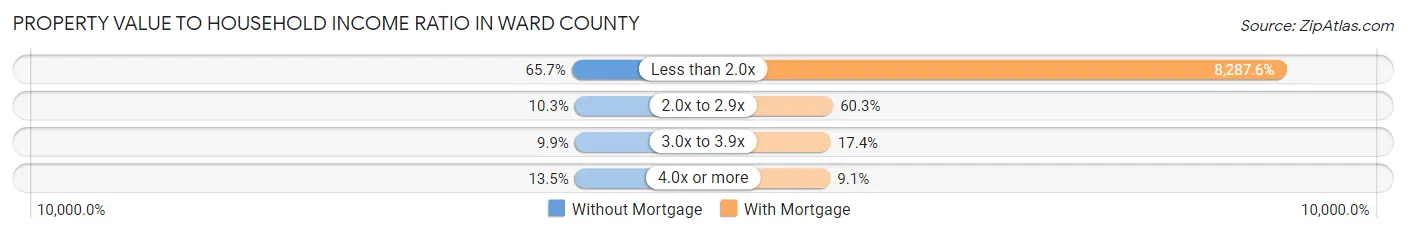
| Value-to-Income Ratio | Without Mortgage | With Mortgage |
| Less than 2.0x | 1,548 (65.7%) | 89,092 (8,287.6%) |
| 2.0x to 2.9x | 242 (10.3%) | 648 (60.3%) |
| 3.0x to 3.9x | 234 (9.9%) | 187 (17.4%) |
| 4.0x or more | 317 (13.5%) | 98 (9.1%) |
| Total | 2,355 (100.0%) | 1,075 (100.0%) |
Real Estate Taxes by Mortgage Status in Ward County
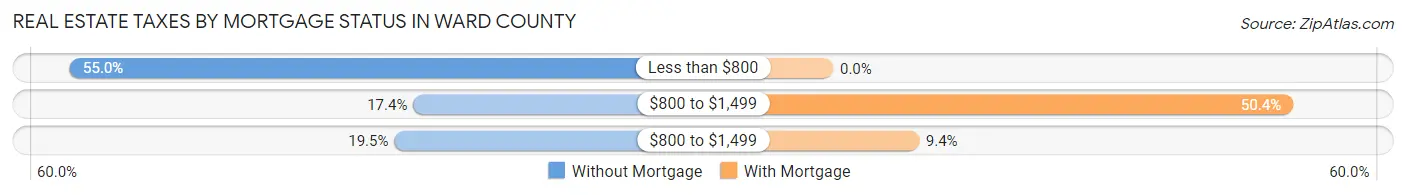
| Property Taxes | Without Mortgage | With Mortgage |
| Less than $800 | 1,296 (55.0%) | 0 (0.0%) |
| $800 to $1,499 | 410 (17.4%) | 542 (50.4%) |
| $800 to $1,499 | 459 (19.5%) | 101 (9.4%) |
| Total | 2,355 (100.0%) | 1,075 (100.0%) |
Health & Disability in Ward County
Health Insurance Coverage by Age in Ward County
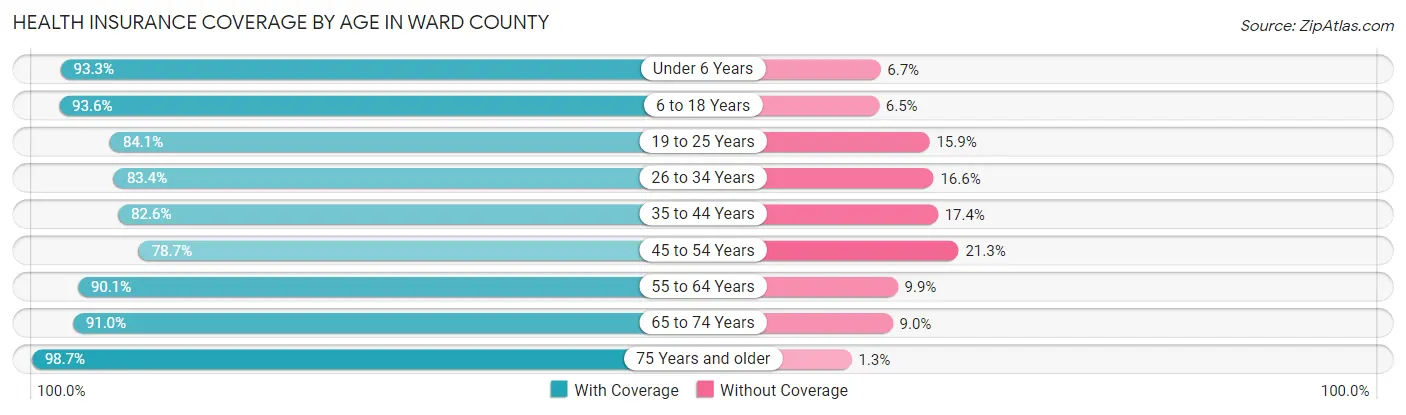
| Age Bracket | With Coverage | Without Coverage |
| Under 6 Years | 874 (93.3%) | 63 (6.7%) |
| 6 to 18 Years | 2,307 (93.5%) | 159 (6.5%) |
| 19 to 25 Years | 672 (84.1%) | 127 (15.9%) |
| 26 to 34 Years | 1,168 (83.4%) | 233 (16.6%) |
| 35 to 44 Years | 1,375 (82.6%) | 290 (17.4%) |
| 45 to 54 Years | 1,002 (78.7%) | 271 (21.3%) |
| 55 to 64 Years | 1,096 (90.1%) | 121 (9.9%) |
| 65 to 74 Years | 728 (91.0%) | 72 (9.0%) |
| 75 Years and older | 669 (98.7%) | 9 (1.3%) |
| Total | 9,891 (88.0%) | 1,345 (12.0%) |
Health Insurance Coverage by Citizenship Status in Ward County
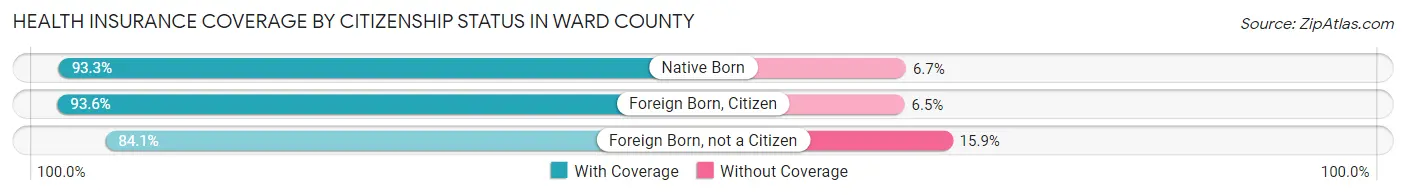
| Citizenship Status | With Coverage | Without Coverage |
| Native Born | 874 (93.3%) | 63 (6.7%) |
| Foreign Born, Citizen | 2,307 (93.5%) | 159 (6.5%) |
| Foreign Born, not a Citizen | 672 (84.1%) | 127 (15.9%) |
Health Insurance Coverage by Household Income in Ward County
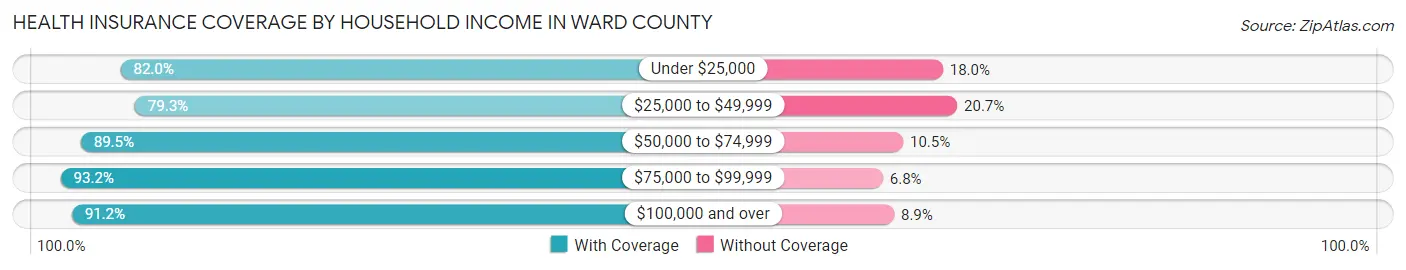
| Household Income | With Coverage | Without Coverage |
| Under $25,000 | 1,346 (82.0%) | 295 (18.0%) |
| $25,000 to $49,999 | 1,332 (79.3%) | 347 (20.7%) |
| $50,000 to $74,999 | 1,629 (89.5%) | 192 (10.5%) |
| $75,000 to $99,999 | 1,434 (93.2%) | 104 (6.8%) |
| $100,000 and over | 4,149 (91.1%) | 403 (8.8%) |
Public vs Private Health Insurance Coverage by Age in Ward County
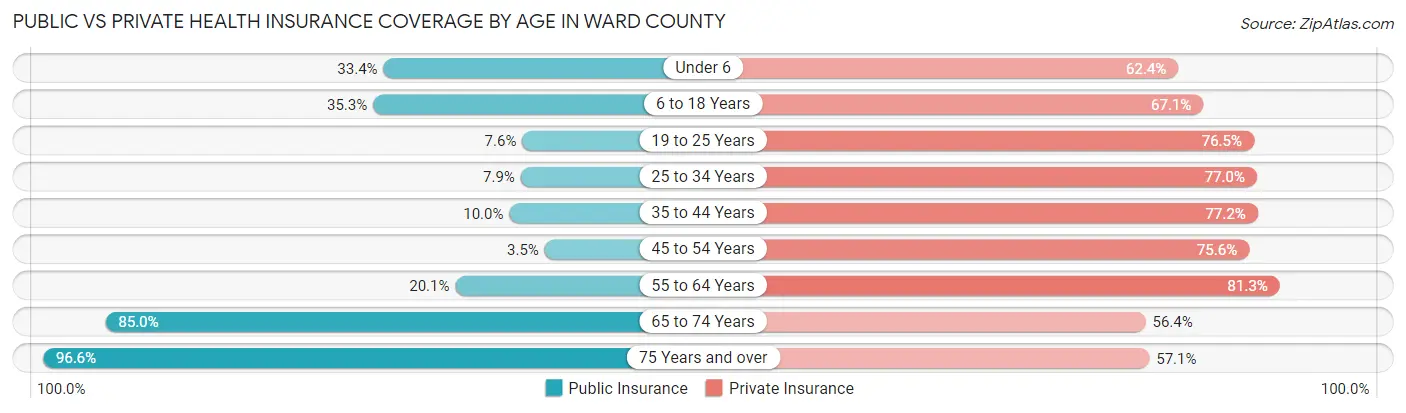
| Age Bracket | Public Insurance | Private Insurance |
| Under 6 | 313 (33.4%) | 585 (62.4%) |
| 6 to 18 Years | 871 (35.3%) | 1,654 (67.1%) |
| 19 to 25 Years | 61 (7.6%) | 611 (76.5%) |
| 25 to 34 Years | 111 (7.9%) | 1,079 (77.0%) |
| 35 to 44 Years | 167 (10.0%) | 1,285 (77.2%) |
| 45 to 54 Years | 44 (3.5%) | 962 (75.6%) |
| 55 to 64 Years | 244 (20.1%) | 989 (81.3%) |
| 65 to 74 Years | 680 (85.0%) | 451 (56.4%) |
| 75 Years and over | 655 (96.6%) | 387 (57.1%) |
| Total | 3,146 (28.0%) | 8,003 (71.2%) |
Disability Status by Sex by Age in Ward County
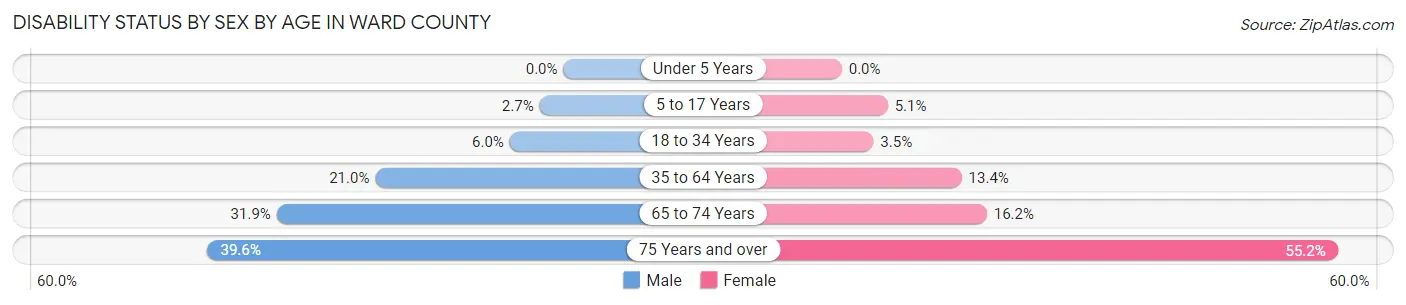
| Age Bracket | Male | Female |
| Under 5 Years | 0 (0.0%) | 0 (0.0%) |
| 5 to 17 Years | 31 (2.7%) | 64 (5.1%) |
| 18 to 34 Years | 74 (6.0%) | 38 (3.5%) |
| 35 to 64 Years | 461 (20.9%) | 261 (13.4%) |
| 65 to 74 Years | 121 (31.9%) | 68 (16.2%) |
| 75 Years and over | 105 (39.6%) | 228 (55.2%) |
Disability Class by Sex by Age in Ward County
Disability Class: Hearing Difficulty
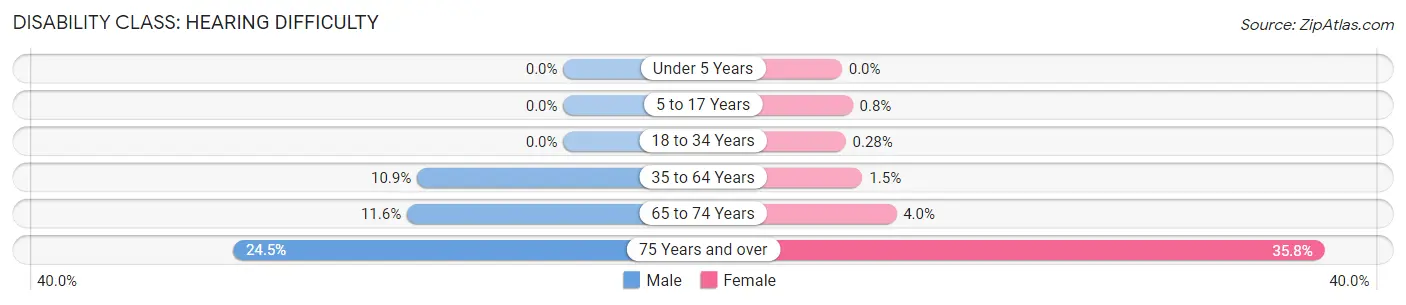
| Age Bracket | Male | Female |
| Under 5 Years | 0 (0.0%) | 0 (0.0%) |
| 5 to 17 Years | 0 (0.0%) | 10 (0.8%) |
| 18 to 34 Years | 0 (0.0%) | 3 (0.3%) |
| 35 to 64 Years | 239 (10.9%) | 30 (1.5%) |
| 65 to 74 Years | 44 (11.6%) | 17 (4.0%) |
| 75 Years and over | 65 (24.5%) | 148 (35.8%) |
Disability Class: Vision Difficulty
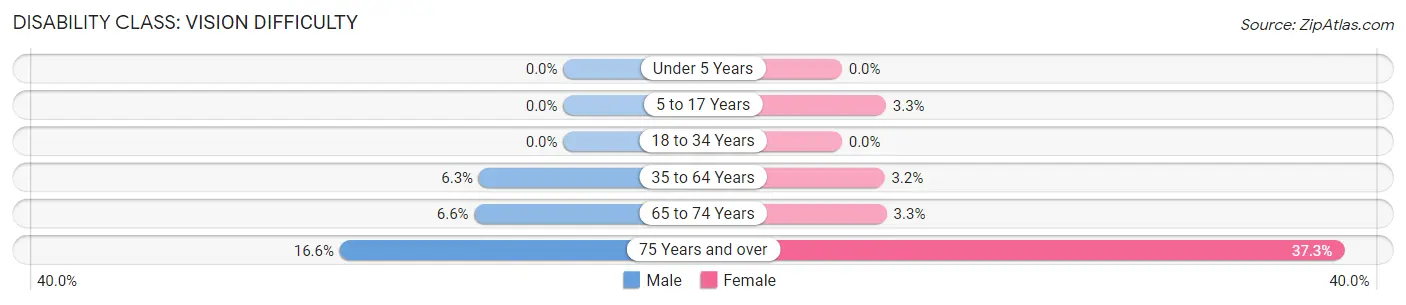
| Age Bracket | Male | Female |
| Under 5 Years | 0 (0.0%) | 0 (0.0%) |
| 5 to 17 Years | 0 (0.0%) | 41 (3.3%) |
| 18 to 34 Years | 0 (0.0%) | 0 (0.0%) |
| 35 to 64 Years | 138 (6.3%) | 62 (3.2%) |
| 65 to 74 Years | 25 (6.6%) | 14 (3.3%) |
| 75 Years and over | 44 (16.6%) | 154 (37.3%) |
Disability Class: Cognitive Difficulty
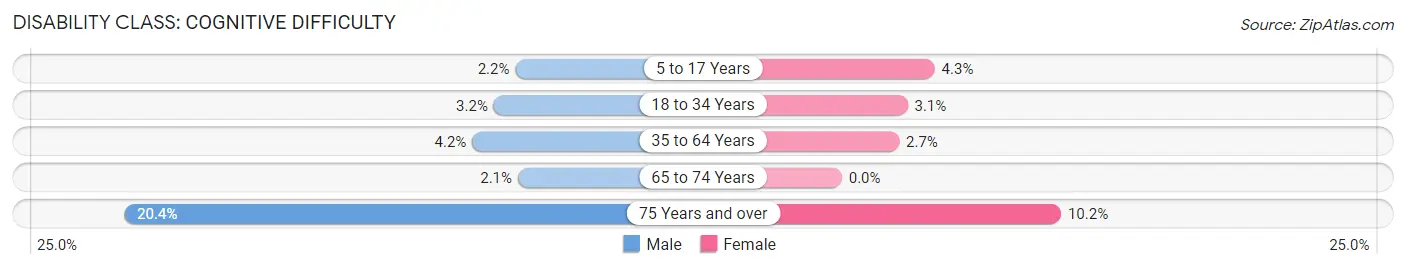
| Age Bracket | Male | Female |
| 5 to 17 Years | 26 (2.2%) | 54 (4.3%) |
| 18 to 34 Years | 40 (3.2%) | 33 (3.0%) |
| 35 to 64 Years | 93 (4.2%) | 52 (2.7%) |
| 65 to 74 Years | 8 (2.1%) | 0 (0.0%) |
| 75 Years and over | 54 (20.4%) | 42 (10.2%) |
Disability Class: Ambulatory Difficulty
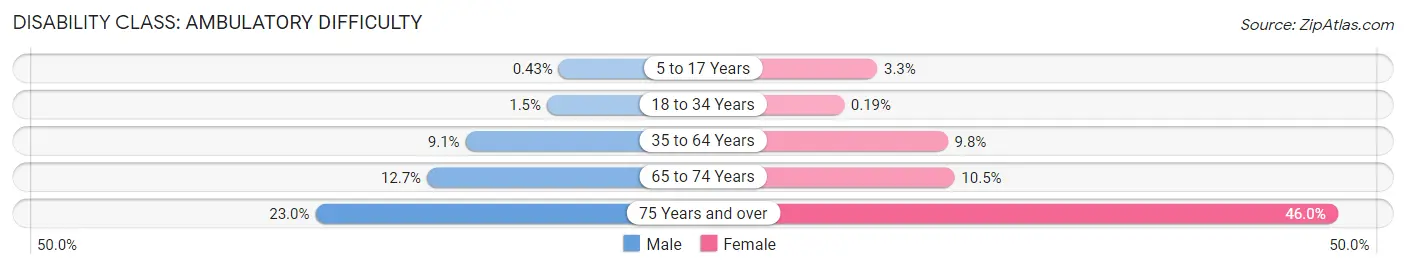
| Age Bracket | Male | Female |
| 5 to 17 Years | 5 (0.4%) | 41 (3.3%) |
| 18 to 34 Years | 19 (1.5%) | 2 (0.2%) |
| 35 to 64 Years | 200 (9.1%) | 192 (9.8%) |
| 65 to 74 Years | 48 (12.7%) | 44 (10.4%) |
| 75 Years and over | 61 (23.0%) | 190 (46.0%) |
Disability Class: Self-Care Difficulty
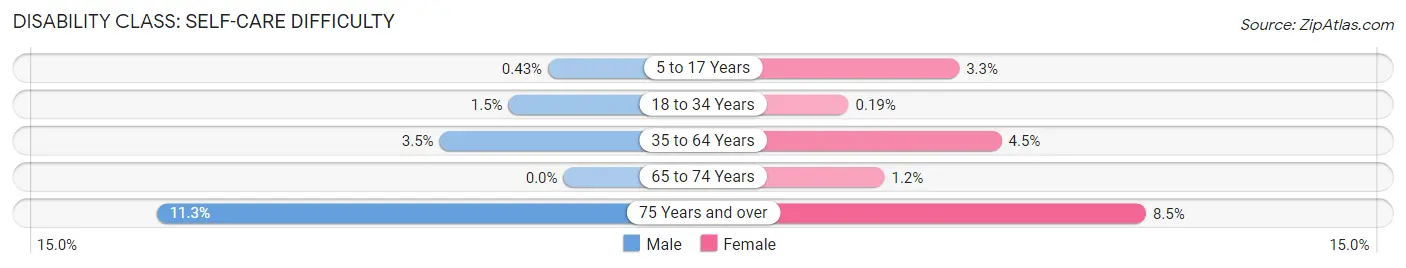
| Age Bracket | Male | Female |
| 5 to 17 Years | 5 (0.4%) | 41 (3.3%) |
| 18 to 34 Years | 19 (1.5%) | 2 (0.2%) |
| 35 to 64 Years | 76 (3.5%) | 87 (4.4%) |
| 65 to 74 Years | 0 (0.0%) | 5 (1.2%) |
| 75 Years and over | 30 (11.3%) | 35 (8.5%) |
Technology Access in Ward County
Computing Device Access in Ward County
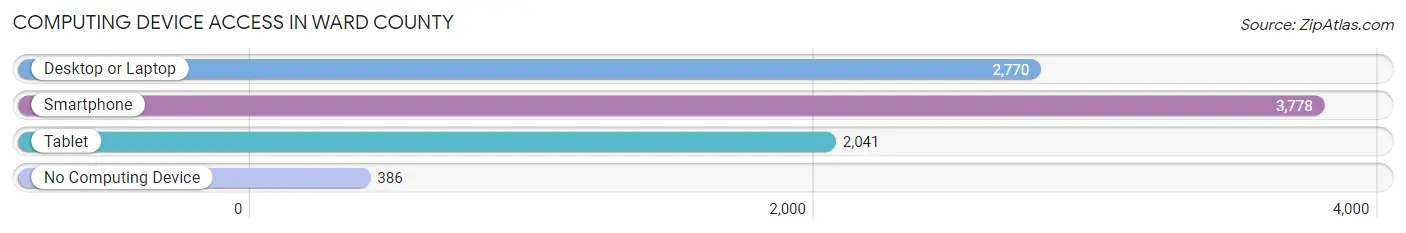
| Device Type | # Households | % Households |
| Desktop or Laptop | 2,770 | 65.0% |
| Smartphone | 3,778 | 88.6% |
| Tablet | 2,041 | 47.9% |
| No Computing Device | 386 | 9.0% |
| Total | 4,264 | 100.0% |
Internet Access in Ward County
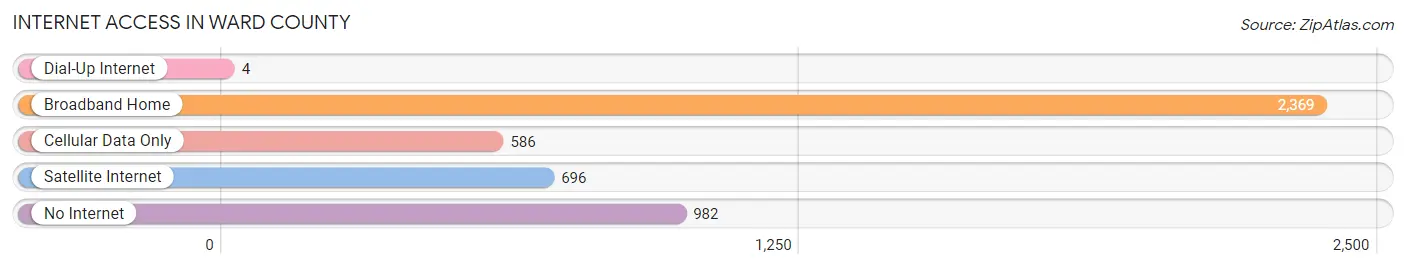
| Internet Type | # Households | % Households |
| Dial-Up Internet | 4 | 0.1% |
| Broadband Home | 2,369 | 55.6% |
| Cellular Data Only | 586 | 13.7% |
| Satellite Internet | 696 | 16.3% |
| No Internet | 982 | 23.0% |
| Total | 4,264 | 100.0% |
Ward County Summary
Ward County is located in the western part of the state of Texas, in the United States. It is bordered by Andrews County to the north, Winkler County to the east, Loving County to the south, and Reeves County to the west. The county seat is Monahans, and the largest city is Monahans. As of the 2010 census, the population was 10,658.
History
Ward County was established in 1887 from Tom Green County. It was named for Thomas William Ward, a Texas state senator and Confederate soldier. The county was originally part of the Comanche Reservation, and the first settlers arrived in the 1880s. The county was organized in 1891, and the first courthouse was built in Monahans in 1892.
Geography
Ward County covers an area of 902 square miles, making it the second-smallest county in Texas. The terrain is mostly flat, with some rolling hills in the northern part of the county. The Pecos River forms the western boundary of the county, and the Monahans Sandhills are located in the southern part of the county.
The climate is semi-arid, with hot summers and mild winters. The average annual precipitation is about 15 inches.
Economy
The economy of Ward County is largely based on oil and gas production. The county is home to several oil and gas fields, including the Ward-Estes Field, the Ward-Loving Field, and the Ward-Reeves Field. Other industries in the county include agriculture, ranching, and tourism.
Demographics
As of the 2010 census, there were 10,658 people, 3,845 households, and 2,717 families living in Ward County. The population density was 11.8 people per square mile. The racial makeup of the county was 75.3% White, 0.7% African American, 0.7% Native American, 0.3% Asian, 0.1% Pacific Islander, 20.3% from other races, and 2.6% from two or more races. Hispanic or Latino of any race were 44.2% of the population.
The median income for a household in the county was $35,945, and the median income for a family was $41,945. The per capita income for the county was $17,845. About 17.2% of families and 22.2% of the population were below the poverty line, including 28.3% of those under age 18 and 15.2% of those age 65 or over.
Common Questions
What is Per Capita Income in Ward County?
Per Capita income in Ward County is $30,854.
What is the Median Family Income in Ward County?
Median Family Income in Ward County is $72,233.
What is the Median Household income in Ward County?
Median Household Income in Ward County is $70,771.
What is Income or Wage Gap in Ward County?
Income or Wage Gap in Ward County is 58.8%.
Women in Ward County earn 41.2 cents for every dollar earned by a man.
What is Family Income Deficit in Ward County?
Family Income Deficit in Ward County is $12,578.
Families that are below poverty line in Ward County earn $12,578 less on average than the poverty threshold level.
What is Inequality or Gini Index in Ward County?
Inequality or Gini Index in Ward County is 0.42.
What is the Total Population of Ward County?
Total Population of Ward County is 11,347.
What is the Total Male Population of Ward County?
Total Male Population of Ward County is 5,732.
What is the Total Female Population of Ward County?
Total Female Population of Ward County is 5,615.
What is the Ratio of Males per 100 Females in Ward County?
There are 102.08 Males per 100 Females in Ward County.
What is the Ratio of Females per 100 Males in Ward County?
There are 97.96 Females per 100 Males in Ward County.
What is the Median Population Age in Ward County?
Median Population Age in Ward County is 35.2 Years.
What is the Average Family Size in Ward County
Average Family Size in Ward County is 3.1 People.
What is the Average Household Size in Ward County
Average Household Size in Ward County is 2.6 People.
How Large is the Labor Force in Ward County?
There are 5,409 People in the Labor Forcein in Ward County.
What is the Percentage of People in the Labor Force in Ward County?
64.3% of People are in the Labor Force in Ward County.
What is the Unemployment Rate in Ward County?
Unemployment Rate in Ward County is 5.5%.