Waller County, TX Map & Demographics
Waller County Map
Waller County Overview
$32,446
PER CAPITA INCOME
$86,563
AVG FAMILY INCOME
$71,643
AVG HOUSEHOLD INCOME
44.2%
WAGE / INCOME GAP [ % ]
55.8¢/ $1
WAGE / INCOME GAP [ $ ]
0.46
INEQUALITY / GINI INDEX
57,463
TOTAL POPULATION
28,521
MALE POPULATION
28,942
FEMALE POPULATION
98.55
MALES / 100 FEMALES
101.48
FEMALES / 100 MALES
28.7
MEDIAN AGE
3.4
AVG FAMILY SIZE
3.0
AVG HOUSEHOLD SIZE
26,537
LABOR FORCE [ PEOPLE ]
58.4%
PERCENT IN LABOR FORCE
6.1%
UNEMPLOYMENT RATE
Income in Waller County
Income Overview in Waller County
Per Capita Income in Waller County is $32,446, while median incomes of families and households are $86,563 and $71,643 respectively.
| Characteristic | Number | Measure |
| Per Capita Income | 57,463 | $32,446 |
| Median Family Income | 13,392 | $86,563 |
| Mean Family Income | 13,392 | $118,471 |
| Median Household Income | 17,780 | $71,643 |
| Mean Household Income | 17,780 | $102,547 |
| Income Deficit | 13,392 | $0 |
| Wage / Income Gap (%) | 57,463 | 44.22% |
| Wage / Income Gap ($) | 57,463 | 55.78¢ per $1 |
| Gini / Inequality Index | 57,463 | 0.46 |
Earnings by Sex in Waller County
Average Earnings in Waller County are $35,815, $47,491 for men and $26,492 for women, a difference of 44.2%.
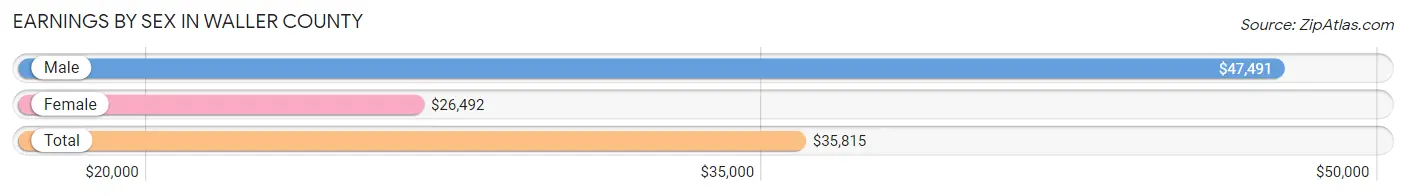
| Sex | Number | Average Earnings |
| Male | 15,268 (54.1%) | $47,491 |
| Female | 12,958 (45.9%) | $26,492 |
| Total | 28,226 (100.0%) | $35,815 |
Earnings by Sex by Income Bracket in Waller County
The most common earnings brackets in Waller County are $100,000+ for men (3,006 | 19.7%) and $30,000 to $34,999 for women (1,098 | 8.5%).
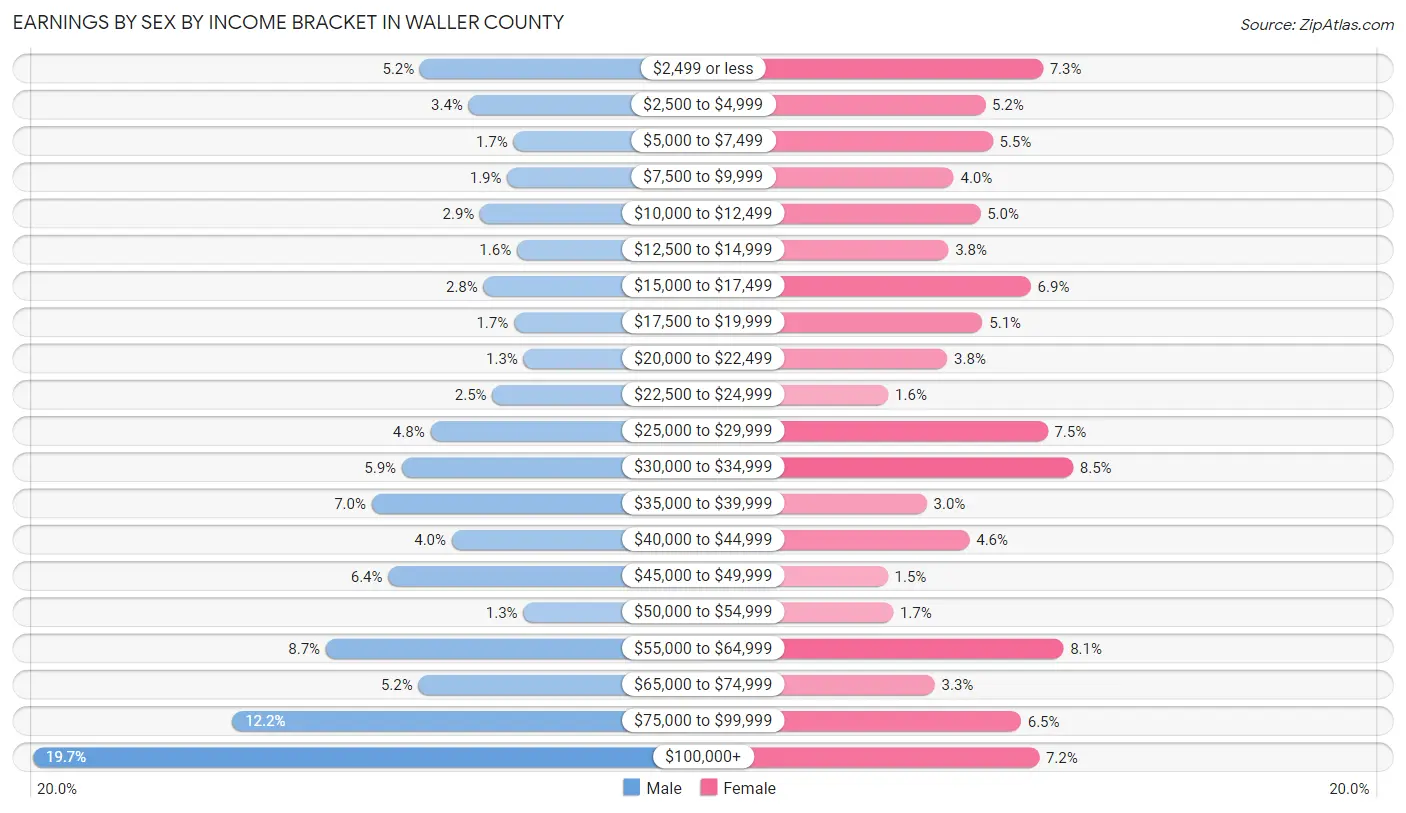
| Income | Male | Female |
| $2,499 or less | 791 (5.2%) | 951 (7.3%) |
| $2,500 to $4,999 | 513 (3.4%) | 671 (5.2%) |
| $5,000 to $7,499 | 256 (1.7%) | 707 (5.5%) |
| $7,500 to $9,999 | 292 (1.9%) | 518 (4.0%) |
| $10,000 to $12,499 | 447 (2.9%) | 648 (5.0%) |
| $12,500 to $14,999 | 237 (1.5%) | 492 (3.8%) |
| $15,000 to $17,499 | 428 (2.8%) | 893 (6.9%) |
| $17,500 to $19,999 | 253 (1.7%) | 658 (5.1%) |
| $20,000 to $22,499 | 198 (1.3%) | 487 (3.8%) |
| $22,500 to $24,999 | 377 (2.5%) | 201 (1.5%) |
| $25,000 to $29,999 | 732 (4.8%) | 975 (7.5%) |
| $30,000 to $34,999 | 894 (5.9%) | 1,098 (8.5%) |
| $35,000 to $39,999 | 1,067 (7.0%) | 387 (3.0%) |
| $40,000 to $44,999 | 609 (4.0%) | 595 (4.6%) |
| $45,000 to $49,999 | 972 (6.4%) | 198 (1.5%) |
| $50,000 to $54,999 | 200 (1.3%) | 224 (1.7%) |
| $55,000 to $64,999 | 1,330 (8.7%) | 1,051 (8.1%) |
| $65,000 to $74,999 | 800 (5.2%) | 426 (3.3%) |
| $75,000 to $99,999 | 1,866 (12.2%) | 845 (6.5%) |
| $100,000+ | 3,006 (19.7%) | 933 (7.2%) |
| Total | 15,268 (100.0%) | 12,958 (100.0%) |
Earnings by Sex by Educational Attainment in Waller County
Average earnings in Waller County are $57,926 for men and $35,625 for women, a difference of 38.5%. Men with an educational attainment of graduate degree enjoy the highest average annual earnings of $113,427, while those with less than high school education earn the least with $43,728. Women with an educational attainment of graduate degree earn the most with the average annual earnings of $80,391, while those with less than high school education have the smallest earnings of $19,141.
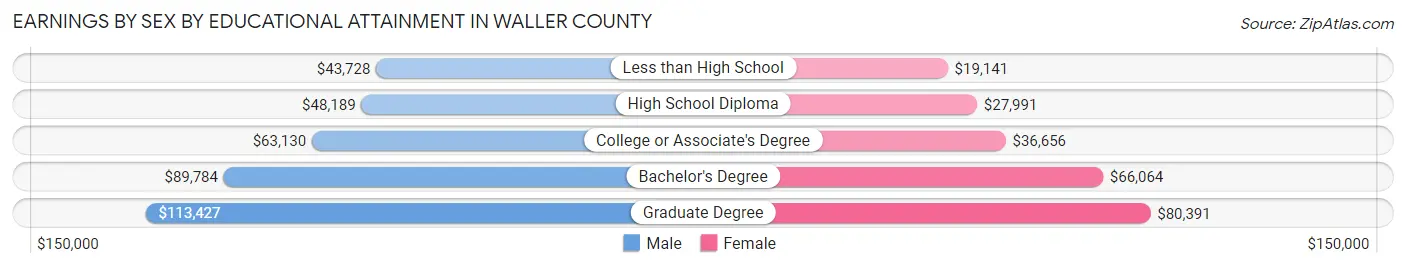
| Educational Attainment | Male Income | Female Income |
| Less than High School | $43,728 | $19,141 |
| High School Diploma | $48,189 | $27,991 |
| College or Associate's Degree | $63,130 | $36,656 |
| Bachelor's Degree | $89,784 | $66,064 |
| Graduate Degree | $113,427 | $80,391 |
| Total | $57,926 | $35,625 |
Family Income in Waller County
Family Income Brackets in Waller County
According to the Waller County family income data, there are 2,424 families falling into the $100,000 to $149,999 income range, which is the most common income bracket and makes up 18.1% of all families. Conversely, the $10,000 to $14,999 income bracket is the least frequent group with only 187 families (1.4%) belonging to this category.
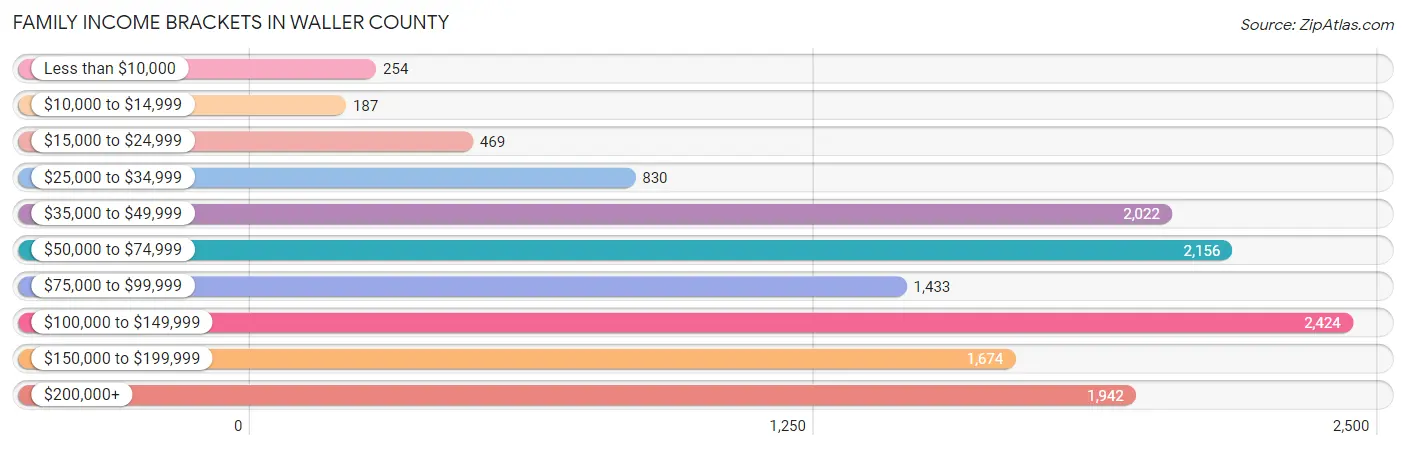
| Income Bracket | # Families | % Families |
| Less than $10,000 | 254 | 1.9% |
| $10,000 to $14,999 | 187 | 1.4% |
| $15,000 to $24,999 | 469 | 3.5% |
| $25,000 to $34,999 | 830 | 6.2% |
| $35,000 to $49,999 | 2,022 | 15.1% |
| $50,000 to $74,999 | 2,156 | 16.1% |
| $75,000 to $99,999 | 1,433 | 10.7% |
| $100,000 to $149,999 | 2,424 | 18.1% |
| $150,000 to $199,999 | 1,674 | 12.5% |
| $200,000+ | 1,942 | 14.5% |
Family Income by Famaliy Size in Waller County
7+ person families (257 | 1.9%) account for the highest median family income in Waller County with $125,417 per family, while 2-person families (6,167 | 46.1%) have the highest median income of $37,260 per family member.
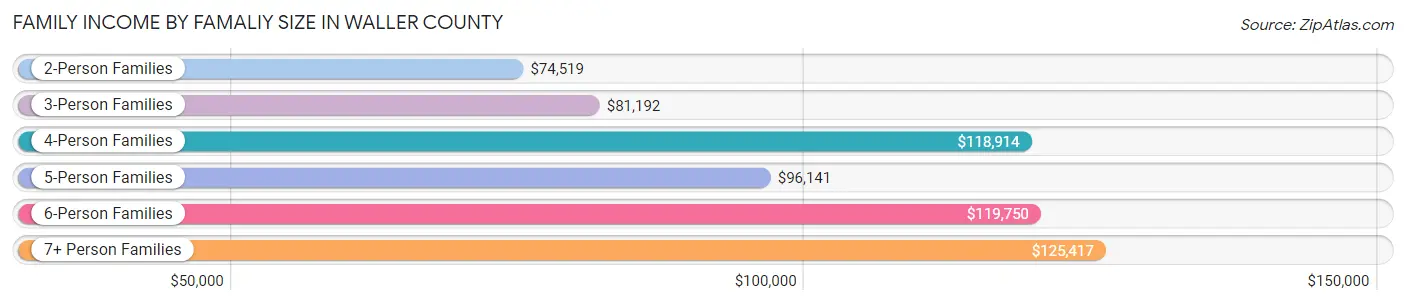
| Income Bracket | # Families | Median Income |
| 2-Person Families | 6,167 (46.1%) | $74,519 |
| 3-Person Families | 3,101 (23.2%) | $81,192 |
| 4-Person Families | 2,275 (17.0%) | $118,914 |
| 5-Person Families | 1,179 (8.8%) | $96,141 |
| 6-Person Families | 413 (3.1%) | $119,750 |
| 7+ Person Families | 257 (1.9%) | $125,417 |
| Total | 13,392 (100.0%) | $86,563 |
Family Income by Number of Earners in Waller County
The median family income in Waller County is $86,563, with families comprising 3+ earners (1,566) having the highest median family income of $164,838, while families with 1 earner (5,542) have the lowest median family income of $56,547, accounting for 11.7% and 41.4% of families, respectively.
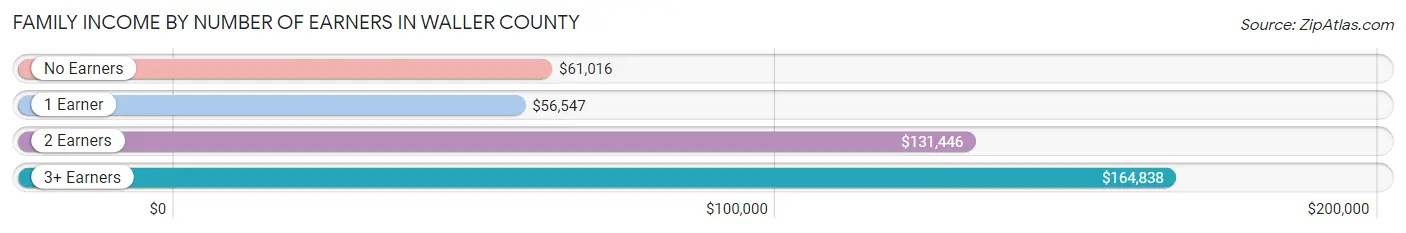
| Number of Earners | # Families | Median Income |
| No Earners | 1,737 (13.0%) | $61,016 |
| 1 Earner | 5,542 (41.4%) | $56,547 |
| 2 Earners | 4,547 (34.0%) | $131,446 |
| 3+ Earners | 1,566 (11.7%) | $164,838 |
| Total | 13,392 (100.0%) | $86,563 |
Household Income in Waller County
Household Income Brackets in Waller County
With 2,934 households falling in the category, the $50,000 to $74,999 income range is the most frequent in Waller County, accounting for 16.5% of all households. In contrast, only 356 households (2.0%) fall into the $10,000 to $14,999 income bracket, making it the least populous group.
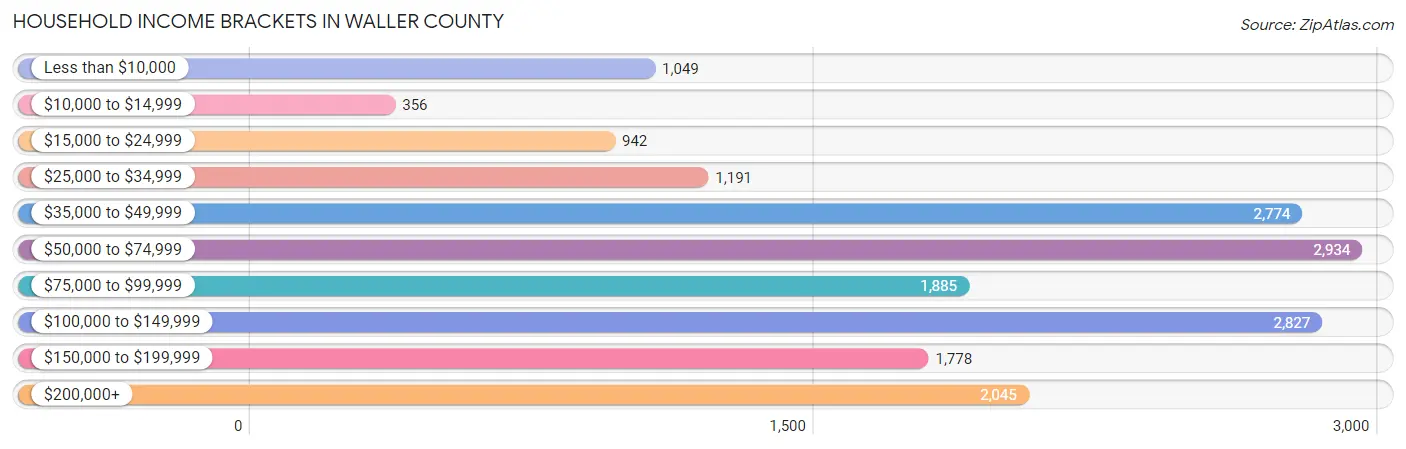
| Income Bracket | # Households | % Households |
| Less than $10,000 | 1,049 | 5.9% |
| $10,000 to $14,999 | 356 | 2.0% |
| $15,000 to $24,999 | 942 | 5.3% |
| $25,000 to $34,999 | 1,191 | 6.7% |
| $35,000 to $49,999 | 2,774 | 15.6% |
| $50,000 to $74,999 | 2,934 | 16.5% |
| $75,000 to $99,999 | 1,885 | 10.6% |
| $100,000 to $149,999 | 2,827 | 15.9% |
| $150,000 to $199,999 | 1,778 | 10.0% |
| $200,000+ | 2,045 | 11.5% |
Household Income by Householder Age in Waller County
The median household income in Waller County is $71,643, with the highest median household income of $112,362 found in the 45 to 64 years age bracket for the primary householder. A total of 6,533 households (36.7%) fall into this category. Meanwhile, the 15 to 24 years age bracket for the primary householder has the lowest median household income of $21,649, with 1,561 households (8.8%) in this group.
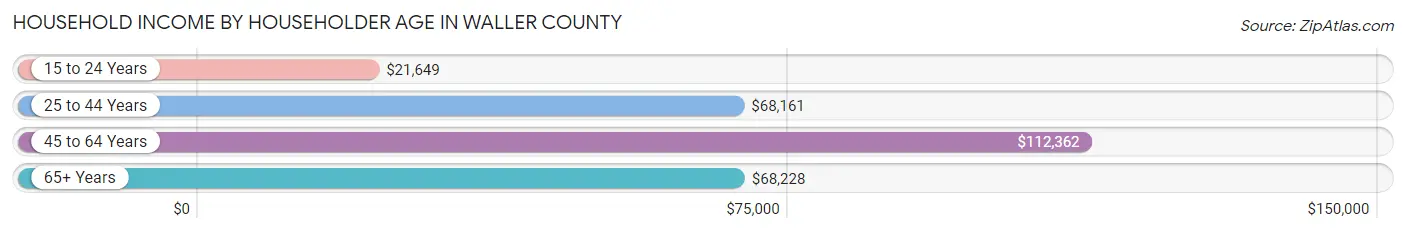
| Income Bracket | # Households | Median Income |
| 15 to 24 Years | 1,561 (8.8%) | $21,649 |
| 25 to 44 Years | 6,256 (35.2%) | $68,161 |
| 45 to 64 Years | 6,533 (36.7%) | $112,362 |
| 65+ Years | 3,430 (19.3%) | $68,228 |
| Total | 17,780 (100.0%) | $71,643 |
Poverty in Waller County
Income Below Poverty by Sex and Age in Waller County
With 11.7% poverty level for males and 14.4% for females among the residents of Waller County, 15 year old males and 12 to 14 year old females are the most vulnerable to poverty, with 141 males (39.9%) and 297 females (30.2%) in their respective age groups living below the poverty level.
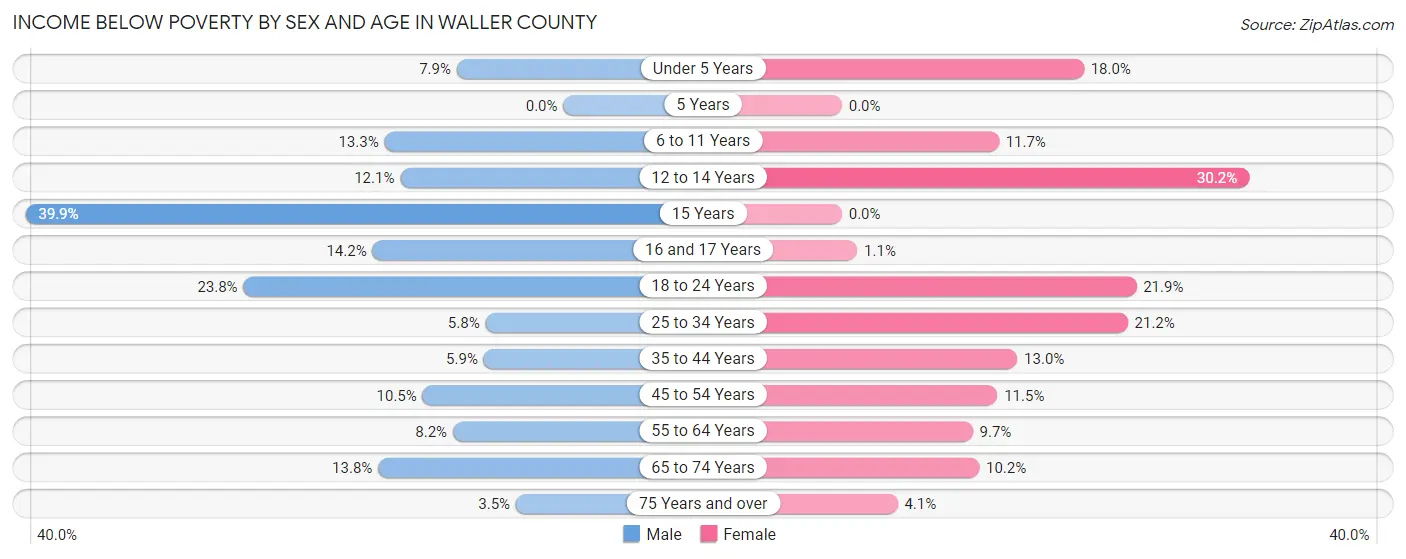
| Age Bracket | Male | Female |
| Under 5 Years | 149 (7.9%) | 281 (18.0%) |
| 5 Years | 0 (0.0%) | 0 (0.0%) |
| 6 to 11 Years | 274 (13.3%) | 314 (11.7%) |
| 12 to 14 Years | 148 (12.1%) | 297 (30.2%) |
| 15 Years | 141 (39.9%) | 0 (0.0%) |
| 16 and 17 Years | 105 (14.2%) | 7 (1.1%) |
| 18 to 24 Years | 1,097 (23.7%) | 815 (21.9%) |
| 25 to 34 Years | 195 (5.8%) | 723 (21.2%) |
| 35 to 44 Years | 201 (5.9%) | 390 (13.0%) |
| 45 to 54 Years | 292 (10.4%) | 328 (11.5%) |
| 55 to 64 Years | 254 (8.2%) | 288 (9.7%) |
| 65 to 74 Years | 284 (13.8%) | 219 (10.2%) |
| 75 Years and over | 35 (3.5%) | 53 (4.1%) |
| Total | 3,175 (11.7%) | 3,715 (14.4%) |
Income Above Poverty by Sex and Age in Waller County
According to the poverty statistics in Waller County, males aged 5 years and females aged 5 years are the age groups that are most secure financially, with 100.0% of males and 100.0% of females in these age groups living above the poverty line.
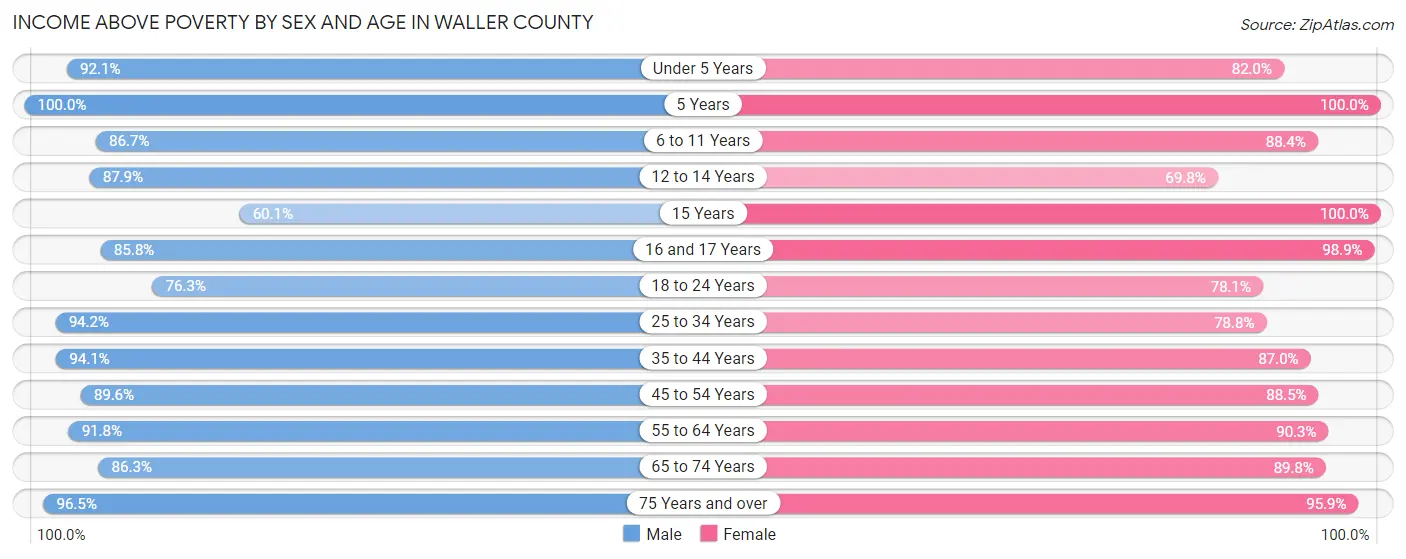
| Age Bracket | Male | Female |
| Under 5 Years | 1,735 (92.1%) | 1,284 (82.0%) |
| 5 Years | 451 (100.0%) | 121 (100.0%) |
| 6 to 11 Years | 1,789 (86.7%) | 2,382 (88.3%) |
| 12 to 14 Years | 1,074 (87.9%) | 685 (69.8%) |
| 15 Years | 212 (60.1%) | 481 (100.0%) |
| 16 and 17 Years | 636 (85.8%) | 606 (98.9%) |
| 18 to 24 Years | 3,521 (76.2%) | 2,913 (78.1%) |
| 25 to 34 Years | 3,181 (94.2%) | 2,684 (78.8%) |
| 35 to 44 Years | 3,198 (94.1%) | 2,606 (87.0%) |
| 45 to 54 Years | 2,502 (89.5%) | 2,515 (88.5%) |
| 55 to 64 Years | 2,843 (91.8%) | 2,679 (90.3%) |
| 65 to 74 Years | 1,781 (86.3%) | 1,930 (89.8%) |
| 75 Years and over | 959 (96.5%) | 1,230 (95.9%) |
| Total | 23,882 (88.3%) | 22,116 (85.6%) |
Income Below Poverty Among Married-Couple Families in Waller County
The poverty statistics for married-couple families in Waller County show that 6.0% or 620 of the total 10,256 families live below the poverty line. Families with 3 or 4 children have the highest poverty rate of 24.1%, comprising of 238 families. On the other hand, families with 5 or more children have the lowest poverty rate of 0.0%, which includes 0 families.
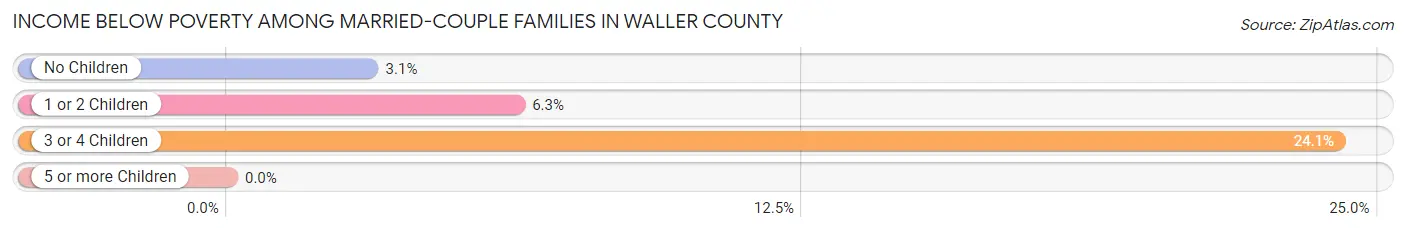
| Children | Above Poverty | Below Poverty |
| No Children | 5,929 (96.9%) | 187 (3.1%) |
| 1 or 2 Children | 2,925 (93.8%) | 195 (6.2%) |
| 3 or 4 Children | 749 (75.9%) | 238 (24.1%) |
| 5 or more Children | 33 (100.0%) | 0 (0.0%) |
| Total | 9,636 (94.0%) | 620 (6.0%) |
Income Below Poverty Among Single-Parent Households in Waller County
According to the poverty data in Waller County, 1.7% or 20 single-father households and 19.2% or 381 single-mother households are living below the poverty line. Among single-father households, those with 1 or 2 children have the highest poverty rate, with 20 households (4.1%) experiencing poverty. Likewise, among single-mother households, those with 3 or 4 children have the highest poverty rate, with 126 households (52.9%) falling below the poverty line.
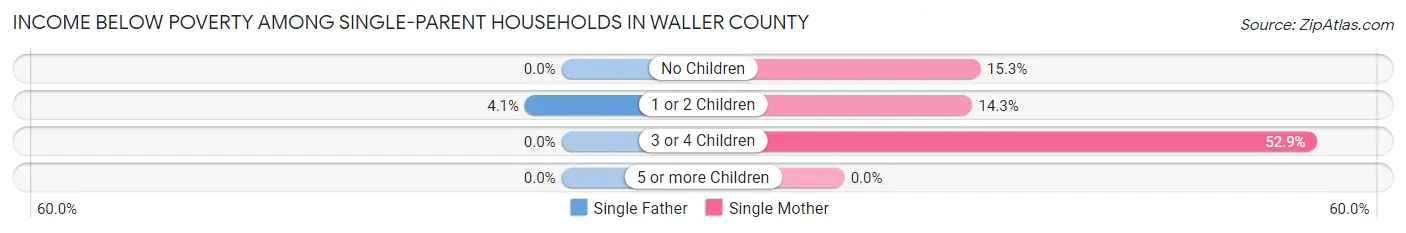
| Children | Single Father | Single Mother |
| No Children | 0 (0.0%) | 93 (15.2%) |
| 1 or 2 Children | 20 (4.1%) | 162 (14.3%) |
| 3 or 4 Children | 0 (0.0%) | 126 (52.9%) |
| 5 or more Children | 0 (0.0%) | 0 (0.0%) |
| Total | 20 (1.7%) | 381 (19.2%) |
Income Below Poverty Among Married-Couple vs Single-Parent Households in Waller County
The poverty data for Waller County shows that 620 of the married-couple family households (6.0%) and 401 of the single-parent households (12.8%) are living below the poverty level. Within the married-couple family households, those with 3 or 4 children have the highest poverty rate, with 238 households (24.1%) falling below the poverty line. Among the single-parent households, those with 3 or 4 children have the highest poverty rate, with 126 household (49.0%) living below poverty.
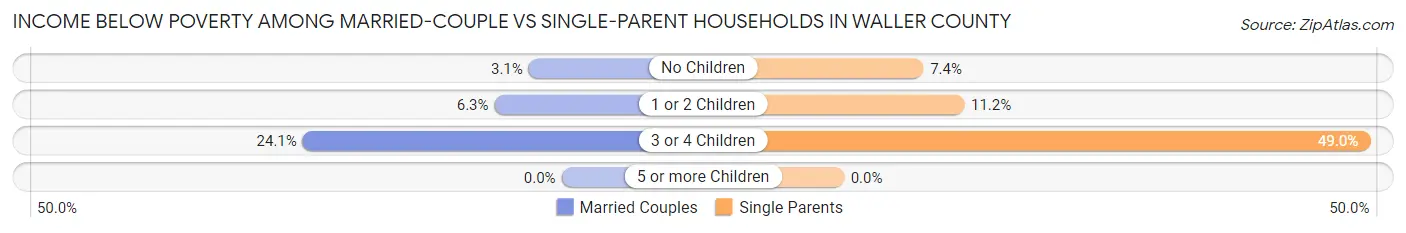
| Children | Married-Couple Families | Single-Parent Households |
| No Children | 187 (3.1%) | 93 (7.4%) |
| 1 or 2 Children | 195 (6.2%) | 182 (11.2%) |
| 3 or 4 Children | 238 (24.1%) | 126 (49.0%) |
| 5 or more Children | 0 (0.0%) | 0 (0.0%) |
| Total | 620 (6.0%) | 401 (12.8%) |
Race in Waller County
The most populous races in Waller County are White / Caucasian (28,128 | 48.9%), Hispanic or Latino (17,732 | 30.9%), and Black / African American (14,220 | 24.7%).
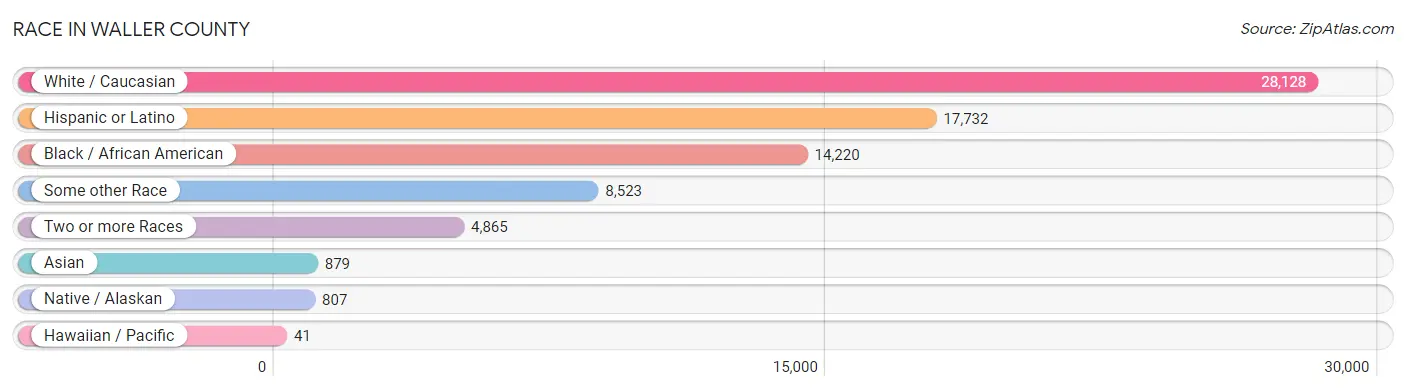
| Race | # Population | % Population |
| Asian | 879 | 1.5% |
| Black / African American | 14,220 | 24.7% |
| Hawaiian / Pacific | 41 | 0.1% |
| Hispanic or Latino | 17,732 | 30.9% |
| Native / Alaskan | 807 | 1.4% |
| White / Caucasian | 28,128 | 48.9% |
| Two or more Races | 4,865 | 8.5% |
| Some other Race | 8,523 | 14.8% |
| Total | 57,463 | 100.0% |
Ancestry in Waller County
The most populous ancestries reported in Waller County are Mexican (14,779 | 25.7%), German (6,138 | 10.7%), Irish (3,504 | 6.1%), English (3,496 | 6.1%), and American (2,805 | 4.9%), together accounting for 53.5% of all Waller County residents.
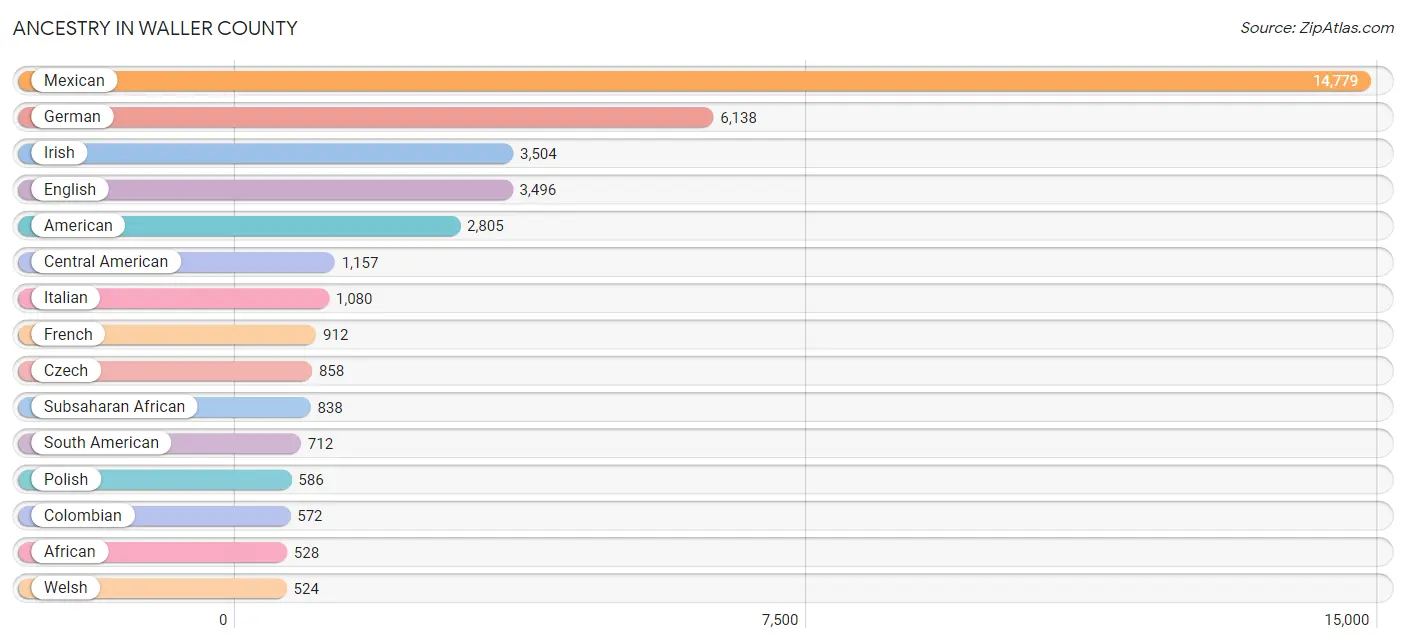
| Ancestry | # Population | % Population |
| African | 528 | 0.9% |
| American | 2,805 | 4.9% |
| Apache | 33 | 0.1% |
| Arab | 181 | 0.3% |
| Argentinean | 46 | 0.1% |
| Armenian | 6 | 0.0% |
| Australian | 52 | 0.1% |
| Austrian | 1 | 0.0% |
| Bahamian | 2 | 0.0% |
| Belgian | 19 | 0.0% |
| Belizean | 8 | 0.0% |
| Bhutanese | 44 | 0.1% |
| Blackfeet | 17 | 0.0% |
| Brazilian | 115 | 0.2% |
| British | 222 | 0.4% |
| Burmese | 20 | 0.0% |
| Cajun | 28 | 0.1% |
| Canadian | 7 | 0.0% |
| Central American | 1,157 | 2.0% |
| Central American Indian | 70 | 0.1% |
| Cherokee | 280 | 0.5% |
| Chilean | 4 | 0.0% |
| Choctaw | 81 | 0.1% |
| Colombian | 572 | 1.0% |
| Cuban | 520 | 0.9% |
| Czech | 858 | 1.5% |
| Czechoslovakian | 96 | 0.2% |
| Danish | 62 | 0.1% |
| Dutch | 272 | 0.5% |
| Eastern European | 9 | 0.0% |
| English | 3,496 | 6.1% |
| Ethiopian | 4 | 0.0% |
| European | 325 | 0.6% |
| Filipino | 83 | 0.1% |
| Finnish | 5 | 0.0% |
| French | 912 | 1.6% |
| French Canadian | 37 | 0.1% |
| German | 6,138 | 10.7% |
| Greek | 57 | 0.1% |
| Guatemalan | 406 | 0.7% |
| Haitian | 4 | 0.0% |
| Honduran | 316 | 0.5% |
| Hungarian | 51 | 0.1% |
| Indian (Asian) | 47 | 0.1% |
| Indonesian | 18 | 0.0% |
| Iranian | 80 | 0.1% |
| Irish | 3,504 | 6.1% |
| Iroquois | 1 | 0.0% |
| Italian | 1,080 | 1.9% |
| Jamaican | 18 | 0.0% |
| Japanese | 30 | 0.1% |
| Korean | 88 | 0.2% |
| Laotian | 30 | 0.1% |
| Lebanese | 30 | 0.1% |
| Lithuanian | 6 | 0.0% |
| Malaysian | 10 | 0.0% |
| Mexican | 14,779 | 25.7% |
| Mexican American Indian | 44 | 0.1% |
| Native Hawaiian | 41 | 0.1% |
| Nigerian | 302 | 0.5% |
| Northern European | 42 | 0.1% |
| Norwegian | 233 | 0.4% |
| Osage | 14 | 0.0% |
| Palestinian | 151 | 0.3% |
| Polish | 586 | 1.0% |
| Portuguese | 91 | 0.2% |
| Puerto Rican | 139 | 0.2% |
| Romanian | 24 | 0.0% |
| Russian | 74 | 0.1% |
| Salvadoran | 435 | 0.8% |
| Scandinavian | 43 | 0.1% |
| Scotch-Irish | 477 | 0.8% |
| Scottish | 488 | 0.9% |
| Sioux | 21 | 0.0% |
| Somali | 4 | 0.0% |
| South American | 712 | 1.2% |
| Spanish | 21 | 0.0% |
| Spanish American Indian | 13 | 0.0% |
| Sri Lankan | 492 | 0.9% |
| Subsaharan African | 838 | 1.5% |
| Swedish | 146 | 0.3% |
| Swiss | 46 | 0.1% |
| Thai | 145 | 0.3% |
| Ukrainian | 104 | 0.2% |
| Venezuelan | 90 | 0.2% |
| Welsh | 524 | 0.9% | View All 86 Rows |
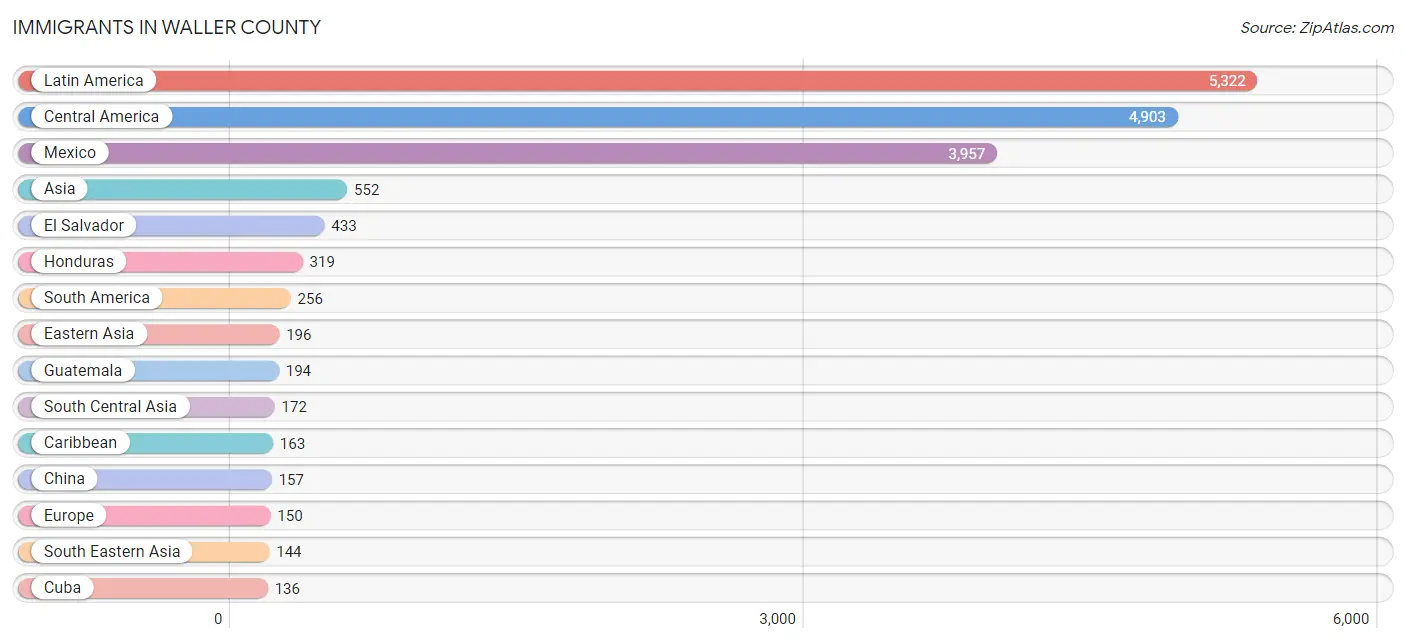
Immigrants in Waller County
The most numerous immigrant groups reported in Waller County came from Latin America (5,322 | 9.3%), Central America (4,903 | 8.5%), Mexico (3,957 | 6.9%), Asia (552 | 1.0%), and El Salvador (433 | 0.7%), together accounting for 26.4% of all Waller County residents.
| Immigration Origin | # Population | % Population |
| Africa | 81 | 0.1% |
| Argentina | 48 | 0.1% |
| Asia | 552 | 1.0% |
| Austria | 11 | 0.0% |
| Bahamas | 2 | 0.0% |
| Brazil | 26 | 0.1% |
| Cambodia | 36 | 0.1% |
| Canada | 120 | 0.2% |
| Caribbean | 163 | 0.3% |
| Central America | 4,903 | 8.5% |
| Chile | 4 | 0.0% |
| China | 157 | 0.3% |
| Colombia | 100 | 0.2% |
| Cuba | 136 | 0.2% |
| Dominican Republic | 25 | 0.0% |
| Eastern Africa | 25 | 0.0% |
| Eastern Asia | 196 | 0.3% |
| Eastern Europe | 24 | 0.0% |
| El Salvador | 433 | 0.7% |
| England | 11 | 0.0% |
| Europe | 150 | 0.3% |
| Germany | 13 | 0.0% |
| Guatemala | 194 | 0.3% |
| Honduras | 319 | 0.6% |
| Hungary | 1 | 0.0% |
| India | 53 | 0.1% |
| Iran | 77 | 0.1% |
| Japan | 16 | 0.0% |
| Korea | 23 | 0.0% |
| Laos | 25 | 0.0% |
| Latin America | 5,322 | 9.3% |
| Lebanon | 23 | 0.0% |
| Mexico | 3,957 | 6.9% |
| Netherlands | 43 | 0.1% |
| Nigeria | 14 | 0.0% |
| Northern Europe | 58 | 0.1% |
| Pakistan | 42 | 0.1% |
| Philippines | 42 | 0.1% |
| Romania | 11 | 0.0% |
| Russia | 12 | 0.0% |
| Saudi Arabia | 17 | 0.0% |
| Scotland | 36 | 0.1% |
| Singapore | 13 | 0.0% |
| South Africa | 42 | 0.1% |
| South America | 256 | 0.4% |
| South Central Asia | 172 | 0.3% |
| South Eastern Asia | 144 | 0.3% |
| Switzerland | 1 | 0.0% |
| Taiwan | 20 | 0.0% |
| Uruguay | 5 | 0.0% |
| Venezuela | 73 | 0.1% |
| Vietnam | 28 | 0.1% |
| Western Africa | 14 | 0.0% |
| Western Asia | 40 | 0.1% |
| Western Europe | 68 | 0.1% | View All 55 Rows |
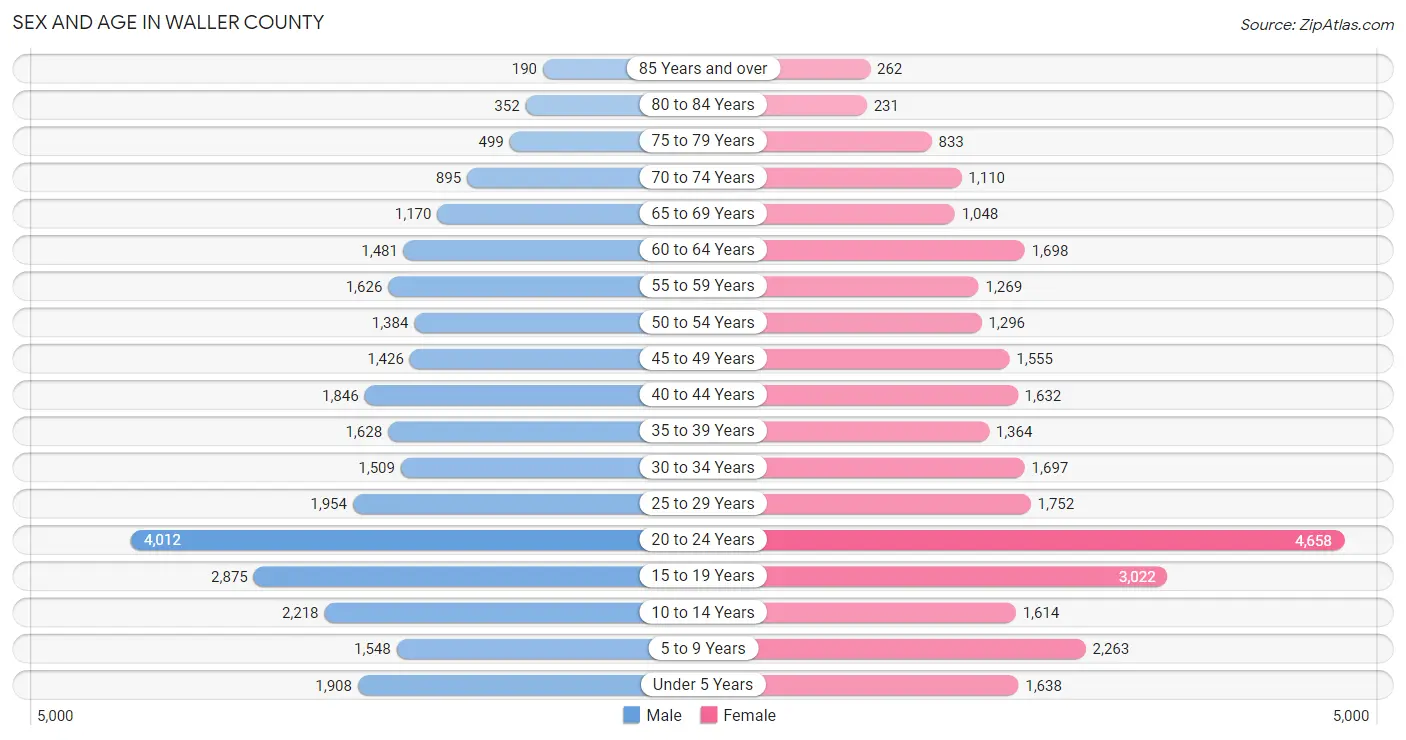
Sex and Age in Waller County
Sex and Age in Waller County
The most populous age groups in Waller County are 20 to 24 Years (4,012 | 14.1%) for men and 20 to 24 Years (4,658 | 16.1%) for women.
| Age Bracket | Male | Female |
| Under 5 Years | 1,908 (6.7%) | 1,638 (5.7%) |
| 5 to 9 Years | 1,548 (5.4%) | 2,263 (7.8%) |
| 10 to 14 Years | 2,218 (7.8%) | 1,614 (5.6%) |
| 15 to 19 Years | 2,875 (10.1%) | 3,022 (10.4%) |
| 20 to 24 Years | 4,012 (14.1%) | 4,658 (16.1%) |
| 25 to 29 Years | 1,954 (6.9%) | 1,752 (6.0%) |
| 30 to 34 Years | 1,509 (5.3%) | 1,697 (5.9%) |
| 35 to 39 Years | 1,628 (5.7%) | 1,364 (4.7%) |
| 40 to 44 Years | 1,846 (6.5%) | 1,632 (5.6%) |
| 45 to 49 Years | 1,426 (5.0%) | 1,555 (5.4%) |
| 50 to 54 Years | 1,384 (4.9%) | 1,296 (4.5%) |
| 55 to 59 Years | 1,626 (5.7%) | 1,269 (4.4%) |
| 60 to 64 Years | 1,481 (5.2%) | 1,698 (5.9%) |
| 65 to 69 Years | 1,170 (4.1%) | 1,048 (3.6%) |
| 70 to 74 Years | 895 (3.1%) | 1,110 (3.8%) |
| 75 to 79 Years | 499 (1.8%) | 833 (2.9%) |
| 80 to 84 Years | 352 (1.2%) | 231 (0.8%) |
| 85 Years and over | 190 (0.7%) | 262 (0.9%) |
| Total | 28,521 (100.0%) | 28,942 (100.0%) |
Families and Households in Waller County
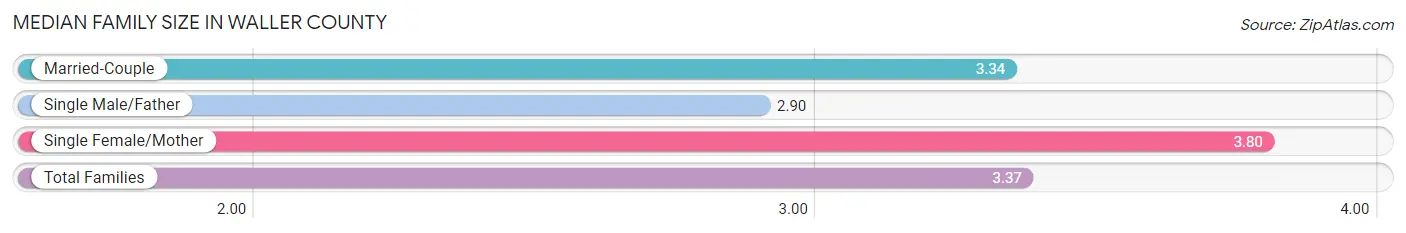
Median Family Size in Waller County
The median family size in Waller County is 3.37 persons per family, with single female/mother families (1,983 | 14.8%) accounting for the largest median family size of 3.8 persons per family. On the other hand, single male/father families (1,153 | 8.6%) represent the smallest median family size with 2.90 persons per family.
| Family Type | # Families | Family Size |
| Married-Couple | 10,256 (76.6%) | 3.34 |
| Single Male/Father | 1,153 (8.6%) | 2.90 |
| Single Female/Mother | 1,983 (14.8%) | 3.80 |
| Total Families | 13,392 (100.0%) | 3.37 |
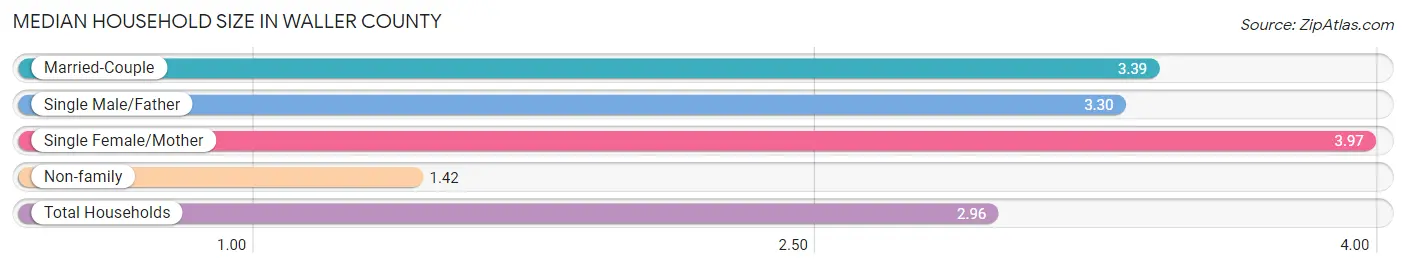
Median Household Size in Waller County
The median household size in Waller County is 2.96 persons per household, with single female/mother households (1,983 | 11.2%) accounting for the largest median household size of 3.97 persons per household. non-family households (4,388 | 24.7%) represent the smallest median household size with 1.42 persons per household.
| Household Type | # Households | Household Size |
| Married-Couple | 10,256 (57.7%) | 3.39 |
| Single Male/Father | 1,153 (6.5%) | 3.30 |
| Single Female/Mother | 1,983 (11.2%) | 3.97 |
| Non-family | 4,388 (24.7%) | 1.42 |
| Total Households | 17,780 (100.0%) | 2.96 |
Household Size by Marriage Status in Waller County
Out of a total of 17,780 households in Waller County, 13,392 (75.3%) are family households, while 4,388 (24.7%) are nonfamily households. The most numerous type of family households are 2-person households, comprising 5,826, and the most common type of nonfamily households are 1-person households, comprising 2,878.
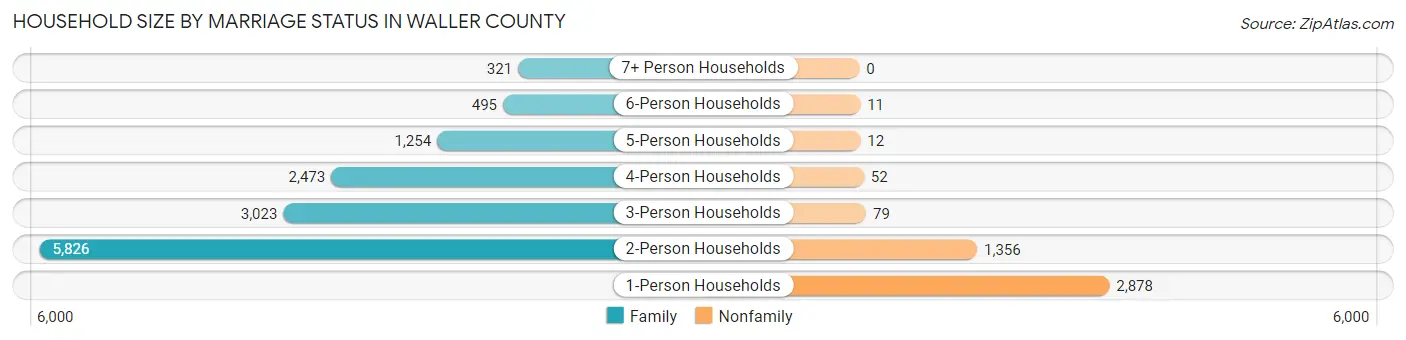
| Household Size | Family Households | Nonfamily Households |
| 1-Person Households | - | 2,878 (16.2%) |
| 2-Person Households | 5,826 (32.8%) | 1,356 (7.6%) |
| 3-Person Households | 3,023 (17.0%) | 79 (0.4%) |
| 4-Person Households | 2,473 (13.9%) | 52 (0.3%) |
| 5-Person Households | 1,254 (7.0%) | 12 (0.1%) |
| 6-Person Households | 495 (2.8%) | 11 (0.1%) |
| 7+ Person Households | 321 (1.8%) | 0 (0.0%) |
| Total | 13,392 (75.3%) | 4,388 (24.7%) |
Female Fertility in Waller County
Fertility by Age in Waller County
Average fertility rate in Waller County is 54.0 births per 1,000 women. Women in the age bracket of 20 to 34 years have the highest fertility rate with 80.0 births per 1,000 women. Women in the age bracket of 20 to 34 years acount for 75.5% of all women with births.
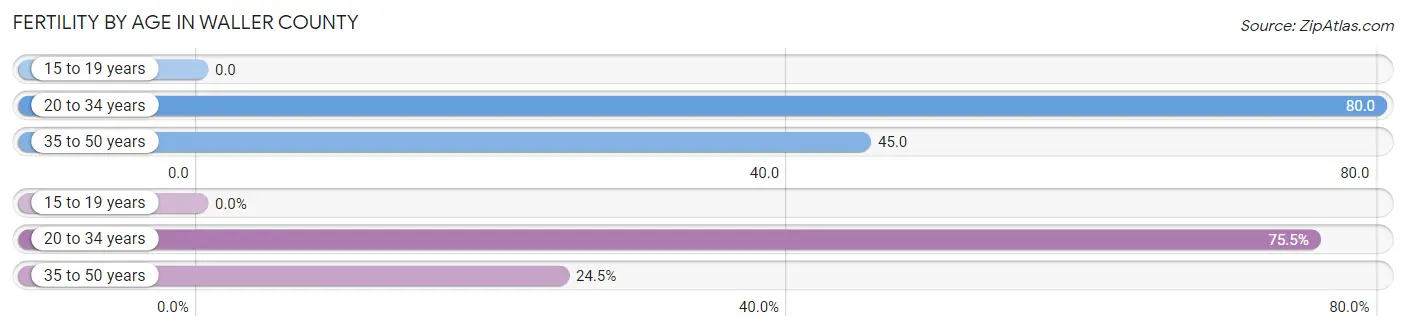
| Age Bracket | Women with Births | Births / 1,000 Women |
| 15 to 19 years | 0 (0.0%) | 0.0 |
| 20 to 34 years | 647 (75.5%) | 80.0 |
| 35 to 50 years | 210 (24.5%) | 45.0 |
| Total | 857 (100.0%) | 54.0 |
Fertility by Age by Marriage Status in Waller County
64.5% of women with births (857) in Waller County are married. The highest percentage of unmarried women with births falls into 20 to 34 years age bracket with 38.2% of them unmarried at the time of birth, while the lowest percentage of unmarried women with births belong to 35 to 50 years age bracket with 27.1% of them unmarried.
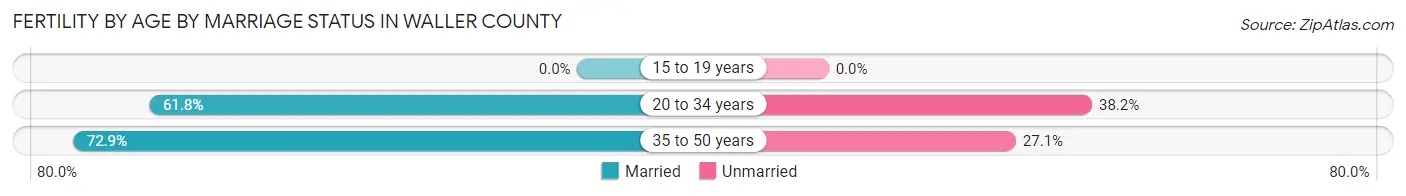
| Age Bracket | Married | Unmarried |
| 15 to 19 years | 0 (0.0%) | 0 (0.0%) |
| 20 to 34 years | 400 (61.8%) | 247 (38.2%) |
| 35 to 50 years | 153 (72.9%) | 57 (27.1%) |
| Total | 553 (64.5%) | 304 (35.5%) |
Fertility by Education in Waller County
Average fertility rate in Waller County is 54.0 births per 1,000 women. Women with the education attainment of graduate degree have the highest fertility rate of 192.0 births per 1,000 women, while women with the education attainment of bachelor's degree have the lowest fertility at 34.0 births per 1,000 women. Women with the education attainment of high school diploma represent 37.2% of all women with births.
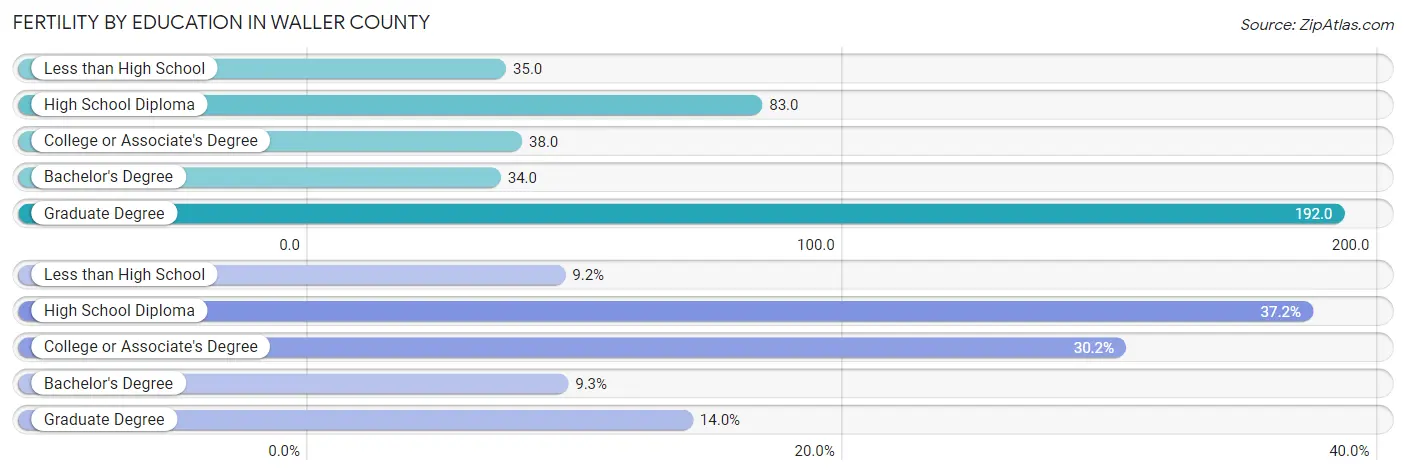
| Educational Attainment | Women with Births | Births / 1,000 Women |
| Less than High School | 79 (9.2%) | 35.0 |
| High School Diploma | 319 (37.2%) | 83.0 |
| College or Associate's Degree | 259 (30.2%) | 38.0 |
| Bachelor's Degree | 80 (9.3%) | 34.0 |
| Graduate Degree | 120 (14.0%) | 192.0 |
| Total | 857 (100.0%) | 54.0 |
Fertility by Education by Marriage Status in Waller County
35.5% of women with births in Waller County are unmarried. Women with the educational attainment of less than high school are most likely to be married with 100.0% of them married at childbirth, while women with the educational attainment of high school diploma are least likely to be married with 79.9% of them unmarried at childbirth.
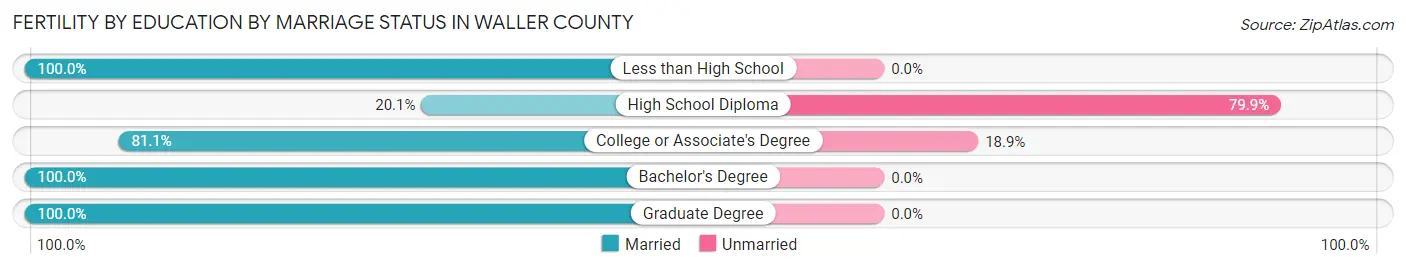
| Educational Attainment | Married | Unmarried |
| Less than High School | 79 (100.0%) | 0 (0.0%) |
| High School Diploma | 64 (20.1%) | 255 (79.9%) |
| College or Associate's Degree | 210 (81.1%) | 49 (18.9%) |
| Bachelor's Degree | 80 (100.0%) | 0 (0.0%) |
| Graduate Degree | 120 (100.0%) | 0 (0.0%) |
| Total | 553 (64.5%) | 304 (35.5%) |
Employment Characteristics in Waller County
Employment by Class of Employer in Waller County
Among the 24,146 employed individuals in Waller County, private company employees (16,644 | 68.9%), local government employees (2,077 | 8.6%), and self-employed (not incorporated) (1,846 | 7.6%) make up the most common classes of employment.
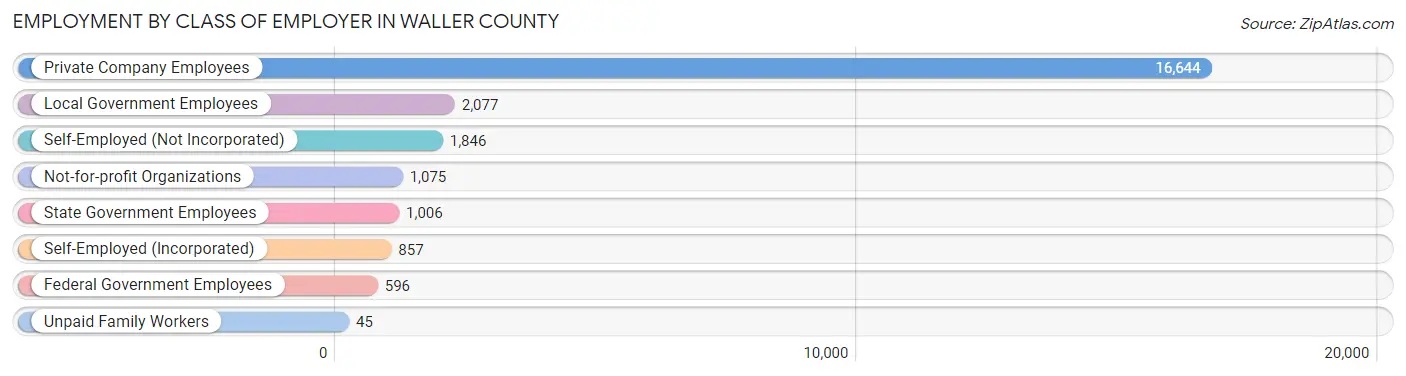
| Employer Class | # Employees | % Employees |
| Private Company Employees | 16,644 | 68.9% |
| Self-Employed (Incorporated) | 857 | 3.5% |
| Self-Employed (Not Incorporated) | 1,846 | 7.6% |
| Not-for-profit Organizations | 1,075 | 4.4% |
| Local Government Employees | 2,077 | 8.6% |
| State Government Employees | 1,006 | 4.2% |
| Federal Government Employees | 596 | 2.5% |
| Unpaid Family Workers | 45 | 0.2% |
| Total | 24,146 | 100.0% |
Employment Status by Age in Waller County
According to the labor force statistics for Waller County, out of the total population over 16 years of age (45,440), 58.4% or 26,537 individuals are in the labor force, with 6.1% or 1,619 of them unemployed. The age group with the highest labor force participation rate is 30 to 34 years, with 79.8% or 2,558 individuals in the labor force. Within the labor force, the 16 to 19 years age range has the highest percentage of unemployed individuals, with 16.3% or 257 of them being unemployed.
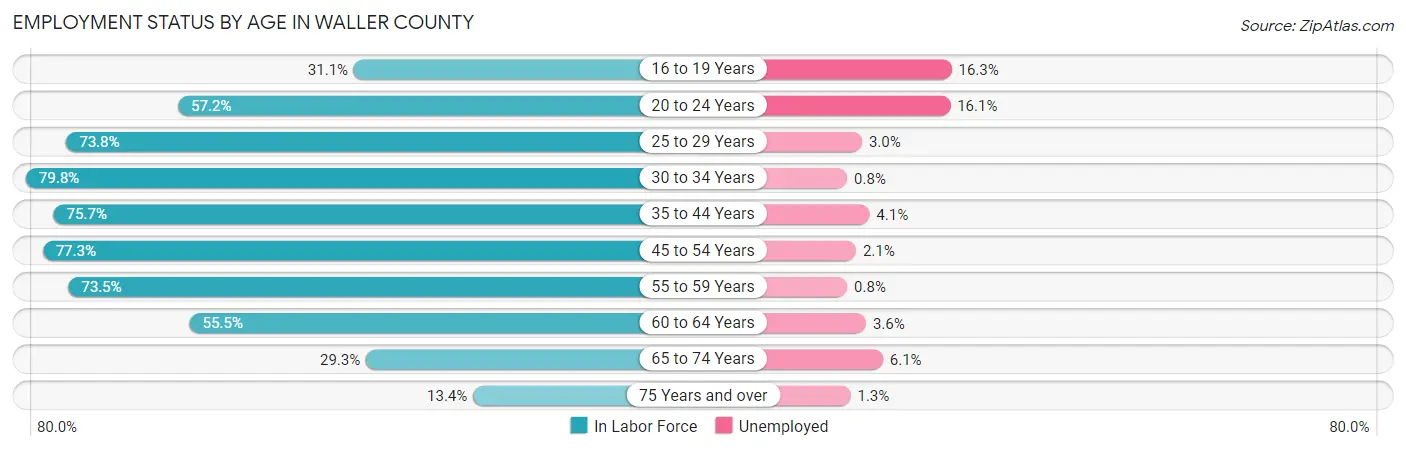
| Age Bracket | In Labor Force | Unemployed |
| 16 to 19 Years | 1,575 (31.1%) | 257 (16.3%) |
| 20 to 24 Years | 4,959 (57.2%) | 798 (16.1%) |
| 25 to 29 Years | 2,735 (73.8%) | 82 (3.0%) |
| 30 to 34 Years | 2,558 (79.8%) | 20 (0.8%) |
| 35 to 44 Years | 4,898 (75.7%) | 201 (4.1%) |
| 45 to 54 Years | 4,376 (77.3%) | 92 (2.1%) |
| 55 to 59 Years | 2,128 (73.5%) | 17 (0.8%) |
| 60 to 64 Years | 1,764 (55.5%) | 64 (3.6%) |
| 65 to 74 Years | 1,237 (29.3%) | 75 (6.1%) |
| 75 Years and over | 317 (13.4%) | 4 (1.3%) |
| Total | 26,537 (58.4%) | 1,619 (6.1%) |
Employment Status by Educational Attainment in Waller County
According to labor force statistics for Waller County, 73.5% of individuals (18,461) out of the total population between 25 and 64 years of age (25,117) are in the labor force, with 2.6% or 480 of them being unemployed. The group with the highest labor force participation rate are those with the educational attainment of bachelor's degree or higher, with 85.1% or 5,437 individuals in the labor force. Within the labor force, individuals with less than high school education have the highest percentage of unemployment, with 4.1% or 71 of them being unemployed.
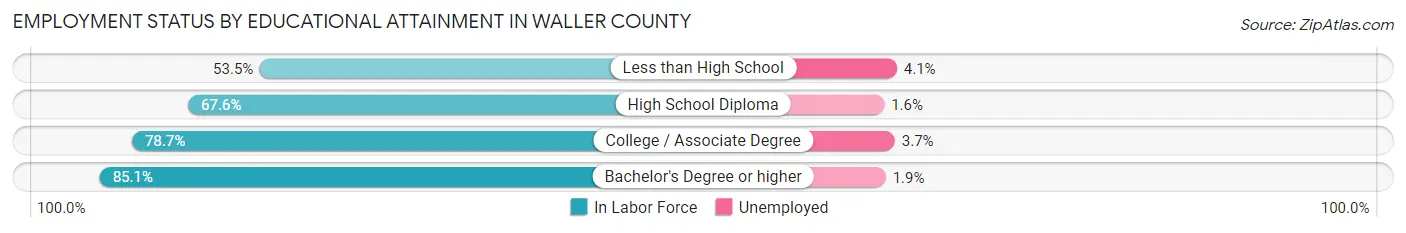
| Educational Attainment | In Labor Force | Unemployed |
| Less than High School | 1,724 (53.5%) | 132 (4.1%) |
| High School Diploma | 5,506 (67.6%) | 130 (1.6%) |
| College / Associate Degree | 5,792 (78.7%) | 272 (3.7%) |
| Bachelor's Degree or higher | 5,437 (85.1%) | 121 (1.9%) |
| Total | 18,461 (73.5%) | 653 (2.6%) |
Employment Occupations by Sex in Waller County
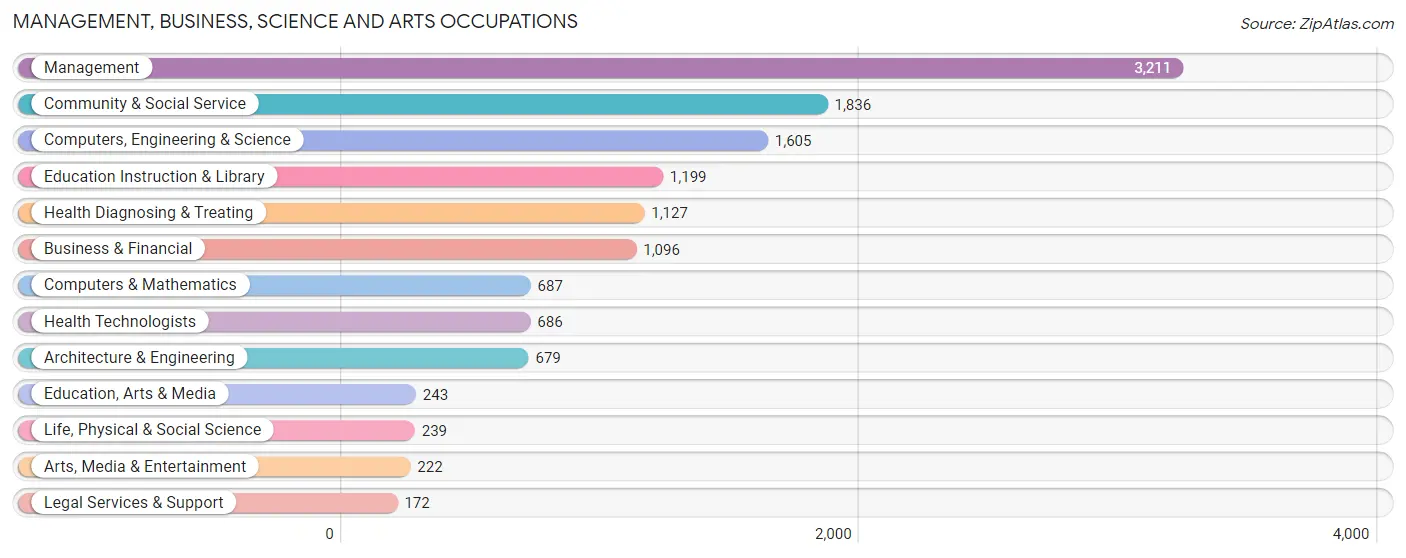
Management, Business, Science and Arts Occupations
The most common Management, Business, Science and Arts occupations in Waller County are Management (3,211 | 12.9%), Community & Social Service (1,836 | 7.4%), Computers, Engineering & Science (1,605 | 6.5%), Education Instruction & Library (1,199 | 4.8%), and Health Diagnosing & Treating (1,127 | 4.5%).
Management, Business, Science and Arts Occupations by Sex
Within the Management, Business, Science and Arts occupations in Waller County, the most male-oriented occupations are Architecture & Engineering (97.5%), Computers, Engineering & Science (79.2%), and Computers & Mathematics (79.0%), while the most female-oriented occupations are Health Technologists (91.2%), Health Diagnosing & Treating (80.7%), and Education Instruction & Library (75.0%).
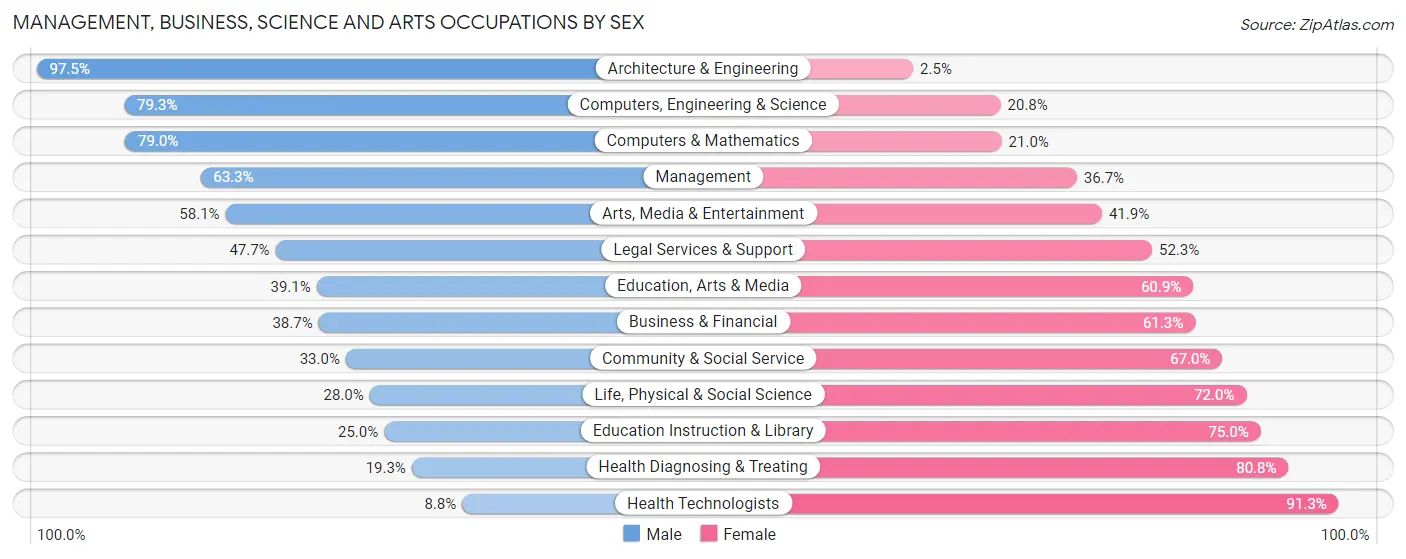
| Occupation | Male | Female |
| Management | 2,034 (63.3%) | 1,177 (36.7%) |
| Business & Financial | 424 (38.7%) | 672 (61.3%) |
| Computers, Engineering & Science | 1,272 (79.2%) | 333 (20.7%) |
| Computers & Mathematics | 543 (79.0%) | 144 (21.0%) |
| Architecture & Engineering | 662 (97.5%) | 17 (2.5%) |
| Life, Physical & Social Science | 67 (28.0%) | 172 (72.0%) |
| Community & Social Service | 606 (33.0%) | 1,230 (67.0%) |
| Education, Arts & Media | 95 (39.1%) | 148 (60.9%) |
| Legal Services & Support | 82 (47.7%) | 90 (52.3%) |
| Education Instruction & Library | 300 (25.0%) | 899 (75.0%) |
| Arts, Media & Entertainment | 129 (58.1%) | 93 (41.9%) |
| Health Diagnosing & Treating | 217 (19.3%) | 910 (80.7%) |
| Health Technologists | 60 (8.7%) | 626 (91.2%) |
| Total (Category) | 4,553 (51.3%) | 4,322 (48.7%) |
| Total (Overall) | 13,688 (55.0%) | 11,214 (45.0%) |
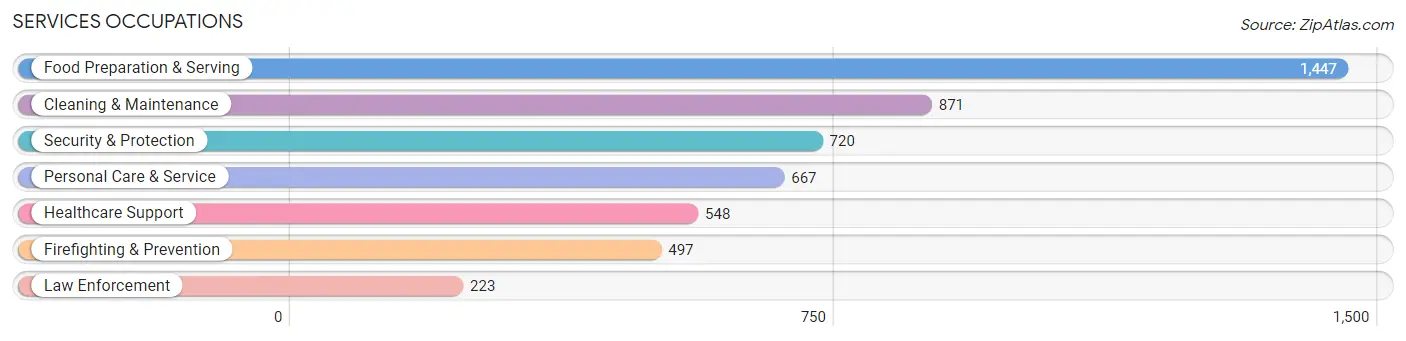
Services Occupations
The most common Services occupations in Waller County are Food Preparation & Serving (1,447 | 5.8%), Cleaning & Maintenance (871 | 3.5%), Security & Protection (720 | 2.9%), Personal Care & Service (667 | 2.7%), and Healthcare Support (548 | 2.2%).
Services Occupations by Sex
Within the Services occupations in Waller County, the most male-oriented occupations are Firefighting & Prevention (91.1%), Security & Protection (89.7%), and Law Enforcement (86.6%), while the most female-oriented occupations are Healthcare Support (90.7%), Personal Care & Service (81.9%), and Food Preparation & Serving (79.3%).
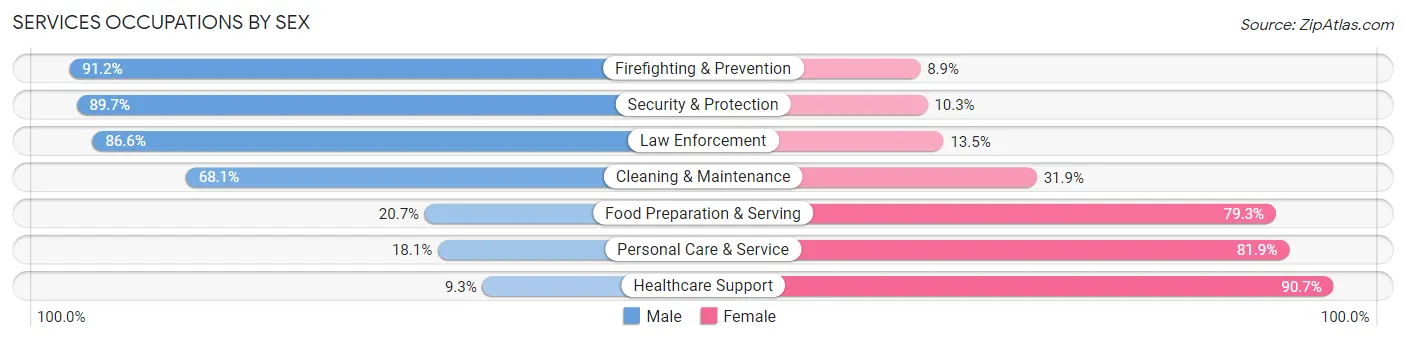
| Occupation | Male | Female |
| Healthcare Support | 51 (9.3%) | 497 (90.7%) |
| Security & Protection | 646 (89.7%) | 74 (10.3%) |
| Firefighting & Prevention | 453 (91.1%) | 44 (8.8%) |
| Law Enforcement | 193 (86.6%) | 30 (13.5%) |
| Food Preparation & Serving | 300 (20.7%) | 1,147 (79.3%) |
| Cleaning & Maintenance | 593 (68.1%) | 278 (31.9%) |
| Personal Care & Service | 121 (18.1%) | 546 (81.9%) |
| Total (Category) | 1,711 (40.2%) | 2,542 (59.8%) |
| Total (Overall) | 13,688 (55.0%) | 11,214 (45.0%) |
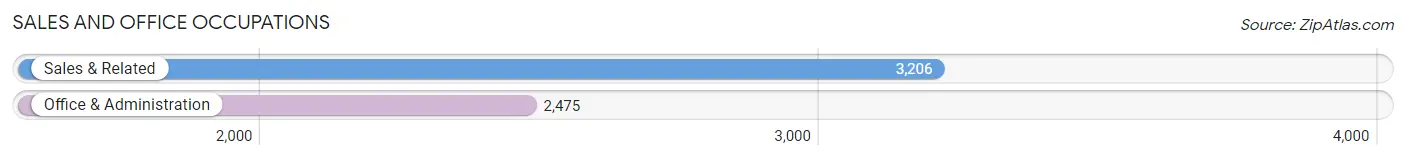
Sales and Office Occupations
The most common Sales and Office occupations in Waller County are Sales & Related (3,206 | 12.9%), and Office & Administration (2,475 | 9.9%).
Sales and Office Occupations by Sex
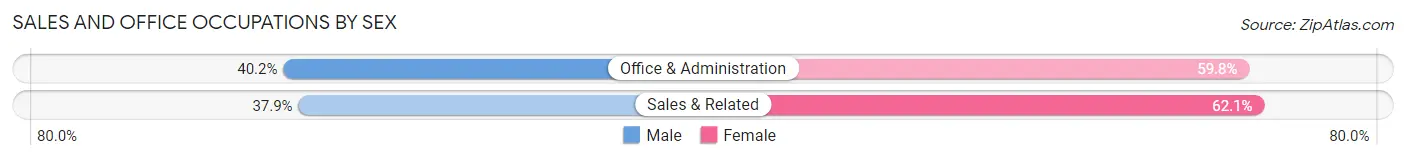
| Occupation | Male | Female |
| Sales & Related | 1,214 (37.9%) | 1,992 (62.1%) |
| Office & Administration | 995 (40.2%) | 1,480 (59.8%) |
| Total (Category) | 2,209 (38.9%) | 3,472 (61.1%) |
| Total (Overall) | 13,688 (55.0%) | 11,214 (45.0%) |
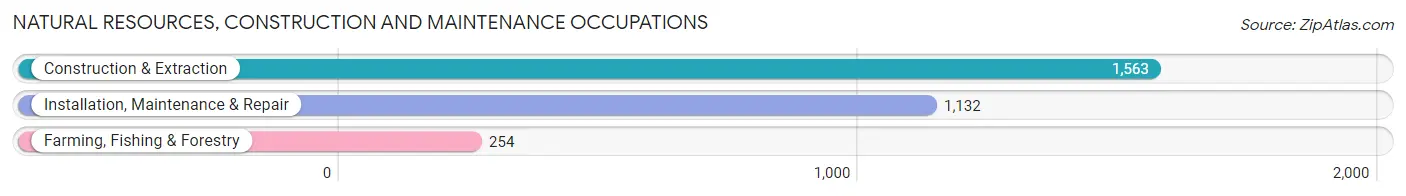
Natural Resources, Construction and Maintenance Occupations
The most common Natural Resources, Construction and Maintenance occupations in Waller County are Construction & Extraction (1,563 | 6.3%), Installation, Maintenance & Repair (1,132 | 4.5%), and Farming, Fishing & Forestry (254 | 1.0%).
Natural Resources, Construction and Maintenance Occupations by Sex
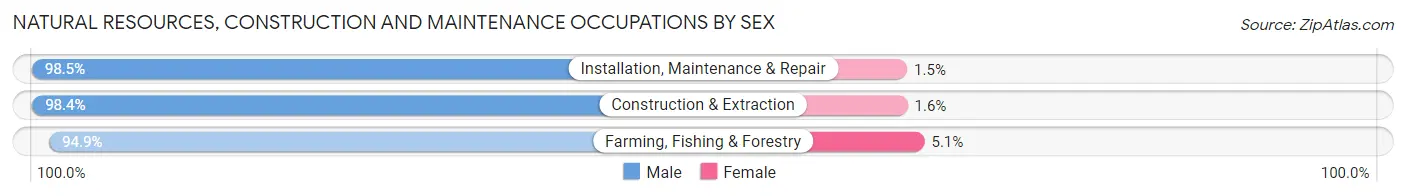
| Occupation | Male | Female |
| Farming, Fishing & Forestry | 241 (94.9%) | 13 (5.1%) |
| Construction & Extraction | 1,538 (98.4%) | 25 (1.6%) |
| Installation, Maintenance & Repair | 1,115 (98.5%) | 17 (1.5%) |
| Total (Category) | 2,894 (98.1%) | 55 (1.9%) |
| Total (Overall) | 13,688 (55.0%) | 11,214 (45.0%) |
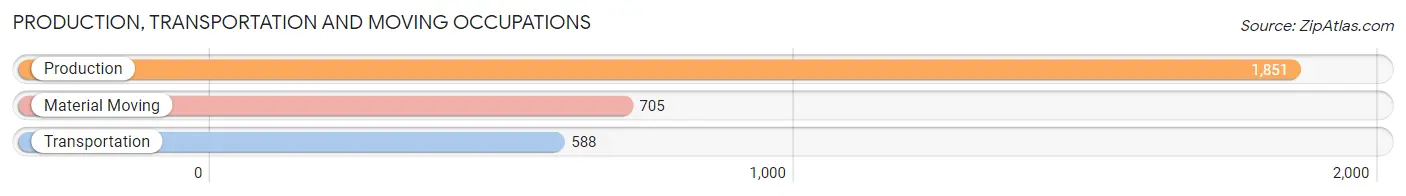
Production, Transportation and Moving Occupations
The most common Production, Transportation and Moving occupations in Waller County are Production (1,851 | 7.4%), Material Moving (705 | 2.8%), and Transportation (588 | 2.4%).
Production, Transportation and Moving Occupations by Sex
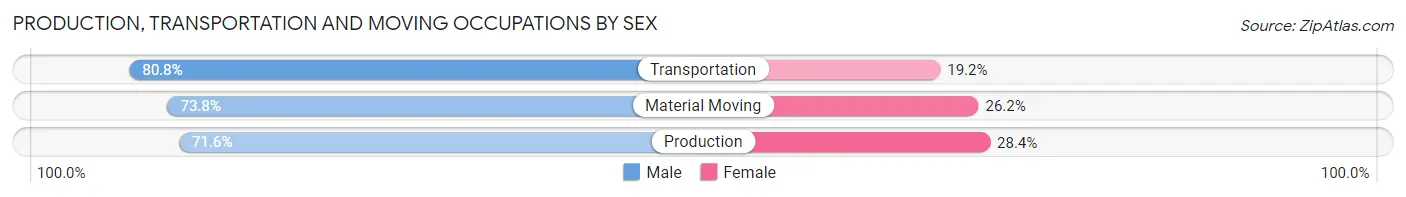
| Occupation | Male | Female |
| Production | 1,326 (71.6%) | 525 (28.4%) |
| Transportation | 475 (80.8%) | 113 (19.2%) |
| Material Moving | 520 (73.8%) | 185 (26.2%) |
| Total (Category) | 2,321 (73.8%) | 823 (26.2%) |
| Total (Overall) | 13,688 (55.0%) | 11,214 (45.0%) |
Employment Industries by Sex in Waller County
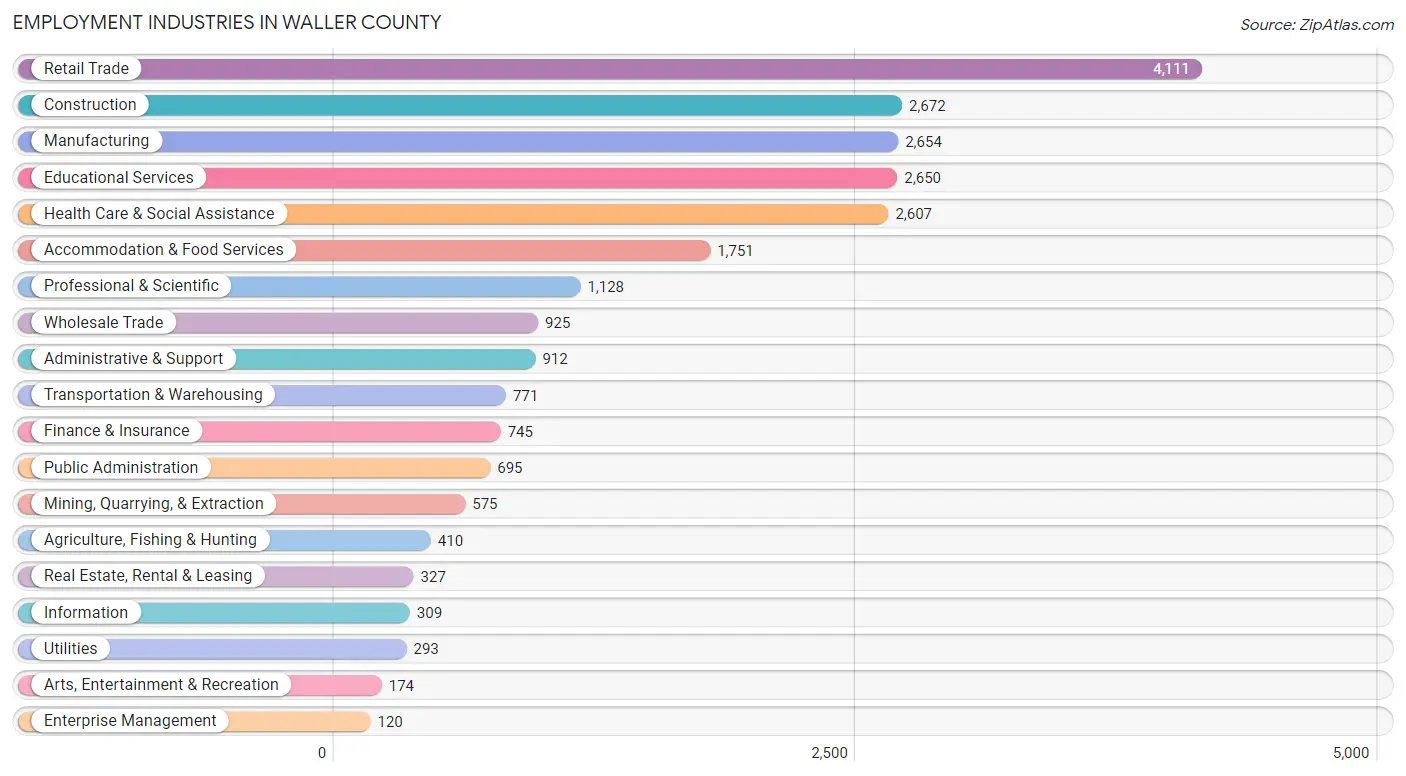
Employment Industries in Waller County
The major employment industries in Waller County include Retail Trade (4,111 | 16.5%), Construction (2,672 | 10.7%), Manufacturing (2,654 | 10.7%), Educational Services (2,650 | 10.6%), and Health Care & Social Assistance (2,607 | 10.5%).
Employment Industries by Sex in Waller County
The Waller County industries that see more men than women are Construction (92.9%), Utilities (91.5%), and Enterprise Management (89.2%), whereas the industries that tend to have a higher number of women are Health Care & Social Assistance (82.3%), Real Estate, Rental & Leasing (74.6%), and Accommodation & Food Services (73.6%).
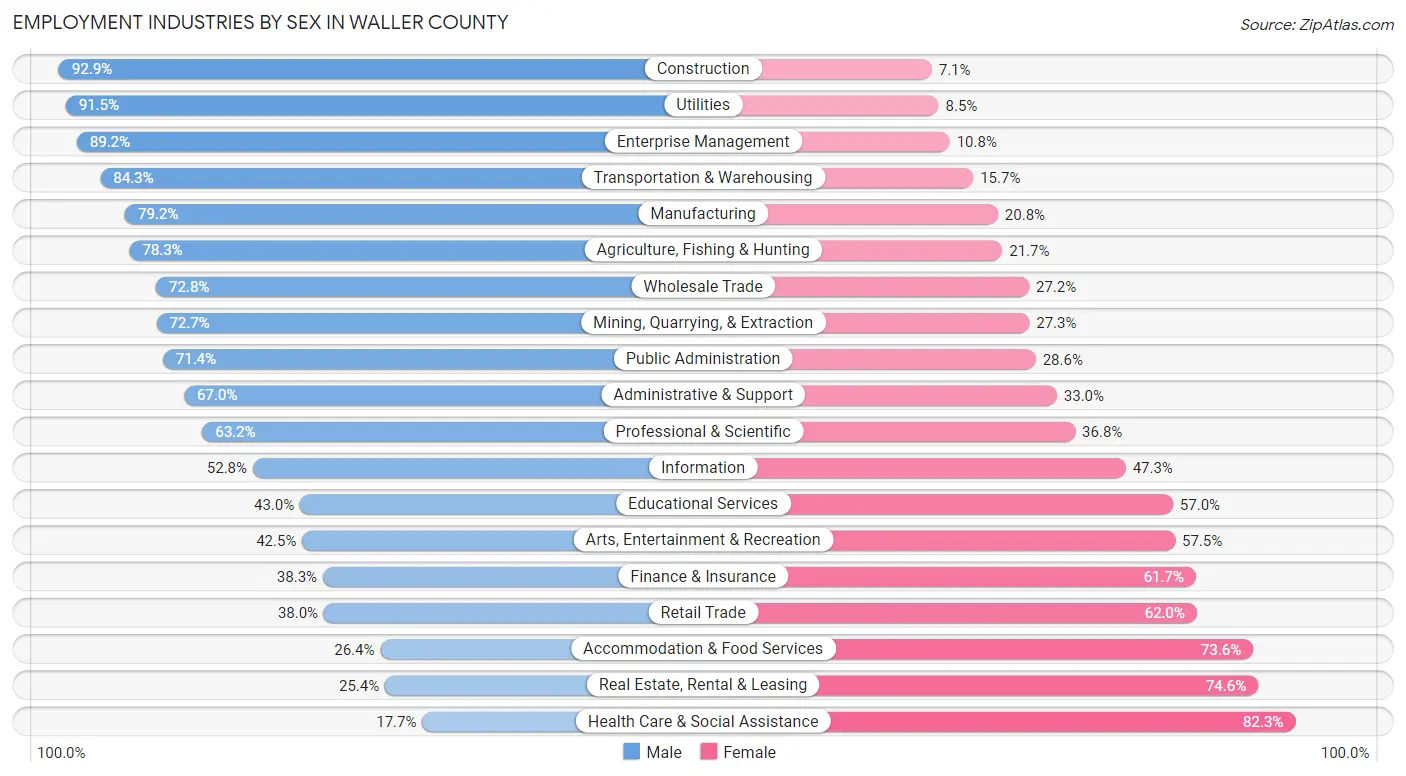
| Industry | Male | Female |
| Agriculture, Fishing & Hunting | 321 (78.3%) | 89 (21.7%) |
| Mining, Quarrying, & Extraction | 418 (72.7%) | 157 (27.3%) |
| Construction | 2,482 (92.9%) | 190 (7.1%) |
| Manufacturing | 2,102 (79.2%) | 552 (20.8%) |
| Wholesale Trade | 673 (72.8%) | 252 (27.2%) |
| Retail Trade | 1,564 (38.0%) | 2,547 (62.0%) |
| Transportation & Warehousing | 650 (84.3%) | 121 (15.7%) |
| Utilities | 268 (91.5%) | 25 (8.5%) |
| Information | 163 (52.7%) | 146 (47.2%) |
| Finance & Insurance | 285 (38.3%) | 460 (61.7%) |
| Real Estate, Rental & Leasing | 83 (25.4%) | 244 (74.6%) |
| Professional & Scientific | 713 (63.2%) | 415 (36.8%) |
| Enterprise Management | 107 (89.2%) | 13 (10.8%) |
| Administrative & Support | 611 (67.0%) | 301 (33.0%) |
| Educational Services | 1,139 (43.0%) | 1,511 (57.0%) |
| Health Care & Social Assistance | 461 (17.7%) | 2,146 (82.3%) |
| Arts, Entertainment & Recreation | 74 (42.5%) | 100 (57.5%) |
| Accommodation & Food Services | 462 (26.4%) | 1,289 (73.6%) |
| Public Administration | 496 (71.4%) | 199 (28.6%) |
| Total | 13,688 (55.0%) | 11,214 (45.0%) |
Education in Waller County
School Enrollment in Waller County
The most common levels of schooling among the 19,521 students in Waller County are college / undergraduate (8,218 | 42.1%), elementary school (3,342 | 17.1%), and middle school (3,057 | 15.7%).
| School Level | # Students | % Students |
| Nursery / Preschool | 913 | 4.7% |
| Kindergarten | 610 | 3.1% |
| Elementary School | 3,342 | 17.1% |
| Middle School | 3,057 | 15.7% |
| High School | 2,840 | 14.5% |
| College / Undergraduate | 8,218 | 42.1% |
| Graduate / Professional | 541 | 2.8% |
| Total | 19,521 | 100.0% |
School Enrollment by Age by Funding Source in Waller County
Out of a total of 19,521 students who are enrolled in schools in Waller County, 2,186 (11.2%) attend a private institution, while the remaining 17,335 (88.8%) are enrolled in public schools. The age group of 3 to 4 year olds has the highest likelihood of being enrolled in private schools, with 275 (35.4% in the age bracket) enrolled. Conversely, the age group of 20 to 24 year olds has the lowest likelihood of being enrolled in a private school, with 4,858 (97.6% in the age bracket) attending a public institution.
| Age Bracket | Public School | Private School |
| 3 to 4 Year Olds | 501 (64.6%) | 275 (35.4%) |
| 5 to 9 Year Old | 3,010 (84.6%) | 547 (15.4%) |
| 10 to 14 Year Olds | 3,075 (83.4%) | 614 (16.6%) |
| 15 to 17 Year Olds | 1,767 (88.2%) | 237 (11.8%) |
| 18 to 19 Year Olds | 3,271 (97.4%) | 88 (2.6%) |
| 20 to 24 Year Olds | 4,858 (97.6%) | 120 (2.4%) |
| 25 to 34 Year Olds | 564 (67.5%) | 271 (32.5%) |
| 35 Years and over | 286 (88.5%) | 37 (11.5%) |
| Total | 17,335 (88.8%) | 2,186 (11.2%) |
Educational Attainment by Field of Study in Waller County
Business (2,024 | 24.7%), education (1,338 | 16.3%), science & technology (799 | 9.8%), bio, nature & agricultural (761 | 9.3%), and engineering (743 | 9.1%) are the most common fields of study among 8,193 individuals in Waller County who have obtained a bachelor's degree or higher.
| Field of Study | # Graduates | % Graduates |
| Computers & Mathematics | 101 | 1.2% |
| Bio, Nature & Agricultural | 761 | 9.3% |
| Physical & Health Sciences | 217 | 2.6% |
| Psychology | 295 | 3.6% |
| Social Sciences | 442 | 5.4% |
| Engineering | 743 | 9.1% |
| Multidisciplinary Studies | 154 | 1.9% |
| Science & Technology | 799 | 9.8% |
| Business | 2,024 | 24.7% |
| Education | 1,338 | 16.3% |
| Literature & Languages | 198 | 2.4% |
| Liberal Arts & History | 518 | 6.3% |
| Visual & Performing Arts | 190 | 2.3% |
| Communications | 57 | 0.7% |
| Arts & Humanities | 356 | 4.3% |
| Total | 8,193 | 100.0% |
Transportation & Commute in Waller County
Vehicle Availability by Sex in Waller County
The most prevalent vehicle ownership categories in Waller County are males with 2 vehicles (5,299, accounting for 41.6%) and females with 2 vehicles (3,905, making up 53.0%).
| Vehicles Available | Male | Female |
| No Vehicle | 319 (2.5%) | 283 (2.8%) |
| 1 Vehicle | 1,340 (10.5%) | 1,595 (16.0%) |
| 2 Vehicles | 5,299 (41.6%) | 3,905 (39.1%) |
| 3 Vehicles | 2,971 (23.3%) | 2,635 (26.4%) |
| 4 Vehicles | 2,039 (16.0%) | 1,154 (11.5%) |
| 5 or more Vehicles | 774 (6.1%) | 424 (4.2%) |
| Total | 12,742 (100.0%) | 9,996 (100.0%) |
Commute Time in Waller County
The most frequently occuring commute durations in Waller County are 45 to 59 minutes (3,509 commuters, 15.9%), 10 to 14 minutes (3,240 commuters, 14.6%), and 20 to 24 minutes (2,655 commuters, 12.0%).
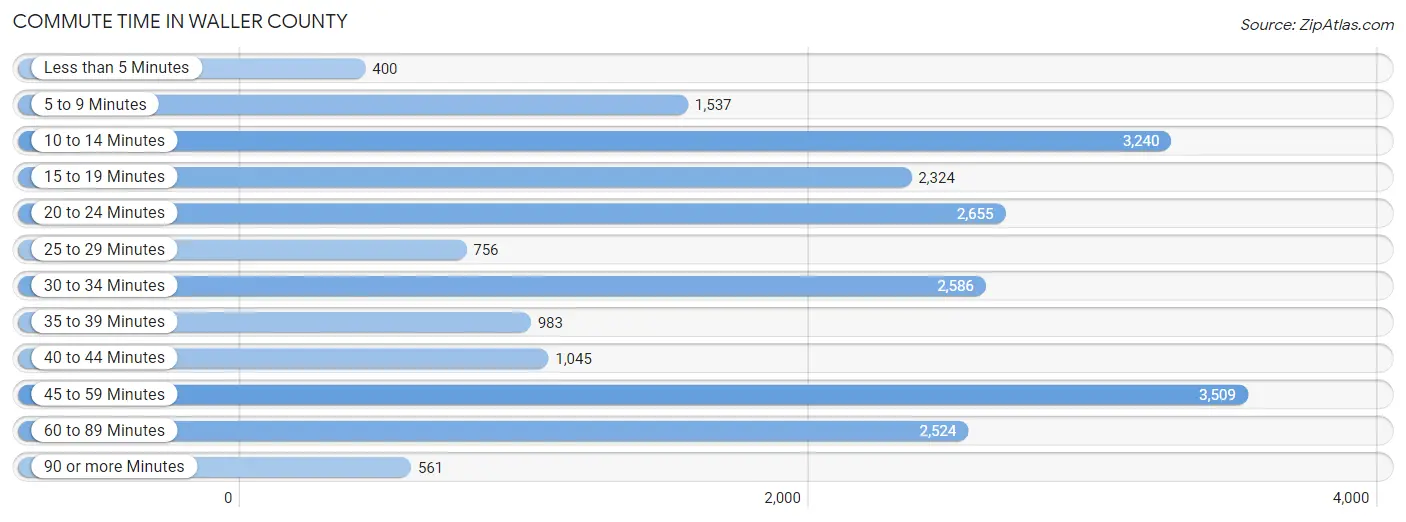
| Commute Time | # Commuters | % Commuters |
| Less than 5 Minutes | 400 | 1.8% |
| 5 to 9 Minutes | 1,537 | 7.0% |
| 10 to 14 Minutes | 3,240 | 14.6% |
| 15 to 19 Minutes | 2,324 | 10.5% |
| 20 to 24 Minutes | 2,655 | 12.0% |
| 25 to 29 Minutes | 756 | 3.4% |
| 30 to 34 Minutes | 2,586 | 11.7% |
| 35 to 39 Minutes | 983 | 4.4% |
| 40 to 44 Minutes | 1,045 | 4.7% |
| 45 to 59 Minutes | 3,509 | 15.9% |
| 60 to 89 Minutes | 2,524 | 11.4% |
| 90 or more Minutes | 561 | 2.5% |
Commute Time by Sex in Waller County
The most common commute times in Waller County are 45 to 59 minutes (1,954 commuters, 16.2%) for males and 20 to 24 minutes (1,683 commuters, 16.8%) for females.
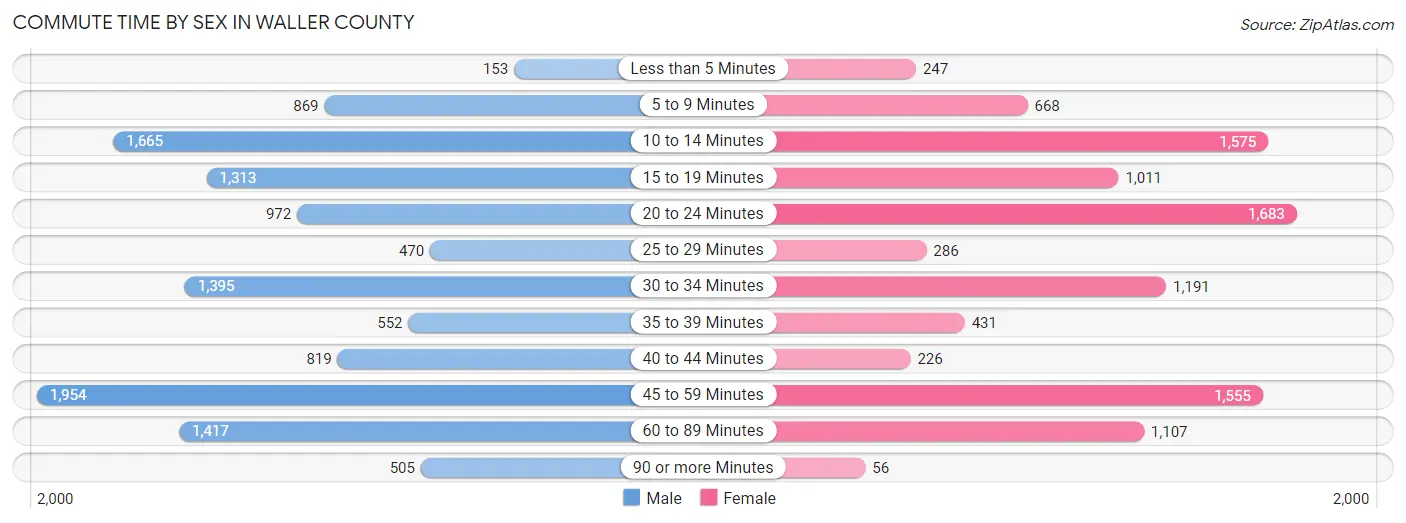
| Commute Time | Male | Female |
| Less than 5 Minutes | 153 (1.3%) | 247 (2.5%) |
| 5 to 9 Minutes | 869 (7.2%) | 668 (6.7%) |
| 10 to 14 Minutes | 1,665 (13.8%) | 1,575 (15.7%) |
| 15 to 19 Minutes | 1,313 (10.9%) | 1,011 (10.1%) |
| 20 to 24 Minutes | 972 (8.0%) | 1,683 (16.8%) |
| 25 to 29 Minutes | 470 (3.9%) | 286 (2.9%) |
| 30 to 34 Minutes | 1,395 (11.5%) | 1,191 (11.9%) |
| 35 to 39 Minutes | 552 (4.6%) | 431 (4.3%) |
| 40 to 44 Minutes | 819 (6.8%) | 226 (2.2%) |
| 45 to 59 Minutes | 1,954 (16.2%) | 1,555 (15.5%) |
| 60 to 89 Minutes | 1,417 (11.7%) | 1,107 (11.0%) |
| 90 or more Minutes | 505 (4.2%) | 56 (0.6%) |
Time of Departure to Work by Sex in Waller County
The most frequent times of departure to work in Waller County are 6:00 AM to 6:29 AM (2,186, 18.1%) for males and 8:00 AM to 8:29 AM (1,728, 17.2%) for females.
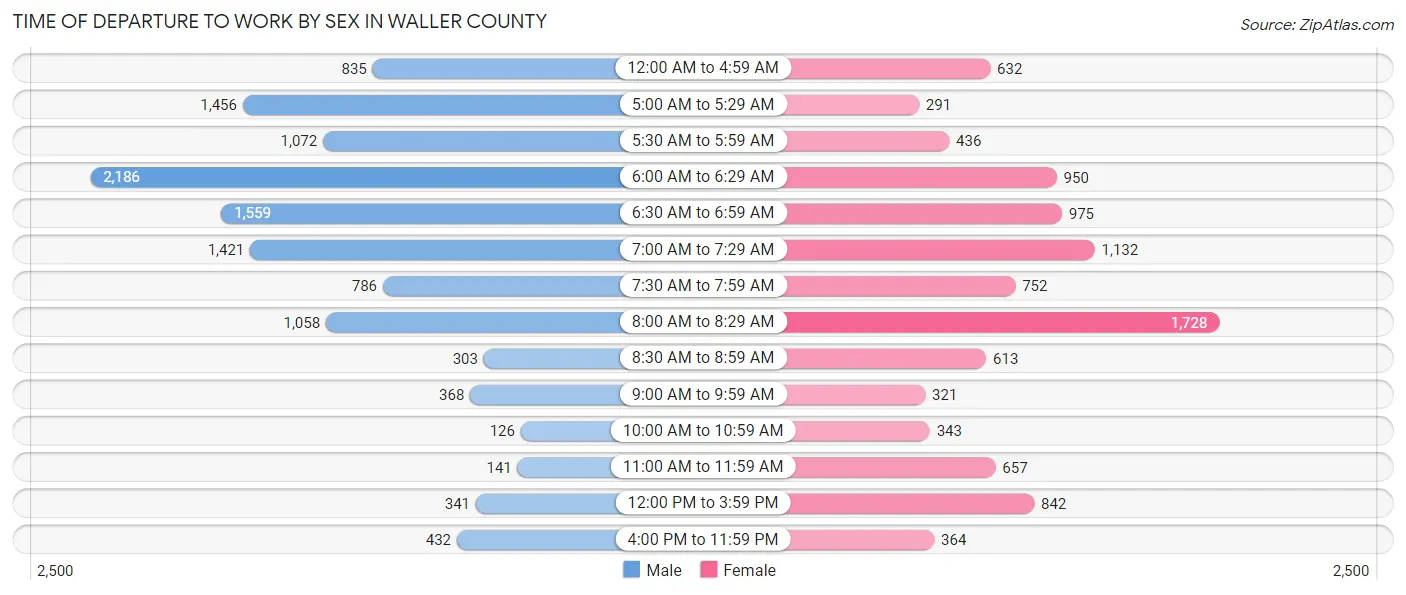
| Time of Departure | Male | Female |
| 12:00 AM to 4:59 AM | 835 (6.9%) | 632 (6.3%) |
| 5:00 AM to 5:29 AM | 1,456 (12.0%) | 291 (2.9%) |
| 5:30 AM to 5:59 AM | 1,072 (8.9%) | 436 (4.3%) |
| 6:00 AM to 6:29 AM | 2,186 (18.1%) | 950 (9.5%) |
| 6:30 AM to 6:59 AM | 1,559 (12.9%) | 975 (9.7%) |
| 7:00 AM to 7:29 AM | 1,421 (11.8%) | 1,132 (11.3%) |
| 7:30 AM to 7:59 AM | 786 (6.5%) | 752 (7.5%) |
| 8:00 AM to 8:29 AM | 1,058 (8.8%) | 1,728 (17.2%) |
| 8:30 AM to 8:59 AM | 303 (2.5%) | 613 (6.1%) |
| 9:00 AM to 9:59 AM | 368 (3.0%) | 321 (3.2%) |
| 10:00 AM to 10:59 AM | 126 (1.0%) | 343 (3.4%) |
| 11:00 AM to 11:59 AM | 141 (1.2%) | 657 (6.6%) |
| 12:00 PM to 3:59 PM | 341 (2.8%) | 842 (8.4%) |
| 4:00 PM to 11:59 PM | 432 (3.6%) | 364 (3.6%) |
| Total | 12,084 (100.0%) | 10,036 (100.0%) |
Housing Occupancy in Waller County
Occupancy by Ownership in Waller County
Of the total 17,780 dwellings in Waller County, owner-occupied units account for 12,348 (69.5%), while renter-occupied units make up 5,432 (30.5%).
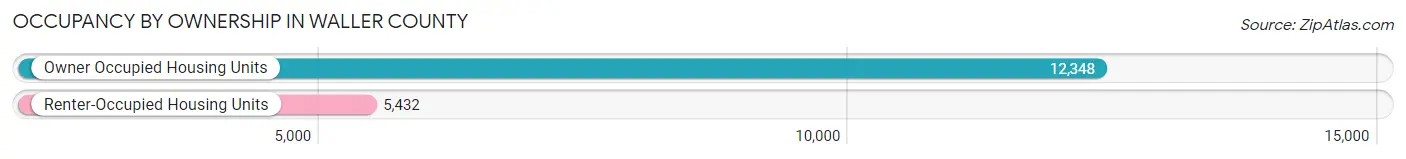
| Occupancy | # Housing Units | % Housing Units |
| Owner Occupied Housing Units | 12,348 | 69.5% |
| Renter-Occupied Housing Units | 5,432 | 30.5% |
| Total Occupied Housing Units | 17,780 | 100.0% |
Occupancy by Household Size in Waller County
| Household Size | # Housing Units | % Housing Units |
| 1-Person Household | 2,878 | 16.2% |
| 2-Person Household | 7,182 | 40.4% |
| 3-Person Household | 3,102 | 17.4% |
| 4+ Person Household | 4,618 | 26.0% |
| Total Housing Units | 17,780 | 100.0% |
Occupancy by Ownership by Household Size in Waller County
| Household Size | Owner-occupied | Renter-occupied |
| 1-Person Household | 1,475 (51.2%) | 1,403 (48.7%) |
| 2-Person Household | 5,231 (72.8%) | 1,951 (27.2%) |
| 3-Person Household | 2,277 (73.4%) | 825 (26.6%) |
| 4+ Person Household | 3,365 (72.9%) | 1,253 (27.1%) |
| Total Housing Units | 12,348 (69.5%) | 5,432 (30.5%) |
Occupancy by Educational Attainment in Waller County
| Household Size | Owner-occupied | Renter-occupied |
| Less than High School | 1,251 (67.1%) | 614 (32.9%) |
| High School Diploma | 3,366 (67.4%) | 1,626 (32.6%) |
| College/Associate Degree | 3,907 (60.7%) | 2,529 (39.3%) |
| Bachelor's Degree or higher | 3,824 (85.2%) | 663 (14.8%) |
Occupancy by Age of Householder in Waller County
| Age Bracket | # Households | % Households |
| Under 35 Years | 4,904 | 27.6% |
| 35 to 44 Years | 2,913 | 16.4% |
| 45 to 54 Years | 3,082 | 17.3% |
| 55 to 64 Years | 3,451 | 19.4% |
| 65 to 74 Years | 2,161 | 12.1% |
| 75 to 84 Years | 1,076 | 6.0% |
| 85 Years and Over | 193 | 1.1% |
| Total | 17,780 | 100.0% |
Housing Finances in Waller County
Median Income by Occupancy in Waller County
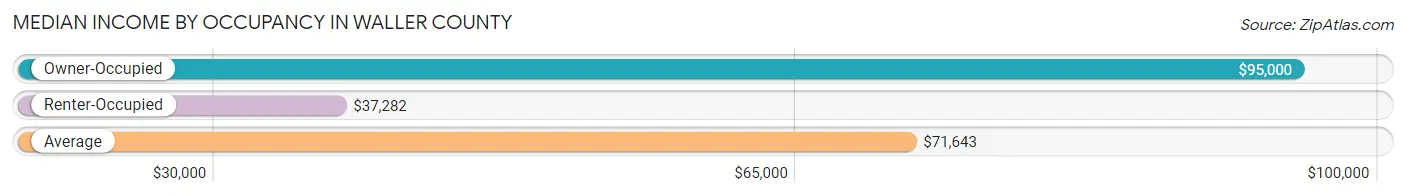
| Occupancy Type | # Households | Median Income |
| Owner-Occupied | 12,348 (69.5%) | $95,000 |
| Renter-Occupied | 5,432 (30.5%) | $37,282 |
| Average | 17,780 (100.0%) | $71,643 |
Occupancy by Householder Income Bracket in Waller County
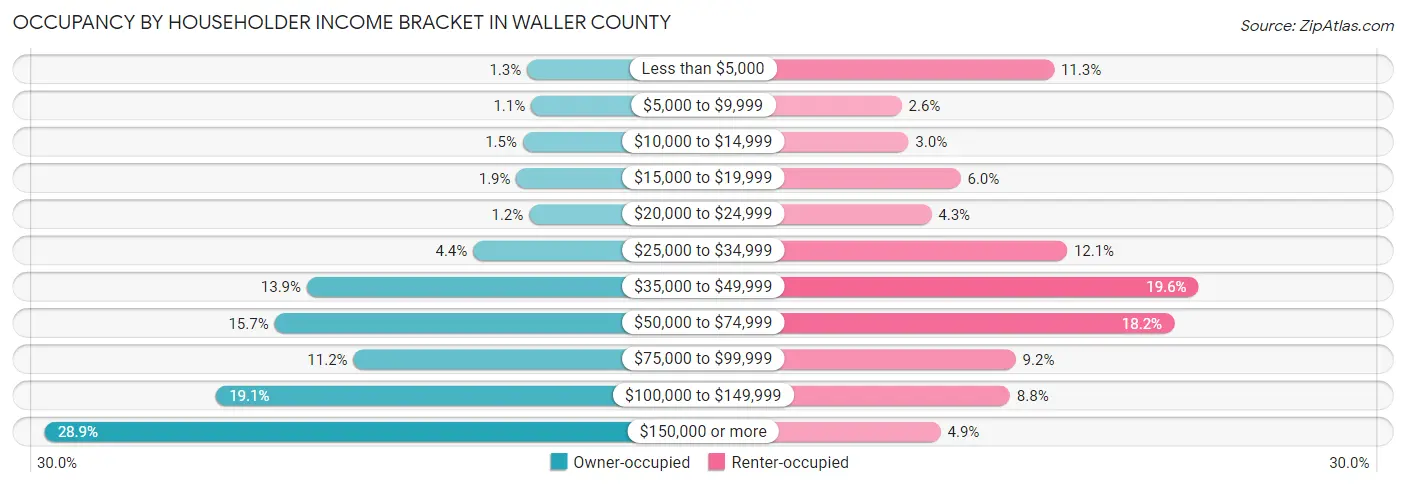
| Income Bracket | Owner-occupied | Renter-occupied |
| Less than $5,000 | 159 (1.3%) | 616 (11.3%) |
| $5,000 to $9,999 | 131 (1.1%) | 143 (2.6%) |
| $10,000 to $14,999 | 189 (1.5%) | 164 (3.0%) |
| $15,000 to $19,999 | 234 (1.9%) | 326 (6.0%) |
| $20,000 to $24,999 | 144 (1.2%) | 235 (4.3%) |
| $25,000 to $34,999 | 539 (4.4%) | 656 (12.1%) |
| $35,000 to $49,999 | 1,713 (13.9%) | 1,064 (19.6%) |
| $50,000 to $74,999 | 1,941 (15.7%) | 988 (18.2%) |
| $75,000 to $99,999 | 1,384 (11.2%) | 497 (9.1%) |
| $100,000 to $149,999 | 2,352 (19.1%) | 479 (8.8%) |
| $150,000 or more | 3,562 (28.8%) | 264 (4.9%) |
| Total | 12,348 (100.0%) | 5,432 (100.0%) |
Monthly Housing Cost Tiers in Waller County
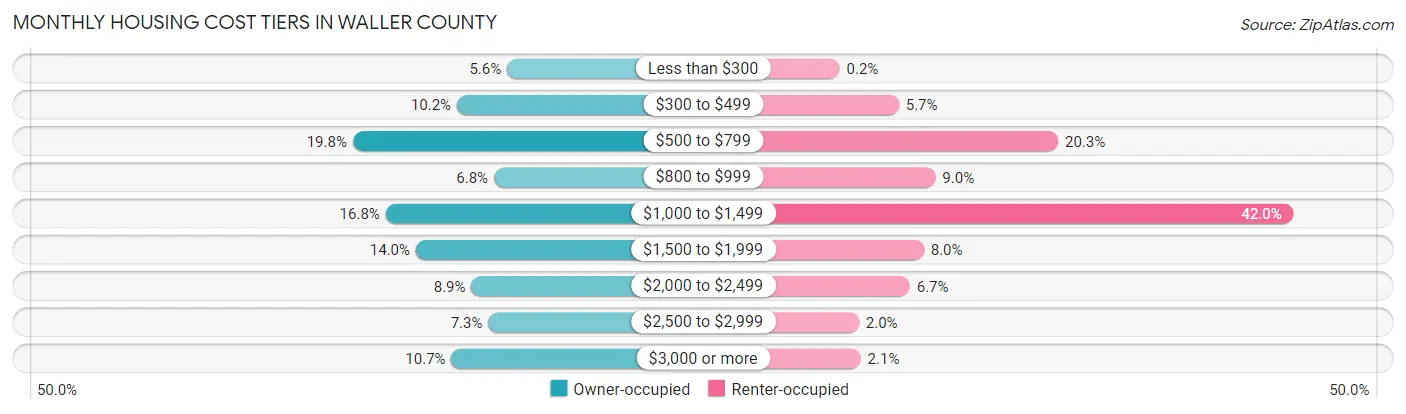
| Monthly Cost | Owner-occupied | Renter-occupied |
| Less than $300 | 690 (5.6%) | 11 (0.2%) |
| $300 to $499 | 1,259 (10.2%) | 307 (5.7%) |
| $500 to $799 | 2,444 (19.8%) | 1,103 (20.3%) |
| $800 to $999 | 839 (6.8%) | 490 (9.0%) |
| $1,000 to $1,499 | 2,069 (16.8%) | 2,281 (42.0%) |
| $1,500 to $1,999 | 1,726 (14.0%) | 432 (8.0%) |
| $2,000 to $2,499 | 1,095 (8.9%) | 362 (6.7%) |
| $2,500 to $2,999 | 903 (7.3%) | 107 (2.0%) |
| $3,000 or more | 1,323 (10.7%) | 116 (2.1%) |
| Total | 12,348 (100.0%) | 5,432 (100.0%) |
Physical Housing Characteristics in Waller County
Housing Structures in Waller County
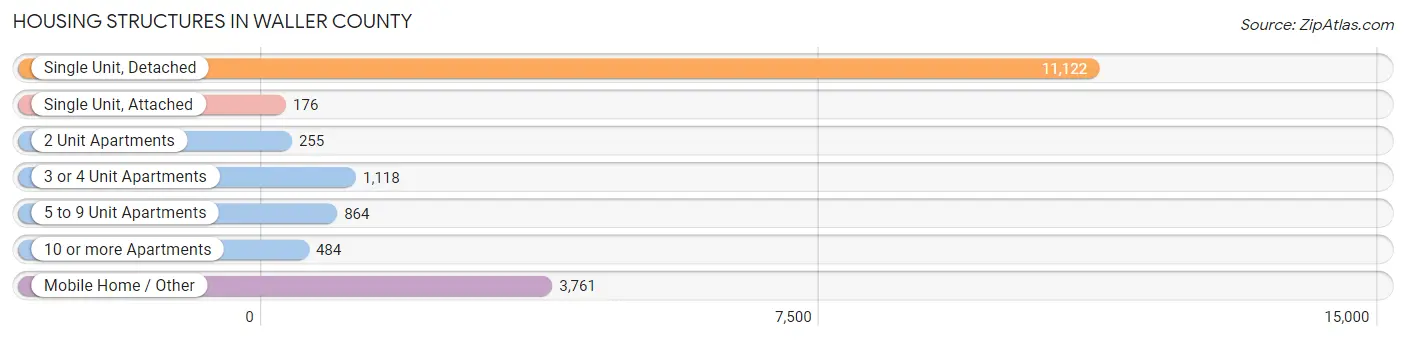
| Structure Type | # Housing Units | % Housing Units |
| Single Unit, Detached | 11,122 | 62.5% |
| Single Unit, Attached | 176 | 1.0% |
| 2 Unit Apartments | 255 | 1.4% |
| 3 or 4 Unit Apartments | 1,118 | 6.3% |
| 5 to 9 Unit Apartments | 864 | 4.9% |
| 10 or more Apartments | 484 | 2.7% |
| Mobile Home / Other | 3,761 | 21.1% |
| Total | 17,780 | 100.0% |
Housing Structures by Occupancy in Waller County
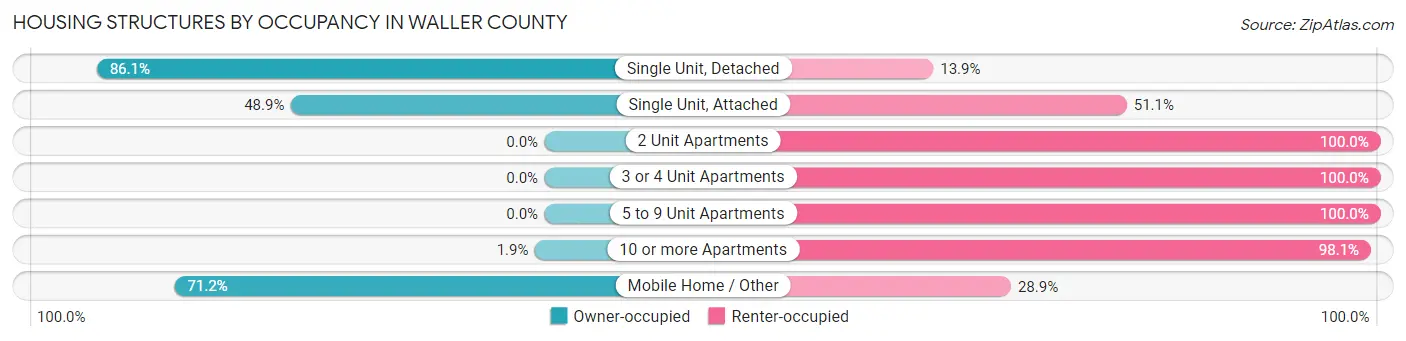
| Structure Type | Owner-occupied | Renter-occupied |
| Single Unit, Detached | 9,577 (86.1%) | 1,545 (13.9%) |
| Single Unit, Attached | 86 (48.9%) | 90 (51.1%) |
| 2 Unit Apartments | 0 (0.0%) | 255 (100.0%) |
| 3 or 4 Unit Apartments | 0 (0.0%) | 1,118 (100.0%) |
| 5 to 9 Unit Apartments | 0 (0.0%) | 864 (100.0%) |
| 10 or more Apartments | 9 (1.9%) | 475 (98.1%) |
| Mobile Home / Other | 2,676 (71.2%) | 1,085 (28.8%) |
| Total | 12,348 (69.5%) | 5,432 (30.5%) |
Housing Structures by Number of Rooms in Waller County
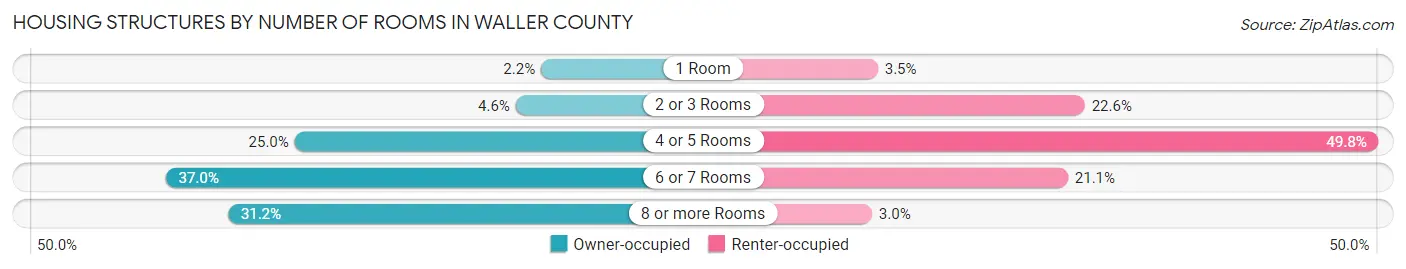
| Number of Rooms | Owner-occupied | Renter-occupied |
| 1 Room | 276 (2.2%) | 190 (3.5%) |
| 2 or 3 Rooms | 565 (4.6%) | 1,230 (22.6%) |
| 4 or 5 Rooms | 3,091 (25.0%) | 2,706 (49.8%) |
| 6 or 7 Rooms | 4,564 (37.0%) | 1,145 (21.1%) |
| 8 or more Rooms | 3,852 (31.2%) | 161 (3.0%) |
| Total | 12,348 (100.0%) | 5,432 (100.0%) |
Housing Structure by Heating Type in Waller County
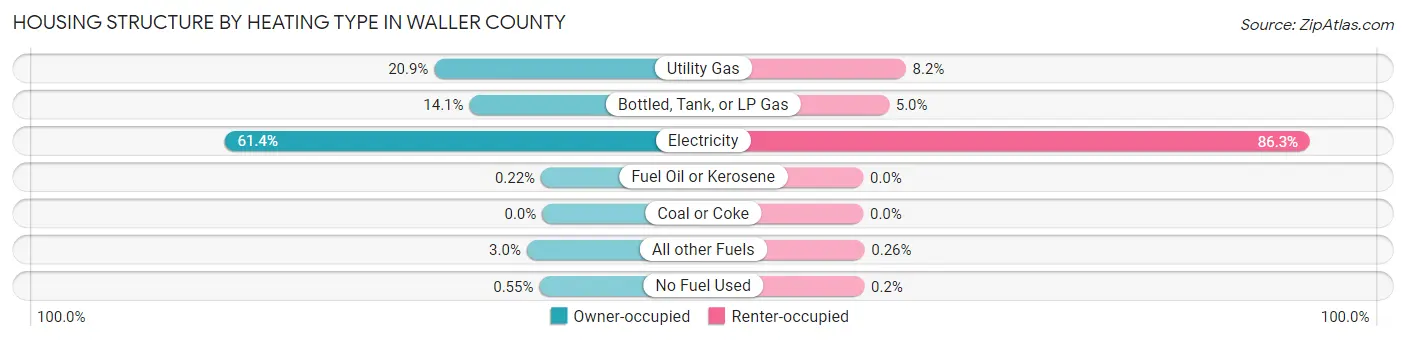
| Heating Type | Owner-occupied | Renter-occupied |
| Utility Gas | 2,574 (20.8%) | 447 (8.2%) |
| Bottled, Tank, or LP Gas | 1,736 (14.1%) | 270 (5.0%) |
| Electricity | 7,576 (61.4%) | 4,690 (86.3%) |
| Fuel Oil or Kerosene | 27 (0.2%) | 0 (0.0%) |
| Coal or Coke | 0 (0.0%) | 0 (0.0%) |
| All other Fuels | 367 (3.0%) | 14 (0.3%) |
| No Fuel Used | 68 (0.5%) | 11 (0.2%) |
| Total | 12,348 (100.0%) | 5,432 (100.0%) |
Household Vehicle Usage in Waller County
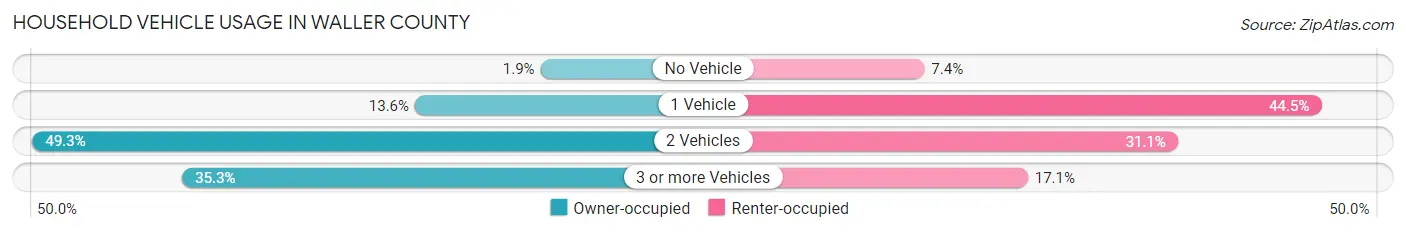
| Vehicles per Household | Owner-occupied | Renter-occupied |
| No Vehicle | 229 (1.8%) | 403 (7.4%) |
| 1 Vehicle | 1,676 (13.6%) | 2,415 (44.5%) |
| 2 Vehicles | 6,085 (49.3%) | 1,687 (31.1%) |
| 3 or more Vehicles | 4,358 (35.3%) | 927 (17.1%) |
| Total | 12,348 (100.0%) | 5,432 (100.0%) |
Real Estate & Mortgages in Waller County
Real Estate and Mortgage Overview in Waller County
| Characteristic | Without Mortgage | With Mortgage |
| Housing Units | 6,396 | 5,952 |
| Median Property Value | $241,400 | $311,800 |
| Median Household Income | $76,781 | $2,252 |
| Monthly Housing Costs | $707 | $1,173 |
| Real Estate Taxes | $2,941 | $284 |
Property Value by Mortgage Status in Waller County
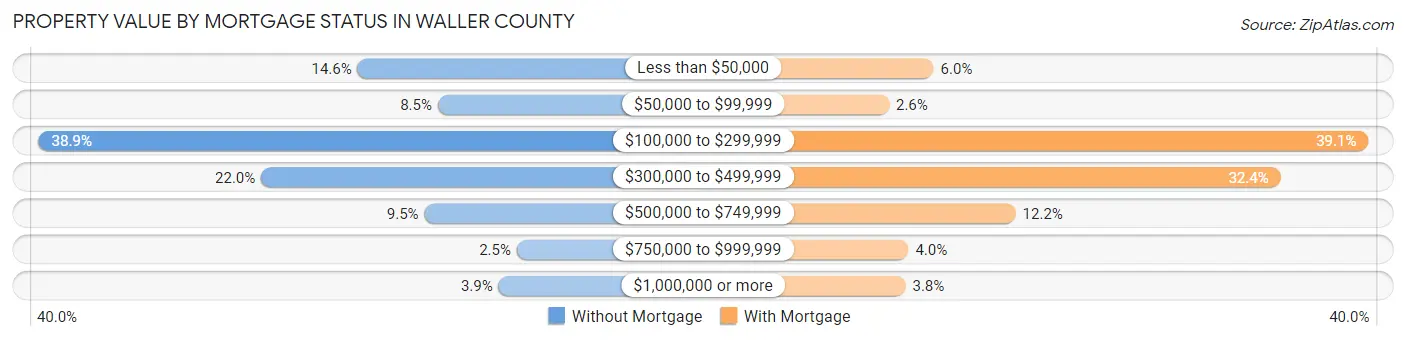
| Property Value | Without Mortgage | With Mortgage |
| Less than $50,000 | 936 (14.6%) | 354 (5.9%) |
| $50,000 to $99,999 | 545 (8.5%) | 152 (2.5%) |
| $100,000 to $299,999 | 2,490 (38.9%) | 2,325 (39.1%) |
| $300,000 to $499,999 | 1,406 (22.0%) | 1,928 (32.4%) |
| $500,000 to $749,999 | 610 (9.5%) | 726 (12.2%) |
| $750,000 to $999,999 | 160 (2.5%) | 240 (4.0%) |
| $1,000,000 or more | 249 (3.9%) | 227 (3.8%) |
| Total | 6,396 (100.0%) | 5,952 (100.0%) |
Household Income by Mortgage Status in Waller County
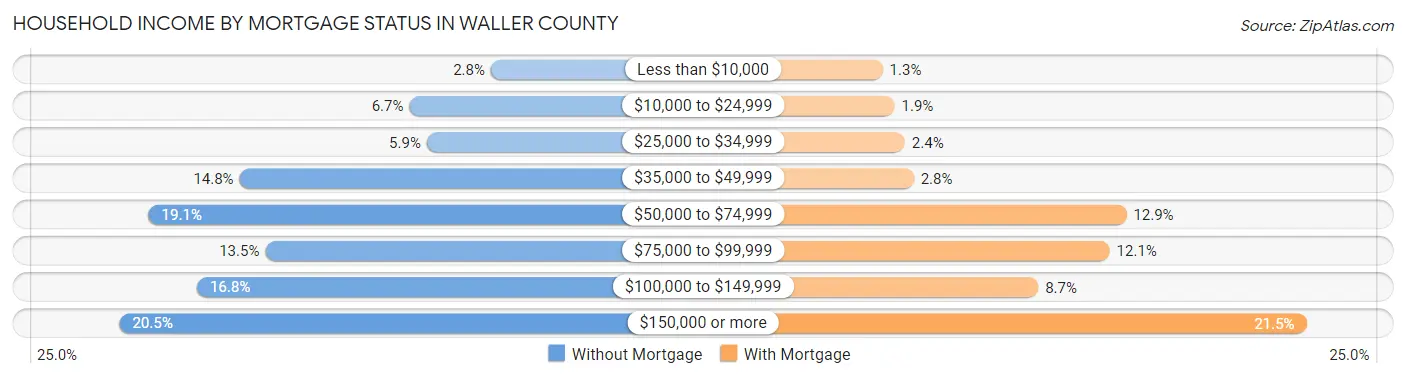
| Household Income | Without Mortgage | With Mortgage |
| Less than $10,000 | 179 (2.8%) | 77 (1.3%) |
| $10,000 to $24,999 | 427 (6.7%) | 111 (1.9%) |
| $25,000 to $34,999 | 374 (5.9%) | 140 (2.4%) |
| $35,000 to $49,999 | 945 (14.8%) | 165 (2.8%) |
| $50,000 to $74,999 | 1,221 (19.1%) | 768 (12.9%) |
| $75,000 to $99,999 | 866 (13.5%) | 720 (12.1%) |
| $100,000 to $149,999 | 1,074 (16.8%) | 518 (8.7%) |
| $150,000 or more | 1,310 (20.5%) | 1,278 (21.5%) |
| Total | 6,396 (100.0%) | 5,952 (100.0%) |
Property Value to Household Income Ratio in Waller County
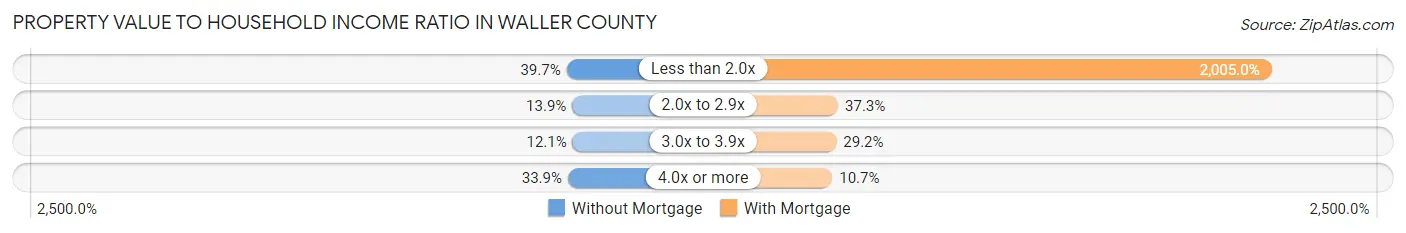
| Value-to-Income Ratio | Without Mortgage | With Mortgage |
| Less than 2.0x | 2,542 (39.7%) | 119,339 (2,005.0%) |
| 2.0x to 2.9x | 888 (13.9%) | 2,222 (37.3%) |
| 3.0x to 3.9x | 772 (12.1%) | 1,739 (29.2%) |
| 4.0x or more | 2,165 (33.9%) | 634 (10.6%) |
| Total | 6,396 (100.0%) | 5,952 (100.0%) |
Real Estate Taxes by Mortgage Status in Waller County
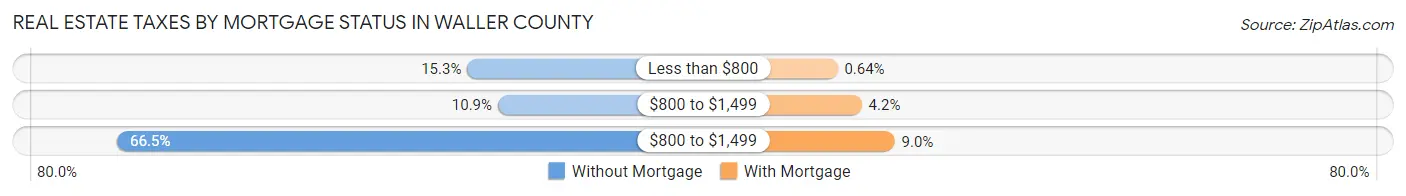
| Property Taxes | Without Mortgage | With Mortgage |
| Less than $800 | 980 (15.3%) | 38 (0.6%) |
| $800 to $1,499 | 694 (10.8%) | 249 (4.2%) |
| $800 to $1,499 | 4,253 (66.5%) | 535 (9.0%) |
| Total | 6,396 (100.0%) | 5,952 (100.0%) |
Health & Disability in Waller County
Health Insurance Coverage by Age in Waller County
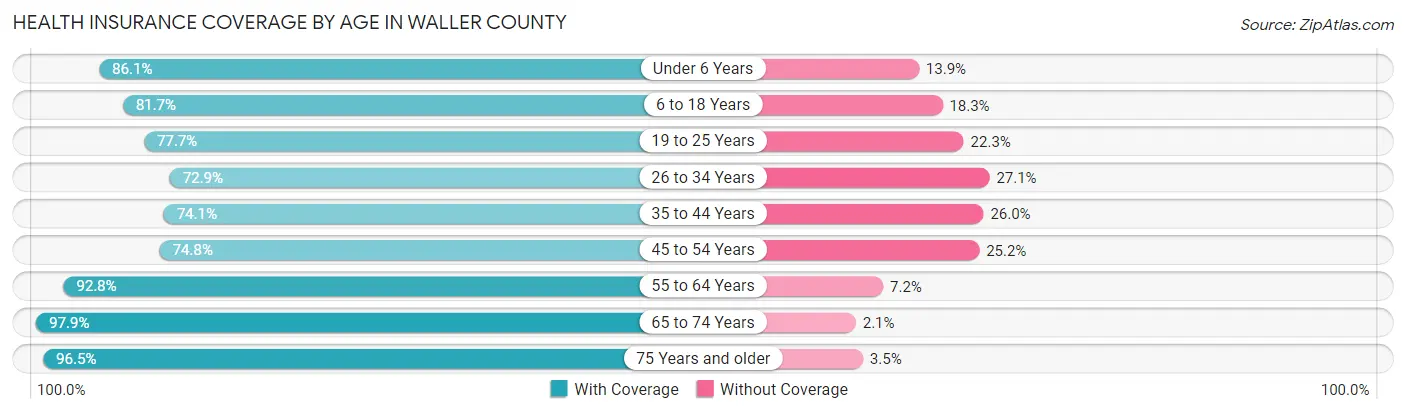
| Age Bracket | With Coverage | Without Coverage |
| Under 6 Years | 3,578 (86.1%) | 578 (13.9%) |
| 6 to 18 Years | 9,007 (81.7%) | 2,018 (18.3%) |
| 19 to 25 Years | 8,743 (77.7%) | 2,504 (22.3%) |
| 26 to 34 Years | 4,501 (72.9%) | 1,671 (27.1%) |
| 35 to 44 Years | 4,778 (74.1%) | 1,674 (26.0%) |
| 45 to 54 Years | 4,219 (74.8%) | 1,418 (25.2%) |
| 55 to 64 Years | 5,625 (92.8%) | 439 (7.2%) |
| 65 to 74 Years | 4,124 (97.9%) | 90 (2.1%) |
| 75 Years and older | 2,198 (96.5%) | 79 (3.5%) |
| Total | 46,773 (81.7%) | 10,471 (18.3%) |
Health Insurance Coverage by Citizenship Status in Waller County
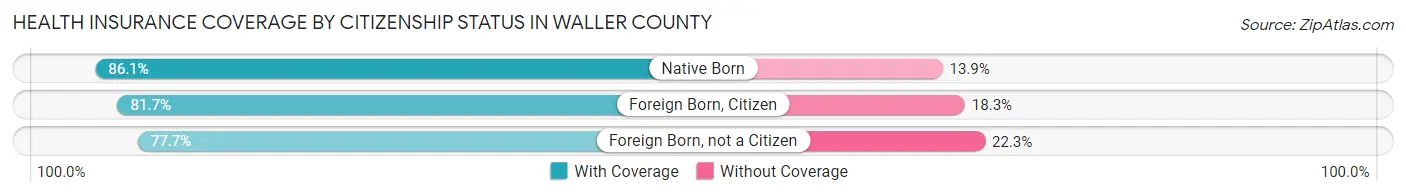
| Citizenship Status | With Coverage | Without Coverage |
| Native Born | 3,578 (86.1%) | 578 (13.9%) |
| Foreign Born, Citizen | 9,007 (81.7%) | 2,018 (18.3%) |
| Foreign Born, not a Citizen | 8,743 (77.7%) | 2,504 (22.3%) |
Health Insurance Coverage by Household Income in Waller County
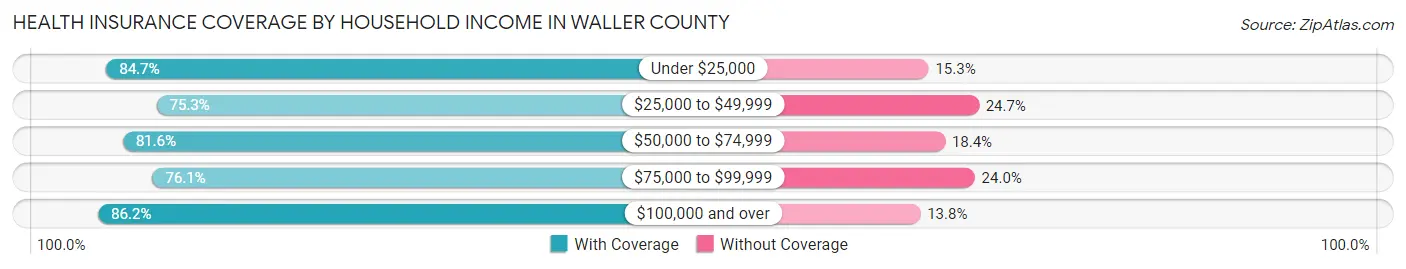
| Household Income | With Coverage | Without Coverage |
| Under $25,000 | 4,012 (84.7%) | 725 (15.3%) |
| $25,000 to $49,999 | 7,661 (75.3%) | 2,514 (24.7%) |
| $50,000 to $74,999 | 7,356 (81.6%) | 1,658 (18.4%) |
| $75,000 to $99,999 | 4,337 (76.0%) | 1,366 (23.9%) |
| $100,000 and over | 19,887 (86.2%) | 3,174 (13.8%) |
Public vs Private Health Insurance Coverage by Age in Waller County
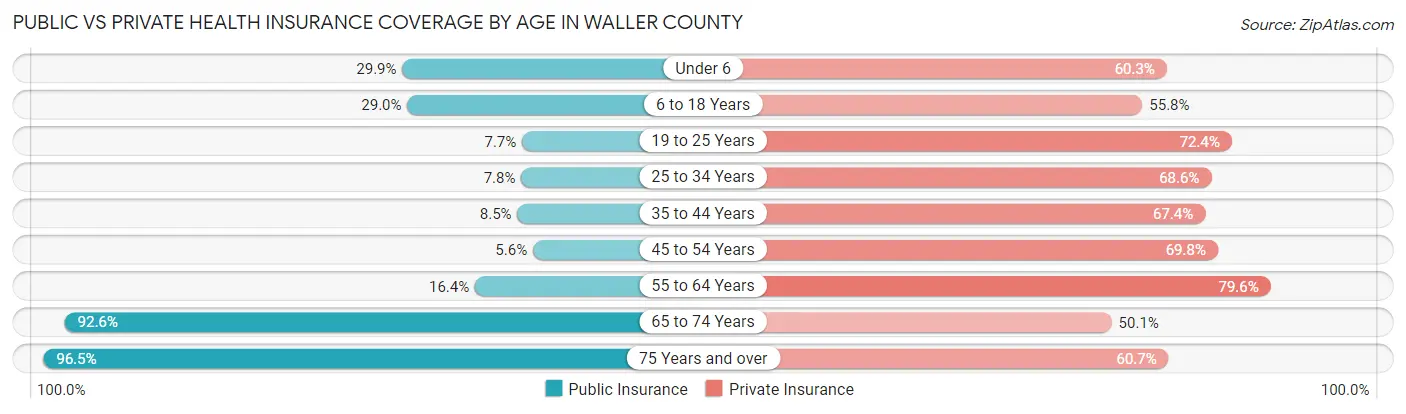
| Age Bracket | Public Insurance | Private Insurance |
| Under 6 | 1,242 (29.9%) | 2,506 (60.3%) |
| 6 to 18 Years | 3,192 (28.9%) | 6,151 (55.8%) |
| 19 to 25 Years | 862 (7.7%) | 8,140 (72.4%) |
| 25 to 34 Years | 482 (7.8%) | 4,232 (68.6%) |
| 35 to 44 Years | 550 (8.5%) | 4,350 (67.4%) |
| 45 to 54 Years | 318 (5.6%) | 3,933 (69.8%) |
| 55 to 64 Years | 994 (16.4%) | 4,826 (79.6%) |
| 65 to 74 Years | 3,901 (92.6%) | 2,111 (50.1%) |
| 75 Years and over | 2,198 (96.5%) | 1,381 (60.7%) |
| Total | 13,739 (24.0%) | 37,630 (65.7%) |
Disability Status by Sex by Age in Waller County
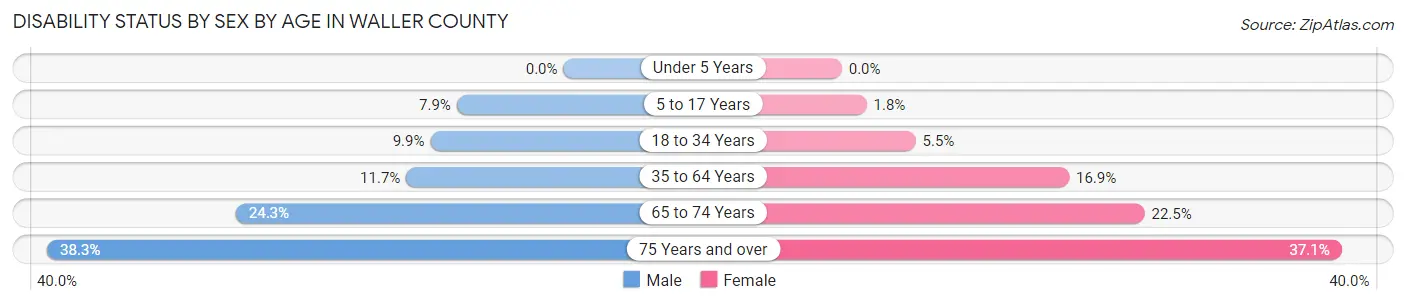
| Age Bracket | Male | Female |
| Under 5 Years | 0 (0.0%) | 0 (0.0%) |
| 5 to 17 Years | 385 (7.9%) | 92 (1.8%) |
| 18 to 34 Years | 912 (9.9%) | 547 (5.5%) |
| 35 to 64 Years | 1,091 (11.7%) | 1,486 (16.9%) |
| 65 to 74 Years | 502 (24.3%) | 483 (22.5%) |
| 75 Years and over | 381 (38.3%) | 476 (37.1%) |
Disability Class by Sex by Age in Waller County
Disability Class: Hearing Difficulty
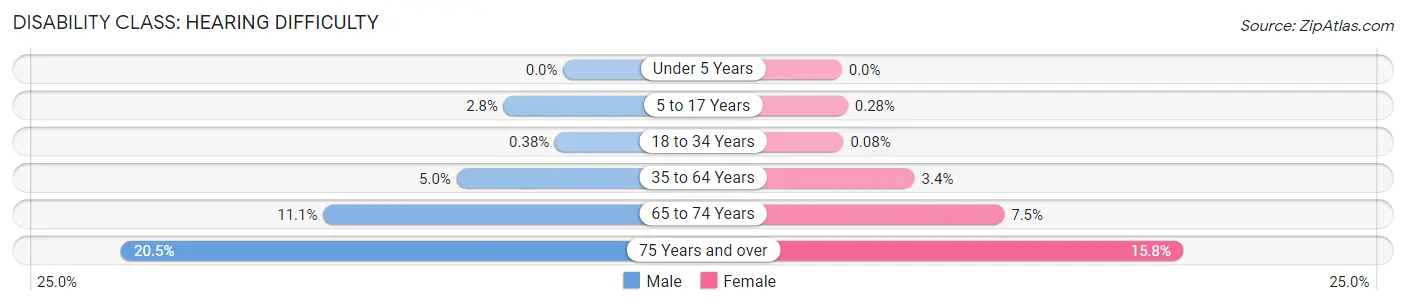
| Age Bracket | Male | Female |
| Under 5 Years | 0 (0.0%) | 0 (0.0%) |
| 5 to 17 Years | 134 (2.8%) | 14 (0.3%) |
| 18 to 34 Years | 35 (0.4%) | 8 (0.1%) |
| 35 to 64 Years | 463 (5.0%) | 298 (3.4%) |
| 65 to 74 Years | 230 (11.1%) | 162 (7.5%) |
| 75 Years and over | 204 (20.5%) | 203 (15.8%) |
Disability Class: Vision Difficulty
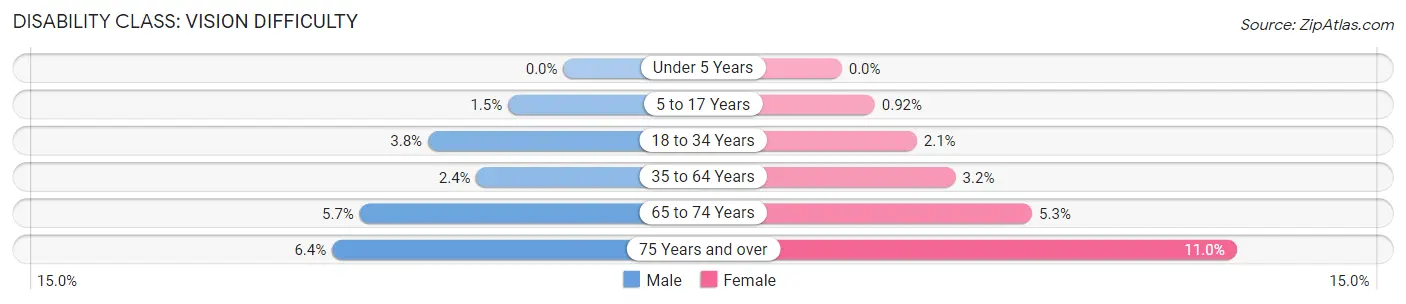
| Age Bracket | Male | Female |
| Under 5 Years | 0 (0.0%) | 0 (0.0%) |
| 5 to 17 Years | 75 (1.5%) | 46 (0.9%) |
| 18 to 34 Years | 348 (3.8%) | 209 (2.1%) |
| 35 to 64 Years | 226 (2.4%) | 279 (3.2%) |
| 65 to 74 Years | 117 (5.7%) | 114 (5.3%) |
| 75 Years and over | 64 (6.4%) | 141 (11.0%) |
Disability Class: Cognitive Difficulty
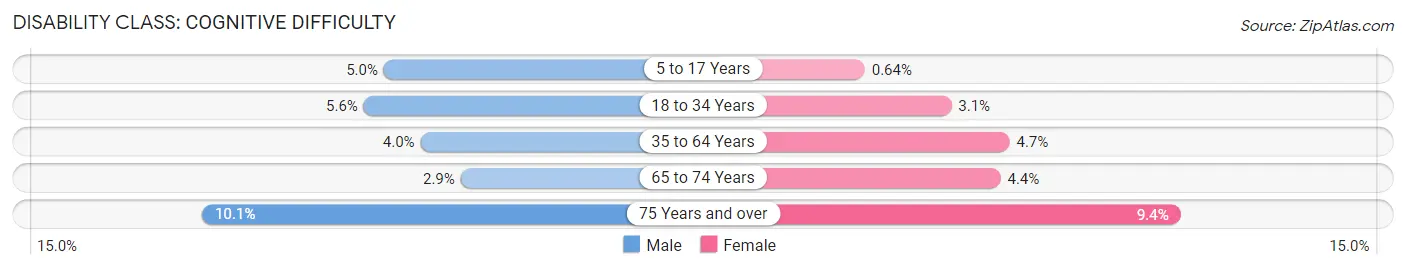
| Age Bracket | Male | Female |
| 5 to 17 Years | 243 (5.0%) | 32 (0.6%) |
| 18 to 34 Years | 513 (5.6%) | 304 (3.0%) |
| 35 to 64 Years | 372 (4.0%) | 411 (4.7%) |
| 65 to 74 Years | 59 (2.9%) | 95 (4.4%) |
| 75 Years and over | 100 (10.1%) | 121 (9.4%) |
Disability Class: Ambulatory Difficulty
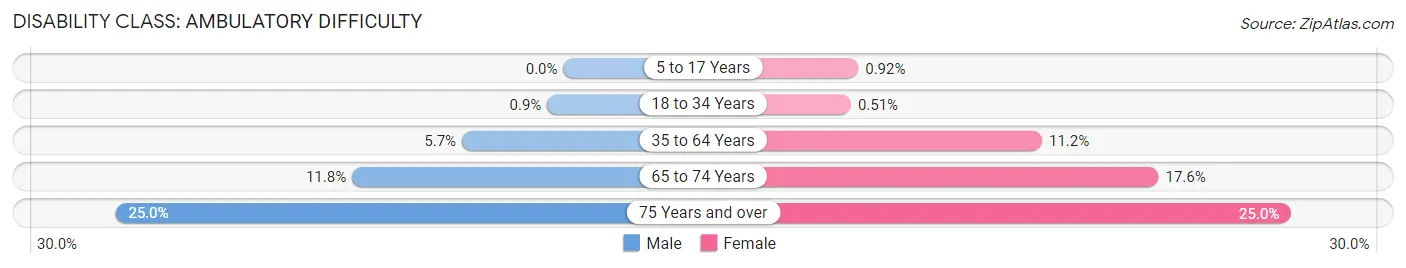
| Age Bracket | Male | Female |
| 5 to 17 Years | 0 (0.0%) | 46 (0.9%) |
| 18 to 34 Years | 83 (0.9%) | 51 (0.5%) |
| 35 to 64 Years | 528 (5.7%) | 982 (11.2%) |
| 65 to 74 Years | 243 (11.8%) | 379 (17.6%) |
| 75 Years and over | 248 (24.9%) | 321 (25.0%) |
Disability Class: Self-Care Difficulty
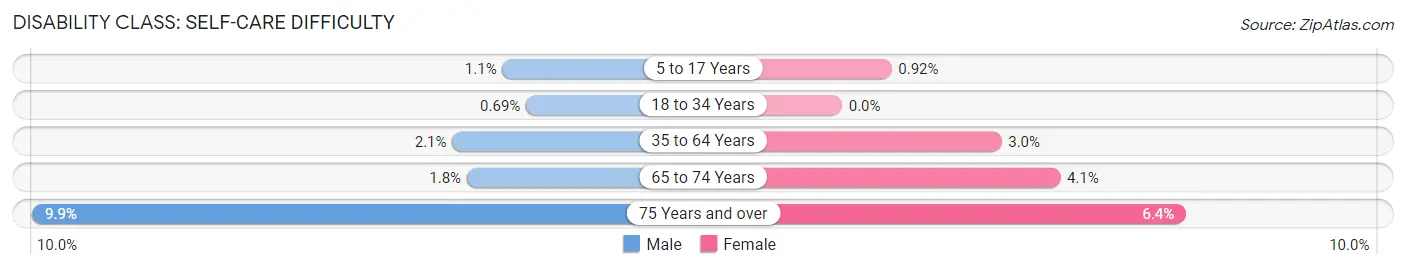
| Age Bracket | Male | Female |
| 5 to 17 Years | 55 (1.1%) | 46 (0.9%) |
| 18 to 34 Years | 64 (0.7%) | 0 (0.0%) |
| 35 to 64 Years | 193 (2.1%) | 261 (3.0%) |
| 65 to 74 Years | 37 (1.8%) | 87 (4.1%) |
| 75 Years and over | 98 (9.9%) | 82 (6.4%) |
Technology Access in Waller County
Computing Device Access in Waller County
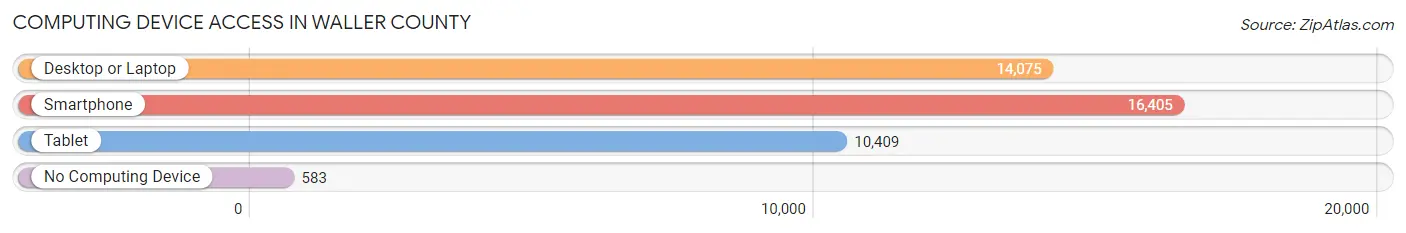
| Device Type | # Households | % Households |
| Desktop or Laptop | 14,075 | 79.2% |
| Smartphone | 16,405 | 92.3% |
| Tablet | 10,409 | 58.5% |
| No Computing Device | 583 | 3.3% |
| Total | 17,780 | 100.0% |
Internet Access in Waller County
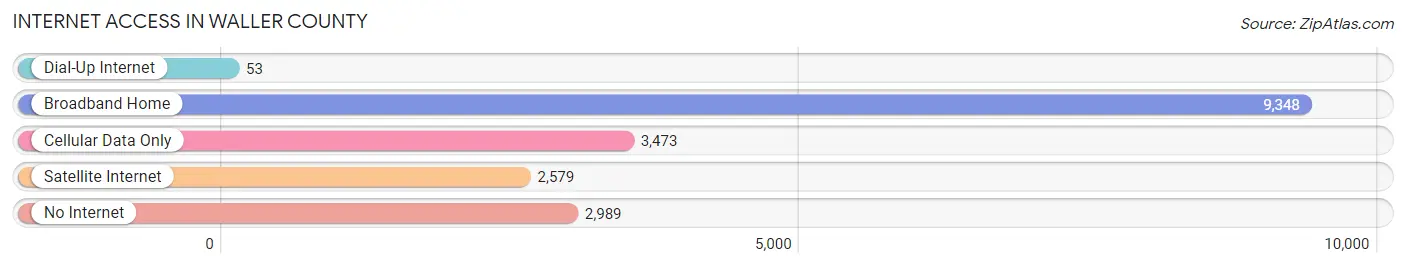
| Internet Type | # Households | % Households |
| Dial-Up Internet | 53 | 0.3% |
| Broadband Home | 9,348 | 52.6% |
| Cellular Data Only | 3,473 | 19.5% |
| Satellite Internet | 2,579 | 14.5% |
| No Internet | 2,989 | 16.8% |
| Total | 17,780 | 100.0% |
Waller County Summary
Waller County is located in the southeastern part of Texas, about 40 miles northwest of Houston. It is bordered by Austin, Grimes, Montgomery, and Washington counties. The county seat is Hempstead, and the county has a population of approximately 43,205 people.
Waller County was established in 1873 and named after Edwin Waller, a signer of the Texas Declaration of Independence. The county was originally part of Austin County, but was later divided into its own county. The county was originally home to the Atakapan Indians, who were later displaced by settlers.
Geography
Waller County is located in the southeastern part of Texas, about 40 miles northwest of Houston. It is bordered by Austin, Grimes, Montgomery, and Washington counties. The county has a total area of 545 square miles, of which 544 square miles is land and 1 square mile is water. The terrain is mostly flat, with some rolling hills in the northern part of the county. The county is drained by the Brazos River, which runs through the center of the county.
The climate of Waller County is humid subtropical, with hot summers and mild winters. The average annual temperature is 68°F, and the average annual precipitation is 40 inches.
Economy
The economy of Waller County is largely based on agriculture and oil and gas production. The county is home to several large farms, which produce cotton, corn, soybeans, and other crops. The county is also home to several oil and gas production companies, which produce oil and natural gas from the county's many oil and gas fields.
In addition to agriculture and oil and gas production, Waller County is home to several manufacturing companies, including a paper mill, a plastics plant, and a steel mill. The county is also home to several retail stores, restaurants, and other businesses.
Demographics
As of the 2010 census, Waller County had a population of 43,205 people. The racial makeup of the county was 73.3% White, 17.2% African American, 0.5% Native American, 0.7% Asian, 0.1% Pacific Islander, 6.7% from other races, and 1.5% from two or more races. Hispanic or Latino of any race were 18.2% of the population.
The median household income in Waller County was $50,945, and the median family income was $60,945. The per capita income was $22,945. About 14.2% of the population was below the poverty line.
Waller County is served by the Waller Independent School District, which includes seven elementary schools, two middle schools, and one high school. The county is also home to several private schools, including a Catholic school and a Lutheran school.
Common Questions
What is Per Capita Income in Waller County?
Per Capita income in Waller County is $32,446.
What is the Median Family Income in Waller County?
Median Family Income in Waller County is $86,563.
What is the Median Household income in Waller County?
Median Household Income in Waller County is $71,643.
What is Income or Wage Gap in Waller County?
Income or Wage Gap in Waller County is 44.2%.
Women in Waller County earn 55.8 cents for every dollar earned by a man.
What is Inequality or Gini Index in Waller County?
Inequality or Gini Index in Waller County is 0.46.
What is the Total Population of Waller County?
Total Population of Waller County is 57,463.
What is the Total Male Population of Waller County?
Total Male Population of Waller County is 28,521.
What is the Total Female Population of Waller County?
Total Female Population of Waller County is 28,942.
What is the Ratio of Males per 100 Females in Waller County?
There are 98.55 Males per 100 Females in Waller County.
What is the Ratio of Females per 100 Males in Waller County?
There are 101.48 Females per 100 Males in Waller County.
What is the Median Population Age in Waller County?
Median Population Age in Waller County is 28.7 Years.
What is the Average Family Size in Waller County
Average Family Size in Waller County is 3.4 People.
What is the Average Household Size in Waller County
Average Household Size in Waller County is 3.0 People.
How Large is the Labor Force in Waller County?
There are 26,537 People in the Labor Forcein in Waller County.
What is the Percentage of People in the Labor Force in Waller County?
58.4% of People are in the Labor Force in Waller County.
What is the Unemployment Rate in Waller County?
Unemployment Rate in Waller County is 6.1%.