Upton County, TX Map & Demographics
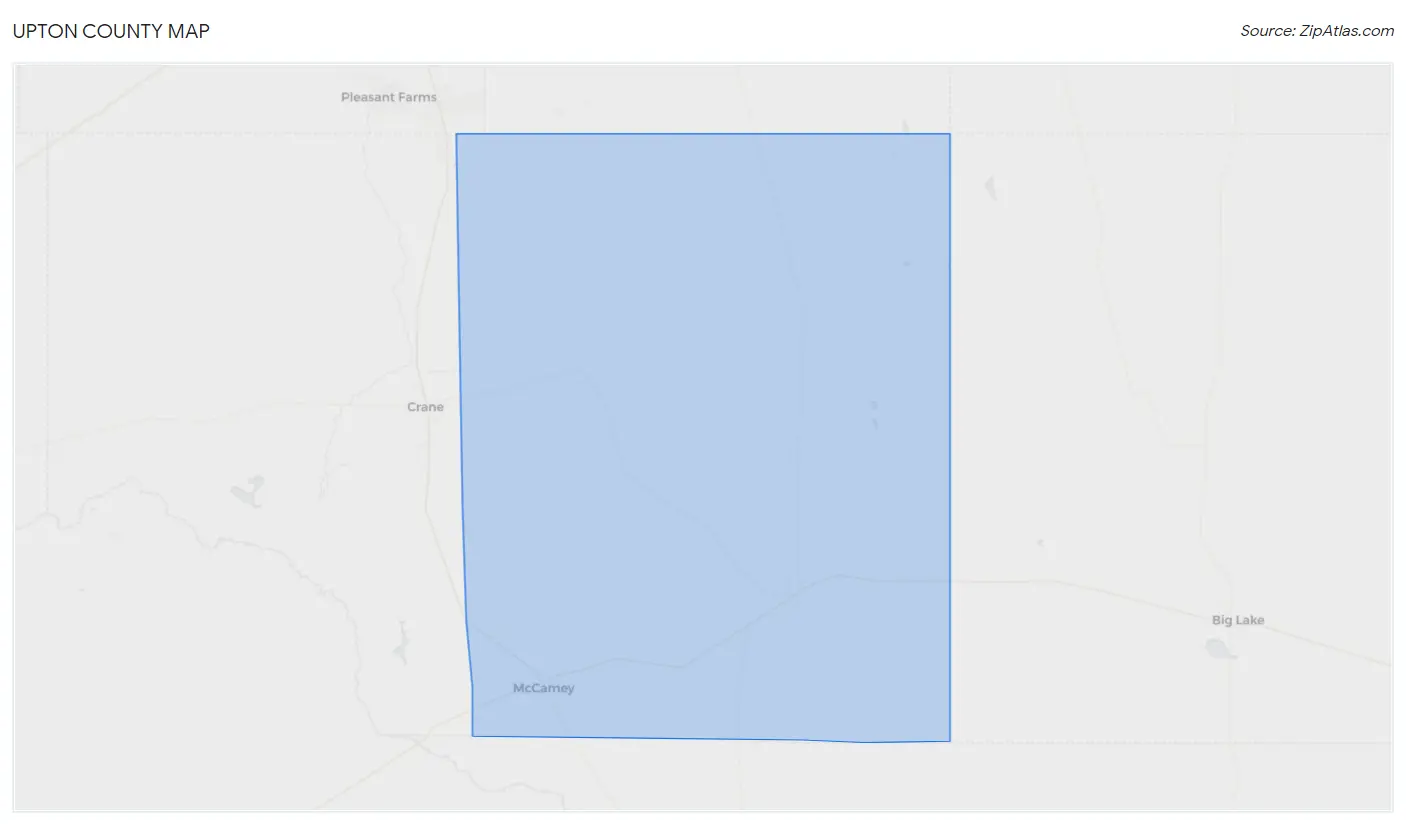
Upton County Map
Upton County Overview
$27,385
PER CAPITA INCOME
$73,563
AVG FAMILY INCOME
$55,284
AVG HOUSEHOLD INCOME
51.2%
WAGE / INCOME GAP [ % ]
48.8¢/ $1
WAGE / INCOME GAP [ $ ]
0.43
INEQUALITY / GINI INDEX
3,284
TOTAL POPULATION
1,640
MALE POPULATION
1,644
FEMALE POPULATION
99.76
MALES / 100 FEMALES
100.24
FEMALES / 100 MALES
39.9
MEDIAN AGE
2.9
AVG FAMILY SIZE
2.4
AVG HOUSEHOLD SIZE
1,428
LABOR FORCE [ PEOPLE ]
58.0%
PERCENT IN LABOR FORCE
4.7%
UNEMPLOYMENT RATE
Upton County Area Codes
Income in Upton County
Income Overview in Upton County
Per Capita Income in Upton County is $27,385, while median incomes of families and households are $73,563 and $55,284 respectively.
| Characteristic | Number | Measure |
| Per Capita Income | 3,284 | $27,385 |
| Median Family Income | 927 | $73,563 |
| Mean Family Income | 927 | $80,112 |
| Median Household Income | 1,363 | $55,284 |
| Mean Household Income | 1,363 | $69,047 |
| Income Deficit | 927 | $0 |
| Wage / Income Gap (%) | 3,284 | 51.21% |
| Wage / Income Gap ($) | 3,284 | 48.79¢ per $1 |
| Gini / Inequality Index | 3,284 | 0.43 |
Earnings by Sex in Upton County
Average Earnings in Upton County are $40,050, $55,139 for men and $26,901 for women, a difference of 51.2%.
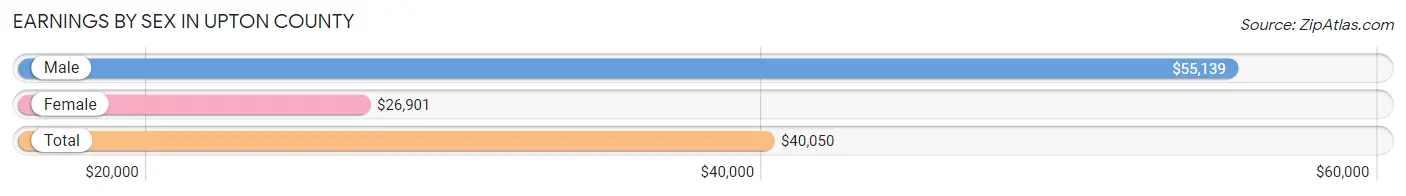
| Sex | Number | Average Earnings |
| Male | 782 (51.8%) | $55,139 |
| Female | 727 (48.2%) | $26,901 |
| Total | 1,509 (100.0%) | $40,050 |
Earnings by Sex by Income Bracket in Upton County
The most common earnings brackets in Upton County are $100,000+ for men (144 | 18.4%) and $2,499 or less for women (97 | 13.3%).
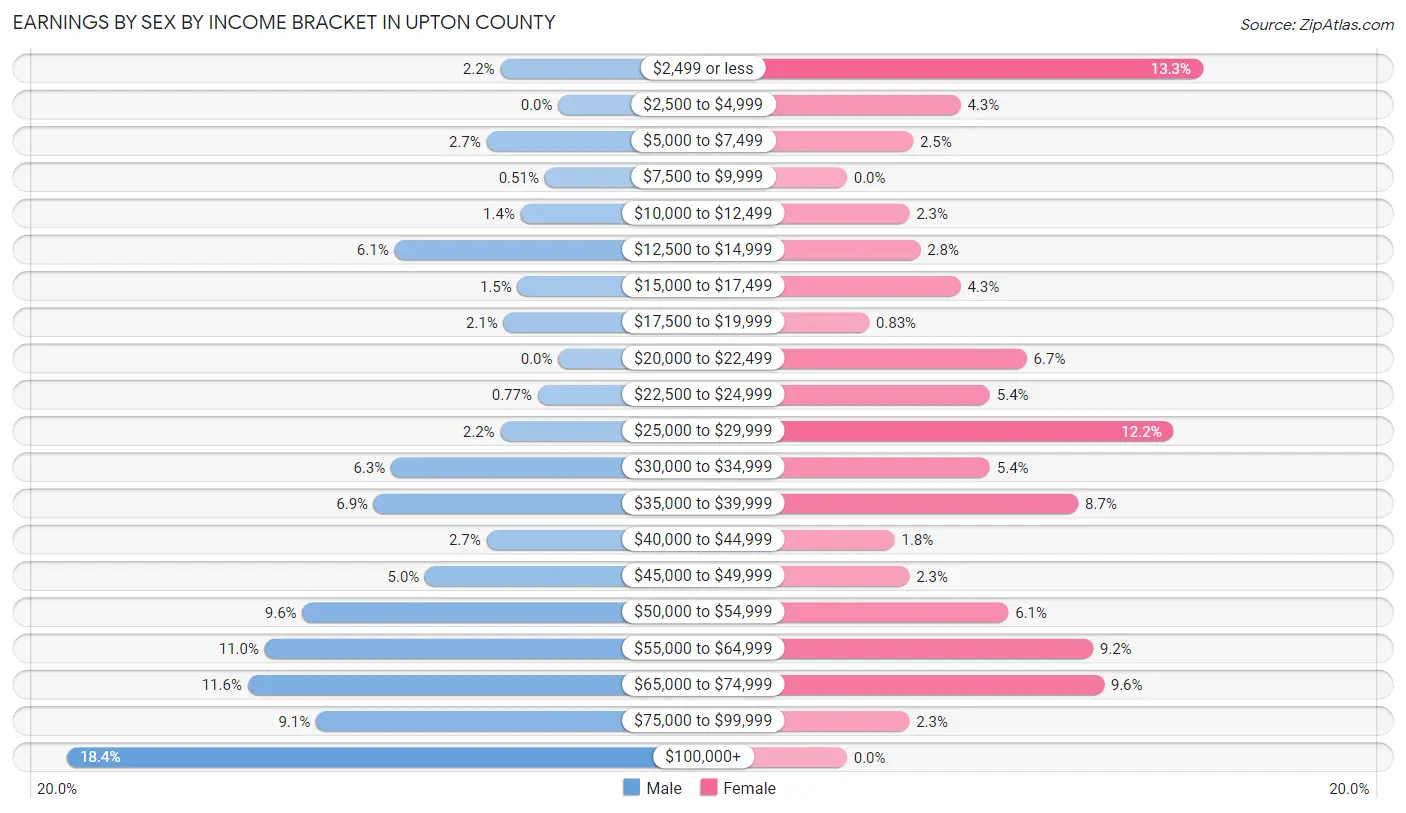
| Income | Male | Female |
| $2,499 or less | 17 (2.2%) | 97 (13.3%) |
| $2,500 to $4,999 | 0 (0.0%) | 31 (4.3%) |
| $5,000 to $7,499 | 21 (2.7%) | 18 (2.5%) |
| $7,500 to $9,999 | 4 (0.5%) | 0 (0.0%) |
| $10,000 to $12,499 | 11 (1.4%) | 17 (2.3%) |
| $12,500 to $14,999 | 48 (6.1%) | 20 (2.8%) |
| $15,000 to $17,499 | 12 (1.5%) | 31 (4.3%) |
| $17,500 to $19,999 | 16 (2.1%) | 6 (0.8%) |
| $20,000 to $22,499 | 0 (0.0%) | 49 (6.7%) |
| $22,500 to $24,999 | 6 (0.8%) | 39 (5.4%) |
| $25,000 to $29,999 | 17 (2.2%) | 89 (12.2%) |
| $30,000 to $34,999 | 49 (6.3%) | 39 (5.4%) |
| $35,000 to $39,999 | 54 (6.9%) | 63 (8.7%) |
| $40,000 to $44,999 | 21 (2.7%) | 13 (1.8%) |
| $45,000 to $49,999 | 39 (5.0%) | 17 (2.3%) |
| $50,000 to $54,999 | 75 (9.6%) | 44 (6.0%) |
| $55,000 to $64,999 | 86 (11.0%) | 67 (9.2%) |
| $65,000 to $74,999 | 91 (11.6%) | 70 (9.6%) |
| $75,000 to $99,999 | 71 (9.1%) | 17 (2.3%) |
| $100,000+ | 144 (18.4%) | 0 (0.0%) |
| Total | 782 (100.0%) | 727 (100.0%) |
Earnings by Sex by Educational Attainment in Upton County
Average earnings in Upton County are $57,014 for men and $26,885 for women, a difference of 52.8%. Men with an educational attainment of college or associate's degree enjoy the highest average annual earnings of $85,069, while those with high school diploma education earn the least with $51,813. Women with an educational attainment of bachelor's degree earn the most with the average annual earnings of $68,152, while those with high school diploma education have the smallest earnings of $24,500.
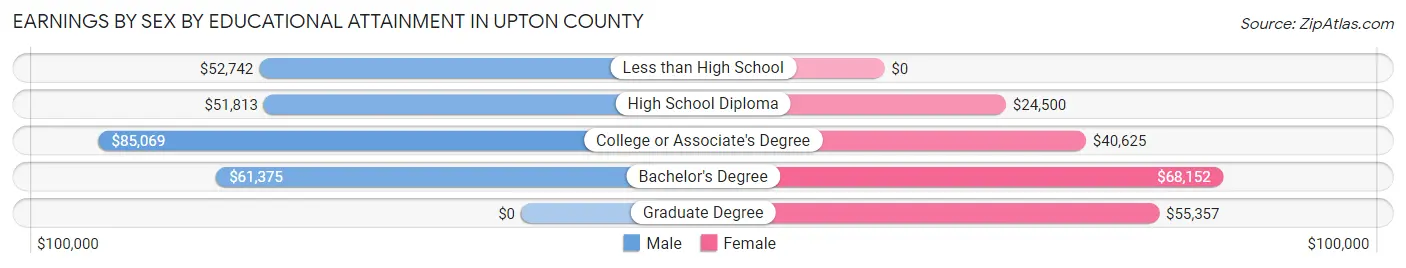
| Educational Attainment | Male Income | Female Income |
| Less than High School | $52,742 | $0 |
| High School Diploma | $51,813 | $24,500 |
| College or Associate's Degree | $85,069 | $40,625 |
| Bachelor's Degree | $61,375 | $68,152 |
| Graduate Degree | - | - |
| Total | $57,014 | $26,885 |
Family Income in Upton County
Family Income Brackets in Upton County
According to the Upton County family income data, there are 209 families falling into the $100,000 to $149,999 income range, which is the most common income bracket and makes up 22.6% of all families. Conversely, the $200,000+ income bracket is the least frequent group with only 21 families (2.3%) belonging to this category.
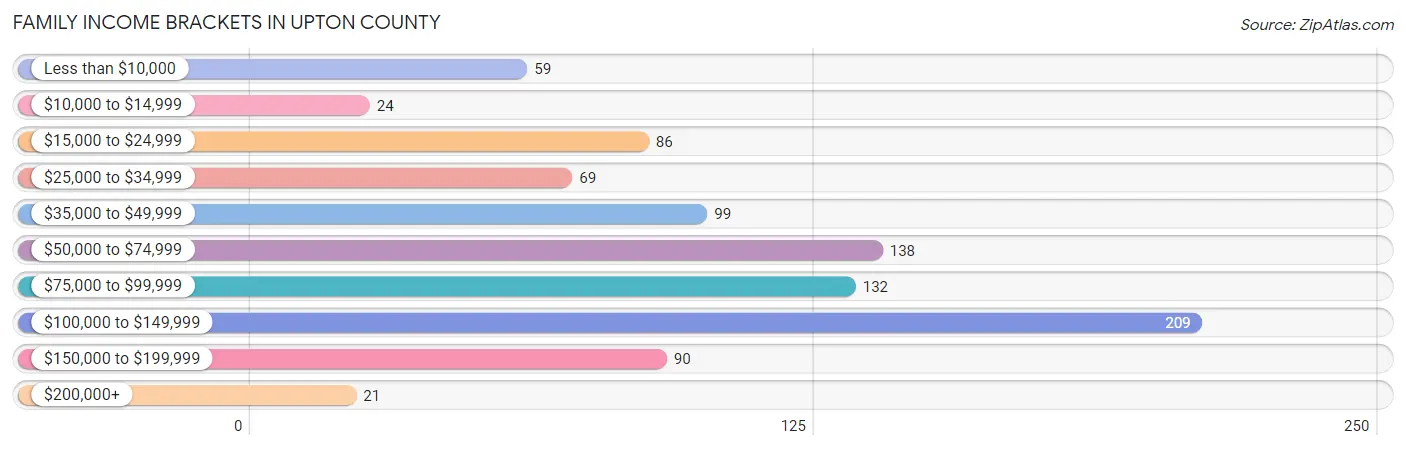
| Income Bracket | # Families | % Families |
| Less than $10,000 | 59 | 6.4% |
| $10,000 to $14,999 | 24 | 2.6% |
| $15,000 to $24,999 | 86 | 9.3% |
| $25,000 to $34,999 | 69 | 7.4% |
| $35,000 to $49,999 | 99 | 10.7% |
| $50,000 to $74,999 | 138 | 14.9% |
| $75,000 to $99,999 | 132 | 14.2% |
| $100,000 to $149,999 | 209 | 22.5% |
| $150,000 to $199,999 | 90 | 9.7% |
| $200,000+ | 21 | 2.3% |
Family Income by Famaliy Size in Upton County
4-person families (120 | 12.9%) account for the highest median family income in Upton County with $117,813 per family, while 2-person families (491 | 53.0%) have the highest median income of $34,214 per family member.
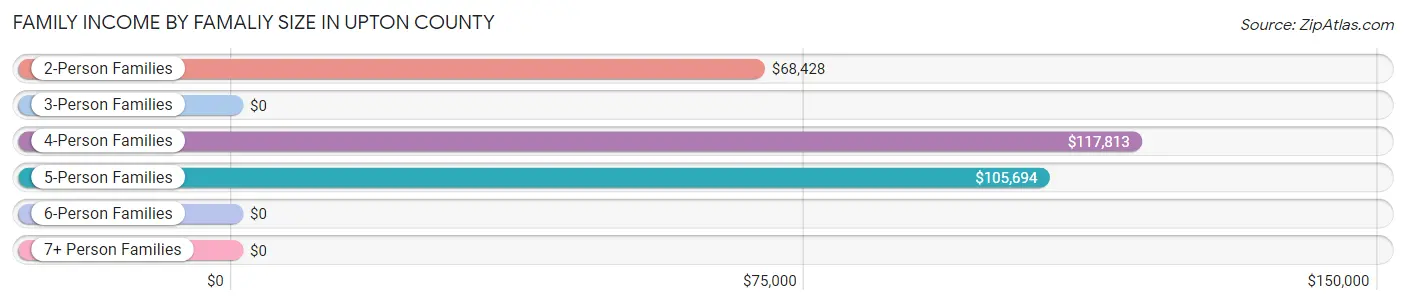
| Income Bracket | # Families | Median Income |
| 2-Person Families | 491 (53.0%) | $68,428 |
| 3-Person Families | 160 (17.3%) | $0 |
| 4-Person Families | 120 (12.9%) | $117,813 |
| 5-Person Families | 108 (11.7%) | $105,694 |
| 6-Person Families | 42 (4.5%) | $0 |
| 7+ Person Families | 6 (0.6%) | $0 |
| Total | 927 (100.0%) | $73,563 |
Family Income by Number of Earners in Upton County
The median family income in Upton County is $73,563, with families comprising 3+ earners (22) having the highest median family income of $132,000, while families with no earners (126) have the lowest median family income of $22,955, accounting for 2.4% and 13.6% of families, respectively.
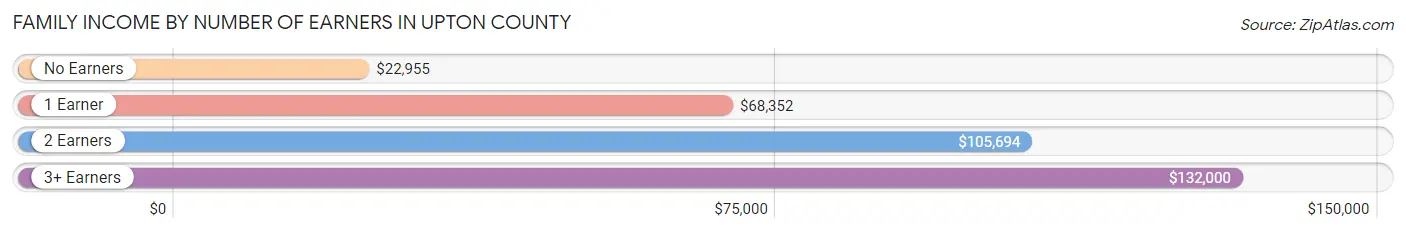
| Number of Earners | # Families | Median Income |
| No Earners | 126 (13.6%) | $22,955 |
| 1 Earner | 371 (40.0%) | $68,352 |
| 2 Earners | 408 (44.0%) | $105,694 |
| 3+ Earners | 22 (2.4%) | $132,000 |
| Total | 927 (100.0%) | $73,563 |
Household Income in Upton County
Household Income Brackets in Upton County
With 234 households falling in the category, the $50,000 to $74,999 income range is the most frequent in Upton County, accounting for 17.2% of all households. In contrast, only 44 households (3.2%) fall into the $200,000+ income bracket, making it the least populous group.
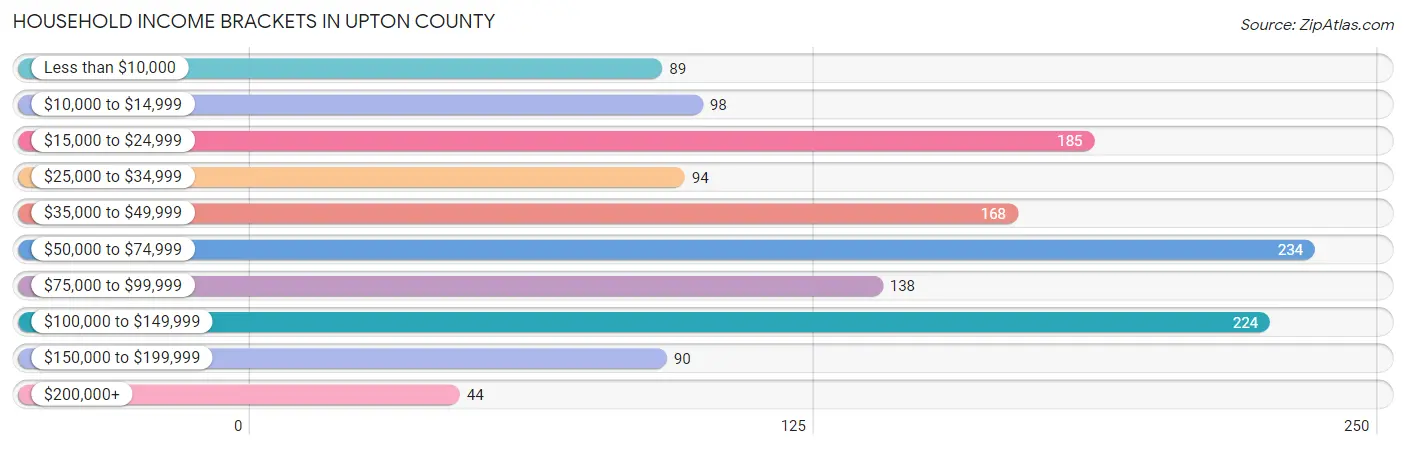
| Income Bracket | # Households | % Households |
| Less than $10,000 | 89 | 6.5% |
| $10,000 to $14,999 | 98 | 7.2% |
| $15,000 to $24,999 | 185 | 13.6% |
| $25,000 to $34,999 | 94 | 6.9% |
| $35,000 to $49,999 | 168 | 12.3% |
| $50,000 to $74,999 | 234 | 17.2% |
| $75,000 to $99,999 | 138 | 10.1% |
| $100,000 to $149,999 | 224 | 16.4% |
| $150,000 to $199,999 | 90 | 6.6% |
| $200,000+ | 44 | 3.2% |
Household Income by Householder Age in Upton County
The median household income in Upton County is $55,284, with the highest median household income of $69,716 found in the 45 to 64 years age bracket for the primary householder. A total of 509 households (37.3%) fall into this category. Meanwhile, the 15 to 24 years age bracket for the primary householder has the lowest median household income of $0, with 67 households (4.9%) in this group.
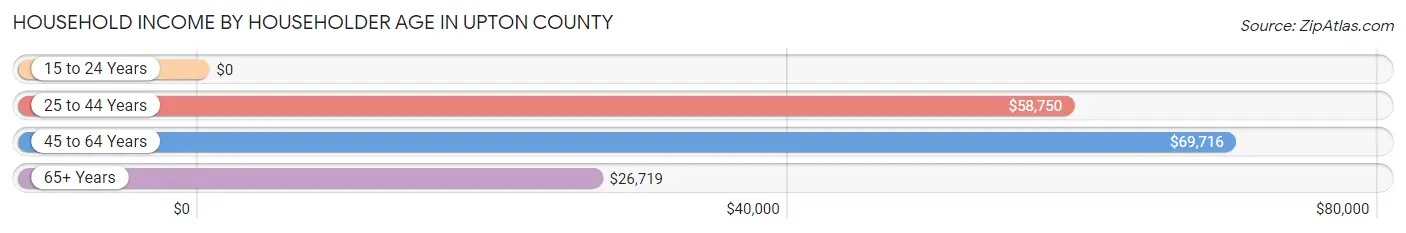
| Income Bracket | # Households | Median Income |
| 15 to 24 Years | 67 (4.9%) | $0 |
| 25 to 44 Years | 442 (32.4%) | $58,750 |
| 45 to 64 Years | 509 (37.3%) | $69,716 |
| 65+ Years | 345 (25.3%) | $26,719 |
| Total | 1,363 (100.0%) | $55,284 |
Poverty in Upton County
Income Below Poverty by Sex and Age in Upton County
With 19.9% poverty level for males and 20.7% for females among the residents of Upton County, under 5 year old males and under 5 year old females are the most vulnerable to poverty, with 17 males (58.6%) and 45 females (60.0%) in their respective age groups living below the poverty level.
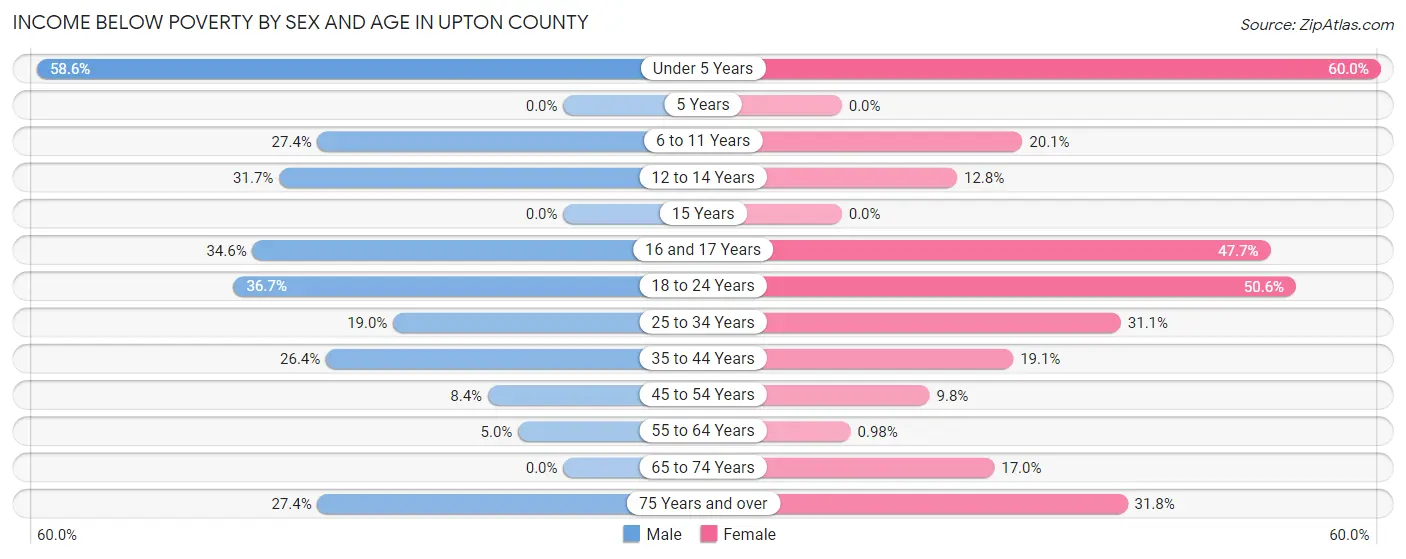
| Age Bracket | Male | Female |
| Under 5 Years | 17 (58.6%) | 45 (60.0%) |
| 5 Years | 0 (0.0%) | 0 (0.0%) |
| 6 to 11 Years | 58 (27.4%) | 36 (20.1%) |
| 12 to 14 Years | 44 (31.7%) | 19 (12.8%) |
| 15 Years | 0 (0.0%) | 0 (0.0%) |
| 16 and 17 Years | 9 (34.6%) | 21 (47.7%) |
| 18 to 24 Years | 36 (36.7%) | 44 (50.6%) |
| 25 to 34 Years | 36 (19.0%) | 46 (31.1%) |
| 35 to 44 Years | 65 (26.4%) | 42 (19.1%) |
| 45 to 54 Years | 20 (8.4%) | 18 (9.8%) |
| 55 to 64 Years | 10 (5.0%) | 2 (1.0%) |
| 65 to 74 Years | 0 (0.0%) | 36 (17.0%) |
| 75 Years and over | 23 (27.4%) | 28 (31.8%) |
| Total | 318 (19.9%) | 337 (20.7%) |
Income Above Poverty by Sex and Age in Upton County
According to the poverty statistics in Upton County, males aged 15 years and females aged 5 years are the age groups that are most secure financially, with 100.0% of males and 100.0% of females in these age groups living above the poverty line.
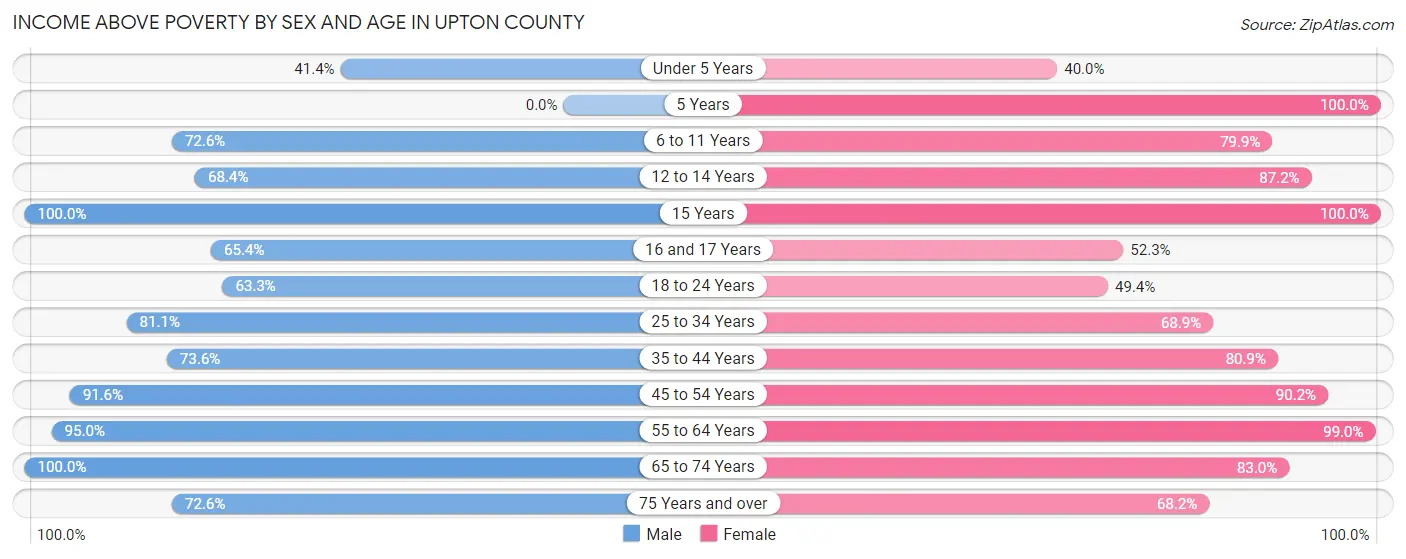
| Age Bracket | Male | Female |
| Under 5 Years | 12 (41.4%) | 30 (40.0%) |
| 5 Years | 0 (0.0%) | 20 (100.0%) |
| 6 to 11 Years | 154 (72.6%) | 143 (79.9%) |
| 12 to 14 Years | 95 (68.3%) | 129 (87.2%) |
| 15 Years | 5 (100.0%) | 15 (100.0%) |
| 16 and 17 Years | 17 (65.4%) | 23 (52.3%) |
| 18 to 24 Years | 62 (63.3%) | 43 (49.4%) |
| 25 to 34 Years | 154 (81.0%) | 102 (68.9%) |
| 35 to 44 Years | 181 (73.6%) | 178 (80.9%) |
| 45 to 54 Years | 218 (91.6%) | 166 (90.2%) |
| 55 to 64 Years | 189 (95.0%) | 203 (99.0%) |
| 65 to 74 Years | 130 (100.0%) | 176 (83.0%) |
| 75 Years and over | 61 (72.6%) | 60 (68.2%) |
| Total | 1,278 (80.1%) | 1,288 (79.3%) |
Income Below Poverty Among Married-Couple Families in Upton County
The poverty statistics for married-couple families in Upton County show that 9.2% or 64 of the total 697 families live below the poverty line. Families with 3 or 4 children have the highest poverty rate of 28.2%, comprising of 20 families. On the other hand, families with 5 or more children have the lowest poverty rate of 0.0%, which includes 0 families.
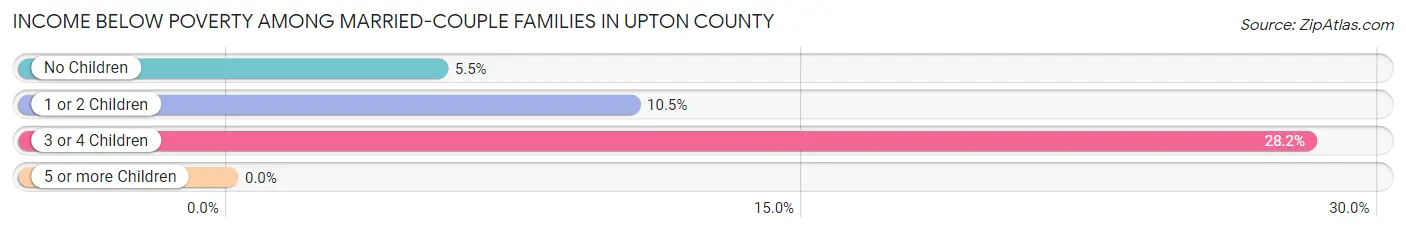
| Children | Above Poverty | Below Poverty |
| No Children | 397 (94.5%) | 23 (5.5%) |
| 1 or 2 Children | 179 (89.5%) | 21 (10.5%) |
| 3 or 4 Children | 51 (71.8%) | 20 (28.2%) |
| 5 or more Children | 6 (100.0%) | 0 (0.0%) |
| Total | 633 (90.8%) | 64 (9.2%) |
Income Below Poverty Among Single-Parent Households in Upton County
According to the poverty data in Upton County, 22.9% or 16 single-father households and 42.5% or 68 single-mother households are living below the poverty line. Among single-father households, those with 1 or 2 children have the highest poverty rate, with 16 households (36.4%) experiencing poverty. Likewise, among single-mother households, those with 3 or 4 children have the highest poverty rate, with 24 households (100.0%) falling below the poverty line.
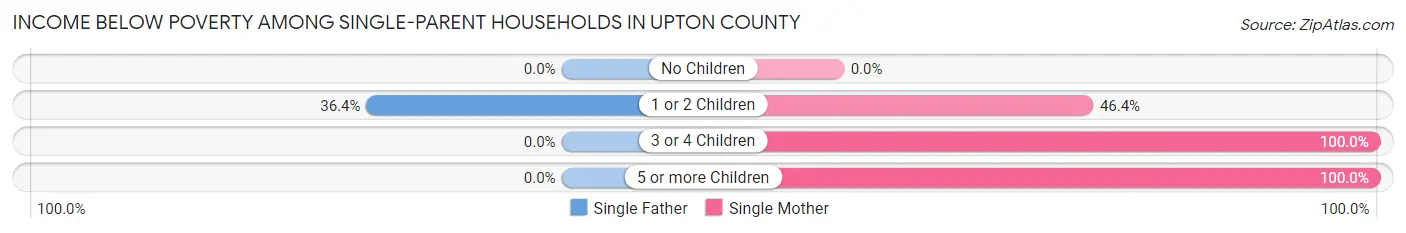
| Children | Single Father | Single Mother |
| No Children | 0 (0.0%) | 0 (0.0%) |
| 1 or 2 Children | 16 (36.4%) | 39 (46.4%) |
| 3 or 4 Children | 0 (0.0%) | 24 (100.0%) |
| 5 or more Children | 0 (0.0%) | 5 (100.0%) |
| Total | 16 (22.9%) | 68 (42.5%) |
Income Below Poverty Among Married-Couple vs Single-Parent Households in Upton County
The poverty data for Upton County shows that 64 of the married-couple family households (9.2%) and 84 of the single-parent households (36.5%) are living below the poverty level. Within the married-couple family households, those with 3 or 4 children have the highest poverty rate, with 20 households (28.2%) falling below the poverty line. Among the single-parent households, those with 3 or 4 children have the highest poverty rate, with 24 household (100.0%) living below poverty.
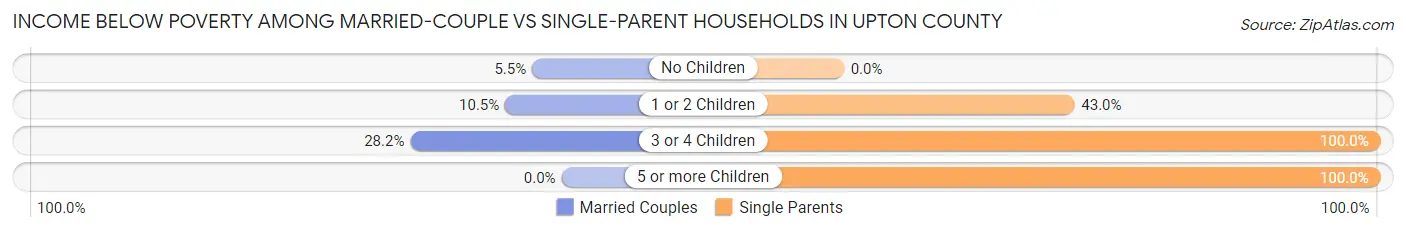
| Children | Married-Couple Families | Single-Parent Households |
| No Children | 23 (5.5%) | 0 (0.0%) |
| 1 or 2 Children | 21 (10.5%) | 55 (43.0%) |
| 3 or 4 Children | 20 (28.2%) | 24 (100.0%) |
| 5 or more Children | 0 (0.0%) | 5 (100.0%) |
| Total | 64 (9.2%) | 84 (36.5%) |
Race in Upton County
The most populous races in Upton County are Hispanic or Latino (1,849 | 56.3%), Some other Race (1,552 | 47.3%), and White / Caucasian (1,427 | 43.4%).
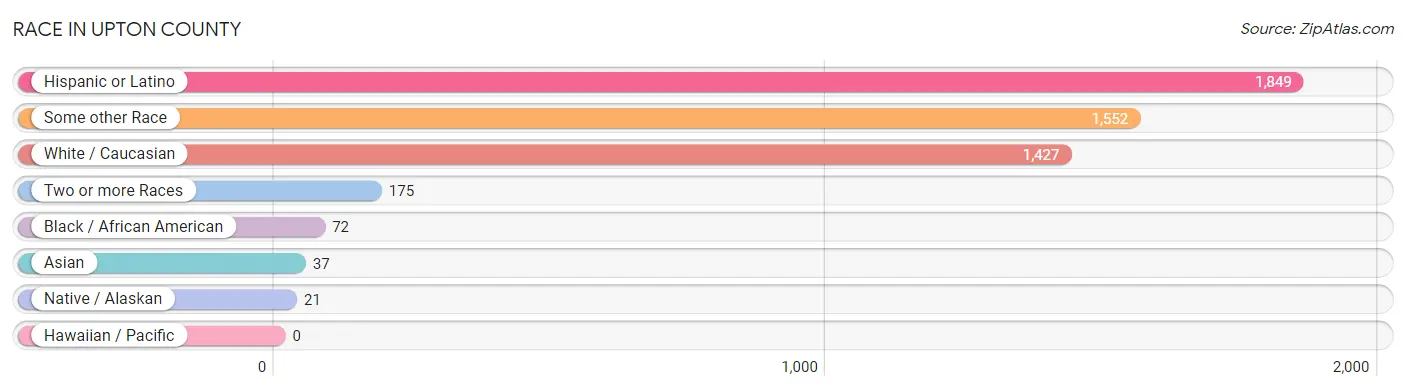
| Race | # Population | % Population |
| Asian | 37 | 1.1% |
| Black / African American | 72 | 2.2% |
| Hawaiian / Pacific | 0 | 0.0% |
| Hispanic or Latino | 1,849 | 56.3% |
| Native / Alaskan | 21 | 0.6% |
| White / Caucasian | 1,427 | 43.4% |
| Two or more Races | 175 | 5.3% |
| Some other Race | 1,552 | 47.3% |
| Total | 3,284 | 100.0% |
Ancestry in Upton County
The most populous ancestries reported in Upton County are Mexican (1,754 | 53.4%), English (219 | 6.7%), Irish (100 | 3.0%), Puerto Rican (93 | 2.8%), and German (63 | 1.9%), together accounting for 67.9% of all Upton County residents.
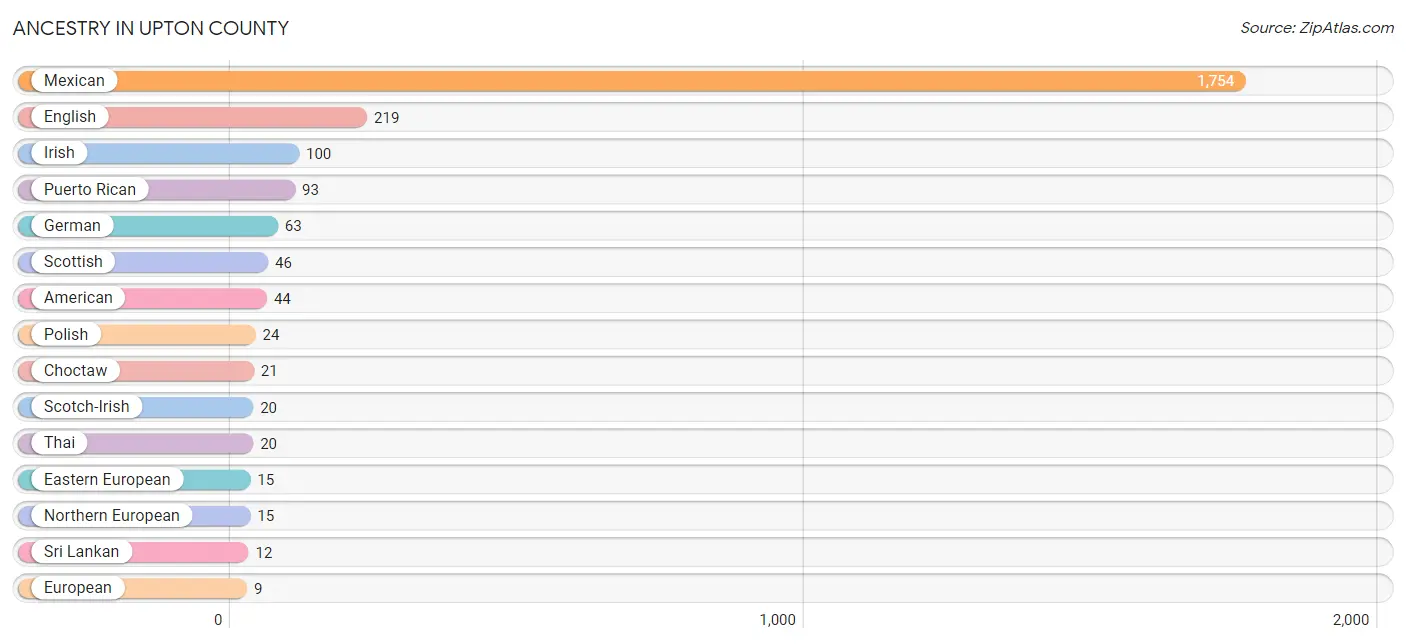
| Ancestry | # Population | % Population |
| American | 44 | 1.3% |
| Cherokee | 2 | 0.1% |
| Choctaw | 21 | 0.6% |
| Czech | 4 | 0.1% |
| Dutch | 8 | 0.2% |
| Dutch West Indian | 2 | 0.1% |
| Eastern European | 15 | 0.5% |
| English | 219 | 6.7% |
| European | 9 | 0.3% |
| German | 63 | 1.9% |
| Irish | 100 | 3.0% |
| Laotian | 5 | 0.2% |
| Mexican | 1,754 | 53.4% |
| Northern European | 15 | 0.5% |
| Norwegian | 7 | 0.2% |
| Polish | 24 | 0.7% |
| Puerto Rican | 93 | 2.8% |
| Scandinavian | 7 | 0.2% |
| Scotch-Irish | 20 | 0.6% |
| Scottish | 46 | 1.4% |
| Sri Lankan | 12 | 0.4% |
| Thai | 20 | 0.6% | View All 22 Rows |
Immigrants in Upton County
The most numerous immigrant groups reported in Upton County came from Central America (263 | 8.0%), Latin America (263 | 8.0%), Mexico (263 | 8.0%), Asia (17 | 0.5%), and South Eastern Asia (17 | 0.5%), together accounting for 25.1% of all Upton County residents.
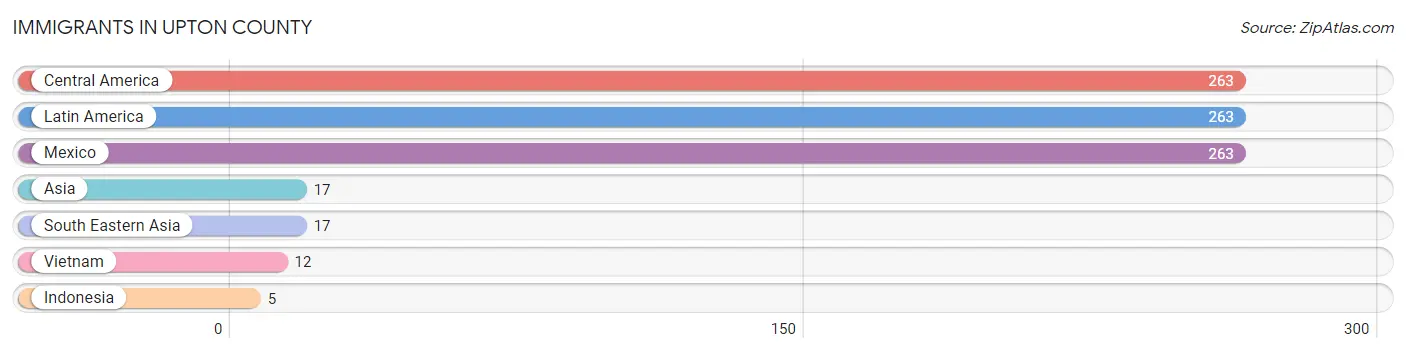
| Immigration Origin | # Population | % Population |
| Asia | 17 | 0.5% |
| Central America | 263 | 8.0% |
| Indonesia | 5 | 0.2% |
| Latin America | 263 | 8.0% |
| Mexico | 263 | 8.0% |
| South Eastern Asia | 17 | 0.5% |
| Vietnam | 12 | 0.4% | View All 7 Rows |
Sex and Age in Upton County
Sex and Age in Upton County
The most populous age groups in Upton County are 10 to 14 Years (176 | 10.7%) for men and 10 to 14 Years (255 | 15.5%) for women.
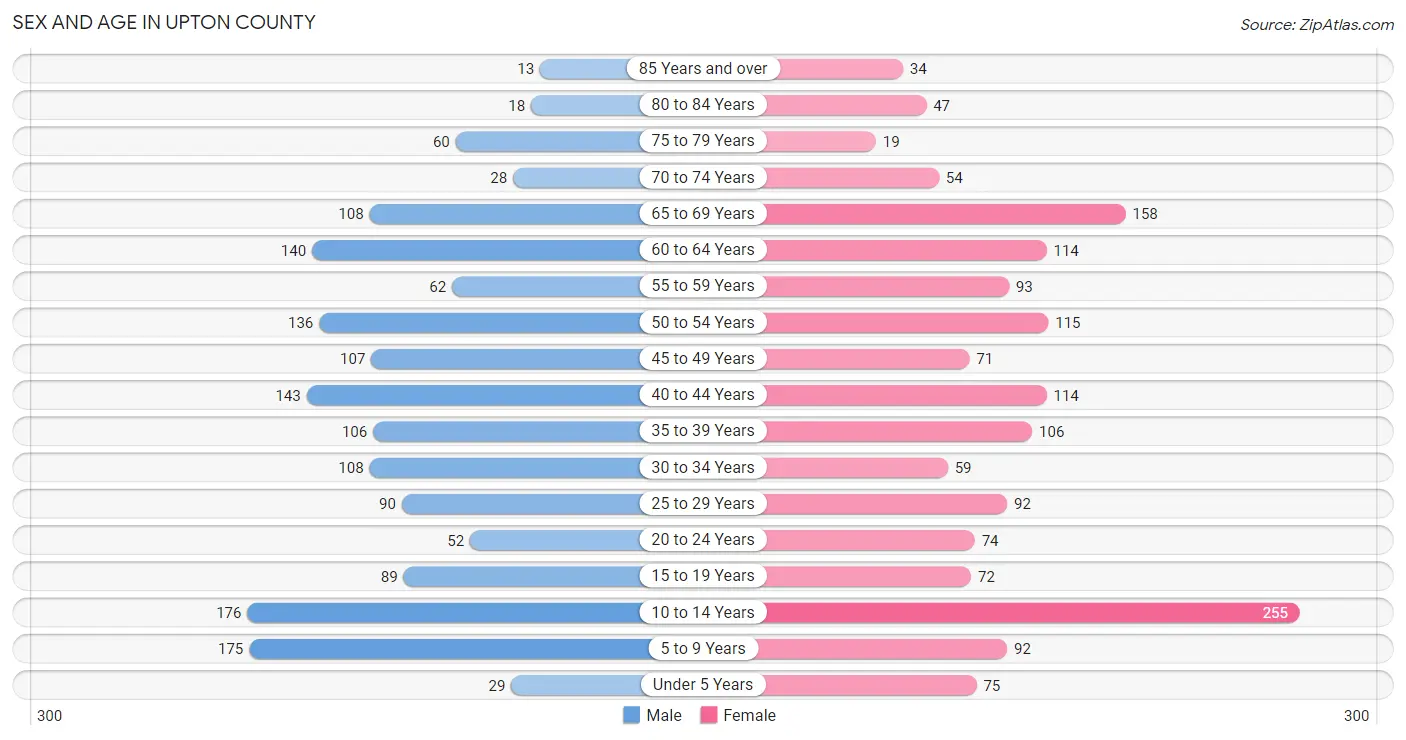
| Age Bracket | Male | Female |
| Under 5 Years | 29 (1.8%) | 75 (4.6%) |
| 5 to 9 Years | 175 (10.7%) | 92 (5.6%) |
| 10 to 14 Years | 176 (10.7%) | 255 (15.5%) |
| 15 to 19 Years | 89 (5.4%) | 72 (4.4%) |
| 20 to 24 Years | 52 (3.2%) | 74 (4.5%) |
| 25 to 29 Years | 90 (5.5%) | 92 (5.6%) |
| 30 to 34 Years | 108 (6.6%) | 59 (3.6%) |
| 35 to 39 Years | 106 (6.5%) | 106 (6.5%) |
| 40 to 44 Years | 143 (8.7%) | 114 (6.9%) |
| 45 to 49 Years | 107 (6.5%) | 71 (4.3%) |
| 50 to 54 Years | 136 (8.3%) | 115 (7.0%) |
| 55 to 59 Years | 62 (3.8%) | 93 (5.7%) |
| 60 to 64 Years | 140 (8.5%) | 114 (6.9%) |
| 65 to 69 Years | 108 (6.6%) | 158 (9.6%) |
| 70 to 74 Years | 28 (1.7%) | 54 (3.3%) |
| 75 to 79 Years | 60 (3.7%) | 19 (1.2%) |
| 80 to 84 Years | 18 (1.1%) | 47 (2.9%) |
| 85 Years and over | 13 (0.8%) | 34 (2.1%) |
| Total | 1,640 (100.0%) | 1,644 (100.0%) |
Families and Households in Upton County
Median Family Size in Upton County
The median family size in Upton County is 2.89 persons per family, with married-couple families (697 | 75.2%) accounting for the largest median family size of 2.93 persons per family. On the other hand, single male/father families (70 | 7.5%) represent the smallest median family size with 2.43 persons per family.
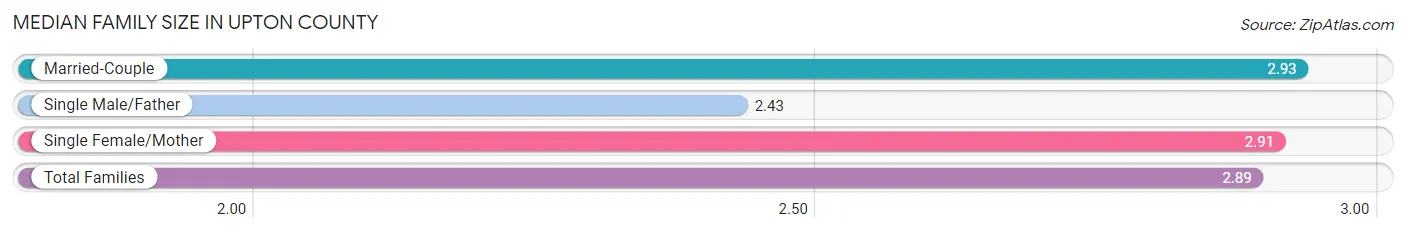
| Family Type | # Families | Family Size |
| Married-Couple | 697 (75.2%) | 2.93 |
| Single Male/Father | 70 (7.5%) | 2.43 |
| Single Female/Mother | 160 (17.3%) | 2.91 |
| Total Families | 927 (100.0%) | 2.89 |
Median Household Size in Upton County
The median household size in Upton County is 2.36 persons per household, with single female/mother households (160 | 11.7%) accounting for the largest median household size of 3.15 persons per household. non-family households (436 | 32.0%) represent the smallest median household size with 1.14 persons per household.
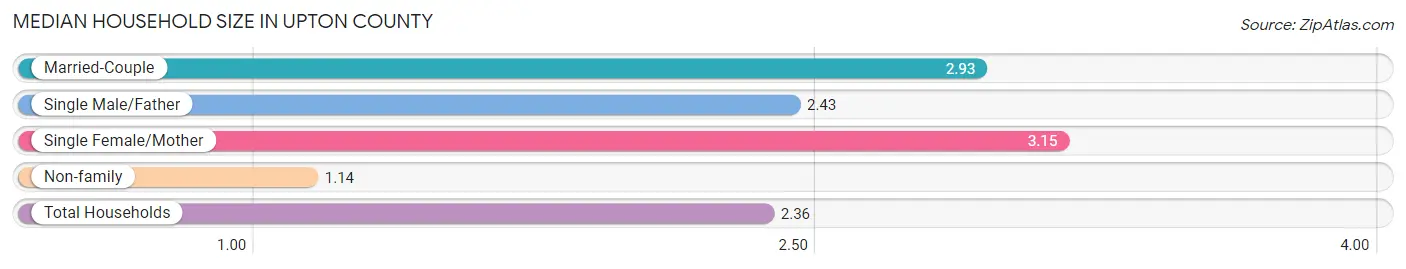
| Household Type | # Households | Household Size |
| Married-Couple | 697 (51.1%) | 2.93 |
| Single Male/Father | 70 (5.1%) | 2.43 |
| Single Female/Mother | 160 (11.7%) | 3.15 |
| Non-family | 436 (32.0%) | 1.14 |
| Total Households | 1,363 (100.0%) | 2.36 |
Household Size by Marriage Status in Upton County
Out of a total of 1,363 households in Upton County, 927 (68.0%) are family households, while 436 (32.0%) are nonfamily households. The most numerous type of family households are 2-person households, comprising 491, and the most common type of nonfamily households are 1-person households, comprising 366.
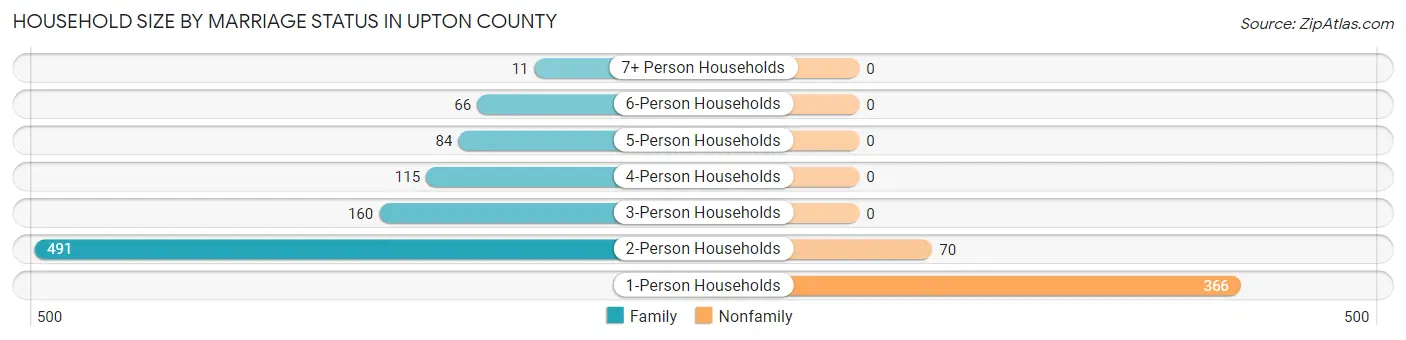
| Household Size | Family Households | Nonfamily Households |
| 1-Person Households | - | 366 (26.9%) |
| 2-Person Households | 491 (36.0%) | 70 (5.1%) |
| 3-Person Households | 160 (11.7%) | 0 (0.0%) |
| 4-Person Households | 115 (8.4%) | 0 (0.0%) |
| 5-Person Households | 84 (6.2%) | 0 (0.0%) |
| 6-Person Households | 66 (4.8%) | 0 (0.0%) |
| 7+ Person Households | 11 (0.8%) | 0 (0.0%) |
| Total | 927 (68.0%) | 436 (32.0%) |
Female Fertility in Upton County
Fertility by Age in Upton County
| Age Bracket | Women with Births | Births / 1,000 Women |
| 15 to 19 years | 0 (0.0%) | 0.0 |
| 20 to 34 years | 0 (0.0%) | 0.0 |
| 35 to 50 years | 0 (0.0%) | 0.0 |
| Total | 0 (0.0%) | 0.0 |
Fertility by Age by Marriage Status in Upton County
| Age Bracket | Married | Unmarried |
| 15 to 19 years | 0 (0.0%) | 0 (0.0%) |
| 20 to 34 years | 0 (0.0%) | 0 (0.0%) |
| 35 to 50 years | 0 (0.0%) | 0 (0.0%) |
| Total | 0 (0.0%) | 0 (0.0%) |
Fertility by Education in Upton County
| Educational Attainment | Women with Births | Births / 1,000 Women |
| Less than High School | 0 (0.0%) | 0.0 |
| High School Diploma | 0 (0.0%) | 0.0 |
| College or Associate's Degree | 0 (0.0%) | 0.0 |
| Bachelor's Degree | 0 (0.0%) | 0.0 |
| Graduate Degree | 0 (0.0%) | 0.0 |
| Total | 0 (0.0%) | 0.0 |
Fertility by Education by Marriage Status in Upton County
| Educational Attainment | Married | Unmarried |
| Less than High School | 0 (0.0%) | 0 (0.0%) |
| High School Diploma | 0 (0.0%) | 0 (0.0%) |
| College or Associate's Degree | 0 (0.0%) | 0 (0.0%) |
| Bachelor's Degree | 0 (0.0%) | 0 (0.0%) |
| Graduate Degree | 0 (0.0%) | 0 (0.0%) |
| Total | 0 (0.0%) | 0 (0.0%) |
Employment Characteristics in Upton County
Employment by Class of Employer in Upton County
Among the 1,320 employed individuals in Upton County, private company employees (826 | 62.6%), local government employees (211 | 16.0%), and state government employees (106 | 8.0%) make up the most common classes of employment.
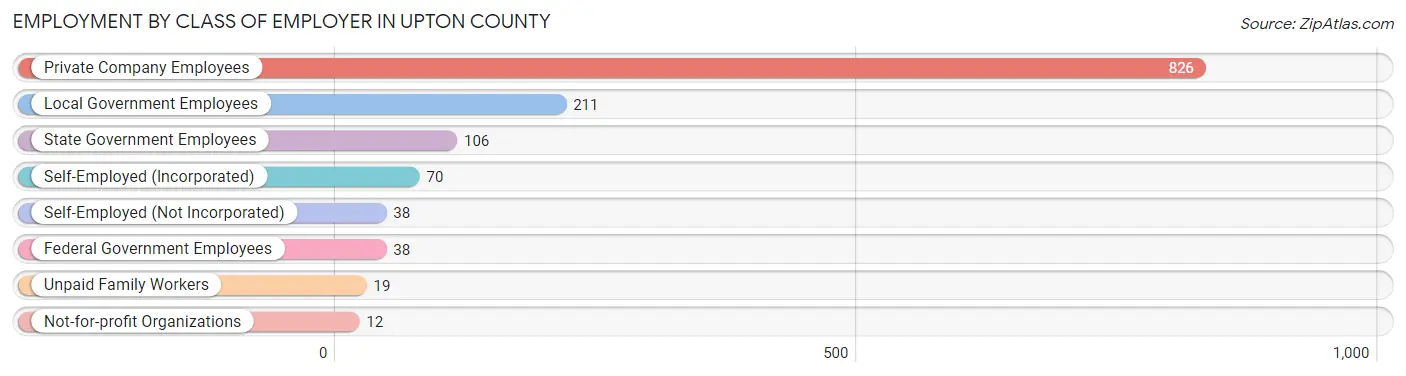
| Employer Class | # Employees | % Employees |
| Private Company Employees | 826 | 62.6% |
| Self-Employed (Incorporated) | 70 | 5.3% |
| Self-Employed (Not Incorporated) | 38 | 2.9% |
| Not-for-profit Organizations | 12 | 0.9% |
| Local Government Employees | 211 | 16.0% |
| State Government Employees | 106 | 8.0% |
| Federal Government Employees | 38 | 2.9% |
| Unpaid Family Workers | 19 | 1.4% |
| Total | 1,320 | 100.0% |
Employment Status by Age in Upton County
According to the labor force statistics for Upton County, out of the total population over 16 years of age (2,462), 58.0% or 1,428 individuals are in the labor force, with 4.7% or 67 of them unemployed. The age group with the highest labor force participation rate is 55 to 59 years, with 87.7% or 136 individuals in the labor force. Within the labor force, the 20 to 24 years age range has the highest percentage of unemployed individuals, with 47.6% or 50 of them being unemployed.
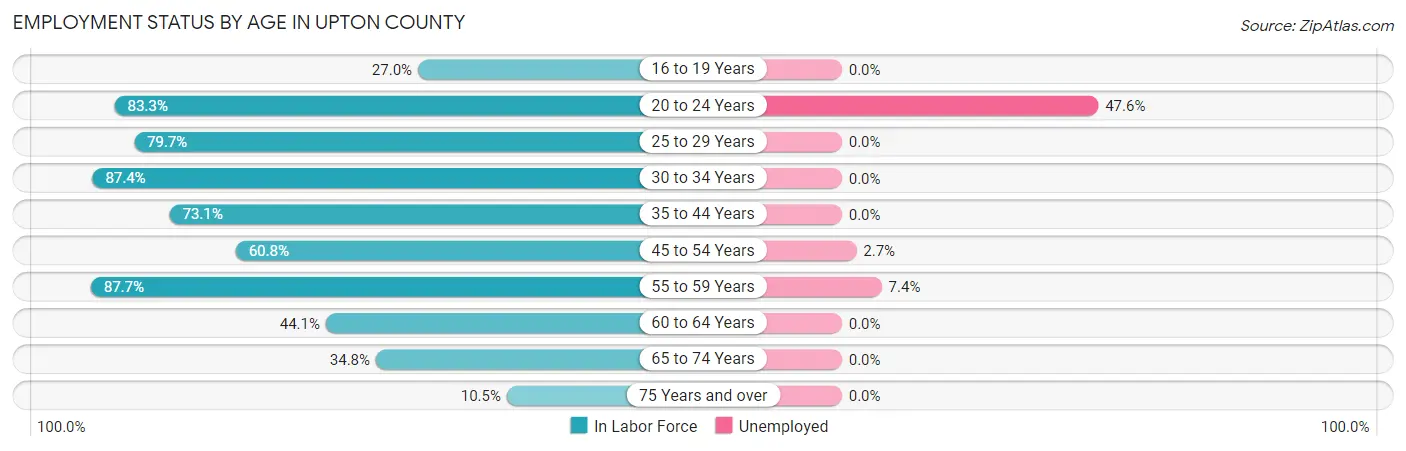
| Age Bracket | In Labor Force | Unemployed |
| 16 to 19 Years | 38 (27.0%) | 0 (0.0%) |
| 20 to 24 Years | 105 (83.3%) | 50 (47.6%) |
| 25 to 29 Years | 145 (79.7%) | 0 (0.0%) |
| 30 to 34 Years | 146 (87.4%) | 0 (0.0%) |
| 35 to 44 Years | 343 (73.1%) | 0 (0.0%) |
| 45 to 54 Years | 261 (60.8%) | 7 (2.7%) |
| 55 to 59 Years | 136 (87.7%) | 10 (7.4%) |
| 60 to 64 Years | 112 (44.1%) | 0 (0.0%) |
| 65 to 74 Years | 121 (34.8%) | 0 (0.0%) |
| 75 Years and over | 20 (10.5%) | 0 (0.0%) |
| Total | 1,428 (58.0%) | 67 (4.7%) |
Employment Status by Educational Attainment in Upton County
According to labor force statistics for Upton County, 69.0% of individuals (1,143) out of the total population between 25 and 64 years of age (1,656) are in the labor force, with 1.5% or 17 of them being unemployed. The group with the highest labor force participation rate are those with the educational attainment of bachelor's degree or higher, with 92.4% or 134 individuals in the labor force. Within the labor force, individuals with less than high school education have the highest percentage of unemployment, with 9.6% or 10 of them being unemployed.
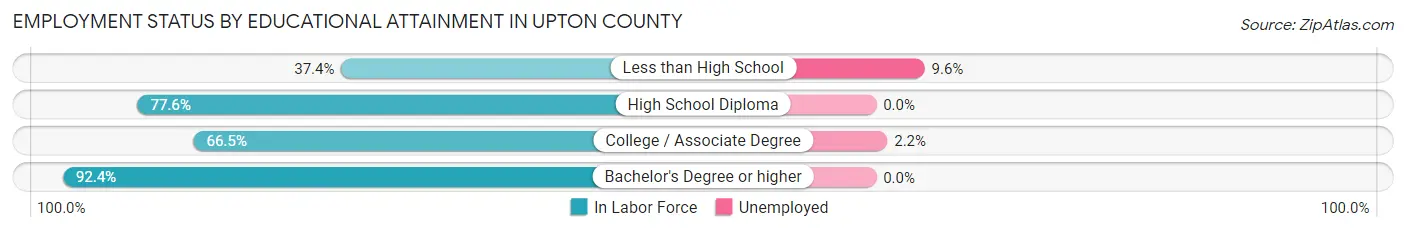
| Educational Attainment | In Labor Force | Unemployed |
| Less than High School | 104 (37.4%) | 27 (9.6%) |
| High School Diploma | 593 (77.6%) | 0 (0.0%) |
| College / Associate Degree | 312 (66.5%) | 10 (2.2%) |
| Bachelor's Degree or higher | 134 (92.4%) | 0 (0.0%) |
| Total | 1,143 (69.0%) | 25 (1.5%) |
Employment Occupations by Sex in Upton County
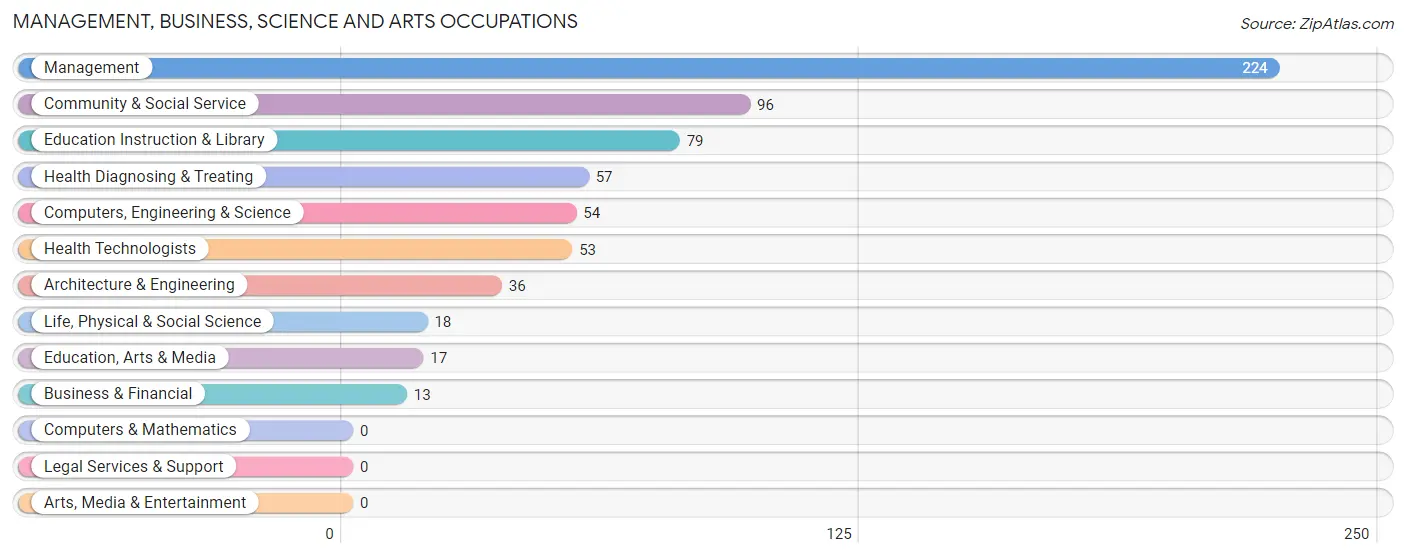
Management, Business, Science and Arts Occupations
The most common Management, Business, Science and Arts occupations in Upton County are Management (224 | 16.5%), Community & Social Service (96 | 7.1%), Education Instruction & Library (79 | 5.8%), Health Diagnosing & Treating (57 | 4.2%), and Computers, Engineering & Science (54 | 4.0%).
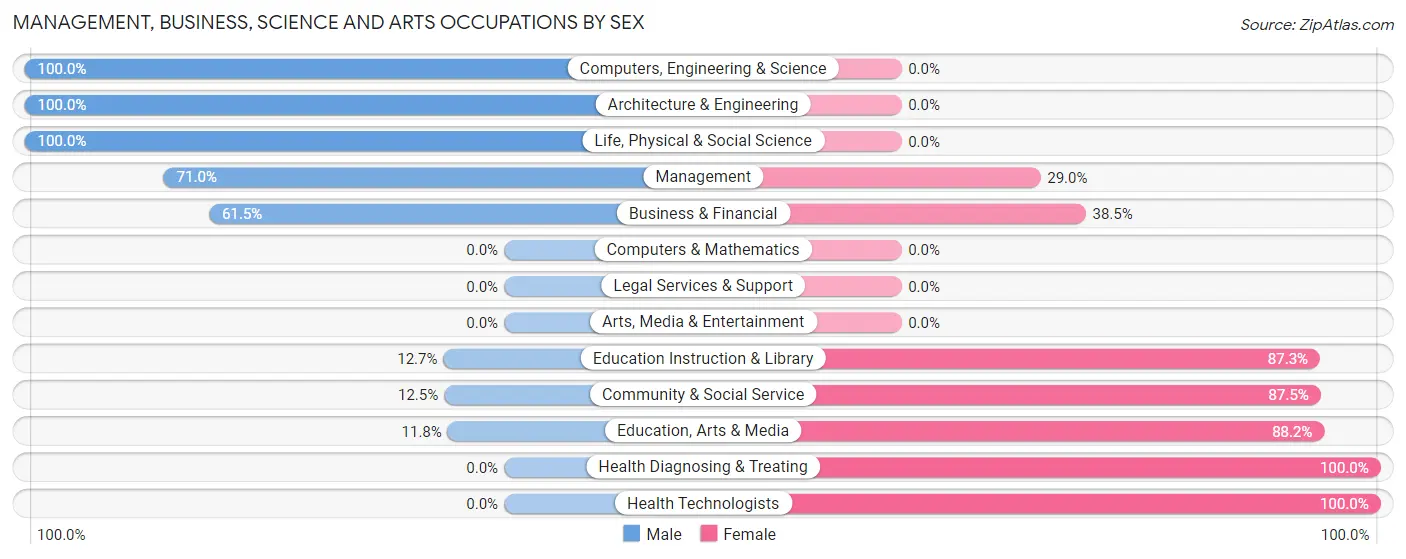
Management, Business, Science and Arts Occupations by Sex
Within the Management, Business, Science and Arts occupations in Upton County, the most male-oriented occupations are Computers, Engineering & Science (100.0%), Architecture & Engineering (100.0%), and Life, Physical & Social Science (100.0%), while the most female-oriented occupations are Health Diagnosing & Treating (100.0%), Health Technologists (100.0%), and Education, Arts & Media (88.2%).
| Occupation | Male | Female |
| Management | 159 (71.0%) | 65 (29.0%) |
| Business & Financial | 8 (61.5%) | 5 (38.5%) |
| Computers, Engineering & Science | 54 (100.0%) | 0 (0.0%) |
| Computers & Mathematics | 0 (0.0%) | 0 (0.0%) |
| Architecture & Engineering | 36 (100.0%) | 0 (0.0%) |
| Life, Physical & Social Science | 18 (100.0%) | 0 (0.0%) |
| Community & Social Service | 12 (12.5%) | 84 (87.5%) |
| Education, Arts & Media | 2 (11.8%) | 15 (88.2%) |
| Legal Services & Support | 0 (0.0%) | 0 (0.0%) |
| Education Instruction & Library | 10 (12.7%) | 69 (87.3%) |
| Arts, Media & Entertainment | 0 (0.0%) | 0 (0.0%) |
| Health Diagnosing & Treating | 0 (0.0%) | 57 (100.0%) |
| Health Technologists | 0 (0.0%) | 53 (100.0%) |
| Total (Category) | 233 (52.5%) | 211 (47.5%) |
| Total (Overall) | 744 (54.7%) | 616 (45.3%) |
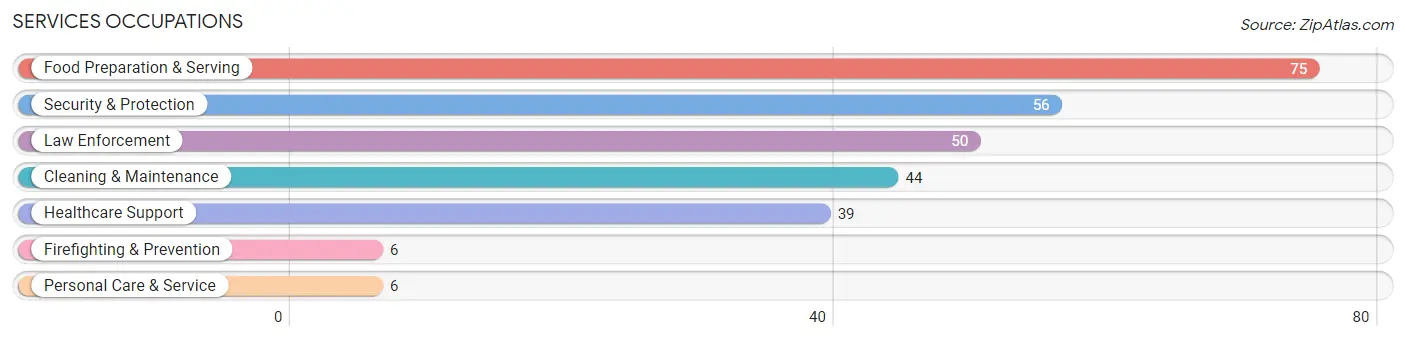
Services Occupations
The most common Services occupations in Upton County are Food Preparation & Serving (75 | 5.5%), Security & Protection (56 | 4.1%), Law Enforcement (50 | 3.7%), Cleaning & Maintenance (44 | 3.2%), and Healthcare Support (39 | 2.9%).
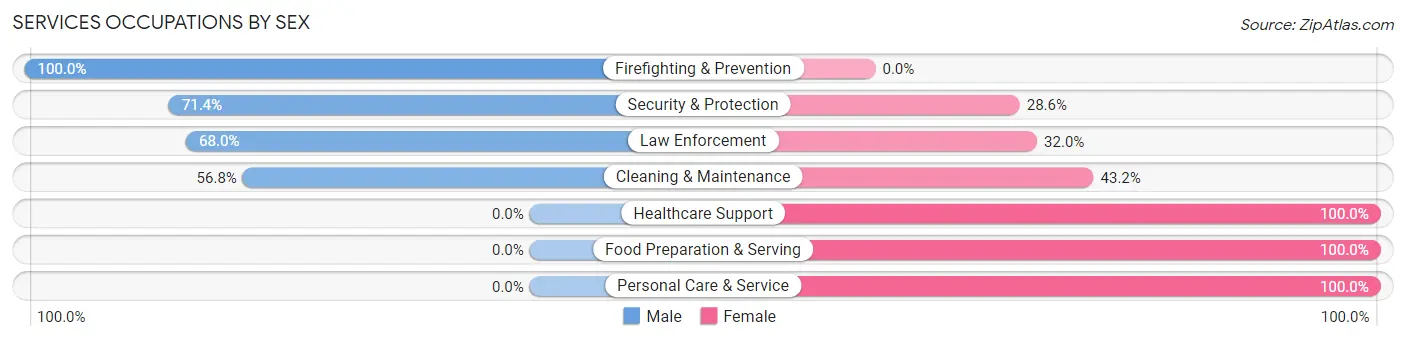
Services Occupations by Sex
Within the Services occupations in Upton County, the most male-oriented occupations are Firefighting & Prevention (100.0%), Security & Protection (71.4%), and Law Enforcement (68.0%), while the most female-oriented occupations are Healthcare Support (100.0%), Food Preparation & Serving (100.0%), and Personal Care & Service (100.0%).
| Occupation | Male | Female |
| Healthcare Support | 0 (0.0%) | 39 (100.0%) |
| Security & Protection | 40 (71.4%) | 16 (28.6%) |
| Firefighting & Prevention | 6 (100.0%) | 0 (0.0%) |
| Law Enforcement | 34 (68.0%) | 16 (32.0%) |
| Food Preparation & Serving | 0 (0.0%) | 75 (100.0%) |
| Cleaning & Maintenance | 25 (56.8%) | 19 (43.2%) |
| Personal Care & Service | 0 (0.0%) | 6 (100.0%) |
| Total (Category) | 65 (29.5%) | 155 (70.5%) |
| Total (Overall) | 744 (54.7%) | 616 (45.3%) |
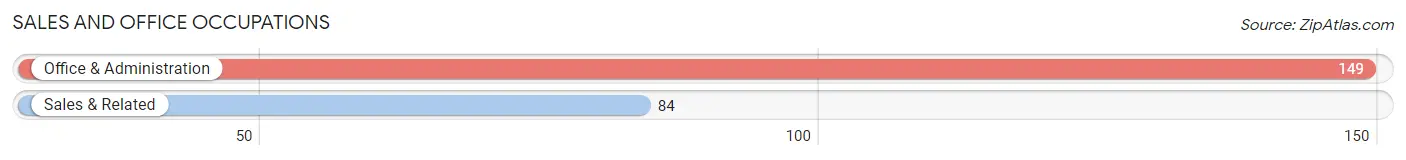
Sales and Office Occupations
The most common Sales and Office occupations in Upton County are Office & Administration (149 | 11.0%), and Sales & Related (84 | 6.2%).
Sales and Office Occupations by Sex
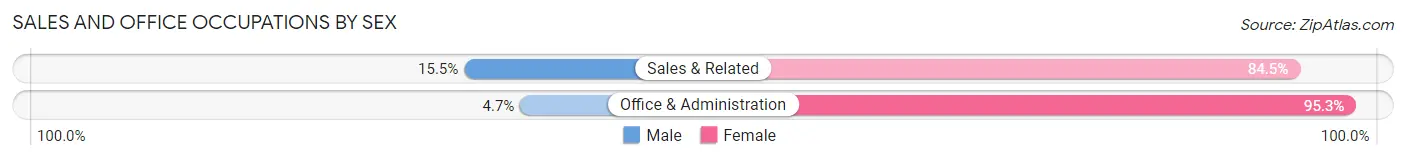
| Occupation | Male | Female |
| Sales & Related | 13 (15.5%) | 71 (84.5%) |
| Office & Administration | 7 (4.7%) | 142 (95.3%) |
| Total (Category) | 20 (8.6%) | 213 (91.4%) |
| Total (Overall) | 744 (54.7%) | 616 (45.3%) |
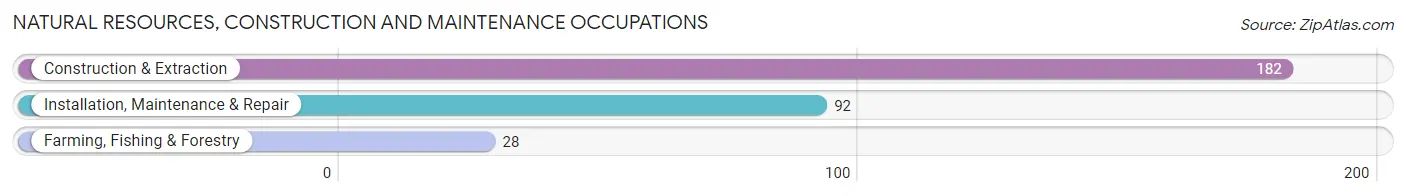
Natural Resources, Construction and Maintenance Occupations
The most common Natural Resources, Construction and Maintenance occupations in Upton County are Construction & Extraction (182 | 13.4%), Installation, Maintenance & Repair (92 | 6.8%), and Farming, Fishing & Forestry (28 | 2.1%).
Natural Resources, Construction and Maintenance Occupations by Sex
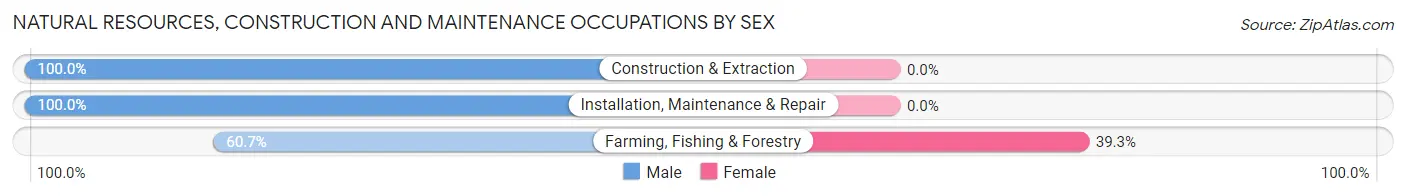
| Occupation | Male | Female |
| Farming, Fishing & Forestry | 17 (60.7%) | 11 (39.3%) |
| Construction & Extraction | 182 (100.0%) | 0 (0.0%) |
| Installation, Maintenance & Repair | 92 (100.0%) | 0 (0.0%) |
| Total (Category) | 291 (96.4%) | 11 (3.6%) |
| Total (Overall) | 744 (54.7%) | 616 (45.3%) |
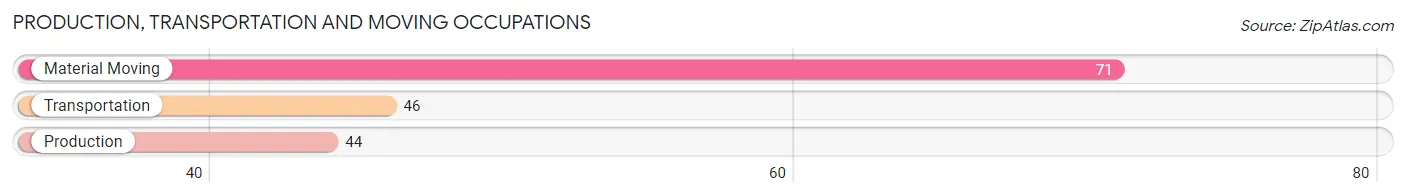
Production, Transportation and Moving Occupations
The most common Production, Transportation and Moving occupations in Upton County are Material Moving (71 | 5.2%), Transportation (46 | 3.4%), and Production (44 | 3.2%).
Production, Transportation and Moving Occupations by Sex
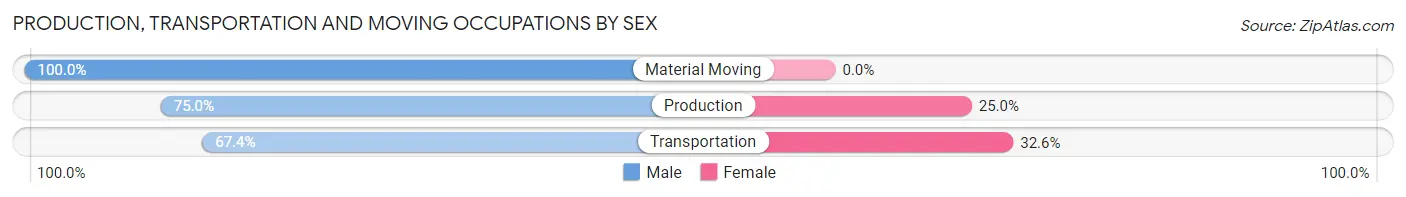
| Occupation | Male | Female |
| Production | 33 (75.0%) | 11 (25.0%) |
| Transportation | 31 (67.4%) | 15 (32.6%) |
| Material Moving | 71 (100.0%) | 0 (0.0%) |
| Total (Category) | 135 (83.9%) | 26 (16.2%) |
| Total (Overall) | 744 (54.7%) | 616 (45.3%) |
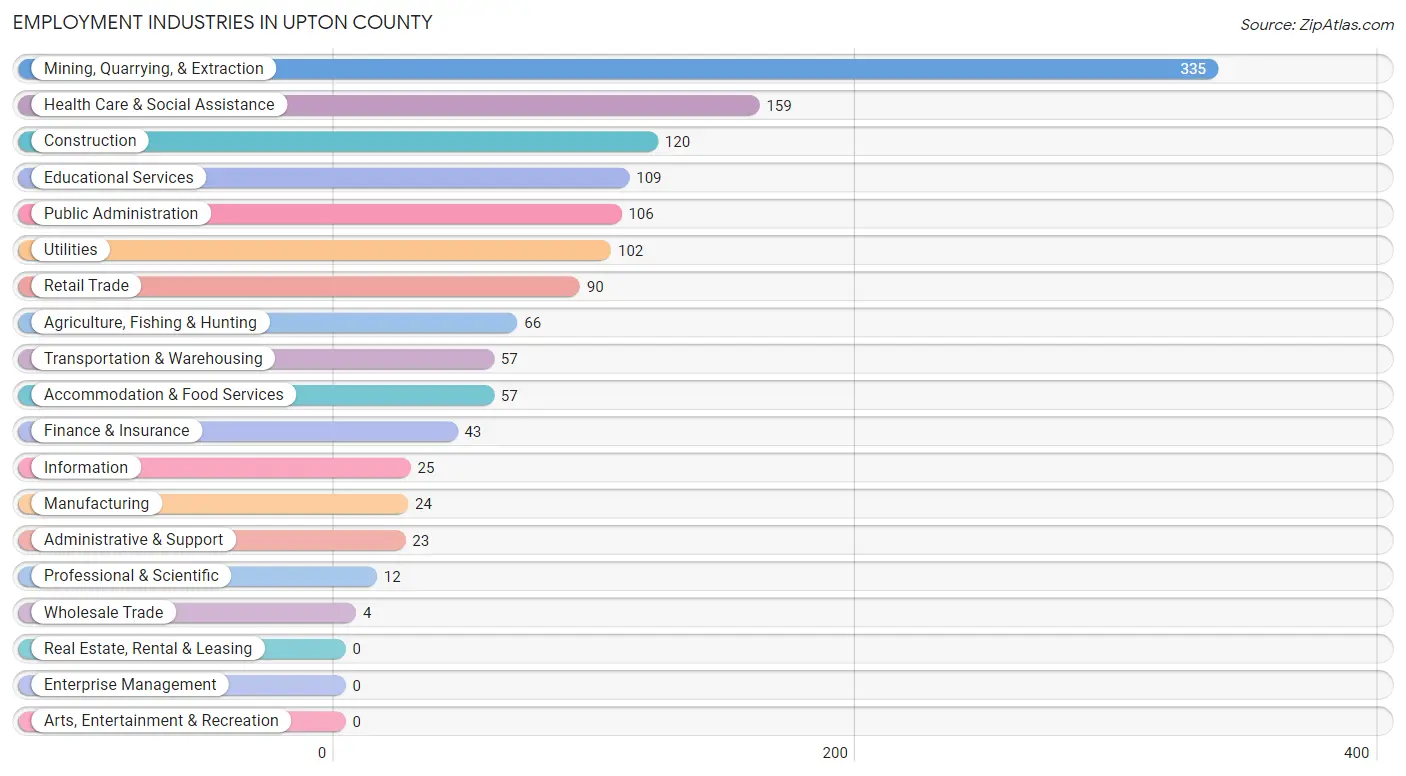
Employment Industries by Sex in Upton County
Employment Industries in Upton County
The major employment industries in Upton County include Mining, Quarrying, & Extraction (335 | 24.6%), Health Care & Social Assistance (159 | 11.7%), Construction (120 | 8.8%), Educational Services (109 | 8.0%), and Public Administration (106 | 7.8%).
Employment Industries by Sex in Upton County
The Upton County industries that see more men than women are Administrative & Support (100.0%), Mining, Quarrying, & Extraction (97.6%), and Manufacturing (91.7%), whereas the industries that tend to have a higher number of women are Health Care & Social Assistance (97.5%), Retail Trade (84.4%), and Educational Services (83.5%).
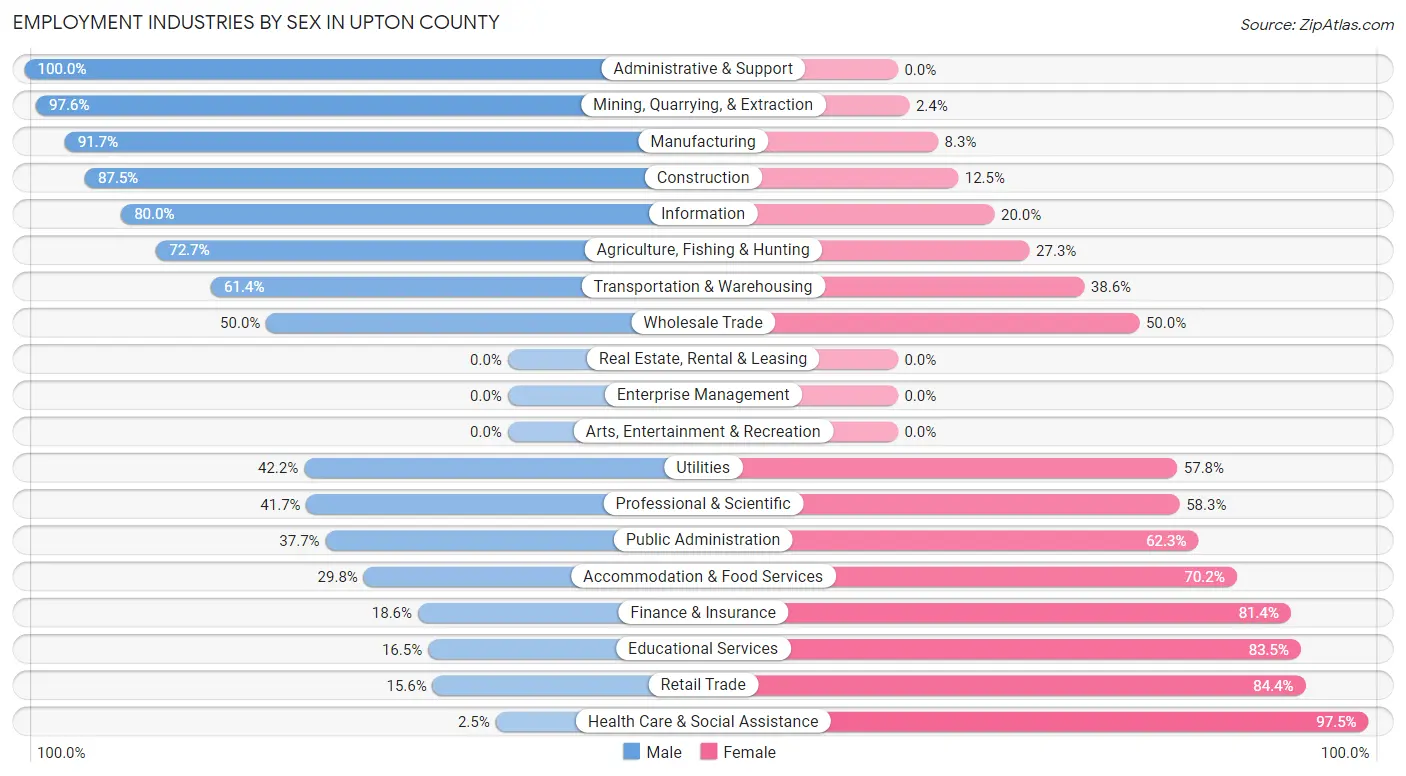
| Industry | Male | Female |
| Agriculture, Fishing & Hunting | 48 (72.7%) | 18 (27.3%) |
| Mining, Quarrying, & Extraction | 327 (97.6%) | 8 (2.4%) |
| Construction | 105 (87.5%) | 15 (12.5%) |
| Manufacturing | 22 (91.7%) | 2 (8.3%) |
| Wholesale Trade | 2 (50.0%) | 2 (50.0%) |
| Retail Trade | 14 (15.6%) | 76 (84.4%) |
| Transportation & Warehousing | 35 (61.4%) | 22 (38.6%) |
| Utilities | 43 (42.2%) | 59 (57.8%) |
| Information | 20 (80.0%) | 5 (20.0%) |
| Finance & Insurance | 8 (18.6%) | 35 (81.4%) |
| Real Estate, Rental & Leasing | 0 (0.0%) | 0 (0.0%) |
| Professional & Scientific | 5 (41.7%) | 7 (58.3%) |
| Enterprise Management | 0 (0.0%) | 0 (0.0%) |
| Administrative & Support | 23 (100.0%) | 0 (0.0%) |
| Educational Services | 18 (16.5%) | 91 (83.5%) |
| Health Care & Social Assistance | 4 (2.5%) | 155 (97.5%) |
| Arts, Entertainment & Recreation | 0 (0.0%) | 0 (0.0%) |
| Accommodation & Food Services | 17 (29.8%) | 40 (70.2%) |
| Public Administration | 40 (37.7%) | 66 (62.3%) |
| Total | 744 (54.7%) | 616 (45.3%) |
Education in Upton County
School Enrollment in Upton County
The most common levels of schooling among the 939 students in Upton County are middle school (409 | 43.6%), elementary school (253 | 26.9%), and high school (106 | 11.3%).
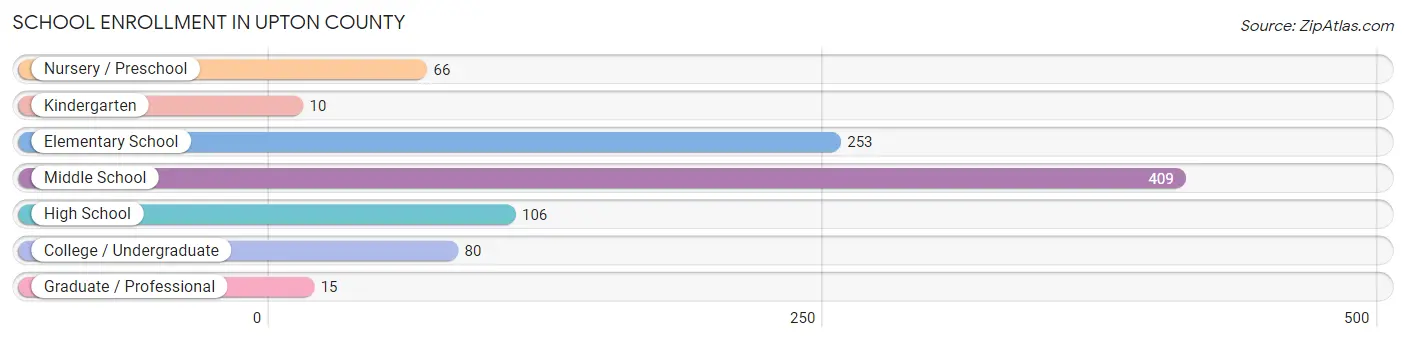
| School Level | # Students | % Students |
| Nursery / Preschool | 66 | 7.0% |
| Kindergarten | 10 | 1.1% |
| Elementary School | 253 | 26.9% |
| Middle School | 409 | 43.6% |
| High School | 106 | 11.3% |
| College / Undergraduate | 80 | 8.5% |
| Graduate / Professional | 15 | 1.6% |
| Total | 939 | 100.0% |
School Enrollment by Age by Funding Source in Upton County
Out of a total of 939 students who are enrolled in schools in Upton County, 15 (1.6%) attend a private institution, while the remaining 924 (98.4%) are enrolled in public schools. The age group of 25 to 34 year olds has the highest likelihood of being enrolled in private schools, with 15 (100.0% in the age bracket) enrolled. Conversely, the age group of 3 to 4 year olds has the lowest likelihood of being enrolled in a private school, with 46 (100.0% in the age bracket) attending a public institution.
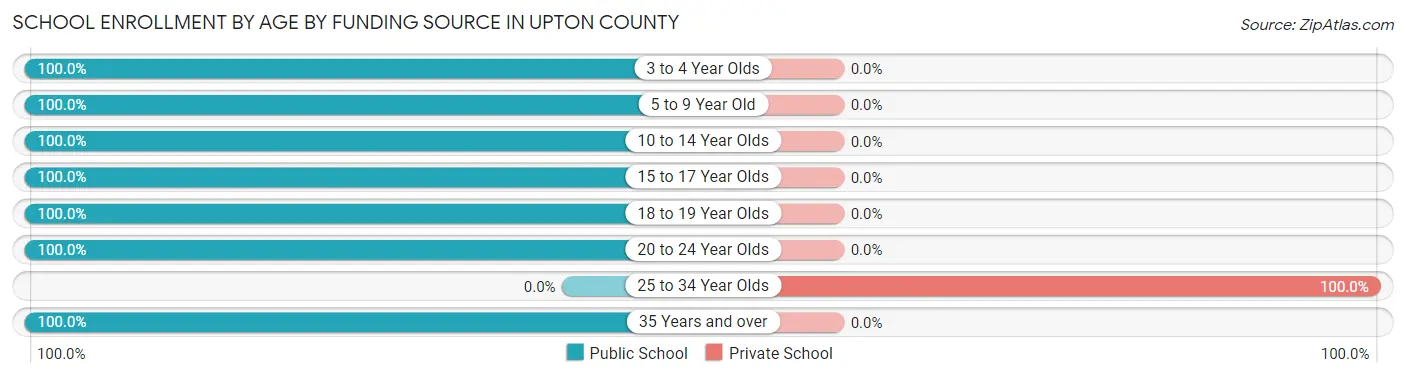
| Age Bracket | Public School | Private School |
| 3 to 4 Year Olds | 46 (100.0%) | 0 (0.0%) |
| 5 to 9 Year Old | 259 (100.0%) | 0 (0.0%) |
| 10 to 14 Year Olds | 431 (100.0%) | 0 (0.0%) |
| 15 to 17 Year Olds | 86 (100.0%) | 0 (0.0%) |
| 18 to 19 Year Olds | 68 (100.0%) | 0 (0.0%) |
| 20 to 24 Year Olds | 9 (100.0%) | 0 (0.0%) |
| 25 to 34 Year Olds | 0 (0.0%) | 15 (100.0%) |
| 35 Years and over | 25 (100.0%) | 0 (0.0%) |
| Total | 924 (98.4%) | 15 (1.6%) |
Educational Attainment by Field of Study in Upton County
Education (54 | 23.4%), arts & humanities (36 | 15.6%), bio, nature & agricultural (28 | 12.1%), physical & health sciences (22 | 9.5%), and psychology (18 | 7.8%) are the most common fields of study among 231 individuals in Upton County who have obtained a bachelor's degree or higher.
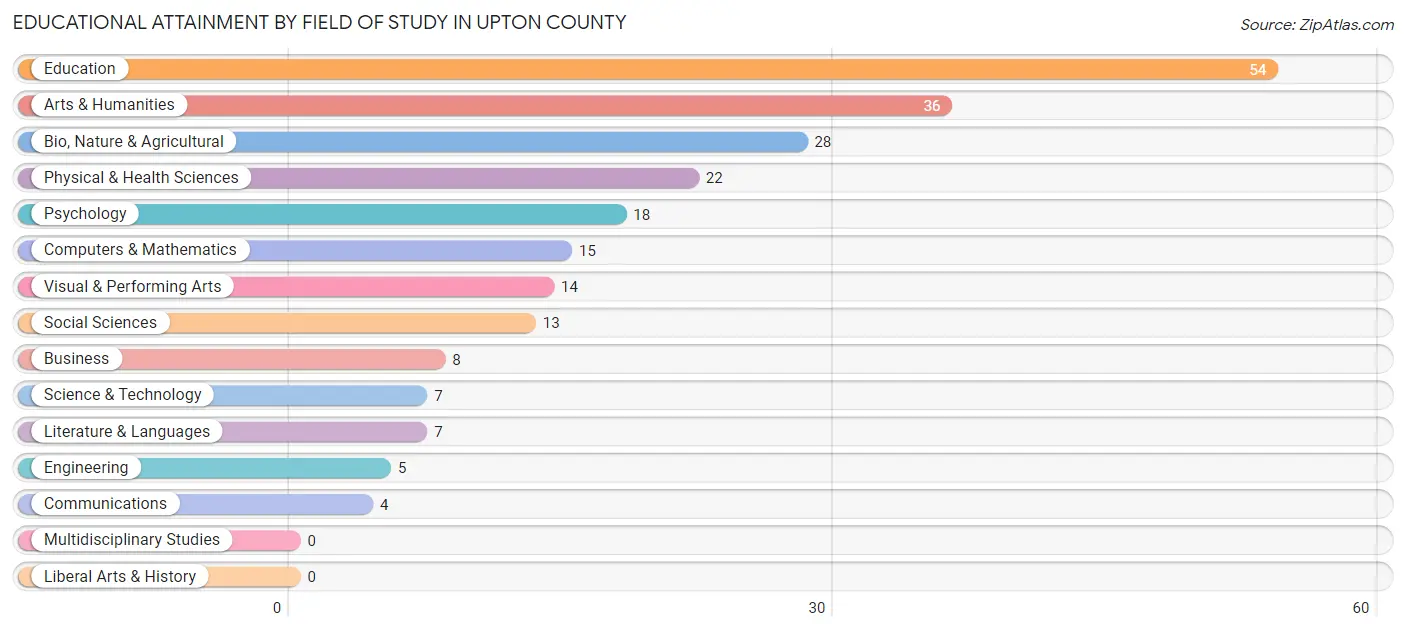
| Field of Study | # Graduates | % Graduates |
| Computers & Mathematics | 15 | 6.5% |
| Bio, Nature & Agricultural | 28 | 12.1% |
| Physical & Health Sciences | 22 | 9.5% |
| Psychology | 18 | 7.8% |
| Social Sciences | 13 | 5.6% |
| Engineering | 5 | 2.2% |
| Multidisciplinary Studies | 0 | 0.0% |
| Science & Technology | 7 | 3.0% |
| Business | 8 | 3.5% |
| Education | 54 | 23.4% |
| Literature & Languages | 7 | 3.0% |
| Liberal Arts & History | 0 | 0.0% |
| Visual & Performing Arts | 14 | 6.1% |
| Communications | 4 | 1.7% |
| Arts & Humanities | 36 | 15.6% |
| Total | 231 | 100.0% |
Transportation & Commute in Upton County
Vehicle Availability by Sex in Upton County
The most prevalent vehicle ownership categories in Upton County are males with 2 vehicles (293, accounting for 40.5%) and females with 2 vehicles (255, making up 49.2%).
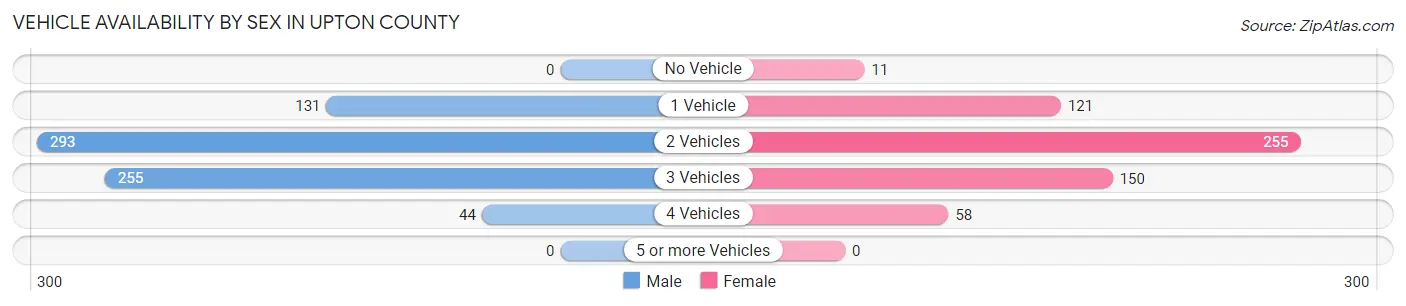
| Vehicles Available | Male | Female |
| No Vehicle | 0 (0.0%) | 11 (1.8%) |
| 1 Vehicle | 131 (18.1%) | 121 (20.3%) |
| 2 Vehicles | 293 (40.5%) | 255 (42.9%) |
| 3 Vehicles | 255 (35.3%) | 150 (25.2%) |
| 4 Vehicles | 44 (6.1%) | 58 (9.8%) |
| 5 or more Vehicles | 0 (0.0%) | 0 (0.0%) |
| Total | 723 (100.0%) | 595 (100.0%) |
Commute Time in Upton County
The most frequently occuring commute durations in Upton County are less than 5 minutes (263 commuters, 21.6%), 5 to 9 minutes (227 commuters, 18.6%), and 30 to 34 minutes (174 commuters, 14.3%).
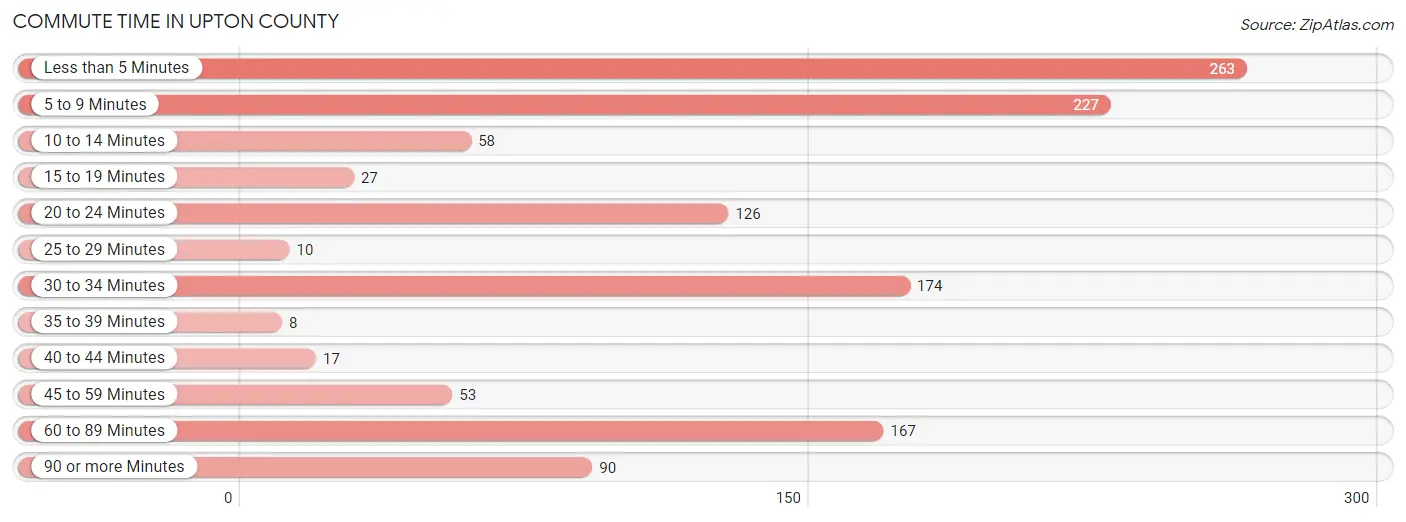
| Commute Time | # Commuters | % Commuters |
| Less than 5 Minutes | 263 | 21.6% |
| 5 to 9 Minutes | 227 | 18.6% |
| 10 to 14 Minutes | 58 | 4.8% |
| 15 to 19 Minutes | 27 | 2.2% |
| 20 to 24 Minutes | 126 | 10.3% |
| 25 to 29 Minutes | 10 | 0.8% |
| 30 to 34 Minutes | 174 | 14.3% |
| 35 to 39 Minutes | 8 | 0.7% |
| 40 to 44 Minutes | 17 | 1.4% |
| 45 to 59 Minutes | 53 | 4.3% |
| 60 to 89 Minutes | 167 | 13.7% |
| 90 or more Minutes | 90 | 7.4% |
Commute Time by Sex in Upton County
The most common commute times in Upton County are 60 to 89 minutes (165 commuters, 24.1%) for males and less than 5 minutes (172 commuters, 32.1%) for females.
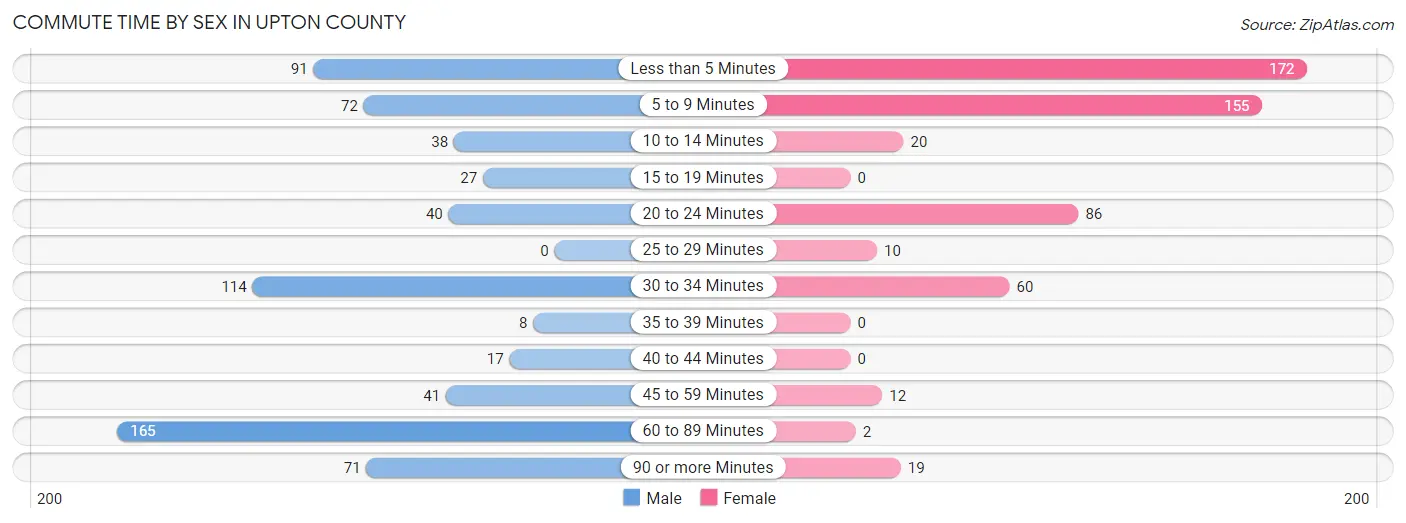
| Commute Time | Male | Female |
| Less than 5 Minutes | 91 (13.3%) | 172 (32.1%) |
| 5 to 9 Minutes | 72 (10.5%) | 155 (28.9%) |
| 10 to 14 Minutes | 38 (5.6%) | 20 (3.7%) |
| 15 to 19 Minutes | 27 (4.0%) | 0 (0.0%) |
| 20 to 24 Minutes | 40 (5.9%) | 86 (16.0%) |
| 25 to 29 Minutes | 0 (0.0%) | 10 (1.9%) |
| 30 to 34 Minutes | 114 (16.7%) | 60 (11.2%) |
| 35 to 39 Minutes | 8 (1.2%) | 0 (0.0%) |
| 40 to 44 Minutes | 17 (2.5%) | 0 (0.0%) |
| 45 to 59 Minutes | 41 (6.0%) | 12 (2.2%) |
| 60 to 89 Minutes | 165 (24.1%) | 2 (0.4%) |
| 90 or more Minutes | 71 (10.4%) | 19 (3.5%) |
Time of Departure to Work by Sex in Upton County
The most frequent times of departure to work in Upton County are 5:30 AM to 5:59 AM (153, 22.4%) for males and 7:30 AM to 7:59 AM (118, 22.0%) for females.
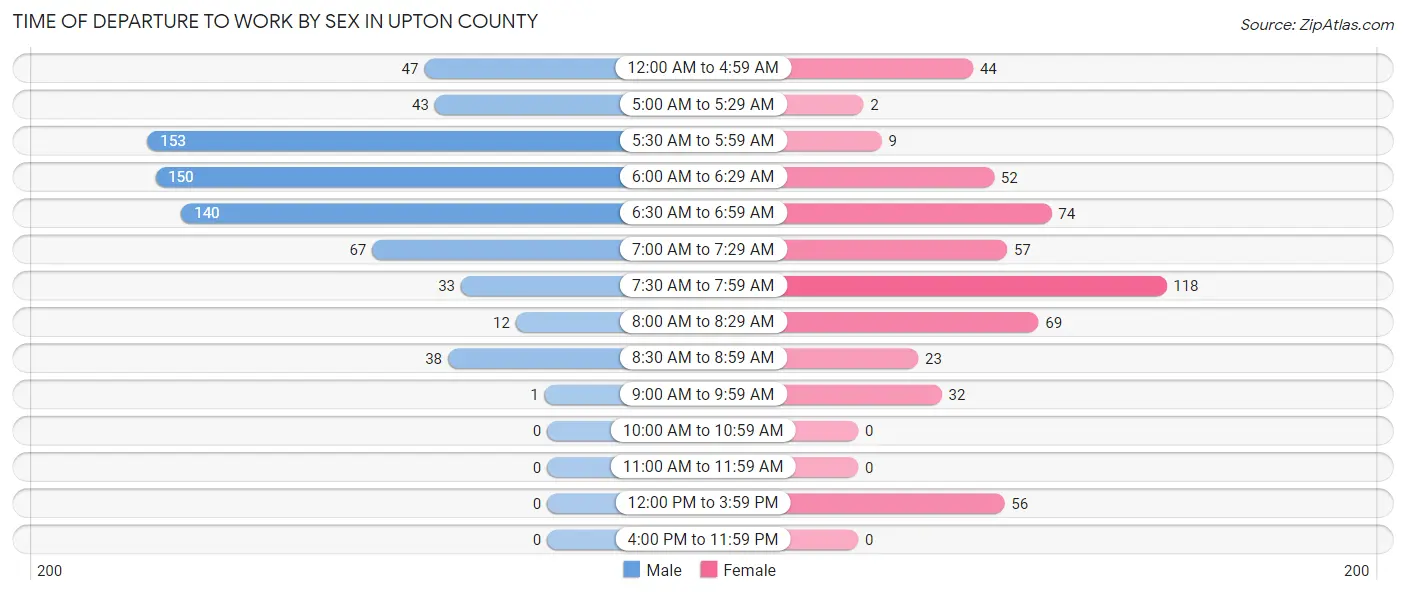
| Time of Departure | Male | Female |
| 12:00 AM to 4:59 AM | 47 (6.9%) | 44 (8.2%) |
| 5:00 AM to 5:29 AM | 43 (6.3%) | 2 (0.4%) |
| 5:30 AM to 5:59 AM | 153 (22.4%) | 9 (1.7%) |
| 6:00 AM to 6:29 AM | 150 (21.9%) | 52 (9.7%) |
| 6:30 AM to 6:59 AM | 140 (20.5%) | 74 (13.8%) |
| 7:00 AM to 7:29 AM | 67 (9.8%) | 57 (10.6%) |
| 7:30 AM to 7:59 AM | 33 (4.8%) | 118 (22.0%) |
| 8:00 AM to 8:29 AM | 12 (1.8%) | 69 (12.9%) |
| 8:30 AM to 8:59 AM | 38 (5.6%) | 23 (4.3%) |
| 9:00 AM to 9:59 AM | 1 (0.2%) | 32 (6.0%) |
| 10:00 AM to 10:59 AM | 0 (0.0%) | 0 (0.0%) |
| 11:00 AM to 11:59 AM | 0 (0.0%) | 0 (0.0%) |
| 12:00 PM to 3:59 PM | 0 (0.0%) | 56 (10.4%) |
| 4:00 PM to 11:59 PM | 0 (0.0%) | 0 (0.0%) |
| Total | 684 (100.0%) | 536 (100.0%) |
Housing Occupancy in Upton County
Occupancy by Ownership in Upton County
Of the total 1,363 dwellings in Upton County, owner-occupied units account for 1,051 (77.1%), while renter-occupied units make up 312 (22.9%).
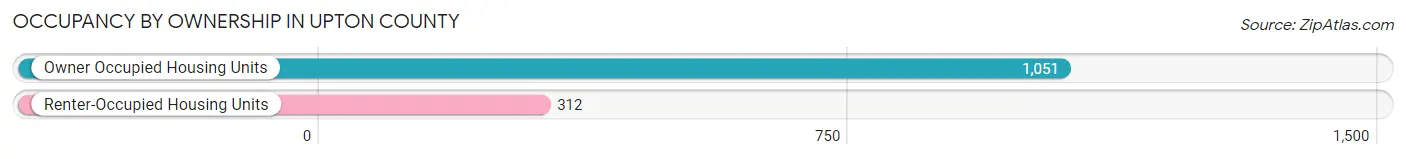
| Occupancy | # Housing Units | % Housing Units |
| Owner Occupied Housing Units | 1,051 | 77.1% |
| Renter-Occupied Housing Units | 312 | 22.9% |
| Total Occupied Housing Units | 1,363 | 100.0% |
Occupancy by Household Size in Upton County
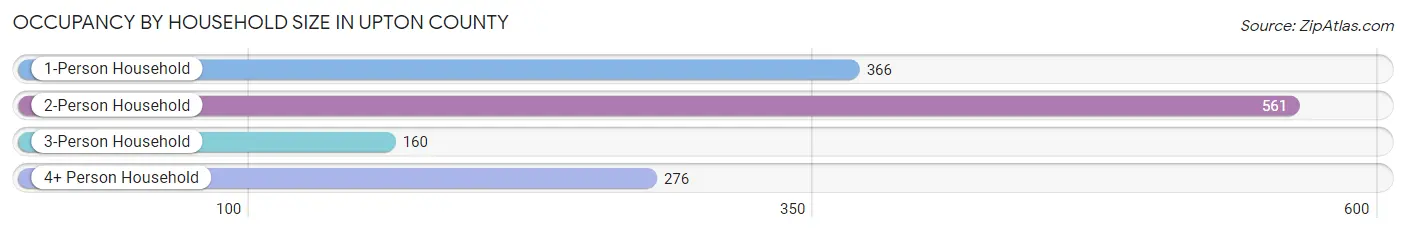
| Household Size | # Housing Units | % Housing Units |
| 1-Person Household | 366 | 26.9% |
| 2-Person Household | 561 | 41.2% |
| 3-Person Household | 160 | 11.7% |
| 4+ Person Household | 276 | 20.3% |
| Total Housing Units | 1,363 | 100.0% |
Occupancy by Ownership by Household Size in Upton County
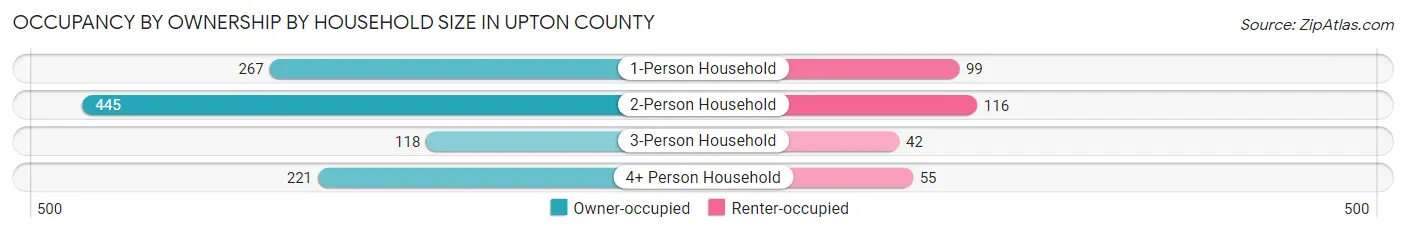
| Household Size | Owner-occupied | Renter-occupied |
| 1-Person Household | 267 (73.0%) | 99 (27.1%) |
| 2-Person Household | 445 (79.3%) | 116 (20.7%) |
| 3-Person Household | 118 (73.8%) | 42 (26.3%) |
| 4+ Person Household | 221 (80.1%) | 55 (19.9%) |
| Total Housing Units | 1,051 (77.1%) | 312 (22.9%) |
Occupancy by Educational Attainment in Upton County
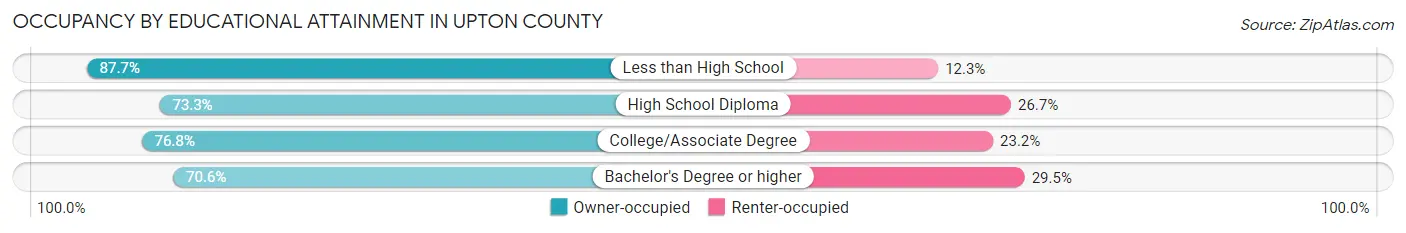
| Household Size | Owner-occupied | Renter-occupied |
| Less than High School | 271 (87.7%) | 38 (12.3%) |
| High School Diploma | 400 (73.3%) | 146 (26.7%) |
| College/Associate Degree | 265 (76.8%) | 80 (23.2%) |
| Bachelor's Degree or higher | 115 (70.6%) | 48 (29.4%) |
Occupancy by Age of Householder in Upton County
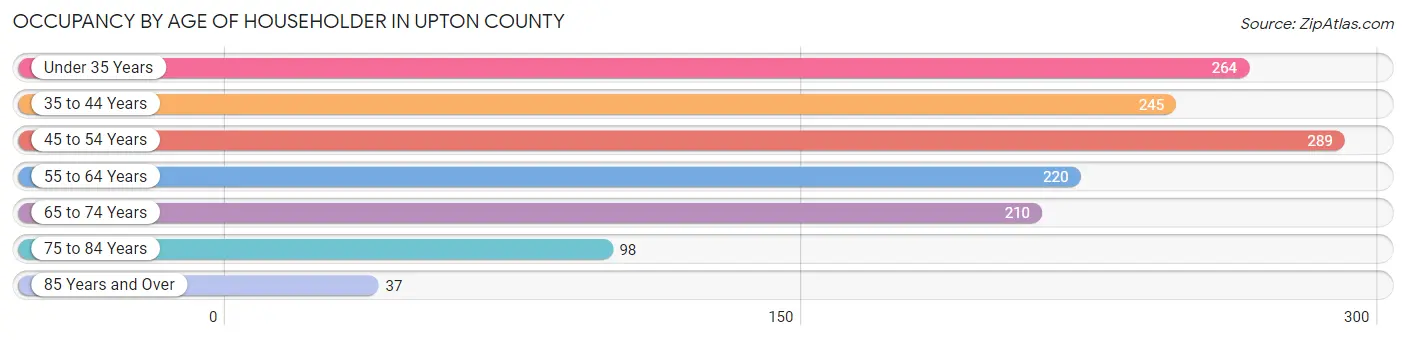
| Age Bracket | # Households | % Households |
| Under 35 Years | 264 | 19.4% |
| 35 to 44 Years | 245 | 18.0% |
| 45 to 54 Years | 289 | 21.2% |
| 55 to 64 Years | 220 | 16.1% |
| 65 to 74 Years | 210 | 15.4% |
| 75 to 84 Years | 98 | 7.2% |
| 85 Years and Over | 37 | 2.7% |
| Total | 1,363 | 100.0% |
Housing Finances in Upton County
Median Income by Occupancy in Upton County
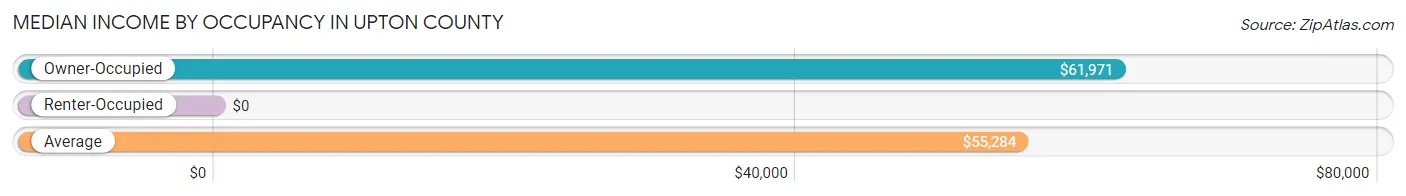
| Occupancy Type | # Households | Median Income |
| Owner-Occupied | 1,051 (77.1%) | $61,971 |
| Renter-Occupied | 312 (22.9%) | $0 |
| Average | 1,363 (100.0%) | $55,284 |
Occupancy by Householder Income Bracket in Upton County
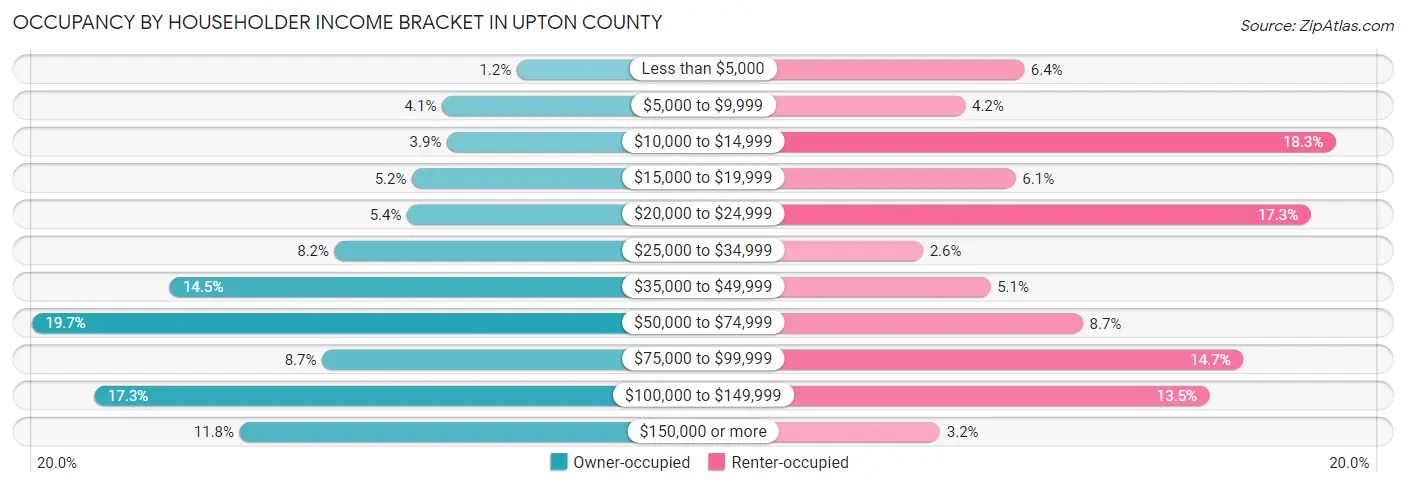
| Income Bracket | Owner-occupied | Renter-occupied |
| Less than $5,000 | 13 (1.2%) | 20 (6.4%) |
| $5,000 to $9,999 | 43 (4.1%) | 13 (4.2%) |
| $10,000 to $14,999 | 41 (3.9%) | 57 (18.3%) |
| $15,000 to $19,999 | 55 (5.2%) | 19 (6.1%) |
| $20,000 to $24,999 | 57 (5.4%) | 54 (17.3%) |
| $25,000 to $34,999 | 86 (8.2%) | 8 (2.6%) |
| $35,000 to $49,999 | 152 (14.5%) | 16 (5.1%) |
| $50,000 to $74,999 | 207 (19.7%) | 27 (8.6%) |
| $75,000 to $99,999 | 91 (8.7%) | 46 (14.7%) |
| $100,000 to $149,999 | 182 (17.3%) | 42 (13.5%) |
| $150,000 or more | 124 (11.8%) | 10 (3.2%) |
| Total | 1,051 (100.0%) | 312 (100.0%) |
Monthly Housing Cost Tiers in Upton County
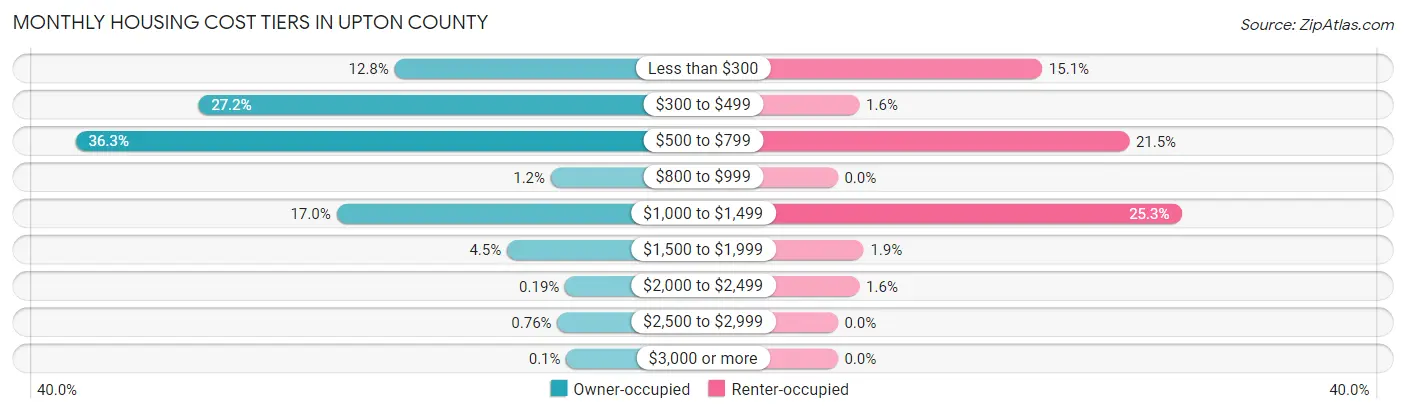
| Monthly Cost | Owner-occupied | Renter-occupied |
| Less than $300 | 134 (12.8%) | 47 (15.1%) |
| $300 to $499 | 286 (27.2%) | 5 (1.6%) |
| $500 to $799 | 381 (36.2%) | 67 (21.5%) |
| $800 to $999 | 13 (1.2%) | 0 (0.0%) |
| $1,000 to $1,499 | 179 (17.0%) | 79 (25.3%) |
| $1,500 to $1,999 | 47 (4.5%) | 6 (1.9%) |
| $2,000 to $2,499 | 2 (0.2%) | 5 (1.6%) |
| $2,500 to $2,999 | 8 (0.8%) | 0 (0.0%) |
| $3,000 or more | 1 (0.1%) | 0 (0.0%) |
| Total | 1,051 (100.0%) | 312 (100.0%) |
Physical Housing Characteristics in Upton County
Housing Structures in Upton County
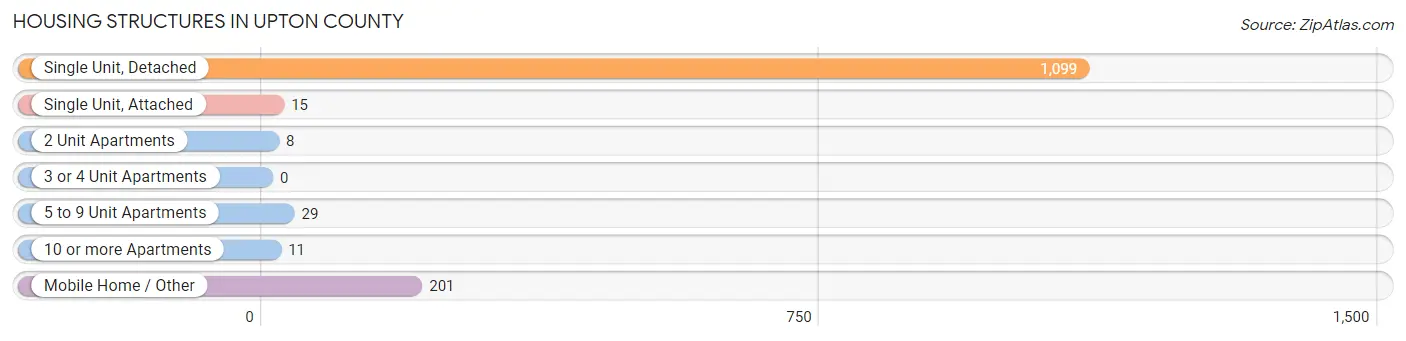
| Structure Type | # Housing Units | % Housing Units |
| Single Unit, Detached | 1,099 | 80.6% |
| Single Unit, Attached | 15 | 1.1% |
| 2 Unit Apartments | 8 | 0.6% |
| 3 or 4 Unit Apartments | 0 | 0.0% |
| 5 to 9 Unit Apartments | 29 | 2.1% |
| 10 or more Apartments | 11 | 0.8% |
| Mobile Home / Other | 201 | 14.7% |
| Total | 1,363 | 100.0% |
Housing Structures by Occupancy in Upton County
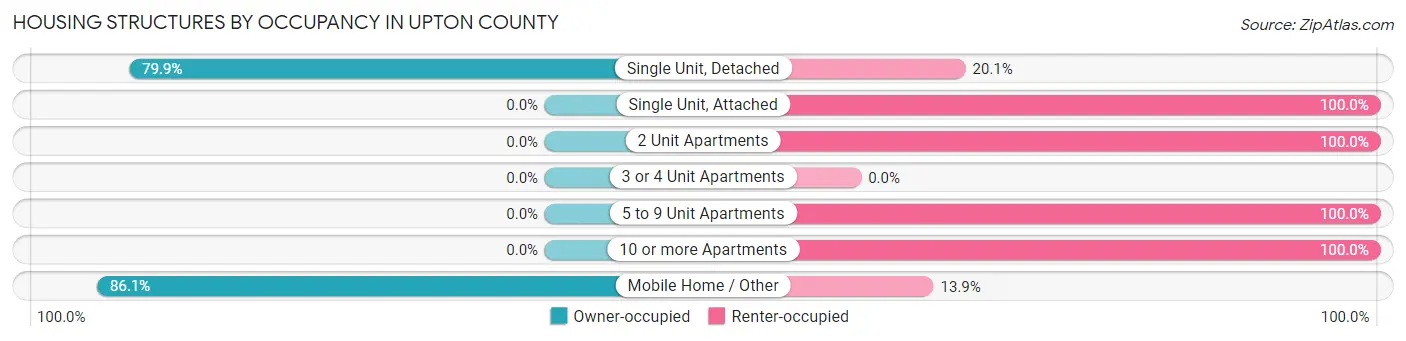
| Structure Type | Owner-occupied | Renter-occupied |
| Single Unit, Detached | 878 (79.9%) | 221 (20.1%) |
| Single Unit, Attached | 0 (0.0%) | 15 (100.0%) |
| 2 Unit Apartments | 0 (0.0%) | 8 (100.0%) |
| 3 or 4 Unit Apartments | 0 (0.0%) | 0 (0.0%) |
| 5 to 9 Unit Apartments | 0 (0.0%) | 29 (100.0%) |
| 10 or more Apartments | 0 (0.0%) | 11 (100.0%) |
| Mobile Home / Other | 173 (86.1%) | 28 (13.9%) |
| Total | 1,051 (77.1%) | 312 (22.9%) |
Housing Structures by Number of Rooms in Upton County
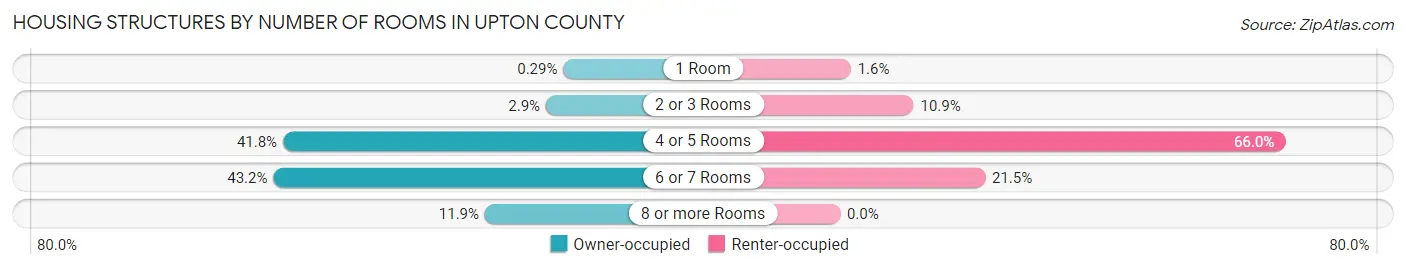
| Number of Rooms | Owner-occupied | Renter-occupied |
| 1 Room | 3 (0.3%) | 5 (1.6%) |
| 2 or 3 Rooms | 30 (2.9%) | 34 (10.9%) |
| 4 or 5 Rooms | 439 (41.8%) | 206 (66.0%) |
| 6 or 7 Rooms | 454 (43.2%) | 67 (21.5%) |
| 8 or more Rooms | 125 (11.9%) | 0 (0.0%) |
| Total | 1,051 (100.0%) | 312 (100.0%) |
Housing Structure by Heating Type in Upton County
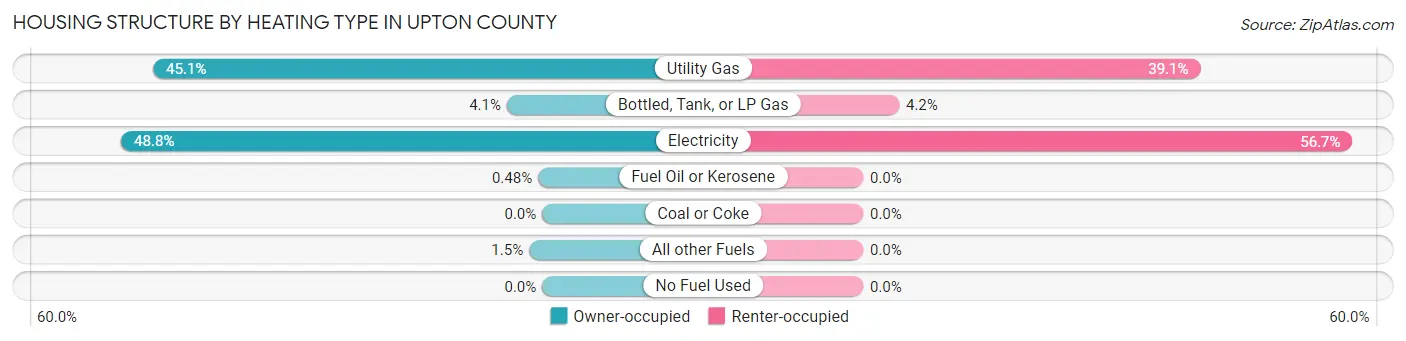
| Heating Type | Owner-occupied | Renter-occupied |
| Utility Gas | 474 (45.1%) | 122 (39.1%) |
| Bottled, Tank, or LP Gas | 43 (4.1%) | 13 (4.2%) |
| Electricity | 513 (48.8%) | 177 (56.7%) |
| Fuel Oil or Kerosene | 5 (0.5%) | 0 (0.0%) |
| Coal or Coke | 0 (0.0%) | 0 (0.0%) |
| All other Fuels | 16 (1.5%) | 0 (0.0%) |
| No Fuel Used | 0 (0.0%) | 0 (0.0%) |
| Total | 1,051 (100.0%) | 312 (100.0%) |
Household Vehicle Usage in Upton County
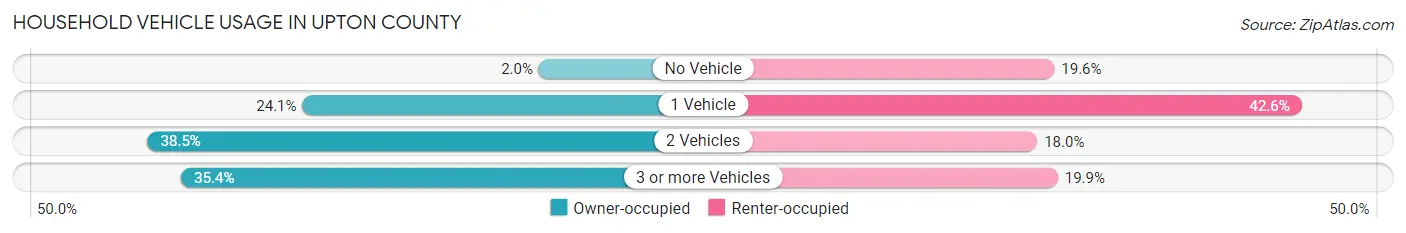
| Vehicles per Household | Owner-occupied | Renter-occupied |
| No Vehicle | 21 (2.0%) | 61 (19.6%) |
| 1 Vehicle | 253 (24.1%) | 133 (42.6%) |
| 2 Vehicles | 405 (38.5%) | 56 (17.9%) |
| 3 or more Vehicles | 372 (35.4%) | 62 (19.9%) |
| Total | 1,051 (100.0%) | 312 (100.0%) |
Real Estate & Mortgages in Upton County
Real Estate and Mortgage Overview in Upton County
| Characteristic | Without Mortgage | With Mortgage |
| Housing Units | 806 | 245 |
| Median Property Value | $87,700 | $149,600 |
| Median Household Income | $53,611 | $67 |
| Monthly Housing Costs | $498 | $1 |
| Real Estate Taxes | $988 | $22 |
Property Value by Mortgage Status in Upton County
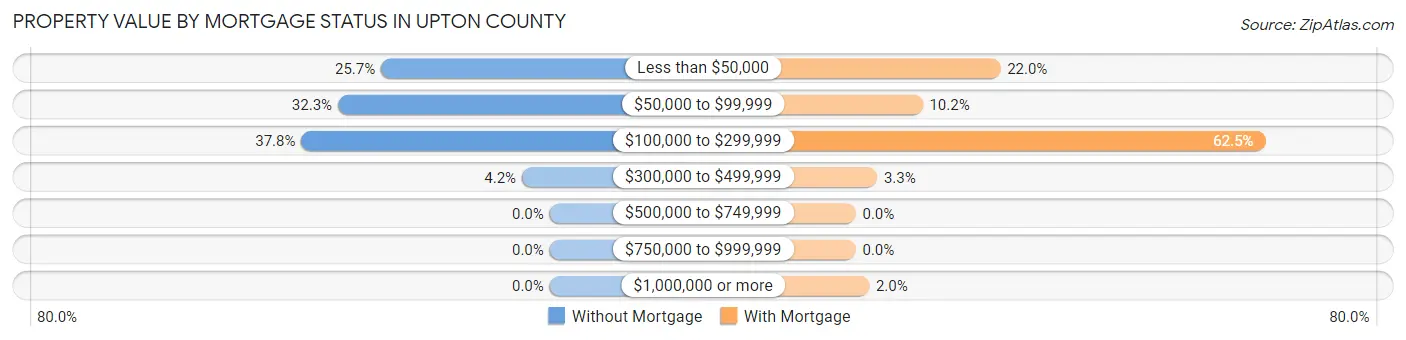
| Property Value | Without Mortgage | With Mortgage |
| Less than $50,000 | 207 (25.7%) | 54 (22.0%) |
| $50,000 to $99,999 | 260 (32.3%) | 25 (10.2%) |
| $100,000 to $299,999 | 305 (37.8%) | 153 (62.5%) |
| $300,000 to $499,999 | 34 (4.2%) | 8 (3.3%) |
| $500,000 to $749,999 | 0 (0.0%) | 0 (0.0%) |
| $750,000 to $999,999 | 0 (0.0%) | 0 (0.0%) |
| $1,000,000 or more | 0 (0.0%) | 5 (2.0%) |
| Total | 806 (100.0%) | 245 (100.0%) |
Household Income by Mortgage Status in Upton County
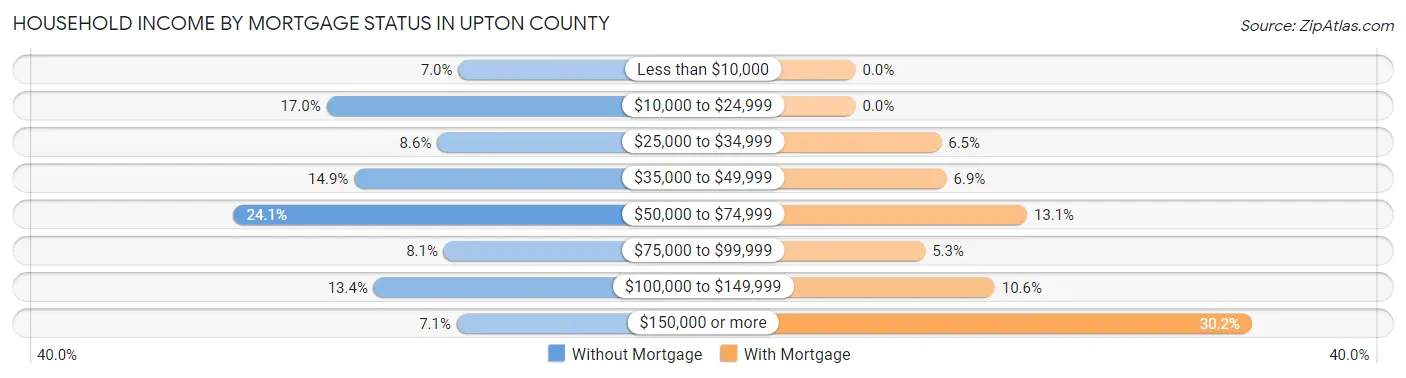
| Household Income | Without Mortgage | With Mortgage |
| Less than $10,000 | 56 (7.0%) | 0 (0.0%) |
| $10,000 to $24,999 | 137 (17.0%) | 0 (0.0%) |
| $25,000 to $34,999 | 69 (8.6%) | 16 (6.5%) |
| $35,000 to $49,999 | 120 (14.9%) | 17 (6.9%) |
| $50,000 to $74,999 | 194 (24.1%) | 32 (13.1%) |
| $75,000 to $99,999 | 65 (8.1%) | 13 (5.3%) |
| $100,000 to $149,999 | 108 (13.4%) | 26 (10.6%) |
| $150,000 or more | 57 (7.1%) | 74 (30.2%) |
| Total | 806 (100.0%) | 245 (100.0%) |
Property Value to Household Income Ratio in Upton County
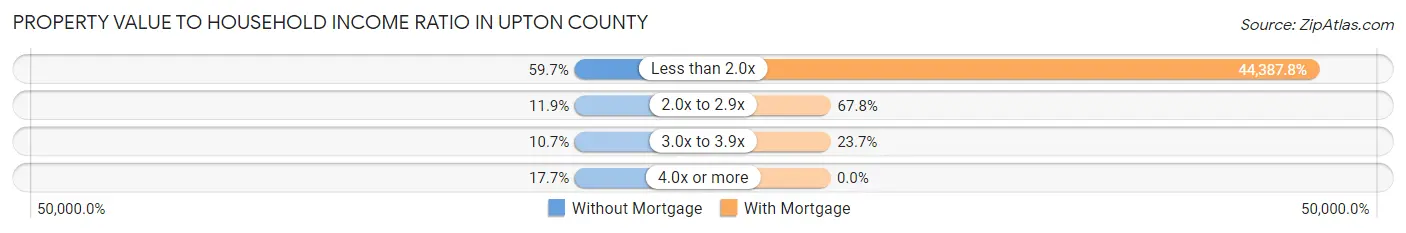
| Value-to-Income Ratio | Without Mortgage | With Mortgage |
| Less than 2.0x | 481 (59.7%) | 108,750 (44,387.8%) |
| 2.0x to 2.9x | 96 (11.9%) | 166 (67.8%) |
| 3.0x to 3.9x | 86 (10.7%) | 58 (23.7%) |
| 4.0x or more | 143 (17.7%) | 0 (0.0%) |
| Total | 806 (100.0%) | 245 (100.0%) |
Real Estate Taxes by Mortgage Status in Upton County
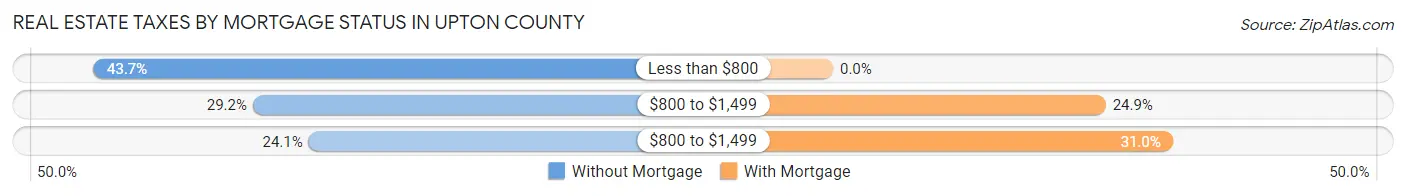
| Property Taxes | Without Mortgage | With Mortgage |
| Less than $800 | 352 (43.7%) | 0 (0.0%) |
| $800 to $1,499 | 235 (29.2%) | 61 (24.9%) |
| $800 to $1,499 | 194 (24.1%) | 76 (31.0%) |
| Total | 806 (100.0%) | 245 (100.0%) |
Health & Disability in Upton County
Health Insurance Coverage by Age in Upton County
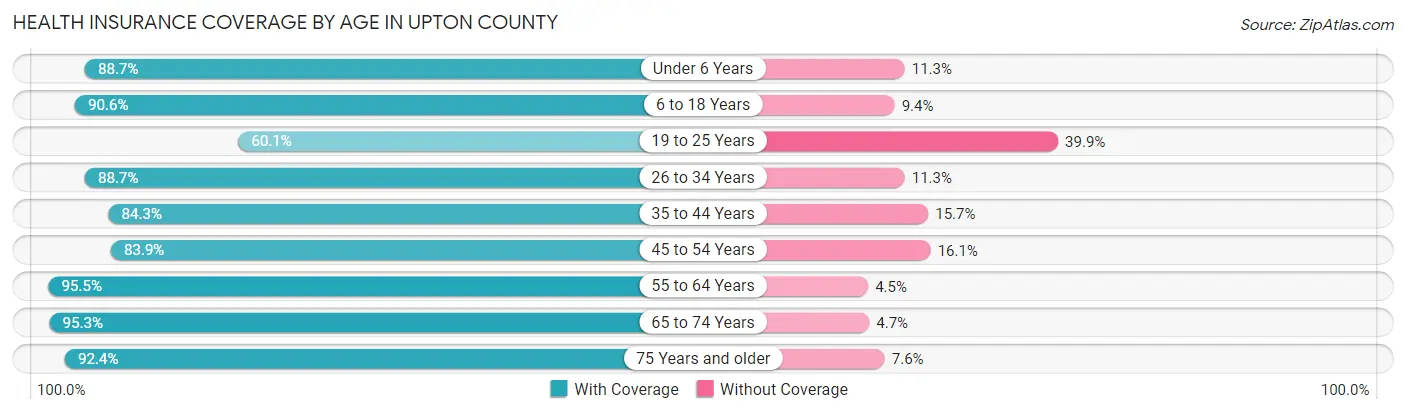
| Age Bracket | With Coverage | Without Coverage |
| Under 6 Years | 110 (88.7%) | 14 (11.3%) |
| 6 to 18 Years | 741 (90.6%) | 77 (9.4%) |
| 19 to 25 Years | 98 (60.1%) | 65 (39.9%) |
| 26 to 34 Years | 275 (88.7%) | 35 (11.3%) |
| 35 to 44 Years | 393 (84.3%) | 73 (15.7%) |
| 45 to 54 Years | 354 (83.9%) | 68 (16.1%) |
| 55 to 64 Years | 386 (95.5%) | 18 (4.5%) |
| 65 to 74 Years | 326 (95.3%) | 16 (4.7%) |
| 75 Years and older | 159 (92.4%) | 13 (7.6%) |
| Total | 2,842 (88.2%) | 379 (11.8%) |
Health Insurance Coverage by Citizenship Status in Upton County
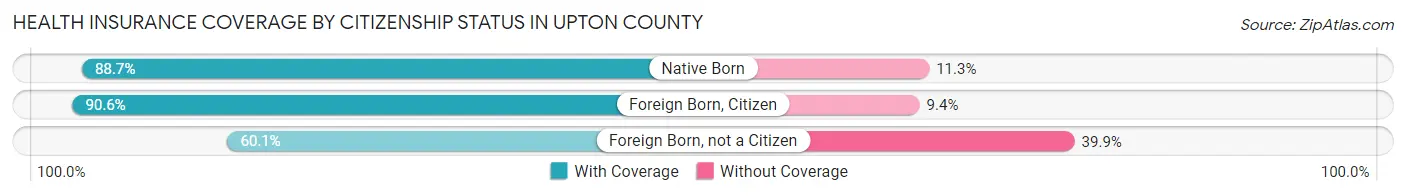
| Citizenship Status | With Coverage | Without Coverage |
| Native Born | 110 (88.7%) | 14 (11.3%) |
| Foreign Born, Citizen | 741 (90.6%) | 77 (9.4%) |
| Foreign Born, not a Citizen | 98 (60.1%) | 65 (39.9%) |
Health Insurance Coverage by Household Income in Upton County
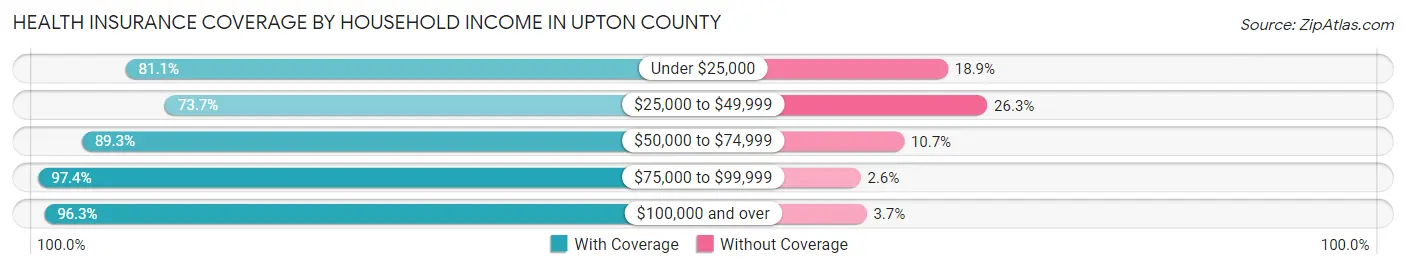
| Household Income | With Coverage | Without Coverage |
| Under $25,000 | 552 (81.1%) | 129 (18.9%) |
| $25,000 to $49,999 | 426 (73.7%) | 152 (26.3%) |
| $50,000 to $74,999 | 375 (89.3%) | 45 (10.7%) |
| $75,000 to $99,999 | 492 (97.4%) | 13 (2.6%) |
| $100,000 and over | 995 (96.3%) | 38 (3.7%) |
Public vs Private Health Insurance Coverage by Age in Upton County
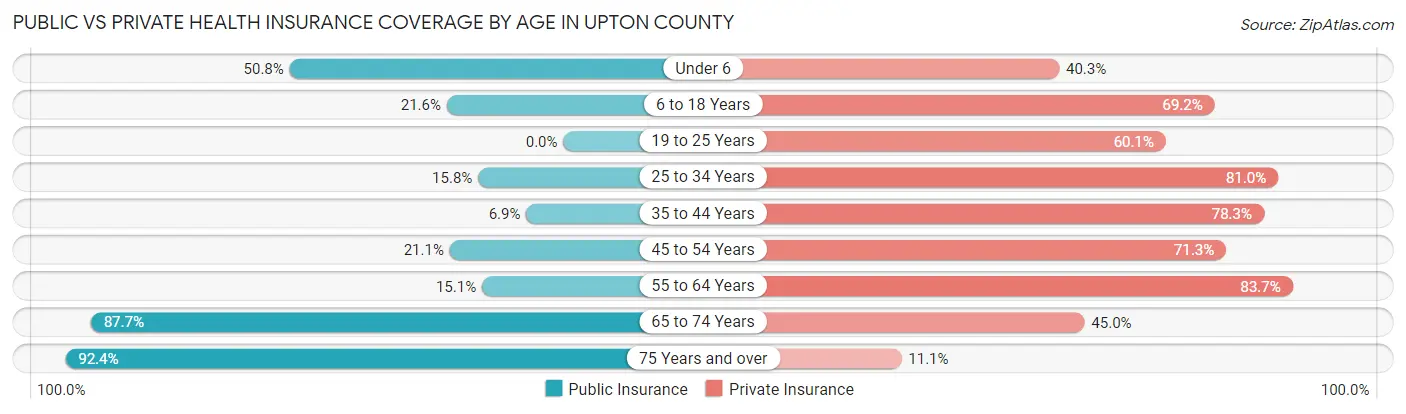
| Age Bracket | Public Insurance | Private Insurance |
| Under 6 | 63 (50.8%) | 50 (40.3%) |
| 6 to 18 Years | 177 (21.6%) | 566 (69.2%) |
| 19 to 25 Years | 0 (0.0%) | 98 (60.1%) |
| 25 to 34 Years | 49 (15.8%) | 251 (81.0%) |
| 35 to 44 Years | 32 (6.9%) | 365 (78.3%) |
| 45 to 54 Years | 89 (21.1%) | 301 (71.3%) |
| 55 to 64 Years | 61 (15.1%) | 338 (83.7%) |
| 65 to 74 Years | 300 (87.7%) | 154 (45.0%) |
| 75 Years and over | 159 (92.4%) | 19 (11.1%) |
| Total | 930 (28.9%) | 2,142 (66.5%) |
Disability Status by Sex by Age in Upton County
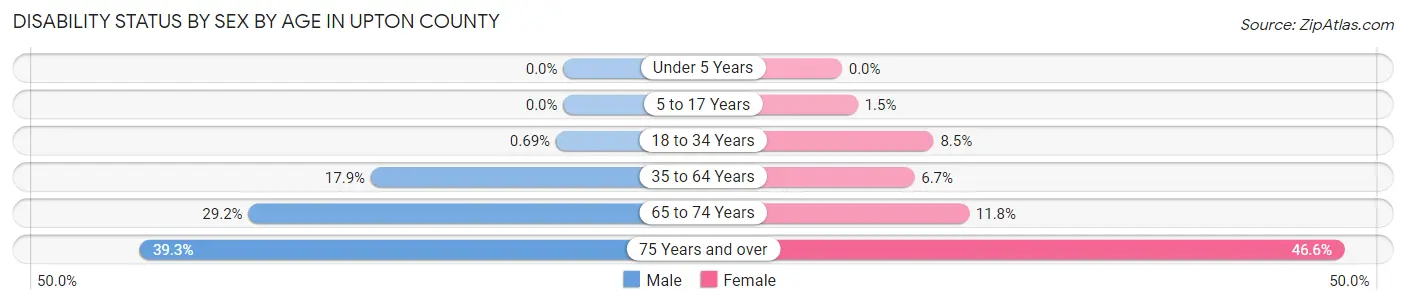
| Age Bracket | Male | Female |
| Under 5 Years | 0 (0.0%) | 0 (0.0%) |
| 5 to 17 Years | 0 (0.0%) | 6 (1.5%) |
| 18 to 34 Years | 2 (0.7%) | 20 (8.5%) |
| 35 to 64 Years | 122 (17.9%) | 41 (6.7%) |
| 65 to 74 Years | 38 (29.2%) | 25 (11.8%) |
| 75 Years and over | 33 (39.3%) | 41 (46.6%) |
Disability Class by Sex by Age in Upton County
Disability Class: Hearing Difficulty
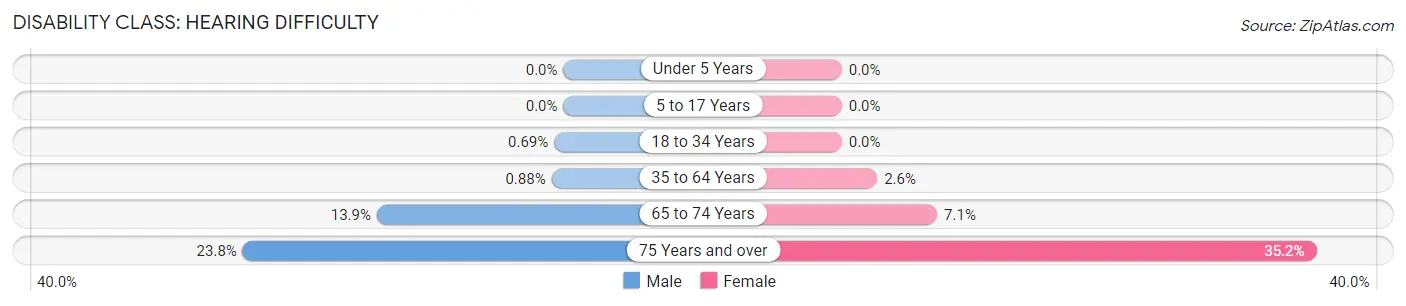
| Age Bracket | Male | Female |
| Under 5 Years | 0 (0.0%) | 0 (0.0%) |
| 5 to 17 Years | 0 (0.0%) | 0 (0.0%) |
| 18 to 34 Years | 2 (0.7%) | 0 (0.0%) |
| 35 to 64 Years | 6 (0.9%) | 16 (2.6%) |
| 65 to 74 Years | 18 (13.9%) | 15 (7.1%) |
| 75 Years and over | 20 (23.8%) | 31 (35.2%) |
Disability Class: Vision Difficulty
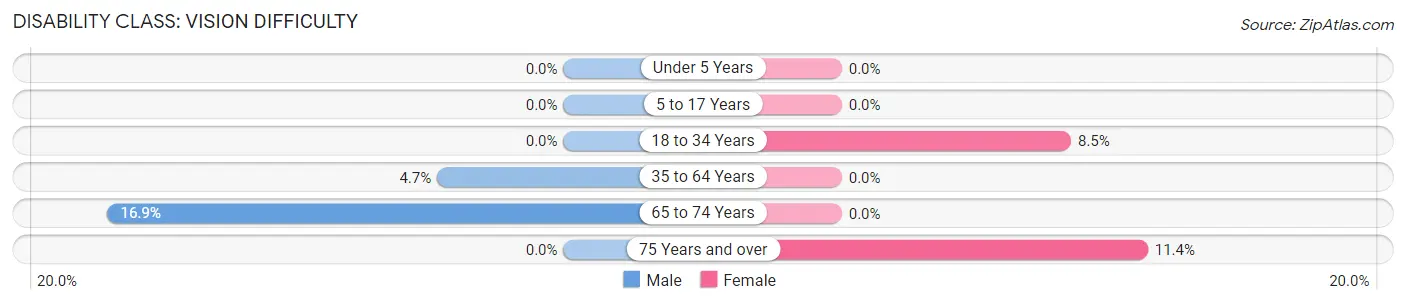
| Age Bracket | Male | Female |
| Under 5 Years | 0 (0.0%) | 0 (0.0%) |
| 5 to 17 Years | 0 (0.0%) | 0 (0.0%) |
| 18 to 34 Years | 0 (0.0%) | 20 (8.5%) |
| 35 to 64 Years | 32 (4.7%) | 0 (0.0%) |
| 65 to 74 Years | 22 (16.9%) | 0 (0.0%) |
| 75 Years and over | 0 (0.0%) | 10 (11.4%) |
Disability Class: Cognitive Difficulty
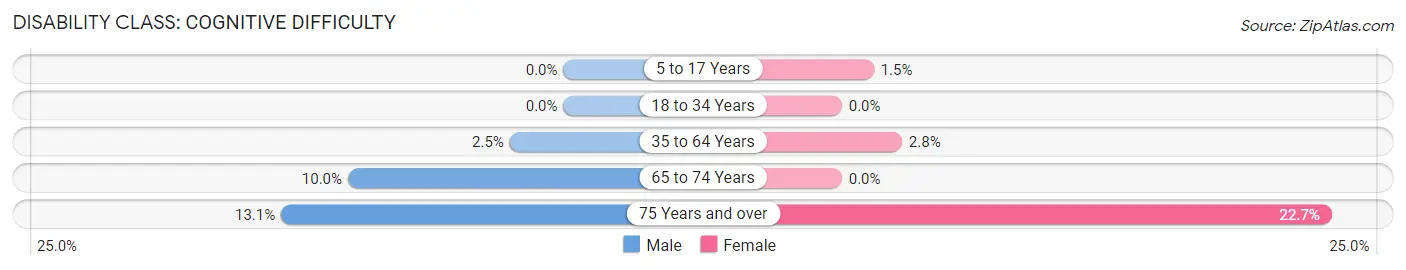
| Age Bracket | Male | Female |
| 5 to 17 Years | 0 (0.0%) | 6 (1.5%) |
| 18 to 34 Years | 0 (0.0%) | 0 (0.0%) |
| 35 to 64 Years | 17 (2.5%) | 17 (2.8%) |
| 65 to 74 Years | 13 (10.0%) | 0 (0.0%) |
| 75 Years and over | 11 (13.1%) | 20 (22.7%) |
Disability Class: Ambulatory Difficulty
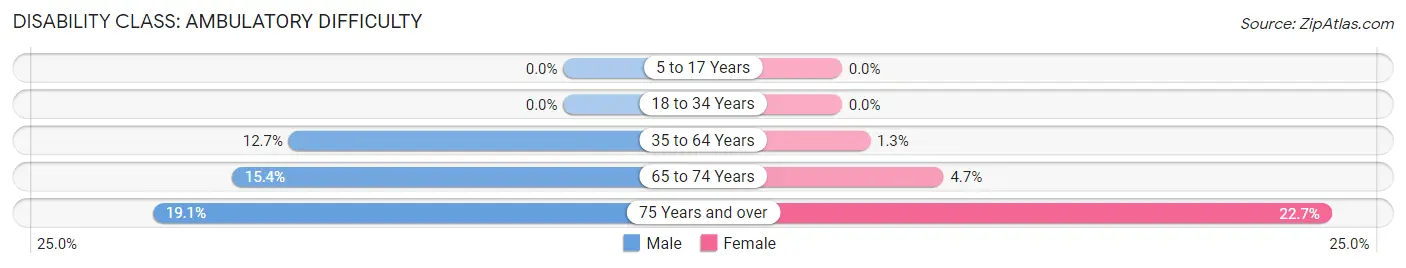
| Age Bracket | Male | Female |
| 5 to 17 Years | 0 (0.0%) | 0 (0.0%) |
| 18 to 34 Years | 0 (0.0%) | 0 (0.0%) |
| 35 to 64 Years | 87 (12.7%) | 8 (1.3%) |
| 65 to 74 Years | 20 (15.4%) | 10 (4.7%) |
| 75 Years and over | 16 (19.1%) | 20 (22.7%) |
Disability Class: Self-Care Difficulty
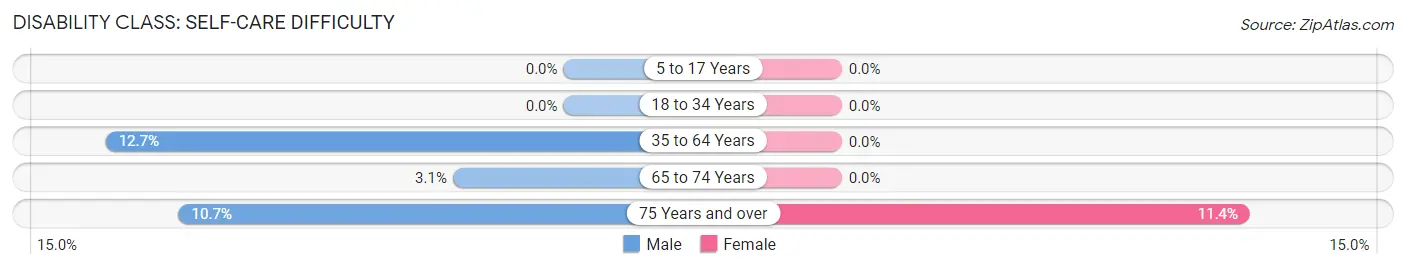
| Age Bracket | Male | Female |
| 5 to 17 Years | 0 (0.0%) | 0 (0.0%) |
| 18 to 34 Years | 0 (0.0%) | 0 (0.0%) |
| 35 to 64 Years | 87 (12.7%) | 0 (0.0%) |
| 65 to 74 Years | 4 (3.1%) | 0 (0.0%) |
| 75 Years and over | 9 (10.7%) | 10 (11.4%) |
Technology Access in Upton County
Computing Device Access in Upton County
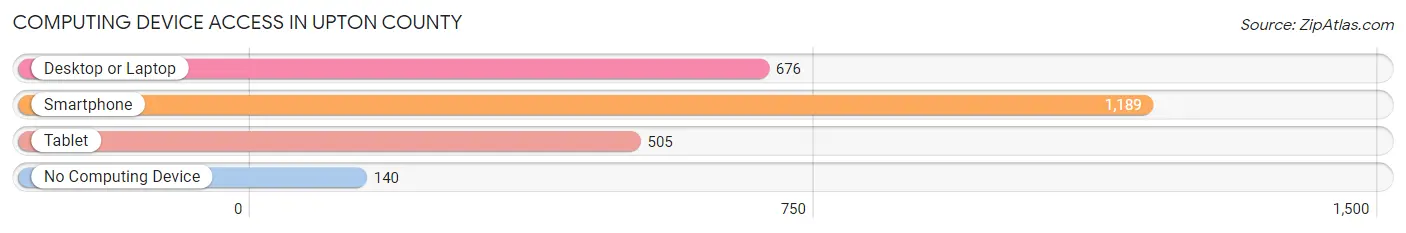
| Device Type | # Households | % Households |
| Desktop or Laptop | 676 | 49.6% |
| Smartphone | 1,189 | 87.2% |
| Tablet | 505 | 37.0% |
| No Computing Device | 140 | 10.3% |
| Total | 1,363 | 100.0% |
Internet Access in Upton County
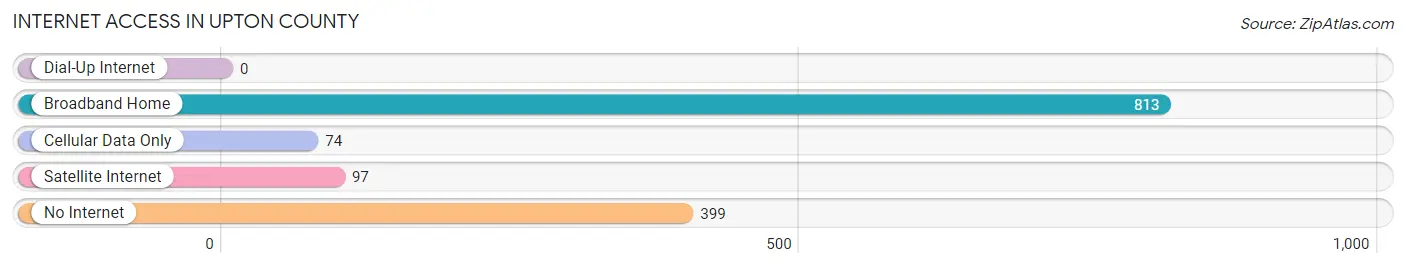
| Internet Type | # Households | % Households |
| Dial-Up Internet | 0 | 0.0% |
| Broadband Home | 813 | 59.7% |
| Cellular Data Only | 74 | 5.4% |
| Satellite Internet | 97 | 7.1% |
| No Internet | 399 | 29.3% |
| Total | 1,363 | 100.0% |
Upton County Summary
Upton County is located in the western part of Texas, in the Permian Basin region. It is bordered by Reagan County to the north, Crockett County to the east, Pecos County to the south, and Midland County to the west. The county seat is Rankin, and the largest city is McCamey. The county was created in 1887 and named after John C. Upton, a Confederate soldier and Texas state legislator.
Geography
Upton County covers an area of 1,072 square miles, making it the second-smallest county in Texas. The terrain is mostly flat, with some rolling hills in the northern part of the county. The county is part of the Edwards Plateau, and the soils are mostly sandy loam. The climate is semi-arid, with hot summers and mild winters. The average annual precipitation is 17.5 inches.
The major waterways in the county are the Pecos River, which forms the western border of the county, and the Salt Fork of the Brazos River, which flows through the northern part of the county. There are several small lakes in the county, including Lake McCamey, Lake Rankin, and Lake Upton.
Economy
The economy of Upton County is largely based on agriculture and oil and gas production. The county is one of the top producers of cotton in the state, and other crops grown in the county include sorghum, wheat, and hay. Cattle and sheep are also raised in the county.
Oil and gas production is a major industry in the county, and there are several large oil and gas fields in the area. The county is also home to several oil and gas processing plants.
Demographics
As of the 2010 census, the population of Upton County was 3,355. The population is mostly white (83.3%), with a small Hispanic population (14.2%). The median household income is $41,944, and the median age is 37.
The largest city in the county is McCamey, with a population of 1,845. Other cities in the county include Rankin (population 1,072) and Upton (population 438).
Conclusion
Upton County is a small county in western Texas, located in the Permian Basin region. The economy is largely based on agriculture and oil and gas production, and the population is mostly white. The county is home to several small cities, including McCamey, Rankin, and Upton.
Common Questions
What is Per Capita Income in Upton County?
Per Capita income in Upton County is $27,385.
What is the Median Family Income in Upton County?
Median Family Income in Upton County is $73,563.
What is the Median Household income in Upton County?
Median Household Income in Upton County is $55,284.
What is Income or Wage Gap in Upton County?
Income or Wage Gap in Upton County is 51.2%.
Women in Upton County earn 48.8 cents for every dollar earned by a man.
What is Inequality or Gini Index in Upton County?
Inequality or Gini Index in Upton County is 0.43.
What is the Total Population of Upton County?
Total Population of Upton County is 3,284.
What is the Total Male Population of Upton County?
Total Male Population of Upton County is 1,640.
What is the Total Female Population of Upton County?
Total Female Population of Upton County is 1,644.
What is the Ratio of Males per 100 Females in Upton County?
There are 99.76 Males per 100 Females in Upton County.
What is the Ratio of Females per 100 Males in Upton County?
There are 100.24 Females per 100 Males in Upton County.
What is the Median Population Age in Upton County?
Median Population Age in Upton County is 39.9 Years.
What is the Average Family Size in Upton County
Average Family Size in Upton County is 2.9 People.
What is the Average Household Size in Upton County
Average Household Size in Upton County is 2.4 People.
How Large is the Labor Force in Upton County?
There are 1,428 People in the Labor Forcein in Upton County.
What is the Percentage of People in the Labor Force in Upton County?
58.0% of People are in the Labor Force in Upton County.
What is the Unemployment Rate in Upton County?
Unemployment Rate in Upton County is 4.7%.