Terrell County, TX Map & Demographics
Terrell County Map
Terrell County Overview
$36,144
PER CAPITA INCOME
$64,141
AVG FAMILY INCOME
$52,813
AVG HOUSEHOLD INCOME
62.2%
WAGE / INCOME GAP [ % ]
37.8¢/ $1
WAGE / INCOME GAP [ $ ]
0.38
INEQUALITY / GINI INDEX
862
TOTAL POPULATION
501
MALE POPULATION
361
FEMALE POPULATION
138.78
MALES / 100 FEMALES
72.06
FEMALES / 100 MALES
57.7
MEDIAN AGE
2.9
AVG FAMILY SIZE
2.0
AVG HOUSEHOLD SIZE
364
LABOR FORCE [ PEOPLE ]
47.6%
PERCENT IN LABOR FORCE
Terrell County Area Codes
Income in Terrell County
Income Overview in Terrell County
Per Capita Income in Terrell County is $36,144, while median incomes of families and households are $64,141 and $52,813 respectively.
| Characteristic | Number | Measure |
| Per Capita Income | 862 | $36,144 |
| Median Family Income | 223 | $64,141 |
| Mean Family Income | 223 | $85,481 |
| Median Household Income | 436 | $52,813 |
| Mean Household Income | 436 | $66,441 |
| Income Deficit | 223 | $0 |
| Wage / Income Gap (%) | 862 | 62.19% |
| Wage / Income Gap ($) | 862 | 37.81¢ per $1 |
| Gini / Inequality Index | 862 | 0.38 |
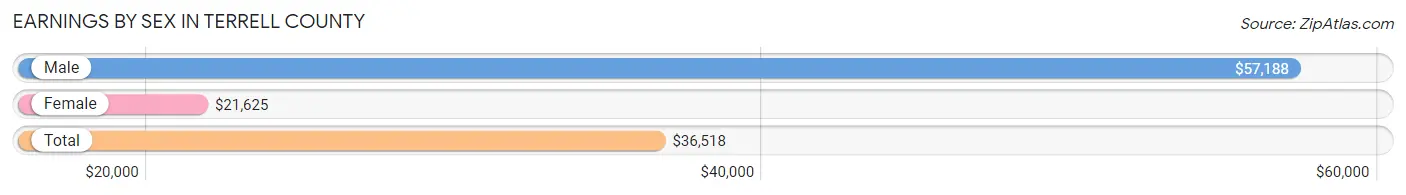
Earnings by Sex in Terrell County
Average Earnings in Terrell County are $36,518, $57,188 for men and $21,625 for women, a difference of 62.2%.
| Sex | Number | Average Earnings |
| Male | 226 (58.1%) | $57,188 |
| Female | 163 (41.9%) | $21,625 |
| Total | 389 (100.0%) | $36,518 |
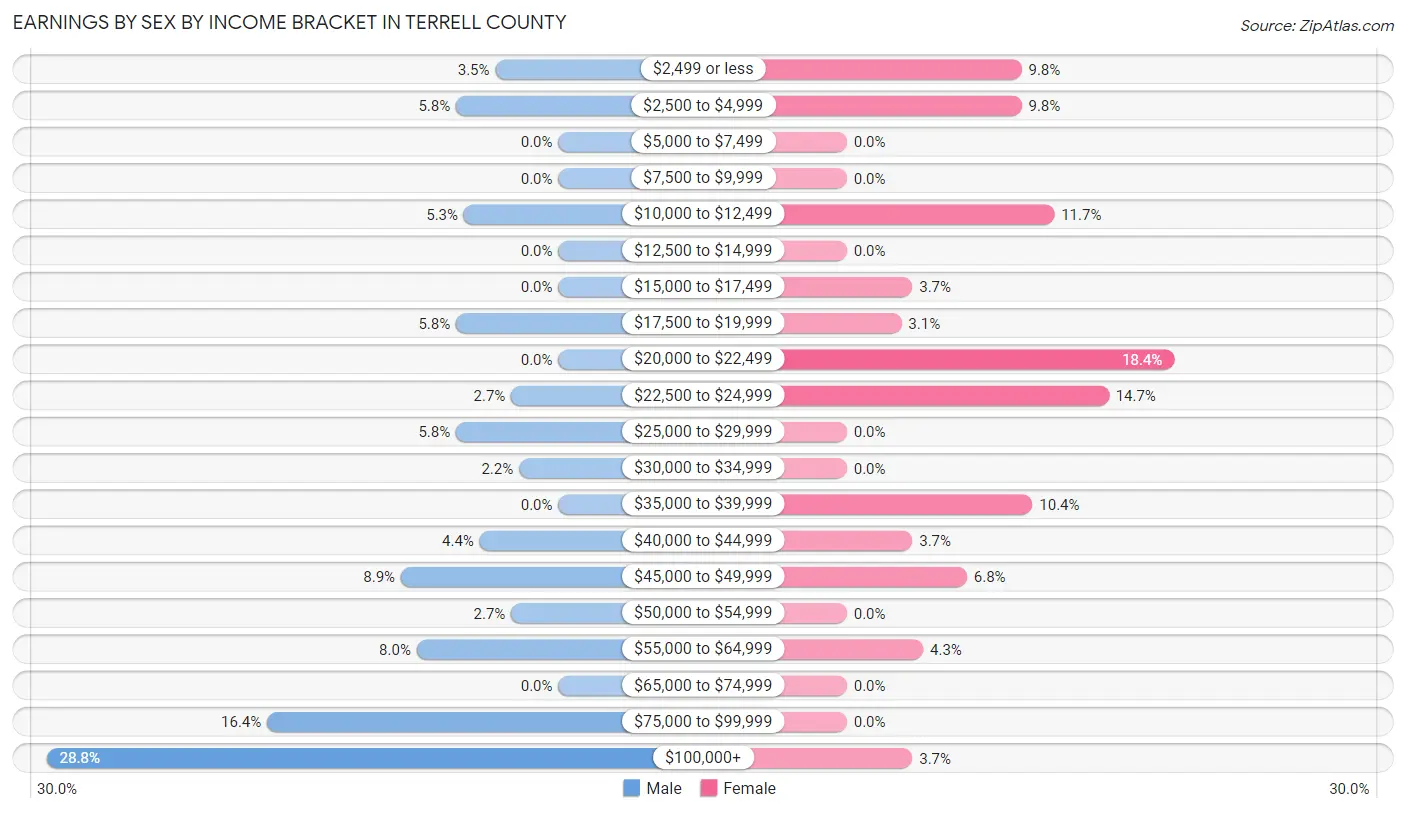
Earnings by Sex by Income Bracket in Terrell County
The most common earnings brackets in Terrell County are $100,000+ for men (65 | 28.8%) and $20,000 to $22,499 for women (30 | 18.4%).
| Income | Male | Female |
| $2,499 or less | 8 (3.5%) | 16 (9.8%) |
| $2,500 to $4,999 | 13 (5.8%) | 16 (9.8%) |
| $5,000 to $7,499 | 0 (0.0%) | 0 (0.0%) |
| $7,500 to $9,999 | 0 (0.0%) | 0 (0.0%) |
| $10,000 to $12,499 | 12 (5.3%) | 19 (11.7%) |
| $12,500 to $14,999 | 0 (0.0%) | 0 (0.0%) |
| $15,000 to $17,499 | 0 (0.0%) | 6 (3.7%) |
| $17,500 to $19,999 | 13 (5.8%) | 5 (3.1%) |
| $20,000 to $22,499 | 0 (0.0%) | 30 (18.4%) |
| $22,500 to $24,999 | 6 (2.6%) | 24 (14.7%) |
| $25,000 to $29,999 | 13 (5.8%) | 0 (0.0%) |
| $30,000 to $34,999 | 5 (2.2%) | 0 (0.0%) |
| $35,000 to $39,999 | 0 (0.0%) | 17 (10.4%) |
| $40,000 to $44,999 | 10 (4.4%) | 6 (3.7%) |
| $45,000 to $49,999 | 20 (8.8%) | 11 (6.8%) |
| $50,000 to $54,999 | 6 (2.6%) | 0 (0.0%) |
| $55,000 to $64,999 | 18 (8.0%) | 7 (4.3%) |
| $65,000 to $74,999 | 0 (0.0%) | 0 (0.0%) |
| $75,000 to $99,999 | 37 (16.4%) | 0 (0.0%) |
| $100,000+ | 65 (28.8%) | 6 (3.7%) |
| Total | 226 (100.0%) | 163 (100.0%) |
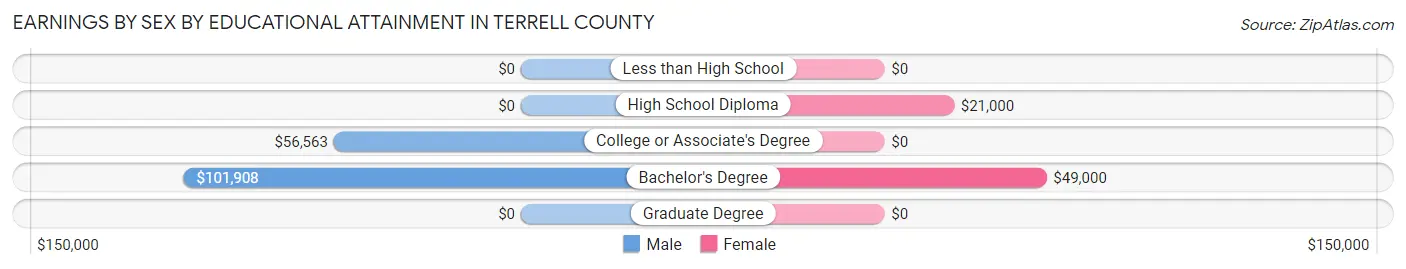
Earnings by Sex by Educational Attainment in Terrell County
Average earnings in Terrell County are $78,438 for men and $21,625 for women, a difference of 72.4%. Men with an educational attainment of bachelor's degree enjoy the highest average annual earnings of $101,908, while those with college or associate's degree education earn the least with $56,563. Women with an educational attainment of bachelor's degree earn the most with the average annual earnings of $49,000, while those with high school diploma education have the smallest earnings of $21,000.
| Educational Attainment | Male Income | Female Income |
| Less than High School | - | - |
| High School Diploma | - | - |
| College or Associate's Degree | $56,563 | $0 |
| Bachelor's Degree | $101,908 | $49,000 |
| Graduate Degree | - | - |
| Total | $78,438 | $21,625 |
Family Income in Terrell County
Family Income Brackets in Terrell County
According to the Terrell County family income data, there are 60 families falling into the $50,000 to $74,999 income range, which is the most common income bracket and makes up 26.9% of all families.
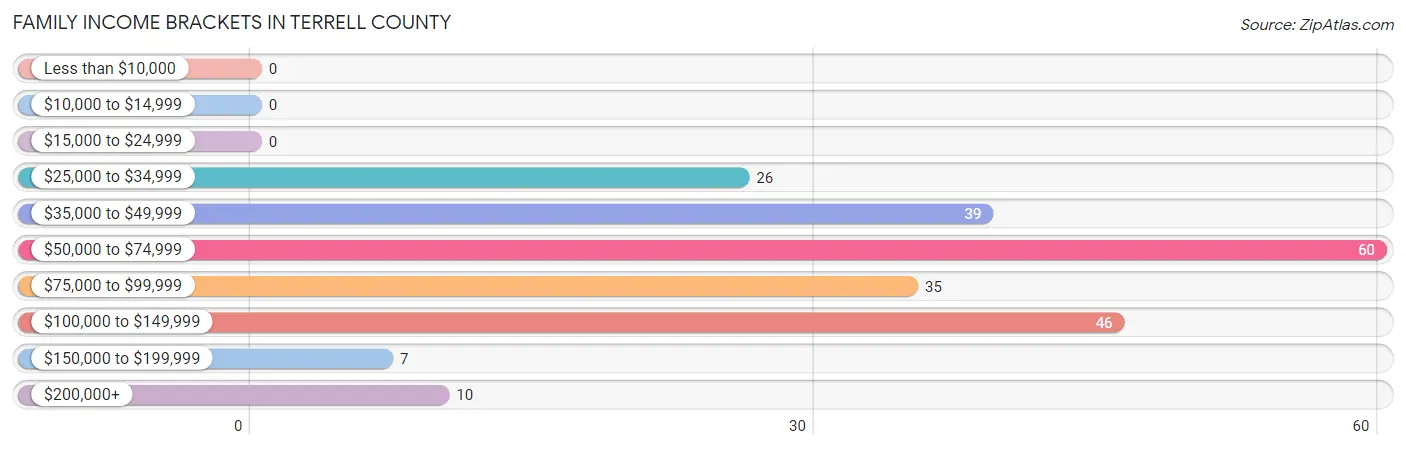
| Income Bracket | # Families | % Families |
| Less than $10,000 | 0 | 0.0% |
| $10,000 to $14,999 | 0 | 0.0% |
| $15,000 to $24,999 | 0 | 0.0% |
| $25,000 to $34,999 | 26 | 11.7% |
| $35,000 to $49,999 | 39 | 17.5% |
| $50,000 to $74,999 | 60 | 26.9% |
| $75,000 to $99,999 | 35 | 15.7% |
| $100,000 to $149,999 | 46 | 20.6% |
| $150,000 to $199,999 | 7 | 3.1% |
| $200,000+ | 10 | 4.5% |
Family Income by Famaliy Size in Terrell County
4-person families (17 | 7.6%) account for the highest median family income in Terrell County with $180,893 per family, while 4-person families (17 | 7.6%) have the highest median income of $45,223 per family member.
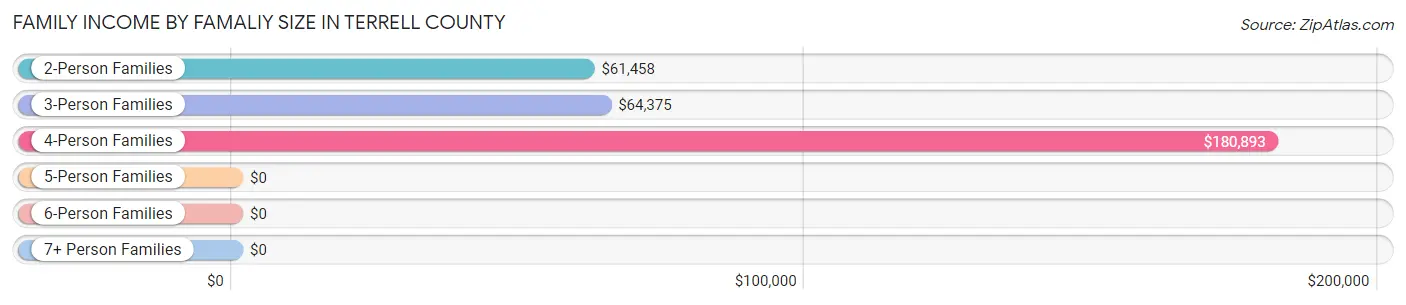
| Income Bracket | # Families | Median Income |
| 2-Person Families | 176 (78.9%) | $61,458 |
| 3-Person Families | 25 (11.2%) | $64,375 |
| 4-Person Families | 17 (7.6%) | $180,893 |
| 5-Person Families | 0 (0.0%) | $0 |
| 6-Person Families | 5 (2.2%) | $0 |
| 7+ Person Families | 0 (0.0%) | $0 |
| Total | 223 (100.0%) | $64,141 |
Family Income by Number of Earners in Terrell County
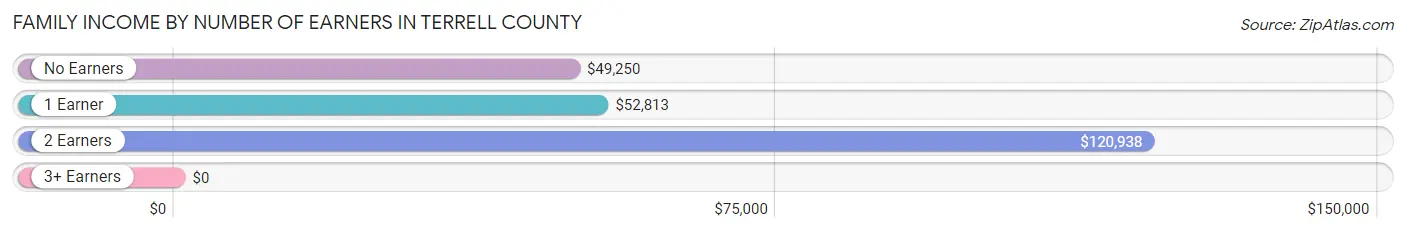
| Number of Earners | # Families | Median Income |
| No Earners | 64 (28.7%) | $49,250 |
| 1 Earner | 38 (17.0%) | $52,813 |
| 2 Earners | 104 (46.6%) | $120,938 |
| 3+ Earners | 17 (7.6%) | $0 |
| Total | 223 (100.0%) | $64,141 |
Household Income in Terrell County
Household Income Brackets in Terrell County
With 110 households falling in the category, the $35,000 to $49,999 income range is the most frequent in Terrell County, accounting for 25.2% of all households. In contrast, only 7 households (1.6%) fall into the $150,000 to $199,999 income bracket, making it the least populous group.
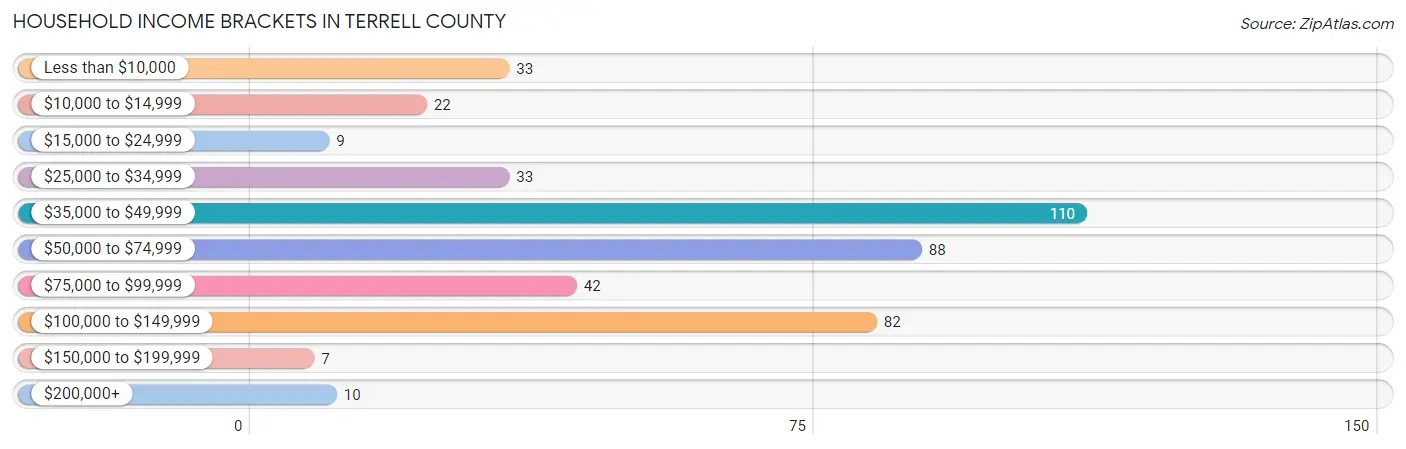
| Income Bracket | # Households | % Households |
| Less than $10,000 | 33 | 7.6% |
| $10,000 to $14,999 | 22 | 5.0% |
| $15,000 to $24,999 | 9 | 2.1% |
| $25,000 to $34,999 | 33 | 7.6% |
| $35,000 to $49,999 | 110 | 25.2% |
| $50,000 to $74,999 | 88 | 20.2% |
| $75,000 to $99,999 | 42 | 9.6% |
| $100,000 to $149,999 | 82 | 18.8% |
| $150,000 to $199,999 | 7 | 1.6% |
| $200,000+ | 10 | 2.3% |
Household Income by Householder Age in Terrell County
The median household income in Terrell County is $52,813, with the highest median household income of $78,947 found in the 45 to 64 years age bracket for the primary householder. A total of 158 households (36.2%) fall into this category.
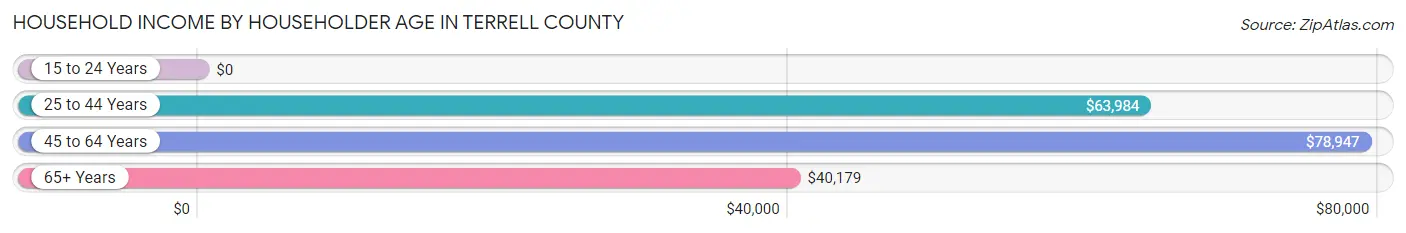
| Income Bracket | # Households | Median Income |
| 15 to 24 Years | 0 (0.0%) | $0 |
| 25 to 44 Years | 45 (10.3%) | $63,984 |
| 45 to 64 Years | 158 (36.2%) | $78,947 |
| 65+ Years | 233 (53.4%) | $40,179 |
| Total | 436 (100.0%) | $52,813 |
Poverty in Terrell County
Income Below Poverty by Sex and Age in Terrell County
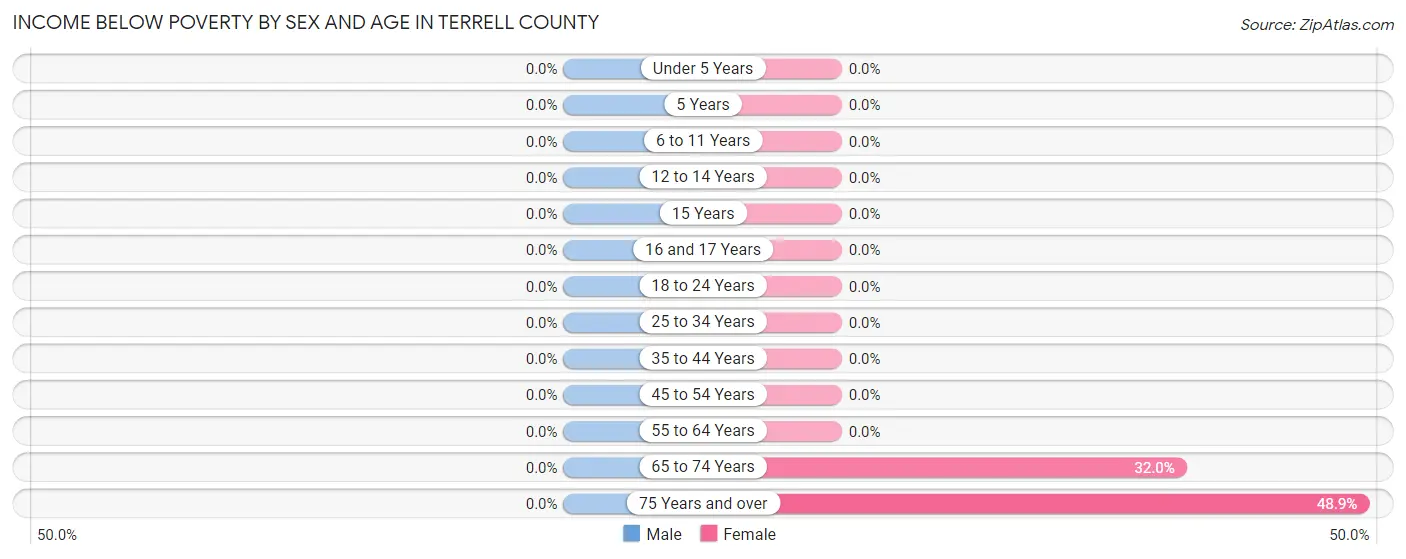
| Age Bracket | Male | Female |
| Under 5 Years | 0 (0.0%) | 0 (0.0%) |
| 5 Years | 0 (0.0%) | 0 (0.0%) |
| 6 to 11 Years | 0 (0.0%) | 0 (0.0%) |
| 12 to 14 Years | 0 (0.0%) | 0 (0.0%) |
| 15 Years | 0 (0.0%) | 0 (0.0%) |
| 16 and 17 Years | 0 (0.0%) | 0 (0.0%) |
| 18 to 24 Years | 0 (0.0%) | 0 (0.0%) |
| 25 to 34 Years | 0 (0.0%) | 0 (0.0%) |
| 35 to 44 Years | 0 (0.0%) | 0 (0.0%) |
| 45 to 54 Years | 0 (0.0%) | 0 (0.0%) |
| 55 to 64 Years | 0 (0.0%) | 0 (0.0%) |
| 65 to 74 Years | 0 (0.0%) | 32 (32.0%) |
| 75 Years and over | 0 (0.0%) | 23 (48.9%) |
| Total | 0 (0.0%) | 55 (15.2%) |
Income Above Poverty by Sex and Age in Terrell County
According to the poverty statistics in Terrell County, males aged under 5 years and females aged under 5 years are the age groups that are most secure financially, with 100.0% of males and 100.0% of females in these age groups living above the poverty line.
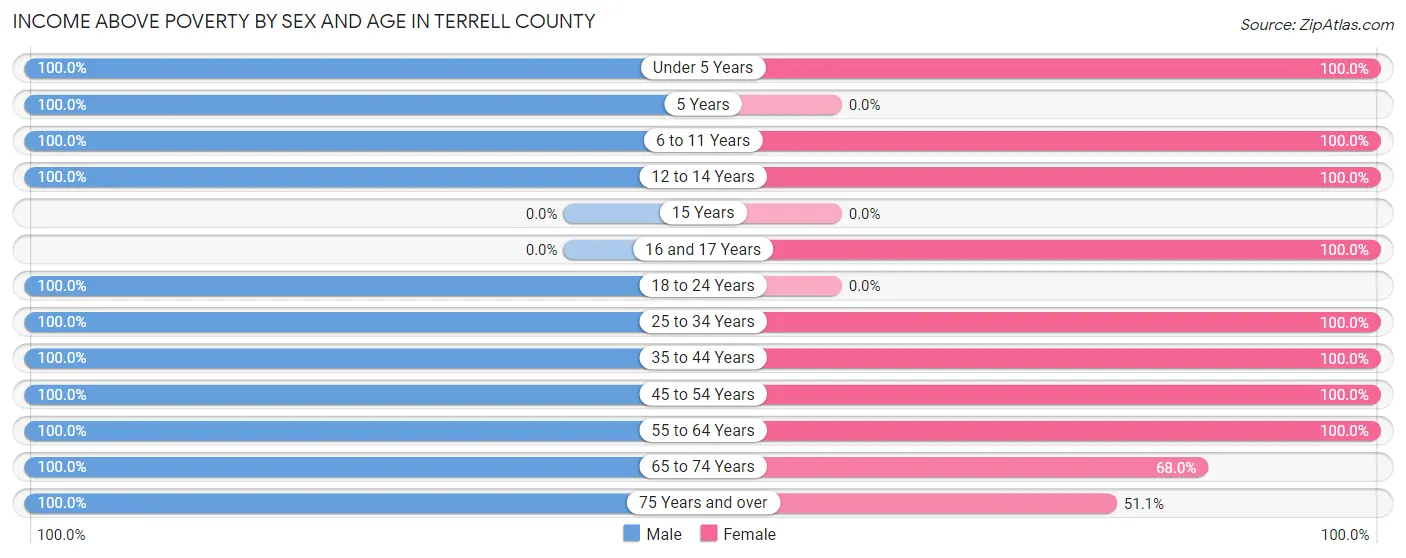
| Age Bracket | Male | Female |
| Under 5 Years | 5 (100.0%) | 6 (100.0%) |
| 5 Years | 17 (100.0%) | 0 (0.0%) |
| 6 to 11 Years | 36 (100.0%) | 25 (100.0%) |
| 12 to 14 Years | 4 (100.0%) | 5 (100.0%) |
| 15 Years | 0 (0.0%) | 0 (0.0%) |
| 16 and 17 Years | 0 (0.0%) | 10 (100.0%) |
| 18 to 24 Years | 36 (100.0%) | 0 (0.0%) |
| 25 to 34 Years | 5 (100.0%) | 5 (100.0%) |
| 35 to 44 Years | 52 (100.0%) | 18 (100.0%) |
| 45 to 54 Years | 69 (100.0%) | 80 (100.0%) |
| 55 to 64 Years | 129 (100.0%) | 65 (100.0%) |
| 65 to 74 Years | 91 (100.0%) | 68 (68.0%) |
| 75 Years and over | 57 (100.0%) | 24 (51.1%) |
| Total | 501 (100.0%) | 306 (84.8%) |
Income Below Poverty Among Married-Couple Families in Terrell County
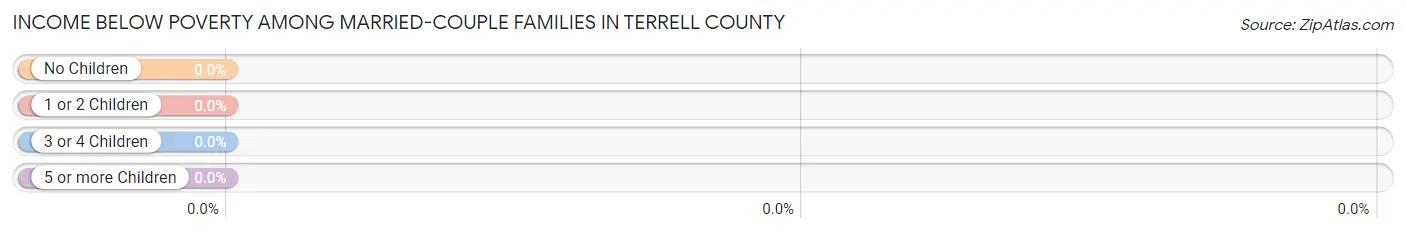
| Children | Above Poverty | Below Poverty |
| No Children | 162 (100.0%) | 0 (0.0%) |
| 1 or 2 Children | 11 (100.0%) | 0 (0.0%) |
| 3 or 4 Children | 5 (100.0%) | 0 (0.0%) |
| 5 or more Children | 0 (0.0%) | 0 (0.0%) |
| Total | 178 (100.0%) | 0 (0.0%) |
Income Below Poverty Among Single-Parent Households in Terrell County
| Children | Single Father | Single Mother |
| No Children | 0 (0.0%) | 0 (0.0%) |
| 1 or 2 Children | 0 (0.0%) | 0 (0.0%) |
| 3 or 4 Children | 0 (0.0%) | 0 (0.0%) |
| 5 or more Children | 0 (0.0%) | 0 (0.0%) |
| Total | 0 (0.0%) | 0 (0.0%) |
Income Below Poverty Among Married-Couple vs Single-Parent Households in Terrell County
| Children | Married-Couple Families | Single-Parent Households |
| No Children | 0 (0.0%) | 0 (0.0%) |
| 1 or 2 Children | 0 (0.0%) | 0 (0.0%) |
| 3 or 4 Children | 0 (0.0%) | 0 (0.0%) |
| 5 or more Children | 0 (0.0%) | 0 (0.0%) |
| Total | 0 (0.0%) | 0 (0.0%) |
Race in Terrell County
The most populous races in Terrell County are White / Caucasian (690 | 80.0%), Hispanic or Latino (405 | 47.0%), and Two or more Races (133 | 15.4%).
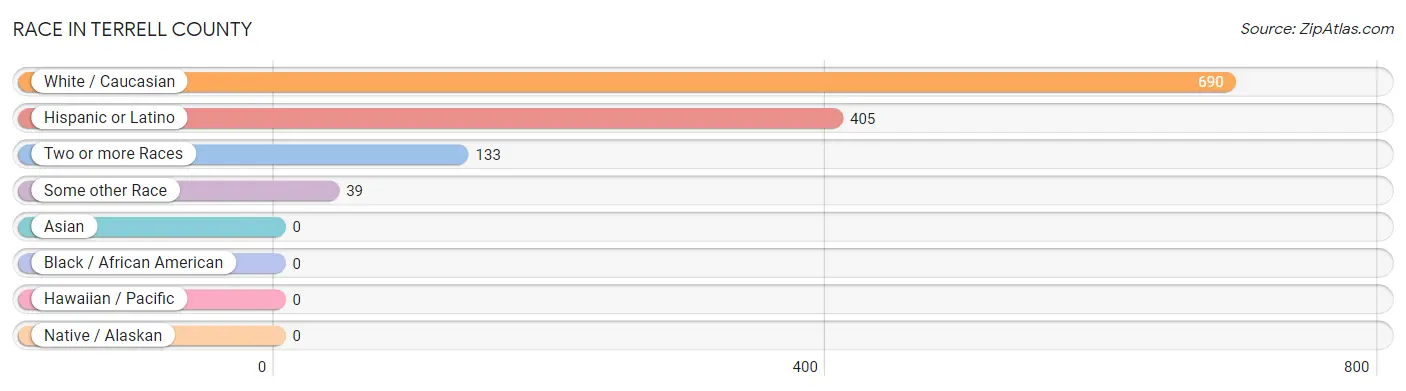
| Race | # Population | % Population |
| Asian | 0 | 0.0% |
| Black / African American | 0 | 0.0% |
| Hawaiian / Pacific | 0 | 0.0% |
| Hispanic or Latino | 405 | 47.0% |
| Native / Alaskan | 0 | 0.0% |
| White / Caucasian | 690 | 80.0% |
| Two or more Races | 133 | 15.4% |
| Some other Race | 39 | 4.5% |
| Total | 862 | 100.0% |
Ancestry in Terrell County
The most populous ancestries reported in Terrell County are Mexican (365 | 42.3%), German (122 | 14.1%), Irish (109 | 12.7%), American (71 | 8.2%), and English (52 | 6.0%), together accounting for 83.4% of all Terrell County residents.
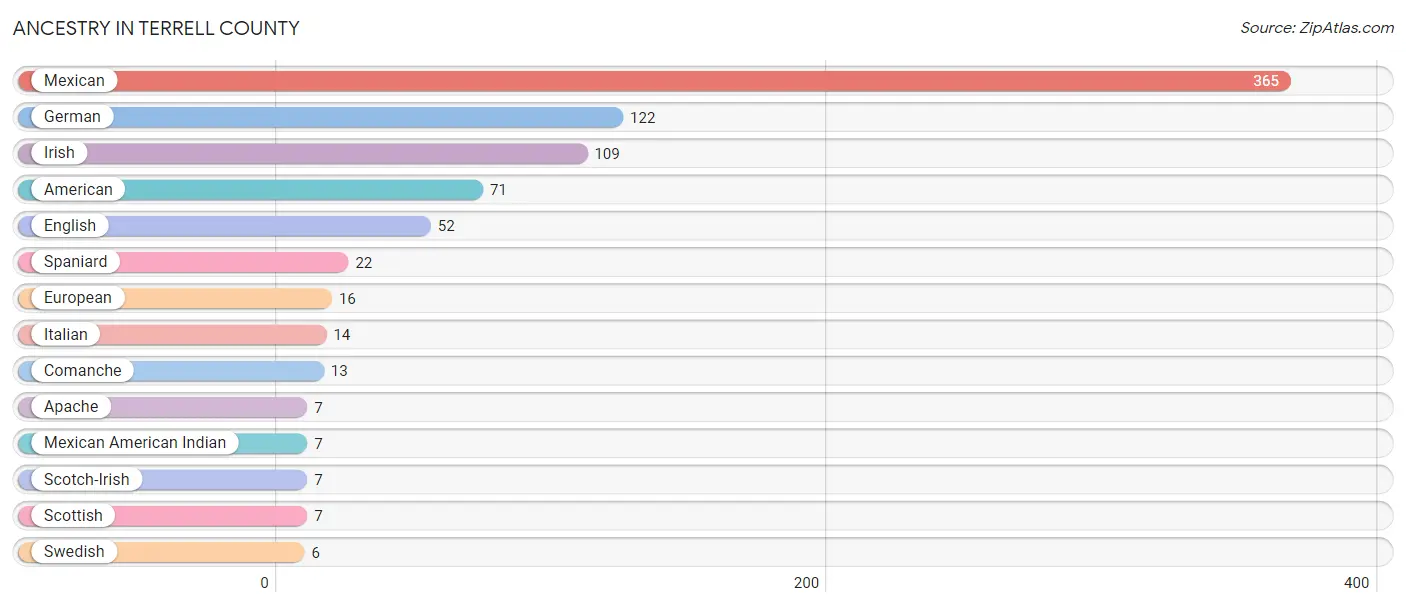
| Ancestry | # Population | % Population |
| American | 71 | 8.2% |
| Apache | 7 | 0.8% |
| Comanche | 13 | 1.5% |
| English | 52 | 6.0% |
| European | 16 | 1.9% |
| German | 122 | 14.1% |
| Irish | 109 | 12.7% |
| Italian | 14 | 1.6% |
| Mexican | 365 | 42.3% |
| Mexican American Indian | 7 | 0.8% |
| Scotch-Irish | 7 | 0.8% |
| Scottish | 7 | 0.8% |
| Spaniard | 22 | 2.5% |
| Swedish | 6 | 0.7% | View All 14 Rows |
Immigrants in Terrell County
The most numerous immigrant groups reported in Terrell County came from Central America (20 | 2.3%), Latin America (20 | 2.3%), and Mexico (20 | 2.3%), together accounting for 7.0% of all Terrell County residents.
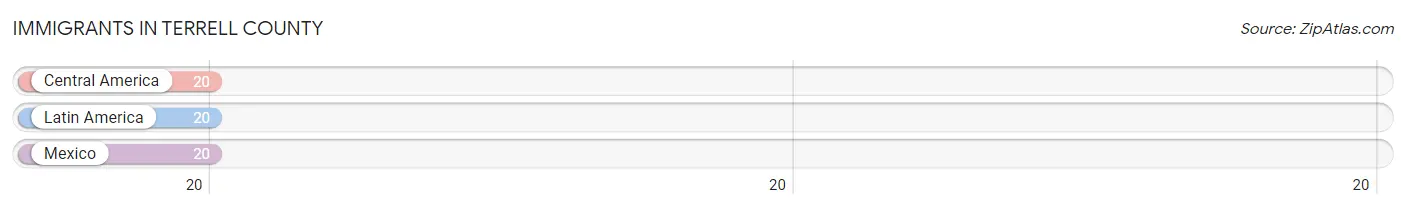
| Immigration Origin | # Population | % Population |
| Central America | 20 | 2.3% |
| Latin America | 20 | 2.3% |
| Mexico | 20 | 2.3% | View All 3 Rows |
Sex and Age in Terrell County
Sex and Age in Terrell County
The most populous age groups in Terrell County are 70 to 74 Years (77 | 15.4%) for men and 65 to 69 Years (62 | 17.2%) for women.
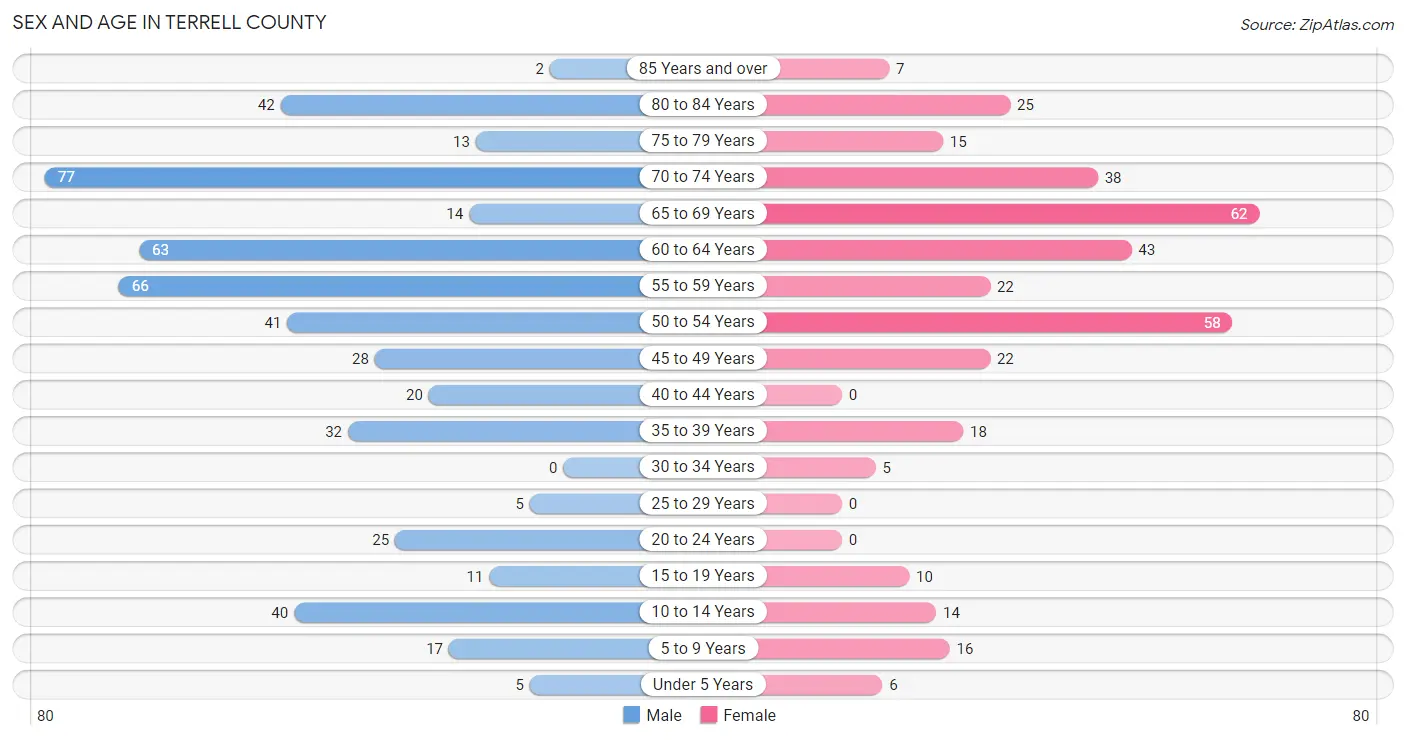
| Age Bracket | Male | Female |
| Under 5 Years | 5 (1.0%) | 6 (1.7%) |
| 5 to 9 Years | 17 (3.4%) | 16 (4.4%) |
| 10 to 14 Years | 40 (8.0%) | 14 (3.9%) |
| 15 to 19 Years | 11 (2.2%) | 10 (2.8%) |
| 20 to 24 Years | 25 (5.0%) | 0 (0.0%) |
| 25 to 29 Years | 5 (1.0%) | 0 (0.0%) |
| 30 to 34 Years | 0 (0.0%) | 5 (1.4%) |
| 35 to 39 Years | 32 (6.4%) | 18 (5.0%) |
| 40 to 44 Years | 20 (4.0%) | 0 (0.0%) |
| 45 to 49 Years | 28 (5.6%) | 22 (6.1%) |
| 50 to 54 Years | 41 (8.2%) | 58 (16.1%) |
| 55 to 59 Years | 66 (13.2%) | 22 (6.1%) |
| 60 to 64 Years | 63 (12.6%) | 43 (11.9%) |
| 65 to 69 Years | 14 (2.8%) | 62 (17.2%) |
| 70 to 74 Years | 77 (15.4%) | 38 (10.5%) |
| 75 to 79 Years | 13 (2.6%) | 15 (4.2%) |
| 80 to 84 Years | 42 (8.4%) | 25 (6.9%) |
| 85 Years and over | 2 (0.4%) | 7 (1.9%) |
| Total | 501 (100.0%) | 361 (100.0%) |
Families and Households in Terrell County
Median Family Size in Terrell County
The median family size in Terrell County is 2.91 persons per family, with single female/mother families (32 | 14.3%) accounting for the largest median family size of 4.13 persons per family. On the other hand, married-couple families (178 | 79.8%) represent the smallest median family size with 2.70 persons per family.
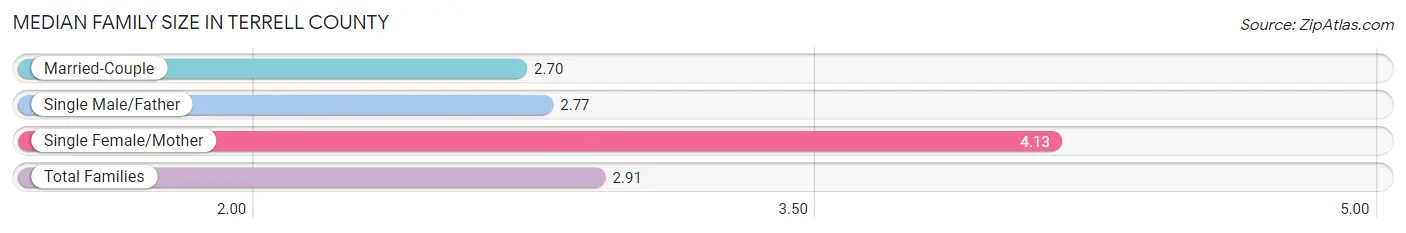
| Family Type | # Families | Family Size |
| Married-Couple | 178 (79.8%) | 2.70 |
| Single Male/Father | 13 (5.8%) | 2.77 |
| Single Female/Mother | 32 (14.3%) | 4.13 |
| Total Families | 223 (100.0%) | 2.91 |
Median Household Size in Terrell County
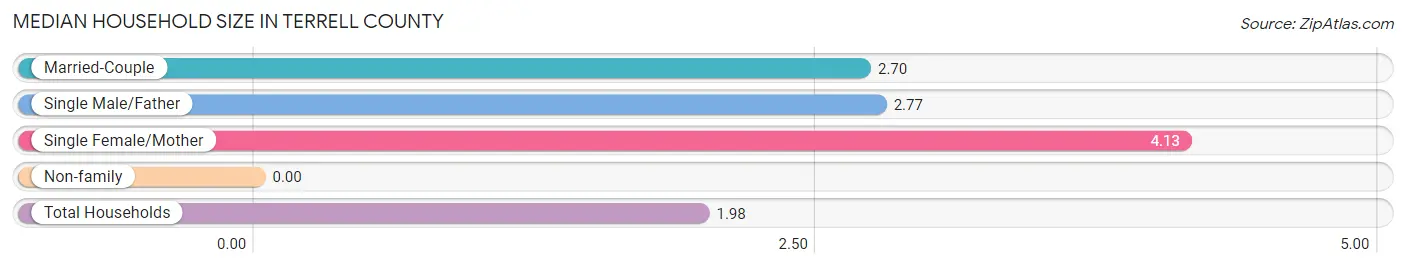
| Household Type | # Households | Household Size |
| Married-Couple | 178 (40.8%) | 2.70 |
| Single Male/Father | 13 (3.0%) | 2.77 |
| Single Female/Mother | 32 (7.3%) | 4.13 |
| Non-family | 213 (48.8%) | - |
| Total Households | 436 (100.0%) | 1.98 |
Household Size by Marriage Status in Terrell County
Out of a total of 436 households in Terrell County, 223 (51.1%) are family households, while 213 (48.8%) are nonfamily households. The most numerous type of family households are 2-person households, comprising 176, and the most common type of nonfamily households are 1-person households, comprising 213.
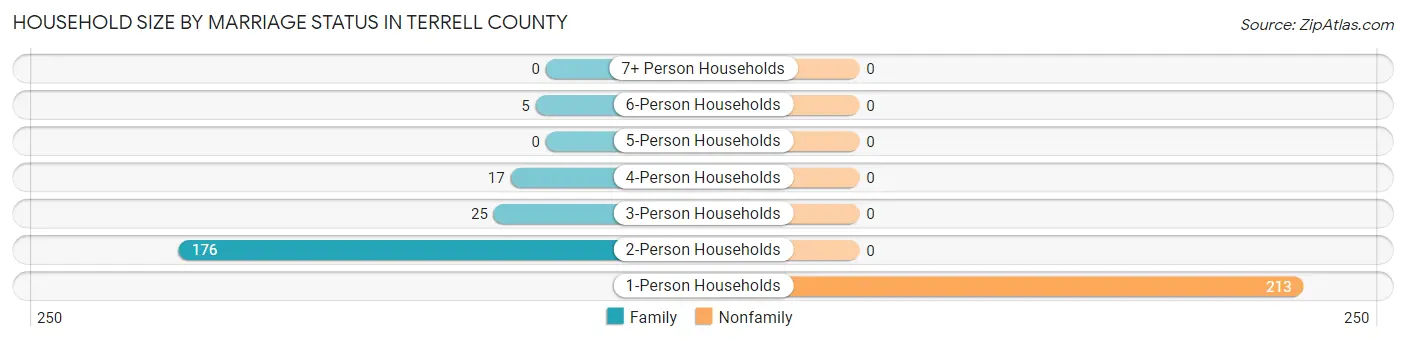
| Household Size | Family Households | Nonfamily Households |
| 1-Person Households | - | 213 (48.8%) |
| 2-Person Households | 176 (40.4%) | 0 (0.0%) |
| 3-Person Households | 25 (5.7%) | 0 (0.0%) |
| 4-Person Households | 17 (3.9%) | 0 (0.0%) |
| 5-Person Households | 0 (0.0%) | 0 (0.0%) |
| 6-Person Households | 5 (1.1%) | 0 (0.0%) |
| 7+ Person Households | 0 (0.0%) | 0 (0.0%) |
| Total | 223 (51.1%) | 213 (48.8%) |
Female Fertility in Terrell County
Fertility by Age in Terrell County
Average fertility rate in Terrell County is 91.0 births per 1,000 women. Women in the age bracket of 35 to 50 years have the highest fertility rate with 125.0 births per 1,000 women. Women in the age bracket of 35 to 50 years acount for 100.0% of all women with births.
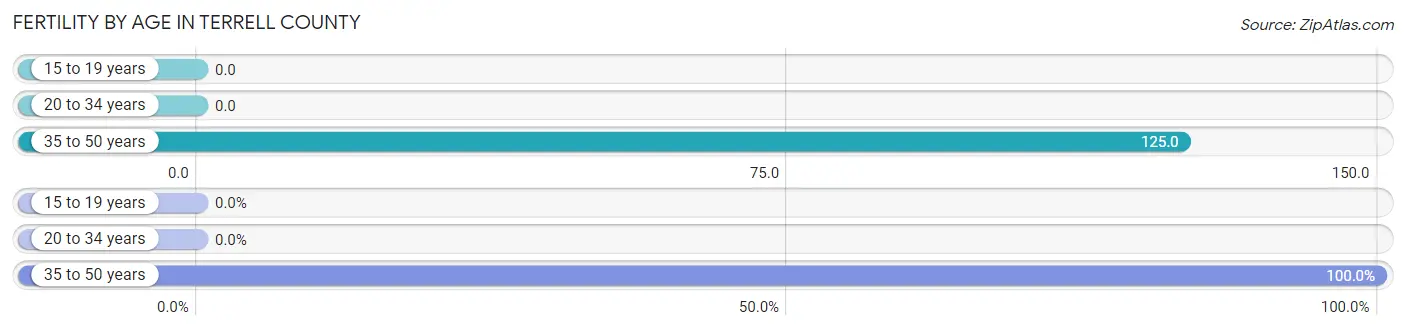
| Age Bracket | Women with Births | Births / 1,000 Women |
| 15 to 19 years | 0 (0.0%) | 0.0 |
| 20 to 34 years | 0 (0.0%) | 0.0 |
| 35 to 50 years | 5 (100.0%) | 125.0 |
| Total | 5 (100.0%) | 91.0 |
Fertility by Age by Marriage Status in Terrell County
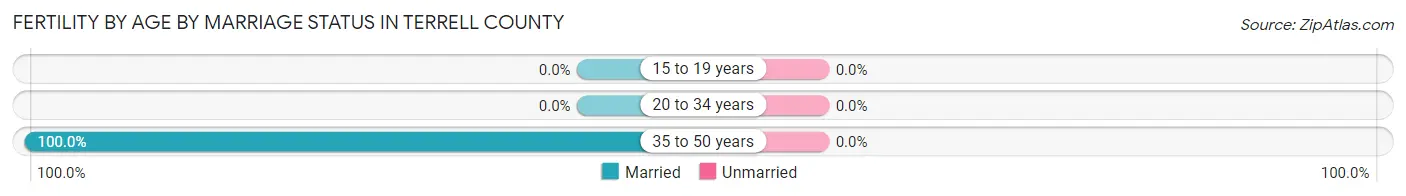
| Age Bracket | Married | Unmarried |
| 15 to 19 years | 0 (0.0%) | 0 (0.0%) |
| 20 to 34 years | 0 (0.0%) | 0 (0.0%) |
| 35 to 50 years | 5 (100.0%) | 0 (0.0%) |
| Total | 5 (100.0%) | 0 (0.0%) |
Fertility by Education in Terrell County
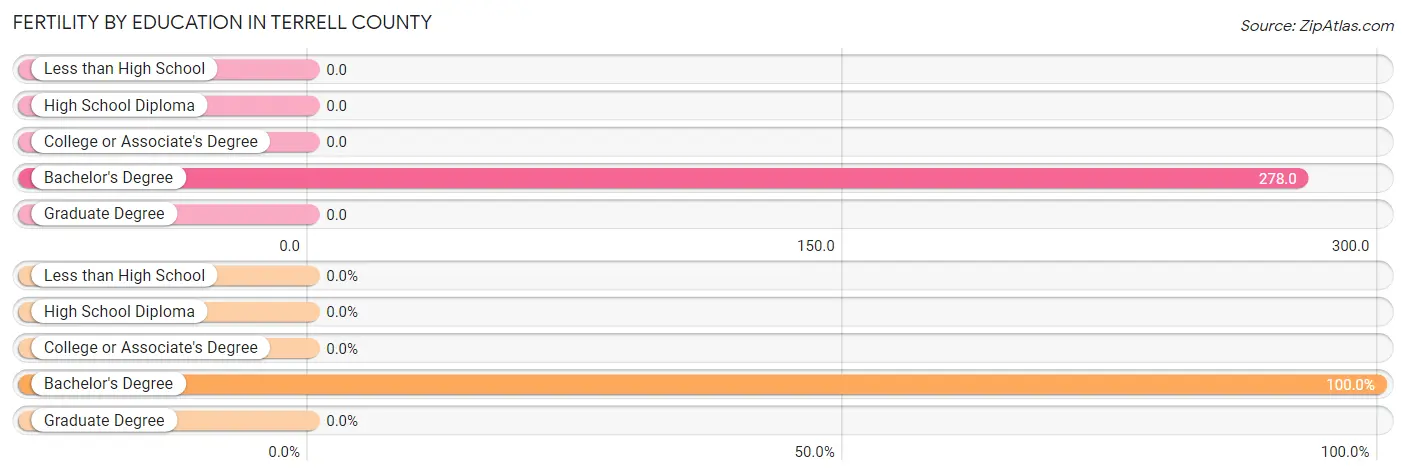
| Educational Attainment | Women with Births | Births / 1,000 Women |
| Less than High School | 0 (0.0%) | 0.0 |
| High School Diploma | 0 (0.0%) | 0.0 |
| College or Associate's Degree | 0 (0.0%) | 0.0 |
| Bachelor's Degree | 5 (100.0%) | 278.0 |
| Graduate Degree | 0 (0.0%) | 0.0 |
| Total | 5 (100.0%) | 91.0 |
Fertility by Education by Marriage Status in Terrell County
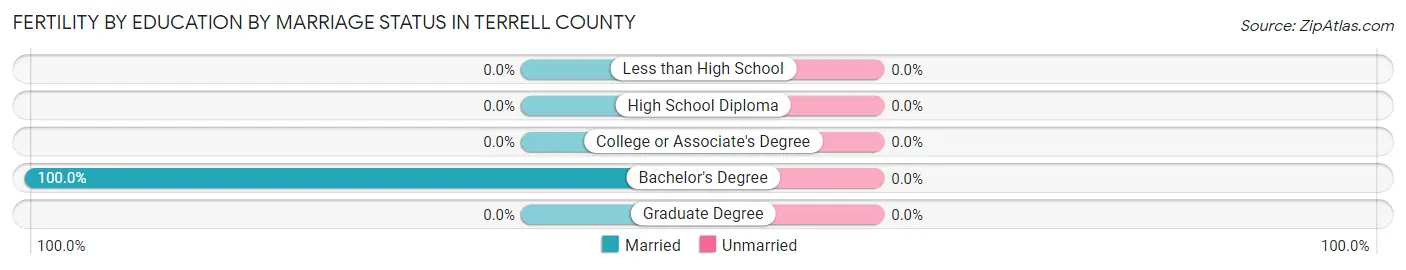
| Educational Attainment | Married | Unmarried |
| Less than High School | 0 (0.0%) | 0 (0.0%) |
| High School Diploma | 0 (0.0%) | 0 (0.0%) |
| College or Associate's Degree | 0 (0.0%) | 0 (0.0%) |
| Bachelor's Degree | 5 (100.0%) | 0 (0.0%) |
| Graduate Degree | 0 (0.0%) | 0 (0.0%) |
| Total | 5 (100.0%) | 0 (0.0%) |
Employment Characteristics in Terrell County
Employment by Class of Employer in Terrell County
Among the 364 employed individuals in Terrell County, private company employees (153 | 42.0%), local government employees (82 | 22.5%), and self-employed (not incorporated) (63 | 17.3%) make up the most common classes of employment.
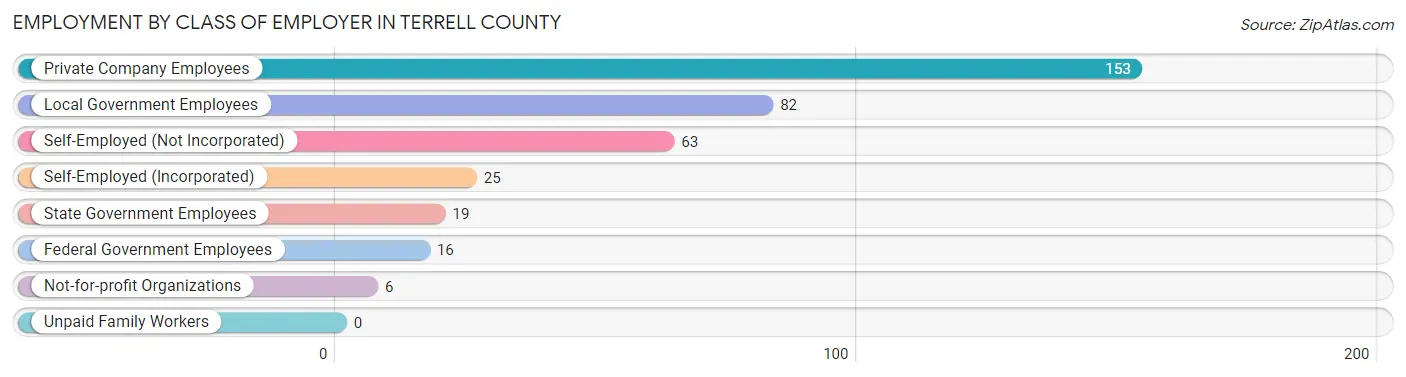
| Employer Class | # Employees | % Employees |
| Private Company Employees | 153 | 42.0% |
| Self-Employed (Incorporated) | 25 | 6.9% |
| Self-Employed (Not Incorporated) | 63 | 17.3% |
| Not-for-profit Organizations | 6 | 1.7% |
| Local Government Employees | 82 | 22.5% |
| State Government Employees | 19 | 5.2% |
| Federal Government Employees | 16 | 4.4% |
| Unpaid Family Workers | 0 | 0.0% |
| Total | 364 | 100.0% |
Employment Status by Age in Terrell County
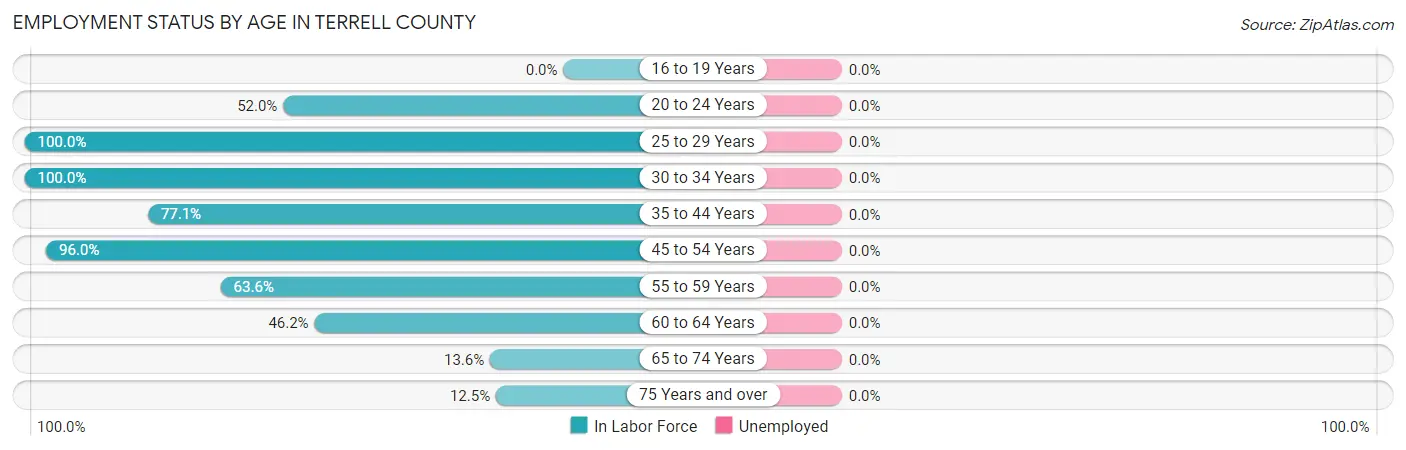
| Age Bracket | In Labor Force | Unemployed |
| 16 to 19 Years | 0 (0.0%) | 0 (0.0%) |
| 20 to 24 Years | 13 (52.0%) | 0 (0.0%) |
| 25 to 29 Years | 5 (100.0%) | 0 (0.0%) |
| 30 to 34 Years | 5 (100.0%) | 0 (0.0%) |
| 35 to 44 Years | 54 (77.1%) | 0 (0.0%) |
| 45 to 54 Years | 143 (96.0%) | 0 (0.0%) |
| 55 to 59 Years | 56 (63.6%) | 0 (0.0%) |
| 60 to 64 Years | 49 (46.2%) | 0 (0.0%) |
| 65 to 74 Years | 26 (13.6%) | 0 (0.0%) |
| 75 Years and over | 13 (12.5%) | 0 (0.0%) |
| Total | 364 (47.6%) | 0 (0.0%) |
Employment Status by Educational Attainment in Terrell County
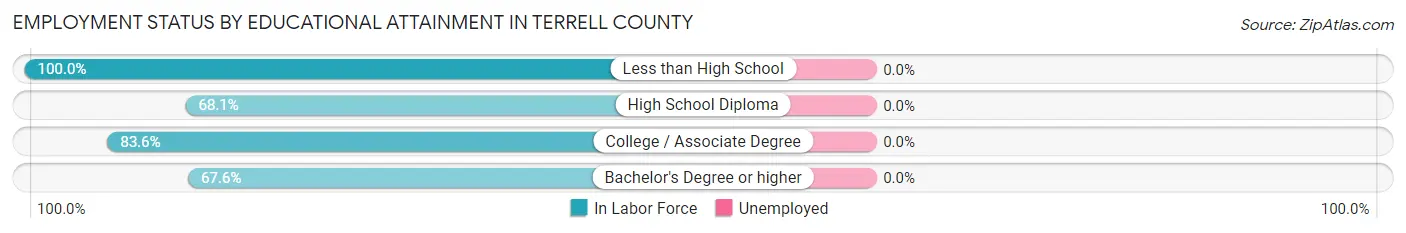
| Educational Attainment | In Labor Force | Unemployed |
| Less than High School | 23 (100.0%) | 0 (0.0%) |
| High School Diploma | 147 (68.1%) | 0 (0.0%) |
| College / Associate Degree | 92 (83.6%) | 0 (0.0%) |
| Bachelor's Degree or higher | 50 (67.6%) | 0 (0.0%) |
| Total | 312 (73.8%) | 0 (0.0%) |
Employment Occupations by Sex in Terrell County
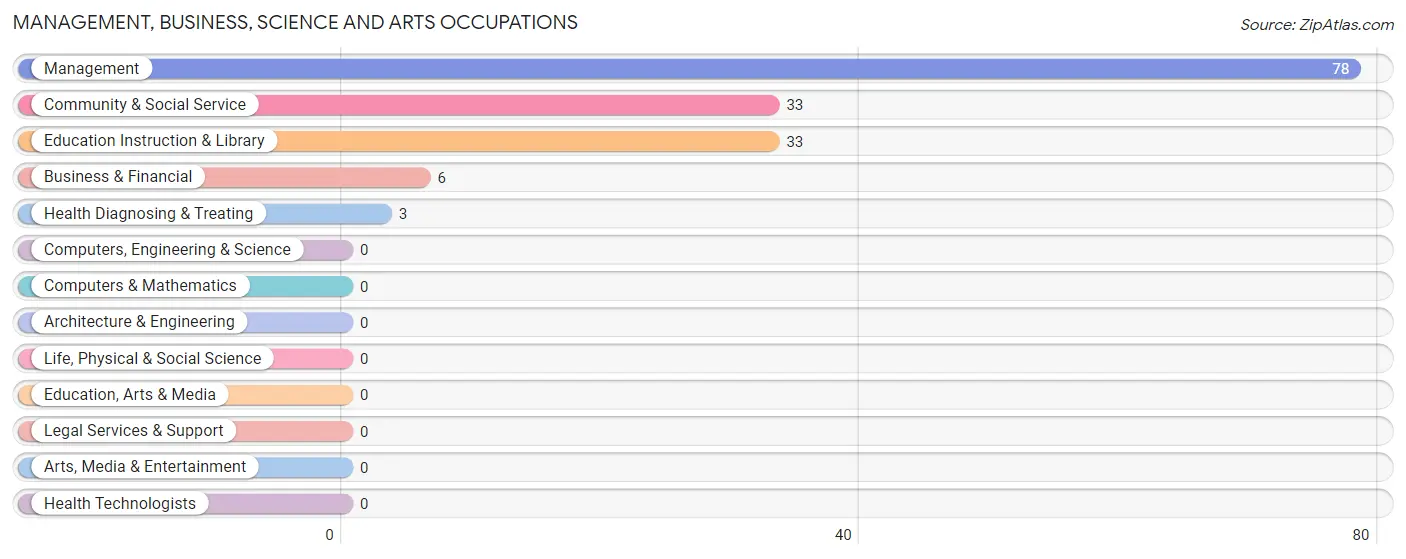
Management, Business, Science and Arts Occupations
The most common Management, Business, Science and Arts occupations in Terrell County are Management (78 | 21.4%), Community & Social Service (33 | 9.1%), Education Instruction & Library (33 | 9.1%), Business & Financial (6 | 1.7%), and Health Diagnosing & Treating (3 | 0.8%).
Management, Business, Science and Arts Occupations by Sex
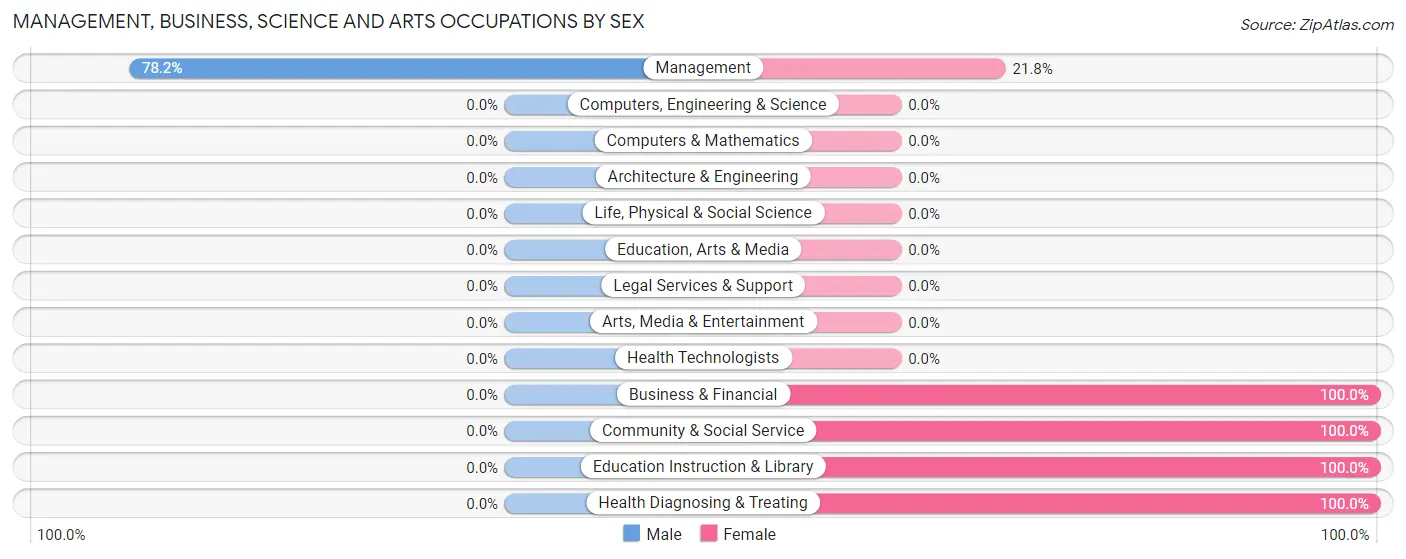
| Occupation | Male | Female |
| Management | 61 (78.2%) | 17 (21.8%) |
| Business & Financial | 0 (0.0%) | 6 (100.0%) |
| Computers, Engineering & Science | 0 (0.0%) | 0 (0.0%) |
| Computers & Mathematics | 0 (0.0%) | 0 (0.0%) |
| Architecture & Engineering | 0 (0.0%) | 0 (0.0%) |
| Life, Physical & Social Science | 0 (0.0%) | 0 (0.0%) |
| Community & Social Service | 0 (0.0%) | 33 (100.0%) |
| Education, Arts & Media | 0 (0.0%) | 0 (0.0%) |
| Legal Services & Support | 0 (0.0%) | 0 (0.0%) |
| Education Instruction & Library | 0 (0.0%) | 33 (100.0%) |
| Arts, Media & Entertainment | 0 (0.0%) | 0 (0.0%) |
| Health Diagnosing & Treating | 0 (0.0%) | 3 (100.0%) |
| Health Technologists | 0 (0.0%) | 0 (0.0%) |
| Total (Category) | 61 (50.8%) | 59 (49.2%) |
| Total (Overall) | 214 (58.8%) | 150 (41.2%) |
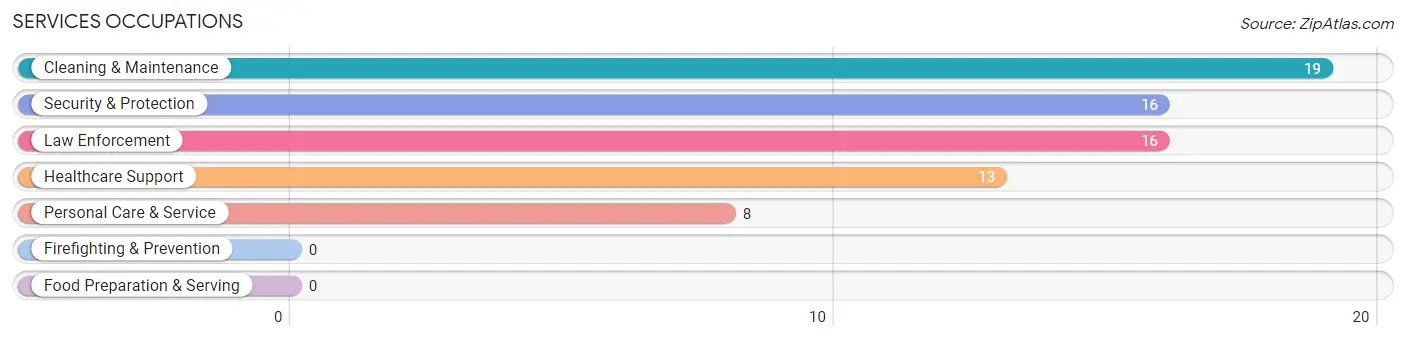
Services Occupations
The most common Services occupations in Terrell County are Cleaning & Maintenance (19 | 5.2%), Security & Protection (16 | 4.4%), Law Enforcement (16 | 4.4%), Healthcare Support (13 | 3.6%), and Personal Care & Service (8 | 2.2%).
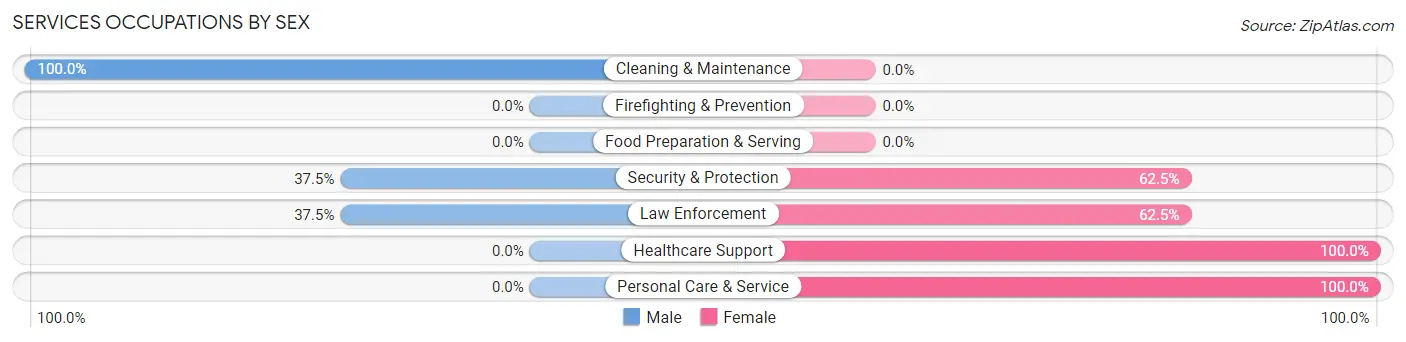
Services Occupations by Sex
Within the Services occupations in Terrell County, the most male-oriented occupations are Cleaning & Maintenance (100.0%), Security & Protection (37.5%), and Law Enforcement (37.5%), while the most female-oriented occupations are Healthcare Support (100.0%), Personal Care & Service (100.0%), and Security & Protection (62.5%).
| Occupation | Male | Female |
| Healthcare Support | 0 (0.0%) | 13 (100.0%) |
| Security & Protection | 6 (37.5%) | 10 (62.5%) |
| Firefighting & Prevention | 0 (0.0%) | 0 (0.0%) |
| Law Enforcement | 6 (37.5%) | 10 (62.5%) |
| Food Preparation & Serving | 0 (0.0%) | 0 (0.0%) |
| Cleaning & Maintenance | 19 (100.0%) | 0 (0.0%) |
| Personal Care & Service | 0 (0.0%) | 8 (100.0%) |
| Total (Category) | 25 (44.6%) | 31 (55.4%) |
| Total (Overall) | 214 (58.8%) | 150 (41.2%) |
Sales and Office Occupations
The most common Sales and Office occupations in Terrell County are Office & Administration (54 | 14.8%), and Sales & Related (10 | 2.8%).
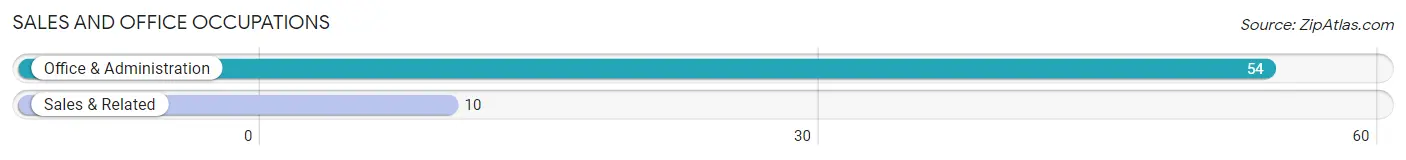
Sales and Office Occupations by Sex
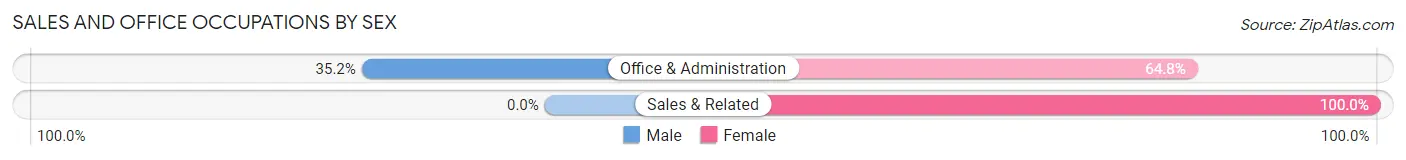
| Occupation | Male | Female |
| Sales & Related | 0 (0.0%) | 10 (100.0%) |
| Office & Administration | 19 (35.2%) | 35 (64.8%) |
| Total (Category) | 19 (29.7%) | 45 (70.3%) |
| Total (Overall) | 214 (58.8%) | 150 (41.2%) |
Natural Resources, Construction and Maintenance Occupations
The most common Natural Resources, Construction and Maintenance occupations in Terrell County are Construction & Extraction (23 | 6.3%), Installation, Maintenance & Repair (22 | 6.0%), and Farming, Fishing & Forestry (8 | 2.2%).
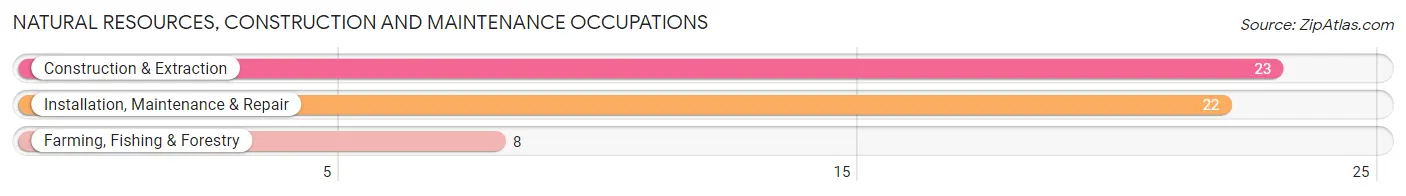
Natural Resources, Construction and Maintenance Occupations by Sex
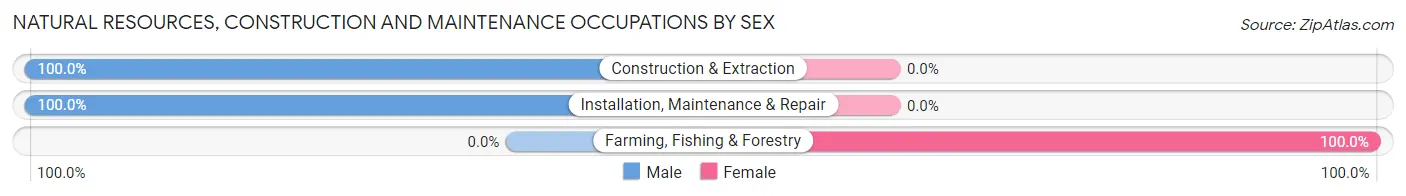
| Occupation | Male | Female |
| Farming, Fishing & Forestry | 0 (0.0%) | 8 (100.0%) |
| Construction & Extraction | 23 (100.0%) | 0 (0.0%) |
| Installation, Maintenance & Repair | 22 (100.0%) | 0 (0.0%) |
| Total (Category) | 45 (84.9%) | 8 (15.1%) |
| Total (Overall) | 214 (58.8%) | 150 (41.2%) |
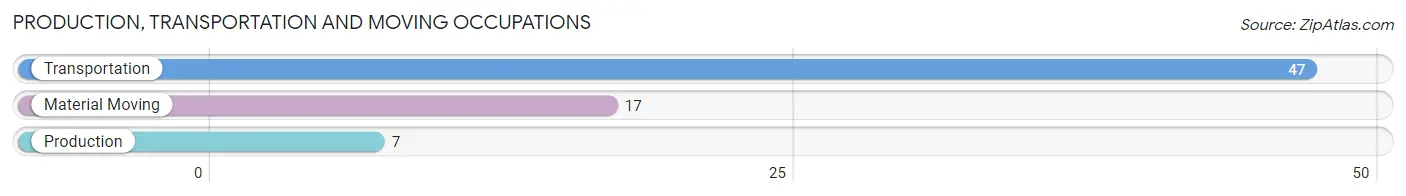
Production, Transportation and Moving Occupations
The most common Production, Transportation and Moving occupations in Terrell County are Transportation (47 | 12.9%), Material Moving (17 | 4.7%), and Production (7 | 1.9%).
Production, Transportation and Moving Occupations by Sex
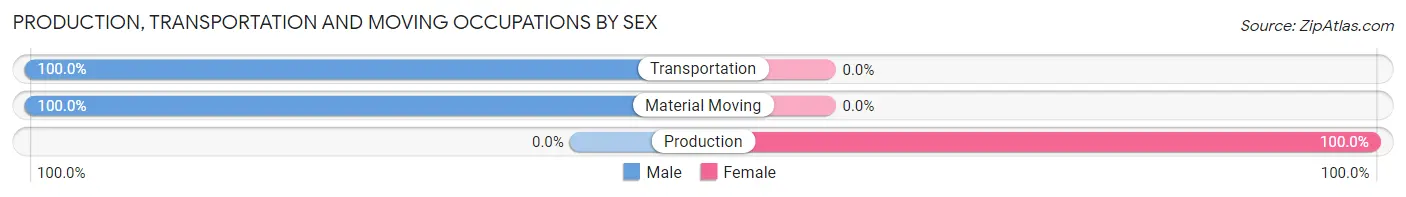
| Occupation | Male | Female |
| Production | 0 (0.0%) | 7 (100.0%) |
| Transportation | 47 (100.0%) | 0 (0.0%) |
| Material Moving | 17 (100.0%) | 0 (0.0%) |
| Total (Category) | 64 (90.1%) | 7 (9.9%) |
| Total (Overall) | 214 (58.8%) | 150 (41.2%) |
Employment Industries by Sex in Terrell County
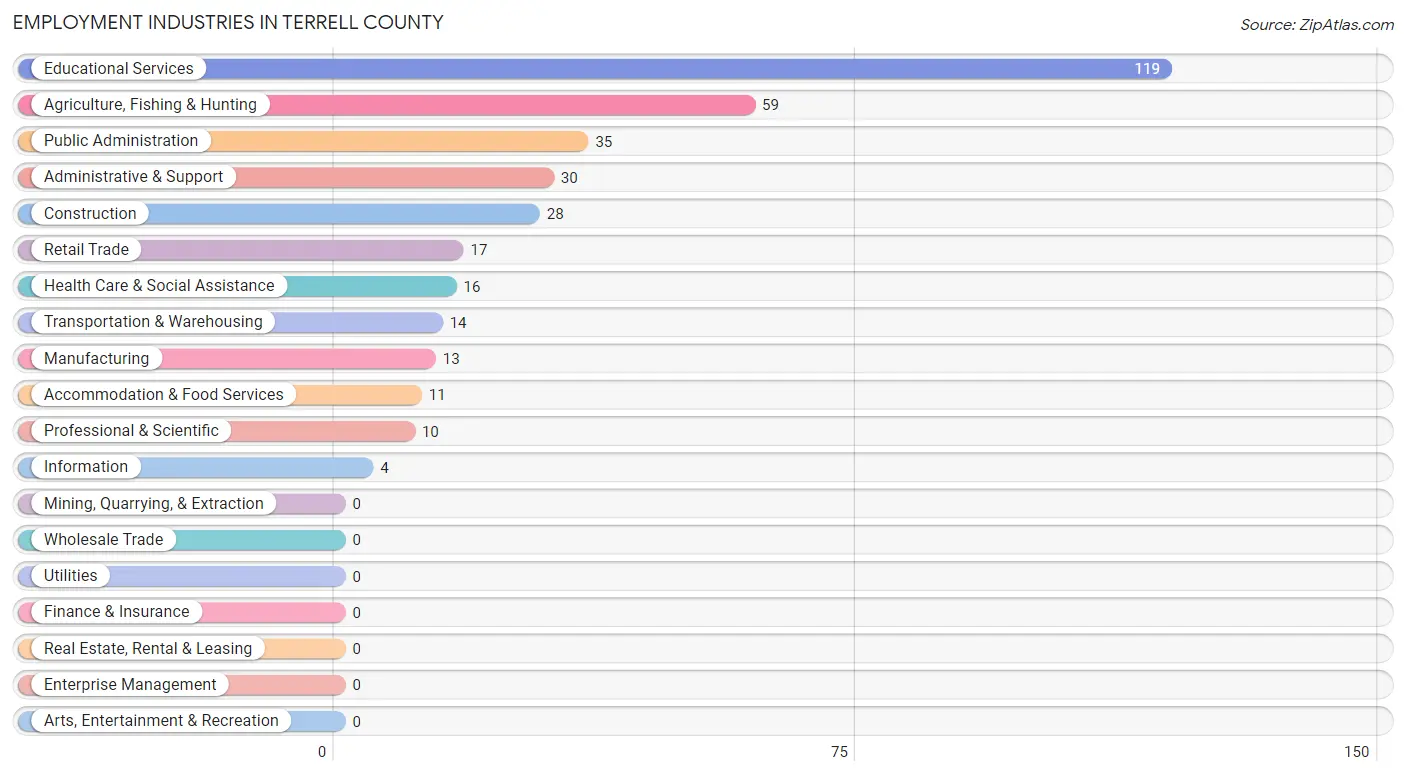
Employment Industries in Terrell County
The major employment industries in Terrell County include Educational Services (119 | 32.7%), Agriculture, Fishing & Hunting (59 | 16.2%), Public Administration (35 | 9.6%), Administrative & Support (30 | 8.2%), and Construction (28 | 7.7%).
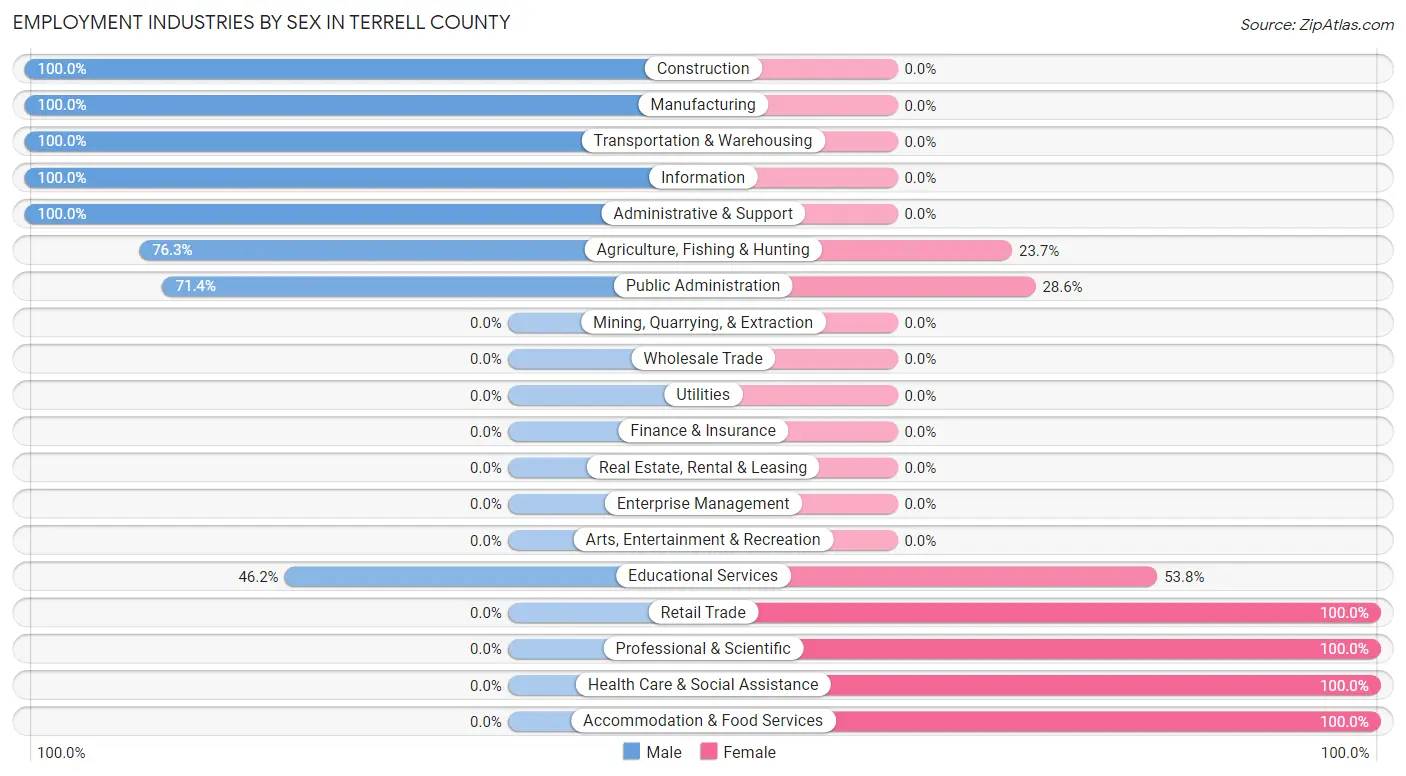
Employment Industries by Sex in Terrell County
The Terrell County industries that see more men than women are Construction (100.0%), Manufacturing (100.0%), and Transportation & Warehousing (100.0%), whereas the industries that tend to have a higher number of women are Retail Trade (100.0%), Professional & Scientific (100.0%), and Health Care & Social Assistance (100.0%).
| Industry | Male | Female |
| Agriculture, Fishing & Hunting | 45 (76.3%) | 14 (23.7%) |
| Mining, Quarrying, & Extraction | 0 (0.0%) | 0 (0.0%) |
| Construction | 28 (100.0%) | 0 (0.0%) |
| Manufacturing | 13 (100.0%) | 0 (0.0%) |
| Wholesale Trade | 0 (0.0%) | 0 (0.0%) |
| Retail Trade | 0 (0.0%) | 17 (100.0%) |
| Transportation & Warehousing | 14 (100.0%) | 0 (0.0%) |
| Utilities | 0 (0.0%) | 0 (0.0%) |
| Information | 4 (100.0%) | 0 (0.0%) |
| Finance & Insurance | 0 (0.0%) | 0 (0.0%) |
| Real Estate, Rental & Leasing | 0 (0.0%) | 0 (0.0%) |
| Professional & Scientific | 0 (0.0%) | 10 (100.0%) |
| Enterprise Management | 0 (0.0%) | 0 (0.0%) |
| Administrative & Support | 30 (100.0%) | 0 (0.0%) |
| Educational Services | 55 (46.2%) | 64 (53.8%) |
| Health Care & Social Assistance | 0 (0.0%) | 16 (100.0%) |
| Arts, Entertainment & Recreation | 0 (0.0%) | 0 (0.0%) |
| Accommodation & Food Services | 0 (0.0%) | 11 (100.0%) |
| Public Administration | 25 (71.4%) | 10 (28.6%) |
| Total | 214 (58.8%) | 150 (41.2%) |
Education in Terrell County
School Enrollment in Terrell County
The most common levels of schooling among the 97 students in Terrell County are elementary school (45 | 46.4%), middle school (25 | 25.8%), and kindergarten (17 | 17.5%).
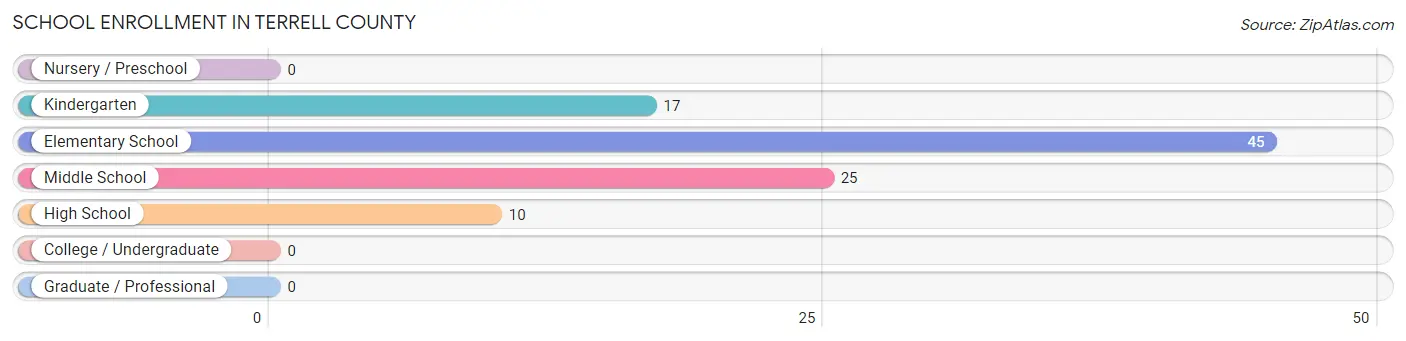
| School Level | # Students | % Students |
| Nursery / Preschool | 0 | 0.0% |
| Kindergarten | 17 | 17.5% |
| Elementary School | 45 | 46.4% |
| Middle School | 25 | 25.8% |
| High School | 10 | 10.3% |
| College / Undergraduate | 0 | 0.0% |
| Graduate / Professional | 0 | 0.0% |
| Total | 97 | 100.0% |
School Enrollment by Age by Funding Source in Terrell County
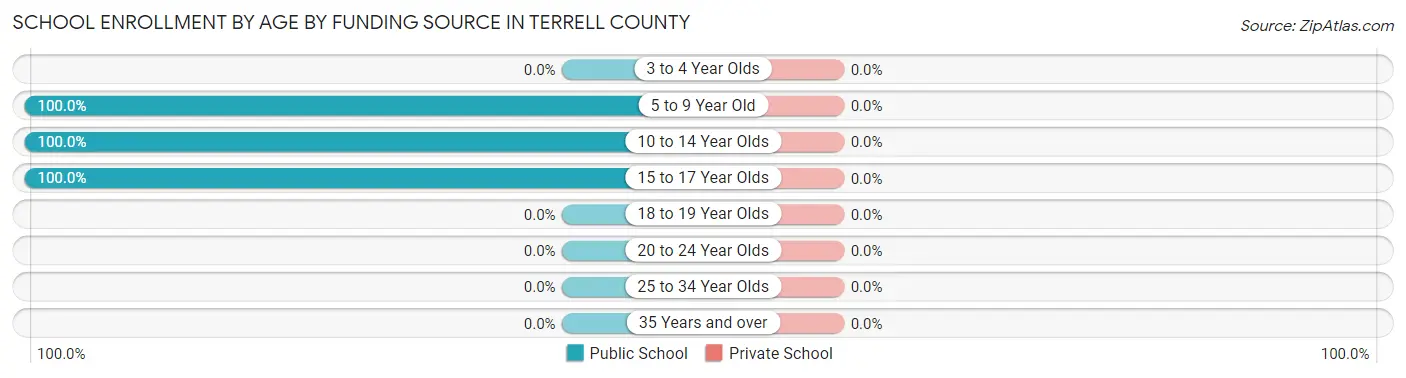
| Age Bracket | Public School | Private School |
| 3 to 4 Year Olds | 0 (0.0%) | 0 (0.0%) |
| 5 to 9 Year Old | 33 (100.0%) | 0 (0.0%) |
| 10 to 14 Year Olds | 54 (100.0%) | 0 (0.0%) |
| 15 to 17 Year Olds | 10 (100.0%) | 0 (0.0%) |
| 18 to 19 Year Olds | 0 (0.0%) | 0 (0.0%) |
| 20 to 24 Year Olds | 0 (0.0%) | 0 (0.0%) |
| 25 to 34 Year Olds | 0 (0.0%) | 0 (0.0%) |
| 35 Years and over | 0 (0.0%) | 0 (0.0%) |
| Total | 97 (100.0%) | 0 (0.0%) |
Educational Attainment by Field of Study in Terrell County
Education (65 | 29.7%), bio, nature & agricultural (42 | 19.2%), business (35 | 16.0%), arts & humanities (31 | 14.2%), and physical & health sciences (19 | 8.7%) are the most common fields of study among 219 individuals in Terrell County who have obtained a bachelor's degree or higher.
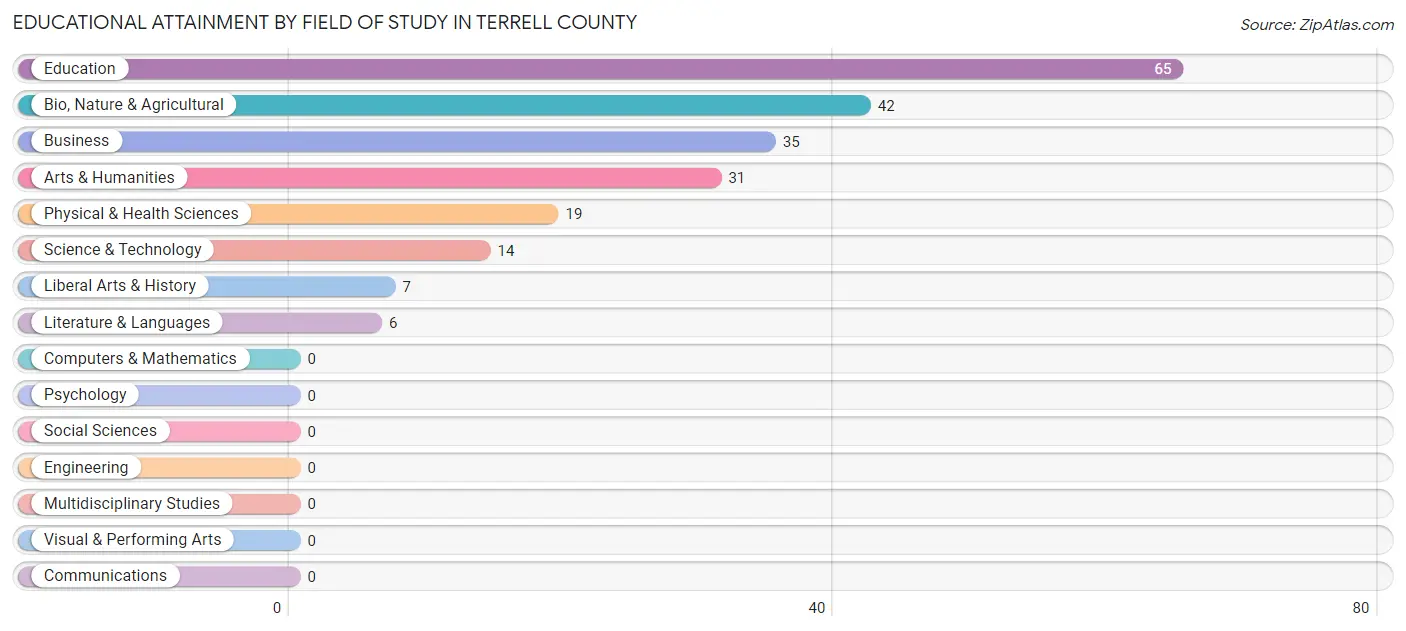
| Field of Study | # Graduates | % Graduates |
| Computers & Mathematics | 0 | 0.0% |
| Bio, Nature & Agricultural | 42 | 19.2% |
| Physical & Health Sciences | 19 | 8.7% |
| Psychology | 0 | 0.0% |
| Social Sciences | 0 | 0.0% |
| Engineering | 0 | 0.0% |
| Multidisciplinary Studies | 0 | 0.0% |
| Science & Technology | 14 | 6.4% |
| Business | 35 | 16.0% |
| Education | 65 | 29.7% |
| Literature & Languages | 6 | 2.7% |
| Liberal Arts & History | 7 | 3.2% |
| Visual & Performing Arts | 0 | 0.0% |
| Communications | 0 | 0.0% |
| Arts & Humanities | 31 | 14.2% |
| Total | 219 | 100.0% |
Transportation & Commute in Terrell County
Vehicle Availability by Sex in Terrell County
The most prevalent vehicle ownership categories in Terrell County are males with 3 vehicles (94, accounting for 43.9%) and females with 3 vehicles (60, making up 62.7%).
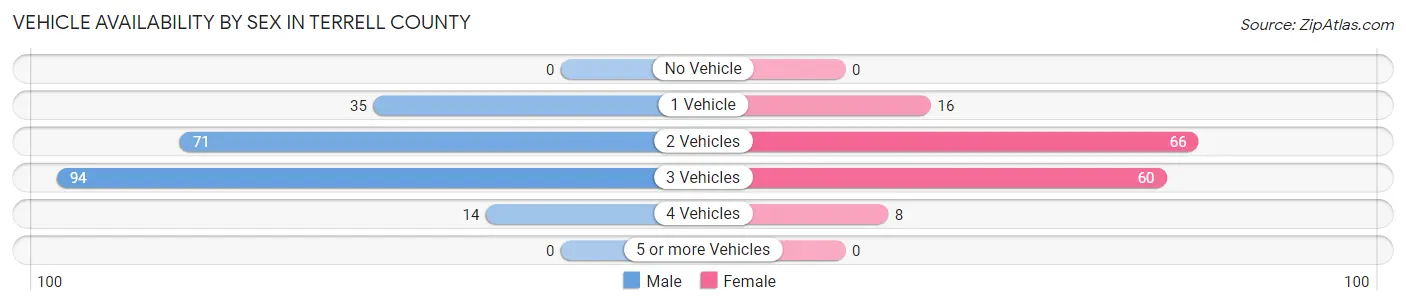
| Vehicles Available | Male | Female |
| No Vehicle | 0 (0.0%) | 0 (0.0%) |
| 1 Vehicle | 35 (16.4%) | 16 (10.7%) |
| 2 Vehicles | 71 (33.2%) | 66 (44.0%) |
| 3 Vehicles | 94 (43.9%) | 60 (40.0%) |
| 4 Vehicles | 14 (6.5%) | 8 (5.3%) |
| 5 or more Vehicles | 0 (0.0%) | 0 (0.0%) |
| Total | 214 (100.0%) | 150 (100.0%) |
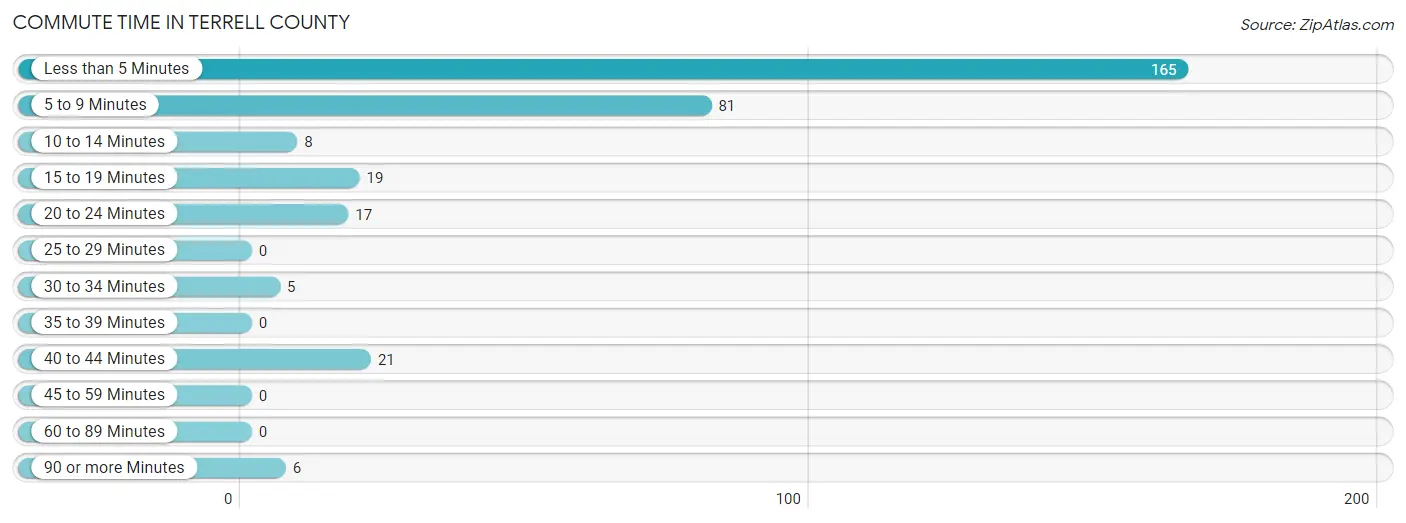
Commute Time in Terrell County
The most frequently occuring commute durations in Terrell County are less than 5 minutes (165 commuters, 51.2%), 5 to 9 minutes (81 commuters, 25.2%), and 40 to 44 minutes (21 commuters, 6.5%).
| Commute Time | # Commuters | % Commuters |
| Less than 5 Minutes | 165 | 51.2% |
| 5 to 9 Minutes | 81 | 25.2% |
| 10 to 14 Minutes | 8 | 2.5% |
| 15 to 19 Minutes | 19 | 5.9% |
| 20 to 24 Minutes | 17 | 5.3% |
| 25 to 29 Minutes | 0 | 0.0% |
| 30 to 34 Minutes | 5 | 1.5% |
| 35 to 39 Minutes | 0 | 0.0% |
| 40 to 44 Minutes | 21 | 6.5% |
| 45 to 59 Minutes | 0 | 0.0% |
| 60 to 89 Minutes | 0 | 0.0% |
| 90 or more Minutes | 6 | 1.9% |
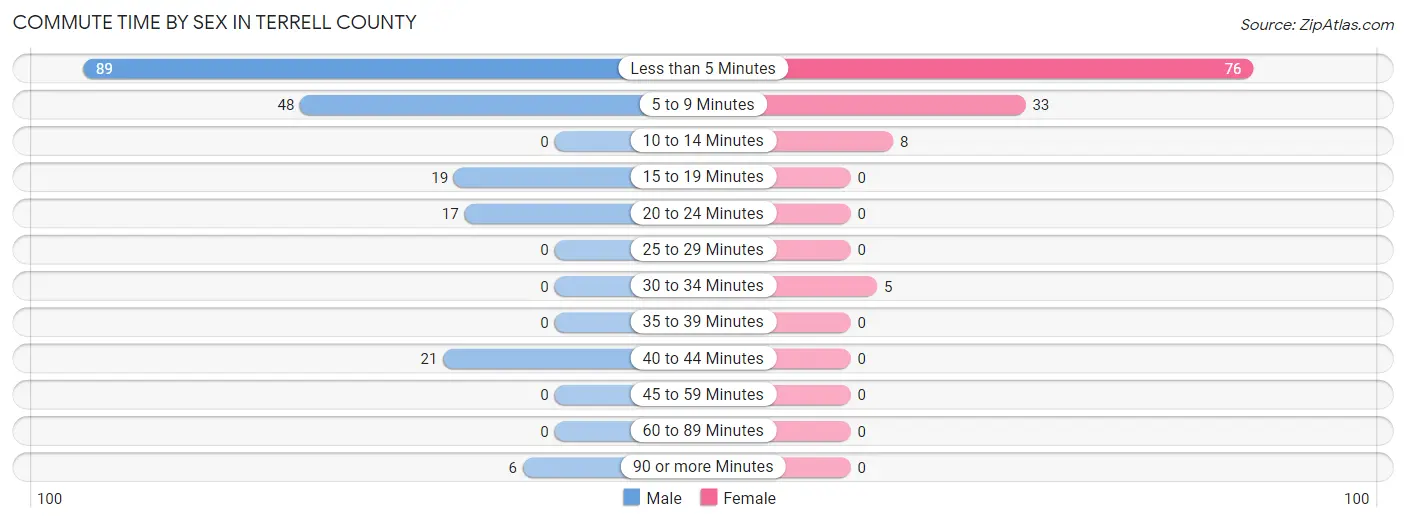
Commute Time by Sex in Terrell County
The most common commute times in Terrell County are less than 5 minutes (89 commuters, 44.5%) for males and less than 5 minutes (76 commuters, 62.3%) for females.
| Commute Time | Male | Female |
| Less than 5 Minutes | 89 (44.5%) | 76 (62.3%) |
| 5 to 9 Minutes | 48 (24.0%) | 33 (27.1%) |
| 10 to 14 Minutes | 0 (0.0%) | 8 (6.6%) |
| 15 to 19 Minutes | 19 (9.5%) | 0 (0.0%) |
| 20 to 24 Minutes | 17 (8.5%) | 0 (0.0%) |
| 25 to 29 Minutes | 0 (0.0%) | 0 (0.0%) |
| 30 to 34 Minutes | 0 (0.0%) | 5 (4.1%) |
| 35 to 39 Minutes | 0 (0.0%) | 0 (0.0%) |
| 40 to 44 Minutes | 21 (10.5%) | 0 (0.0%) |
| 45 to 59 Minutes | 0 (0.0%) | 0 (0.0%) |
| 60 to 89 Minutes | 0 (0.0%) | 0 (0.0%) |
| 90 or more Minutes | 6 (3.0%) | 0 (0.0%) |
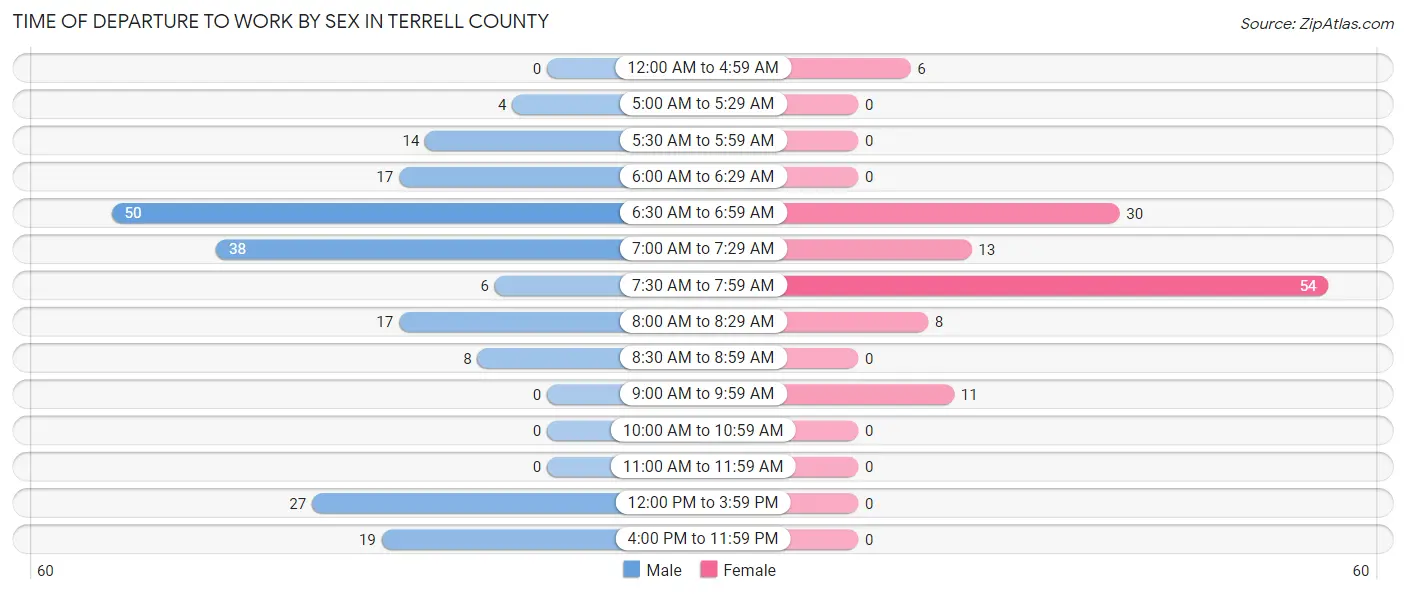
Time of Departure to Work by Sex in Terrell County
The most frequent times of departure to work in Terrell County are 6:30 AM to 6:59 AM (50, 25.0%) for males and 7:30 AM to 7:59 AM (54, 44.3%) for females.
| Time of Departure | Male | Female |
| 12:00 AM to 4:59 AM | 0 (0.0%) | 6 (4.9%) |
| 5:00 AM to 5:29 AM | 4 (2.0%) | 0 (0.0%) |
| 5:30 AM to 5:59 AM | 14 (7.0%) | 0 (0.0%) |
| 6:00 AM to 6:29 AM | 17 (8.5%) | 0 (0.0%) |
| 6:30 AM to 6:59 AM | 50 (25.0%) | 30 (24.6%) |
| 7:00 AM to 7:29 AM | 38 (19.0%) | 13 (10.7%) |
| 7:30 AM to 7:59 AM | 6 (3.0%) | 54 (44.3%) |
| 8:00 AM to 8:29 AM | 17 (8.5%) | 8 (6.6%) |
| 8:30 AM to 8:59 AM | 8 (4.0%) | 0 (0.0%) |
| 9:00 AM to 9:59 AM | 0 (0.0%) | 11 (9.0%) |
| 10:00 AM to 10:59 AM | 0 (0.0%) | 0 (0.0%) |
| 11:00 AM to 11:59 AM | 0 (0.0%) | 0 (0.0%) |
| 12:00 PM to 3:59 PM | 27 (13.5%) | 0 (0.0%) |
| 4:00 PM to 11:59 PM | 19 (9.5%) | 0 (0.0%) |
| Total | 200 (100.0%) | 122 (100.0%) |
Housing Occupancy in Terrell County
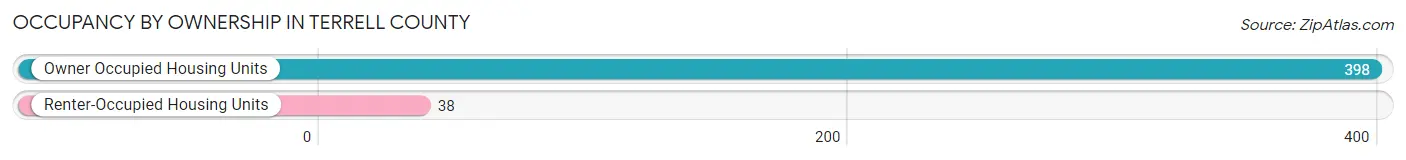
Occupancy by Ownership in Terrell County
Of the total 436 dwellings in Terrell County, owner-occupied units account for 398 (91.3%), while renter-occupied units make up 38 (8.7%).
| Occupancy | # Housing Units | % Housing Units |
| Owner Occupied Housing Units | 398 | 91.3% |
| Renter-Occupied Housing Units | 38 | 8.7% |
| Total Occupied Housing Units | 436 | 100.0% |
Occupancy by Household Size in Terrell County
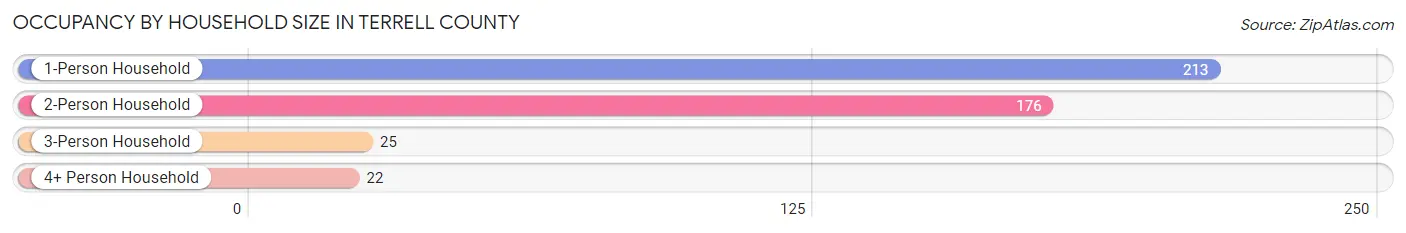
| Household Size | # Housing Units | % Housing Units |
| 1-Person Household | 213 | 48.8% |
| 2-Person Household | 176 | 40.4% |
| 3-Person Household | 25 | 5.7% |
| 4+ Person Household | 22 | 5.1% |
| Total Housing Units | 436 | 100.0% |
Occupancy by Ownership by Household Size in Terrell County
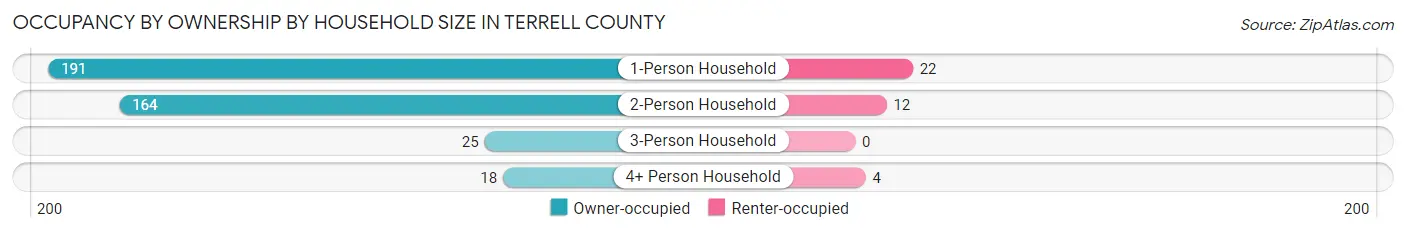
| Household Size | Owner-occupied | Renter-occupied |
| 1-Person Household | 191 (89.7%) | 22 (10.3%) |
| 2-Person Household | 164 (93.2%) | 12 (6.8%) |
| 3-Person Household | 25 (100.0%) | 0 (0.0%) |
| 4+ Person Household | 18 (81.8%) | 4 (18.2%) |
| Total Housing Units | 398 (91.3%) | 38 (8.7%) |
Occupancy by Educational Attainment in Terrell County
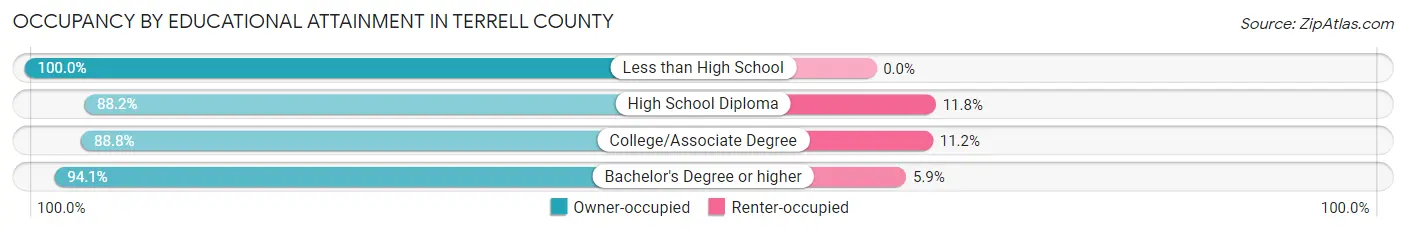
| Household Size | Owner-occupied | Renter-occupied |
| Less than High School | 25 (100.0%) | 0 (0.0%) |
| High School Diploma | 127 (88.2%) | 17 (11.8%) |
| College/Associate Degree | 87 (88.8%) | 11 (11.2%) |
| Bachelor's Degree or higher | 159 (94.1%) | 10 (5.9%) |
Occupancy by Age of Householder in Terrell County
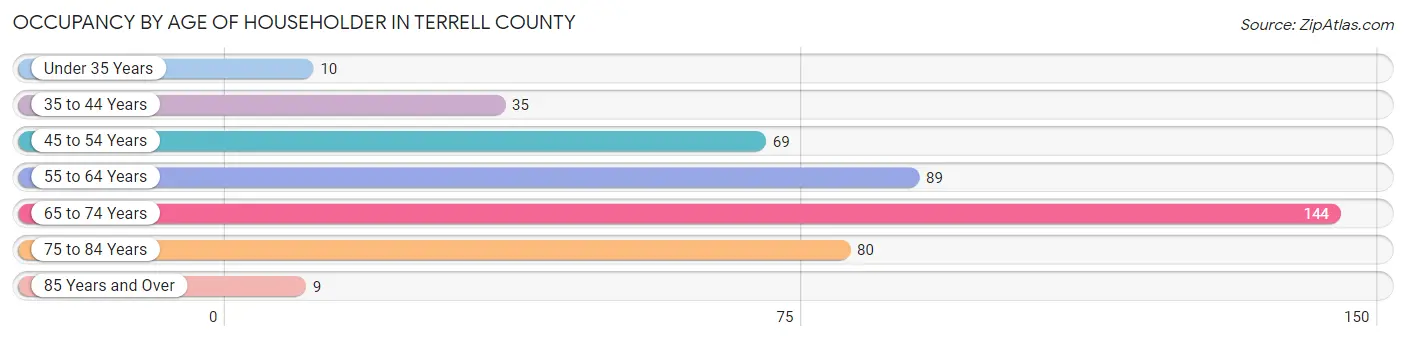
| Age Bracket | # Households | % Households |
| Under 35 Years | 10 | 2.3% |
| 35 to 44 Years | 35 | 8.0% |
| 45 to 54 Years | 69 | 15.8% |
| 55 to 64 Years | 89 | 20.4% |
| 65 to 74 Years | 144 | 33.0% |
| 75 to 84 Years | 80 | 18.3% |
| 85 Years and Over | 9 | 2.1% |
| Total | 436 | 100.0% |
Housing Finances in Terrell County
Median Income by Occupancy in Terrell County
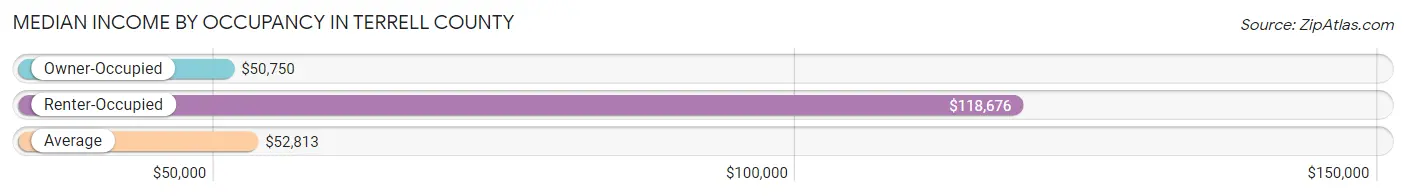
| Occupancy Type | # Households | Median Income |
| Owner-Occupied | 398 (91.3%) | $50,750 |
| Renter-Occupied | 38 (8.7%) | $118,676 |
| Average | 436 (100.0%) | $52,813 |
Occupancy by Householder Income Bracket in Terrell County
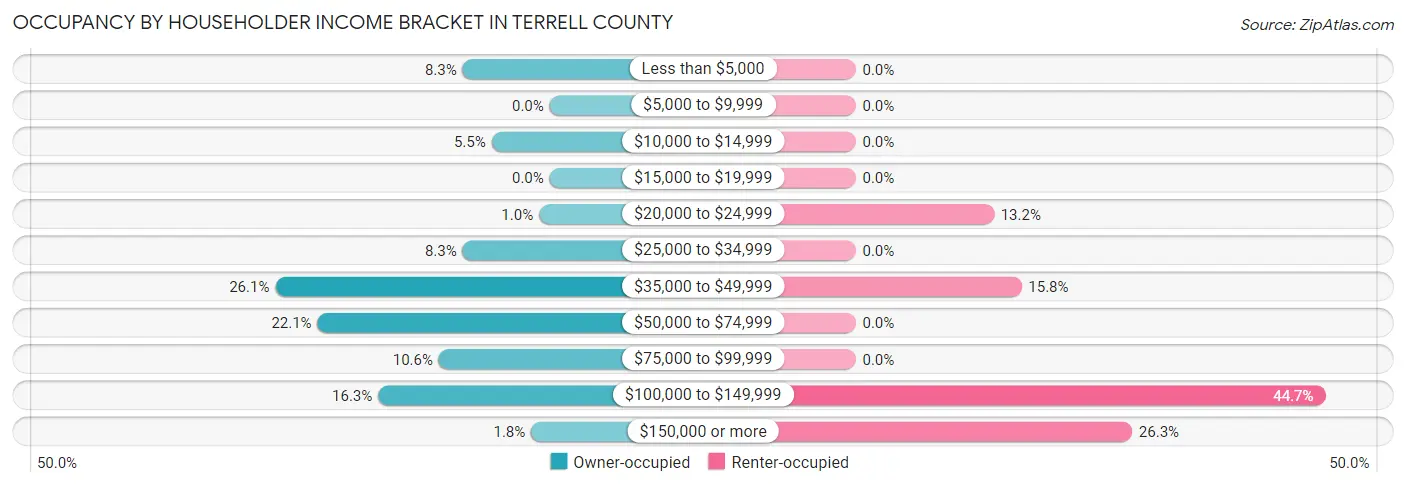
| Income Bracket | Owner-occupied | Renter-occupied |
| Less than $5,000 | 33 (8.3%) | 0 (0.0%) |
| $5,000 to $9,999 | 0 (0.0%) | 0 (0.0%) |
| $10,000 to $14,999 | 22 (5.5%) | 0 (0.0%) |
| $15,000 to $19,999 | 0 (0.0%) | 0 (0.0%) |
| $20,000 to $24,999 | 4 (1.0%) | 5 (13.2%) |
| $25,000 to $34,999 | 33 (8.3%) | 0 (0.0%) |
| $35,000 to $49,999 | 104 (26.1%) | 6 (15.8%) |
| $50,000 to $74,999 | 88 (22.1%) | 0 (0.0%) |
| $75,000 to $99,999 | 42 (10.5%) | 0 (0.0%) |
| $100,000 to $149,999 | 65 (16.3%) | 17 (44.7%) |
| $150,000 or more | 7 (1.8%) | 10 (26.3%) |
| Total | 398 (100.0%) | 38 (100.0%) |
Monthly Housing Cost Tiers in Terrell County
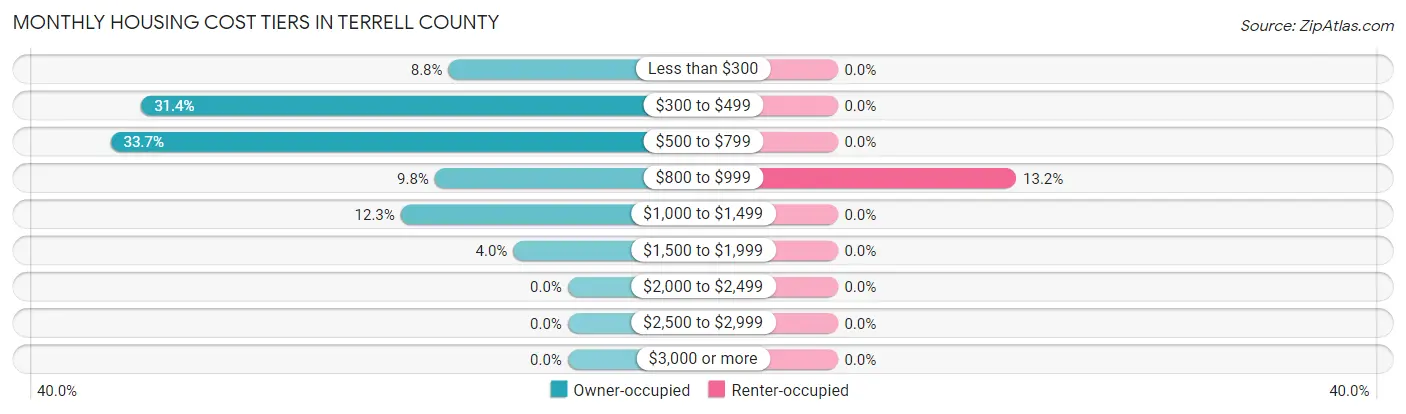
| Monthly Cost | Owner-occupied | Renter-occupied |
| Less than $300 | 35 (8.8%) | 0 (0.0%) |
| $300 to $499 | 125 (31.4%) | 0 (0.0%) |
| $500 to $799 | 134 (33.7%) | 0 (0.0%) |
| $800 to $999 | 39 (9.8%) | 5 (13.2%) |
| $1,000 to $1,499 | 49 (12.3%) | 0 (0.0%) |
| $1,500 to $1,999 | 16 (4.0%) | 0 (0.0%) |
| $2,000 to $2,499 | 0 (0.0%) | 0 (0.0%) |
| $2,500 to $2,999 | 0 (0.0%) | 0 (0.0%) |
| $3,000 or more | 0 (0.0%) | 0 (0.0%) |
| Total | 398 (100.0%) | 38 (100.0%) |
Physical Housing Characteristics in Terrell County
Housing Structures in Terrell County
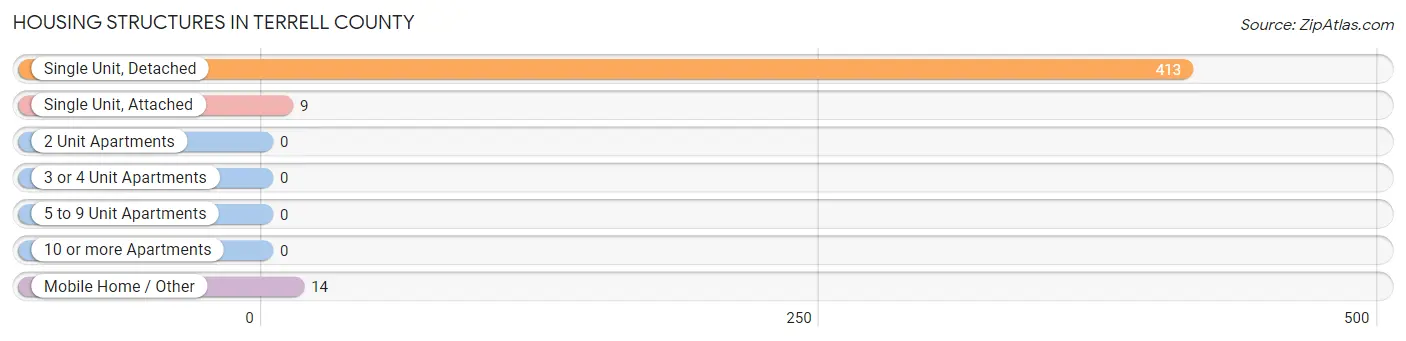
| Structure Type | # Housing Units | % Housing Units |
| Single Unit, Detached | 413 | 94.7% |
| Single Unit, Attached | 9 | 2.1% |
| 2 Unit Apartments | 0 | 0.0% |
| 3 or 4 Unit Apartments | 0 | 0.0% |
| 5 to 9 Unit Apartments | 0 | 0.0% |
| 10 or more Apartments | 0 | 0.0% |
| Mobile Home / Other | 14 | 3.2% |
| Total | 436 | 100.0% |
Housing Structures by Occupancy in Terrell County
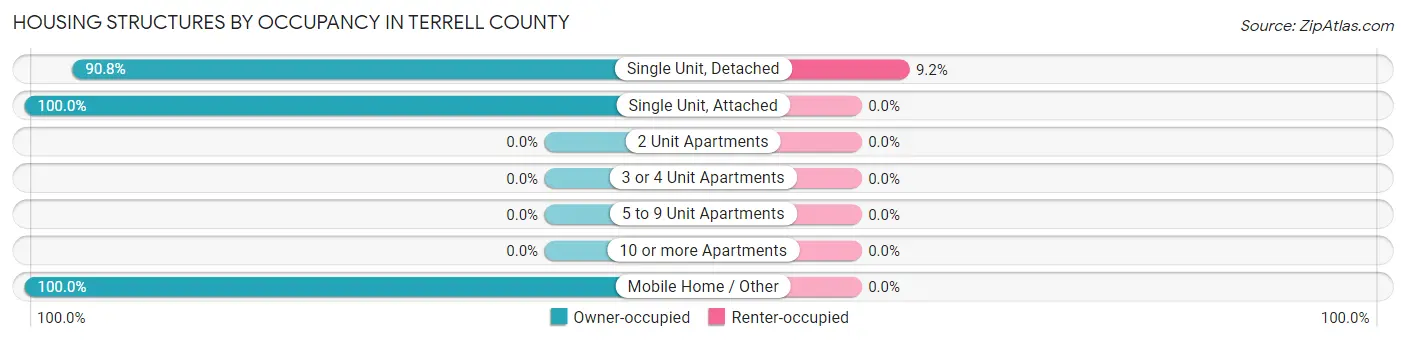
| Structure Type | Owner-occupied | Renter-occupied |
| Single Unit, Detached | 375 (90.8%) | 38 (9.2%) |
| Single Unit, Attached | 9 (100.0%) | 0 (0.0%) |
| 2 Unit Apartments | 0 (0.0%) | 0 (0.0%) |
| 3 or 4 Unit Apartments | 0 (0.0%) | 0 (0.0%) |
| 5 to 9 Unit Apartments | 0 (0.0%) | 0 (0.0%) |
| 10 or more Apartments | 0 (0.0%) | 0 (0.0%) |
| Mobile Home / Other | 14 (100.0%) | 0 (0.0%) |
| Total | 398 (91.3%) | 38 (8.7%) |
Housing Structures by Number of Rooms in Terrell County
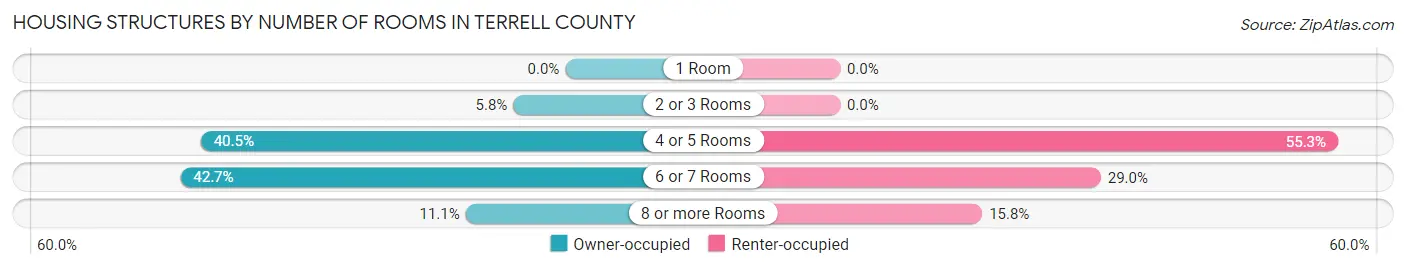
| Number of Rooms | Owner-occupied | Renter-occupied |
| 1 Room | 0 (0.0%) | 0 (0.0%) |
| 2 or 3 Rooms | 23 (5.8%) | 0 (0.0%) |
| 4 or 5 Rooms | 161 (40.5%) | 21 (55.3%) |
| 6 or 7 Rooms | 170 (42.7%) | 11 (28.9%) |
| 8 or more Rooms | 44 (11.1%) | 6 (15.8%) |
| Total | 398 (100.0%) | 38 (100.0%) |
Housing Structure by Heating Type in Terrell County
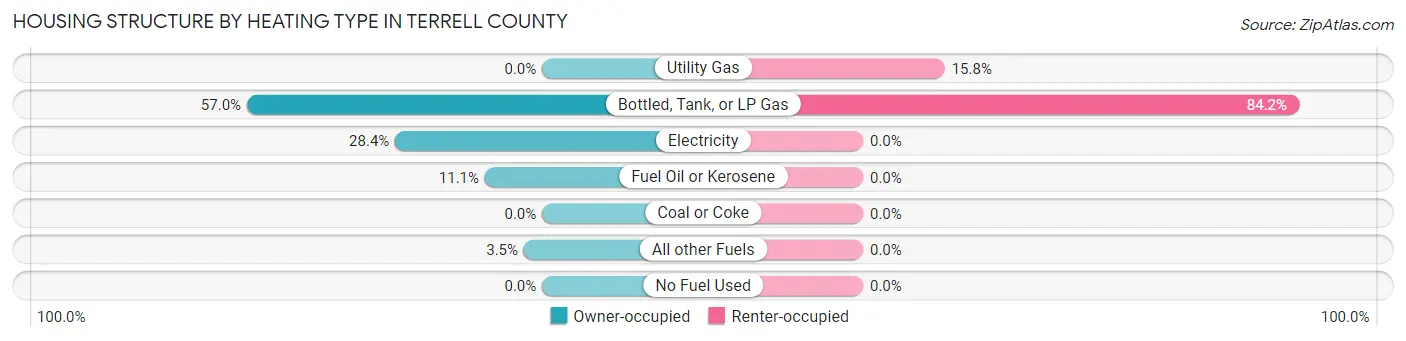
| Heating Type | Owner-occupied | Renter-occupied |
| Utility Gas | 0 (0.0%) | 6 (15.8%) |
| Bottled, Tank, or LP Gas | 227 (57.0%) | 32 (84.2%) |
| Electricity | 113 (28.4%) | 0 (0.0%) |
| Fuel Oil or Kerosene | 44 (11.1%) | 0 (0.0%) |
| Coal or Coke | 0 (0.0%) | 0 (0.0%) |
| All other Fuels | 14 (3.5%) | 0 (0.0%) |
| No Fuel Used | 0 (0.0%) | 0 (0.0%) |
| Total | 398 (100.0%) | 38 (100.0%) |
Household Vehicle Usage in Terrell County
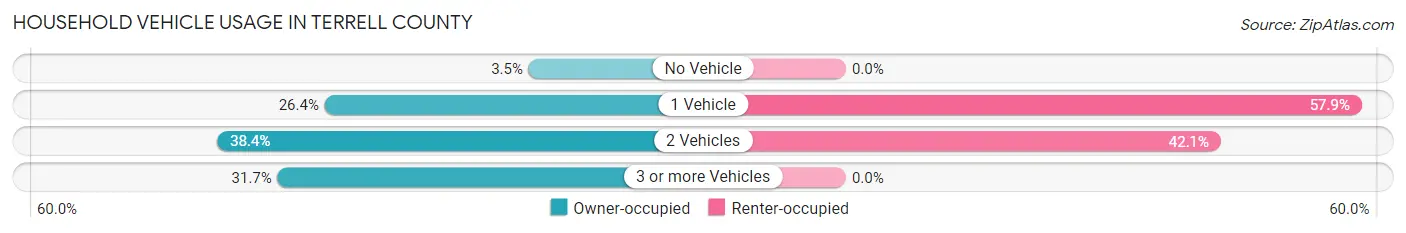
| Vehicles per Household | Owner-occupied | Renter-occupied |
| No Vehicle | 14 (3.5%) | 0 (0.0%) |
| 1 Vehicle | 105 (26.4%) | 22 (57.9%) |
| 2 Vehicles | 153 (38.4%) | 16 (42.1%) |
| 3 or more Vehicles | 126 (31.7%) | 0 (0.0%) |
| Total | 398 (100.0%) | 38 (100.0%) |
Real Estate & Mortgages in Terrell County
Real Estate and Mortgage Overview in Terrell County
| Characteristic | Without Mortgage | With Mortgage |
| Housing Units | 319 | 79 |
| Median Property Value | $122,100 | $112,500 |
| Median Household Income | $49,718 | $7 |
| Monthly Housing Costs | $499 | $0 |
| Real Estate Taxes | $1,301 | $5 |
Property Value by Mortgage Status in Terrell County
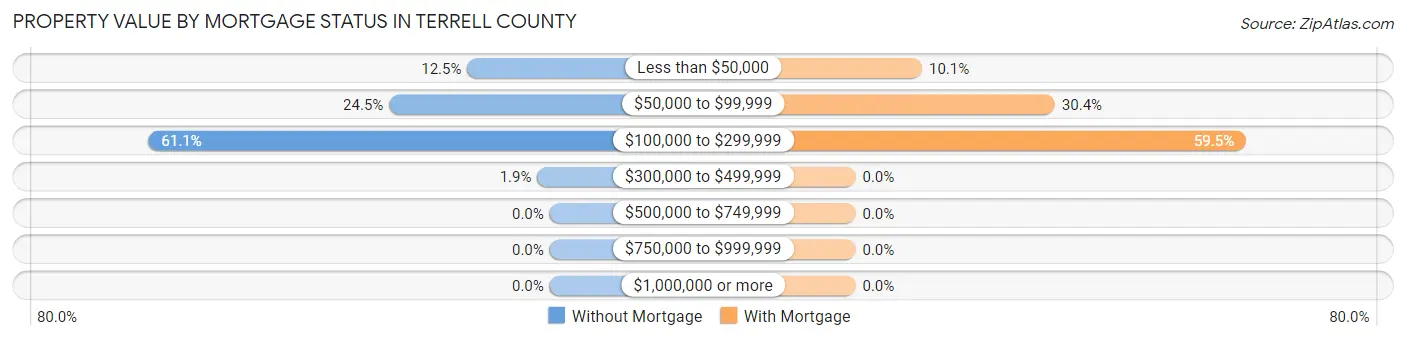
| Property Value | Without Mortgage | With Mortgage |
| Less than $50,000 | 40 (12.5%) | 8 (10.1%) |
| $50,000 to $99,999 | 78 (24.4%) | 24 (30.4%) |
| $100,000 to $299,999 | 195 (61.1%) | 47 (59.5%) |
| $300,000 to $499,999 | 6 (1.9%) | 0 (0.0%) |
| $500,000 to $749,999 | 0 (0.0%) | 0 (0.0%) |
| $750,000 to $999,999 | 0 (0.0%) | 0 (0.0%) |
| $1,000,000 or more | 0 (0.0%) | 0 (0.0%) |
| Total | 319 (100.0%) | 79 (100.0%) |
Household Income by Mortgage Status in Terrell County
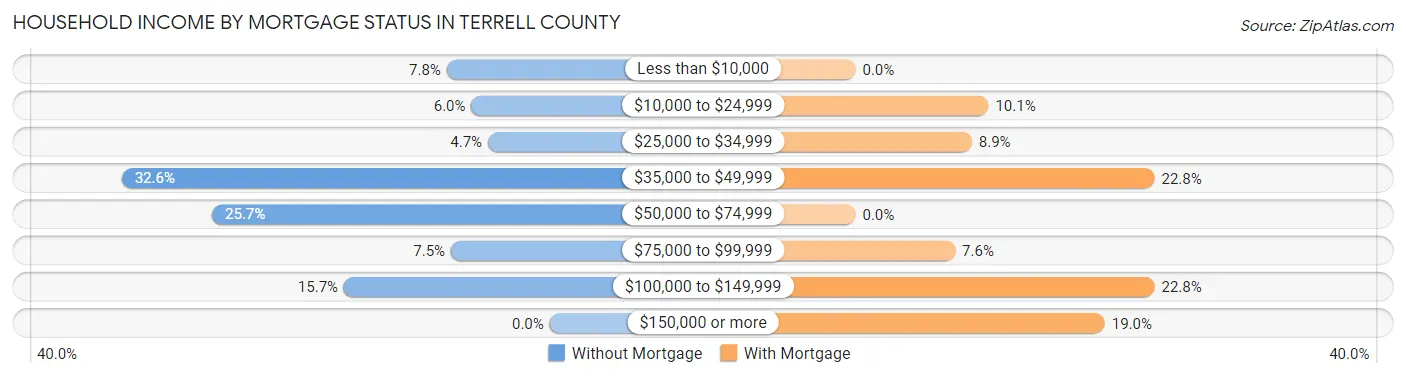
| Household Income | Without Mortgage | With Mortgage |
| Less than $10,000 | 25 (7.8%) | 0 (0.0%) |
| $10,000 to $24,999 | 19 (6.0%) | 8 (10.1%) |
| $25,000 to $34,999 | 15 (4.7%) | 7 (8.9%) |
| $35,000 to $49,999 | 104 (32.6%) | 18 (22.8%) |
| $50,000 to $74,999 | 82 (25.7%) | 0 (0.0%) |
| $75,000 to $99,999 | 24 (7.5%) | 6 (7.6%) |
| $100,000 to $149,999 | 50 (15.7%) | 18 (22.8%) |
| $150,000 or more | 0 (0.0%) | 15 (19.0%) |
| Total | 319 (100.0%) | 79 (100.0%) |
Property Value to Household Income Ratio in Terrell County
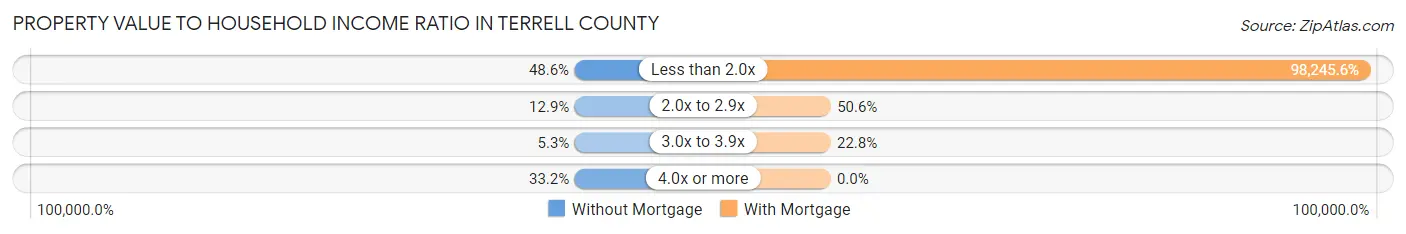
| Value-to-Income Ratio | Without Mortgage | With Mortgage |
| Less than 2.0x | 155 (48.6%) | 77,614 (98,245.6%) |
| 2.0x to 2.9x | 41 (12.9%) | 40 (50.6%) |
| 3.0x to 3.9x | 17 (5.3%) | 18 (22.8%) |
| 4.0x or more | 106 (33.2%) | 0 (0.0%) |
| Total | 319 (100.0%) | 79 (100.0%) |
Real Estate Taxes by Mortgage Status in Terrell County
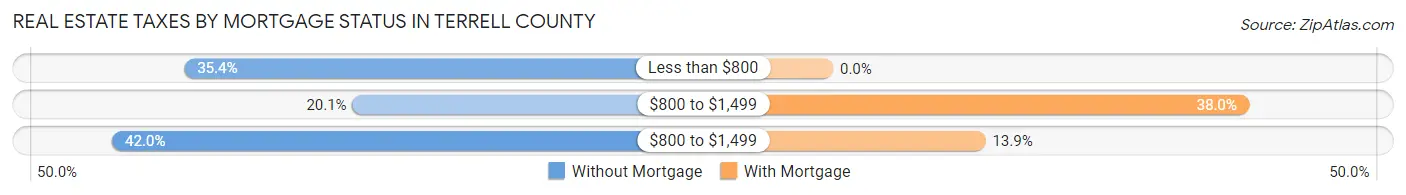
| Property Taxes | Without Mortgage | With Mortgage |
| Less than $800 | 113 (35.4%) | 0 (0.0%) |
| $800 to $1,499 | 64 (20.1%) | 30 (38.0%) |
| $800 to $1,499 | 134 (42.0%) | 11 (13.9%) |
| Total | 319 (100.0%) | 79 (100.0%) |
Health & Disability in Terrell County
Health Insurance Coverage by Age in Terrell County
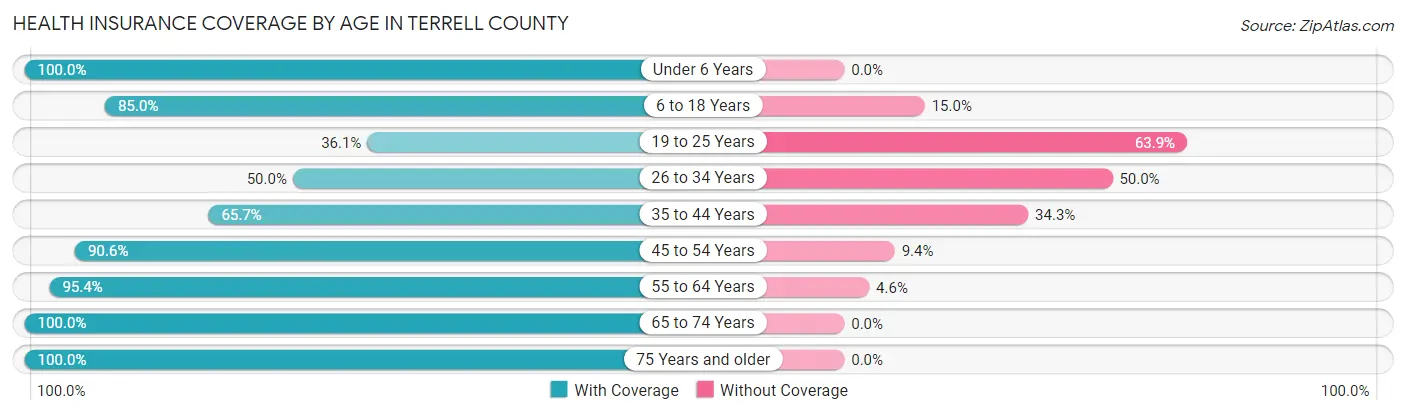
| Age Bracket | With Coverage | Without Coverage |
| Under 6 Years | 28 (100.0%) | 0 (0.0%) |
| 6 to 18 Years | 68 (85.0%) | 12 (15.0%) |
| 19 to 25 Years | 13 (36.1%) | 23 (63.9%) |
| 26 to 34 Years | 5 (50.0%) | 5 (50.0%) |
| 35 to 44 Years | 46 (65.7%) | 24 (34.3%) |
| 45 to 54 Years | 135 (90.6%) | 14 (9.4%) |
| 55 to 64 Years | 185 (95.4%) | 9 (4.6%) |
| 65 to 74 Years | 191 (100.0%) | 0 (0.0%) |
| 75 Years and older | 104 (100.0%) | 0 (0.0%) |
| Total | 775 (89.9%) | 87 (10.1%) |
Health Insurance Coverage by Citizenship Status in Terrell County
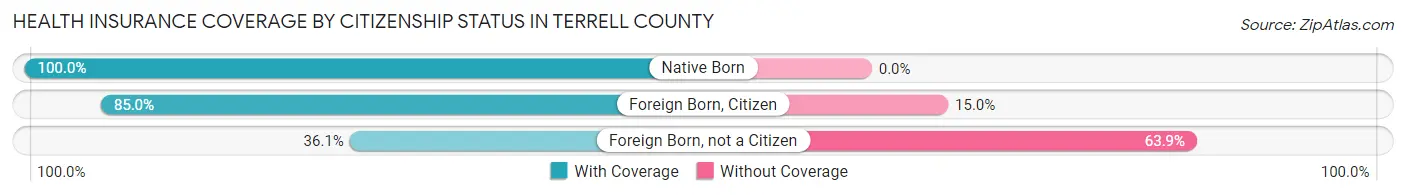
| Citizenship Status | With Coverage | Without Coverage |
| Native Born | 28 (100.0%) | 0 (0.0%) |
| Foreign Born, Citizen | 68 (85.0%) | 12 (15.0%) |
| Foreign Born, not a Citizen | 13 (36.1%) | 23 (63.9%) |
Health Insurance Coverage by Household Income in Terrell County
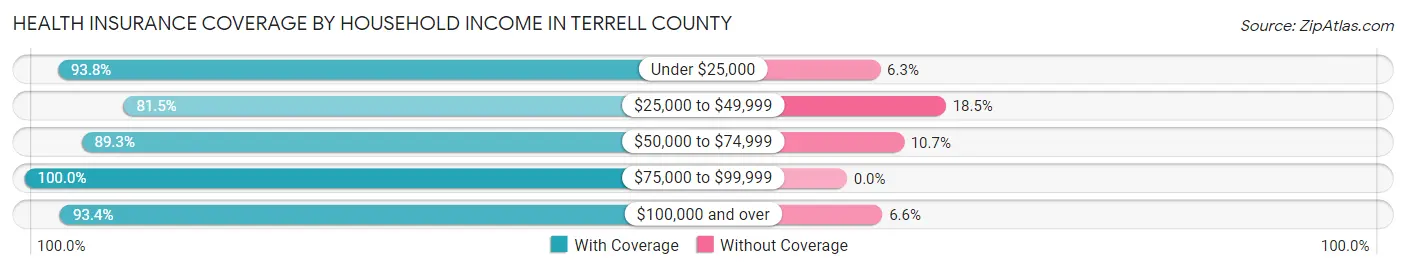
| Household Income | With Coverage | Without Coverage |
| Under $25,000 | 60 (93.8%) | 4 (6.2%) |
| $25,000 to $49,999 | 211 (81.5%) | 48 (18.5%) |
| $50,000 to $74,999 | 159 (89.3%) | 19 (10.7%) |
| $75,000 to $99,999 | 120 (100.0%) | 0 (0.0%) |
| $100,000 and over | 225 (93.4%) | 16 (6.6%) |
Public vs Private Health Insurance Coverage by Age in Terrell County
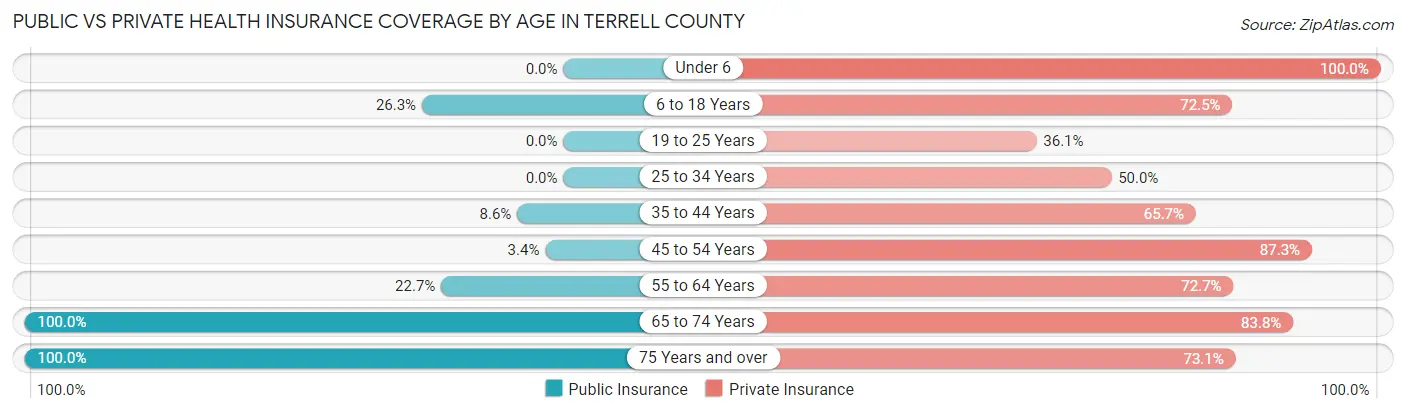
| Age Bracket | Public Insurance | Private Insurance |
| Under 6 | 0 (0.0%) | 28 (100.0%) |
| 6 to 18 Years | 21 (26.3%) | 58 (72.5%) |
| 19 to 25 Years | 0 (0.0%) | 13 (36.1%) |
| 25 to 34 Years | 0 (0.0%) | 5 (50.0%) |
| 35 to 44 Years | 6 (8.6%) | 46 (65.7%) |
| 45 to 54 Years | 5 (3.4%) | 130 (87.3%) |
| 55 to 64 Years | 44 (22.7%) | 141 (72.7%) |
| 65 to 74 Years | 191 (100.0%) | 160 (83.8%) |
| 75 Years and over | 104 (100.0%) | 76 (73.1%) |
| Total | 371 (43.0%) | 657 (76.2%) |
Disability Status by Sex by Age in Terrell County
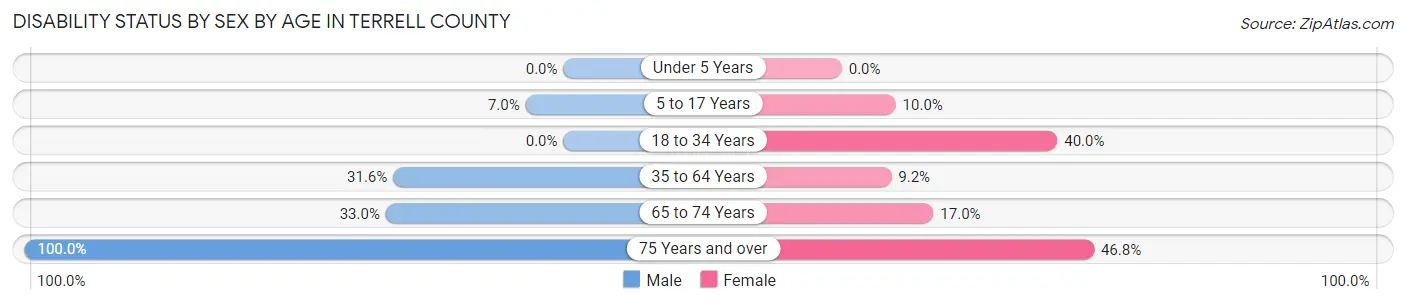
| Age Bracket | Male | Female |
| Under 5 Years | 0 (0.0%) | 0 (0.0%) |
| 5 to 17 Years | 4 (7.0%) | 4 (10.0%) |
| 18 to 34 Years | 0 (0.0%) | 2 (40.0%) |
| 35 to 64 Years | 79 (31.6%) | 15 (9.2%) |
| 65 to 74 Years | 30 (33.0%) | 17 (17.0%) |
| 75 Years and over | 57 (100.0%) | 22 (46.8%) |
Disability Class by Sex by Age in Terrell County
Disability Class: Hearing Difficulty
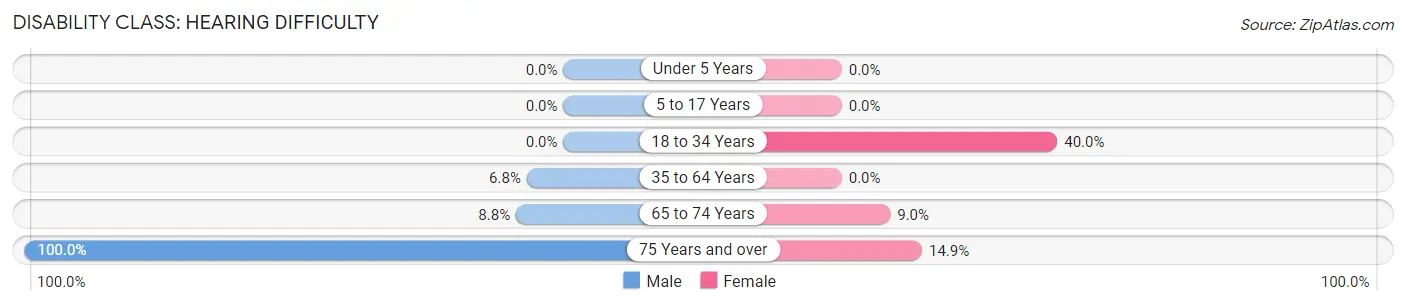
| Age Bracket | Male | Female |
| Under 5 Years | 0 (0.0%) | 0 (0.0%) |
| 5 to 17 Years | 0 (0.0%) | 0 (0.0%) |
| 18 to 34 Years | 0 (0.0%) | 2 (40.0%) |
| 35 to 64 Years | 17 (6.8%) | 0 (0.0%) |
| 65 to 74 Years | 8 (8.8%) | 9 (9.0%) |
| 75 Years and over | 57 (100.0%) | 7 (14.9%) |
Disability Class: Vision Difficulty
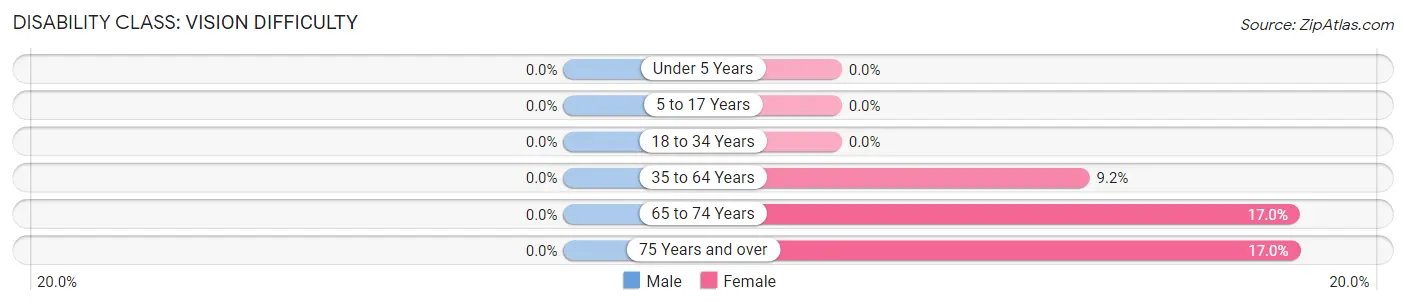
| Age Bracket | Male | Female |
| Under 5 Years | 0 (0.0%) | 0 (0.0%) |
| 5 to 17 Years | 0 (0.0%) | 0 (0.0%) |
| 18 to 34 Years | 0 (0.0%) | 0 (0.0%) |
| 35 to 64 Years | 0 (0.0%) | 15 (9.2%) |
| 65 to 74 Years | 0 (0.0%) | 17 (17.0%) |
| 75 Years and over | 0 (0.0%) | 8 (17.0%) |
Disability Class: Cognitive Difficulty
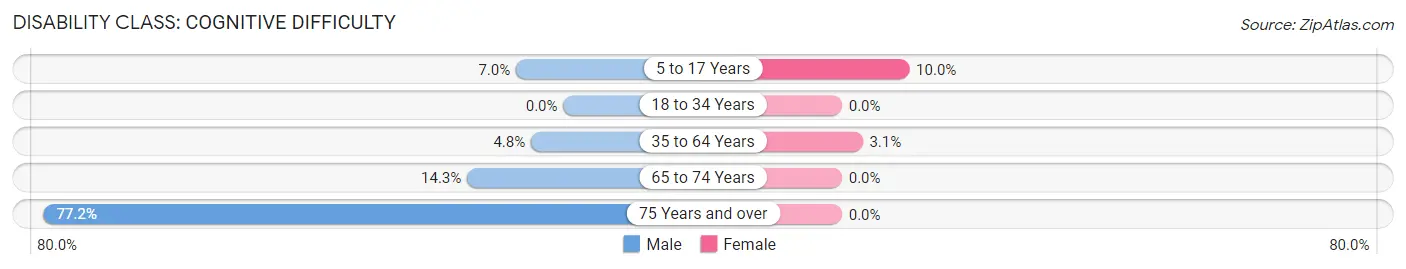
| Age Bracket | Male | Female |
| 5 to 17 Years | 4 (7.0%) | 4 (10.0%) |
| 18 to 34 Years | 0 (0.0%) | 0 (0.0%) |
| 35 to 64 Years | 12 (4.8%) | 5 (3.1%) |
| 65 to 74 Years | 13 (14.3%) | 0 (0.0%) |
| 75 Years and over | 44 (77.2%) | 0 (0.0%) |
Disability Class: Ambulatory Difficulty
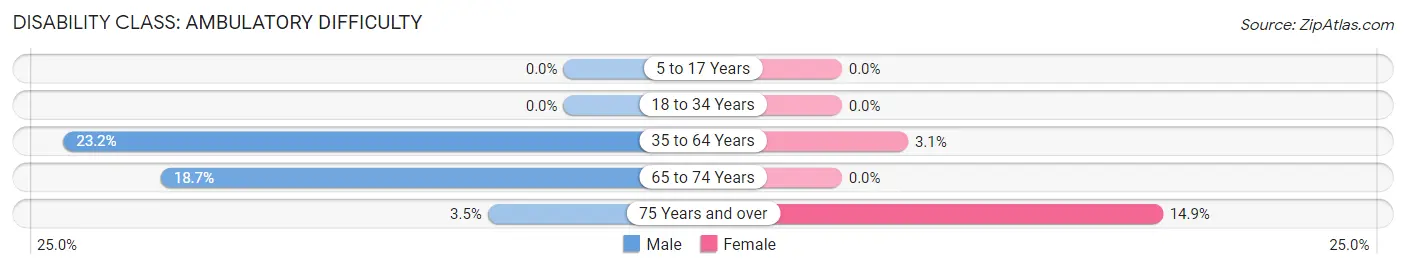
| Age Bracket | Male | Female |
| 5 to 17 Years | 0 (0.0%) | 0 (0.0%) |
| 18 to 34 Years | 0 (0.0%) | 0 (0.0%) |
| 35 to 64 Years | 58 (23.2%) | 5 (3.1%) |
| 65 to 74 Years | 17 (18.7%) | 0 (0.0%) |
| 75 Years and over | 2 (3.5%) | 7 (14.9%) |
Disability Class: Self-Care Difficulty
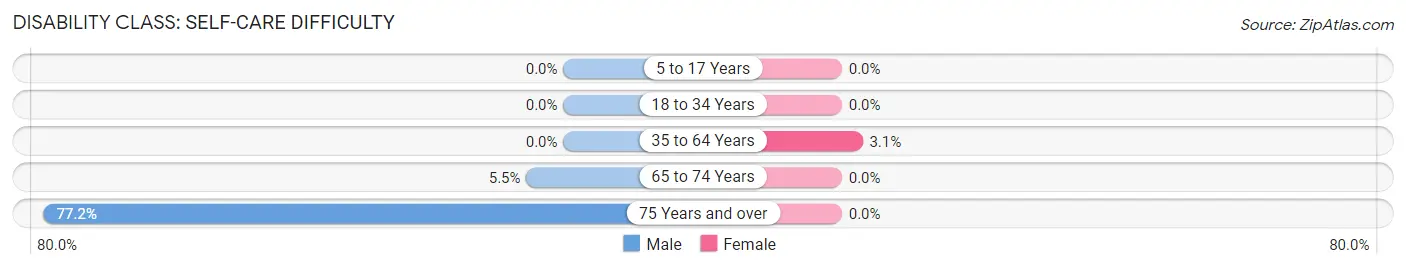
| Age Bracket | Male | Female |
| 5 to 17 Years | 0 (0.0%) | 0 (0.0%) |
| 18 to 34 Years | 0 (0.0%) | 0 (0.0%) |
| 35 to 64 Years | 0 (0.0%) | 5 (3.1%) |
| 65 to 74 Years | 5 (5.5%) | 0 (0.0%) |
| 75 Years and over | 44 (77.2%) | 0 (0.0%) |
Technology Access in Terrell County
Computing Device Access in Terrell County
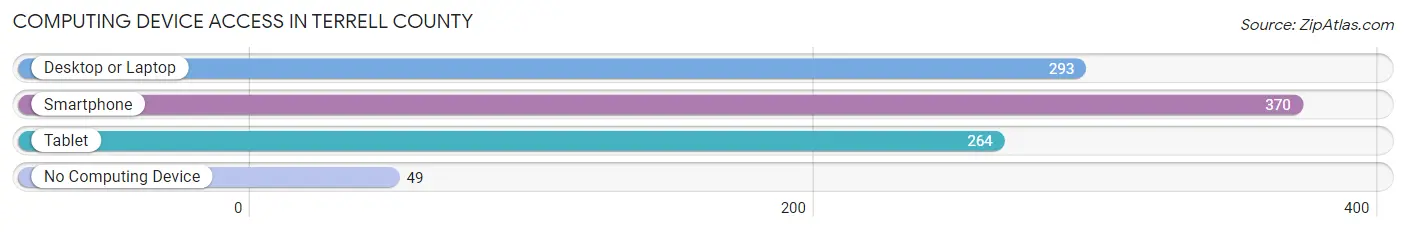
| Device Type | # Households | % Households |
| Desktop or Laptop | 293 | 67.2% |
| Smartphone | 370 | 84.9% |
| Tablet | 264 | 60.6% |
| No Computing Device | 49 | 11.2% |
| Total | 436 | 100.0% |
Internet Access in Terrell County
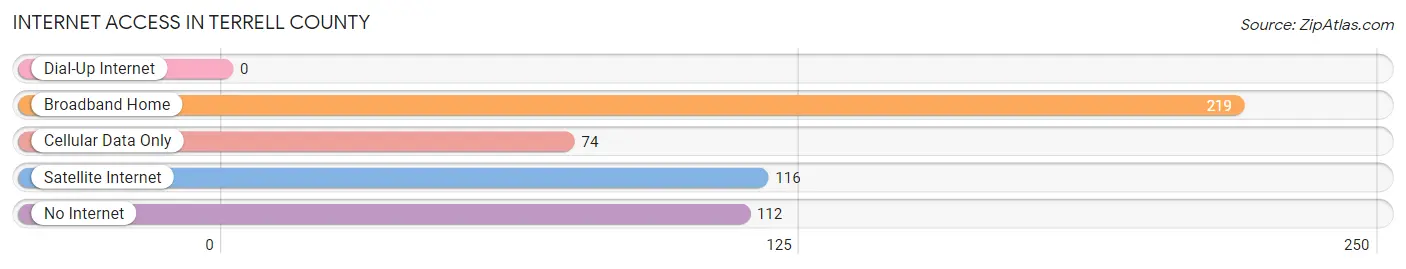
| Internet Type | # Households | % Households |
| Dial-Up Internet | 0 | 0.0% |
| Broadband Home | 219 | 50.2% |
| Cellular Data Only | 74 | 17.0% |
| Satellite Internet | 116 | 26.6% |
| No Internet | 112 | 25.7% |
| Total | 436 | 100.0% |
Terrell County Summary
Terrell County is located in the western part of Texas, in the United States. It is bordered by Pecos County to the north, Jeff Davis County to the east, Brewster County to the south, and Presidio County to the west. The county seat is Sanderson, and the largest city is Dryden. As of the 2010 census, the population was 984, making it the second-least populous county in Texas.
Geography
Terrell County covers an area of 2,945 square miles, making it the fourth-largest county in Texas. The terrain is mostly flat, with some rolling hills in the northern part of the county. The highest point in the county is an unnamed peak in the northern part of the county, at an elevation of 4,890 feet. The county is drained by the Pecos River, which forms the northern boundary of the county.
The climate of Terrell County is semi-arid, with hot summers and mild winters. The average annual temperature is 68°F, and the average annual precipitation is 16.5 inches.
History
Terrell County was established in 1887 from portions of Pecos and Brewster counties. It was named for Alexander Watkins Terrell, a former Confederate soldier and Texas state senator.
The first settlers in the county were ranchers, who established large cattle ranches in the area. The first town in the county was Sanderson, which was established in 1891. The town was named for a local rancher, William Sanderson.
The county experienced a population boom in the early 20th century, as oil was discovered in the area. The population peaked in 1940, at 10,845. Since then, the population has steadily declined, as the oil industry has declined and the county has become increasingly rural.
Economy
The economy of Terrell County is largely based on agriculture and ranching. The county is home to several large cattle ranches, and the county is one of the top producers of beef in the state. Other agricultural products include cotton, sorghum, and wheat.
The county also has some oil and gas production although it is not as significant as it once was
Demographics
As of the 2010 census, there were 984 people living in Terrell County. The population density was 0.3 people per square mile. The racial makeup of the county was 81.2% White, 0.3% African American, 0.2% Native American, 0.1% Asian, 0.1% Pacific Islander, 16.7% from other races, and 1.5% from two or more races. Hispanic or Latino of any race were 44.2% of the population.
The median income for a household in the county was $25,000, and the median income for a family was $30,000. The per capita income for the county was $13,000. About 20.2% of the population was below the poverty line.
Common Questions
What is Per Capita Income in Terrell County?
Per Capita income in Terrell County is $36,144.
What is the Median Family Income in Terrell County?
Median Family Income in Terrell County is $64,141.
What is the Median Household income in Terrell County?
Median Household Income in Terrell County is $52,813.
What is Income or Wage Gap in Terrell County?
Income or Wage Gap in Terrell County is 62.2%.
Women in Terrell County earn 37.8 cents for every dollar earned by a man.
What is Inequality or Gini Index in Terrell County?
Inequality or Gini Index in Terrell County is 0.38.
What is the Total Population of Terrell County?
Total Population of Terrell County is 862.
What is the Total Male Population of Terrell County?
Total Male Population of Terrell County is 501.
What is the Total Female Population of Terrell County?
Total Female Population of Terrell County is 361.
What is the Ratio of Males per 100 Females in Terrell County?
There are 138.78 Males per 100 Females in Terrell County.
What is the Ratio of Females per 100 Males in Terrell County?
There are 72.06 Females per 100 Males in Terrell County.
What is the Median Population Age in Terrell County?
Median Population Age in Terrell County is 57.7 Years.
What is the Average Family Size in Terrell County
Average Family Size in Terrell County is 2.9 People.
What is the Average Household Size in Terrell County
Average Household Size in Terrell County is 2.0 People.
How Large is the Labor Force in Terrell County?
There are 364 People in the Labor Forcein in Terrell County.
What is the Percentage of People in the Labor Force in Terrell County?
47.6% of People are in the Labor Force in Terrell County.