Scurry County, TX Map & Demographics
Scurry County Map
Scurry County Overview
$28,549
PER CAPITA INCOME
$76,176
AVG FAMILY INCOME
$58,932
AVG HOUSEHOLD INCOME
40.8%
WAGE / INCOME GAP [ % ]
59.2¢/ $1
WAGE / INCOME GAP [ $ ]
0.42
INEQUALITY / GINI INDEX
16,883
TOTAL POPULATION
9,084
MALE POPULATION
7,799
FEMALE POPULATION
116.48
MALES / 100 FEMALES
85.85
FEMALES / 100 MALES
36.2
MEDIAN AGE
3.2
AVG FAMILY SIZE
2.6
AVG HOUSEHOLD SIZE
7,070
LABOR FORCE [ PEOPLE ]
53.7%
PERCENT IN LABOR FORCE
2.2%
UNEMPLOYMENT RATE
Income in Scurry County
Income Overview in Scurry County
Per Capita Income in Scurry County is $28,549, while median incomes of families and households are $76,176 and $58,932 respectively.
| Characteristic | Number | Measure |
| Per Capita Income | 16,883 | $28,549 |
| Median Family Income | 3,734 | $76,176 |
| Mean Family Income | 3,734 | $95,427 |
| Median Household Income | 5,693 | $58,932 |
| Mean Household Income | 5,693 | $82,991 |
| Income Deficit | 3,734 | $0 |
| Wage / Income Gap (%) | 16,883 | 40.84% |
| Wage / Income Gap ($) | 16,883 | 59.16¢ per $1 |
| Gini / Inequality Index | 16,883 | 0.42 |
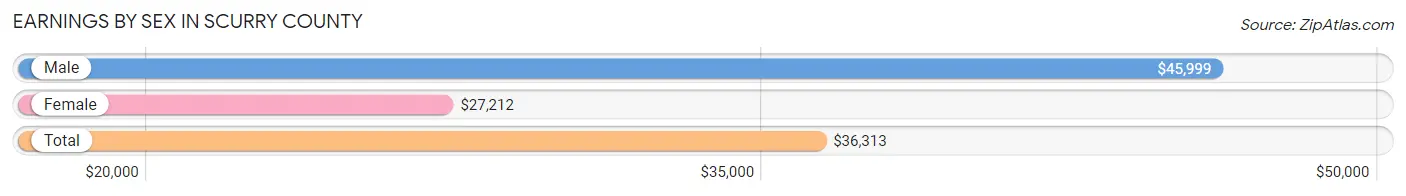
Earnings by Sex in Scurry County
Average Earnings in Scurry County are $36,313, $45,999 for men and $27,212 for women, a difference of 40.8%.
| Sex | Number | Average Earnings |
| Male | 4,319 (56.9%) | $45,999 |
| Female | 3,276 (43.1%) | $27,212 |
| Total | 7,595 (100.0%) | $36,313 |
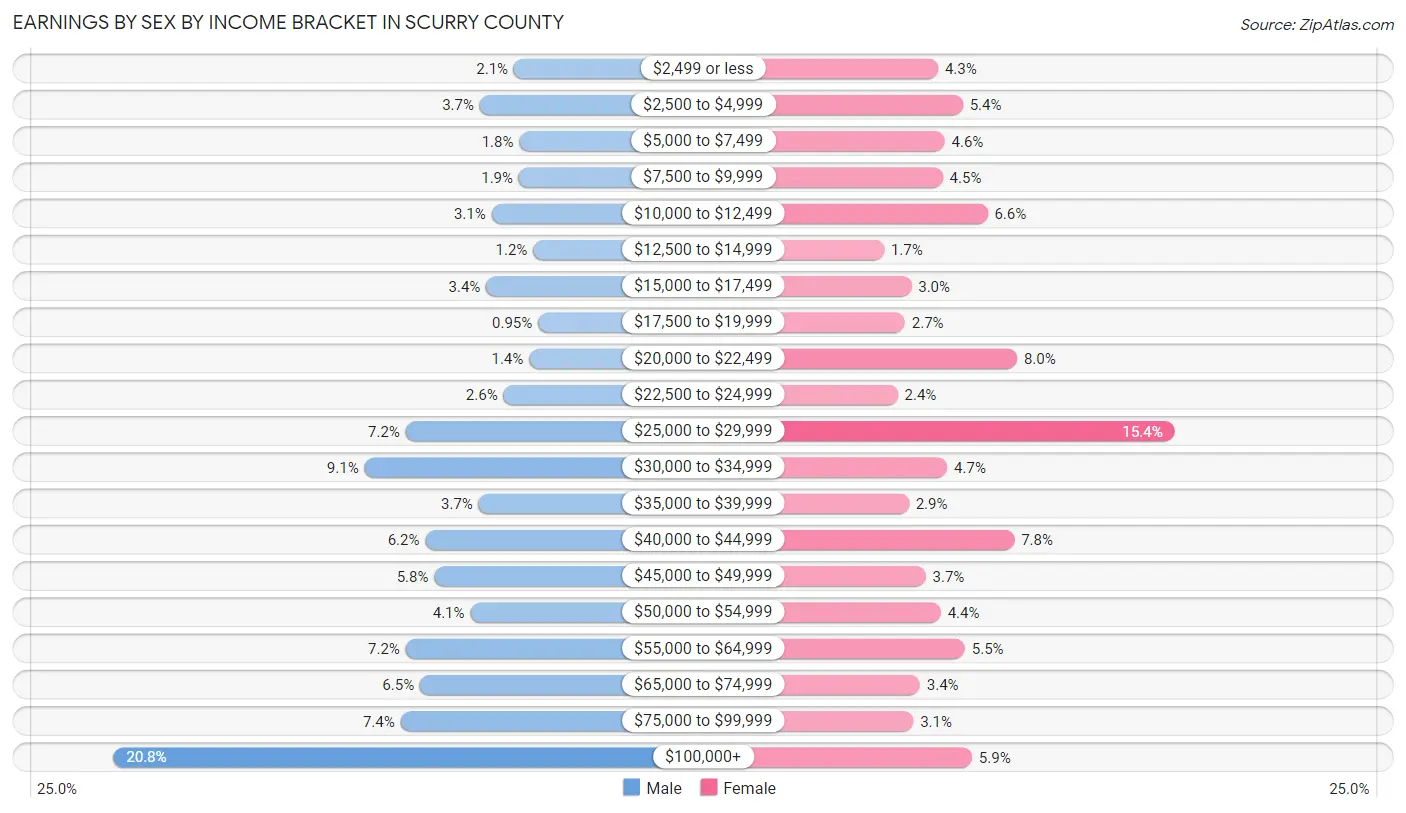
Earnings by Sex by Income Bracket in Scurry County
The most common earnings brackets in Scurry County are $100,000+ for men (900 | 20.8%) and $25,000 to $29,999 for women (503 | 15.3%).
| Income | Male | Female |
| $2,499 or less | 90 (2.1%) | 140 (4.3%) |
| $2,500 to $4,999 | 159 (3.7%) | 178 (5.4%) |
| $5,000 to $7,499 | 79 (1.8%) | 150 (4.6%) |
| $7,500 to $9,999 | 80 (1.8%) | 147 (4.5%) |
| $10,000 to $12,499 | 135 (3.1%) | 216 (6.6%) |
| $12,500 to $14,999 | 51 (1.2%) | 57 (1.7%) |
| $15,000 to $17,499 | 146 (3.4%) | 99 (3.0%) |
| $17,500 to $19,999 | 41 (0.9%) | 89 (2.7%) |
| $20,000 to $22,499 | 59 (1.4%) | 261 (8.0%) |
| $22,500 to $24,999 | 111 (2.6%) | 78 (2.4%) |
| $25,000 to $29,999 | 309 (7.1%) | 503 (15.3%) |
| $30,000 to $34,999 | 392 (9.1%) | 154 (4.7%) |
| $35,000 to $39,999 | 161 (3.7%) | 95 (2.9%) |
| $40,000 to $44,999 | 269 (6.2%) | 257 (7.8%) |
| $45,000 to $49,999 | 251 (5.8%) | 121 (3.7%) |
| $50,000 to $54,999 | 178 (4.1%) | 144 (4.4%) |
| $55,000 to $64,999 | 309 (7.1%) | 181 (5.5%) |
| $65,000 to $74,999 | 280 (6.5%) | 112 (3.4%) |
| $75,000 to $99,999 | 319 (7.4%) | 102 (3.1%) |
| $100,000+ | 900 (20.8%) | 192 (5.9%) |
| Total | 4,319 (100.0%) | 3,276 (100.0%) |
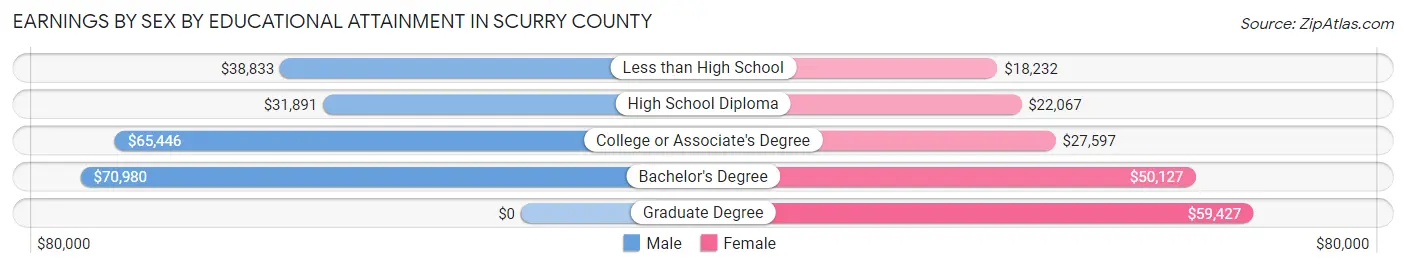
Earnings by Sex by Educational Attainment in Scurry County
Average earnings in Scurry County are $51,341 for men and $28,881 for women, a difference of 43.8%. Men with an educational attainment of bachelor's degree enjoy the highest average annual earnings of $70,980, while those with high school diploma education earn the least with $31,891. Women with an educational attainment of graduate degree earn the most with the average annual earnings of $59,427, while those with less than high school education have the smallest earnings of $18,232.
| Educational Attainment | Male Income | Female Income |
| Less than High School | $38,833 | $18,232 |
| High School Diploma | $31,891 | $22,067 |
| College or Associate's Degree | $65,446 | $27,597 |
| Bachelor's Degree | $70,980 | $50,127 |
| Graduate Degree | - | - |
| Total | $51,341 | $28,881 |
Family Income in Scurry County
Family Income Brackets in Scurry County
According to the Scurry County family income data, there are 866 families falling into the $100,000 to $149,999 income range, which is the most common income bracket and makes up 23.2% of all families. Conversely, the less than $10,000 income bracket is the least frequent group with only 52 families (1.4%) belonging to this category.
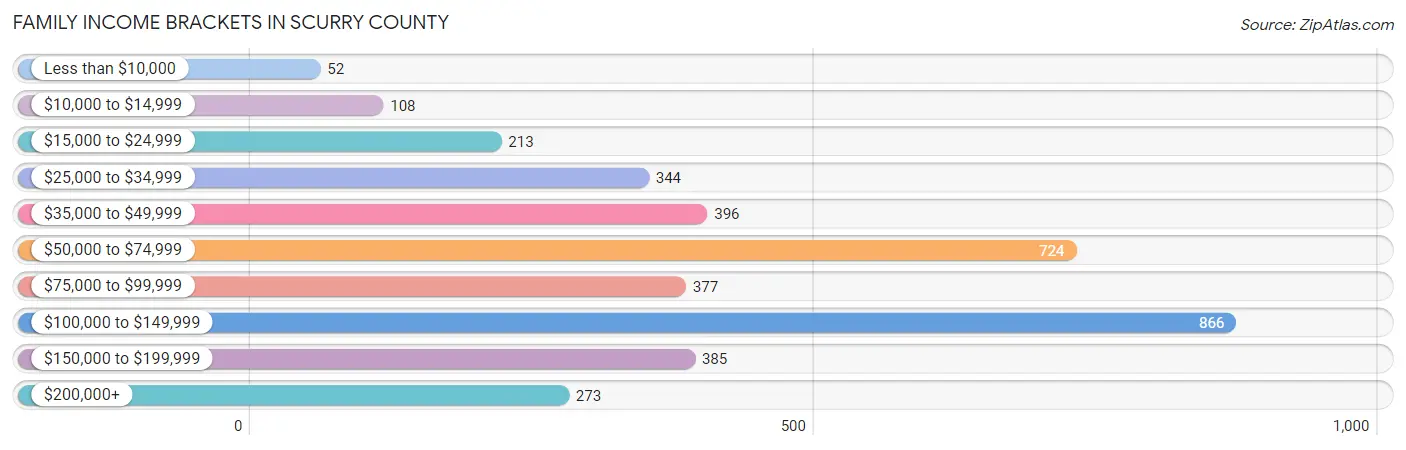
| Income Bracket | # Families | % Families |
| Less than $10,000 | 52 | 1.4% |
| $10,000 to $14,999 | 108 | 2.9% |
| $15,000 to $24,999 | 213 | 5.7% |
| $25,000 to $34,999 | 344 | 9.2% |
| $35,000 to $49,999 | 396 | 10.6% |
| $50,000 to $74,999 | 724 | 19.4% |
| $75,000 to $99,999 | 377 | 10.1% |
| $100,000 to $149,999 | 866 | 23.2% |
| $150,000 to $199,999 | 385 | 10.3% |
| $200,000+ | 273 | 7.3% |
Family Income by Famaliy Size in Scurry County
7+ person families (36 | 1.0%) account for the highest median family income in Scurry County with $141,250 per family, while 2-person families (1,667 | 44.6%) have the highest median income of $39,420 per family member.
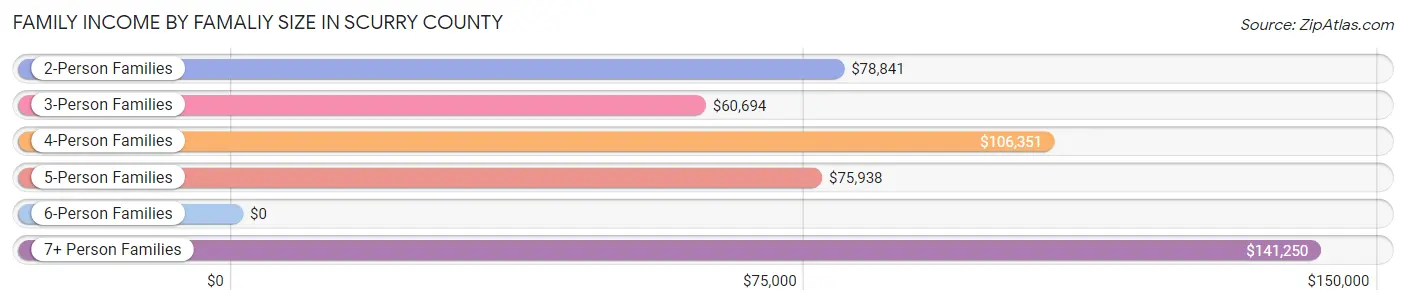
| Income Bracket | # Families | Median Income |
| 2-Person Families | 1,667 (44.6%) | $78,841 |
| 3-Person Families | 730 (19.6%) | $60,694 |
| 4-Person Families | 752 (20.1%) | $106,351 |
| 5-Person Families | 519 (13.9%) | $75,938 |
| 6-Person Families | 30 (0.8%) | $0 |
| 7+ Person Families | 36 (1.0%) | $141,250 |
| Total | 3,734 (100.0%) | $76,176 |
Family Income by Number of Earners in Scurry County
The median family income in Scurry County is $76,176, with families comprising 3+ earners (247) having the highest median family income of $108,375, while families with no earners (367) have the lowest median family income of $36,563, accounting for 6.6% and 9.8% of families, respectively.
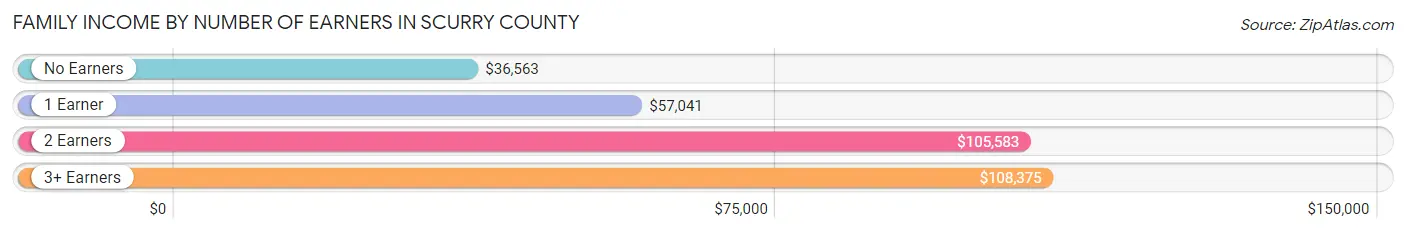
| Number of Earners | # Families | Median Income |
| No Earners | 367 (9.8%) | $36,563 |
| 1 Earner | 1,443 (38.6%) | $57,041 |
| 2 Earners | 1,677 (44.9%) | $105,583 |
| 3+ Earners | 247 (6.6%) | $108,375 |
| Total | 3,734 (100.0%) | $76,176 |
Household Income in Scurry County
Household Income Brackets in Scurry County
With 1,104 households falling in the category, the $100,000 to $149,999 income range is the most frequent in Scurry County, accounting for 19.4% of all households. In contrast, only 154 households (2.7%) fall into the less than $10,000 income bracket, making it the least populous group.
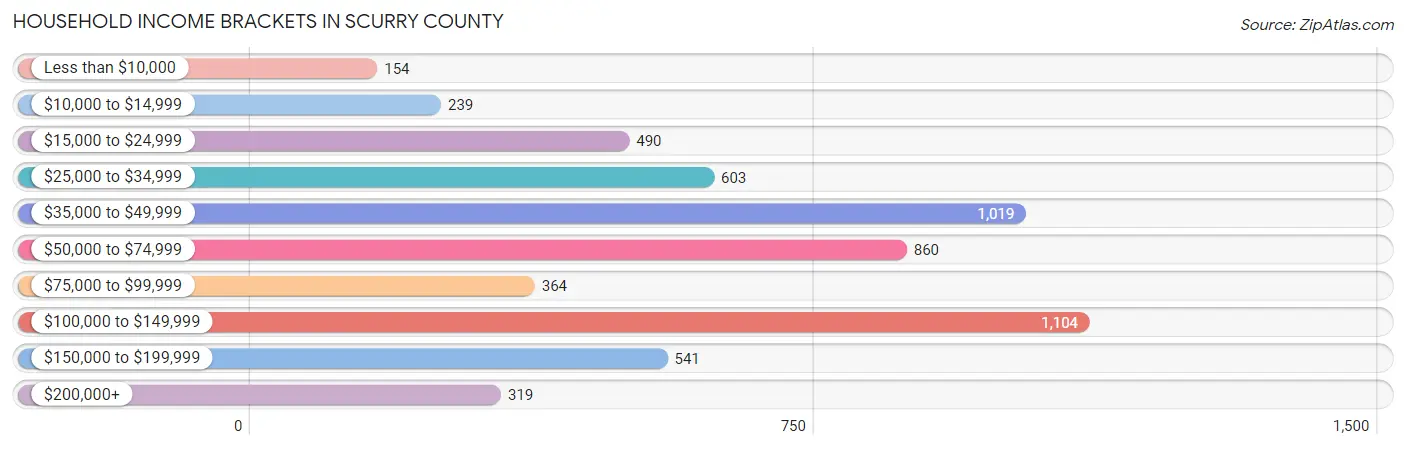
| Income Bracket | # Households | % Households |
| Less than $10,000 | 154 | 2.7% |
| $10,000 to $14,999 | 239 | 4.2% |
| $15,000 to $24,999 | 490 | 8.6% |
| $25,000 to $34,999 | 603 | 10.6% |
| $35,000 to $49,999 | 1,019 | 17.9% |
| $50,000 to $74,999 | 860 | 15.1% |
| $75,000 to $99,999 | 364 | 6.4% |
| $100,000 to $149,999 | 1,104 | 19.4% |
| $150,000 to $199,999 | 541 | 9.5% |
| $200,000+ | 319 | 5.6% |
Household Income by Householder Age in Scurry County
The median household income in Scurry County is $58,932, with the highest median household income of $79,167 found in the 45 to 64 years age bracket for the primary householder. A total of 1,804 households (31.7%) fall into this category. Meanwhile, the 65+ years age bracket for the primary householder has the lowest median household income of $39,583, with 1,629 households (28.6%) in this group.
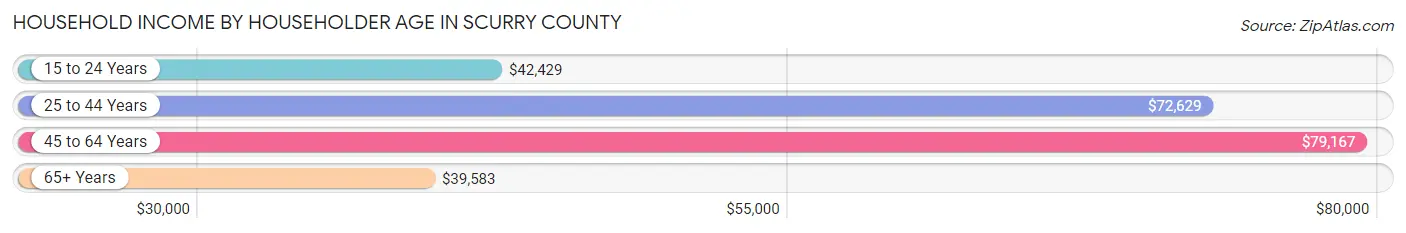
| Income Bracket | # Households | Median Income |
| 15 to 24 Years | 359 (6.3%) | $42,429 |
| 25 to 44 Years | 1,901 (33.4%) | $72,629 |
| 45 to 64 Years | 1,804 (31.7%) | $79,167 |
| 65+ Years | 1,629 (28.6%) | $39,583 |
| Total | 5,693 (100.0%) | $58,932 |
Poverty in Scurry County
Income Below Poverty by Sex and Age in Scurry County
With 12.3% poverty level for males and 11.3% for females among the residents of Scurry County, 12 to 14 year old males and 5 year old females are the most vulnerable to poverty, with 130 males (31.9%) and 19 females (20.2%) in their respective age groups living below the poverty level.
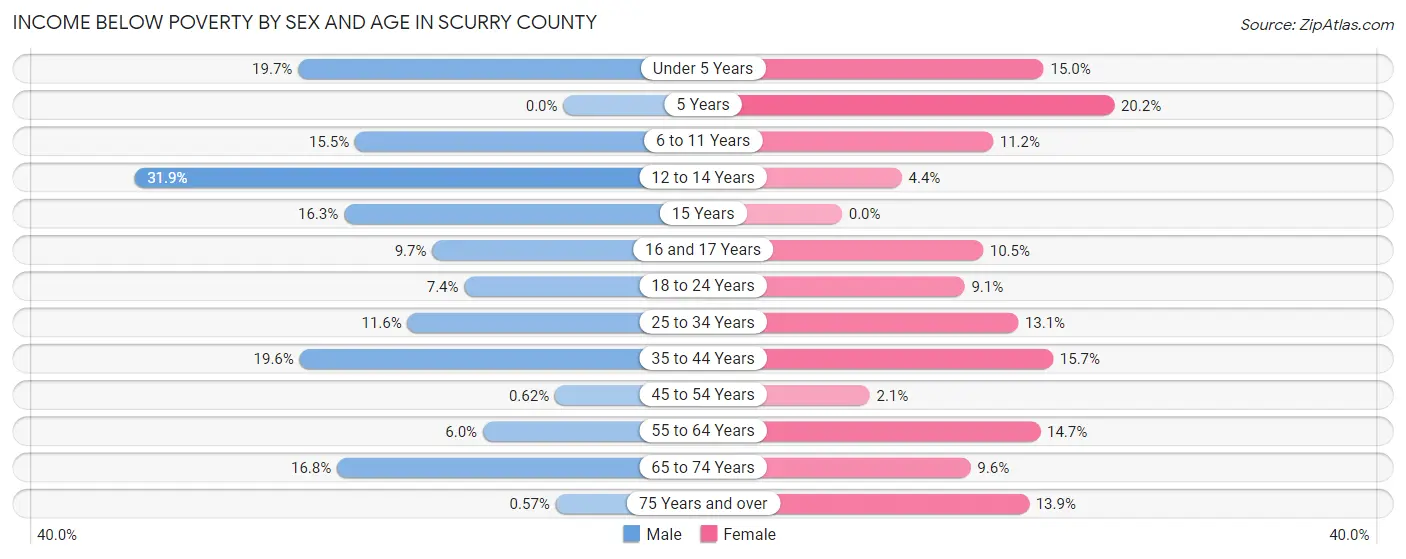
| Age Bracket | Male | Female |
| Under 5 Years | 77 (19.7%) | 95 (15.0%) |
| 5 Years | 0 (0.0%) | 19 (20.2%) |
| 6 to 11 Years | 111 (15.5%) | 72 (11.2%) |
| 12 to 14 Years | 130 (31.9%) | 18 (4.4%) |
| 15 Years | 14 (16.3%) | 0 (0.0%) |
| 16 and 17 Years | 29 (9.7%) | 27 (10.5%) |
| 18 to 24 Years | 54 (7.3%) | 42 (9.1%) |
| 25 to 34 Years | 114 (11.6%) | 132 (13.1%) |
| 35 to 44 Years | 194 (19.6%) | 141 (15.7%) |
| 45 to 54 Years | 4 (0.6%) | 17 (2.1%) |
| 55 to 64 Years | 54 (6.0%) | 136 (14.7%) |
| 65 to 74 Years | 122 (16.8%) | 64 (9.6%) |
| 75 Years and over | 2 (0.6%) | 89 (13.9%) |
| Total | 905 (12.3%) | 852 (11.3%) |
Income Above Poverty by Sex and Age in Scurry County
According to the poverty statistics in Scurry County, males aged 5 years and females aged 15 years are the age groups that are most secure financially, with 100.0% of males and 100.0% of females in these age groups living above the poverty line.
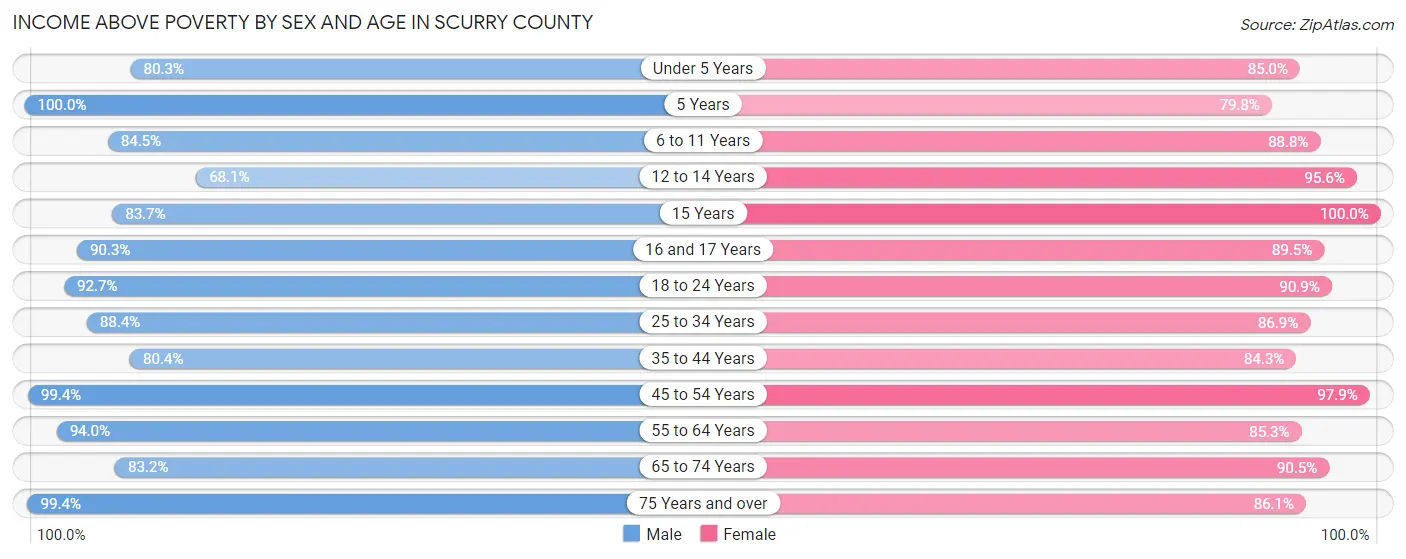
| Age Bracket | Male | Female |
| Under 5 Years | 314 (80.3%) | 539 (85.0%) |
| 5 Years | 114 (100.0%) | 75 (79.8%) |
| 6 to 11 Years | 607 (84.5%) | 570 (88.8%) |
| 12 to 14 Years | 278 (68.1%) | 387 (95.6%) |
| 15 Years | 72 (83.7%) | 54 (100.0%) |
| 16 and 17 Years | 269 (90.3%) | 231 (89.5%) |
| 18 to 24 Years | 681 (92.6%) | 419 (90.9%) |
| 25 to 34 Years | 871 (88.4%) | 877 (86.9%) |
| 35 to 44 Years | 797 (80.4%) | 759 (84.3%) |
| 45 to 54 Years | 636 (99.4%) | 807 (97.9%) |
| 55 to 64 Years | 850 (94.0%) | 788 (85.3%) |
| 65 to 74 Years | 604 (83.2%) | 606 (90.4%) |
| 75 Years and over | 348 (99.4%) | 552 (86.1%) |
| Total | 6,441 (87.7%) | 6,664 (88.7%) |
Income Below Poverty Among Married-Couple Families in Scurry County
The poverty statistics for married-couple families in Scurry County show that 7.7% or 235 of the total 3,038 families live below the poverty line. Families with 3 or 4 children have the highest poverty rate of 29.2%, comprising of 100 families. On the other hand, families with 5 or more children have the lowest poverty rate of 0.0%, which includes 0 families.
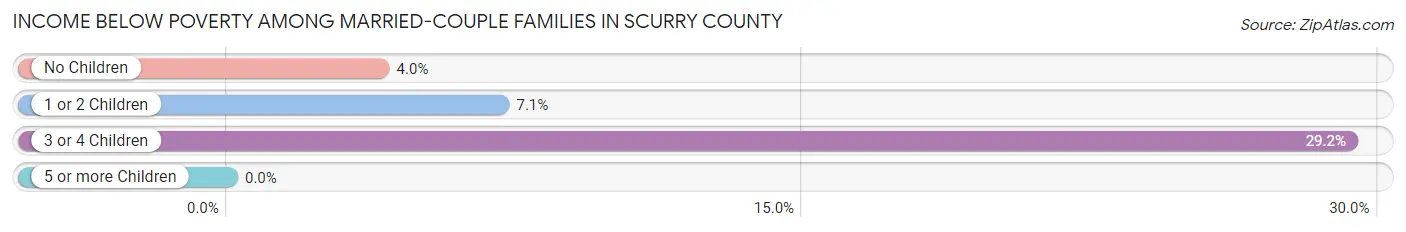
| Children | Above Poverty | Below Poverty |
| No Children | 1,675 (96.0%) | 69 (4.0%) |
| 1 or 2 Children | 865 (92.9%) | 66 (7.1%) |
| 3 or 4 Children | 242 (70.8%) | 100 (29.2%) |
| 5 or more Children | 21 (100.0%) | 0 (0.0%) |
| Total | 2,803 (92.3%) | 235 (7.7%) |
Income Below Poverty Among Single-Parent Households in Scurry County
According to the poverty data in Scurry County, 11.6% or 34 single-father households and 12.4% or 50 single-mother households are living below the poverty line. Among single-father households, those with 3 or 4 children have the highest poverty rate, with 16 households (100.0%) experiencing poverty. Likewise, among single-mother households, those with 3 or 4 children have the highest poverty rate, with 38 households (90.5%) falling below the poverty line.
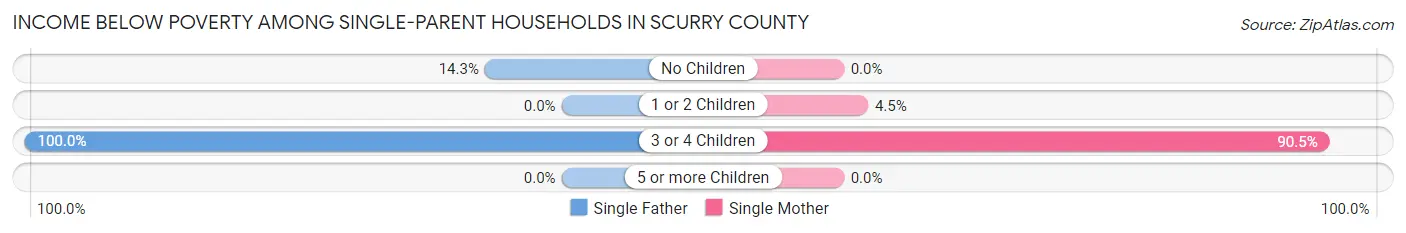
| Children | Single Father | Single Mother |
| No Children | 18 (14.3%) | 0 (0.0%) |
| 1 or 2 Children | 0 (0.0%) | 12 (4.5%) |
| 3 or 4 Children | 16 (100.0%) | 38 (90.5%) |
| 5 or more Children | 0 (0.0%) | 0 (0.0%) |
| Total | 34 (11.6%) | 50 (12.4%) |
Income Below Poverty Among Married-Couple vs Single-Parent Households in Scurry County
The poverty data for Scurry County shows that 235 of the married-couple family households (7.7%) and 84 of the single-parent households (12.1%) are living below the poverty level. Within the married-couple family households, those with 3 or 4 children have the highest poverty rate, with 100 households (29.2%) falling below the poverty line. Among the single-parent households, those with 3 or 4 children have the highest poverty rate, with 54 household (93.1%) living below poverty.
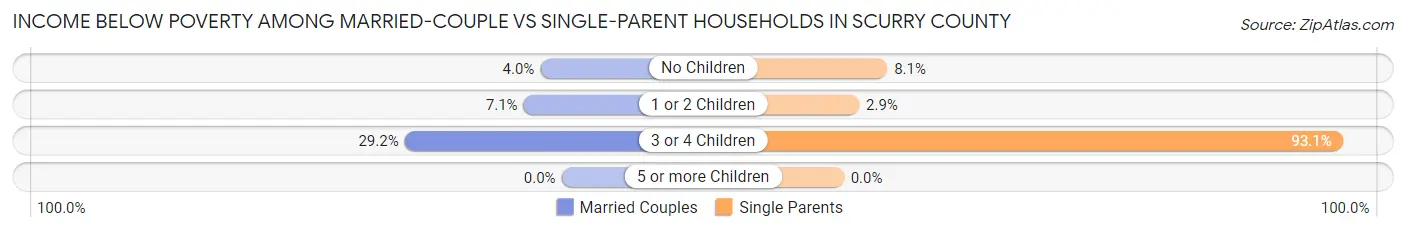
| Children | Married-Couple Families | Single-Parent Households |
| No Children | 69 (4.0%) | 18 (8.1%) |
| 1 or 2 Children | 66 (7.1%) | 12 (2.9%) |
| 3 or 4 Children | 100 (29.2%) | 54 (93.1%) |
| 5 or more Children | 0 (0.0%) | 0 (0.0%) |
| Total | 235 (7.7%) | 84 (12.1%) |
Race in Scurry County
The most populous races in Scurry County are White / Caucasian (12,531 | 74.2%), Hispanic or Latino (7,102 | 42.1%), and Some other Race (1,963 | 11.6%).
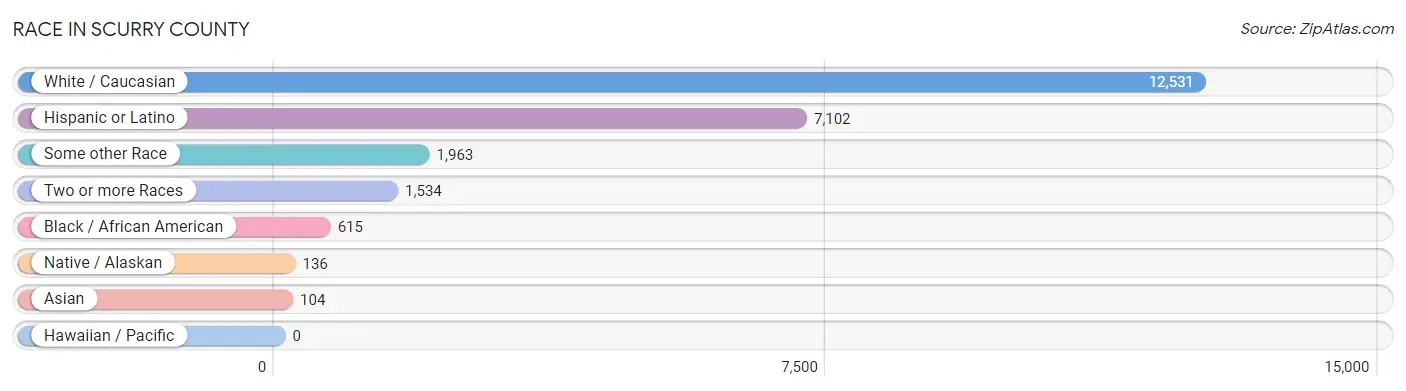
| Race | # Population | % Population |
| Asian | 104 | 0.6% |
| Black / African American | 615 | 3.6% |
| Hawaiian / Pacific | 0 | 0.0% |
| Hispanic or Latino | 7,102 | 42.1% |
| Native / Alaskan | 136 | 0.8% |
| White / Caucasian | 12,531 | 74.2% |
| Two or more Races | 1,534 | 9.1% |
| Some other Race | 1,963 | 11.6% |
| Total | 16,883 | 100.0% |
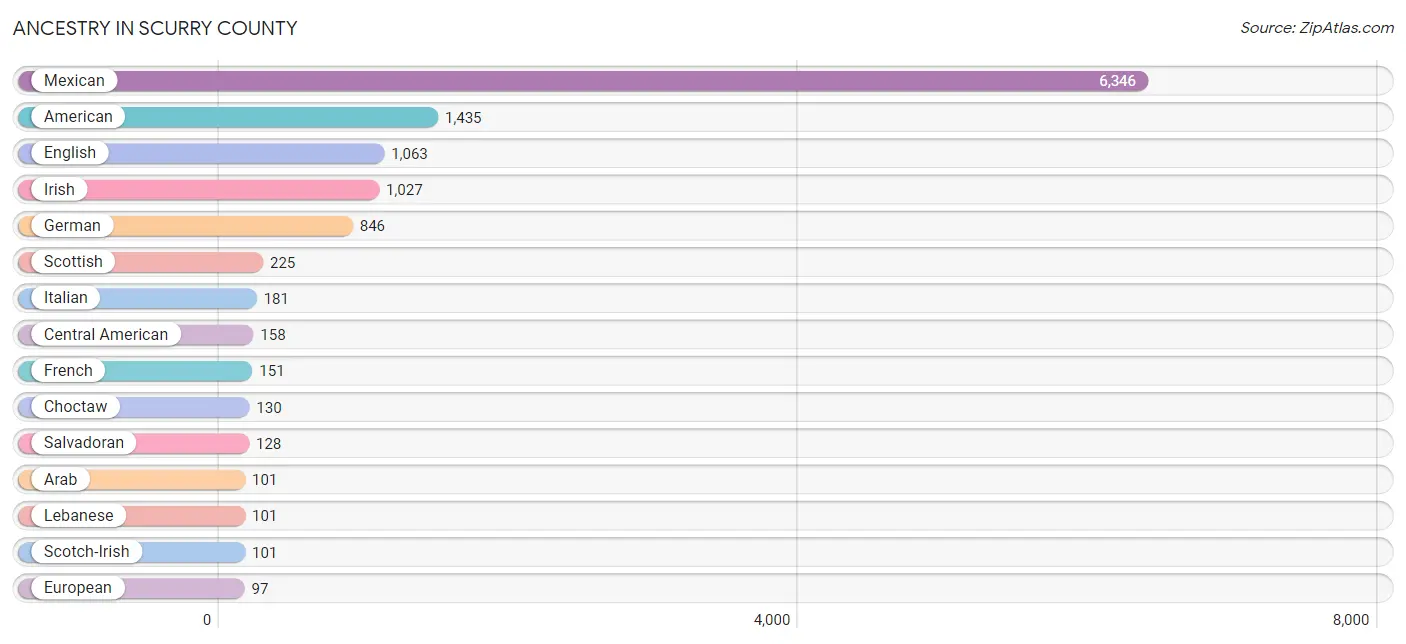
Ancestry in Scurry County
The most populous ancestries reported in Scurry County are Mexican (6,346 | 37.6%), American (1,435 | 8.5%), English (1,063 | 6.3%), Irish (1,027 | 6.1%), and German (846 | 5.0%), together accounting for 63.5% of all Scurry County residents.
| Ancestry | # Population | % Population |
| African | 6 | 0.0% |
| American | 1,435 | 8.5% |
| Apache | 24 | 0.1% |
| Arab | 101 | 0.6% |
| Austrian | 27 | 0.2% |
| Bhutanese | 1 | 0.0% |
| Blackfeet | 17 | 0.1% |
| British | 39 | 0.2% |
| Burmese | 19 | 0.1% |
| Central American | 158 | 0.9% |
| Central American Indian | 12 | 0.1% |
| Cherokee | 75 | 0.4% |
| Chickasaw | 2 | 0.0% |
| Choctaw | 130 | 0.8% |
| Colombian | 5 | 0.0% |
| Creek | 18 | 0.1% |
| Cuban | 9 | 0.1% |
| Czech | 61 | 0.4% |
| Dominican | 4 | 0.0% |
| Dutch | 27 | 0.2% |
| Dutch West Indian | 11 | 0.1% |
| Eastern European | 16 | 0.1% |
| English | 1,063 | 6.3% |
| European | 97 | 0.6% |
| French | 151 | 0.9% |
| French Canadian | 13 | 0.1% |
| German | 846 | 5.0% |
| Greek | 6 | 0.0% |
| Guatemalan | 1 | 0.0% |
| Honduran | 29 | 0.2% |
| Indian (Asian) | 16 | 0.1% |
| Irish | 1,027 | 6.1% |
| Iroquois | 16 | 0.1% |
| Italian | 181 | 1.1% |
| Jamaican | 28 | 0.2% |
| Korean | 42 | 0.3% |
| Laotian | 9 | 0.1% |
| Lebanese | 101 | 0.6% |
| Lithuanian | 10 | 0.1% |
| Mexican | 6,346 | 37.6% |
| Mexican American Indian | 3 | 0.0% |
| Navajo | 3 | 0.0% |
| Nigerian | 7 | 0.0% |
| Northern European | 10 | 0.1% |
| Norwegian | 50 | 0.3% |
| Polish | 12 | 0.1% |
| Puerto Rican | 48 | 0.3% |
| Salvadoran | 128 | 0.8% |
| Samoan | 4 | 0.0% |
| Scandinavian | 13 | 0.1% |
| Scotch-Irish | 101 | 0.6% |
| Scottish | 225 | 1.3% |
| Sioux | 6 | 0.0% |
| South American | 5 | 0.0% |
| Spaniard | 11 | 0.1% |
| Spanish | 88 | 0.5% |
| Spanish American Indian | 2 | 0.0% |
| Sri Lankan | 40 | 0.2% |
| Subsaharan African | 13 | 0.1% |
| Swedish | 2 | 0.0% |
| Welsh | 25 | 0.2% |
| West Indian | 12 | 0.1% | View All 62 Rows |
Immigrants in Scurry County
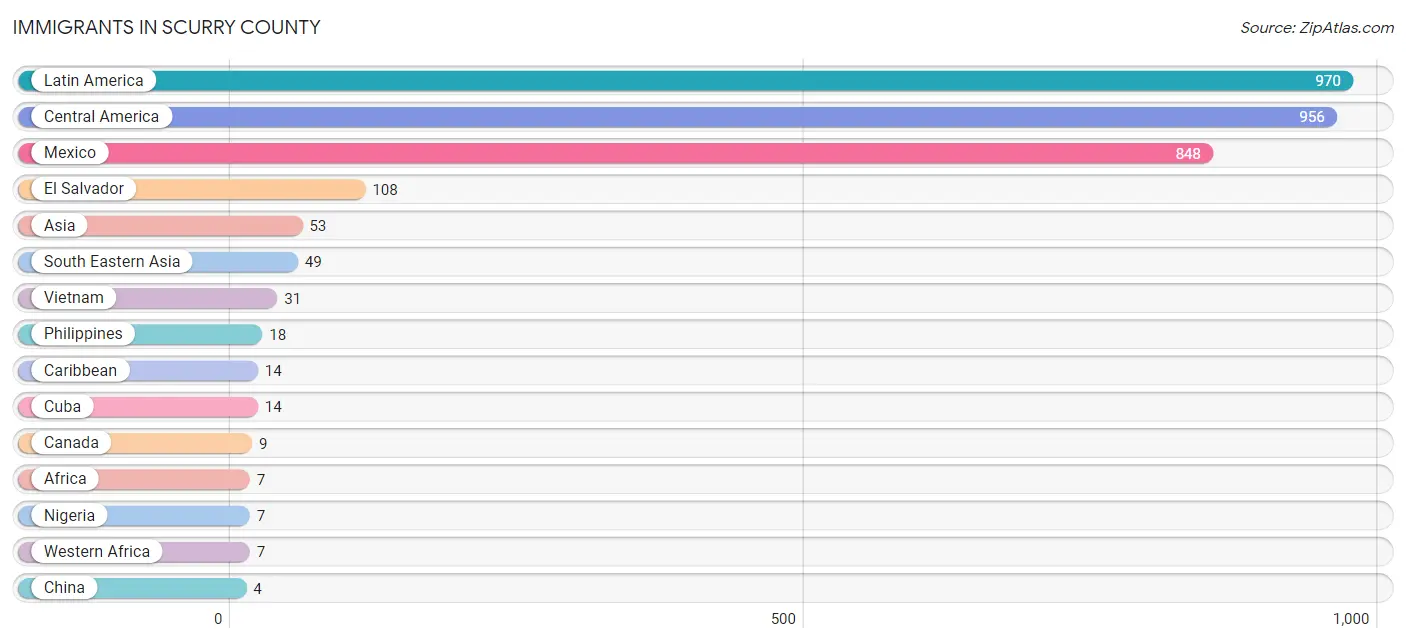
The most numerous immigrant groups reported in Scurry County came from Latin America (970 | 5.8%), Central America (956 | 5.7%), Mexico (848 | 5.0%), El Salvador (108 | 0.6%), and Asia (53 | 0.3%), together accounting for 17.4% of all Scurry County residents.
| Immigration Origin | # Population | % Population |
| Africa | 7 | 0.0% |
| Asia | 53 | 0.3% |
| Canada | 9 | 0.1% |
| Caribbean | 14 | 0.1% |
| Central America | 956 | 5.7% |
| China | 4 | 0.0% |
| Cuba | 14 | 0.1% |
| Eastern Asia | 4 | 0.0% |
| El Salvador | 108 | 0.6% |
| Europe | 1 | 0.0% |
| Hong Kong | 4 | 0.0% |
| Italy | 1 | 0.0% |
| Latin America | 970 | 5.8% |
| Mexico | 848 | 5.0% |
| Nigeria | 7 | 0.0% |
| Philippines | 18 | 0.1% |
| South Eastern Asia | 49 | 0.3% |
| Southern Europe | 1 | 0.0% |
| Vietnam | 31 | 0.2% |
| Western Africa | 7 | 0.0% | View All 20 Rows |
Sex and Age in Scurry County
Sex and Age in Scurry County
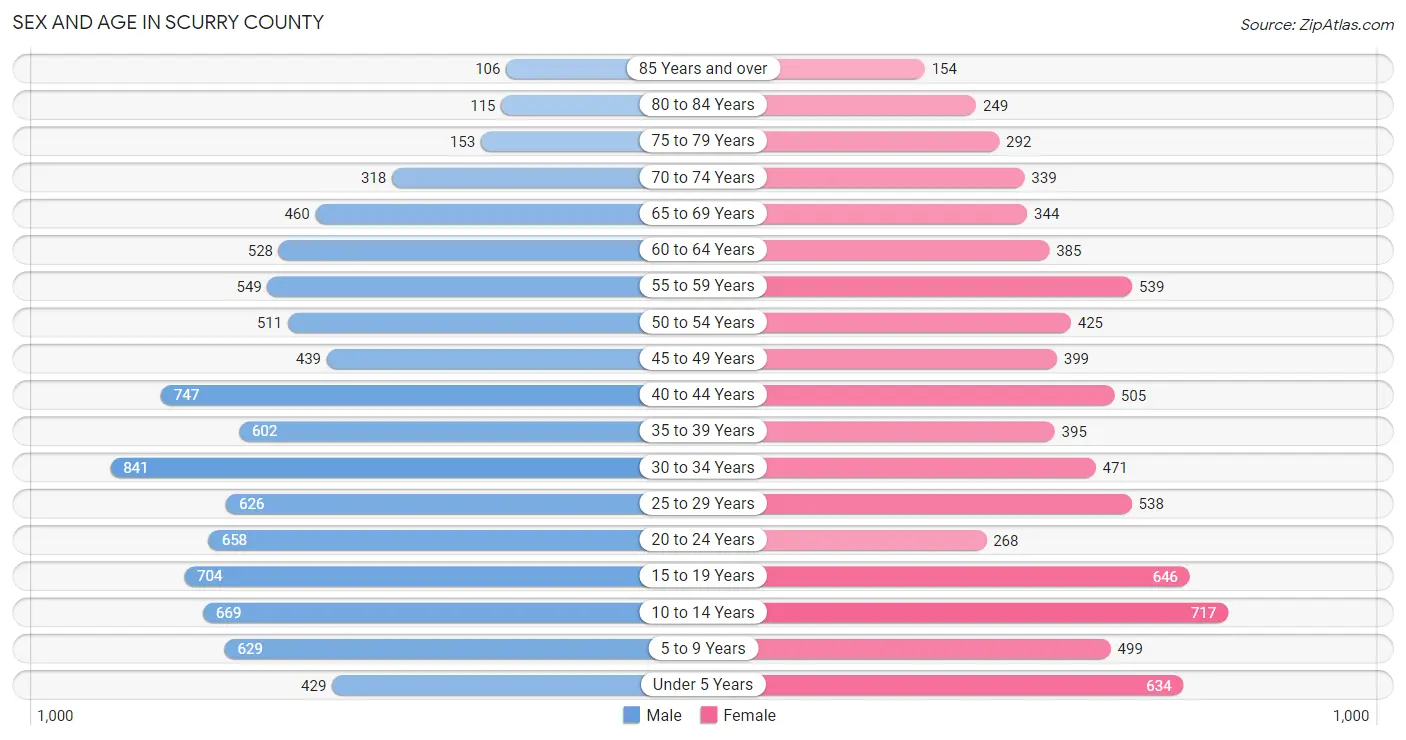
The most populous age groups in Scurry County are 30 to 34 Years (841 | 9.3%) for men and 10 to 14 Years (717 | 9.2%) for women.
| Age Bracket | Male | Female |
| Under 5 Years | 429 (4.7%) | 634 (8.1%) |
| 5 to 9 Years | 629 (6.9%) | 499 (6.4%) |
| 10 to 14 Years | 669 (7.4%) | 717 (9.2%) |
| 15 to 19 Years | 704 (7.7%) | 646 (8.3%) |
| 20 to 24 Years | 658 (7.2%) | 268 (3.4%) |
| 25 to 29 Years | 626 (6.9%) | 538 (6.9%) |
| 30 to 34 Years | 841 (9.3%) | 471 (6.0%) |
| 35 to 39 Years | 602 (6.6%) | 395 (5.1%) |
| 40 to 44 Years | 747 (8.2%) | 505 (6.5%) |
| 45 to 49 Years | 439 (4.8%) | 399 (5.1%) |
| 50 to 54 Years | 511 (5.6%) | 425 (5.4%) |
| 55 to 59 Years | 549 (6.0%) | 539 (6.9%) |
| 60 to 64 Years | 528 (5.8%) | 385 (4.9%) |
| 65 to 69 Years | 460 (5.1%) | 344 (4.4%) |
| 70 to 74 Years | 318 (3.5%) | 339 (4.3%) |
| 75 to 79 Years | 153 (1.7%) | 292 (3.7%) |
| 80 to 84 Years | 115 (1.3%) | 249 (3.2%) |
| 85 Years and over | 106 (1.2%) | 154 (2.0%) |
| Total | 9,084 (100.0%) | 7,799 (100.0%) |
Families and Households in Scurry County
Median Family Size in Scurry County
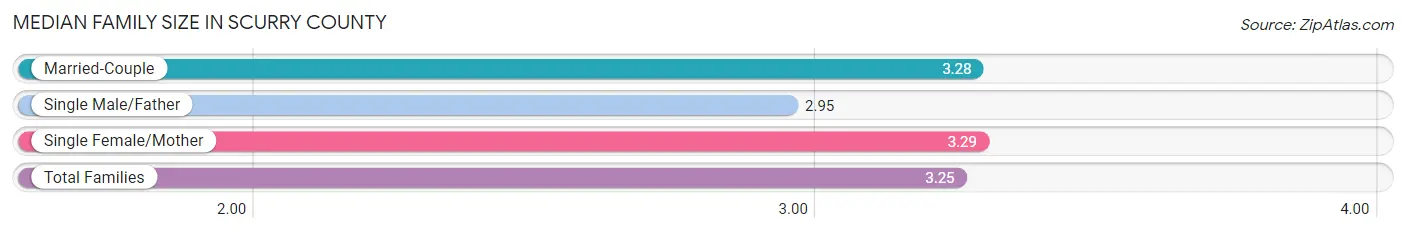
The median family size in Scurry County is 3.25 persons per family, with single female/mother families (403 | 10.8%) accounting for the largest median family size of 3.29 persons per family. On the other hand, single male/father families (293 | 7.9%) represent the smallest median family size with 2.95 persons per family.
| Family Type | # Families | Family Size |
| Married-Couple | 3,038 (81.4%) | 3.28 |
| Single Male/Father | 293 (7.9%) | 2.95 |
| Single Female/Mother | 403 (10.8%) | 3.29 |
| Total Families | 3,734 (100.0%) | 3.25 |
Median Household Size in Scurry County
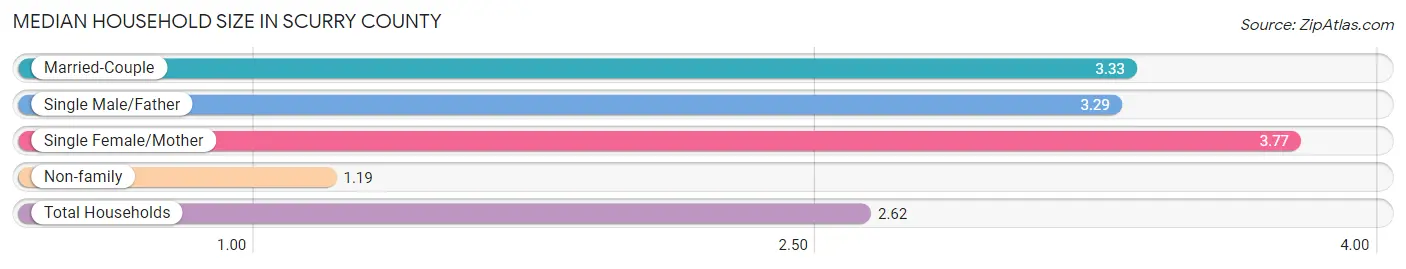
The median household size in Scurry County is 2.62 persons per household, with single female/mother households (403 | 7.1%) accounting for the largest median household size of 3.77 persons per household. non-family households (1,959 | 34.4%) represent the smallest median household size with 1.19 persons per household.
| Household Type | # Households | Household Size |
| Married-Couple | 3,038 (53.4%) | 3.33 |
| Single Male/Father | 293 (5.1%) | 3.29 |
| Single Female/Mother | 403 (7.1%) | 3.77 |
| Non-family | 1,959 (34.4%) | 1.19 |
| Total Households | 5,693 (100.0%) | 2.62 |
Household Size by Marriage Status in Scurry County
Out of a total of 5,693 households in Scurry County, 3,734 (65.6%) are family households, while 1,959 (34.4%) are nonfamily households. The most numerous type of family households are 2-person households, comprising 1,607, and the most common type of nonfamily households are 1-person households, comprising 1,799.
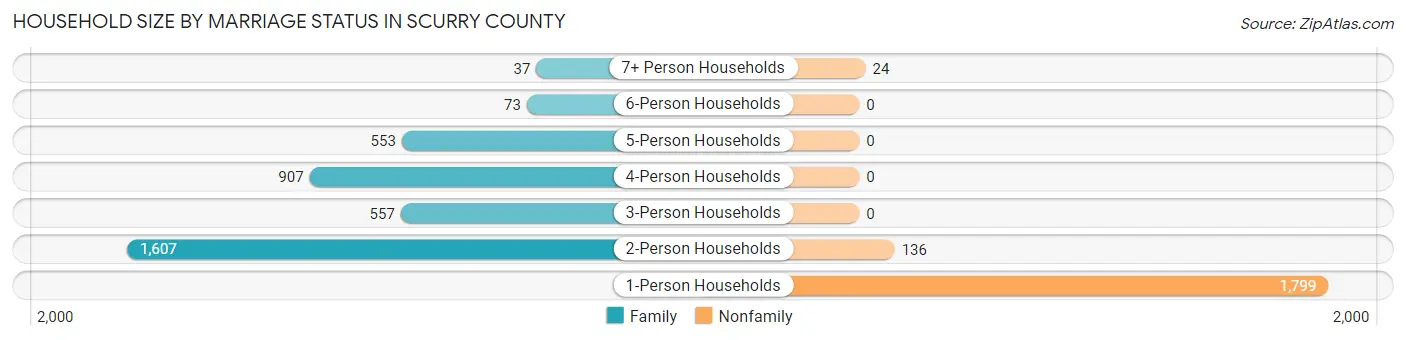
| Household Size | Family Households | Nonfamily Households |
| 1-Person Households | - | 1,799 (31.6%) |
| 2-Person Households | 1,607 (28.2%) | 136 (2.4%) |
| 3-Person Households | 557 (9.8%) | 0 (0.0%) |
| 4-Person Households | 907 (15.9%) | 0 (0.0%) |
| 5-Person Households | 553 (9.7%) | 0 (0.0%) |
| 6-Person Households | 73 (1.3%) | 0 (0.0%) |
| 7+ Person Households | 37 (0.6%) | 24 (0.4%) |
| Total | 3,734 (65.6%) | 1,959 (34.4%) |
Female Fertility in Scurry County
Fertility by Age in Scurry County
Average fertility rate in Scurry County is 106.0 births per 1,000 women. Women in the age bracket of 20 to 34 years have the highest fertility rate with 214.0 births per 1,000 women. Women in the age bracket of 20 to 34 years acount for 77.1% of all women with births.
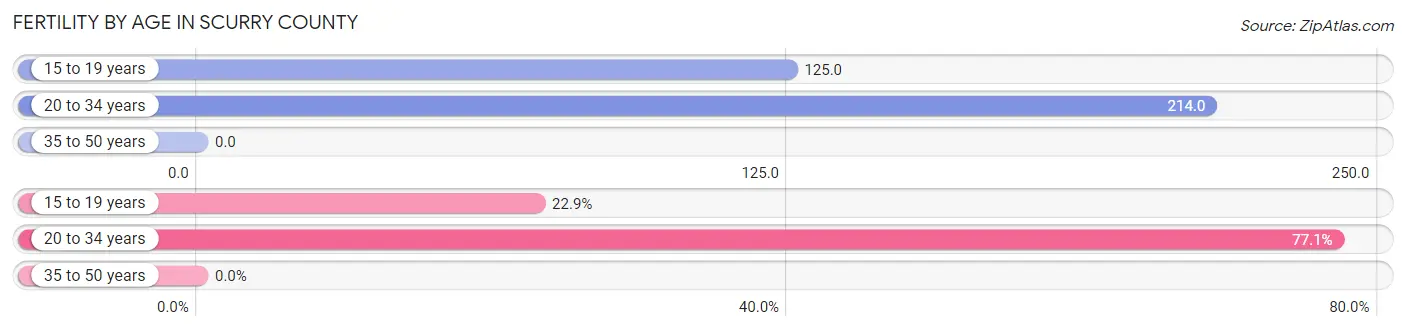
| Age Bracket | Women with Births | Births / 1,000 Women |
| 15 to 19 years | 81 (22.9%) | 125.0 |
| 20 to 34 years | 273 (77.1%) | 214.0 |
| 35 to 50 years | 0 (0.0%) | 0.0 |
| Total | 354 (100.0%) | 106.0 |
Fertility by Age by Marriage Status in Scurry County
77.7% of women with births (354) in Scurry County are married. The highest percentage of unmarried women with births falls into 15 to 19 years age bracket with 55.6% of them unmarried at the time of birth, while the lowest percentage of unmarried women with births belong to 20 to 34 years age bracket with 12.5% of them unmarried.
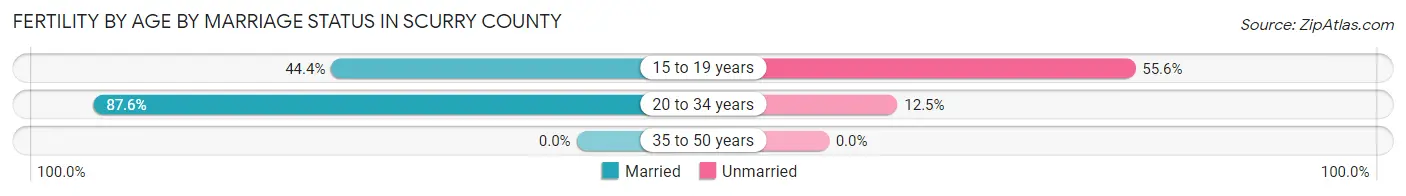
| Age Bracket | Married | Unmarried |
| 15 to 19 years | 36 (44.4%) | 45 (55.6%) |
| 20 to 34 years | 239 (87.5%) | 34 (12.4%) |
| 35 to 50 years | 0 (0.0%) | 0 (0.0%) |
| Total | 275 (77.7%) | 79 (22.3%) |
Fertility by Education in Scurry County
Average fertility rate in Scurry County is 106.0 births per 1,000 women. Women with the education attainment of less than high school have the highest fertility rate of 154.0 births per 1,000 women, while women with the education attainment of high school diploma have the lowest fertility at 42.0 births per 1,000 women. Women with the education attainment of college or associate's degree represent 43.2% of all women with births.
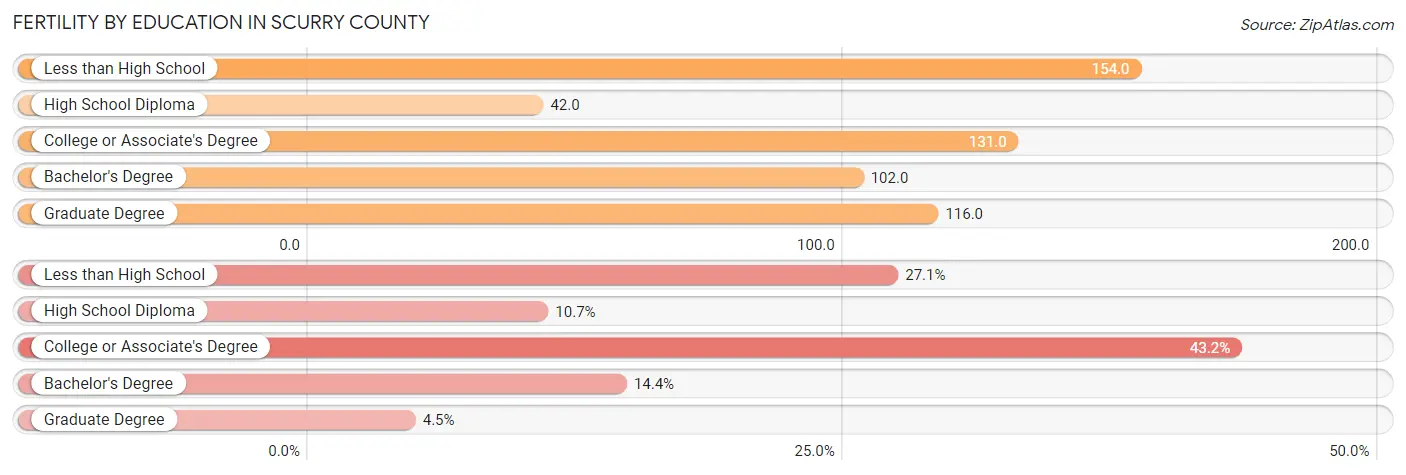
| Educational Attainment | Women with Births | Births / 1,000 Women |
| Less than High School | 96 (27.1%) | 154.0 |
| High School Diploma | 38 (10.7%) | 42.0 |
| College or Associate's Degree | 153 (43.2%) | 131.0 |
| Bachelor's Degree | 51 (14.4%) | 102.0 |
| Graduate Degree | 16 (4.5%) | 116.0 |
| Total | 354 (100.0%) | 106.0 |
Fertility by Education by Marriage Status in Scurry County
22.3% of women with births in Scurry County are unmarried. Women with the educational attainment of bachelor's degree are most likely to be married with 100.0% of them married at childbirth, while women with the educational attainment of less than high school are least likely to be married with 62.5% of them unmarried at childbirth.
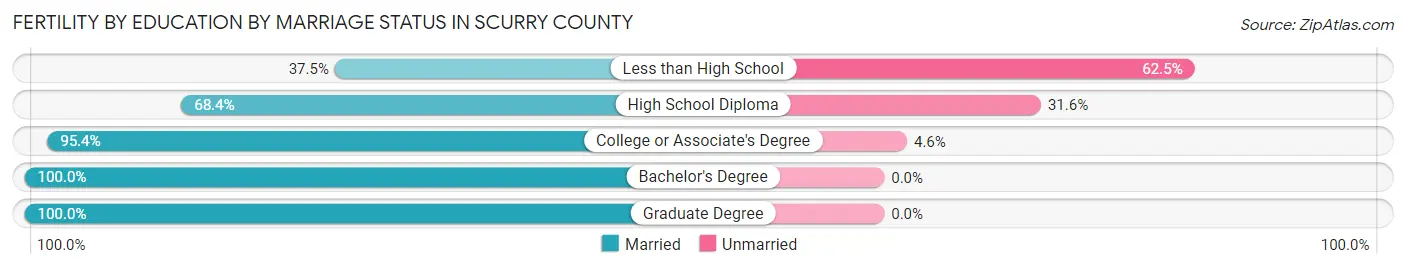
| Educational Attainment | Married | Unmarried |
| Less than High School | 36 (37.5%) | 60 (62.5%) |
| High School Diploma | 26 (68.4%) | 12 (31.6%) |
| College or Associate's Degree | 146 (95.4%) | 7 (4.6%) |
| Bachelor's Degree | 51 (100.0%) | 0 (0.0%) |
| Graduate Degree | 16 (100.0%) | 0 (0.0%) |
| Total | 275 (77.7%) | 79 (22.3%) |
Employment Characteristics in Scurry County
Employment by Class of Employer in Scurry County
Among the 6,876 employed individuals in Scurry County, private company employees (4,458 | 64.8%), local government employees (604 | 8.8%), and self-employed (not incorporated) (590 | 8.6%) make up the most common classes of employment.
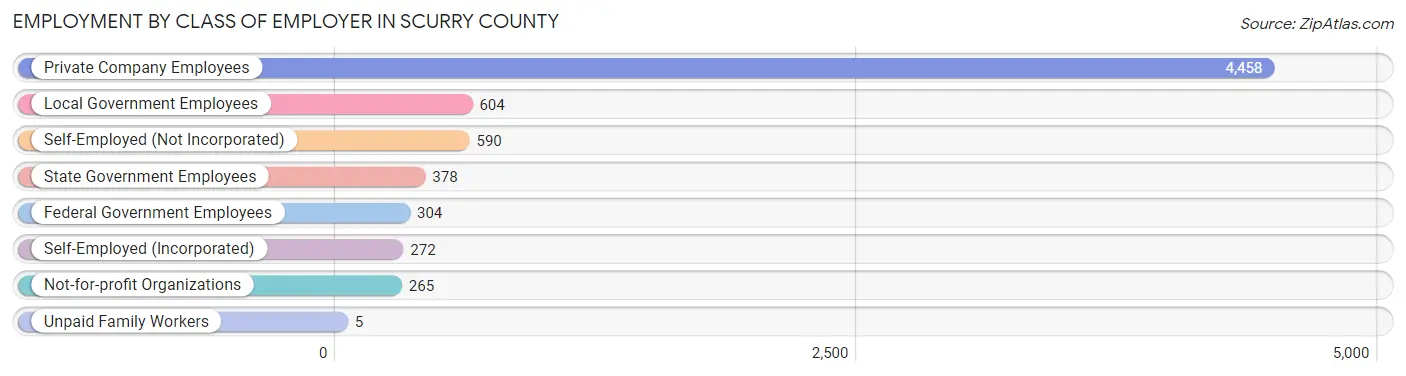
| Employer Class | # Employees | % Employees |
| Private Company Employees | 4,458 | 64.8% |
| Self-Employed (Incorporated) | 272 | 4.0% |
| Self-Employed (Not Incorporated) | 590 | 8.6% |
| Not-for-profit Organizations | 265 | 3.8% |
| Local Government Employees | 604 | 8.8% |
| State Government Employees | 378 | 5.5% |
| Federal Government Employees | 304 | 4.4% |
| Unpaid Family Workers | 5 | 0.1% |
| Total | 6,876 | 100.0% |
Employment Status by Age in Scurry County
According to the labor force statistics for Scurry County, out of the total population over 16 years of age (13,166), 53.7% or 7,070 individuals are in the labor force, with 2.2% or 156 of them unemployed. The age group with the highest labor force participation rate is 35 to 44 years, with 74.6% or 1,678 individuals in the labor force. Within the labor force, the 75 years and over age range has the highest percentage of unemployed individuals, with 10.4% or 7 of them being unemployed.
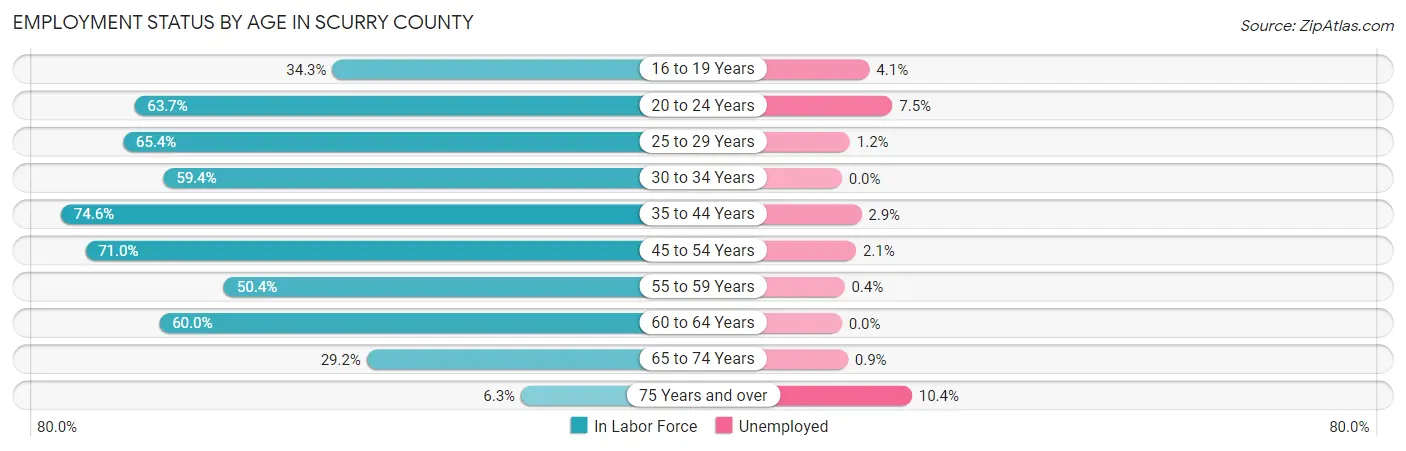
| Age Bracket | In Labor Force | Unemployed |
| 16 to 19 Years | 415 (34.3%) | 17 (4.1%) |
| 20 to 24 Years | 590 (63.7%) | 44 (7.5%) |
| 25 to 29 Years | 761 (65.4%) | 9 (1.2%) |
| 30 to 34 Years | 779 (59.4%) | 0 (0.0%) |
| 35 to 44 Years | 1,678 (74.6%) | 49 (2.9%) |
| 45 to 54 Years | 1,260 (71.0%) | 26 (2.1%) |
| 55 to 59 Years | 548 (50.4%) | 2 (0.4%) |
| 60 to 64 Years | 548 (60.0%) | 0 (0.0%) |
| 65 to 74 Years | 427 (29.2%) | 4 (0.9%) |
| 75 Years and over | 67 (6.3%) | 7 (10.4%) |
| Total | 7,070 (53.7%) | 156 (2.2%) |
Employment Status by Educational Attainment in Scurry County
According to labor force statistics for Scurry County, 65.6% of individuals (5,576) out of the total population between 25 and 64 years of age (8,500) are in the labor force, with 1.6% or 89 of them being unemployed. The group with the highest labor force participation rate are those with the educational attainment of bachelor's degree or higher, with 87.9% or 1,355 individuals in the labor force. Within the labor force, individuals with high school diploma education have the highest percentage of unemployment, with 2.7% or 50 of them being unemployed.
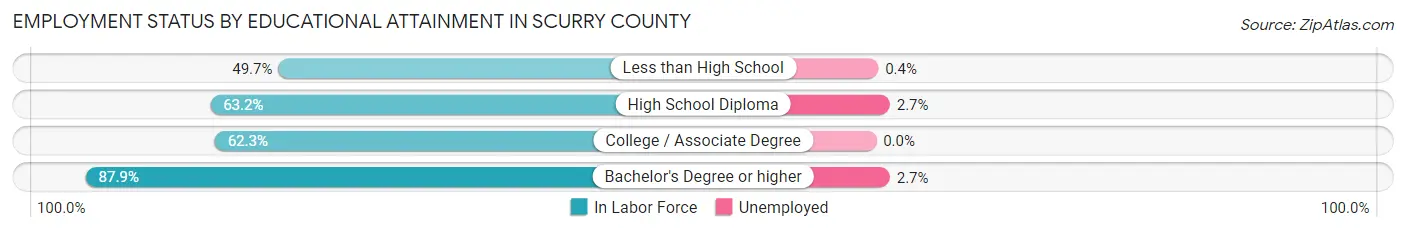
| Educational Attainment | In Labor Force | Unemployed |
| Less than High School | 561 (49.7%) | 5 (0.4%) |
| High School Diploma | 1,837 (63.2%) | 78 (2.7%) |
| College / Associate Degree | 1,821 (62.3%) | 0 (0.0%) |
| Bachelor's Degree or higher | 1,355 (87.9%) | 42 (2.7%) |
| Total | 5,576 (65.6%) | 136 (1.6%) |
Employment Occupations by Sex in Scurry County
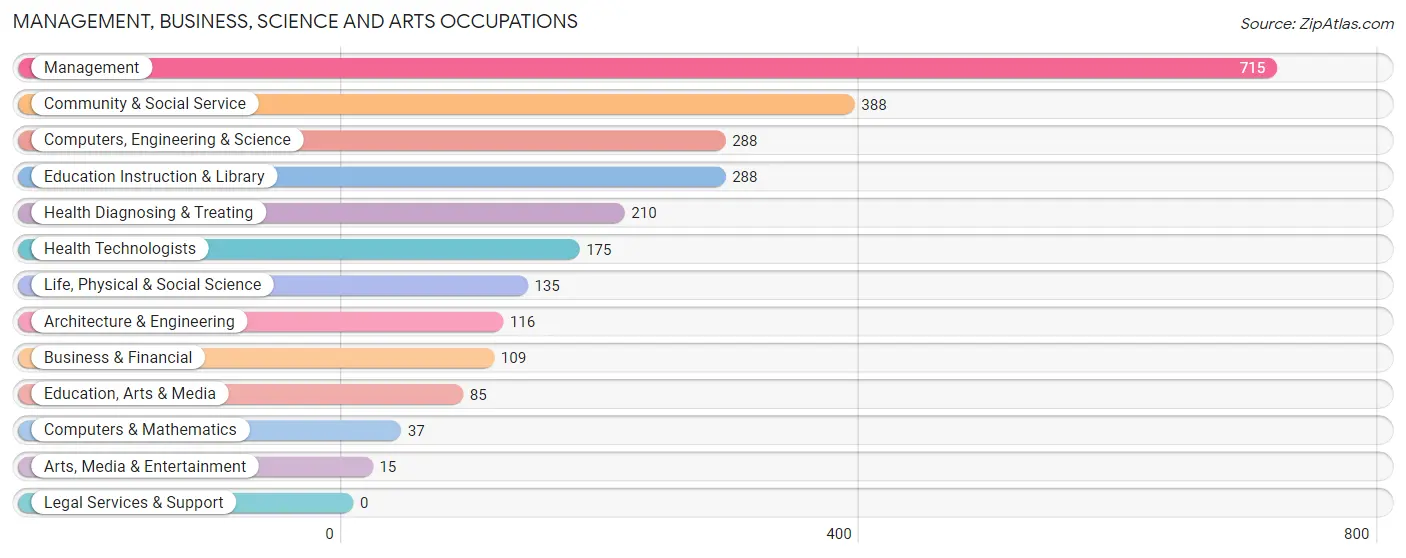
Management, Business, Science and Arts Occupations
The most common Management, Business, Science and Arts occupations in Scurry County are Management (715 | 10.3%), Community & Social Service (388 | 5.6%), Computers, Engineering & Science (288 | 4.2%), Education Instruction & Library (288 | 4.2%), and Health Diagnosing & Treating (210 | 3.0%).
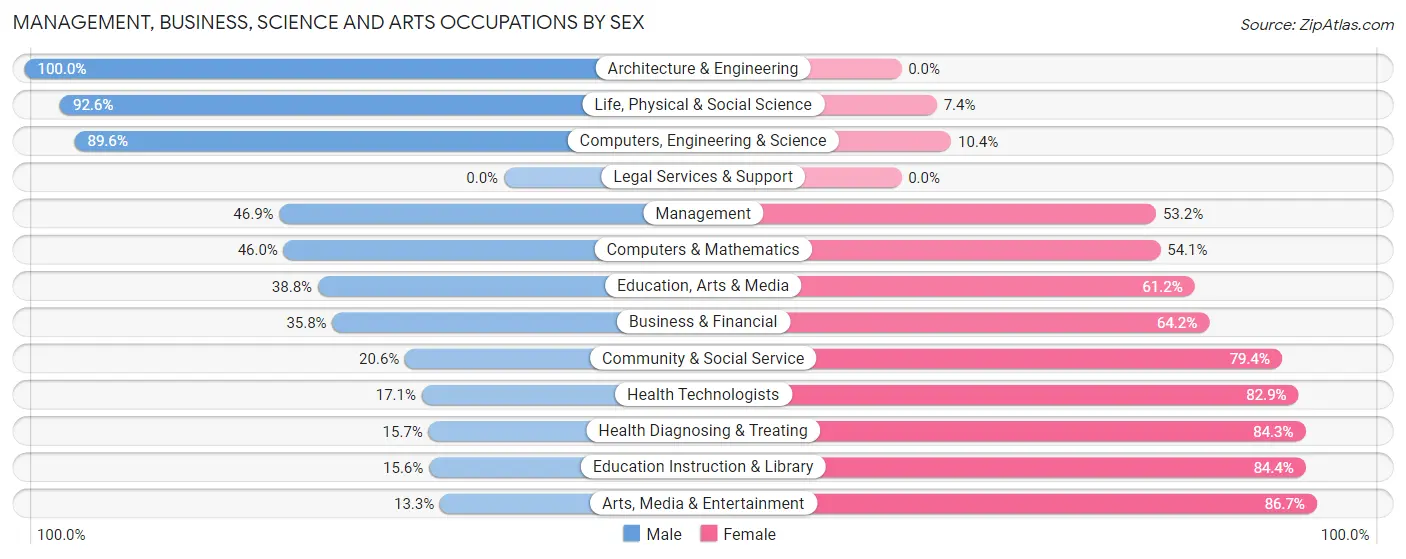
Management, Business, Science and Arts Occupations by Sex
Within the Management, Business, Science and Arts occupations in Scurry County, the most male-oriented occupations are Architecture & Engineering (100.0%), Life, Physical & Social Science (92.6%), and Computers, Engineering & Science (89.6%), while the most female-oriented occupations are Arts, Media & Entertainment (86.7%), Education Instruction & Library (84.4%), and Health Diagnosing & Treating (84.3%).
| Occupation | Male | Female |
| Management | 335 (46.9%) | 380 (53.1%) |
| Business & Financial | 39 (35.8%) | 70 (64.2%) |
| Computers, Engineering & Science | 258 (89.6%) | 30 (10.4%) |
| Computers & Mathematics | 17 (46.0%) | 20 (54.0%) |
| Architecture & Engineering | 116 (100.0%) | 0 (0.0%) |
| Life, Physical & Social Science | 125 (92.6%) | 10 (7.4%) |
| Community & Social Service | 80 (20.6%) | 308 (79.4%) |
| Education, Arts & Media | 33 (38.8%) | 52 (61.2%) |
| Legal Services & Support | 0 (0.0%) | 0 (0.0%) |
| Education Instruction & Library | 45 (15.6%) | 243 (84.4%) |
| Arts, Media & Entertainment | 2 (13.3%) | 13 (86.7%) |
| Health Diagnosing & Treating | 33 (15.7%) | 177 (84.3%) |
| Health Technologists | 30 (17.1%) | 145 (82.9%) |
| Total (Category) | 745 (43.6%) | 965 (56.4%) |
| Total (Overall) | 3,985 (57.7%) | 2,928 (42.3%) |
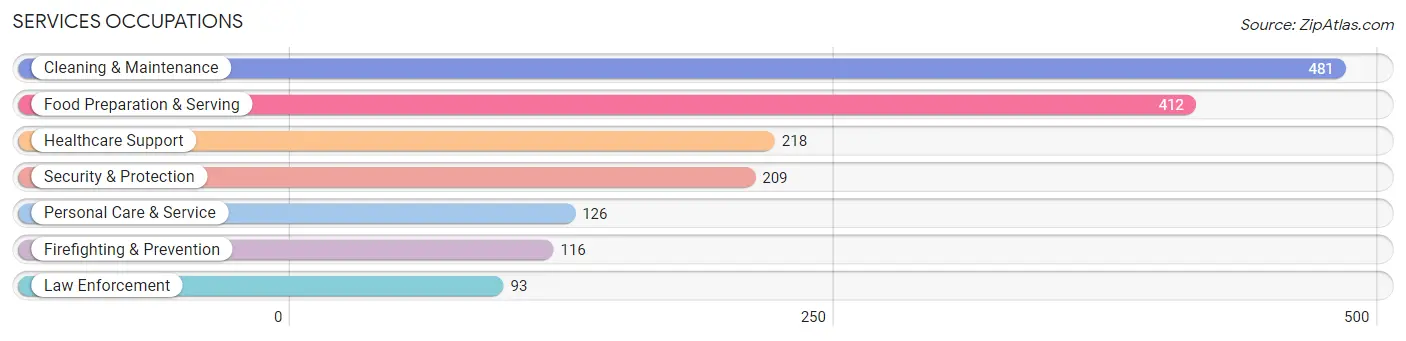
Services Occupations
The most common Services occupations in Scurry County are Cleaning & Maintenance (481 | 7.0%), Food Preparation & Serving (412 | 6.0%), Healthcare Support (218 | 3.2%), Security & Protection (209 | 3.0%), and Personal Care & Service (126 | 1.8%).
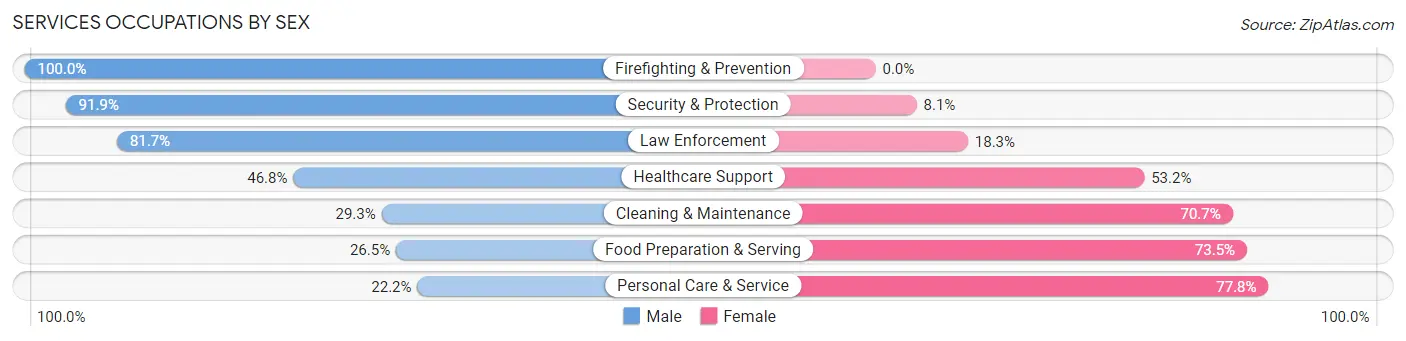
Services Occupations by Sex
Within the Services occupations in Scurry County, the most male-oriented occupations are Firefighting & Prevention (100.0%), Security & Protection (91.9%), and Law Enforcement (81.7%), while the most female-oriented occupations are Personal Care & Service (77.8%), Food Preparation & Serving (73.5%), and Cleaning & Maintenance (70.7%).
| Occupation | Male | Female |
| Healthcare Support | 102 (46.8%) | 116 (53.2%) |
| Security & Protection | 192 (91.9%) | 17 (8.1%) |
| Firefighting & Prevention | 116 (100.0%) | 0 (0.0%) |
| Law Enforcement | 76 (81.7%) | 17 (18.3%) |
| Food Preparation & Serving | 109 (26.5%) | 303 (73.5%) |
| Cleaning & Maintenance | 141 (29.3%) | 340 (70.7%) |
| Personal Care & Service | 28 (22.2%) | 98 (77.8%) |
| Total (Category) | 572 (39.6%) | 874 (60.4%) |
| Total (Overall) | 3,985 (57.7%) | 2,928 (42.3%) |
Sales and Office Occupations
The most common Sales and Office occupations in Scurry County are Office & Administration (952 | 13.8%), and Sales & Related (521 | 7.5%).
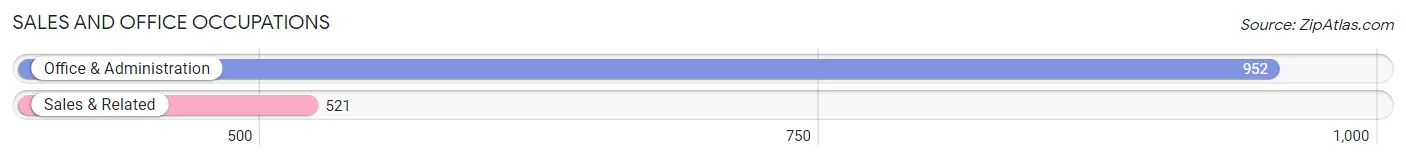
Sales and Office Occupations by Sex
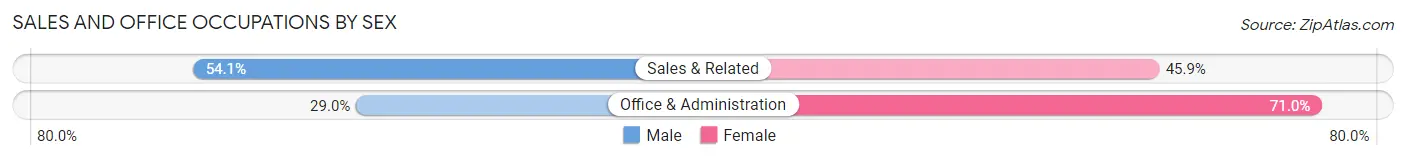
| Occupation | Male | Female |
| Sales & Related | 282 (54.1%) | 239 (45.9%) |
| Office & Administration | 276 (29.0%) | 676 (71.0%) |
| Total (Category) | 558 (37.9%) | 915 (62.1%) |
| Total (Overall) | 3,985 (57.7%) | 2,928 (42.3%) |
Natural Resources, Construction and Maintenance Occupations
The most common Natural Resources, Construction and Maintenance occupations in Scurry County are Construction & Extraction (685 | 9.9%), Installation, Maintenance & Repair (466 | 6.7%), and Farming, Fishing & Forestry (126 | 1.8%).
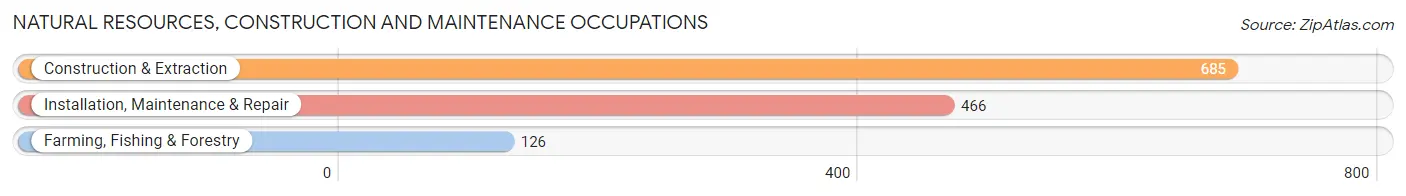
Natural Resources, Construction and Maintenance Occupations by Sex
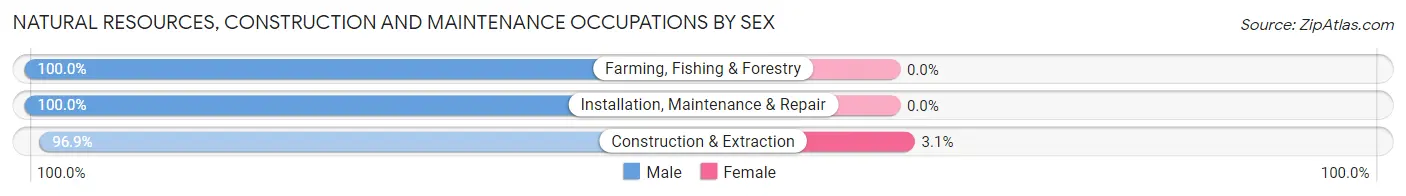
| Occupation | Male | Female |
| Farming, Fishing & Forestry | 126 (100.0%) | 0 (0.0%) |
| Construction & Extraction | 664 (96.9%) | 21 (3.1%) |
| Installation, Maintenance & Repair | 466 (100.0%) | 0 (0.0%) |
| Total (Category) | 1,256 (98.4%) | 21 (1.6%) |
| Total (Overall) | 3,985 (57.7%) | 2,928 (42.3%) |
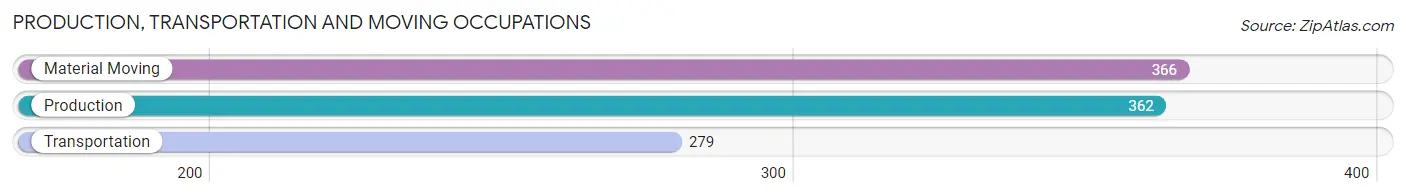
Production, Transportation and Moving Occupations
The most common Production, Transportation and Moving occupations in Scurry County are Material Moving (366 | 5.3%), Production (362 | 5.2%), and Transportation (279 | 4.0%).
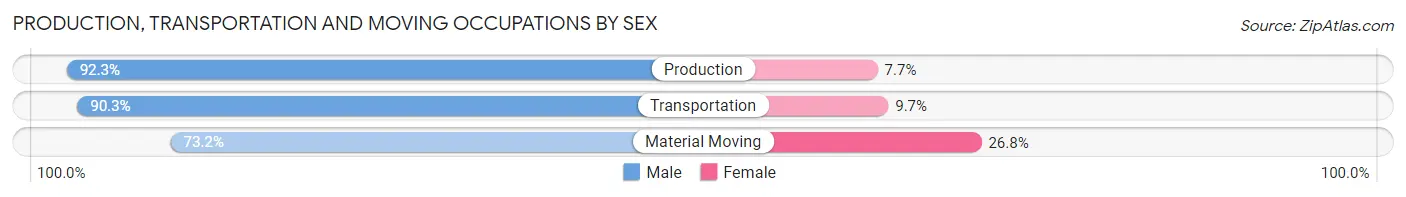
Production, Transportation and Moving Occupations by Sex
| Occupation | Male | Female |
| Production | 334 (92.3%) | 28 (7.7%) |
| Transportation | 252 (90.3%) | 27 (9.7%) |
| Material Moving | 268 (73.2%) | 98 (26.8%) |
| Total (Category) | 854 (84.8%) | 153 (15.2%) |
| Total (Overall) | 3,985 (57.7%) | 2,928 (42.3%) |
Employment Industries by Sex in Scurry County
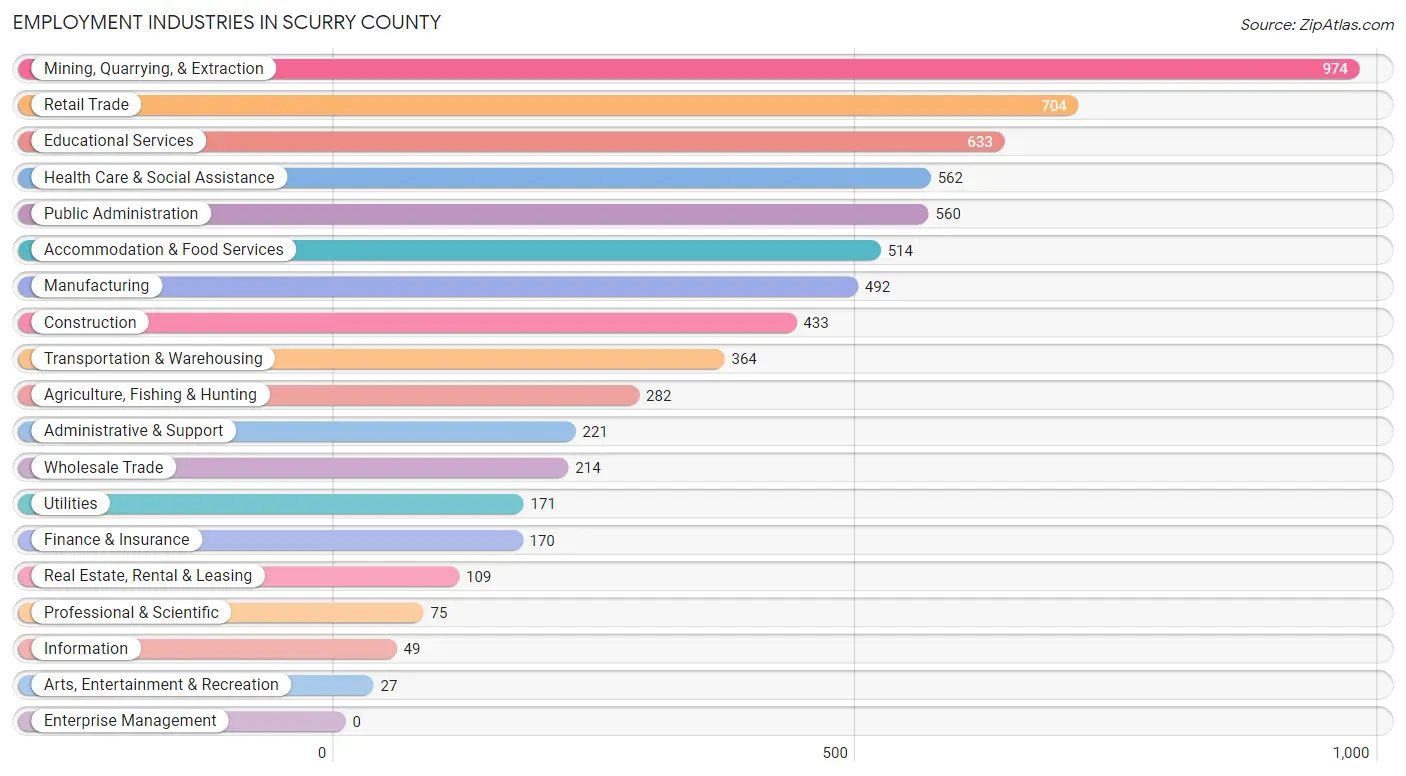
Employment Industries in Scurry County
The major employment industries in Scurry County include Mining, Quarrying, & Extraction (974 | 14.1%), Retail Trade (704 | 10.2%), Educational Services (633 | 9.2%), Health Care & Social Assistance (562 | 8.1%), and Public Administration (560 | 8.1%).
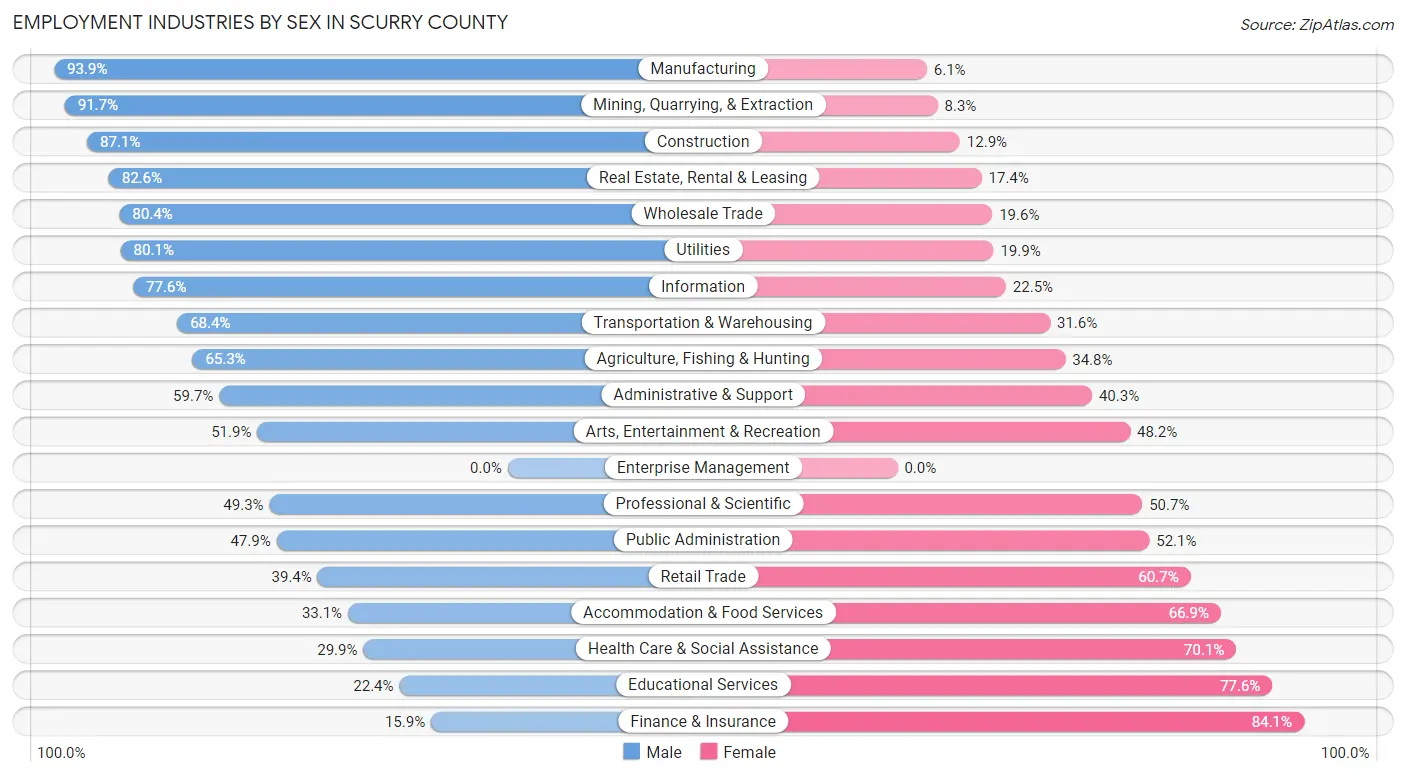
Employment Industries by Sex in Scurry County
The Scurry County industries that see more men than women are Manufacturing (93.9%), Mining, Quarrying, & Extraction (91.7%), and Construction (87.1%), whereas the industries that tend to have a higher number of women are Finance & Insurance (84.1%), Educational Services (77.6%), and Health Care & Social Assistance (70.1%).
| Industry | Male | Female |
| Agriculture, Fishing & Hunting | 184 (65.2%) | 98 (34.7%) |
| Mining, Quarrying, & Extraction | 893 (91.7%) | 81 (8.3%) |
| Construction | 377 (87.1%) | 56 (12.9%) |
| Manufacturing | 462 (93.9%) | 30 (6.1%) |
| Wholesale Trade | 172 (80.4%) | 42 (19.6%) |
| Retail Trade | 277 (39.4%) | 427 (60.7%) |
| Transportation & Warehousing | 249 (68.4%) | 115 (31.6%) |
| Utilities | 137 (80.1%) | 34 (19.9%) |
| Information | 38 (77.5%) | 11 (22.5%) |
| Finance & Insurance | 27 (15.9%) | 143 (84.1%) |
| Real Estate, Rental & Leasing | 90 (82.6%) | 19 (17.4%) |
| Professional & Scientific | 37 (49.3%) | 38 (50.7%) |
| Enterprise Management | 0 (0.0%) | 0 (0.0%) |
| Administrative & Support | 132 (59.7%) | 89 (40.3%) |
| Educational Services | 142 (22.4%) | 491 (77.6%) |
| Health Care & Social Assistance | 168 (29.9%) | 394 (70.1%) |
| Arts, Entertainment & Recreation | 14 (51.8%) | 13 (48.1%) |
| Accommodation & Food Services | 170 (33.1%) | 344 (66.9%) |
| Public Administration | 268 (47.9%) | 292 (52.1%) |
| Total | 3,985 (57.7%) | 2,928 (42.3%) |
Education in Scurry County
School Enrollment in Scurry County
The most common levels of schooling among the 4,152 students in Scurry County are high school (1,063 | 25.6%), middle school (1,007 | 24.2%), and elementary school (917 | 22.1%).
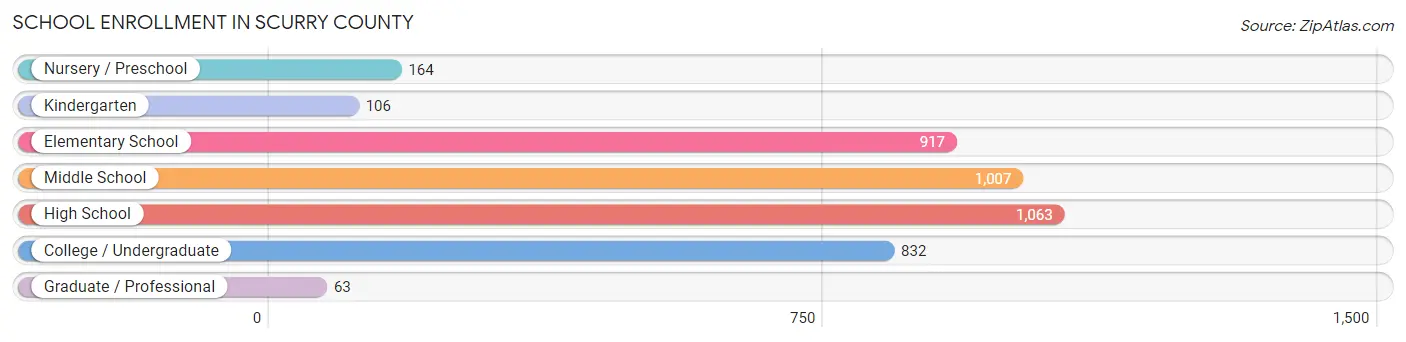
| School Level | # Students | % Students |
| Nursery / Preschool | 164 | 4.0% |
| Kindergarten | 106 | 2.5% |
| Elementary School | 917 | 22.1% |
| Middle School | 1,007 | 24.2% |
| High School | 1,063 | 25.6% |
| College / Undergraduate | 832 | 20.0% |
| Graduate / Professional | 63 | 1.5% |
| Total | 4,152 | 100.0% |
School Enrollment by Age by Funding Source in Scurry County
Out of a total of 4,152 students who are enrolled in schools in Scurry County, 527 (12.7%) attend a private institution, while the remaining 3,625 (87.3%) are enrolled in public schools. The age group of 25 to 34 year olds has the highest likelihood of being enrolled in private schools, with 164 (39.4% in the age bracket) enrolled. Conversely, the age group of 5 to 9 year old has the lowest likelihood of being enrolled in a private school, with 878 (93.5% in the age bracket) attending a public institution.
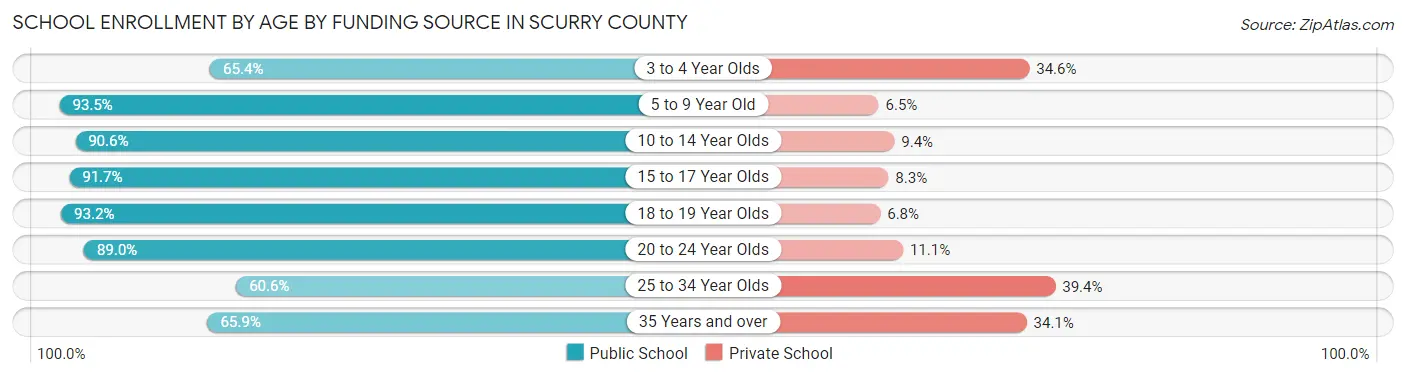
| Age Bracket | Public School | Private School |
| 3 to 4 Year Olds | 53 (65.4%) | 28 (34.6%) |
| 5 to 9 Year Old | 878 (93.5%) | 61 (6.5%) |
| 10 to 14 Year Olds | 1,151 (90.6%) | 120 (9.4%) |
| 15 to 17 Year Olds | 605 (91.7%) | 55 (8.3%) |
| 18 to 19 Year Olds | 437 (93.2%) | 32 (6.8%) |
| 20 to 24 Year Olds | 161 (88.9%) | 20 (11.1%) |
| 25 to 34 Year Olds | 252 (60.6%) | 164 (39.4%) |
| 35 Years and over | 89 (65.9%) | 46 (34.1%) |
| Total | 3,625 (87.3%) | 527 (12.7%) |
Educational Attainment by Field of Study in Scurry County
Business (430 | 20.0%), education (365 | 17.0%), bio, nature & agricultural (244 | 11.3%), science & technology (223 | 10.4%), and physical & health sciences (180 | 8.4%) are the most common fields of study among 2,152 individuals in Scurry County who have obtained a bachelor's degree or higher.
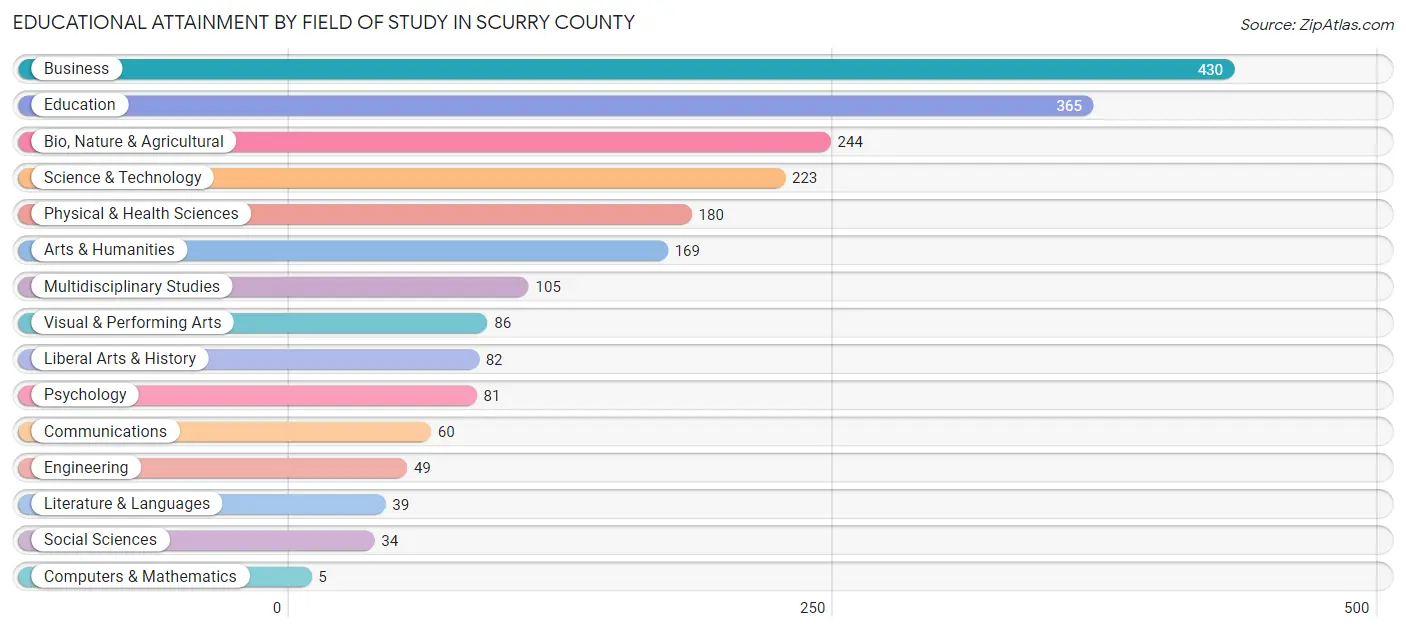
| Field of Study | # Graduates | % Graduates |
| Computers & Mathematics | 5 | 0.2% |
| Bio, Nature & Agricultural | 244 | 11.3% |
| Physical & Health Sciences | 180 | 8.4% |
| Psychology | 81 | 3.8% |
| Social Sciences | 34 | 1.6% |
| Engineering | 49 | 2.3% |
| Multidisciplinary Studies | 105 | 4.9% |
| Science & Technology | 223 | 10.4% |
| Business | 430 | 20.0% |
| Education | 365 | 17.0% |
| Literature & Languages | 39 | 1.8% |
| Liberal Arts & History | 82 | 3.8% |
| Visual & Performing Arts | 86 | 4.0% |
| Communications | 60 | 2.8% |
| Arts & Humanities | 169 | 7.9% |
| Total | 2,152 | 100.0% |
Transportation & Commute in Scurry County
Vehicle Availability by Sex in Scurry County
The most prevalent vehicle ownership categories in Scurry County are males with 2 vehicles (2,048, accounting for 52.8%) and females with 2 vehicles (1,315, making up 71.1%).
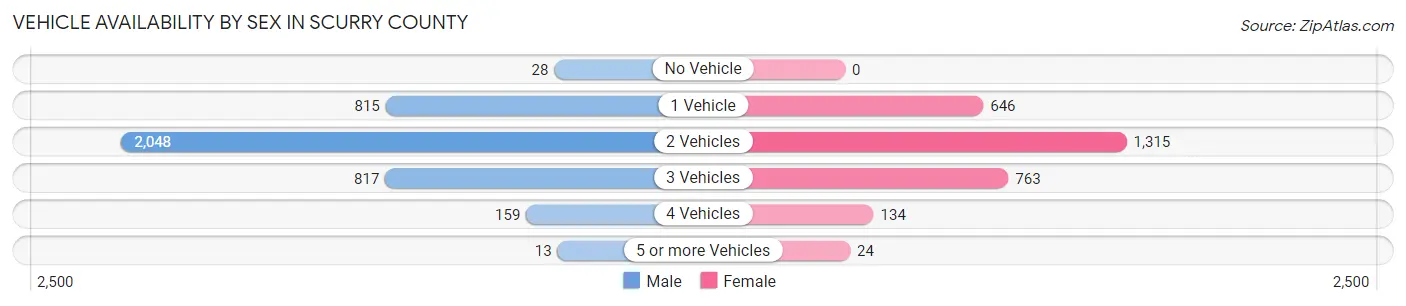
| Vehicles Available | Male | Female |
| No Vehicle | 28 (0.7%) | 0 (0.0%) |
| 1 Vehicle | 815 (21.0%) | 646 (22.4%) |
| 2 Vehicles | 2,048 (52.8%) | 1,315 (45.6%) |
| 3 Vehicles | 817 (21.1%) | 763 (26.5%) |
| 4 Vehicles | 159 (4.1%) | 134 (4.6%) |
| 5 or more Vehicles | 13 (0.3%) | 24 (0.8%) |
| Total | 3,880 (100.0%) | 2,882 (100.0%) |
Commute Time in Scurry County
The most frequently occuring commute durations in Scurry County are 5 to 9 minutes (2,330 commuters, 34.9%), 10 to 14 minutes (1,559 commuters, 23.4%), and 15 to 19 minutes (1,056 commuters, 15.8%).
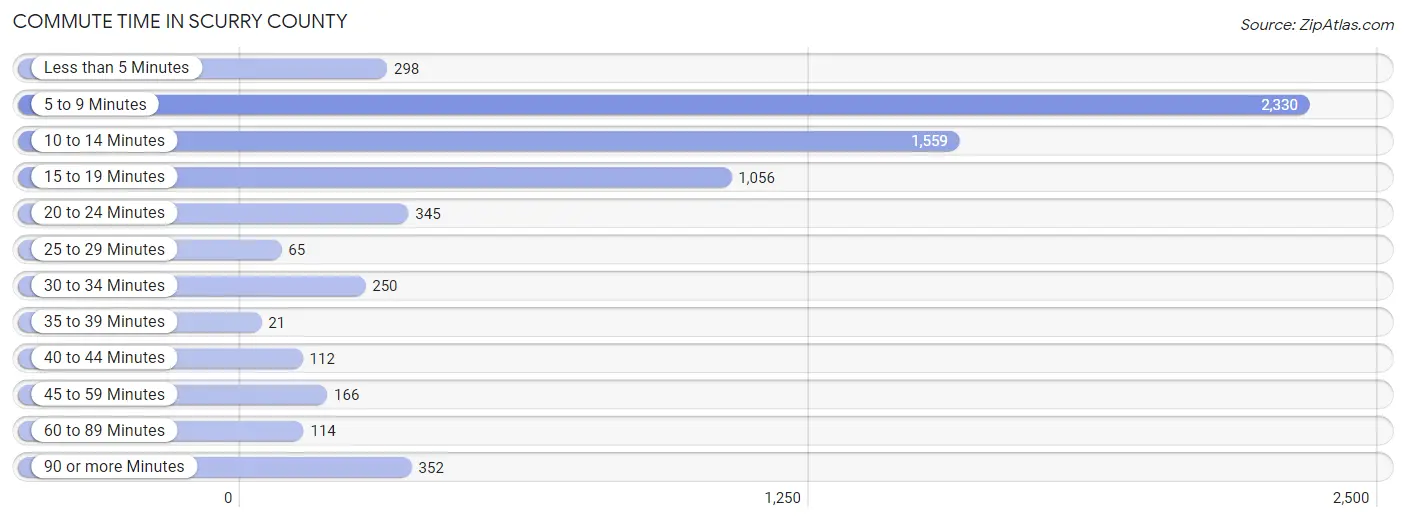
| Commute Time | # Commuters | % Commuters |
| Less than 5 Minutes | 298 | 4.5% |
| 5 to 9 Minutes | 2,330 | 34.9% |
| 10 to 14 Minutes | 1,559 | 23.4% |
| 15 to 19 Minutes | 1,056 | 15.8% |
| 20 to 24 Minutes | 345 | 5.2% |
| 25 to 29 Minutes | 65 | 1.0% |
| 30 to 34 Minutes | 250 | 3.7% |
| 35 to 39 Minutes | 21 | 0.3% |
| 40 to 44 Minutes | 112 | 1.7% |
| 45 to 59 Minutes | 166 | 2.5% |
| 60 to 89 Minutes | 114 | 1.7% |
| 90 or more Minutes | 352 | 5.3% |
Commute Time by Sex in Scurry County
The most common commute times in Scurry County are 5 to 9 minutes (1,132 commuters, 29.0%) for males and 5 to 9 minutes (1,198 commuters, 43.3%) for females.
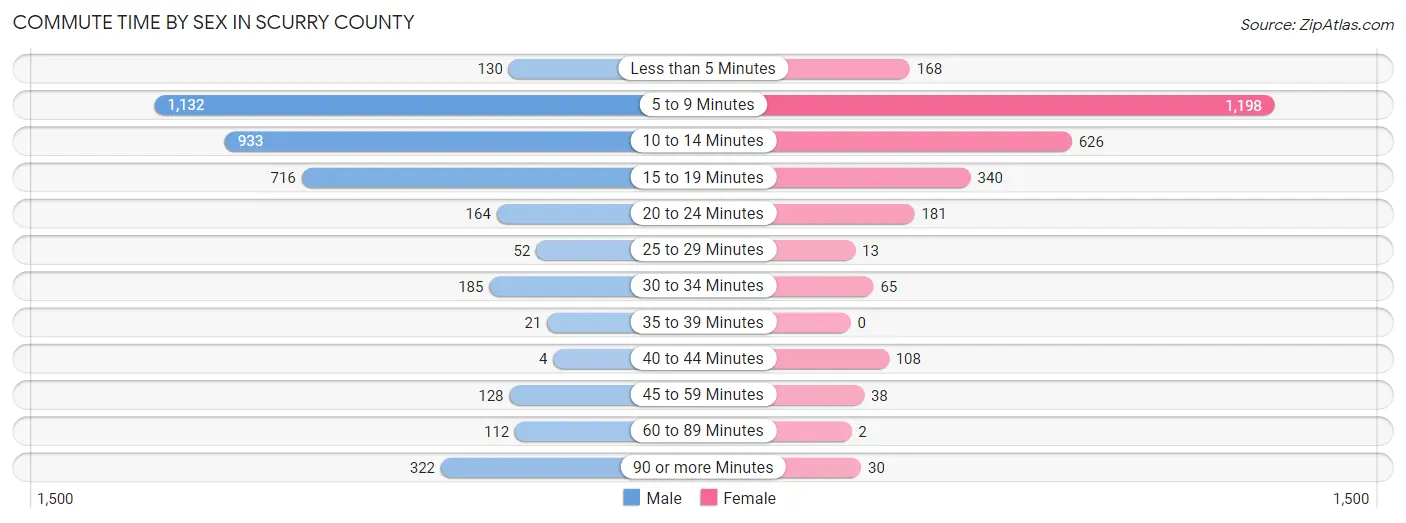
| Commute Time | Male | Female |
| Less than 5 Minutes | 130 (3.3%) | 168 (6.1%) |
| 5 to 9 Minutes | 1,132 (29.0%) | 1,198 (43.3%) |
| 10 to 14 Minutes | 933 (23.9%) | 626 (22.6%) |
| 15 to 19 Minutes | 716 (18.4%) | 340 (12.3%) |
| 20 to 24 Minutes | 164 (4.2%) | 181 (6.5%) |
| 25 to 29 Minutes | 52 (1.3%) | 13 (0.5%) |
| 30 to 34 Minutes | 185 (4.7%) | 65 (2.4%) |
| 35 to 39 Minutes | 21 (0.5%) | 0 (0.0%) |
| 40 to 44 Minutes | 4 (0.1%) | 108 (3.9%) |
| 45 to 59 Minutes | 128 (3.3%) | 38 (1.4%) |
| 60 to 89 Minutes | 112 (2.9%) | 2 (0.1%) |
| 90 or more Minutes | 322 (8.3%) | 30 (1.1%) |
Time of Departure to Work by Sex in Scurry County
The most frequent times of departure to work in Scurry County are 7:00 AM to 7:29 AM (641, 16.4%) for males and 7:30 AM to 7:59 AM (525, 19.0%) for females.
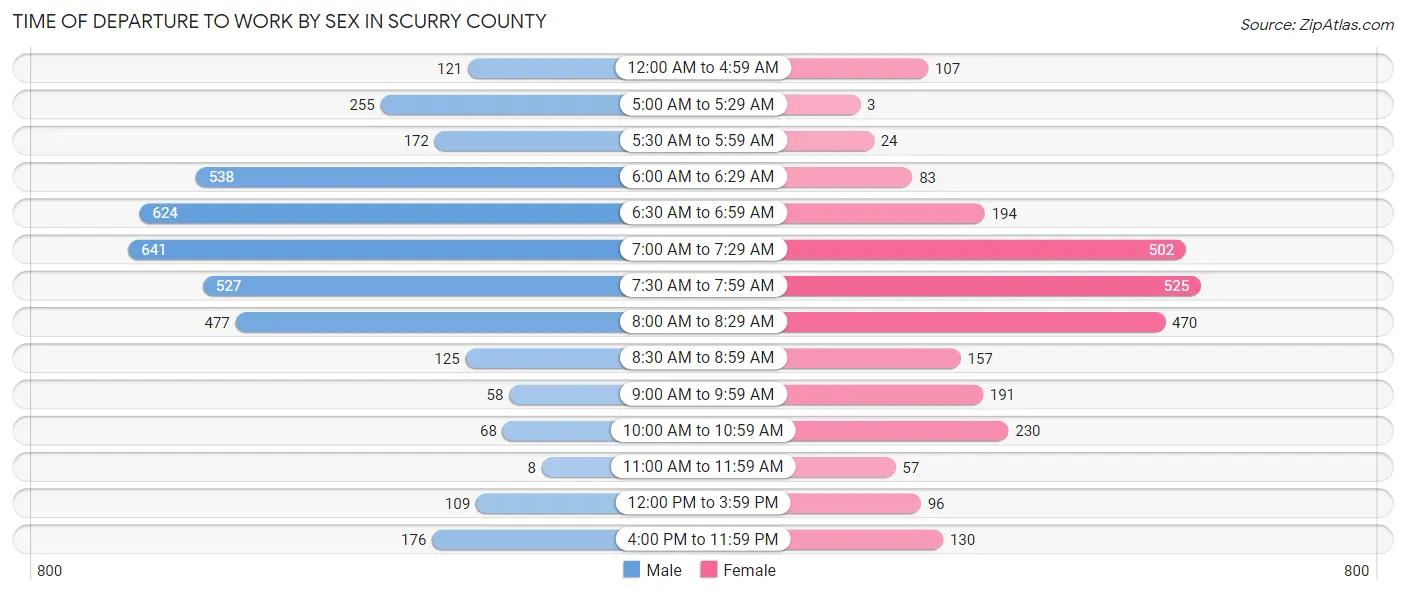
| Time of Departure | Male | Female |
| 12:00 AM to 4:59 AM | 121 (3.1%) | 107 (3.9%) |
| 5:00 AM to 5:29 AM | 255 (6.5%) | 3 (0.1%) |
| 5:30 AM to 5:59 AM | 172 (4.4%) | 24 (0.9%) |
| 6:00 AM to 6:29 AM | 538 (13.8%) | 83 (3.0%) |
| 6:30 AM to 6:59 AM | 624 (16.0%) | 194 (7.0%) |
| 7:00 AM to 7:29 AM | 641 (16.4%) | 502 (18.1%) |
| 7:30 AM to 7:59 AM | 527 (13.5%) | 525 (19.0%) |
| 8:00 AM to 8:29 AM | 477 (12.2%) | 470 (17.0%) |
| 8:30 AM to 8:59 AM | 125 (3.2%) | 157 (5.7%) |
| 9:00 AM to 9:59 AM | 58 (1.5%) | 191 (6.9%) |
| 10:00 AM to 10:59 AM | 68 (1.7%) | 230 (8.3%) |
| 11:00 AM to 11:59 AM | 8 (0.2%) | 57 (2.1%) |
| 12:00 PM to 3:59 PM | 109 (2.8%) | 96 (3.5%) |
| 4:00 PM to 11:59 PM | 176 (4.5%) | 130 (4.7%) |
| Total | 3,899 (100.0%) | 2,769 (100.0%) |
Housing Occupancy in Scurry County
Occupancy by Ownership in Scurry County
Of the total 5,693 dwellings in Scurry County, owner-occupied units account for 4,603 (80.8%), while renter-occupied units make up 1,090 (19.2%).
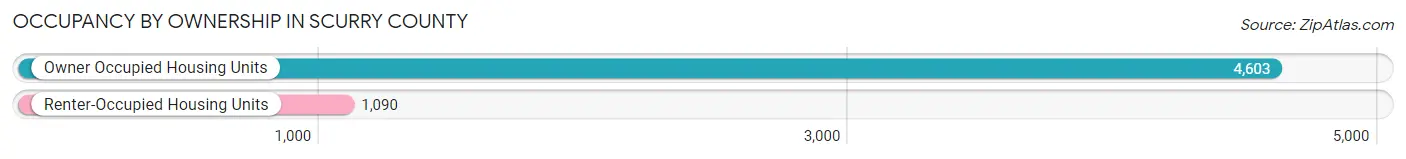
| Occupancy | # Housing Units | % Housing Units |
| Owner Occupied Housing Units | 4,603 | 80.8% |
| Renter-Occupied Housing Units | 1,090 | 19.2% |
| Total Occupied Housing Units | 5,693 | 100.0% |
Occupancy by Household Size in Scurry County
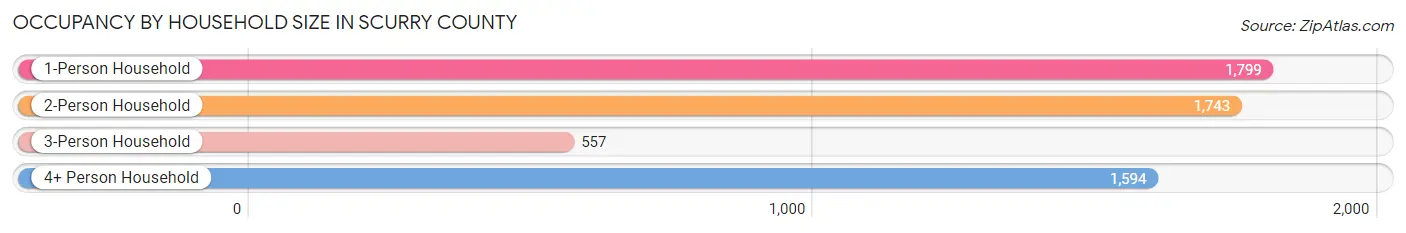
| Household Size | # Housing Units | % Housing Units |
| 1-Person Household | 1,799 | 31.6% |
| 2-Person Household | 1,743 | 30.6% |
| 3-Person Household | 557 | 9.8% |
| 4+ Person Household | 1,594 | 28.0% |
| Total Housing Units | 5,693 | 100.0% |
Occupancy by Ownership by Household Size in Scurry County
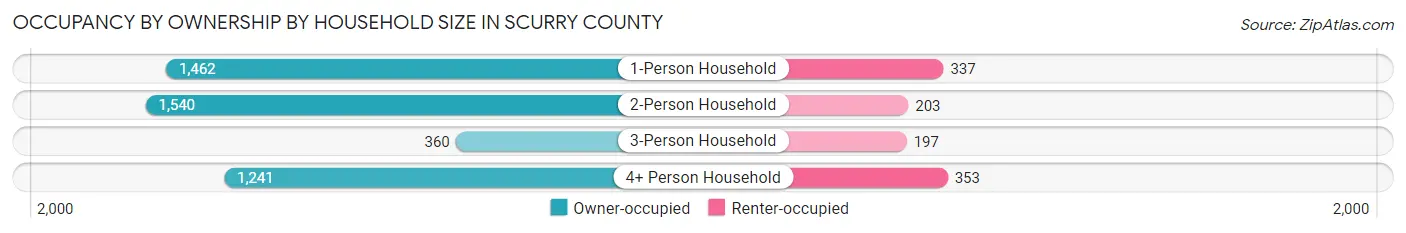
| Household Size | Owner-occupied | Renter-occupied |
| 1-Person Household | 1,462 (81.3%) | 337 (18.7%) |
| 2-Person Household | 1,540 (88.3%) | 203 (11.7%) |
| 3-Person Household | 360 (64.6%) | 197 (35.4%) |
| 4+ Person Household | 1,241 (77.8%) | 353 (22.2%) |
| Total Housing Units | 4,603 (80.8%) | 1,090 (19.2%) |
Occupancy by Educational Attainment in Scurry County
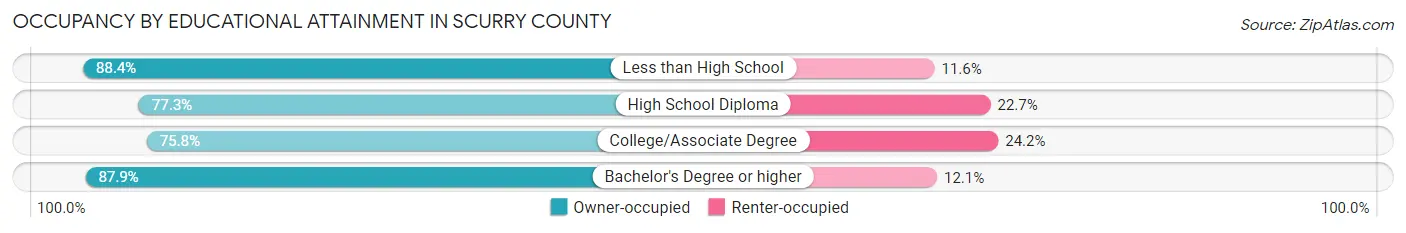
| Household Size | Owner-occupied | Renter-occupied |
| Less than High School | 619 (88.4%) | 81 (11.6%) |
| High School Diploma | 1,310 (77.3%) | 384 (22.7%) |
| College/Associate Degree | 1,414 (75.8%) | 452 (24.2%) |
| Bachelor's Degree or higher | 1,260 (87.9%) | 173 (12.1%) |
Occupancy by Age of Householder in Scurry County
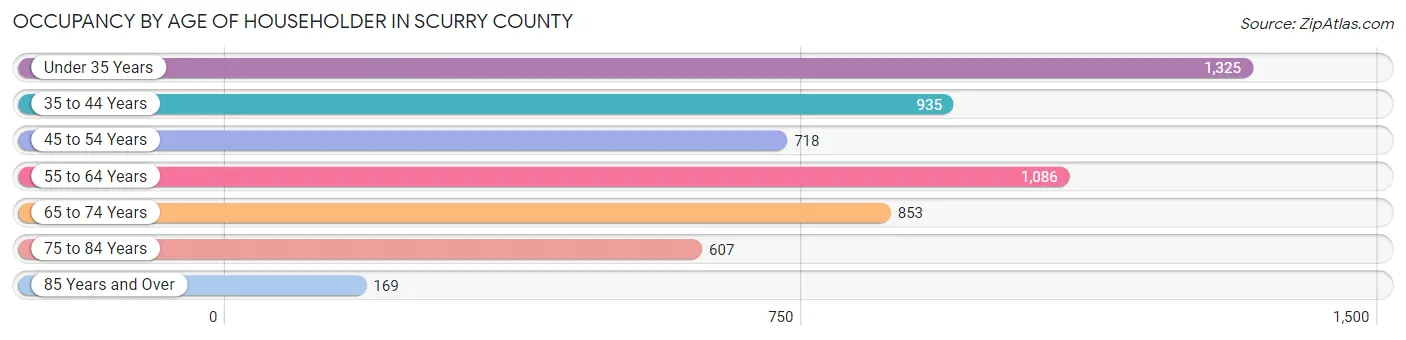
| Age Bracket | # Households | % Households |
| Under 35 Years | 1,325 | 23.3% |
| 35 to 44 Years | 935 | 16.4% |
| 45 to 54 Years | 718 | 12.6% |
| 55 to 64 Years | 1,086 | 19.1% |
| 65 to 74 Years | 853 | 15.0% |
| 75 to 84 Years | 607 | 10.7% |
| 85 Years and Over | 169 | 3.0% |
| Total | 5,693 | 100.0% |
Housing Finances in Scurry County
Median Income by Occupancy in Scurry County
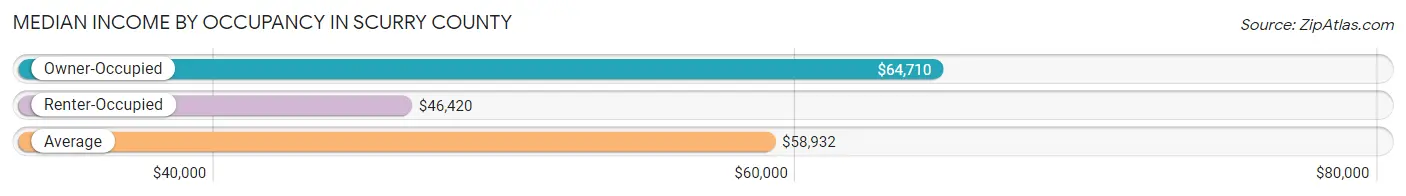
| Occupancy Type | # Households | Median Income |
| Owner-Occupied | 4,603 (80.8%) | $64,710 |
| Renter-Occupied | 1,090 (19.2%) | $46,420 |
| Average | 5,693 (100.0%) | $58,932 |
Occupancy by Householder Income Bracket in Scurry County
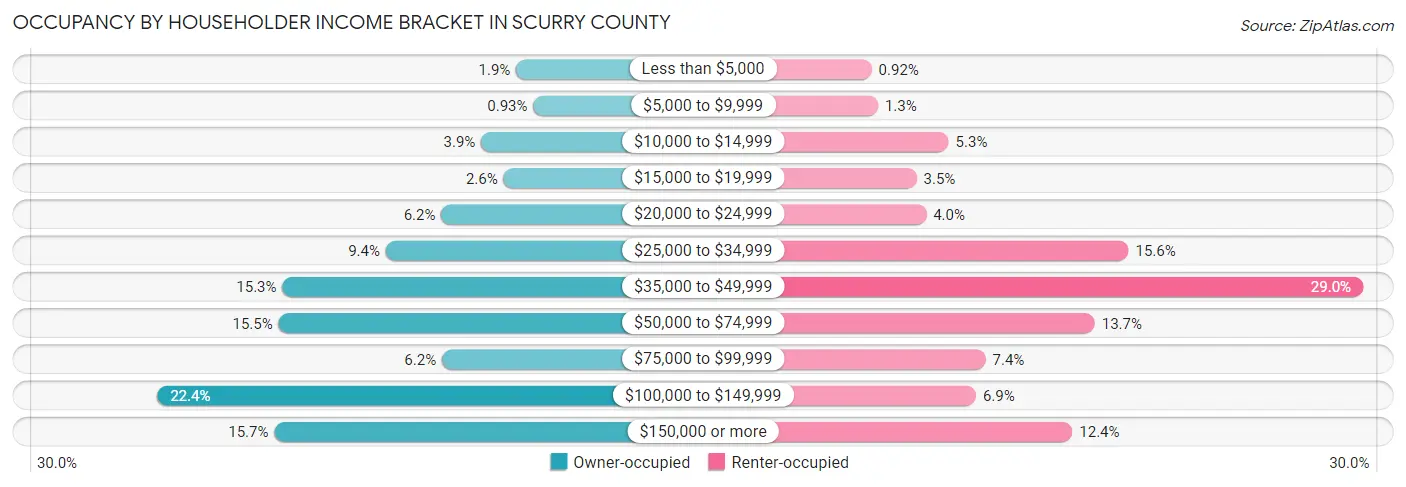
| Income Bracket | Owner-occupied | Renter-occupied |
| Less than $5,000 | 88 (1.9%) | 10 (0.9%) |
| $5,000 to $9,999 | 43 (0.9%) | 14 (1.3%) |
| $10,000 to $14,999 | 180 (3.9%) | 58 (5.3%) |
| $15,000 to $19,999 | 121 (2.6%) | 38 (3.5%) |
| $20,000 to $24,999 | 285 (6.2%) | 44 (4.0%) |
| $25,000 to $34,999 | 431 (9.4%) | 170 (15.6%) |
| $35,000 to $49,999 | 703 (15.3%) | 316 (29.0%) |
| $50,000 to $74,999 | 713 (15.5%) | 149 (13.7%) |
| $75,000 to $99,999 | 283 (6.1%) | 81 (7.4%) |
| $100,000 to $149,999 | 1,032 (22.4%) | 75 (6.9%) |
| $150,000 or more | 724 (15.7%) | 135 (12.4%) |
| Total | 4,603 (100.0%) | 1,090 (100.0%) |
Monthly Housing Cost Tiers in Scurry County
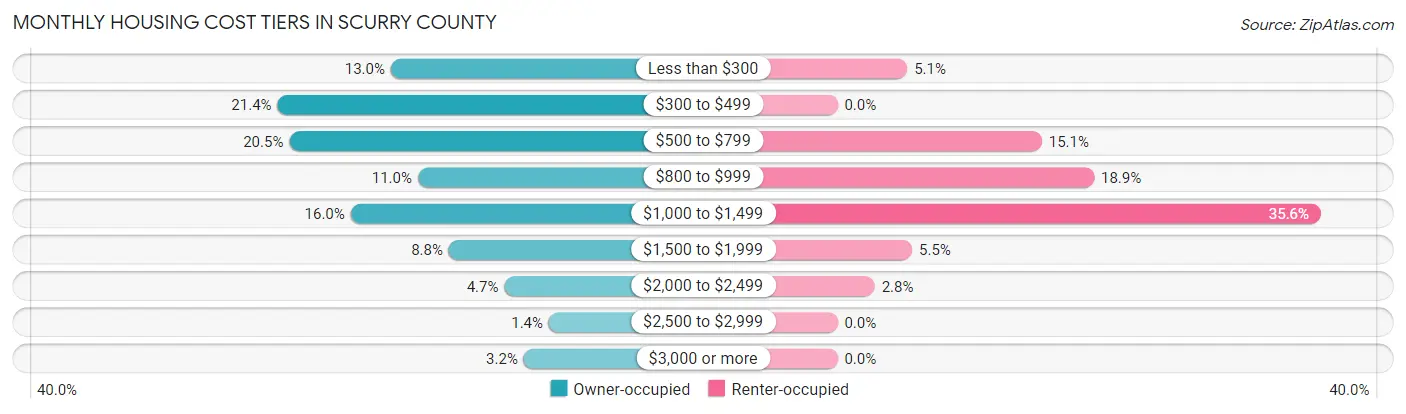
| Monthly Cost | Owner-occupied | Renter-occupied |
| Less than $300 | 600 (13.0%) | 56 (5.1%) |
| $300 to $499 | 984 (21.4%) | 0 (0.0%) |
| $500 to $799 | 944 (20.5%) | 164 (15.0%) |
| $800 to $999 | 508 (11.0%) | 206 (18.9%) |
| $1,000 to $1,499 | 736 (16.0%) | 388 (35.6%) |
| $1,500 to $1,999 | 403 (8.8%) | 60 (5.5%) |
| $2,000 to $2,499 | 215 (4.7%) | 30 (2.8%) |
| $2,500 to $2,999 | 64 (1.4%) | 0 (0.0%) |
| $3,000 or more | 149 (3.2%) | 0 (0.0%) |
| Total | 4,603 (100.0%) | 1,090 (100.0%) |
Physical Housing Characteristics in Scurry County
Housing Structures in Scurry County
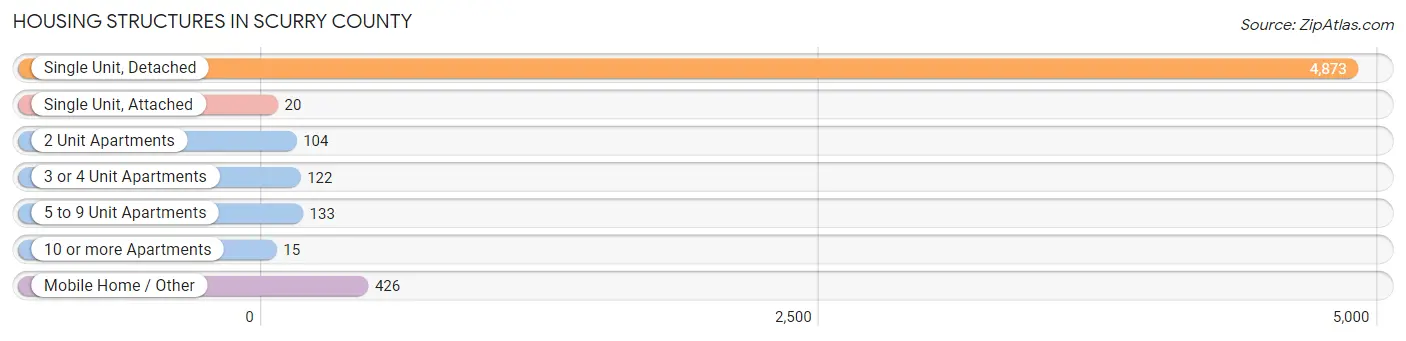
| Structure Type | # Housing Units | % Housing Units |
| Single Unit, Detached | 4,873 | 85.6% |
| Single Unit, Attached | 20 | 0.4% |
| 2 Unit Apartments | 104 | 1.8% |
| 3 or 4 Unit Apartments | 122 | 2.1% |
| 5 to 9 Unit Apartments | 133 | 2.3% |
| 10 or more Apartments | 15 | 0.3% |
| Mobile Home / Other | 426 | 7.5% |
| Total | 5,693 | 100.0% |
Housing Structures by Occupancy in Scurry County
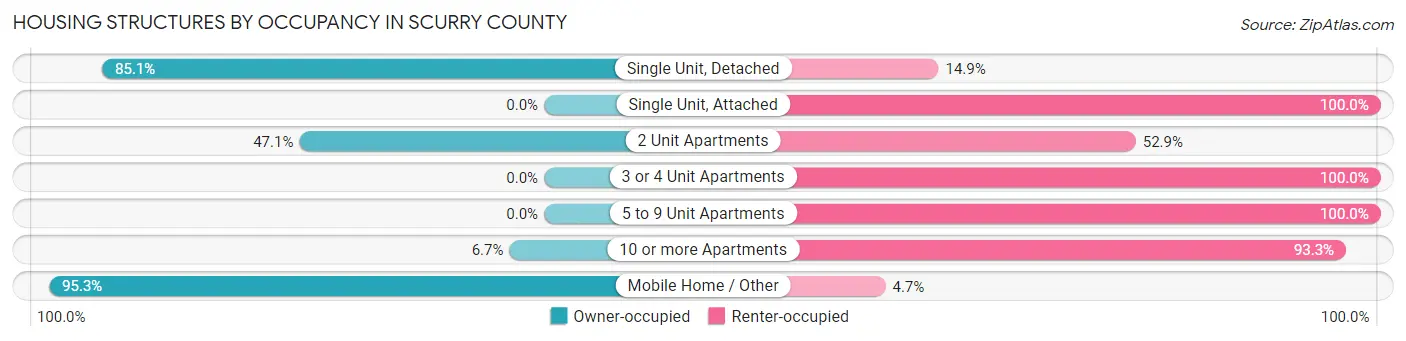
| Structure Type | Owner-occupied | Renter-occupied |
| Single Unit, Detached | 4,147 (85.1%) | 726 (14.9%) |
| Single Unit, Attached | 0 (0.0%) | 20 (100.0%) |
| 2 Unit Apartments | 49 (47.1%) | 55 (52.9%) |
| 3 or 4 Unit Apartments | 0 (0.0%) | 122 (100.0%) |
| 5 to 9 Unit Apartments | 0 (0.0%) | 133 (100.0%) |
| 10 or more Apartments | 1 (6.7%) | 14 (93.3%) |
| Mobile Home / Other | 406 (95.3%) | 20 (4.7%) |
| Total | 4,603 (80.8%) | 1,090 (19.2%) |
Housing Structures by Number of Rooms in Scurry County
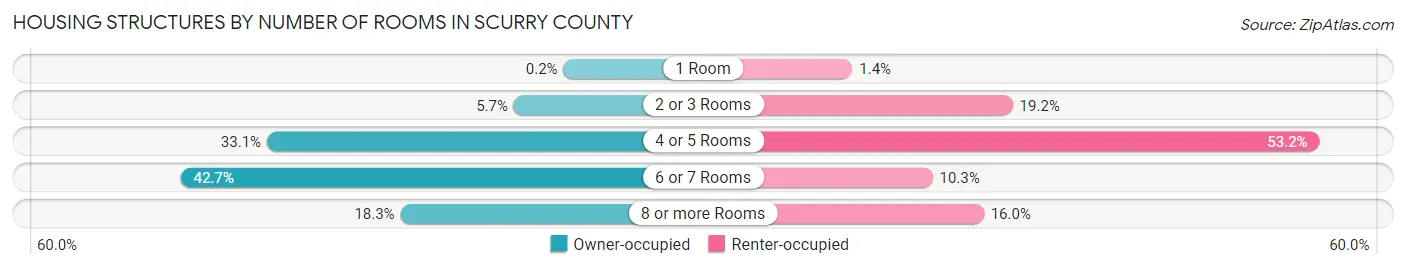
| Number of Rooms | Owner-occupied | Renter-occupied |
| 1 Room | 9 (0.2%) | 15 (1.4%) |
| 2 or 3 Rooms | 263 (5.7%) | 209 (19.2%) |
| 4 or 5 Rooms | 1,524 (33.1%) | 580 (53.2%) |
| 6 or 7 Rooms | 1,965 (42.7%) | 112 (10.3%) |
| 8 or more Rooms | 842 (18.3%) | 174 (16.0%) |
| Total | 4,603 (100.0%) | 1,090 (100.0%) |
Housing Structure by Heating Type in Scurry County
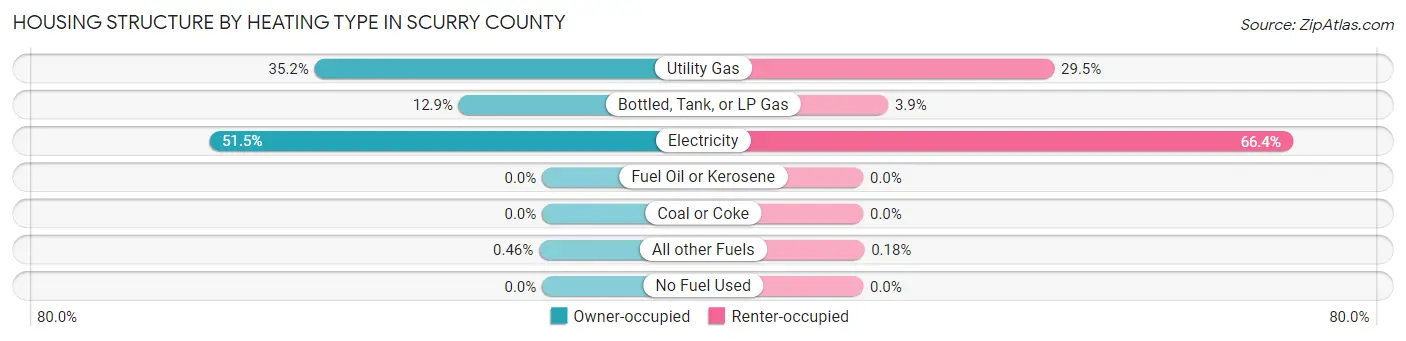
| Heating Type | Owner-occupied | Renter-occupied |
| Utility Gas | 1,619 (35.2%) | 322 (29.5%) |
| Bottled, Tank, or LP Gas | 593 (12.9%) | 42 (3.8%) |
| Electricity | 2,370 (51.5%) | 724 (66.4%) |
| Fuel Oil or Kerosene | 0 (0.0%) | 0 (0.0%) |
| Coal or Coke | 0 (0.0%) | 0 (0.0%) |
| All other Fuels | 21 (0.5%) | 2 (0.2%) |
| No Fuel Used | 0 (0.0%) | 0 (0.0%) |
| Total | 4,603 (100.0%) | 1,090 (100.0%) |
Household Vehicle Usage in Scurry County
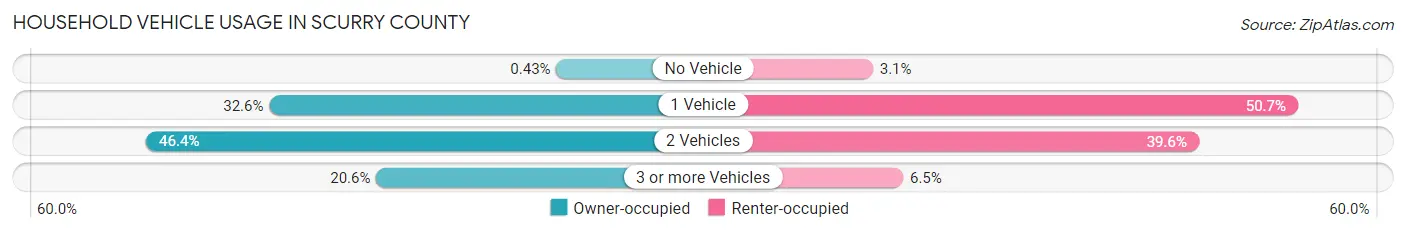
| Vehicles per Household | Owner-occupied | Renter-occupied |
| No Vehicle | 20 (0.4%) | 34 (3.1%) |
| 1 Vehicle | 1,500 (32.6%) | 553 (50.7%) |
| 2 Vehicles | 2,135 (46.4%) | 432 (39.6%) |
| 3 or more Vehicles | 948 (20.6%) | 71 (6.5%) |
| Total | 4,603 (100.0%) | 1,090 (100.0%) |
Real Estate & Mortgages in Scurry County
Real Estate and Mortgage Overview in Scurry County
| Characteristic | Without Mortgage | With Mortgage |
| Housing Units | 2,766 | 1,837 |
| Median Property Value | $86,400 | $166,900 |
| Median Household Income | $50,526 | $472 |
| Monthly Housing Costs | $484 | $149 |
| Real Estate Taxes | $1,251 | $63 |
Property Value by Mortgage Status in Scurry County
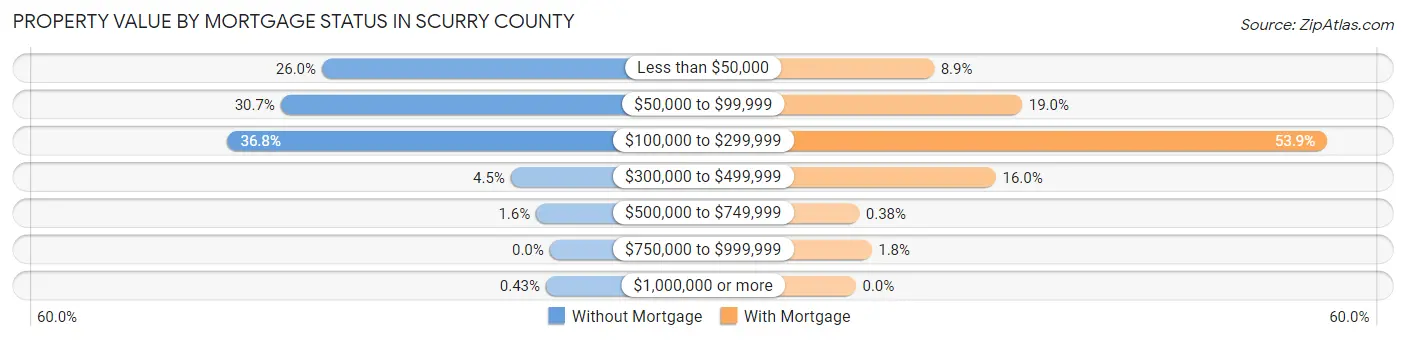
| Property Value | Without Mortgage | With Mortgage |
| Less than $50,000 | 720 (26.0%) | 164 (8.9%) |
| $50,000 to $99,999 | 850 (30.7%) | 349 (19.0%) |
| $100,000 to $299,999 | 1,018 (36.8%) | 990 (53.9%) |
| $300,000 to $499,999 | 123 (4.4%) | 294 (16.0%) |
| $500,000 to $749,999 | 43 (1.5%) | 7 (0.4%) |
| $750,000 to $999,999 | 0 (0.0%) | 33 (1.8%) |
| $1,000,000 or more | 12 (0.4%) | 0 (0.0%) |
| Total | 2,766 (100.0%) | 1,837 (100.0%) |
Household Income by Mortgage Status in Scurry County
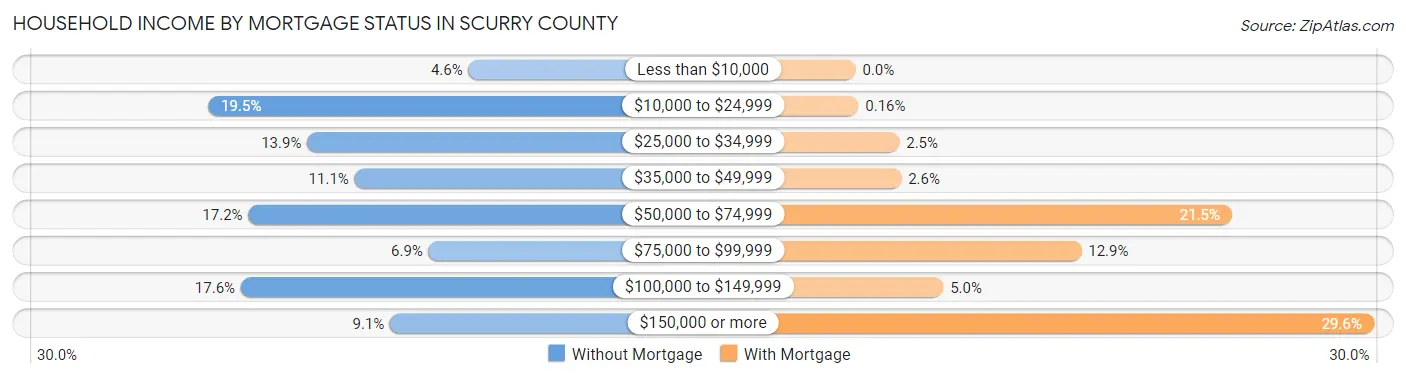
| Household Income | Without Mortgage | With Mortgage |
| Less than $10,000 | 128 (4.6%) | 0 (0.0%) |
| $10,000 to $24,999 | 540 (19.5%) | 3 (0.2%) |
| $25,000 to $34,999 | 383 (13.9%) | 46 (2.5%) |
| $35,000 to $49,999 | 308 (11.1%) | 48 (2.6%) |
| $50,000 to $74,999 | 476 (17.2%) | 395 (21.5%) |
| $75,000 to $99,999 | 191 (6.9%) | 237 (12.9%) |
| $100,000 to $149,999 | 488 (17.6%) | 92 (5.0%) |
| $150,000 or more | 252 (9.1%) | 544 (29.6%) |
| Total | 2,766 (100.0%) | 1,837 (100.0%) |
Property Value to Household Income Ratio in Scurry County
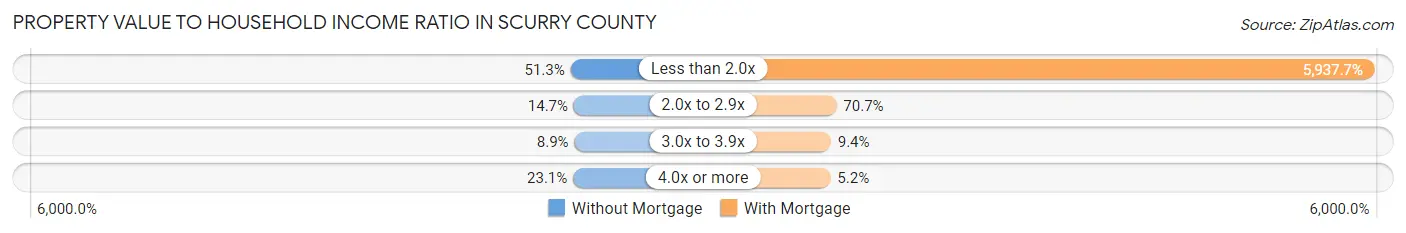
| Value-to-Income Ratio | Without Mortgage | With Mortgage |
| Less than 2.0x | 1,419 (51.3%) | 109,076 (5,937.7%) |
| 2.0x to 2.9x | 407 (14.7%) | 1,298 (70.7%) |
| 3.0x to 3.9x | 246 (8.9%) | 172 (9.4%) |
| 4.0x or more | 638 (23.1%) | 96 (5.2%) |
| Total | 2,766 (100.0%) | 1,837 (100.0%) |
Real Estate Taxes by Mortgage Status in Scurry County
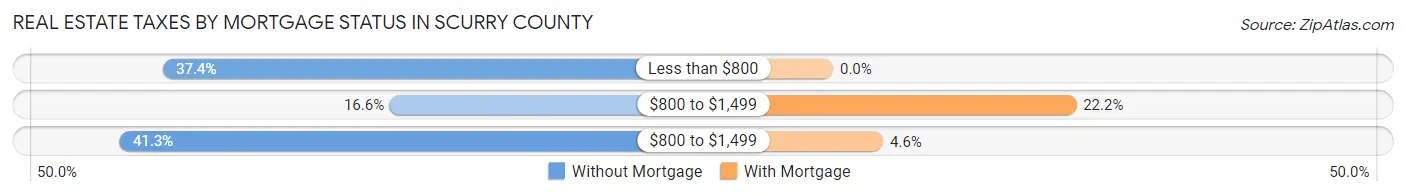
| Property Taxes | Without Mortgage | With Mortgage |
| Less than $800 | 1,033 (37.3%) | 0 (0.0%) |
| $800 to $1,499 | 460 (16.6%) | 408 (22.2%) |
| $800 to $1,499 | 1,142 (41.3%) | 84 (4.6%) |
| Total | 2,766 (100.0%) | 1,837 (100.0%) |
Health & Disability in Scurry County
Health Insurance Coverage by Age in Scurry County
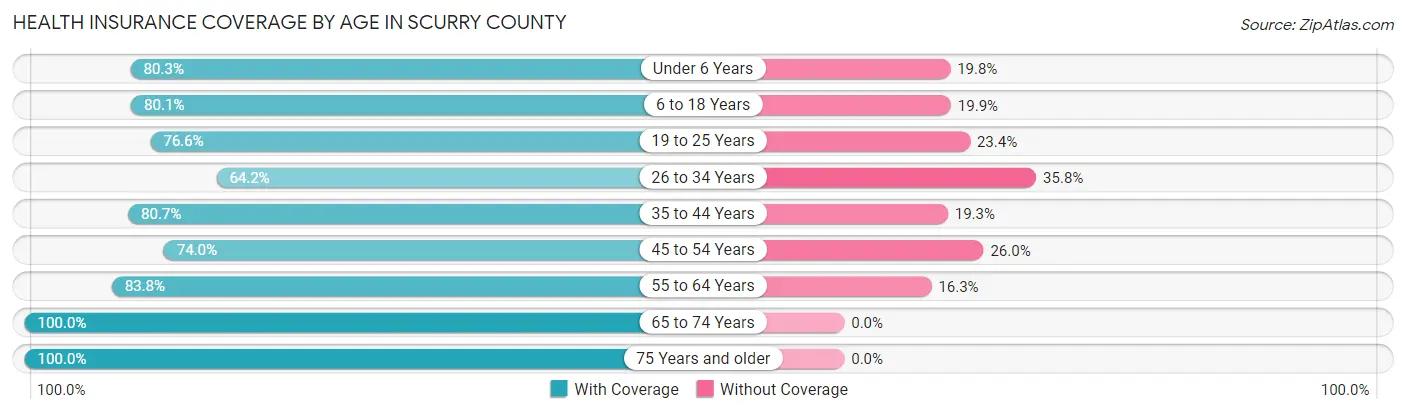
| Age Bracket | With Coverage | Without Coverage |
| Under 6 Years | 1,020 (80.2%) | 251 (19.8%) |
| 6 to 18 Years | 2,644 (80.1%) | 656 (19.9%) |
| 19 to 25 Years | 1,019 (76.6%) | 312 (23.4%) |
| 26 to 34 Years | 1,190 (64.2%) | 663 (35.8%) |
| 35 to 44 Years | 1,526 (80.7%) | 365 (19.3%) |
| 45 to 54 Years | 1,084 (74.0%) | 380 (26.0%) |
| 55 to 64 Years | 1,531 (83.8%) | 297 (16.3%) |
| 65 to 74 Years | 1,396 (100.0%) | 0 (0.0%) |
| 75 Years and older | 991 (100.0%) | 0 (0.0%) |
| Total | 12,401 (80.9%) | 2,924 (19.1%) |
Health Insurance Coverage by Citizenship Status in Scurry County
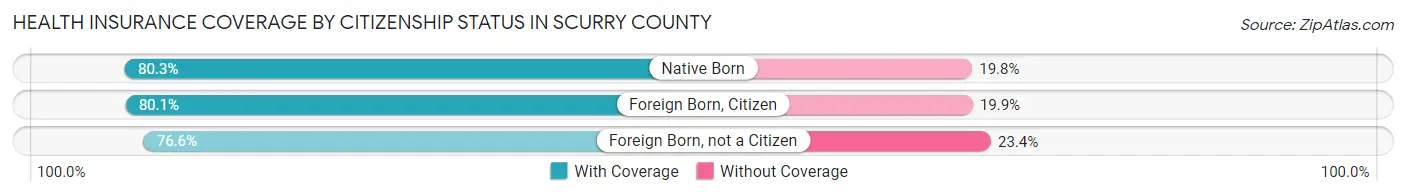
| Citizenship Status | With Coverage | Without Coverage |
| Native Born | 1,020 (80.2%) | 251 (19.8%) |
| Foreign Born, Citizen | 2,644 (80.1%) | 656 (19.9%) |
| Foreign Born, not a Citizen | 1,019 (76.6%) | 312 (23.4%) |
Health Insurance Coverage by Household Income in Scurry County
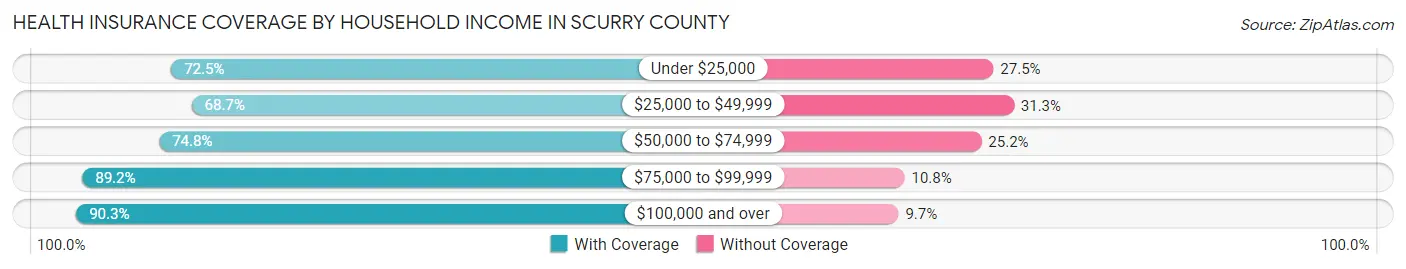
| Household Income | With Coverage | Without Coverage |
| Under $25,000 | 1,204 (72.5%) | 456 (27.5%) |
| $25,000 to $49,999 | 2,436 (68.7%) | 1,110 (31.3%) |
| $50,000 to $74,999 | 1,936 (74.8%) | 653 (25.2%) |
| $75,000 to $99,999 | 948 (89.2%) | 115 (10.8%) |
| $100,000 and over | 5,494 (90.3%) | 589 (9.7%) |
Public vs Private Health Insurance Coverage by Age in Scurry County
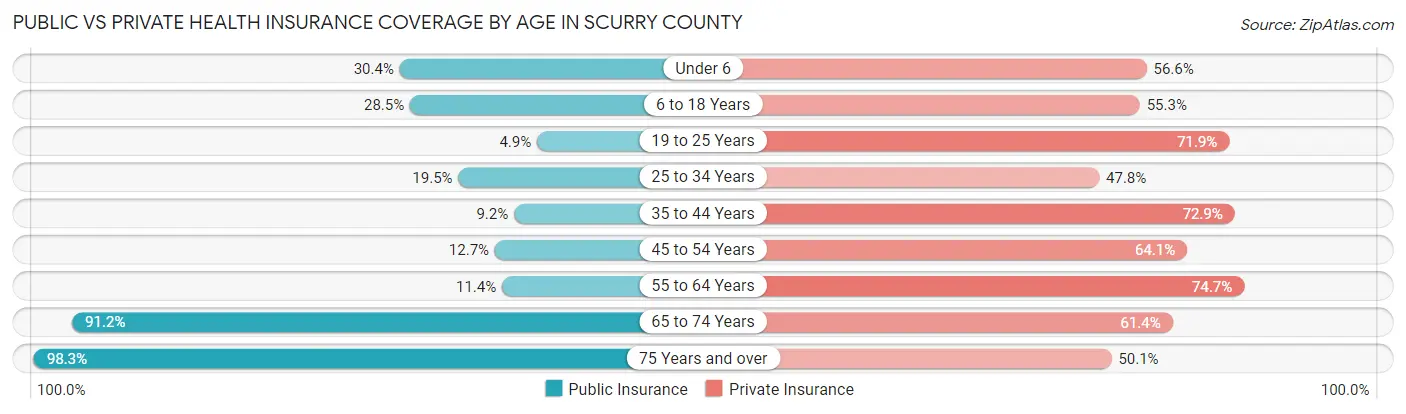
| Age Bracket | Public Insurance | Private Insurance |
| Under 6 | 386 (30.4%) | 719 (56.6%) |
| 6 to 18 Years | 939 (28.4%) | 1,825 (55.3%) |
| 19 to 25 Years | 65 (4.9%) | 957 (71.9%) |
| 25 to 34 Years | 361 (19.5%) | 885 (47.8%) |
| 35 to 44 Years | 173 (9.1%) | 1,379 (72.9%) |
| 45 to 54 Years | 186 (12.7%) | 938 (64.1%) |
| 55 to 64 Years | 208 (11.4%) | 1,365 (74.7%) |
| 65 to 74 Years | 1,273 (91.2%) | 857 (61.4%) |
| 75 Years and over | 974 (98.3%) | 496 (50.0%) |
| Total | 4,565 (29.8%) | 9,421 (61.5%) |
Disability Status by Sex by Age in Scurry County
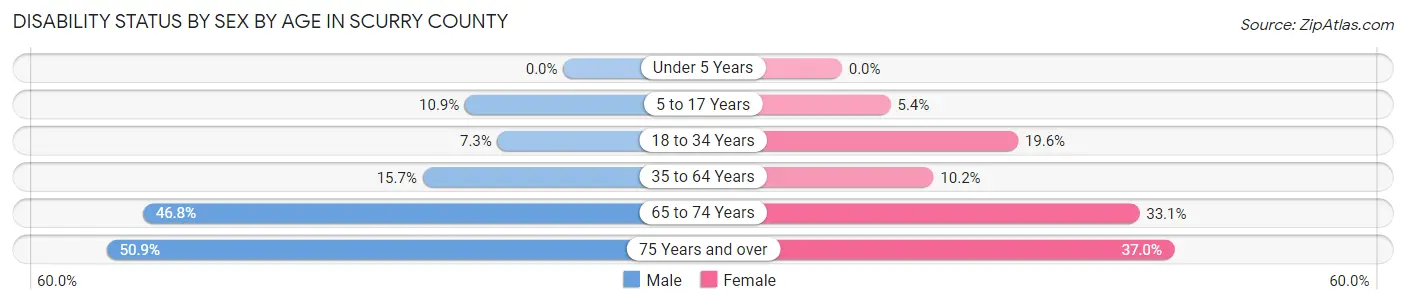
| Age Bracket | Male | Female |
| Under 5 Years | 0 (0.0%) | 0 (0.0%) |
| 5 to 17 Years | 184 (10.9%) | 83 (5.4%) |
| 18 to 34 Years | 137 (7.3%) | 316 (19.6%) |
| 35 to 64 Years | 397 (15.7%) | 270 (10.2%) |
| 65 to 74 Years | 340 (46.8%) | 222 (33.1%) |
| 75 Years and over | 178 (50.9%) | 237 (37.0%) |
Disability Class by Sex by Age in Scurry County
Disability Class: Hearing Difficulty
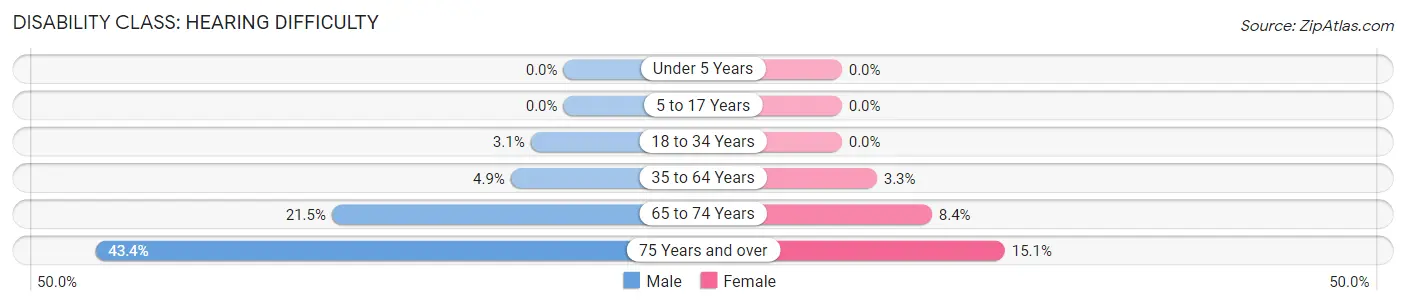
| Age Bracket | Male | Female |
| Under 5 Years | 0 (0.0%) | 0 (0.0%) |
| 5 to 17 Years | 0 (0.0%) | 0 (0.0%) |
| 18 to 34 Years | 57 (3.0%) | 0 (0.0%) |
| 35 to 64 Years | 124 (4.9%) | 86 (3.3%) |
| 65 to 74 Years | 156 (21.5%) | 56 (8.4%) |
| 75 Years and over | 152 (43.4%) | 97 (15.1%) |
Disability Class: Vision Difficulty
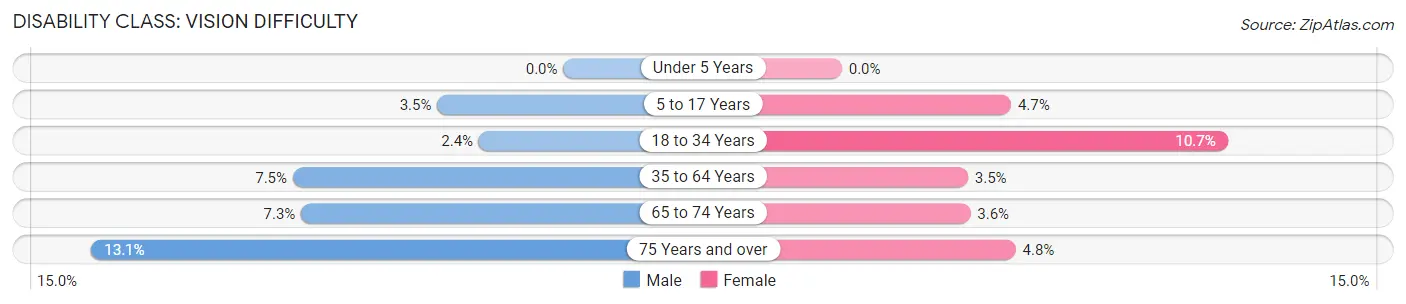
| Age Bracket | Male | Female |
| Under 5 Years | 0 (0.0%) | 0 (0.0%) |
| 5 to 17 Years | 59 (3.5%) | 72 (4.7%) |
| 18 to 34 Years | 44 (2.4%) | 173 (10.7%) |
| 35 to 64 Years | 191 (7.5%) | 93 (3.5%) |
| 65 to 74 Years | 53 (7.3%) | 24 (3.6%) |
| 75 Years and over | 46 (13.1%) | 31 (4.8%) |
Disability Class: Cognitive Difficulty
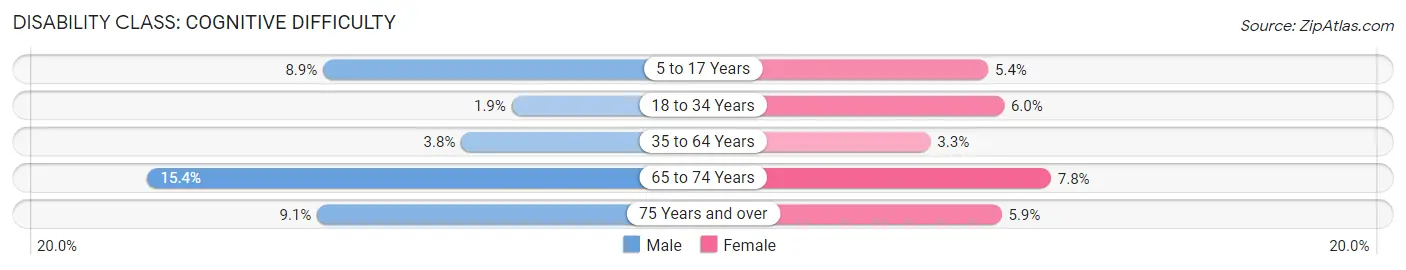
| Age Bracket | Male | Female |
| 5 to 17 Years | 150 (8.9%) | 83 (5.4%) |
| 18 to 34 Years | 36 (1.9%) | 97 (6.0%) |
| 35 to 64 Years | 96 (3.8%) | 87 (3.3%) |
| 65 to 74 Years | 112 (15.4%) | 52 (7.8%) |
| 75 Years and over | 32 (9.1%) | 38 (5.9%) |
Disability Class: Ambulatory Difficulty
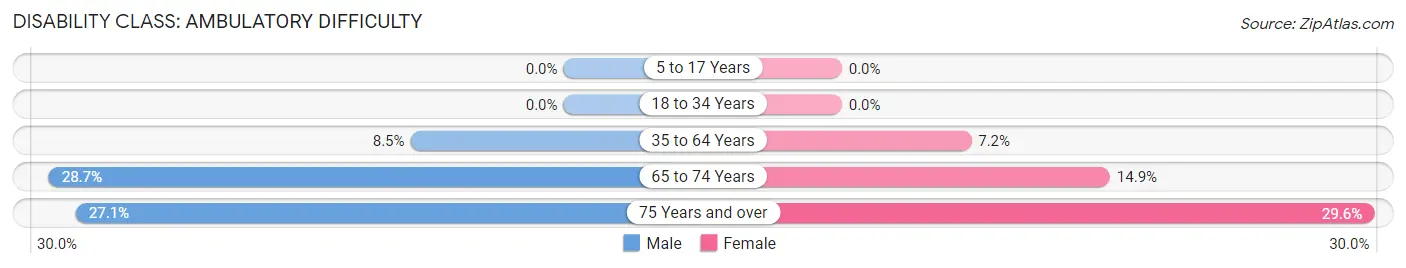
| Age Bracket | Male | Female |
| 5 to 17 Years | 0 (0.0%) | 0 (0.0%) |
| 18 to 34 Years | 0 (0.0%) | 0 (0.0%) |
| 35 to 64 Years | 216 (8.5%) | 191 (7.2%) |
| 65 to 74 Years | 208 (28.6%) | 100 (14.9%) |
| 75 Years and over | 95 (27.1%) | 190 (29.6%) |
Disability Class: Self-Care Difficulty
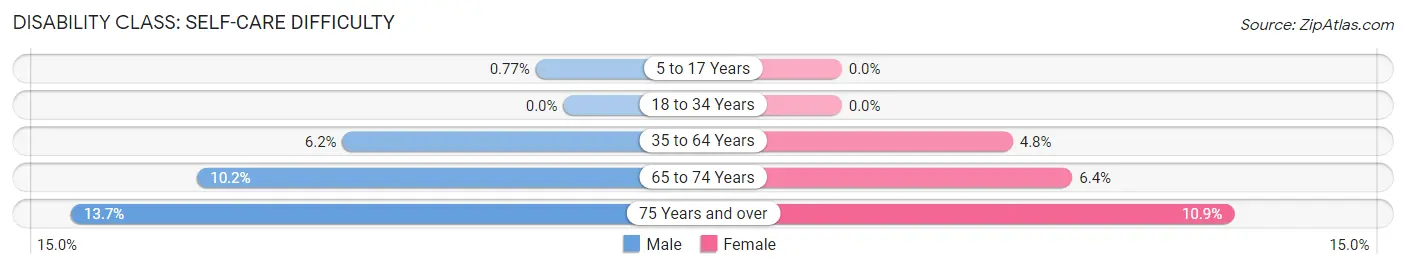
| Age Bracket | Male | Female |
| 5 to 17 Years | 13 (0.8%) | 0 (0.0%) |
| 18 to 34 Years | 0 (0.0%) | 0 (0.0%) |
| 35 to 64 Years | 156 (6.1%) | 126 (4.8%) |
| 65 to 74 Years | 74 (10.2%) | 43 (6.4%) |
| 75 Years and over | 48 (13.7%) | 70 (10.9%) |
Technology Access in Scurry County
Computing Device Access in Scurry County
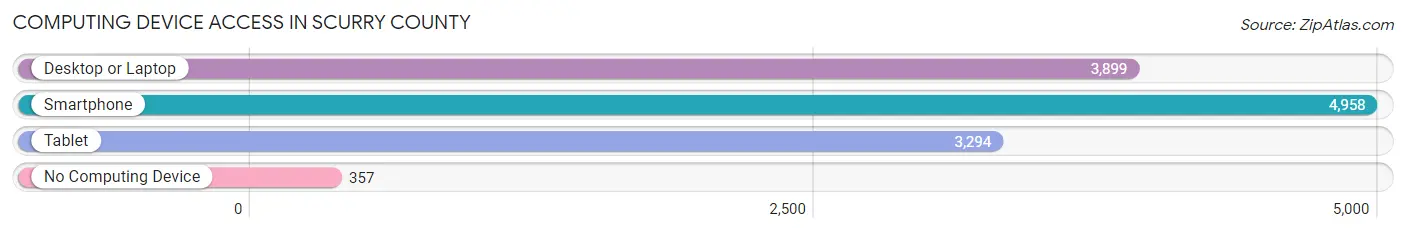
| Device Type | # Households | % Households |
| Desktop or Laptop | 3,899 | 68.5% |
| Smartphone | 4,958 | 87.1% |
| Tablet | 3,294 | 57.9% |
| No Computing Device | 357 | 6.3% |
| Total | 5,693 | 100.0% |
Internet Access in Scurry County
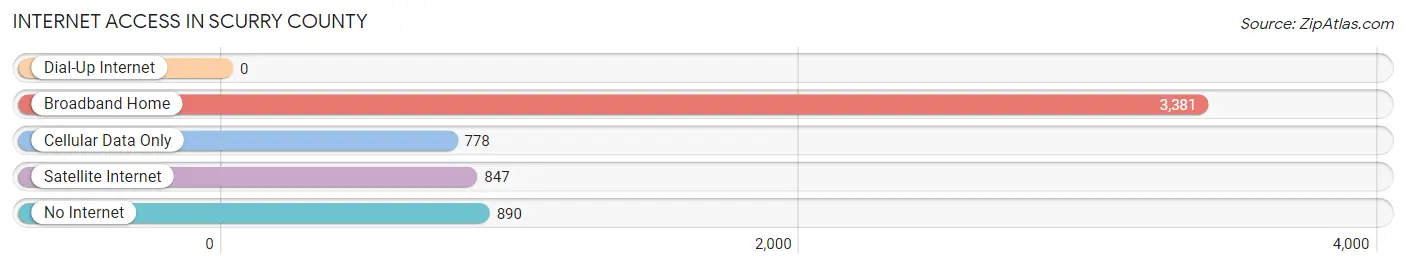
| Internet Type | # Households | % Households |
| Dial-Up Internet | 0 | 0.0% |
| Broadband Home | 3,381 | 59.4% |
| Cellular Data Only | 778 | 13.7% |
| Satellite Internet | 847 | 14.9% |
| No Internet | 890 | 15.6% |
| Total | 5,693 | 100.0% |
Scurry County Summary
Scurry County is located in the western part of the state of Texas, in the United States. It is part of the Big Country region of the state and is bordered by Fisher County to the north, Mitchell County to the east, Borden County to the south, and Kent and Stonewall Counties to the west. The county seat is Snyder, and the largest city is Hermleigh.
History
Scurry County was established in 1876 from Bexar County. It was named for William Read Scurry, a Confederate general who was killed in the Battle of Jenkins Ferry in Arkansas. The county was originally part of the Bexar District, which was created in 1858.
The first settlers in the area were ranchers, who began arriving in the late 1870s. The first town in the county was Hermleigh, which was established in 1881. The town of Snyder was established in 1882, and it became the county seat in 1884.
The county experienced rapid growth in the early 1900s, as the population increased from 1,845 in 1900 to 8,845 in 1930. This growth was largely due to the discovery of oil in the area in the 1920s. The oil boom led to the establishment of several new towns, including Fluvanna, Ira, and Loraine.
Geography
Scurry County covers an area of 902 square miles, making it the 33rd largest county in Texas. The county is located in the western part of the state, and is part of the Big Country region. It is bordered by Fisher County to the north, Mitchell County to the east, Borden County to the south, and Kent and Stonewall Counties to the west.
The terrain of the county is mostly flat, with some rolling hills in the western part of the county. The county is drained by the Colorado River, which flows through the western part of the county. The county also contains several small lakes, including Lake J.B. Thomas and Lake Colorado City.
Economy
The economy of Scurry County is largely based on agriculture and oil production. The county is home to several large ranches, and the main crops grown in the county are cotton, wheat, and sorghum.
Oil production is also an important part of the county's economy. The county is home to several large oil fields, including the Snyder Oil Field, the Fluvanna Oil Field, and the Ira Oil Field.
Demographics
As of the 2010 census, the population of Scurry County was 16,921. The racial makeup of the county was 79.2% White, 8.2% Black or African American, 0.7% Native American, 0.3% Asian, 0.1% Pacific Islander, 9.7% from other races, and 1.8% from two or more races. Hispanic or Latino of any race were 19.3% of the population.
The median income for a household in the county was $37,945, and the median income for a family was $45,945. The per capita income for the county was $18,945. About 16.2% of the population was below the poverty line.
Common Questions
What is Per Capita Income in Scurry County?
Per Capita income in Scurry County is $28,549.
What is the Median Family Income in Scurry County?
Median Family Income in Scurry County is $76,176.
What is the Median Household income in Scurry County?
Median Household Income in Scurry County is $58,932.
What is Income or Wage Gap in Scurry County?
Income or Wage Gap in Scurry County is 40.8%.
Women in Scurry County earn 59.2 cents for every dollar earned by a man.
What is Inequality or Gini Index in Scurry County?
Inequality or Gini Index in Scurry County is 0.42.
What is the Total Population of Scurry County?
Total Population of Scurry County is 16,883.
What is the Total Male Population of Scurry County?
Total Male Population of Scurry County is 9,084.
What is the Total Female Population of Scurry County?
Total Female Population of Scurry County is 7,799.
What is the Ratio of Males per 100 Females in Scurry County?
There are 116.48 Males per 100 Females in Scurry County.
What is the Ratio of Females per 100 Males in Scurry County?
There are 85.85 Females per 100 Males in Scurry County.
What is the Median Population Age in Scurry County?
Median Population Age in Scurry County is 36.2 Years.
What is the Average Family Size in Scurry County
Average Family Size in Scurry County is 3.2 People.
What is the Average Household Size in Scurry County
Average Household Size in Scurry County is 2.6 People.
How Large is the Labor Force in Scurry County?
There are 7,070 People in the Labor Forcein in Scurry County.
What is the Percentage of People in the Labor Force in Scurry County?
53.7% of People are in the Labor Force in Scurry County.
What is the Unemployment Rate in Scurry County?
Unemployment Rate in Scurry County is 2.2%.