Reeves County, TX Map & Demographics
Reeves County Map
Reeves County Overview
$26,180
PER CAPITA INCOME
$61,477
AVG FAMILY INCOME
$57,487
AVG HOUSEHOLD INCOME
27.1%
WAGE / INCOME GAP [ % ]
72.9¢/ $1
WAGE / INCOME GAP [ $ ]
0.44
INEQUALITY / GINI INDEX
14,022
TOTAL POPULATION
8,530
MALE POPULATION
5,492
FEMALE POPULATION
155.32
MALES / 100 FEMALES
64.38
FEMALES / 100 MALES
35.4
MEDIAN AGE
3.9
AVG FAMILY SIZE
3.1
AVG HOUSEHOLD SIZE
6,798
LABOR FORCE [ PEOPLE ]
61.0%
PERCENT IN LABOR FORCE
7.0%
UNEMPLOYMENT RATE
Reeves County Area Codes
Income in Reeves County
Income Overview in Reeves County
Per Capita Income in Reeves County is $26,180, while median incomes of families and households are $61,477 and $57,487 respectively.
| Characteristic | Number | Measure |
| Per Capita Income | 14,022 | $26,180 |
| Median Family Income | 2,630 | $61,477 |
| Mean Family Income | 2,630 | $83,016 |
| Median Household Income | 4,117 | $57,487 |
| Mean Household Income | 4,117 | $74,058 |
| Income Deficit | 2,630 | $0 |
| Wage / Income Gap (%) | 14,022 | 27.11% |
| Wage / Income Gap ($) | 14,022 | 72.89¢ per $1 |
| Gini / Inequality Index | 14,022 | 0.44 |
Earnings by Sex in Reeves County
Average Earnings in Reeves County are $35,209, $39,038 for men and $28,456 for women, a difference of 27.1%.
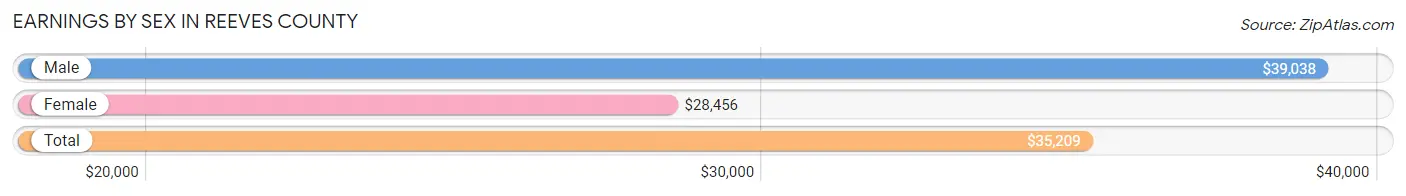
| Sex | Number | Average Earnings |
| Male | 4,603 (64.8%) | $39,038 |
| Female | 2,497 (35.2%) | $28,456 |
| Total | 7,100 (100.0%) | $35,209 |
Earnings by Sex by Income Bracket in Reeves County
The most common earnings brackets in Reeves County are $100,000+ for men (854 | 18.5%) and $25,000 to $29,999 for women (367 | 14.7%).
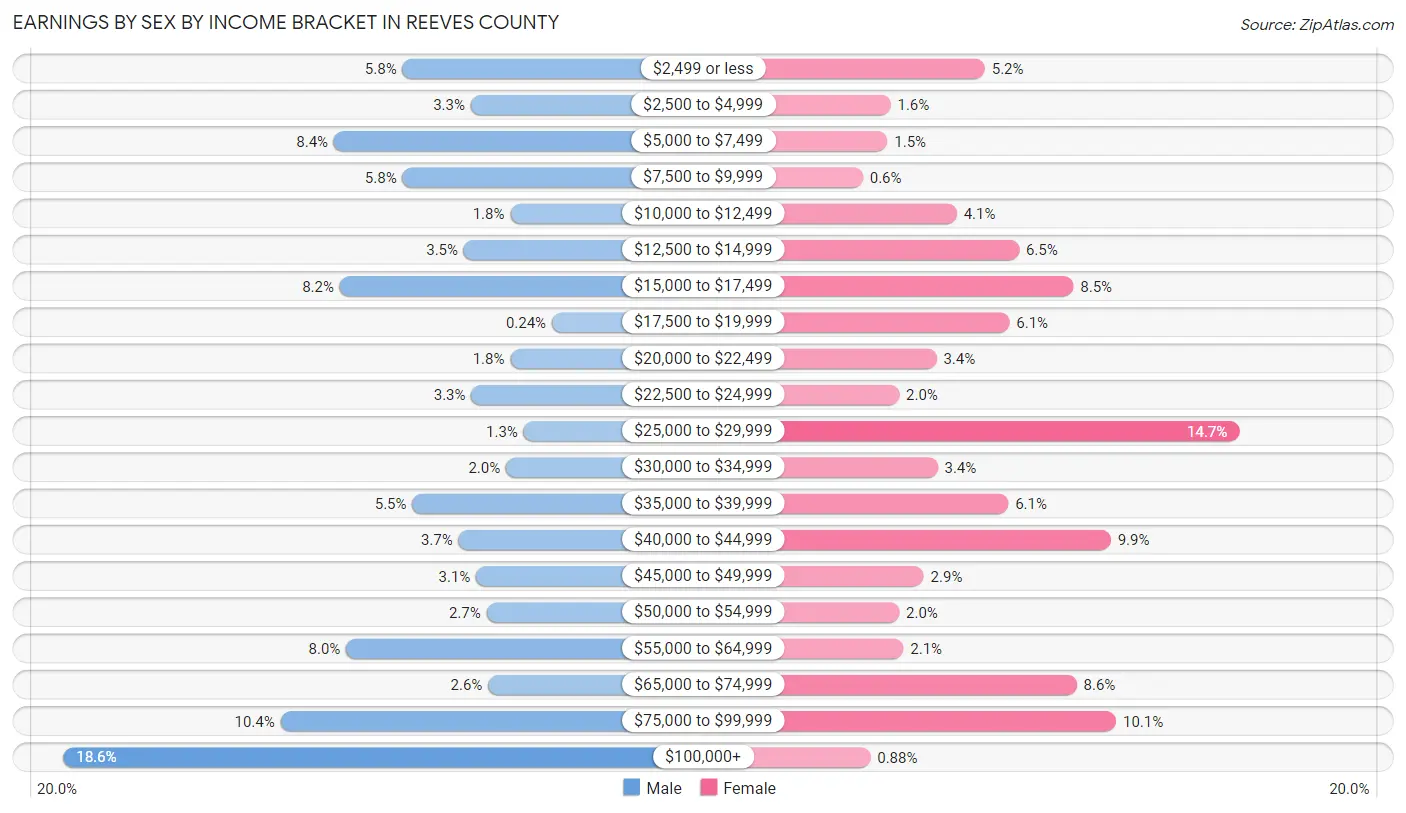
| Income | Male | Female |
| $2,499 or less | 269 (5.8%) | 129 (5.2%) |
| $2,500 to $4,999 | 151 (3.3%) | 41 (1.6%) |
| $5,000 to $7,499 | 387 (8.4%) | 38 (1.5%) |
| $7,500 to $9,999 | 269 (5.8%) | 15 (0.6%) |
| $10,000 to $12,499 | 83 (1.8%) | 103 (4.1%) |
| $12,500 to $14,999 | 163 (3.5%) | 161 (6.5%) |
| $15,000 to $17,499 | 377 (8.2%) | 212 (8.5%) |
| $17,500 to $19,999 | 11 (0.2%) | 152 (6.1%) |
| $20,000 to $22,499 | 83 (1.8%) | 84 (3.4%) |
| $22,500 to $24,999 | 150 (3.3%) | 49 (2.0%) |
| $25,000 to $29,999 | 60 (1.3%) | 367 (14.7%) |
| $30,000 to $34,999 | 90 (2.0%) | 85 (3.4%) |
| $35,000 to $39,999 | 252 (5.5%) | 151 (6.0%) |
| $40,000 to $44,999 | 172 (3.7%) | 247 (9.9%) |
| $45,000 to $49,999 | 142 (3.1%) | 72 (2.9%) |
| $50,000 to $54,999 | 124 (2.7%) | 49 (2.0%) |
| $55,000 to $64,999 | 366 (8.0%) | 53 (2.1%) |
| $65,000 to $74,999 | 121 (2.6%) | 215 (8.6%) |
| $75,000 to $99,999 | 479 (10.4%) | 252 (10.1%) |
| $100,000+ | 854 (18.5%) | 22 (0.9%) |
| Total | 4,603 (100.0%) | 2,497 (100.0%) |
Earnings by Sex by Educational Attainment in Reeves County
Average earnings in Reeves County are $45,585 for men and $34,412 for women, a difference of 24.5%. Men with an educational attainment of high school diploma enjoy the highest average annual earnings of $51,265, while those with college or associate's degree education earn the least with $48,984. Women with an educational attainment of bachelor's degree earn the most with the average annual earnings of $71,250, while those with high school diploma education have the smallest earnings of $28,479.
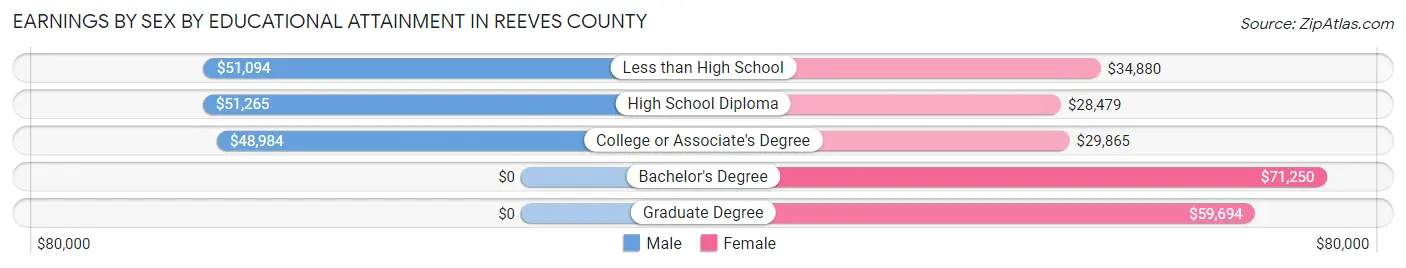
| Educational Attainment | Male Income | Female Income |
| Less than High School | $51,094 | $34,880 |
| High School Diploma | $51,265 | $28,479 |
| College or Associate's Degree | $48,984 | $29,865 |
| Bachelor's Degree | - | - |
| Graduate Degree | - | - |
| Total | $45,585 | $34,412 |
Family Income in Reeves County
Family Income Brackets in Reeves County
According to the Reeves County family income data, there are 450 families falling into the $100,000 to $149,999 income range, which is the most common income bracket and makes up 17.1% of all families. Conversely, the $200,000+ income bracket is the least frequent group with only 68 families (2.6%) belonging to this category.
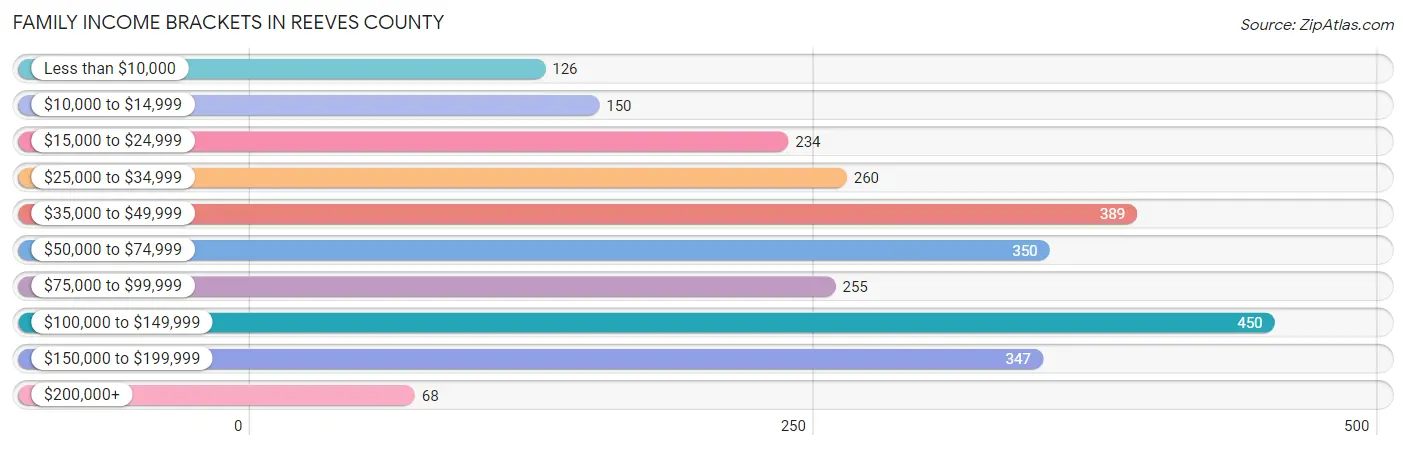
| Income Bracket | # Families | % Families |
| Less than $10,000 | 126 | 4.8% |
| $10,000 to $14,999 | 150 | 5.7% |
| $15,000 to $24,999 | 234 | 8.9% |
| $25,000 to $34,999 | 260 | 9.9% |
| $35,000 to $49,999 | 389 | 14.8% |
| $50,000 to $74,999 | 350 | 13.3% |
| $75,000 to $99,999 | 255 | 9.7% |
| $100,000 to $149,999 | 450 | 17.1% |
| $150,000 to $199,999 | 347 | 13.2% |
| $200,000+ | 68 | 2.6% |
Family Income by Famaliy Size in Reeves County
5-person families (95 | 3.6%) account for the highest median family income in Reeves County with $112,292 per family, while 2-person families (1,090 | 41.4%) have the highest median income of $24,407 per family member.
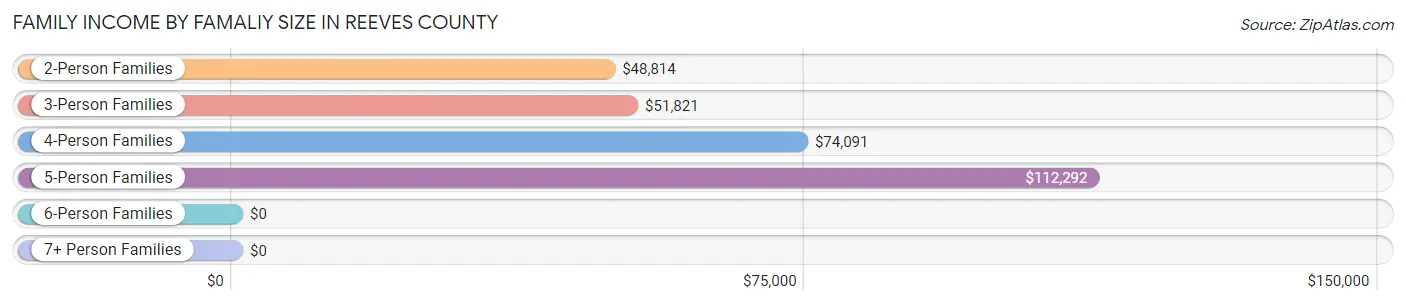
| Income Bracket | # Families | Median Income |
| 2-Person Families | 1,090 (41.4%) | $48,814 |
| 3-Person Families | 457 (17.4%) | $51,821 |
| 4-Person Families | 858 (32.6%) | $74,091 |
| 5-Person Families | 95 (3.6%) | $112,292 |
| 6-Person Families | 82 (3.1%) | $0 |
| 7+ Person Families | 48 (1.8%) | $0 |
| Total | 2,630 (100.0%) | $61,477 |
Family Income by Number of Earners in Reeves County
The median family income in Reeves County is $61,477, with families comprising 3+ earners (145) having the highest median family income of $113,274, while families with no earners (437) have the lowest median family income of $20,457, accounting for 5.5% and 16.6% of families, respectively.
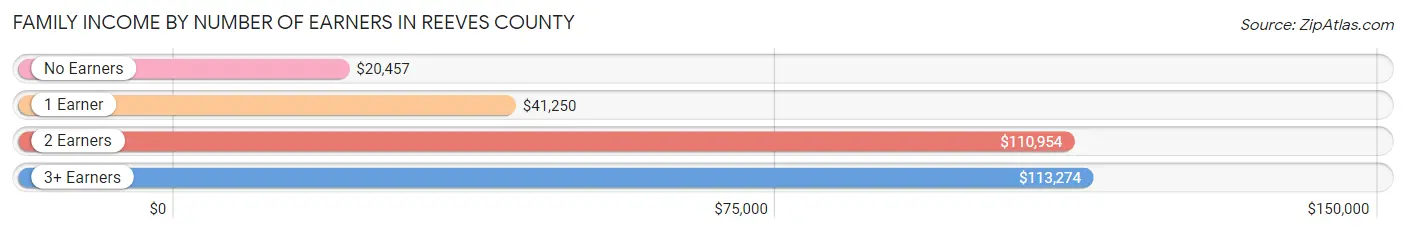
| Number of Earners | # Families | Median Income |
| No Earners | 437 (16.6%) | $20,457 |
| 1 Earner | 898 (34.1%) | $41,250 |
| 2 Earners | 1,150 (43.7%) | $110,954 |
| 3+ Earners | 145 (5.5%) | $113,274 |
| Total | 2,630 (100.0%) | $61,477 |
Household Income in Reeves County
Household Income Brackets in Reeves County
With 638 households falling in the category, the $100,000 to $149,999 income range is the most frequent in Reeves County, accounting for 15.5% of all households. In contrast, only 70 households (1.7%) fall into the $200,000+ income bracket, making it the least populous group.
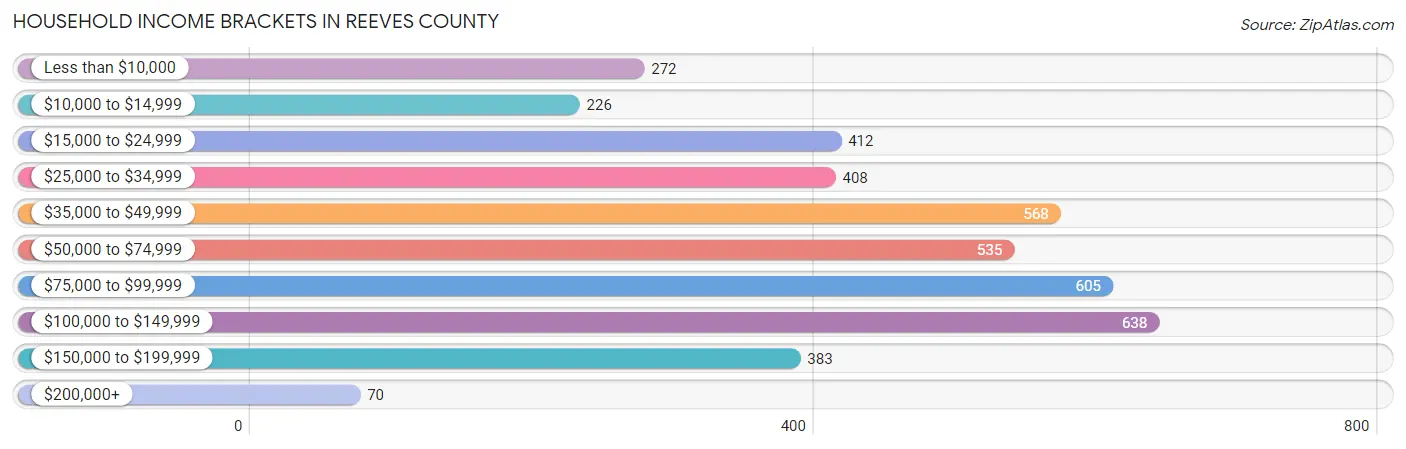
| Income Bracket | # Households | % Households |
| Less than $10,000 | 272 | 6.6% |
| $10,000 to $14,999 | 226 | 5.5% |
| $15,000 to $24,999 | 412 | 10.0% |
| $25,000 to $34,999 | 408 | 9.9% |
| $35,000 to $49,999 | 568 | 13.8% |
| $50,000 to $74,999 | 535 | 13.0% |
| $75,000 to $99,999 | 605 | 14.7% |
| $100,000 to $149,999 | 638 | 15.5% |
| $150,000 to $199,999 | 383 | 9.3% |
| $200,000+ | 70 | 1.7% |
Household Income by Householder Age in Reeves County
The median household income in Reeves County is $57,487, with the highest median household income of $91,731 found in the 45 to 64 years age bracket for the primary householder. A total of 1,588 households (38.6%) fall into this category. Meanwhile, the 15 to 24 years age bracket for the primary householder has the lowest median household income of $0, with 140 households (3.4%) in this group.
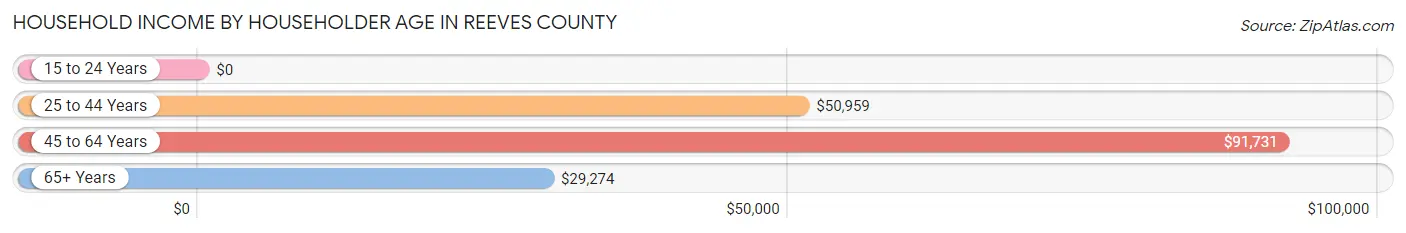
| Income Bracket | # Households | Median Income |
| 15 to 24 Years | 140 (3.4%) | $0 |
| 25 to 44 Years | 1,481 (36.0%) | $50,959 |
| 45 to 64 Years | 1,588 (38.6%) | $91,731 |
| 65+ Years | 908 (22.1%) | $29,274 |
| Total | 4,117 (100.0%) | $57,487 |
Poverty in Reeves County
Income Below Poverty by Sex and Age in Reeves County
With 22.7% poverty level for males and 18.6% for females among the residents of Reeves County, under 5 year old males and 5 year old females are the most vulnerable to poverty, with 205 males (51.6%) and 47 females (70.2%) in their respective age groups living below the poverty level.
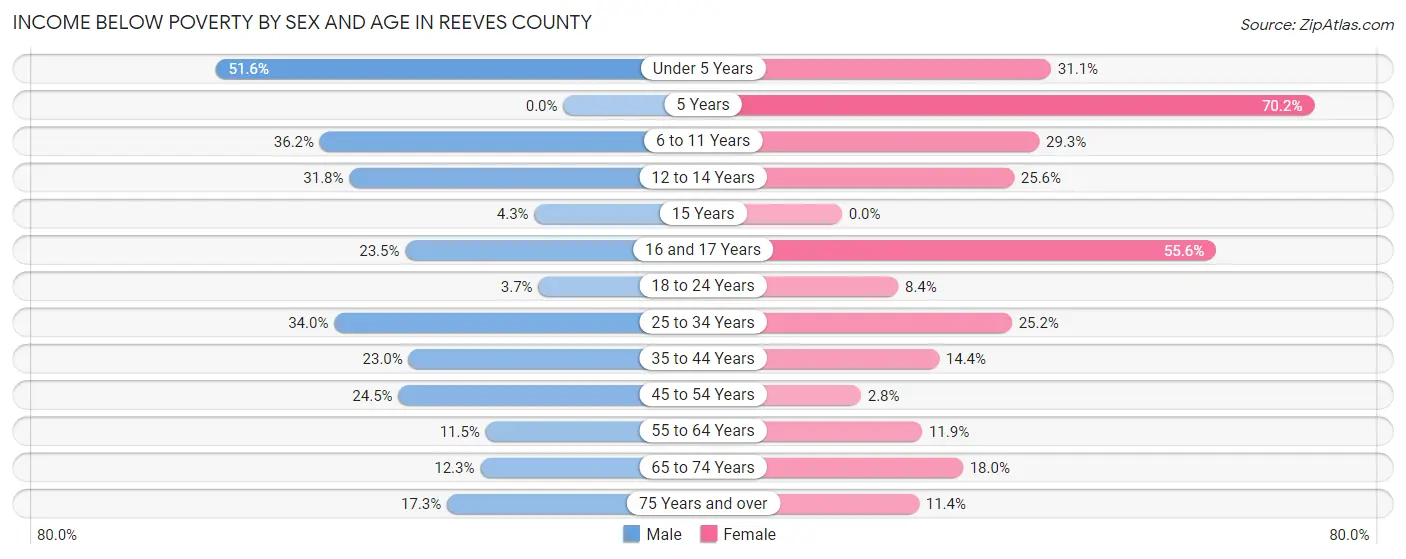
| Age Bracket | Male | Female |
| Under 5 Years | 205 (51.6%) | 136 (31.0%) |
| 5 Years | 0 (0.0%) | 47 (70.2%) |
| 6 to 11 Years | 205 (36.2%) | 160 (29.3%) |
| 12 to 14 Years | 82 (31.8%) | 70 (25.6%) |
| 15 Years | 8 (4.3%) | 0 (0.0%) |
| 16 and 17 Years | 65 (23.5%) | 55 (55.6%) |
| 18 to 24 Years | 37 (3.7%) | 49 (8.4%) |
| 25 to 34 Years | 347 (34.0%) | 190 (25.2%) |
| 35 to 44 Years | 248 (23.0%) | 98 (14.4%) |
| 45 to 54 Years | 326 (24.5%) | 14 (2.8%) |
| 55 to 64 Years | 55 (11.5%) | 66 (11.9%) |
| 65 to 74 Years | 64 (12.3%) | 81 (18.0%) |
| 75 Years and over | 48 (17.3%) | 48 (11.4%) |
| Total | 1,690 (22.7%) | 1,014 (18.6%) |
Income Above Poverty by Sex and Age in Reeves County
According to the poverty statistics in Reeves County, males aged 5 years and females aged 15 years are the age groups that are most secure financially, with 100.0% of males and 100.0% of females in these age groups living above the poverty line.
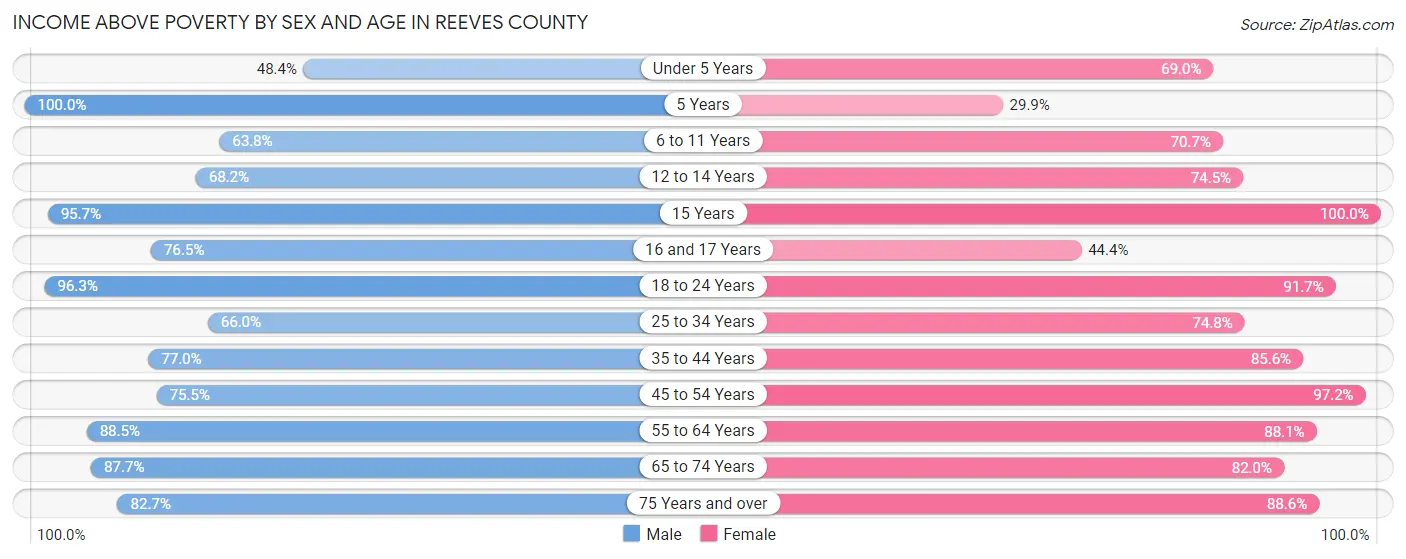
| Age Bracket | Male | Female |
| Under 5 Years | 192 (48.4%) | 302 (69.0%) |
| 5 Years | 67 (100.0%) | 20 (29.8%) |
| 6 to 11 Years | 362 (63.8%) | 386 (70.7%) |
| 12 to 14 Years | 176 (68.2%) | 204 (74.5%) |
| 15 Years | 178 (95.7%) | 76 (100.0%) |
| 16 and 17 Years | 212 (76.5%) | 44 (44.4%) |
| 18 to 24 Years | 963 (96.3%) | 538 (91.6%) |
| 25 to 34 Years | 673 (66.0%) | 563 (74.8%) |
| 35 to 44 Years | 831 (77.0%) | 582 (85.6%) |
| 45 to 54 Years | 1,005 (75.5%) | 482 (97.2%) |
| 55 to 64 Years | 422 (88.5%) | 488 (88.1%) |
| 65 to 74 Years | 455 (87.7%) | 370 (82.0%) |
| 75 Years and over | 230 (82.7%) | 372 (88.6%) |
| Total | 5,766 (77.3%) | 4,427 (81.4%) |
Income Below Poverty Among Married-Couple Families in Reeves County
The poverty statistics for married-couple families in Reeves County show that 3.6% or 60 of the total 1,681 families live below the poverty line. Families with no children have the highest poverty rate of 6.1%, comprising of 49 families. On the other hand, families with 3 or 4 children have the lowest poverty rate of 0.0%, which includes 0 families.
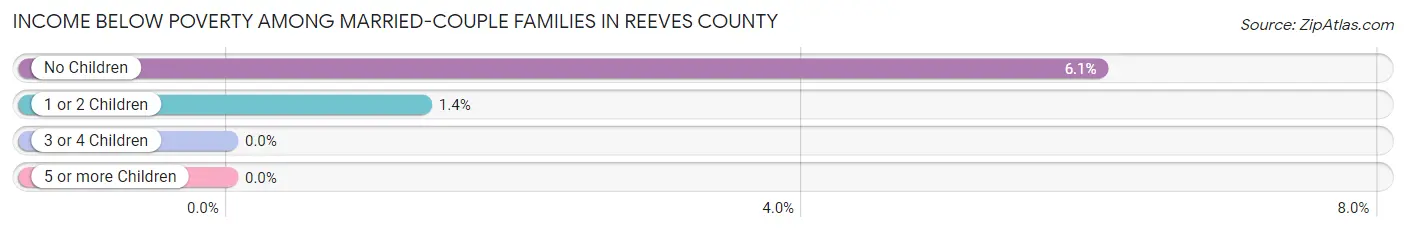
| Children | Above Poverty | Below Poverty |
| No Children | 759 (93.9%) | 49 (6.1%) |
| 1 or 2 Children | 801 (98.7%) | 11 (1.3%) |
| 3 or 4 Children | 49 (100.0%) | 0 (0.0%) |
| 5 or more Children | 12 (100.0%) | 0 (0.0%) |
| Total | 1,621 (96.4%) | 60 (3.6%) |
Income Below Poverty Among Single-Parent Households in Reeves County
According to the poverty data in Reeves County, 18.4% or 39 single-father households and 46.7% or 344 single-mother households are living below the poverty line. Among single-father households, those with 3 or 4 children have the highest poverty rate, with 30 households (41.1%) experiencing poverty. Likewise, among single-mother households, those with 5 or more children have the highest poverty rate, with 48 households (100.0%) falling below the poverty line.
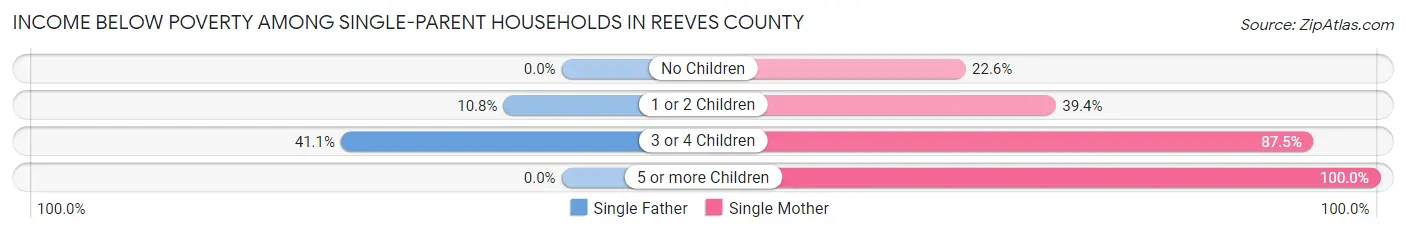
| Children | Single Father | Single Mother |
| No Children | 0 (0.0%) | 50 (22.6%) |
| 1 or 2 Children | 9 (10.8%) | 134 (39.4%) |
| 3 or 4 Children | 30 (41.1%) | 112 (87.5%) |
| 5 or more Children | 0 (0.0%) | 48 (100.0%) |
| Total | 39 (18.4%) | 344 (46.7%) |
Income Below Poverty Among Married-Couple vs Single-Parent Households in Reeves County
The poverty data for Reeves County shows that 60 of the married-couple family households (3.6%) and 383 of the single-parent households (40.4%) are living below the poverty level. Within the married-couple family households, those with no children have the highest poverty rate, with 49 households (6.1%) falling below the poverty line. Among the single-parent households, those with 5 or more children have the highest poverty rate, with 48 household (100.0%) living below poverty.
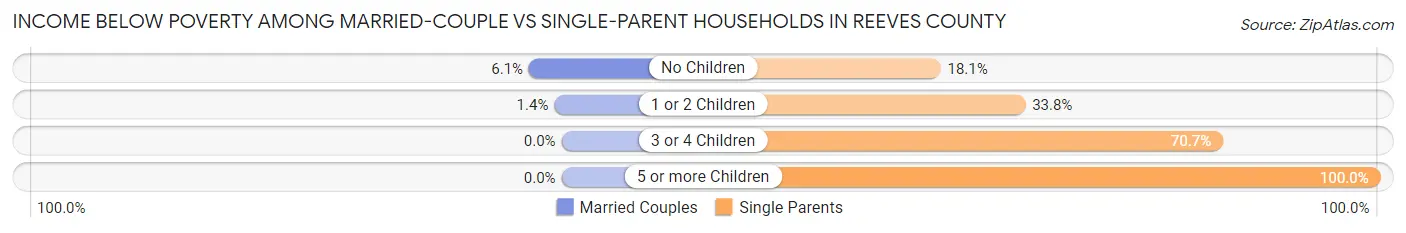
| Children | Married-Couple Families | Single-Parent Households |
| No Children | 49 (6.1%) | 50 (18.0%) |
| 1 or 2 Children | 11 (1.3%) | 143 (33.8%) |
| 3 or 4 Children | 0 (0.0%) | 142 (70.7%) |
| 5 or more Children | 0 (0.0%) | 48 (100.0%) |
| Total | 60 (3.6%) | 383 (40.4%) |
Race in Reeves County
The most populous races in Reeves County are Hispanic or Latino (10,574 | 75.4%), White / Caucasian (7,512 | 53.6%), and Some other Race (3,097 | 22.1%).
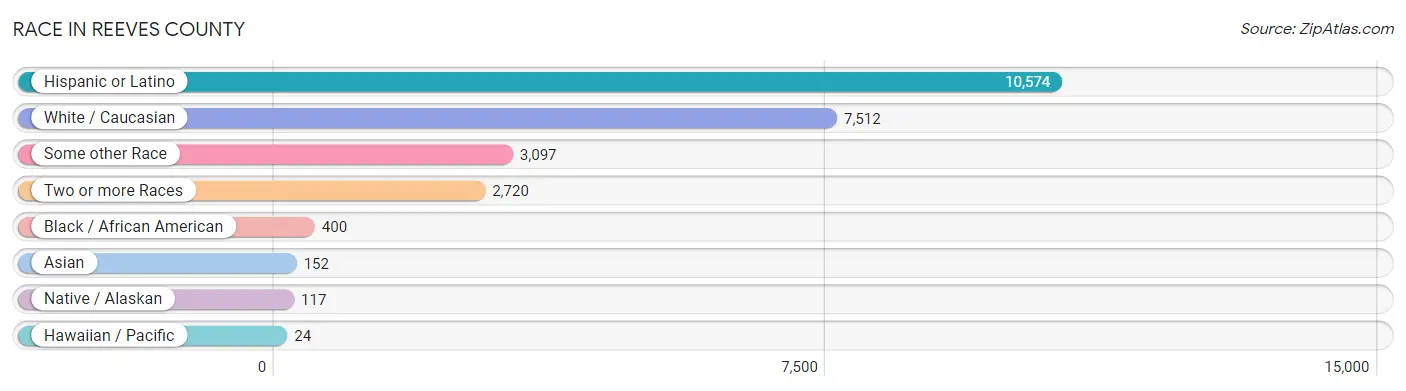
| Race | # Population | % Population |
| Asian | 152 | 1.1% |
| Black / African American | 400 | 2.9% |
| Hawaiian / Pacific | 24 | 0.2% |
| Hispanic or Latino | 10,574 | 75.4% |
| Native / Alaskan | 117 | 0.8% |
| White / Caucasian | 7,512 | 53.6% |
| Two or more Races | 2,720 | 19.4% |
| Some other Race | 3,097 | 22.1% |
| Total | 14,022 | 100.0% |
Ancestry in Reeves County
The most populous ancestries reported in Reeves County are Mexican (9,806 | 69.9%), American (696 | 5.0%), German (628 | 4.5%), Italian (389 | 2.8%), and Czech (240 | 1.7%), together accounting for 83.8% of all Reeves County residents.
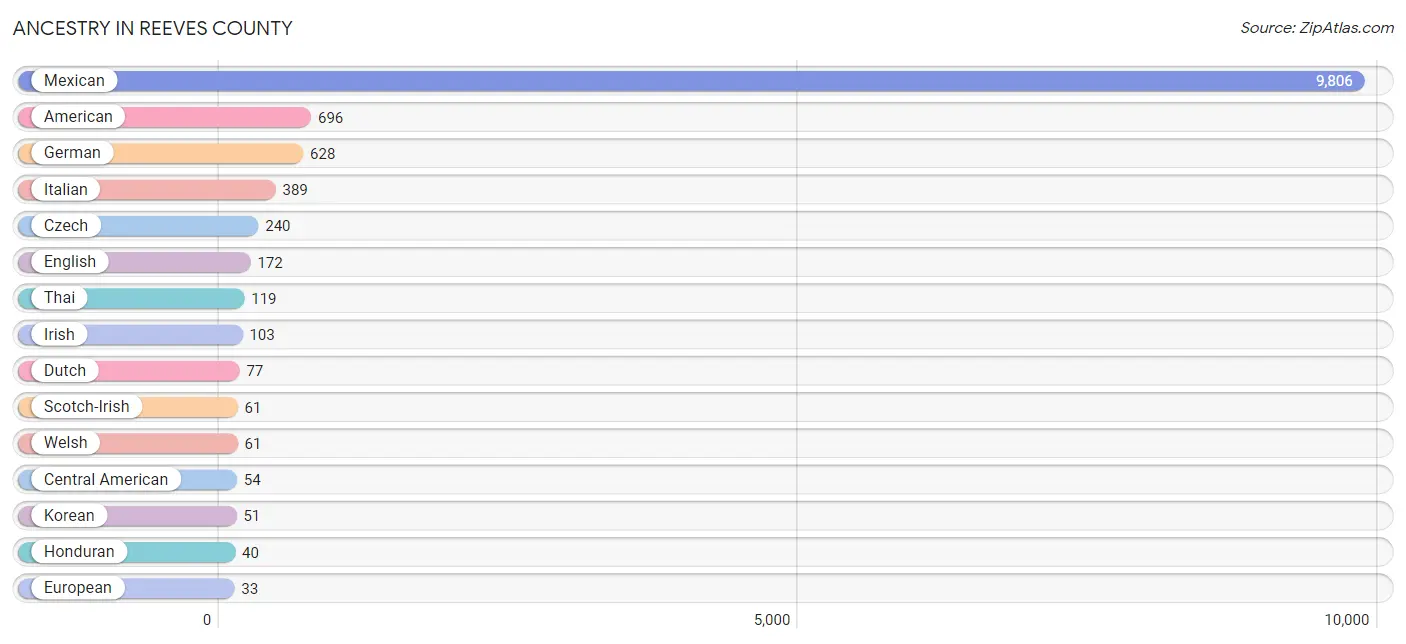
| Ancestry | # Population | % Population |
| American | 696 | 5.0% |
| Armenian | 3 | 0.0% |
| Barbadian | 18 | 0.1% |
| Belizean | 21 | 0.2% |
| British | 7 | 0.1% |
| Central American | 54 | 0.4% |
| Comanche | 27 | 0.2% |
| Czech | 240 | 1.7% |
| Dominican | 6 | 0.0% |
| Dutch | 77 | 0.5% |
| Ecuadorian | 3 | 0.0% |
| English | 172 | 1.2% |
| European | 33 | 0.2% |
| French | 7 | 0.1% |
| German | 628 | 4.5% |
| Guatemalan | 11 | 0.1% |
| Honduran | 40 | 0.3% |
| Irish | 103 | 0.7% |
| Italian | 389 | 2.8% |
| Korean | 51 | 0.4% |
| Mexican | 9,806 | 69.9% |
| Mexican American Indian | 13 | 0.1% |
| Native Hawaiian | 3 | 0.0% |
| Pakistani | 12 | 0.1% |
| Puerto Rican | 19 | 0.1% |
| Salvadoran | 3 | 0.0% |
| Scotch-Irish | 61 | 0.4% |
| Slovene | 26 | 0.2% |
| South American | 3 | 0.0% |
| Spanish | 6 | 0.0% |
| Thai | 119 | 0.9% |
| Tongan | 21 | 0.2% |
| Welsh | 61 | 0.4% | View All 33 Rows |
Immigrants in Reeves County
The most numerous immigrant groups reported in Reeves County came from Latin America (2,272 | 16.2%), Central America (2,212 | 15.8%), Mexico (2,129 | 15.2%), Asia (122 | 0.9%), and China (63 | 0.4%), together accounting for 48.5% of all Reeves County residents.
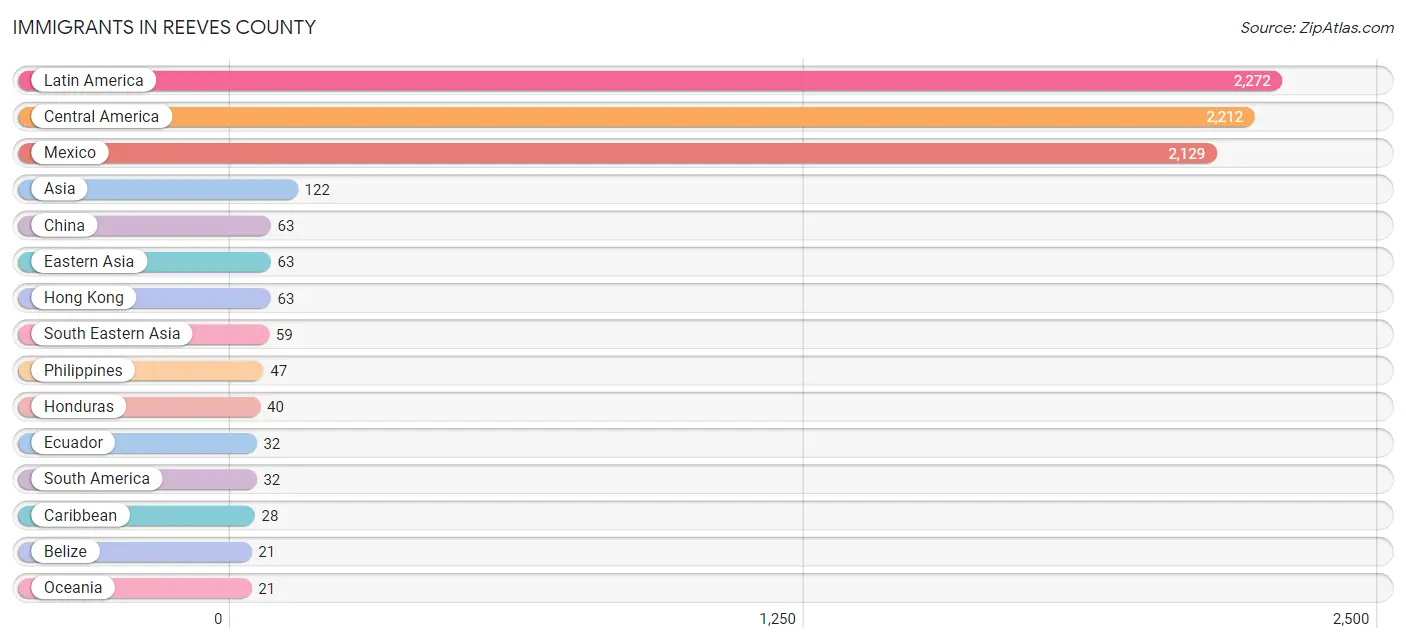
| Immigration Origin | # Population | % Population |
| Asia | 122 | 0.9% |
| Barbados | 18 | 0.1% |
| Belize | 21 | 0.2% |
| Caribbean | 28 | 0.2% |
| Central America | 2,212 | 15.8% |
| China | 63 | 0.4% |
| Dominican Republic | 10 | 0.1% |
| Eastern Asia | 63 | 0.4% |
| Ecuador | 32 | 0.2% |
| El Salvador | 11 | 0.1% |
| Europe | 8 | 0.1% |
| Guatemala | 11 | 0.1% |
| Honduras | 40 | 0.3% |
| Hong Kong | 63 | 0.4% |
| Latin America | 2,272 | 16.2% |
| Mexico | 2,129 | 15.2% |
| Oceania | 21 | 0.2% |
| Philippines | 47 | 0.3% |
| South America | 32 | 0.2% |
| South Eastern Asia | 59 | 0.4% |
| Thailand | 12 | 0.1% | View All 21 Rows |
Sex and Age in Reeves County
Sex and Age in Reeves County
The most populous age groups in Reeves County are 45 to 49 Years (1,249 | 14.6%) for men and 10 to 14 Years (483 | 8.8%) for women.
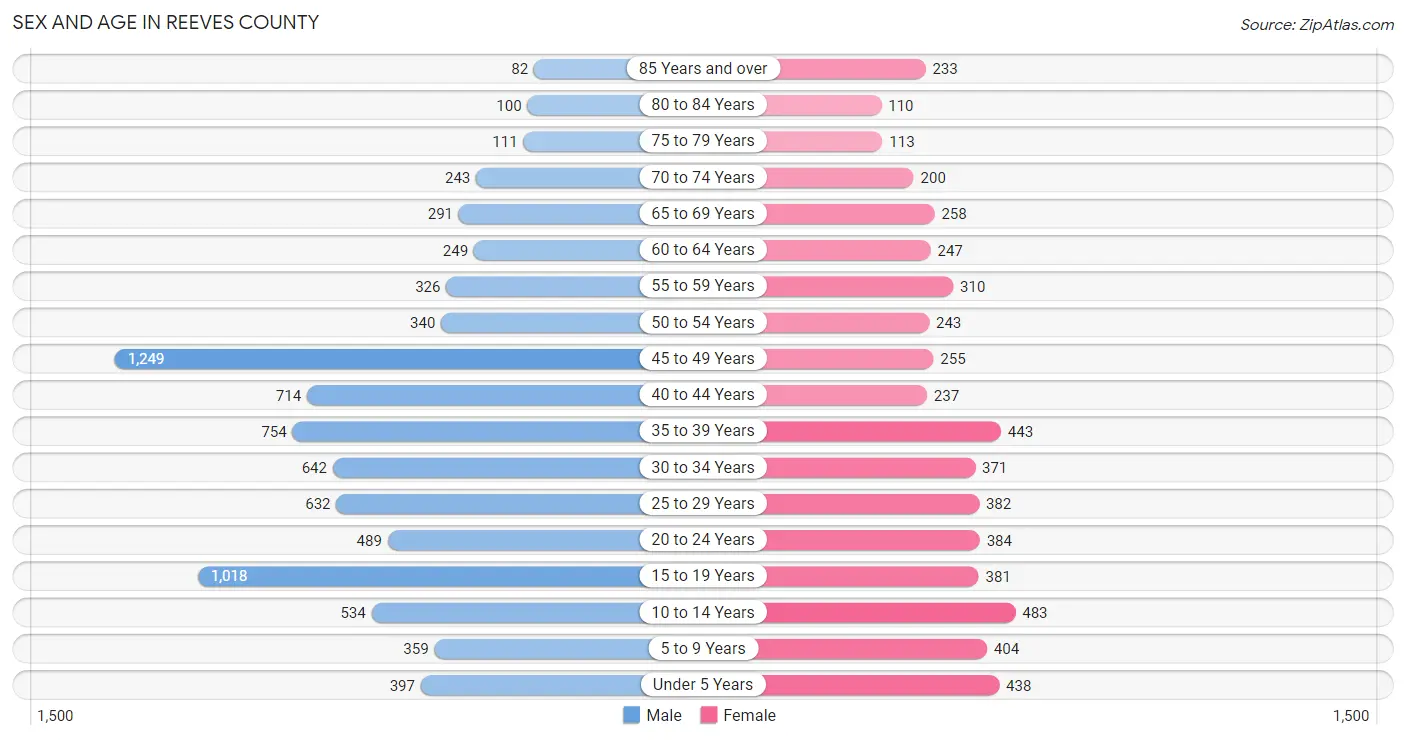
| Age Bracket | Male | Female |
| Under 5 Years | 397 (4.6%) | 438 (8.0%) |
| 5 to 9 Years | 359 (4.2%) | 404 (7.4%) |
| 10 to 14 Years | 534 (6.3%) | 483 (8.8%) |
| 15 to 19 Years | 1,018 (11.9%) | 381 (6.9%) |
| 20 to 24 Years | 489 (5.7%) | 384 (7.0%) |
| 25 to 29 Years | 632 (7.4%) | 382 (7.0%) |
| 30 to 34 Years | 642 (7.5%) | 371 (6.8%) |
| 35 to 39 Years | 754 (8.8%) | 443 (8.1%) |
| 40 to 44 Years | 714 (8.4%) | 237 (4.3%) |
| 45 to 49 Years | 1,249 (14.6%) | 255 (4.6%) |
| 50 to 54 Years | 340 (4.0%) | 243 (4.4%) |
| 55 to 59 Years | 326 (3.8%) | 310 (5.6%) |
| 60 to 64 Years | 249 (2.9%) | 247 (4.5%) |
| 65 to 69 Years | 291 (3.4%) | 258 (4.7%) |
| 70 to 74 Years | 243 (2.9%) | 200 (3.6%) |
| 75 to 79 Years | 111 (1.3%) | 113 (2.1%) |
| 80 to 84 Years | 100 (1.2%) | 110 (2.0%) |
| 85 Years and over | 82 (1.0%) | 233 (4.2%) |
| Total | 8,530 (100.0%) | 5,492 (100.0%) |
Families and Households in Reeves County
Median Family Size in Reeves County
The median family size in Reeves County is 3.89 persons per family, with single female/mother families (737 | 28.0%) accounting for the largest median family size of 4.32 persons per family. On the other hand, single male/father families (212 | 8.1%) represent the smallest median family size with 3.49 persons per family.
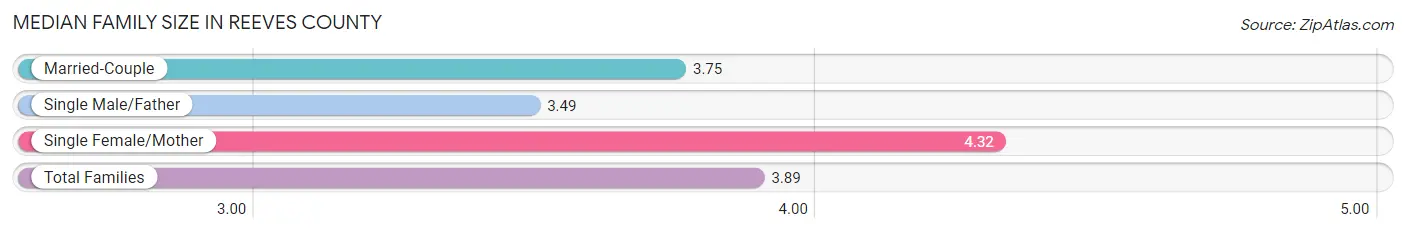
| Family Type | # Families | Family Size |
| Married-Couple | 1,681 (63.9%) | 3.75 |
| Single Male/Father | 212 (8.1%) | 3.49 |
| Single Female/Mother | 737 (28.0%) | 4.32 |
| Total Families | 2,630 (100.0%) | 3.89 |
Median Household Size in Reeves County
The median household size in Reeves County is 3.13 persons per household, with single female/mother households (737 | 17.9%) accounting for the largest median household size of 4.79 persons per household. non-family households (1,487 | 36.1%) represent the smallest median household size with 1.47 persons per household.
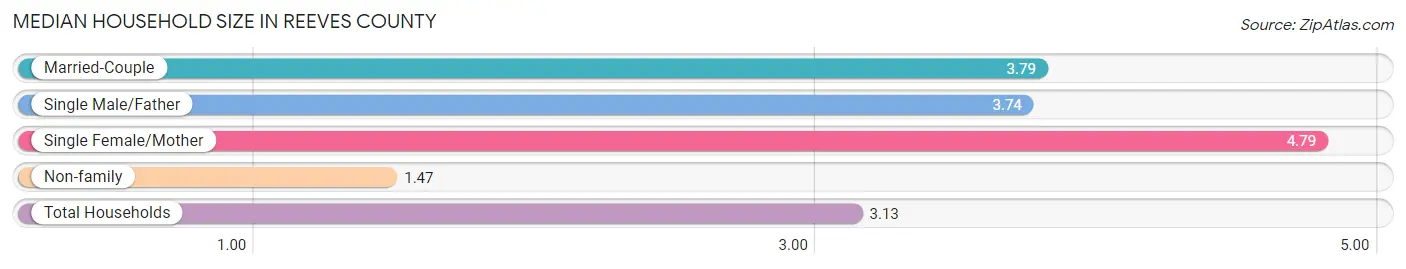
| Household Type | # Households | Household Size |
| Married-Couple | 1,681 (40.8%) | 3.79 |
| Single Male/Father | 212 (5.1%) | 3.74 |
| Single Female/Mother | 737 (17.9%) | 4.79 |
| Non-family | 1,487 (36.1%) | 1.47 |
| Total Households | 4,117 (100.0%) | 3.13 |
Household Size by Marriage Status in Reeves County
Out of a total of 4,117 households in Reeves County, 2,630 (63.9%) are family households, while 1,487 (36.1%) are nonfamily households. The most numerous type of family households are 2-person households, comprising 1,030, and the most common type of nonfamily households are 1-person households, comprising 1,310.
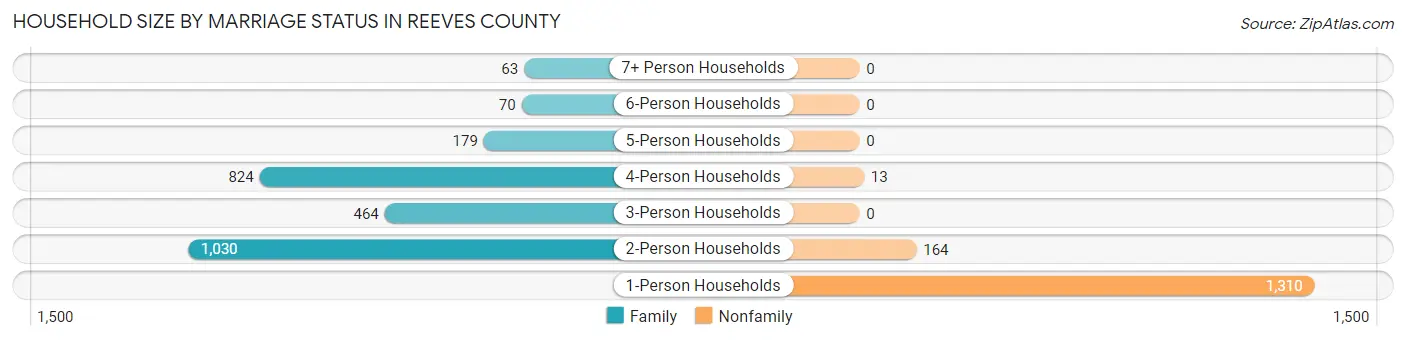
| Household Size | Family Households | Nonfamily Households |
| 1-Person Households | - | 1,310 (31.8%) |
| 2-Person Households | 1,030 (25.0%) | 164 (4.0%) |
| 3-Person Households | 464 (11.3%) | 0 (0.0%) |
| 4-Person Households | 824 (20.0%) | 13 (0.3%) |
| 5-Person Households | 179 (4.3%) | 0 (0.0%) |
| 6-Person Households | 70 (1.7%) | 0 (0.0%) |
| 7+ Person Households | 63 (1.5%) | 0 (0.0%) |
| Total | 2,630 (63.9%) | 1,487 (36.1%) |
Female Fertility in Reeves County
Fertility by Age in Reeves County
Average fertility rate in Reeves County is 34.0 births per 1,000 women. Women in the age bracket of 20 to 34 years have the highest fertility rate with 61.0 births per 1,000 women. Women in the age bracket of 20 to 34 years acount for 82.1% of all women with births.
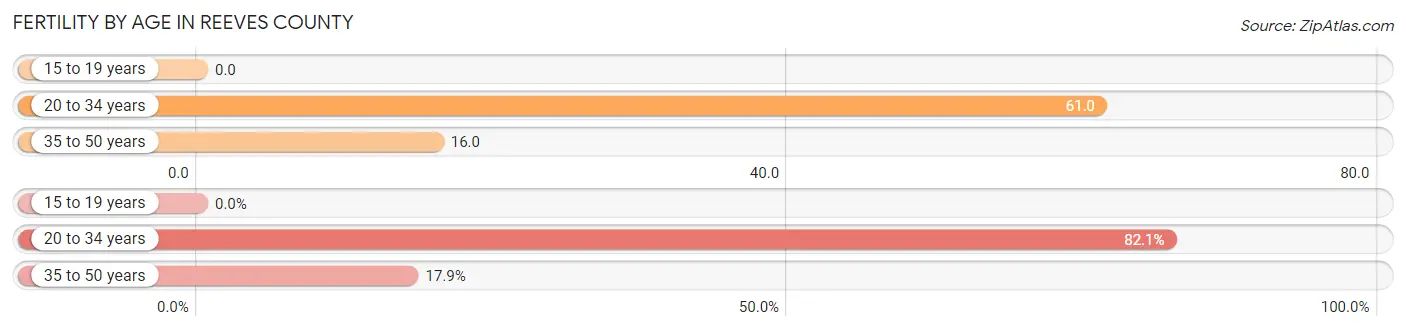
| Age Bracket | Women with Births | Births / 1,000 Women |
| 15 to 19 years | 0 (0.0%) | 0.0 |
| 20 to 34 years | 69 (82.1%) | 61.0 |
| 35 to 50 years | 15 (17.9%) | 16.0 |
| Total | 84 (100.0%) | 34.0 |
Fertility by Age by Marriage Status in Reeves County
33.3% of women with births (84) in Reeves County are married. The highest percentage of unmarried women with births falls into 20 to 34 years age bracket with 66.7% of them unmarried at the time of birth, while the lowest percentage of unmarried women with births belong to 20 to 34 years age bracket with 66.7% of them unmarried.
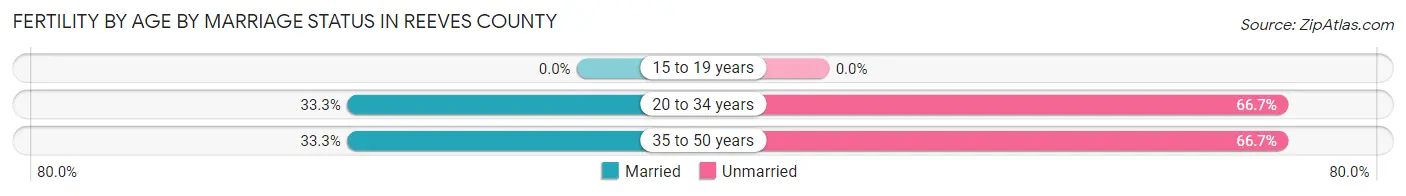
| Age Bracket | Married | Unmarried |
| 15 to 19 years | 0 (0.0%) | 0 (0.0%) |
| 20 to 34 years | 23 (33.3%) | 46 (66.7%) |
| 35 to 50 years | 5 (33.3%) | 10 (66.7%) |
| Total | 28 (33.3%) | 56 (66.7%) |
Fertility by Education in Reeves County
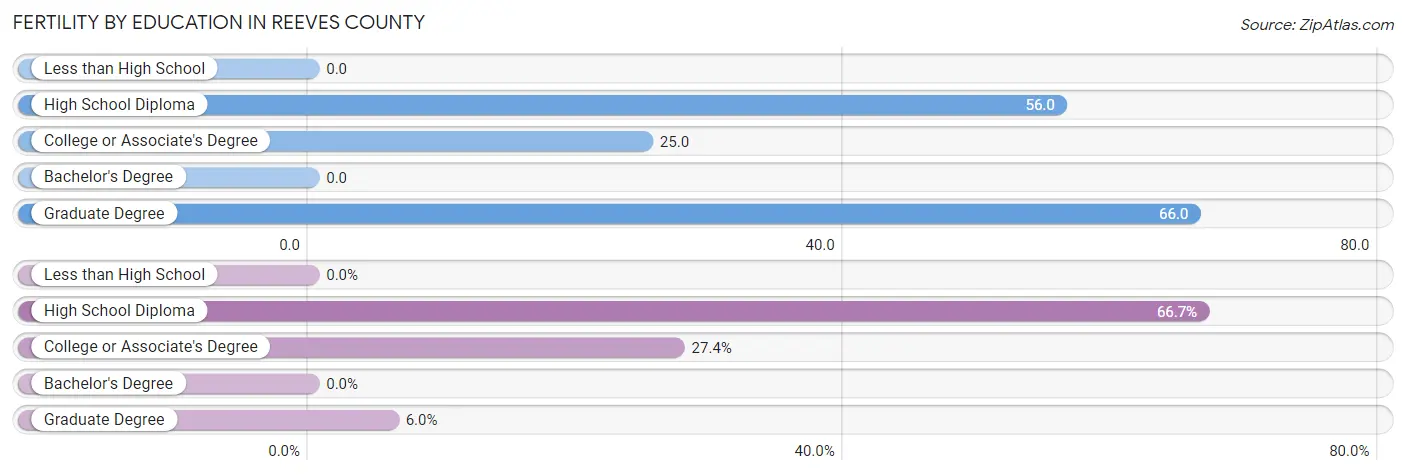
| Educational Attainment | Women with Births | Births / 1,000 Women |
| Less than High School | 0 (0.0%) | 0.0 |
| High School Diploma | 56 (66.7%) | 56.0 |
| College or Associate's Degree | 23 (27.4%) | 25.0 |
| Bachelor's Degree | 0 (0.0%) | 0.0 |
| Graduate Degree | 5 (5.9%) | 66.0 |
| Total | 84 (100.0%) | 34.0 |
Fertility by Education by Marriage Status in Reeves County
66.7% of women with births in Reeves County are unmarried. Women with the educational attainment of graduate degree are most likely to be married with 100.0% of them married at childbirth, while women with the educational attainment of college or associate's degree are least likely to be married with 100.0% of them unmarried at childbirth.
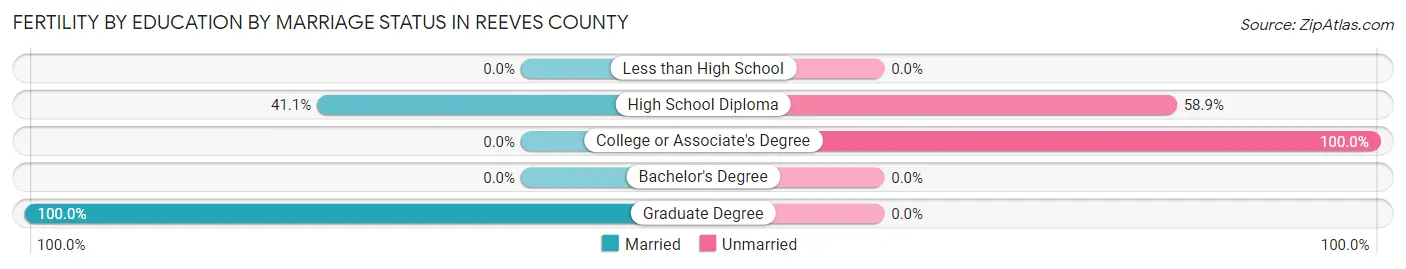
| Educational Attainment | Married | Unmarried |
| Less than High School | 0 (0.0%) | 0 (0.0%) |
| High School Diploma | 23 (41.1%) | 33 (58.9%) |
| College or Associate's Degree | 0 (0.0%) | 23 (100.0%) |
| Bachelor's Degree | 0 (0.0%) | 0 (0.0%) |
| Graduate Degree | 5 (100.0%) | 0 (0.0%) |
| Total | 28 (33.3%) | 56 (66.7%) |
Employment Characteristics in Reeves County
Employment by Class of Employer in Reeves County
Among the 6,255 employed individuals in Reeves County, private company employees (4,243 | 67.8%), self-employed (not incorporated) (668 | 10.7%), and local government employees (642 | 10.3%) make up the most common classes of employment.
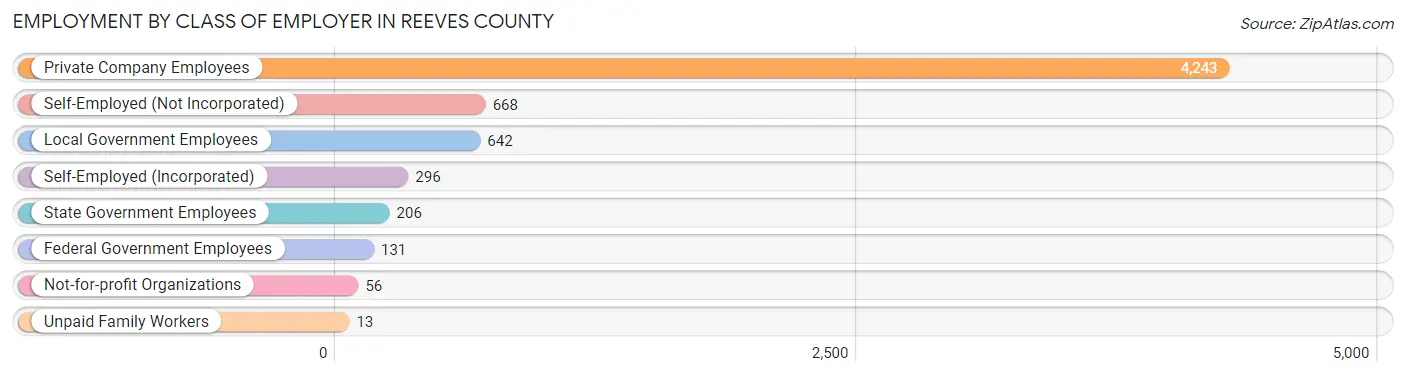
| Employer Class | # Employees | % Employees |
| Private Company Employees | 4,243 | 67.8% |
| Self-Employed (Incorporated) | 296 | 4.7% |
| Self-Employed (Not Incorporated) | 668 | 10.7% |
| Not-for-profit Organizations | 56 | 0.9% |
| Local Government Employees | 642 | 10.3% |
| State Government Employees | 206 | 3.3% |
| Federal Government Employees | 131 | 2.1% |
| Unpaid Family Workers | 13 | 0.2% |
| Total | 6,255 | 100.0% |
Employment Status by Age in Reeves County
According to the labor force statistics for Reeves County, out of the total population over 16 years of age (11,145), 61.0% or 6,798 individuals are in the labor force, with 7.0% or 476 of them unemployed. The age group with the highest labor force participation rate is 25 to 29 years, with 78.2% or 793 individuals in the labor force. Within the labor force, the 30 to 34 years age range has the highest percentage of unemployed individuals, with 36.2% or 180 of them being unemployed.
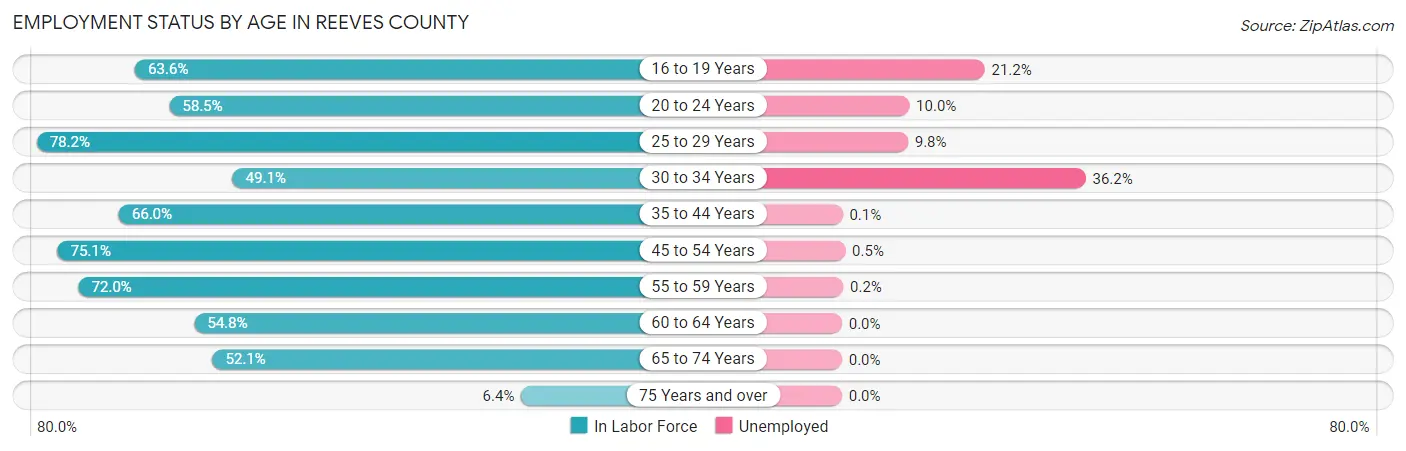
| Age Bracket | In Labor Force | Unemployed |
| 16 to 19 Years | 723 (63.6%) | 153 (21.2%) |
| 20 to 24 Years | 511 (58.5%) | 51 (10.0%) |
| 25 to 29 Years | 793 (78.2%) | 78 (9.8%) |
| 30 to 34 Years | 497 (49.1%) | 180 (36.2%) |
| 35 to 44 Years | 1,418 (66.0%) | 1 (0.1%) |
| 45 to 54 Years | 1,567 (75.1%) | 8 (0.5%) |
| 55 to 59 Years | 458 (72.0%) | 1 (0.2%) |
| 60 to 64 Years | 272 (54.8%) | 0 (0.0%) |
| 65 to 74 Years | 517 (52.1%) | 0 (0.0%) |
| 75 Years and over | 48 (6.4%) | 0 (0.0%) |
| Total | 6,798 (61.0%) | 476 (7.0%) |
Employment Status by Educational Attainment in Reeves County
According to labor force statistics for Reeves County, 67.7% of individuals (5,006) out of the total population between 25 and 64 years of age (7,394) are in the labor force, with 5.4% or 270 of them being unemployed. The group with the highest labor force participation rate are those with the educational attainment of bachelor's degree or higher, with 80.3% or 618 individuals in the labor force. Within the labor force, individuals with bachelor's degree or higher education have the highest percentage of unemployment, with 29.3% or 181 of them being unemployed.
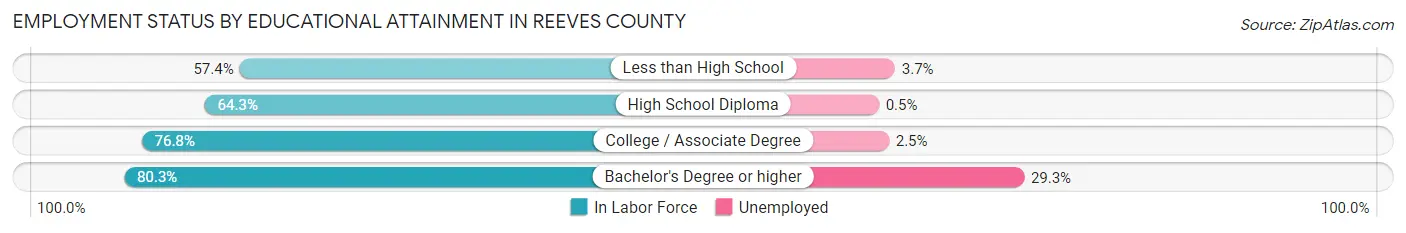
| Educational Attainment | In Labor Force | Unemployed |
| Less than High School | 1,076 (57.4%) | 69 (3.7%) |
| High School Diploma | 1,735 (64.3%) | 13 (0.5%) |
| College / Associate Degree | 1,575 (76.8%) | 51 (2.5%) |
| Bachelor's Degree or higher | 618 (80.3%) | 226 (29.3%) |
| Total | 5,006 (67.7%) | 399 (5.4%) |
Employment Occupations by Sex in Reeves County
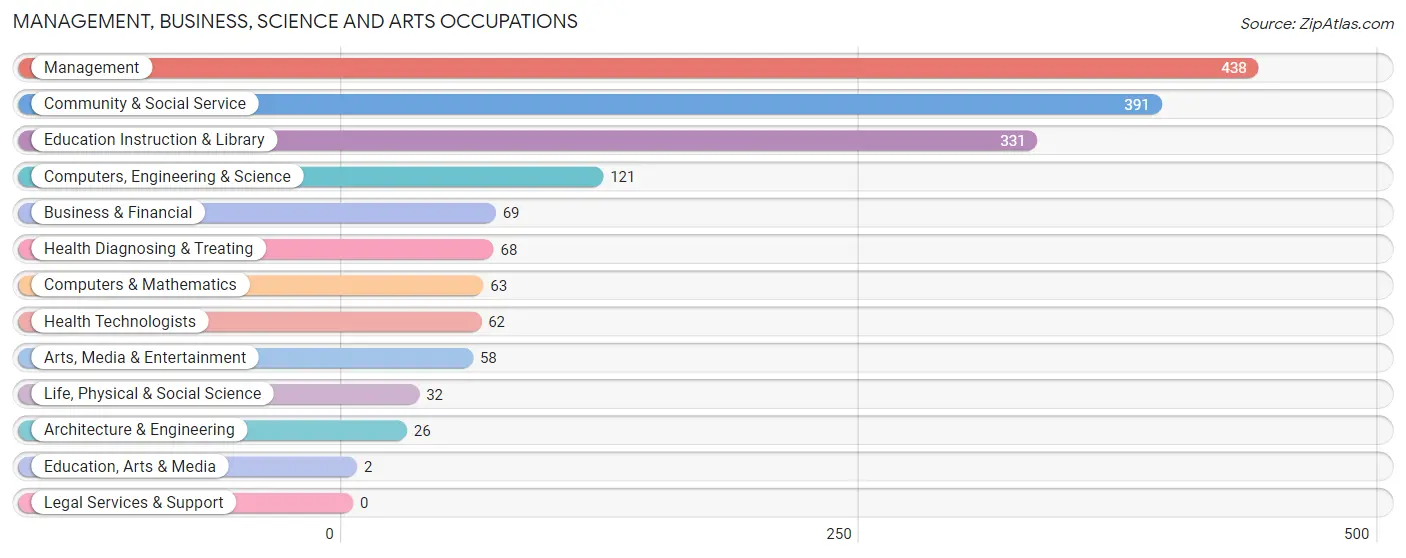
Management, Business, Science and Arts Occupations
The most common Management, Business, Science and Arts occupations in Reeves County are Management (438 | 6.9%), Community & Social Service (391 | 6.2%), Education Instruction & Library (331 | 5.2%), Computers, Engineering & Science (121 | 1.9%), and Business & Financial (69 | 1.1%).
Management, Business, Science and Arts Occupations by Sex
Within the Management, Business, Science and Arts occupations in Reeves County, the most male-oriented occupations are Computers, Engineering & Science (100.0%), Computers & Mathematics (100.0%), and Architecture & Engineering (100.0%), while the most female-oriented occupations are Education, Arts & Media (100.0%), Arts, Media & Entertainment (100.0%), and Community & Social Service (99.2%).
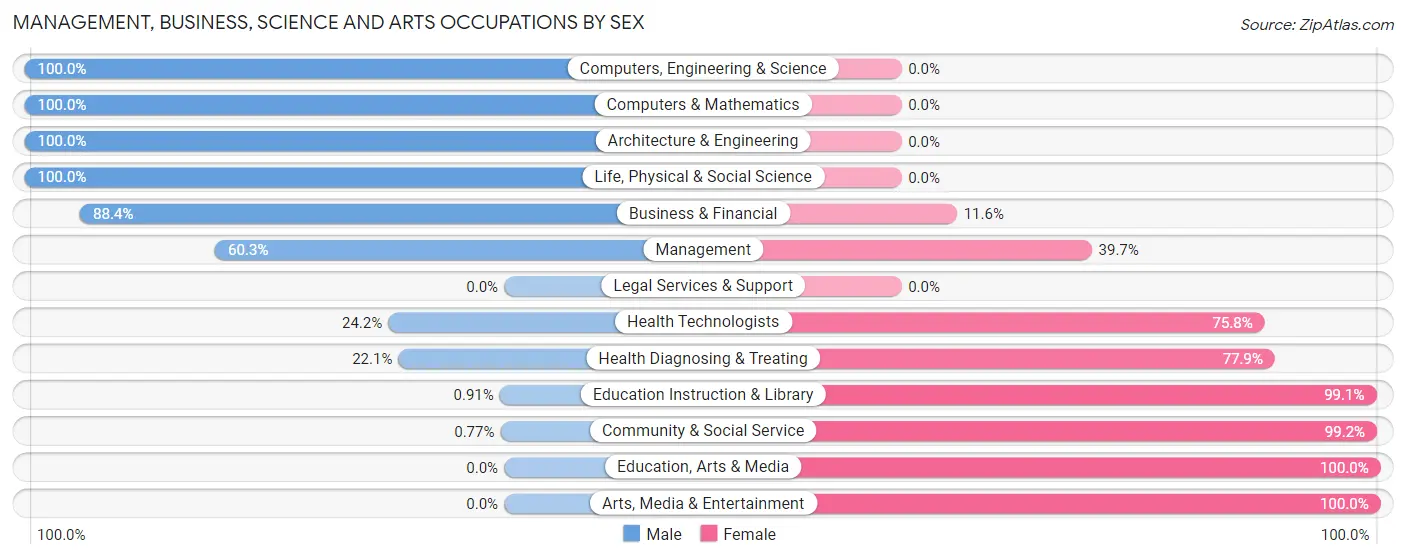
| Occupation | Male | Female |
| Management | 264 (60.3%) | 174 (39.7%) |
| Business & Financial | 61 (88.4%) | 8 (11.6%) |
| Computers, Engineering & Science | 121 (100.0%) | 0 (0.0%) |
| Computers & Mathematics | 63 (100.0%) | 0 (0.0%) |
| Architecture & Engineering | 26 (100.0%) | 0 (0.0%) |
| Life, Physical & Social Science | 32 (100.0%) | 0 (0.0%) |
| Community & Social Service | 3 (0.8%) | 388 (99.2%) |
| Education, Arts & Media | 0 (0.0%) | 2 (100.0%) |
| Legal Services & Support | 0 (0.0%) | 0 (0.0%) |
| Education Instruction & Library | 3 (0.9%) | 328 (99.1%) |
| Arts, Media & Entertainment | 0 (0.0%) | 58 (100.0%) |
| Health Diagnosing & Treating | 15 (22.1%) | 53 (77.9%) |
| Health Technologists | 15 (24.2%) | 47 (75.8%) |
| Total (Category) | 464 (42.7%) | 623 (57.3%) |
| Total (Overall) | 4,021 (63.5%) | 2,310 (36.5%) |
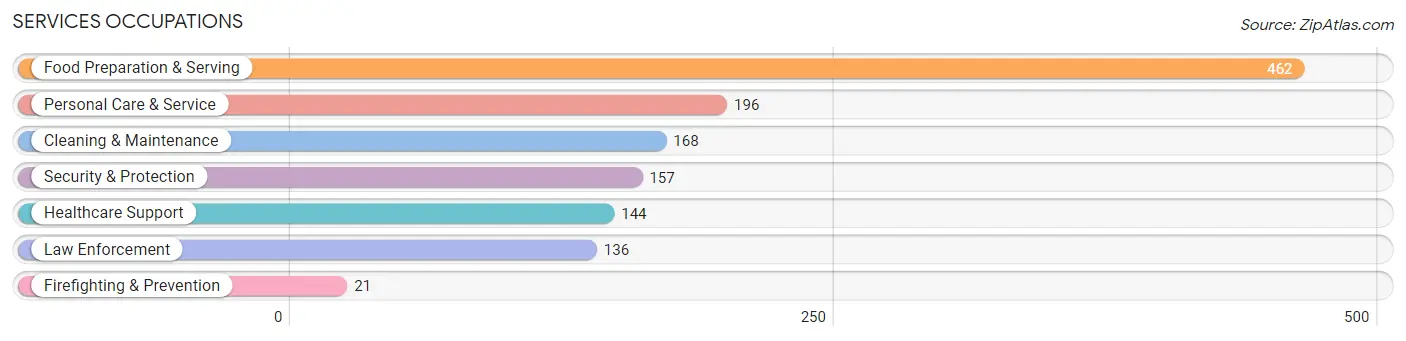
Services Occupations
The most common Services occupations in Reeves County are Food Preparation & Serving (462 | 7.3%), Personal Care & Service (196 | 3.1%), Cleaning & Maintenance (168 | 2.6%), Security & Protection (157 | 2.5%), and Healthcare Support (144 | 2.3%).
Services Occupations by Sex
Within the Services occupations in Reeves County, the most male-oriented occupations are Firefighting & Prevention (100.0%), Personal Care & Service (90.8%), and Security & Protection (66.2%), while the most female-oriented occupations are Healthcare Support (79.2%), Food Preparation & Serving (71.7%), and Cleaning & Maintenance (63.7%).
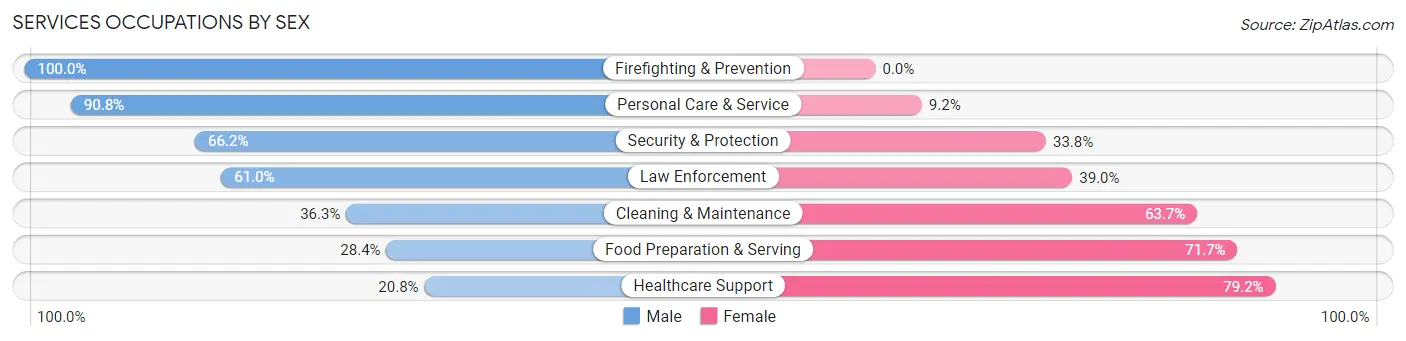
| Occupation | Male | Female |
| Healthcare Support | 30 (20.8%) | 114 (79.2%) |
| Security & Protection | 104 (66.2%) | 53 (33.8%) |
| Firefighting & Prevention | 21 (100.0%) | 0 (0.0%) |
| Law Enforcement | 83 (61.0%) | 53 (39.0%) |
| Food Preparation & Serving | 131 (28.3%) | 331 (71.7%) |
| Cleaning & Maintenance | 61 (36.3%) | 107 (63.7%) |
| Personal Care & Service | 178 (90.8%) | 18 (9.2%) |
| Total (Category) | 504 (44.7%) | 623 (55.3%) |
| Total (Overall) | 4,021 (63.5%) | 2,310 (36.5%) |
Sales and Office Occupations
The most common Sales and Office occupations in Reeves County are Office & Administration (717 | 11.3%), and Sales & Related (342 | 5.4%).
Sales and Office Occupations by Sex
| Occupation | Male | Female |
| Sales & Related | 157 (45.9%) | 185 (54.1%) |
| Office & Administration | 60 (8.4%) | 657 (91.6%) |
| Total (Category) | 217 (20.5%) | 842 (79.5%) |
| Total (Overall) | 4,021 (63.5%) | 2,310 (36.5%) |
Natural Resources, Construction and Maintenance Occupations
The most common Natural Resources, Construction and Maintenance occupations in Reeves County are Construction & Extraction (1,280 | 20.2%), Installation, Maintenance & Repair (398 | 6.3%), and Farming, Fishing & Forestry (158 | 2.5%).
Natural Resources, Construction and Maintenance Occupations by Sex
| Occupation | Male | Female |
| Farming, Fishing & Forestry | 158 (100.0%) | 0 (0.0%) |
| Construction & Extraction | 1,212 (94.7%) | 68 (5.3%) |
| Installation, Maintenance & Repair | 398 (100.0%) | 0 (0.0%) |
| Total (Category) | 1,768 (96.3%) | 68 (3.7%) |
| Total (Overall) | 4,021 (63.5%) | 2,310 (36.5%) |
Production, Transportation and Moving Occupations
The most common Production, Transportation and Moving occupations in Reeves County are Transportation (523 | 8.3%), Production (396 | 6.2%), and Material Moving (303 | 4.8%).
Production, Transportation and Moving Occupations by Sex
| Occupation | Male | Female |
| Production | 391 (98.7%) | 5 (1.3%) |
| Transportation | 426 (81.5%) | 97 (18.5%) |
| Material Moving | 251 (82.8%) | 52 (17.2%) |
| Total (Category) | 1,068 (87.4%) | 154 (12.6%) |
| Total (Overall) | 4,021 (63.5%) | 2,310 (36.5%) |
Employment Industries by Sex in Reeves County
Employment Industries in Reeves County
The major employment industries in Reeves County include Construction (1,082 | 17.1%), Retail Trade (973 | 15.4%), Mining, Quarrying, & Extraction (865 | 13.7%), Accommodation & Food Services (628 | 9.9%), and Transportation & Warehousing (480 | 7.6%).
Employment Industries by Sex in Reeves County
The Reeves County industries that see more men than women are Manufacturing (100.0%), Real Estate, Rental & Leasing (100.0%), and Arts, Entertainment & Recreation (100.0%), whereas the industries that tend to have a higher number of women are Health Care & Social Assistance (89.3%), Utilities (75.9%), and Public Administration (71.9%).
| Industry | Male | Female |
| Agriculture, Fishing & Hunting | 166 (97.1%) | 5 (2.9%) |
| Mining, Quarrying, & Extraction | 830 (96.0%) | 35 (4.1%) |
| Construction | 955 (88.3%) | 127 (11.7%) |
| Manufacturing | 183 (100.0%) | 0 (0.0%) |
| Wholesale Trade | 43 (40.9%) | 62 (59.1%) |
| Retail Trade | 535 (55.0%) | 438 (45.0%) |
| Transportation & Warehousing | 394 (82.1%) | 86 (17.9%) |
| Utilities | 19 (24.0%) | 60 (75.9%) |
| Information | 69 (84.2%) | 13 (15.9%) |
| Finance & Insurance | 30 (33.3%) | 60 (66.7%) |
| Real Estate, Rental & Leasing | 39 (100.0%) | 0 (0.0%) |
| Professional & Scientific | 89 (54.9%) | 73 (45.1%) |
| Enterprise Management | 0 (0.0%) | 0 (0.0%) |
| Administrative & Support | 28 (71.8%) | 11 (28.2%) |
| Educational Services | 118 (28.2%) | 300 (71.8%) |
| Health Care & Social Assistance | 45 (10.7%) | 376 (89.3%) |
| Arts, Entertainment & Recreation | 63 (100.0%) | 0 (0.0%) |
| Accommodation & Food Services | 235 (37.4%) | 393 (62.6%) |
| Public Administration | 103 (28.1%) | 263 (71.9%) |
| Total | 4,021 (63.5%) | 2,310 (36.5%) |
Education in Reeves County
School Enrollment in Reeves County
The most common levels of schooling among the 3,164 students in Reeves County are elementary school (802 | 25.4%), middle school (785 | 24.8%), and high school (684 | 21.6%).
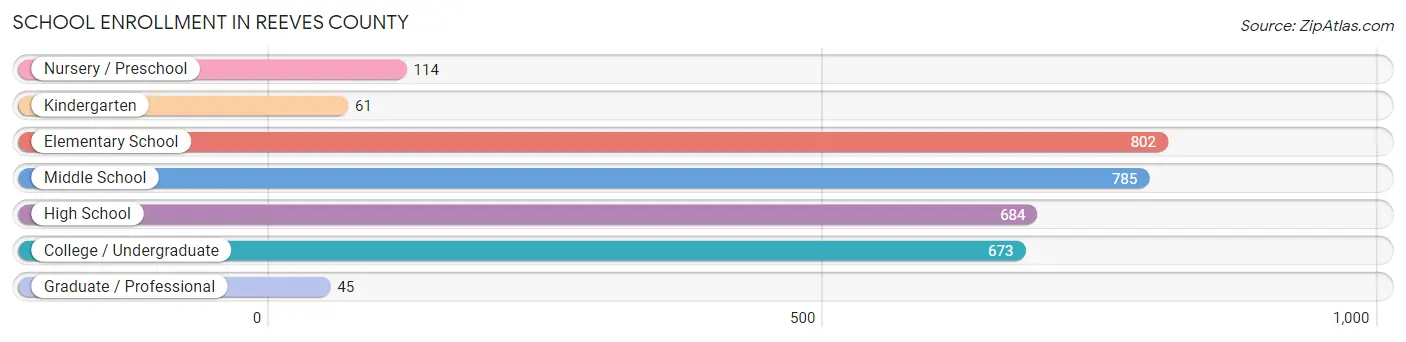
| School Level | # Students | % Students |
| Nursery / Preschool | 114 | 3.6% |
| Kindergarten | 61 | 1.9% |
| Elementary School | 802 | 25.4% |
| Middle School | 785 | 24.8% |
| High School | 684 | 21.6% |
| College / Undergraduate | 673 | 21.3% |
| Graduate / Professional | 45 | 1.4% |
| Total | 3,164 | 100.0% |
School Enrollment by Age by Funding Source in Reeves County
Out of a total of 3,164 students who are enrolled in schools in Reeves County, 209 (6.6%) attend a private institution, while the remaining 2,955 (93.4%) are enrolled in public schools. The age group of 25 to 34 year olds has the highest likelihood of being enrolled in private schools, with 124 (66.3% in the age bracket) enrolled. Conversely, the age group of 20 to 24 year olds has the lowest likelihood of being enrolled in a private school, with 188 (100.0% in the age bracket) attending a public institution.
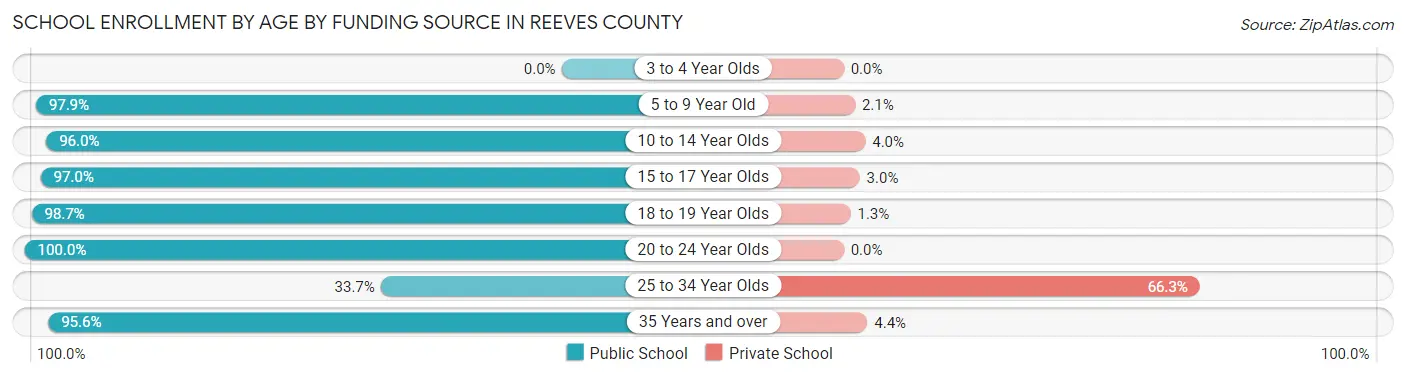
| Age Bracket | Public School | Private School |
| 3 to 4 Year Olds | 0 (0.0%) | 0 (0.0%) |
| 5 to 9 Year Old | 747 (97.9%) | 16 (2.1%) |
| 10 to 14 Year Olds | 976 (96.0%) | 41 (4.0%) |
| 15 to 17 Year Olds | 619 (97.0%) | 19 (3.0%) |
| 18 to 19 Year Olds | 232 (98.7%) | 3 (1.3%) |
| 20 to 24 Year Olds | 188 (100.0%) | 0 (0.0%) |
| 25 to 34 Year Olds | 63 (33.7%) | 124 (66.3%) |
| 35 Years and over | 130 (95.6%) | 6 (4.4%) |
| Total | 2,955 (93.4%) | 209 (6.6%) |
Educational Attainment by Field of Study in Reeves County
Bio, nature & agricultural (214 | 23.3%), arts & humanities (165 | 18.0%), business (157 | 17.1%), liberal arts & history (103 | 11.2%), and science & technology (87 | 9.5%) are the most common fields of study among 918 individuals in Reeves County who have obtained a bachelor's degree or higher.
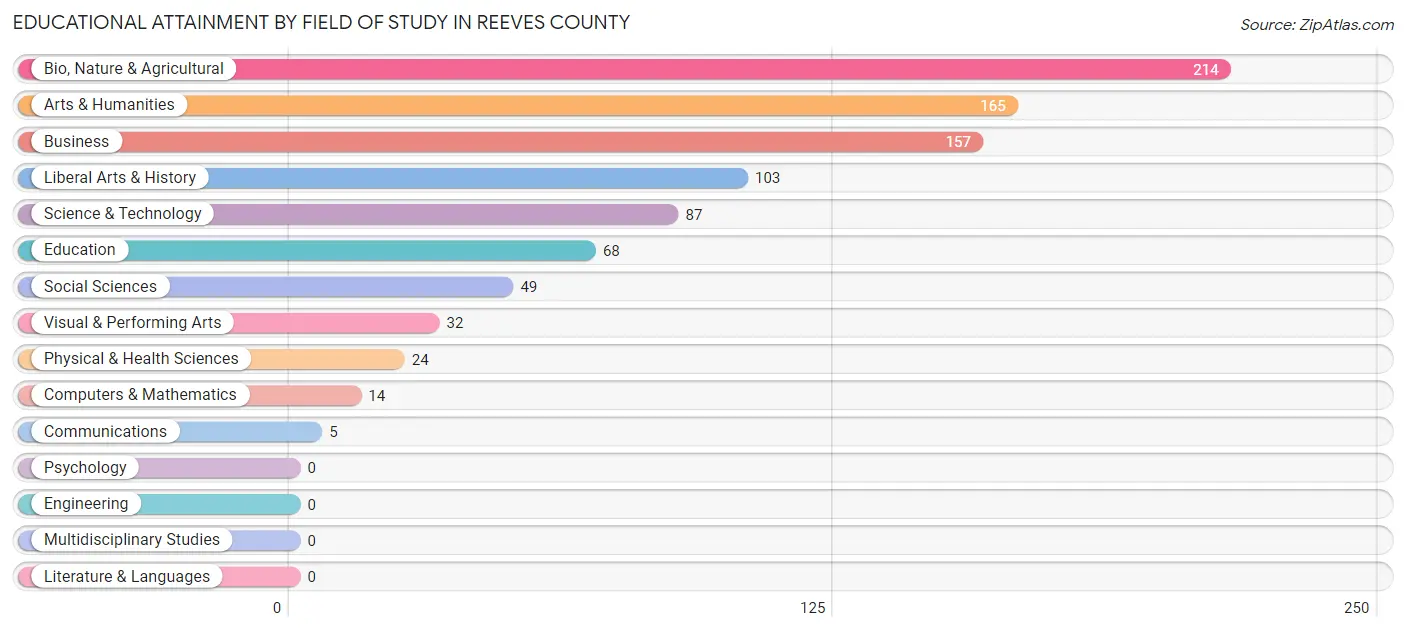
| Field of Study | # Graduates | % Graduates |
| Computers & Mathematics | 14 | 1.5% |
| Bio, Nature & Agricultural | 214 | 23.3% |
| Physical & Health Sciences | 24 | 2.6% |
| Psychology | 0 | 0.0% |
| Social Sciences | 49 | 5.3% |
| Engineering | 0 | 0.0% |
| Multidisciplinary Studies | 0 | 0.0% |
| Science & Technology | 87 | 9.5% |
| Business | 157 | 17.1% |
| Education | 68 | 7.4% |
| Literature & Languages | 0 | 0.0% |
| Liberal Arts & History | 103 | 11.2% |
| Visual & Performing Arts | 32 | 3.5% |
| Communications | 5 | 0.5% |
| Arts & Humanities | 165 | 18.0% |
| Total | 918 | 100.0% |
Transportation & Commute in Reeves County
Vehicle Availability by Sex in Reeves County
The most prevalent vehicle ownership categories in Reeves County are males with 2 vehicles (1,383, accounting for 34.9%) and females with 2 vehicles (709, making up 60.6%).
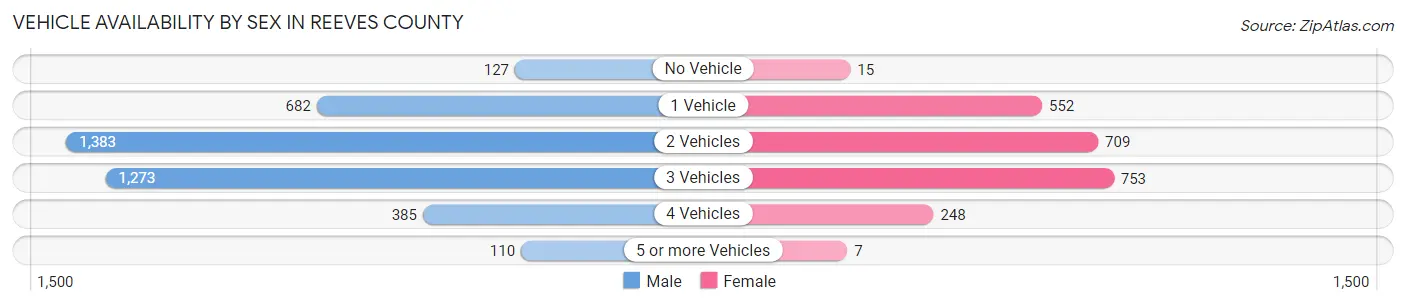
| Vehicles Available | Male | Female |
| No Vehicle | 127 (3.2%) | 15 (0.7%) |
| 1 Vehicle | 682 (17.2%) | 552 (24.2%) |
| 2 Vehicles | 1,383 (34.9%) | 709 (31.0%) |
| 3 Vehicles | 1,273 (32.2%) | 753 (33.0%) |
| 4 Vehicles | 385 (9.7%) | 248 (10.9%) |
| 5 or more Vehicles | 110 (2.8%) | 7 (0.3%) |
| Total | 3,960 (100.0%) | 2,284 (100.0%) |
Commute Time in Reeves County
The most frequently occuring commute durations in Reeves County are 5 to 9 minutes (2,007 commuters, 32.5%), 10 to 14 minutes (1,173 commuters, 19.0%), and 15 to 19 minutes (870 commuters, 14.1%).
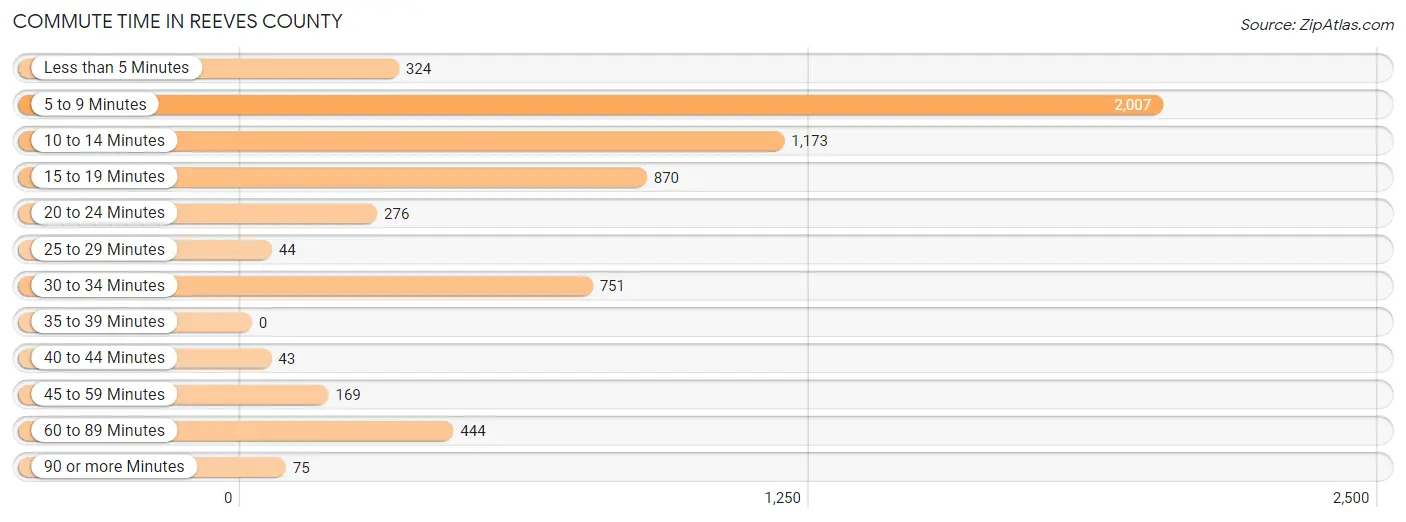
| Commute Time | # Commuters | % Commuters |
| Less than 5 Minutes | 324 | 5.2% |
| 5 to 9 Minutes | 2,007 | 32.5% |
| 10 to 14 Minutes | 1,173 | 19.0% |
| 15 to 19 Minutes | 870 | 14.1% |
| 20 to 24 Minutes | 276 | 4.5% |
| 25 to 29 Minutes | 44 | 0.7% |
| 30 to 34 Minutes | 751 | 12.2% |
| 35 to 39 Minutes | 0 | 0.0% |
| 40 to 44 Minutes | 43 | 0.7% |
| 45 to 59 Minutes | 169 | 2.7% |
| 60 to 89 Minutes | 444 | 7.2% |
| 90 or more Minutes | 75 | 1.2% |
Commute Time by Sex in Reeves County
The most common commute times in Reeves County are 5 to 9 minutes (1,021 commuters, 26.0%) for males and 5 to 9 minutes (986 commuters, 43.7%) for females.
| Commute Time | Male | Female |
| Less than 5 Minutes | 50 (1.3%) | 274 (12.1%) |
| 5 to 9 Minutes | 1,021 (26.0%) | 986 (43.7%) |
| 10 to 14 Minutes | 836 (21.3%) | 337 (14.9%) |
| 15 to 19 Minutes | 566 (14.4%) | 304 (13.5%) |
| 20 to 24 Minutes | 33 (0.8%) | 243 (10.8%) |
| 25 to 29 Minutes | 34 (0.9%) | 10 (0.4%) |
| 30 to 34 Minutes | 704 (17.9%) | 47 (2.1%) |
| 35 to 39 Minutes | 0 (0.0%) | 0 (0.0%) |
| 40 to 44 Minutes | 43 (1.1%) | 0 (0.0%) |
| 45 to 59 Minutes | 126 (3.2%) | 43 (1.9%) |
| 60 to 89 Minutes | 433 (11.0%) | 11 (0.5%) |
| 90 or more Minutes | 75 (1.9%) | 0 (0.0%) |
Time of Departure to Work by Sex in Reeves County
The most frequent times of departure to work in Reeves County are 6:00 AM to 6:29 AM (790, 20.2%) for males and 7:00 AM to 7:29 AM (459, 20.3%) for females.
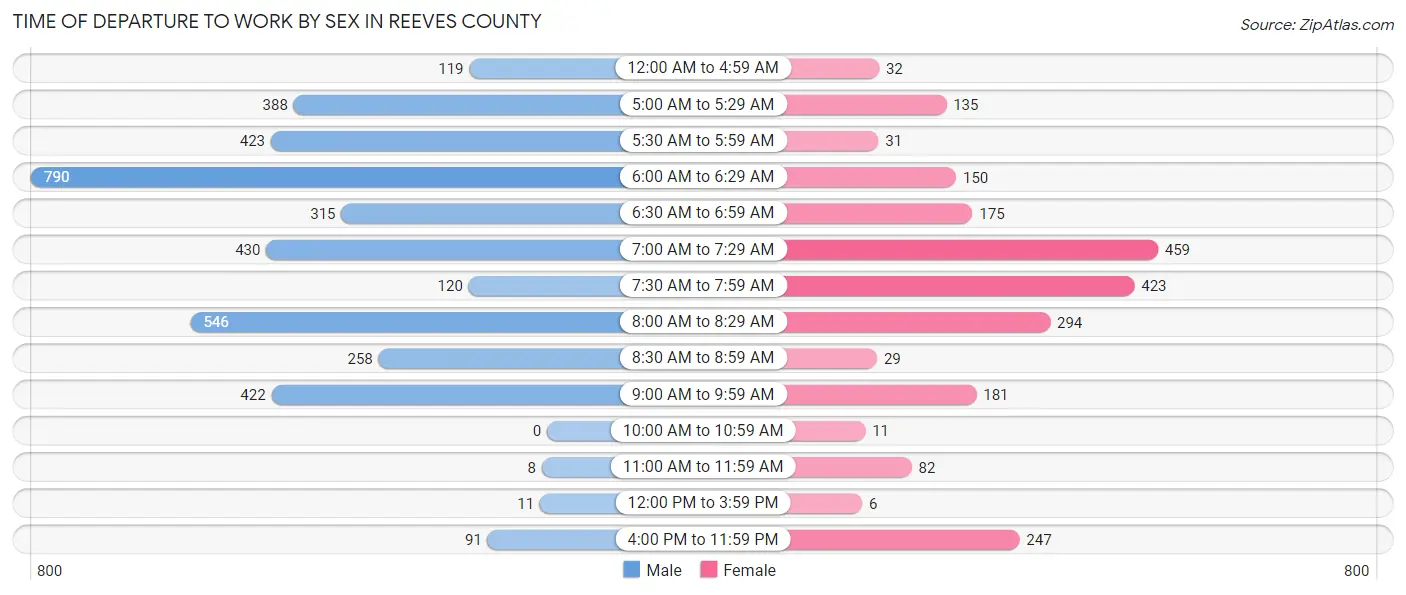
| Time of Departure | Male | Female |
| 12:00 AM to 4:59 AM | 119 (3.0%) | 32 (1.4%) |
| 5:00 AM to 5:29 AM | 388 (9.9%) | 135 (6.0%) |
| 5:30 AM to 5:59 AM | 423 (10.8%) | 31 (1.4%) |
| 6:00 AM to 6:29 AM | 790 (20.2%) | 150 (6.7%) |
| 6:30 AM to 6:59 AM | 315 (8.0%) | 175 (7.8%) |
| 7:00 AM to 7:29 AM | 430 (11.0%) | 459 (20.3%) |
| 7:30 AM to 7:59 AM | 120 (3.1%) | 423 (18.8%) |
| 8:00 AM to 8:29 AM | 546 (13.9%) | 294 (13.0%) |
| 8:30 AM to 8:59 AM | 258 (6.6%) | 29 (1.3%) |
| 9:00 AM to 9:59 AM | 422 (10.8%) | 181 (8.0%) |
| 10:00 AM to 10:59 AM | 0 (0.0%) | 11 (0.5%) |
| 11:00 AM to 11:59 AM | 8 (0.2%) | 82 (3.6%) |
| 12:00 PM to 3:59 PM | 11 (0.3%) | 6 (0.3%) |
| 4:00 PM to 11:59 PM | 91 (2.3%) | 247 (11.0%) |
| Total | 3,921 (100.0%) | 2,255 (100.0%) |
Housing Occupancy in Reeves County
Occupancy by Ownership in Reeves County
Of the total 4,117 dwellings in Reeves County, owner-occupied units account for 3,089 (75.0%), while renter-occupied units make up 1,028 (25.0%).
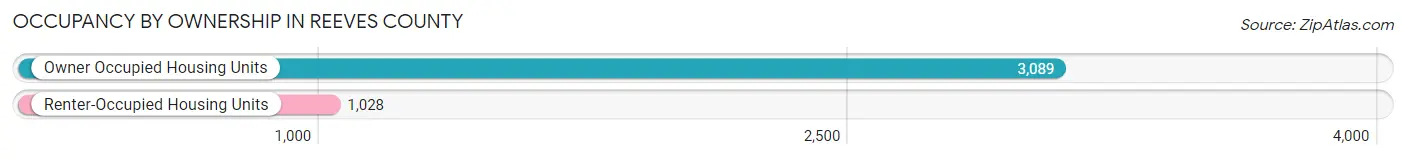
| Occupancy | # Housing Units | % Housing Units |
| Owner Occupied Housing Units | 3,089 | 75.0% |
| Renter-Occupied Housing Units | 1,028 | 25.0% |
| Total Occupied Housing Units | 4,117 | 100.0% |
Occupancy by Household Size in Reeves County
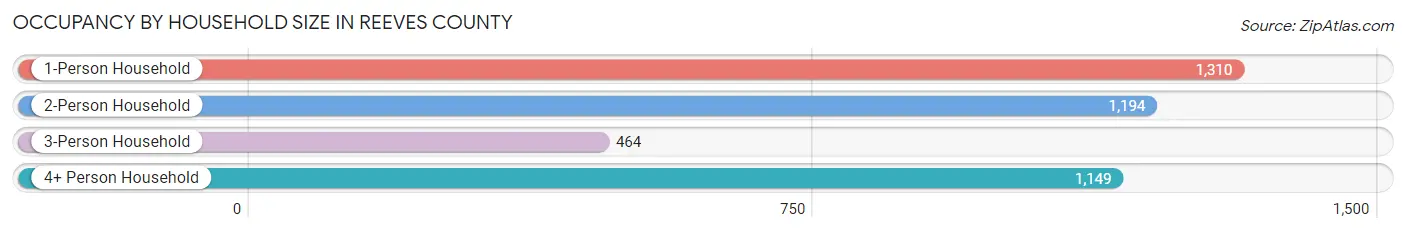
| Household Size | # Housing Units | % Housing Units |
| 1-Person Household | 1,310 | 31.8% |
| 2-Person Household | 1,194 | 29.0% |
| 3-Person Household | 464 | 11.3% |
| 4+ Person Household | 1,149 | 27.9% |
| Total Housing Units | 4,117 | 100.0% |
Occupancy by Ownership by Household Size in Reeves County
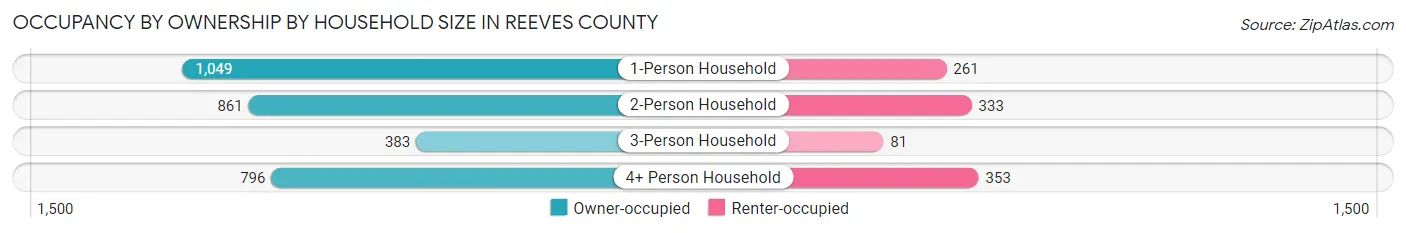
| Household Size | Owner-occupied | Renter-occupied |
| 1-Person Household | 1,049 (80.1%) | 261 (19.9%) |
| 2-Person Household | 861 (72.1%) | 333 (27.9%) |
| 3-Person Household | 383 (82.5%) | 81 (17.5%) |
| 4+ Person Household | 796 (69.3%) | 353 (30.7%) |
| Total Housing Units | 3,089 (75.0%) | 1,028 (25.0%) |
Occupancy by Educational Attainment in Reeves County
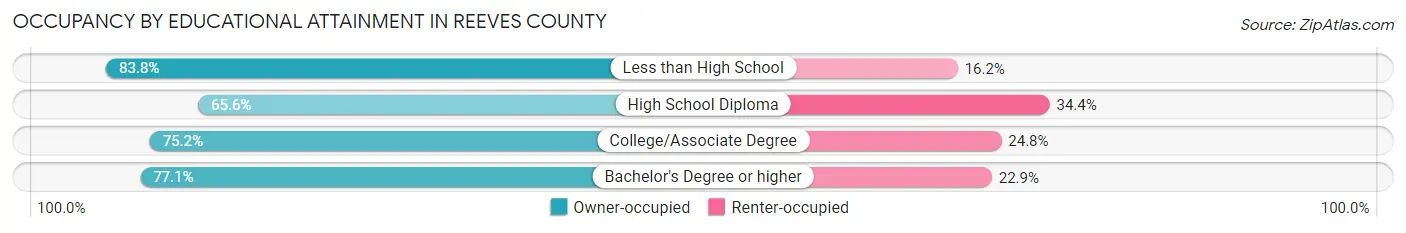
| Household Size | Owner-occupied | Renter-occupied |
| Less than High School | 1,110 (83.8%) | 214 (16.2%) |
| High School Diploma | 876 (65.6%) | 459 (34.4%) |
| College/Associate Degree | 824 (75.2%) | 272 (24.8%) |
| Bachelor's Degree or higher | 279 (77.1%) | 83 (22.9%) |
Occupancy by Age of Householder in Reeves County
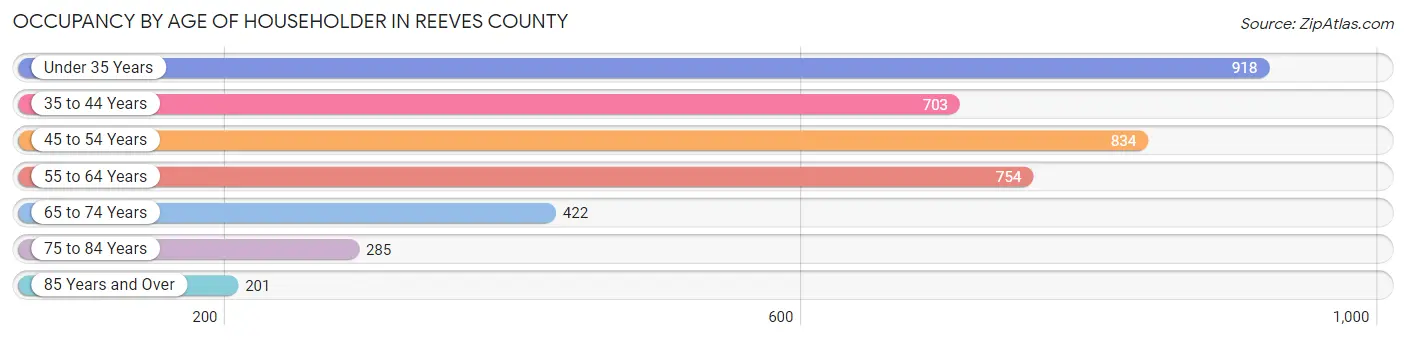
| Age Bracket | # Households | % Households |
| Under 35 Years | 918 | 22.3% |
| 35 to 44 Years | 703 | 17.1% |
| 45 to 54 Years | 834 | 20.3% |
| 55 to 64 Years | 754 | 18.3% |
| 65 to 74 Years | 422 | 10.2% |
| 75 to 84 Years | 285 | 6.9% |
| 85 Years and Over | 201 | 4.9% |
| Total | 4,117 | 100.0% |
Housing Finances in Reeves County
Median Income by Occupancy in Reeves County
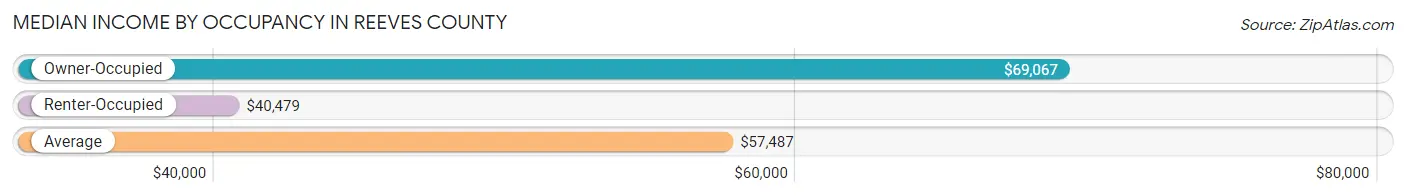
| Occupancy Type | # Households | Median Income |
| Owner-Occupied | 3,089 (75.0%) | $69,067 |
| Renter-Occupied | 1,028 (25.0%) | $40,479 |
| Average | 4,117 (100.0%) | $57,487 |
Occupancy by Householder Income Bracket in Reeves County
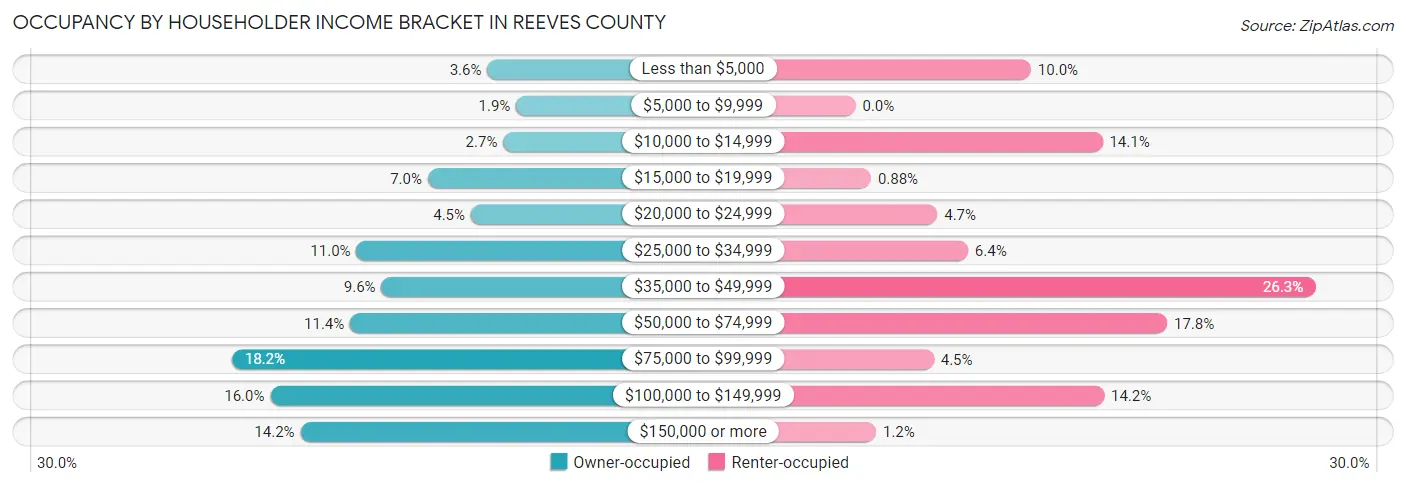
| Income Bracket | Owner-occupied | Renter-occupied |
| Less than $5,000 | 110 (3.6%) | 103 (10.0%) |
| $5,000 to $9,999 | 59 (1.9%) | 0 (0.0%) |
| $10,000 to $14,999 | 82 (2.6%) | 145 (14.1%) |
| $15,000 to $19,999 | 215 (7.0%) | 9 (0.9%) |
| $20,000 to $24,999 | 139 (4.5%) | 48 (4.7%) |
| $25,000 to $34,999 | 341 (11.0%) | 66 (6.4%) |
| $35,000 to $49,999 | 297 (9.6%) | 270 (26.3%) |
| $50,000 to $74,999 | 352 (11.4%) | 183 (17.8%) |
| $75,000 to $99,999 | 561 (18.2%) | 46 (4.5%) |
| $100,000 to $149,999 | 493 (16.0%) | 146 (14.2%) |
| $150,000 or more | 440 (14.2%) | 12 (1.2%) |
| Total | 3,089 (100.0%) | 1,028 (100.0%) |
Monthly Housing Cost Tiers in Reeves County
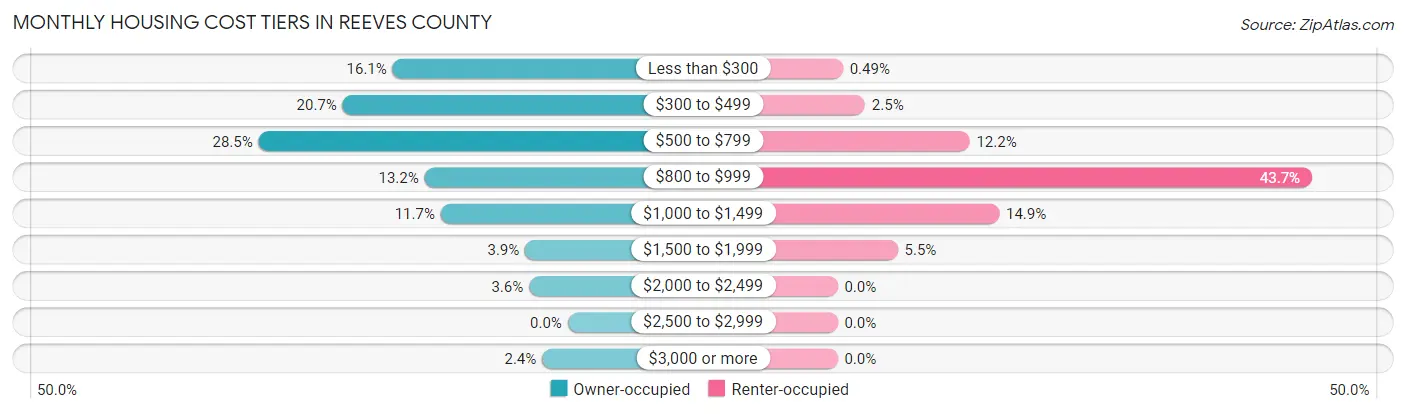
| Monthly Cost | Owner-occupied | Renter-occupied |
| Less than $300 | 498 (16.1%) | 5 (0.5%) |
| $300 to $499 | 640 (20.7%) | 26 (2.5%) |
| $500 to $799 | 879 (28.5%) | 125 (12.2%) |
| $800 to $999 | 407 (13.2%) | 449 (43.7%) |
| $1,000 to $1,499 | 361 (11.7%) | 153 (14.9%) |
| $1,500 to $1,999 | 121 (3.9%) | 57 (5.5%) |
| $2,000 to $2,499 | 110 (3.6%) | 0 (0.0%) |
| $2,500 to $2,999 | 0 (0.0%) | 0 (0.0%) |
| $3,000 or more | 73 (2.4%) | 0 (0.0%) |
| Total | 3,089 (100.0%) | 1,028 (100.0%) |
Physical Housing Characteristics in Reeves County
Housing Structures in Reeves County
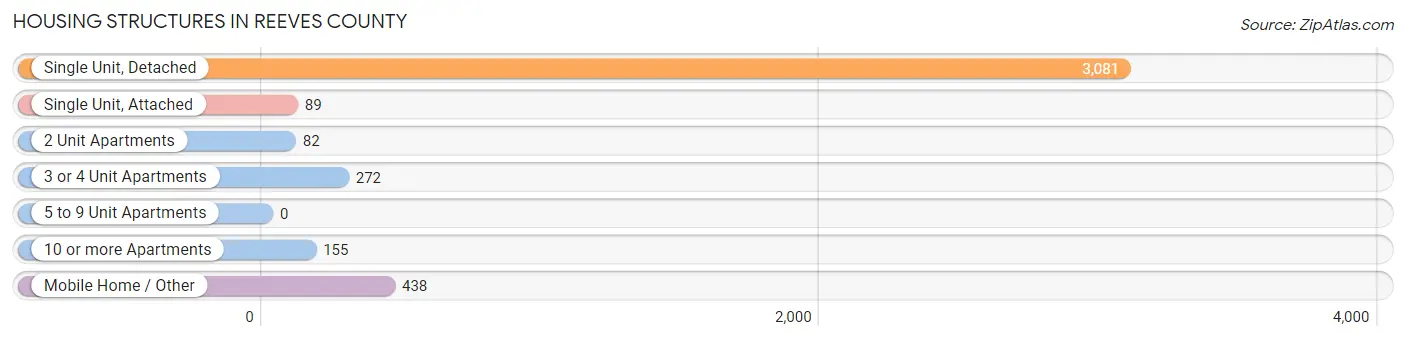
| Structure Type | # Housing Units | % Housing Units |
| Single Unit, Detached | 3,081 | 74.8% |
| Single Unit, Attached | 89 | 2.2% |
| 2 Unit Apartments | 82 | 2.0% |
| 3 or 4 Unit Apartments | 272 | 6.6% |
| 5 to 9 Unit Apartments | 0 | 0.0% |
| 10 or more Apartments | 155 | 3.8% |
| Mobile Home / Other | 438 | 10.6% |
| Total | 4,117 | 100.0% |
Housing Structures by Occupancy in Reeves County
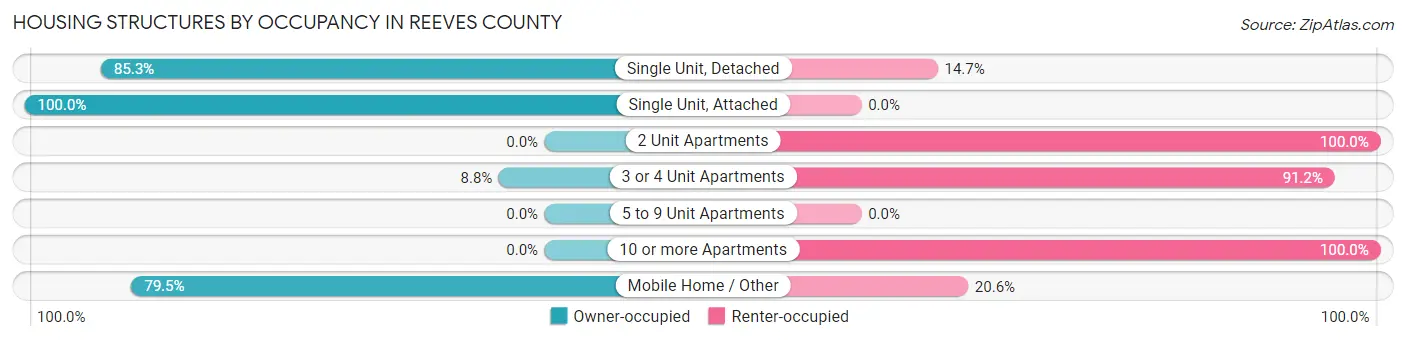
| Structure Type | Owner-occupied | Renter-occupied |
| Single Unit, Detached | 2,628 (85.3%) | 453 (14.7%) |
| Single Unit, Attached | 89 (100.0%) | 0 (0.0%) |
| 2 Unit Apartments | 0 (0.0%) | 82 (100.0%) |
| 3 or 4 Unit Apartments | 24 (8.8%) | 248 (91.2%) |
| 5 to 9 Unit Apartments | 0 (0.0%) | 0 (0.0%) |
| 10 or more Apartments | 0 (0.0%) | 155 (100.0%) |
| Mobile Home / Other | 348 (79.4%) | 90 (20.5%) |
| Total | 3,089 (75.0%) | 1,028 (25.0%) |
Housing Structures by Number of Rooms in Reeves County
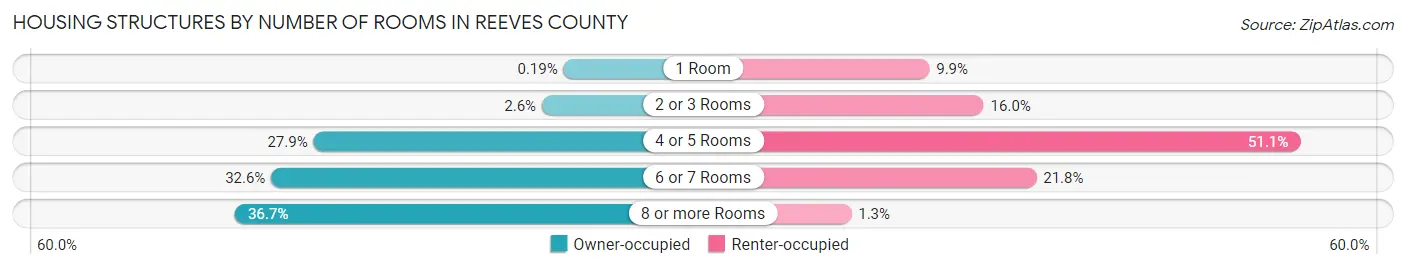
| Number of Rooms | Owner-occupied | Renter-occupied |
| 1 Room | 6 (0.2%) | 102 (9.9%) |
| 2 or 3 Rooms | 80 (2.6%) | 164 (16.0%) |
| 4 or 5 Rooms | 863 (27.9%) | 525 (51.1%) |
| 6 or 7 Rooms | 1,008 (32.6%) | 224 (21.8%) |
| 8 or more Rooms | 1,132 (36.6%) | 13 (1.3%) |
| Total | 3,089 (100.0%) | 1,028 (100.0%) |
Housing Structure by Heating Type in Reeves County
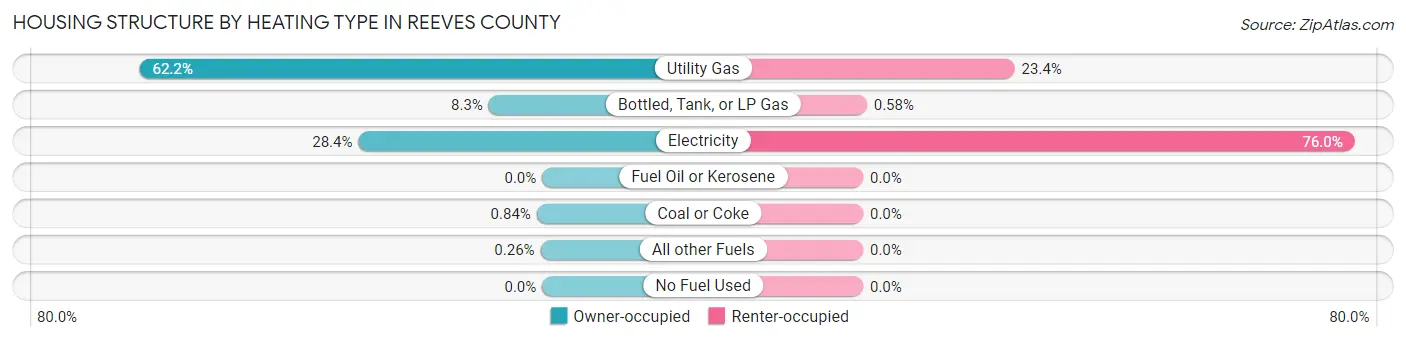
| Heating Type | Owner-occupied | Renter-occupied |
| Utility Gas | 1,922 (62.2%) | 241 (23.4%) |
| Bottled, Tank, or LP Gas | 255 (8.3%) | 6 (0.6%) |
| Electricity | 878 (28.4%) | 781 (76.0%) |
| Fuel Oil or Kerosene | 0 (0.0%) | 0 (0.0%) |
| Coal or Coke | 26 (0.8%) | 0 (0.0%) |
| All other Fuels | 8 (0.3%) | 0 (0.0%) |
| No Fuel Used | 0 (0.0%) | 0 (0.0%) |
| Total | 3,089 (100.0%) | 1,028 (100.0%) |
Household Vehicle Usage in Reeves County
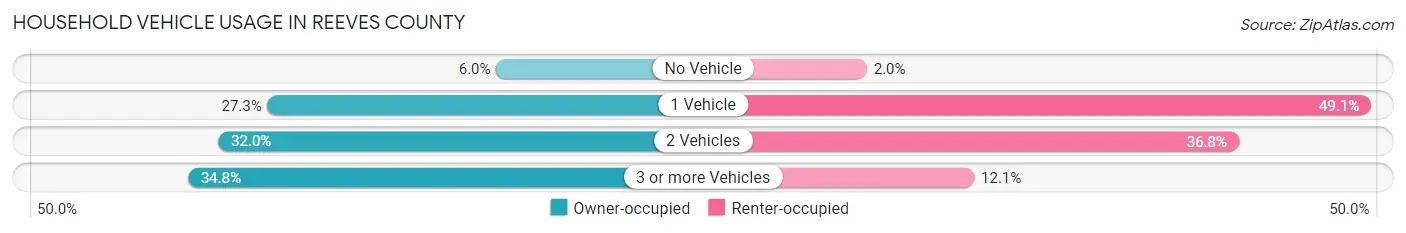
| Vehicles per Household | Owner-occupied | Renter-occupied |
| No Vehicle | 184 (6.0%) | 21 (2.0%) |
| 1 Vehicle | 844 (27.3%) | 505 (49.1%) |
| 2 Vehicles | 987 (32.0%) | 378 (36.8%) |
| 3 or more Vehicles | 1,074 (34.8%) | 124 (12.1%) |
| Total | 3,089 (100.0%) | 1,028 (100.0%) |
Real Estate & Mortgages in Reeves County
Real Estate and Mortgage Overview in Reeves County
| Characteristic | Without Mortgage | With Mortgage |
| Housing Units | 2,365 | 724 |
| Median Property Value | $102,900 | $129,200 |
| Median Household Income | $58,698 | $77 |
| Monthly Housing Costs | $508 | $35 |
| Real Estate Taxes | $964 | $15 |
Property Value by Mortgage Status in Reeves County
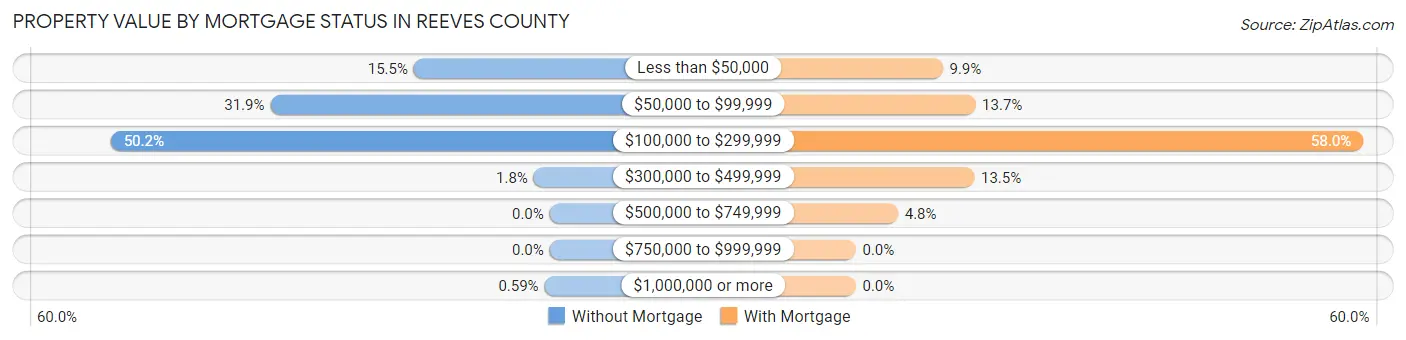
| Property Value | Without Mortgage | With Mortgage |
| Less than $50,000 | 367 (15.5%) | 72 (9.9%) |
| $50,000 to $99,999 | 755 (31.9%) | 99 (13.7%) |
| $100,000 to $299,999 | 1,186 (50.1%) | 420 (58.0%) |
| $300,000 to $499,999 | 43 (1.8%) | 98 (13.5%) |
| $500,000 to $749,999 | 0 (0.0%) | 35 (4.8%) |
| $750,000 to $999,999 | 0 (0.0%) | 0 (0.0%) |
| $1,000,000 or more | 14 (0.6%) | 0 (0.0%) |
| Total | 2,365 (100.0%) | 724 (100.0%) |
Household Income by Mortgage Status in Reeves County
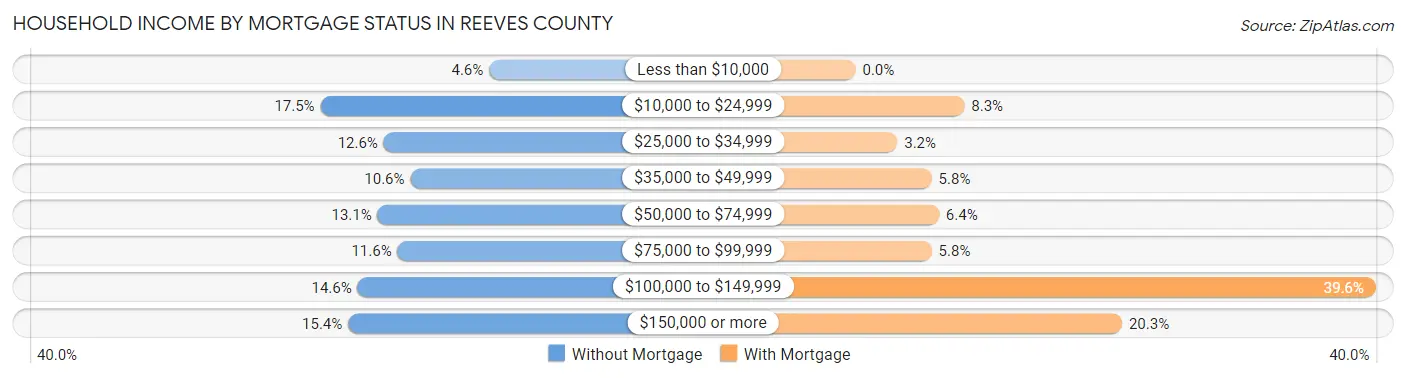
| Household Income | Without Mortgage | With Mortgage |
| Less than $10,000 | 109 (4.6%) | 0 (0.0%) |
| $10,000 to $24,999 | 413 (17.5%) | 60 (8.3%) |
| $25,000 to $34,999 | 299 (12.6%) | 23 (3.2%) |
| $35,000 to $49,999 | 251 (10.6%) | 42 (5.8%) |
| $50,000 to $74,999 | 310 (13.1%) | 46 (6.4%) |
| $75,000 to $99,999 | 274 (11.6%) | 42 (5.8%) |
| $100,000 to $149,999 | 346 (14.6%) | 287 (39.6%) |
| $150,000 or more | 363 (15.3%) | 147 (20.3%) |
| Total | 2,365 (100.0%) | 724 (100.0%) |
Property Value to Household Income Ratio in Reeves County
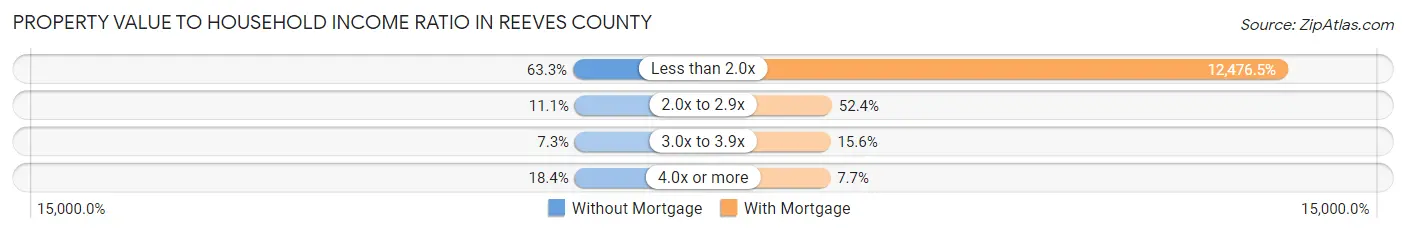
| Value-to-Income Ratio | Without Mortgage | With Mortgage |
| Less than 2.0x | 1,496 (63.3%) | 90,330 (12,476.5%) |
| 2.0x to 2.9x | 263 (11.1%) | 379 (52.3%) |
| 3.0x to 3.9x | 172 (7.3%) | 113 (15.6%) |
| 4.0x or more | 434 (18.3%) | 56 (7.7%) |
| Total | 2,365 (100.0%) | 724 (100.0%) |
Real Estate Taxes by Mortgage Status in Reeves County
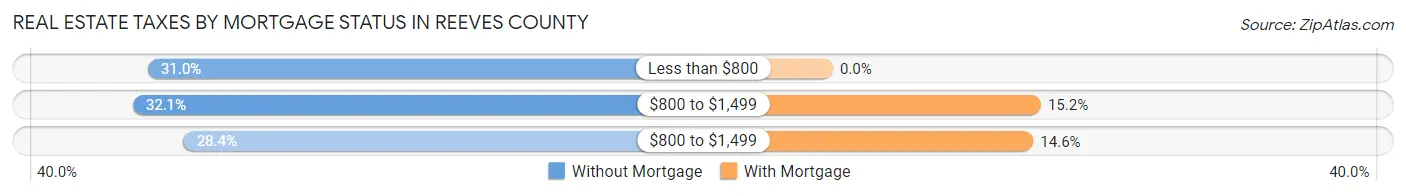
| Property Taxes | Without Mortgage | With Mortgage |
| Less than $800 | 733 (31.0%) | 0 (0.0%) |
| $800 to $1,499 | 759 (32.1%) | 110 (15.2%) |
| $800 to $1,499 | 671 (28.4%) | 106 (14.6%) |
| Total | 2,365 (100.0%) | 724 (100.0%) |
Health & Disability in Reeves County
Health Insurance Coverage by Age in Reeves County
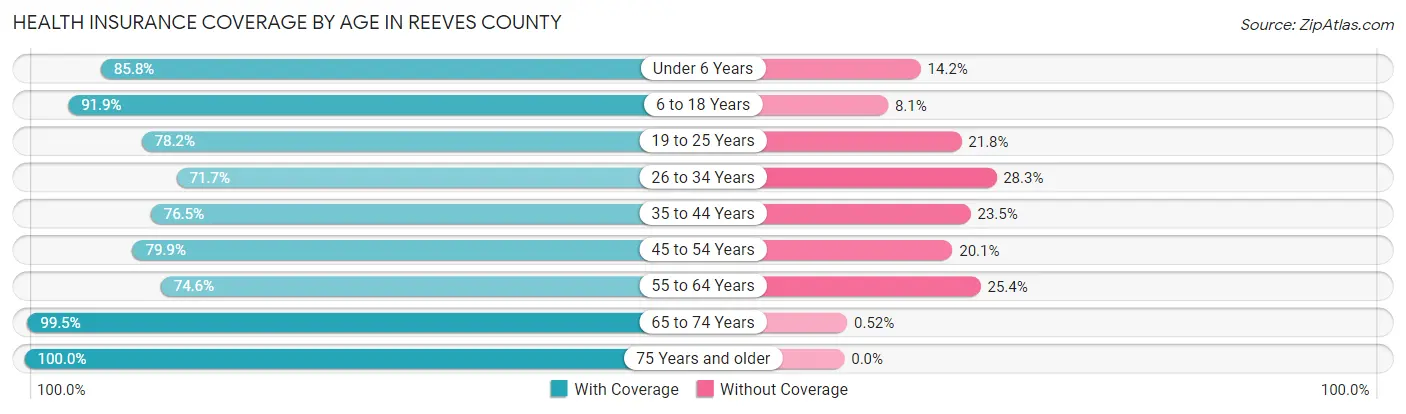
| Age Bracket | With Coverage | Without Coverage |
| Under 6 Years | 831 (85.8%) | 138 (14.2%) |
| 6 to 18 Years | 2,460 (91.9%) | 218 (8.1%) |
| 19 to 25 Years | 1,121 (78.2%) | 313 (21.8%) |
| 26 to 34 Years | 1,098 (71.7%) | 434 (28.3%) |
| 35 to 44 Years | 1,345 (76.5%) | 414 (23.5%) |
| 45 to 54 Years | 1,459 (79.9%) | 368 (20.1%) |
| 55 to 64 Years | 769 (74.6%) | 262 (25.4%) |
| 65 to 74 Years | 965 (99.5%) | 5 (0.5%) |
| 75 Years and older | 698 (100.0%) | 0 (0.0%) |
| Total | 10,746 (83.3%) | 2,152 (16.7%) |
Health Insurance Coverage by Citizenship Status in Reeves County
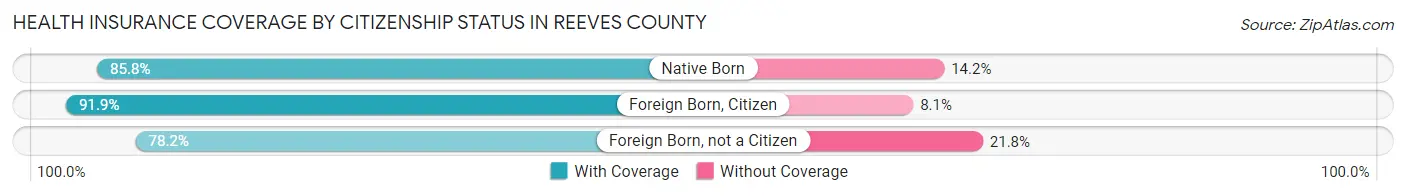
| Citizenship Status | With Coverage | Without Coverage |
| Native Born | 831 (85.8%) | 138 (14.2%) |
| Foreign Born, Citizen | 2,460 (91.9%) | 218 (8.1%) |
| Foreign Born, not a Citizen | 1,121 (78.2%) | 313 (21.8%) |
Health Insurance Coverage by Household Income in Reeves County
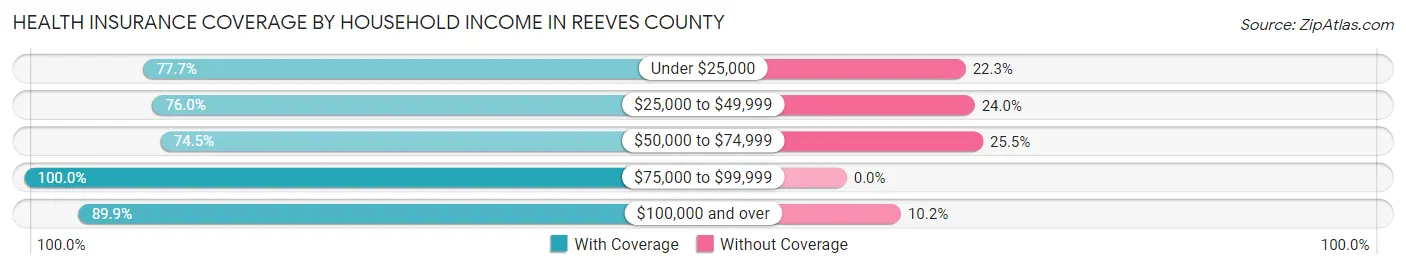
| Household Income | With Coverage | Without Coverage |
| Under $25,000 | 1,573 (77.7%) | 451 (22.3%) |
| $25,000 to $49,999 | 2,312 (76.0%) | 729 (24.0%) |
| $50,000 to $74,999 | 1,542 (74.5%) | 529 (25.5%) |
| $75,000 to $99,999 | 1,463 (100.0%) | 0 (0.0%) |
| $100,000 and over | 3,843 (89.8%) | 434 (10.2%) |
Public vs Private Health Insurance Coverage by Age in Reeves County
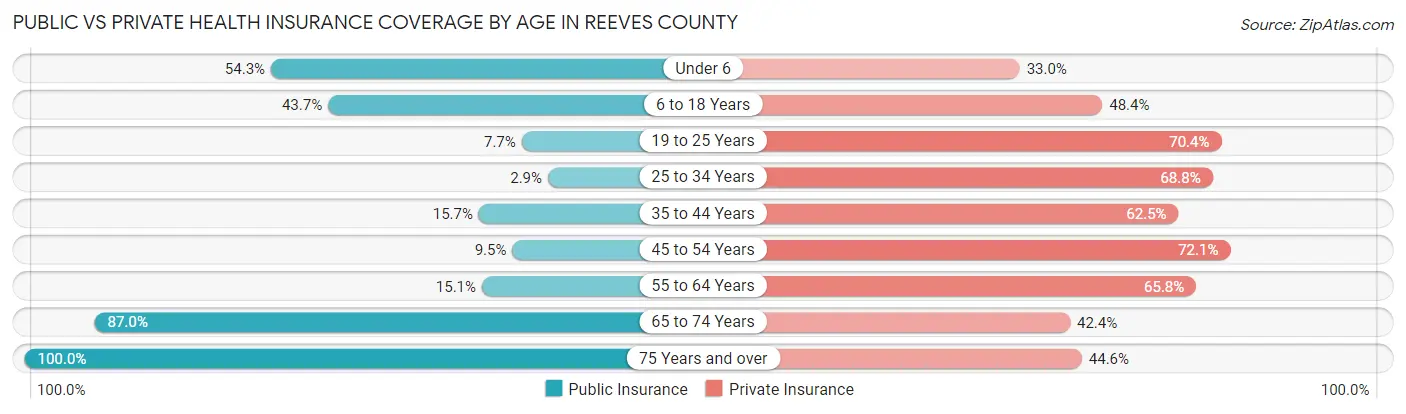
| Age Bracket | Public Insurance | Private Insurance |
| Under 6 | 526 (54.3%) | 320 (33.0%) |
| 6 to 18 Years | 1,170 (43.7%) | 1,295 (48.4%) |
| 19 to 25 Years | 111 (7.7%) | 1,010 (70.4%) |
| 25 to 34 Years | 44 (2.9%) | 1,054 (68.8%) |
| 35 to 44 Years | 276 (15.7%) | 1,099 (62.5%) |
| 45 to 54 Years | 173 (9.5%) | 1,317 (72.1%) |
| 55 to 64 Years | 156 (15.1%) | 678 (65.8%) |
| 65 to 74 Years | 844 (87.0%) | 411 (42.4%) |
| 75 Years and over | 698 (100.0%) | 311 (44.6%) |
| Total | 3,998 (31.0%) | 7,495 (58.1%) |
Disability Status by Sex by Age in Reeves County
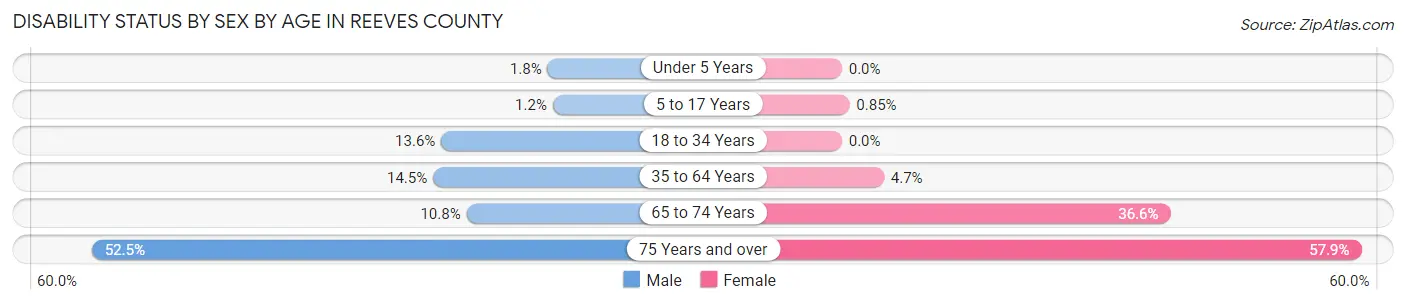
| Age Bracket | Male | Female |
| Under 5 Years | 7 (1.8%) | 0 (0.0%) |
| 5 to 17 Years | 16 (1.2%) | 9 (0.9%) |
| 18 to 34 Years | 275 (13.6%) | 0 (0.0%) |
| 35 to 64 Years | 419 (14.5%) | 81 (4.7%) |
| 65 to 74 Years | 56 (10.8%) | 165 (36.6%) |
| 75 Years and over | 146 (52.5%) | 243 (57.9%) |
Disability Class by Sex by Age in Reeves County
Disability Class: Hearing Difficulty
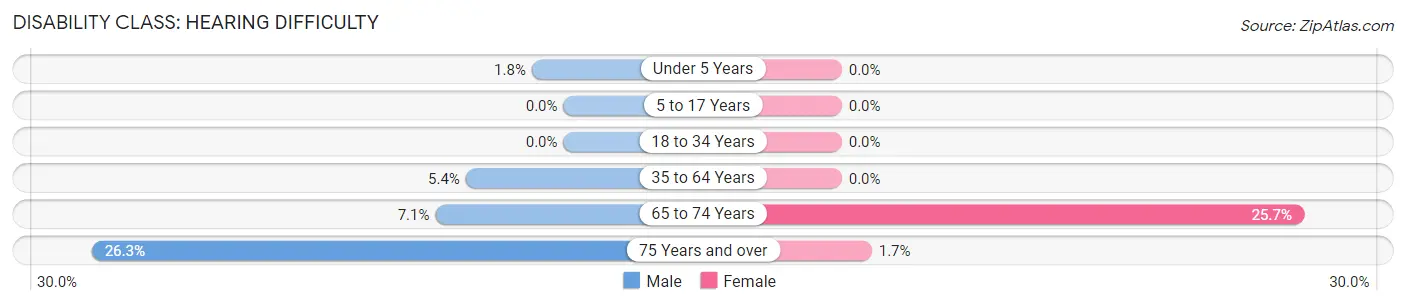
| Age Bracket | Male | Female |
| Under 5 Years | 7 (1.8%) | 0 (0.0%) |
| 5 to 17 Years | 0 (0.0%) | 0 (0.0%) |
| 18 to 34 Years | 0 (0.0%) | 0 (0.0%) |
| 35 to 64 Years | 157 (5.4%) | 0 (0.0%) |
| 65 to 74 Years | 37 (7.1%) | 116 (25.7%) |
| 75 Years and over | 73 (26.3%) | 7 (1.7%) |
Disability Class: Vision Difficulty
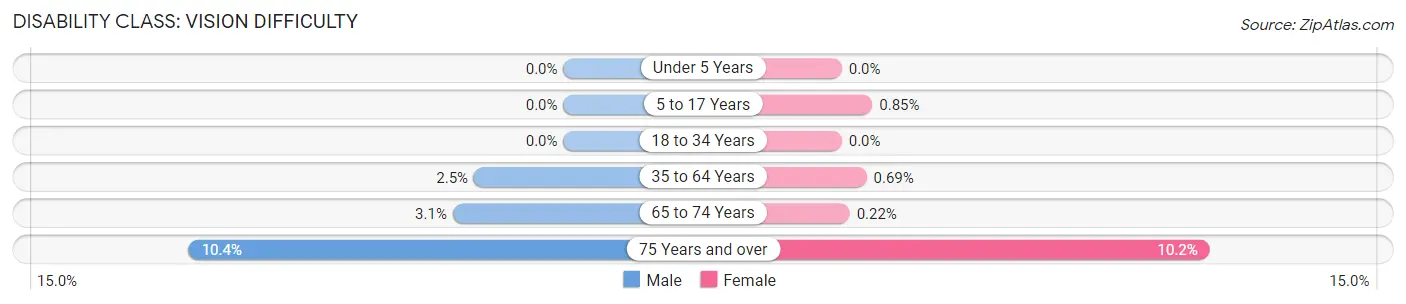
| Age Bracket | Male | Female |
| Under 5 Years | 0 (0.0%) | 0 (0.0%) |
| 5 to 17 Years | 0 (0.0%) | 9 (0.9%) |
| 18 to 34 Years | 0 (0.0%) | 0 (0.0%) |
| 35 to 64 Years | 72 (2.5%) | 12 (0.7%) |
| 65 to 74 Years | 16 (3.1%) | 1 (0.2%) |
| 75 Years and over | 29 (10.4%) | 43 (10.2%) |
Disability Class: Cognitive Difficulty
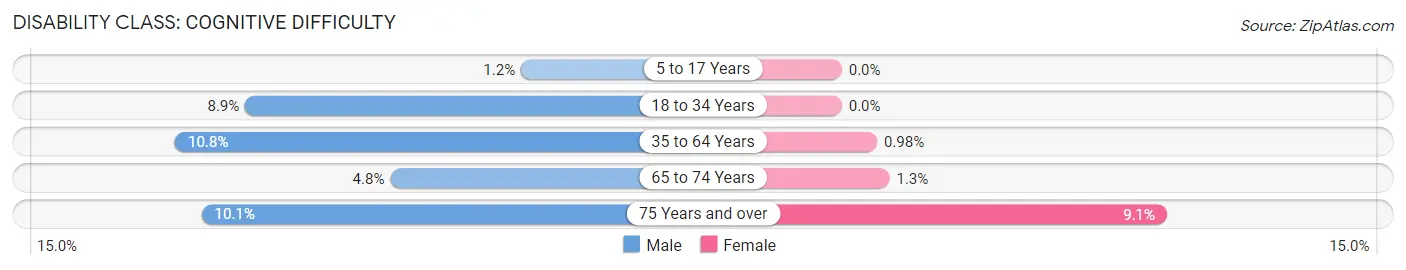
| Age Bracket | Male | Female |
| 5 to 17 Years | 16 (1.2%) | 0 (0.0%) |
| 18 to 34 Years | 179 (8.9%) | 0 (0.0%) |
| 35 to 64 Years | 312 (10.8%) | 17 (1.0%) |
| 65 to 74 Years | 25 (4.8%) | 6 (1.3%) |
| 75 Years and over | 28 (10.1%) | 38 (9.0%) |
Disability Class: Ambulatory Difficulty
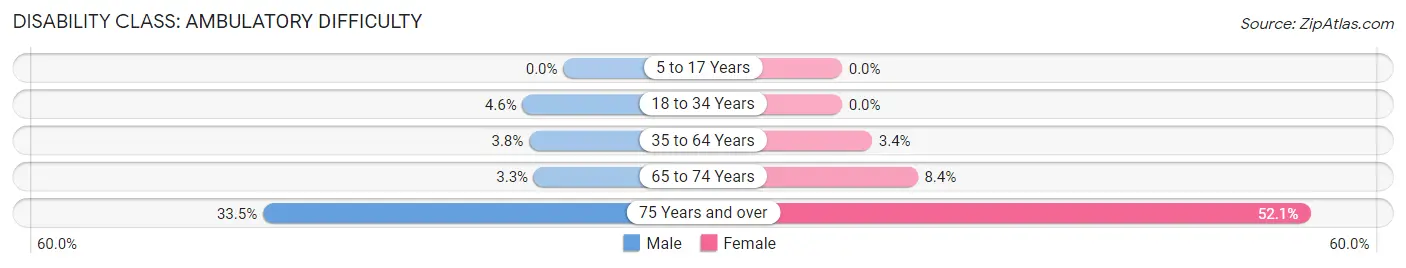
| Age Bracket | Male | Female |
| 5 to 17 Years | 0 (0.0%) | 0 (0.0%) |
| 18 to 34 Years | 92 (4.5%) | 0 (0.0%) |
| 35 to 64 Years | 110 (3.8%) | 58 (3.4%) |
| 65 to 74 Years | 17 (3.3%) | 38 (8.4%) |
| 75 Years and over | 93 (33.5%) | 219 (52.1%) |
Disability Class: Self-Care Difficulty
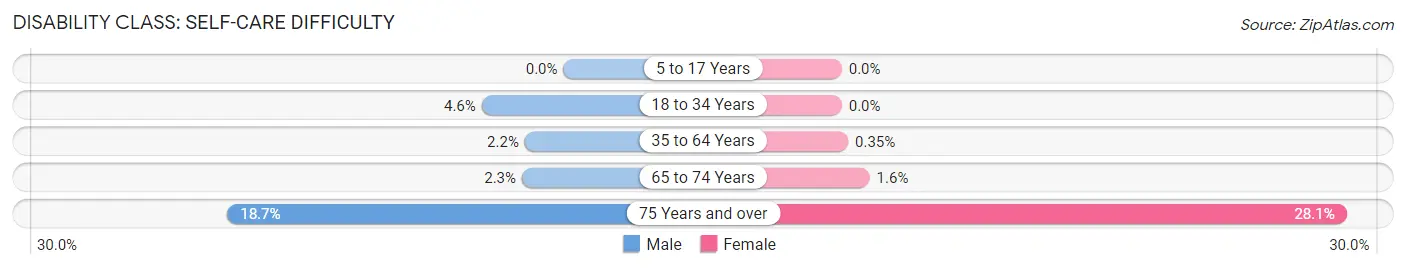
| Age Bracket | Male | Female |
| 5 to 17 Years | 0 (0.0%) | 0 (0.0%) |
| 18 to 34 Years | 92 (4.5%) | 0 (0.0%) |
| 35 to 64 Years | 62 (2.1%) | 6 (0.4%) |
| 65 to 74 Years | 12 (2.3%) | 7 (1.5%) |
| 75 Years and over | 52 (18.7%) | 118 (28.1%) |
Technology Access in Reeves County
Computing Device Access in Reeves County

| Device Type | # Households | % Households |
| Desktop or Laptop | 2,609 | 63.4% |
| Smartphone | 3,321 | 80.7% |
| Tablet | 2,392 | 58.1% |
| No Computing Device | 693 | 16.8% |
| Total | 4,117 | 100.0% |
Internet Access in Reeves County
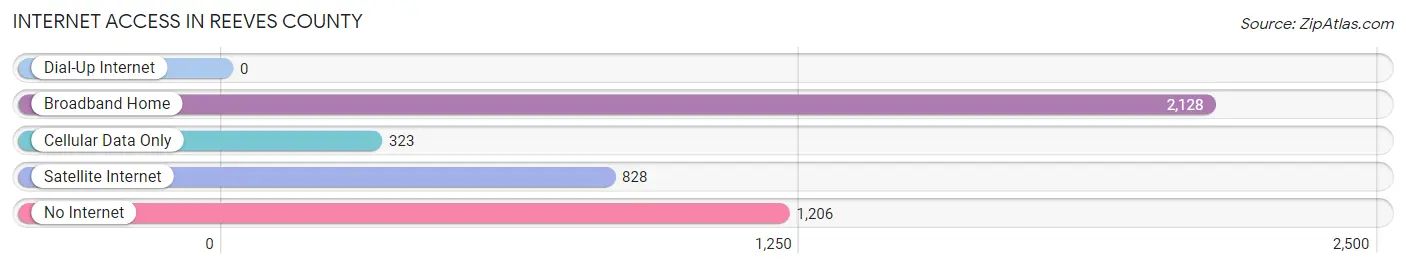
| Internet Type | # Households | % Households |
| Dial-Up Internet | 0 | 0.0% |
| Broadband Home | 2,128 | 51.7% |
| Cellular Data Only | 323 | 7.9% |
| Satellite Internet | 828 | 20.1% |
| No Internet | 1,206 | 29.3% |
| Total | 4,117 | 100.0% |
Reeves County Summary
Reeves County is located in the western part of Texas, in the Trans-Pecos region of the state. It is bordered by Loving County to the north, Ward County to the east, Pecos County to the south, and Culberson County to the west. The county seat is Pecos, and the largest city is Balmorhea. The county was named after George R. Reeves, a Texas state legislator and Confederate soldier.
Geography
Reeves County covers an area of 2,569 square miles, making it the fourth-largest county in Texas. The terrain is mostly flat, with some rolling hills in the northern part of the county. The Pecos River forms the eastern border of the county, and the Rio Grande forms the western border. The county is part of the Chihuahuan Desert, and the climate is arid and semi-arid. The average annual precipitation is 12.5 inches.
Demographics
As of the 2010 census, Reeves County had a population of 13,783. The racial makeup of the county was 73.3% White, 0.7% African American, 0.5% Native American, 0.2% Asian, 0.1% Pacific Islander, 23.7% from other races, and 1.5% from two or more races. Hispanic or Latino of any race were 81.2% of the population.
Economy
Reeves County is an agricultural and ranching county. The main crops are cotton, sorghum, and wheat. Cattle and sheep are also raised in the county. Oil and gas production is also an important part of the economy. The county is home to several oil and gas fields, including the Pecos River Field, the Balmorhea Field, and the Saragosa Field.
The county is also home to several prisons, including the Reeves County Detention Center, the Reeves County State Jail, and the Reeves County Correctional Center. These facilities provide jobs for many of the county's residents.
History
Reeves County was established in 1883 from parts of Pecos and Tom Green counties. The county was named after George R. Reeves, a Texas state legislator and Confederate soldier. The county seat was originally located in Toyah, but it was moved to Pecos in 1884.
The county was largely agricultural until the early 20th century, when oil and gas production began to take off. The first oil well was drilled in 1921, and by the 1930s, the county was producing more than 10 million barrels of oil per year. The oil and gas industry has been an important part of the county's economy ever since.
In the late 20th century, the county began to diversify its economy with the construction of several prisons. The Reeves County Detention Center opened in 1986, and the Reeves County State Jail opened in 1989. These facilities have provided jobs for many of the county's residents.
Today, Reeves County is a diverse and vibrant county. It is home to a thriving agricultural and ranching industry, as well as a booming oil and gas industry. The county is also home to several prisons, which provide jobs for many of the county's residents.
Common Questions
What is Per Capita Income in Reeves County?
Per Capita income in Reeves County is $26,180.
What is the Median Family Income in Reeves County?
Median Family Income in Reeves County is $61,477.
What is the Median Household income in Reeves County?
Median Household Income in Reeves County is $57,487.
What is Income or Wage Gap in Reeves County?
Income or Wage Gap in Reeves County is 27.1%.
Women in Reeves County earn 72.9 cents for every dollar earned by a man.
What is Inequality or Gini Index in Reeves County?
Inequality or Gini Index in Reeves County is 0.44.
What is the Total Population of Reeves County?
Total Population of Reeves County is 14,022.
What is the Total Male Population of Reeves County?
Total Male Population of Reeves County is 8,530.
What is the Total Female Population of Reeves County?
Total Female Population of Reeves County is 5,492.
What is the Ratio of Males per 100 Females in Reeves County?
There are 155.32 Males per 100 Females in Reeves County.
What is the Ratio of Females per 100 Males in Reeves County?
There are 64.38 Females per 100 Males in Reeves County.
What is the Median Population Age in Reeves County?
Median Population Age in Reeves County is 35.4 Years.
What is the Average Family Size in Reeves County
Average Family Size in Reeves County is 3.9 People.
What is the Average Household Size in Reeves County
Average Household Size in Reeves County is 3.1 People.
How Large is the Labor Force in Reeves County?
There are 6,798 People in the Labor Forcein in Reeves County.
What is the Percentage of People in the Labor Force in Reeves County?
61.0% of People are in the Labor Force in Reeves County.
What is the Unemployment Rate in Reeves County?
Unemployment Rate in Reeves County is 7.0%.