Presidio County, TX Map & Demographics
Presidio County Map
Presidio County Overview
$22,256
PER CAPITA INCOME
$75,838
AVG FAMILY INCOME
$29,012
AVG HOUSEHOLD INCOME
23.2%
WAGE / INCOME GAP [ % ]
76.8¢/ $1
WAGE / INCOME GAP [ $ ]
$8,821
FAMILY INCOME DEFICIT
0.59
INEQUALITY / GINI INDEX
6,168
TOTAL POPULATION
3,029
MALE POPULATION
3,139
FEMALE POPULATION
96.50
MALES / 100 FEMALES
103.63
FEMALES / 100 MALES
41.9
MEDIAN AGE
4.9
AVG FAMILY SIZE
2.7
AVG HOUSEHOLD SIZE
2,795
LABOR FORCE [ PEOPLE ]
61.6%
PERCENT IN LABOR FORCE
12.3%
UNEMPLOYMENT RATE
Presidio County Area Codes
Income in Presidio County
Income Overview in Presidio County
Per Capita Income in Presidio County is $22,256, while median incomes of families and households are $75,838 and $29,012 respectively.
| Characteristic | Number | Measure |
| Per Capita Income | 6,168 | $22,256 |
| Median Family Income | 981 | $75,838 |
| Mean Family Income | 981 | $103,344 |
| Median Household Income | 2,275 | $29,012 |
| Mean Household Income | 2,275 | $59,503 |
| Income Deficit | 981 | $8,821 |
| Wage / Income Gap (%) | 6,168 | 23.21% |
| Wage / Income Gap ($) | 6,168 | 76.79¢ per $1 |
| Gini / Inequality Index | 6,168 | 0.59 |
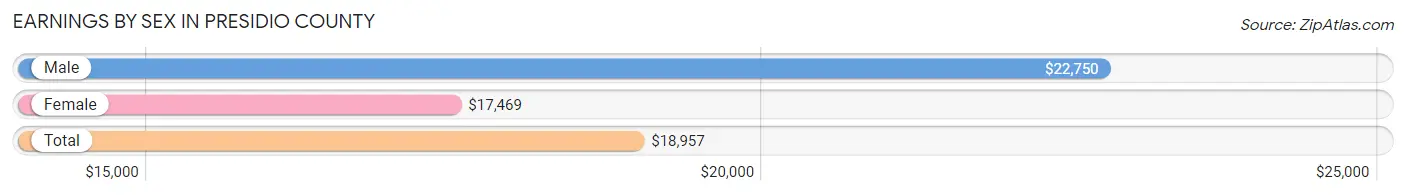
Earnings by Sex in Presidio County
Average Earnings in Presidio County are $18,957, $22,750 for men and $17,469 for women, a difference of 23.2%.
| Sex | Number | Average Earnings |
| Male | 1,601 (54.4%) | $22,750 |
| Female | 1,340 (45.6%) | $17,469 |
| Total | 2,941 (100.0%) | $18,957 |
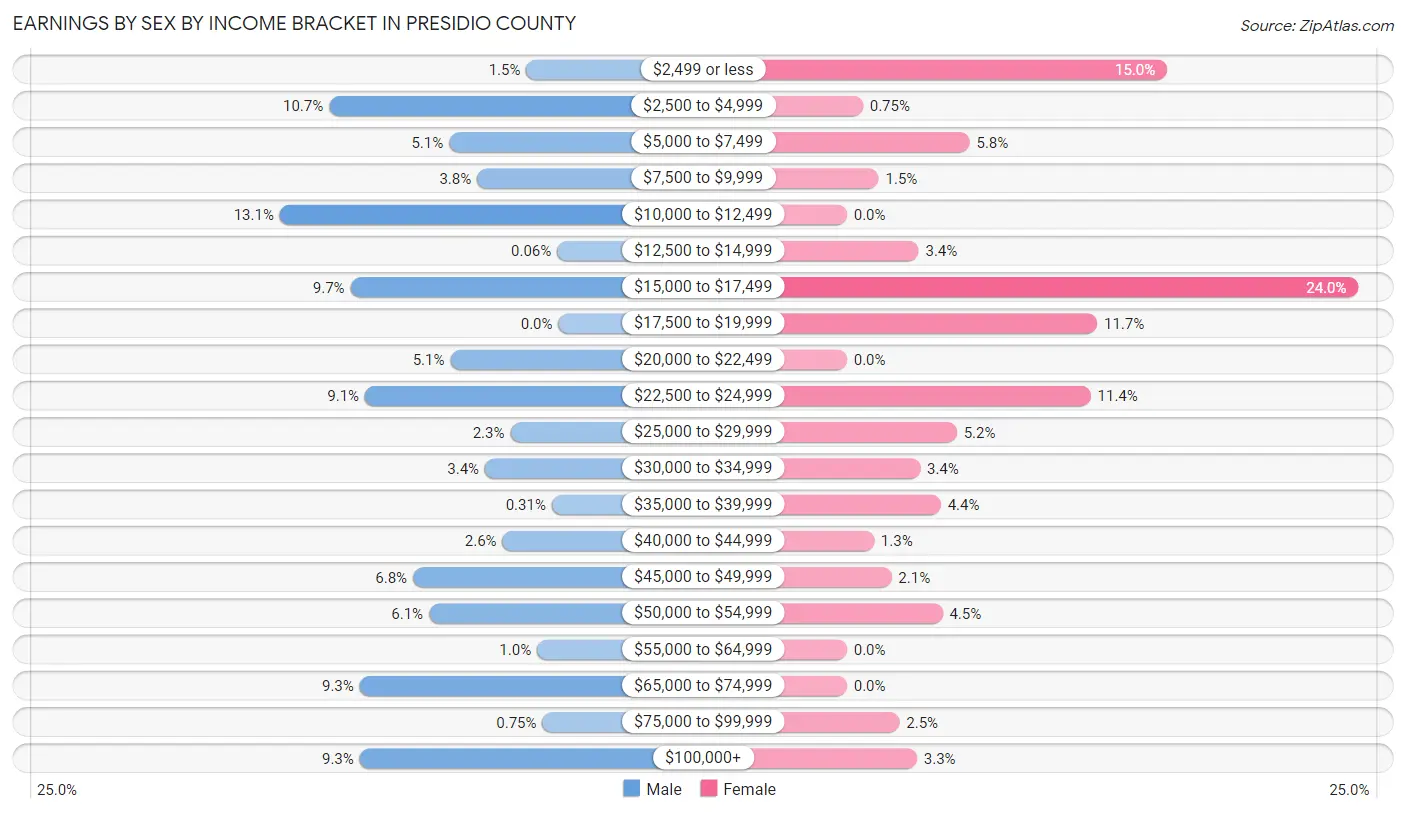
Earnings by Sex by Income Bracket in Presidio County
The most common earnings brackets in Presidio County are $10,000 to $12,499 for men (209 | 13.1%) and $15,000 to $17,499 for women (321 | 24.0%).
| Income | Male | Female |
| $2,499 or less | 24 (1.5%) | 201 (15.0%) |
| $2,500 to $4,999 | 172 (10.7%) | 10 (0.7%) |
| $5,000 to $7,499 | 82 (5.1%) | 77 (5.8%) |
| $7,500 to $9,999 | 61 (3.8%) | 20 (1.5%) |
| $10,000 to $12,499 | 209 (13.1%) | 0 (0.0%) |
| $12,500 to $14,999 | 1 (0.1%) | 45 (3.4%) |
| $15,000 to $17,499 | 156 (9.7%) | 321 (24.0%) |
| $17,500 to $19,999 | 0 (0.0%) | 157 (11.7%) |
| $20,000 to $22,499 | 81 (5.1%) | 0 (0.0%) |
| $22,500 to $24,999 | 145 (9.1%) | 153 (11.4%) |
| $25,000 to $29,999 | 36 (2.2%) | 69 (5.1%) |
| $30,000 to $34,999 | 55 (3.4%) | 46 (3.4%) |
| $35,000 to $39,999 | 5 (0.3%) | 59 (4.4%) |
| $40,000 to $44,999 | 42 (2.6%) | 17 (1.3%) |
| $45,000 to $49,999 | 109 (6.8%) | 28 (2.1%) |
| $50,000 to $54,999 | 97 (6.1%) | 60 (4.5%) |
| $55,000 to $64,999 | 16 (1.0%) | 0 (0.0%) |
| $65,000 to $74,999 | 149 (9.3%) | 0 (0.0%) |
| $75,000 to $99,999 | 12 (0.7%) | 33 (2.5%) |
| $100,000+ | 149 (9.3%) | 44 (3.3%) |
| Total | 1,601 (100.0%) | 1,340 (100.0%) |
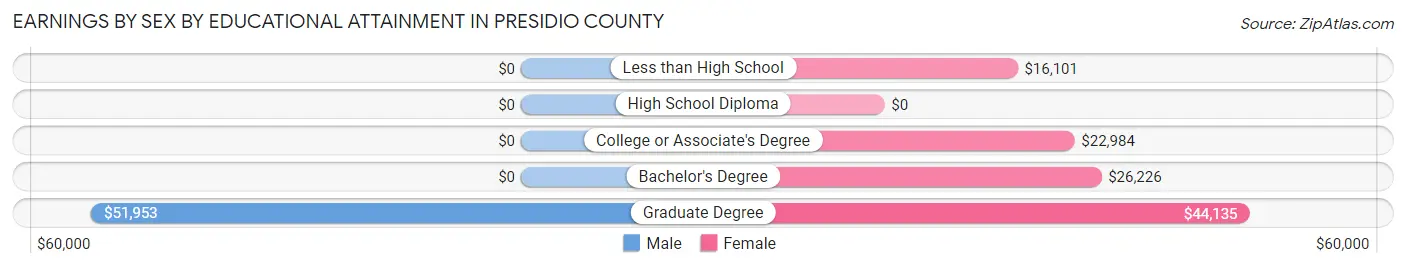
Earnings by Sex by Educational Attainment in Presidio County
Average earnings in Presidio County are $24,405 for men and $19,610 for women, a difference of 19.7%. Men with an educational attainment of graduate degree enjoy the highest average annual earnings of $51,953, while those with graduate degree education earn the least with $51,953. Women with an educational attainment of graduate degree earn the most with the average annual earnings of $44,135, while those with less than high school education have the smallest earnings of $16,101.
| Educational Attainment | Male Income | Female Income |
| Less than High School | - | - |
| High School Diploma | - | - |
| College or Associate's Degree | - | - |
| Bachelor's Degree | - | - |
| Graduate Degree | $51,953 | $44,135 |
| Total | $24,405 | $19,610 |
Family Income in Presidio County
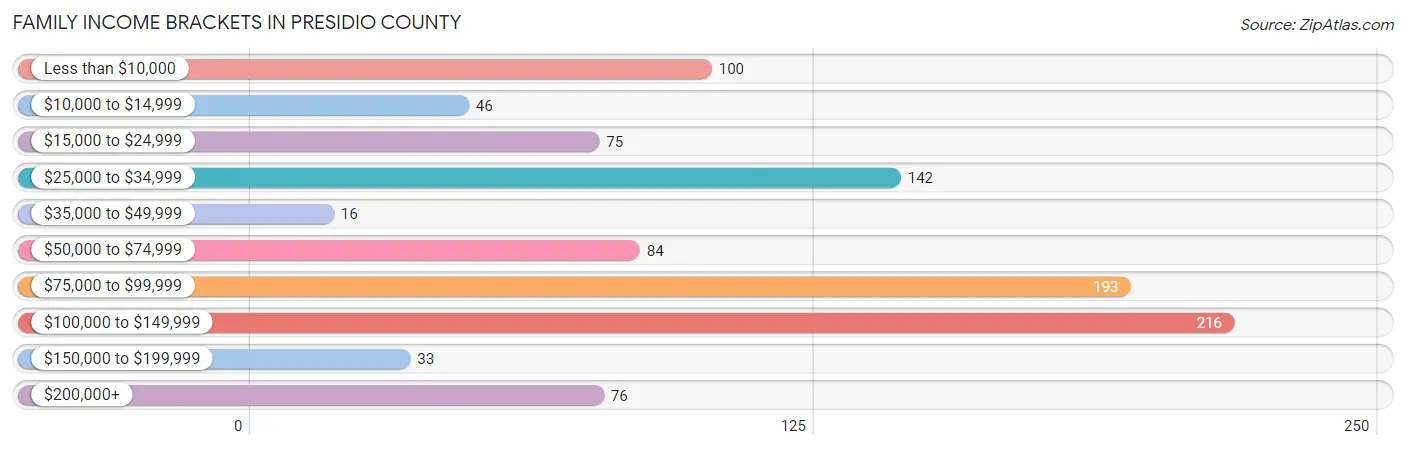
Family Income Brackets in Presidio County
According to the Presidio County family income data, there are 216 families falling into the $100,000 to $149,999 income range, which is the most common income bracket and makes up 22.0% of all families. Conversely, the $35,000 to $49,999 income bracket is the least frequent group with only 16 families (1.6%) belonging to this category.
| Income Bracket | # Families | % Families |
| Less than $10,000 | 100 | 10.2% |
| $10,000 to $14,999 | 46 | 4.7% |
| $15,000 to $24,999 | 75 | 7.6% |
| $25,000 to $34,999 | 142 | 14.5% |
| $35,000 to $49,999 | 16 | 1.6% |
| $50,000 to $74,999 | 84 | 8.6% |
| $75,000 to $99,999 | 193 | 19.7% |
| $100,000 to $149,999 | 216 | 22.0% |
| $150,000 to $199,999 | 33 | 3.4% |
| $200,000+ | 76 | 7.7% |
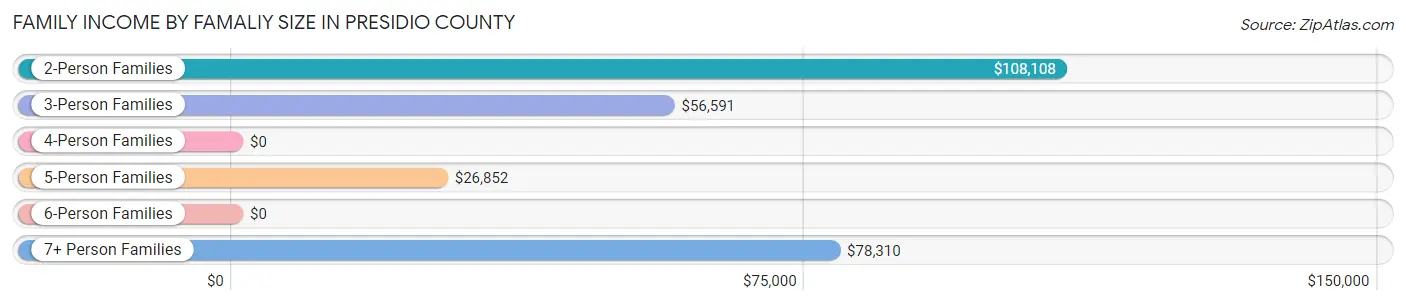
Family Income by Famaliy Size in Presidio County
2-person families (508 | 51.8%) account for the highest median family income in Presidio County with $108,108 per family, while 2-person families (508 | 51.8%) have the highest median income of $54,054 per family member.
| Income Bracket | # Families | Median Income |
| 2-Person Families | 508 (51.8%) | $108,108 |
| 3-Person Families | 220 (22.4%) | $56,591 |
| 4-Person Families | 18 (1.8%) | $0 |
| 5-Person Families | 162 (16.5%) | $26,852 |
| 6-Person Families | 0 (0.0%) | $0 |
| 7+ Person Families | 73 (7.4%) | $78,310 |
| Total | 981 (100.0%) | $75,838 |
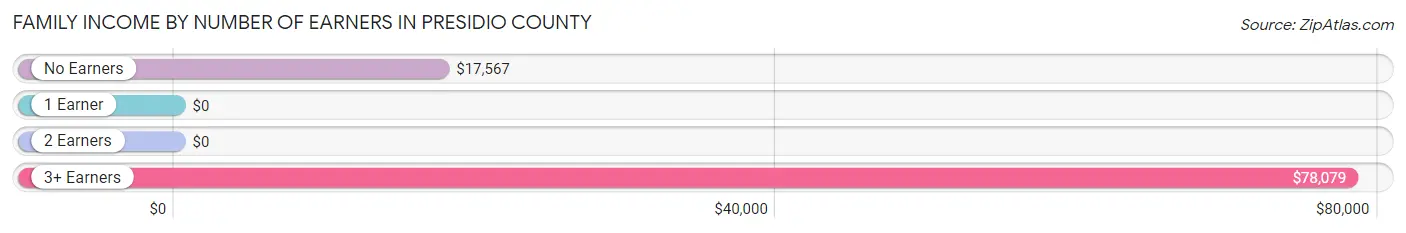
Family Income by Number of Earners in Presidio County
| Number of Earners | # Families | Median Income |
| No Earners | 260 (26.5%) | $17,567 |
| 1 Earner | 136 (13.9%) | $0 |
| 2 Earners | 396 (40.4%) | $0 |
| 3+ Earners | 189 (19.3%) | $78,079 |
| Total | 981 (100.0%) | $75,838 |
Household Income in Presidio County
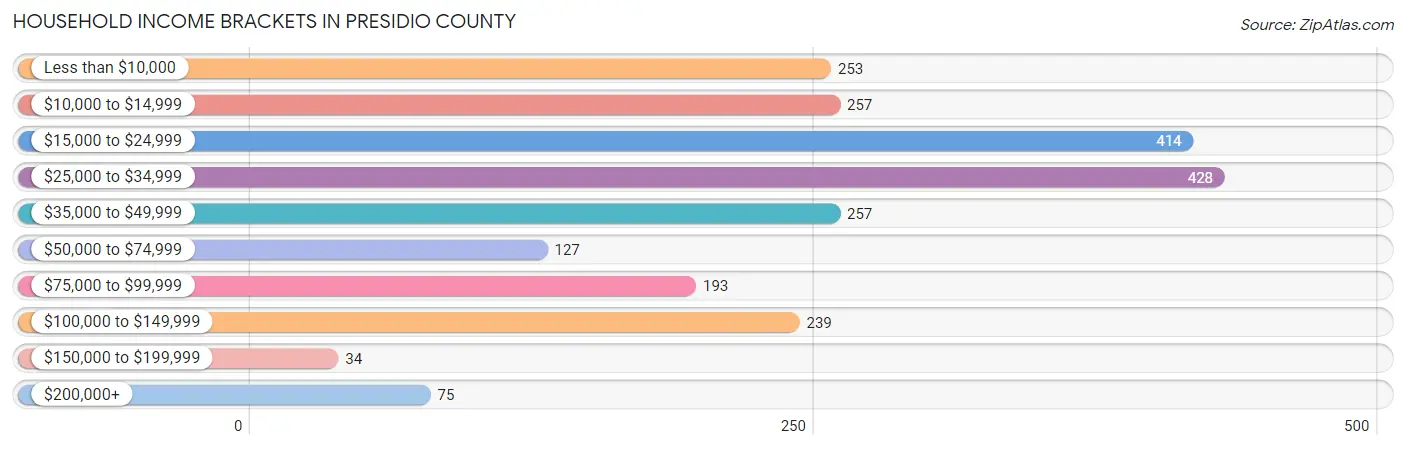
Household Income Brackets in Presidio County
With 428 households falling in the category, the $25,000 to $34,999 income range is the most frequent in Presidio County, accounting for 18.8% of all households. In contrast, only 34 households (1.5%) fall into the $150,000 to $199,999 income bracket, making it the least populous group.
| Income Bracket | # Households | % Households |
| Less than $10,000 | 253 | 11.1% |
| $10,000 to $14,999 | 257 | 11.3% |
| $15,000 to $24,999 | 414 | 18.2% |
| $25,000 to $34,999 | 428 | 18.8% |
| $35,000 to $49,999 | 257 | 11.3% |
| $50,000 to $74,999 | 127 | 5.6% |
| $75,000 to $99,999 | 193 | 8.5% |
| $100,000 to $149,999 | 239 | 10.5% |
| $150,000 to $199,999 | 34 | 1.5% |
| $200,000+ | 75 | 3.3% |
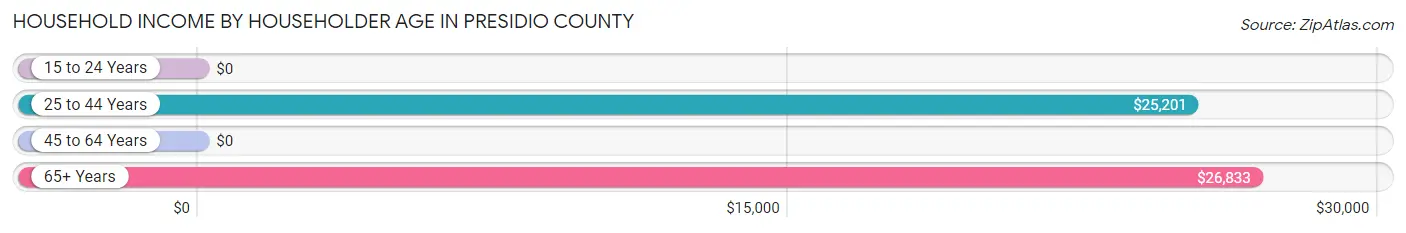
Household Income by Householder Age in Presidio County
The median household income in Presidio County is $29,012, with the highest median household income of $26,833 found in the 65+ years age bracket for the primary householder. A total of 1,134 households (49.8%) fall into this category. Meanwhile, the 15 to 24 years age bracket for the primary householder has the lowest median household income of $0, with 47 households (2.1%) in this group.
| Income Bracket | # Households | Median Income |
| 15 to 24 Years | 47 (2.1%) | $0 |
| 25 to 44 Years | 471 (20.7%) | $25,201 |
| 45 to 64 Years | 623 (27.4%) | $0 |
| 65+ Years | 1,134 (49.8%) | $26,833 |
| Total | 2,275 (100.0%) | $29,012 |
Poverty in Presidio County
Income Below Poverty by Sex and Age in Presidio County
With 35.5% poverty level for males and 44.4% for females among the residents of Presidio County, 6 to 11 year old males and under 5 year old females are the most vulnerable to poverty, with 473 males (100.0%) and 152 females (100.0%) in their respective age groups living below the poverty level.
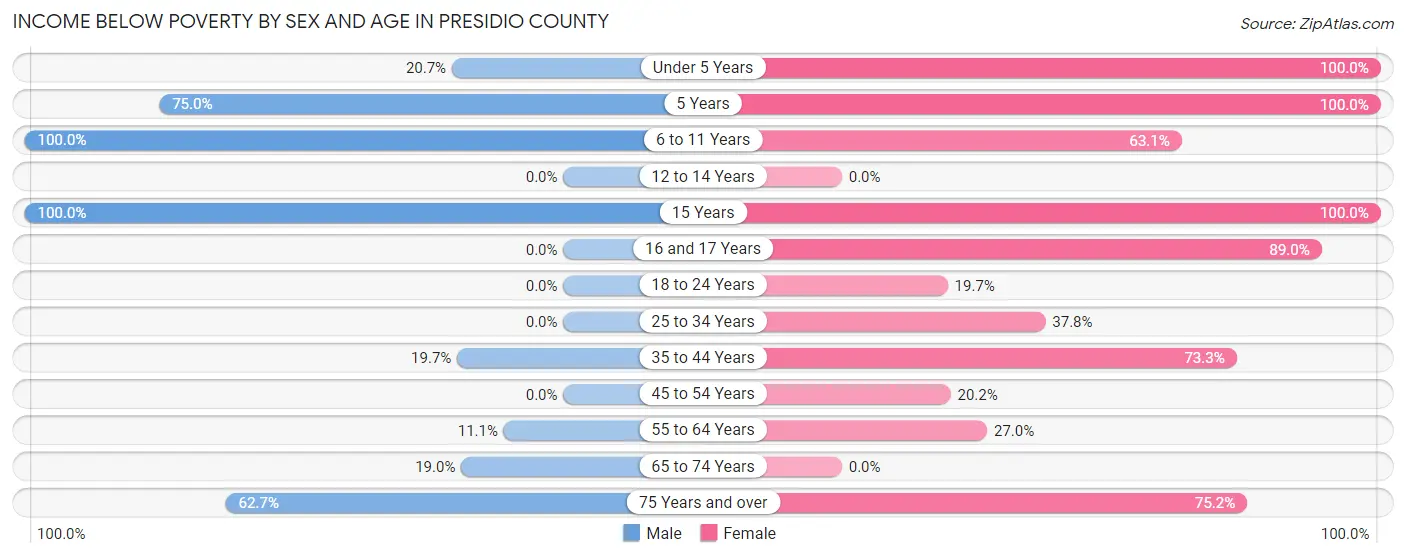
| Age Bracket | Male | Female |
| Under 5 Years | 73 (20.7%) | 152 (100.0%) |
| 5 Years | 78 (75.0%) | 55 (100.0%) |
| 6 to 11 Years | 473 (100.0%) | 157 (63.0%) |
| 12 to 14 Years | 0 (0.0%) | 0 (0.0%) |
| 15 Years | 103 (100.0%) | 49 (100.0%) |
| 16 and 17 Years | 0 (0.0%) | 130 (89.0%) |
| 18 to 24 Years | 0 (0.0%) | 56 (19.7%) |
| 25 to 34 Years | 0 (0.0%) | 102 (37.8%) |
| 35 to 44 Years | 81 (19.7%) | 282 (73.3%) |
| 45 to 54 Years | 0 (0.0%) | 43 (20.2%) |
| 55 to 64 Years | 40 (11.1%) | 110 (27.0%) |
| 65 to 74 Years | 58 (19.0%) | 0 (0.0%) |
| 75 Years and over | 168 (62.7%) | 255 (75.2%) |
| Total | 1,074 (35.5%) | 1,391 (44.4%) |
Income Above Poverty by Sex and Age in Presidio County
According to the poverty statistics in Presidio County, males aged 16 and 17 years and females aged 12 to 14 years are the age groups that are most secure financially, with 100.0% of males and 100.0% of females in these age groups living above the poverty line.
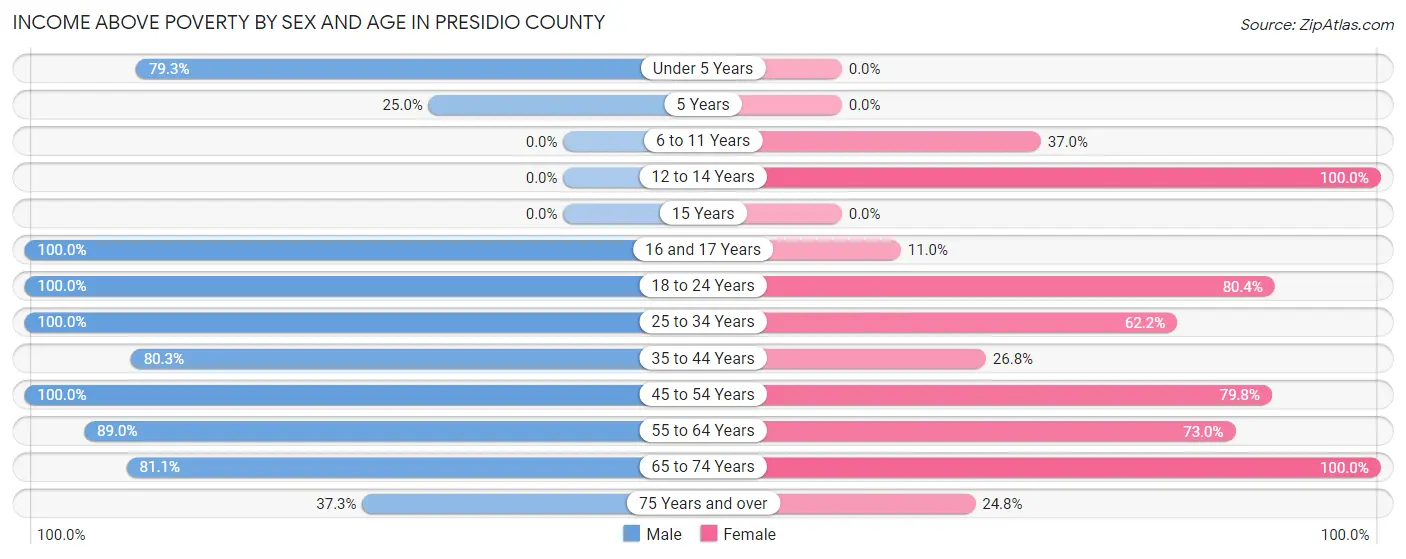
| Age Bracket | Male | Female |
| Under 5 Years | 280 (79.3%) | 0 (0.0%) |
| 5 Years | 26 (25.0%) | 0 (0.0%) |
| 6 to 11 Years | 0 (0.0%) | 92 (36.9%) |
| 12 to 14 Years | 0 (0.0%) | 93 (100.0%) |
| 15 Years | 0 (0.0%) | 0 (0.0%) |
| 16 and 17 Years | 65 (100.0%) | 16 (11.0%) |
| 18 to 24 Years | 242 (100.0%) | 229 (80.3%) |
| 25 to 34 Years | 55 (100.0%) | 168 (62.2%) |
| 35 to 44 Years | 330 (80.3%) | 103 (26.8%) |
| 45 to 54 Years | 285 (100.0%) | 170 (79.8%) |
| 55 to 64 Years | 322 (88.9%) | 298 (73.0%) |
| 65 to 74 Years | 248 (81.0%) | 492 (100.0%) |
| 75 Years and over | 100 (37.3%) | 84 (24.8%) |
| Total | 1,953 (64.5%) | 1,745 (55.6%) |
Income Below Poverty Among Married-Couple Families in Presidio County
The poverty statistics for married-couple families in Presidio County show that 28.3% or 249 of the total 881 families live below the poverty line. Families with 3 or 4 children have the highest poverty rate of 53.9%, comprising of 97 families. On the other hand, families with 5 or more children have the lowest poverty rate of 0.0%, which includes 0 families.
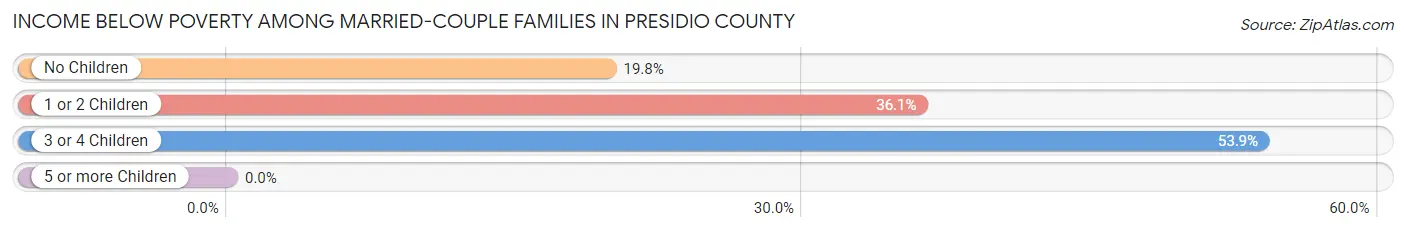
| Children | Above Poverty | Below Poverty |
| No Children | 491 (80.2%) | 121 (19.8%) |
| 1 or 2 Children | 55 (63.9%) | 31 (36.0%) |
| 3 or 4 Children | 83 (46.1%) | 97 (53.9%) |
| 5 or more Children | 3 (100.0%) | 0 (0.0%) |
| Total | 632 (71.7%) | 249 (28.3%) |
Income Below Poverty Among Single-Parent Households in Presidio County
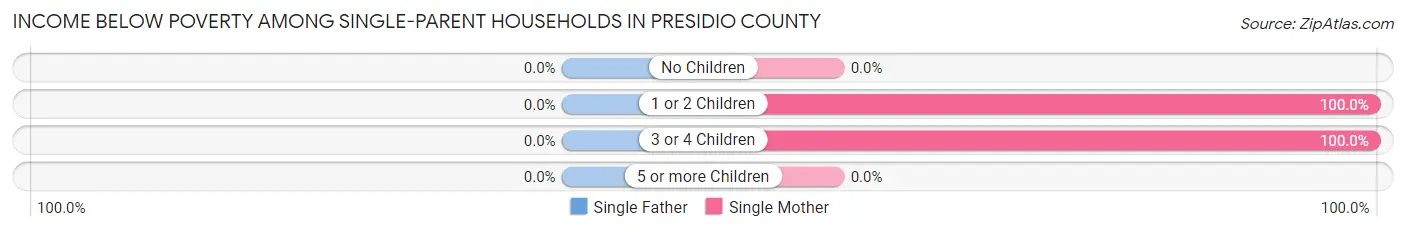
| Children | Single Father | Single Mother |
| No Children | 0 (0.0%) | 0 (0.0%) |
| 1 or 2 Children | 0 (0.0%) | 61 (100.0%) |
| 3 or 4 Children | 0 (0.0%) | 39 (100.0%) |
| 5 or more Children | 0 (0.0%) | 0 (0.0%) |
| Total | 0 (0.0%) | 100 (100.0%) |
Income Below Poverty Among Married-Couple vs Single-Parent Households in Presidio County
The poverty data for Presidio County shows that 249 of the married-couple family households (28.3%) and 100 of the single-parent households (100.0%) are living below the poverty level. Within the married-couple family households, those with 3 or 4 children have the highest poverty rate, with 97 households (53.9%) falling below the poverty line. Among the single-parent households, those with 1 or 2 children have the highest poverty rate, with 61 household (100.0%) living below poverty.
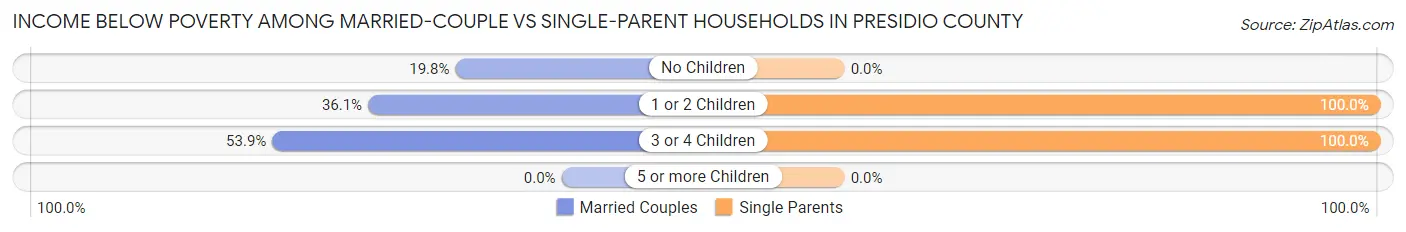
| Children | Married-Couple Families | Single-Parent Households |
| No Children | 121 (19.8%) | 0 (0.0%) |
| 1 or 2 Children | 31 (36.0%) | 61 (100.0%) |
| 3 or 4 Children | 97 (53.9%) | 39 (100.0%) |
| 5 or more Children | 0 (0.0%) | 0 (0.0%) |
| Total | 249 (28.3%) | 100 (100.0%) |
Race in Presidio County
The most populous races in Presidio County are Hispanic or Latino (4,893 | 79.3%), White / Caucasian (3,571 | 57.9%), and Two or more Races (2,440 | 39.6%).
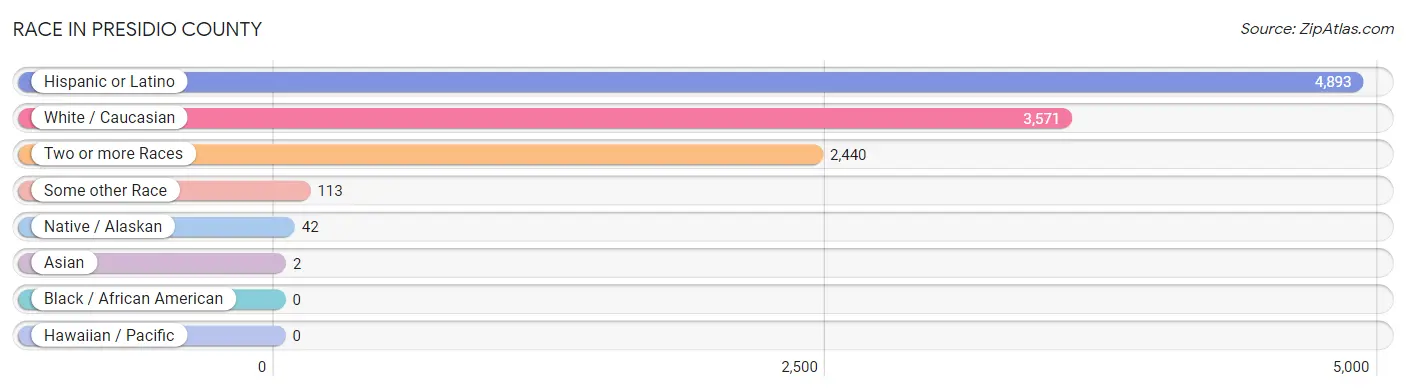
| Race | # Population | % Population |
| Asian | 2 | 0.0% |
| Black / African American | 0 | 0.0% |
| Hawaiian / Pacific | 0 | 0.0% |
| Hispanic or Latino | 4,893 | 79.3% |
| Native / Alaskan | 42 | 0.7% |
| White / Caucasian | 3,571 | 57.9% |
| Two or more Races | 2,440 | 39.6% |
| Some other Race | 113 | 1.8% |
| Total | 6,168 | 100.0% |
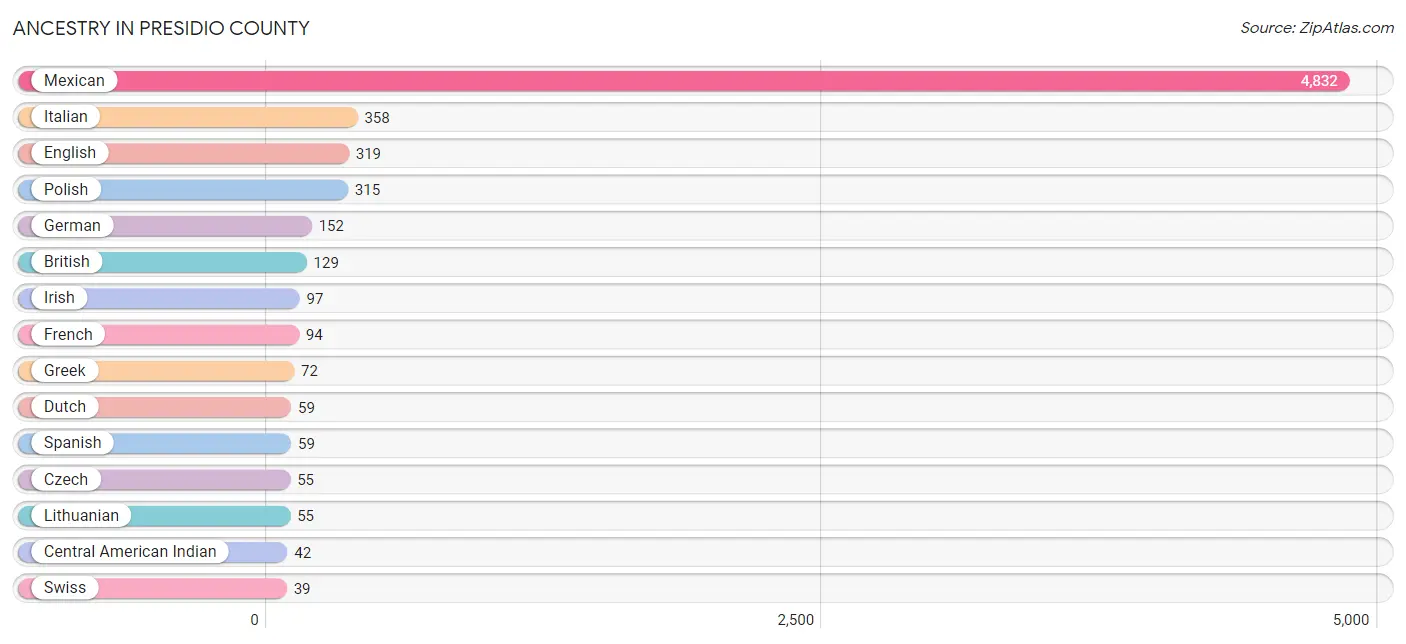
Ancestry in Presidio County
The most populous ancestries reported in Presidio County are Mexican (4,832 | 78.3%), Italian (358 | 5.8%), English (319 | 5.2%), Polish (315 | 5.1%), and German (152 | 2.5%), together accounting for 96.9% of all Presidio County residents.
| Ancestry | # Population | % Population |
| African | 1 | 0.0% |
| American | 22 | 0.4% |
| British | 129 | 2.1% |
| Central American | 1 | 0.0% |
| Central American Indian | 42 | 0.7% |
| Colombian | 1 | 0.0% |
| Czech | 55 | 0.9% |
| Czechoslovakian | 9 | 0.2% |
| Dutch | 59 | 1.0% |
| Eastern European | 36 | 0.6% |
| English | 319 | 5.2% |
| French | 94 | 1.5% |
| French Canadian | 21 | 0.3% |
| German | 152 | 2.5% |
| Greek | 72 | 1.2% |
| Guatemalan | 1 | 0.0% |
| Indian (Asian) | 1 | 0.0% |
| Irish | 97 | 1.6% |
| Italian | 358 | 5.8% |
| Lithuanian | 55 | 0.9% |
| Mexican | 4,832 | 78.3% |
| Polish | 315 | 5.1% |
| Scotch-Irish | 19 | 0.3% |
| Slovene | 13 | 0.2% |
| South American | 1 | 0.0% |
| Spanish | 59 | 1.0% |
| Sri Lankan | 1 | 0.0% |
| Subsaharan African | 1 | 0.0% |
| Swiss | 39 | 0.6% |
| Thai | 21 | 0.3% | View All 30 Rows |
Immigrants in Presidio County
The most numerous immigrant groups reported in Presidio County came from Latin America (2,213 | 35.9%), Central America (2,212 | 35.9%), Mexico (2,170 | 35.2%), Guatemala (42 | 0.7%), and Asia (2 | 0.0%), together accounting for 107.6% of all Presidio County residents.
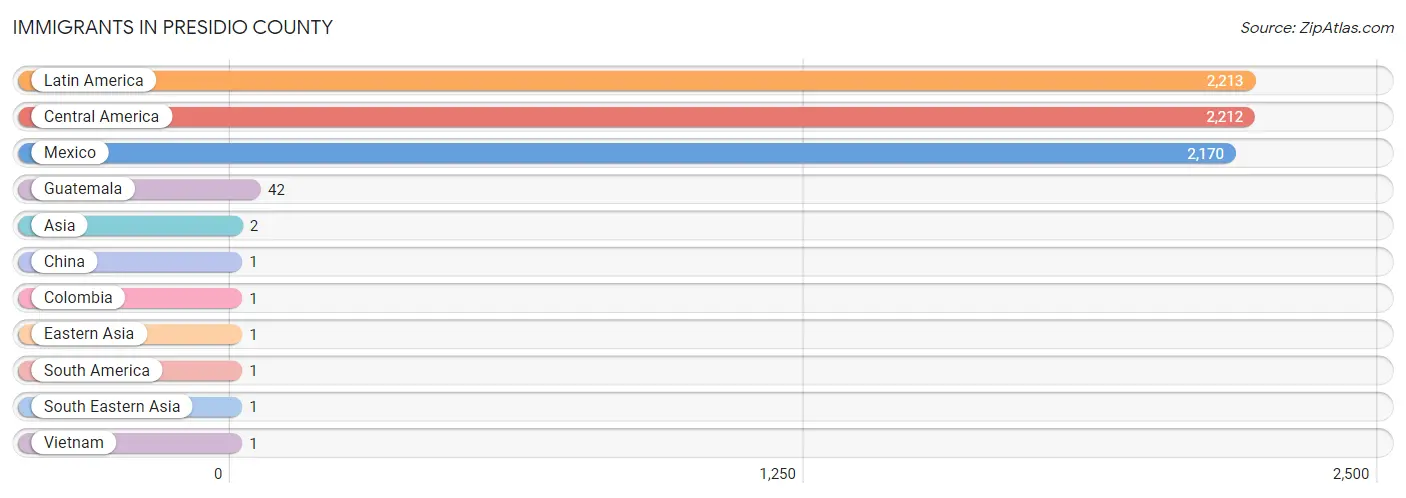
| Immigration Origin | # Population | % Population |
| Asia | 2 | 0.0% |
| Central America | 2,212 | 35.9% |
| China | 1 | 0.0% |
| Colombia | 1 | 0.0% |
| Eastern Asia | 1 | 0.0% |
| Guatemala | 42 | 0.7% |
| Latin America | 2,213 | 35.9% |
| Mexico | 2,170 | 35.2% |
| South America | 1 | 0.0% |
| South Eastern Asia | 1 | 0.0% |
| Vietnam | 1 | 0.0% | View All 11 Rows |
Sex and Age in Presidio County
Sex and Age in Presidio County
The most populous age groups in Presidio County are 5 to 9 Years (503 | 16.6%) for men and 65 to 69 Years (367 | 11.7%) for women.
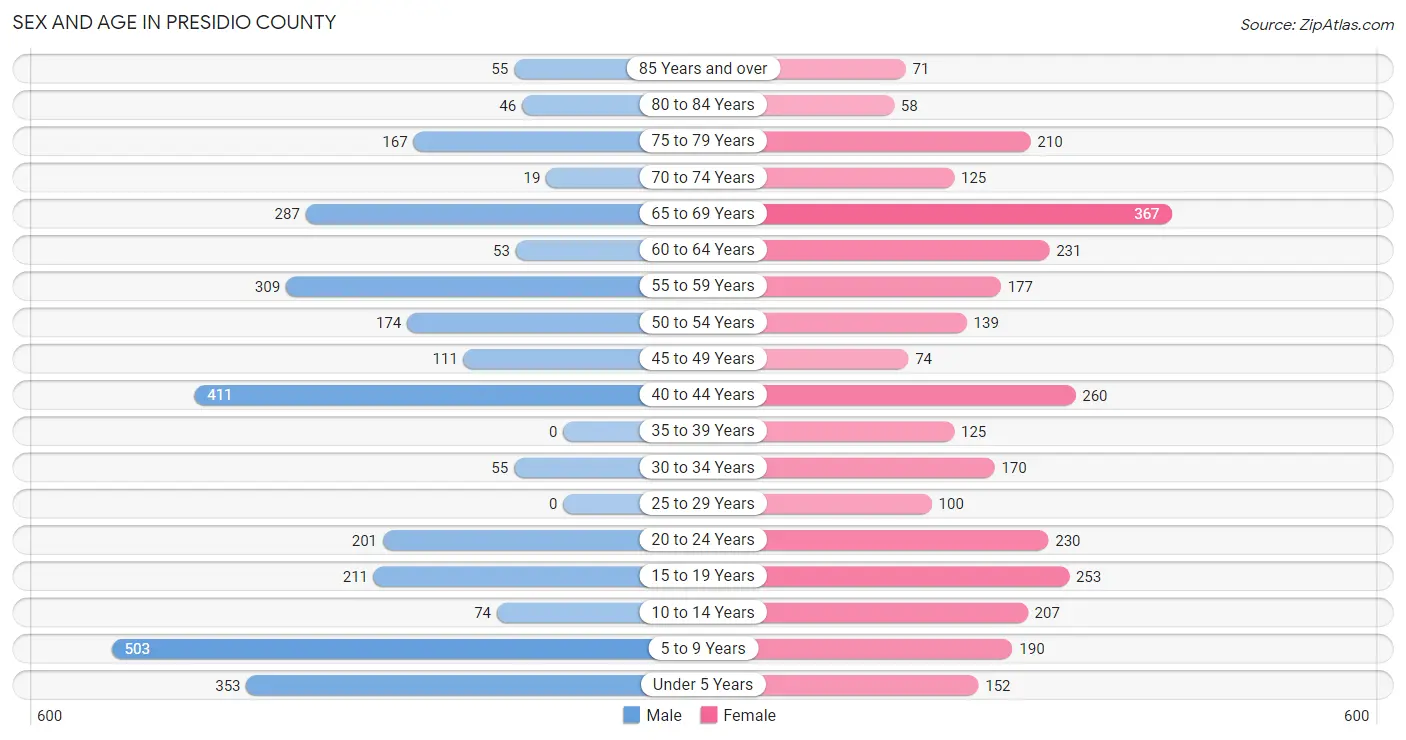
| Age Bracket | Male | Female |
| Under 5 Years | 353 (11.7%) | 152 (4.8%) |
| 5 to 9 Years | 503 (16.6%) | 190 (6.0%) |
| 10 to 14 Years | 74 (2.4%) | 207 (6.6%) |
| 15 to 19 Years | 211 (7.0%) | 253 (8.1%) |
| 20 to 24 Years | 201 (6.6%) | 230 (7.3%) |
| 25 to 29 Years | 0 (0.0%) | 100 (3.2%) |
| 30 to 34 Years | 55 (1.8%) | 170 (5.4%) |
| 35 to 39 Years | 0 (0.0%) | 125 (4.0%) |
| 40 to 44 Years | 411 (13.6%) | 260 (8.3%) |
| 45 to 49 Years | 111 (3.7%) | 74 (2.4%) |
| 50 to 54 Years | 174 (5.7%) | 139 (4.4%) |
| 55 to 59 Years | 309 (10.2%) | 177 (5.6%) |
| 60 to 64 Years | 53 (1.8%) | 231 (7.4%) |
| 65 to 69 Years | 287 (9.5%) | 367 (11.7%) |
| 70 to 74 Years | 19 (0.6%) | 125 (4.0%) |
| 75 to 79 Years | 167 (5.5%) | 210 (6.7%) |
| 80 to 84 Years | 46 (1.5%) | 58 (1.8%) |
| 85 Years and over | 55 (1.8%) | 71 (2.3%) |
| Total | 3,029 (100.0%) | 3,139 (100.0%) |
Families and Households in Presidio County
Median Family Size in Presidio County
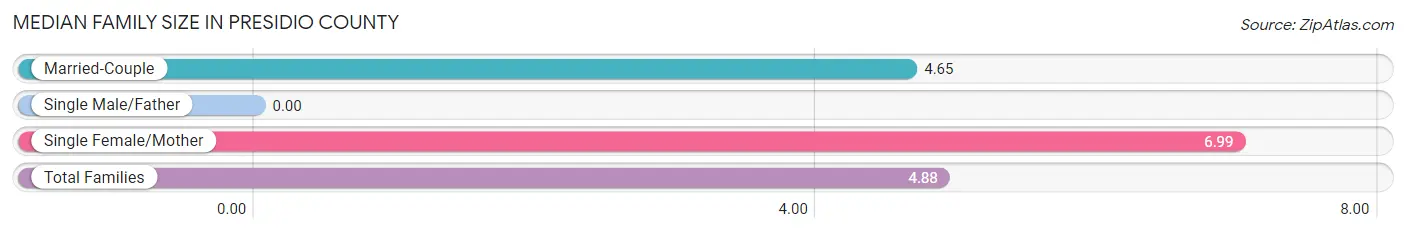
| Family Type | # Families | Family Size |
| Married-Couple | 881 (89.8%) | 4.65 |
| Single Male/Father | 0 (0.0%) | - |
| Single Female/Mother | 100 (10.2%) | 6.99 |
| Total Families | 981 (100.0%) | 4.88 |
Median Household Size in Presidio County
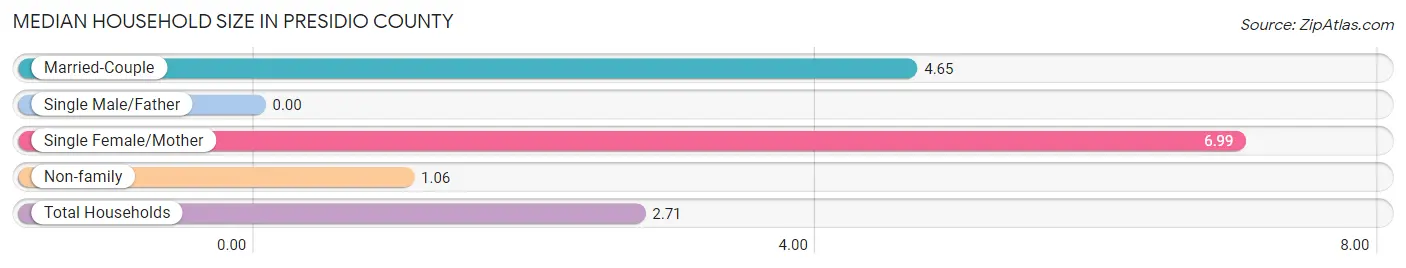
| Household Type | # Households | Household Size |
| Married-Couple | 881 (38.7%) | 4.65 |
| Single Male/Father | 0 (0.0%) | - |
| Single Female/Mother | 100 (4.4%) | 6.99 |
| Non-family | 1,294 (56.9%) | 1.06 |
| Total Households | 2,275 (100.0%) | 2.71 |
Household Size by Marriage Status in Presidio County
Out of a total of 2,275 households in Presidio County, 981 (43.1%) are family households, while 1,294 (56.9%) are nonfamily households. The most numerous type of family households are 2-person households, comprising 508, and the most common type of nonfamily households are 1-person households, comprising 1,190.
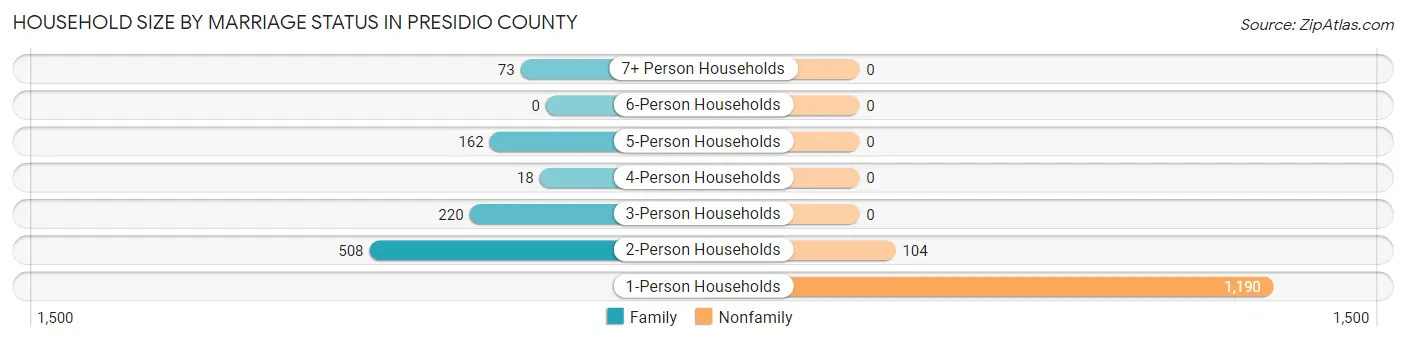
| Household Size | Family Households | Nonfamily Households |
| 1-Person Households | - | 1,190 (52.3%) |
| 2-Person Households | 508 (22.3%) | 104 (4.6%) |
| 3-Person Households | 220 (9.7%) | 0 (0.0%) |
| 4-Person Households | 18 (0.8%) | 0 (0.0%) |
| 5-Person Households | 162 (7.1%) | 0 (0.0%) |
| 6-Person Households | 0 (0.0%) | 0 (0.0%) |
| 7+ Person Households | 73 (3.2%) | 0 (0.0%) |
| Total | 981 (43.1%) | 1,294 (56.9%) |
Female Fertility in Presidio County
Fertility by Age in Presidio County
Average fertility rate in Presidio County is 164.0 births per 1,000 women. Women in the age bracket of 20 to 34 years have the highest fertility rate with 244.0 births per 1,000 women. Women in the age bracket of 20 to 34 years acount for 61.3% of all women with births.
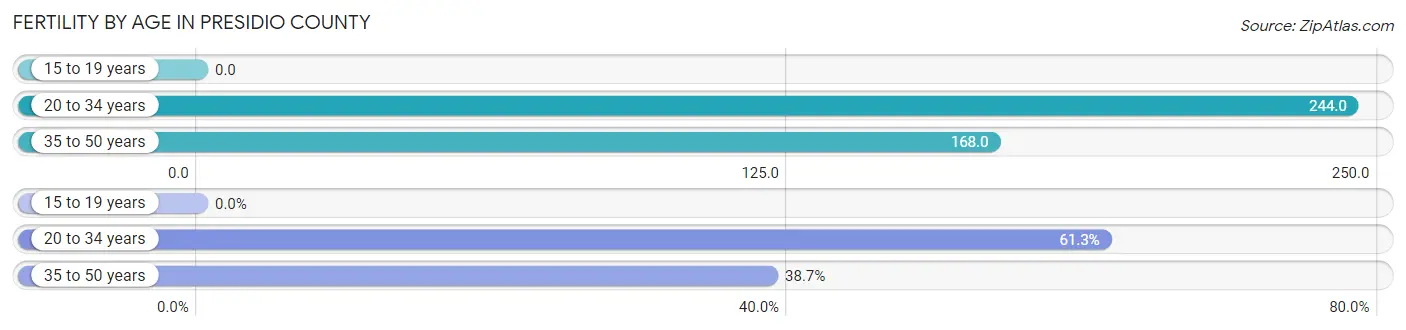
| Age Bracket | Women with Births | Births / 1,000 Women |
| 15 to 19 years | 0 (0.0%) | 0.0 |
| 20 to 34 years | 122 (61.3%) | 244.0 |
| 35 to 50 years | 77 (38.7%) | 168.0 |
| Total | 199 (100.0%) | 164.0 |
Fertility by Age by Marriage Status in Presidio County
33.7% of women with births (199) in Presidio County are married. The highest percentage of unmarried women with births falls into 20 to 34 years age bracket with 93.4% of them unmarried at the time of birth, while the lowest percentage of unmarried women with births belong to 35 to 50 years age bracket with 23.4% of them unmarried.
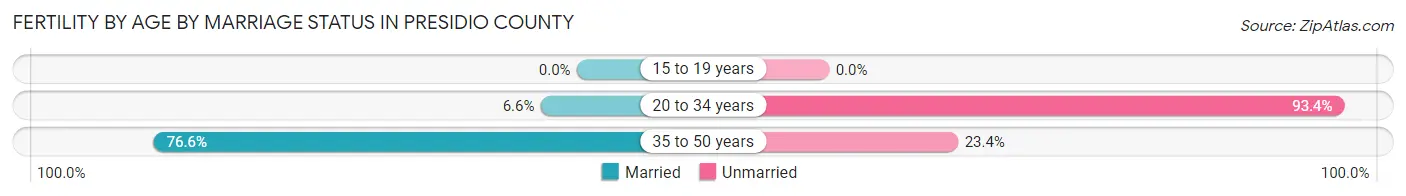
| Age Bracket | Married | Unmarried |
| 15 to 19 years | 0 (0.0%) | 0 (0.0%) |
| 20 to 34 years | 8 (6.6%) | 114 (93.4%) |
| 35 to 50 years | 59 (76.6%) | 18 (23.4%) |
| Total | 67 (33.7%) | 132 (66.3%) |
Fertility by Education in Presidio County
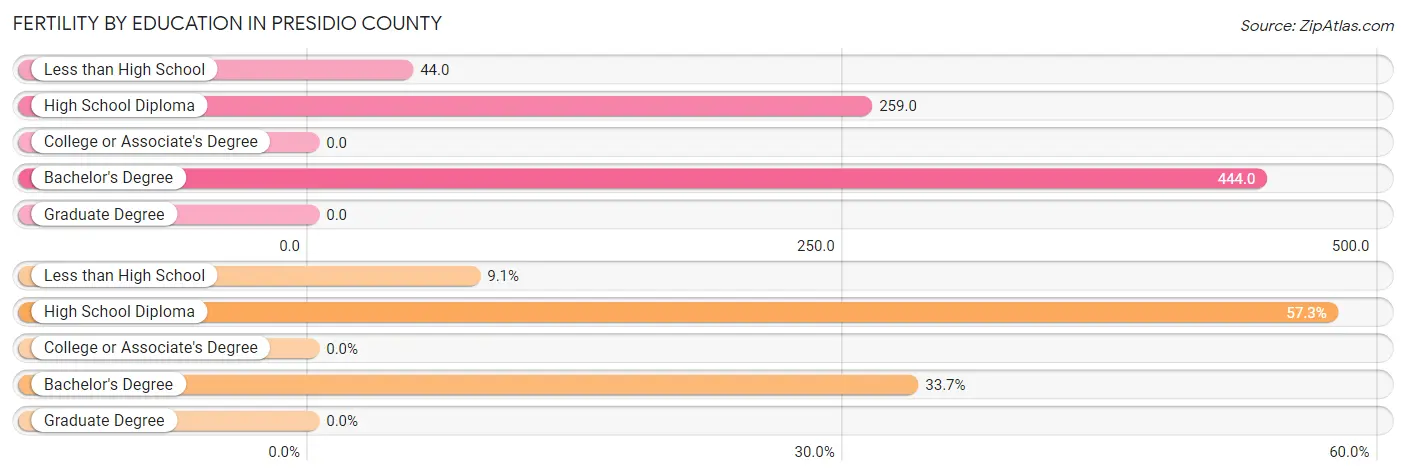
| Educational Attainment | Women with Births | Births / 1,000 Women |
| Less than High School | 18 (9.0%) | 44.0 |
| High School Diploma | 114 (57.3%) | 259.0 |
| College or Associate's Degree | 0 (0.0%) | 0.0 |
| Bachelor's Degree | 67 (33.7%) | 444.0 |
| Graduate Degree | 0 (0.0%) | 0.0 |
| Total | 199 (100.0%) | 164.0 |
Fertility by Education by Marriage Status in Presidio County
66.3% of women with births in Presidio County are unmarried. Women with the educational attainment of bachelor's degree are most likely to be married with 100.0% of them married at childbirth, while women with the educational attainment of less than high school are least likely to be married with 100.0% of them unmarried at childbirth.
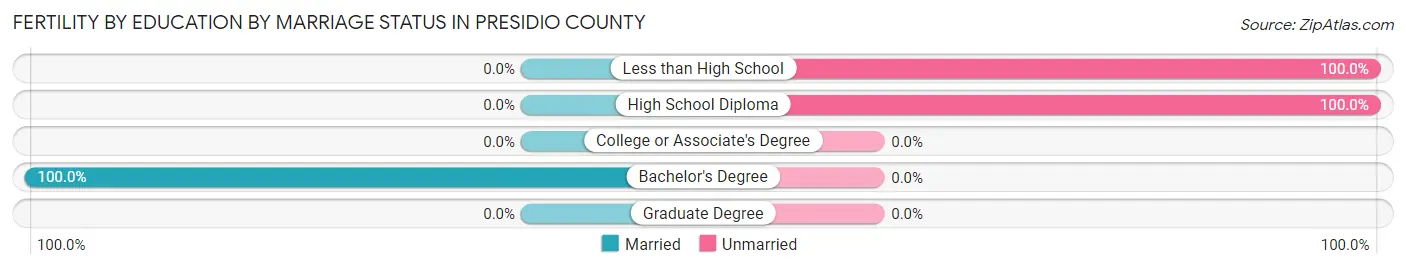
| Educational Attainment | Married | Unmarried |
| Less than High School | 0 (0.0%) | 18 (100.0%) |
| High School Diploma | 0 (0.0%) | 114 (100.0%) |
| College or Associate's Degree | 0 (0.0%) | 0 (0.0%) |
| Bachelor's Degree | 67 (100.0%) | 0 (0.0%) |
| Graduate Degree | 0 (0.0%) | 0 (0.0%) |
| Total | 67 (33.7%) | 132 (66.3%) |
Employment Characteristics in Presidio County
Employment by Class of Employer in Presidio County
Among the 2,449 employed individuals in Presidio County, private company employees (1,127 | 46.0%), local government employees (358 | 14.6%), and self-employed (not incorporated) (343 | 14.0%) make up the most common classes of employment.
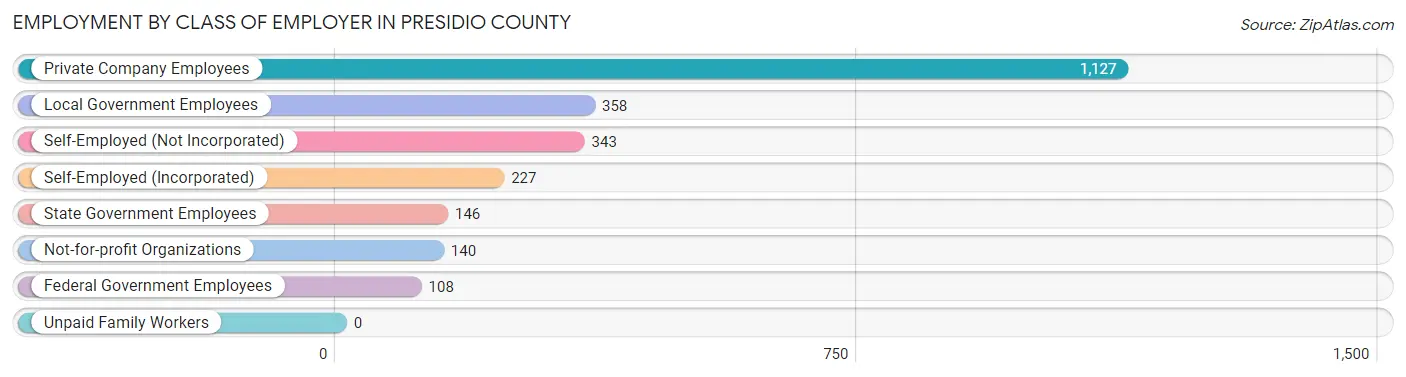
| Employer Class | # Employees | % Employees |
| Private Company Employees | 1,127 | 46.0% |
| Self-Employed (Incorporated) | 227 | 9.3% |
| Self-Employed (Not Incorporated) | 343 | 14.0% |
| Not-for-profit Organizations | 140 | 5.7% |
| Local Government Employees | 358 | 14.6% |
| State Government Employees | 146 | 6.0% |
| Federal Government Employees | 108 | 4.4% |
| Unpaid Family Workers | 0 | 0.0% |
| Total | 2,449 | 100.0% |
Employment Status by Age in Presidio County
According to the labor force statistics for Presidio County, out of the total population over 16 years of age (4,537), 61.6% or 2,795 individuals are in the labor force, with 12.3% or 344 of them unemployed. The age group with the highest labor force participation rate is 30 to 34 years, with 100.0% or 225 individuals in the labor force. Within the labor force, the 20 to 24 years age range has the highest percentage of unemployed individuals, with 48.6% or 153 of them being unemployed.
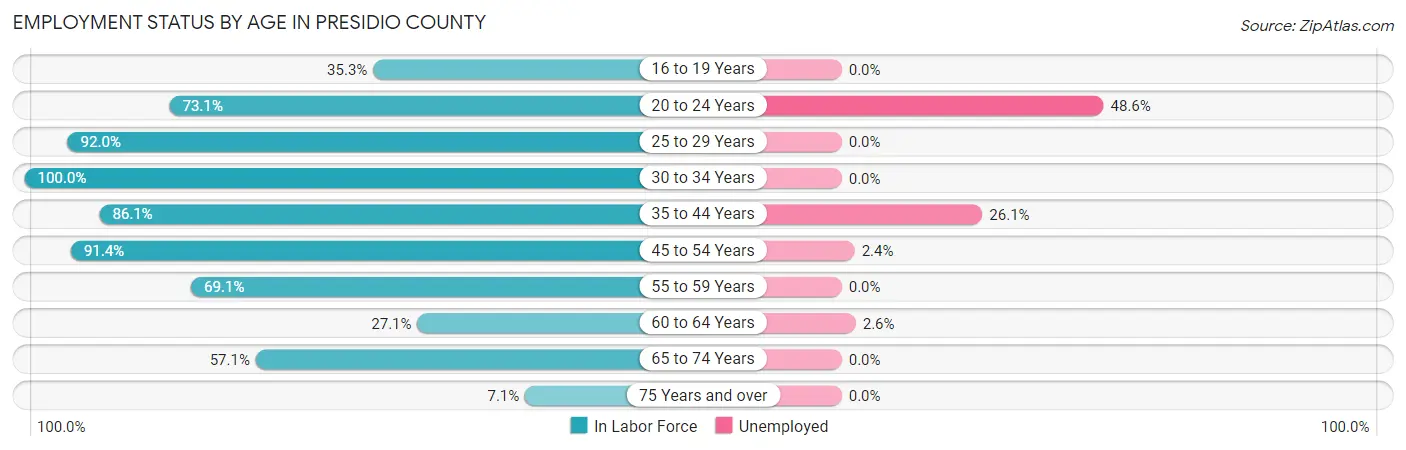
| Age Bracket | In Labor Force | Unemployed |
| 16 to 19 Years | 110 (35.3%) | 0 (0.0%) |
| 20 to 24 Years | 315 (73.1%) | 153 (48.6%) |
| 25 to 29 Years | 92 (92.0%) | 0 (0.0%) |
| 30 to 34 Years | 225 (100.0%) | 0 (0.0%) |
| 35 to 44 Years | 685 (86.1%) | 179 (26.1%) |
| 45 to 54 Years | 455 (91.4%) | 11 (2.4%) |
| 55 to 59 Years | 336 (69.1%) | 0 (0.0%) |
| 60 to 64 Years | 77 (27.1%) | 2 (2.6%) |
| 65 to 74 Years | 456 (57.1%) | 0 (0.0%) |
| 75 Years and over | 43 (7.1%) | 0 (0.0%) |
| Total | 2,795 (61.6%) | 344 (12.3%) |
Employment Status by Educational Attainment in Presidio County
According to labor force statistics for Presidio County, 78.3% of individuals (1,871) out of the total population between 25 and 64 years of age (2,389) are in the labor force, with 10.3% or 193 of them being unemployed. The group with the highest labor force participation rate are those with the educational attainment of college / associate degree, with 95.2% or 432 individuals in the labor force. Within the labor force, individuals with high school diploma education have the highest percentage of unemployment, with 41.1% or 146 of them being unemployed.
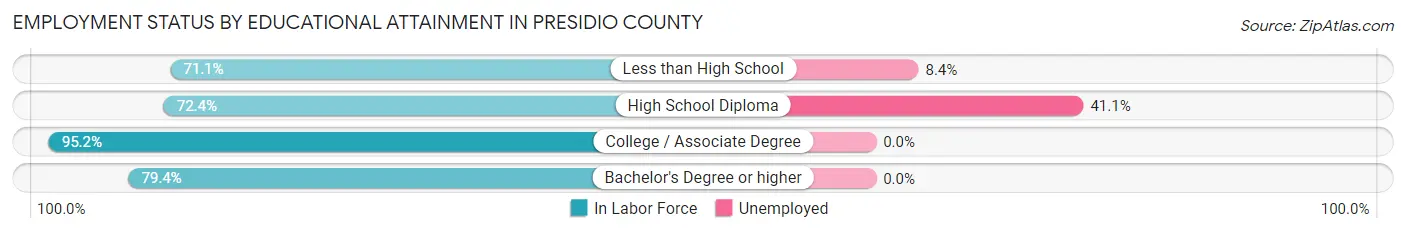
| Educational Attainment | In Labor Force | Unemployed |
| Less than High School | 545 (71.1%) | 64 (8.4%) |
| High School Diploma | 355 (72.4%) | 201 (41.1%) |
| College / Associate Degree | 432 (95.2%) | 0 (0.0%) |
| Bachelor's Degree or higher | 538 (79.4%) | 0 (0.0%) |
| Total | 1,871 (78.3%) | 246 (10.3%) |
Employment Occupations by Sex in Presidio County
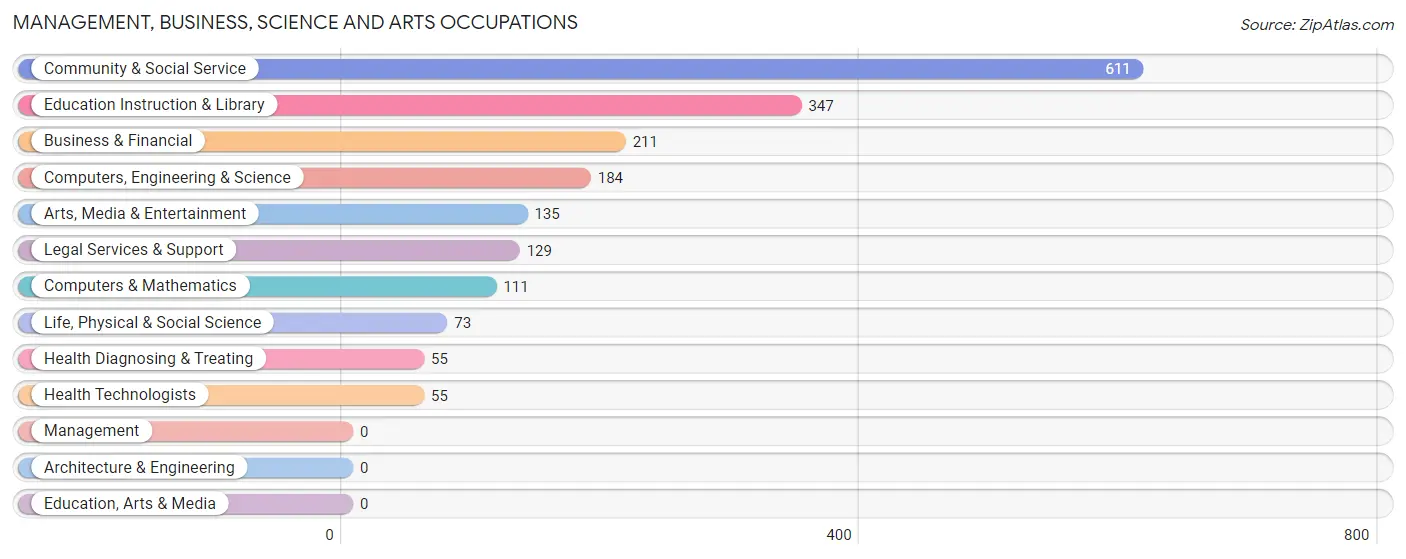
Management, Business, Science and Arts Occupations
The most common Management, Business, Science and Arts occupations in Presidio County are Community & Social Service (611 | 24.9%), Education Instruction & Library (347 | 14.2%), Business & Financial (211 | 8.6%), Computers, Engineering & Science (184 | 7.5%), and Arts, Media & Entertainment (135 | 5.5%).
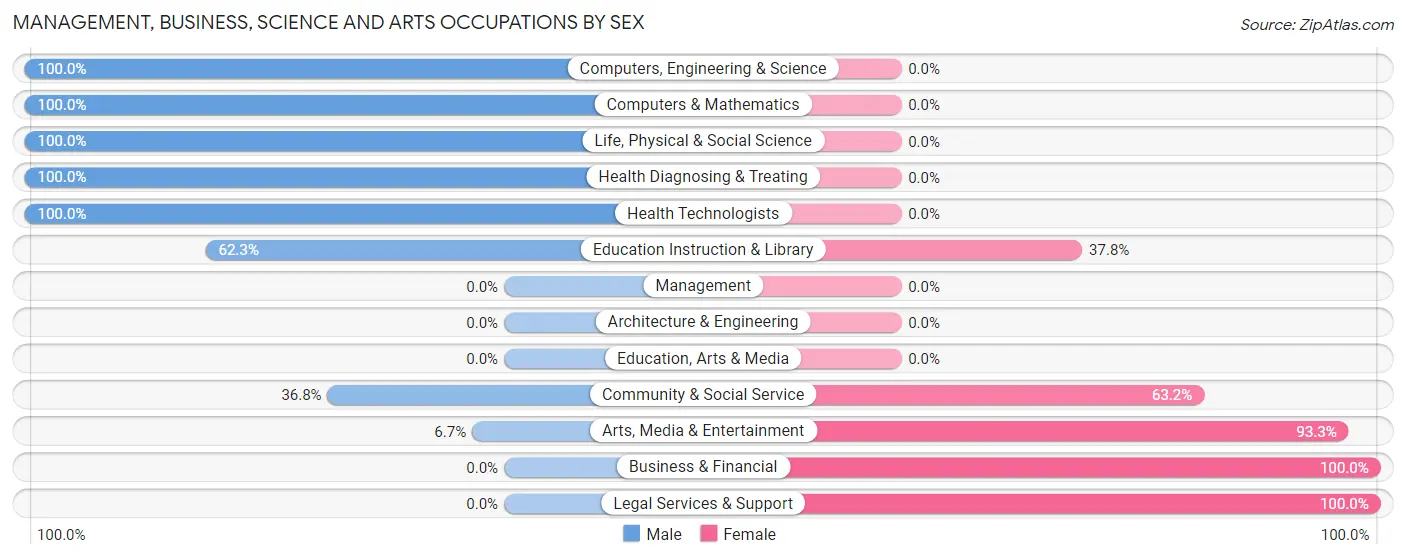
Management, Business, Science and Arts Occupations by Sex
Within the Management, Business, Science and Arts occupations in Presidio County, the most male-oriented occupations are Computers, Engineering & Science (100.0%), Computers & Mathematics (100.0%), and Life, Physical & Social Science (100.0%), while the most female-oriented occupations are Business & Financial (100.0%), Legal Services & Support (100.0%), and Arts, Media & Entertainment (93.3%).
| Occupation | Male | Female |
| Management | 0 (0.0%) | 0 (0.0%) |
| Business & Financial | 0 (0.0%) | 211 (100.0%) |
| Computers, Engineering & Science | 184 (100.0%) | 0 (0.0%) |
| Computers & Mathematics | 111 (100.0%) | 0 (0.0%) |
| Architecture & Engineering | 0 (0.0%) | 0 (0.0%) |
| Life, Physical & Social Science | 73 (100.0%) | 0 (0.0%) |
| Community & Social Service | 225 (36.8%) | 386 (63.2%) |
| Education, Arts & Media | 0 (0.0%) | 0 (0.0%) |
| Legal Services & Support | 0 (0.0%) | 129 (100.0%) |
| Education Instruction & Library | 216 (62.3%) | 131 (37.8%) |
| Arts, Media & Entertainment | 9 (6.7%) | 126 (93.3%) |
| Health Diagnosing & Treating | 55 (100.0%) | 0 (0.0%) |
| Health Technologists | 55 (100.0%) | 0 (0.0%) |
| Total (Category) | 464 (43.7%) | 597 (56.3%) |
| Total (Overall) | 1,395 (57.0%) | 1,054 (43.0%) |
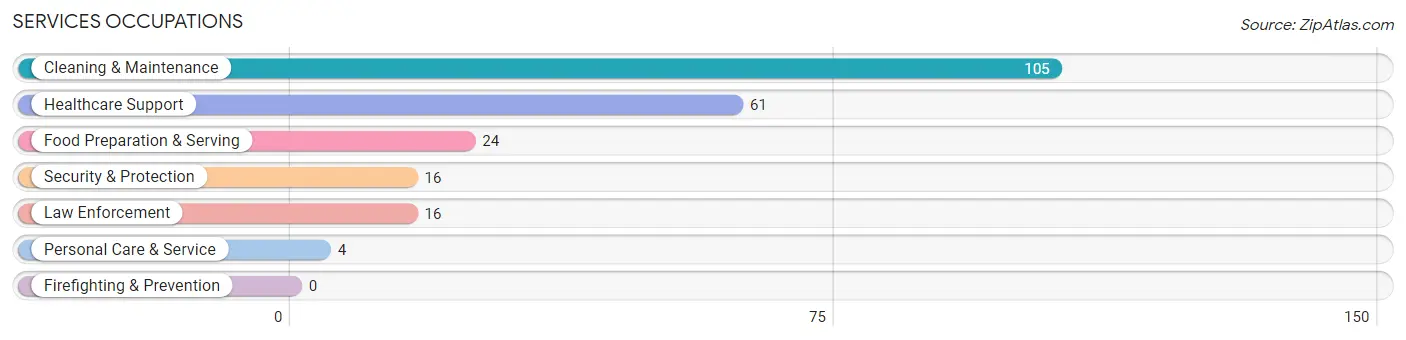
Services Occupations
The most common Services occupations in Presidio County are Cleaning & Maintenance (105 | 4.3%), Healthcare Support (61 | 2.5%), Food Preparation & Serving (24 | 1.0%), Security & Protection (16 | 0.6%), and Law Enforcement (16 | 0.6%).
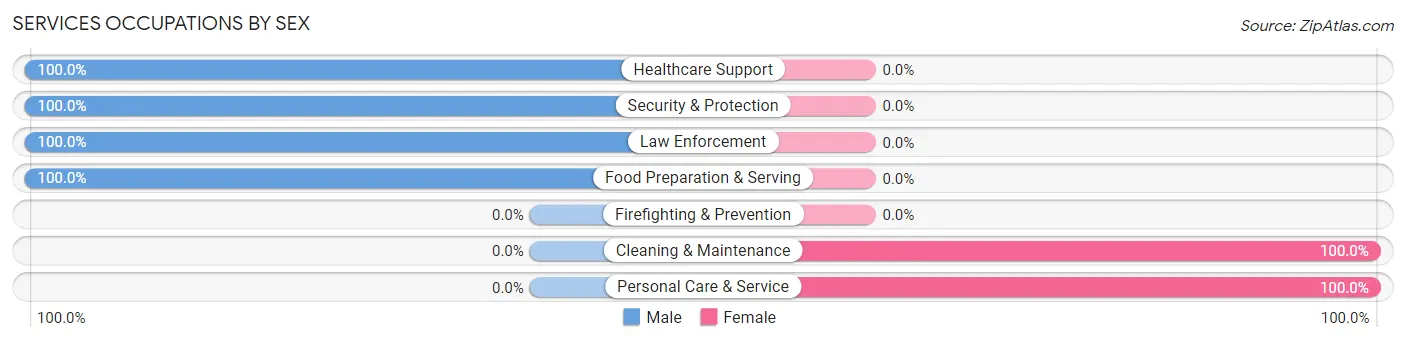
Services Occupations by Sex
Within the Services occupations in Presidio County, the most male-oriented occupations are Healthcare Support (100.0%), Security & Protection (100.0%), and Law Enforcement (100.0%), while the most female-oriented occupations are Cleaning & Maintenance (100.0%), and Personal Care & Service (100.0%).
| Occupation | Male | Female |
| Healthcare Support | 61 (100.0%) | 0 (0.0%) |
| Security & Protection | 16 (100.0%) | 0 (0.0%) |
| Firefighting & Prevention | 0 (0.0%) | 0 (0.0%) |
| Law Enforcement | 16 (100.0%) | 0 (0.0%) |
| Food Preparation & Serving | 24 (100.0%) | 0 (0.0%) |
| Cleaning & Maintenance | 0 (0.0%) | 105 (100.0%) |
| Personal Care & Service | 0 (0.0%) | 4 (100.0%) |
| Total (Category) | 101 (48.1%) | 109 (51.9%) |
| Total (Overall) | 1,395 (57.0%) | 1,054 (43.0%) |
Sales and Office Occupations
The most common Sales and Office occupations in Presidio County are Sales & Related (296 | 12.1%), and Office & Administration (66 | 2.7%).
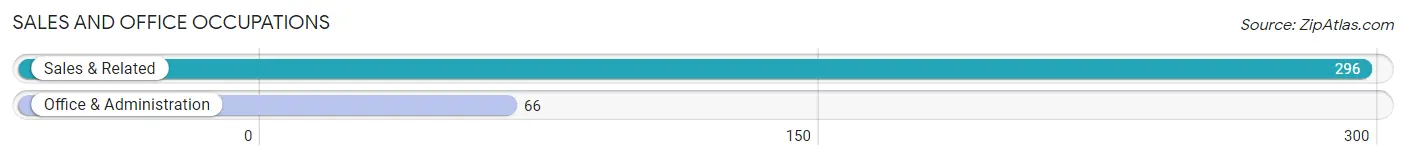
Sales and Office Occupations by Sex

| Occupation | Male | Female |
| Sales & Related | 47 (15.9%) | 249 (84.1%) |
| Office & Administration | 13 (19.7%) | 53 (80.3%) |
| Total (Category) | 60 (16.6%) | 302 (83.4%) |
| Total (Overall) | 1,395 (57.0%) | 1,054 (43.0%) |
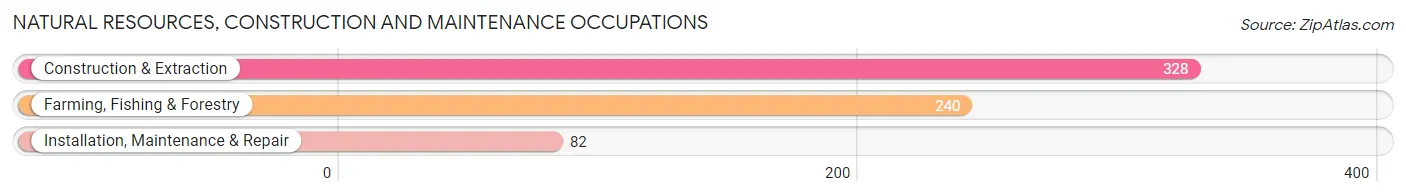
Natural Resources, Construction and Maintenance Occupations
The most common Natural Resources, Construction and Maintenance occupations in Presidio County are Construction & Extraction (328 | 13.4%), Farming, Fishing & Forestry (240 | 9.8%), and Installation, Maintenance & Repair (82 | 3.4%).
Natural Resources, Construction and Maintenance Occupations by Sex
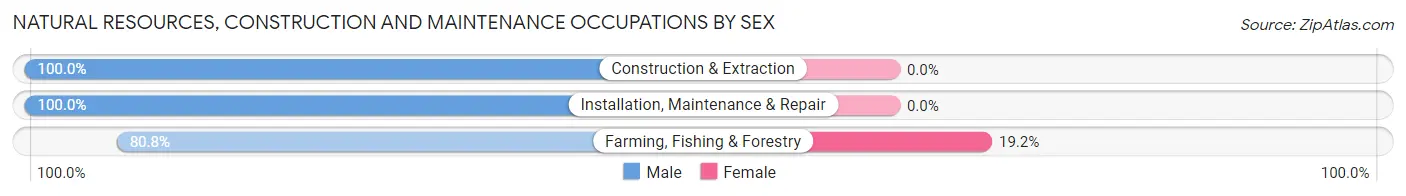
| Occupation | Male | Female |
| Farming, Fishing & Forestry | 194 (80.8%) | 46 (19.2%) |
| Construction & Extraction | 328 (100.0%) | 0 (0.0%) |
| Installation, Maintenance & Repair | 82 (100.0%) | 0 (0.0%) |
| Total (Category) | 604 (92.9%) | 46 (7.1%) |
| Total (Overall) | 1,395 (57.0%) | 1,054 (43.0%) |
Production, Transportation and Moving Occupations
The most common Production, Transportation and Moving occupations in Presidio County are Production (154 | 6.3%), and Transportation (12 | 0.5%).
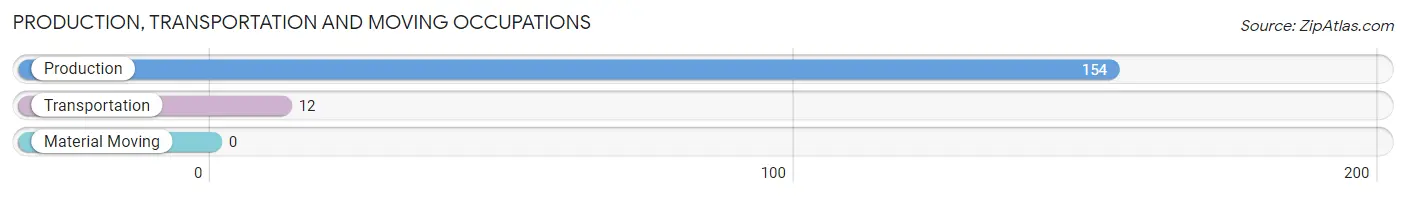
Production, Transportation and Moving Occupations by Sex
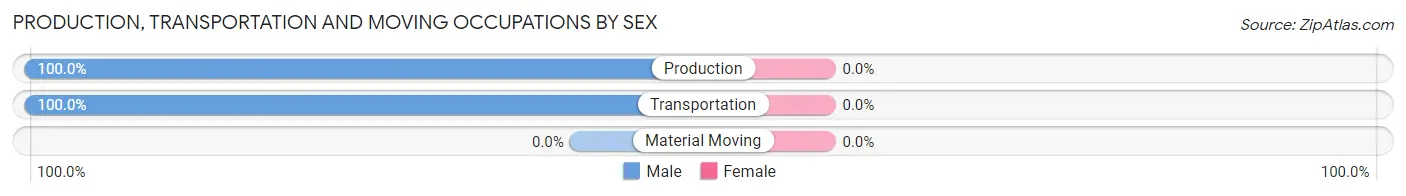
| Occupation | Male | Female |
| Production | 154 (100.0%) | 0 (0.0%) |
| Transportation | 12 (100.0%) | 0 (0.0%) |
| Material Moving | 0 (0.0%) | 0 (0.0%) |
| Total (Category) | 166 (100.0%) | 0 (0.0%) |
| Total (Overall) | 1,395 (57.0%) | 1,054 (43.0%) |
Employment Industries by Sex in Presidio County
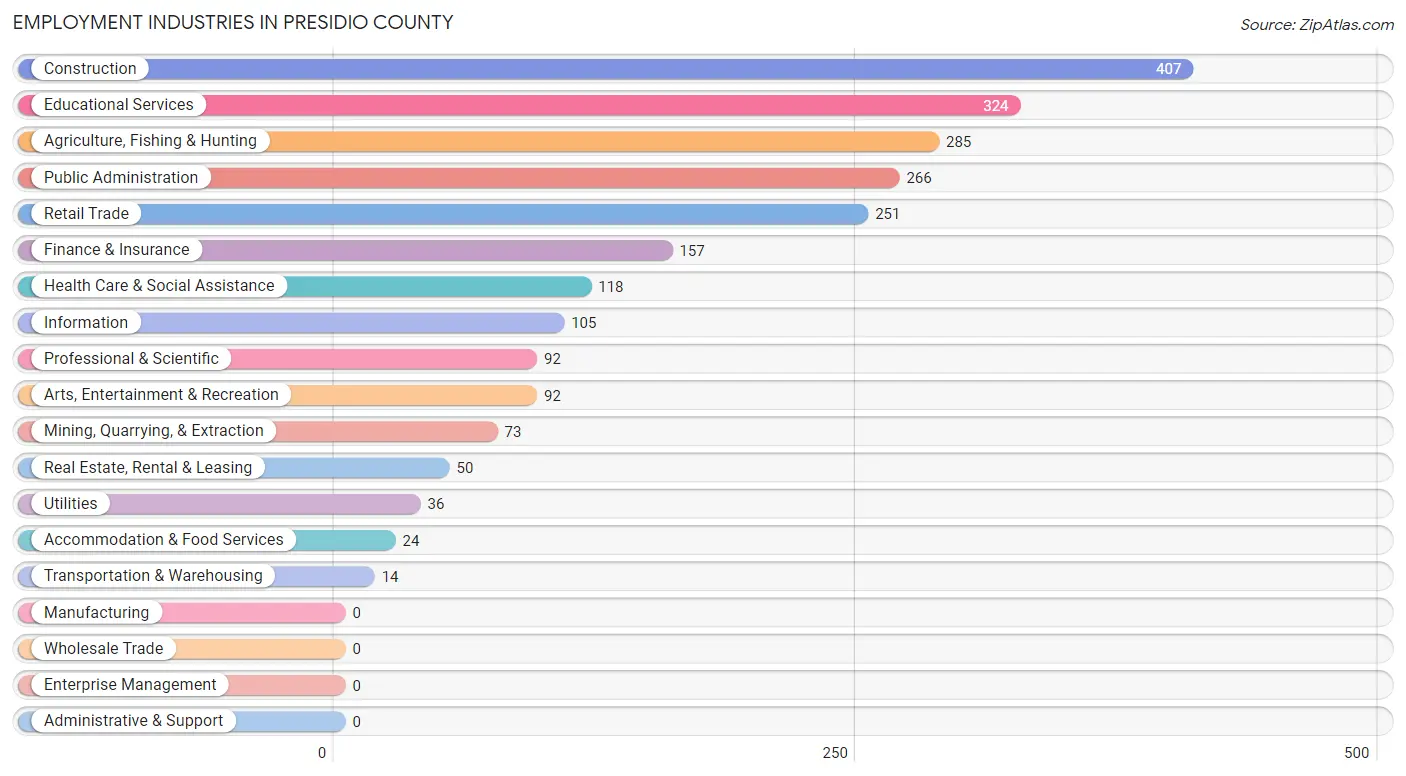
Employment Industries in Presidio County
The major employment industries in Presidio County include Construction (407 | 16.6%), Educational Services (324 | 13.2%), Agriculture, Fishing & Hunting (285 | 11.6%), Public Administration (266 | 10.9%), and Retail Trade (251 | 10.2%).
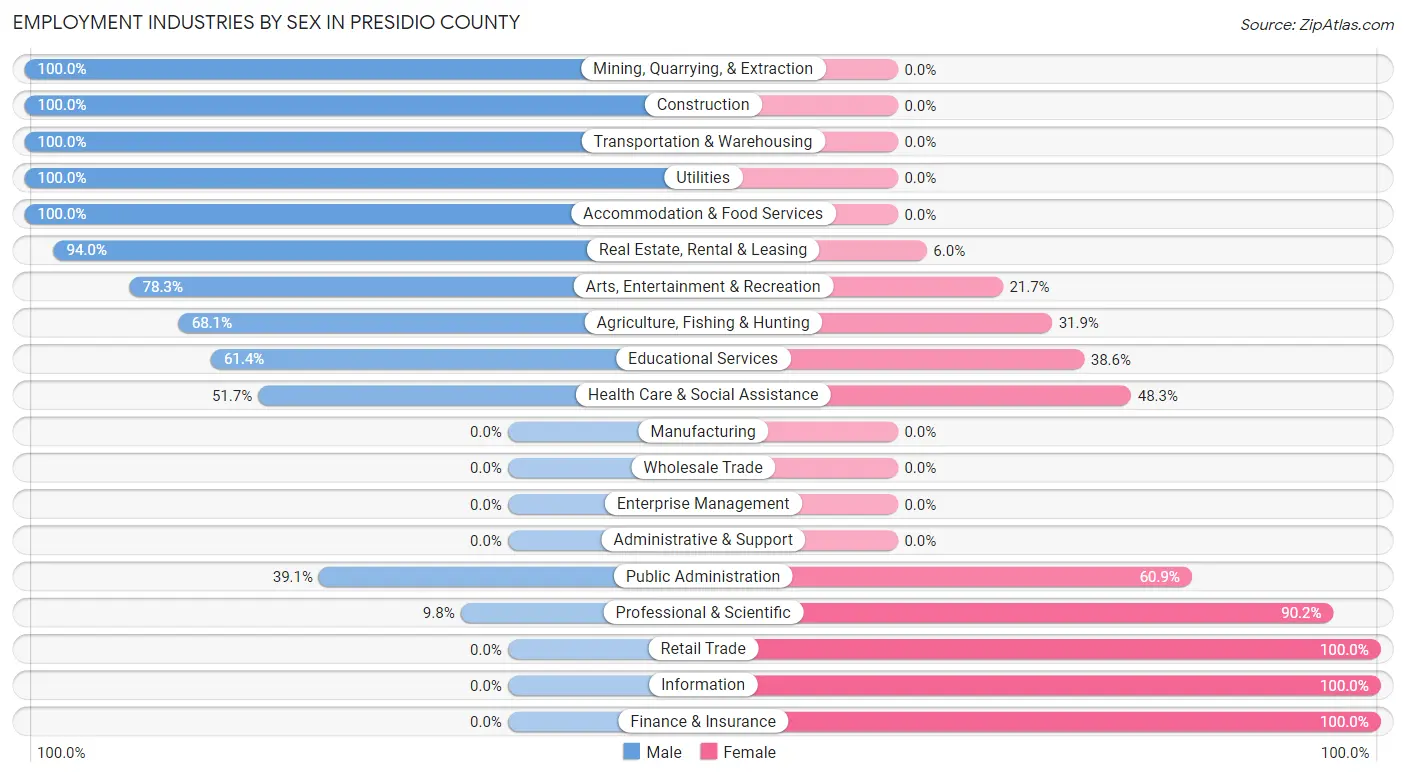
Employment Industries by Sex in Presidio County
The Presidio County industries that see more men than women are Mining, Quarrying, & Extraction (100.0%), Construction (100.0%), and Transportation & Warehousing (100.0%), whereas the industries that tend to have a higher number of women are Retail Trade (100.0%), Information (100.0%), and Finance & Insurance (100.0%).
| Industry | Male | Female |
| Agriculture, Fishing & Hunting | 194 (68.1%) | 91 (31.9%) |
| Mining, Quarrying, & Extraction | 73 (100.0%) | 0 (0.0%) |
| Construction | 407 (100.0%) | 0 (0.0%) |
| Manufacturing | 0 (0.0%) | 0 (0.0%) |
| Wholesale Trade | 0 (0.0%) | 0 (0.0%) |
| Retail Trade | 0 (0.0%) | 251 (100.0%) |
| Transportation & Warehousing | 14 (100.0%) | 0 (0.0%) |
| Utilities | 36 (100.0%) | 0 (0.0%) |
| Information | 0 (0.0%) | 105 (100.0%) |
| Finance & Insurance | 0 (0.0%) | 157 (100.0%) |
| Real Estate, Rental & Leasing | 47 (94.0%) | 3 (6.0%) |
| Professional & Scientific | 9 (9.8%) | 83 (90.2%) |
| Enterprise Management | 0 (0.0%) | 0 (0.0%) |
| Administrative & Support | 0 (0.0%) | 0 (0.0%) |
| Educational Services | 199 (61.4%) | 125 (38.6%) |
| Health Care & Social Assistance | 61 (51.7%) | 57 (48.3%) |
| Arts, Entertainment & Recreation | 72 (78.3%) | 20 (21.7%) |
| Accommodation & Food Services | 24 (100.0%) | 0 (0.0%) |
| Public Administration | 104 (39.1%) | 162 (60.9%) |
| Total | 1,395 (57.0%) | 1,054 (43.0%) |
Education in Presidio County
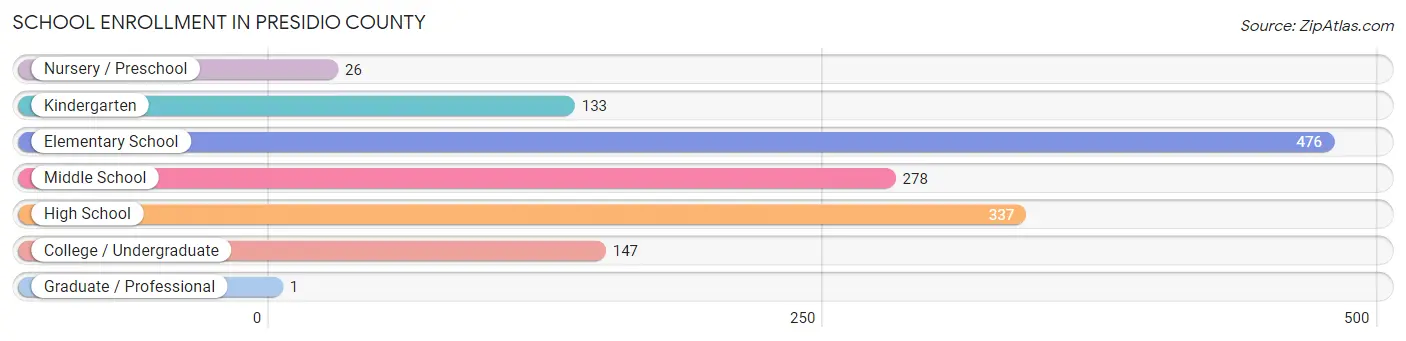
School Enrollment in Presidio County
The most common levels of schooling among the 1,398 students in Presidio County are elementary school (476 | 34.1%), high school (337 | 24.1%), and middle school (278 | 19.9%).
| School Level | # Students | % Students |
| Nursery / Preschool | 26 | 1.9% |
| Kindergarten | 133 | 9.5% |
| Elementary School | 476 | 34.1% |
| Middle School | 278 | 19.9% |
| High School | 337 | 24.1% |
| College / Undergraduate | 147 | 10.5% |
| Graduate / Professional | 1 | 0.1% |
| Total | 1,398 | 100.0% |
School Enrollment by Age by Funding Source in Presidio County
Out of a total of 1,398 students who are enrolled in schools in Presidio County, 200 (14.3%) attend a private institution, while the remaining 1,198 (85.7%) are enrolled in public schools. The age group of 20 to 24 year olds has the highest likelihood of being enrolled in private schools, with 1 (100.0% in the age bracket) enrolled. Conversely, the age group of 10 to 14 year olds has the lowest likelihood of being enrolled in a private school, with 281 (100.0% in the age bracket) attending a public institution.
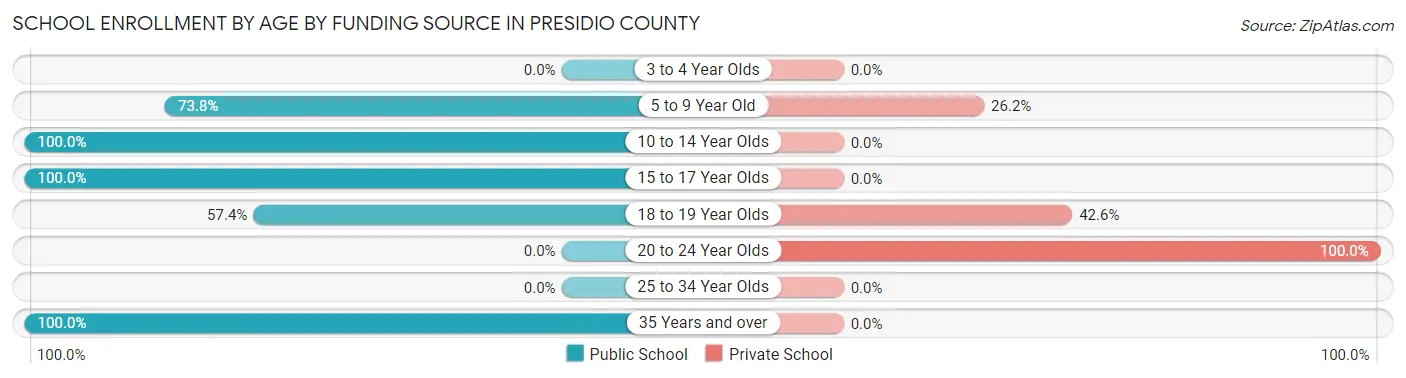
| Age Bracket | Public School | Private School |
| 3 to 4 Year Olds | 0 (0.0%) | 0 (0.0%) |
| 5 to 9 Year Old | 440 (73.8%) | 156 (26.2%) |
| 10 to 14 Year Olds | 281 (100.0%) | 0 (0.0%) |
| 15 to 17 Year Olds | 317 (100.0%) | 0 (0.0%) |
| 18 to 19 Year Olds | 58 (57.4%) | 43 (42.6%) |
| 20 to 24 Year Olds | 0 (0.0%) | 1 (100.0%) |
| 25 to 34 Year Olds | 0 (0.0%) | 0 (0.0%) |
| 35 Years and over | 102 (100.0%) | 0 (0.0%) |
| Total | 1,198 (85.7%) | 200 (14.3%) |
Educational Attainment by Field of Study in Presidio County
Visual & performing arts (231 | 28.7%), literature & languages (205 | 25.5%), education (172 | 21.4%), arts & humanities (92 | 11.4%), and social sciences (36 | 4.5%) are the most common fields of study among 805 individuals in Presidio County who have obtained a bachelor's degree or higher.
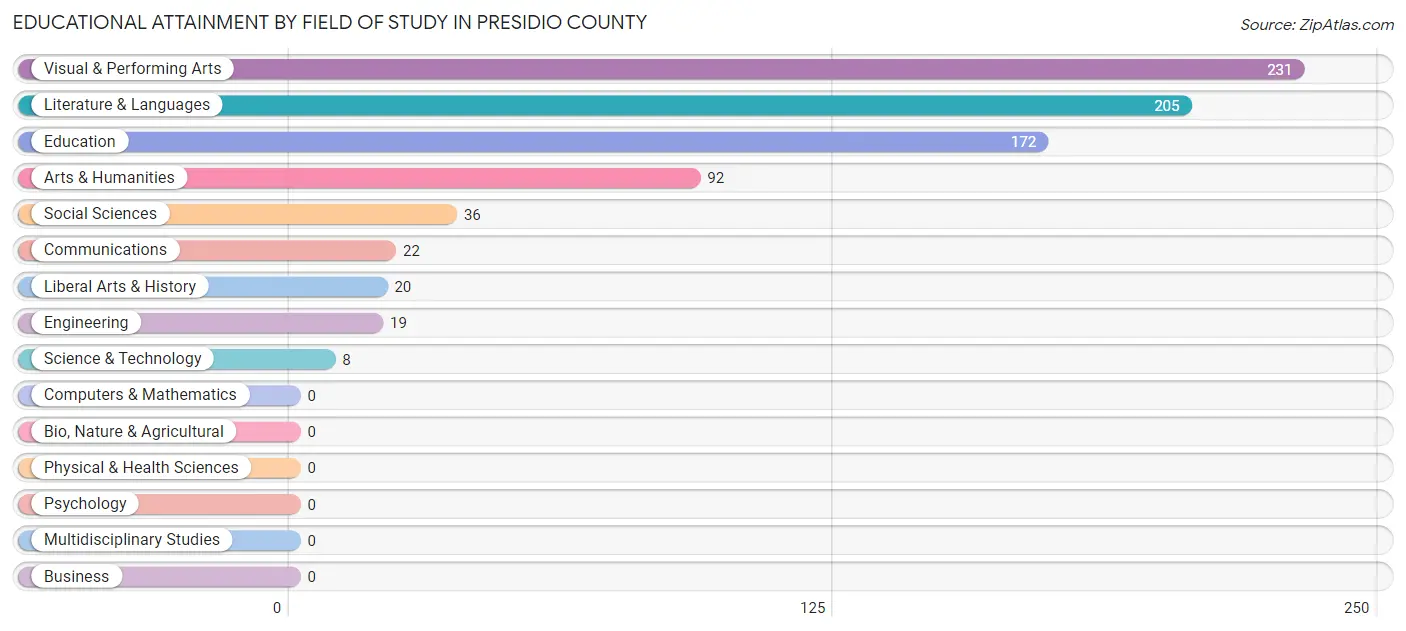
| Field of Study | # Graduates | % Graduates |
| Computers & Mathematics | 0 | 0.0% |
| Bio, Nature & Agricultural | 0 | 0.0% |
| Physical & Health Sciences | 0 | 0.0% |
| Psychology | 0 | 0.0% |
| Social Sciences | 36 | 4.5% |
| Engineering | 19 | 2.4% |
| Multidisciplinary Studies | 0 | 0.0% |
| Science & Technology | 8 | 1.0% |
| Business | 0 | 0.0% |
| Education | 172 | 21.4% |
| Literature & Languages | 205 | 25.5% |
| Liberal Arts & History | 20 | 2.5% |
| Visual & Performing Arts | 231 | 28.7% |
| Communications | 22 | 2.7% |
| Arts & Humanities | 92 | 11.4% |
| Total | 805 | 100.0% |
Transportation & Commute in Presidio County
Vehicle Availability by Sex in Presidio County
The most prevalent vehicle ownership categories in Presidio County are males with 1 vehicle (381, accounting for 27.3%) and females with 1 vehicle (208, making up 36.1%).
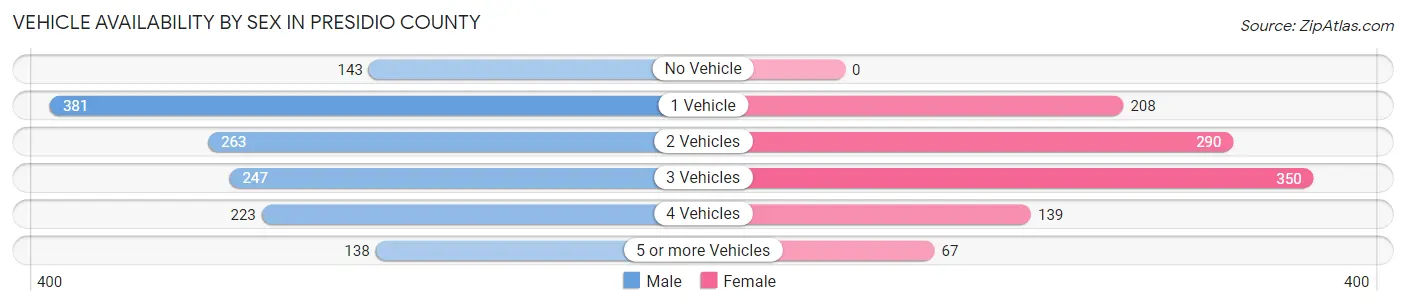
| Vehicles Available | Male | Female |
| No Vehicle | 143 (10.2%) | 0 (0.0%) |
| 1 Vehicle | 381 (27.3%) | 208 (19.7%) |
| 2 Vehicles | 263 (18.9%) | 290 (27.5%) |
| 3 Vehicles | 247 (17.7%) | 350 (33.2%) |
| 4 Vehicles | 223 (16.0%) | 139 (13.2%) |
| 5 or more Vehicles | 138 (9.9%) | 67 (6.4%) |
| Total | 1,395 (100.0%) | 1,054 (100.0%) |
Commute Time in Presidio County
The most frequently occuring commute durations in Presidio County are 5 to 9 minutes (996 commuters, 43.3%), less than 5 minutes (671 commuters, 29.2%), and 10 to 14 minutes (372 commuters, 16.2%).
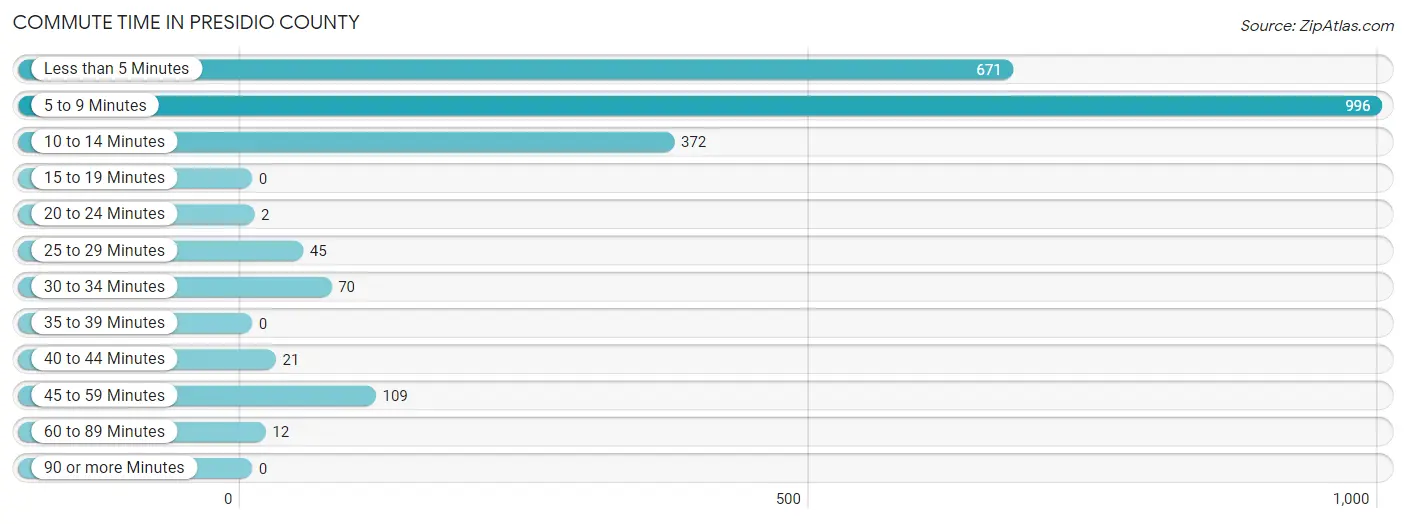
| Commute Time | # Commuters | % Commuters |
| Less than 5 Minutes | 671 | 29.2% |
| 5 to 9 Minutes | 996 | 43.3% |
| 10 to 14 Minutes | 372 | 16.2% |
| 15 to 19 Minutes | 0 | 0.0% |
| 20 to 24 Minutes | 2 | 0.1% |
| 25 to 29 Minutes | 45 | 2.0% |
| 30 to 34 Minutes | 70 | 3.0% |
| 35 to 39 Minutes | 0 | 0.0% |
| 40 to 44 Minutes | 21 | 0.9% |
| 45 to 59 Minutes | 109 | 4.7% |
| 60 to 89 Minutes | 12 | 0.5% |
| 90 or more Minutes | 0 | 0.0% |
Commute Time by Sex in Presidio County
The most common commute times in Presidio County are 5 to 9 minutes (436 commuters, 32.9%) for males and 5 to 9 minutes (560 commuters, 57.7%) for females.
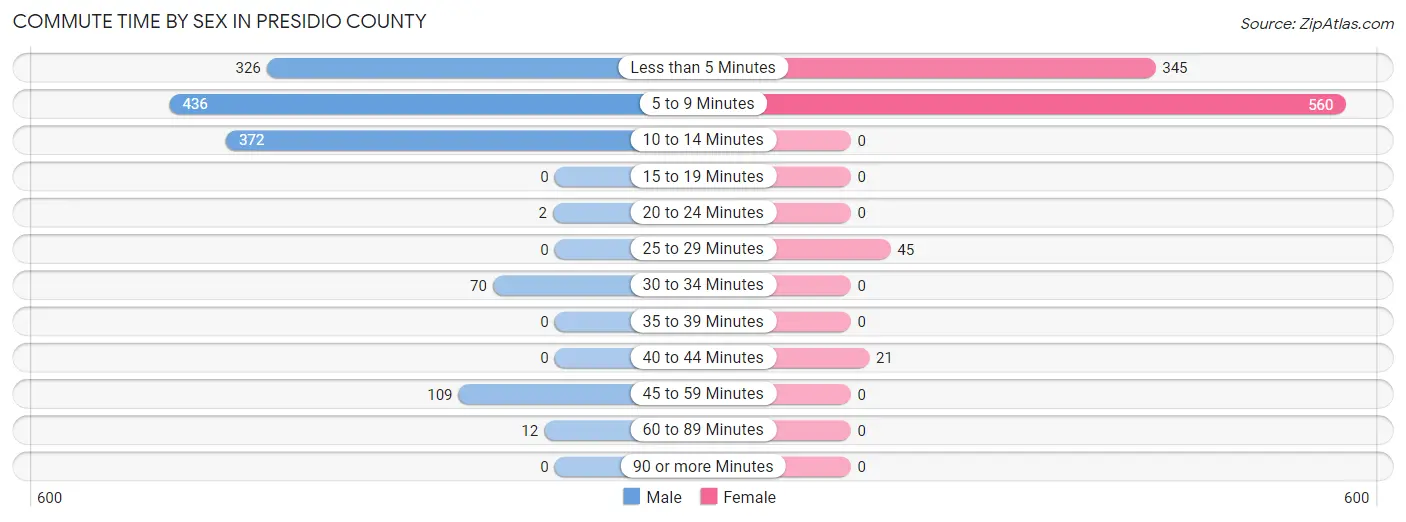
| Commute Time | Male | Female |
| Less than 5 Minutes | 326 (24.6%) | 345 (35.5%) |
| 5 to 9 Minutes | 436 (32.9%) | 560 (57.7%) |
| 10 to 14 Minutes | 372 (28.0%) | 0 (0.0%) |
| 15 to 19 Minutes | 0 (0.0%) | 0 (0.0%) |
| 20 to 24 Minutes | 2 (0.2%) | 0 (0.0%) |
| 25 to 29 Minutes | 0 (0.0%) | 45 (4.6%) |
| 30 to 34 Minutes | 70 (5.3%) | 0 (0.0%) |
| 35 to 39 Minutes | 0 (0.0%) | 0 (0.0%) |
| 40 to 44 Minutes | 0 (0.0%) | 21 (2.2%) |
| 45 to 59 Minutes | 109 (8.2%) | 0 (0.0%) |
| 60 to 89 Minutes | 12 (0.9%) | 0 (0.0%) |
| 90 or more Minutes | 0 (0.0%) | 0 (0.0%) |
Time of Departure to Work by Sex in Presidio County
The most frequent times of departure to work in Presidio County are 7:00 AM to 7:29 AM (269, 20.3%) for males and 7:30 AM to 7:59 AM (521, 53.7%) for females.
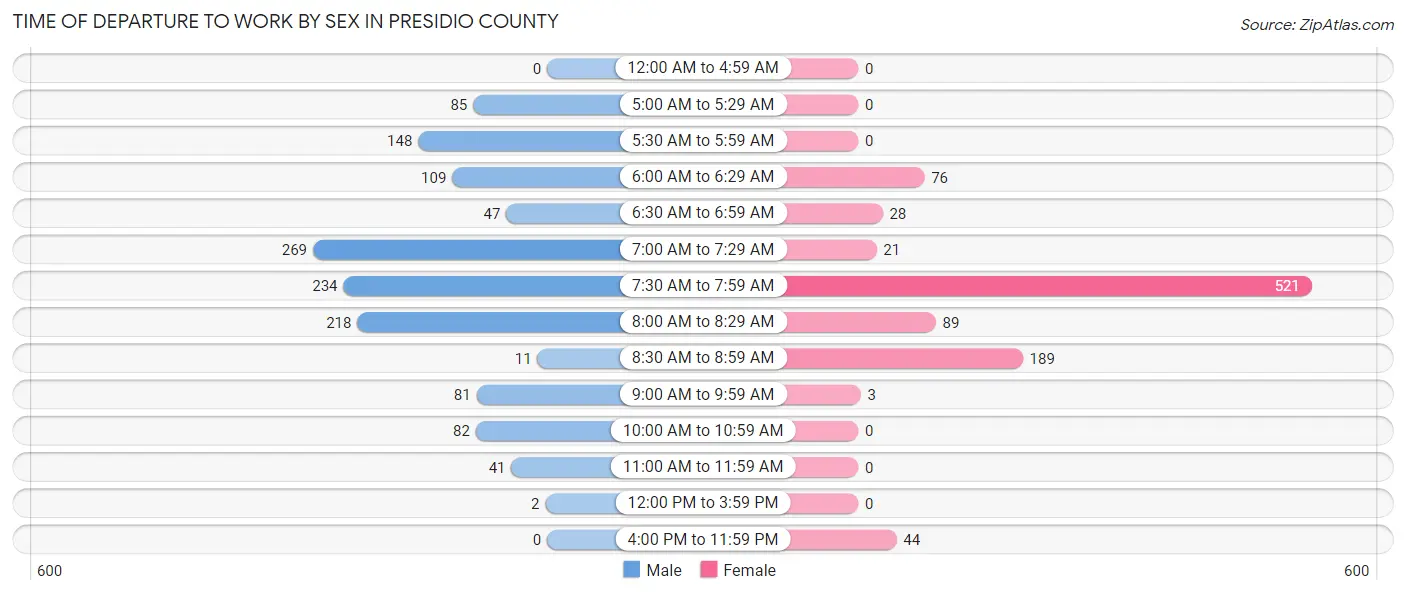
| Time of Departure | Male | Female |
| 12:00 AM to 4:59 AM | 0 (0.0%) | 0 (0.0%) |
| 5:00 AM to 5:29 AM | 85 (6.4%) | 0 (0.0%) |
| 5:30 AM to 5:59 AM | 148 (11.2%) | 0 (0.0%) |
| 6:00 AM to 6:29 AM | 109 (8.2%) | 76 (7.8%) |
| 6:30 AM to 6:59 AM | 47 (3.5%) | 28 (2.9%) |
| 7:00 AM to 7:29 AM | 269 (20.3%) | 21 (2.2%) |
| 7:30 AM to 7:59 AM | 234 (17.6%) | 521 (53.7%) |
| 8:00 AM to 8:29 AM | 218 (16.4%) | 89 (9.2%) |
| 8:30 AM to 8:59 AM | 11 (0.8%) | 189 (19.5%) |
| 9:00 AM to 9:59 AM | 81 (6.1%) | 3 (0.3%) |
| 10:00 AM to 10:59 AM | 82 (6.2%) | 0 (0.0%) |
| 11:00 AM to 11:59 AM | 41 (3.1%) | 0 (0.0%) |
| 12:00 PM to 3:59 PM | 2 (0.2%) | 0 (0.0%) |
| 4:00 PM to 11:59 PM | 0 (0.0%) | 44 (4.5%) |
| Total | 1,327 (100.0%) | 971 (100.0%) |
Housing Occupancy in Presidio County
Occupancy by Ownership in Presidio County
Of the total 2,275 dwellings in Presidio County, owner-occupied units account for 1,683 (74.0%), while renter-occupied units make up 592 (26.0%).
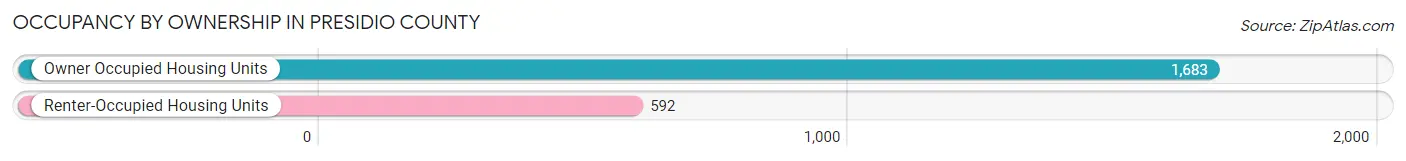
| Occupancy | # Housing Units | % Housing Units |
| Owner Occupied Housing Units | 1,683 | 74.0% |
| Renter-Occupied Housing Units | 592 | 26.0% |
| Total Occupied Housing Units | 2,275 | 100.0% |
Occupancy by Household Size in Presidio County
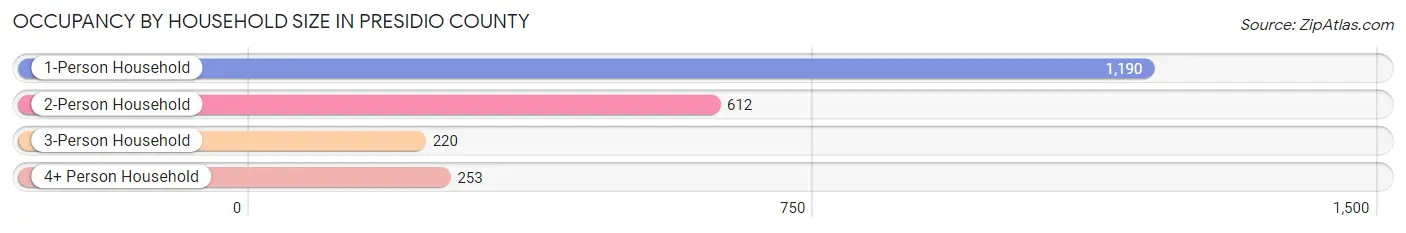
| Household Size | # Housing Units | % Housing Units |
| 1-Person Household | 1,190 | 52.3% |
| 2-Person Household | 612 | 26.9% |
| 3-Person Household | 220 | 9.7% |
| 4+ Person Household | 253 | 11.1% |
| Total Housing Units | 2,275 | 100.0% |
Occupancy by Ownership by Household Size in Presidio County
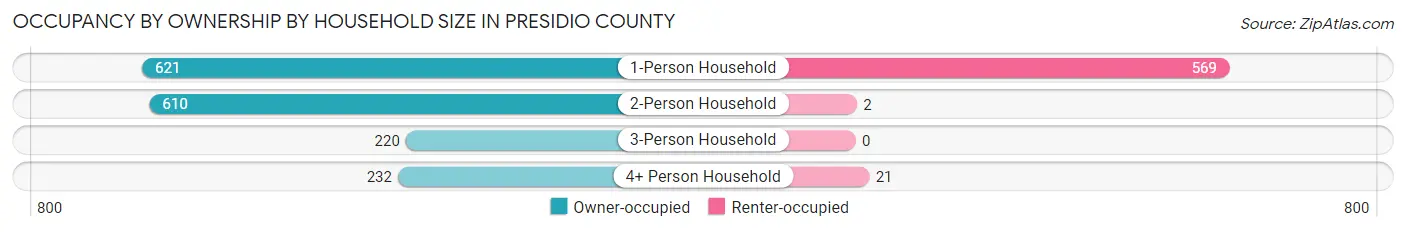
| Household Size | Owner-occupied | Renter-occupied |
| 1-Person Household | 621 (52.2%) | 569 (47.8%) |
| 2-Person Household | 610 (99.7%) | 2 (0.3%) |
| 3-Person Household | 220 (100.0%) | 0 (0.0%) |
| 4+ Person Household | 232 (91.7%) | 21 (8.3%) |
| Total Housing Units | 1,683 (74.0%) | 592 (26.0%) |
Occupancy by Educational Attainment in Presidio County
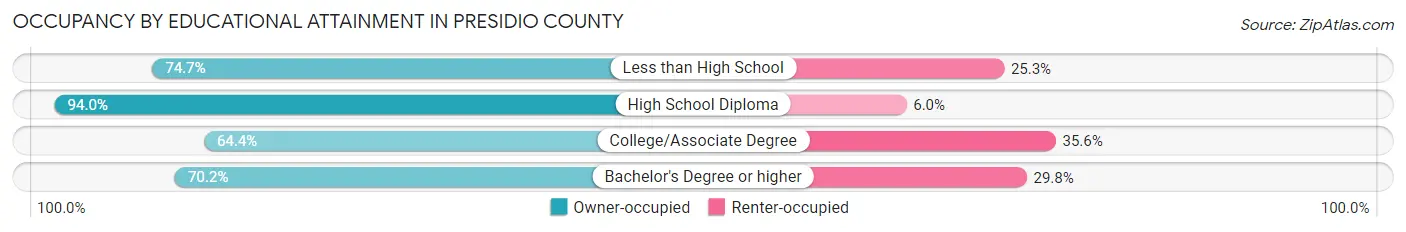
| Household Size | Owner-occupied | Renter-occupied |
| Less than High School | 613 (74.7%) | 208 (25.3%) |
| High School Diploma | 331 (94.0%) | 21 (6.0%) |
| College/Associate Degree | 386 (64.4%) | 213 (35.6%) |
| Bachelor's Degree or higher | 353 (70.2%) | 150 (29.8%) |
Occupancy by Age of Householder in Presidio County
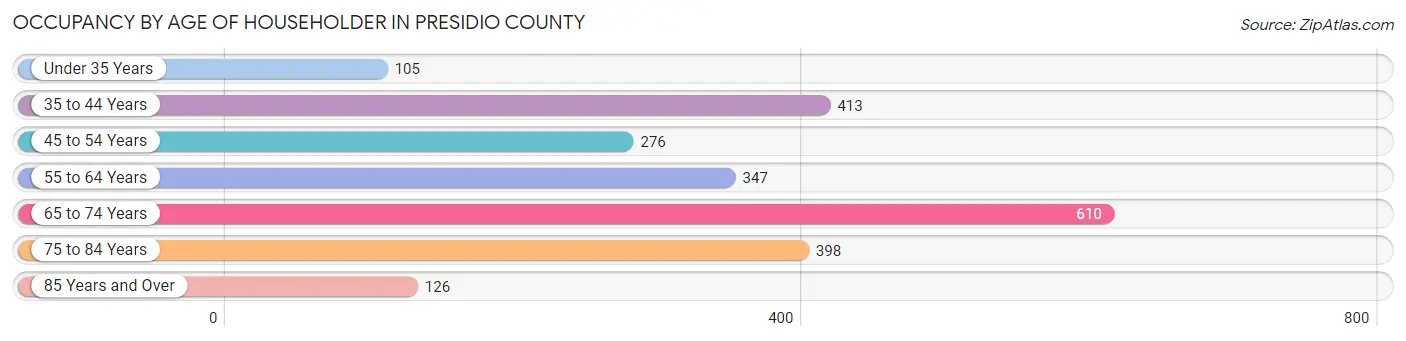
| Age Bracket | # Households | % Households |
| Under 35 Years | 105 | 4.6% |
| 35 to 44 Years | 413 | 18.1% |
| 45 to 54 Years | 276 | 12.1% |
| 55 to 64 Years | 347 | 15.2% |
| 65 to 74 Years | 610 | 26.8% |
| 75 to 84 Years | 398 | 17.5% |
| 85 Years and Over | 126 | 5.5% |
| Total | 2,275 | 100.0% |
Housing Finances in Presidio County
Median Income by Occupancy in Presidio County
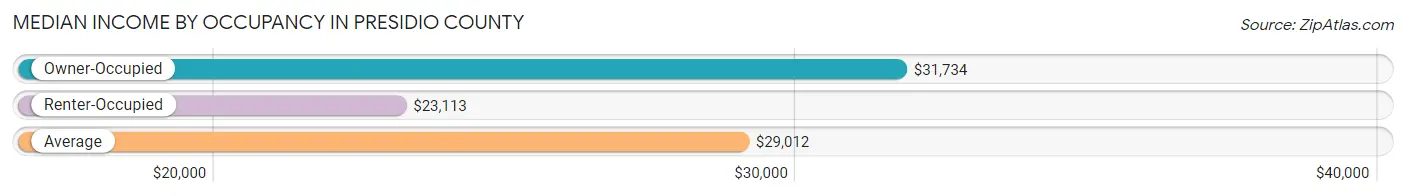
| Occupancy Type | # Households | Median Income |
| Owner-Occupied | 1,683 (74.0%) | $31,734 |
| Renter-Occupied | 592 (26.0%) | $23,113 |
| Average | 2,275 (100.0%) | $29,012 |
Occupancy by Householder Income Bracket in Presidio County
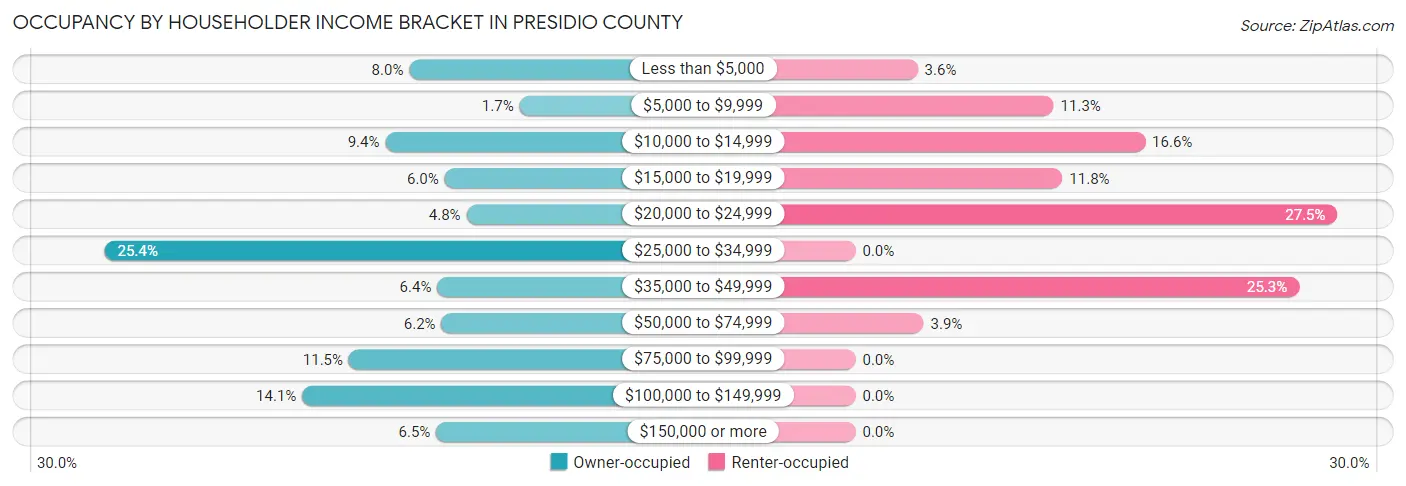
| Income Bracket | Owner-occupied | Renter-occupied |
| Less than $5,000 | 135 (8.0%) | 21 (3.5%) |
| $5,000 to $9,999 | 29 (1.7%) | 67 (11.3%) |
| $10,000 to $14,999 | 158 (9.4%) | 98 (16.6%) |
| $15,000 to $19,999 | 101 (6.0%) | 70 (11.8%) |
| $20,000 to $24,999 | 80 (4.8%) | 163 (27.5%) |
| $25,000 to $34,999 | 428 (25.4%) | 0 (0.0%) |
| $35,000 to $49,999 | 108 (6.4%) | 150 (25.3%) |
| $50,000 to $74,999 | 104 (6.2%) | 23 (3.9%) |
| $75,000 to $99,999 | 193 (11.5%) | 0 (0.0%) |
| $100,000 to $149,999 | 238 (14.1%) | 0 (0.0%) |
| $150,000 or more | 109 (6.5%) | 0 (0.0%) |
| Total | 1,683 (100.0%) | 592 (100.0%) |
Monthly Housing Cost Tiers in Presidio County
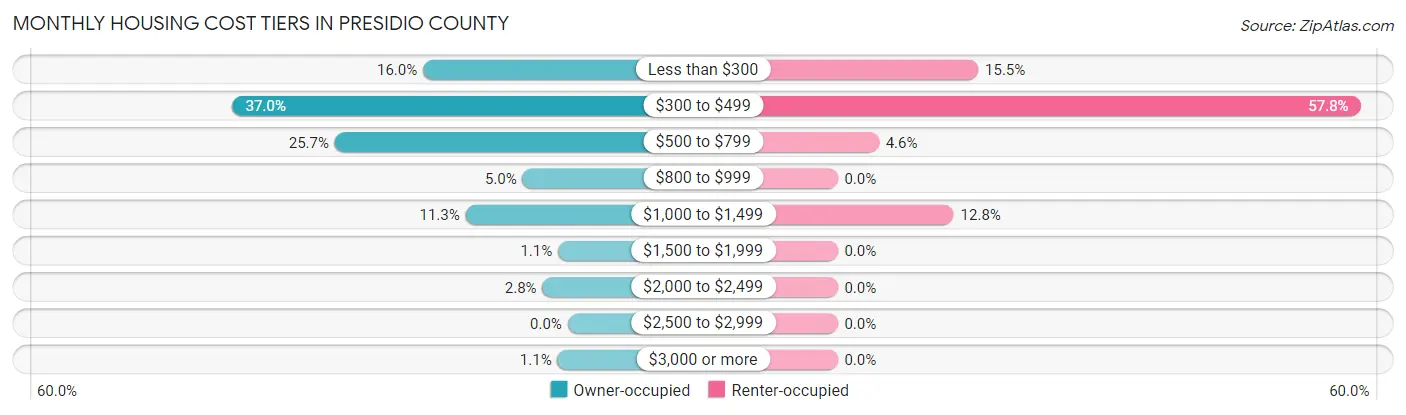
| Monthly Cost | Owner-occupied | Renter-occupied |
| Less than $300 | 269 (16.0%) | 92 (15.5%) |
| $300 to $499 | 623 (37.0%) | 342 (57.8%) |
| $500 to $799 | 433 (25.7%) | 27 (4.6%) |
| $800 to $999 | 84 (5.0%) | 0 (0.0%) |
| $1,000 to $1,499 | 190 (11.3%) | 76 (12.8%) |
| $1,500 to $1,999 | 18 (1.1%) | 0 (0.0%) |
| $2,000 to $2,499 | 47 (2.8%) | 0 (0.0%) |
| $2,500 to $2,999 | 0 (0.0%) | 0 (0.0%) |
| $3,000 or more | 19 (1.1%) | 0 (0.0%) |
| Total | 1,683 (100.0%) | 592 (100.0%) |
Physical Housing Characteristics in Presidio County
Housing Structures in Presidio County
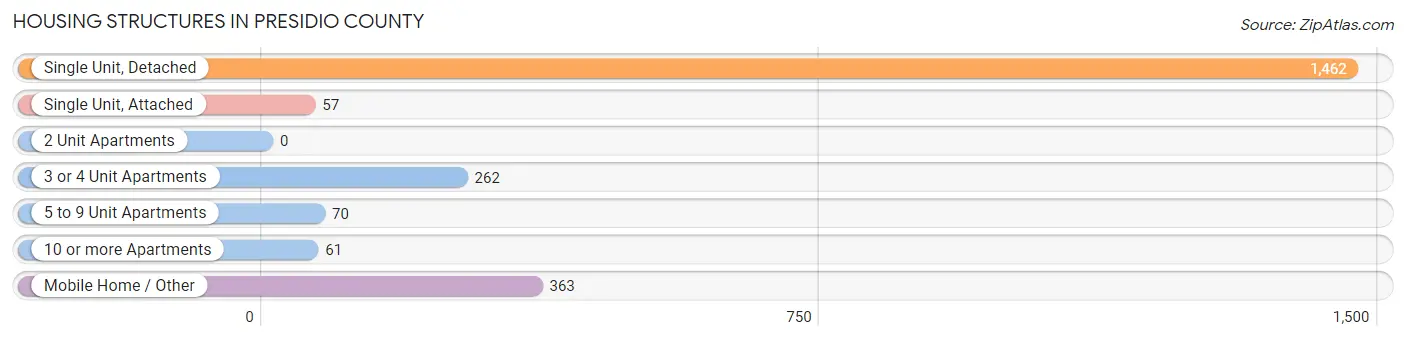
| Structure Type | # Housing Units | % Housing Units |
| Single Unit, Detached | 1,462 | 64.3% |
| Single Unit, Attached | 57 | 2.5% |
| 2 Unit Apartments | 0 | 0.0% |
| 3 or 4 Unit Apartments | 262 | 11.5% |
| 5 to 9 Unit Apartments | 70 | 3.1% |
| 10 or more Apartments | 61 | 2.7% |
| Mobile Home / Other | 363 | 16.0% |
| Total | 2,275 | 100.0% |
Housing Structures by Occupancy in Presidio County
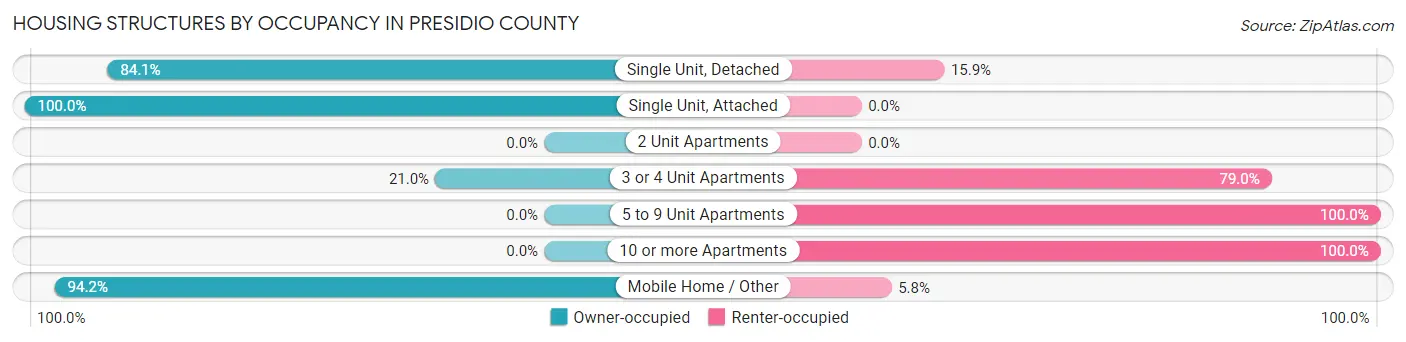
| Structure Type | Owner-occupied | Renter-occupied |
| Single Unit, Detached | 1,229 (84.1%) | 233 (15.9%) |
| Single Unit, Attached | 57 (100.0%) | 0 (0.0%) |
| 2 Unit Apartments | 0 (0.0%) | 0 (0.0%) |
| 3 or 4 Unit Apartments | 55 (21.0%) | 207 (79.0%) |
| 5 to 9 Unit Apartments | 0 (0.0%) | 70 (100.0%) |
| 10 or more Apartments | 0 (0.0%) | 61 (100.0%) |
| Mobile Home / Other | 342 (94.2%) | 21 (5.8%) |
| Total | 1,683 (74.0%) | 592 (26.0%) |
Housing Structures by Number of Rooms in Presidio County
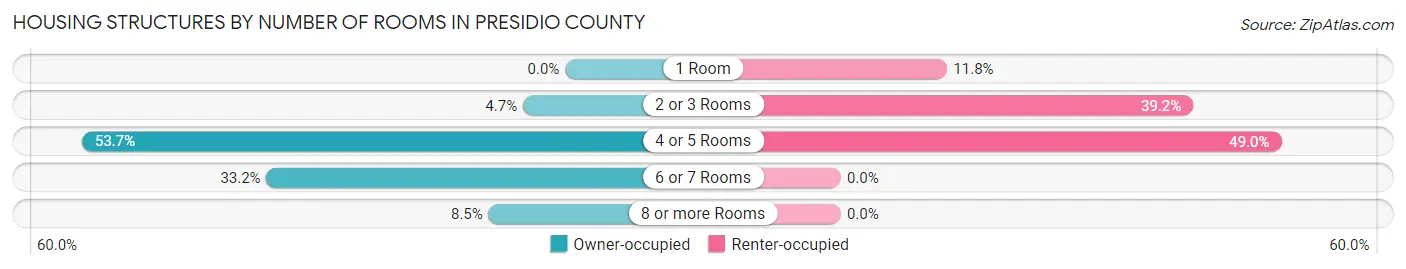
| Number of Rooms | Owner-occupied | Renter-occupied |
| 1 Room | 0 (0.0%) | 70 (11.8%) |
| 2 or 3 Rooms | 79 (4.7%) | 232 (39.2%) |
| 4 or 5 Rooms | 903 (53.6%) | 290 (49.0%) |
| 6 or 7 Rooms | 558 (33.2%) | 0 (0.0%) |
| 8 or more Rooms | 143 (8.5%) | 0 (0.0%) |
| Total | 1,683 (100.0%) | 592 (100.0%) |
Housing Structure by Heating Type in Presidio County
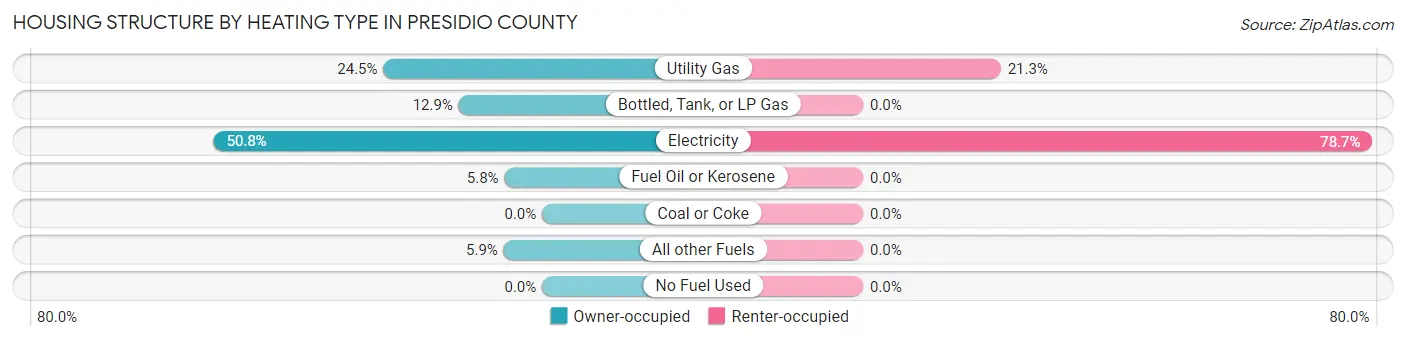
| Heating Type | Owner-occupied | Renter-occupied |
| Utility Gas | 413 (24.5%) | 126 (21.3%) |
| Bottled, Tank, or LP Gas | 217 (12.9%) | 0 (0.0%) |
| Electricity | 855 (50.8%) | 466 (78.7%) |
| Fuel Oil or Kerosene | 98 (5.8%) | 0 (0.0%) |
| Coal or Coke | 0 (0.0%) | 0 (0.0%) |
| All other Fuels | 100 (5.9%) | 0 (0.0%) |
| No Fuel Used | 0 (0.0%) | 0 (0.0%) |
| Total | 1,683 (100.0%) | 592 (100.0%) |
Household Vehicle Usage in Presidio County
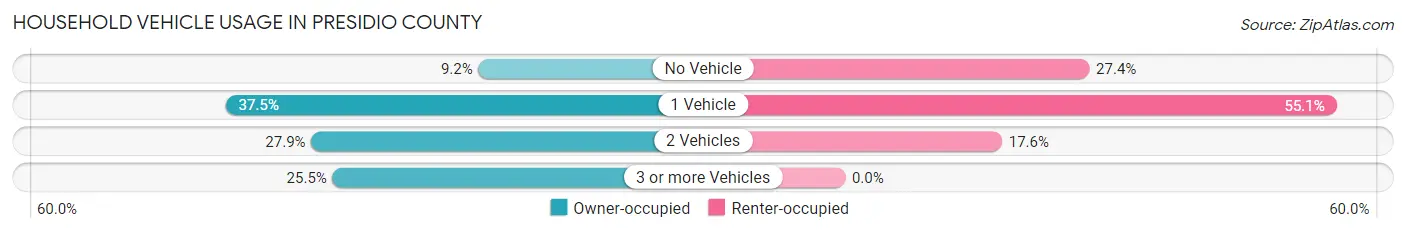
| Vehicles per Household | Owner-occupied | Renter-occupied |
| No Vehicle | 154 (9.1%) | 162 (27.4%) |
| 1 Vehicle | 631 (37.5%) | 326 (55.1%) |
| 2 Vehicles | 469 (27.9%) | 104 (17.6%) |
| 3 or more Vehicles | 429 (25.5%) | 0 (0.0%) |
| Total | 1,683 (100.0%) | 592 (100.0%) |
Real Estate & Mortgages in Presidio County
Real Estate and Mortgage Overview in Presidio County
| Characteristic | Without Mortgage | With Mortgage |
| Housing Units | 1,430 | 253 |
| Median Property Value | $105,100 | $346,900 |
| Median Household Income | $31,505 | $80 |
| Monthly Housing Costs | $456 | $19 |
| Real Estate Taxes | $1,848 | $0 |
Property Value by Mortgage Status in Presidio County
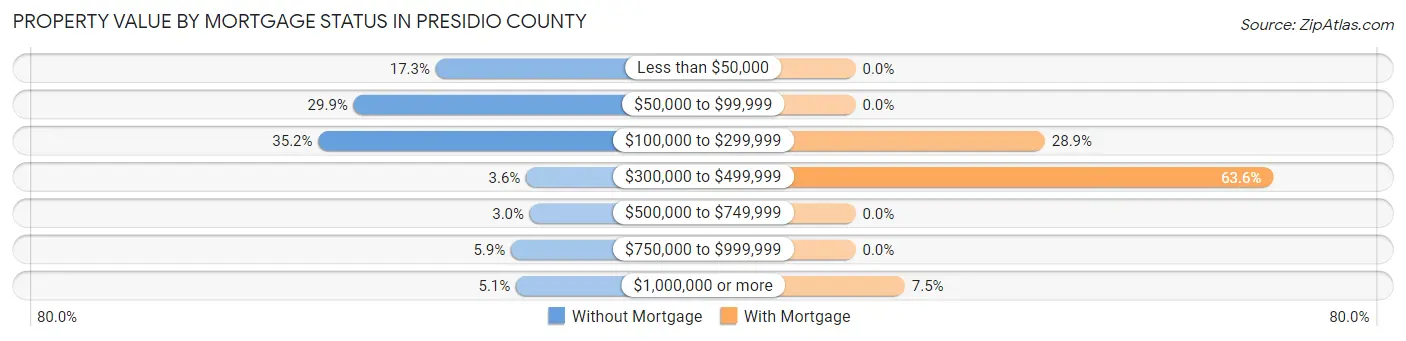
| Property Value | Without Mortgage | With Mortgage |
| Less than $50,000 | 248 (17.3%) | 0 (0.0%) |
| $50,000 to $99,999 | 427 (29.9%) | 0 (0.0%) |
| $100,000 to $299,999 | 504 (35.2%) | 73 (28.8%) |
| $300,000 to $499,999 | 51 (3.6%) | 161 (63.6%) |
| $500,000 to $749,999 | 43 (3.0%) | 0 (0.0%) |
| $750,000 to $999,999 | 84 (5.9%) | 0 (0.0%) |
| $1,000,000 or more | 73 (5.1%) | 19 (7.5%) |
| Total | 1,430 (100.0%) | 253 (100.0%) |
Household Income by Mortgage Status in Presidio County
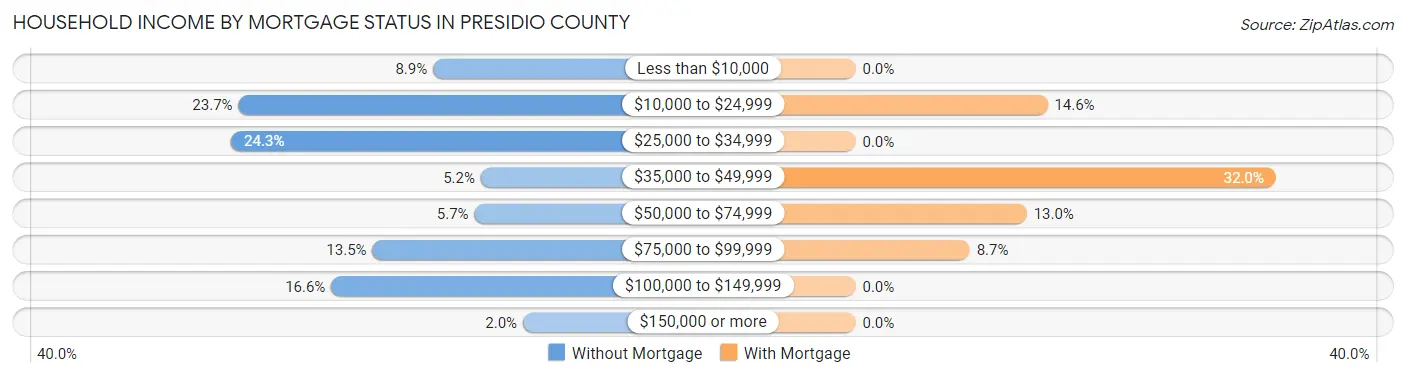
| Household Income | Without Mortgage | With Mortgage |
| Less than $10,000 | 127 (8.9%) | 0 (0.0%) |
| $10,000 to $24,999 | 339 (23.7%) | 37 (14.6%) |
| $25,000 to $34,999 | 347 (24.3%) | 0 (0.0%) |
| $35,000 to $49,999 | 75 (5.2%) | 81 (32.0%) |
| $50,000 to $74,999 | 82 (5.7%) | 33 (13.0%) |
| $75,000 to $99,999 | 193 (13.5%) | 22 (8.7%) |
| $100,000 to $149,999 | 238 (16.6%) | 0 (0.0%) |
| $150,000 or more | 29 (2.0%) | 0 (0.0%) |
| Total | 1,430 (100.0%) | 253 (100.0%) |
Property Value to Household Income Ratio in Presidio County
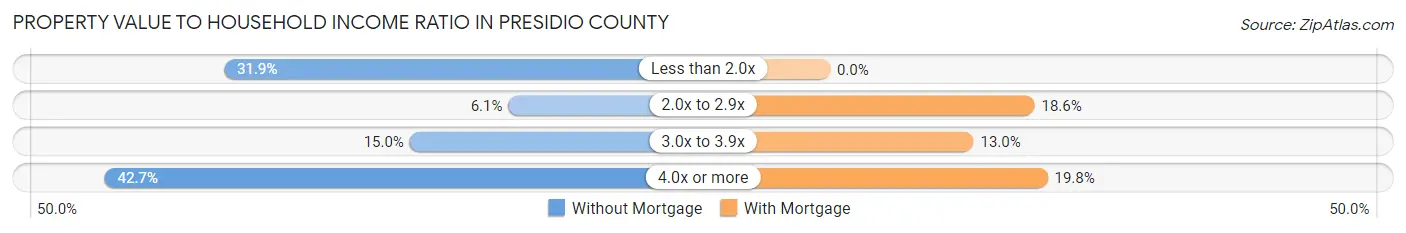
| Value-to-Income Ratio | Without Mortgage | With Mortgage |
| Less than 2.0x | 456 (31.9%) | 0 (0.0%) |
| 2.0x to 2.9x | 87 (6.1%) | 47 (18.6%) |
| 3.0x to 3.9x | 215 (15.0%) | 33 (13.0%) |
| 4.0x or more | 611 (42.7%) | 50 (19.8%) |
| Total | 1,430 (100.0%) | 253 (100.0%) |
Real Estate Taxes by Mortgage Status in Presidio County
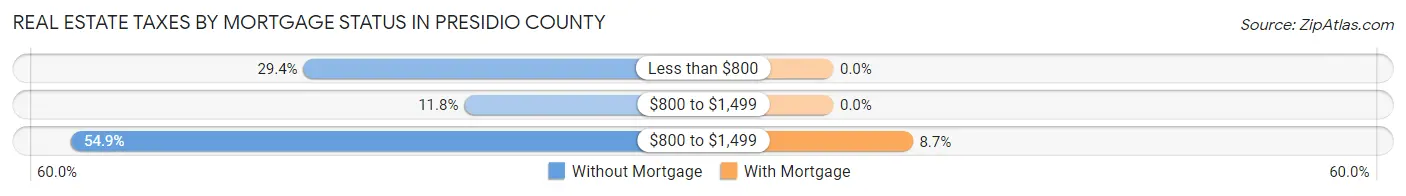
| Property Taxes | Without Mortgage | With Mortgage |
| Less than $800 | 421 (29.4%) | 0 (0.0%) |
| $800 to $1,499 | 169 (11.8%) | 0 (0.0%) |
| $800 to $1,499 | 785 (54.9%) | 22 (8.7%) |
| Total | 1,430 (100.0%) | 253 (100.0%) |
Health & Disability in Presidio County
Health Insurance Coverage by Age in Presidio County
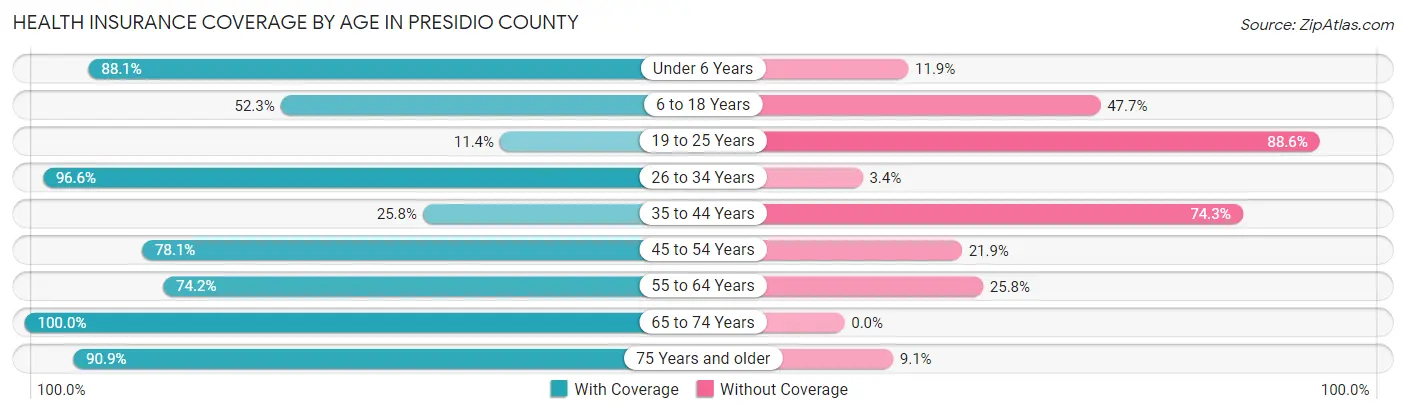
| Age Bracket | With Coverage | Without Coverage |
| Under 6 Years | 585 (88.1%) | 79 (11.9%) |
| 6 to 18 Years | 668 (52.3%) | 610 (47.7%) |
| 19 to 25 Years | 49 (11.4%) | 382 (88.6%) |
| 26 to 34 Years | 314 (96.6%) | 11 (3.4%) |
| 35 to 44 Years | 205 (25.8%) | 591 (74.3%) |
| 45 to 54 Years | 389 (78.1%) | 109 (21.9%) |
| 55 to 64 Years | 571 (74.2%) | 199 (25.8%) |
| 65 to 74 Years | 798 (100.0%) | 0 (0.0%) |
| 75 Years and older | 552 (90.9%) | 55 (9.1%) |
| Total | 4,131 (67.0%) | 2,036 (33.0%) |
Health Insurance Coverage by Citizenship Status in Presidio County
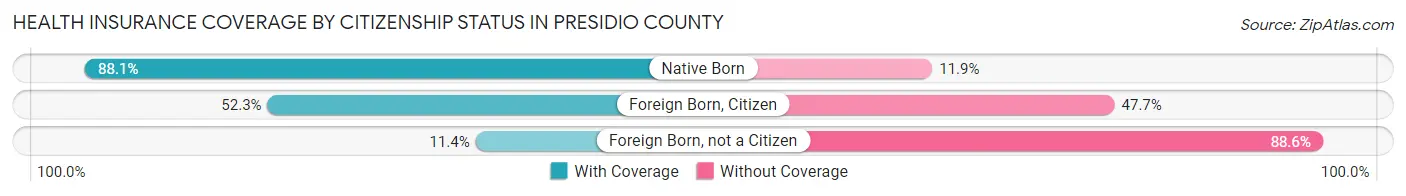
| Citizenship Status | With Coverage | Without Coverage |
| Native Born | 585 (88.1%) | 79 (11.9%) |
| Foreign Born, Citizen | 668 (52.3%) | 610 (47.7%) |
| Foreign Born, not a Citizen | 49 (11.4%) | 382 (88.6%) |
Health Insurance Coverage by Household Income in Presidio County
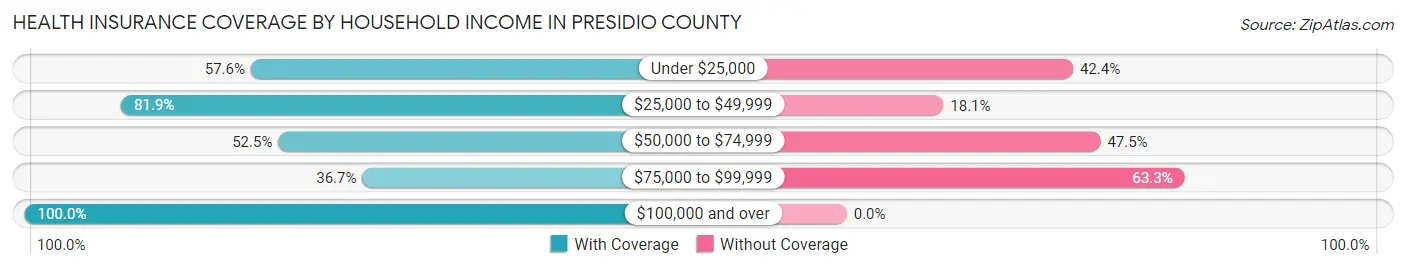
| Household Income | With Coverage | Without Coverage |
| Under $25,000 | 911 (57.6%) | 670 (42.4%) |
| $25,000 to $49,999 | 1,680 (81.9%) | 371 (18.1%) |
| $50,000 to $74,999 | 317 (52.5%) | 287 (47.5%) |
| $75,000 to $99,999 | 411 (36.7%) | 708 (63.3%) |
| $100,000 and over | 808 (100.0%) | 0 (0.0%) |
Public vs Private Health Insurance Coverage by Age in Presidio County
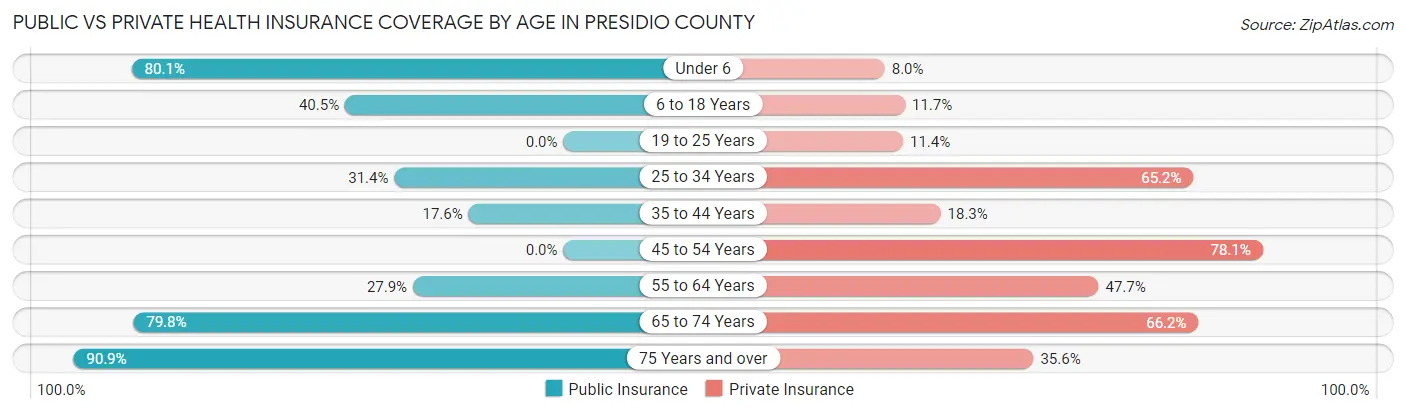
| Age Bracket | Public Insurance | Private Insurance |
| Under 6 | 532 (80.1%) | 53 (8.0%) |
| 6 to 18 Years | 518 (40.5%) | 150 (11.7%) |
| 19 to 25 Years | 0 (0.0%) | 49 (11.4%) |
| 25 to 34 Years | 102 (31.4%) | 212 (65.2%) |
| 35 to 44 Years | 140 (17.6%) | 146 (18.3%) |
| 45 to 54 Years | 0 (0.0%) | 389 (78.1%) |
| 55 to 64 Years | 215 (27.9%) | 367 (47.7%) |
| 65 to 74 Years | 637 (79.8%) | 528 (66.2%) |
| 75 Years and over | 552 (90.9%) | 216 (35.6%) |
| Total | 2,696 (43.7%) | 2,110 (34.2%) |
Disability Status by Sex by Age in Presidio County
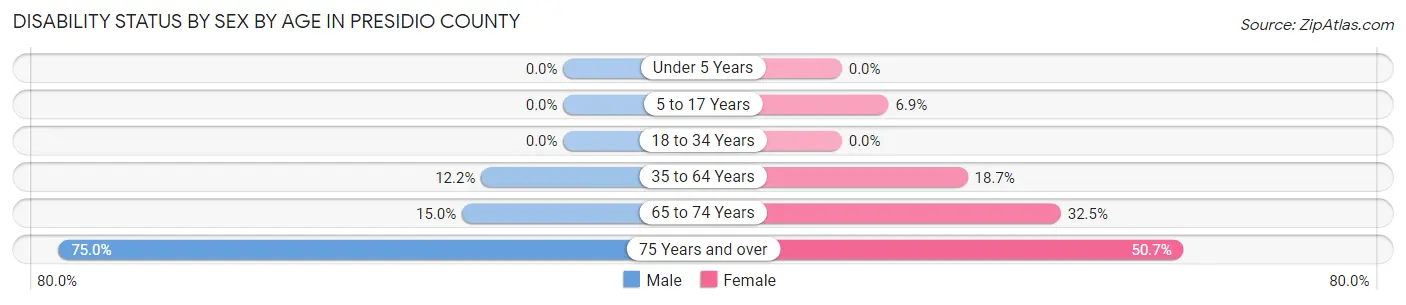
| Age Bracket | Male | Female |
| Under 5 Years | 0 (0.0%) | 0 (0.0%) |
| 5 to 17 Years | 0 (0.0%) | 41 (6.9%) |
| 18 to 34 Years | 0 (0.0%) | 0 (0.0%) |
| 35 to 64 Years | 129 (12.2%) | 188 (18.7%) |
| 65 to 74 Years | 46 (15.0%) | 160 (32.5%) |
| 75 Years and over | 201 (75.0%) | 172 (50.7%) |
Disability Class by Sex by Age in Presidio County
Disability Class: Hearing Difficulty
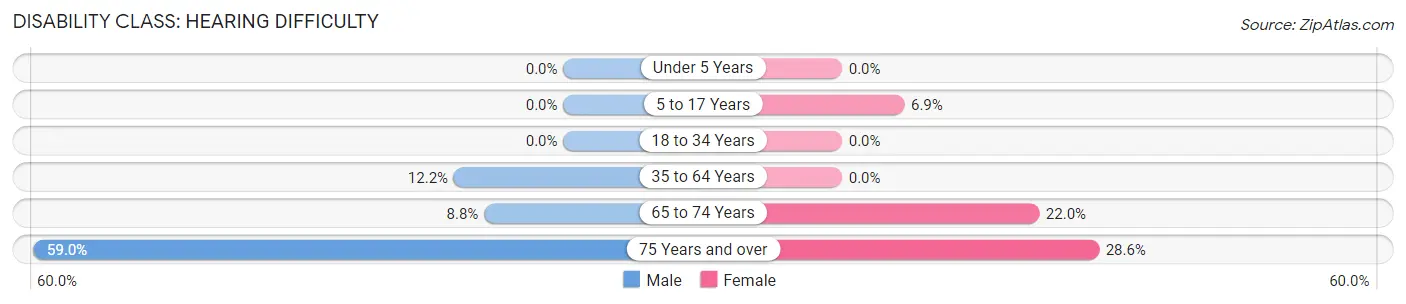
| Age Bracket | Male | Female |
| Under 5 Years | 0 (0.0%) | 0 (0.0%) |
| 5 to 17 Years | 0 (0.0%) | 41 (6.9%) |
| 18 to 34 Years | 0 (0.0%) | 0 (0.0%) |
| 35 to 64 Years | 129 (12.2%) | 0 (0.0%) |
| 65 to 74 Years | 27 (8.8%) | 108 (22.0%) |
| 75 Years and over | 158 (59.0%) | 97 (28.6%) |
Disability Class: Vision Difficulty
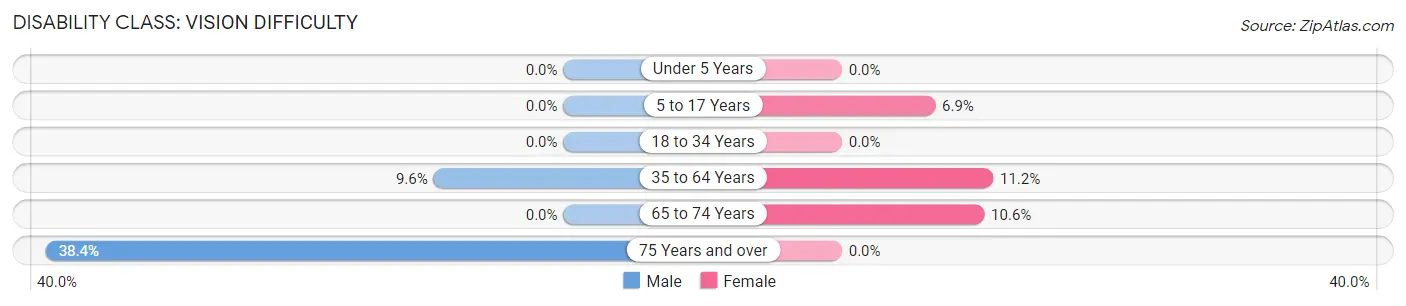
| Age Bracket | Male | Female |
| Under 5 Years | 0 (0.0%) | 0 (0.0%) |
| 5 to 17 Years | 0 (0.0%) | 41 (6.9%) |
| 18 to 34 Years | 0 (0.0%) | 0 (0.0%) |
| 35 to 64 Years | 102 (9.6%) | 113 (11.2%) |
| 65 to 74 Years | 0 (0.0%) | 52 (10.6%) |
| 75 Years and over | 103 (38.4%) | 0 (0.0%) |
Disability Class: Cognitive Difficulty
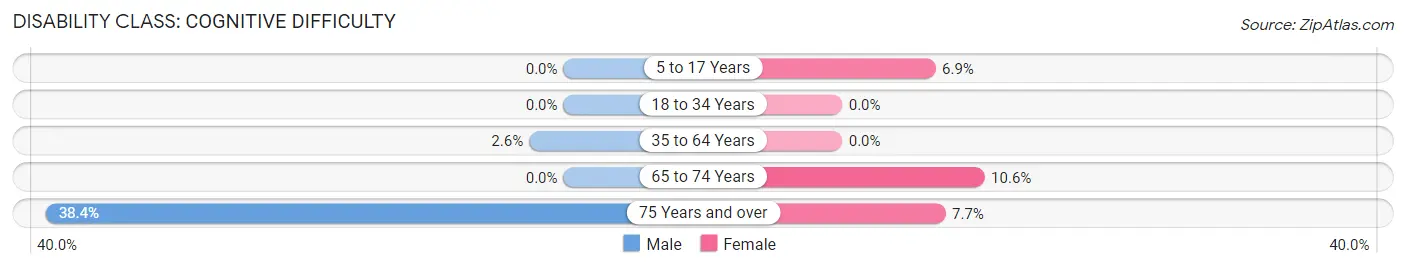
| Age Bracket | Male | Female |
| 5 to 17 Years | 0 (0.0%) | 41 (6.9%) |
| 18 to 34 Years | 0 (0.0%) | 0 (0.0%) |
| 35 to 64 Years | 27 (2.5%) | 0 (0.0%) |
| 65 to 74 Years | 0 (0.0%) | 52 (10.6%) |
| 75 Years and over | 103 (38.4%) | 26 (7.7%) |
Disability Class: Ambulatory Difficulty
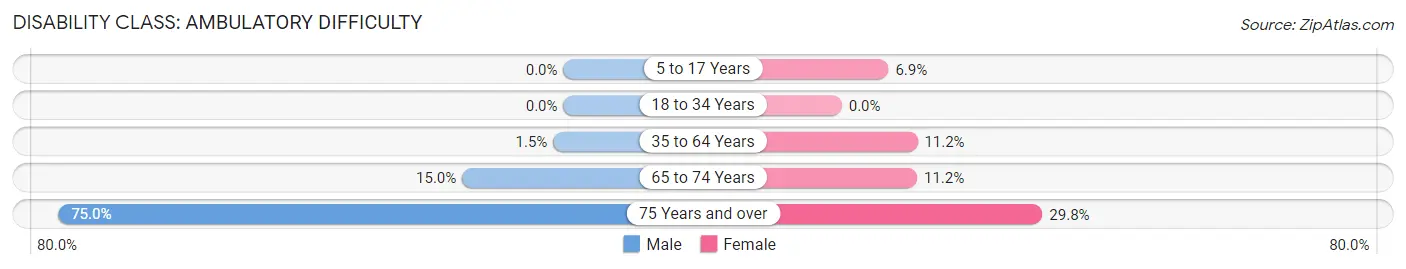
| Age Bracket | Male | Female |
| 5 to 17 Years | 0 (0.0%) | 41 (6.9%) |
| 18 to 34 Years | 0 (0.0%) | 0 (0.0%) |
| 35 to 64 Years | 16 (1.5%) | 113 (11.2%) |
| 65 to 74 Years | 46 (15.0%) | 55 (11.2%) |
| 75 Years and over | 201 (75.0%) | 101 (29.8%) |
Disability Class: Self-Care Difficulty
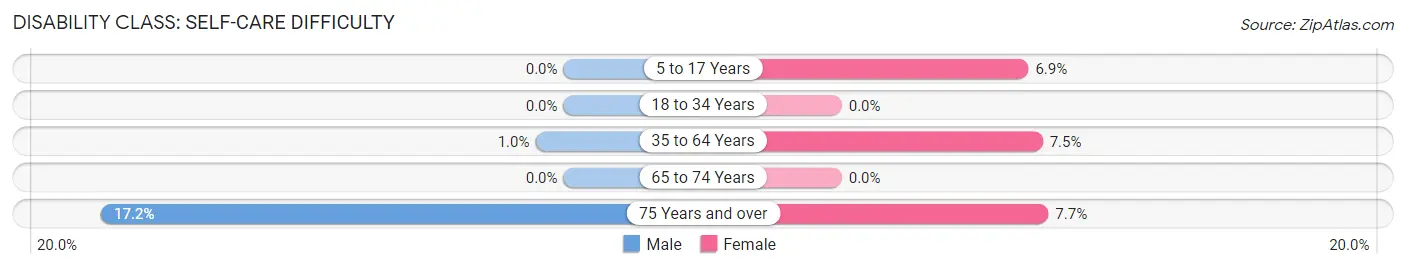
| Age Bracket | Male | Female |
| 5 to 17 Years | 0 (0.0%) | 41 (6.9%) |
| 18 to 34 Years | 0 (0.0%) | 0 (0.0%) |
| 35 to 64 Years | 11 (1.0%) | 75 (7.5%) |
| 65 to 74 Years | 0 (0.0%) | 0 (0.0%) |
| 75 Years and over | 46 (17.2%) | 26 (7.7%) |
Technology Access in Presidio County
Computing Device Access in Presidio County
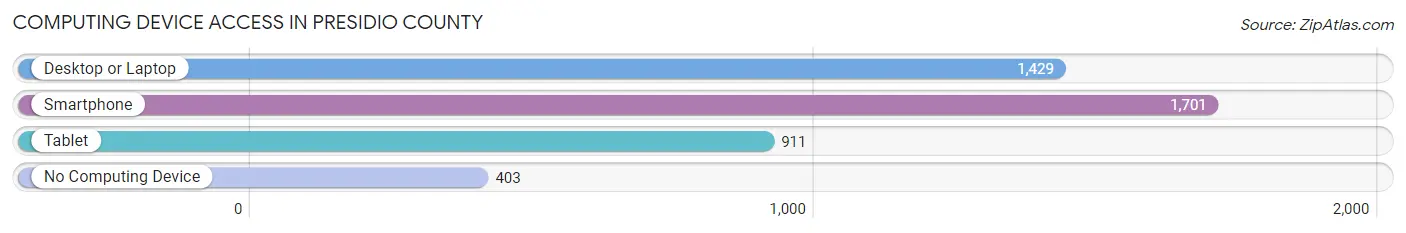
| Device Type | # Households | % Households |
| Desktop or Laptop | 1,429 | 62.8% |
| Smartphone | 1,701 | 74.8% |
| Tablet | 911 | 40.0% |
| No Computing Device | 403 | 17.7% |
| Total | 2,275 | 100.0% |
Internet Access in Presidio County
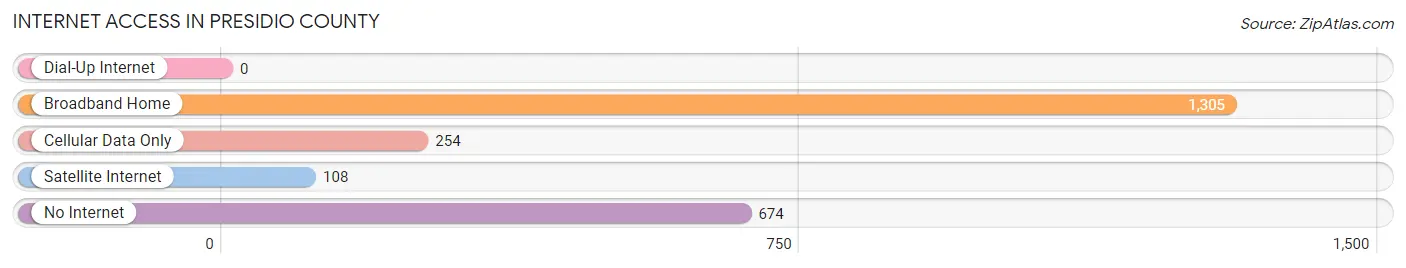
| Internet Type | # Households | % Households |
| Dial-Up Internet | 0 | 0.0% |
| Broadband Home | 1,305 | 57.4% |
| Cellular Data Only | 254 | 11.2% |
| Satellite Internet | 108 | 4.8% |
| No Internet | 674 | 29.6% |
| Total | 2,275 | 100.0% |
Presidio County Summary
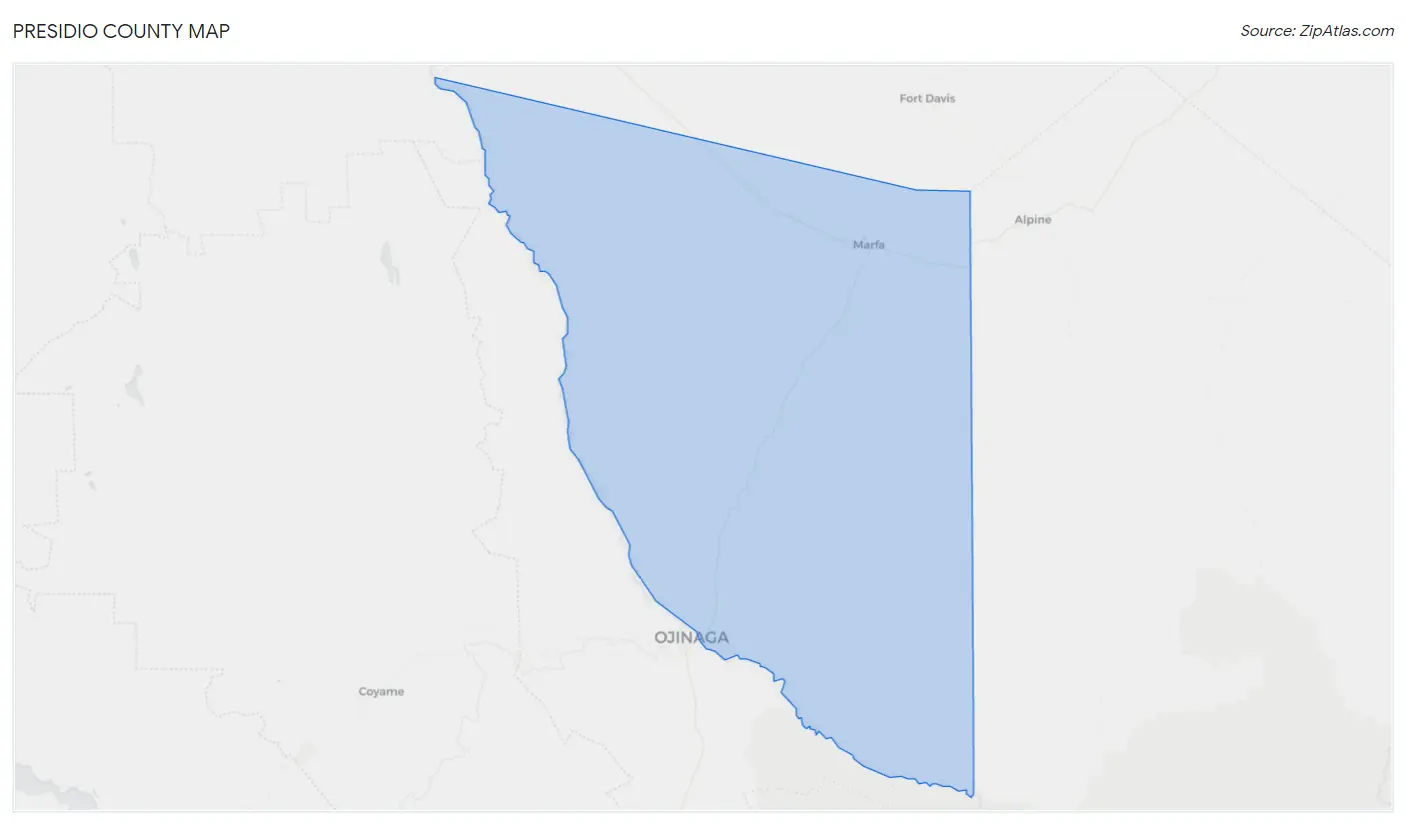
Presidio County is located in the western part of the state of Texas, in the Trans-Pecos region of the state. It is bordered by Brewster County to the north, Jeff Davis County to the east, and Mexico to the south and west. The county seat is Marfa, and the county has a total area of 2,996 square miles, making it the fourth-largest county in Texas. As of the 2010 census, the population was 7,818.
History
Presidio County was established in 1850, and was named for the Spanish presidio, or fort, that was located in the area. The county was originally part of the Republic of Texas, and was later annexed by the United States in 1848. The county was organized in 1875, and Marfa was designated as the county seat.
The area was originally inhabited by Native American tribes, including the Apache, Comanche, and Kiowa. The first Europeans to settle in the area were Spanish missionaries and explorers, who established the presidio in the late 1700s. The area was later settled by ranchers and farmers, and the town of Marfa was established in the 1880s.
Geography
Presidio County is located in the Trans-Pecos region of Texas, and is bordered by Brewster County to the north, Jeff Davis County to the east, and Mexico to the south and west. The county has a total area of 2,996 square miles, making it the fourth-largest county in Texas. The county is mostly mountainous, with the Davis Mountains to the north and the Chisos Mountains to the south. The Rio Grande forms the western border of the county.
The county is home to Big Bend National Park, which is located in the Chisos Mountains. The park is home to a variety of wildlife, including black bears, mountain lions, and bighorn sheep.
Economy
The economy of Presidio County is largely based on agriculture and tourism. The county is home to several large ranches, and the main crops grown in the area are cotton, sorghum, and wheat. The county is also home to several tourist attractions, including Big Bend National Park, the Marfa Lights, and the Chinati Hot Springs.
Demographics
As of the 2010 census, the population of Presidio County was 7,818. The population is largely Hispanic, with 78.3% of the population identifying as Hispanic or Latino. The median household income in the county is $30,945, and the median age is 33.7 years. The county has a poverty rate of 28.3%.
Conclusion
Presidio County is located in the western part of Texas, in the Trans-Pecos region of the state. It is bordered by Brewster County to the north, Jeff Davis County to the east, and Mexico to the south and west. The county has a total area of 2,996 square miles, making it the fourth-largest county in Texas. The population of the county is largely Hispanic, and the economy is based on agriculture and tourism. The county is home to several tourist attractions, including Big Bend National Park, the Marfa Lights, and the Chinati Hot Springs.
Common Questions
What is Per Capita Income in Presidio County?
Per Capita income in Presidio County is $22,256.
What is the Median Family Income in Presidio County?
Median Family Income in Presidio County is $75,838.
What is the Median Household income in Presidio County?
Median Household Income in Presidio County is $29,012.
What is Income or Wage Gap in Presidio County?
Income or Wage Gap in Presidio County is 23.2%.
Women in Presidio County earn 76.8 cents for every dollar earned by a man.
What is Family Income Deficit in Presidio County?
Family Income Deficit in Presidio County is $8,821.
Families that are below poverty line in Presidio County earn $8,821 less on average than the poverty threshold level.
What is Inequality or Gini Index in Presidio County?
Inequality or Gini Index in Presidio County is 0.59.
What is the Total Population of Presidio County?
Total Population of Presidio County is 6,168.
What is the Total Male Population of Presidio County?
Total Male Population of Presidio County is 3,029.
What is the Total Female Population of Presidio County?
Total Female Population of Presidio County is 3,139.
What is the Ratio of Males per 100 Females in Presidio County?
There are 96.50 Males per 100 Females in Presidio County.
What is the Ratio of Females per 100 Males in Presidio County?
There are 103.63 Females per 100 Males in Presidio County.
What is the Median Population Age in Presidio County?
Median Population Age in Presidio County is 41.9 Years.
What is the Average Family Size in Presidio County
Average Family Size in Presidio County is 4.9 People.
What is the Average Household Size in Presidio County
Average Household Size in Presidio County is 2.7 People.
How Large is the Labor Force in Presidio County?
There are 2,795 People in the Labor Forcein in Presidio County.
What is the Percentage of People in the Labor Force in Presidio County?
61.6% of People are in the Labor Force in Presidio County.
What is the Unemployment Rate in Presidio County?
Unemployment Rate in Presidio County is 12.3%.