Parker County, TX Map & Demographics
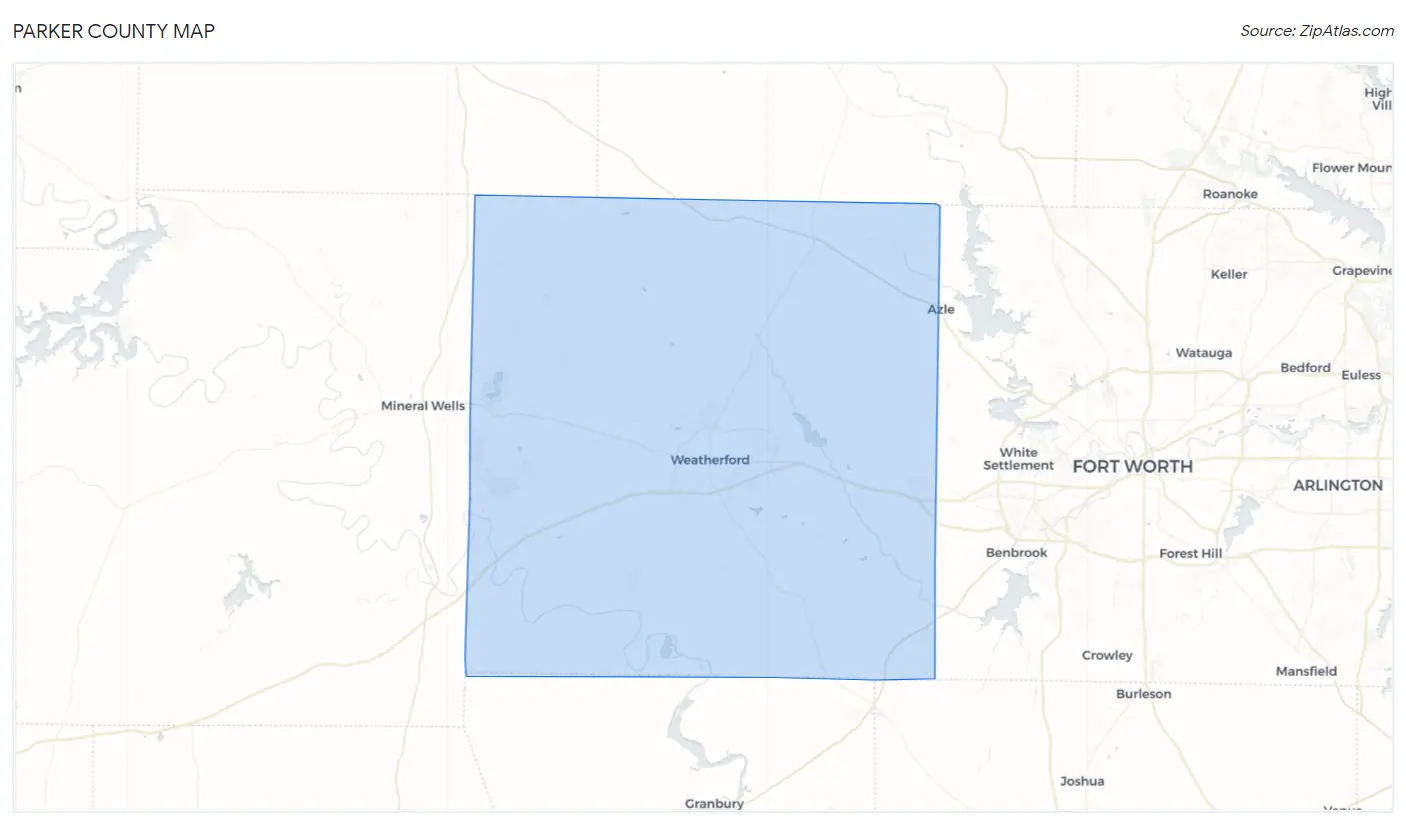
Parker County Map
Parker County Overview
$43,434
PER CAPITA INCOME
$109,857
AVG FAMILY INCOME
$95,721
AVG HOUSEHOLD INCOME
43.8%
WAGE / INCOME GAP [ % ]
56.2¢/ $1
WAGE / INCOME GAP [ $ ]
$9,708
FAMILY INCOME DEFICIT
0.43
INEQUALITY / GINI INDEX
151,188
TOTAL POPULATION
75,827
MALE POPULATION
75,361
FEMALE POPULATION
100.62
MALES / 100 FEMALES
99.39
FEMALES / 100 MALES
39.4
MEDIAN AGE
3.2
AVG FAMILY SIZE
2.8
AVG HOUSEHOLD SIZE
76,155
LABOR FORCE [ PEOPLE ]
64.5%
PERCENT IN LABOR FORCE
3.9%
UNEMPLOYMENT RATE
Income in Parker County
Income Overview in Parker County
Per Capita Income in Parker County is $43,434, while median incomes of families and households are $109,857 and $95,721 respectively.
| Characteristic | Number | Measure |
| Per Capita Income | 151,188 | $43,434 |
| Median Family Income | 40,506 | $109,857 |
| Mean Family Income | 40,506 | $134,733 |
| Median Household Income | 52,622 | $95,721 |
| Mean Household Income | 52,622 | $120,085 |
| Income Deficit | 40,506 | $9,708 |
| Wage / Income Gap (%) | 151,188 | 43.77% |
| Wage / Income Gap ($) | 151,188 | 56.23¢ per $1 |
| Gini / Inequality Index | 151,188 | 0.43 |
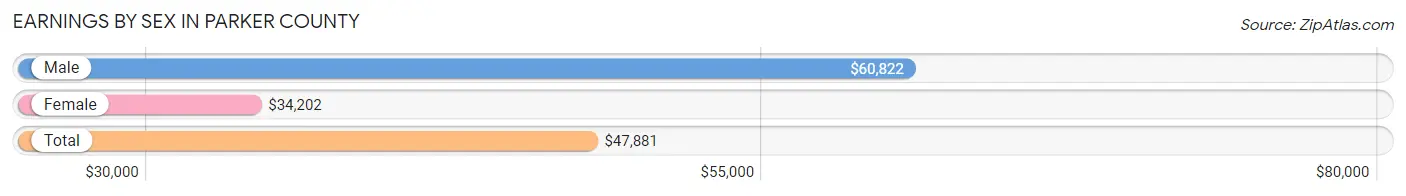
Earnings by Sex in Parker County
Average Earnings in Parker County are $47,881, $60,822 for men and $34,202 for women, a difference of 43.8%.
| Sex | Number | Average Earnings |
| Male | 42,767 (53.6%) | $60,822 |
| Female | 37,063 (46.4%) | $34,202 |
| Total | 79,830 (100.0%) | $47,881 |
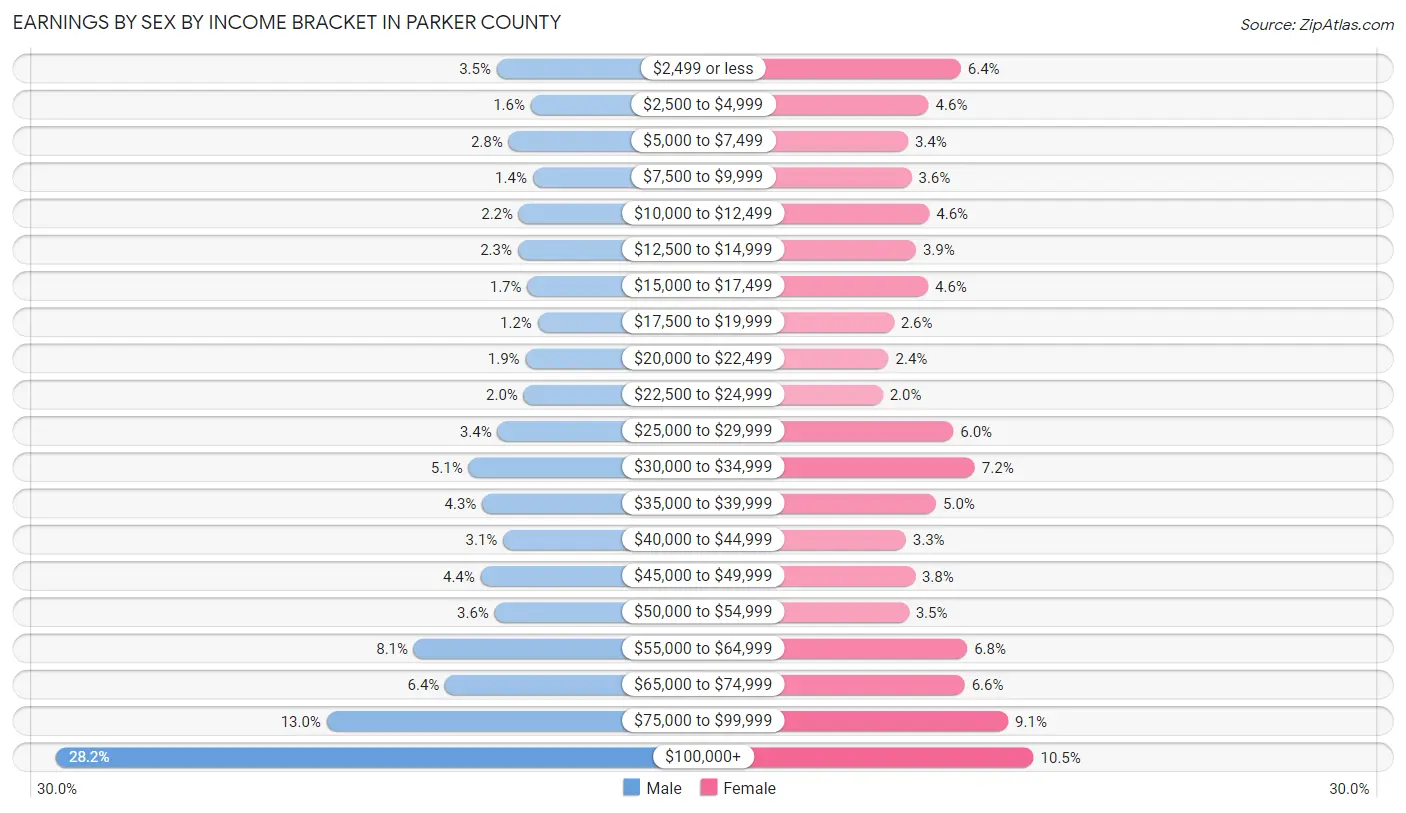
Earnings by Sex by Income Bracket in Parker County
The most common earnings brackets in Parker County are $100,000+ for men (12,071 | 28.2%) and $100,000+ for women (3,891 | 10.5%).
| Income | Male | Female |
| $2,499 or less | 1,481 (3.5%) | 2,374 (6.4%) |
| $2,500 to $4,999 | 665 (1.5%) | 1,705 (4.6%) |
| $5,000 to $7,499 | 1,196 (2.8%) | 1,276 (3.4%) |
| $7,500 to $9,999 | 617 (1.4%) | 1,350 (3.6%) |
| $10,000 to $12,499 | 950 (2.2%) | 1,718 (4.6%) |
| $12,500 to $14,999 | 974 (2.3%) | 1,440 (3.9%) |
| $15,000 to $17,499 | 746 (1.7%) | 1,692 (4.6%) |
| $17,500 to $19,999 | 494 (1.2%) | 980 (2.6%) |
| $20,000 to $22,499 | 792 (1.8%) | 870 (2.4%) |
| $22,500 to $24,999 | 836 (1.9%) | 749 (2.0%) |
| $25,000 to $29,999 | 1,463 (3.4%) | 2,221 (6.0%) |
| $30,000 to $34,999 | 2,160 (5.1%) | 2,667 (7.2%) |
| $35,000 to $39,999 | 1,831 (4.3%) | 1,861 (5.0%) |
| $40,000 to $44,999 | 1,326 (3.1%) | 1,232 (3.3%) |
| $45,000 to $49,999 | 1,871 (4.4%) | 1,418 (3.8%) |
| $50,000 to $54,999 | 1,532 (3.6%) | 1,289 (3.5%) |
| $55,000 to $64,999 | 3,473 (8.1%) | 2,510 (6.8%) |
| $65,000 to $74,999 | 2,721 (6.4%) | 2,457 (6.6%) |
| $75,000 to $99,999 | 5,568 (13.0%) | 3,363 (9.1%) |
| $100,000+ | 12,071 (28.2%) | 3,891 (10.5%) |
| Total | 42,767 (100.0%) | 37,063 (100.0%) |
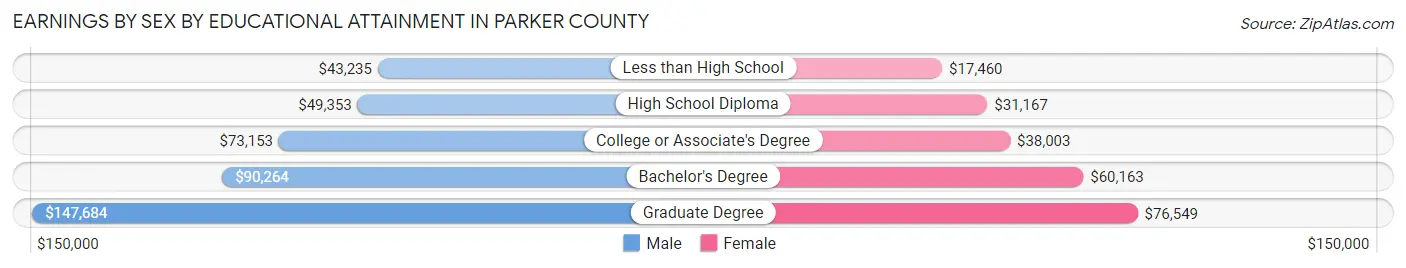
Earnings by Sex by Educational Attainment in Parker County
Average earnings in Parker County are $69,710 for men and $40,000 for women, a difference of 42.6%. Men with an educational attainment of graduate degree enjoy the highest average annual earnings of $147,684, while those with less than high school education earn the least with $43,235. Women with an educational attainment of graduate degree earn the most with the average annual earnings of $76,549, while those with less than high school education have the smallest earnings of $17,460.
| Educational Attainment | Male Income | Female Income |
| Less than High School | $43,235 | $17,460 |
| High School Diploma | $49,353 | $31,167 |
| College or Associate's Degree | $73,153 | $38,003 |
| Bachelor's Degree | $90,264 | $60,163 |
| Graduate Degree | $147,684 | $76,549 |
| Total | $69,710 | $40,000 |
Family Income in Parker County
Family Income Brackets in Parker County
According to the Parker County family income data, there are 8,790 families falling into the $100,000 to $149,999 income range, which is the most common income bracket and makes up 21.7% of all families. Conversely, the $10,000 to $14,999 income bracket is the least frequent group with only 608 families (1.5%) belonging to this category.
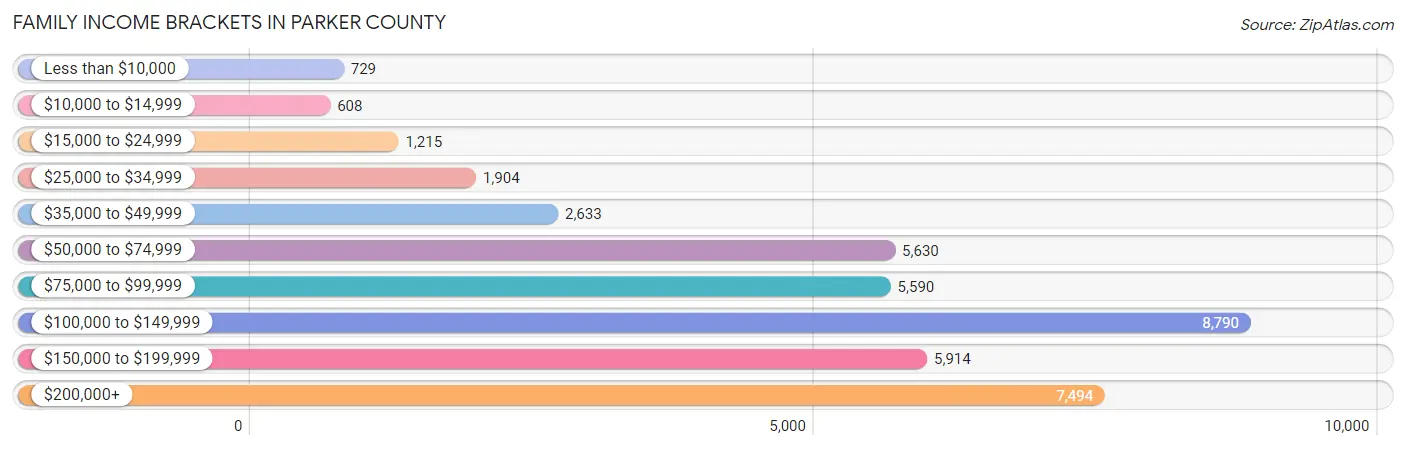
| Income Bracket | # Families | % Families |
| Less than $10,000 | 729 | 1.8% |
| $10,000 to $14,999 | 608 | 1.5% |
| $15,000 to $24,999 | 1,215 | 3.0% |
| $25,000 to $34,999 | 1,904 | 4.7% |
| $35,000 to $49,999 | 2,633 | 6.5% |
| $50,000 to $74,999 | 5,630 | 13.9% |
| $75,000 to $99,999 | 5,590 | 13.8% |
| $100,000 to $149,999 | 8,790 | 21.7% |
| $150,000 to $199,999 | 5,914 | 14.6% |
| $200,000+ | 7,494 | 18.5% |
Family Income by Famaliy Size in Parker County
4-person families (7,283 | 18.0%) account for the highest median family income in Parker County with $138,968 per family, while 2-person families (18,647 | 46.0%) have the highest median income of $49,178 per family member.
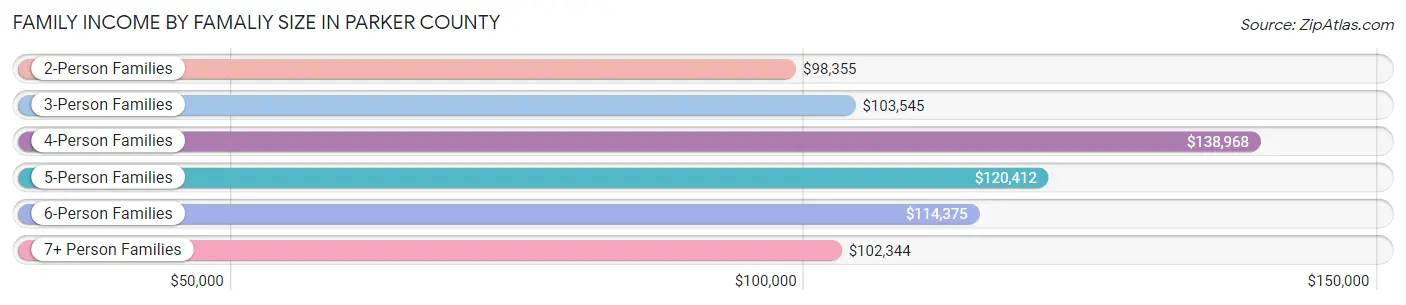
| Income Bracket | # Families | Median Income |
| 2-Person Families | 18,647 (46.0%) | $98,355 |
| 3-Person Families | 9,208 (22.7%) | $103,545 |
| 4-Person Families | 7,283 (18.0%) | $138,968 |
| 5-Person Families | 3,532 (8.7%) | $120,412 |
| 6-Person Families | 1,207 (3.0%) | $114,375 |
| 7+ Person Families | 629 (1.5%) | $102,344 |
| Total | 40,506 (100.0%) | $109,857 |
Family Income by Number of Earners in Parker County
The median family income in Parker County is $109,857, with families comprising 3+ earners (4,302) having the highest median family income of $145,291, while families with no earners (5,444) have the lowest median family income of $58,581, accounting for 10.6% and 13.4% of families, respectively.
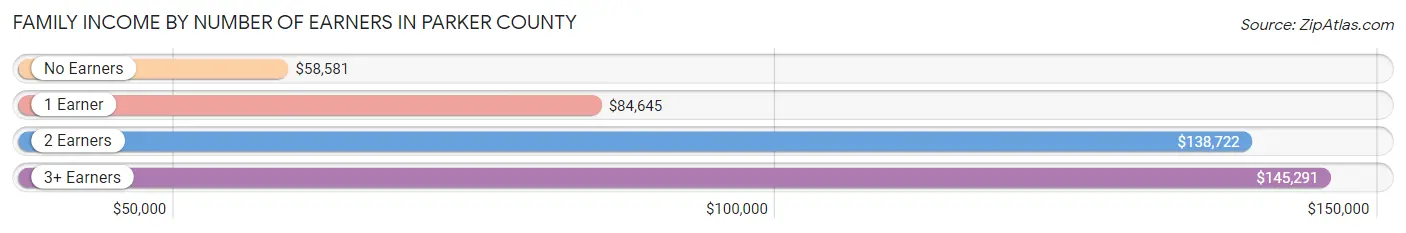
| Number of Earners | # Families | Median Income |
| No Earners | 5,444 (13.4%) | $58,581 |
| 1 Earner | 11,966 (29.5%) | $84,645 |
| 2 Earners | 18,794 (46.4%) | $138,722 |
| 3+ Earners | 4,302 (10.6%) | $145,291 |
| Total | 40,506 (100.0%) | $109,857 |
Household Income in Parker County
Household Income Brackets in Parker County
With 10,209 households falling in the category, the $100,000 to $149,999 income range is the most frequent in Parker County, accounting for 19.4% of all households. In contrast, only 1,263 households (2.4%) fall into the $10,000 to $14,999 income bracket, making it the least populous group.
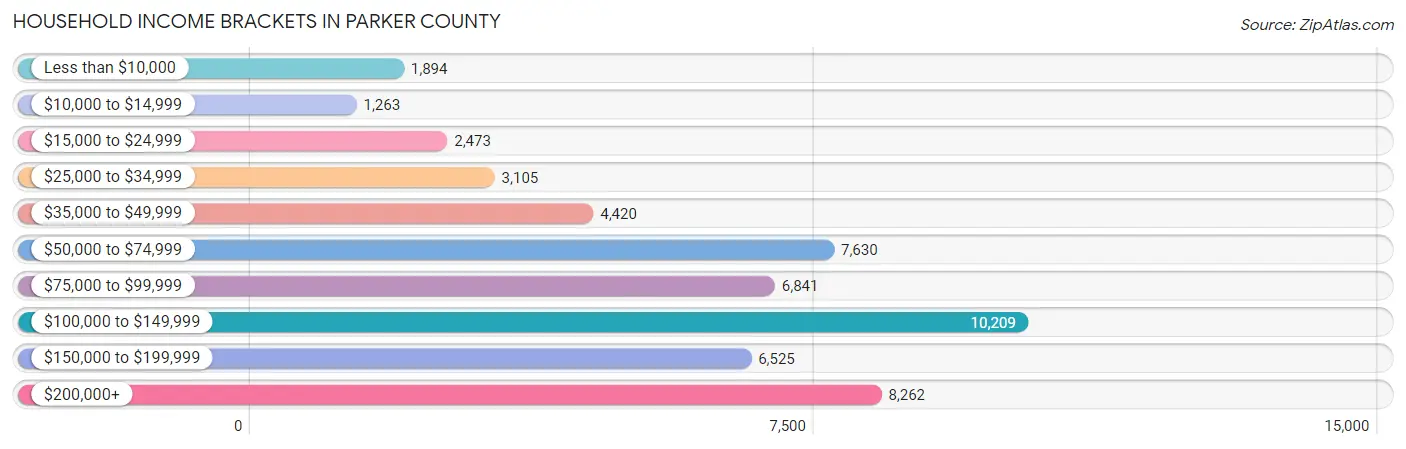
| Income Bracket | # Households | % Households |
| Less than $10,000 | 1,894 | 3.6% |
| $10,000 to $14,999 | 1,263 | 2.4% |
| $15,000 to $24,999 | 2,473 | 4.7% |
| $25,000 to $34,999 | 3,105 | 5.9% |
| $35,000 to $49,999 | 4,420 | 8.4% |
| $50,000 to $74,999 | 7,630 | 14.5% |
| $75,000 to $99,999 | 6,841 | 13.0% |
| $100,000 to $149,999 | 10,209 | 19.4% |
| $150,000 to $199,999 | 6,525 | 12.4% |
| $200,000+ | 8,262 | 15.7% |
Household Income by Householder Age in Parker County
The median household income in Parker County is $95,721, with the highest median household income of $117,416 found in the 45 to 64 years age bracket for the primary householder. A total of 21,095 households (40.1%) fall into this category. Meanwhile, the 15 to 24 years age bracket for the primary householder has the lowest median household income of $61,631, with 1,581 households (3.0%) in this group.
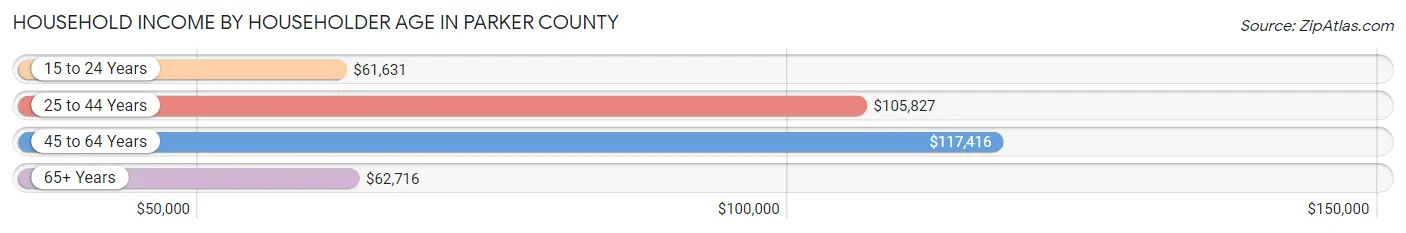
| Income Bracket | # Households | Median Income |
| 15 to 24 Years | 1,581 (3.0%) | $61,631 |
| 25 to 44 Years | 16,317 (31.0%) | $105,827 |
| 45 to 64 Years | 21,095 (40.1%) | $117,416 |
| 65+ Years | 13,629 (25.9%) | $62,716 |
| Total | 52,622 (100.0%) | $95,721 |
Poverty in Parker County
Income Below Poverty by Sex and Age in Parker County
With 6.5% poverty level for males and 9.3% for females among the residents of Parker County, 75 year old and over males and 18 to 24 year old females are the most vulnerable to poverty, with 436 males (11.4%) and 745 females (13.5%) in their respective age groups living below the poverty level.
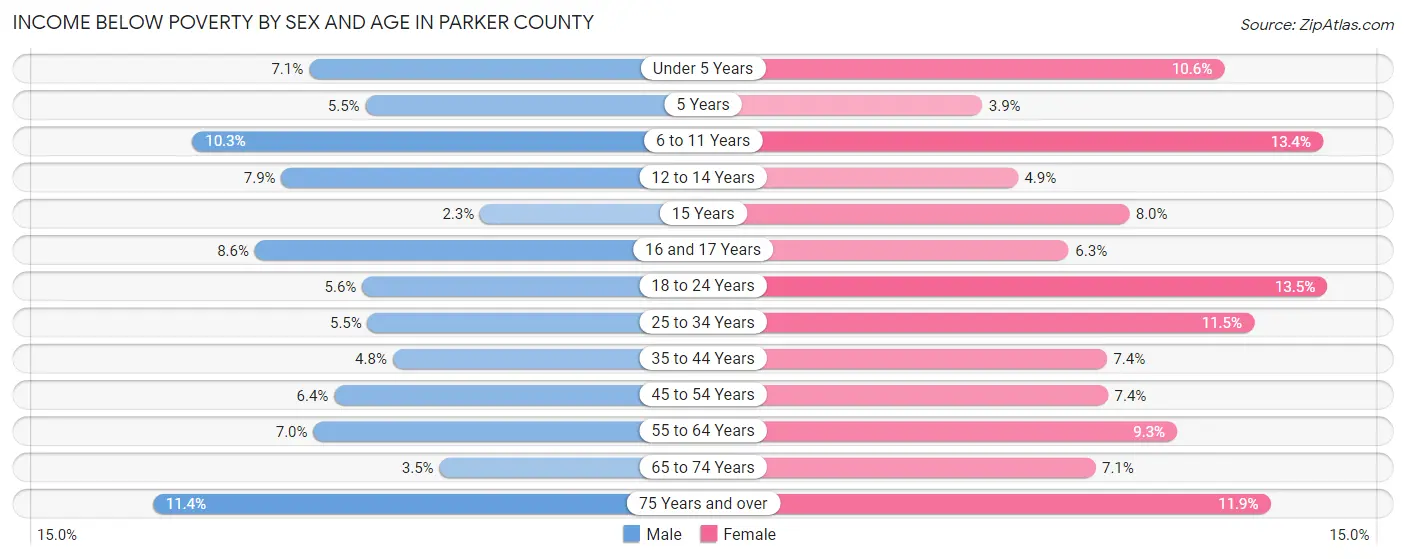
| Age Bracket | Male | Female |
| Under 5 Years | 330 (7.1%) | 453 (10.6%) |
| 5 Years | 60 (5.5%) | 27 (3.9%) |
| 6 to 11 Years | 685 (10.3%) | 820 (13.4%) |
| 12 to 14 Years | 251 (7.9%) | 166 (4.9%) |
| 15 Years | 30 (2.3%) | 92 (8.0%) |
| 16 and 17 Years | 174 (8.6%) | 133 (6.3%) |
| 18 to 24 Years | 338 (5.6%) | 745 (13.5%) |
| 25 to 34 Years | 460 (5.4%) | 1,008 (11.5%) |
| 35 to 44 Years | 485 (4.8%) | 753 (7.4%) |
| 45 to 54 Years | 621 (6.4%) | 720 (7.4%) |
| 55 to 64 Years | 718 (7.0%) | 954 (9.3%) |
| 65 to 74 Years | 247 (3.5%) | 535 (7.0%) |
| 75 Years and over | 436 (11.4%) | 550 (11.9%) |
| Total | 4,835 (6.5%) | 6,956 (9.3%) |
Income Above Poverty by Sex and Age in Parker County
According to the poverty statistics in Parker County, males aged 15 years and females aged 5 years are the age groups that are most secure financially, with 97.7% of males and 96.1% of females in these age groups living above the poverty line.
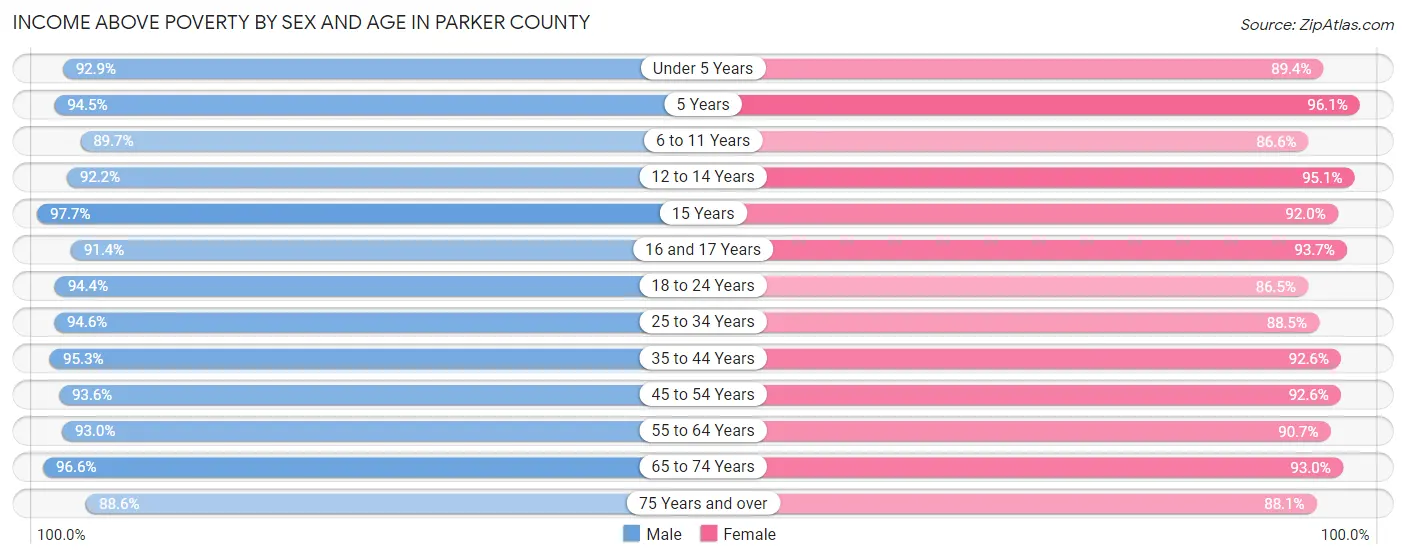
| Age Bracket | Male | Female |
| Under 5 Years | 4,329 (92.9%) | 3,803 (89.4%) |
| 5 Years | 1,028 (94.5%) | 666 (96.1%) |
| 6 to 11 Years | 5,944 (89.7%) | 5,306 (86.6%) |
| 12 to 14 Years | 2,945 (92.1%) | 3,227 (95.1%) |
| 15 Years | 1,264 (97.7%) | 1,059 (92.0%) |
| 16 and 17 Years | 1,852 (91.4%) | 1,974 (93.7%) |
| 18 to 24 Years | 5,700 (94.4%) | 4,770 (86.5%) |
| 25 to 34 Years | 7,981 (94.6%) | 7,781 (88.5%) |
| 35 to 44 Years | 9,716 (95.3%) | 9,470 (92.6%) |
| 45 to 54 Years | 9,112 (93.6%) | 9,016 (92.6%) |
| 55 to 64 Years | 9,604 (93.0%) | 9,274 (90.7%) |
| 65 to 74 Years | 6,918 (96.6%) | 7,049 (92.9%) |
| 75 Years and over | 3,378 (88.6%) | 4,062 (88.1%) |
| Total | 69,771 (93.5%) | 67,457 (90.6%) |
Income Below Poverty Among Married-Couple Families in Parker County
The poverty statistics for married-couple families in Parker County show that 4.5% or 1,538 of the total 34,032 families live below the poverty line. Families with 5 or more children have the highest poverty rate of 21.0%, comprising of 29 families. On the other hand, families with 1 or 2 children have the lowest poverty rate of 3.3%, which includes 385 families.
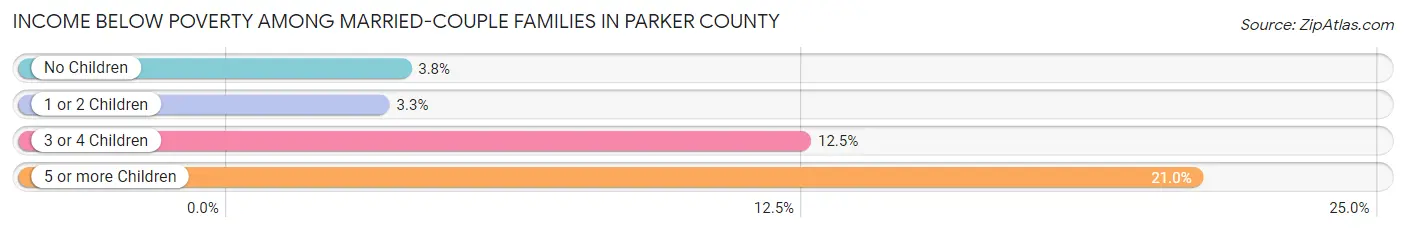
| Children | Above Poverty | Below Poverty |
| No Children | 18,212 (96.2%) | 713 (3.8%) |
| 1 or 2 Children | 11,289 (96.7%) | 385 (3.3%) |
| 3 or 4 Children | 2,884 (87.5%) | 411 (12.5%) |
| 5 or more Children | 109 (79.0%) | 29 (21.0%) |
| Total | 32,494 (95.5%) | 1,538 (4.5%) |
Income Below Poverty Among Single-Parent Households in Parker County
According to the poverty data in Parker County, 8.8% or 174 single-father households and 16.0% or 719 single-mother households are living below the poverty line. Among single-father households, those with 1 or 2 children have the highest poverty rate, with 158 households (24.4%) experiencing poverty. Likewise, among single-mother households, those with 3 or 4 children have the highest poverty rate, with 127 households (36.7%) falling below the poverty line.
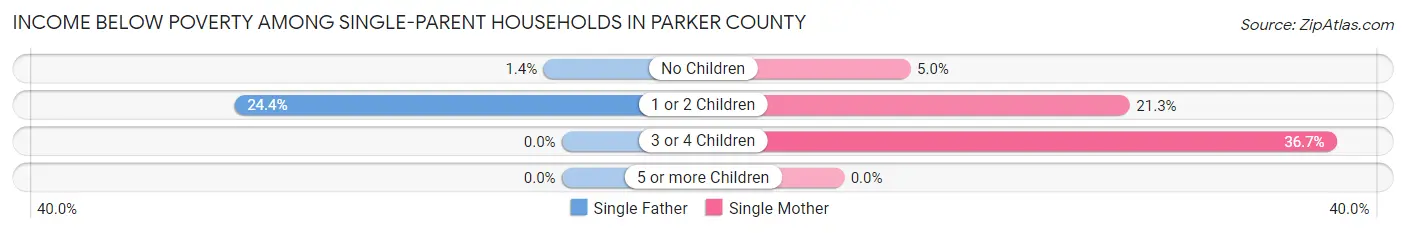
| Children | Single Father | Single Mother |
| No Children | 16 (1.4%) | 87 (5.0%) |
| 1 or 2 Children | 158 (24.4%) | 505 (21.3%) |
| 3 or 4 Children | 0 (0.0%) | 127 (36.7%) |
| 5 or more Children | 0 (0.0%) | 0 (0.0%) |
| Total | 174 (8.8%) | 719 (16.0%) |
Income Below Poverty Among Married-Couple vs Single-Parent Households in Parker County
The poverty data for Parker County shows that 1,538 of the married-couple family households (4.5%) and 893 of the single-parent households (13.8%) are living below the poverty level. Within the married-couple family households, those with 5 or more children have the highest poverty rate, with 29 households (21.0%) falling below the poverty line. Among the single-parent households, those with 3 or 4 children have the highest poverty rate, with 127 household (25.1%) living below poverty.
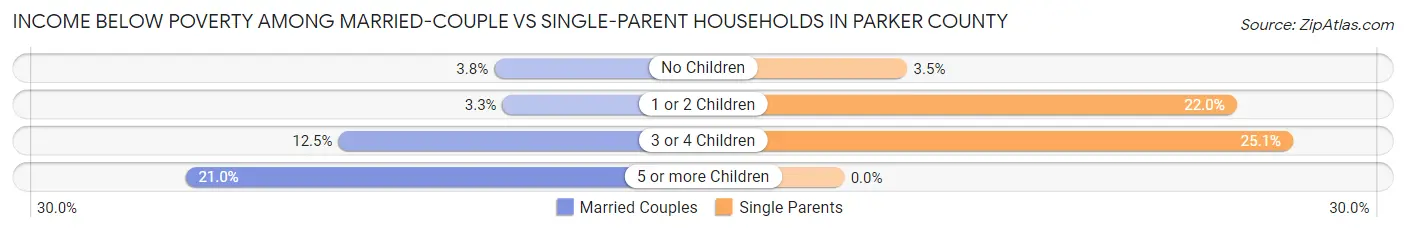
| Children | Married-Couple Families | Single-Parent Households |
| No Children | 713 (3.8%) | 103 (3.5%) |
| 1 or 2 Children | 385 (3.3%) | 663 (22.0%) |
| 3 or 4 Children | 411 (12.5%) | 127 (25.1%) |
| 5 or more Children | 29 (21.0%) | 0 (0.0%) |
| Total | 1,538 (4.5%) | 893 (13.8%) |
Race in Parker County
The most populous races in Parker County are White / Caucasian (132,194 | 87.4%), Hispanic or Latino (20,648 | 13.7%), and Two or more Races (11,983 | 7.9%).
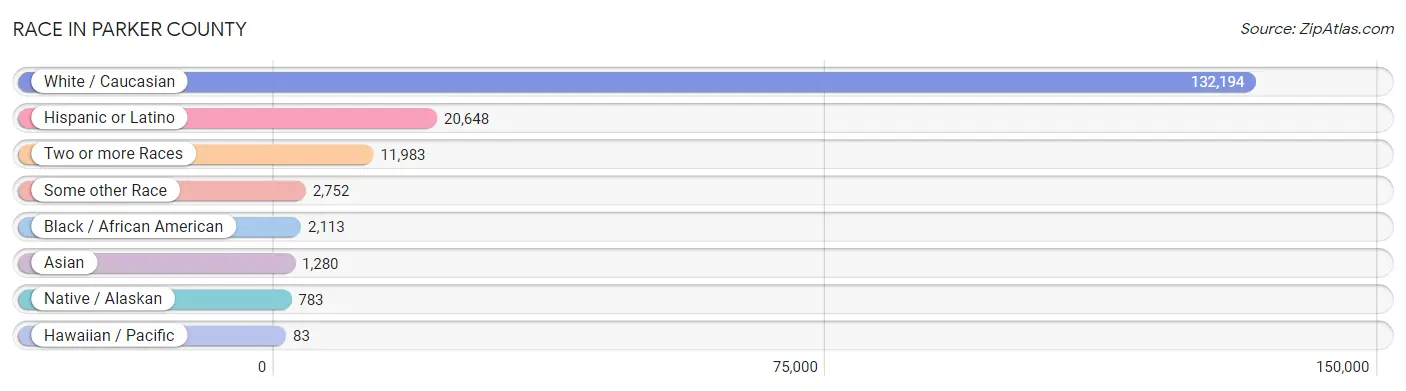
| Race | # Population | % Population |
| Asian | 1,280 | 0.9% |
| Black / African American | 2,113 | 1.4% |
| Hawaiian / Pacific | 83 | 0.1% |
| Hispanic or Latino | 20,648 | 13.7% |
| Native / Alaskan | 783 | 0.5% |
| White / Caucasian | 132,194 | 87.4% |
| Two or more Races | 11,983 | 7.9% |
| Some other Race | 2,752 | 1.8% |
| Total | 151,188 | 100.0% |
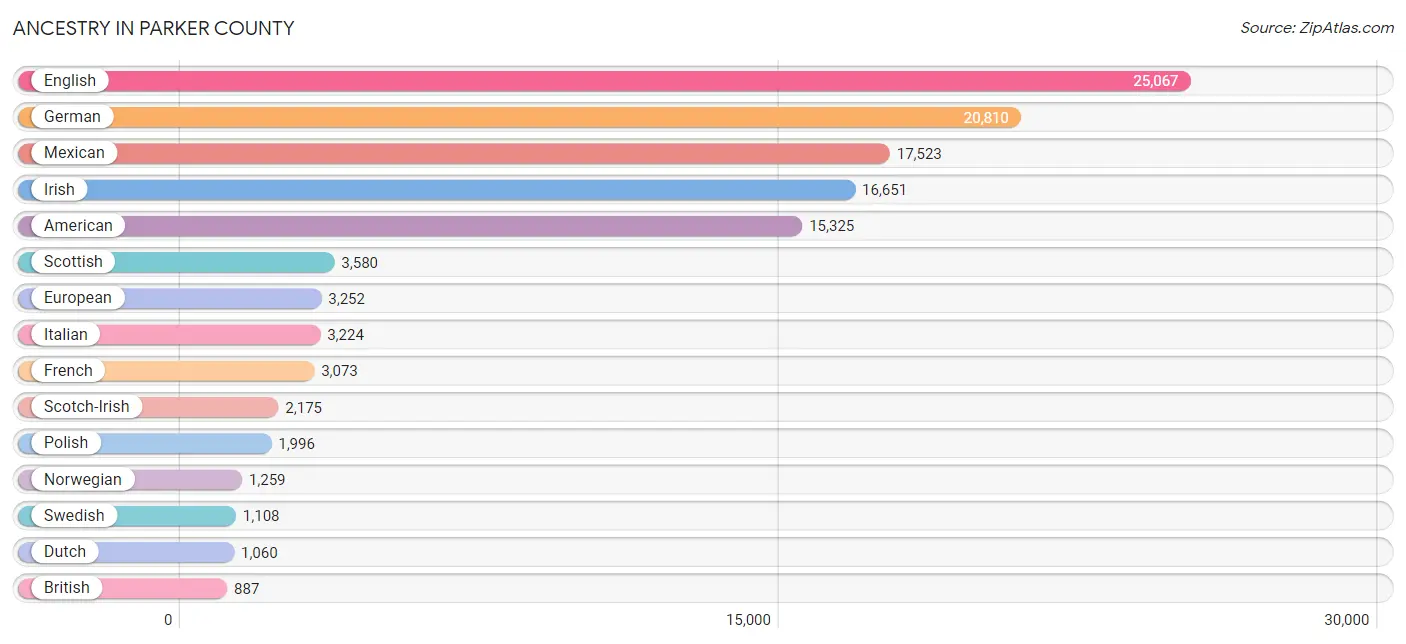
Ancestry in Parker County
The most populous ancestries reported in Parker County are English (25,067 | 16.6%), German (20,810 | 13.8%), Mexican (17,523 | 11.6%), Irish (16,651 | 11.0%), and American (15,325 | 10.1%), together accounting for 63.1% of all Parker County residents.
| Ancestry | # Population | % Population |
| African | 171 | 0.1% |
| Aleut | 34 | 0.0% |
| American | 15,325 | 10.1% |
| Apache | 125 | 0.1% |
| Arab | 598 | 0.4% |
| Argentinean | 31 | 0.0% |
| Armenian | 5 | 0.0% |
| Australian | 18 | 0.0% |
| Austrian | 137 | 0.1% |
| Bahamian | 2 | 0.0% |
| Basque | 23 | 0.0% |
| Belgian | 127 | 0.1% |
| Bhutanese | 39 | 0.0% |
| Blackfeet | 234 | 0.2% |
| Brazilian | 18 | 0.0% |
| British | 887 | 0.6% |
| Burmese | 347 | 0.2% |
| Cajun | 8 | 0.0% |
| Canadian | 559 | 0.4% |
| Celtic | 8 | 0.0% |
| Central American | 435 | 0.3% |
| Central American Indian | 150 | 0.1% |
| Cherokee | 432 | 0.3% |
| Cheyenne | 21 | 0.0% |
| Chickasaw | 19 | 0.0% |
| Choctaw | 397 | 0.3% |
| Colombian | 85 | 0.1% |
| Comanche | 92 | 0.1% |
| Costa Rican | 33 | 0.0% |
| Creek | 73 | 0.1% |
| Croatian | 63 | 0.0% |
| Cuban | 297 | 0.2% |
| Czech | 873 | 0.6% |
| Czechoslovakian | 89 | 0.1% |
| Danish | 524 | 0.4% |
| Delaware | 32 | 0.0% |
| Dutch | 1,060 | 0.7% |
| Dutch West Indian | 123 | 0.1% |
| Eastern European | 107 | 0.1% |
| Egyptian | 42 | 0.0% |
| English | 25,067 | 16.6% |
| Estonian | 42 | 0.0% |
| European | 3,252 | 2.1% |
| Filipino | 44 | 0.0% |
| Finnish | 72 | 0.1% |
| French | 3,073 | 2.0% |
| French American Indian | 76 | 0.1% |
| French Canadian | 441 | 0.3% |
| German | 20,810 | 13.8% |
| German Russian | 9 | 0.0% |
| Greek | 177 | 0.1% |
| Guamanian / Chamorro | 8 | 0.0% |
| Guatemalan | 182 | 0.1% |
| Honduran | 188 | 0.1% |
| Hungarian | 223 | 0.2% |
| Indian (Asian) | 295 | 0.2% |
| Iranian | 58 | 0.0% |
| Irish | 16,651 | 11.0% |
| Israeli | 15 | 0.0% |
| Italian | 3,224 | 2.1% |
| Jamaican | 7 | 0.0% |
| Japanese | 74 | 0.1% |
| Jordanian | 20 | 0.0% |
| Kiowa | 156 | 0.1% |
| Korean | 252 | 0.2% |
| Laotian | 23 | 0.0% |
| Latvian | 7 | 0.0% |
| Lebanese | 476 | 0.3% |
| Lithuanian | 27 | 0.0% |
| Luxembourger | 10 | 0.0% |
| Malaysian | 66 | 0.0% |
| Mexican | 17,523 | 11.6% |
| Mexican American Indian | 475 | 0.3% |
| Mongolian | 13 | 0.0% |
| Native Hawaiian | 24 | 0.0% |
| Navajo | 11 | 0.0% |
| New Zealander | 31 | 0.0% |
| Nicaraguan | 19 | 0.0% |
| Nigerian | 20 | 0.0% |
| Northern European | 216 | 0.1% |
| Norwegian | 1,259 | 0.8% |
| Paiute | 6 | 0.0% |
| Pakistani | 116 | 0.1% |
| Pennsylvania German | 42 | 0.0% |
| Peruvian | 14 | 0.0% |
| Polish | 1,996 | 1.3% |
| Portuguese | 65 | 0.0% |
| Pueblo | 26 | 0.0% |
| Puerto Rican | 541 | 0.4% |
| Romanian | 183 | 0.1% |
| Russian | 511 | 0.3% |
| Salvadoran | 13 | 0.0% |
| Samoan | 71 | 0.1% |
| Scandinavian | 380 | 0.3% |
| Scotch-Irish | 2,175 | 1.4% |
| Scottish | 3,580 | 2.4% |
| Seminole | 16 | 0.0% |
| Serbian | 27 | 0.0% |
| Sioux | 4 | 0.0% |
| Slavic | 20 | 0.0% |
| Slovak | 53 | 0.0% |
| Slovene | 19 | 0.0% |
| South African | 19 | 0.0% |
| South American | 195 | 0.1% |
| Spaniard | 674 | 0.4% |
| Spanish | 537 | 0.4% |
| Sri Lankan | 438 | 0.3% |
| Subsaharan African | 210 | 0.1% |
| Swedish | 1,108 | 0.7% |
| Swiss | 435 | 0.3% |
| Syrian | 58 | 0.0% |
| Thai | 60 | 0.0% |
| Tongan | 13 | 0.0% |
| Ukrainian | 82 | 0.1% |
| Venezuelan | 65 | 0.0% |
| Welsh | 653 | 0.4% |
| Yugoslavian | 22 | 0.0% | View All 117 Rows |
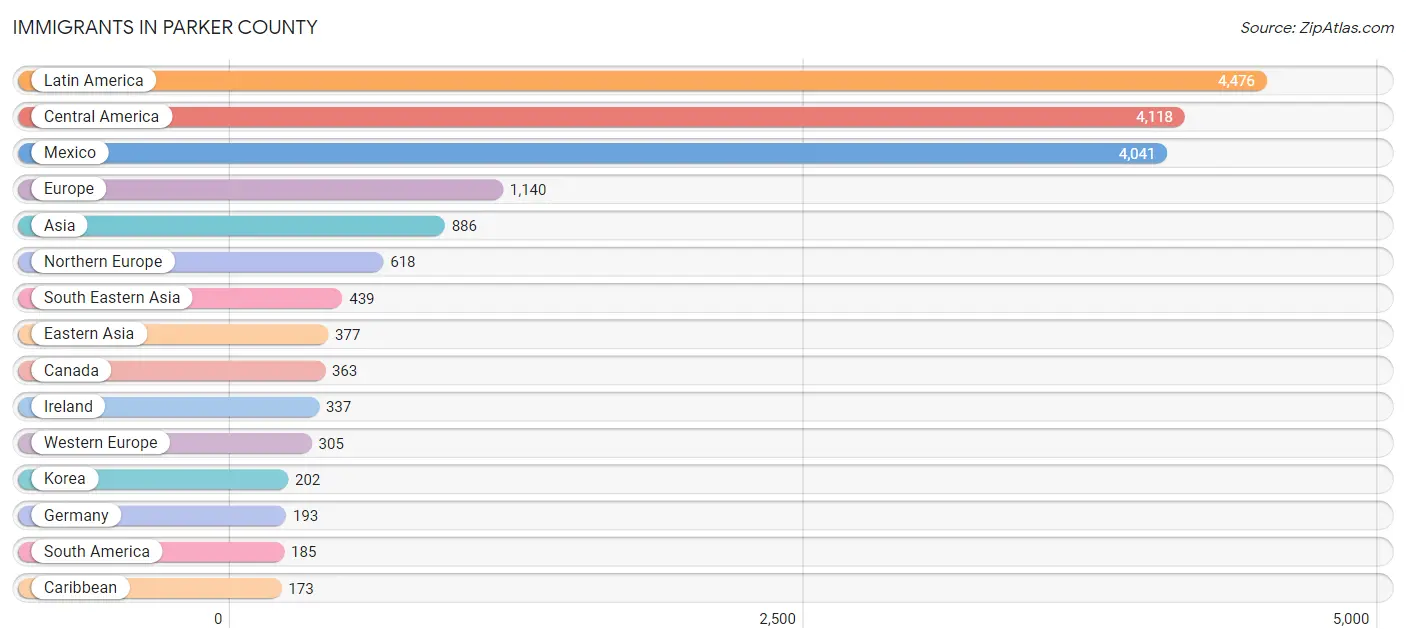
Immigrants in Parker County
The most numerous immigrant groups reported in Parker County came from Latin America (4,476 | 3.0%), Central America (4,118 | 2.7%), Mexico (4,041 | 2.7%), Europe (1,140 | 0.7%), and Asia (886 | 0.6%), together accounting for 9.7% of all Parker County residents.
| Immigration Origin | # Population | % Population |
| Africa | 65 | 0.0% |
| Argentina | 31 | 0.0% |
| Asia | 886 | 0.6% |
| Australia | 70 | 0.1% |
| Belgium | 22 | 0.0% |
| Brazil | 25 | 0.0% |
| Cambodia | 9 | 0.0% |
| Canada | 363 | 0.2% |
| Caribbean | 173 | 0.1% |
| Central America | 4,118 | 2.7% |
| China | 169 | 0.1% |
| Colombia | 38 | 0.0% |
| Costa Rica | 7 | 0.0% |
| Cuba | 173 | 0.1% |
| Denmark | 18 | 0.0% |
| Eastern Asia | 377 | 0.3% |
| Eastern Europe | 172 | 0.1% |
| Egypt | 11 | 0.0% |
| England | 165 | 0.1% |
| Europe | 1,140 | 0.7% |
| France | 52 | 0.0% |
| Germany | 193 | 0.1% |
| Guatemala | 67 | 0.0% |
| Honduras | 1 | 0.0% |
| Hong Kong | 10 | 0.0% |
| Hungary | 1 | 0.0% |
| India | 12 | 0.0% |
| Iran | 20 | 0.0% |
| Ireland | 337 | 0.2% |
| Italy | 45 | 0.0% |
| Japan | 6 | 0.0% |
| Korea | 202 | 0.1% |
| Laos | 16 | 0.0% |
| Latin America | 4,476 | 3.0% |
| Malaysia | 46 | 0.0% |
| Mexico | 4,041 | 2.7% |
| Netherlands | 38 | 0.0% |
| Nicaragua | 2 | 0.0% |
| Nigeria | 20 | 0.0% |
| Northern Africa | 11 | 0.0% |
| Northern Europe | 618 | 0.4% |
| Oceania | 83 | 0.1% |
| Peru | 26 | 0.0% |
| Philippines | 158 | 0.1% |
| Poland | 89 | 0.1% |
| Russia | 82 | 0.1% |
| Saudi Arabia | 5 | 0.0% |
| Scotland | 17 | 0.0% |
| South Africa | 19 | 0.0% |
| South America | 185 | 0.1% |
| South Central Asia | 42 | 0.0% |
| South Eastern Asia | 439 | 0.3% |
| Southern Europe | 45 | 0.0% |
| Sri Lanka | 10 | 0.0% |
| Taiwan | 11 | 0.0% |
| Thailand | 52 | 0.0% |
| Venezuela | 65 | 0.0% |
| Vietnam | 144 | 0.1% |
| Western Africa | 35 | 0.0% |
| Western Asia | 19 | 0.0% |
| Western Europe | 305 | 0.2% | View All 61 Rows |
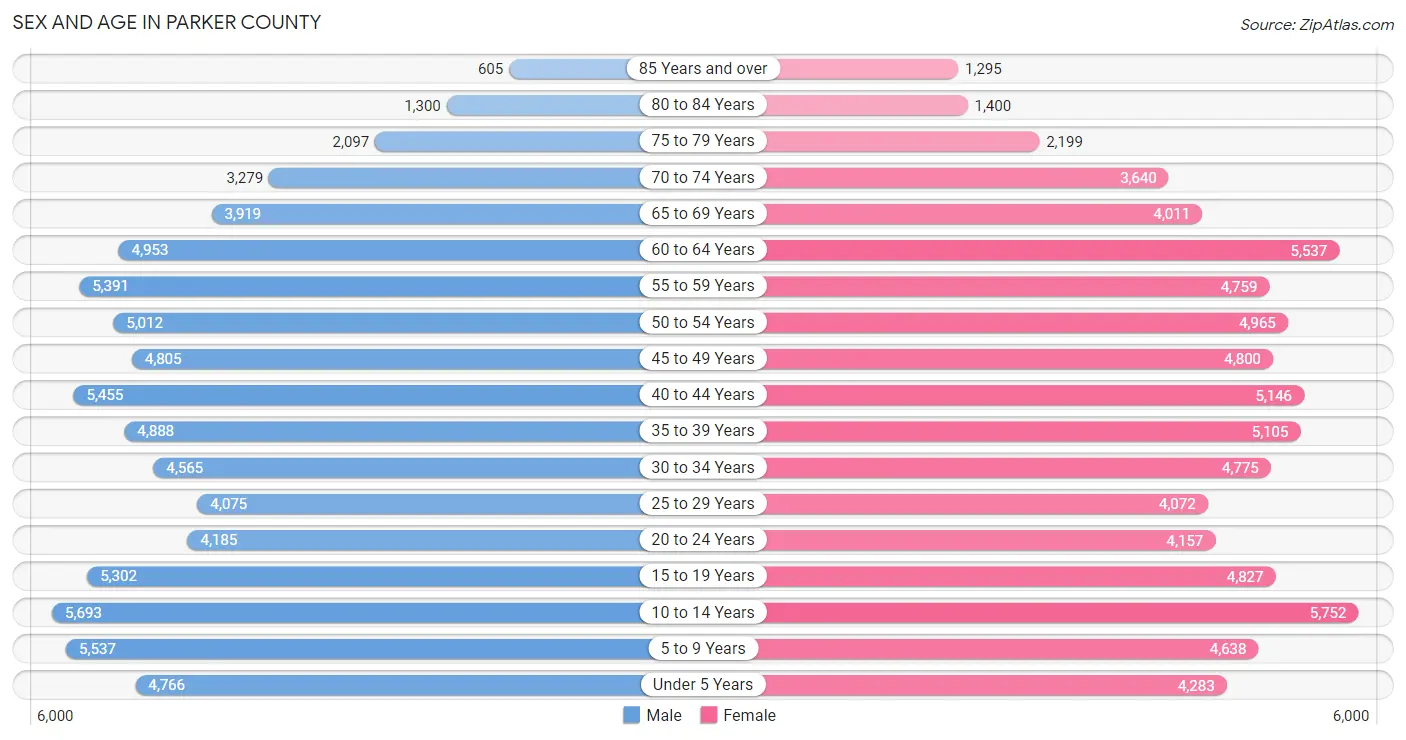
Sex and Age in Parker County
Sex and Age in Parker County
The most populous age groups in Parker County are 10 to 14 Years (5,693 | 7.5%) for men and 10 to 14 Years (5,752 | 7.6%) for women.
| Age Bracket | Male | Female |
| Under 5 Years | 4,766 (6.3%) | 4,283 (5.7%) |
| 5 to 9 Years | 5,537 (7.3%) | 4,638 (6.1%) |
| 10 to 14 Years | 5,693 (7.5%) | 5,752 (7.6%) |
| 15 to 19 Years | 5,302 (7.0%) | 4,827 (6.4%) |
| 20 to 24 Years | 4,185 (5.5%) | 4,157 (5.5%) |
| 25 to 29 Years | 4,075 (5.4%) | 4,072 (5.4%) |
| 30 to 34 Years | 4,565 (6.0%) | 4,775 (6.3%) |
| 35 to 39 Years | 4,888 (6.5%) | 5,105 (6.8%) |
| 40 to 44 Years | 5,455 (7.2%) | 5,146 (6.8%) |
| 45 to 49 Years | 4,805 (6.3%) | 4,800 (6.4%) |
| 50 to 54 Years | 5,012 (6.6%) | 4,965 (6.6%) |
| 55 to 59 Years | 5,391 (7.1%) | 4,759 (6.3%) |
| 60 to 64 Years | 4,953 (6.5%) | 5,537 (7.3%) |
| 65 to 69 Years | 3,919 (5.2%) | 4,011 (5.3%) |
| 70 to 74 Years | 3,279 (4.3%) | 3,640 (4.8%) |
| 75 to 79 Years | 2,097 (2.8%) | 2,199 (2.9%) |
| 80 to 84 Years | 1,300 (1.7%) | 1,400 (1.9%) |
| 85 Years and over | 605 (0.8%) | 1,295 (1.7%) |
| Total | 75,827 (100.0%) | 75,361 (100.0%) |
Families and Households in Parker County
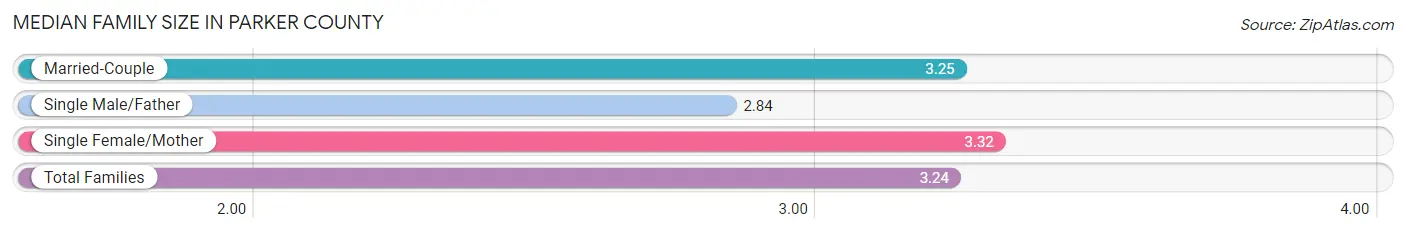
Median Family Size in Parker County
The median family size in Parker County is 3.24 persons per family, with single female/mother families (4,492 | 11.1%) accounting for the largest median family size of 3.32 persons per family. On the other hand, single male/father families (1,982 | 4.9%) represent the smallest median family size with 2.84 persons per family.
| Family Type | # Families | Family Size |
| Married-Couple | 34,032 (84.0%) | 3.25 |
| Single Male/Father | 1,982 (4.9%) | 2.84 |
| Single Female/Mother | 4,492 (11.1%) | 3.32 |
| Total Families | 40,506 (100.0%) | 3.24 |
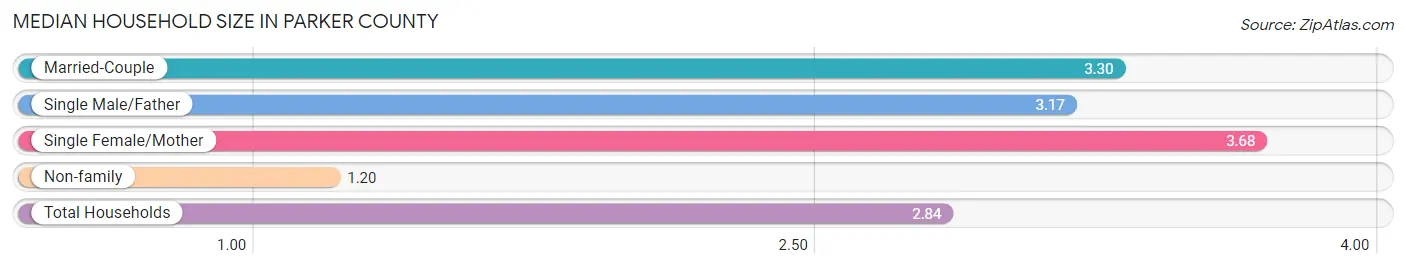
Median Household Size in Parker County
The median household size in Parker County is 2.84 persons per household, with single female/mother households (4,492 | 8.5%) accounting for the largest median household size of 3.68 persons per household. non-family households (12,116 | 23.0%) represent the smallest median household size with 1.20 persons per household.
| Household Type | # Households | Household Size |
| Married-Couple | 34,032 (64.7%) | 3.30 |
| Single Male/Father | 1,982 (3.8%) | 3.17 |
| Single Female/Mother | 4,492 (8.5%) | 3.68 |
| Non-family | 12,116 (23.0%) | 1.20 |
| Total Households | 52,622 (100.0%) | 2.84 |
Household Size by Marriage Status in Parker County
Out of a total of 52,622 households in Parker County, 40,506 (77.0%) are family households, while 12,116 (23.0%) are nonfamily households. The most numerous type of family households are 2-person households, comprising 17,613, and the most common type of nonfamily households are 1-person households, comprising 10,658.
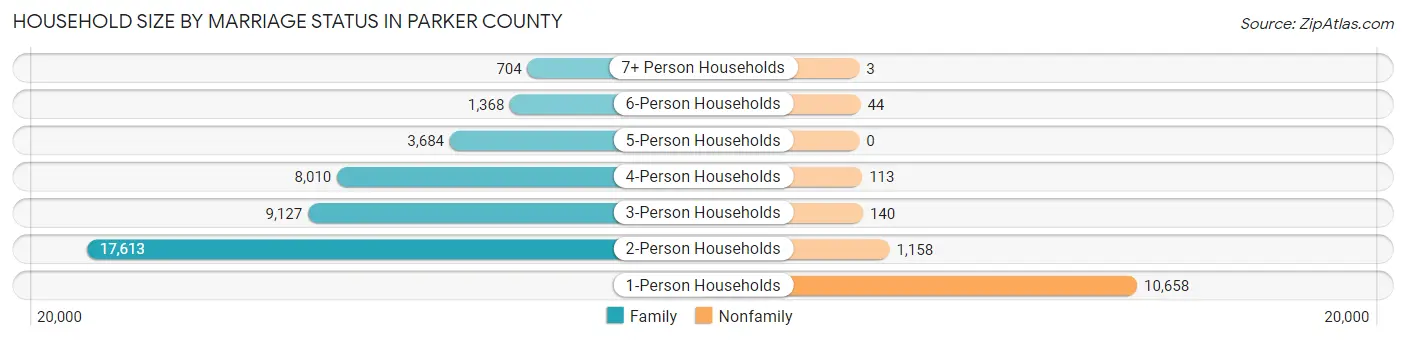
| Household Size | Family Households | Nonfamily Households |
| 1-Person Households | - | 10,658 (20.3%) |
| 2-Person Households | 17,613 (33.5%) | 1,158 (2.2%) |
| 3-Person Households | 9,127 (17.3%) | 140 (0.3%) |
| 4-Person Households | 8,010 (15.2%) | 113 (0.2%) |
| 5-Person Households | 3,684 (7.0%) | 0 (0.0%) |
| 6-Person Households | 1,368 (2.6%) | 44 (0.1%) |
| 7+ Person Households | 704 (1.3%) | 3 (0.0%) |
| Total | 40,506 (77.0%) | 12,116 (23.0%) |
Female Fertility in Parker County
Fertility by Age in Parker County
Average fertility rate in Parker County is 59.0 births per 1,000 women. Women in the age bracket of 20 to 34 years have the highest fertility rate with 119.0 births per 1,000 women. Women in the age bracket of 20 to 34 years acount for 76.3% of all women with births.
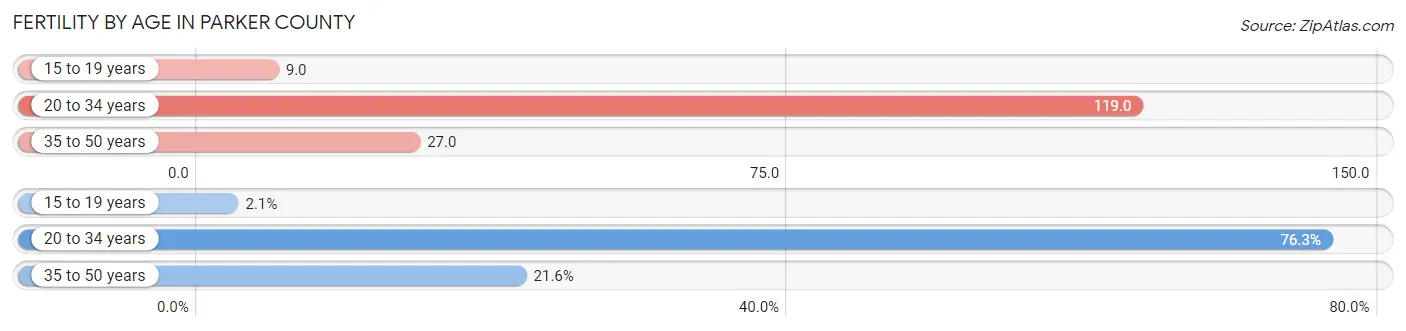
| Age Bracket | Women with Births | Births / 1,000 Women |
| 15 to 19 years | 42 (2.1%) | 9.0 |
| 20 to 34 years | 1,546 (76.3%) | 119.0 |
| 35 to 50 years | 438 (21.6%) | 27.0 |
| Total | 2,026 (100.0%) | 59.0 |
Fertility by Age by Marriage Status in Parker County
73.7% of women with births (2,026) in Parker County are married. The highest percentage of unmarried women with births falls into 15 to 19 years age bracket with 73.8% of them unmarried at the time of birth, while the lowest percentage of unmarried women with births belong to 20 to 34 years age bracket with 25.2% of them unmarried.
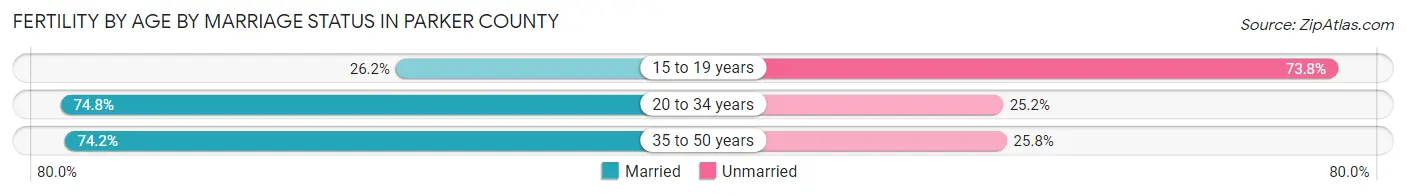
| Age Bracket | Married | Unmarried |
| 15 to 19 years | 11 (26.2%) | 31 (73.8%) |
| 20 to 34 years | 1,156 (74.8%) | 390 (25.2%) |
| 35 to 50 years | 325 (74.2%) | 113 (25.8%) |
| Total | 1,493 (73.7%) | 533 (26.3%) |
Fertility by Education in Parker County
Average fertility rate in Parker County is 59.0 births per 1,000 women. Women with the education attainment of graduate degree have the highest fertility rate of 117.0 births per 1,000 women, while women with the education attainment of less than high school have the lowest fertility at 27.0 births per 1,000 women. Women with the education attainment of bachelor's degree represent 27.1% of all women with births.
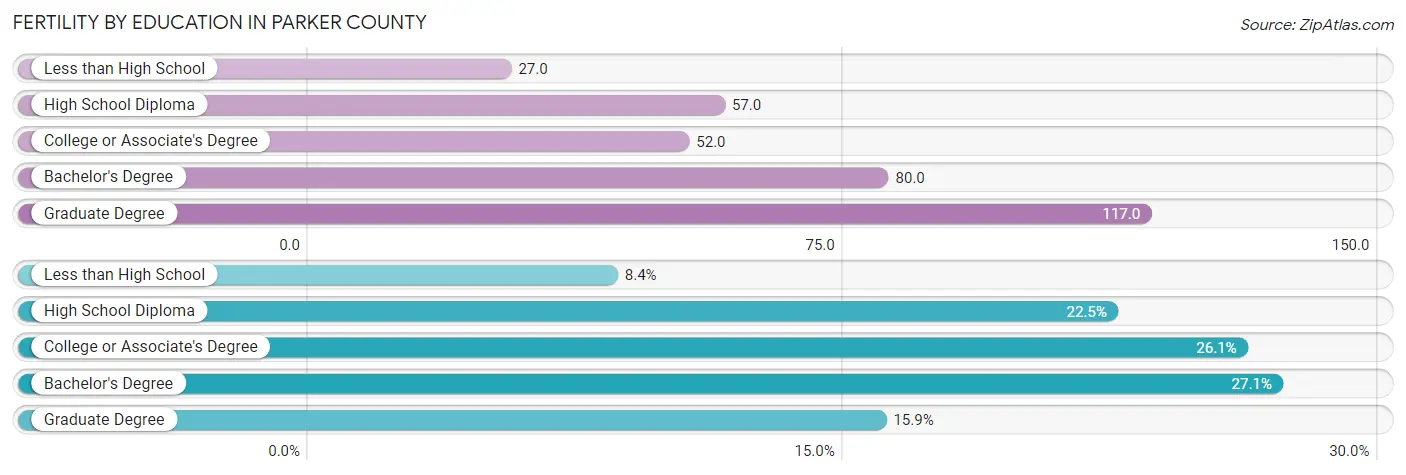
| Educational Attainment | Women with Births | Births / 1,000 Women |
| Less than High School | 170 (8.4%) | 27.0 |
| High School Diploma | 455 (22.5%) | 57.0 |
| College or Associate's Degree | 529 (26.1%) | 52.0 |
| Bachelor's Degree | 549 (27.1%) | 80.0 |
| Graduate Degree | 323 (15.9%) | 117.0 |
| Total | 2,026 (100.0%) | 59.0 |
Fertility by Education by Marriage Status in Parker County
26.3% of women with births in Parker County are unmarried. Women with the educational attainment of graduate degree are most likely to be married with 100.0% of them married at childbirth, while women with the educational attainment of less than high school are least likely to be married with 51.8% of them unmarried at childbirth.
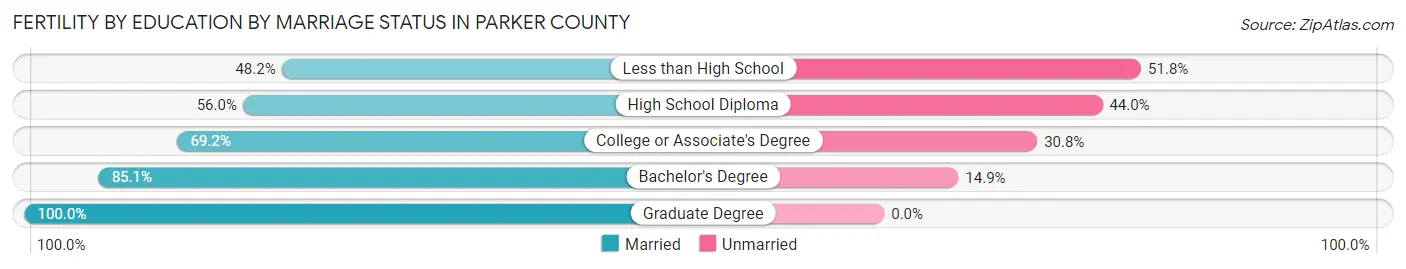
| Educational Attainment | Married | Unmarried |
| Less than High School | 82 (48.2%) | 88 (51.8%) |
| High School Diploma | 255 (56.0%) | 200 (44.0%) |
| College or Associate's Degree | 366 (69.2%) | 163 (30.8%) |
| Bachelor's Degree | 467 (85.1%) | 82 (14.9%) |
| Graduate Degree | 323 (100.0%) | 0 (0.0%) |
| Total | 1,493 (73.7%) | 533 (26.3%) |
Employment Characteristics in Parker County
Employment by Class of Employer in Parker County
Among the 71,963 employed individuals in Parker County, private company employees (47,191 | 65.6%), local government employees (6,652 | 9.2%), and self-employed (not incorporated) (6,640 | 9.2%) make up the most common classes of employment.
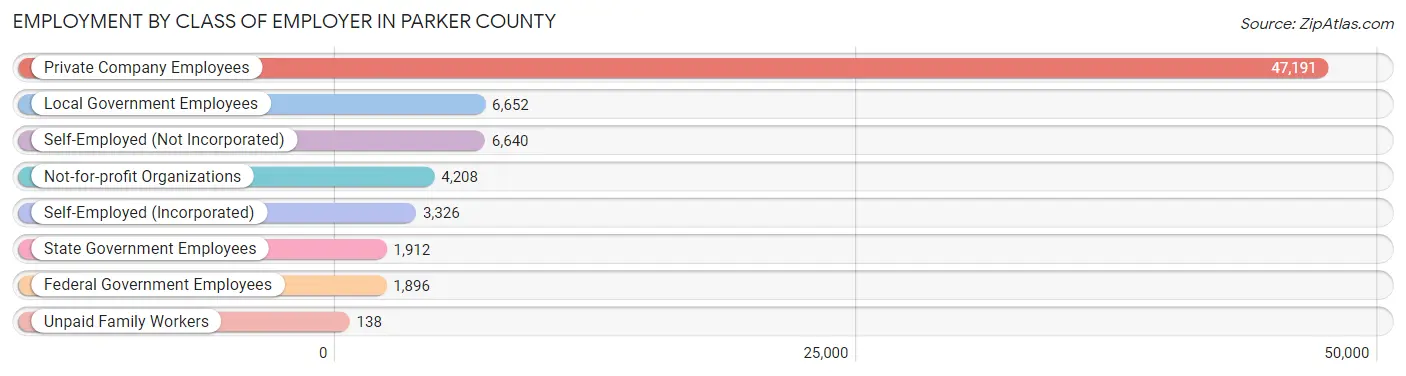
| Employer Class | # Employees | % Employees |
| Private Company Employees | 47,191 | 65.6% |
| Self-Employed (Incorporated) | 3,326 | 4.6% |
| Self-Employed (Not Incorporated) | 6,640 | 9.2% |
| Not-for-profit Organizations | 4,208 | 5.9% |
| Local Government Employees | 6,652 | 9.2% |
| State Government Employees | 1,912 | 2.7% |
| Federal Government Employees | 1,896 | 2.6% |
| Unpaid Family Workers | 138 | 0.2% |
| Total | 71,963 | 100.0% |
Employment Status by Age in Parker County
According to the labor force statistics for Parker County, out of the total population over 16 years of age (118,070), 64.5% or 76,155 individuals are in the labor force, with 3.9% or 2,970 of them unemployed. The age group with the highest labor force participation rate is 45 to 54 years, with 83.4% or 16,331 individuals in the labor force. Within the labor force, the 16 to 19 years age range has the highest percentage of unemployed individuals, with 10.8% or 367 of them being unemployed.
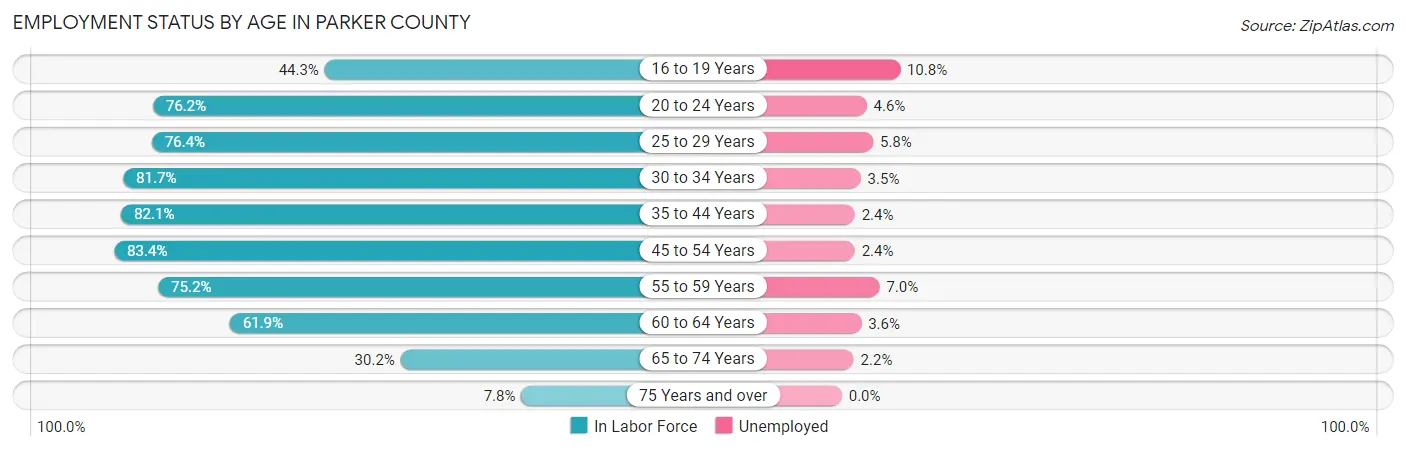
| Age Bracket | In Labor Force | Unemployed |
| 16 to 19 Years | 3,402 (44.3%) | 367 (10.8%) |
| 20 to 24 Years | 6,357 (76.2%) | 292 (4.6%) |
| 25 to 29 Years | 6,224 (76.4%) | 361 (5.8%) |
| 30 to 34 Years | 7,631 (81.7%) | 267 (3.5%) |
| 35 to 44 Years | 16,908 (82.1%) | 406 (2.4%) |
| 45 to 54 Years | 16,331 (83.4%) | 392 (2.4%) |
| 55 to 59 Years | 7,633 (75.2%) | 534 (7.0%) |
| 60 to 64 Years | 6,493 (61.9%) | 234 (3.6%) |
| 65 to 74 Years | 4,484 (30.2%) | 99 (2.2%) |
| 75 Years and over | 694 (7.8%) | 0 (0.0%) |
| Total | 76,155 (64.5%) | 2,970 (3.9%) |
Employment Status by Educational Attainment in Parker County
According to labor force statistics for Parker County, 78.2% of individuals (61,233) out of the total population between 25 and 64 years of age (78,303) are in the labor force, with 3.6% or 2,204 of them being unemployed. The group with the highest labor force participation rate are those with the educational attainment of bachelor's degree or higher, with 85.2% or 21,329 individuals in the labor force. Within the labor force, individuals with less than high school education have the highest percentage of unemployment, with 8.7% or 470 of them being unemployed.
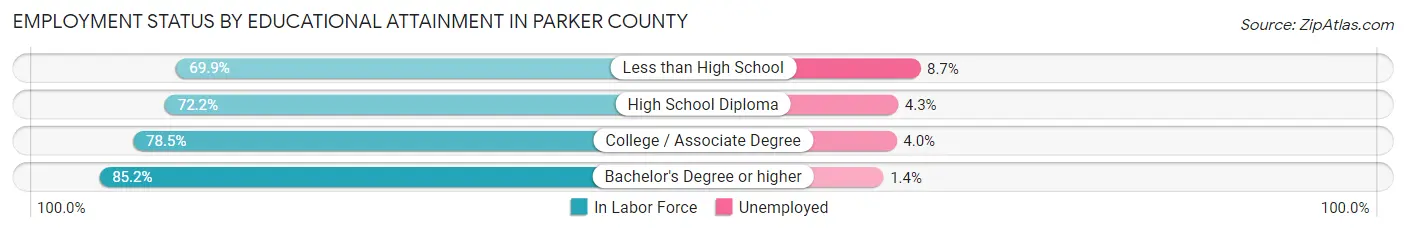
| Educational Attainment | In Labor Force | Unemployed |
| Less than High School | 5,399 (69.9%) | 672 (8.7%) |
| High School Diploma | 14,390 (72.2%) | 857 (4.3%) |
| College / Associate Degree | 20,107 (78.5%) | 1,025 (4.0%) |
| Bachelor's Degree or higher | 21,329 (85.2%) | 350 (1.4%) |
| Total | 61,233 (78.2%) | 2,819 (3.6%) |
Employment Occupations by Sex in Parker County
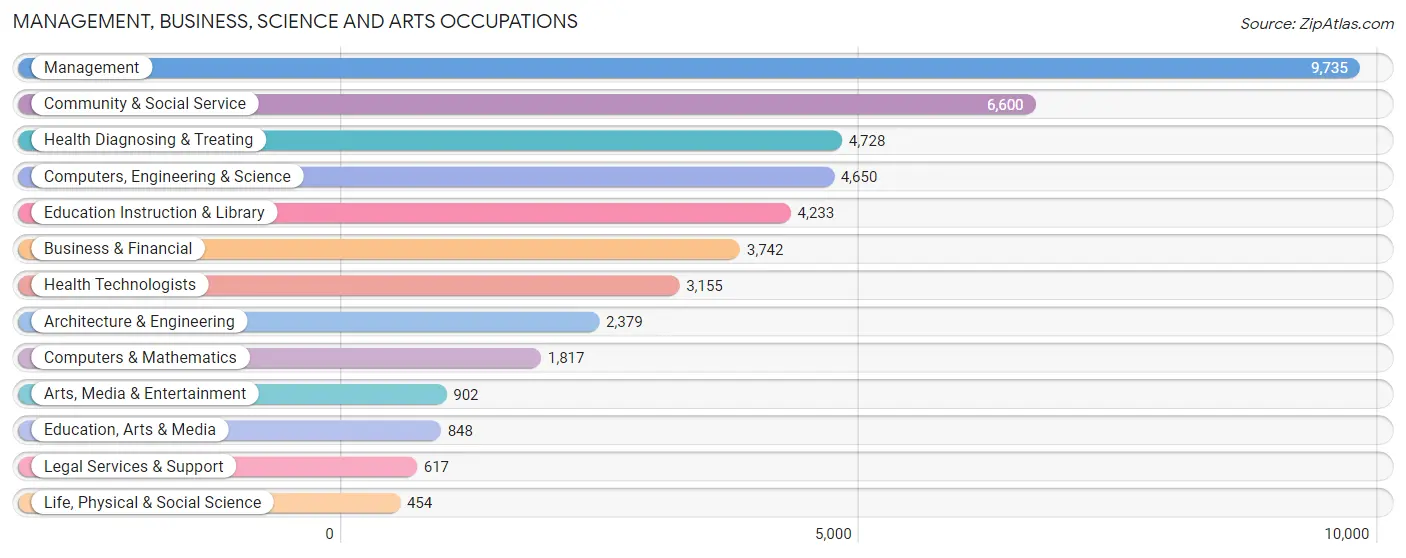
Management, Business, Science and Arts Occupations
The most common Management, Business, Science and Arts occupations in Parker County are Management (9,735 | 13.4%), Community & Social Service (6,600 | 9.0%), Health Diagnosing & Treating (4,728 | 6.5%), Computers, Engineering & Science (4,650 | 6.4%), and Education Instruction & Library (4,233 | 5.8%).
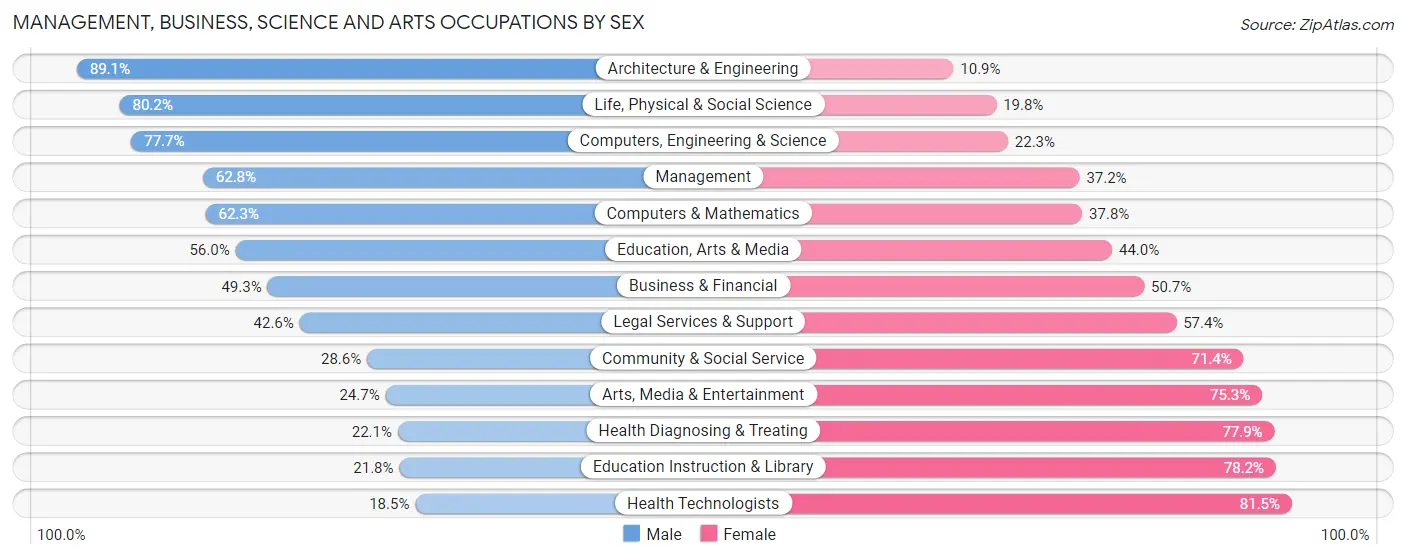
Management, Business, Science and Arts Occupations by Sex
Within the Management, Business, Science and Arts occupations in Parker County, the most male-oriented occupations are Architecture & Engineering (89.1%), Life, Physical & Social Science (80.2%), and Computers, Engineering & Science (77.7%), while the most female-oriented occupations are Health Technologists (81.5%), Education Instruction & Library (78.2%), and Health Diagnosing & Treating (77.9%).
| Occupation | Male | Female |
| Management | 6,115 (62.8%) | 3,620 (37.2%) |
| Business & Financial | 1,846 (49.3%) | 1,896 (50.7%) |
| Computers, Engineering & Science | 3,615 (77.7%) | 1,035 (22.3%) |
| Computers & Mathematics | 1,131 (62.3%) | 686 (37.8%) |
| Architecture & Engineering | 2,120 (89.1%) | 259 (10.9%) |
| Life, Physical & Social Science | 364 (80.2%) | 90 (19.8%) |
| Community & Social Service | 1,885 (28.6%) | 4,715 (71.4%) |
| Education, Arts & Media | 475 (56.0%) | 373 (44.0%) |
| Legal Services & Support | 263 (42.6%) | 354 (57.4%) |
| Education Instruction & Library | 924 (21.8%) | 3,309 (78.2%) |
| Arts, Media & Entertainment | 223 (24.7%) | 679 (75.3%) |
| Health Diagnosing & Treating | 1,047 (22.1%) | 3,681 (77.9%) |
| Health Technologists | 584 (18.5%) | 2,571 (81.5%) |
| Total (Category) | 14,508 (49.2%) | 14,947 (50.7%) |
| Total (Overall) | 39,187 (53.7%) | 33,722 (46.3%) |
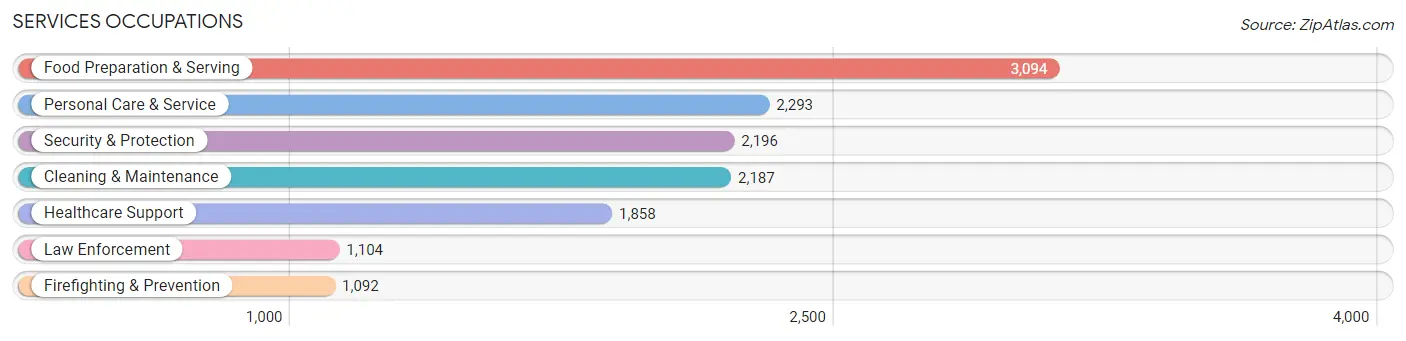
Services Occupations
The most common Services occupations in Parker County are Food Preparation & Serving (3,094 | 4.2%), Personal Care & Service (2,293 | 3.2%), Security & Protection (2,196 | 3.0%), Cleaning & Maintenance (2,187 | 3.0%), and Healthcare Support (1,858 | 2.5%).
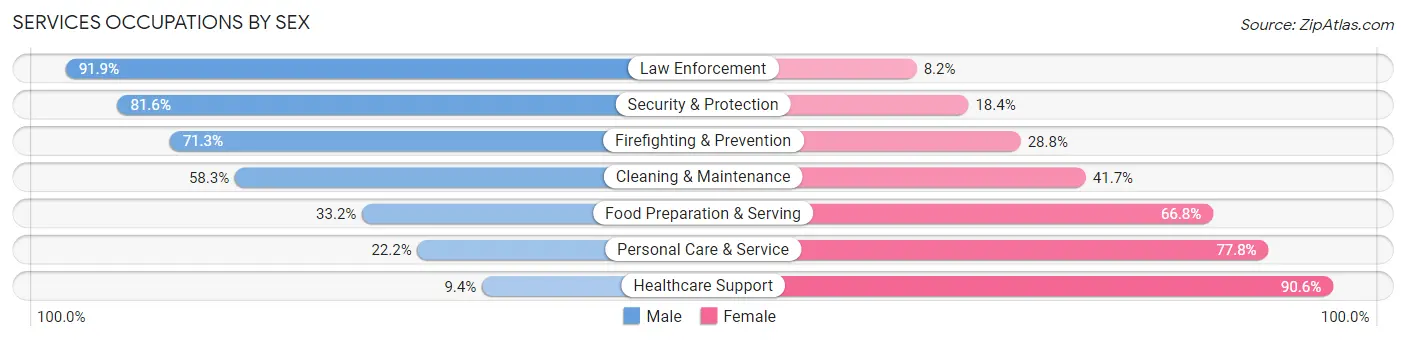
Services Occupations by Sex
Within the Services occupations in Parker County, the most male-oriented occupations are Law Enforcement (91.8%), Security & Protection (81.6%), and Firefighting & Prevention (71.3%), while the most female-oriented occupations are Healthcare Support (90.6%), Personal Care & Service (77.8%), and Food Preparation & Serving (66.8%).
| Occupation | Male | Female |
| Healthcare Support | 175 (9.4%) | 1,683 (90.6%) |
| Security & Protection | 1,792 (81.6%) | 404 (18.4%) |
| Firefighting & Prevention | 778 (71.3%) | 314 (28.7%) |
| Law Enforcement | 1,014 (91.8%) | 90 (8.2%) |
| Food Preparation & Serving | 1,026 (33.2%) | 2,068 (66.8%) |
| Cleaning & Maintenance | 1,276 (58.3%) | 911 (41.7%) |
| Personal Care & Service | 509 (22.2%) | 1,784 (77.8%) |
| Total (Category) | 4,778 (41.1%) | 6,850 (58.9%) |
| Total (Overall) | 39,187 (53.7%) | 33,722 (46.3%) |
Sales and Office Occupations
The most common Sales and Office occupations in Parker County are Sales & Related (7,562 | 10.4%), and Office & Administration (7,522 | 10.3%).

Sales and Office Occupations by Sex
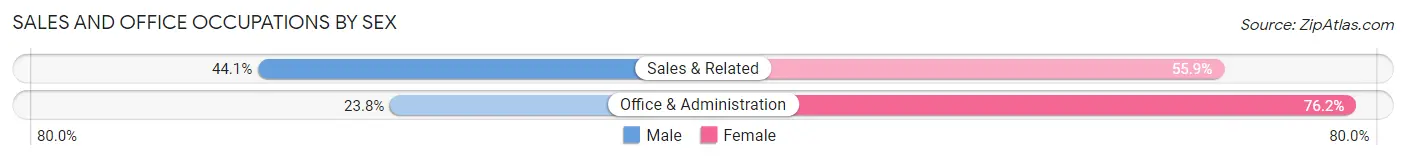
| Occupation | Male | Female |
| Sales & Related | 3,334 (44.1%) | 4,228 (55.9%) |
| Office & Administration | 1,787 (23.8%) | 5,735 (76.2%) |
| Total (Category) | 5,121 (34.0%) | 9,963 (66.0%) |
| Total (Overall) | 39,187 (53.7%) | 33,722 (46.3%) |
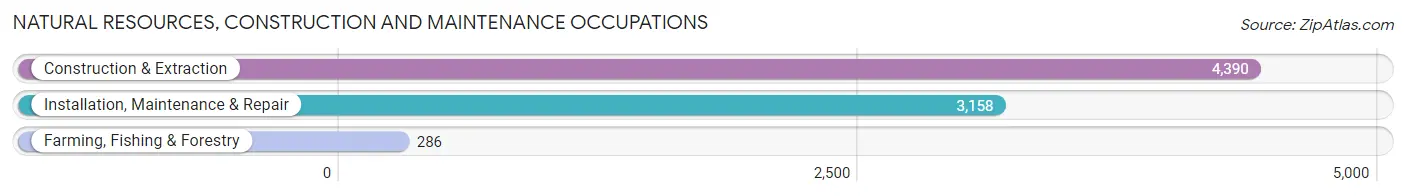
Natural Resources, Construction and Maintenance Occupations
The most common Natural Resources, Construction and Maintenance occupations in Parker County are Construction & Extraction (4,390 | 6.0%), Installation, Maintenance & Repair (3,158 | 4.3%), and Farming, Fishing & Forestry (286 | 0.4%).
Natural Resources, Construction and Maintenance Occupations by Sex
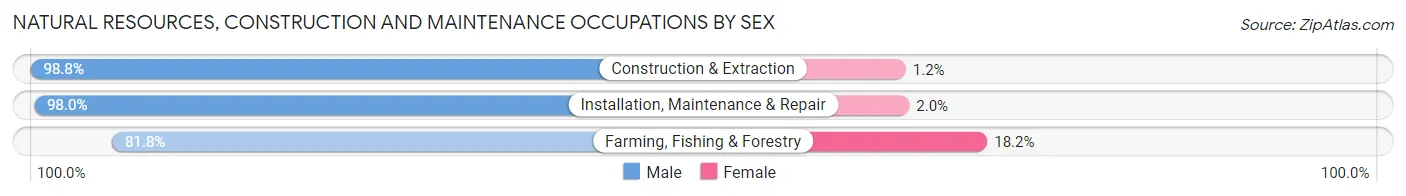
| Occupation | Male | Female |
| Farming, Fishing & Forestry | 234 (81.8%) | 52 (18.2%) |
| Construction & Extraction | 4,336 (98.8%) | 54 (1.2%) |
| Installation, Maintenance & Repair | 3,096 (98.0%) | 62 (2.0%) |
| Total (Category) | 7,666 (97.9%) | 168 (2.1%) |
| Total (Overall) | 39,187 (53.7%) | 33,722 (46.3%) |
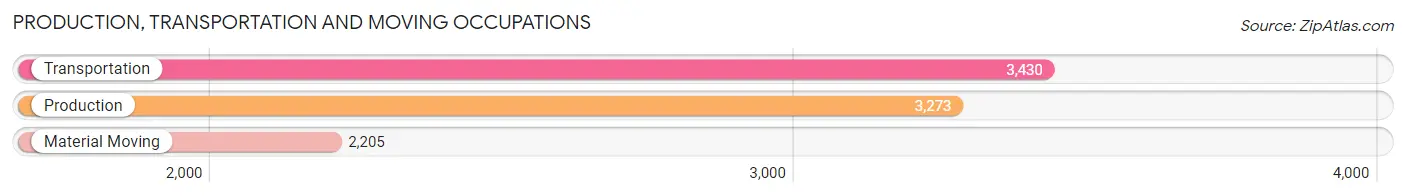
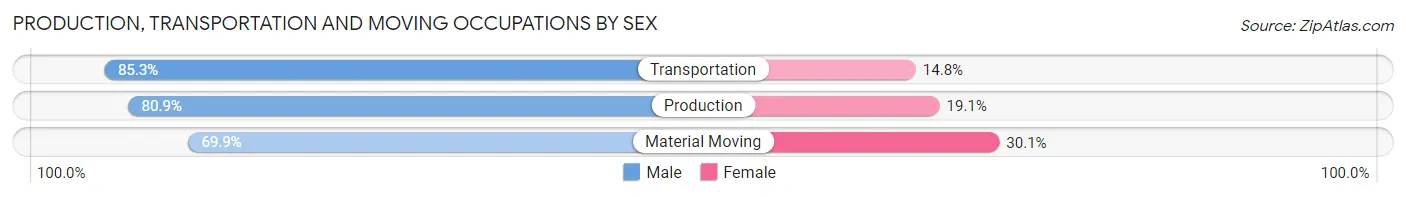
Production, Transportation and Moving Occupations
The most common Production, Transportation and Moving occupations in Parker County are Transportation (3,430 | 4.7%), Production (3,273 | 4.5%), and Material Moving (2,205 | 3.0%).
Production, Transportation and Moving Occupations by Sex
| Occupation | Male | Female |
| Production | 2,648 (80.9%) | 625 (19.1%) |
| Transportation | 2,924 (85.3%) | 506 (14.7%) |
| Material Moving | 1,542 (69.9%) | 663 (30.1%) |
| Total (Category) | 7,114 (79.9%) | 1,794 (20.1%) |
| Total (Overall) | 39,187 (53.7%) | 33,722 (46.3%) |
Employment Industries by Sex in Parker County
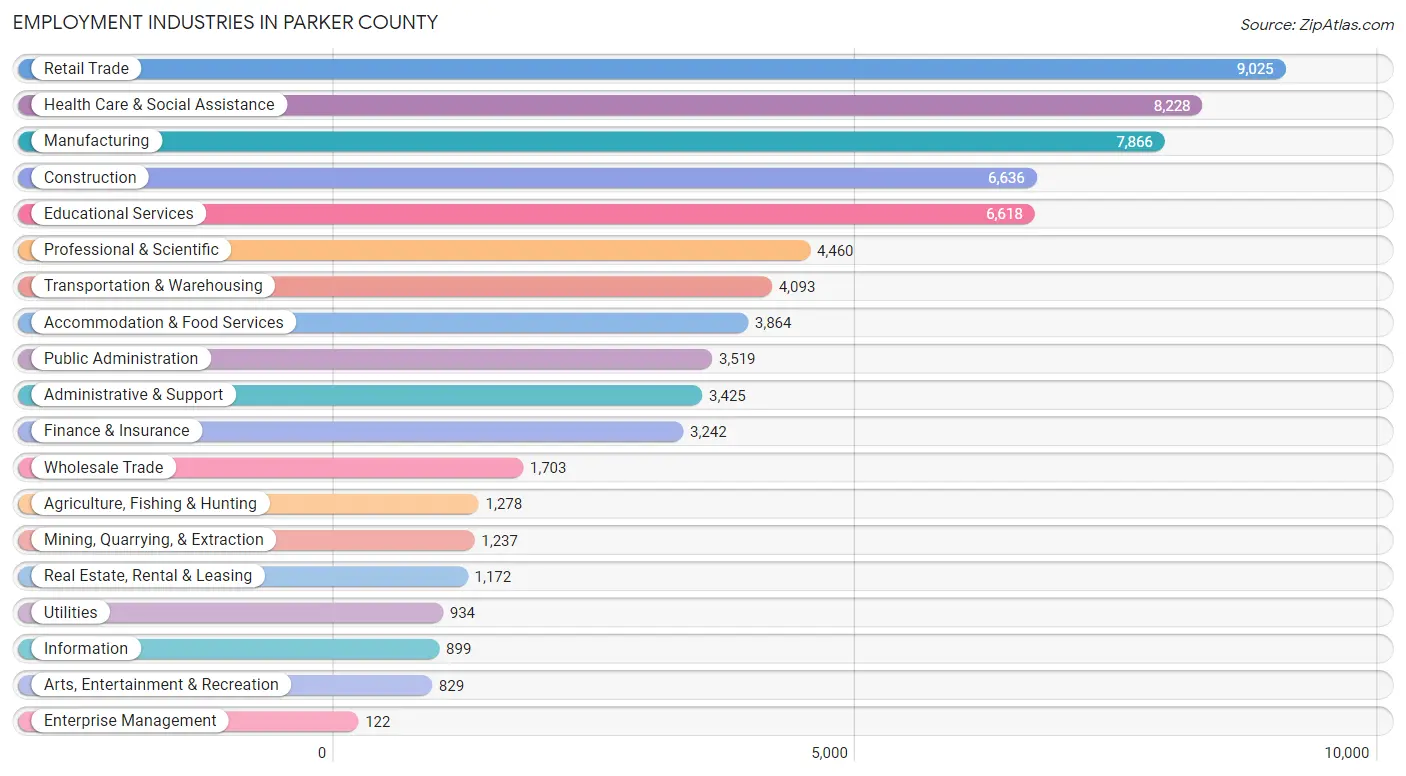
Employment Industries in Parker County
The major employment industries in Parker County include Retail Trade (9,025 | 12.4%), Health Care & Social Assistance (8,228 | 11.3%), Manufacturing (7,866 | 10.8%), Construction (6,636 | 9.1%), and Educational Services (6,618 | 9.1%).
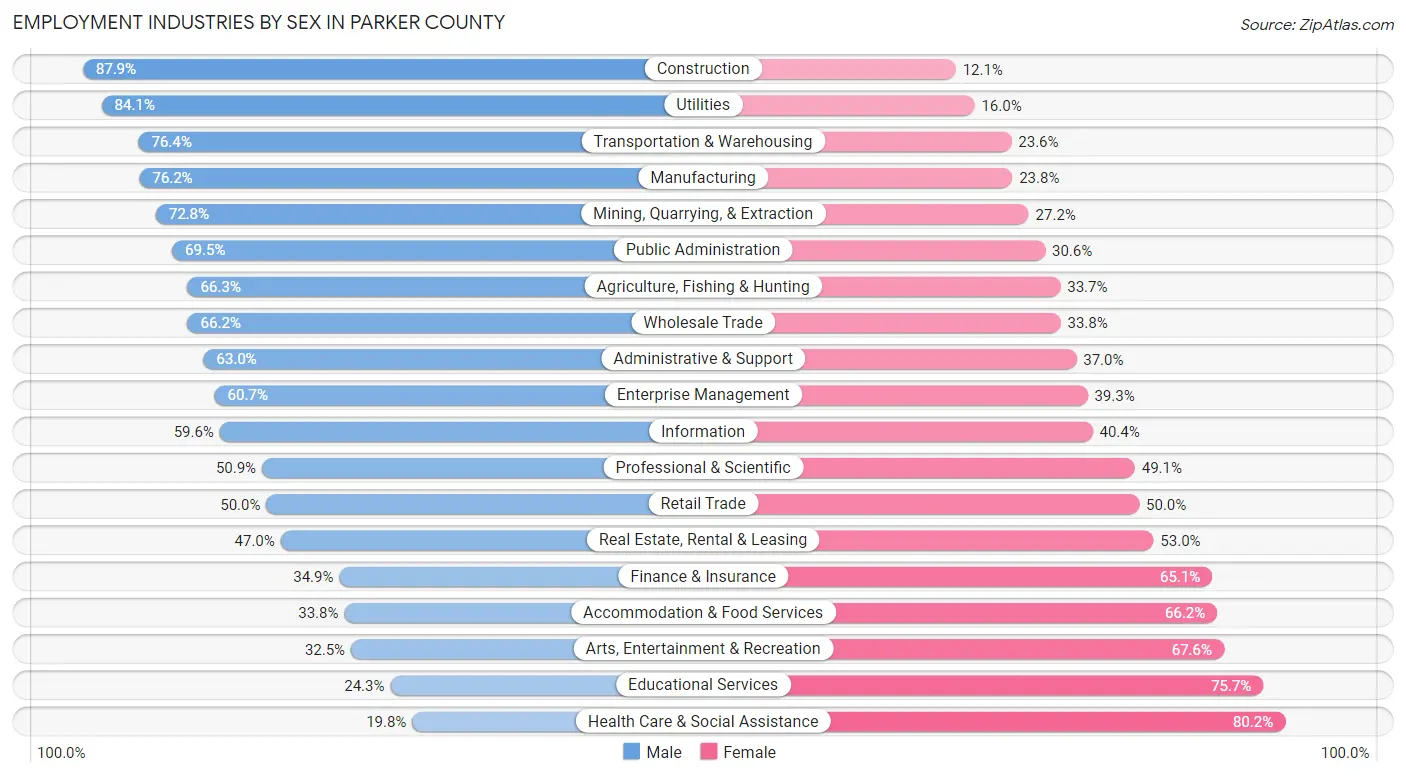
Employment Industries by Sex in Parker County
The Parker County industries that see more men than women are Construction (87.9%), Utilities (84.1%), and Transportation & Warehousing (76.4%), whereas the industries that tend to have a higher number of women are Health Care & Social Assistance (80.2%), Educational Services (75.7%), and Arts, Entertainment & Recreation (67.5%).
| Industry | Male | Female |
| Agriculture, Fishing & Hunting | 847 (66.3%) | 431 (33.7%) |
| Mining, Quarrying, & Extraction | 901 (72.8%) | 336 (27.2%) |
| Construction | 5,836 (87.9%) | 800 (12.1%) |
| Manufacturing | 5,996 (76.2%) | 1,870 (23.8%) |
| Wholesale Trade | 1,128 (66.2%) | 575 (33.8%) |
| Retail Trade | 4,510 (50.0%) | 4,515 (50.0%) |
| Transportation & Warehousing | 3,128 (76.4%) | 965 (23.6%) |
| Utilities | 785 (84.1%) | 149 (16.0%) |
| Information | 536 (59.6%) | 363 (40.4%) |
| Finance & Insurance | 1,130 (34.9%) | 2,112 (65.1%) |
| Real Estate, Rental & Leasing | 551 (47.0%) | 621 (53.0%) |
| Professional & Scientific | 2,269 (50.9%) | 2,191 (49.1%) |
| Enterprise Management | 74 (60.7%) | 48 (39.3%) |
| Administrative & Support | 2,157 (63.0%) | 1,268 (37.0%) |
| Educational Services | 1,608 (24.3%) | 5,010 (75.7%) |
| Health Care & Social Assistance | 1,627 (19.8%) | 6,601 (80.2%) |
| Arts, Entertainment & Recreation | 269 (32.5%) | 560 (67.5%) |
| Accommodation & Food Services | 1,307 (33.8%) | 2,557 (66.2%) |
| Public Administration | 2,444 (69.5%) | 1,075 (30.5%) |
| Total | 39,187 (53.7%) | 33,722 (46.3%) |
Education in Parker County
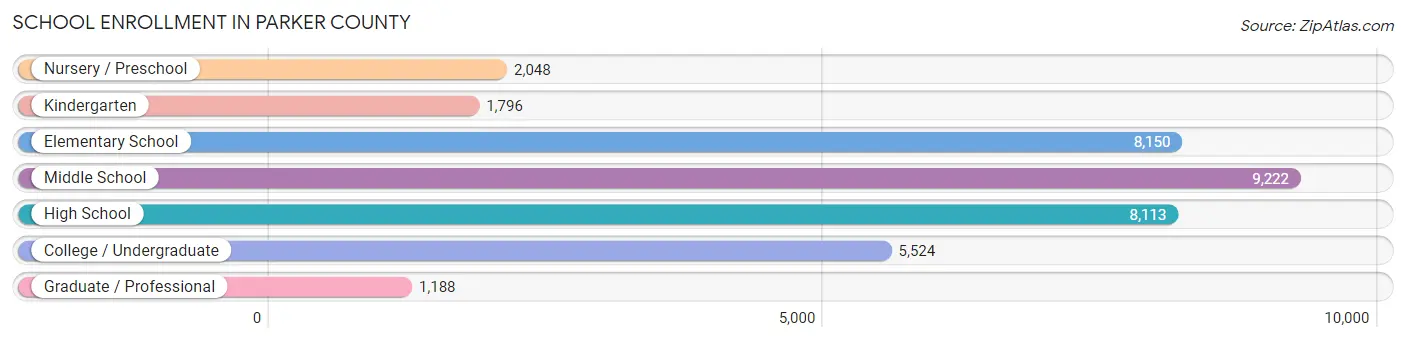
School Enrollment in Parker County
The most common levels of schooling among the 36,041 students in Parker County are middle school (9,222 | 25.6%), elementary school (8,150 | 22.6%), and high school (8,113 | 22.5%).
| School Level | # Students | % Students |
| Nursery / Preschool | 2,048 | 5.7% |
| Kindergarten | 1,796 | 5.0% |
| Elementary School | 8,150 | 22.6% |
| Middle School | 9,222 | 25.6% |
| High School | 8,113 | 22.5% |
| College / Undergraduate | 5,524 | 15.3% |
| Graduate / Professional | 1,188 | 3.3% |
| Total | 36,041 | 100.0% |
School Enrollment by Age by Funding Source in Parker County
Out of a total of 36,041 students who are enrolled in schools in Parker County, 5,983 (16.6%) attend a private institution, while the remaining 30,058 (83.4%) are enrolled in public schools. The age group of 3 to 4 year olds has the highest likelihood of being enrolled in private schools, with 918 (62.9% in the age bracket) enrolled. Conversely, the age group of 20 to 24 year olds has the lowest likelihood of being enrolled in a private school, with 2,174 (89.2% in the age bracket) attending a public institution.
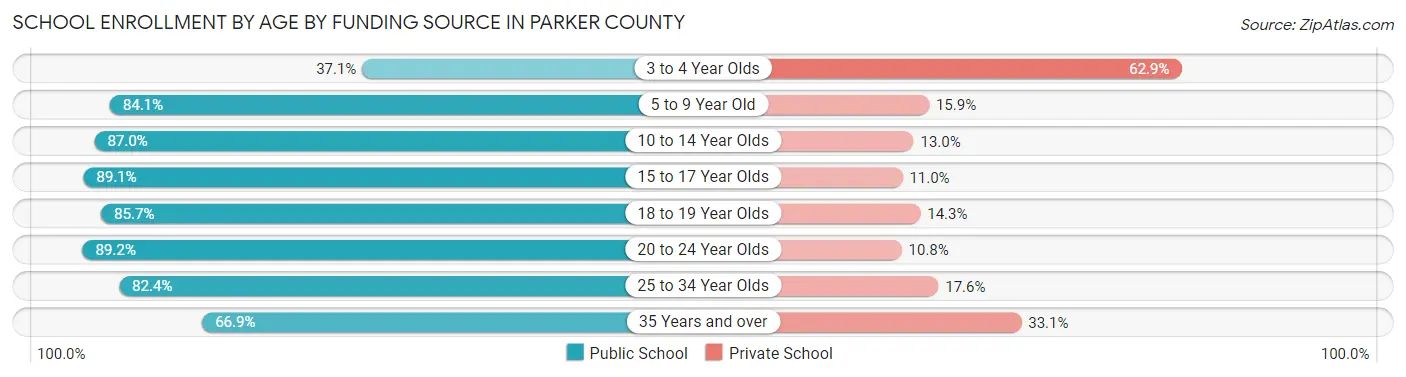
| Age Bracket | Public School | Private School |
| 3 to 4 Year Olds | 542 (37.1%) | 918 (62.9%) |
| 5 to 9 Year Old | 7,821 (84.1%) | 1,478 (15.9%) |
| 10 to 14 Year Olds | 9,633 (87.0%) | 1,442 (13.0%) |
| 15 to 17 Year Olds | 5,523 (89.0%) | 679 (11.0%) |
| 18 to 19 Year Olds | 1,994 (85.7%) | 332 (14.3%) |
| 20 to 24 Year Olds | 2,174 (89.2%) | 263 (10.8%) |
| 25 to 34 Year Olds | 1,080 (82.4%) | 231 (17.6%) |
| 35 Years and over | 1,292 (66.9%) | 639 (33.1%) |
| Total | 30,058 (83.4%) | 5,983 (16.6%) |
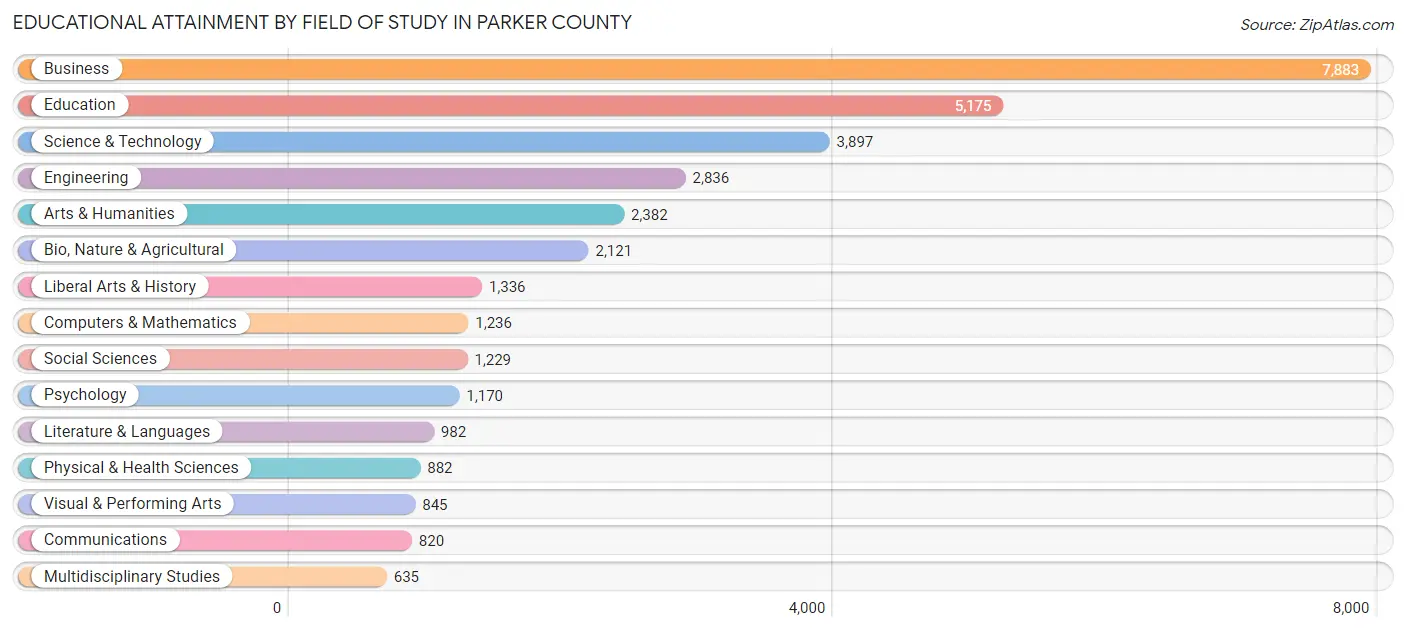
Educational Attainment by Field of Study in Parker County
Business (7,883 | 23.6%), education (5,175 | 15.5%), science & technology (3,897 | 11.7%), engineering (2,836 | 8.5%), and arts & humanities (2,382 | 7.1%) are the most common fields of study among 33,429 individuals in Parker County who have obtained a bachelor's degree or higher.
| Field of Study | # Graduates | % Graduates |
| Computers & Mathematics | 1,236 | 3.7% |
| Bio, Nature & Agricultural | 2,121 | 6.3% |
| Physical & Health Sciences | 882 | 2.6% |
| Psychology | 1,170 | 3.5% |
| Social Sciences | 1,229 | 3.7% |
| Engineering | 2,836 | 8.5% |
| Multidisciplinary Studies | 635 | 1.9% |
| Science & Technology | 3,897 | 11.7% |
| Business | 7,883 | 23.6% |
| Education | 5,175 | 15.5% |
| Literature & Languages | 982 | 2.9% |
| Liberal Arts & History | 1,336 | 4.0% |
| Visual & Performing Arts | 845 | 2.5% |
| Communications | 820 | 2.5% |
| Arts & Humanities | 2,382 | 7.1% |
| Total | 33,429 | 100.0% |
Transportation & Commute in Parker County
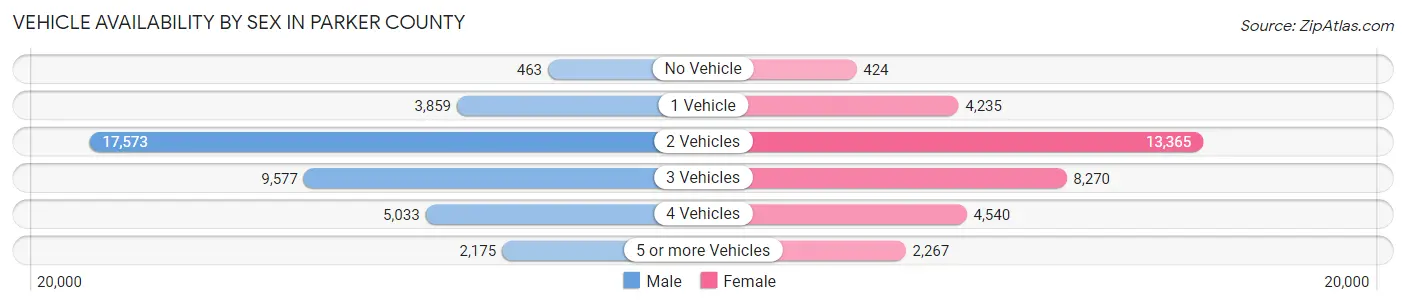
Vehicle Availability by Sex in Parker County
The most prevalent vehicle ownership categories in Parker County are males with 2 vehicles (17,573, accounting for 45.4%) and females with 2 vehicles (13,365, making up 53.1%).
| Vehicles Available | Male | Female |
| No Vehicle | 463 (1.2%) | 424 (1.3%) |
| 1 Vehicle | 3,859 (10.0%) | 4,235 (12.8%) |
| 2 Vehicles | 17,573 (45.4%) | 13,365 (40.4%) |
| 3 Vehicles | 9,577 (24.8%) | 8,270 (25.0%) |
| 4 Vehicles | 5,033 (13.0%) | 4,540 (13.7%) |
| 5 or more Vehicles | 2,175 (5.6%) | 2,267 (6.9%) |
| Total | 38,680 (100.0%) | 33,101 (100.0%) |
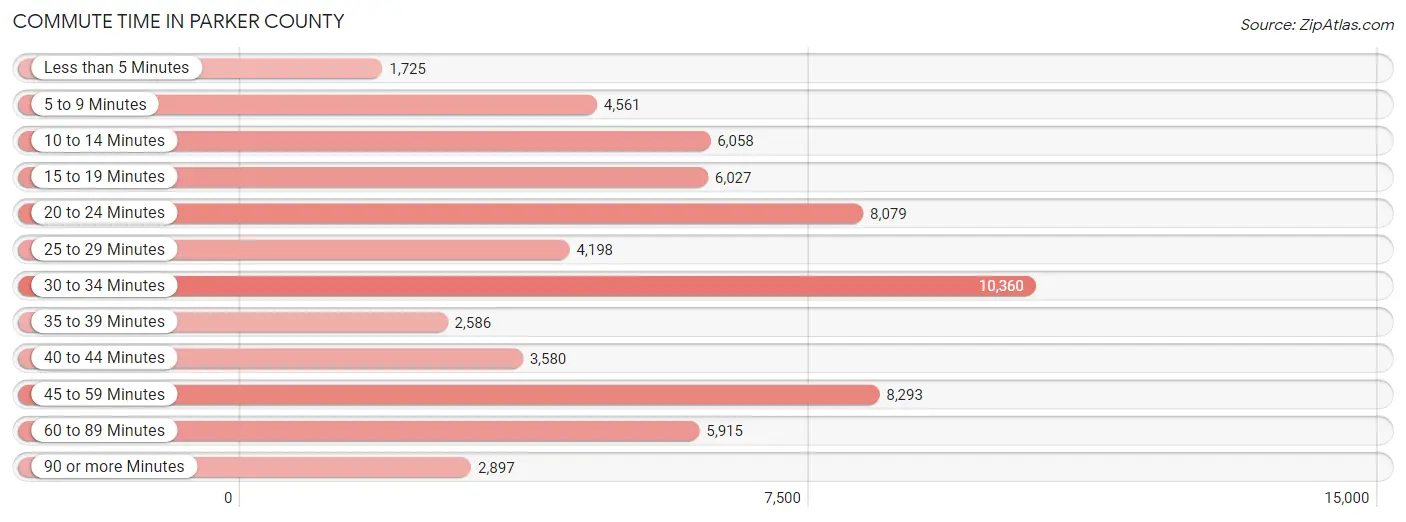
Commute Time in Parker County
The most frequently occuring commute durations in Parker County are 30 to 34 minutes (10,360 commuters, 16.1%), 45 to 59 minutes (8,293 commuters, 12.9%), and 20 to 24 minutes (8,079 commuters, 12.6%).
| Commute Time | # Commuters | % Commuters |
| Less than 5 Minutes | 1,725 | 2.7% |
| 5 to 9 Minutes | 4,561 | 7.1% |
| 10 to 14 Minutes | 6,058 | 9.4% |
| 15 to 19 Minutes | 6,027 | 9.4% |
| 20 to 24 Minutes | 8,079 | 12.6% |
| 25 to 29 Minutes | 4,198 | 6.5% |
| 30 to 34 Minutes | 10,360 | 16.1% |
| 35 to 39 Minutes | 2,586 | 4.0% |
| 40 to 44 Minutes | 3,580 | 5.6% |
| 45 to 59 Minutes | 8,293 | 12.9% |
| 60 to 89 Minutes | 5,915 | 9.2% |
| 90 or more Minutes | 2,897 | 4.5% |
Commute Time by Sex in Parker County
The most common commute times in Parker County are 30 to 34 minutes (5,937 commuters, 16.9%) for males and 30 to 34 minutes (4,423 commuters, 15.2%) for females.
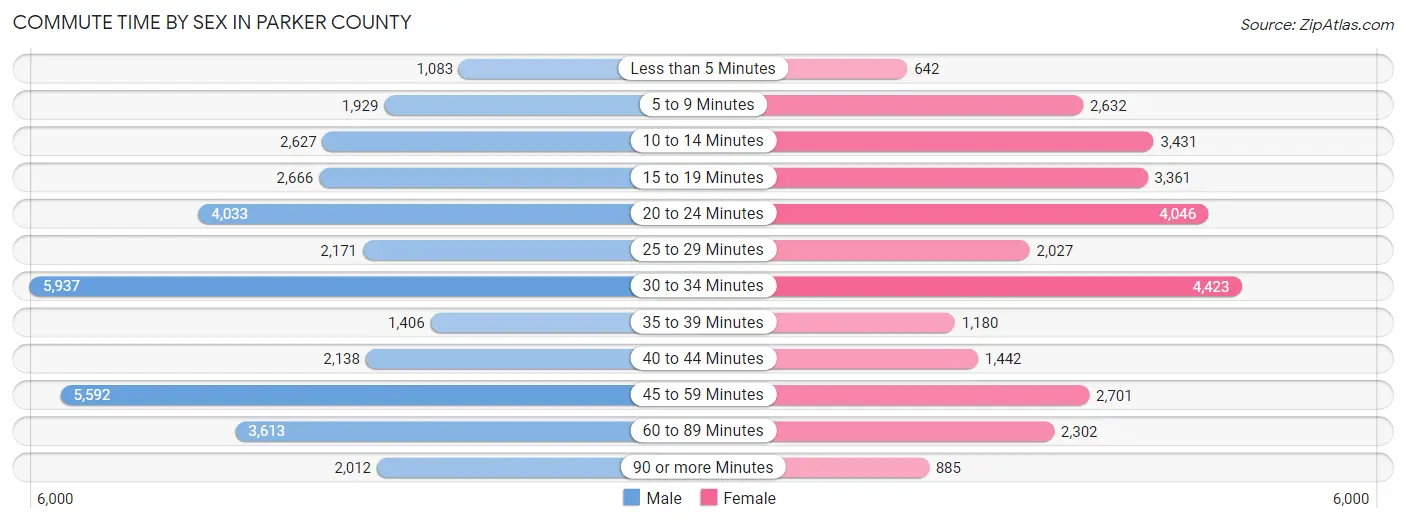
| Commute Time | Male | Female |
| Less than 5 Minutes | 1,083 (3.1%) | 642 (2.2%) |
| 5 to 9 Minutes | 1,929 (5.5%) | 2,632 (9.0%) |
| 10 to 14 Minutes | 2,627 (7.5%) | 3,431 (11.8%) |
| 15 to 19 Minutes | 2,666 (7.6%) | 3,361 (11.6%) |
| 20 to 24 Minutes | 4,033 (11.5%) | 4,046 (13.9%) |
| 25 to 29 Minutes | 2,171 (6.2%) | 2,027 (7.0%) |
| 30 to 34 Minutes | 5,937 (16.9%) | 4,423 (15.2%) |
| 35 to 39 Minutes | 1,406 (4.0%) | 1,180 (4.1%) |
| 40 to 44 Minutes | 2,138 (6.1%) | 1,442 (5.0%) |
| 45 to 59 Minutes | 5,592 (15.9%) | 2,701 (9.3%) |
| 60 to 89 Minutes | 3,613 (10.3%) | 2,302 (7.9%) |
| 90 or more Minutes | 2,012 (5.7%) | 885 (3.0%) |
Time of Departure to Work by Sex in Parker County
The most frequent times of departure to work in Parker County are 7:00 AM to 7:29 AM (5,940, 16.9%) for males and 7:00 AM to 7:29 AM (5,903, 20.3%) for females.
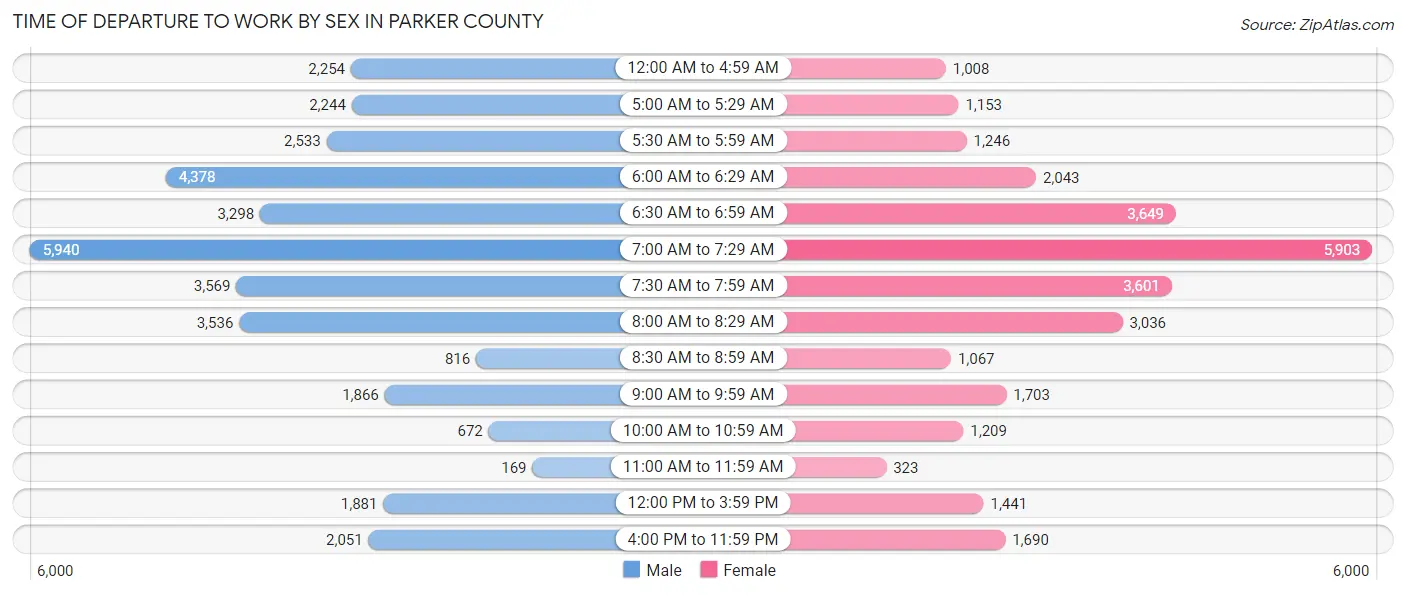
| Time of Departure | Male | Female |
| 12:00 AM to 4:59 AM | 2,254 (6.4%) | 1,008 (3.5%) |
| 5:00 AM to 5:29 AM | 2,244 (6.4%) | 1,153 (4.0%) |
| 5:30 AM to 5:59 AM | 2,533 (7.2%) | 1,246 (4.3%) |
| 6:00 AM to 6:29 AM | 4,378 (12.4%) | 2,043 (7.0%) |
| 6:30 AM to 6:59 AM | 3,298 (9.4%) | 3,649 (12.6%) |
| 7:00 AM to 7:29 AM | 5,940 (16.9%) | 5,903 (20.3%) |
| 7:30 AM to 7:59 AM | 3,569 (10.1%) | 3,601 (12.4%) |
| 8:00 AM to 8:29 AM | 3,536 (10.0%) | 3,036 (10.4%) |
| 8:30 AM to 8:59 AM | 816 (2.3%) | 1,067 (3.7%) |
| 9:00 AM to 9:59 AM | 1,866 (5.3%) | 1,703 (5.9%) |
| 10:00 AM to 10:59 AM | 672 (1.9%) | 1,209 (4.2%) |
| 11:00 AM to 11:59 AM | 169 (0.5%) | 323 (1.1%) |
| 12:00 PM to 3:59 PM | 1,881 (5.3%) | 1,441 (5.0%) |
| 4:00 PM to 11:59 PM | 2,051 (5.8%) | 1,690 (5.8%) |
| Total | 35,207 (100.0%) | 29,072 (100.0%) |
Housing Occupancy in Parker County
Occupancy by Ownership in Parker County
Of the total 52,622 dwellings in Parker County, owner-occupied units account for 43,127 (82.0%), while renter-occupied units make up 9,495 (18.0%).
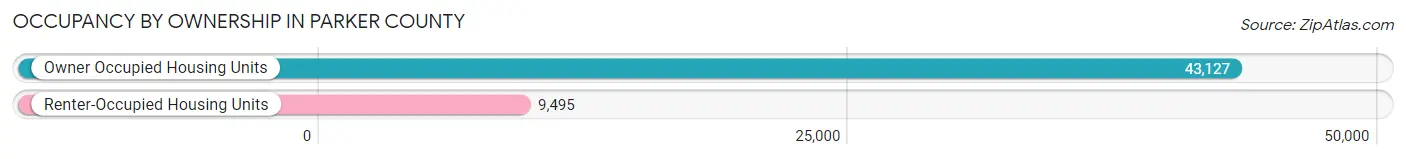
| Occupancy | # Housing Units | % Housing Units |
| Owner Occupied Housing Units | 43,127 | 82.0% |
| Renter-Occupied Housing Units | 9,495 | 18.0% |
| Total Occupied Housing Units | 52,622 | 100.0% |
Occupancy by Household Size in Parker County
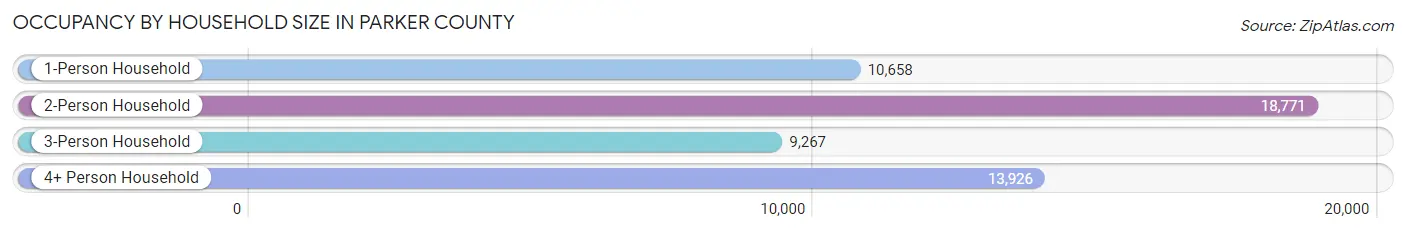
| Household Size | # Housing Units | % Housing Units |
| 1-Person Household | 10,658 | 20.3% |
| 2-Person Household | 18,771 | 35.7% |
| 3-Person Household | 9,267 | 17.6% |
| 4+ Person Household | 13,926 | 26.5% |
| Total Housing Units | 52,622 | 100.0% |
Occupancy by Ownership by Household Size in Parker County
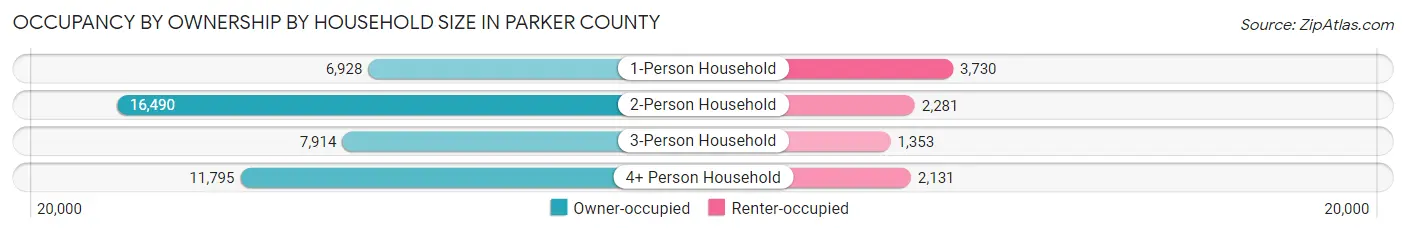
| Household Size | Owner-occupied | Renter-occupied |
| 1-Person Household | 6,928 (65.0%) | 3,730 (35.0%) |
| 2-Person Household | 16,490 (87.8%) | 2,281 (12.1%) |
| 3-Person Household | 7,914 (85.4%) | 1,353 (14.6%) |
| 4+ Person Household | 11,795 (84.7%) | 2,131 (15.3%) |
| Total Housing Units | 43,127 (82.0%) | 9,495 (18.0%) |
Occupancy by Educational Attainment in Parker County
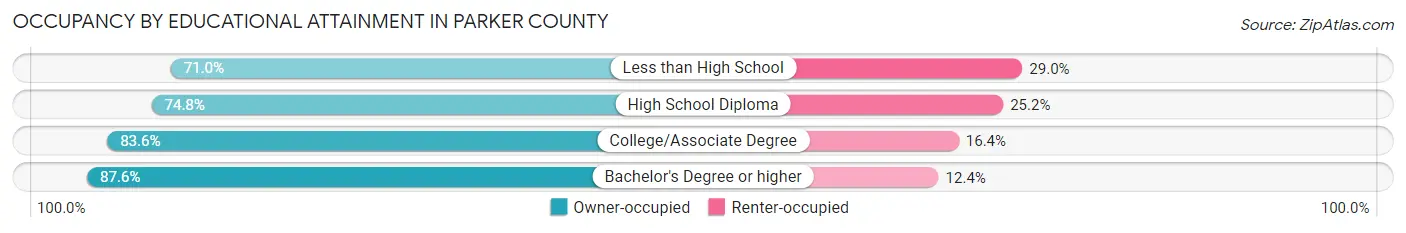
| Household Size | Owner-occupied | Renter-occupied |
| Less than High School | 3,233 (71.0%) | 1,320 (29.0%) |
| High School Diploma | 8,629 (74.8%) | 2,905 (25.2%) |
| College/Associate Degree | 15,531 (83.6%) | 3,045 (16.4%) |
| Bachelor's Degree or higher | 15,734 (87.6%) | 2,225 (12.4%) |
Occupancy by Age of Householder in Parker County
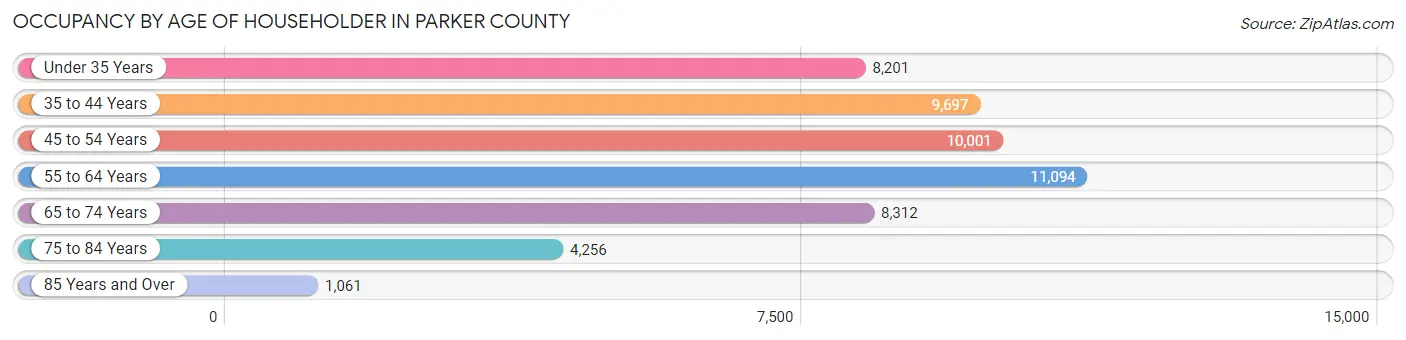
| Age Bracket | # Households | % Households |
| Under 35 Years | 8,201 | 15.6% |
| 35 to 44 Years | 9,697 | 18.4% |
| 45 to 54 Years | 10,001 | 19.0% |
| 55 to 64 Years | 11,094 | 21.1% |
| 65 to 74 Years | 8,312 | 15.8% |
| 75 to 84 Years | 4,256 | 8.1% |
| 85 Years and Over | 1,061 | 2.0% |
| Total | 52,622 | 100.0% |
Housing Finances in Parker County
Median Income by Occupancy in Parker County
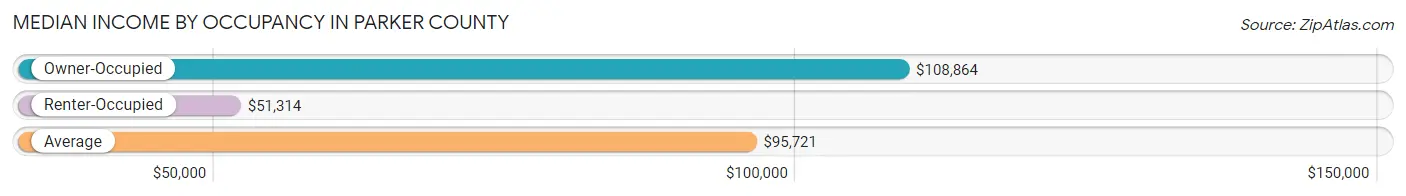
| Occupancy Type | # Households | Median Income |
| Owner-Occupied | 43,127 (82.0%) | $108,864 |
| Renter-Occupied | 9,495 (18.0%) | $51,314 |
| Average | 52,622 (100.0%) | $95,721 |
Occupancy by Householder Income Bracket in Parker County
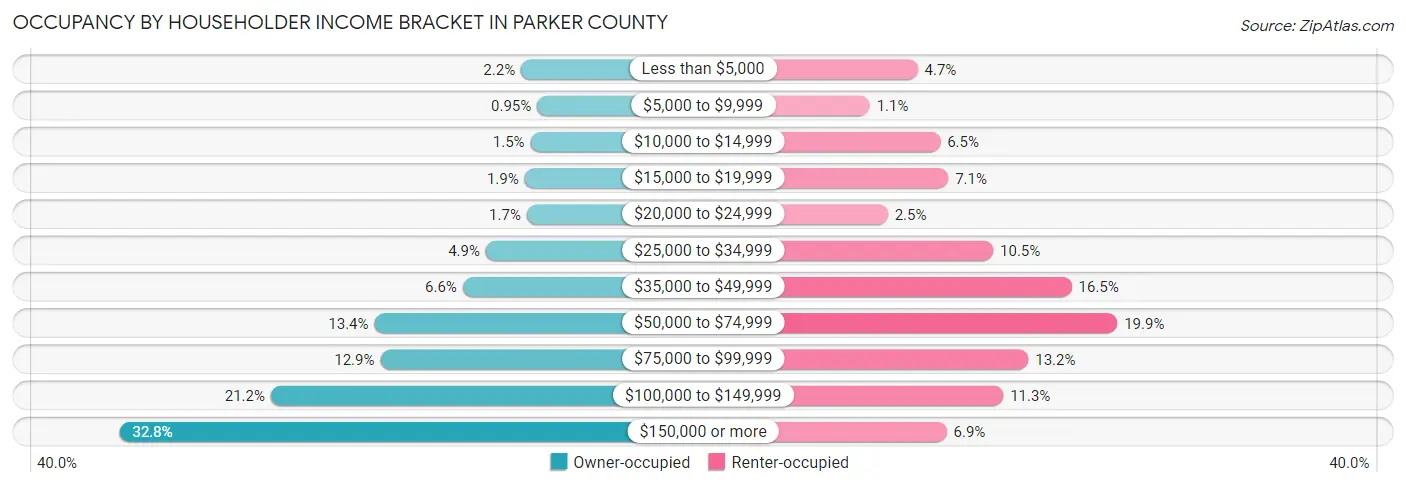
| Income Bracket | Owner-occupied | Renter-occupied |
| Less than $5,000 | 941 (2.2%) | 449 (4.7%) |
| $5,000 to $9,999 | 411 (0.9%) | 103 (1.1%) |
| $10,000 to $14,999 | 628 (1.5%) | 612 (6.5%) |
| $15,000 to $19,999 | 822 (1.9%) | 670 (7.1%) |
| $20,000 to $24,999 | 751 (1.7%) | 233 (2.5%) |
| $25,000 to $34,999 | 2,097 (4.9%) | 995 (10.5%) |
| $35,000 to $49,999 | 2,857 (6.6%) | 1,563 (16.5%) |
| $50,000 to $74,999 | 5,758 (13.4%) | 1,893 (19.9%) |
| $75,000 to $99,999 | 5,565 (12.9%) | 1,250 (13.2%) |
| $100,000 to $149,999 | 9,160 (21.2%) | 1,068 (11.3%) |
| $150,000 or more | 14,137 (32.8%) | 659 (6.9%) |
| Total | 43,127 (100.0%) | 9,495 (100.0%) |
Monthly Housing Cost Tiers in Parker County
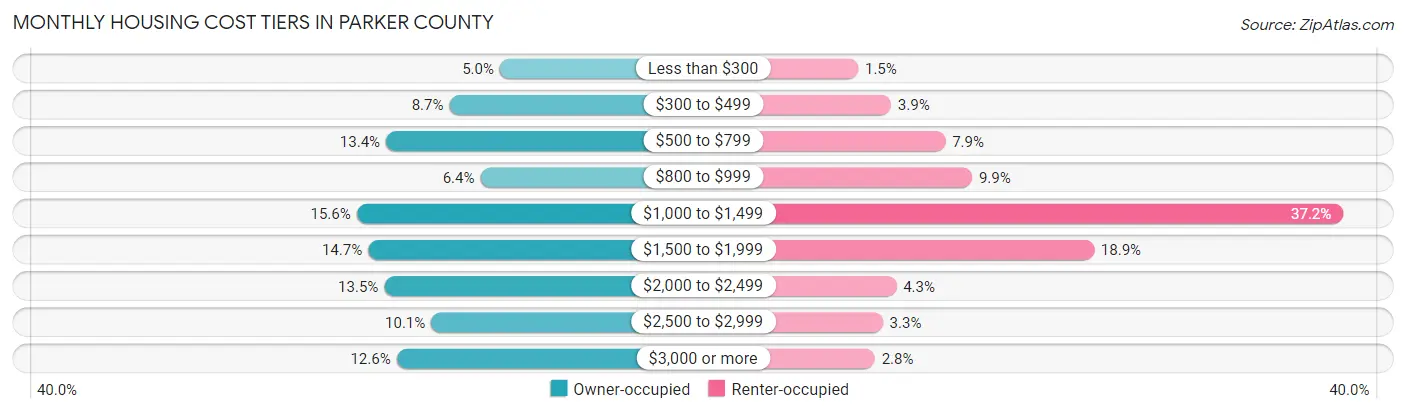
| Monthly Cost | Owner-occupied | Renter-occupied |
| Less than $300 | 2,155 (5.0%) | 144 (1.5%) |
| $300 to $499 | 3,762 (8.7%) | 374 (3.9%) |
| $500 to $799 | 5,774 (13.4%) | 754 (7.9%) |
| $800 to $999 | 2,776 (6.4%) | 941 (9.9%) |
| $1,000 to $1,499 | 6,707 (15.5%) | 3,536 (37.2%) |
| $1,500 to $1,999 | 6,346 (14.7%) | 1,794 (18.9%) |
| $2,000 to $2,499 | 5,829 (13.5%) | 411 (4.3%) |
| $2,500 to $2,999 | 4,339 (10.1%) | 316 (3.3%) |
| $3,000 or more | 5,439 (12.6%) | 261 (2.8%) |
| Total | 43,127 (100.0%) | 9,495 (100.0%) |
Physical Housing Characteristics in Parker County
Housing Structures in Parker County
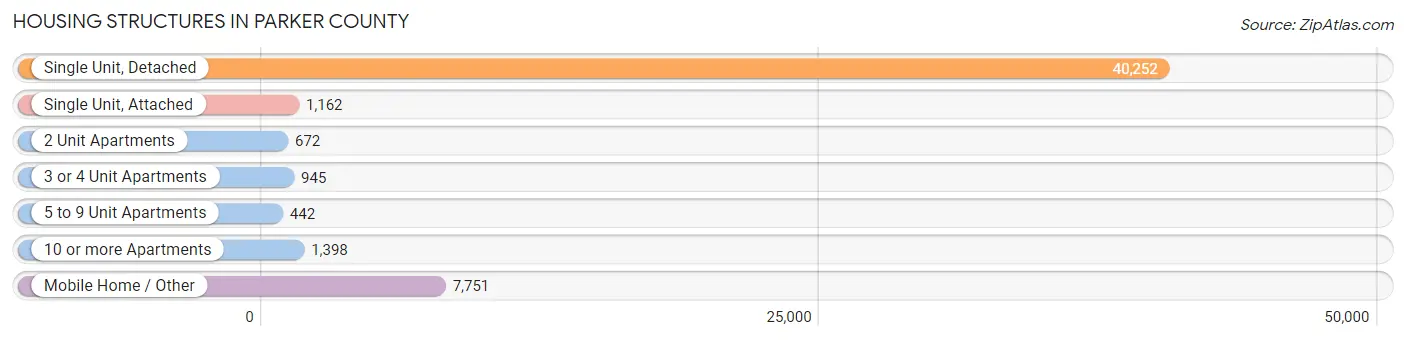
| Structure Type | # Housing Units | % Housing Units |
| Single Unit, Detached | 40,252 | 76.5% |
| Single Unit, Attached | 1,162 | 2.2% |
| 2 Unit Apartments | 672 | 1.3% |
| 3 or 4 Unit Apartments | 945 | 1.8% |
| 5 to 9 Unit Apartments | 442 | 0.8% |
| 10 or more Apartments | 1,398 | 2.7% |
| Mobile Home / Other | 7,751 | 14.7% |
| Total | 52,622 | 100.0% |
Housing Structures by Occupancy in Parker County
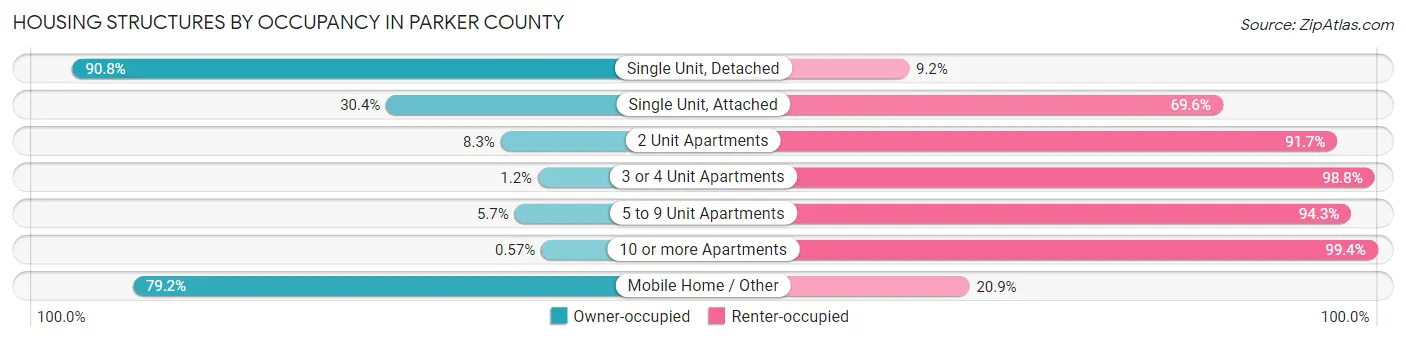
| Structure Type | Owner-occupied | Renter-occupied |
| Single Unit, Detached | 36,539 (90.8%) | 3,713 (9.2%) |
| Single Unit, Attached | 353 (30.4%) | 809 (69.6%) |
| 2 Unit Apartments | 56 (8.3%) | 616 (91.7%) |
| 3 or 4 Unit Apartments | 11 (1.2%) | 934 (98.8%) |
| 5 to 9 Unit Apartments | 25 (5.7%) | 417 (94.3%) |
| 10 or more Apartments | 8 (0.6%) | 1,390 (99.4%) |
| Mobile Home / Other | 6,135 (79.1%) | 1,616 (20.8%) |
| Total | 43,127 (82.0%) | 9,495 (18.0%) |
Housing Structures by Number of Rooms in Parker County
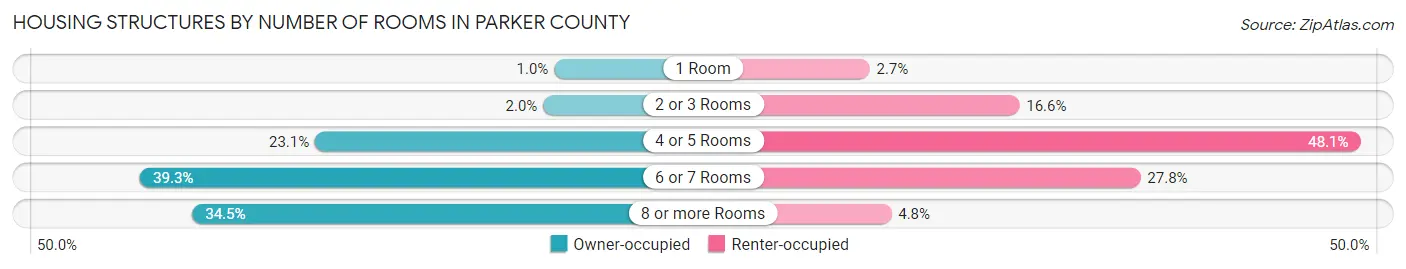
| Number of Rooms | Owner-occupied | Renter-occupied |
| 1 Room | 439 (1.0%) | 260 (2.7%) |
| 2 or 3 Rooms | 881 (2.0%) | 1,575 (16.6%) |
| 4 or 5 Rooms | 9,979 (23.1%) | 4,570 (48.1%) |
| 6 or 7 Rooms | 16,954 (39.3%) | 2,639 (27.8%) |
| 8 or more Rooms | 14,874 (34.5%) | 451 (4.8%) |
| Total | 43,127 (100.0%) | 9,495 (100.0%) |
Housing Structure by Heating Type in Parker County
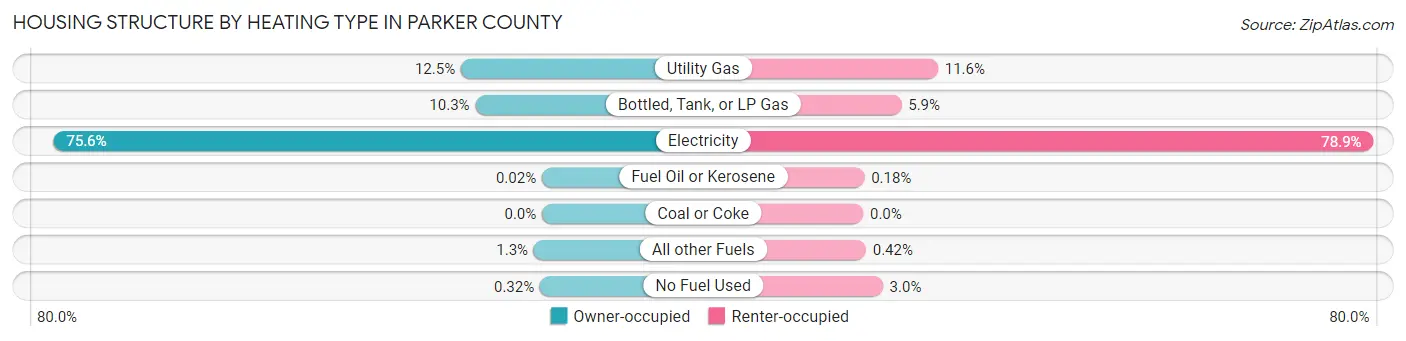
| Heating Type | Owner-occupied | Renter-occupied |
| Utility Gas | 5,407 (12.5%) | 1,098 (11.6%) |
| Bottled, Tank, or LP Gas | 4,446 (10.3%) | 561 (5.9%) |
| Electricity | 32,583 (75.5%) | 7,491 (78.9%) |
| Fuel Oil or Kerosene | 10 (0.0%) | 17 (0.2%) |
| Coal or Coke | 0 (0.0%) | 0 (0.0%) |
| All other Fuels | 542 (1.3%) | 40 (0.4%) |
| No Fuel Used | 139 (0.3%) | 288 (3.0%) |
| Total | 43,127 (100.0%) | 9,495 (100.0%) |
Household Vehicle Usage in Parker County
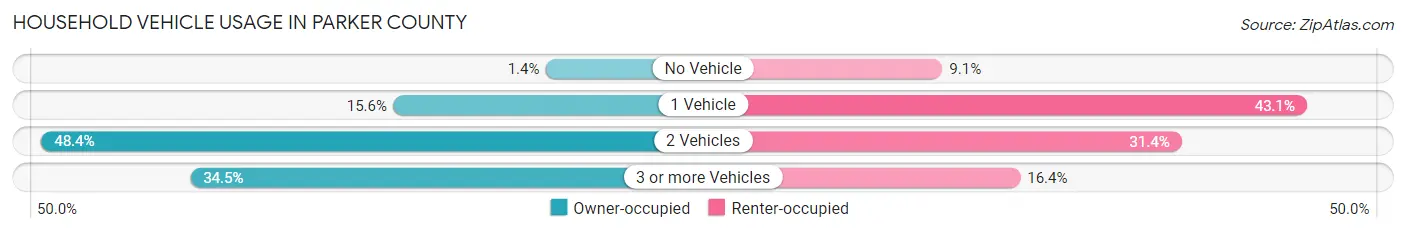
| Vehicles per Household | Owner-occupied | Renter-occupied |
| No Vehicle | 601 (1.4%) | 864 (9.1%) |
| 1 Vehicle | 6,739 (15.6%) | 4,093 (43.1%) |
| 2 Vehicles | 20,889 (48.4%) | 2,984 (31.4%) |
| 3 or more Vehicles | 14,898 (34.5%) | 1,554 (16.4%) |
| Total | 43,127 (100.0%) | 9,495 (100.0%) |
Real Estate & Mortgages in Parker County
Real Estate and Mortgage Overview in Parker County
| Characteristic | Without Mortgage | With Mortgage |
| Housing Units | 17,044 | 26,083 |
| Median Property Value | $245,000 | $348,600 |
| Median Household Income | $71,378 | $10,753 |
| Monthly Housing Costs | $666 | $5,347 |
| Real Estate Taxes | $2,904 | $1,054 |
Property Value by Mortgage Status in Parker County
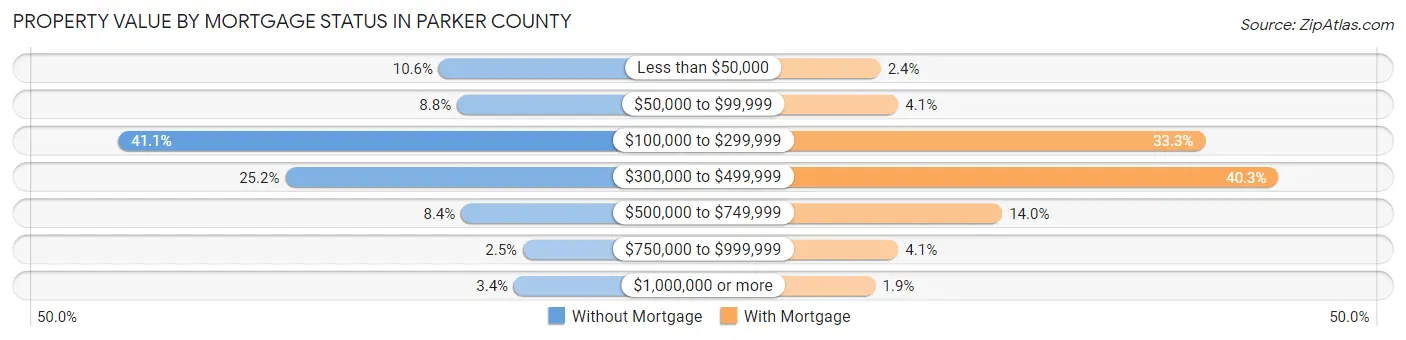
| Property Value | Without Mortgage | With Mortgage |
| Less than $50,000 | 1,798 (10.5%) | 626 (2.4%) |
| $50,000 to $99,999 | 1,504 (8.8%) | 1,065 (4.1%) |
| $100,000 to $299,999 | 7,000 (41.1%) | 8,685 (33.3%) |
| $300,000 to $499,999 | 4,292 (25.2%) | 10,500 (40.3%) |
| $500,000 to $749,999 | 1,437 (8.4%) | 3,645 (14.0%) |
| $750,000 to $999,999 | 433 (2.5%) | 1,065 (4.1%) |
| $1,000,000 or more | 580 (3.4%) | 497 (1.9%) |
| Total | 17,044 (100.0%) | 26,083 (100.0%) |
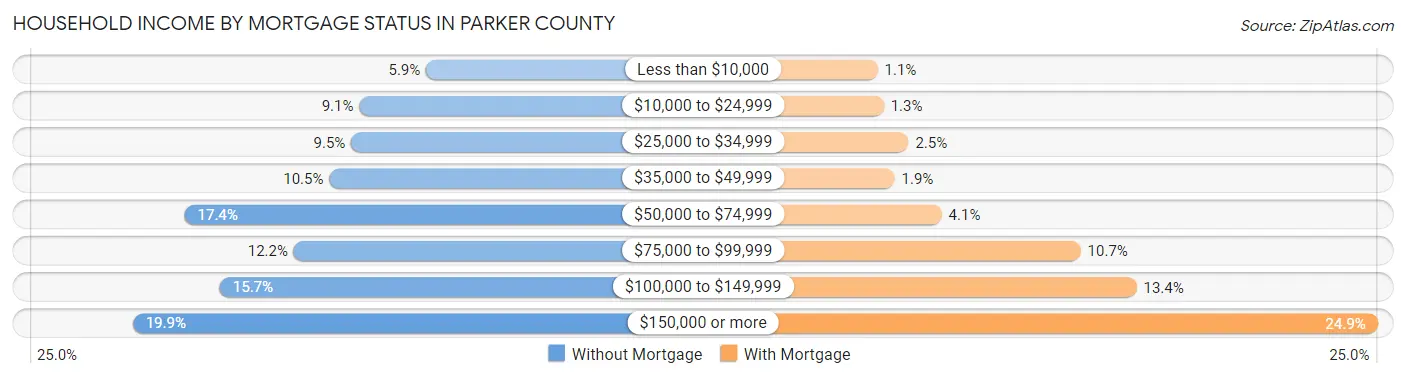
Household Income by Mortgage Status in Parker County
| Household Income | Without Mortgage | With Mortgage |
| Less than $10,000 | 1,002 (5.9%) | 274 (1.1%) |
| $10,000 to $24,999 | 1,544 (9.1%) | 350 (1.3%) |
| $25,000 to $34,999 | 1,611 (9.5%) | 657 (2.5%) |
| $35,000 to $49,999 | 1,788 (10.5%) | 486 (1.9%) |
| $50,000 to $74,999 | 2,963 (17.4%) | 1,069 (4.1%) |
| $75,000 to $99,999 | 2,076 (12.2%) | 2,795 (10.7%) |
| $100,000 to $149,999 | 2,676 (15.7%) | 3,489 (13.4%) |
| $150,000 or more | 3,384 (19.9%) | 6,484 (24.9%) |
| Total | 17,044 (100.0%) | 26,083 (100.0%) |
Property Value to Household Income Ratio in Parker County
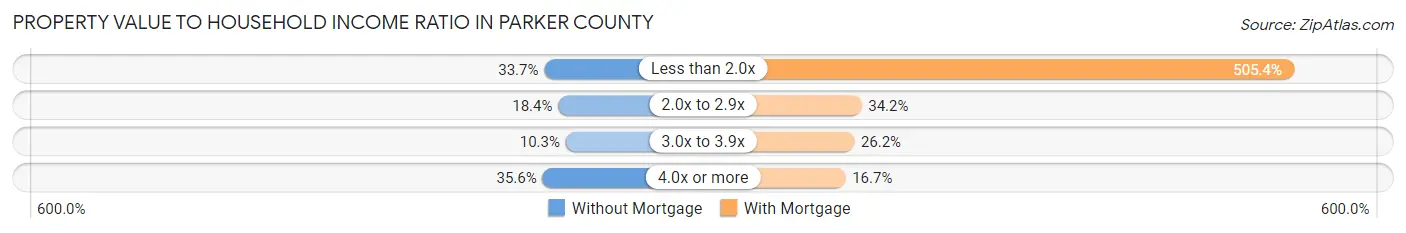
| Value-to-Income Ratio | Without Mortgage | With Mortgage |
| Less than 2.0x | 5,750 (33.7%) | 131,818 (505.4%) |
| 2.0x to 2.9x | 3,138 (18.4%) | 8,918 (34.2%) |
| 3.0x to 3.9x | 1,750 (10.3%) | 6,827 (26.2%) |
| 4.0x or more | 6,066 (35.6%) | 4,356 (16.7%) |
| Total | 17,044 (100.0%) | 26,083 (100.0%) |
Real Estate Taxes by Mortgage Status in Parker County
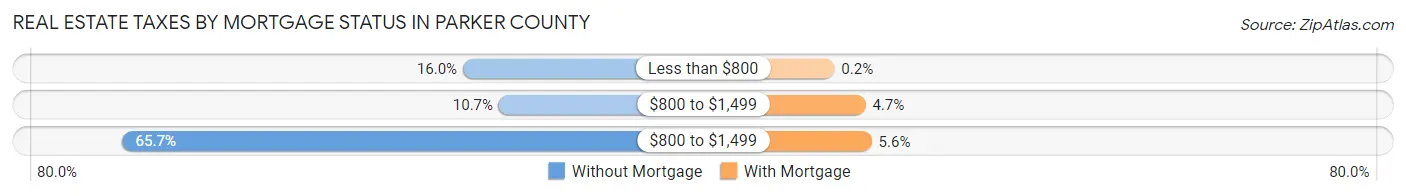
| Property Taxes | Without Mortgage | With Mortgage |
| Less than $800 | 2,719 (16.0%) | 53 (0.2%) |
| $800 to $1,499 | 1,823 (10.7%) | 1,237 (4.7%) |
| $800 to $1,499 | 11,193 (65.7%) | 1,471 (5.6%) |
| Total | 17,044 (100.0%) | 26,083 (100.0%) |
Health & Disability in Parker County
Health Insurance Coverage by Age in Parker County
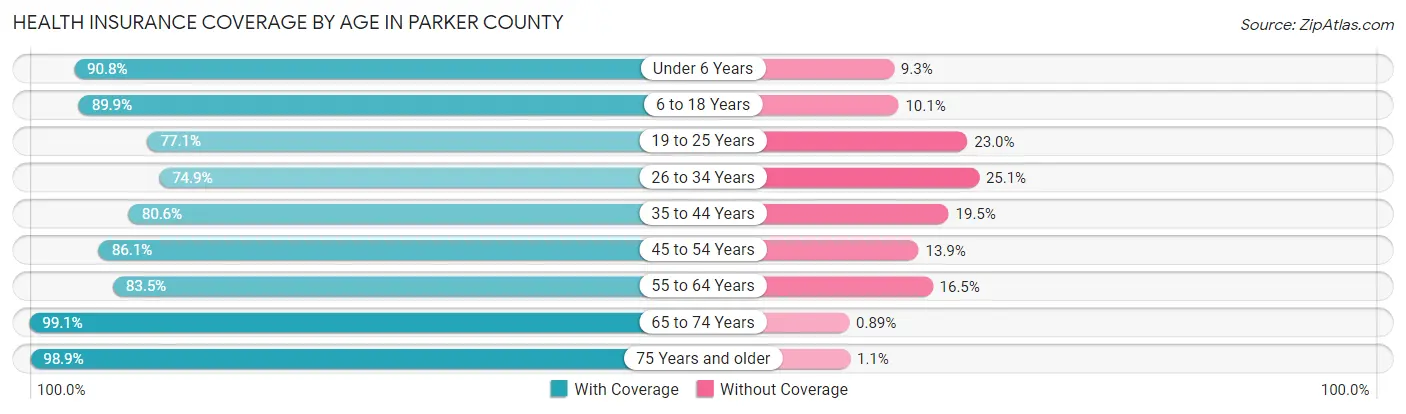
| Age Bracket | With Coverage | Without Coverage |
| Under 6 Years | 9,866 (90.7%) | 1,006 (9.2%) |
| 6 to 18 Years | 25,410 (89.9%) | 2,859 (10.1%) |
| 19 to 25 Years | 8,826 (77.0%) | 2,629 (23.0%) |
| 26 to 34 Years | 11,757 (74.9%) | 3,943 (25.1%) |
| 35 to 44 Years | 16,317 (80.5%) | 3,939 (19.5%) |
| 45 to 54 Years | 16,696 (86.1%) | 2,686 (13.9%) |
| 55 to 64 Years | 17,166 (83.5%) | 3,384 (16.5%) |
| 65 to 74 Years | 14,617 (99.1%) | 132 (0.9%) |
| 75 Years and older | 8,336 (98.9%) | 90 (1.1%) |
| Total | 128,991 (86.2%) | 20,668 (13.8%) |
Health Insurance Coverage by Citizenship Status in Parker County
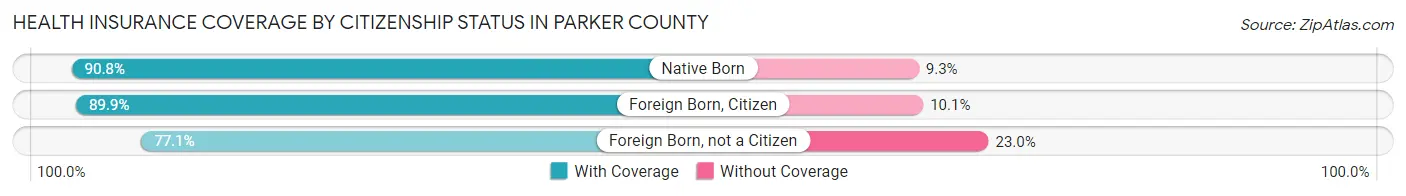
| Citizenship Status | With Coverage | Without Coverage |
| Native Born | 9,866 (90.7%) | 1,006 (9.2%) |
| Foreign Born, Citizen | 25,410 (89.9%) | 2,859 (10.1%) |
| Foreign Born, not a Citizen | 8,826 (77.0%) | 2,629 (23.0%) |
Health Insurance Coverage by Household Income in Parker County
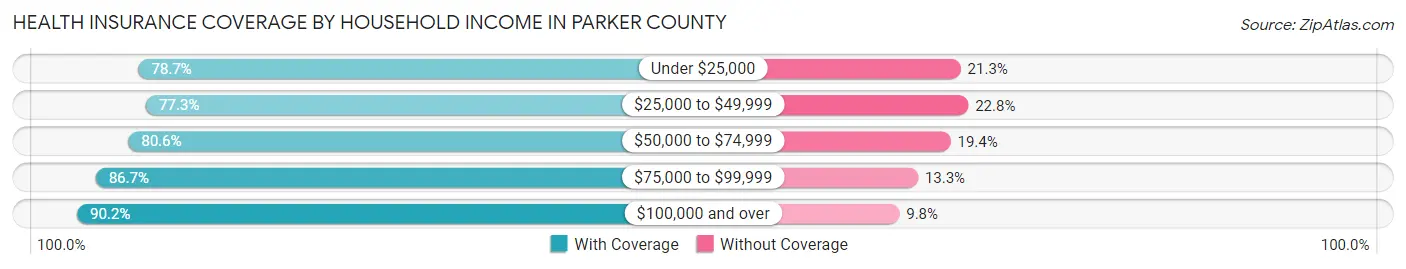
| Household Income | With Coverage | Without Coverage |
| Under $25,000 | 7,533 (78.7%) | 2,042 (21.3%) |
| $25,000 to $49,999 | 12,812 (77.2%) | 3,774 (22.8%) |
| $50,000 to $74,999 | 17,104 (80.6%) | 4,128 (19.4%) |
| $75,000 to $99,999 | 16,843 (86.7%) | 2,591 (13.3%) |
| $100,000 and over | 74,245 (90.2%) | 8,090 (9.8%) |
Public vs Private Health Insurance Coverage by Age in Parker County
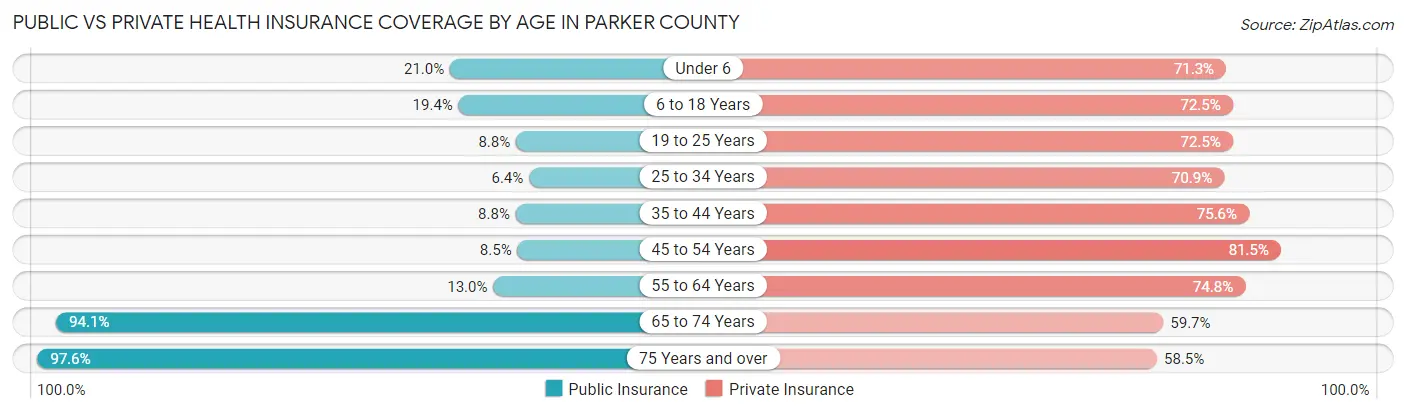
| Age Bracket | Public Insurance | Private Insurance |
| Under 6 | 2,286 (21.0%) | 7,752 (71.3%) |
| 6 to 18 Years | 5,492 (19.4%) | 20,503 (72.5%) |
| 19 to 25 Years | 1,006 (8.8%) | 8,310 (72.5%) |
| 25 to 34 Years | 997 (6.4%) | 11,137 (70.9%) |
| 35 to 44 Years | 1,790 (8.8%) | 15,303 (75.5%) |
| 45 to 54 Years | 1,649 (8.5%) | 15,792 (81.5%) |
| 55 to 64 Years | 2,671 (13.0%) | 15,379 (74.8%) |
| 65 to 74 Years | 13,884 (94.1%) | 8,803 (59.7%) |
| 75 Years and over | 8,227 (97.6%) | 4,932 (58.5%) |
| Total | 38,002 (25.4%) | 107,911 (72.1%) |
Disability Status by Sex by Age in Parker County
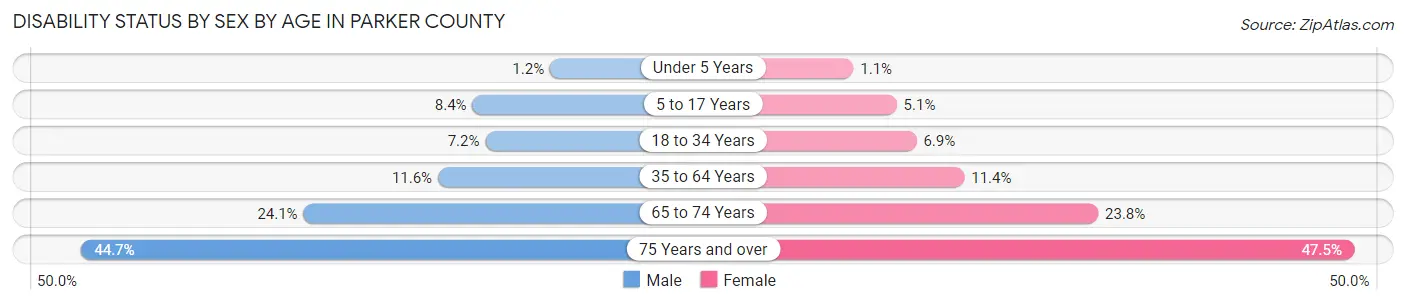
| Age Bracket | Male | Female |
| Under 5 Years | 59 (1.2%) | 46 (1.1%) |
| 5 to 17 Years | 1,227 (8.4%) | 694 (5.1%) |
| 18 to 34 Years | 1,054 (7.2%) | 1,005 (6.9%) |
| 35 to 64 Years | 3,492 (11.6%) | 3,432 (11.4%) |
| 65 to 74 Years | 1,728 (24.1%) | 1,804 (23.8%) |
| 75 Years and over | 1,706 (44.7%) | 2,191 (47.5%) |
Disability Class by Sex by Age in Parker County
Disability Class: Hearing Difficulty
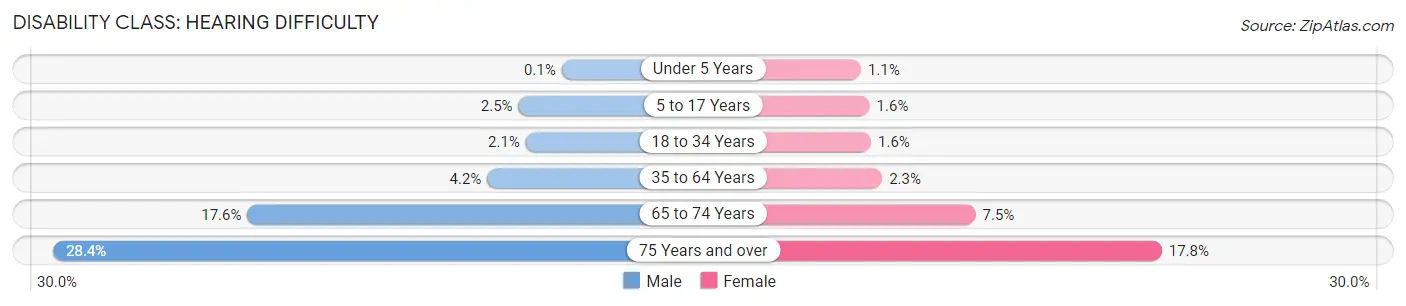
| Age Bracket | Male | Female |
| Under 5 Years | 5 (0.1%) | 46 (1.1%) |
| 5 to 17 Years | 363 (2.5%) | 211 (1.5%) |
| 18 to 34 Years | 306 (2.1%) | 236 (1.6%) |
| 35 to 64 Years | 1,273 (4.2%) | 679 (2.2%) |
| 65 to 74 Years | 1,261 (17.6%) | 565 (7.4%) |
| 75 Years and over | 1,084 (28.4%) | 822 (17.8%) |
Disability Class: Vision Difficulty
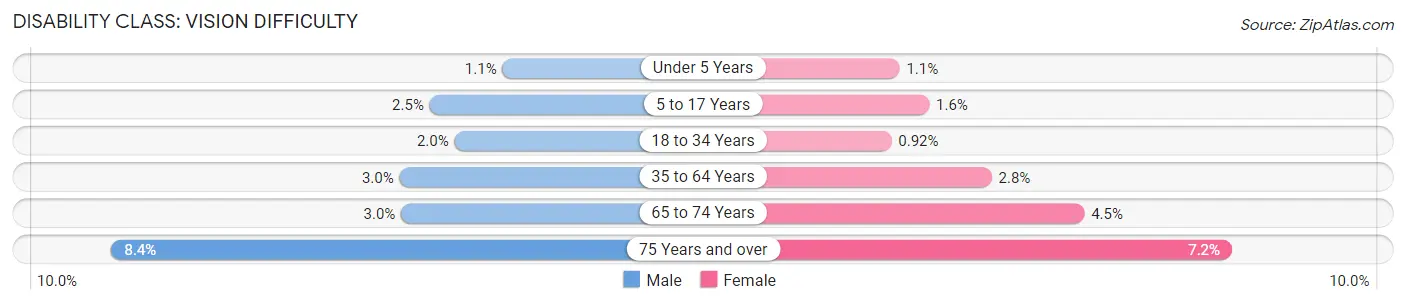
| Age Bracket | Male | Female |
| Under 5 Years | 54 (1.1%) | 46 (1.1%) |
| 5 to 17 Years | 361 (2.5%) | 221 (1.6%) |
| 18 to 34 Years | 294 (2.0%) | 133 (0.9%) |
| 35 to 64 Years | 911 (3.0%) | 840 (2.8%) |
| 65 to 74 Years | 216 (3.0%) | 341 (4.5%) |
| 75 Years and over | 320 (8.4%) | 334 (7.2%) |
Disability Class: Cognitive Difficulty
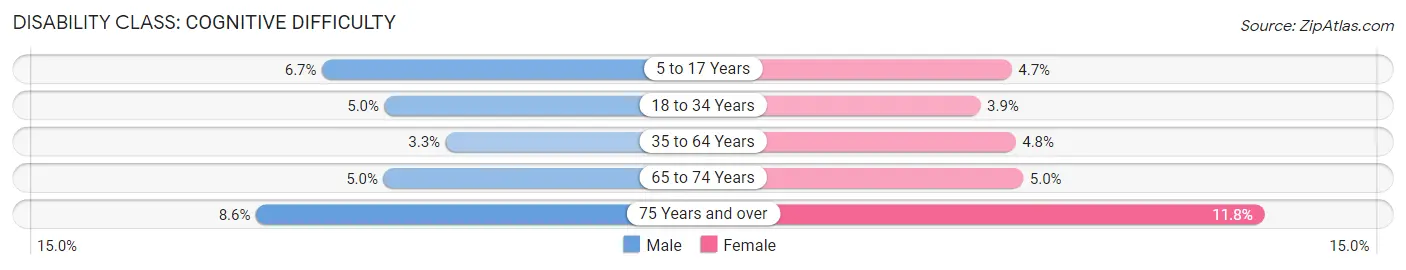
| Age Bracket | Male | Female |
| 5 to 17 Years | 975 (6.7%) | 644 (4.7%) |
| 18 to 34 Years | 724 (5.0%) | 558 (3.8%) |
| 35 to 64 Years | 980 (3.3%) | 1,459 (4.8%) |
| 65 to 74 Years | 358 (5.0%) | 382 (5.0%) |
| 75 Years and over | 326 (8.6%) | 543 (11.8%) |
Disability Class: Ambulatory Difficulty
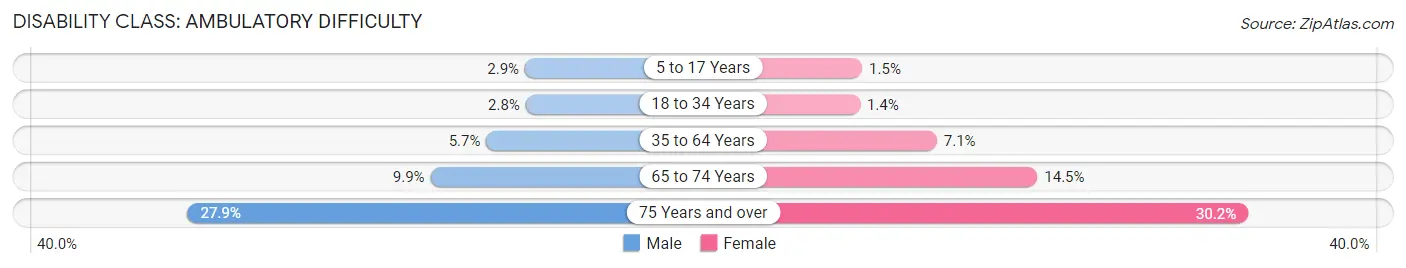
| Age Bracket | Male | Female |
| 5 to 17 Years | 414 (2.9%) | 206 (1.5%) |
| 18 to 34 Years | 407 (2.8%) | 196 (1.3%) |
| 35 to 64 Years | 1,717 (5.7%) | 2,130 (7.1%) |
| 65 to 74 Years | 707 (9.9%) | 1,101 (14.5%) |
| 75 Years and over | 1,064 (27.9%) | 1,391 (30.2%) |
Disability Class: Self-Care Difficulty
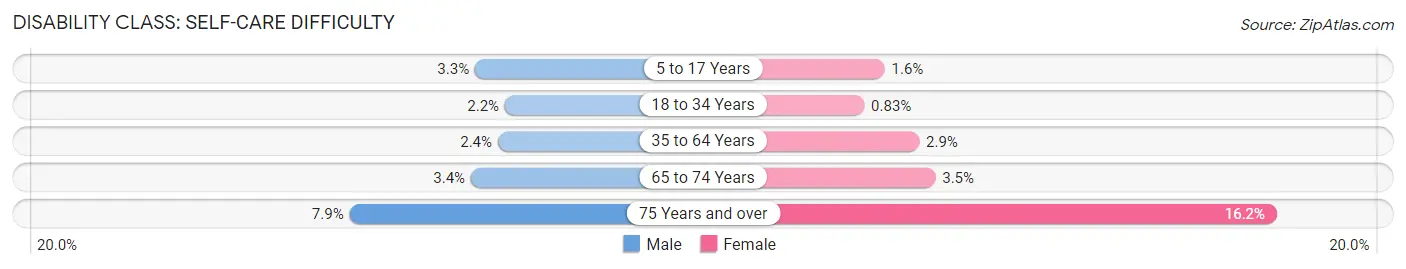
| Age Bracket | Male | Female |
| 5 to 17 Years | 477 (3.3%) | 217 (1.6%) |
| 18 to 34 Years | 316 (2.2%) | 121 (0.8%) |
| 35 to 64 Years | 729 (2.4%) | 866 (2.9%) |
| 65 to 74 Years | 246 (3.4%) | 263 (3.5%) |
| 75 Years and over | 303 (7.9%) | 745 (16.2%) |
Technology Access in Parker County
Computing Device Access in Parker County
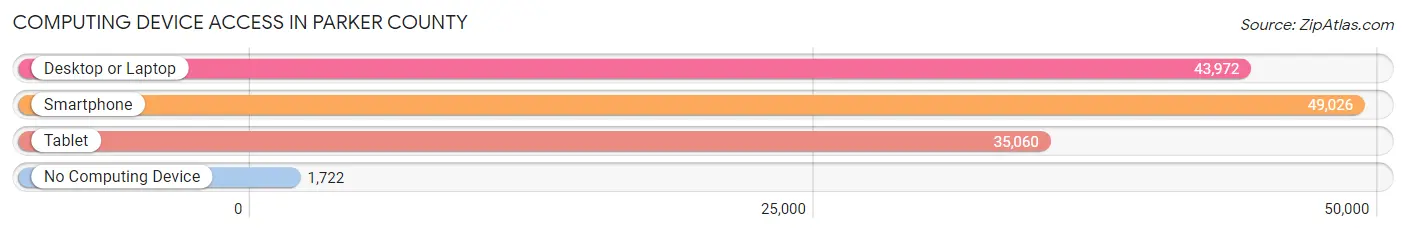
| Device Type | # Households | % Households |
| Desktop or Laptop | 43,972 | 83.6% |
| Smartphone | 49,026 | 93.2% |
| Tablet | 35,060 | 66.6% |
| No Computing Device | 1,722 | 3.3% |
| Total | 52,622 | 100.0% |
Internet Access in Parker County
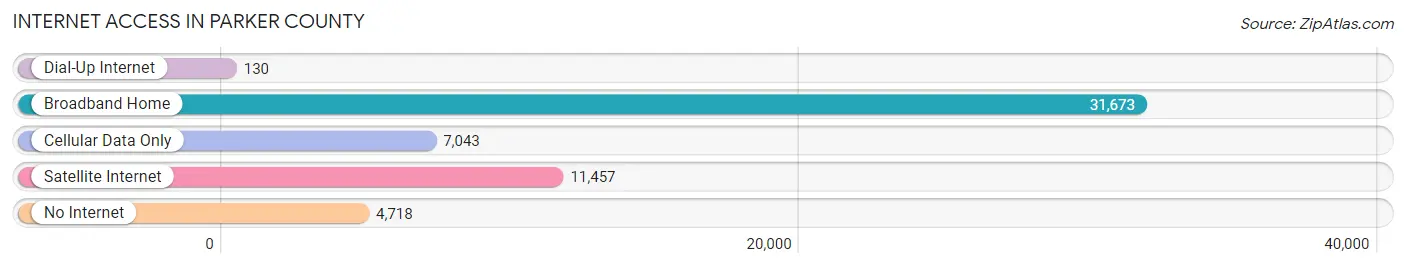
| Internet Type | # Households | % Households |
| Dial-Up Internet | 130 | 0.3% |
| Broadband Home | 31,673 | 60.2% |
| Cellular Data Only | 7,043 | 13.4% |
| Satellite Internet | 11,457 | 21.8% |
| No Internet | 4,718 | 9.0% |
| Total | 52,622 | 100.0% |
Parker County Summary
Parker County is located in the north-central part of Texas, and is part of the Dallas-Fort Worth-Arlington metropolitan area. It is bordered by Wise, Jack, Palo Pinto, Hood, and Tarrant counties. The county seat is Weatherford, and the largest city is Azle. As of the 2010 census, the population was 116,927.
Geography
Parker County covers an area of 910 square miles, making it the 33rd largest county in Texas. It is located in the Cross Timbers region of the state, and is mostly flat with rolling hills. The county is drained by the Brazos River and its tributaries, including the Paluxy, the Nolan, and the Clear Fork. The county is home to several state parks, including Lake Mineral Wells State Park, Possum Kingdom State Park, and Palo Pinto Mountains State Park.
Climate
Parker County has a humid subtropical climate, with hot summers and mild winters. The average annual temperature is 64°F, and the average annual precipitation is 33 inches.
Demographics
As of the 2010 census, there were 116,927 people, 41,945 households, and 31,845 families living in the county. The population density was 129 people per square mile. The racial makeup of the county was 84.3% White, 8.2% Black or African American, 0.7% Native American, 0.7% Asian, 0.1% Pacific Islander, 4.2% from other races, and 1.9% from two or more races. 11.7% of the population were Hispanic or Latino of any race.
The median income for a household in the county was $50,867, and the median income for a family was $59,845. The per capita income for the county was $24,844. About 8.2% of families and 10.7% of the population were below the poverty line, including 14.2% of those under age 18 and 7.2% of those age 65 or over.
Economy
Parker County is home to a diverse economy, with a mix of agriculture, manufacturing, and services. The county is home to several large employers, including Lockheed Martin, Weatherford International, and the Weatherford Regional Medical Center. Agriculture is a major part of the economy, with cattle, hay, and wheat being the main crops. The county is also home to several wineries and vineyards.
History
Parker County was established in 1855 from land that was formerly part of Navarro and Fannin counties. It was named for Isaac Parker, a Texas Ranger and state legislator. The county seat was originally located in Springtown, but was moved to Weatherford in 1856.
During the Civil War, the county was divided between Confederate and Union sympathizers. The county was the site of several battles, including the Battle of Weatherford in 1862. After the war, the county's economy was largely based on agriculture, with cotton, corn, and wheat being the main crops.
In the late 19th century, the county began to develop its oil and gas industry. The first oil well was drilled in 1892, and by the early 20th century, the county was home to several oil and gas companies. The county's economy continued to diversify in the 20th century, with the development of manufacturing and services.
Today, Parker County is a thriving community with a diverse economy. It is home to several large employers, and is a popular tourist destination, with its state parks, wineries, and historic sites.
Common Questions
What is Per Capita Income in Parker County?
Per Capita income in Parker County is $43,434.
What is the Median Family Income in Parker County?
Median Family Income in Parker County is $109,857.
What is the Median Household income in Parker County?
Median Household Income in Parker County is $95,721.
What is Income or Wage Gap in Parker County?
Income or Wage Gap in Parker County is 43.8%.
Women in Parker County earn 56.2 cents for every dollar earned by a man.
What is Family Income Deficit in Parker County?
Family Income Deficit in Parker County is $9,708.
Families that are below poverty line in Parker County earn $9,708 less on average than the poverty threshold level.
What is Inequality or Gini Index in Parker County?
Inequality or Gini Index in Parker County is 0.43.
What is the Total Population of Parker County?
Total Population of Parker County is 151,188.
What is the Total Male Population of Parker County?
Total Male Population of Parker County is 75,827.
What is the Total Female Population of Parker County?
Total Female Population of Parker County is 75,361.
What is the Ratio of Males per 100 Females in Parker County?
There are 100.62 Males per 100 Females in Parker County.
What is the Ratio of Females per 100 Males in Parker County?
There are 99.39 Females per 100 Males in Parker County.
What is the Median Population Age in Parker County?
Median Population Age in Parker County is 39.4 Years.
What is the Average Family Size in Parker County
Average Family Size in Parker County is 3.2 People.
What is the Average Household Size in Parker County
Average Household Size in Parker County is 2.8 People.
How Large is the Labor Force in Parker County?
There are 76,155 People in the Labor Forcein in Parker County.
What is the Percentage of People in the Labor Force in Parker County?
64.5% of People are in the Labor Force in Parker County.
What is the Unemployment Rate in Parker County?
Unemployment Rate in Parker County is 3.9%.