Mitchell County, TX Map & Demographics
Mitchell County Map
Mitchell County Overview
$24,591
PER CAPITA INCOME
$89,034
AVG FAMILY INCOME
$49,869
AVG HOUSEHOLD INCOME
57.4%
WAGE / INCOME GAP [ % ]
42.6¢/ $1
WAGE / INCOME GAP [ $ ]
0.46
INEQUALITY / GINI INDEX
8,947
TOTAL POPULATION
5,054
MALE POPULATION
3,893
FEMALE POPULATION
129.82
MALES / 100 FEMALES
77.03
FEMALES / 100 MALES
32.3
MEDIAN AGE
4.1
AVG FAMILY SIZE
3.1
AVG HOUSEHOLD SIZE
3,859
LABOR FORCE [ PEOPLE ]
51.2%
PERCENT IN LABOR FORCE
1.4%
UNEMPLOYMENT RATE
Income in Mitchell County
Income Overview in Mitchell County
Per Capita Income in Mitchell County is $24,591, while median incomes of families and households are $89,034 and $49,869 respectively.
| Characteristic | Number | Measure |
| Per Capita Income | 8,947 | $24,591 |
| Median Family Income | 1,385 | $89,034 |
| Mean Family Income | 1,385 | $109,962 |
| Median Household Income | 2,411 | $49,869 |
| Mean Household Income | 2,411 | $80,812 |
| Income Deficit | 1,385 | $0 |
| Wage / Income Gap (%) | 8,947 | 57.42% |
| Wage / Income Gap ($) | 8,947 | 42.58¢ per $1 |
| Gini / Inequality Index | 8,947 | 0.46 |
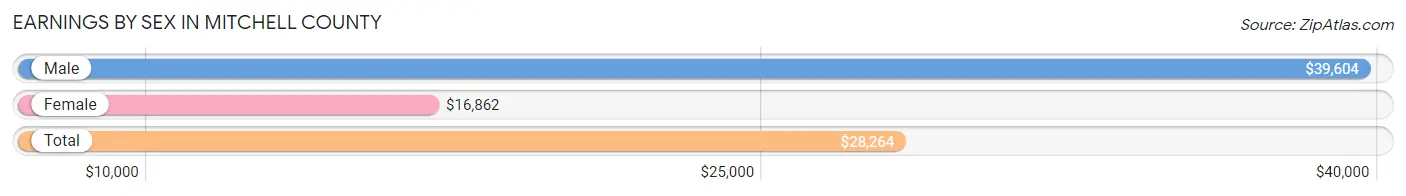
Earnings by Sex in Mitchell County
Average Earnings in Mitchell County are $28,264, $39,604 for men and $16,862 for women, a difference of 57.4%.
| Sex | Number | Average Earnings |
| Male | 2,108 (51.9%) | $39,604 |
| Female | 1,956 (48.1%) | $16,862 |
| Total | 4,064 (100.0%) | $28,264 |
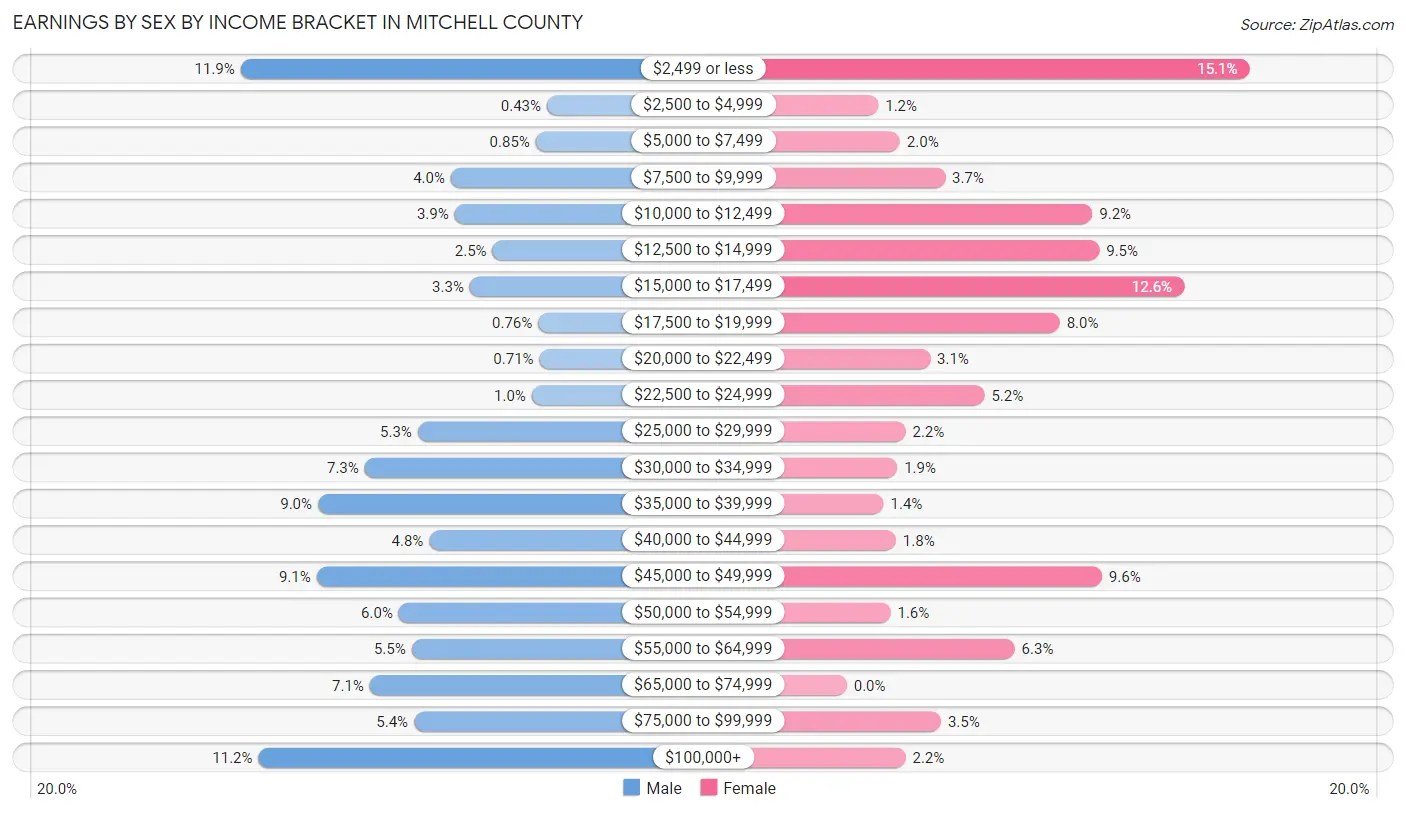
Earnings by Sex by Income Bracket in Mitchell County
The most common earnings brackets in Mitchell County are $2,499 or less for men (251 | 11.9%) and $2,499 or less for women (295 | 15.1%).
| Income | Male | Female |
| $2,499 or less | 251 (11.9%) | 295 (15.1%) |
| $2,500 to $4,999 | 9 (0.4%) | 23 (1.2%) |
| $5,000 to $7,499 | 18 (0.9%) | 39 (2.0%) |
| $7,500 to $9,999 | 85 (4.0%) | 72 (3.7%) |
| $10,000 to $12,499 | 82 (3.9%) | 180 (9.2%) |
| $12,500 to $14,999 | 52 (2.5%) | 185 (9.5%) |
| $15,000 to $17,499 | 70 (3.3%) | 247 (12.6%) |
| $17,500 to $19,999 | 16 (0.8%) | 156 (8.0%) |
| $20,000 to $22,499 | 15 (0.7%) | 61 (3.1%) |
| $22,500 to $24,999 | 21 (1.0%) | 101 (5.2%) |
| $25,000 to $29,999 | 111 (5.3%) | 43 (2.2%) |
| $30,000 to $34,999 | 153 (7.3%) | 37 (1.9%) |
| $35,000 to $39,999 | 190 (9.0%) | 27 (1.4%) |
| $40,000 to $44,999 | 102 (4.8%) | 36 (1.8%) |
| $45,000 to $49,999 | 191 (9.1%) | 187 (9.6%) |
| $50,000 to $54,999 | 126 (6.0%) | 32 (1.6%) |
| $55,000 to $64,999 | 116 (5.5%) | 123 (6.3%) |
| $65,000 to $74,999 | 149 (7.1%) | 0 (0.0%) |
| $75,000 to $99,999 | 114 (5.4%) | 69 (3.5%) |
| $100,000+ | 237 (11.2%) | 43 (2.2%) |
| Total | 2,108 (100.0%) | 1,956 (100.0%) |
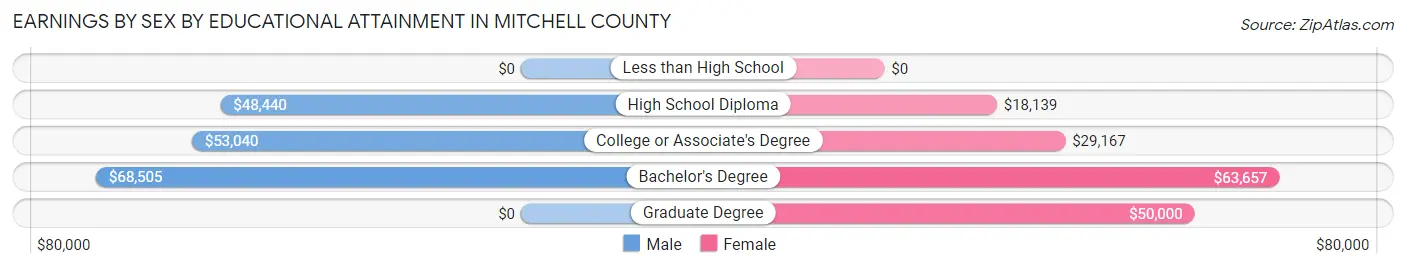
Earnings by Sex by Educational Attainment in Mitchell County
Average earnings in Mitchell County are $48,911 for men and $22,234 for women, a difference of 54.5%. Men with an educational attainment of bachelor's degree enjoy the highest average annual earnings of $68,505, while those with high school diploma education earn the least with $48,440. Women with an educational attainment of bachelor's degree earn the most with the average annual earnings of $63,657, while those with high school diploma education have the smallest earnings of $18,139.
| Educational Attainment | Male Income | Female Income |
| Less than High School | - | - |
| High School Diploma | $48,440 | $18,139 |
| College or Associate's Degree | $53,040 | $29,167 |
| Bachelor's Degree | $68,505 | $63,657 |
| Graduate Degree | - | - |
| Total | $48,911 | $22,234 |
Family Income in Mitchell County
Family Income Brackets in Mitchell County
According to the Mitchell County family income data, there are 271 families falling into the $100,000 to $149,999 income range, which is the most common income bracket and makes up 19.6% of all families.
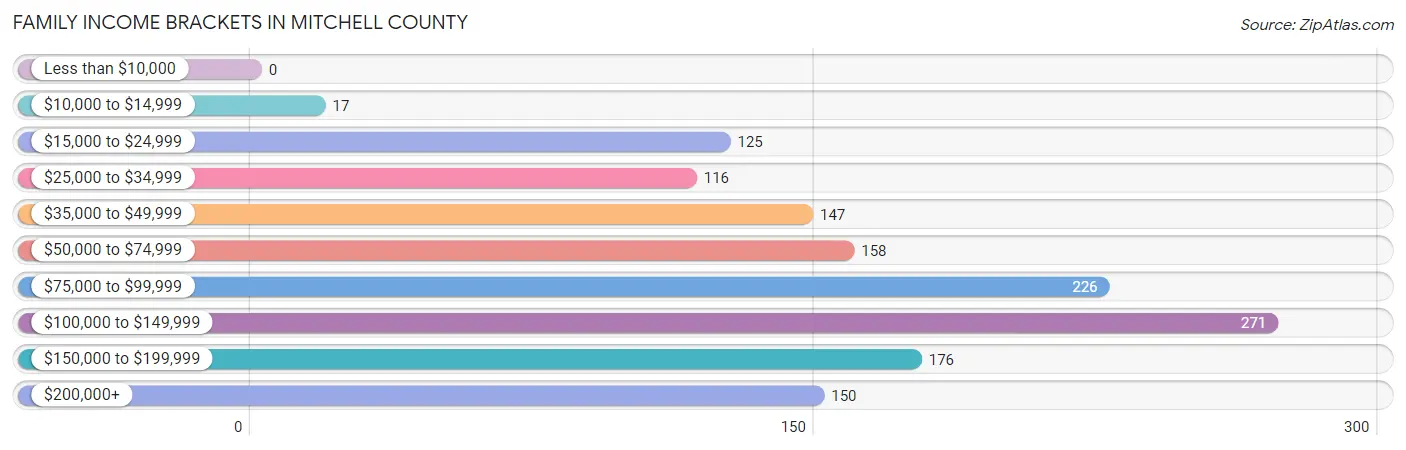
| Income Bracket | # Families | % Families |
| Less than $10,000 | 0 | 0.0% |
| $10,000 to $14,999 | 17 | 1.2% |
| $15,000 to $24,999 | 125 | 9.0% |
| $25,000 to $34,999 | 116 | 8.4% |
| $35,000 to $49,999 | 147 | 10.6% |
| $50,000 to $74,999 | 158 | 11.4% |
| $75,000 to $99,999 | 226 | 16.3% |
| $100,000 to $149,999 | 271 | 19.6% |
| $150,000 to $199,999 | 176 | 12.7% |
| $200,000+ | 150 | 10.8% |
Family Income by Famaliy Size in Mitchell County
5-person families (159 | 11.5%) account for the highest median family income in Mitchell County with $103,405 per family, while 2-person families (753 | 54.4%) have the highest median income of $47,032 per family member.
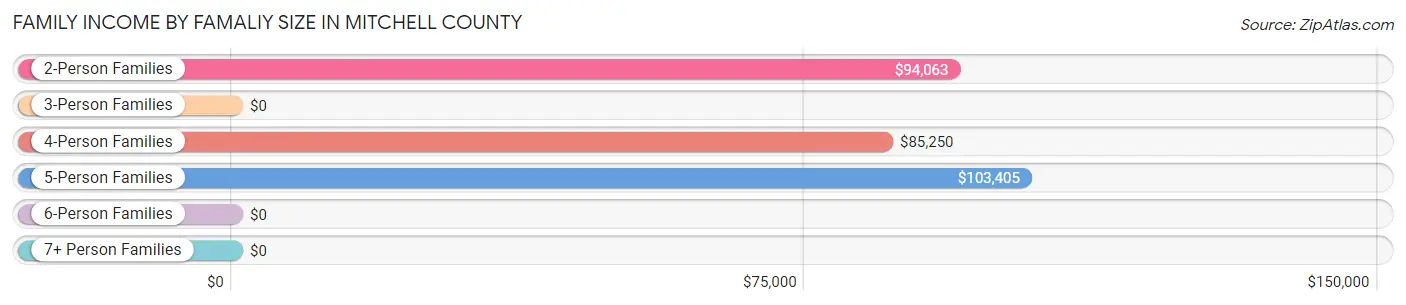
| Income Bracket | # Families | Median Income |
| 2-Person Families | 753 (54.4%) | $94,063 |
| 3-Person Families | 260 (18.8%) | $0 |
| 4-Person Families | 168 (12.1%) | $85,250 |
| 5-Person Families | 159 (11.5%) | $103,405 |
| 6-Person Families | 45 (3.3%) | $0 |
| 7+ Person Families | 0 (0.0%) | $0 |
| Total | 1,385 (100.0%) | $89,034 |
Family Income by Number of Earners in Mitchell County
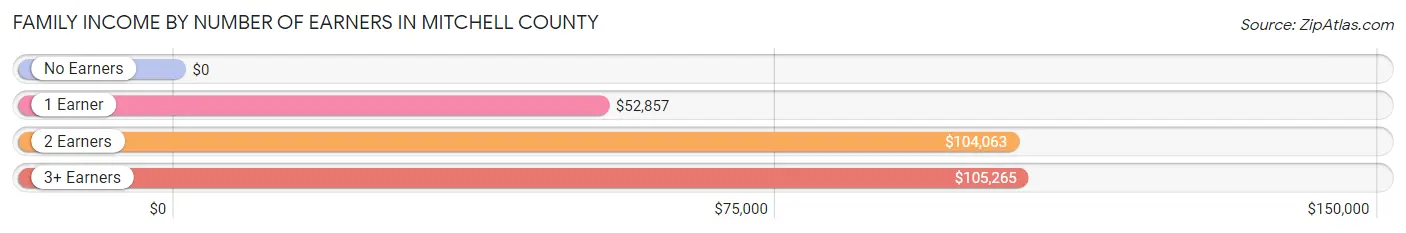
| Number of Earners | # Families | Median Income |
| No Earners | 209 (15.1%) | $0 |
| 1 Earner | 394 (28.4%) | $52,857 |
| 2 Earners | 687 (49.6%) | $104,063 |
| 3+ Earners | 95 (6.9%) | $105,265 |
| Total | 1,385 (100.0%) | $89,034 |
Household Income in Mitchell County
Household Income Brackets in Mitchell County
With 504 households falling in the category, the $35,000 to $49,999 income range is the most frequent in Mitchell County, accounting for 20.9% of all households. In contrast, only 87 households (3.6%) fall into the less than $10,000 income bracket, making it the least populous group.
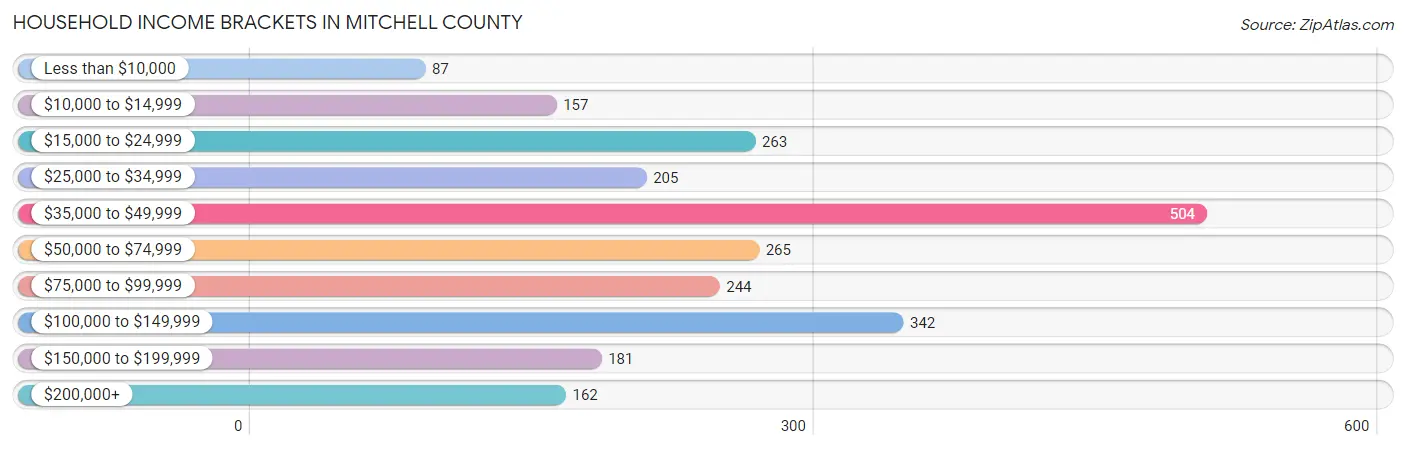
| Income Bracket | # Households | % Households |
| Less than $10,000 | 87 | 3.6% |
| $10,000 to $14,999 | 157 | 6.5% |
| $15,000 to $24,999 | 263 | 10.9% |
| $25,000 to $34,999 | 205 | 8.5% |
| $35,000 to $49,999 | 504 | 20.9% |
| $50,000 to $74,999 | 265 | 11.0% |
| $75,000 to $99,999 | 244 | 10.1% |
| $100,000 to $149,999 | 342 | 14.2% |
| $150,000 to $199,999 | 181 | 7.5% |
| $200,000+ | 162 | 6.7% |
Household Income by Householder Age in Mitchell County
The median household income in Mitchell County is $49,869, with the highest median household income of $80,188 found in the 45 to 64 years age bracket for the primary householder. A total of 847 households (35.1%) fall into this category. Meanwhile, the 65+ years age bracket for the primary householder has the lowest median household income of $38,167, with 700 households (29.0%) in this group.
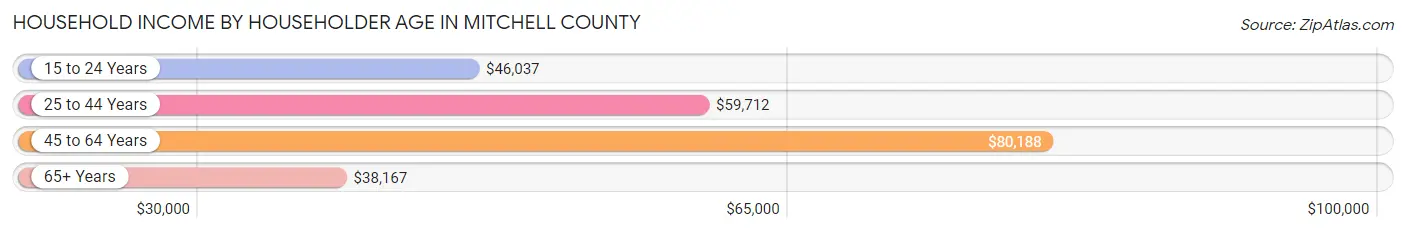
| Income Bracket | # Households | Median Income |
| 15 to 24 Years | 171 (7.1%) | $46,037 |
| 25 to 44 Years | 693 (28.7%) | $59,712 |
| 45 to 64 Years | 847 (35.1%) | $80,188 |
| 65+ Years | 700 (29.0%) | $38,167 |
| Total | 2,411 (100.0%) | $49,869 |
Poverty in Mitchell County
Income Below Poverty by Sex and Age in Mitchell County
With 8.8% poverty level for males and 19.7% for females among the residents of Mitchell County, 5 year old males and 18 to 24 year old females are the most vulnerable to poverty, with 24 males (32.9%) and 340 females (32.9%) in their respective age groups living below the poverty level.
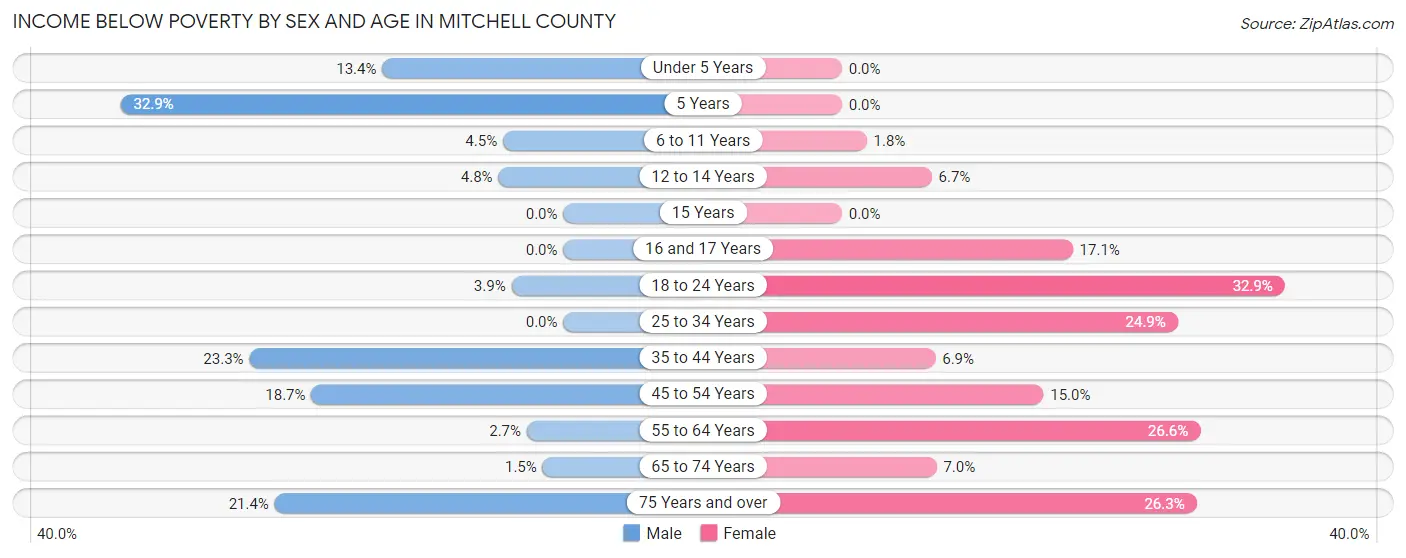
| Age Bracket | Male | Female |
| Under 5 Years | 34 (13.4%) | 0 (0.0%) |
| 5 Years | 24 (32.9%) | 0 (0.0%) |
| 6 to 11 Years | 9 (4.5%) | 5 (1.8%) |
| 12 to 14 Years | 4 (4.8%) | 7 (6.7%) |
| 15 Years | 0 (0.0%) | 0 (0.0%) |
| 16 and 17 Years | 0 (0.0%) | 6 (17.1%) |
| 18 to 24 Years | 19 (3.8%) | 340 (32.9%) |
| 25 to 34 Years | 0 (0.0%) | 86 (24.9%) |
| 35 to 44 Years | 69 (23.3%) | 20 (6.9%) |
| 45 to 54 Years | 90 (18.7%) | 60 (15.0%) |
| 55 to 64 Years | 12 (2.7%) | 112 (26.6%) |
| 65 to 74 Years | 5 (1.5%) | 27 (7.0%) |
| 75 Years and over | 39 (21.4%) | 74 (26.3%) |
| Total | 305 (8.8%) | 737 (19.7%) |
Income Above Poverty by Sex and Age in Mitchell County
According to the poverty statistics in Mitchell County, males aged 15 years and females aged under 5 years are the age groups that are most secure financially, with 100.0% of males and 100.0% of females in these age groups living above the poverty line.
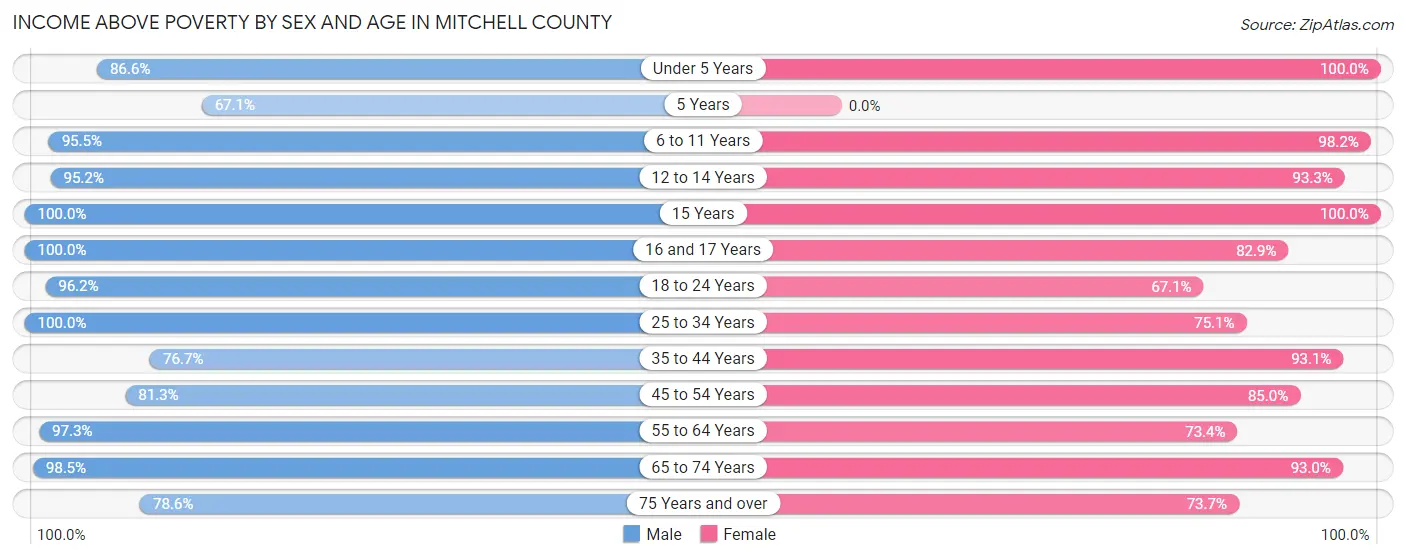
| Age Bracket | Male | Female |
| Under 5 Years | 219 (86.6%) | 141 (100.0%) |
| 5 Years | 49 (67.1%) | 0 (0.0%) |
| 6 to 11 Years | 192 (95.5%) | 267 (98.2%) |
| 12 to 14 Years | 79 (95.2%) | 98 (93.3%) |
| 15 Years | 9 (100.0%) | 29 (100.0%) |
| 16 and 17 Years | 205 (100.0%) | 29 (82.9%) |
| 18 to 24 Years | 474 (96.2%) | 694 (67.1%) |
| 25 to 34 Years | 432 (100.0%) | 259 (75.1%) |
| 35 to 44 Years | 227 (76.7%) | 268 (93.1%) |
| 45 to 54 Years | 391 (81.3%) | 341 (85.0%) |
| 55 to 64 Years | 431 (97.3%) | 309 (73.4%) |
| 65 to 74 Years | 319 (98.5%) | 357 (93.0%) |
| 75 Years and over | 143 (78.6%) | 207 (73.7%) |
| Total | 3,170 (91.2%) | 2,999 (80.3%) |
Income Below Poverty Among Married-Couple Families in Mitchell County
The poverty statistics for married-couple families in Mitchell County show that 7.0% or 77 of the total 1,099 families live below the poverty line. Families with 3 or 4 children have the highest poverty rate of 30.9%, comprising of 42 families. On the other hand, families with 1 or 2 children have the lowest poverty rate of 0.0%, which includes 0 families.
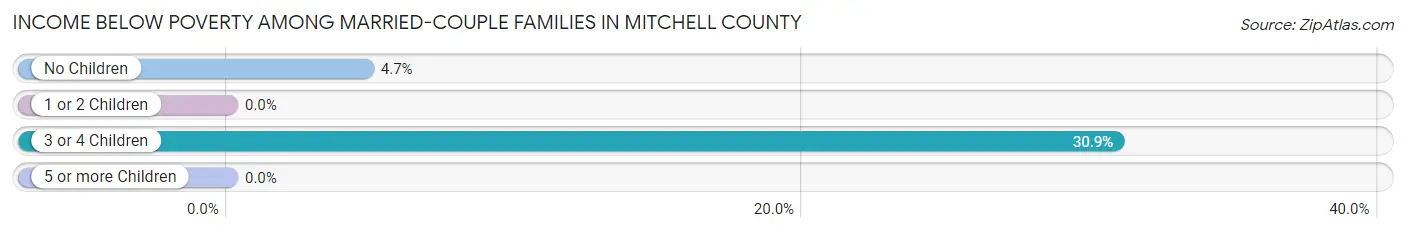
| Children | Above Poverty | Below Poverty |
| No Children | 705 (95.3%) | 35 (4.7%) |
| 1 or 2 Children | 223 (100.0%) | 0 (0.0%) |
| 3 or 4 Children | 94 (69.1%) | 42 (30.9%) |
| 5 or more Children | 0 (0.0%) | 0 (0.0%) |
| Total | 1,022 (93.0%) | 77 (7.0%) |
Income Below Poverty Among Single-Parent Households in Mitchell County
According to the poverty data in Mitchell County, 5.7% or 2 single-father households and 0.8% or 2 single-mother households are living below the poverty line. Among single-father households, those with 1 or 2 children have the highest poverty rate, with 2 households (9.5%) experiencing poverty. Likewise, among single-mother households, those with 1 or 2 children have the highest poverty rate, with 2 households (1.1%) falling below the poverty line.
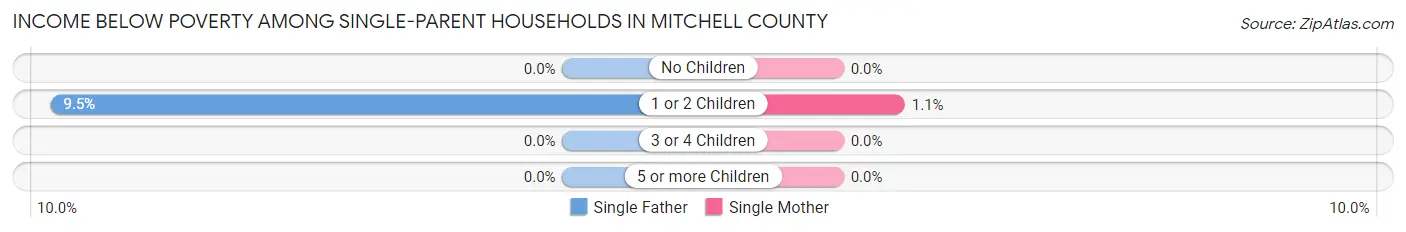
| Children | Single Father | Single Mother |
| No Children | 0 (0.0%) | 0 (0.0%) |
| 1 or 2 Children | 2 (9.5%) | 2 (1.1%) |
| 3 or 4 Children | 0 (0.0%) | 0 (0.0%) |
| 5 or more Children | 0 (0.0%) | 0 (0.0%) |
| Total | 2 (5.7%) | 2 (0.8%) |
Income Below Poverty Among Married-Couple vs Single-Parent Households in Mitchell County
The poverty data for Mitchell County shows that 77 of the married-couple family households (7.0%) and 4 of the single-parent households (1.4%) are living below the poverty level. Within the married-couple family households, those with 3 or 4 children have the highest poverty rate, with 42 households (30.9%) falling below the poverty line. Among the single-parent households, those with 1 or 2 children have the highest poverty rate, with 4 household (2.0%) living below poverty.
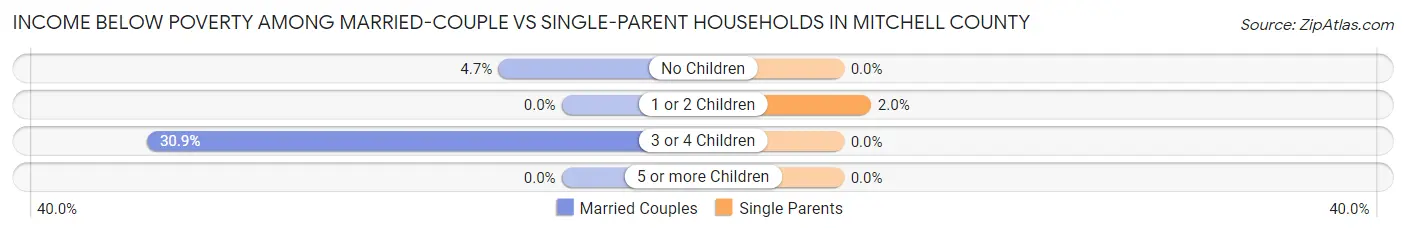
| Children | Married-Couple Families | Single-Parent Households |
| No Children | 35 (4.7%) | 0 (0.0%) |
| 1 or 2 Children | 0 (0.0%) | 4 (2.0%) |
| 3 or 4 Children | 42 (30.9%) | 0 (0.0%) |
| 5 or more Children | 0 (0.0%) | 0 (0.0%) |
| Total | 77 (7.0%) | 4 (1.4%) |
Race in Mitchell County
The most populous races in Mitchell County are White / Caucasian (6,017 | 67.2%), Hispanic or Latino (3,674 | 41.1%), and Two or more Races (1,444 | 16.1%).
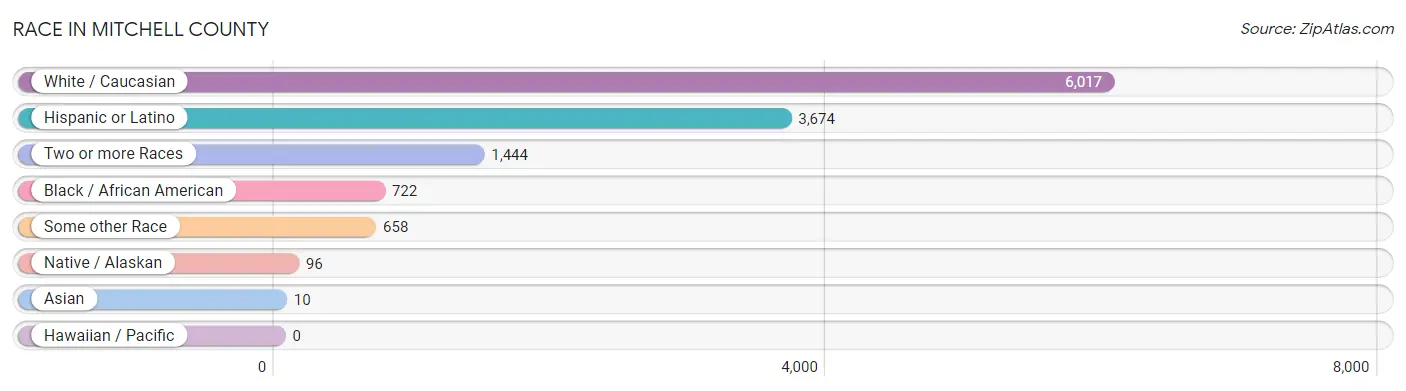
| Race | # Population | % Population |
| Asian | 10 | 0.1% |
| Black / African American | 722 | 8.1% |
| Hawaiian / Pacific | 0 | 0.0% |
| Hispanic or Latino | 3,674 | 41.1% |
| Native / Alaskan | 96 | 1.1% |
| White / Caucasian | 6,017 | 67.2% |
| Two or more Races | 1,444 | 16.1% |
| Some other Race | 658 | 7.3% |
| Total | 8,947 | 100.0% |
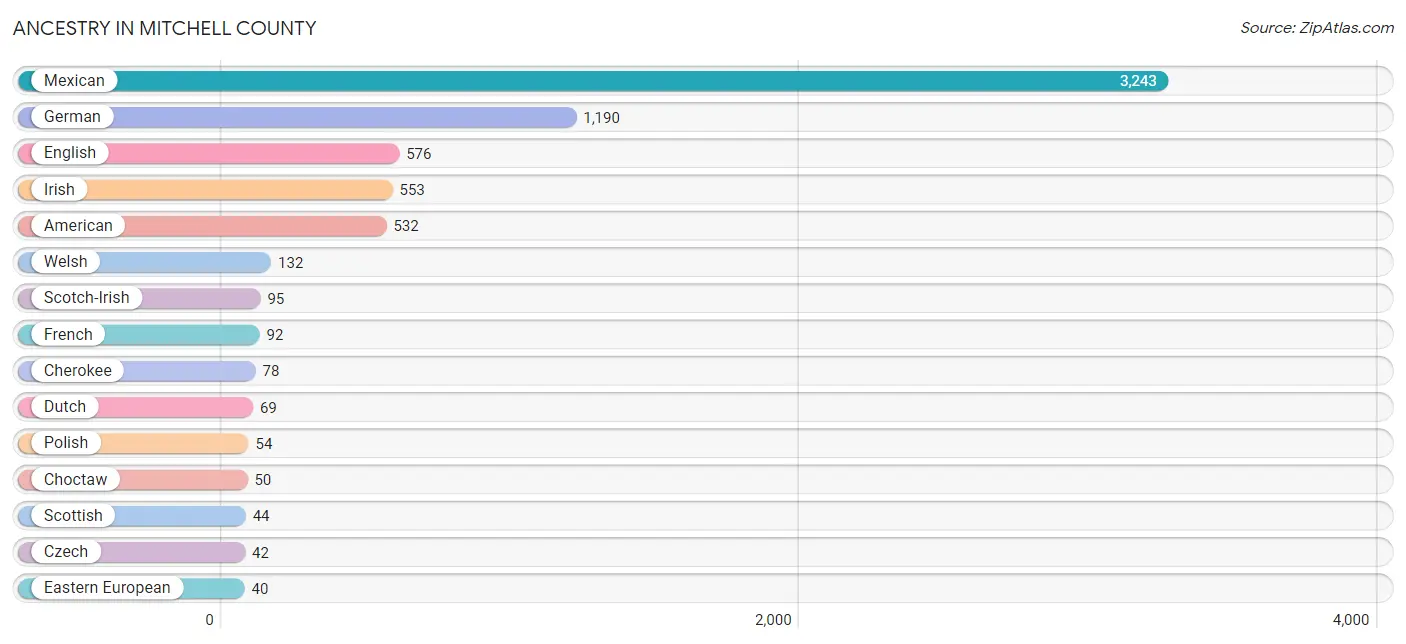
Ancestry in Mitchell County
The most populous ancestries reported in Mitchell County are Mexican (3,243 | 36.2%), German (1,190 | 13.3%), English (576 | 6.4%), Irish (553 | 6.2%), and American (532 | 5.9%), together accounting for 68.1% of all Mitchell County residents.
| Ancestry | # Population | % Population |
| African | 6 | 0.1% |
| American | 532 | 5.9% |
| Apache | 30 | 0.3% |
| Austrian | 9 | 0.1% |
| Barbadian | 13 | 0.2% |
| Blackfeet | 12 | 0.1% |
| British | 4 | 0.0% |
| Central American | 33 | 0.4% |
| Cherokee | 78 | 0.9% |
| Choctaw | 50 | 0.6% |
| Czech | 42 | 0.5% |
| Czechoslovakian | 10 | 0.1% |
| Danish | 14 | 0.2% |
| Dutch | 69 | 0.8% |
| Dutch West Indian | 1 | 0.0% |
| Eastern European | 40 | 0.4% |
| English | 576 | 6.4% |
| European | 8 | 0.1% |
| French | 92 | 1.0% |
| German | 1,190 | 13.3% |
| Greek | 2 | 0.0% |
| Guatemalan | 14 | 0.2% |
| Honduran | 11 | 0.1% |
| Irish | 553 | 6.2% |
| Italian | 11 | 0.1% |
| Jamaican | 7 | 0.1% |
| Korean | 10 | 0.1% |
| Mexican | 3,243 | 36.2% |
| Mexican American Indian | 39 | 0.4% |
| Norwegian | 30 | 0.3% |
| Panamanian | 4 | 0.0% |
| Polish | 54 | 0.6% |
| Puerto Rican | 11 | 0.1% |
| Salvadoran | 4 | 0.0% |
| Scandinavian | 9 | 0.1% |
| Scotch-Irish | 95 | 1.1% |
| Scottish | 44 | 0.5% |
| Spanish | 15 | 0.2% |
| Subsaharan African | 6 | 0.1% |
| Swedish | 3 | 0.0% |
| Thai | 11 | 0.1% |
| Welsh | 132 | 1.5% | View All 42 Rows |
Immigrants in Mitchell County
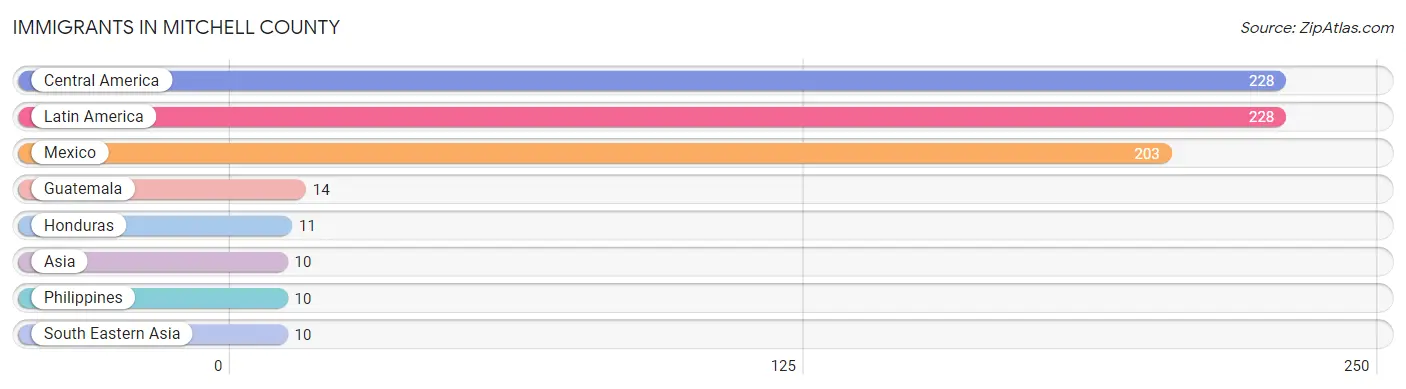
The most numerous immigrant groups reported in Mitchell County came from Central America (228 | 2.5%), Latin America (228 | 2.5%), Mexico (203 | 2.3%), Guatemala (14 | 0.2%), and Honduras (11 | 0.1%), together accounting for 7.7% of all Mitchell County residents.
| Immigration Origin | # Population | % Population |
| Asia | 10 | 0.1% |
| Central America | 228 | 2.5% |
| Guatemala | 14 | 0.2% |
| Honduras | 11 | 0.1% |
| Latin America | 228 | 2.5% |
| Mexico | 203 | 2.3% |
| Philippines | 10 | 0.1% |
| South Eastern Asia | 10 | 0.1% | View All 8 Rows |
Sex and Age in Mitchell County
Sex and Age in Mitchell County
The most populous age groups in Mitchell County are 20 to 24 Years (613 | 12.1%) for men and 20 to 24 Years (976 | 25.1%) for women.

| Age Bracket | Male | Female |
| Under 5 Years | 416 (8.2%) | 141 (3.6%) |
| 5 to 9 Years | 217 (4.3%) | 334 (8.6%) |
| 10 to 14 Years | 145 (2.9%) | 119 (3.1%) |
| 15 to 19 Years | 405 (8.0%) | 122 (3.1%) |
| 20 to 24 Years | 613 (12.1%) | 976 (25.1%) |
| 25 to 29 Years | 447 (8.8%) | 186 (4.8%) |
| 30 to 34 Years | 605 (12.0%) | 159 (4.1%) |
| 35 to 39 Years | 256 (5.1%) | 122 (3.1%) |
| 40 to 44 Years | 337 (6.7%) | 166 (4.3%) |
| 45 to 49 Years | 397 (7.9%) | 234 (6.0%) |
| 50 to 54 Years | 234 (4.6%) | 167 (4.3%) |
| 55 to 59 Years | 288 (5.7%) | 216 (5.6%) |
| 60 to 64 Years | 162 (3.2%) | 205 (5.3%) |
| 65 to 69 Years | 215 (4.3%) | 169 (4.3%) |
| 70 to 74 Years | 116 (2.3%) | 215 (5.5%) |
| 75 to 79 Years | 53 (1.1%) | 142 (3.6%) |
| 80 to 84 Years | 104 (2.1%) | 86 (2.2%) |
| 85 Years and over | 44 (0.9%) | 134 (3.4%) |
| Total | 5,054 (100.0%) | 3,893 (100.0%) |
Families and Households in Mitchell County
Median Family Size in Mitchell County
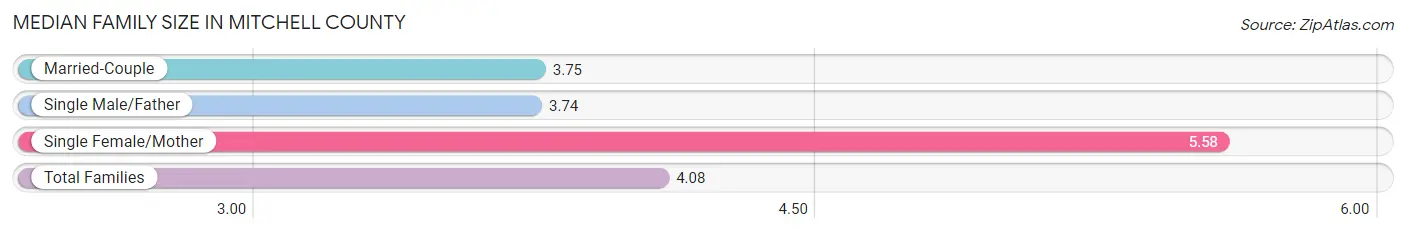
The median family size in Mitchell County is 4.08 persons per family, with single female/mother families (251 | 18.1%) accounting for the largest median family size of 5.58 persons per family. On the other hand, single male/father families (35 | 2.5%) represent the smallest median family size with 3.74 persons per family.
| Family Type | # Families | Family Size |
| Married-Couple | 1,099 (79.3%) | 3.75 |
| Single Male/Father | 35 (2.5%) | 3.74 |
| Single Female/Mother | 251 (18.1%) | 5.58 |
| Total Families | 1,385 (100.0%) | 4.08 |
Median Household Size in Mitchell County
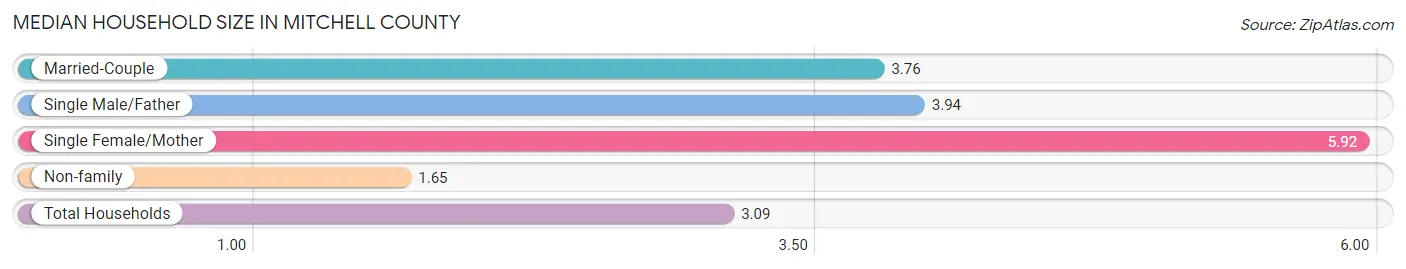
The median household size in Mitchell County is 3.09 persons per household, with single female/mother households (251 | 10.4%) accounting for the largest median household size of 5.92 persons per household. non-family households (1,026 | 42.5%) represent the smallest median household size with 1.65 persons per household.
| Household Type | # Households | Household Size |
| Married-Couple | 1,099 (45.6%) | 3.76 |
| Single Male/Father | 35 (1.5%) | 3.94 |
| Single Female/Mother | 251 (10.4%) | 5.92 |
| Non-family | 1,026 (42.5%) | 1.65 |
| Total Households | 2,411 (100.0%) | 3.09 |
Household Size by Marriage Status in Mitchell County
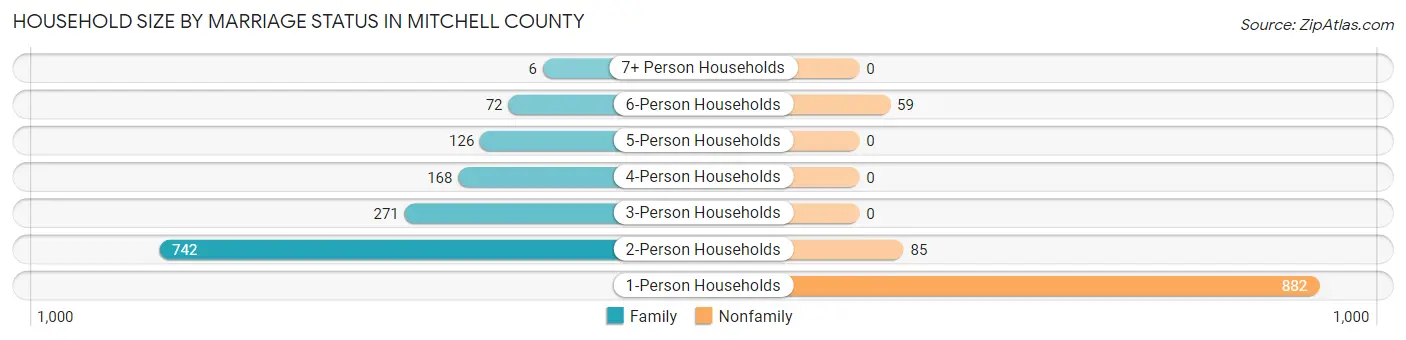
Out of a total of 2,411 households in Mitchell County, 1,385 (57.5%) are family households, while 1,026 (42.5%) are nonfamily households. The most numerous type of family households are 2-person households, comprising 742, and the most common type of nonfamily households are 1-person households, comprising 882.
| Household Size | Family Households | Nonfamily Households |
| 1-Person Households | - | 882 (36.6%) |
| 2-Person Households | 742 (30.8%) | 85 (3.5%) |
| 3-Person Households | 271 (11.2%) | 0 (0.0%) |
| 4-Person Households | 168 (7.0%) | 0 (0.0%) |
| 5-Person Households | 126 (5.2%) | 0 (0.0%) |
| 6-Person Households | 72 (3.0%) | 59 (2.5%) |
| 7+ Person Households | 6 (0.3%) | 0 (0.0%) |
| Total | 1,385 (57.5%) | 1,026 (42.5%) |
Female Fertility in Mitchell County
Fertility by Age in Mitchell County
Average fertility rate in Mitchell County is 157.0 births per 1,000 women. Women in the age bracket of 20 to 34 years have the highest fertility rate with 241.0 births per 1,000 women. Women in the age bracket of 20 to 34 years acount for 100.0% of all women with births.
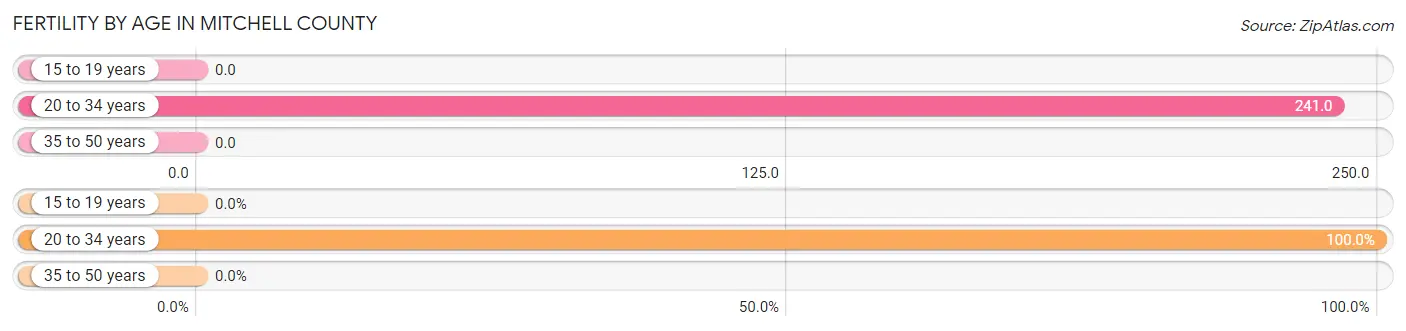
| Age Bracket | Women with Births | Births / 1,000 Women |
| 15 to 19 years | 0 (0.0%) | 0.0 |
| 20 to 34 years | 319 (100.0%) | 241.0 |
| 35 to 50 years | 0 (0.0%) | 0.0 |
| Total | 319 (100.0%) | 157.0 |
Fertility by Age by Marriage Status in Mitchell County
1.6% of women with births (319) in Mitchell County are married. The highest percentage of unmarried women with births falls into 20 to 34 years age bracket with 98.4% of them unmarried at the time of birth, while the lowest percentage of unmarried women with births belong to 20 to 34 years age bracket with 98.4% of them unmarried.
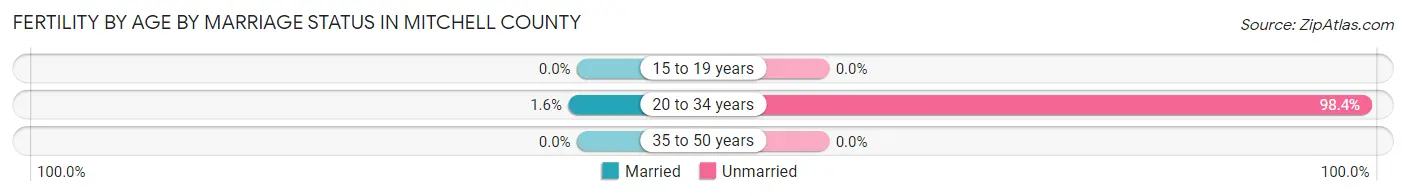
| Age Bracket | Married | Unmarried |
| 15 to 19 years | 0 (0.0%) | 0 (0.0%) |
| 20 to 34 years | 5 (1.6%) | 314 (98.4%) |
| 35 to 50 years | 0 (0.0%) | 0 (0.0%) |
| Total | 5 (1.6%) | 314 (98.4%) |
Fertility by Education in Mitchell County
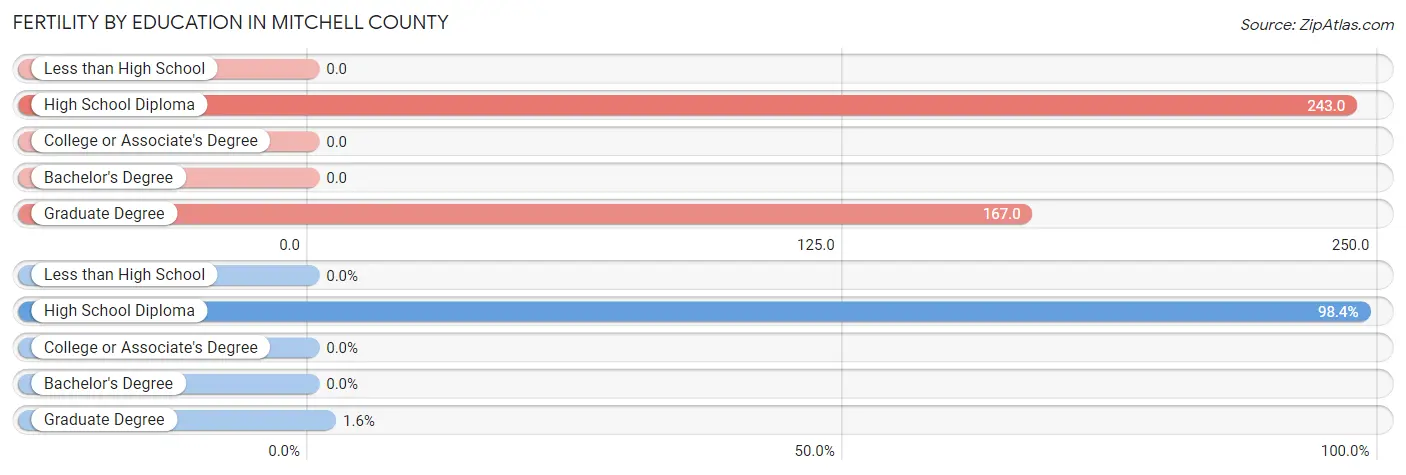
| Educational Attainment | Women with Births | Births / 1,000 Women |
| Less than High School | 0 (0.0%) | 0.0 |
| High School Diploma | 314 (98.4%) | 243.0 |
| College or Associate's Degree | 0 (0.0%) | 0.0 |
| Bachelor's Degree | 0 (0.0%) | 0.0 |
| Graduate Degree | 5 (1.6%) | 167.0 |
| Total | 319 (100.0%) | 157.0 |
Fertility by Education by Marriage Status in Mitchell County
98.4% of women with births in Mitchell County are unmarried. Women with the educational attainment of graduate degree are most likely to be married with 100.0% of them married at childbirth, while women with the educational attainment of high school diploma are least likely to be married with 100.0% of them unmarried at childbirth.
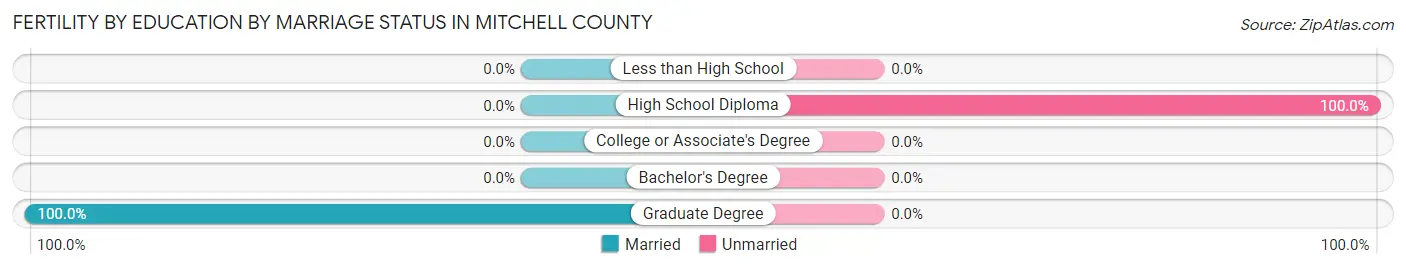
| Educational Attainment | Married | Unmarried |
| Less than High School | 0 (0.0%) | 0 (0.0%) |
| High School Diploma | 0 (0.0%) | 314 (100.0%) |
| College or Associate's Degree | 0 (0.0%) | 0 (0.0%) |
| Bachelor's Degree | 0 (0.0%) | 0 (0.0%) |
| Graduate Degree | 5 (100.0%) | 0 (0.0%) |
| Total | 5 (1.6%) | 314 (98.4%) |
Employment Characteristics in Mitchell County
Employment by Class of Employer in Mitchell County
Among the 3,745 employed individuals in Mitchell County, private company employees (2,530 | 67.6%), local government employees (459 | 12.3%), and self-employed (not incorporated) (400 | 10.7%) make up the most common classes of employment.
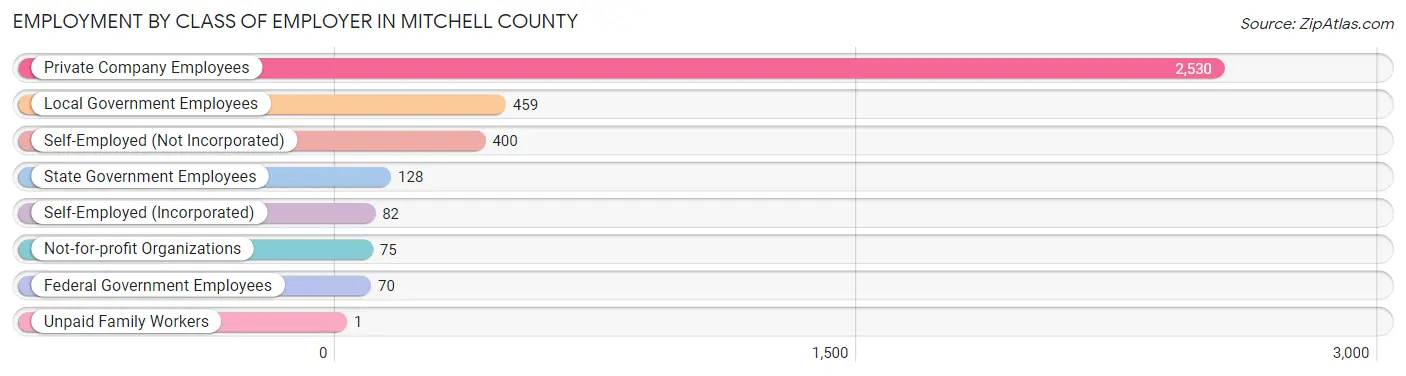
| Employer Class | # Employees | % Employees |
| Private Company Employees | 2,530 | 67.6% |
| Self-Employed (Incorporated) | 82 | 2.2% |
| Self-Employed (Not Incorporated) | 400 | 10.7% |
| Not-for-profit Organizations | 75 | 2.0% |
| Local Government Employees | 459 | 12.3% |
| State Government Employees | 128 | 3.4% |
| Federal Government Employees | 70 | 1.9% |
| Unpaid Family Workers | 1 | 0.0% |
| Total | 3,745 | 100.0% |
Employment Status by Age in Mitchell County
According to the labor force statistics for Mitchell County, out of the total population over 16 years of age (7,537), 51.2% or 3,859 individuals are in the labor force, with 1.4% or 54 of them unemployed. The age group with the highest labor force participation rate is 45 to 54 years, with 71.8% or 741 individuals in the labor force. Within the labor force, the 55 to 59 years age range has the highest percentage of unemployed individuals, with 6.0% or 20 of them being unemployed.
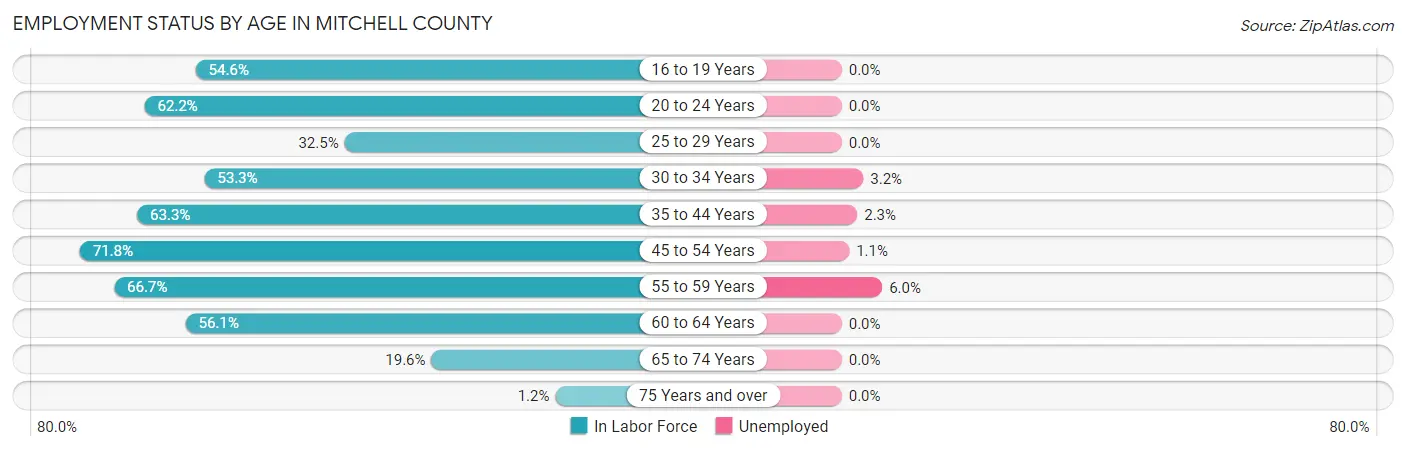
| Age Bracket | In Labor Force | Unemployed |
| 16 to 19 Years | 267 (54.6%) | 0 (0.0%) |
| 20 to 24 Years | 988 (62.2%) | 0 (0.0%) |
| 25 to 29 Years | 206 (32.5%) | 0 (0.0%) |
| 30 to 34 Years | 407 (53.3%) | 13 (3.2%) |
| 35 to 44 Years | 558 (63.3%) | 13 (2.3%) |
| 45 to 54 Years | 741 (71.8%) | 8 (1.1%) |
| 55 to 59 Years | 336 (66.7%) | 20 (6.0%) |
| 60 to 64 Years | 206 (56.1%) | 0 (0.0%) |
| 65 to 74 Years | 140 (19.6%) | 0 (0.0%) |
| 75 Years and over | 7 (1.2%) | 0 (0.0%) |
| Total | 3,859 (51.2%) | 54 (1.4%) |
Employment Status by Educational Attainment in Mitchell County
According to labor force statistics for Mitchell County, 58.7% of individuals (2,454) out of the total population between 25 and 64 years of age (4,181) are in the labor force, with 2.2% or 54 of them being unemployed. The group with the highest labor force participation rate are those with the educational attainment of bachelor's degree or higher, with 92.5% or 380 individuals in the labor force. Within the labor force, individuals with bachelor's degree or higher education have the highest percentage of unemployment, with 3.4% or 13 of them being unemployed.
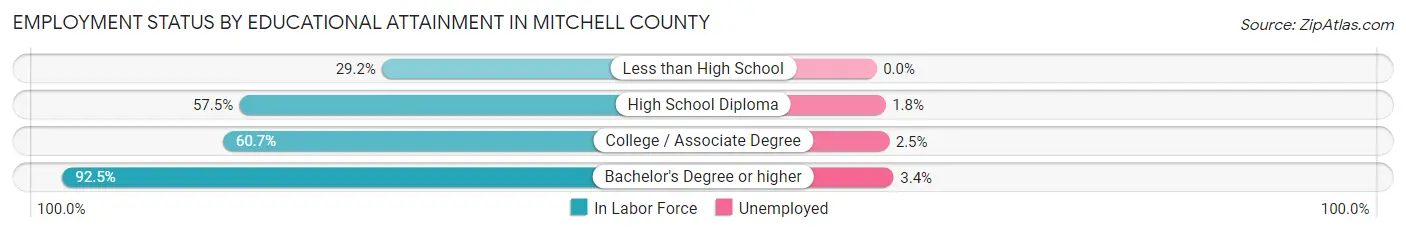
| Educational Attainment | In Labor Force | Unemployed |
| Less than High School | 147 (29.2%) | 0 (0.0%) |
| High School Diploma | 1,014 (57.5%) | 32 (1.8%) |
| College / Associate Degree | 912 (60.7%) | 38 (2.5%) |
| Bachelor's Degree or higher | 380 (92.5%) | 14 (3.4%) |
| Total | 2,454 (58.7%) | 92 (2.2%) |
Employment Occupations by Sex in Mitchell County
Management, Business, Science and Arts Occupations
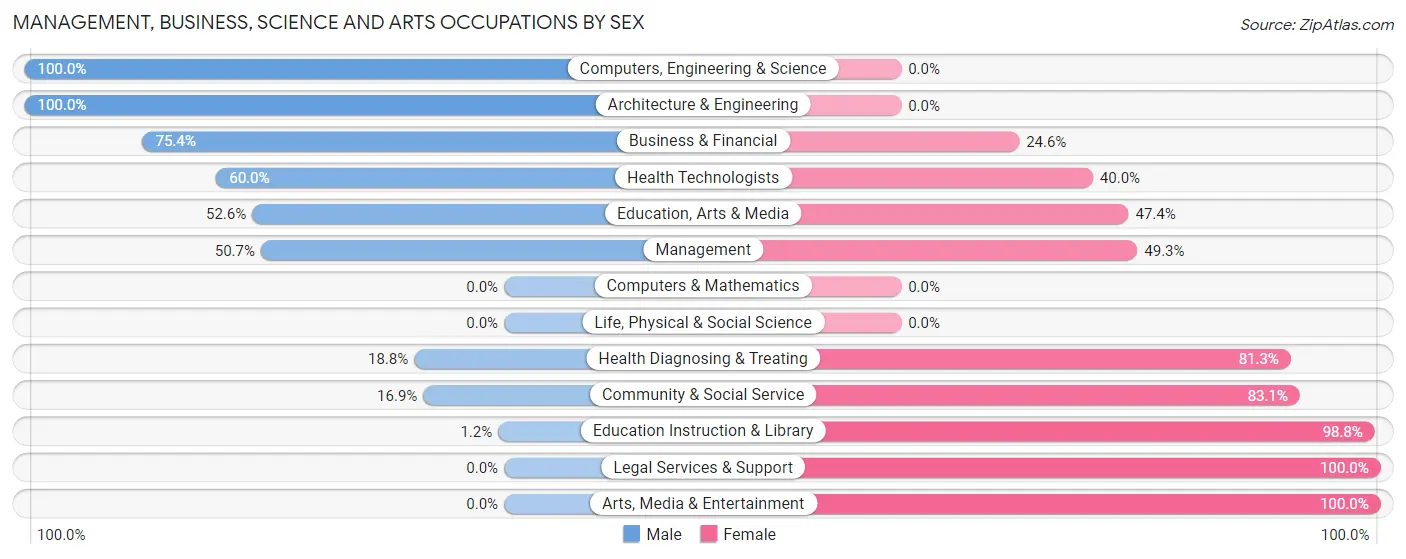
The most common Management, Business, Science and Arts occupations in Mitchell County are Management (412 | 10.8%), Community & Social Service (255 | 6.7%), Education Instruction & Library (162 | 4.3%), Health Diagnosing & Treating (96 | 2.5%), and Education, Arts & Media (78 | 2.1%).
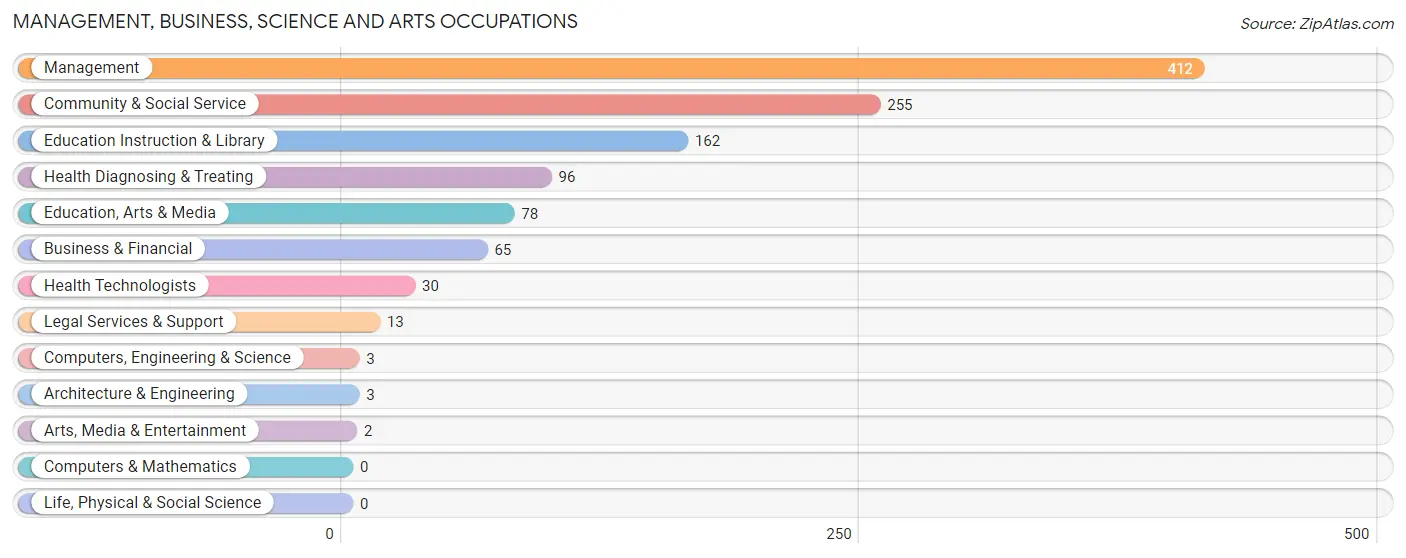
Management, Business, Science and Arts Occupations by Sex
Within the Management, Business, Science and Arts occupations in Mitchell County, the most male-oriented occupations are Computers, Engineering & Science (100.0%), Architecture & Engineering (100.0%), and Business & Financial (75.4%), while the most female-oriented occupations are Legal Services & Support (100.0%), Arts, Media & Entertainment (100.0%), and Education Instruction & Library (98.8%).
| Occupation | Male | Female |
| Management | 209 (50.7%) | 203 (49.3%) |
| Business & Financial | 49 (75.4%) | 16 (24.6%) |
| Computers, Engineering & Science | 3 (100.0%) | 0 (0.0%) |
| Computers & Mathematics | 0 (0.0%) | 0 (0.0%) |
| Architecture & Engineering | 3 (100.0%) | 0 (0.0%) |
| Life, Physical & Social Science | 0 (0.0%) | 0 (0.0%) |
| Community & Social Service | 43 (16.9%) | 212 (83.1%) |
| Education, Arts & Media | 41 (52.6%) | 37 (47.4%) |
| Legal Services & Support | 0 (0.0%) | 13 (100.0%) |
| Education Instruction & Library | 2 (1.2%) | 160 (98.8%) |
| Arts, Media & Entertainment | 0 (0.0%) | 2 (100.0%) |
| Health Diagnosing & Treating | 18 (18.8%) | 78 (81.2%) |
| Health Technologists | 18 (60.0%) | 12 (40.0%) |
| Total (Category) | 322 (38.8%) | 509 (61.3%) |
| Total (Overall) | 1,920 (50.5%) | 1,882 (49.5%) |
Services Occupations
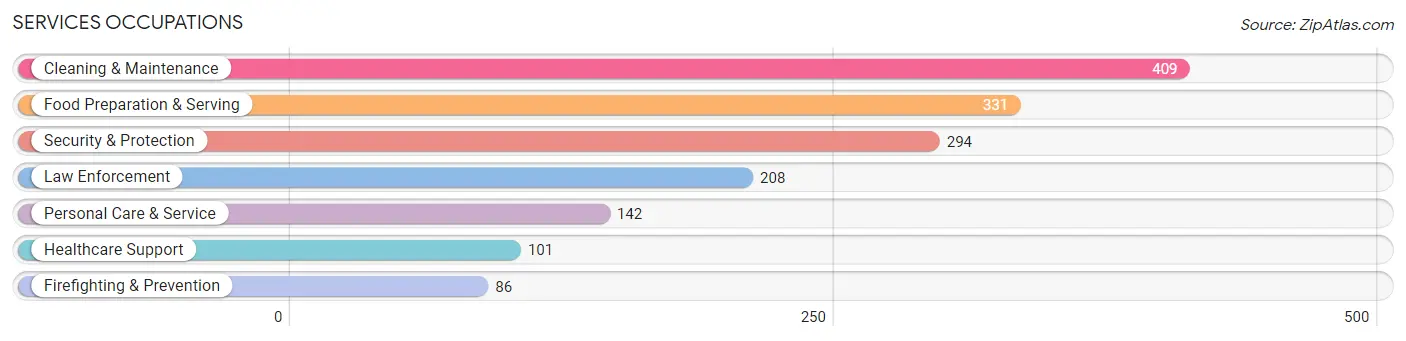
The most common Services occupations in Mitchell County are Cleaning & Maintenance (409 | 10.8%), Food Preparation & Serving (331 | 8.7%), Security & Protection (294 | 7.7%), Law Enforcement (208 | 5.5%), and Personal Care & Service (142 | 3.7%).
Services Occupations by Sex
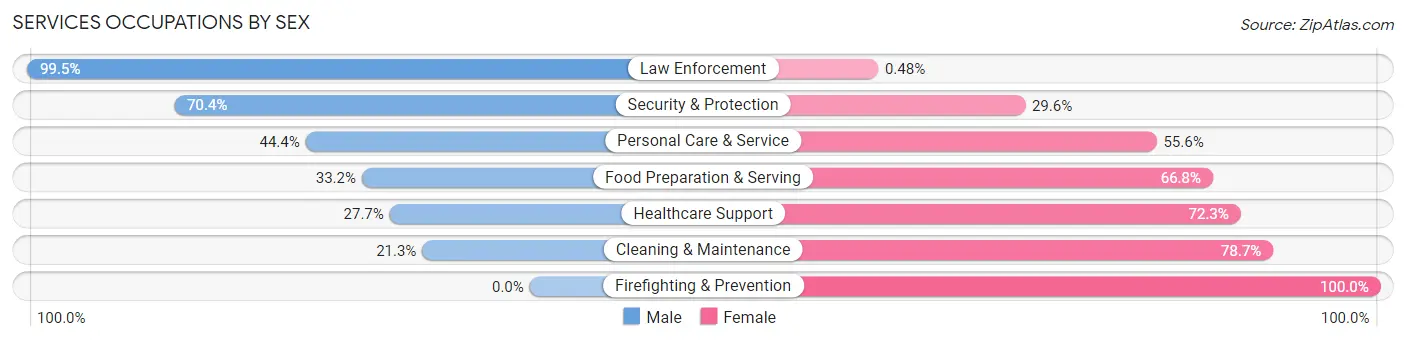
Within the Services occupations in Mitchell County, the most male-oriented occupations are Law Enforcement (99.5%), Security & Protection (70.4%), and Personal Care & Service (44.4%), while the most female-oriented occupations are Firefighting & Prevention (100.0%), Cleaning & Maintenance (78.7%), and Healthcare Support (72.3%).
| Occupation | Male | Female |
| Healthcare Support | 28 (27.7%) | 73 (72.3%) |
| Security & Protection | 207 (70.4%) | 87 (29.6%) |
| Firefighting & Prevention | 0 (0.0%) | 86 (100.0%) |
| Law Enforcement | 207 (99.5%) | 1 (0.5%) |
| Food Preparation & Serving | 110 (33.2%) | 221 (66.8%) |
| Cleaning & Maintenance | 87 (21.3%) | 322 (78.7%) |
| Personal Care & Service | 63 (44.4%) | 79 (55.6%) |
| Total (Category) | 495 (38.8%) | 782 (61.2%) |
| Total (Overall) | 1,920 (50.5%) | 1,882 (49.5%) |
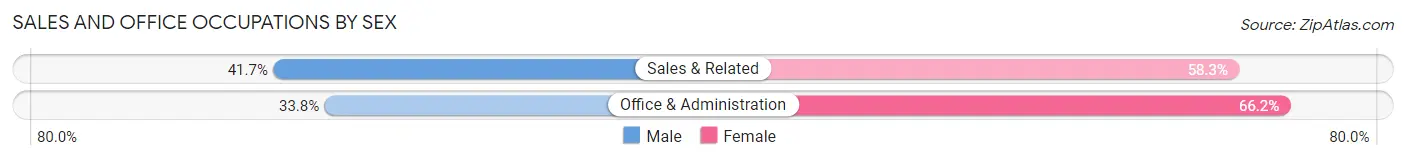
Sales and Office Occupations
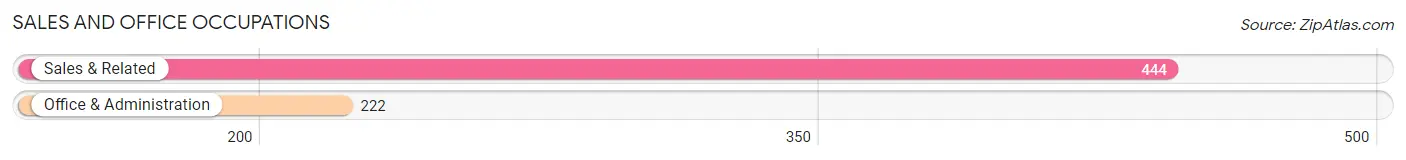
The most common Sales and Office occupations in Mitchell County are Sales & Related (444 | 11.7%), and Office & Administration (222 | 5.8%).
Sales and Office Occupations by Sex
| Occupation | Male | Female |
| Sales & Related | 185 (41.7%) | 259 (58.3%) |
| Office & Administration | 75 (33.8%) | 147 (66.2%) |
| Total (Category) | 260 (39.0%) | 406 (61.0%) |
| Total (Overall) | 1,920 (50.5%) | 1,882 (49.5%) |
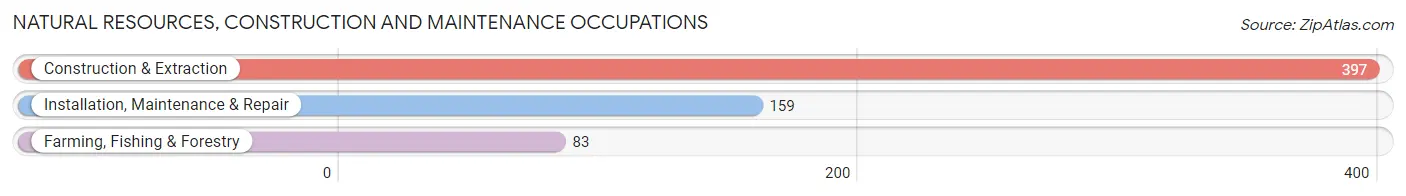
Natural Resources, Construction and Maintenance Occupations
The most common Natural Resources, Construction and Maintenance occupations in Mitchell County are Construction & Extraction (397 | 10.4%), Installation, Maintenance & Repair (159 | 4.2%), and Farming, Fishing & Forestry (83 | 2.2%).
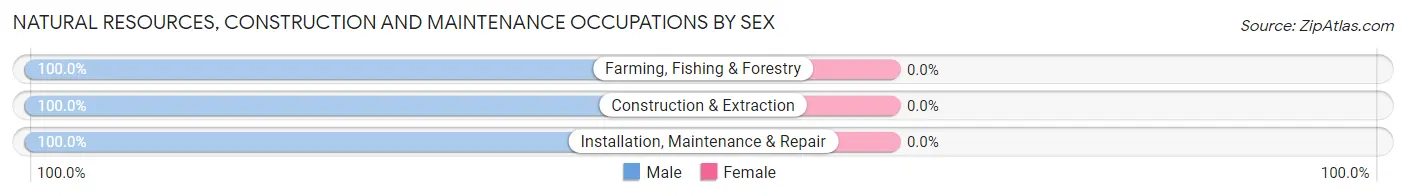
Natural Resources, Construction and Maintenance Occupations by Sex
| Occupation | Male | Female |
| Farming, Fishing & Forestry | 83 (100.0%) | 0 (0.0%) |
| Construction & Extraction | 397 (100.0%) | 0 (0.0%) |
| Installation, Maintenance & Repair | 159 (100.0%) | 0 (0.0%) |
| Total (Category) | 639 (100.0%) | 0 (0.0%) |
| Total (Overall) | 1,920 (50.5%) | 1,882 (49.5%) |
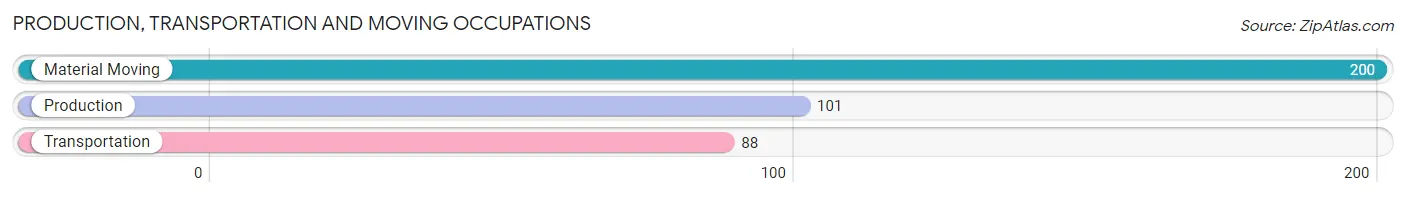
Production, Transportation and Moving Occupations
The most common Production, Transportation and Moving occupations in Mitchell County are Material Moving (200 | 5.3%), Production (101 | 2.7%), and Transportation (88 | 2.3%).
Production, Transportation and Moving Occupations by Sex
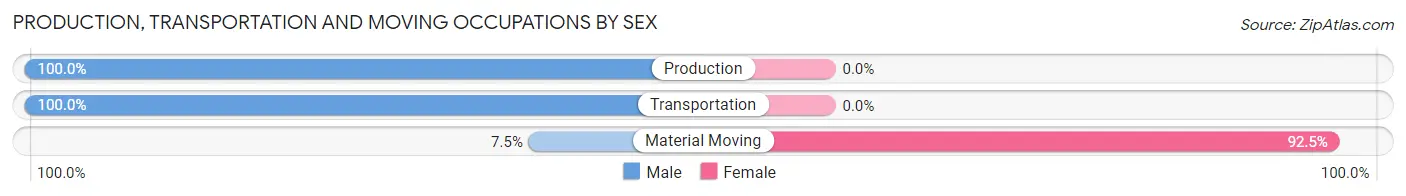
| Occupation | Male | Female |
| Production | 101 (100.0%) | 0 (0.0%) |
| Transportation | 88 (100.0%) | 0 (0.0%) |
| Material Moving | 15 (7.5%) | 185 (92.5%) |
| Total (Category) | 204 (52.4%) | 185 (47.6%) |
| Total (Overall) | 1,920 (50.5%) | 1,882 (49.5%) |
Employment Industries by Sex in Mitchell County
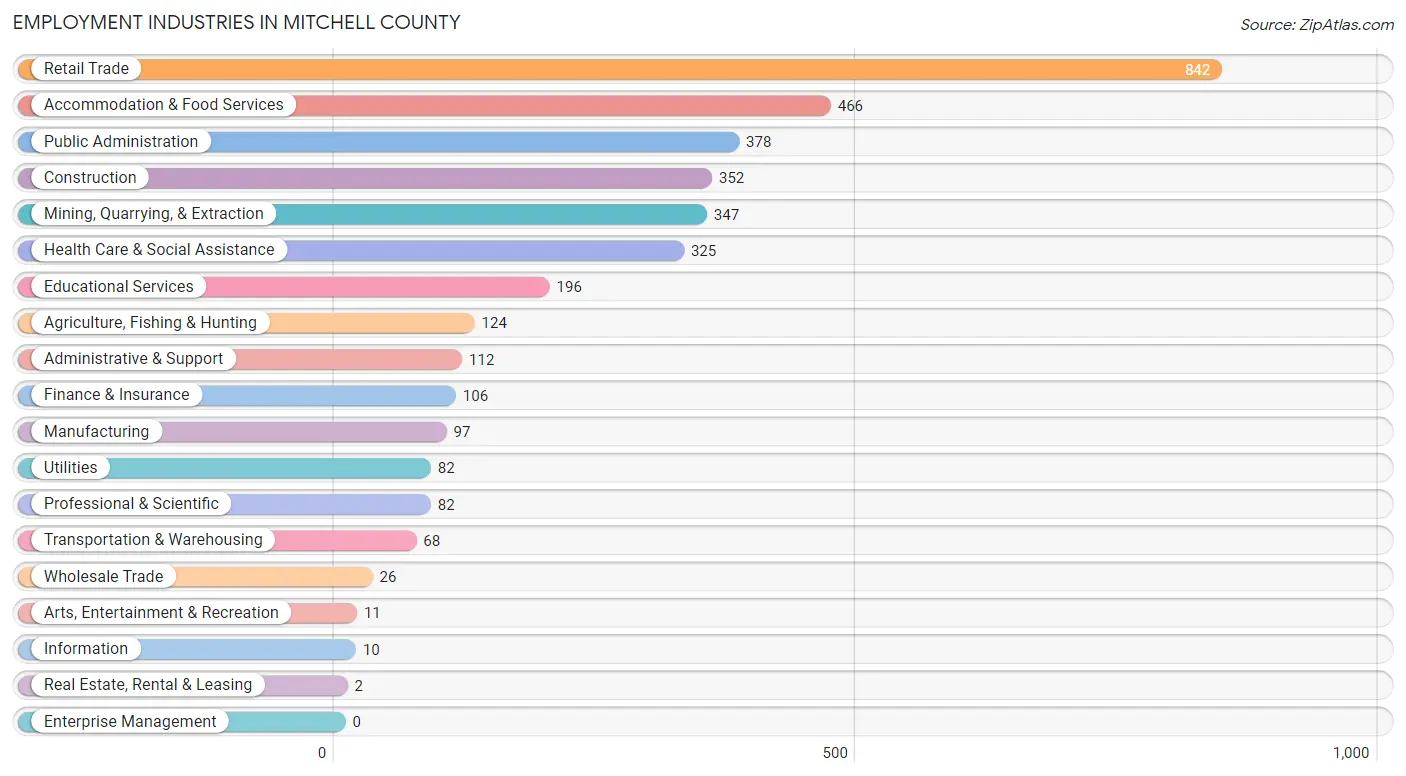
Employment Industries in Mitchell County
The major employment industries in Mitchell County include Retail Trade (842 | 22.2%), Accommodation & Food Services (466 | 12.3%), Public Administration (378 | 9.9%), Construction (352 | 9.3%), and Mining, Quarrying, & Extraction (347 | 9.1%).
Employment Industries by Sex in Mitchell County
The Mitchell County industries that see more men than women are Agriculture, Fishing & Hunting (100.0%), Utilities (100.0%), and Administrative & Support (100.0%), whereas the industries that tend to have a higher number of women are Information (100.0%), Finance & Insurance (100.0%), and Real Estate, Rental & Leasing (100.0%).
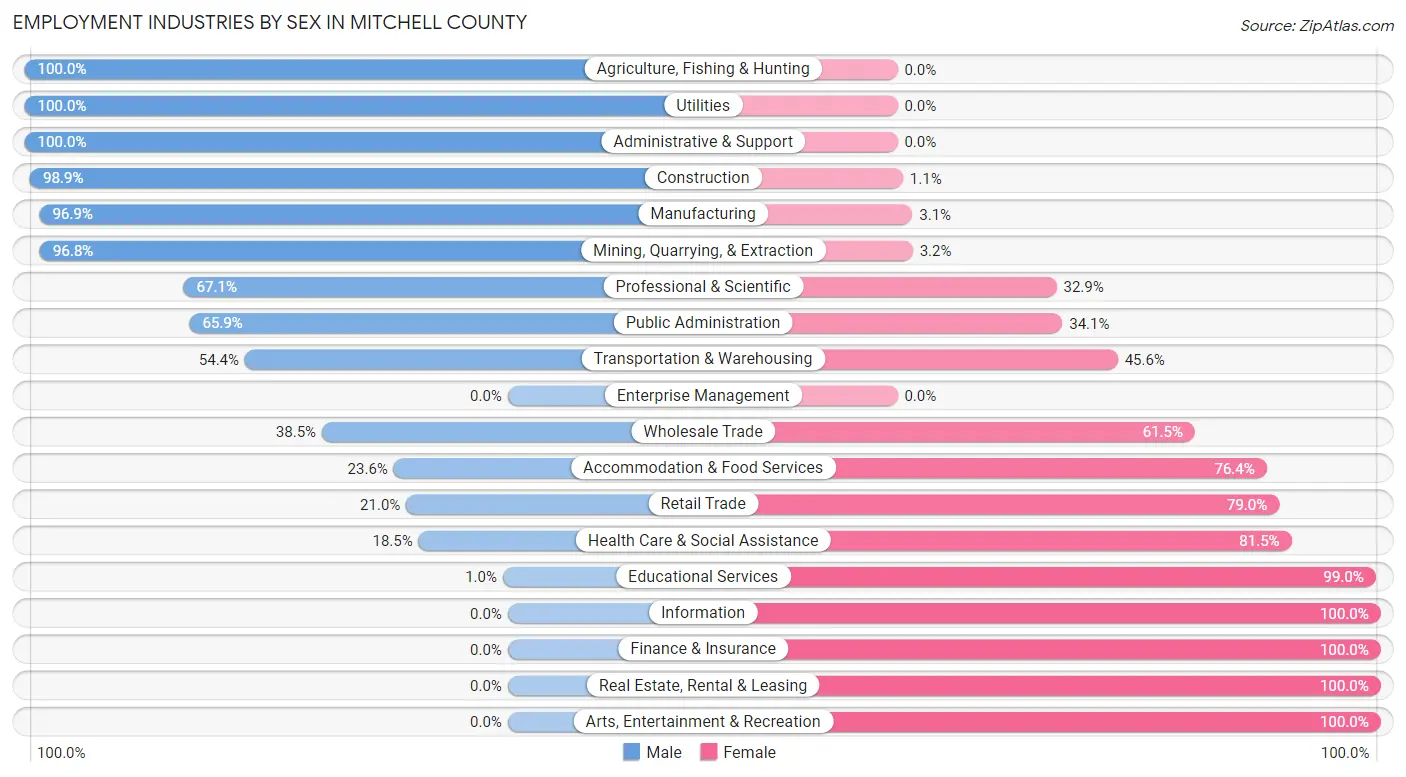
| Industry | Male | Female |
| Agriculture, Fishing & Hunting | 124 (100.0%) | 0 (0.0%) |
| Mining, Quarrying, & Extraction | 336 (96.8%) | 11 (3.2%) |
| Construction | 348 (98.9%) | 4 (1.1%) |
| Manufacturing | 94 (96.9%) | 3 (3.1%) |
| Wholesale Trade | 10 (38.5%) | 16 (61.5%) |
| Retail Trade | 177 (21.0%) | 665 (79.0%) |
| Transportation & Warehousing | 37 (54.4%) | 31 (45.6%) |
| Utilities | 82 (100.0%) | 0 (0.0%) |
| Information | 0 (0.0%) | 10 (100.0%) |
| Finance & Insurance | 0 (0.0%) | 106 (100.0%) |
| Real Estate, Rental & Leasing | 0 (0.0%) | 2 (100.0%) |
| Professional & Scientific | 55 (67.1%) | 27 (32.9%) |
| Enterprise Management | 0 (0.0%) | 0 (0.0%) |
| Administrative & Support | 112 (100.0%) | 0 (0.0%) |
| Educational Services | 2 (1.0%) | 194 (99.0%) |
| Health Care & Social Assistance | 60 (18.5%) | 265 (81.5%) |
| Arts, Entertainment & Recreation | 0 (0.0%) | 11 (100.0%) |
| Accommodation & Food Services | 110 (23.6%) | 356 (76.4%) |
| Public Administration | 249 (65.9%) | 129 (34.1%) |
| Total | 1,920 (50.5%) | 1,882 (49.5%) |
Education in Mitchell County
School Enrollment in Mitchell County
The most common levels of schooling among the 1,665 students in Mitchell County are high school (523 | 31.4%), elementary school (454 | 27.3%), and college / undergraduate (351 | 21.1%).
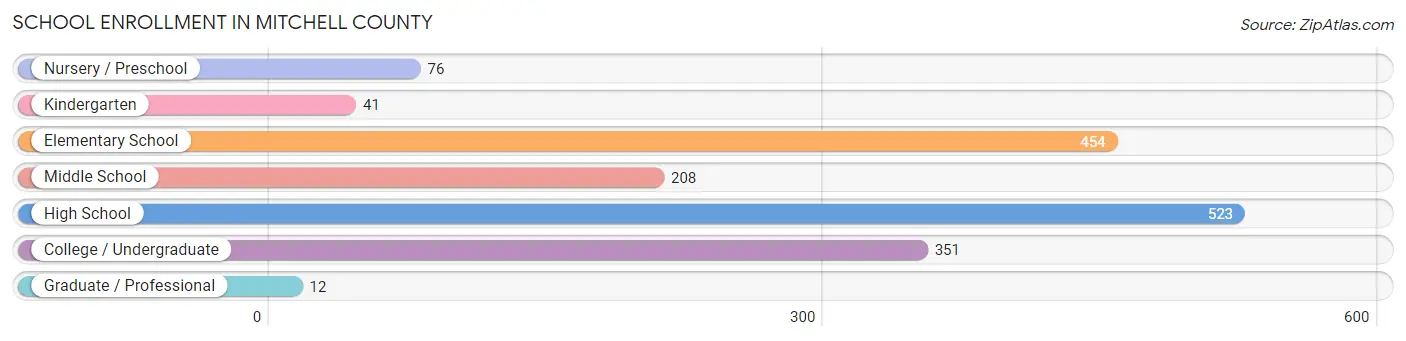
| School Level | # Students | % Students |
| Nursery / Preschool | 76 | 4.6% |
| Kindergarten | 41 | 2.5% |
| Elementary School | 454 | 27.3% |
| Middle School | 208 | 12.5% |
| High School | 523 | 31.4% |
| College / Undergraduate | 351 | 21.1% |
| Graduate / Professional | 12 | 0.7% |
| Total | 1,665 | 100.0% |
School Enrollment by Age by Funding Source in Mitchell County
Out of a total of 1,665 students who are enrolled in schools in Mitchell County, 87 (5.2%) attend a private institution, while the remaining 1,578 (94.8%) are enrolled in public schools. The age group of 18 to 19 year olds has the highest likelihood of being enrolled in private schools, with 43 (19.0% in the age bracket) enrolled. Conversely, the age group of 15 to 17 year olds has the lowest likelihood of being enrolled in a private school, with 271 (100.0% in the age bracket) attending a public institution.
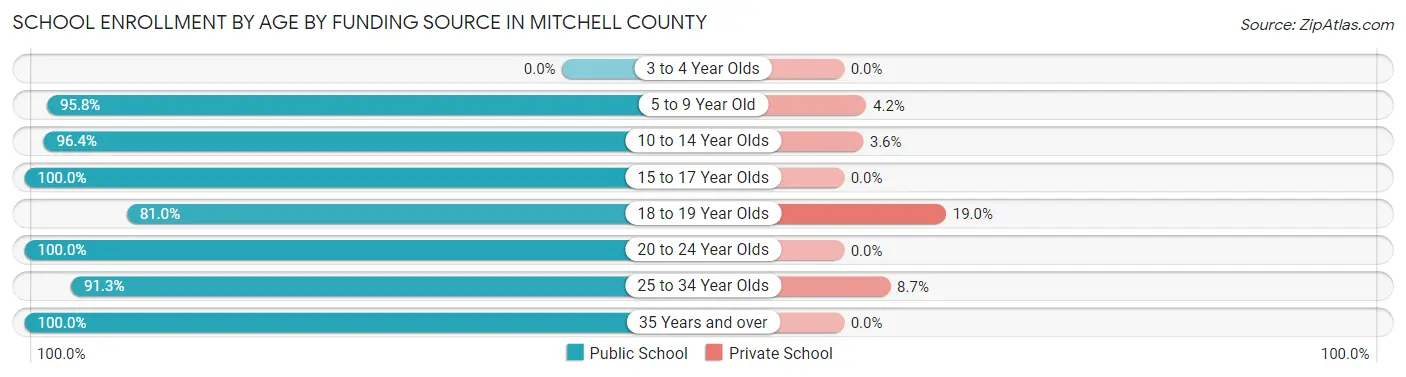
| Age Bracket | Public School | Private School |
| 3 to 4 Year Olds | 0 (0.0%) | 0 (0.0%) |
| 5 to 9 Year Old | 528 (95.8%) | 23 (4.2%) |
| 10 to 14 Year Olds | 244 (96.4%) | 9 (3.6%) |
| 15 to 17 Year Olds | 271 (100.0%) | 0 (0.0%) |
| 18 to 19 Year Olds | 183 (81.0%) | 43 (19.0%) |
| 20 to 24 Year Olds | 188 (100.0%) | 0 (0.0%) |
| 25 to 34 Year Olds | 116 (91.3%) | 11 (8.7%) |
| 35 Years and over | 49 (100.0%) | 0 (0.0%) |
| Total | 1,578 (94.8%) | 87 (5.2%) |
Educational Attainment by Field of Study in Mitchell County
Education (183 | 32.1%), bio, nature & agricultural (85 | 14.9%), business (82 | 14.4%), arts & humanities (58 | 10.2%), and science & technology (48 | 8.4%) are the most common fields of study among 570 individuals in Mitchell County who have obtained a bachelor's degree or higher.
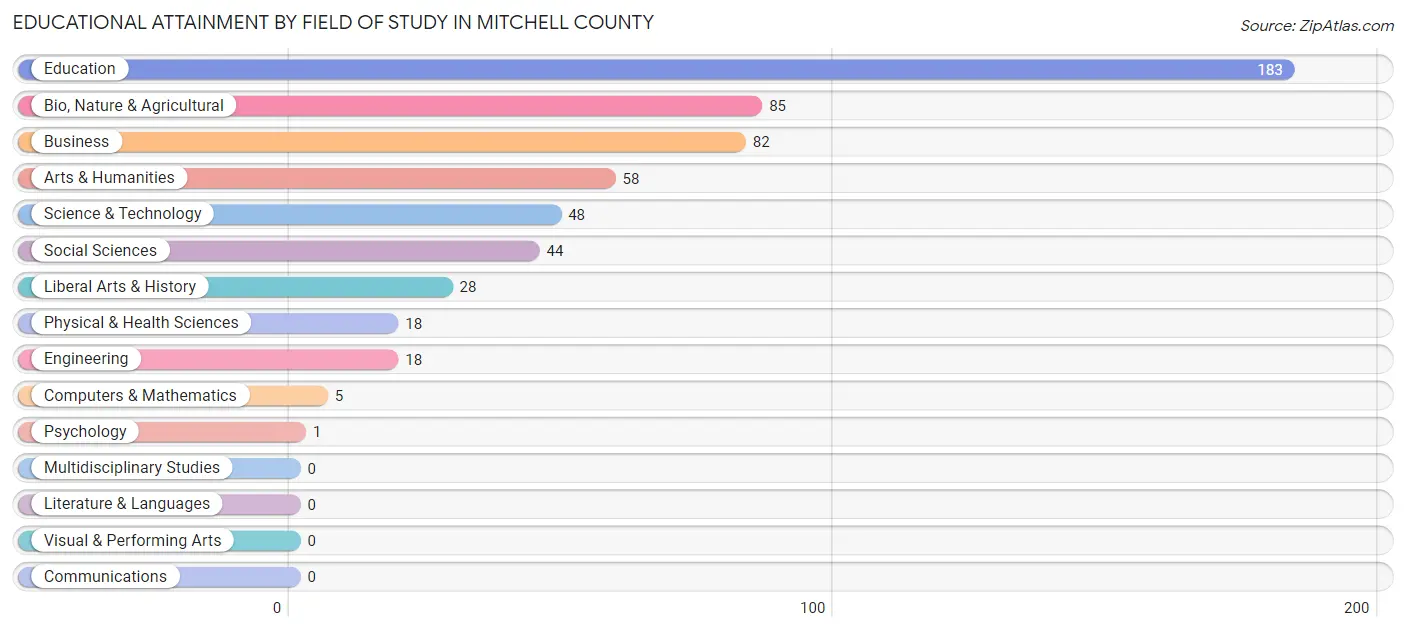
| Field of Study | # Graduates | % Graduates |
| Computers & Mathematics | 5 | 0.9% |
| Bio, Nature & Agricultural | 85 | 14.9% |
| Physical & Health Sciences | 18 | 3.2% |
| Psychology | 1 | 0.2% |
| Social Sciences | 44 | 7.7% |
| Engineering | 18 | 3.2% |
| Multidisciplinary Studies | 0 | 0.0% |
| Science & Technology | 48 | 8.4% |
| Business | 82 | 14.4% |
| Education | 183 | 32.1% |
| Literature & Languages | 0 | 0.0% |
| Liberal Arts & History | 28 | 4.9% |
| Visual & Performing Arts | 0 | 0.0% |
| Communications | 0 | 0.0% |
| Arts & Humanities | 58 | 10.2% |
| Total | 570 | 100.0% |
Transportation & Commute in Mitchell County
Vehicle Availability by Sex in Mitchell County
The most prevalent vehicle ownership categories in Mitchell County are males with 3 vehicles (692, accounting for 36.3%) and females with 3 vehicles (344, making up 37.7%).
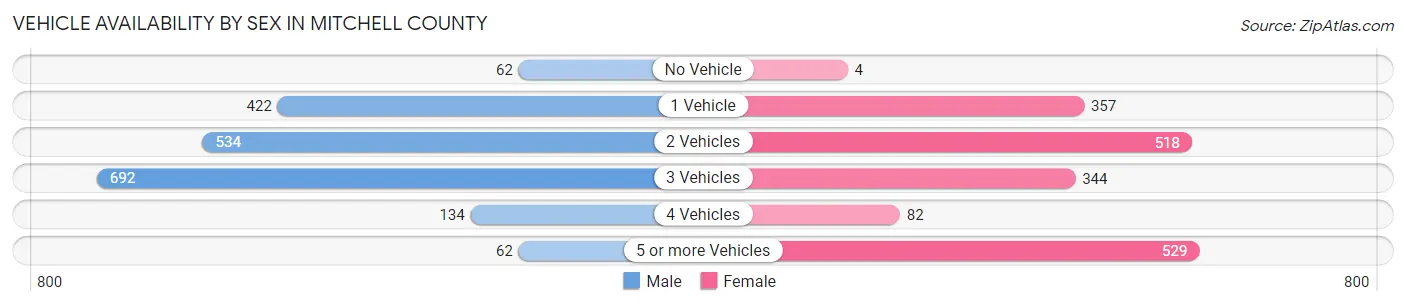
| Vehicles Available | Male | Female |
| No Vehicle | 62 (3.3%) | 4 (0.2%) |
| 1 Vehicle | 422 (22.1%) | 357 (19.5%) |
| 2 Vehicles | 534 (28.0%) | 518 (28.2%) |
| 3 Vehicles | 692 (36.3%) | 344 (18.8%) |
| 4 Vehicles | 134 (7.0%) | 82 (4.5%) |
| 5 or more Vehicles | 62 (3.3%) | 529 (28.8%) |
| Total | 1,906 (100.0%) | 1,834 (100.0%) |
Commute Time in Mitchell County
The most frequently occuring commute durations in Mitchell County are 5 to 9 minutes (811 commuters, 21.9%), 45 to 59 minutes (652 commuters, 17.6%), and 10 to 14 minutes (422 commuters, 11.4%).
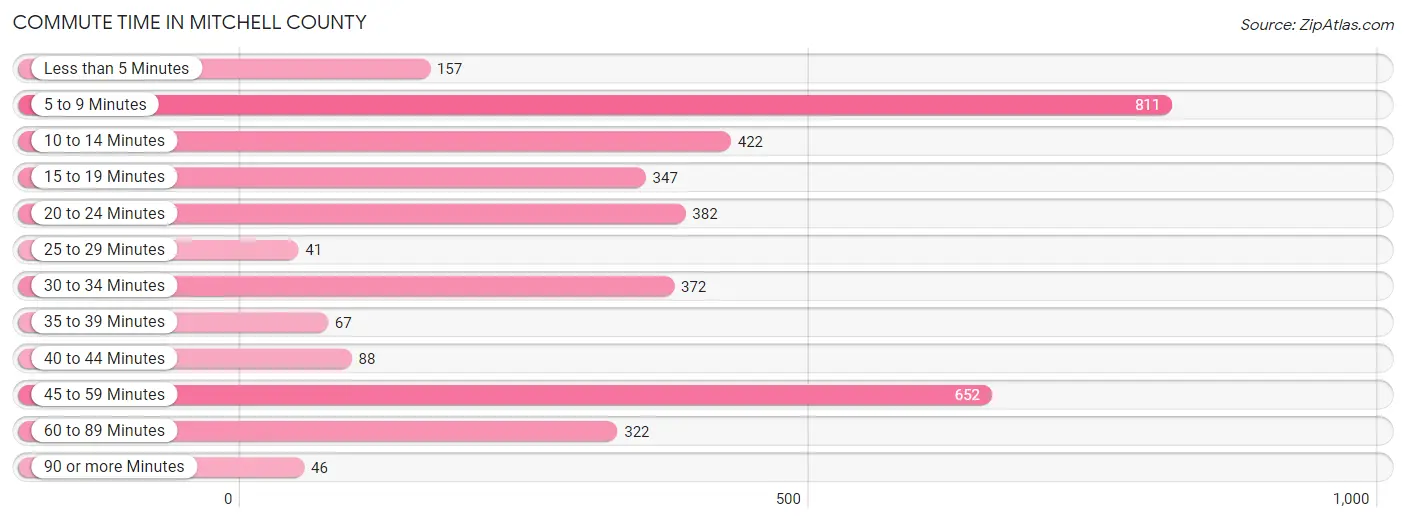
| Commute Time | # Commuters | % Commuters |
| Less than 5 Minutes | 157 | 4.2% |
| 5 to 9 Minutes | 811 | 21.9% |
| 10 to 14 Minutes | 422 | 11.4% |
| 15 to 19 Minutes | 347 | 9.4% |
| 20 to 24 Minutes | 382 | 10.3% |
| 25 to 29 Minutes | 41 | 1.1% |
| 30 to 34 Minutes | 372 | 10.0% |
| 35 to 39 Minutes | 67 | 1.8% |
| 40 to 44 Minutes | 88 | 2.4% |
| 45 to 59 Minutes | 652 | 17.6% |
| 60 to 89 Minutes | 322 | 8.7% |
| 90 or more Minutes | 46 | 1.2% |
Commute Time by Sex in Mitchell County
The most common commute times in Mitchell County are 5 to 9 minutes (421 commuters, 22.1%) for males and 5 to 9 minutes (390 commuters, 21.7%) for females.
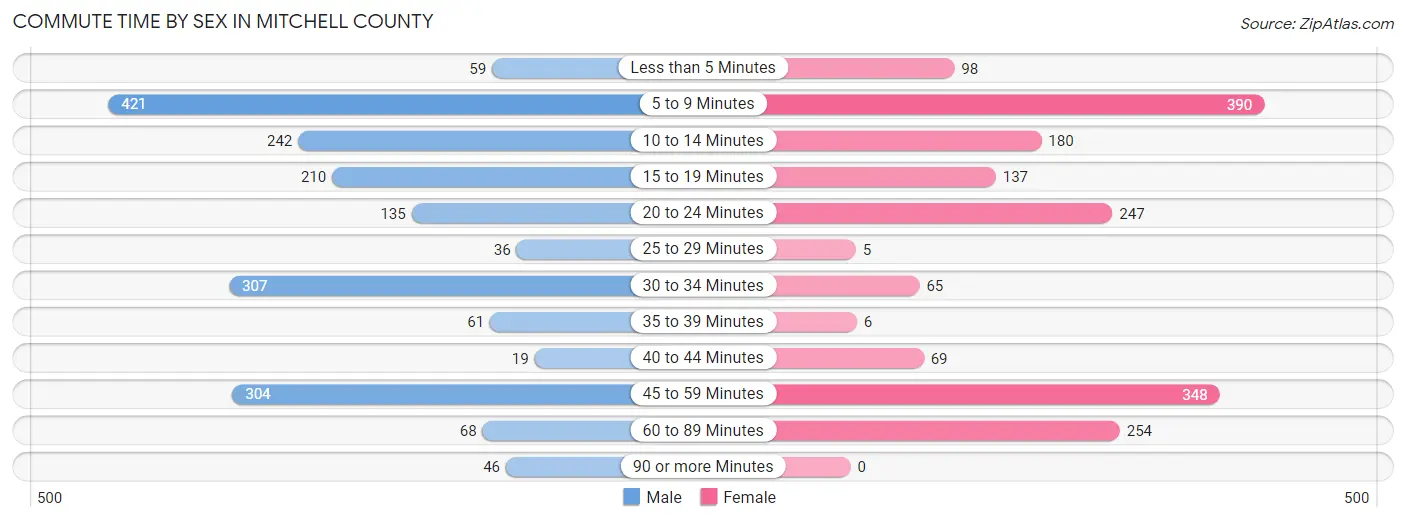
| Commute Time | Male | Female |
| Less than 5 Minutes | 59 (3.1%) | 98 (5.4%) |
| 5 to 9 Minutes | 421 (22.1%) | 390 (21.7%) |
| 10 to 14 Minutes | 242 (12.7%) | 180 (10.0%) |
| 15 to 19 Minutes | 210 (11.0%) | 137 (7.6%) |
| 20 to 24 Minutes | 135 (7.1%) | 247 (13.7%) |
| 25 to 29 Minutes | 36 (1.9%) | 5 (0.3%) |
| 30 to 34 Minutes | 307 (16.1%) | 65 (3.6%) |
| 35 to 39 Minutes | 61 (3.2%) | 6 (0.3%) |
| 40 to 44 Minutes | 19 (1.0%) | 69 (3.8%) |
| 45 to 59 Minutes | 304 (15.9%) | 348 (19.3%) |
| 60 to 89 Minutes | 68 (3.6%) | 254 (14.1%) |
| 90 or more Minutes | 46 (2.4%) | 0 (0.0%) |
Time of Departure to Work by Sex in Mitchell County
The most frequent times of departure to work in Mitchell County are 7:00 AM to 7:29 AM (392, 20.5%) for males and 6:00 AM to 6:29 AM (403, 22.4%) for females.
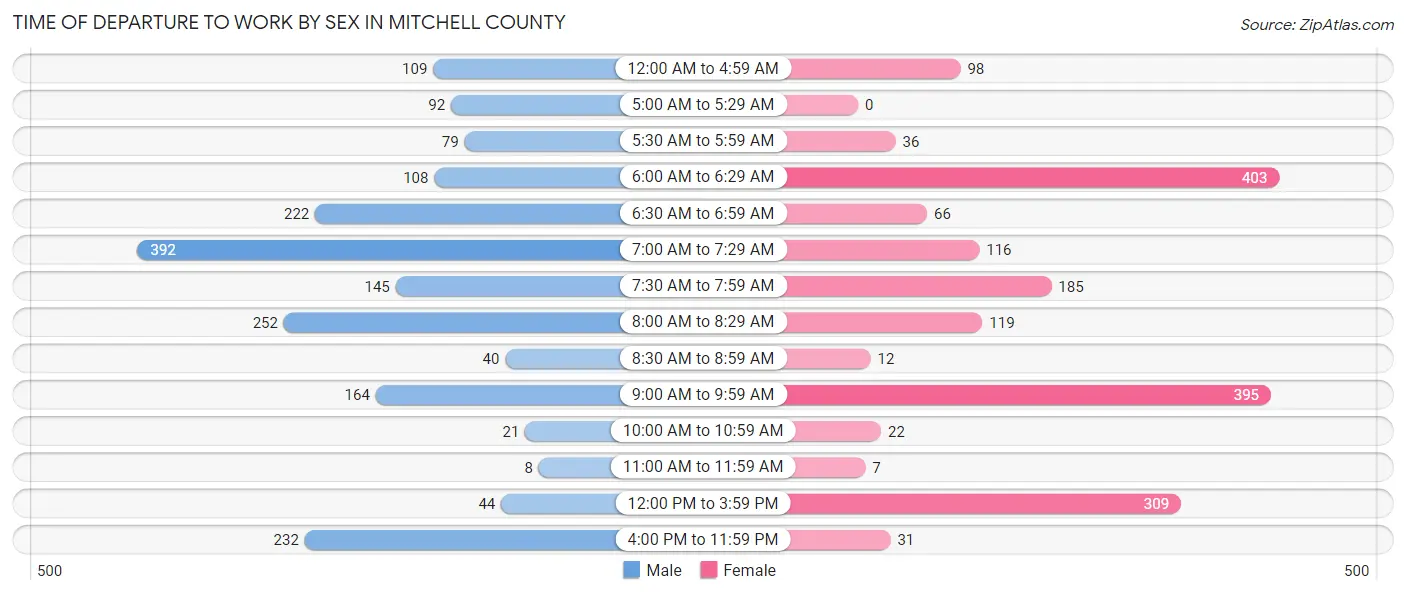
| Time of Departure | Male | Female |
| 12:00 AM to 4:59 AM | 109 (5.7%) | 98 (5.4%) |
| 5:00 AM to 5:29 AM | 92 (4.8%) | 0 (0.0%) |
| 5:30 AM to 5:59 AM | 79 (4.1%) | 36 (2.0%) |
| 6:00 AM to 6:29 AM | 108 (5.7%) | 403 (22.4%) |
| 6:30 AM to 6:59 AM | 222 (11.6%) | 66 (3.7%) |
| 7:00 AM to 7:29 AM | 392 (20.5%) | 116 (6.5%) |
| 7:30 AM to 7:59 AM | 145 (7.6%) | 185 (10.3%) |
| 8:00 AM to 8:29 AM | 252 (13.2%) | 119 (6.6%) |
| 8:30 AM to 8:59 AM | 40 (2.1%) | 12 (0.7%) |
| 9:00 AM to 9:59 AM | 164 (8.6%) | 395 (22.0%) |
| 10:00 AM to 10:59 AM | 21 (1.1%) | 22 (1.2%) |
| 11:00 AM to 11:59 AM | 8 (0.4%) | 7 (0.4%) |
| 12:00 PM to 3:59 PM | 44 (2.3%) | 309 (17.2%) |
| 4:00 PM to 11:59 PM | 232 (12.2%) | 31 (1.7%) |
| Total | 1,908 (100.0%) | 1,799 (100.0%) |
Housing Occupancy in Mitchell County
Occupancy by Ownership in Mitchell County
Of the total 2,411 dwellings in Mitchell County, owner-occupied units account for 1,710 (70.9%), while renter-occupied units make up 701 (29.1%).
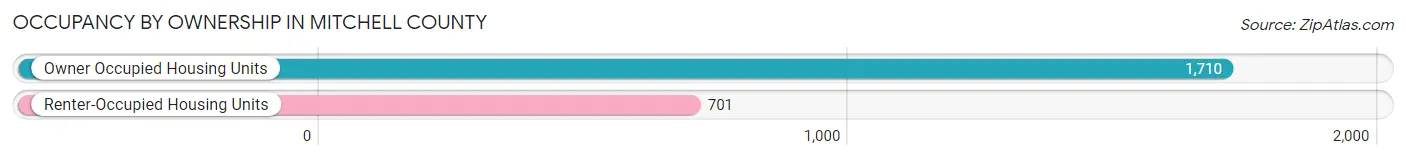
| Occupancy | # Housing Units | % Housing Units |
| Owner Occupied Housing Units | 1,710 | 70.9% |
| Renter-Occupied Housing Units | 701 | 29.1% |
| Total Occupied Housing Units | 2,411 | 100.0% |
Occupancy by Household Size in Mitchell County
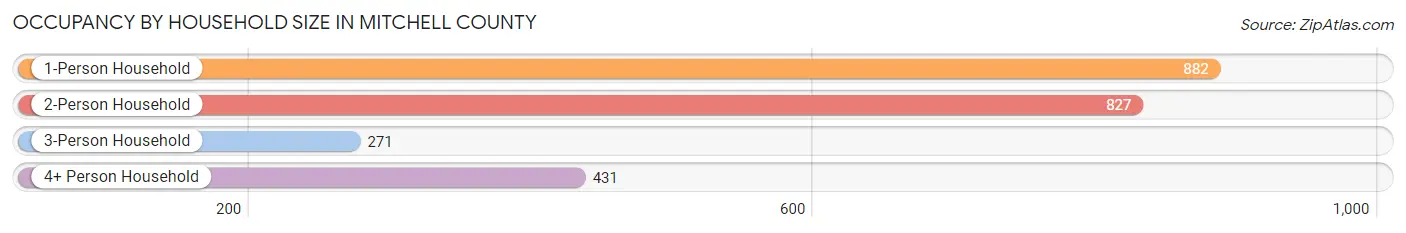
| Household Size | # Housing Units | % Housing Units |
| 1-Person Household | 882 | 36.6% |
| 2-Person Household | 827 | 34.3% |
| 3-Person Household | 271 | 11.2% |
| 4+ Person Household | 431 | 17.9% |
| Total Housing Units | 2,411 | 100.0% |
Occupancy by Ownership by Household Size in Mitchell County
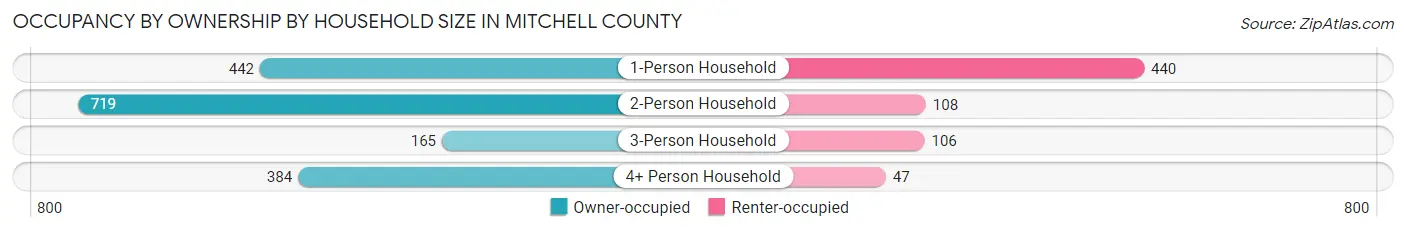
| Household Size | Owner-occupied | Renter-occupied |
| 1-Person Household | 442 (50.1%) | 440 (49.9%) |
| 2-Person Household | 719 (86.9%) | 108 (13.1%) |
| 3-Person Household | 165 (60.9%) | 106 (39.1%) |
| 4+ Person Household | 384 (89.1%) | 47 (10.9%) |
| Total Housing Units | 1,710 (70.9%) | 701 (29.1%) |
Occupancy by Educational Attainment in Mitchell County
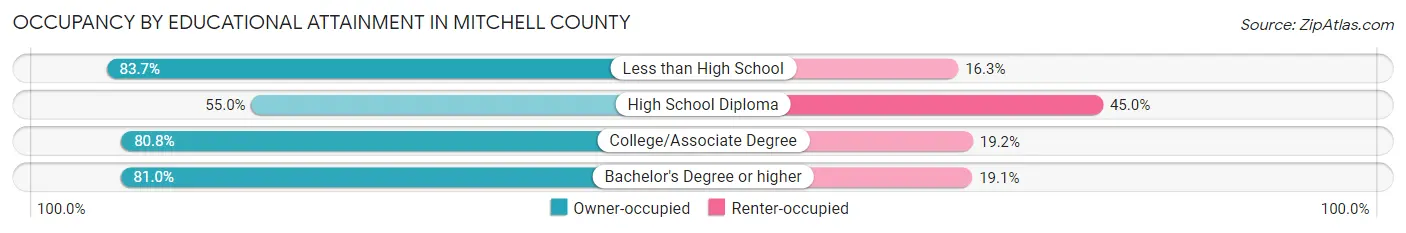
| Household Size | Owner-occupied | Renter-occupied |
| Less than High School | 283 (83.7%) | 55 (16.3%) |
| High School Diploma | 531 (55.0%) | 434 (45.0%) |
| College/Associate Degree | 624 (80.8%) | 148 (19.2%) |
| Bachelor's Degree or higher | 272 (80.9%) | 64 (19.1%) |
Occupancy by Age of Householder in Mitchell County
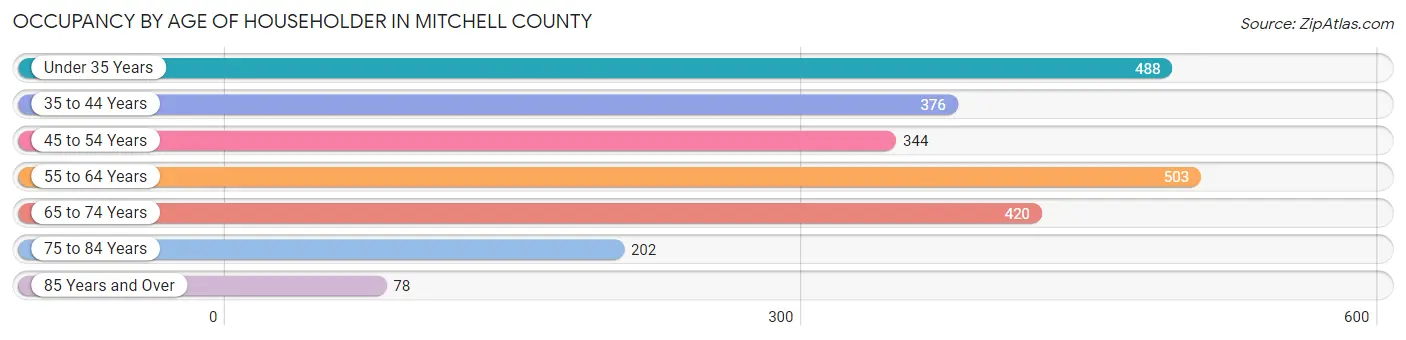
| Age Bracket | # Households | % Households |
| Under 35 Years | 488 | 20.2% |
| 35 to 44 Years | 376 | 15.6% |
| 45 to 54 Years | 344 | 14.3% |
| 55 to 64 Years | 503 | 20.9% |
| 65 to 74 Years | 420 | 17.4% |
| 75 to 84 Years | 202 | 8.4% |
| 85 Years and Over | 78 | 3.2% |
| Total | 2,411 | 100.0% |
Housing Finances in Mitchell County
Median Income by Occupancy in Mitchell County
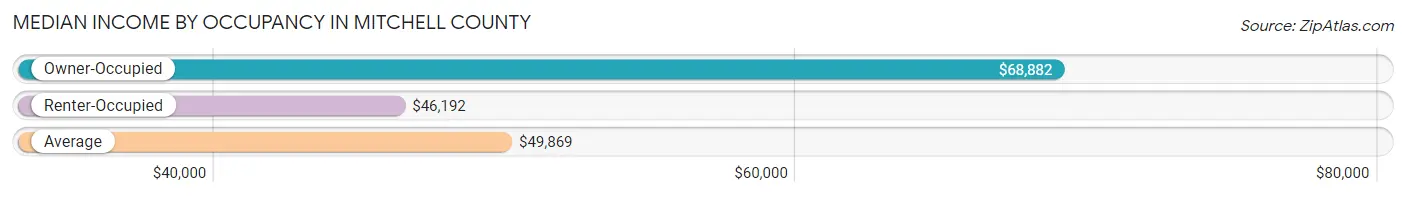
| Occupancy Type | # Households | Median Income |
| Owner-Occupied | 1,710 (70.9%) | $68,882 |
| Renter-Occupied | 701 (29.1%) | $46,192 |
| Average | 2,411 (100.0%) | $49,869 |
Occupancy by Householder Income Bracket in Mitchell County
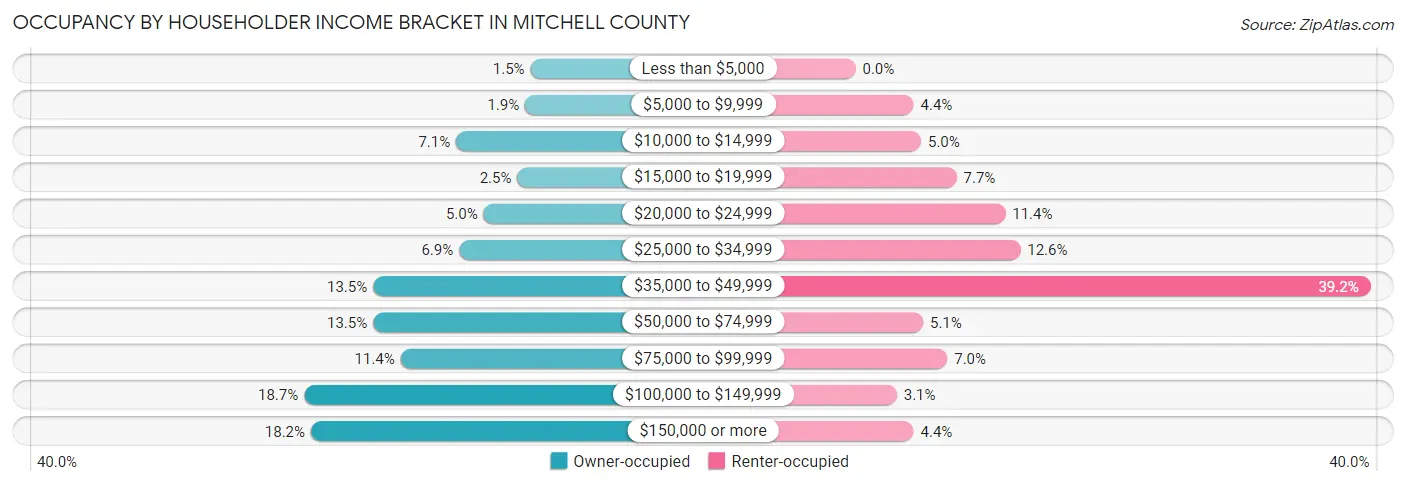
| Income Bracket | Owner-occupied | Renter-occupied |
| Less than $5,000 | 25 (1.5%) | 0 (0.0%) |
| $5,000 to $9,999 | 32 (1.9%) | 31 (4.4%) |
| $10,000 to $14,999 | 122 (7.1%) | 35 (5.0%) |
| $15,000 to $19,999 | 42 (2.5%) | 54 (7.7%) |
| $20,000 to $24,999 | 86 (5.0%) | 80 (11.4%) |
| $25,000 to $34,999 | 118 (6.9%) | 88 (12.6%) |
| $35,000 to $49,999 | 230 (13.5%) | 275 (39.2%) |
| $50,000 to $74,999 | 230 (13.5%) | 36 (5.1%) |
| $75,000 to $99,999 | 194 (11.4%) | 49 (7.0%) |
| $100,000 to $149,999 | 320 (18.7%) | 22 (3.1%) |
| $150,000 or more | 311 (18.2%) | 31 (4.4%) |
| Total | 1,710 (100.0%) | 701 (100.0%) |
Monthly Housing Cost Tiers in Mitchell County
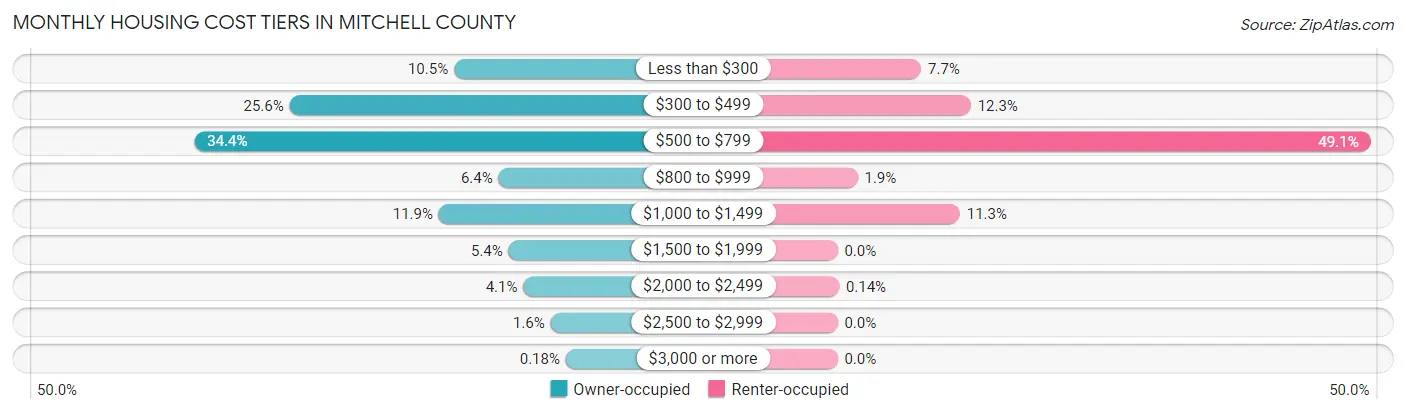
| Monthly Cost | Owner-occupied | Renter-occupied |
| Less than $300 | 179 (10.5%) | 54 (7.7%) |
| $300 to $499 | 438 (25.6%) | 86 (12.3%) |
| $500 to $799 | 588 (34.4%) | 344 (49.1%) |
| $800 to $999 | 109 (6.4%) | 13 (1.8%) |
| $1,000 to $1,499 | 203 (11.9%) | 79 (11.3%) |
| $1,500 to $1,999 | 93 (5.4%) | 0 (0.0%) |
| $2,000 to $2,499 | 70 (4.1%) | 1 (0.1%) |
| $2,500 to $2,999 | 27 (1.6%) | 0 (0.0%) |
| $3,000 or more | 3 (0.2%) | 0 (0.0%) |
| Total | 1,710 (100.0%) | 701 (100.0%) |
Physical Housing Characteristics in Mitchell County
Housing Structures in Mitchell County
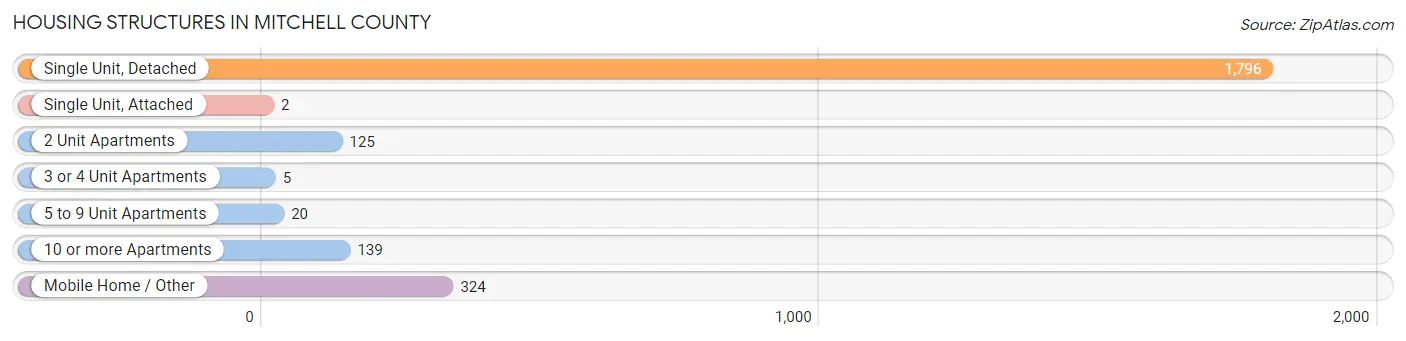
| Structure Type | # Housing Units | % Housing Units |
| Single Unit, Detached | 1,796 | 74.5% |
| Single Unit, Attached | 2 | 0.1% |
| 2 Unit Apartments | 125 | 5.2% |
| 3 or 4 Unit Apartments | 5 | 0.2% |
| 5 to 9 Unit Apartments | 20 | 0.8% |
| 10 or more Apartments | 139 | 5.8% |
| Mobile Home / Other | 324 | 13.4% |
| Total | 2,411 | 100.0% |
Housing Structures by Occupancy in Mitchell County
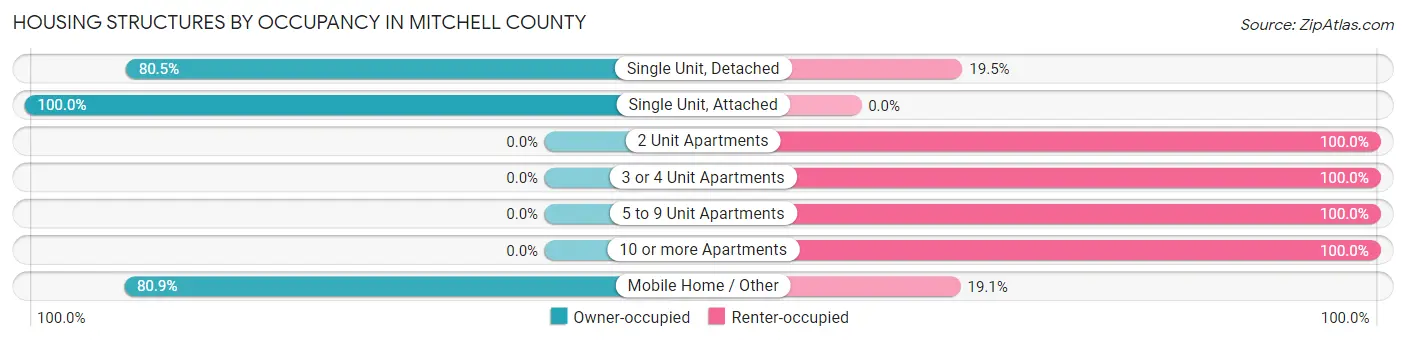
| Structure Type | Owner-occupied | Renter-occupied |
| Single Unit, Detached | 1,446 (80.5%) | 350 (19.5%) |
| Single Unit, Attached | 2 (100.0%) | 0 (0.0%) |
| 2 Unit Apartments | 0 (0.0%) | 125 (100.0%) |
| 3 or 4 Unit Apartments | 0 (0.0%) | 5 (100.0%) |
| 5 to 9 Unit Apartments | 0 (0.0%) | 20 (100.0%) |
| 10 or more Apartments | 0 (0.0%) | 139 (100.0%) |
| Mobile Home / Other | 262 (80.9%) | 62 (19.1%) |
| Total | 1,710 (70.9%) | 701 (29.1%) |
Housing Structures by Number of Rooms in Mitchell County
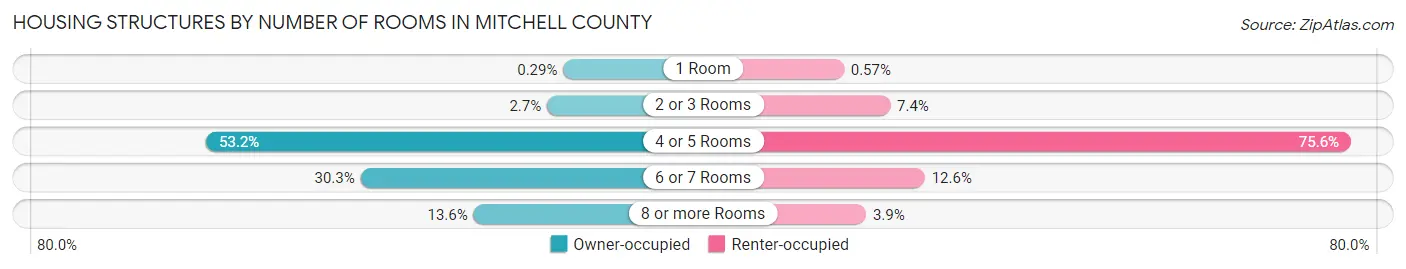
| Number of Rooms | Owner-occupied | Renter-occupied |
| 1 Room | 5 (0.3%) | 4 (0.6%) |
| 2 or 3 Rooms | 46 (2.7%) | 52 (7.4%) |
| 4 or 5 Rooms | 909 (53.2%) | 530 (75.6%) |
| 6 or 7 Rooms | 518 (30.3%) | 88 (12.6%) |
| 8 or more Rooms | 232 (13.6%) | 27 (3.8%) |
| Total | 1,710 (100.0%) | 701 (100.0%) |
Housing Structure by Heating Type in Mitchell County
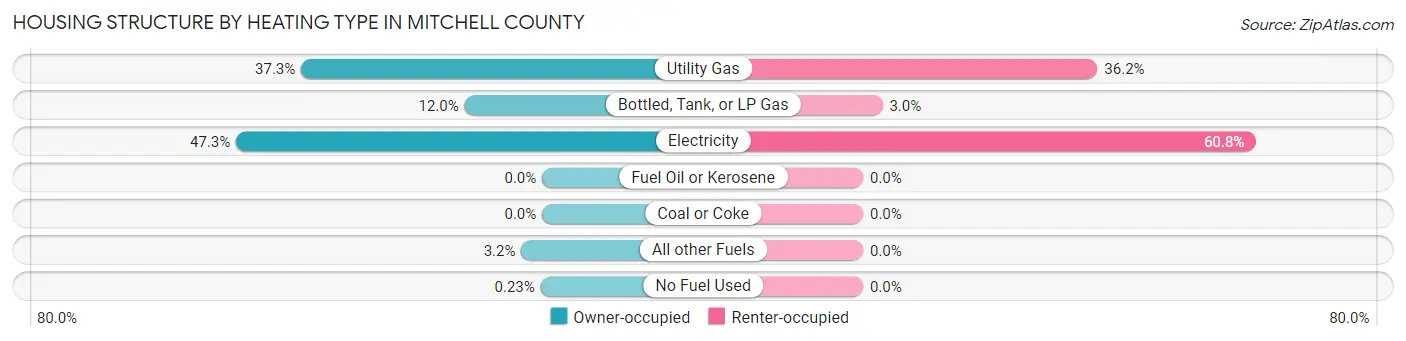
| Heating Type | Owner-occupied | Renter-occupied |
| Utility Gas | 637 (37.2%) | 254 (36.2%) |
| Bottled, Tank, or LP Gas | 205 (12.0%) | 21 (3.0%) |
| Electricity | 809 (47.3%) | 426 (60.8%) |
| Fuel Oil or Kerosene | 0 (0.0%) | 0 (0.0%) |
| Coal or Coke | 0 (0.0%) | 0 (0.0%) |
| All other Fuels | 55 (3.2%) | 0 (0.0%) |
| No Fuel Used | 4 (0.2%) | 0 (0.0%) |
| Total | 1,710 (100.0%) | 701 (100.0%) |
Household Vehicle Usage in Mitchell County
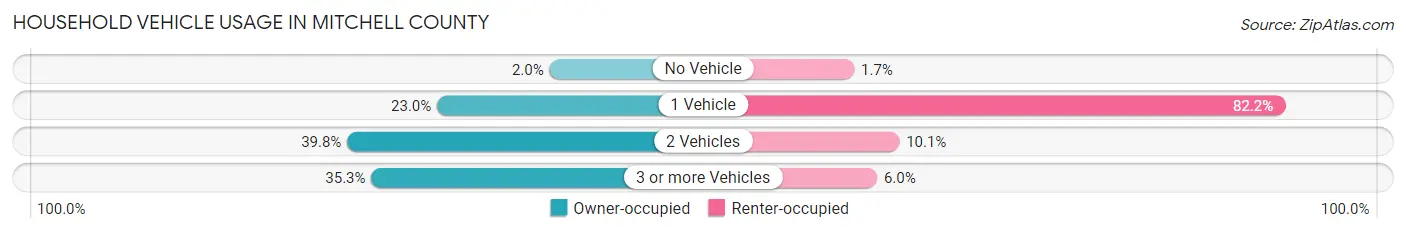
| Vehicles per Household | Owner-occupied | Renter-occupied |
| No Vehicle | 34 (2.0%) | 12 (1.7%) |
| 1 Vehicle | 393 (23.0%) | 576 (82.2%) |
| 2 Vehicles | 680 (39.8%) | 71 (10.1%) |
| 3 or more Vehicles | 603 (35.3%) | 42 (6.0%) |
| Total | 1,710 (100.0%) | 701 (100.0%) |
Real Estate & Mortgages in Mitchell County
Real Estate and Mortgage Overview in Mitchell County
| Characteristic | Without Mortgage | With Mortgage |
| Housing Units | 1,316 | 394 |
| Median Property Value | $69,100 | $98,900 |
| Median Household Income | $57,619 | $120 |
| Monthly Housing Costs | $514 | $3 |
| Real Estate Taxes | $1,222 | $23 |
Property Value by Mortgage Status in Mitchell County
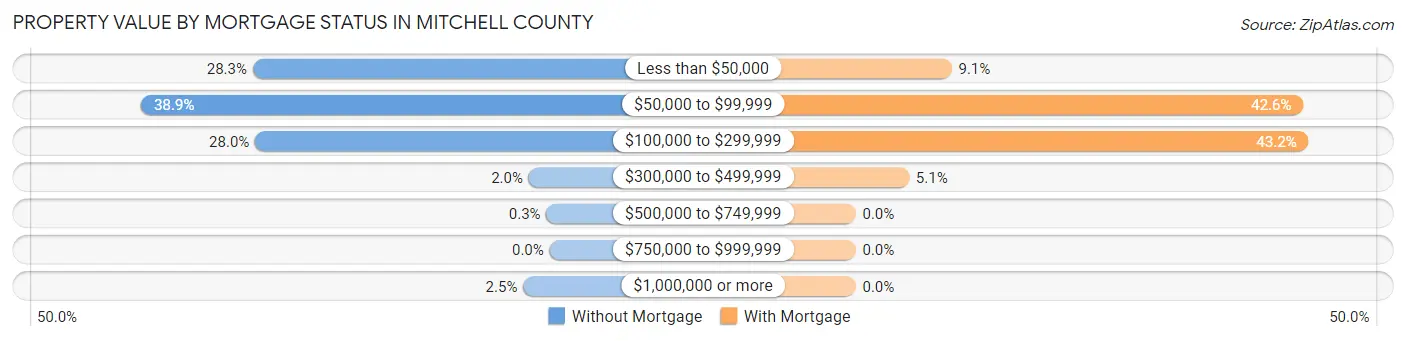
| Property Value | Without Mortgage | With Mortgage |
| Less than $50,000 | 372 (28.3%) | 36 (9.1%) |
| $50,000 to $99,999 | 512 (38.9%) | 168 (42.6%) |
| $100,000 to $299,999 | 369 (28.0%) | 170 (43.1%) |
| $300,000 to $499,999 | 26 (2.0%) | 20 (5.1%) |
| $500,000 to $749,999 | 4 (0.3%) | 0 (0.0%) |
| $750,000 to $999,999 | 0 (0.0%) | 0 (0.0%) |
| $1,000,000 or more | 33 (2.5%) | 0 (0.0%) |
| Total | 1,316 (100.0%) | 394 (100.0%) |
Household Income by Mortgage Status in Mitchell County
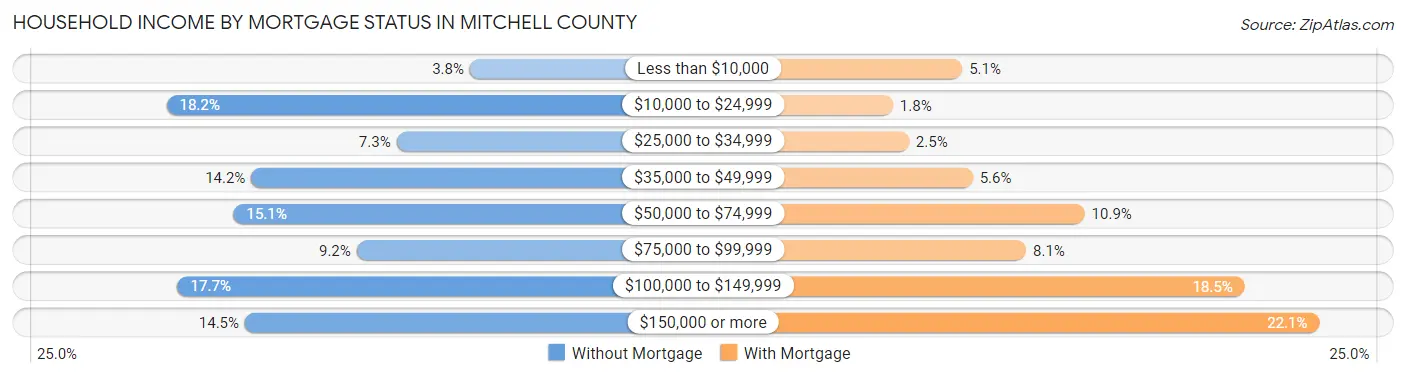
| Household Income | Without Mortgage | With Mortgage |
| Less than $10,000 | 50 (3.8%) | 20 (5.1%) |
| $10,000 to $24,999 | 240 (18.2%) | 7 (1.8%) |
| $25,000 to $34,999 | 96 (7.3%) | 10 (2.5%) |
| $35,000 to $49,999 | 187 (14.2%) | 22 (5.6%) |
| $50,000 to $74,999 | 198 (15.0%) | 43 (10.9%) |
| $75,000 to $99,999 | 121 (9.2%) | 32 (8.1%) |
| $100,000 to $149,999 | 233 (17.7%) | 73 (18.5%) |
| $150,000 or more | 191 (14.5%) | 87 (22.1%) |
| Total | 1,316 (100.0%) | 394 (100.0%) |
Property Value to Household Income Ratio in Mitchell County
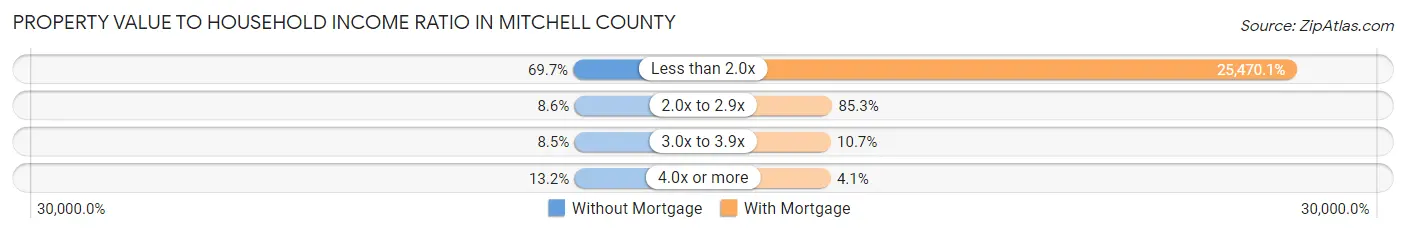
| Value-to-Income Ratio | Without Mortgage | With Mortgage |
| Less than 2.0x | 917 (69.7%) | 100,352 (25,470.1%) |
| 2.0x to 2.9x | 113 (8.6%) | 336 (85.3%) |
| 3.0x to 3.9x | 112 (8.5%) | 42 (10.7%) |
| 4.0x or more | 174 (13.2%) | 16 (4.1%) |
| Total | 1,316 (100.0%) | 394 (100.0%) |
Real Estate Taxes by Mortgage Status in Mitchell County
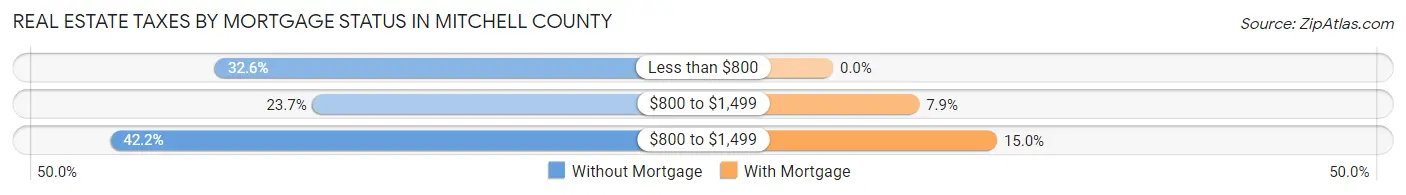
| Property Taxes | Without Mortgage | With Mortgage |
| Less than $800 | 429 (32.6%) | 0 (0.0%) |
| $800 to $1,499 | 312 (23.7%) | 31 (7.9%) |
| $800 to $1,499 | 555 (42.2%) | 59 (15.0%) |
| Total | 1,316 (100.0%) | 394 (100.0%) |
Health & Disability in Mitchell County
Health Insurance Coverage by Age in Mitchell County
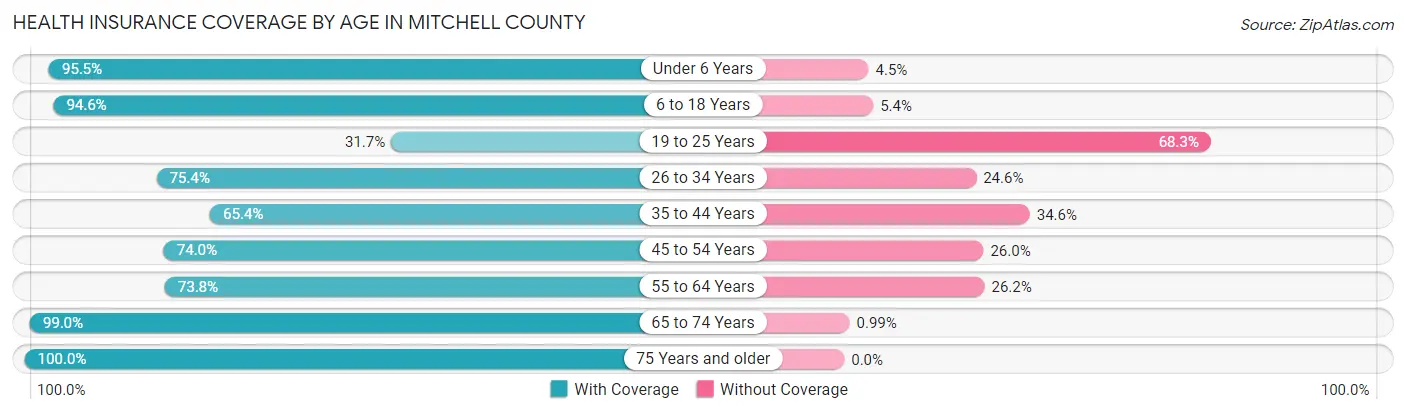
| Age Bracket | With Coverage | Without Coverage |
| Under 6 Years | 674 (95.5%) | 32 (4.5%) |
| 6 to 18 Years | 1,036 (94.6%) | 59 (5.4%) |
| 19 to 25 Years | 463 (31.7%) | 999 (68.3%) |
| 26 to 34 Years | 521 (75.4%) | 170 (24.6%) |
| 35 to 44 Years | 382 (65.4%) | 202 (34.6%) |
| 45 to 54 Years | 653 (74.0%) | 229 (26.0%) |
| 55 to 64 Years | 638 (73.8%) | 226 (26.2%) |
| 65 to 74 Years | 701 (99.0%) | 7 (1.0%) |
| 75 Years and older | 463 (100.0%) | 0 (0.0%) |
| Total | 5,531 (74.2%) | 1,924 (25.8%) |
Health Insurance Coverage by Citizenship Status in Mitchell County
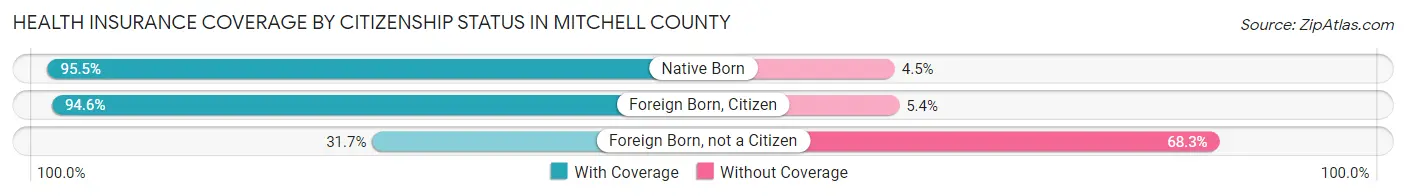
| Citizenship Status | With Coverage | Without Coverage |
| Native Born | 674 (95.5%) | 32 (4.5%) |
| Foreign Born, Citizen | 1,036 (94.6%) | 59 (5.4%) |
| Foreign Born, not a Citizen | 463 (31.7%) | 999 (68.3%) |
Health Insurance Coverage by Household Income in Mitchell County
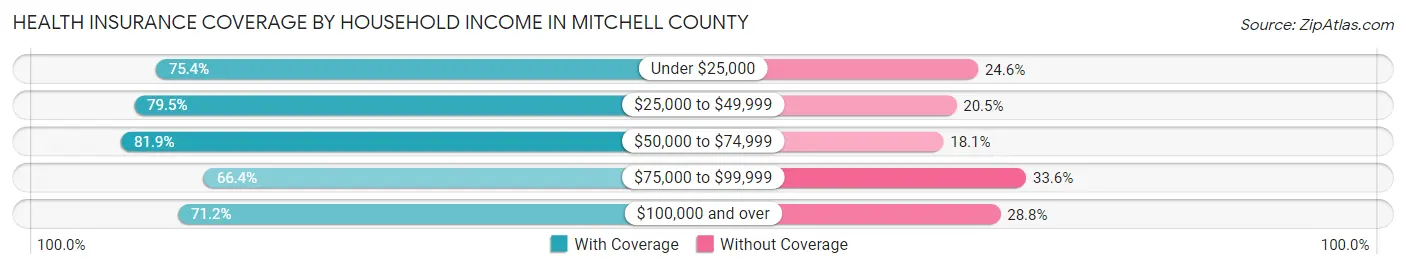
| Household Income | With Coverage | Without Coverage |
| Under $25,000 | 721 (75.4%) | 235 (24.6%) |
| $25,000 to $49,999 | 1,240 (79.5%) | 320 (20.5%) |
| $50,000 to $74,999 | 802 (81.9%) | 177 (18.1%) |
| $75,000 to $99,999 | 710 (66.4%) | 359 (33.6%) |
| $100,000 and over | 2,056 (71.2%) | 830 (28.8%) |
Public vs Private Health Insurance Coverage by Age in Mitchell County
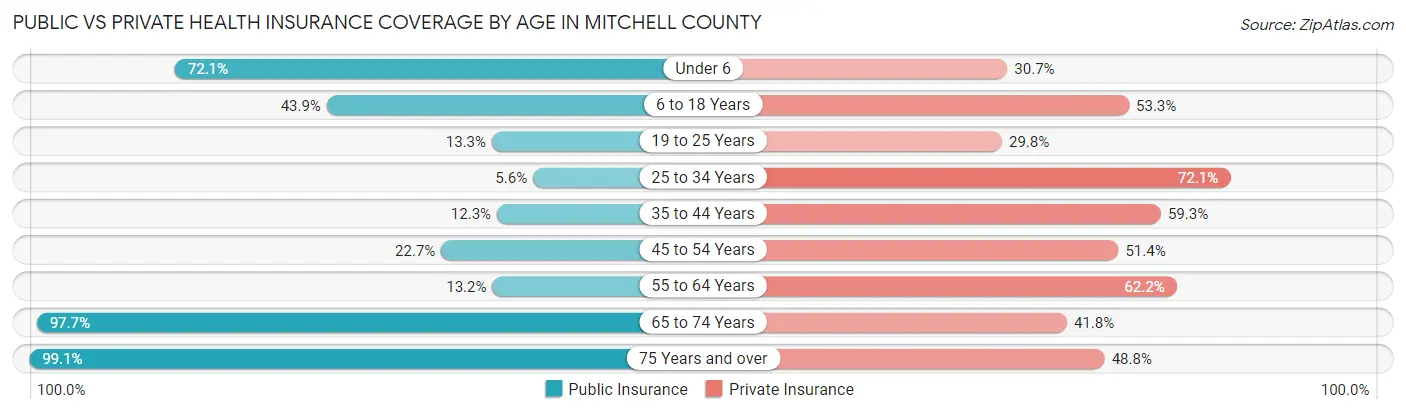
| Age Bracket | Public Insurance | Private Insurance |
| Under 6 | 509 (72.1%) | 217 (30.7%) |
| 6 to 18 Years | 481 (43.9%) | 584 (53.3%) |
| 19 to 25 Years | 194 (13.3%) | 435 (29.7%) |
| 25 to 34 Years | 39 (5.6%) | 498 (72.1%) |
| 35 to 44 Years | 72 (12.3%) | 346 (59.3%) |
| 45 to 54 Years | 200 (22.7%) | 453 (51.4%) |
| 55 to 64 Years | 114 (13.2%) | 537 (62.2%) |
| 65 to 74 Years | 692 (97.7%) | 296 (41.8%) |
| 75 Years and over | 459 (99.1%) | 226 (48.8%) |
| Total | 2,760 (37.0%) | 3,592 (48.2%) |
Disability Status by Sex by Age in Mitchell County
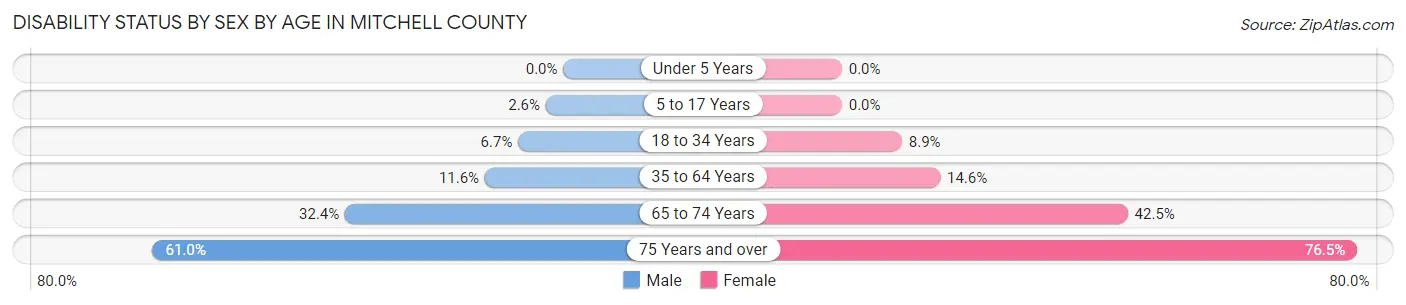
| Age Bracket | Male | Female |
| Under 5 Years | 0 (0.0%) | 0 (0.0%) |
| 5 to 17 Years | 15 (2.6%) | 0 (0.0%) |
| 18 to 34 Years | 62 (6.7%) | 123 (8.9%) |
| 35 to 64 Years | 142 (11.6%) | 162 (14.6%) |
| 65 to 74 Years | 105 (32.4%) | 163 (42.4%) |
| 75 Years and over | 111 (61.0%) | 215 (76.5%) |
Disability Class by Sex by Age in Mitchell County
Disability Class: Hearing Difficulty
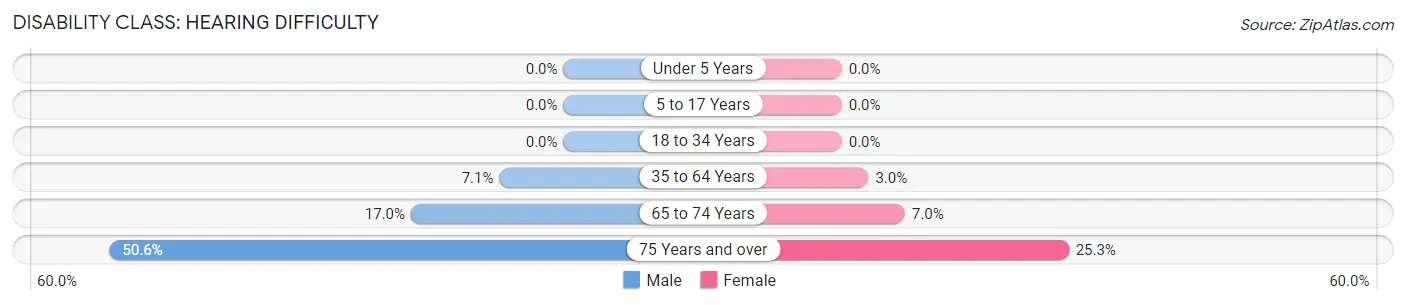
| Age Bracket | Male | Female |
| Under 5 Years | 0 (0.0%) | 0 (0.0%) |
| 5 to 17 Years | 0 (0.0%) | 0 (0.0%) |
| 18 to 34 Years | 0 (0.0%) | 0 (0.0%) |
| 35 to 64 Years | 87 (7.1%) | 33 (3.0%) |
| 65 to 74 Years | 55 (17.0%) | 27 (7.0%) |
| 75 Years and over | 92 (50.5%) | 71 (25.3%) |
Disability Class: Vision Difficulty
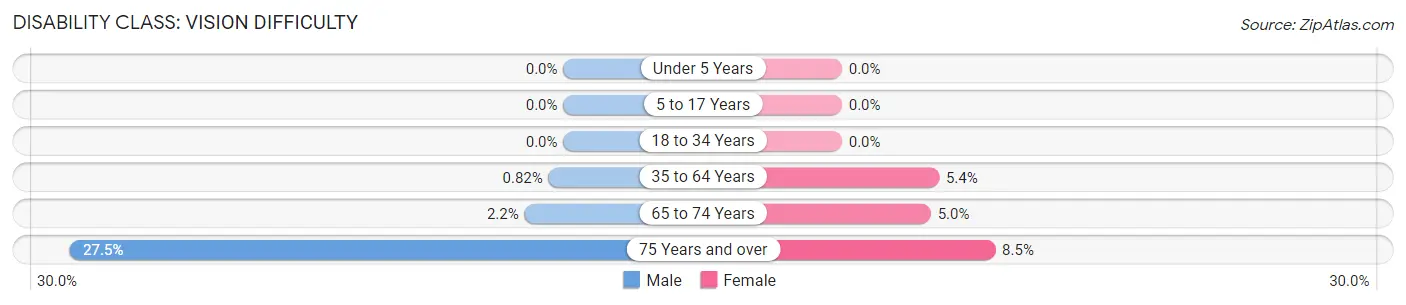
| Age Bracket | Male | Female |
| Under 5 Years | 0 (0.0%) | 0 (0.0%) |
| 5 to 17 Years | 0 (0.0%) | 0 (0.0%) |
| 18 to 34 Years | 0 (0.0%) | 0 (0.0%) |
| 35 to 64 Years | 10 (0.8%) | 60 (5.4%) |
| 65 to 74 Years | 7 (2.2%) | 19 (5.0%) |
| 75 Years and over | 50 (27.5%) | 24 (8.5%) |
Disability Class: Cognitive Difficulty
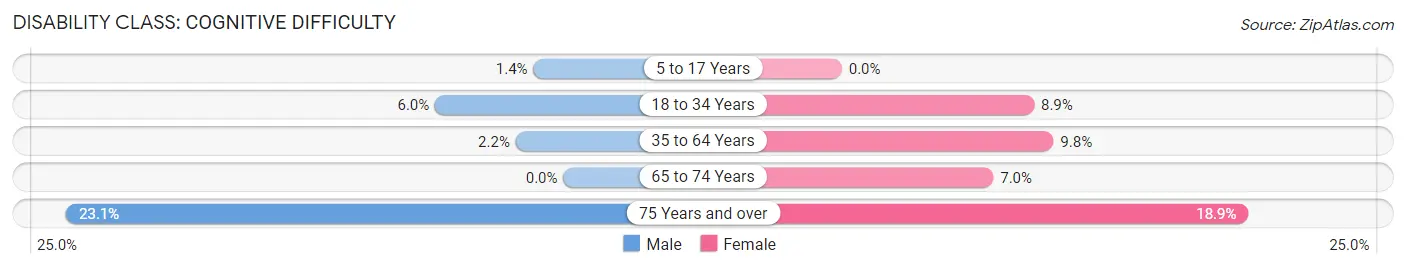
| Age Bracket | Male | Female |
| 5 to 17 Years | 8 (1.4%) | 0 (0.0%) |
| 18 to 34 Years | 55 (5.9%) | 123 (8.9%) |
| 35 to 64 Years | 27 (2.2%) | 109 (9.8%) |
| 65 to 74 Years | 0 (0.0%) | 27 (7.0%) |
| 75 Years and over | 42 (23.1%) | 53 (18.9%) |
Disability Class: Ambulatory Difficulty
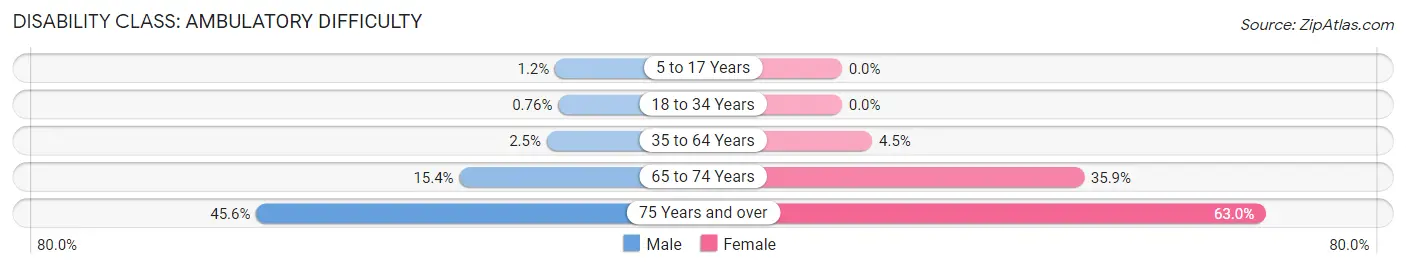
| Age Bracket | Male | Female |
| 5 to 17 Years | 7 (1.2%) | 0 (0.0%) |
| 18 to 34 Years | 7 (0.8%) | 0 (0.0%) |
| 35 to 64 Years | 30 (2.5%) | 50 (4.5%) |
| 65 to 74 Years | 50 (15.4%) | 138 (35.9%) |
| 75 Years and over | 83 (45.6%) | 177 (63.0%) |
Disability Class: Self-Care Difficulty
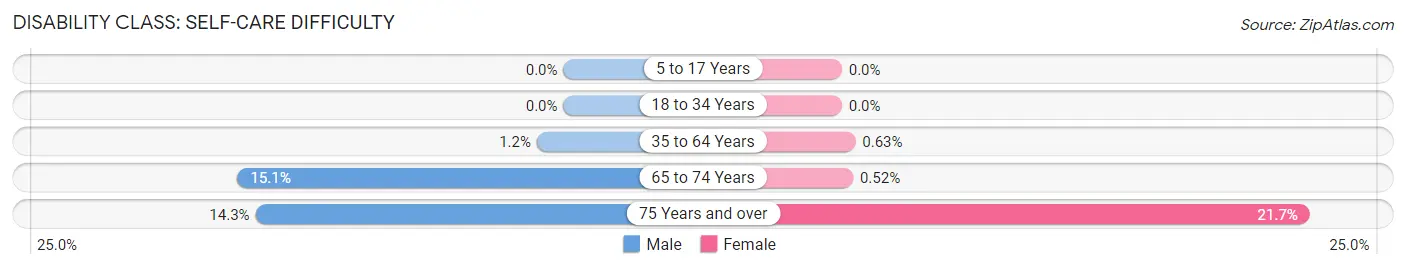
| Age Bracket | Male | Female |
| 5 to 17 Years | 0 (0.0%) | 0 (0.0%) |
| 18 to 34 Years | 0 (0.0%) | 0 (0.0%) |
| 35 to 64 Years | 15 (1.2%) | 7 (0.6%) |
| 65 to 74 Years | 49 (15.1%) | 2 (0.5%) |
| 75 Years and over | 26 (14.3%) | 61 (21.7%) |
Technology Access in Mitchell County
Computing Device Access in Mitchell County
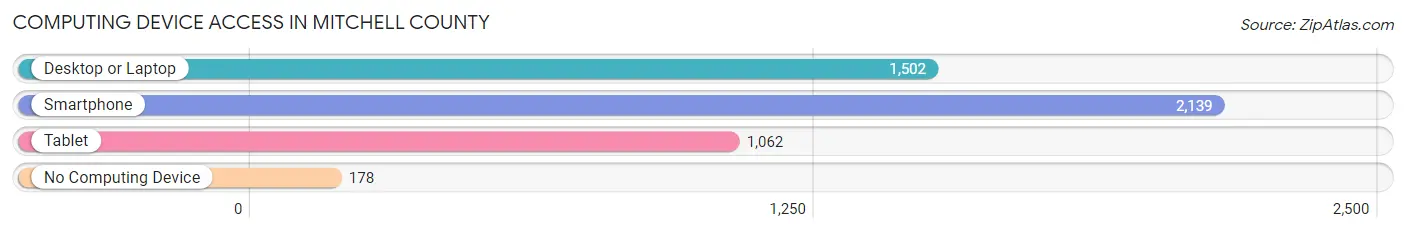
| Device Type | # Households | % Households |
| Desktop or Laptop | 1,502 | 62.3% |
| Smartphone | 2,139 | 88.7% |
| Tablet | 1,062 | 44.1% |
| No Computing Device | 178 | 7.4% |
| Total | 2,411 | 100.0% |
Internet Access in Mitchell County
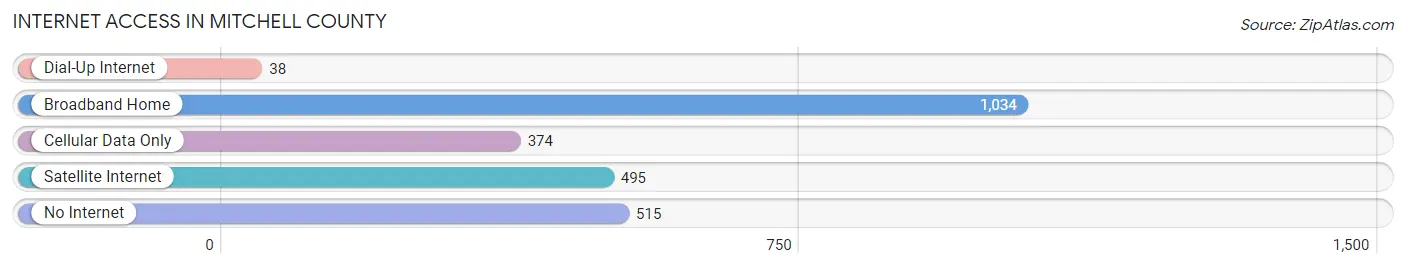
| Internet Type | # Households | % Households |
| Dial-Up Internet | 38 | 1.6% |
| Broadband Home | 1,034 | 42.9% |
| Cellular Data Only | 374 | 15.5% |
| Satellite Internet | 495 | 20.5% |
| No Internet | 515 | 21.4% |
| Total | 2,411 | 100.0% |
Mitchell County Summary
Mitchell County is located in the western part of the state of Texas, in the United States. It is bordered by Howard County to the north, Borden County to the east, Scurry County to the south, and Glasscock County to the west. The county seat is Colorado City, and the largest city is Colorado City. The county was created in 1876 and is named for Asa Mitchell, a Texas Ranger and early settler of the area.
Geography
Mitchell County is located in the Rolling Plains region of Texas, and is mostly flat with some rolling hills. The terrain is mostly covered in grasslands, with some areas of mesquite and juniper trees. The county is drained by the Colorado River, which forms its western boundary. The county has a total area of 902 square miles, of which 899 square miles is land and 3 square miles is water.
Climate
Mitchell County has a semi-arid climate, with hot summers and mild winters. The average annual temperature is 68°F, and the average annual precipitation is 19 inches.
Demographics
As of the 2010 census, there were 8,906 people, 3,093 households, and 2,220 families residing in the county. The population density was 10 people per square mile. The racial makeup of the county was 79.2% White, 0.7% African American, 0.7% Native American, 0.2% Asian, 16.7% from other races, and 2.5% from two or more races. Hispanic or Latino of any race were 33.2% of the population.
The median income for a household in the county was $31,945, and the median income for a family was $37,917. The per capita income for the county was $15,845. About 17.2% of families and 21.2% of the population were below the poverty line, including 28.2% of those under age 18 and 15.2% of those age 65 or over.
Economy
The economy of Mitchell County is largely based on agriculture and oil and gas production. The county is home to several large ranches, and the main crops grown are cotton, wheat, and sorghum. Oil and gas production is also a major industry in the county, and there are several large oil and gas fields in the area.
The county also has a growing tourism industry, with several attractions such as the Colorado City State Park, the Mitchell County Historical Museum, and the Mitchell County Fair.
Conclusion
Mitchell County is a rural county in the western part of Texas. It is mostly flat with some rolling hills, and is mostly covered in grasslands. The economy of the county is largely based on agriculture and oil and gas production. The population of the county is mostly white, with a significant Hispanic population. The county has a growing tourism industry, with several attractions such as the Colorado City State Park, the Mitchell County Historical Museum, and the Mitchell County Fair.
Common Questions
What is Per Capita Income in Mitchell County?
Per Capita income in Mitchell County is $24,591.
What is the Median Family Income in Mitchell County?
Median Family Income in Mitchell County is $89,034.
What is the Median Household income in Mitchell County?
Median Household Income in Mitchell County is $49,869.
What is Income or Wage Gap in Mitchell County?
Income or Wage Gap in Mitchell County is 57.4%.
Women in Mitchell County earn 42.6 cents for every dollar earned by a man.
What is Inequality or Gini Index in Mitchell County?
Inequality or Gini Index in Mitchell County is 0.46.
What is the Total Population of Mitchell County?
Total Population of Mitchell County is 8,947.
What is the Total Male Population of Mitchell County?
Total Male Population of Mitchell County is 5,054.
What is the Total Female Population of Mitchell County?
Total Female Population of Mitchell County is 3,893.
What is the Ratio of Males per 100 Females in Mitchell County?
There are 129.82 Males per 100 Females in Mitchell County.
What is the Ratio of Females per 100 Males in Mitchell County?
There are 77.03 Females per 100 Males in Mitchell County.
What is the Median Population Age in Mitchell County?
Median Population Age in Mitchell County is 32.3 Years.
What is the Average Family Size in Mitchell County
Average Family Size in Mitchell County is 4.1 People.
What is the Average Household Size in Mitchell County
Average Household Size in Mitchell County is 3.1 People.
How Large is the Labor Force in Mitchell County?
There are 3,859 People in the Labor Forcein in Mitchell County.
What is the Percentage of People in the Labor Force in Mitchell County?
51.2% of People are in the Labor Force in Mitchell County.
What is the Unemployment Rate in Mitchell County?
Unemployment Rate in Mitchell County is 1.4%.