Loving County, TX Map & Demographics
Loving County Map
Loving County Overview
$44,821
PER CAPITA INCOME
$130,781
AVG FAMILY INCOME
0.53
INEQUALITY / GINI INDEX
96
TOTAL POPULATION
51
MALE POPULATION
45
FEMALE POPULATION
113.33
MALES / 100 FEMALES
88.24
FEMALES / 100 MALES
31.9
MEDIAN AGE
3.7
AVG FAMILY SIZE
2.4
AVG HOUSEHOLD SIZE
39
LABOR FORCE [ PEOPLE ]
57.4%
PERCENT IN LABOR FORCE
Loving County Area Codes
Income in Loving County
Income Overview in Loving County
| Characteristic | Number | Measure |
| Per Capita Income | 96 | $44,821 |
| Median Family Income | 21 | $130,781 |
| Mean Family Income | 21 | $108,452 |
| Median Household Income | 40 | $0 |
| Mean Household Income | 40 | $103,993 |
| Income Deficit | 21 | $0 |
| Wage / Income Gap (%) | 96 | 0.00% |
| Wage / Income Gap ($) | 96 | 100.00¢ per $1 |
| Gini / Inequality Index | 96 | 0.53 |
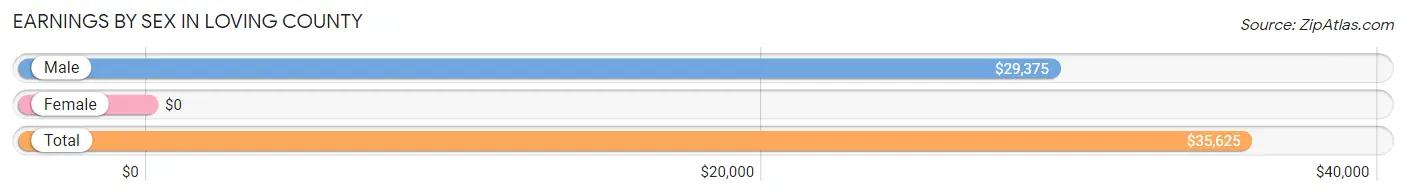
Earnings by Sex in Loving County
| Sex | Number | Average Earnings |
| Male | 34 (87.2%) | $29,375 |
| Female | 5 (12.8%) | $0 |
| Total | 39 (100.0%) | $35,625 |
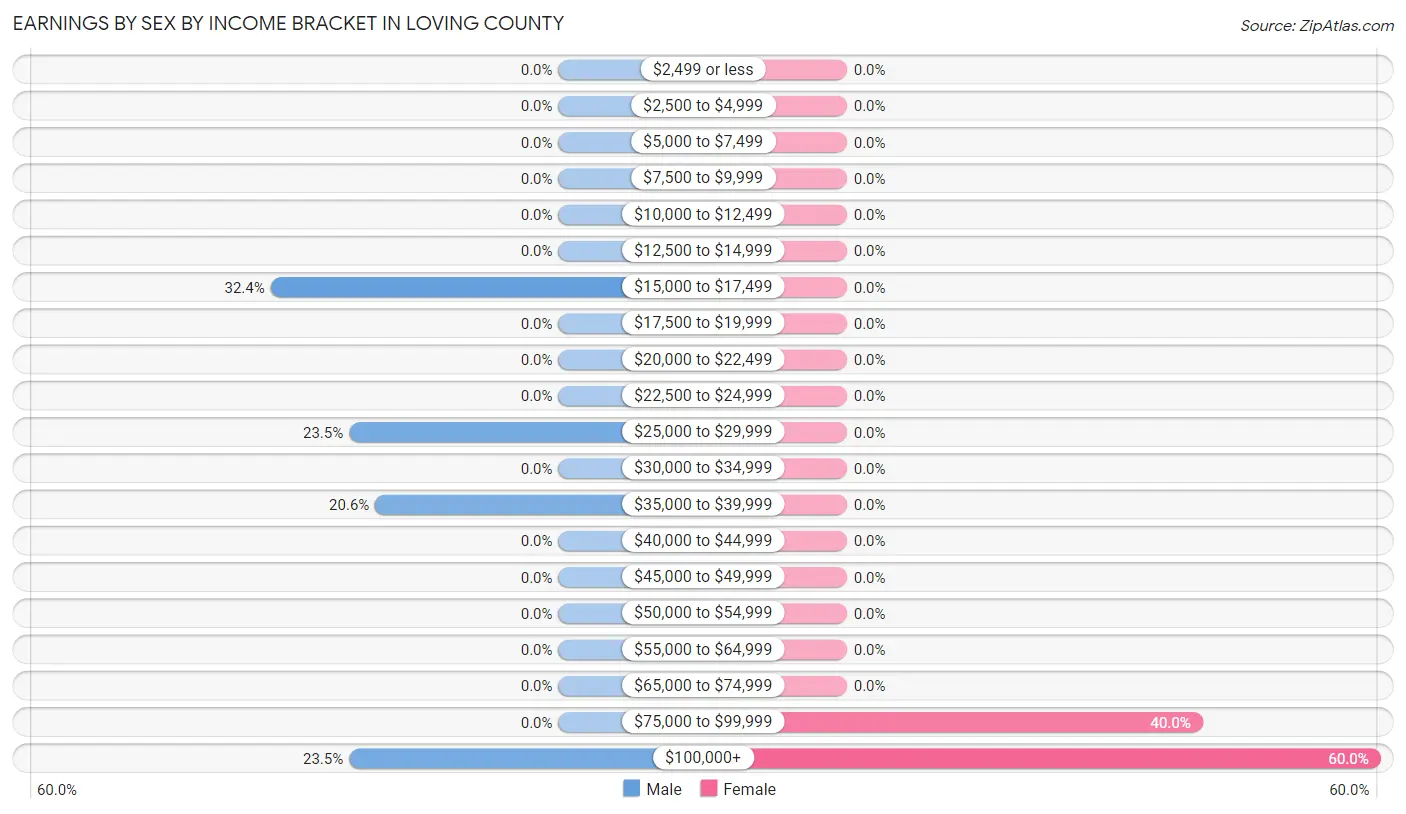
Earnings by Sex by Income Bracket in Loving County
The most common earnings brackets in Loving County are $15,000 to $17,499 for men (11 | 32.4%) and $100,000+ for women (3 | 60.0%).
| Income | Male | Female |
| $2,499 or less | 0 (0.0%) | 0 (0.0%) |
| $2,500 to $4,999 | 0 (0.0%) | 0 (0.0%) |
| $5,000 to $7,499 | 0 (0.0%) | 0 (0.0%) |
| $7,500 to $9,999 | 0 (0.0%) | 0 (0.0%) |
| $10,000 to $12,499 | 0 (0.0%) | 0 (0.0%) |
| $12,500 to $14,999 | 0 (0.0%) | 0 (0.0%) |
| $15,000 to $17,499 | 11 (32.4%) | 0 (0.0%) |
| $17,500 to $19,999 | 0 (0.0%) | 0 (0.0%) |
| $20,000 to $22,499 | 0 (0.0%) | 0 (0.0%) |
| $22,500 to $24,999 | 0 (0.0%) | 0 (0.0%) |
| $25,000 to $29,999 | 8 (23.5%) | 0 (0.0%) |
| $30,000 to $34,999 | 0 (0.0%) | 0 (0.0%) |
| $35,000 to $39,999 | 7 (20.6%) | 0 (0.0%) |
| $40,000 to $44,999 | 0 (0.0%) | 0 (0.0%) |
| $45,000 to $49,999 | 0 (0.0%) | 0 (0.0%) |
| $50,000 to $54,999 | 0 (0.0%) | 0 (0.0%) |
| $55,000 to $64,999 | 0 (0.0%) | 0 (0.0%) |
| $65,000 to $74,999 | 0 (0.0%) | 0 (0.0%) |
| $75,000 to $99,999 | 0 (0.0%) | 2 (40.0%) |
| $100,000+ | 8 (23.5%) | 3 (60.0%) |
| Total | 34 (100.0%) | 5 (100.0%) |
Earnings by Sex by Educational Attainment in Loving County
| Educational Attainment | Male Income | Female Income |
| Less than High School | - | - |
| High School Diploma | - | - |
| College or Associate's Degree | - | - |
| Bachelor's Degree | - | - |
| Graduate Degree | - | - |
| Total | - | - |
Family Income in Loving County
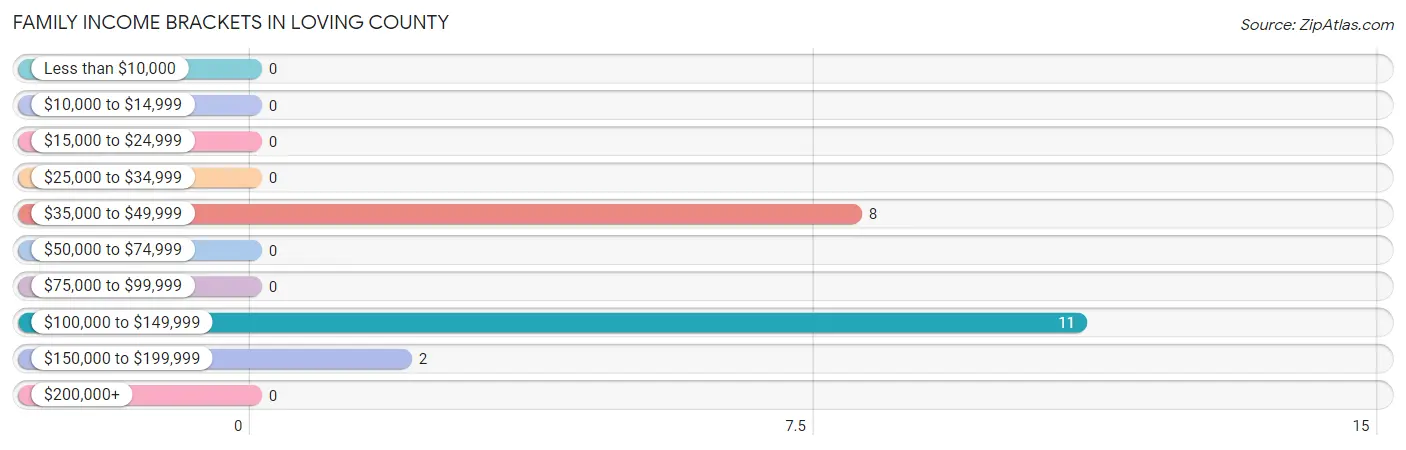
Family Income Brackets in Loving County
According to the Loving County family income data, there are 11 families falling into the $100,000 to $149,999 income range, which is the most common income bracket and makes up 52.4% of all families.
| Income Bracket | # Families | % Families |
| Less than $10,000 | 0 | 0.0% |
| $10,000 to $14,999 | 0 | 0.0% |
| $15,000 to $24,999 | 0 | 0.0% |
| $25,000 to $34,999 | 0 | 0.0% |
| $35,000 to $49,999 | 8 | 38.1% |
| $50,000 to $74,999 | 0 | 0.0% |
| $75,000 to $99,999 | 0 | 0.0% |
| $100,000 to $149,999 | 11 | 52.4% |
| $150,000 to $199,999 | 2 | 9.5% |
| $200,000+ | 0 | 0.0% |
Family Income by Famaliy Size in Loving County
| Income Bracket | # Families | Median Income |
| 2-Person Families | 11 (52.4%) | $0 |
| 3-Person Families | 2 (9.5%) | $0 |
| 4-Person Families | 0 (0.0%) | $0 |
| 5-Person Families | 0 (0.0%) | $0 |
| 6-Person Families | 8 (38.1%) | $0 |
| 7+ Person Families | 0 (0.0%) | $0 |
| Total | 21 (100.0%) | $130,781 |
Family Income by Number of Earners in Loving County
| Number of Earners | # Families | Median Income |
| No Earners | 0 (0.0%) | $0 |
| 1 Earner | 19 (90.5%) | $0 |
| 2 Earners | 0 (0.0%) | $0 |
| 3+ Earners | 2 (9.5%) | $0 |
| Total | 21 (100.0%) | $130,781 |
Household Income in Loving County
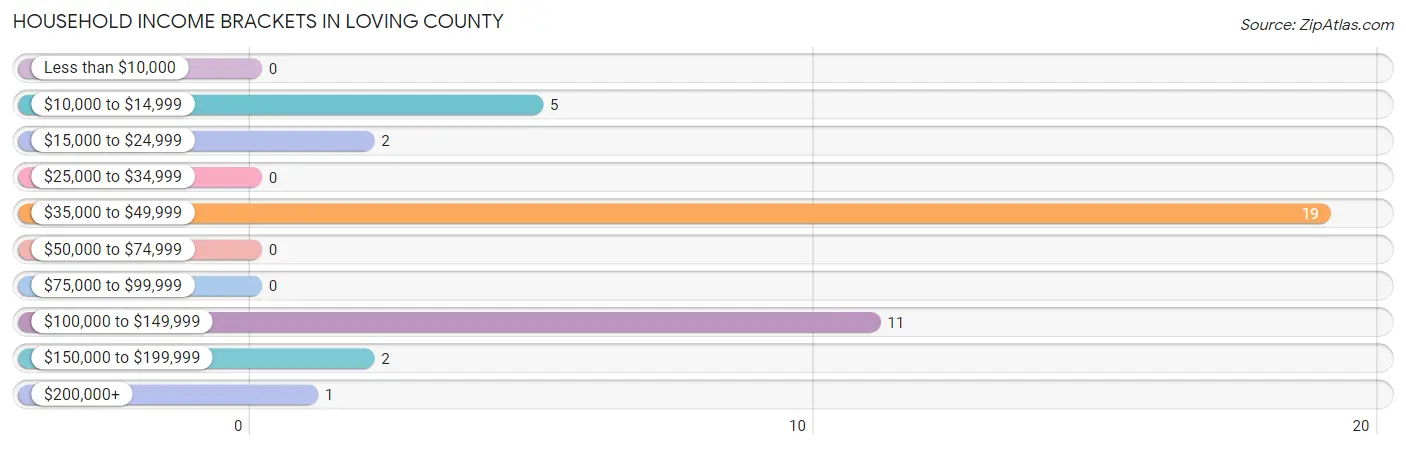
Household Income Brackets in Loving County
With 19 households falling in the category, the $35,000 to $49,999 income range is the most frequent in Loving County, accounting for 47.5% of all households.
| Income Bracket | # Households | % Households |
| Less than $10,000 | 0 | 0.0% |
| $10,000 to $14,999 | 5 | 12.5% |
| $15,000 to $24,999 | 2 | 5.0% |
| $25,000 to $34,999 | 0 | 0.0% |
| $35,000 to $49,999 | 19 | 47.5% |
| $50,000 to $74,999 | 0 | 0.0% |
| $75,000 to $99,999 | 0 | 0.0% |
| $100,000 to $149,999 | 11 | 27.5% |
| $150,000 to $199,999 | 2 | 5.0% |
| $200,000+ | 1 | 2.5% |
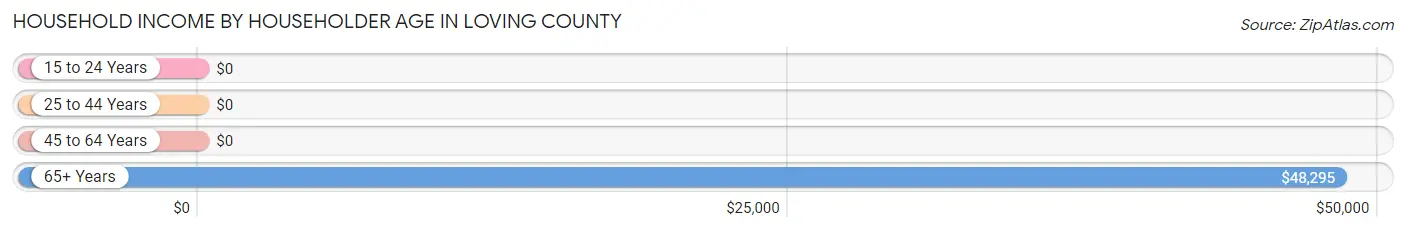
Household Income by Householder Age in Loving County
The median household income in Loving County is $0, with the highest median household income of $48,295 found in the 65+ years age bracket for the primary householder. A total of 21 households (52.5%) fall into this category.
| Income Bracket | # Households | Median Income |
| 15 to 24 Years | 0 (0.0%) | $0 |
| 25 to 44 Years | 8 (20.0%) | $0 |
| 45 to 64 Years | 11 (27.5%) | $0 |
| 65+ Years | 21 (52.5%) | $48,295 |
| Total | 40 (100.0%) | $0 |
Poverty in Loving County
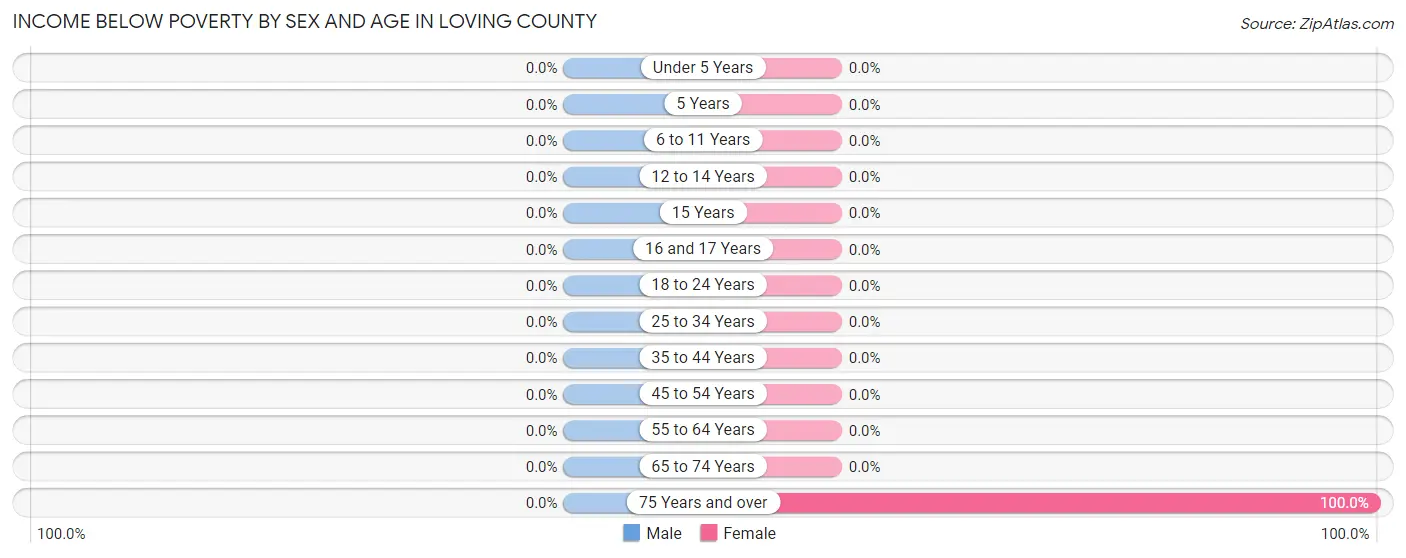
Income Below Poverty by Sex and Age in Loving County
| Age Bracket | Male | Female |
| Under 5 Years | 0 (0.0%) | 0 (0.0%) |
| 5 Years | 0 (0.0%) | 0 (0.0%) |
| 6 to 11 Years | 0 (0.0%) | 0 (0.0%) |
| 12 to 14 Years | 0 (0.0%) | 0 (0.0%) |
| 15 Years | 0 (0.0%) | 0 (0.0%) |
| 16 and 17 Years | 0 (0.0%) | 0 (0.0%) |
| 18 to 24 Years | 0 (0.0%) | 0 (0.0%) |
| 25 to 34 Years | 0 (0.0%) | 0 (0.0%) |
| 35 to 44 Years | 0 (0.0%) | 0 (0.0%) |
| 45 to 54 Years | 0 (0.0%) | 0 (0.0%) |
| 55 to 64 Years | 0 (0.0%) | 0 (0.0%) |
| 65 to 74 Years | 0 (0.0%) | 0 (0.0%) |
| 75 Years and over | 0 (0.0%) | 5 (100.0%) |
| Total | 0 (0.0%) | 5 (11.1%) |
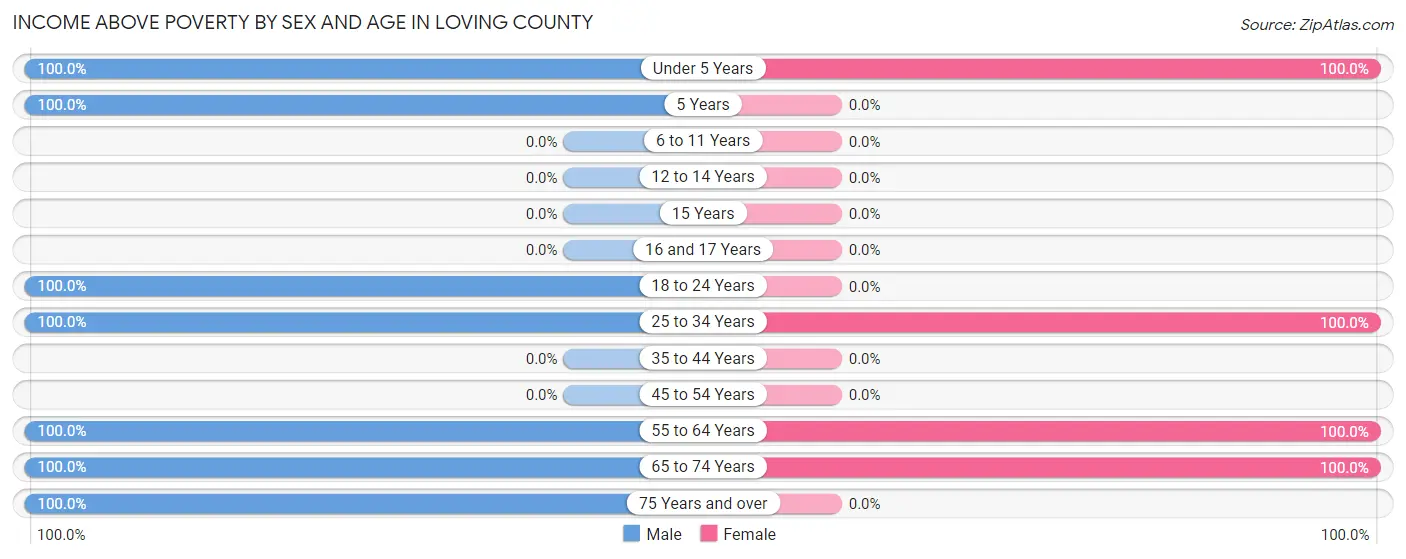
Income Above Poverty by Sex and Age in Loving County
According to the poverty statistics in Loving County, males aged under 5 years and females aged under 5 years are the age groups that are most secure financially, with 100.0% of males and 100.0% of females in these age groups living above the poverty line.
| Age Bracket | Male | Female |
| Under 5 Years | 7 (100.0%) | 16 (100.0%) |
| 5 Years | 5 (100.0%) | 0 (0.0%) |
| 6 to 11 Years | 0 (0.0%) | 0 (0.0%) |
| 12 to 14 Years | 0 (0.0%) | 0 (0.0%) |
| 15 Years | 0 (0.0%) | 0 (0.0%) |
| 16 and 17 Years | 0 (0.0%) | 0 (0.0%) |
| 18 to 24 Years | 5 (100.0%) | 0 (0.0%) |
| 25 to 34 Years | 8 (100.0%) | 8 (100.0%) |
| 35 to 44 Years | 0 (0.0%) | 0 (0.0%) |
| 45 to 54 Years | 0 (0.0%) | 0 (0.0%) |
| 55 to 64 Years | 8 (100.0%) | 5 (100.0%) |
| 65 to 74 Years | 4 (100.0%) | 11 (100.0%) |
| 75 Years and over | 14 (100.0%) | 0 (0.0%) |
| Total | 51 (100.0%) | 40 (88.9%) |
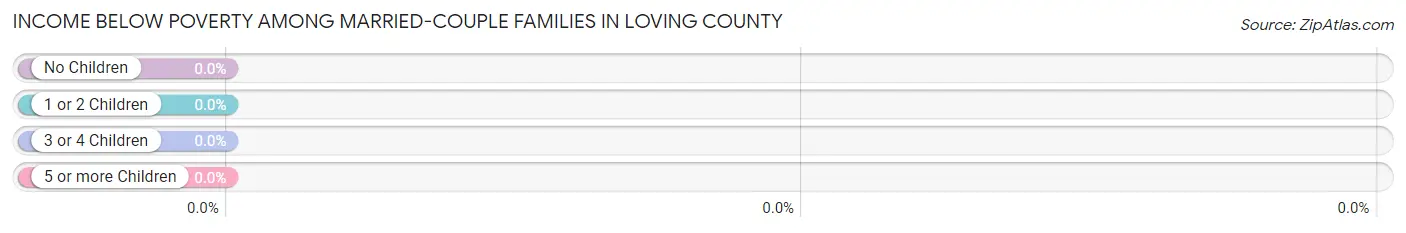
Income Below Poverty Among Married-Couple Families in Loving County
| Children | Above Poverty | Below Poverty |
| No Children | 13 (100.0%) | 0 (0.0%) |
| 1 or 2 Children | 0 (0.0%) | 0 (0.0%) |
| 3 or 4 Children | 8 (100.0%) | 0 (0.0%) |
| 5 or more Children | 0 (0.0%) | 0 (0.0%) |
| Total | 21 (100.0%) | 0 (0.0%) |
Income Below Poverty Among Single-Parent Households in Loving County
| Children | Single Father | Single Mother |
| No Children | 0 (0.0%) | 0 (0.0%) |
| 1 or 2 Children | 0 (0.0%) | 0 (0.0%) |
| 3 or 4 Children | 0 (0.0%) | 0 (0.0%) |
| 5 or more Children | 0 (0.0%) | 0 (0.0%) |
| Total | 0 (0.0%) | 0 (0.0%) |
Income Below Poverty Among Married-Couple vs Single-Parent Households in Loving County
| Children | Married-Couple Families | Single-Parent Households |
| No Children | 0 (0.0%) | 0 (0.0%) |
| 1 or 2 Children | 0 (0.0%) | 0 (0.0%) |
| 3 or 4 Children | 0 (0.0%) | 0 (0.0%) |
| 5 or more Children | 0 (0.0%) | 0 (0.0%) |
| Total | 0 (0.0%) | 0 (0.0%) |
Race in Loving County
The most populous races in Loving County are White / Caucasian (91 | 94.8%), and Asian (5 | 5.2%).
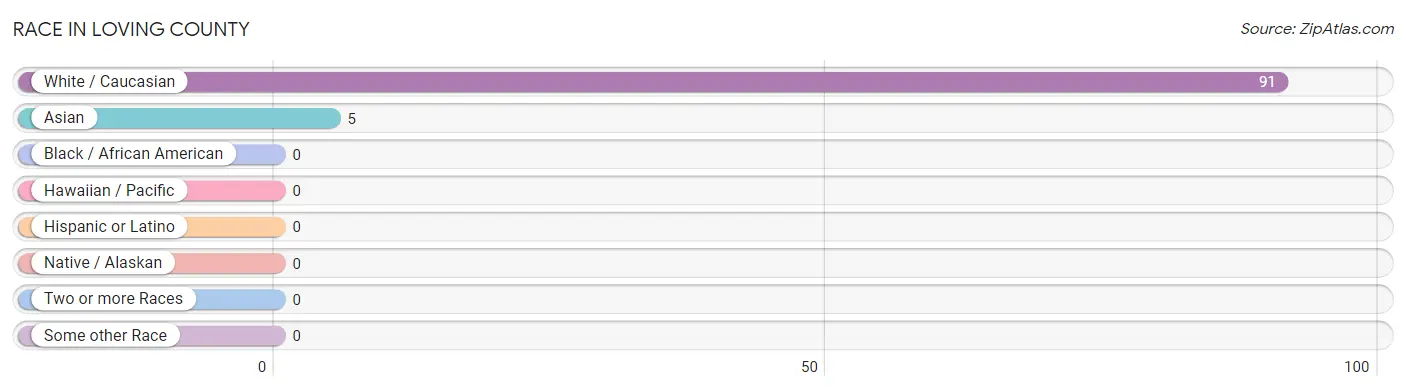
| Race | # Population | % Population |
| Asian | 5 | 5.2% |
| Black / African American | 0 | 0.0% |
| Hawaiian / Pacific | 0 | 0.0% |
| Hispanic or Latino | 0 | 0.0% |
| Native / Alaskan | 0 | 0.0% |
| White / Caucasian | 91 | 94.8% |
| Two or more Races | 0 | 0.0% |
| Some other Race | 0 | 0.0% |
| Total | 96 | 100.0% |
Ancestry in Loving County
The most populous ancestries reported in Loving County are American (63 | 65.6%), German (7 | 7.3%), Irish (7 | 7.3%), English (6 | 6.2%), and Indian (Asian) (5 | 5.2%), together accounting for 91.7% of all Loving County residents.
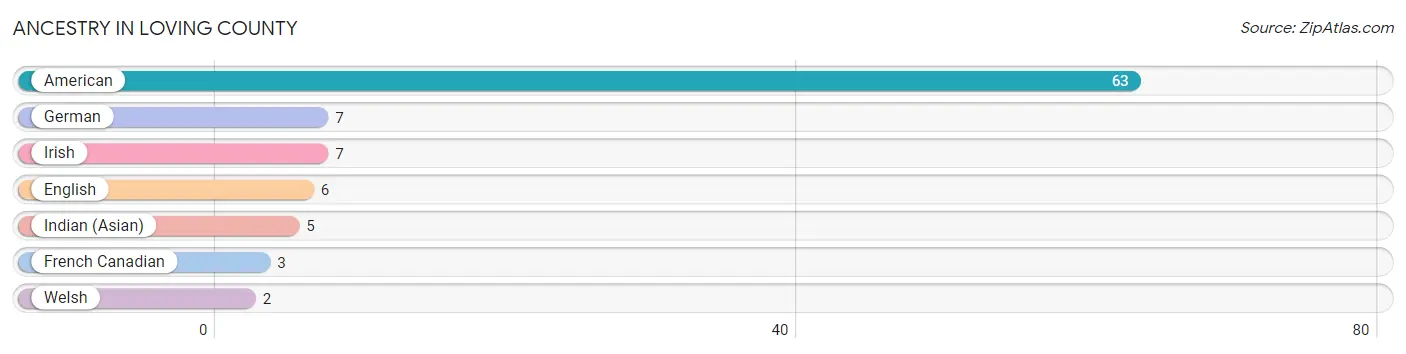
| Ancestry | # Population | % Population |
| American | 63 | 65.6% |
| English | 6 | 6.2% |
| French Canadian | 3 | 3.1% |
| German | 7 | 7.3% |
| Indian (Asian) | 5 | 5.2% |
| Irish | 7 | 7.3% |
| Welsh | 2 | 2.1% | View All 7 Rows |
Immigrants in Loving County
The most numerous immigrant groups reported in Loving County came from Asia (5 | 5.2%), China (5 | 5.2%), and Eastern Asia (5 | 5.2%), together accounting for 15.6% of all Loving County residents.
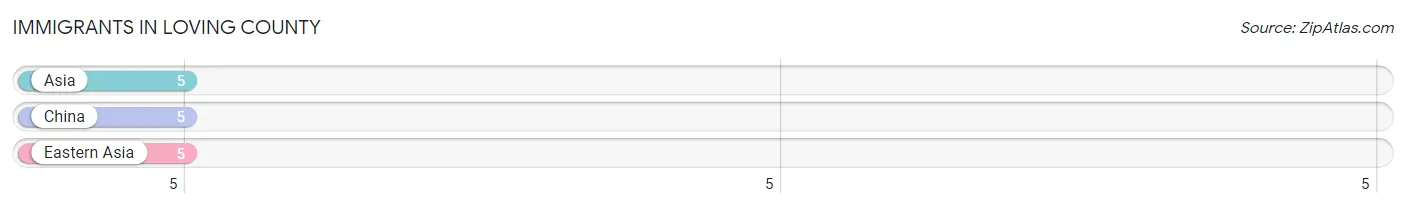
| Immigration Origin | # Population | % Population |
| Asia | 5 | 5.2% |
| China | 5 | 5.2% |
| Eastern Asia | 5 | 5.2% | View All 3 Rows |
Sex and Age in Loving County
Sex and Age in Loving County
The most populous age groups in Loving County are 85 Years and over (11 | 21.6%) for men and Under 5 Years (16 | 35.6%) for women.
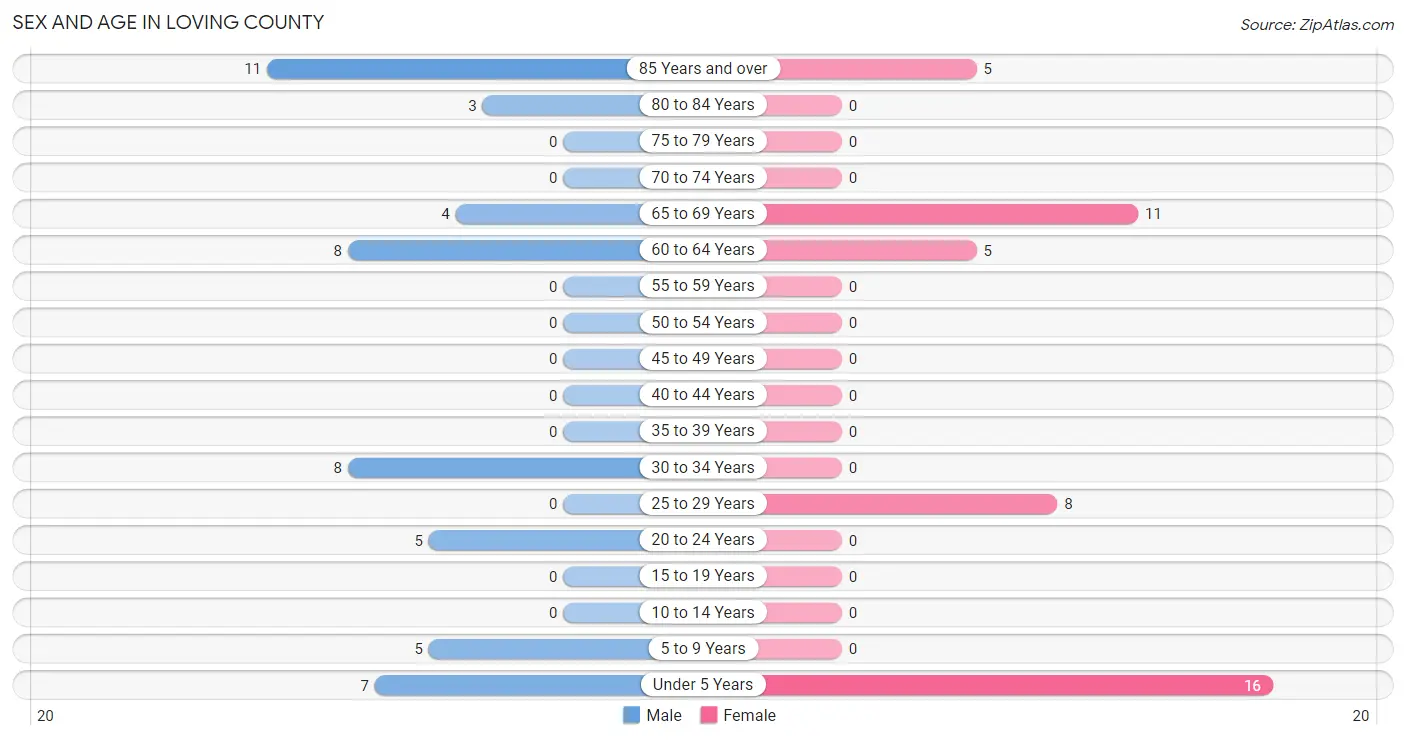
| Age Bracket | Male | Female |
| Under 5 Years | 7 (13.7%) | 16 (35.6%) |
| 5 to 9 Years | 5 (9.8%) | 0 (0.0%) |
| 10 to 14 Years | 0 (0.0%) | 0 (0.0%) |
| 15 to 19 Years | 0 (0.0%) | 0 (0.0%) |
| 20 to 24 Years | 5 (9.8%) | 0 (0.0%) |
| 25 to 29 Years | 0 (0.0%) | 8 (17.8%) |
| 30 to 34 Years | 8 (15.7%) | 0 (0.0%) |
| 35 to 39 Years | 0 (0.0%) | 0 (0.0%) |
| 40 to 44 Years | 0 (0.0%) | 0 (0.0%) |
| 45 to 49 Years | 0 (0.0%) | 0 (0.0%) |
| 50 to 54 Years | 0 (0.0%) | 0 (0.0%) |
| 55 to 59 Years | 0 (0.0%) | 0 (0.0%) |
| 60 to 64 Years | 8 (15.7%) | 5 (11.1%) |
| 65 to 69 Years | 4 (7.8%) | 11 (24.4%) |
| 70 to 74 Years | 0 (0.0%) | 0 (0.0%) |
| 75 to 79 Years | 0 (0.0%) | 0 (0.0%) |
| 80 to 84 Years | 3 (5.9%) | 0 (0.0%) |
| 85 Years and over | 11 (21.6%) | 5 (11.1%) |
| Total | 51 (100.0%) | 45 (100.0%) |
Families and Households in Loving County
Median Family Size in Loving County
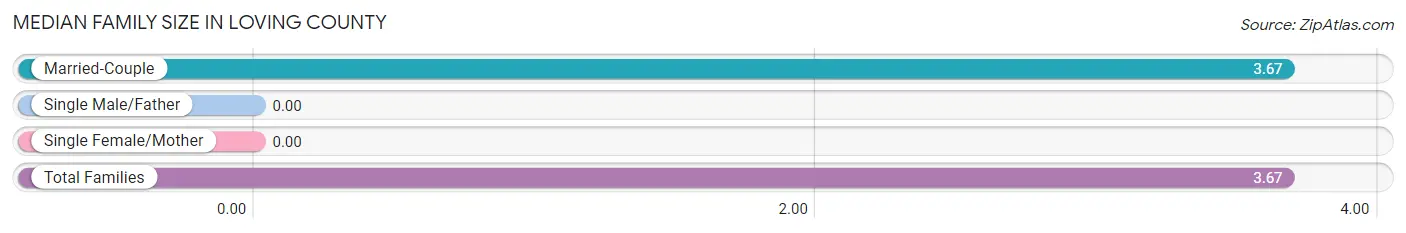
| Family Type | # Families | Family Size |
| Married-Couple | 21 (100.0%) | 3.67 |
| Single Male/Father | 0 (0.0%) | - |
| Single Female/Mother | 0 (0.0%) | - |
| Total Families | 21 (100.0%) | 3.67 |
Median Household Size in Loving County
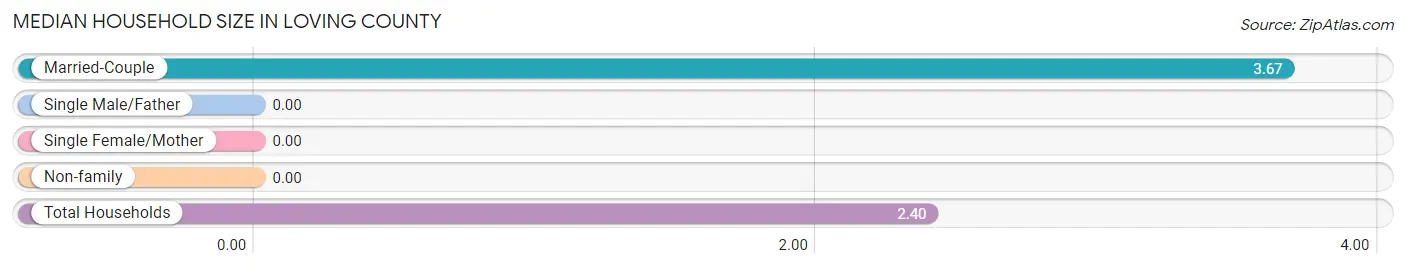
| Household Type | # Households | Household Size |
| Married-Couple | 21 (52.5%) | 3.67 |
| Single Male/Father | 0 (0.0%) | - |
| Single Female/Mother | 0 (0.0%) | - |
| Non-family | 19 (47.5%) | - |
| Total Households | 40 (100.0%) | 2.40 |
Household Size by Marriage Status in Loving County
Out of a total of 40 households in Loving County, 21 (52.5%) are family households, while 19 (47.5%) are nonfamily households. The most numerous type of family households are 2-person households, comprising 11, and the most common type of nonfamily households are 1-person households, comprising 19.
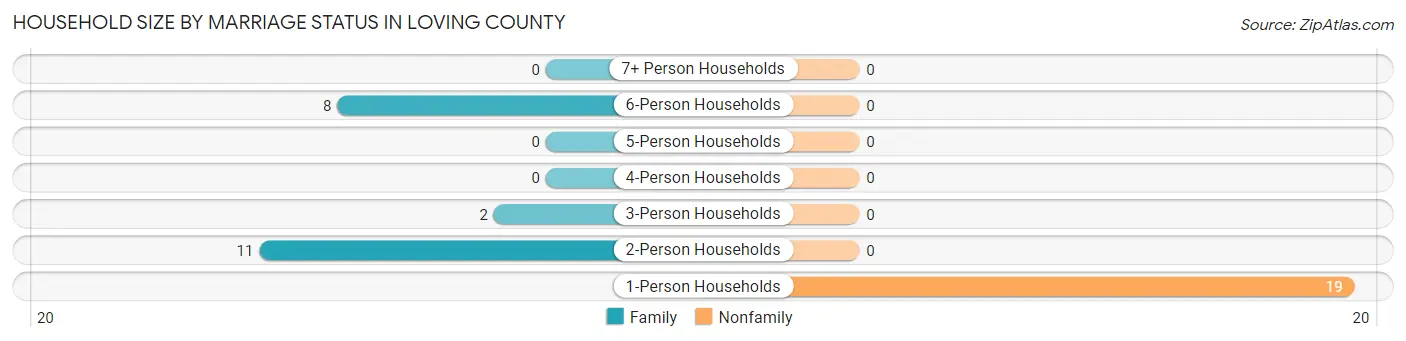
| Household Size | Family Households | Nonfamily Households |
| 1-Person Households | - | 19 (47.5%) |
| 2-Person Households | 11 (27.5%) | 0 (0.0%) |
| 3-Person Households | 2 (5.0%) | 0 (0.0%) |
| 4-Person Households | 0 (0.0%) | 0 (0.0%) |
| 5-Person Households | 0 (0.0%) | 0 (0.0%) |
| 6-Person Households | 8 (20.0%) | 0 (0.0%) |
| 7+ Person Households | 0 (0.0%) | 0 (0.0%) |
| Total | 21 (52.5%) | 19 (47.5%) |
Female Fertility in Loving County
Fertility by Age in Loving County
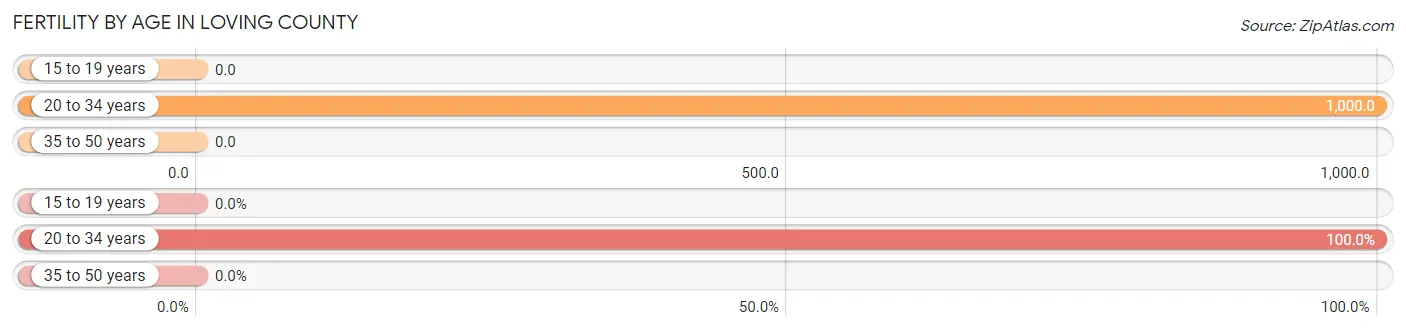
Average fertility rate in Loving County is 1,000.0 births per 1,000 women. Women in the age bracket of 20 to 34 years have the highest fertility rate with 1,000.0 births per 1,000 women. Women in the age bracket of 20 to 34 years acount for 100.0% of all women with births.
| Age Bracket | Women with Births | Births / 1,000 Women |
| 15 to 19 years | 0 (0.0%) | 0.0 |
| 20 to 34 years | 8 (100.0%) | 1,000.0 |
| 35 to 50 years | 0 (0.0%) | 0.0 |
| Total | 8 (100.0%) | 1,000.0 |
Fertility by Age by Marriage Status in Loving County
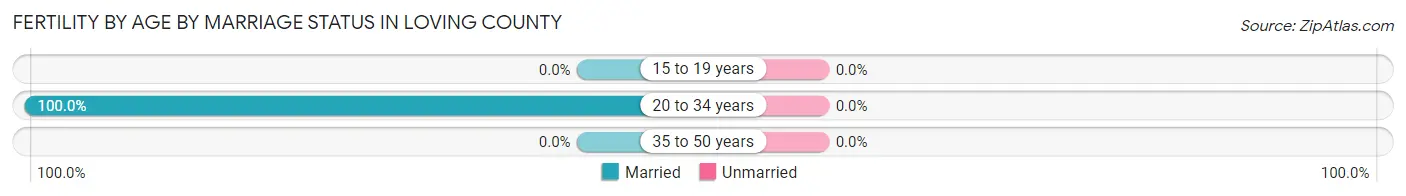
| Age Bracket | Married | Unmarried |
| 15 to 19 years | 0 (0.0%) | 0 (0.0%) |
| 20 to 34 years | 8 (100.0%) | 0 (0.0%) |
| 35 to 50 years | 0 (0.0%) | 0 (0.0%) |
| Total | 8 (100.0%) | 0 (0.0%) |
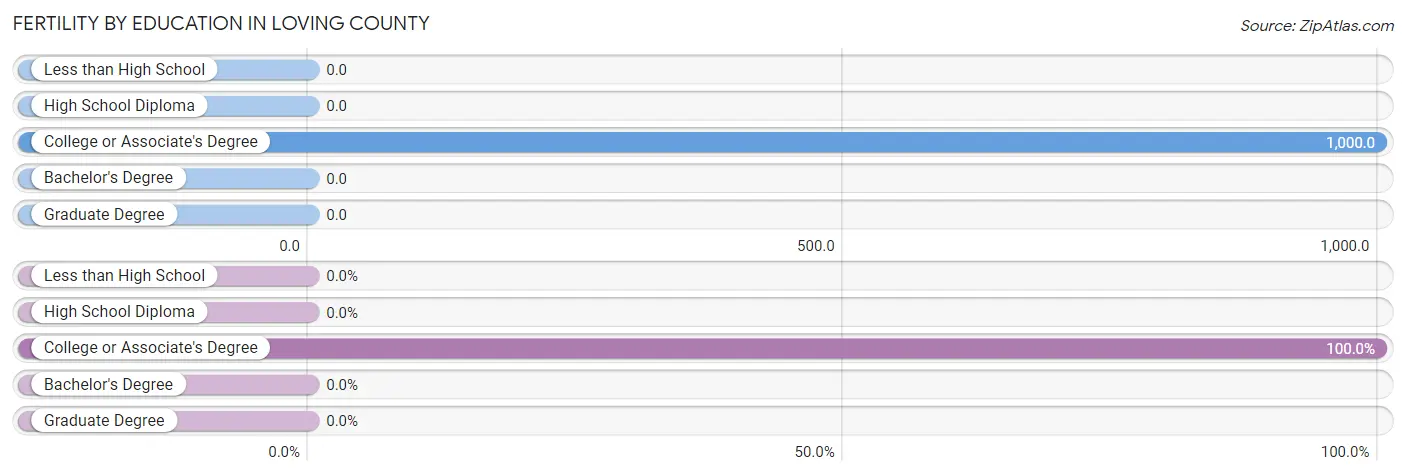
Fertility by Education in Loving County
| Educational Attainment | Women with Births | Births / 1,000 Women |
| Less than High School | 0 (0.0%) | 0.0 |
| High School Diploma | 0 (0.0%) | 0.0 |
| College or Associate's Degree | 8 (100.0%) | 1,000.0 |
| Bachelor's Degree | 0 (0.0%) | 0.0 |
| Graduate Degree | 0 (0.0%) | 0.0 |
| Total | 8 (100.0%) | 1,000.0 |
Fertility by Education by Marriage Status in Loving County
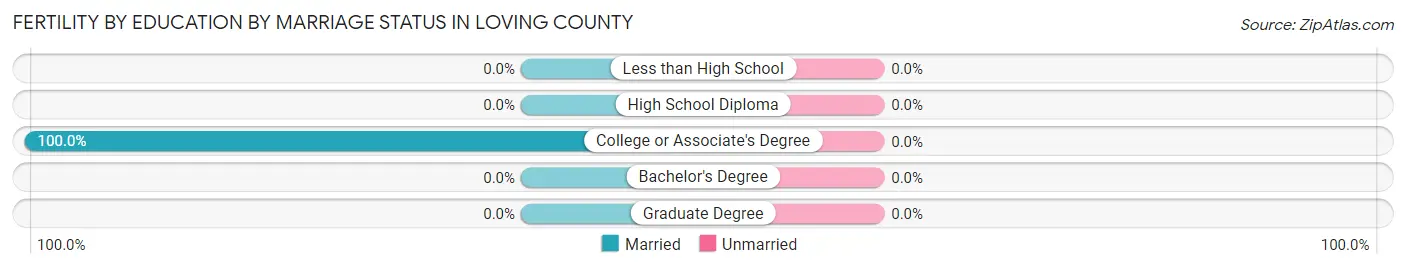
| Educational Attainment | Married | Unmarried |
| Less than High School | 0 (0.0%) | 0 (0.0%) |
| High School Diploma | 0 (0.0%) | 0 (0.0%) |
| College or Associate's Degree | 8 (100.0%) | 0 (0.0%) |
| Bachelor's Degree | 0 (0.0%) | 0 (0.0%) |
| Graduate Degree | 0 (0.0%) | 0 (0.0%) |
| Total | 8 (100.0%) | 0 (0.0%) |
Employment Characteristics in Loving County
Employment by Class of Employer in Loving County
Among the 39 employed individuals in Loving County, private company employees (17 | 43.6%), local government employees (14 | 35.9%), and self-employed (not incorporated) (8 | 20.5%) make up the most common classes of employment.
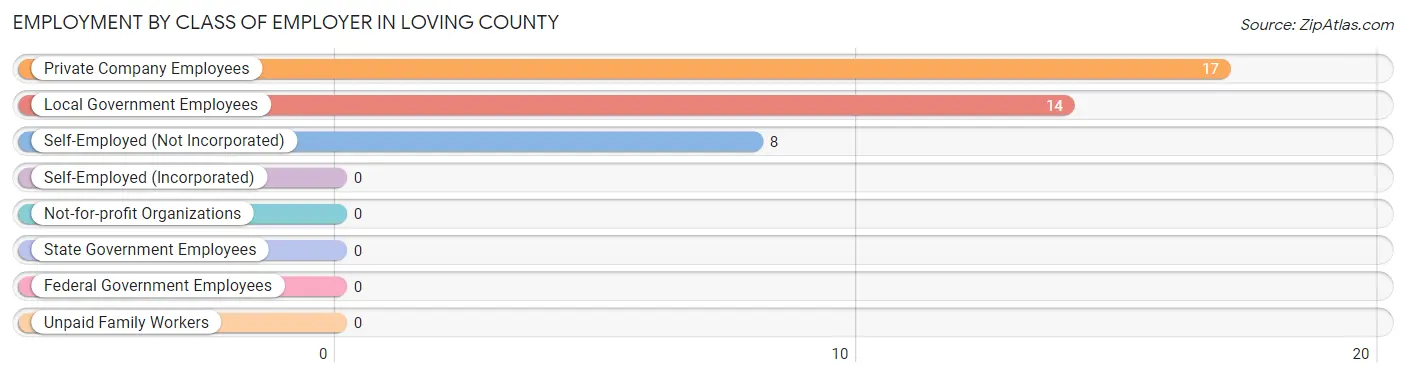
| Employer Class | # Employees | % Employees |
| Private Company Employees | 17 | 43.6% |
| Self-Employed (Incorporated) | 0 | 0.0% |
| Self-Employed (Not Incorporated) | 8 | 20.5% |
| Not-for-profit Organizations | 0 | 0.0% |
| Local Government Employees | 14 | 35.9% |
| State Government Employees | 0 | 0.0% |
| Federal Government Employees | 0 | 0.0% |
| Unpaid Family Workers | 0 | 0.0% |
| Total | 39 | 100.0% |
Employment Status by Age in Loving County
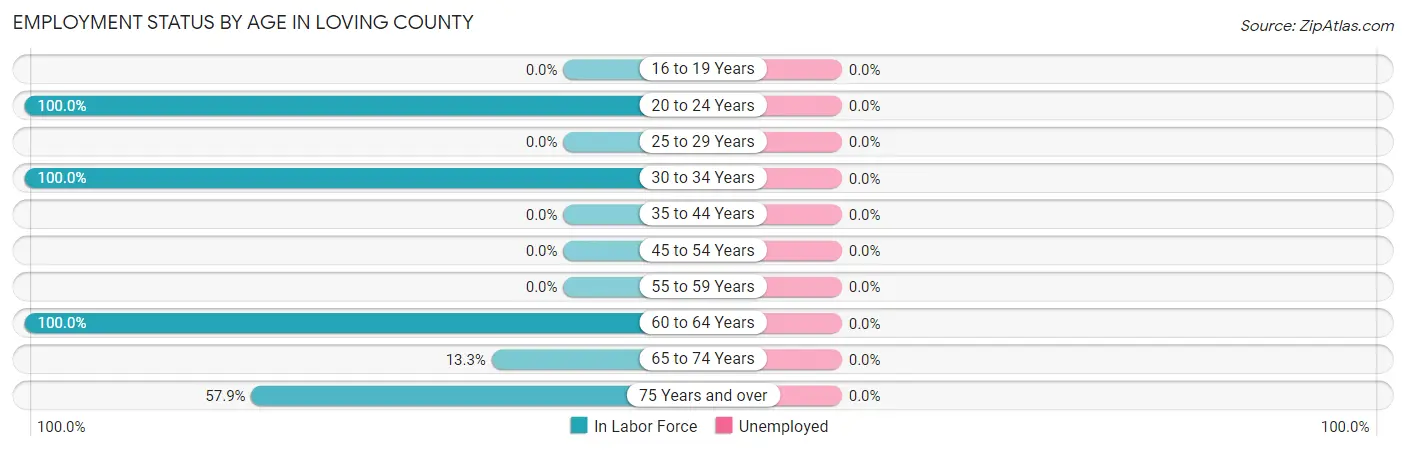
| Age Bracket | In Labor Force | Unemployed |
| 16 to 19 Years | 0 (0.0%) | 0 (0.0%) |
| 20 to 24 Years | 5 (100.0%) | 0 (0.0%) |
| 25 to 29 Years | 0 (0.0%) | 0 (0.0%) |
| 30 to 34 Years | 8 (100.0%) | 0 (0.0%) |
| 35 to 44 Years | 0 (0.0%) | 0 (0.0%) |
| 45 to 54 Years | 0 (0.0%) | 0 (0.0%) |
| 55 to 59 Years | 0 (0.0%) | 0 (0.0%) |
| 60 to 64 Years | 13 (100.0%) | 0 (0.0%) |
| 65 to 74 Years | 2 (13.3%) | 0 (0.0%) |
| 75 Years and over | 11 (57.9%) | 0 (0.0%) |
| Total | 39 (57.4%) | 0 (0.0%) |
Employment Status by Educational Attainment in Loving County
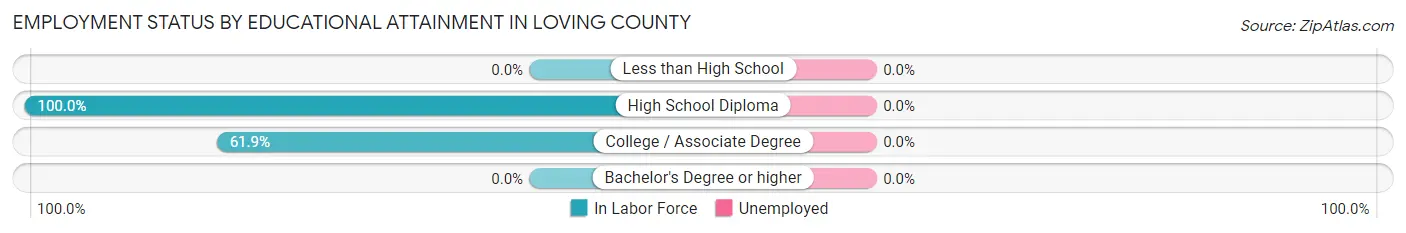
| Educational Attainment | In Labor Force | Unemployed |
| Less than High School | 0 (0.0%) | 0 (0.0%) |
| High School Diploma | 8 (100.0%) | 0 (0.0%) |
| College / Associate Degree | 13 (61.9%) | 0 (0.0%) |
| Bachelor's Degree or higher | 0 (0.0%) | 0 (0.0%) |
| Total | 21 (72.4%) | 0 (0.0%) |
Employment Occupations by Sex in Loving County
Management, Business, Science and Arts Occupations
The most common Management, Business, Science and Arts occupations in Loving County are Management (19 | 48.7%), Community & Social Service (2 | 5.1%), and Arts, Media & Entertainment (2 | 5.1%).
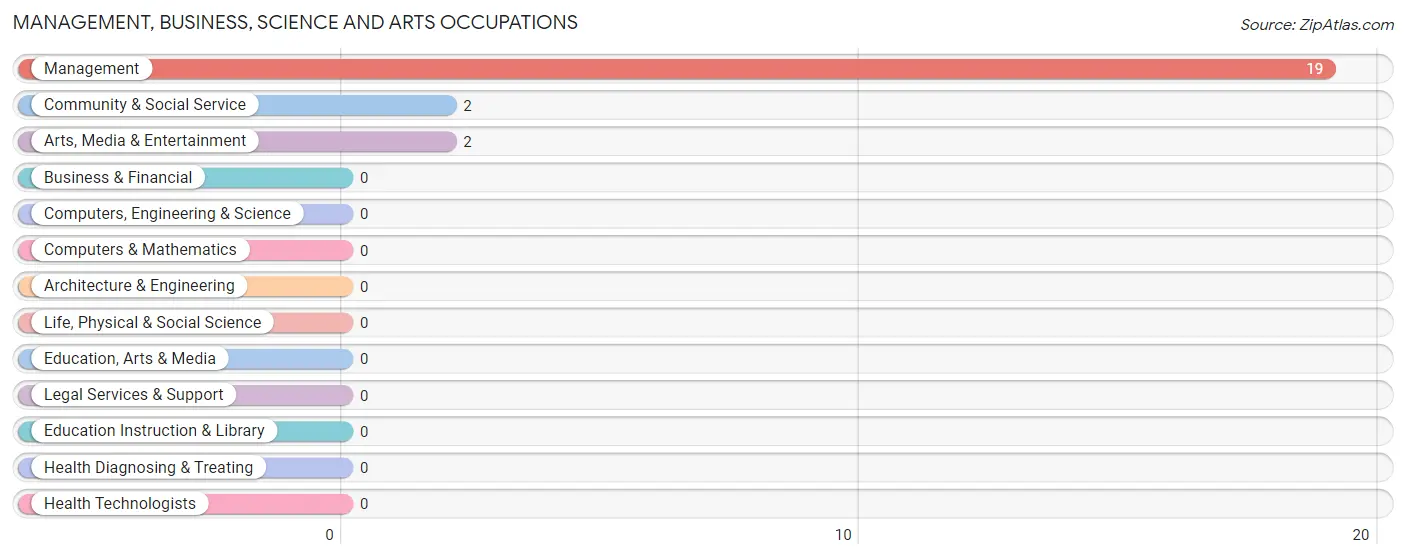
Management, Business, Science and Arts Occupations by Sex
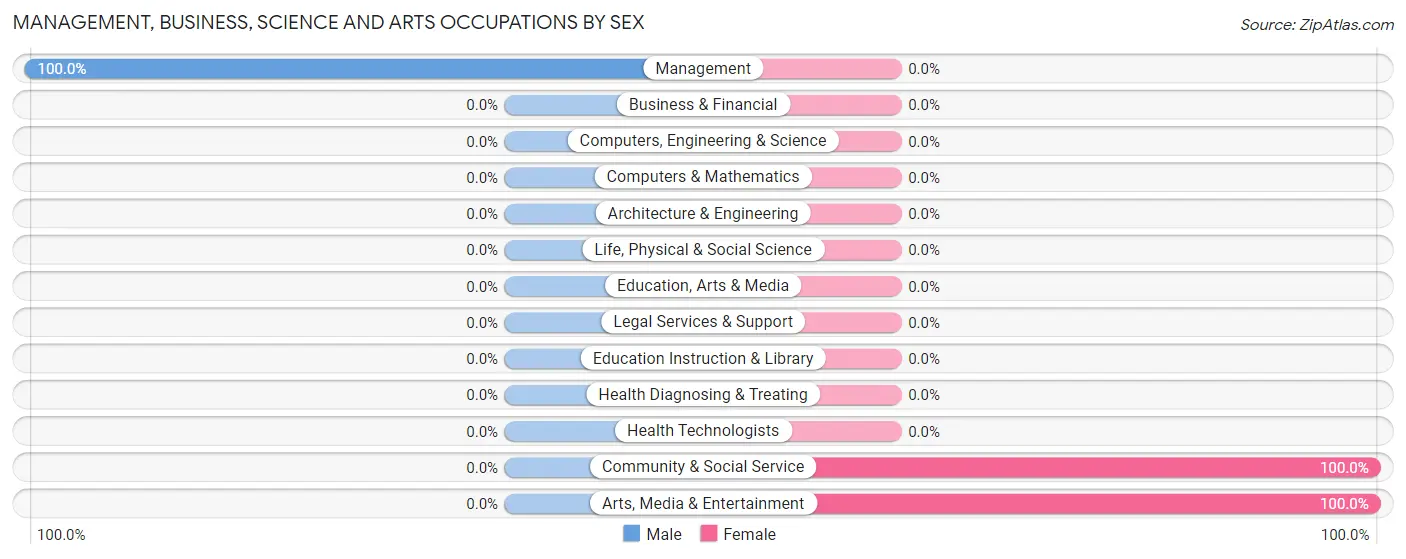
| Occupation | Male | Female |
| Management | 19 (100.0%) | 0 (0.0%) |
| Business & Financial | 0 (0.0%) | 0 (0.0%) |
| Computers, Engineering & Science | 0 (0.0%) | 0 (0.0%) |
| Computers & Mathematics | 0 (0.0%) | 0 (0.0%) |
| Architecture & Engineering | 0 (0.0%) | 0 (0.0%) |
| Life, Physical & Social Science | 0 (0.0%) | 0 (0.0%) |
| Community & Social Service | 0 (0.0%) | 2 (100.0%) |
| Education, Arts & Media | 0 (0.0%) | 0 (0.0%) |
| Legal Services & Support | 0 (0.0%) | 0 (0.0%) |
| Education Instruction & Library | 0 (0.0%) | 0 (0.0%) |
| Arts, Media & Entertainment | 0 (0.0%) | 2 (100.0%) |
| Health Diagnosing & Treating | 0 (0.0%) | 0 (0.0%) |
| Health Technologists | 0 (0.0%) | 0 (0.0%) |
| Total (Category) | 19 (90.5%) | 2 (9.5%) |
| Total (Overall) | 34 (87.2%) | 5 (12.8%) |
Services Occupations
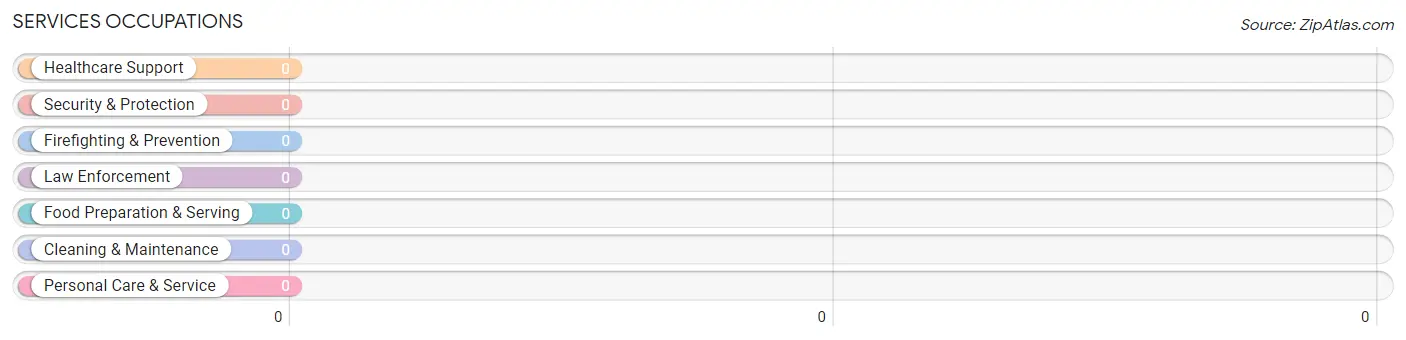
Services Occupations by Sex
| Occupation | Male | Female |
| Healthcare Support | 0 (0.0%) | 0 (0.0%) |
| Security & Protection | 0 (0.0%) | 0 (0.0%) |
| Firefighting & Prevention | 0 (0.0%) | 0 (0.0%) |
| Law Enforcement | 0 (0.0%) | 0 (0.0%) |
| Food Preparation & Serving | 0 (0.0%) | 0 (0.0%) |
| Cleaning & Maintenance | 0 (0.0%) | 0 (0.0%) |
| Personal Care & Service | 0 (0.0%) | 0 (0.0%) |
| Total (Category) | 0 (0.0%) | 0 (0.0%) |
| Total (Overall) | 34 (87.2%) | 5 (12.8%) |
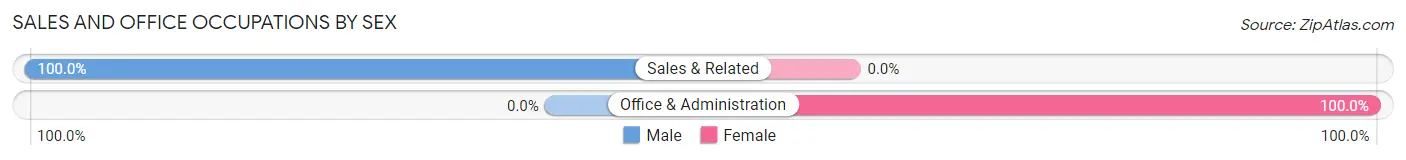
Sales and Office Occupations
The most common Sales and Office occupations in Loving County are Office & Administration (3 | 7.7%), and Sales & Related (2 | 5.1%).
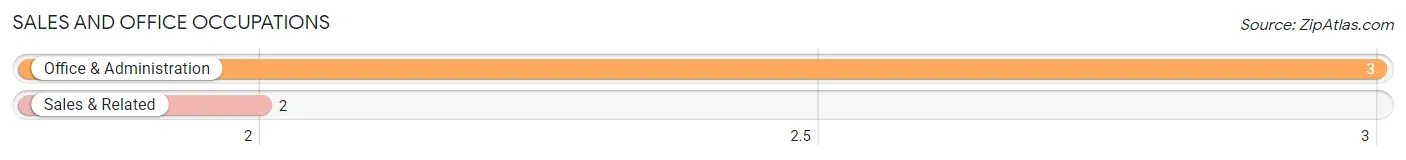
Sales and Office Occupations by Sex
| Occupation | Male | Female |
| Sales & Related | 2 (100.0%) | 0 (0.0%) |
| Office & Administration | 0 (0.0%) | 3 (100.0%) |
| Total (Category) | 2 (40.0%) | 3 (60.0%) |
| Total (Overall) | 34 (87.2%) | 5 (12.8%) |
Natural Resources, Construction and Maintenance Occupations
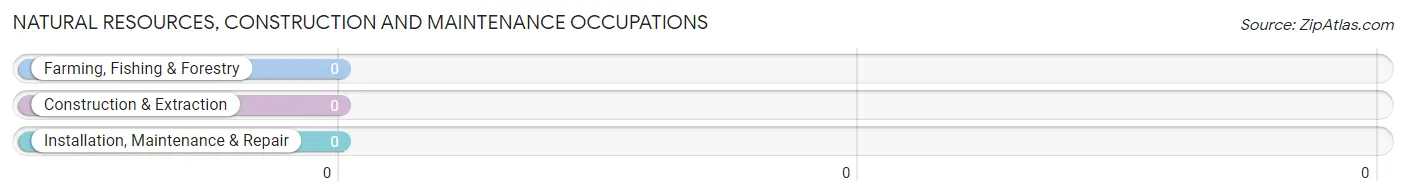
Natural Resources, Construction and Maintenance Occupations by Sex
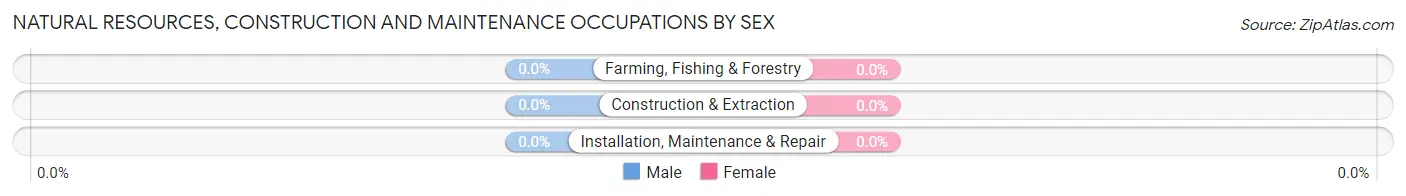
| Occupation | Male | Female |
| Farming, Fishing & Forestry | 0 (0.0%) | 0 (0.0%) |
| Construction & Extraction | 0 (0.0%) | 0 (0.0%) |
| Installation, Maintenance & Repair | 0 (0.0%) | 0 (0.0%) |
| Total (Category) | 0 (0.0%) | 0 (0.0%) |
| Total (Overall) | 34 (87.2%) | 5 (12.8%) |
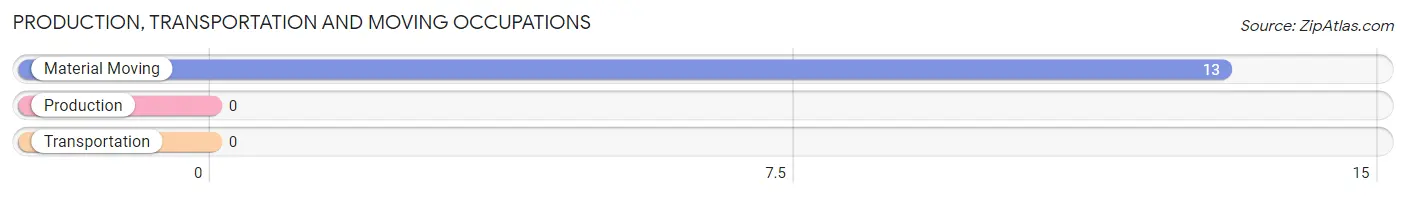
Production, Transportation and Moving Occupations
The most common Production, Transportation and Moving occupations in Loving County are , and Material Moving (13 | 33.3%).
Production, Transportation and Moving Occupations by Sex
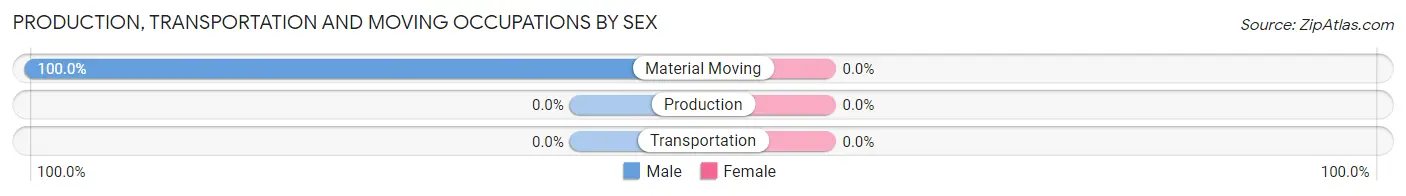
| Occupation | Male | Female |
| Production | 0 (0.0%) | 0 (0.0%) |
| Transportation | 0 (0.0%) | 0 (0.0%) |
| Material Moving | 13 (100.0%) | 0 (0.0%) |
| Total (Category) | 13 (100.0%) | 0 (0.0%) |
| Total (Overall) | 34 (87.2%) | 5 (12.8%) |
Employment Industries by Sex in Loving County
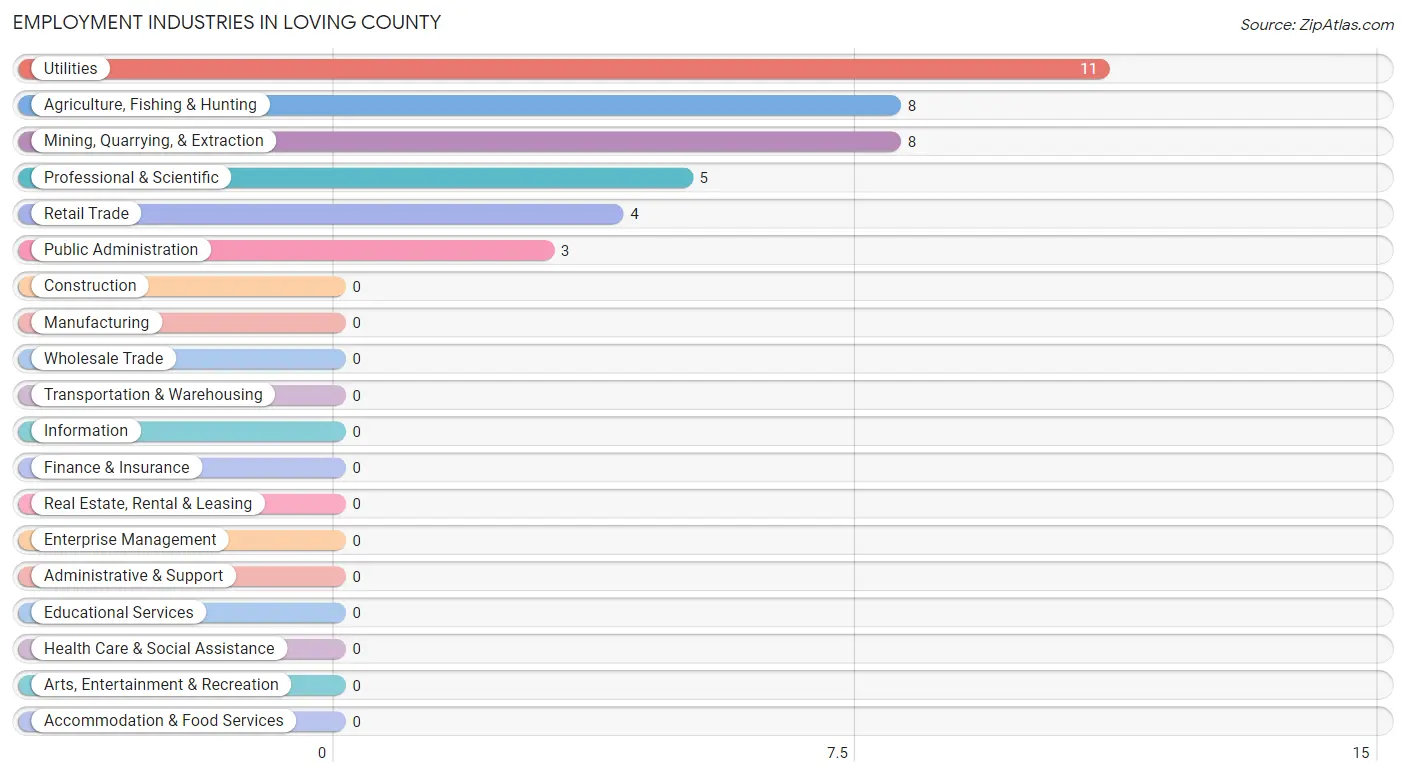
Employment Industries in Loving County
The major employment industries in Loving County include Utilities (11 | 28.2%), Agriculture, Fishing & Hunting (8 | 20.5%), Mining, Quarrying, & Extraction (8 | 20.5%), Professional & Scientific (5 | 12.8%), and Retail Trade (4 | 10.3%).
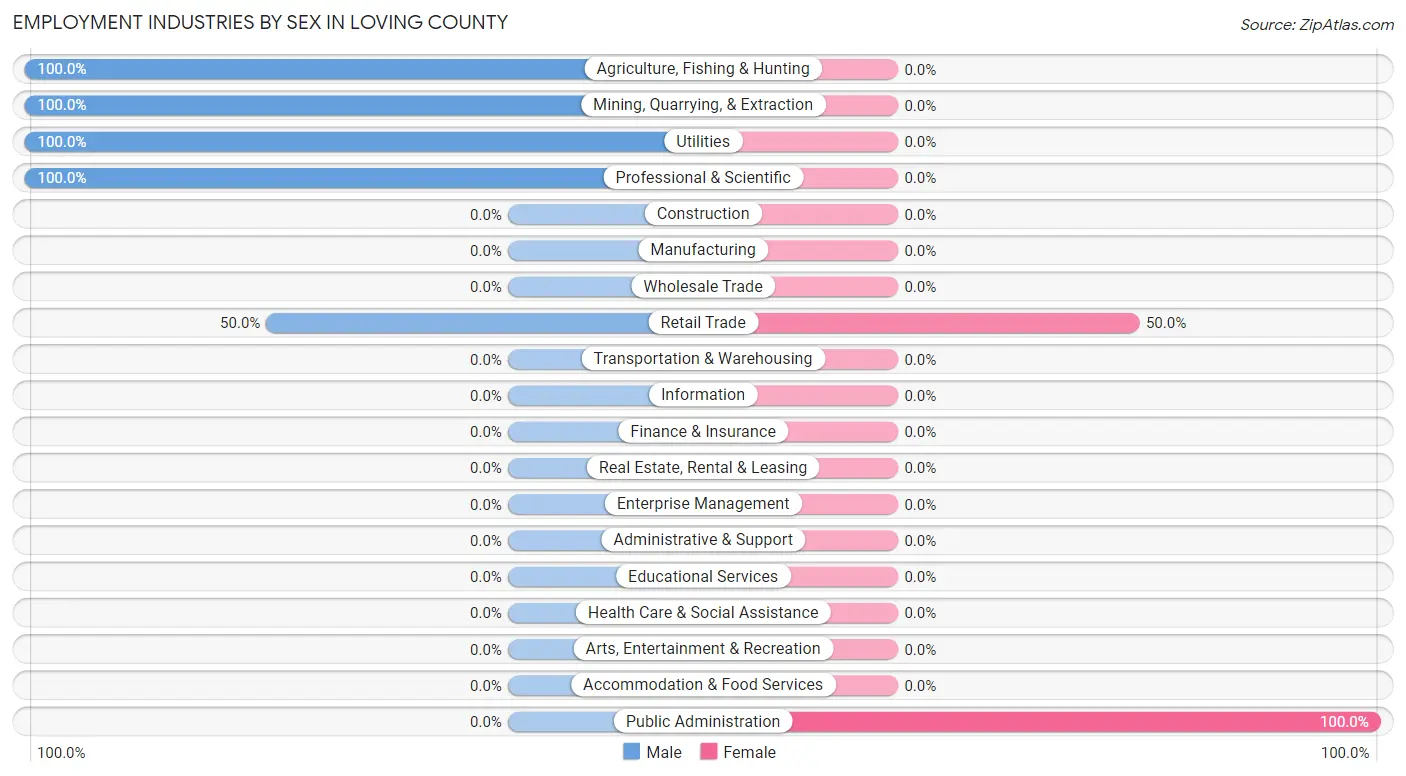
Employment Industries by Sex in Loving County
The Loving County industries that see more men than women are Agriculture, Fishing & Hunting (100.0%), Mining, Quarrying, & Extraction (100.0%), and Utilities (100.0%), whereas the industries that tend to have a higher number of women are Public Administration (100.0%), and Retail Trade (50.0%).
| Industry | Male | Female |
| Agriculture, Fishing & Hunting | 8 (100.0%) | 0 (0.0%) |
| Mining, Quarrying, & Extraction | 8 (100.0%) | 0 (0.0%) |
| Construction | 0 (0.0%) | 0 (0.0%) |
| Manufacturing | 0 (0.0%) | 0 (0.0%) |
| Wholesale Trade | 0 (0.0%) | 0 (0.0%) |
| Retail Trade | 2 (50.0%) | 2 (50.0%) |
| Transportation & Warehousing | 0 (0.0%) | 0 (0.0%) |
| Utilities | 11 (100.0%) | 0 (0.0%) |
| Information | 0 (0.0%) | 0 (0.0%) |
| Finance & Insurance | 0 (0.0%) | 0 (0.0%) |
| Real Estate, Rental & Leasing | 0 (0.0%) | 0 (0.0%) |
| Professional & Scientific | 5 (100.0%) | 0 (0.0%) |
| Enterprise Management | 0 (0.0%) | 0 (0.0%) |
| Administrative & Support | 0 (0.0%) | 0 (0.0%) |
| Educational Services | 0 (0.0%) | 0 (0.0%) |
| Health Care & Social Assistance | 0 (0.0%) | 0 (0.0%) |
| Arts, Entertainment & Recreation | 0 (0.0%) | 0 (0.0%) |
| Accommodation & Food Services | 0 (0.0%) | 0 (0.0%) |
| Public Administration | 0 (0.0%) | 3 (100.0%) |
| Total | 34 (87.2%) | 5 (12.8%) |
Education in Loving County
School Enrollment in Loving County
| School Level | # Students | % Students |
| Nursery / Preschool | 0 | 0.0% |
| Kindergarten | 0 | 0.0% |
| Elementary School | 0 | 0.0% |
| Middle School | 0 | 0.0% |
| High School | 0 | 0.0% |
| College / Undergraduate | 0 | 0.0% |
| Graduate / Professional | 0 | 0.0% |
| Total | 0 | 0.0% |
School Enrollment by Age by Funding Source in Loving County
| Age Bracket | Public School | Private School |
| 3 to 4 Year Olds | 0 (0.0%) | 0 (0.0%) |
| 5 to 9 Year Old | 0 (0.0%) | 0 (0.0%) |
| 10 to 14 Year Olds | 0 (0.0%) | 0 (0.0%) |
| 15 to 17 Year Olds | 0 (0.0%) | 0 (0.0%) |
| 18 to 19 Year Olds | 0 (0.0%) | 0 (0.0%) |
| 20 to 24 Year Olds | 0 (0.0%) | 0 (0.0%) |
| 25 to 34 Year Olds | 0 (0.0%) | 0 (0.0%) |
| 35 Years and over | 0 (0.0%) | 0 (0.0%) |
| Total | 0 (0.0%) | 0 (0.0%) |
Educational Attainment by Field of Study in Loving County
| Field of Study | # Graduates | % Graduates |
| Computers & Mathematics | 0 | 0.0% |
| Bio, Nature & Agricultural | 0 | 0.0% |
| Physical & Health Sciences | 0 | 0.0% |
| Psychology | 0 | 0.0% |
| Social Sciences | 0 | 0.0% |
| Engineering | 0 | 0.0% |
| Multidisciplinary Studies | 0 | 0.0% |
| Science & Technology | 0 | 0.0% |
| Business | 0 | 0.0% |
| Education | 0 | 0.0% |
| Literature & Languages | 0 | 0.0% |
| Liberal Arts & History | 0 | 0.0% |
| Visual & Performing Arts | 0 | 0.0% |
| Communications | 0 | 0.0% |
| Arts & Humanities | 0 | 0.0% |
| Total | 0 | 0.0% |
Transportation & Commute in Loving County
Vehicle Availability by Sex in Loving County
The most prevalent vehicle ownership categories in Loving County are males with 2 vehicles (16, accounting for 47.1%) and females with 2 vehicles (3, making up 320.0%).
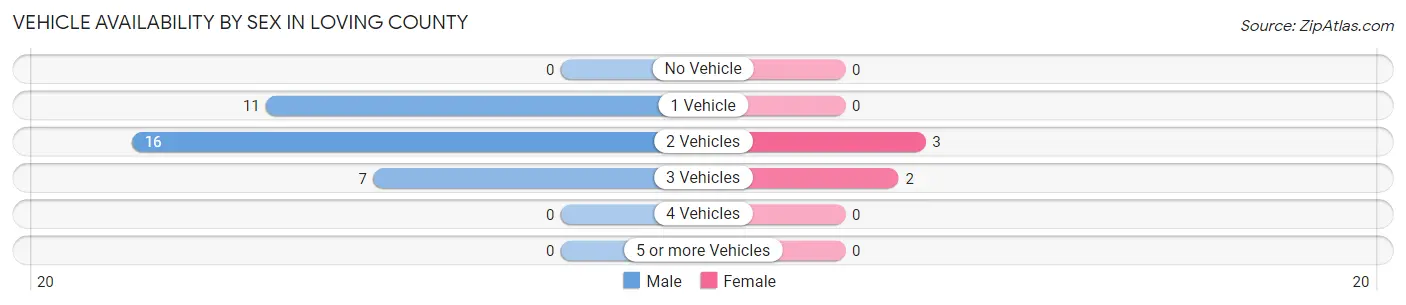
| Vehicles Available | Male | Female |
| No Vehicle | 0 (0.0%) | 0 (0.0%) |
| 1 Vehicle | 11 (32.4%) | 0 (0.0%) |
| 2 Vehicles | 16 (47.1%) | 3 (60.0%) |
| 3 Vehicles | 7 (20.6%) | 2 (40.0%) |
| 4 Vehicles | 0 (0.0%) | 0 (0.0%) |
| 5 or more Vehicles | 0 (0.0%) | 0 (0.0%) |
| Total | 34 (100.0%) | 5 (100.0%) |
Commute Time in Loving County
The most frequently occuring commute durations in Loving County are less than 5 minutes (13 commuters, 41.9%), 5 to 9 minutes (10 commuters, 32.3%), and 90 or more minutes (8 commuters, 25.8%).
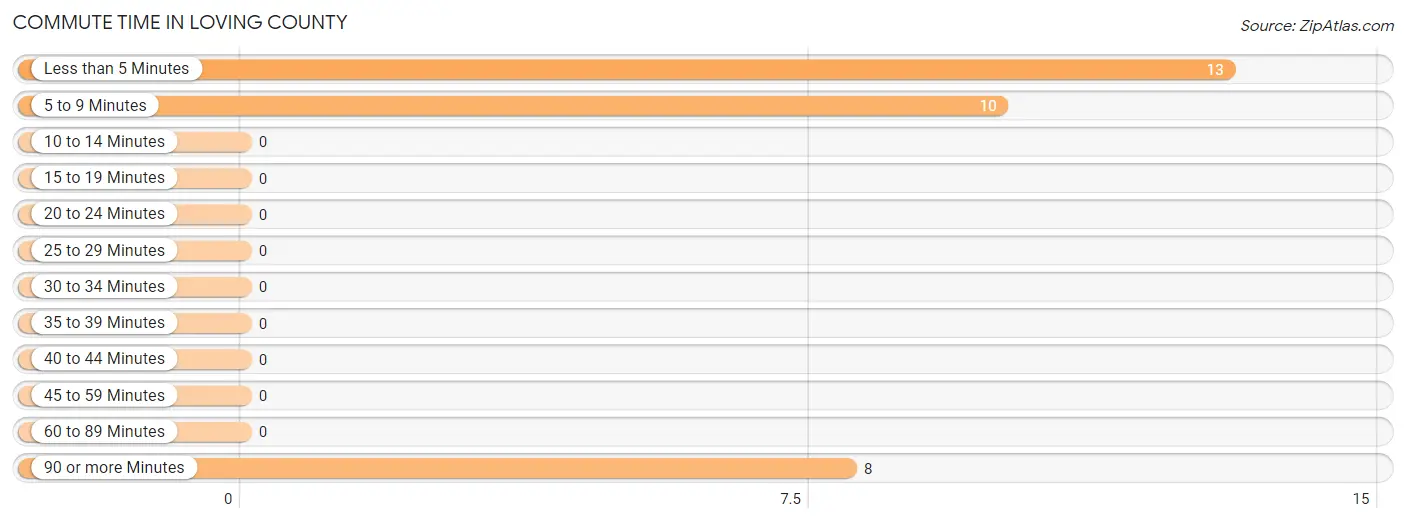
| Commute Time | # Commuters | % Commuters |
| Less than 5 Minutes | 13 | 41.9% |
| 5 to 9 Minutes | 10 | 32.3% |
| 10 to 14 Minutes | 0 | 0.0% |
| 15 to 19 Minutes | 0 | 0.0% |
| 20 to 24 Minutes | 0 | 0.0% |
| 25 to 29 Minutes | 0 | 0.0% |
| 30 to 34 Minutes | 0 | 0.0% |
| 35 to 39 Minutes | 0 | 0.0% |
| 40 to 44 Minutes | 0 | 0.0% |
| 45 to 59 Minutes | 0 | 0.0% |
| 60 to 89 Minutes | 0 | 0.0% |
| 90 or more Minutes | 8 | 25.8% |
Commute Time by Sex in Loving County
The most common commute times in Loving County are less than 5 minutes (13 commuters, 50.0%) for males and 5 to 9 minutes (5 commuters, 100.0%) for females.
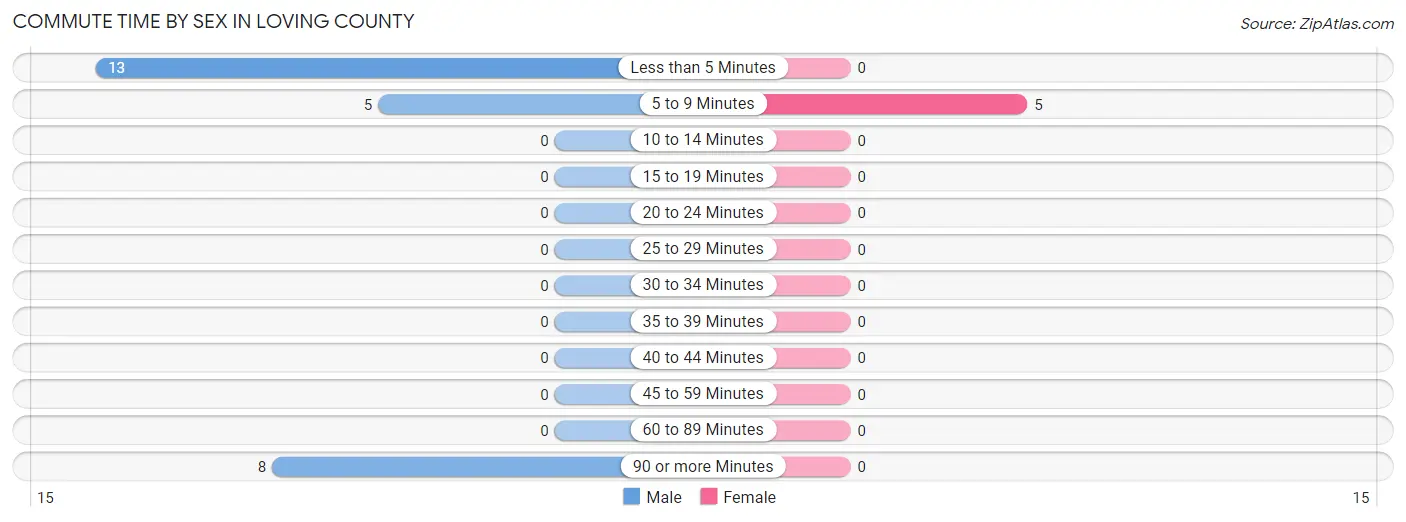
| Commute Time | Male | Female |
| Less than 5 Minutes | 13 (50.0%) | 0 (0.0%) |
| 5 to 9 Minutes | 5 (19.2%) | 5 (100.0%) |
| 10 to 14 Minutes | 0 (0.0%) | 0 (0.0%) |
| 15 to 19 Minutes | 0 (0.0%) | 0 (0.0%) |
| 20 to 24 Minutes | 0 (0.0%) | 0 (0.0%) |
| 25 to 29 Minutes | 0 (0.0%) | 0 (0.0%) |
| 30 to 34 Minutes | 0 (0.0%) | 0 (0.0%) |
| 35 to 39 Minutes | 0 (0.0%) | 0 (0.0%) |
| 40 to 44 Minutes | 0 (0.0%) | 0 (0.0%) |
| 45 to 59 Minutes | 0 (0.0%) | 0 (0.0%) |
| 60 to 89 Minutes | 0 (0.0%) | 0 (0.0%) |
| 90 or more Minutes | 8 (30.8%) | 0 (0.0%) |
Time of Departure to Work by Sex in Loving County
The most frequent times of departure to work in Loving County are 8:30 AM to 8:59 AM (11, 42.3%) for males and 8:00 AM to 8:29 AM (3, 60.0%) for females.
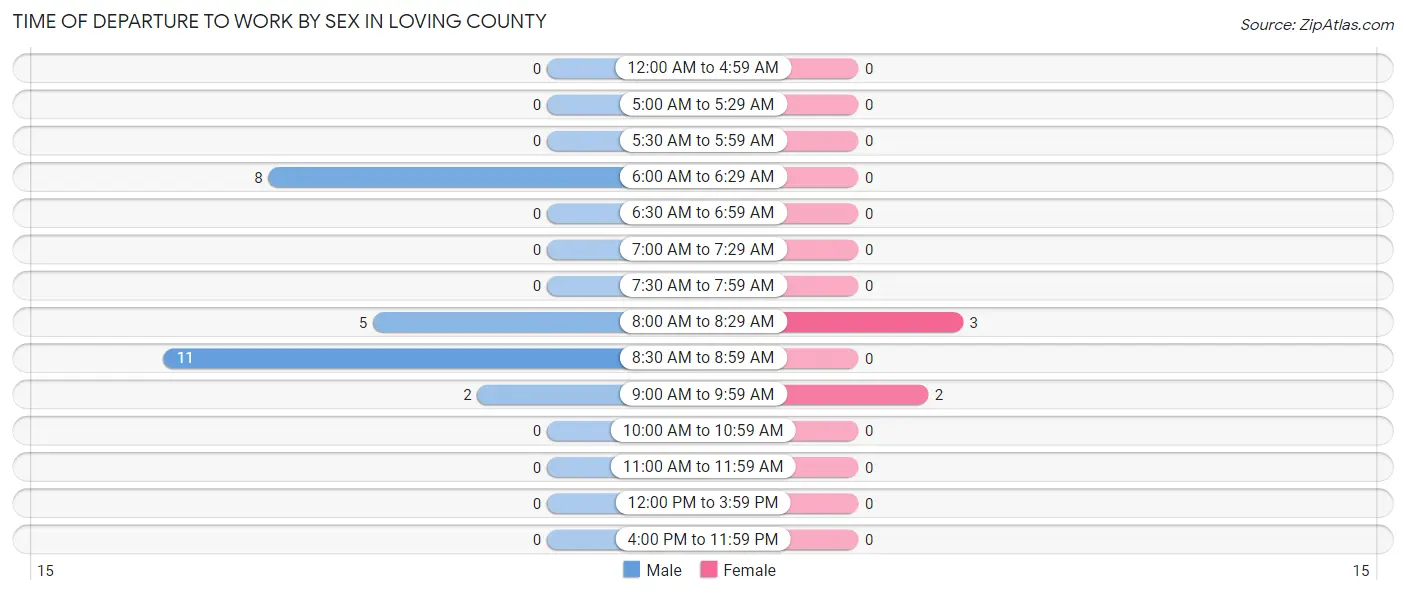
| Time of Departure | Male | Female |
| 12:00 AM to 4:59 AM | 0 (0.0%) | 0 (0.0%) |
| 5:00 AM to 5:29 AM | 0 (0.0%) | 0 (0.0%) |
| 5:30 AM to 5:59 AM | 0 (0.0%) | 0 (0.0%) |
| 6:00 AM to 6:29 AM | 8 (30.8%) | 0 (0.0%) |
| 6:30 AM to 6:59 AM | 0 (0.0%) | 0 (0.0%) |
| 7:00 AM to 7:29 AM | 0 (0.0%) | 0 (0.0%) |
| 7:30 AM to 7:59 AM | 0 (0.0%) | 0 (0.0%) |
| 8:00 AM to 8:29 AM | 5 (19.2%) | 3 (60.0%) |
| 8:30 AM to 8:59 AM | 11 (42.3%) | 0 (0.0%) |
| 9:00 AM to 9:59 AM | 2 (7.7%) | 2 (40.0%) |
| 10:00 AM to 10:59 AM | 0 (0.0%) | 0 (0.0%) |
| 11:00 AM to 11:59 AM | 0 (0.0%) | 0 (0.0%) |
| 12:00 PM to 3:59 PM | 0 (0.0%) | 0 (0.0%) |
| 4:00 PM to 11:59 PM | 0 (0.0%) | 0 (0.0%) |
| Total | 26 (100.0%) | 5 (100.0%) |
Housing Occupancy in Loving County
Occupancy by Ownership in Loving County
Of the total 40 dwellings in Loving County, owner-occupied units account for 12 (30.0%), while renter-occupied units make up 28 (70.0%).
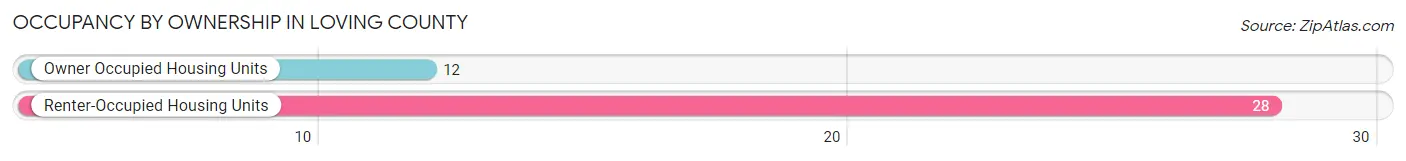
| Occupancy | # Housing Units | % Housing Units |
| Owner Occupied Housing Units | 12 | 30.0% |
| Renter-Occupied Housing Units | 28 | 70.0% |
| Total Occupied Housing Units | 40 | 100.0% |
Occupancy by Household Size in Loving County
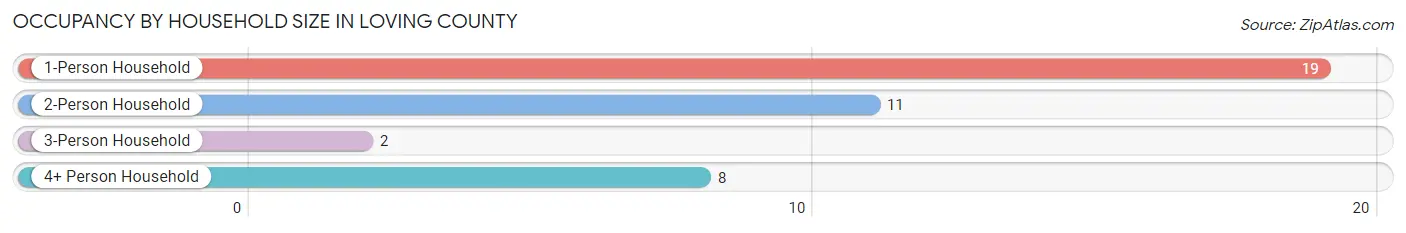
| Household Size | # Housing Units | % Housing Units |
| 1-Person Household | 19 | 47.5% |
| 2-Person Household | 11 | 27.5% |
| 3-Person Household | 2 | 5.0% |
| 4+ Person Household | 8 | 20.0% |
| Total Housing Units | 40 | 100.0% |
Occupancy by Ownership by Household Size in Loving County
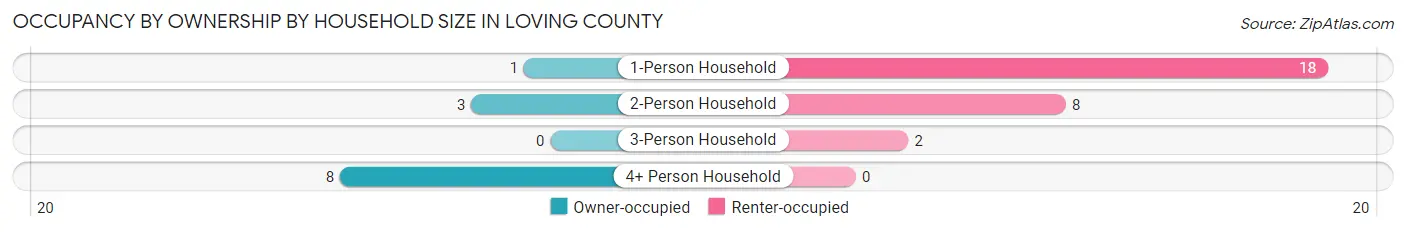
| Household Size | Owner-occupied | Renter-occupied |
| 1-Person Household | 1 (5.3%) | 18 (94.7%) |
| 2-Person Household | 3 (27.3%) | 8 (72.7%) |
| 3-Person Household | 0 (0.0%) | 2 (100.0%) |
| 4+ Person Household | 8 (100.0%) | 0 (0.0%) |
| Total Housing Units | 12 (30.0%) | 28 (70.0%) |
Occupancy by Educational Attainment in Loving County
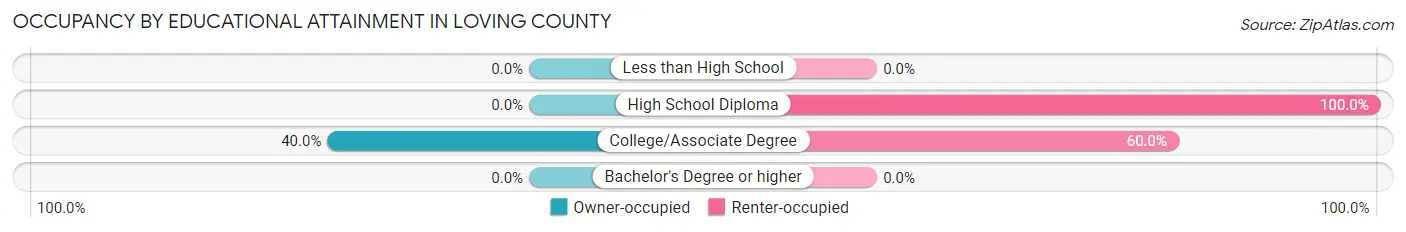
| Household Size | Owner-occupied | Renter-occupied |
| Less than High School | 0 (0.0%) | 0 (0.0%) |
| High School Diploma | 0 (0.0%) | 10 (100.0%) |
| College/Associate Degree | 12 (40.0%) | 18 (60.0%) |
| Bachelor's Degree or higher | 0 (0.0%) | 0 (0.0%) |
Occupancy by Age of Householder in Loving County
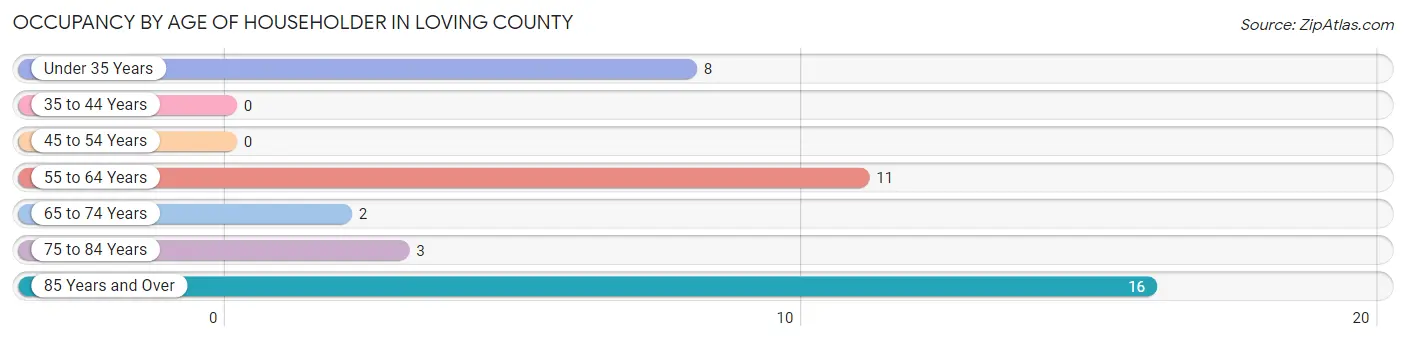
| Age Bracket | # Households | % Households |
| Under 35 Years | 8 | 20.0% |
| 35 to 44 Years | 0 | 0.0% |
| 45 to 54 Years | 0 | 0.0% |
| 55 to 64 Years | 11 | 27.5% |
| 65 to 74 Years | 2 | 5.0% |
| 75 to 84 Years | 3 | 7.5% |
| 85 Years and Over | 16 | 40.0% |
| Total | 40 | 100.0% |
Housing Finances in Loving County
Median Income by Occupancy in Loving County
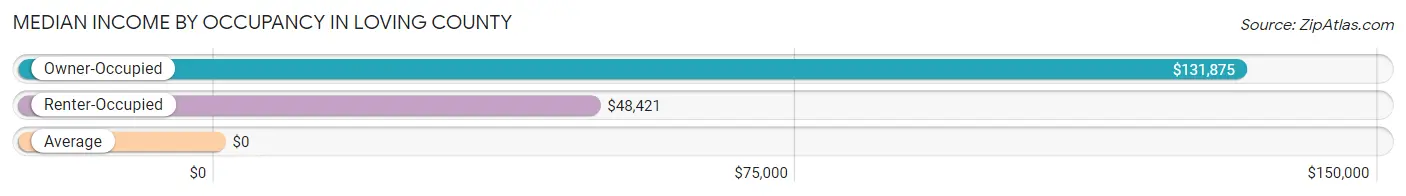
| Occupancy Type | # Households | Median Income |
| Owner-Occupied | 12 (30.0%) | $131,875 |
| Renter-Occupied | 28 (70.0%) | $48,421 |
| Average | 40 (100.0%) | $0 |
Occupancy by Householder Income Bracket in Loving County
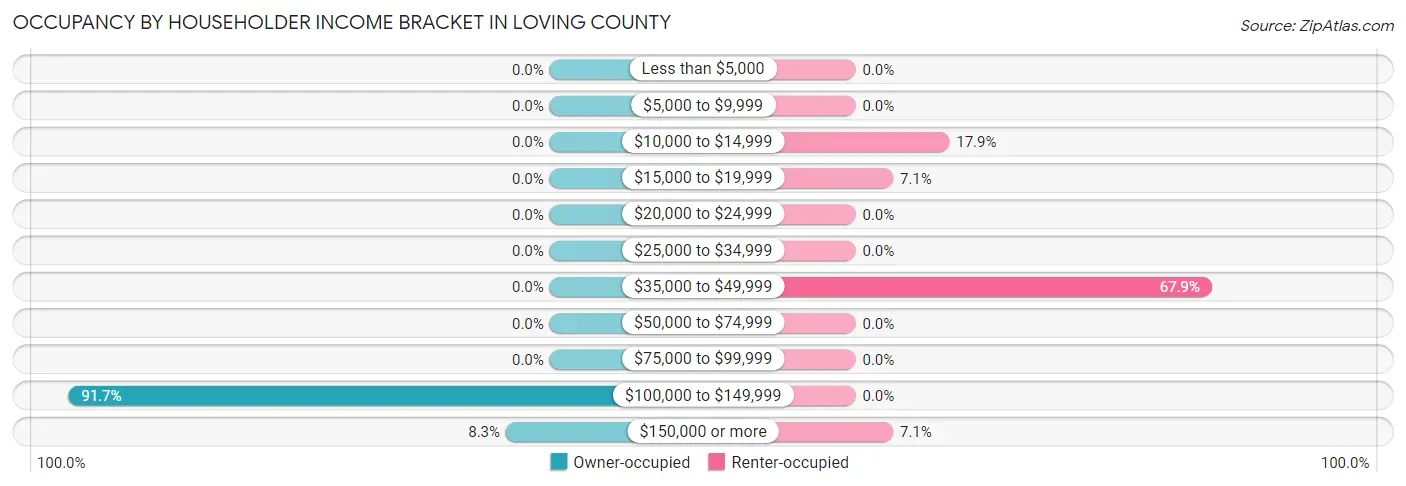
| Income Bracket | Owner-occupied | Renter-occupied |
| Less than $5,000 | 0 (0.0%) | 0 (0.0%) |
| $5,000 to $9,999 | 0 (0.0%) | 0 (0.0%) |
| $10,000 to $14,999 | 0 (0.0%) | 5 (17.9%) |
| $15,000 to $19,999 | 0 (0.0%) | 2 (7.1%) |
| $20,000 to $24,999 | 0 (0.0%) | 0 (0.0%) |
| $25,000 to $34,999 | 0 (0.0%) | 0 (0.0%) |
| $35,000 to $49,999 | 0 (0.0%) | 19 (67.9%) |
| $50,000 to $74,999 | 0 (0.0%) | 0 (0.0%) |
| $75,000 to $99,999 | 0 (0.0%) | 0 (0.0%) |
| $100,000 to $149,999 | 11 (91.7%) | 0 (0.0%) |
| $150,000 or more | 1 (8.3%) | 2 (7.1%) |
| Total | 12 (100.0%) | 28 (100.0%) |
Monthly Housing Cost Tiers in Loving County
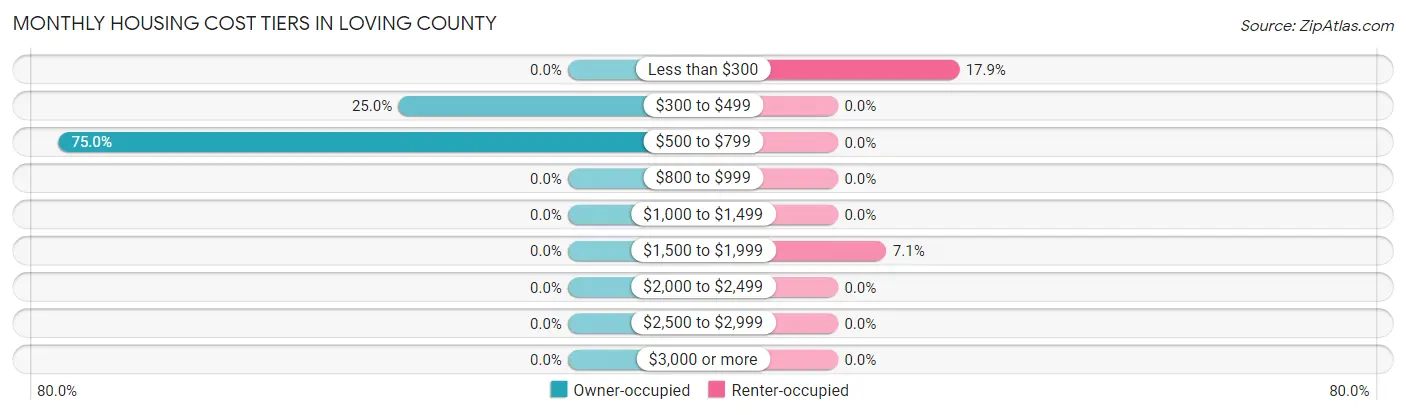
| Monthly Cost | Owner-occupied | Renter-occupied |
| Less than $300 | 0 (0.0%) | 5 (17.9%) |
| $300 to $499 | 3 (25.0%) | 0 (0.0%) |
| $500 to $799 | 9 (75.0%) | 0 (0.0%) |
| $800 to $999 | 0 (0.0%) | 0 (0.0%) |
| $1,000 to $1,499 | 0 (0.0%) | 0 (0.0%) |
| $1,500 to $1,999 | 0 (0.0%) | 2 (7.1%) |
| $2,000 to $2,499 | 0 (0.0%) | 0 (0.0%) |
| $2,500 to $2,999 | 0 (0.0%) | 0 (0.0%) |
| $3,000 or more | 0 (0.0%) | 0 (0.0%) |
| Total | 12 (100.0%) | 28 (100.0%) |
Physical Housing Characteristics in Loving County
Housing Structures in Loving County
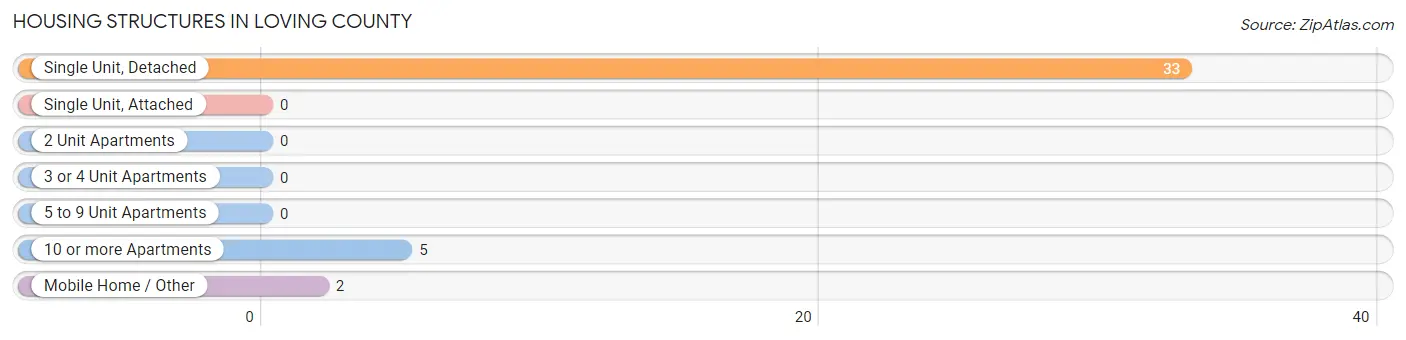
| Structure Type | # Housing Units | % Housing Units |
| Single Unit, Detached | 33 | 82.5% |
| Single Unit, Attached | 0 | 0.0% |
| 2 Unit Apartments | 0 | 0.0% |
| 3 or 4 Unit Apartments | 0 | 0.0% |
| 5 to 9 Unit Apartments | 0 | 0.0% |
| 10 or more Apartments | 5 | 12.5% |
| Mobile Home / Other | 2 | 5.0% |
| Total | 40 | 100.0% |
Housing Structures by Occupancy in Loving County
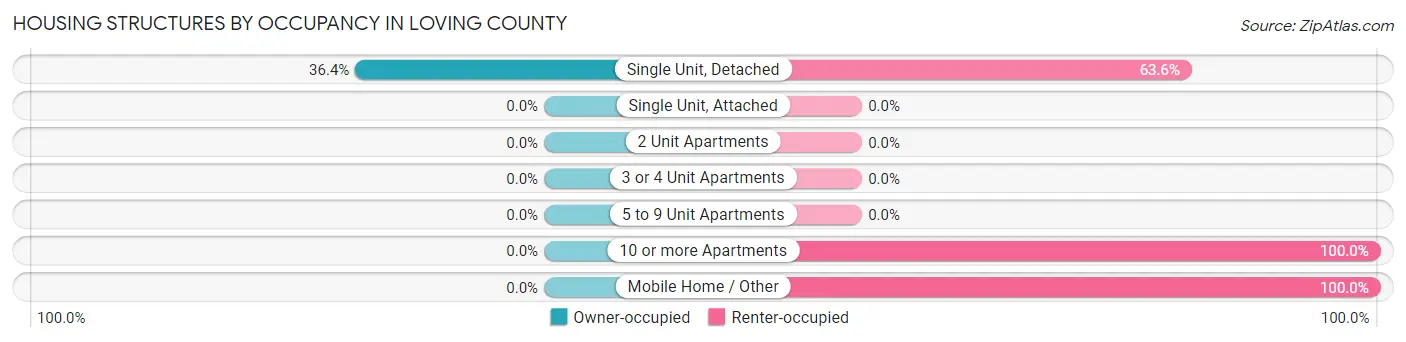
| Structure Type | Owner-occupied | Renter-occupied |
| Single Unit, Detached | 12 (36.4%) | 21 (63.6%) |
| Single Unit, Attached | 0 (0.0%) | 0 (0.0%) |
| 2 Unit Apartments | 0 (0.0%) | 0 (0.0%) |
| 3 or 4 Unit Apartments | 0 (0.0%) | 0 (0.0%) |
| 5 to 9 Unit Apartments | 0 (0.0%) | 0 (0.0%) |
| 10 or more Apartments | 0 (0.0%) | 5 (100.0%) |
| Mobile Home / Other | 0 (0.0%) | 2 (100.0%) |
| Total | 12 (30.0%) | 28 (70.0%) |
Housing Structures by Number of Rooms in Loving County
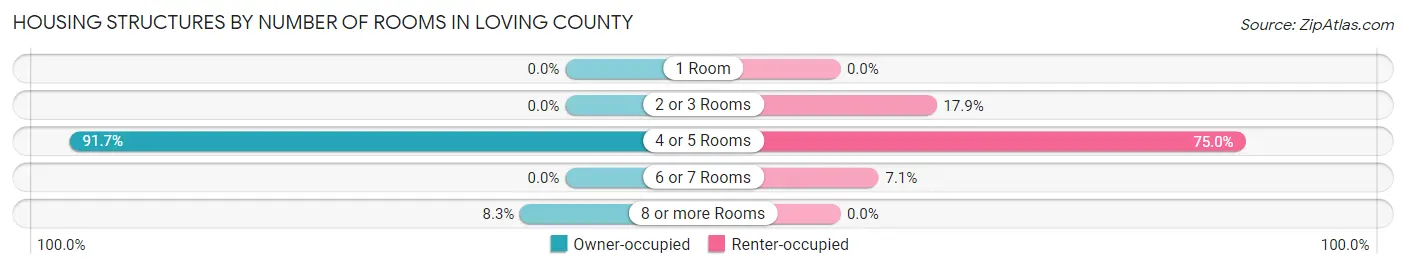
| Number of Rooms | Owner-occupied | Renter-occupied |
| 1 Room | 0 (0.0%) | 0 (0.0%) |
| 2 or 3 Rooms | 0 (0.0%) | 5 (17.9%) |
| 4 or 5 Rooms | 11 (91.7%) | 21 (75.0%) |
| 6 or 7 Rooms | 0 (0.0%) | 2 (7.1%) |
| 8 or more Rooms | 1 (8.3%) | 0 (0.0%) |
| Total | 12 (100.0%) | 28 (100.0%) |
Housing Structure by Heating Type in Loving County
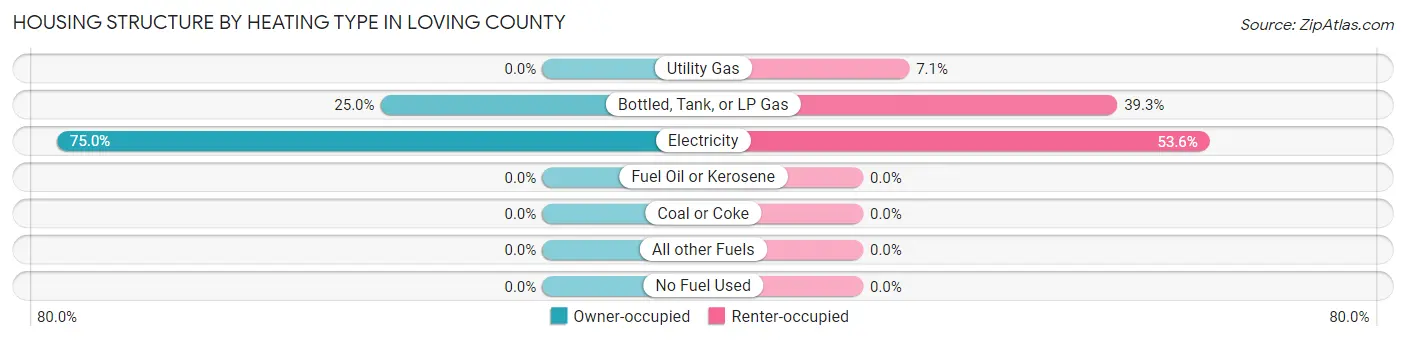
| Heating Type | Owner-occupied | Renter-occupied |
| Utility Gas | 0 (0.0%) | 2 (7.1%) |
| Bottled, Tank, or LP Gas | 3 (25.0%) | 11 (39.3%) |
| Electricity | 9 (75.0%) | 15 (53.6%) |
| Fuel Oil or Kerosene | 0 (0.0%) | 0 (0.0%) |
| Coal or Coke | 0 (0.0%) | 0 (0.0%) |
| All other Fuels | 0 (0.0%) | 0 (0.0%) |
| No Fuel Used | 0 (0.0%) | 0 (0.0%) |
| Total | 12 (100.0%) | 28 (100.0%) |
Household Vehicle Usage in Loving County
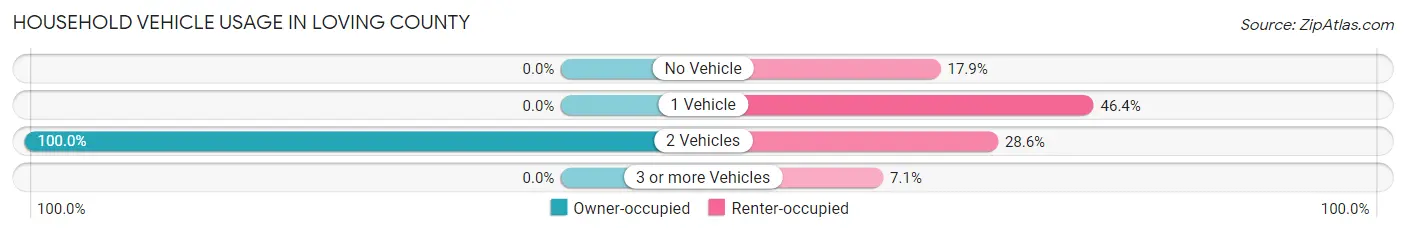
| Vehicles per Household | Owner-occupied | Renter-occupied |
| No Vehicle | 0 (0.0%) | 5 (17.9%) |
| 1 Vehicle | 0 (0.0%) | 13 (46.4%) |
| 2 Vehicles | 12 (100.0%) | 8 (28.6%) |
| 3 or more Vehicles | 0 (0.0%) | 2 (7.1%) |
| Total | 12 (100.0%) | 28 (100.0%) |
Real Estate & Mortgages in Loving County
Real Estate and Mortgage Overview in Loving County
| Characteristic | Without Mortgage | With Mortgage |
| Housing Units | 12 | 0 |
| Median Property Value | $218,800 | $0 |
| Median Household Income | $131,875 | $0 |
| Monthly Housing Costs | $533 | $0 |
| Real Estate Taxes | - | - |
Property Value by Mortgage Status in Loving County
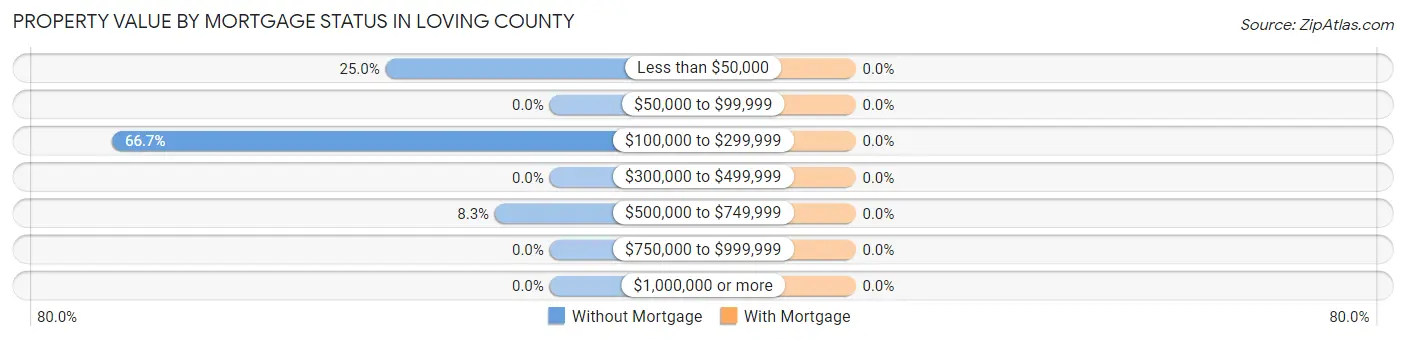
| Property Value | Without Mortgage | With Mortgage |
| Less than $50,000 | 3 (25.0%) | 0 (0.0%) |
| $50,000 to $99,999 | 0 (0.0%) | 0 (0.0%) |
| $100,000 to $299,999 | 8 (66.7%) | 0 (0.0%) |
| $300,000 to $499,999 | 0 (0.0%) | 0 (0.0%) |
| $500,000 to $749,999 | 1 (8.3%) | 0 (0.0%) |
| $750,000 to $999,999 | 0 (0.0%) | 0 (0.0%) |
| $1,000,000 or more | 0 (0.0%) | 0 (0.0%) |
| Total | 12 (100.0%) | 0 (0.0%) |
Household Income by Mortgage Status in Loving County
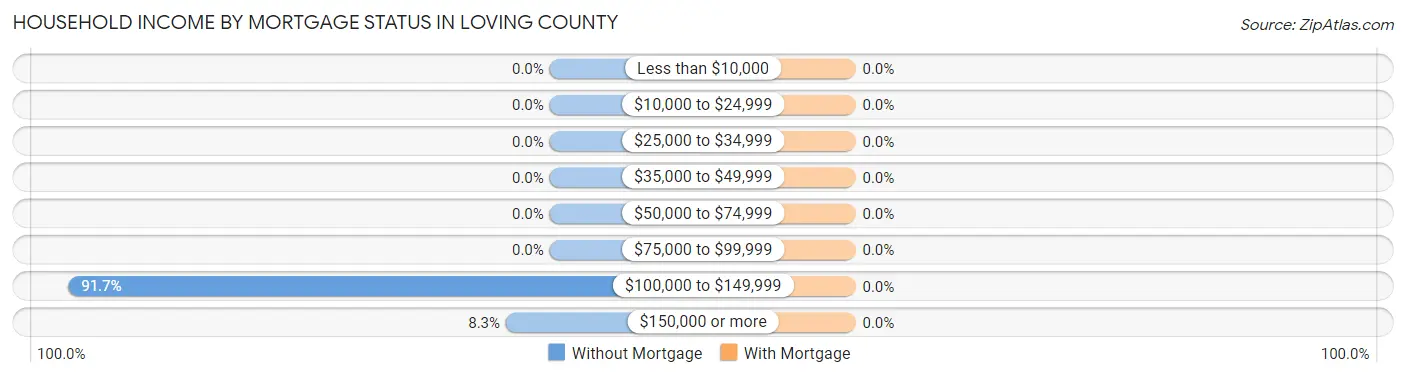
| Household Income | Without Mortgage | With Mortgage |
| Less than $10,000 | 0 (0.0%) | 0 (0.0%) |
| $10,000 to $24,999 | 0 (0.0%) | 0 (0.0%) |
| $25,000 to $34,999 | 0 (0.0%) | 0 (0.0%) |
| $35,000 to $49,999 | 0 (0.0%) | 0 (0.0%) |
| $50,000 to $74,999 | 0 (0.0%) | 0 (0.0%) |
| $75,000 to $99,999 | 0 (0.0%) | 0 (0.0%) |
| $100,000 to $149,999 | 11 (91.7%) | 0 (0.0%) |
| $150,000 or more | 1 (8.3%) | 0 (0.0%) |
| Total | 12 (100.0%) | 0 (0.0%) |
Property Value to Household Income Ratio in Loving County
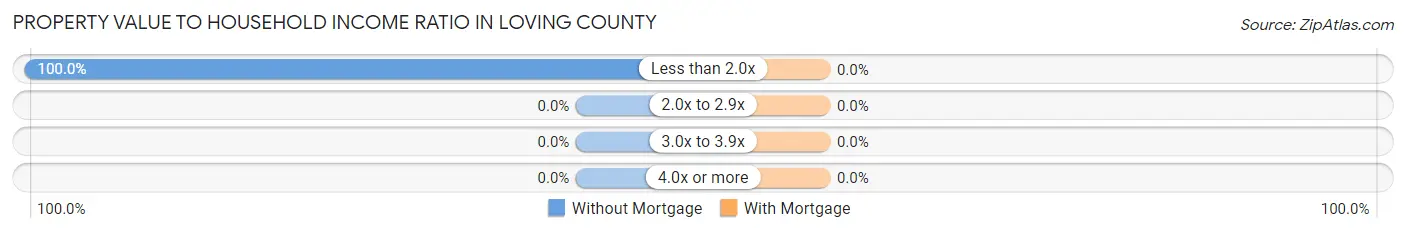
| Value-to-Income Ratio | Without Mortgage | With Mortgage |
| Less than 2.0x | 12 (100.0%) | 0 (0.0%) |
| 2.0x to 2.9x | 0 (0.0%) | 0 (0.0%) |
| 3.0x to 3.9x | 0 (0.0%) | 0 (0.0%) |
| 4.0x or more | 0 (0.0%) | 0 (0.0%) |
| Total | 12 (100.0%) | 0 (0.0%) |
Real Estate Taxes by Mortgage Status in Loving County
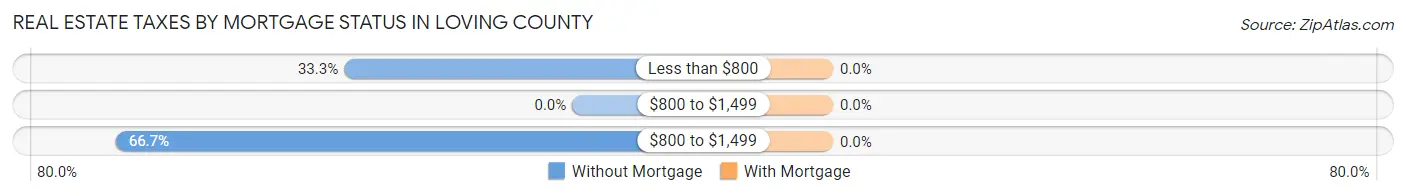
| Property Taxes | Without Mortgage | With Mortgage |
| Less than $800 | 4 (33.3%) | 0 (0.0%) |
| $800 to $1,499 | 0 (0.0%) | 0 (0.0%) |
| $800 to $1,499 | 8 (66.7%) | 0 (0.0%) |
| Total | 12 (100.0%) | 0 (0.0%) |
Health & Disability in Loving County
Health Insurance Coverage by Age in Loving County
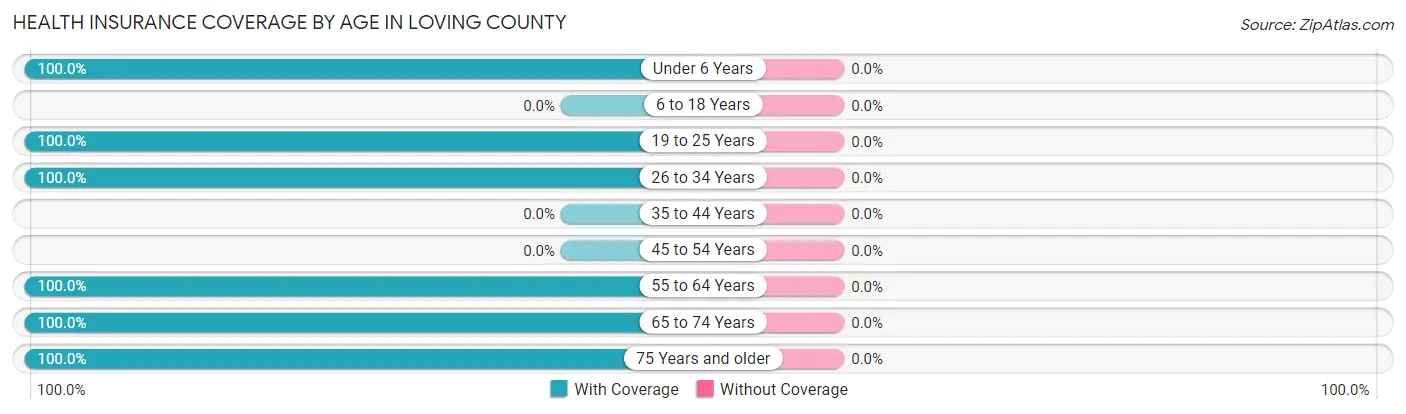
| Age Bracket | With Coverage | Without Coverage |
| Under 6 Years | 28 (100.0%) | 0 (0.0%) |
| 6 to 18 Years | 0 (0.0%) | 0 (0.0%) |
| 19 to 25 Years | 5 (100.0%) | 0 (0.0%) |
| 26 to 34 Years | 16 (100.0%) | 0 (0.0%) |
| 35 to 44 Years | 0 (0.0%) | 0 (0.0%) |
| 45 to 54 Years | 0 (0.0%) | 0 (0.0%) |
| 55 to 64 Years | 13 (100.0%) | 0 (0.0%) |
| 65 to 74 Years | 15 (100.0%) | 0 (0.0%) |
| 75 Years and older | 19 (100.0%) | 0 (0.0%) |
| Total | 96 (100.0%) | 0 (0.0%) |
Health Insurance Coverage by Citizenship Status in Loving County
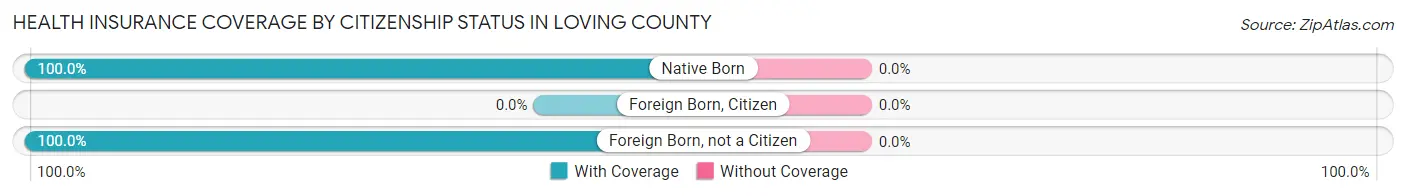
| Citizenship Status | With Coverage | Without Coverage |
| Native Born | 28 (100.0%) | 0 (0.0%) |
| Foreign Born, Citizen | 0 (0.0%) | 0 (0.0%) |
| Foreign Born, not a Citizen | 5 (100.0%) | 0 (0.0%) |
Health Insurance Coverage by Household Income in Loving County
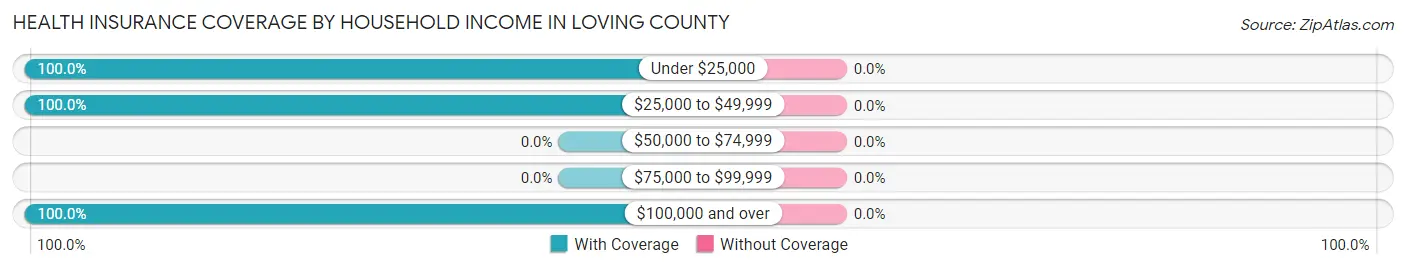
| Household Income | With Coverage | Without Coverage |
| Under $25,000 | 7 (100.0%) | 0 (0.0%) |
| $25,000 to $49,999 | 30 (100.0%) | 0 (0.0%) |
| $50,000 to $74,999 | 0 (0.0%) | 0 (0.0%) |
| $75,000 to $99,999 | 0 (0.0%) | 0 (0.0%) |
| $100,000 and over | 59 (100.0%) | 0 (0.0%) |
Public vs Private Health Insurance Coverage by Age in Loving County
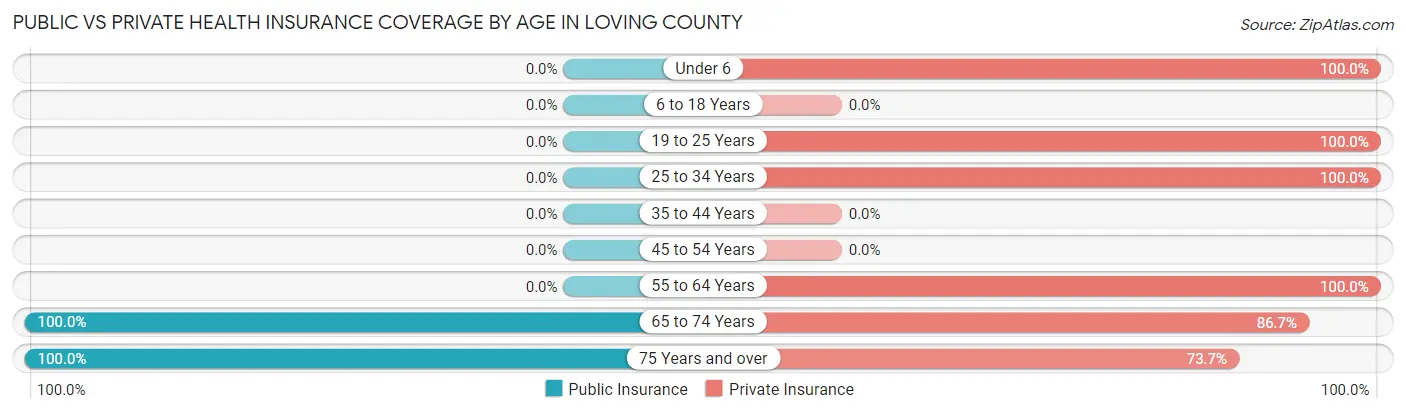
| Age Bracket | Public Insurance | Private Insurance |
| Under 6 | 0 (0.0%) | 28 (100.0%) |
| 6 to 18 Years | 0 (0.0%) | 0 (0.0%) |
| 19 to 25 Years | 0 (0.0%) | 5 (100.0%) |
| 25 to 34 Years | 0 (0.0%) | 16 (100.0%) |
| 35 to 44 Years | 0 (0.0%) | 0 (0.0%) |
| 45 to 54 Years | 0 (0.0%) | 0 (0.0%) |
| 55 to 64 Years | 0 (0.0%) | 13 (100.0%) |
| 65 to 74 Years | 15 (100.0%) | 13 (86.7%) |
| 75 Years and over | 19 (100.0%) | 14 (73.7%) |
| Total | 34 (35.4%) | 89 (92.7%) |
Disability Status by Sex by Age in Loving County
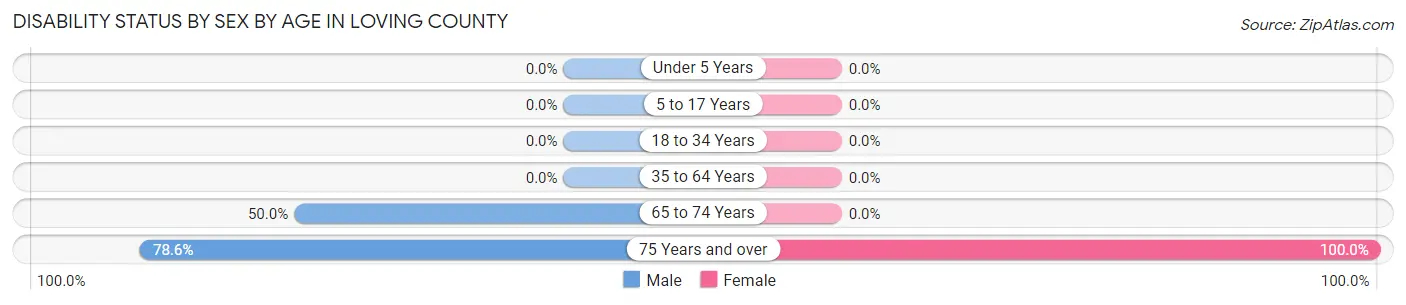
| Age Bracket | Male | Female |
| Under 5 Years | 0 (0.0%) | 0 (0.0%) |
| 5 to 17 Years | 0 (0.0%) | 0 (0.0%) |
| 18 to 34 Years | 0 (0.0%) | 0 (0.0%) |
| 35 to 64 Years | 0 (0.0%) | 0 (0.0%) |
| 65 to 74 Years | 2 (50.0%) | 0 (0.0%) |
| 75 Years and over | 11 (78.6%) | 5 (100.0%) |
Disability Class by Sex by Age in Loving County
Disability Class: Hearing Difficulty
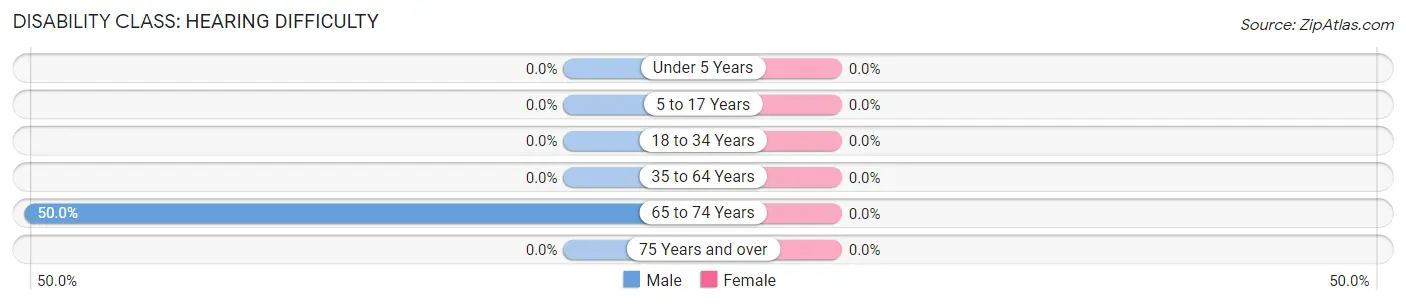
| Age Bracket | Male | Female |
| Under 5 Years | 0 (0.0%) | 0 (0.0%) |
| 5 to 17 Years | 0 (0.0%) | 0 (0.0%) |
| 18 to 34 Years | 0 (0.0%) | 0 (0.0%) |
| 35 to 64 Years | 0 (0.0%) | 0 (0.0%) |
| 65 to 74 Years | 2 (50.0%) | 0 (0.0%) |
| 75 Years and over | 0 (0.0%) | 0 (0.0%) |
Disability Class: Vision Difficulty
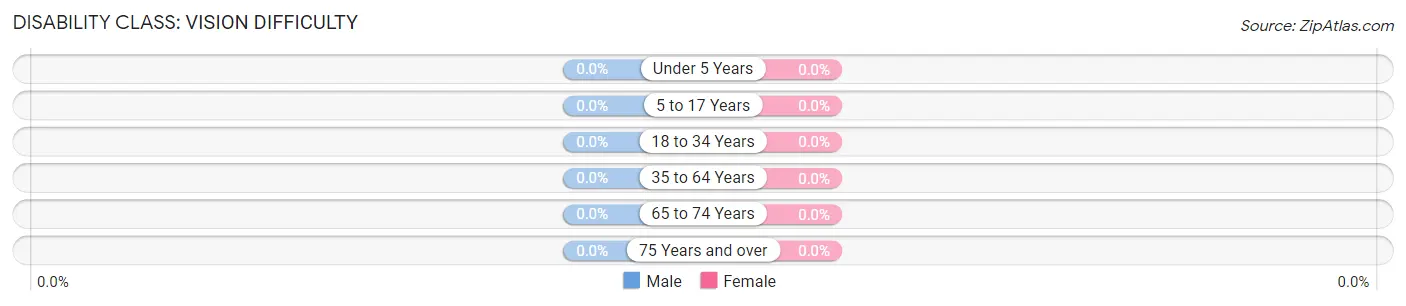
| Age Bracket | Male | Female |
| Under 5 Years | 0 (0.0%) | 0 (0.0%) |
| 5 to 17 Years | 0 (0.0%) | 0 (0.0%) |
| 18 to 34 Years | 0 (0.0%) | 0 (0.0%) |
| 35 to 64 Years | 0 (0.0%) | 0 (0.0%) |
| 65 to 74 Years | 0 (0.0%) | 0 (0.0%) |
| 75 Years and over | 0 (0.0%) | 0 (0.0%) |
Disability Class: Cognitive Difficulty
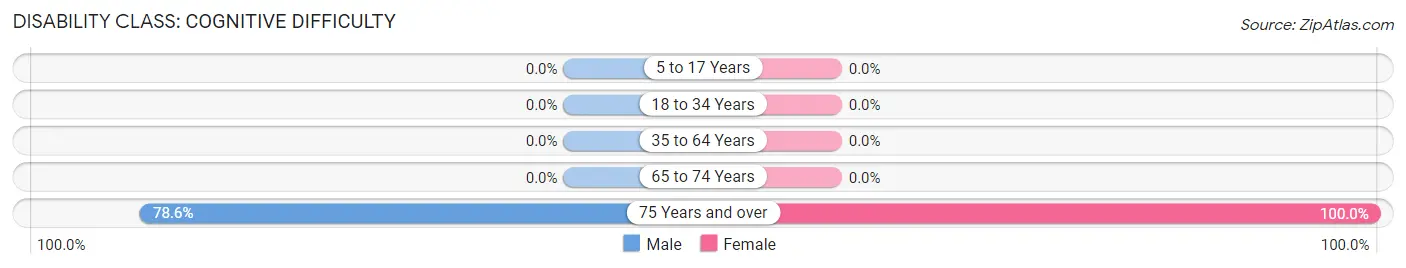
| Age Bracket | Male | Female |
| 5 to 17 Years | 0 (0.0%) | 0 (0.0%) |
| 18 to 34 Years | 0 (0.0%) | 0 (0.0%) |
| 35 to 64 Years | 0 (0.0%) | 0 (0.0%) |
| 65 to 74 Years | 0 (0.0%) | 0 (0.0%) |
| 75 Years and over | 11 (78.6%) | 5 (100.0%) |
Disability Class: Ambulatory Difficulty
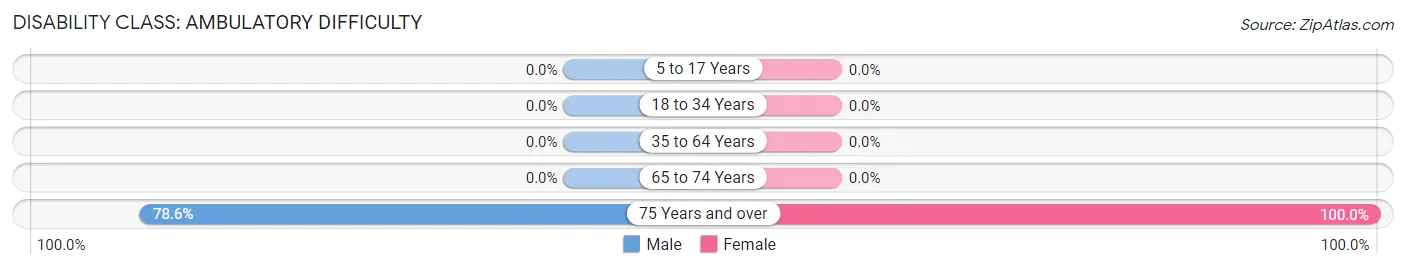
| Age Bracket | Male | Female |
| 5 to 17 Years | 0 (0.0%) | 0 (0.0%) |
| 18 to 34 Years | 0 (0.0%) | 0 (0.0%) |
| 35 to 64 Years | 0 (0.0%) | 0 (0.0%) |
| 65 to 74 Years | 0 (0.0%) | 0 (0.0%) |
| 75 Years and over | 11 (78.6%) | 5 (100.0%) |
Disability Class: Self-Care Difficulty
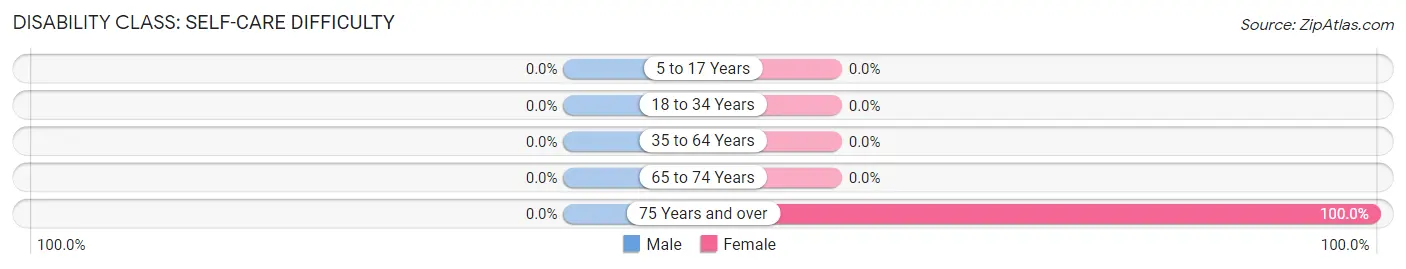
| Age Bracket | Male | Female |
| 5 to 17 Years | 0 (0.0%) | 0 (0.0%) |
| 18 to 34 Years | 0 (0.0%) | 0 (0.0%) |
| 35 to 64 Years | 0 (0.0%) | 0 (0.0%) |
| 65 to 74 Years | 0 (0.0%) | 0 (0.0%) |
| 75 Years and over | 0 (0.0%) | 5 (100.0%) |
Technology Access in Loving County
Computing Device Access in Loving County
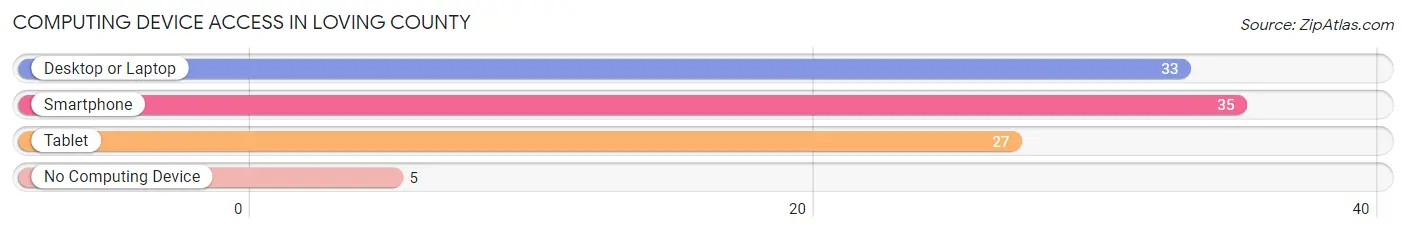
| Device Type | # Households | % Households |
| Desktop or Laptop | 33 | 82.5% |
| Smartphone | 35 | 87.5% |
| Tablet | 27 | 67.5% |
| No Computing Device | 5 | 12.5% |
| Total | 40 | 100.0% |
Internet Access in Loving County
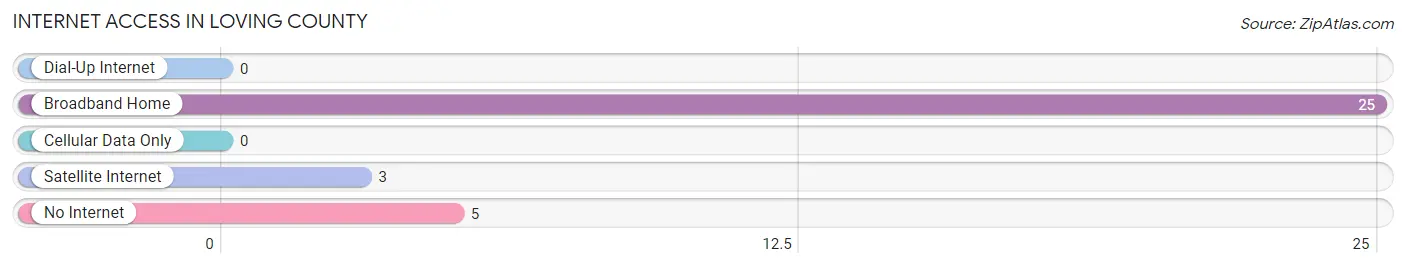
| Internet Type | # Households | % Households |
| Dial-Up Internet | 0 | 0.0% |
| Broadband Home | 25 | 62.5% |
| Cellular Data Only | 0 | 0.0% |
| Satellite Internet | 3 | 7.5% |
| No Internet | 5 | 12.5% |
| Total | 40 | 100.0% |
Loving County Summary
Loving County is a county located in the U.S. state of Texas. As of the 2010 census, the population was 82, making it the least populous county in the United States. It is the only county in the United States without a municipality. Its county seat is Mentone. The county was created in 1887 and organized in 1931. It is named for Oliver Loving, a cattle rancher and pioneer of the cattle drive who was the subject of the 1959 novel and 1967 film, "Lonesome Dove".
Geography
Loving County is located in the western part of the state of Texas. It is bordered by Reeves County to the north, Ward County to the east, Winkler County to the south, and Culberson County to the west. The county covers an area of 677 square miles, making it the second-smallest county in Texas. The terrain is mostly flat, with some rolling hills in the northern part of the county. The Pecos River forms the western boundary of the county.
The climate of Loving County is semi-arid, with hot summers and mild winters. The average annual temperature is 68°F, and the average annual precipitation is 14.5 inches.
Demographics
As of the 2010 census, there were 82 people living in Loving County. The population density was 0.1 people per square mile. The racial makeup of the county was 95.1% White, 0.0% African American, 0.0% Native American, 0.0% Asian, 0.0% Pacific Islander, 0.0% from other races, and 4.9% from two or more races. Hispanic or Latino of any race were 4.9% of the population.
The median income for a household in the county was $25,000, and the median income for a family was $25,000. The per capita income for the county was $14,000. About 100% of families and 100% of the population were below the poverty line, including 100% of those under the age of 18 and 100% of those 65 and older.
Economy
Loving County is largely an agricultural economy, with cattle ranching and farming being the primary industries. Oil and gas production is also an important part of the economy. The county is home to several oil and gas fields, including the Pecos River Field, the Loving Field, and the Mentone Field.
The county is also home to several wind farms, including the Loving Wind Farm, the Mentone Wind Farm, and the Pecos Wind Farm. These wind farms generate electricity for the region and provide jobs for local residents.
The county also has a small tourism industry, with visitors coming to the area to hunt, fish, and explore the area's natural beauty.
Conclusion
Loving County is a small, rural county located in the western part of Texas. It is the least populous county in the United States, with a population of 82 as of the 2010 census. The county is largely an agricultural economy, with cattle ranching and farming being the primary industries. Oil and gas production is also an important part of the economy, and the county is home to several wind farms. The county also has a small tourism industry, with visitors coming to the area to hunt, fish, and explore the area's natural beauty.
Common Questions
What is Per Capita Income in Loving County?
Per Capita income in Loving County is $44,821.
What is the Median Family Income in Loving County?
Median Family Income in Loving County is $130,781.
What is Inequality or Gini Index in Loving County?
Inequality or Gini Index in Loving County is 0.53.
What is the Total Population of Loving County?
Total Population of Loving County is 96.
What is the Total Male Population of Loving County?
Total Male Population of Loving County is 51.
What is the Total Female Population of Loving County?
Total Female Population of Loving County is 45.
What is the Ratio of Males per 100 Females in Loving County?
There are 113.33 Males per 100 Females in Loving County.
What is the Ratio of Females per 100 Males in Loving County?
There are 88.24 Females per 100 Males in Loving County.
What is the Median Population Age in Loving County?
Median Population Age in Loving County is 31.9 Years.
What is the Average Family Size in Loving County
Average Family Size in Loving County is 3.7 People.
What is the Average Household Size in Loving County
Average Household Size in Loving County is 2.4 People.
How Large is the Labor Force in Loving County?
There are 39 People in the Labor Forcein in Loving County.
What is the Percentage of People in the Labor Force in Loving County?
57.4% of People are in the Labor Force in Loving County.