Jeff Davis County, TX Map & Demographics
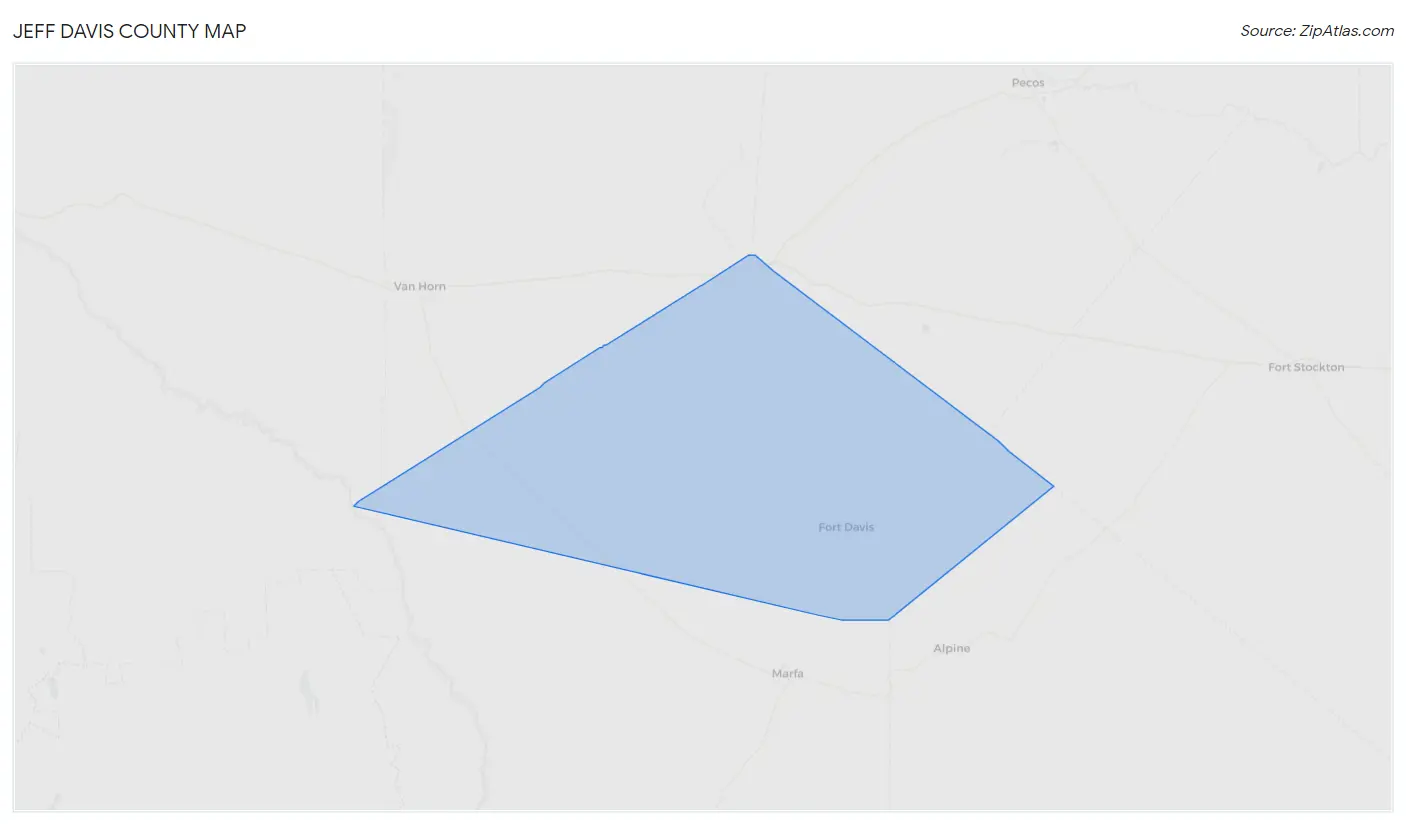
Jeff Davis County Map
Jeff Davis County Overview
$38,603
PER CAPITA INCOME
$66,806
AVG FAMILY INCOME
$38,125
AVG HOUSEHOLD INCOME
18.9%
WAGE / INCOME GAP [ % ]
81.1¢/ $1
WAGE / INCOME GAP [ $ ]
0.54
INEQUALITY / GINI INDEX
1,992
TOTAL POPULATION
1,106
MALE POPULATION
886
FEMALE POPULATION
124.83
MALES / 100 FEMALES
80.11
FEMALES / 100 MALES
62.0
MEDIAN AGE
2.4
AVG FAMILY SIZE
1.8
AVG HOUSEHOLD SIZE
748
LABOR FORCE [ PEOPLE ]
43.3%
PERCENT IN LABOR FORCE
Jeff Davis County Area Codes
Income in Jeff Davis County
Income Overview in Jeff Davis County
Per Capita Income in Jeff Davis County is $38,603, while median incomes of families and households are $66,806 and $38,125 respectively.
| Characteristic | Number | Measure |
| Per Capita Income | 1,992 | $38,603 |
| Median Family Income | 507 | $66,806 |
| Mean Family Income | 507 | $79,724 |
| Median Household Income | 1,095 | $38,125 |
| Mean Household Income | 1,095 | $71,740 |
| Income Deficit | 507 | $0 |
| Wage / Income Gap (%) | 1,992 | 18.91% |
| Wage / Income Gap ($) | 1,992 | 81.09¢ per $1 |
| Gini / Inequality Index | 1,992 | 0.54 |
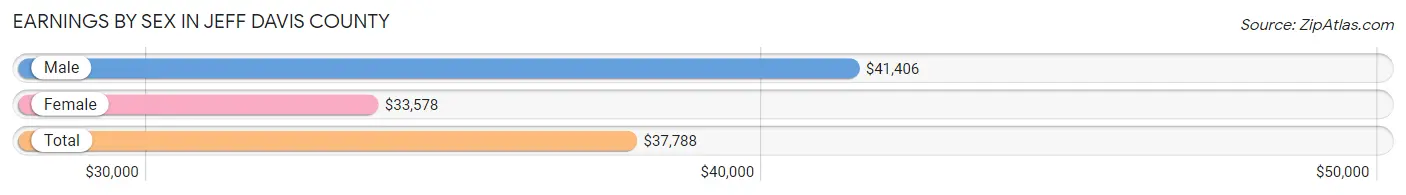
Earnings by Sex in Jeff Davis County
Average Earnings in Jeff Davis County are $37,788, $41,406 for men and $33,578 for women, a difference of 18.9%.
| Sex | Number | Average Earnings |
| Male | 502 (54.5%) | $41,406 |
| Female | 419 (45.5%) | $33,578 |
| Total | 921 (100.0%) | $37,788 |
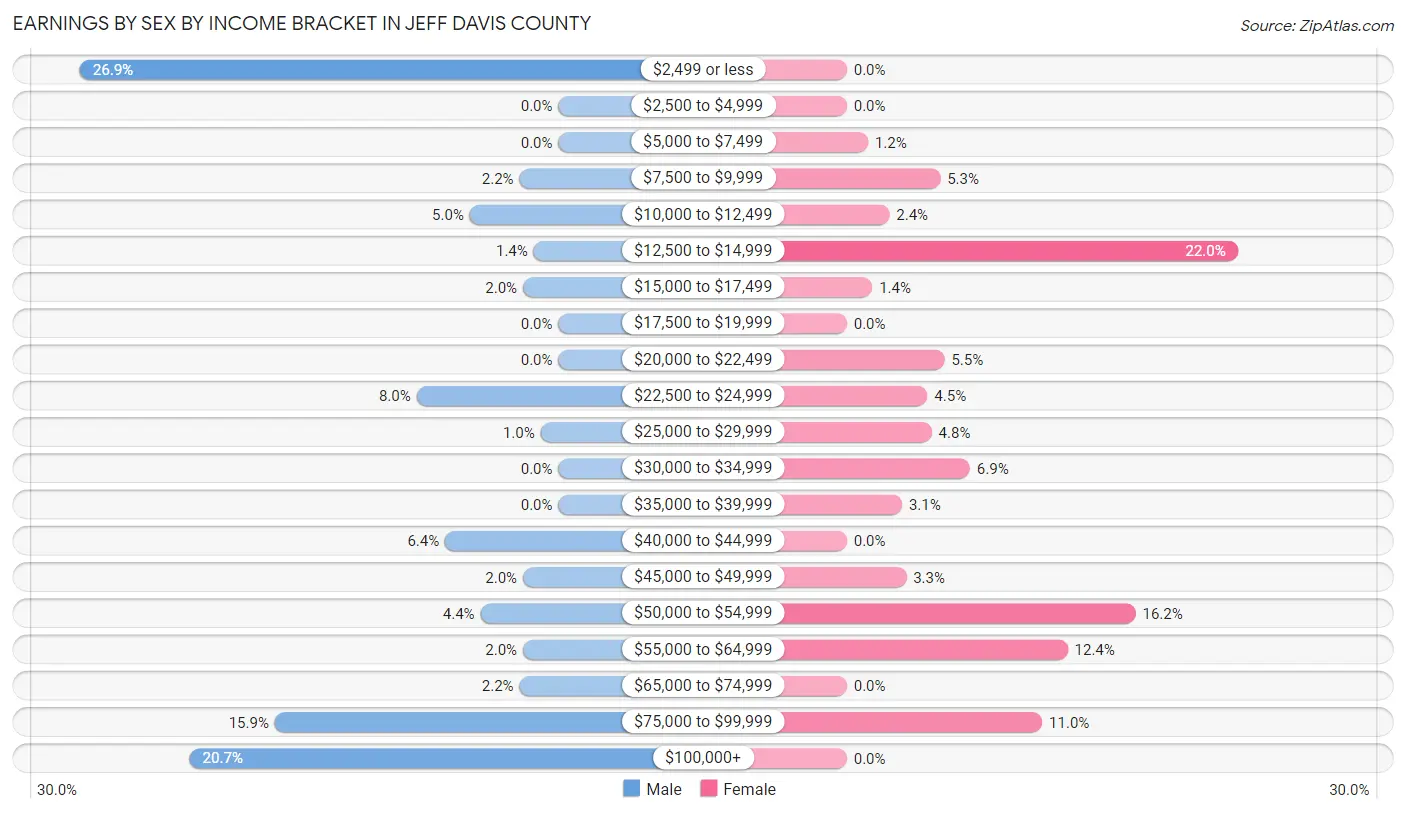
Earnings by Sex by Income Bracket in Jeff Davis County
The most common earnings brackets in Jeff Davis County are $2,499 or less for men (135 | 26.9%) and $12,500 to $14,999 for women (92 | 22.0%).
| Income | Male | Female |
| $2,499 or less | 135 (26.9%) | 0 (0.0%) |
| $2,500 to $4,999 | 0 (0.0%) | 0 (0.0%) |
| $5,000 to $7,499 | 0 (0.0%) | 5 (1.2%) |
| $7,500 to $9,999 | 11 (2.2%) | 22 (5.2%) |
| $10,000 to $12,499 | 25 (5.0%) | 10 (2.4%) |
| $12,500 to $14,999 | 7 (1.4%) | 92 (22.0%) |
| $15,000 to $17,499 | 10 (2.0%) | 6 (1.4%) |
| $17,500 to $19,999 | 0 (0.0%) | 0 (0.0%) |
| $20,000 to $22,499 | 0 (0.0%) | 23 (5.5%) |
| $22,500 to $24,999 | 40 (8.0%) | 19 (4.5%) |
| $25,000 to $29,999 | 5 (1.0%) | 20 (4.8%) |
| $30,000 to $34,999 | 0 (0.0%) | 29 (6.9%) |
| $35,000 to $39,999 | 0 (0.0%) | 13 (3.1%) |
| $40,000 to $44,999 | 32 (6.4%) | 0 (0.0%) |
| $45,000 to $49,999 | 10 (2.0%) | 14 (3.3%) |
| $50,000 to $54,999 | 22 (4.4%) | 68 (16.2%) |
| $55,000 to $64,999 | 10 (2.0%) | 52 (12.4%) |
| $65,000 to $74,999 | 11 (2.2%) | 0 (0.0%) |
| $75,000 to $99,999 | 80 (15.9%) | 46 (11.0%) |
| $100,000+ | 104 (20.7%) | 0 (0.0%) |
| Total | 502 (100.0%) | 419 (100.0%) |
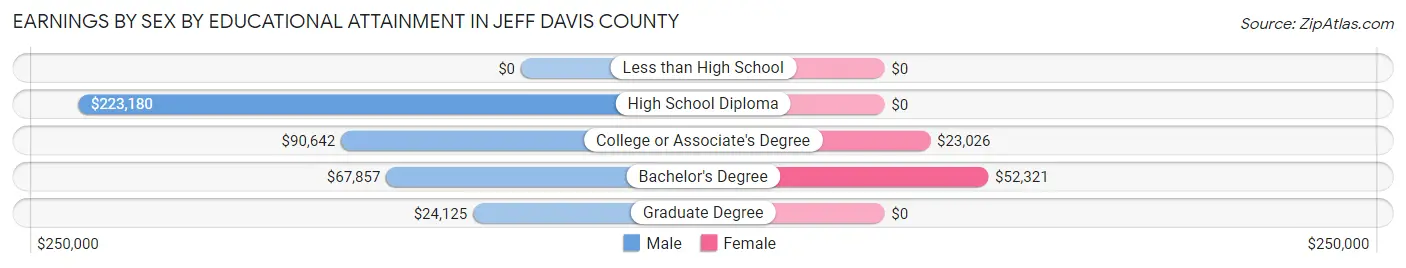
Earnings by Sex by Educational Attainment in Jeff Davis County
Average earnings in Jeff Davis County are $41,406 for men and $33,578 for women, a difference of 18.9%. Men with an educational attainment of high school diploma enjoy the highest average annual earnings of $223,180, while those with graduate degree education earn the least with $24,125. Women with an educational attainment of bachelor's degree earn the most with the average annual earnings of $52,321, while those with college or associate's degree education have the smallest earnings of $23,026.
| Educational Attainment | Male Income | Female Income |
| Less than High School | - | - |
| High School Diploma | $223,180 | $0 |
| College or Associate's Degree | $90,642 | $23,026 |
| Bachelor's Degree | $67,857 | $52,321 |
| Graduate Degree | $24,125 | $0 |
| Total | $41,406 | $33,578 |
Family Income in Jeff Davis County
Family Income Brackets in Jeff Davis County
According to the Jeff Davis County family income data, there are 91 families falling into the $25,000 to $34,999 income range, which is the most common income bracket and makes up 17.9% of all families.
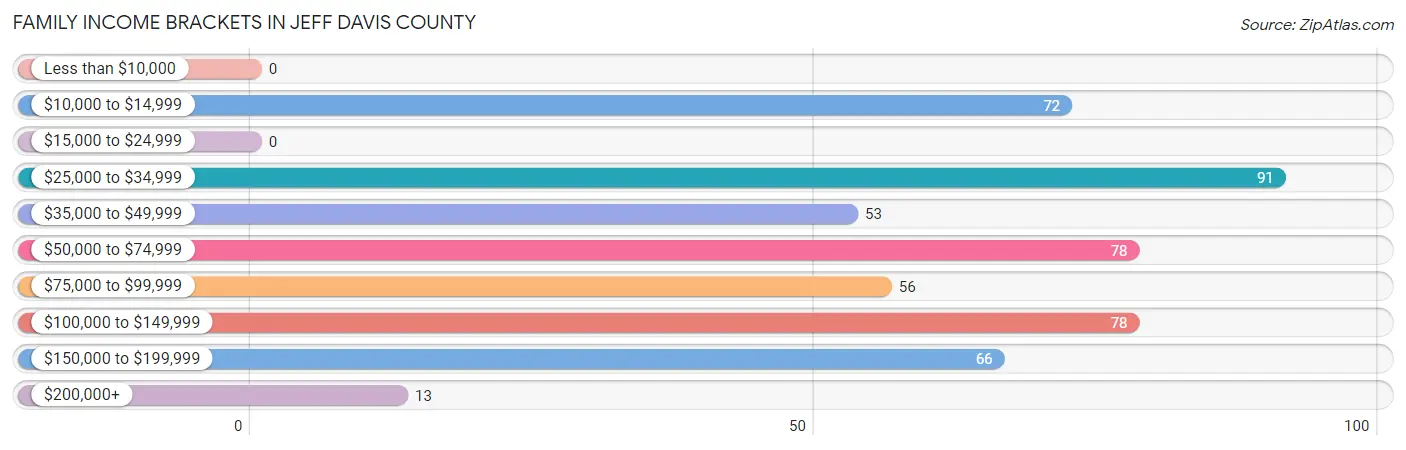
| Income Bracket | # Families | % Families |
| Less than $10,000 | 0 | 0.0% |
| $10,000 to $14,999 | 72 | 14.2% |
| $15,000 to $24,999 | 0 | 0.0% |
| $25,000 to $34,999 | 91 | 17.9% |
| $35,000 to $49,999 | 53 | 10.5% |
| $50,000 to $74,999 | 78 | 15.4% |
| $75,000 to $99,999 | 56 | 11.0% |
| $100,000 to $149,999 | 78 | 15.4% |
| $150,000 to $199,999 | 66 | 13.0% |
| $200,000+ | 13 | 2.6% |
Family Income by Famaliy Size in Jeff Davis County
2-person families (352 | 69.4%) account for the highest median family income in Jeff Davis County with $74,750 per family, while 2-person families (352 | 69.4%) have the highest median income of $37,375 per family member.
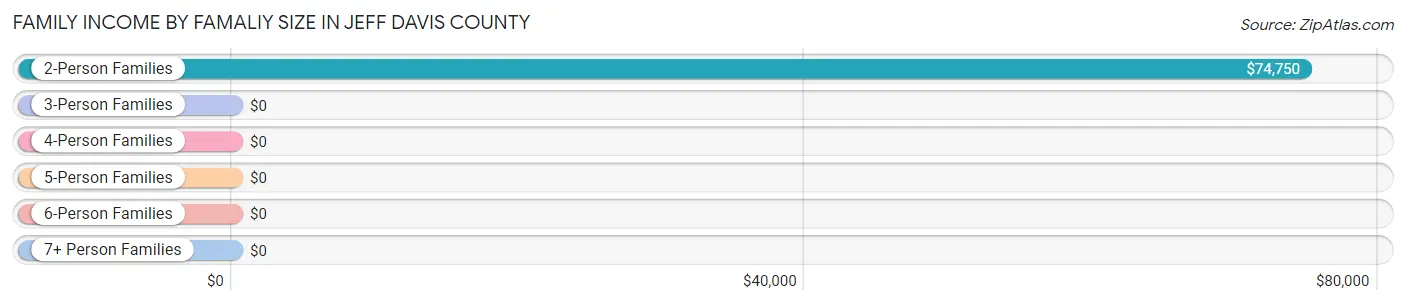
| Income Bracket | # Families | Median Income |
| 2-Person Families | 352 (69.4%) | $74,750 |
| 3-Person Families | 54 (10.6%) | $0 |
| 4-Person Families | 9 (1.8%) | $0 |
| 5-Person Families | 92 (18.1%) | $0 |
| 6-Person Families | 0 (0.0%) | $0 |
| 7+ Person Families | 0 (0.0%) | $0 |
| Total | 507 (100.0%) | $66,806 |
Family Income by Number of Earners in Jeff Davis County
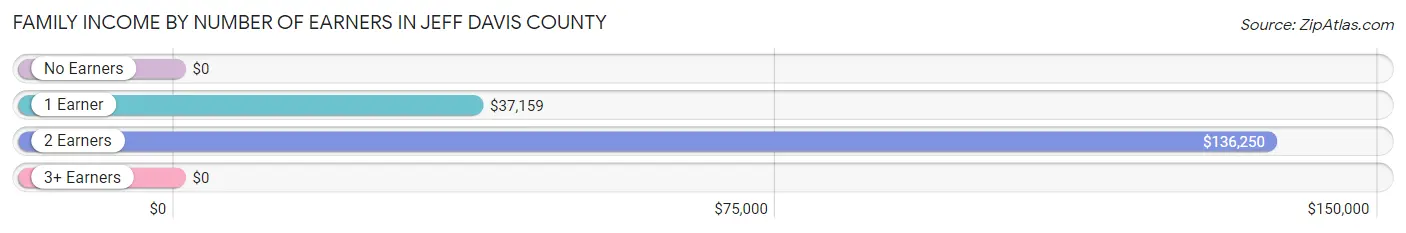
| Number of Earners | # Families | Median Income |
| No Earners | 160 (31.6%) | $0 |
| 1 Earner | 221 (43.6%) | $37,159 |
| 2 Earners | 126 (24.8%) | $136,250 |
| 3+ Earners | 0 (0.0%) | $0 |
| Total | 507 (100.0%) | $66,806 |
Household Income in Jeff Davis County
Household Income Brackets in Jeff Davis County
With 212 households falling in the category, the $25,000 to $34,999 income range is the most frequent in Jeff Davis County, accounting for 19.4% of all households. In contrast, only 60 households (5.5%) fall into the $35,000 to $49,999 income bracket, making it the least populous group.
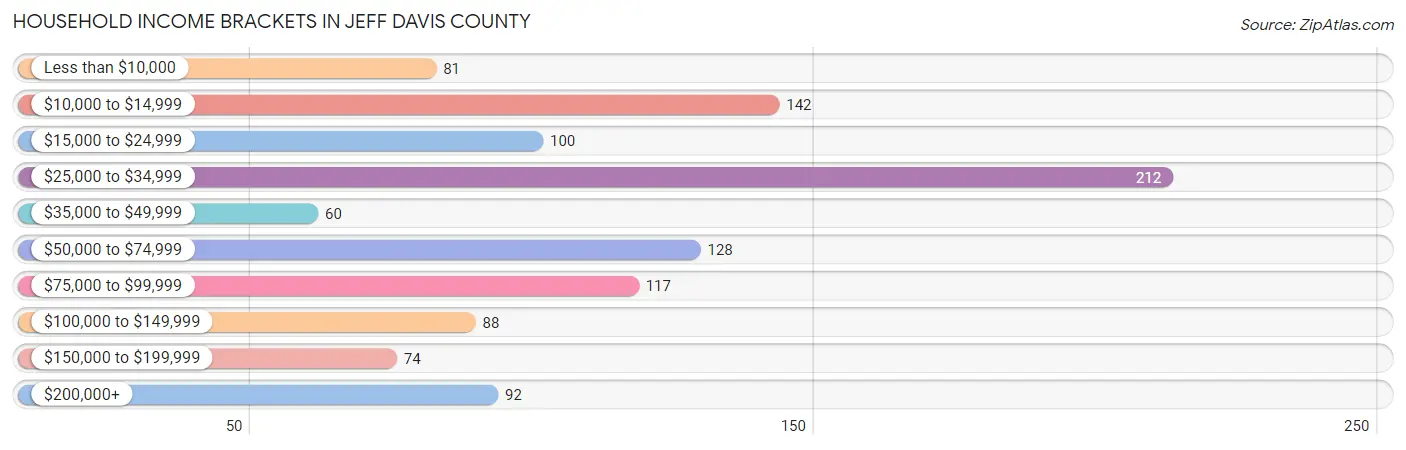
| Income Bracket | # Households | % Households |
| Less than $10,000 | 81 | 7.4% |
| $10,000 to $14,999 | 142 | 13.0% |
| $15,000 to $24,999 | 100 | 9.1% |
| $25,000 to $34,999 | 212 | 19.4% |
| $35,000 to $49,999 | 60 | 5.5% |
| $50,000 to $74,999 | 128 | 11.7% |
| $75,000 to $99,999 | 117 | 10.7% |
| $100,000 to $149,999 | 88 | 8.0% |
| $150,000 to $199,999 | 74 | 6.8% |
| $200,000+ | 92 | 8.4% |
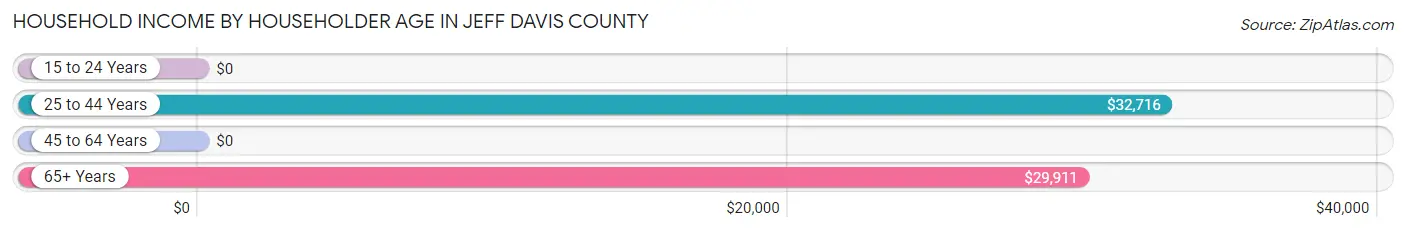
Household Income by Householder Age in Jeff Davis County
The median household income in Jeff Davis County is $38,125, with the highest median household income of $32,716 found in the 25 to 44 years age bracket for the primary householder. A total of 179 households (16.4%) fall into this category.
| Income Bracket | # Households | Median Income |
| 15 to 24 Years | 0 (0.0%) | $0 |
| 25 to 44 Years | 179 (16.4%) | $32,716 |
| 45 to 64 Years | 349 (31.9%) | $0 |
| 65+ Years | 567 (51.8%) | $29,911 |
| Total | 1,095 (100.0%) | $38,125 |
Poverty in Jeff Davis County
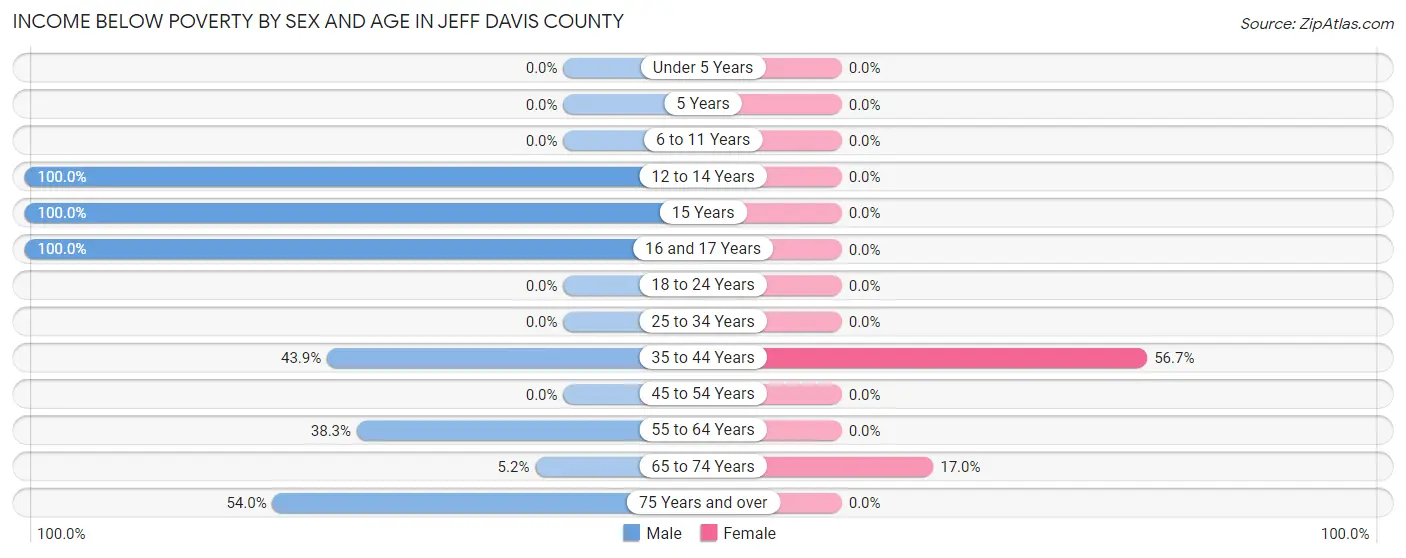
Income Below Poverty by Sex and Age in Jeff Davis County
With 33.6% poverty level for males and 13.4% for females among the residents of Jeff Davis County, 12 to 14 year old males and 35 to 44 year old females are the most vulnerable to poverty, with 80 males (100.0%) and 72 females (56.7%) in their respective age groups living below the poverty level.
| Age Bracket | Male | Female |
| Under 5 Years | 0 (0.0%) | 0 (0.0%) |
| 5 Years | 0 (0.0%) | 0 (0.0%) |
| 6 to 11 Years | 0 (0.0%) | 0 (0.0%) |
| 12 to 14 Years | 80 (100.0%) | 0 (0.0%) |
| 15 Years | 17 (100.0%) | 0 (0.0%) |
| 16 and 17 Years | 18 (100.0%) | 0 (0.0%) |
| 18 to 24 Years | 0 (0.0%) | 0 (0.0%) |
| 25 to 34 Years | 0 (0.0%) | 0 (0.0%) |
| 35 to 44 Years | 25 (43.9%) | 72 (56.7%) |
| 45 to 54 Years | 0 (0.0%) | 0 (0.0%) |
| 55 to 64 Years | 69 (38.3%) | 0 (0.0%) |
| 65 to 74 Years | 12 (5.2%) | 45 (17.0%) |
| 75 Years and over | 142 (54.0%) | 0 (0.0%) |
| Total | 363 (33.6%) | 117 (13.4%) |
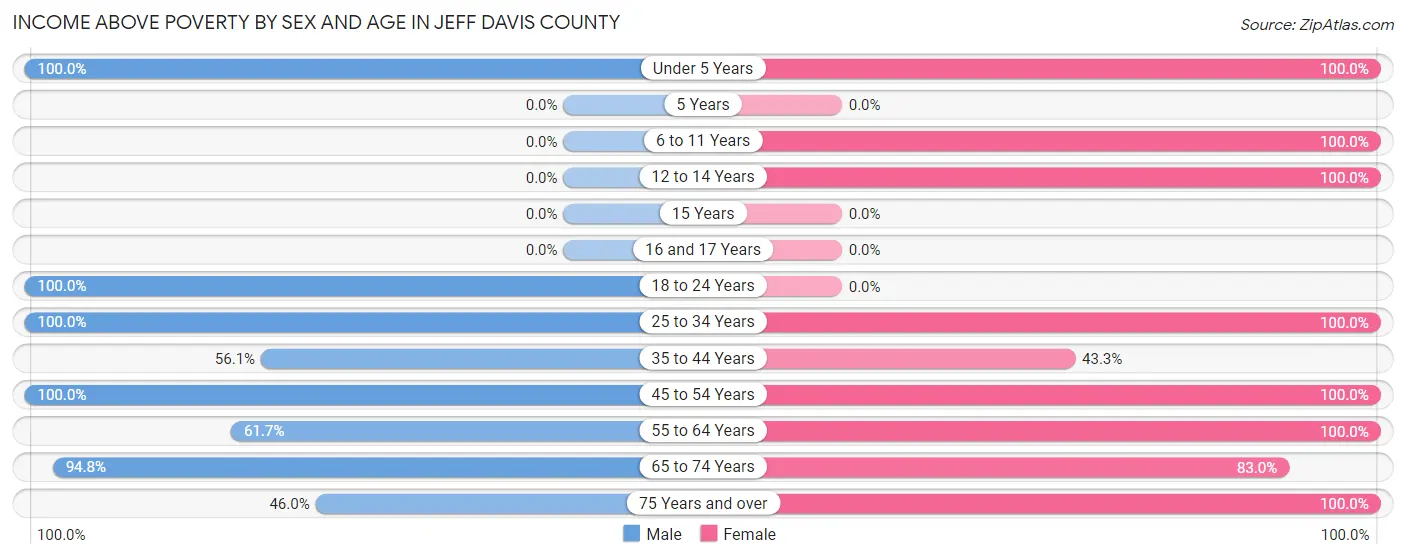
Income Above Poverty by Sex and Age in Jeff Davis County
According to the poverty statistics in Jeff Davis County, males aged under 5 years and females aged under 5 years are the age groups that are most secure financially, with 100.0% of males and 100.0% of females in these age groups living above the poverty line.
| Age Bracket | Male | Female |
| Under 5 Years | 49 (100.0%) | 85 (100.0%) |
| 5 Years | 0 (0.0%) | 0 (0.0%) |
| 6 to 11 Years | 0 (0.0%) | 8 (100.0%) |
| 12 to 14 Years | 0 (0.0%) | 7 (100.0%) |
| 15 Years | 0 (0.0%) | 0 (0.0%) |
| 16 and 17 Years | 0 (0.0%) | 0 (0.0%) |
| 18 to 24 Years | 67 (100.0%) | 0 (0.0%) |
| 25 to 34 Years | 48 (100.0%) | 50 (100.0%) |
| 35 to 44 Years | 32 (56.1%) | 55 (43.3%) |
| 45 to 54 Years | 70 (100.0%) | 92 (100.0%) |
| 55 to 64 Years | 111 (61.7%) | 165 (100.0%) |
| 65 to 74 Years | 218 (94.8%) | 220 (83.0%) |
| 75 Years and over | 121 (46.0%) | 73 (100.0%) |
| Total | 716 (66.4%) | 755 (86.6%) |
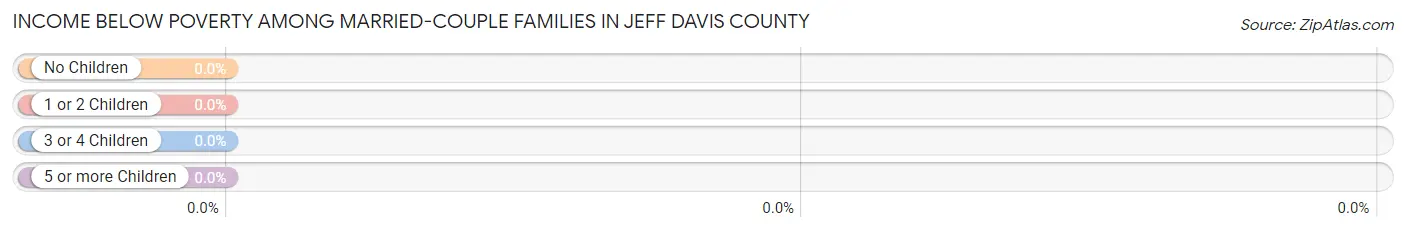
Income Below Poverty Among Married-Couple Families in Jeff Davis County
| Children | Above Poverty | Below Poverty |
| No Children | 333 (100.0%) | 0 (0.0%) |
| 1 or 2 Children | 52 (100.0%) | 0 (0.0%) |
| 3 or 4 Children | 20 (100.0%) | 0 (0.0%) |
| 5 or more Children | 0 (0.0%) | 0 (0.0%) |
| Total | 405 (100.0%) | 0 (0.0%) |
Income Below Poverty Among Single-Parent Households in Jeff Davis County
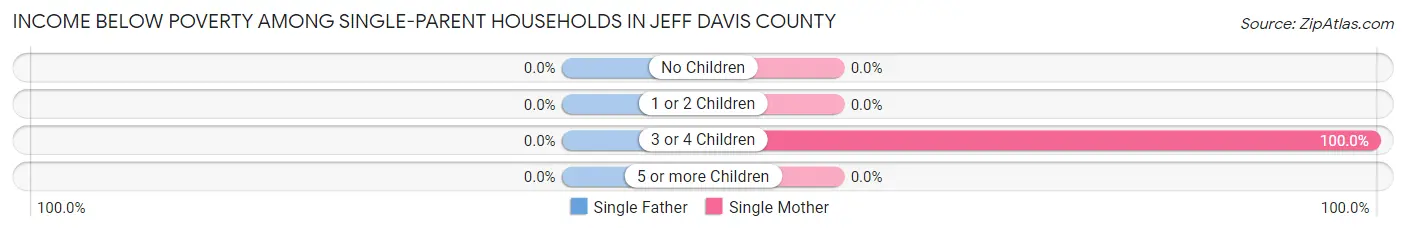
| Children | Single Father | Single Mother |
| No Children | 0 (0.0%) | 0 (0.0%) |
| 1 or 2 Children | 0 (0.0%) | 0 (0.0%) |
| 3 or 4 Children | 0 (0.0%) | 72 (100.0%) |
| 5 or more Children | 0 (0.0%) | 0 (0.0%) |
| Total | 0 (0.0%) | 72 (70.6%) |
Income Below Poverty Among Married-Couple vs Single-Parent Households in Jeff Davis County
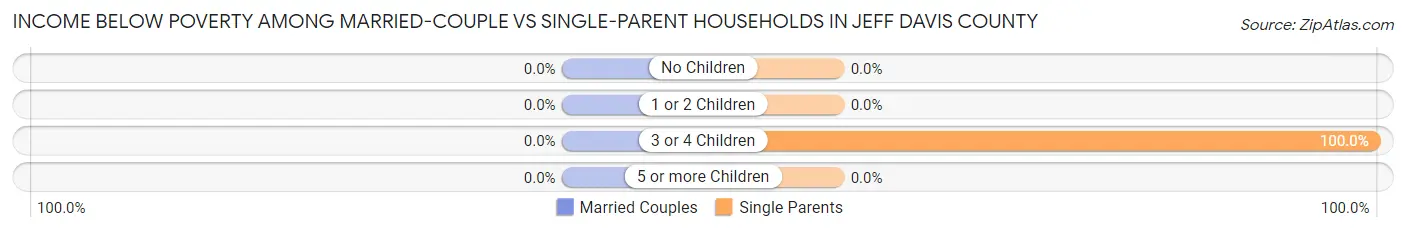
| Children | Married-Couple Families | Single-Parent Households |
| No Children | 0 (0.0%) | 0 (0.0%) |
| 1 or 2 Children | 0 (0.0%) | 0 (0.0%) |
| 3 or 4 Children | 0 (0.0%) | 72 (100.0%) |
| 5 or more Children | 0 (0.0%) | 0 (0.0%) |
| Total | 0 (0.0%) | 72 (70.6%) |
Race in Jeff Davis County
The most populous races in Jeff Davis County are White / Caucasian (1,648 | 82.7%), Hispanic or Latino (393 | 19.7%), and Two or more Races (269 | 13.5%).
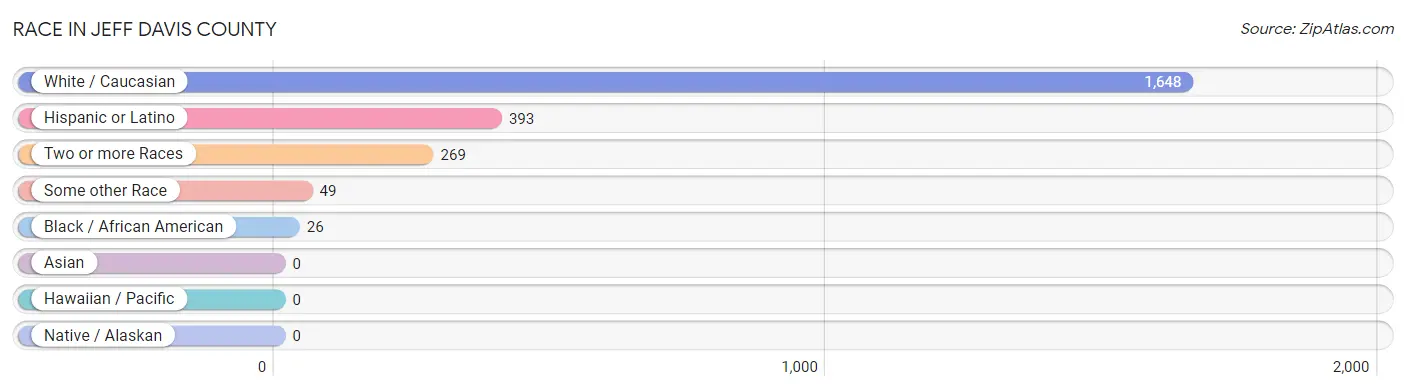
| Race | # Population | % Population |
| Asian | 0 | 0.0% |
| Black / African American | 26 | 1.3% |
| Hawaiian / Pacific | 0 | 0.0% |
| Hispanic or Latino | 393 | 19.7% |
| Native / Alaskan | 0 | 0.0% |
| White / Caucasian | 1,648 | 82.7% |
| Two or more Races | 269 | 13.5% |
| Some other Race | 49 | 2.5% |
| Total | 1,992 | 100.0% |
Ancestry in Jeff Davis County
The most populous ancestries reported in Jeff Davis County are English (403 | 20.2%), Mexican (371 | 18.6%), Irish (187 | 9.4%), German (157 | 7.9%), and American (139 | 7.0%), together accounting for 63.1% of all Jeff Davis County residents.
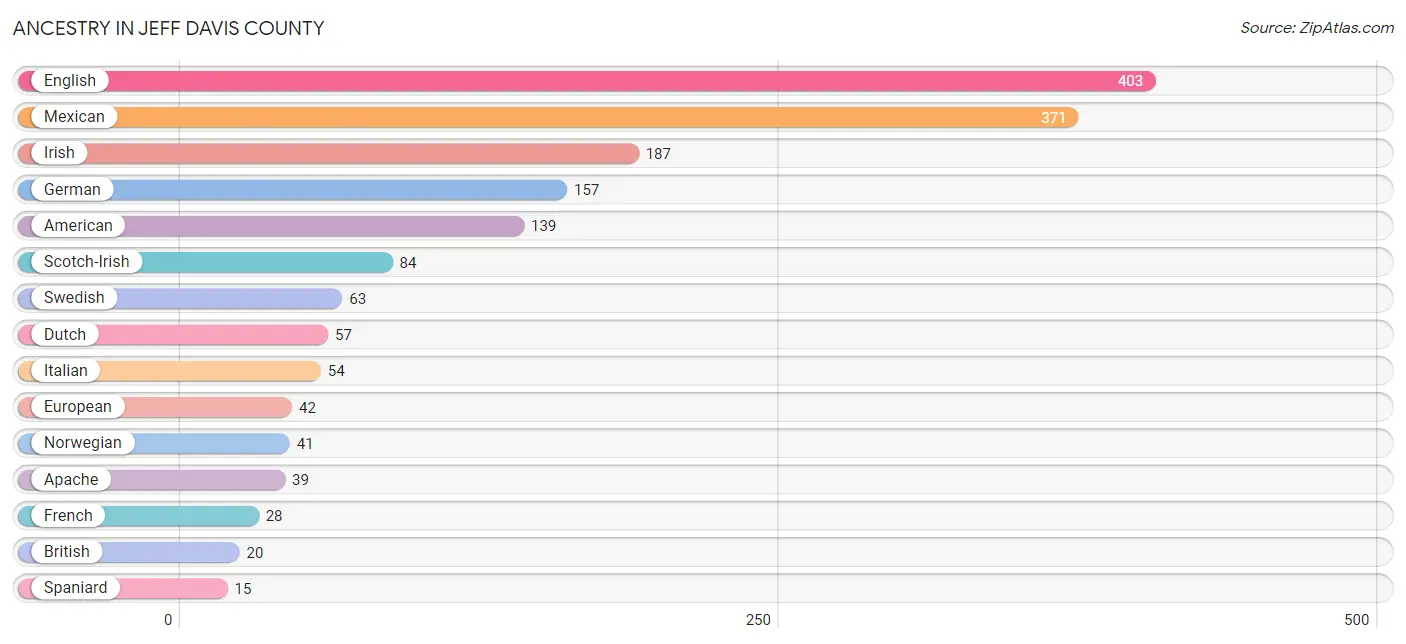
| Ancestry | # Population | % Population |
| American | 139 | 7.0% |
| Apache | 39 | 2.0% |
| Austrian | 5 | 0.3% |
| British | 20 | 1.0% |
| Bulgarian | 3 | 0.2% |
| Cambodian | 5 | 0.3% |
| Cherokee | 5 | 0.3% |
| Dutch | 57 | 2.9% |
| English | 403 | 20.2% |
| European | 42 | 2.1% |
| French | 28 | 1.4% |
| German | 157 | 7.9% |
| Irish | 187 | 9.4% |
| Italian | 54 | 2.7% |
| Mexican | 371 | 18.6% |
| Northern European | 6 | 0.3% |
| Norwegian | 41 | 2.1% |
| Portuguese | 7 | 0.4% |
| Romanian | 7 | 0.4% |
| Russian | 8 | 0.4% |
| Scandinavian | 4 | 0.2% |
| Scotch-Irish | 84 | 4.2% |
| Scottish | 9 | 0.4% |
| Slavic | 3 | 0.2% |
| South African | 8 | 0.4% |
| Spaniard | 15 | 0.7% |
| Subsaharan African | 8 | 0.4% |
| Swedish | 63 | 3.2% |
| Welsh | 3 | 0.2% | View All 29 Rows |
Immigrants in Jeff Davis County
The most numerous immigrant groups reported in Jeff Davis County came from Central America (128 | 6.4%), Latin America (128 | 6.4%), Mexico (128 | 6.4%), Europe (84 | 4.2%), and Northern Europe (73 | 3.7%), together accounting for 27.2% of all Jeff Davis County residents.
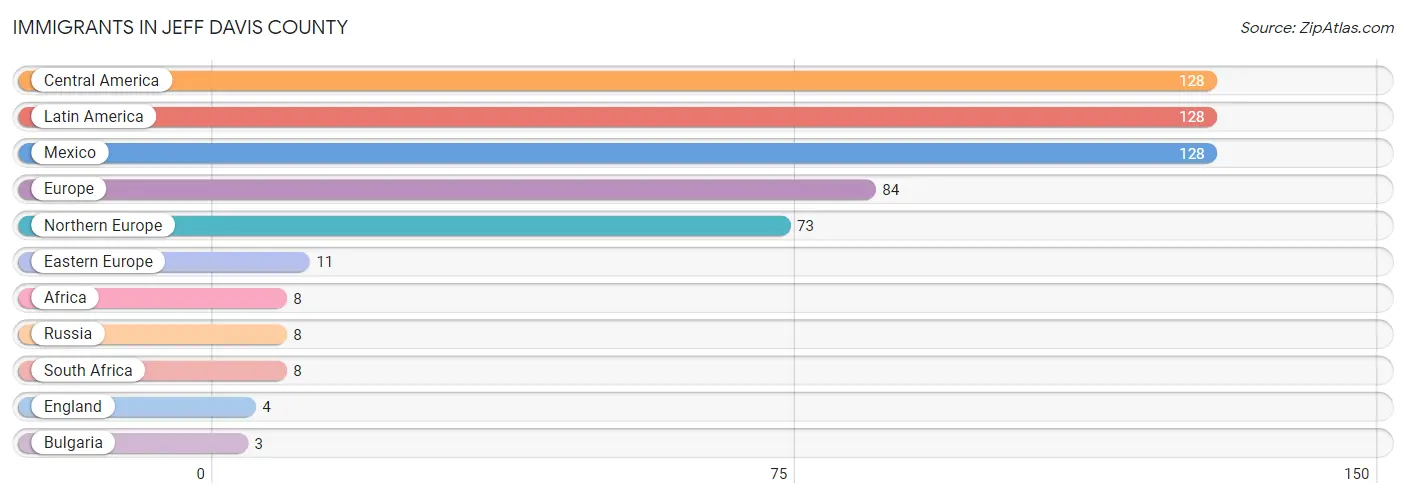
| Immigration Origin | # Population | % Population |
| Africa | 8 | 0.4% |
| Bulgaria | 3 | 0.2% |
| Central America | 128 | 6.4% |
| Eastern Europe | 11 | 0.5% |
| England | 4 | 0.2% |
| Europe | 84 | 4.2% |
| Latin America | 128 | 6.4% |
| Mexico | 128 | 6.4% |
| Northern Europe | 73 | 3.7% |
| Russia | 8 | 0.4% |
| South Africa | 8 | 0.4% | View All 11 Rows |
Sex and Age in Jeff Davis County
Sex and Age in Jeff Davis County
The most populous age groups in Jeff Davis County are 75 to 79 Years (232 | 21.0%) for men and 70 to 74 Years (148 | 16.7%) for women.
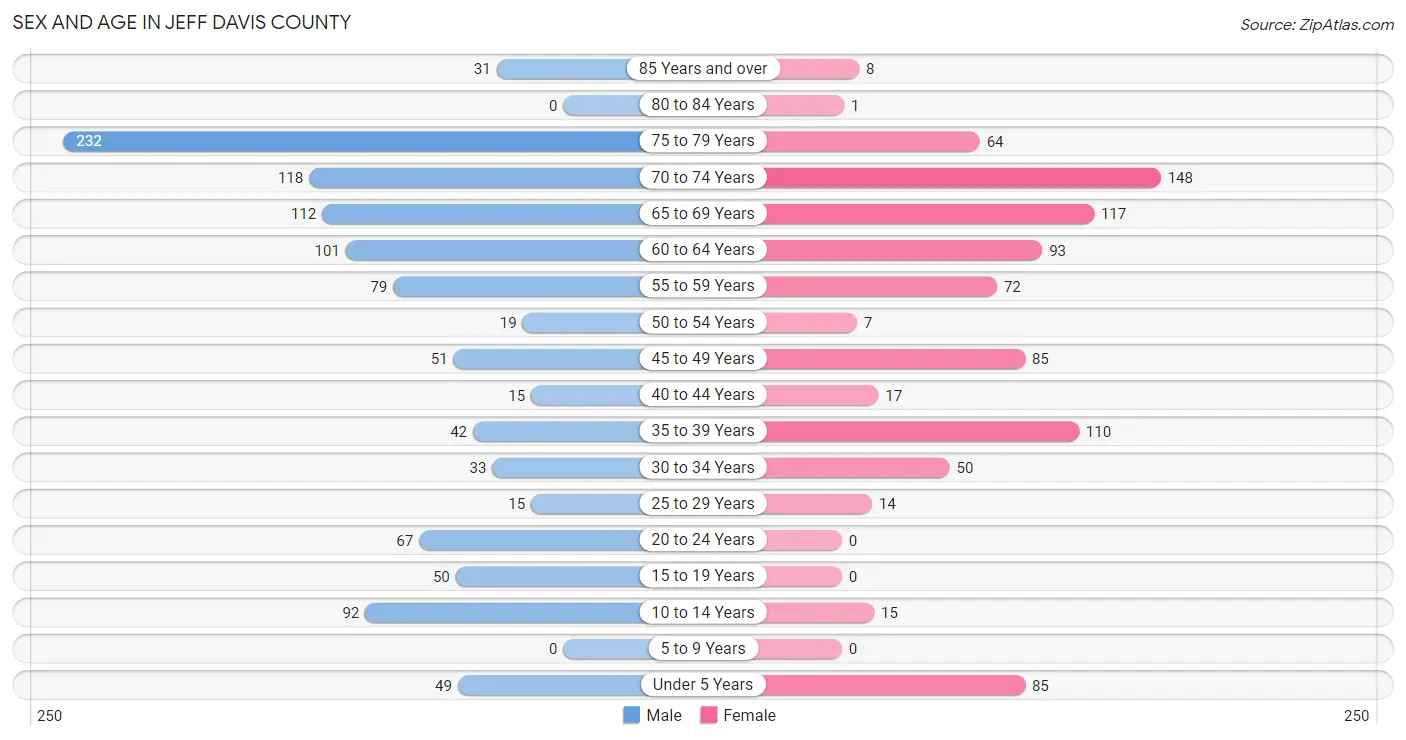
| Age Bracket | Male | Female |
| Under 5 Years | 49 (4.4%) | 85 (9.6%) |
| 5 to 9 Years | 0 (0.0%) | 0 (0.0%) |
| 10 to 14 Years | 92 (8.3%) | 15 (1.7%) |
| 15 to 19 Years | 50 (4.5%) | 0 (0.0%) |
| 20 to 24 Years | 67 (6.1%) | 0 (0.0%) |
| 25 to 29 Years | 15 (1.4%) | 14 (1.6%) |
| 30 to 34 Years | 33 (3.0%) | 50 (5.6%) |
| 35 to 39 Years | 42 (3.8%) | 110 (12.4%) |
| 40 to 44 Years | 15 (1.4%) | 17 (1.9%) |
| 45 to 49 Years | 51 (4.6%) | 85 (9.6%) |
| 50 to 54 Years | 19 (1.7%) | 7 (0.8%) |
| 55 to 59 Years | 79 (7.1%) | 72 (8.1%) |
| 60 to 64 Years | 101 (9.1%) | 93 (10.5%) |
| 65 to 69 Years | 112 (10.1%) | 117 (13.2%) |
| 70 to 74 Years | 118 (10.7%) | 148 (16.7%) |
| 75 to 79 Years | 232 (21.0%) | 64 (7.2%) |
| 80 to 84 Years | 0 (0.0%) | 1 (0.1%) |
| 85 Years and over | 31 (2.8%) | 8 (0.9%) |
| Total | 1,106 (100.0%) | 886 (100.0%) |
Families and Households in Jeff Davis County
Median Family Size in Jeff Davis County
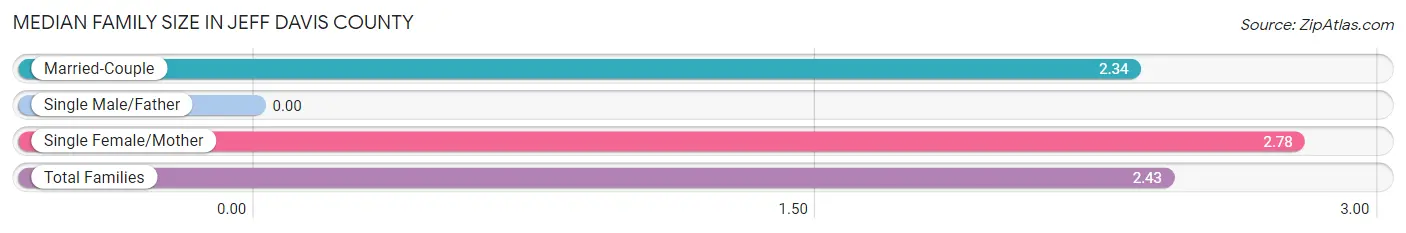
| Family Type | # Families | Family Size |
| Married-Couple | 405 (79.9%) | 2.34 |
| Single Male/Father | 0 (0.0%) | - |
| Single Female/Mother | 102 (20.1%) | 2.78 |
| Total Families | 507 (100.0%) | 2.43 |
Median Household Size in Jeff Davis County
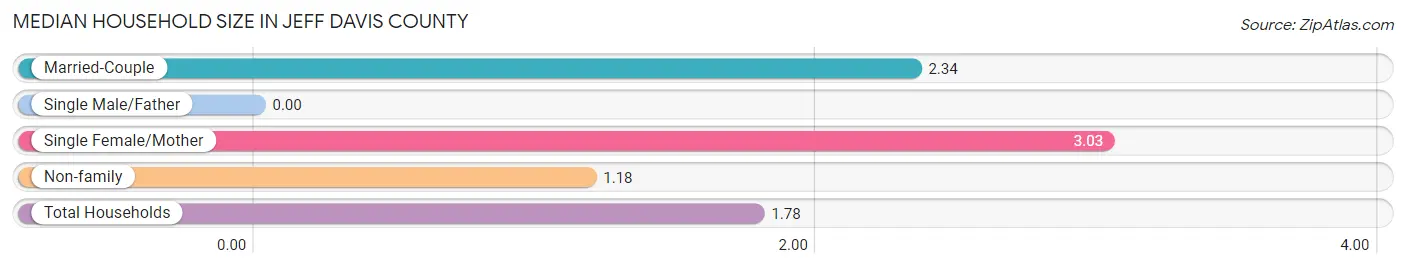
| Household Type | # Households | Household Size |
| Married-Couple | 405 (37.0%) | 2.34 |
| Single Male/Father | 0 (0.0%) | - |
| Single Female/Mother | 102 (9.3%) | 3.03 |
| Non-family | 588 (53.7%) | 1.18 |
| Total Households | 1,095 (100.0%) | 1.78 |
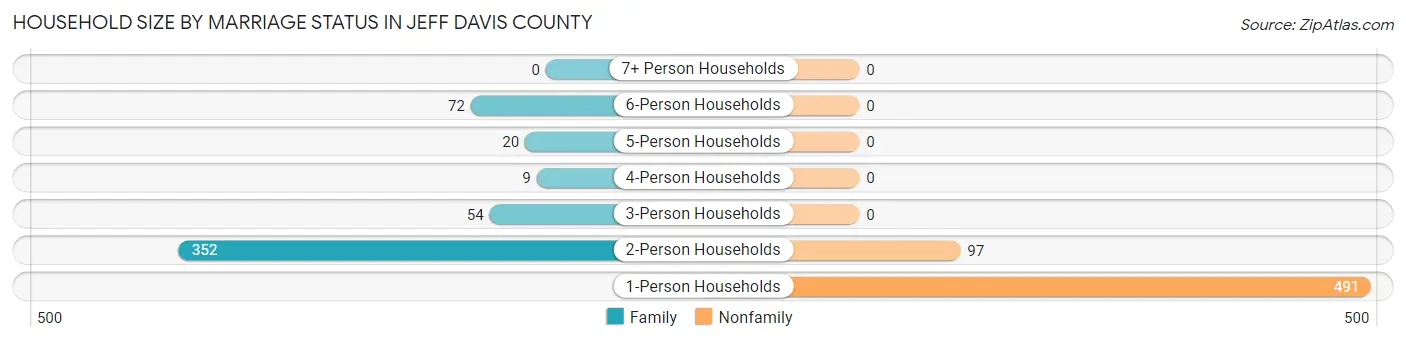
Household Size by Marriage Status in Jeff Davis County
Out of a total of 1,095 households in Jeff Davis County, 507 (46.3%) are family households, while 588 (53.7%) are nonfamily households. The most numerous type of family households are 2-person households, comprising 352, and the most common type of nonfamily households are 1-person households, comprising 491.
| Household Size | Family Households | Nonfamily Households |
| 1-Person Households | - | 491 (44.8%) |
| 2-Person Households | 352 (32.2%) | 97 (8.9%) |
| 3-Person Households | 54 (4.9%) | 0 (0.0%) |
| 4-Person Households | 9 (0.8%) | 0 (0.0%) |
| 5-Person Households | 20 (1.8%) | 0 (0.0%) |
| 6-Person Households | 72 (6.6%) | 0 (0.0%) |
| 7+ Person Households | 0 (0.0%) | 0 (0.0%) |
| Total | 507 (46.3%) | 588 (53.7%) |
Female Fertility in Jeff Davis County
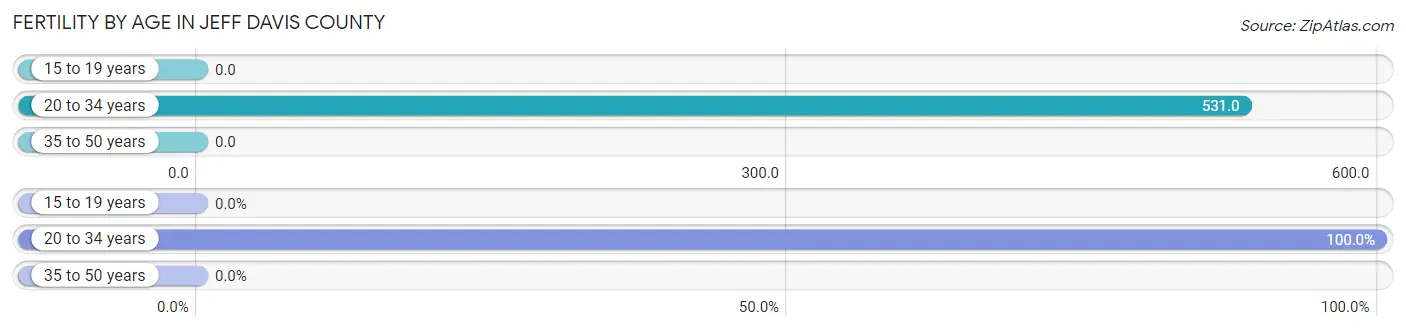
Fertility by Age in Jeff Davis County
Average fertility rate in Jeff Davis County is 120.0 births per 1,000 women. Women in the age bracket of 20 to 34 years have the highest fertility rate with 531.0 births per 1,000 women. Women in the age bracket of 20 to 34 years acount for 100.0% of all women with births.
| Age Bracket | Women with Births | Births / 1,000 Women |
| 15 to 19 years | 0 (0.0%) | 0.0 |
| 20 to 34 years | 34 (100.0%) | 531.0 |
| 35 to 50 years | 0 (0.0%) | 0.0 |
| Total | 34 (100.0%) | 120.0 |
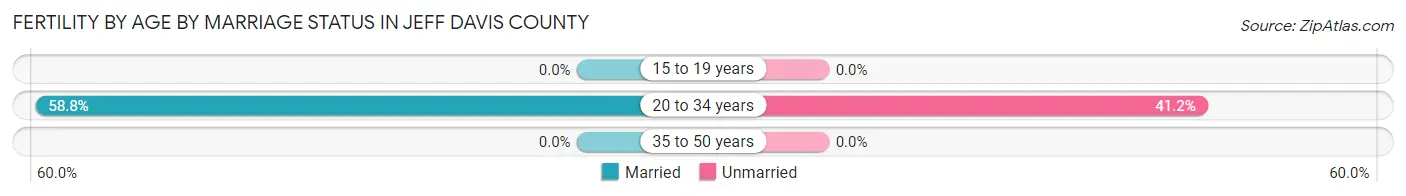
Fertility by Age by Marriage Status in Jeff Davis County
58.8% of women with births (34) in Jeff Davis County are married. The highest percentage of unmarried women with births falls into 20 to 34 years age bracket with 41.2% of them unmarried at the time of birth, while the lowest percentage of unmarried women with births belong to 20 to 34 years age bracket with 41.2% of them unmarried.
| Age Bracket | Married | Unmarried |
| 15 to 19 years | 0 (0.0%) | 0 (0.0%) |
| 20 to 34 years | 20 (58.8%) | 14 (41.2%) |
| 35 to 50 years | 0 (0.0%) | 0 (0.0%) |
| Total | 20 (58.8%) | 14 (41.2%) |
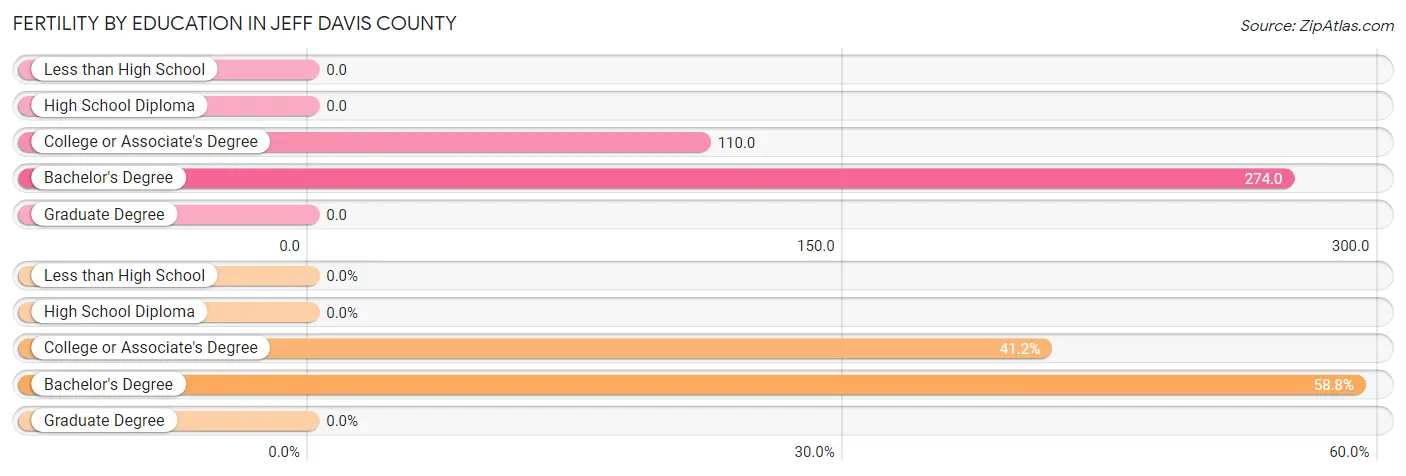
Fertility by Education in Jeff Davis County
| Educational Attainment | Women with Births | Births / 1,000 Women |
| Less than High School | 0 (0.0%) | 0.0 |
| High School Diploma | 0 (0.0%) | 0.0 |
| College or Associate's Degree | 14 (41.2%) | 110.0 |
| Bachelor's Degree | 20 (58.8%) | 274.0 |
| Graduate Degree | 0 (0.0%) | 0.0 |
| Total | 34 (100.0%) | 120.0 |
Fertility by Education by Marriage Status in Jeff Davis County
41.2% of women with births in Jeff Davis County are unmarried. Women with the educational attainment of bachelor's degree are most likely to be married with 100.0% of them married at childbirth, while women with the educational attainment of college or associate's degree are least likely to be married with 100.0% of them unmarried at childbirth.
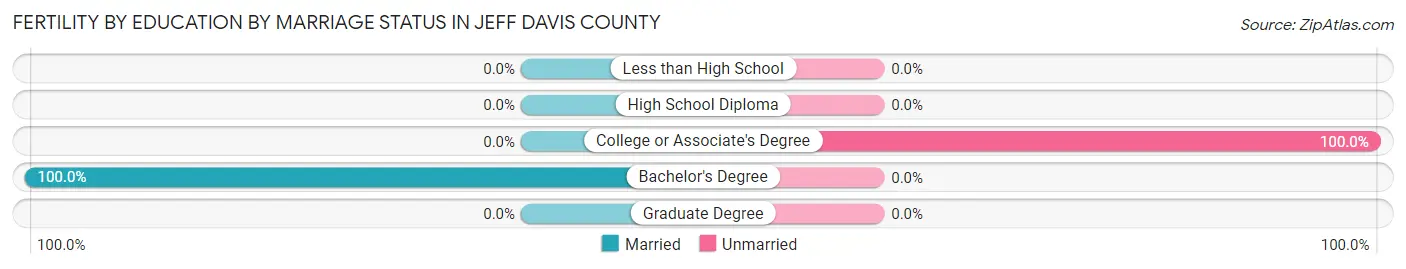
| Educational Attainment | Married | Unmarried |
| Less than High School | 0 (0.0%) | 0 (0.0%) |
| High School Diploma | 0 (0.0%) | 0 (0.0%) |
| College or Associate's Degree | 0 (0.0%) | 14 (100.0%) |
| Bachelor's Degree | 20 (100.0%) | 0 (0.0%) |
| Graduate Degree | 0 (0.0%) | 0 (0.0%) |
| Total | 20 (58.8%) | 14 (41.2%) |
Employment Characteristics in Jeff Davis County
Employment by Class of Employer in Jeff Davis County
Among the 700 employed individuals in Jeff Davis County, private company employees (412 | 58.9%), local government employees (87 | 12.4%), and self-employed (incorporated) (71 | 10.1%) make up the most common classes of employment.
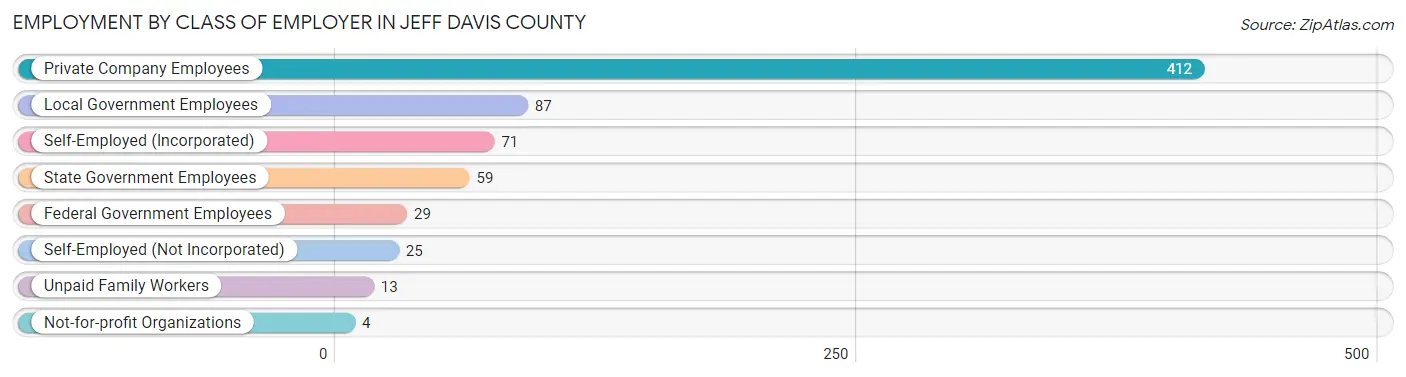
| Employer Class | # Employees | % Employees |
| Private Company Employees | 412 | 58.9% |
| Self-Employed (Incorporated) | 71 | 10.1% |
| Self-Employed (Not Incorporated) | 25 | 3.6% |
| Not-for-profit Organizations | 4 | 0.6% |
| Local Government Employees | 87 | 12.4% |
| State Government Employees | 59 | 8.4% |
| Federal Government Employees | 29 | 4.1% |
| Unpaid Family Workers | 13 | 1.9% |
| Total | 700 | 100.0% |
Employment Status by Age in Jeff Davis County
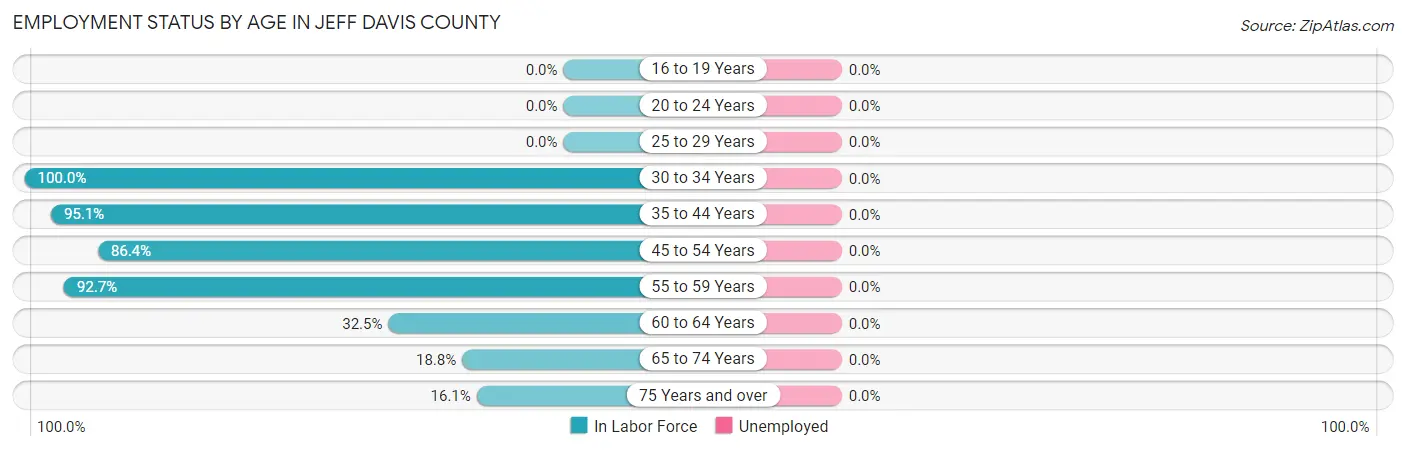
| Age Bracket | In Labor Force | Unemployed |
| 16 to 19 Years | 0 (0.0%) | 0 (0.0%) |
| 20 to 24 Years | 0 (0.0%) | 0 (0.0%) |
| 25 to 29 Years | 0 (0.0%) | 0 (0.0%) |
| 30 to 34 Years | 83 (100.0%) | 0 (0.0%) |
| 35 to 44 Years | 175 (95.1%) | 0 (0.0%) |
| 45 to 54 Years | 140 (86.4%) | 0 (0.0%) |
| 55 to 59 Years | 140 (92.7%) | 0 (0.0%) |
| 60 to 64 Years | 63 (32.5%) | 0 (0.0%) |
| 65 to 74 Years | 93 (18.8%) | 0 (0.0%) |
| 75 Years and over | 54 (16.1%) | 0 (0.0%) |
| Total | 748 (43.3%) | 0 (0.0%) |
Employment Status by Educational Attainment in Jeff Davis County
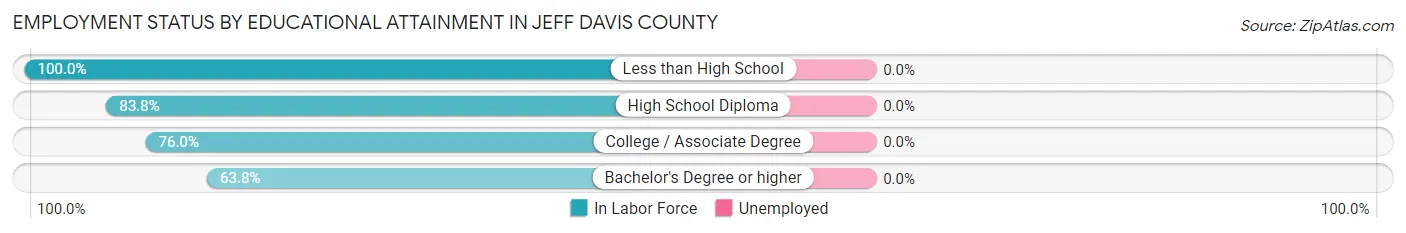
| Educational Attainment | In Labor Force | Unemployed |
| Less than High School | 23 (100.0%) | 0 (0.0%) |
| High School Diploma | 150 (83.8%) | 0 (0.0%) |
| College / Associate Degree | 278 (76.0%) | 0 (0.0%) |
| Bachelor's Degree or higher | 150 (63.8%) | 0 (0.0%) |
| Total | 601 (74.8%) | 0 (0.0%) |
Employment Occupations by Sex in Jeff Davis County
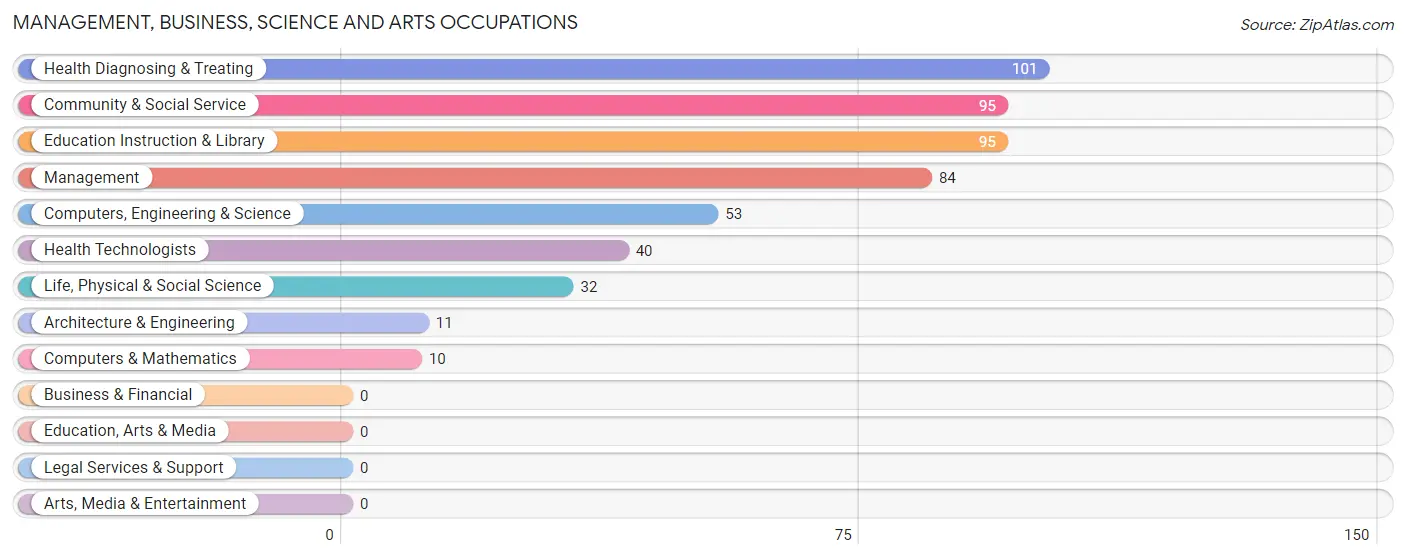
Management, Business, Science and Arts Occupations
The most common Management, Business, Science and Arts occupations in Jeff Davis County are Health Diagnosing & Treating (101 | 13.5%), Community & Social Service (95 | 12.7%), Education Instruction & Library (95 | 12.7%), Management (84 | 11.2%), and Computers, Engineering & Science (53 | 7.1%).
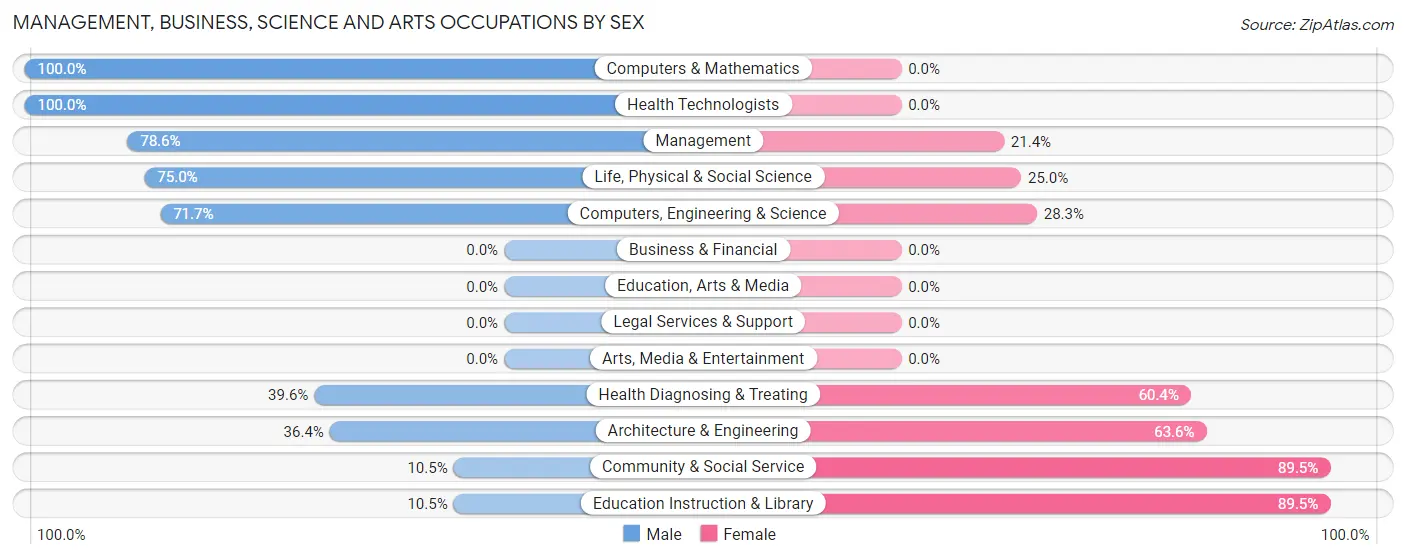
Management, Business, Science and Arts Occupations by Sex
Within the Management, Business, Science and Arts occupations in Jeff Davis County, the most male-oriented occupations are Computers & Mathematics (100.0%), Health Technologists (100.0%), and Management (78.6%), while the most female-oriented occupations are Community & Social Service (89.5%), Education Instruction & Library (89.5%), and Architecture & Engineering (63.6%).
| Occupation | Male | Female |
| Management | 66 (78.6%) | 18 (21.4%) |
| Business & Financial | 0 (0.0%) | 0 (0.0%) |
| Computers, Engineering & Science | 38 (71.7%) | 15 (28.3%) |
| Computers & Mathematics | 10 (100.0%) | 0 (0.0%) |
| Architecture & Engineering | 4 (36.4%) | 7 (63.6%) |
| Life, Physical & Social Science | 24 (75.0%) | 8 (25.0%) |
| Community & Social Service | 10 (10.5%) | 85 (89.5%) |
| Education, Arts & Media | 0 (0.0%) | 0 (0.0%) |
| Legal Services & Support | 0 (0.0%) | 0 (0.0%) |
| Education Instruction & Library | 10 (10.5%) | 85 (89.5%) |
| Arts, Media & Entertainment | 0 (0.0%) | 0 (0.0%) |
| Health Diagnosing & Treating | 40 (39.6%) | 61 (60.4%) |
| Health Technologists | 40 (100.0%) | 0 (0.0%) |
| Total (Category) | 154 (46.3%) | 179 (53.7%) |
| Total (Overall) | 356 (47.6%) | 392 (52.4%) |
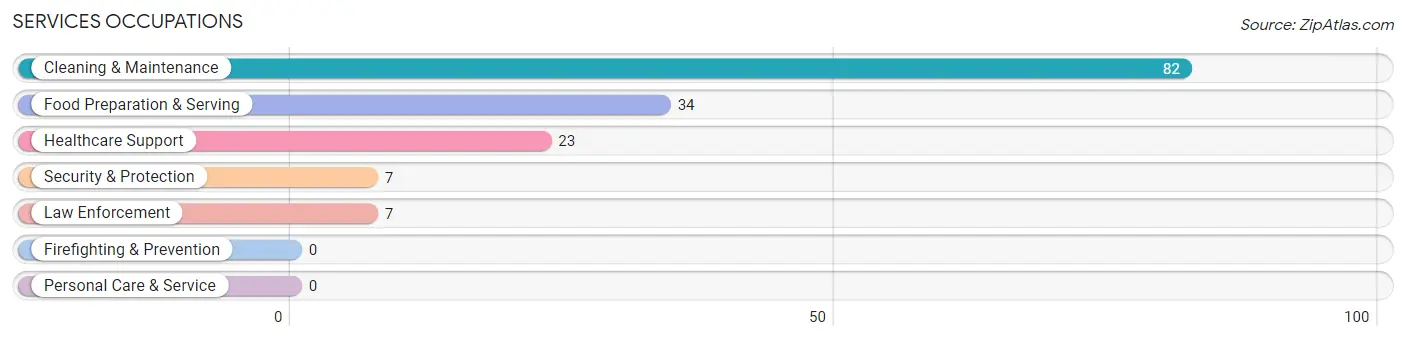
Services Occupations
The most common Services occupations in Jeff Davis County are Cleaning & Maintenance (82 | 11.0%), Food Preparation & Serving (34 | 4.5%), Healthcare Support (23 | 3.1%), Security & Protection (7 | 0.9%), and Law Enforcement (7 | 0.9%).
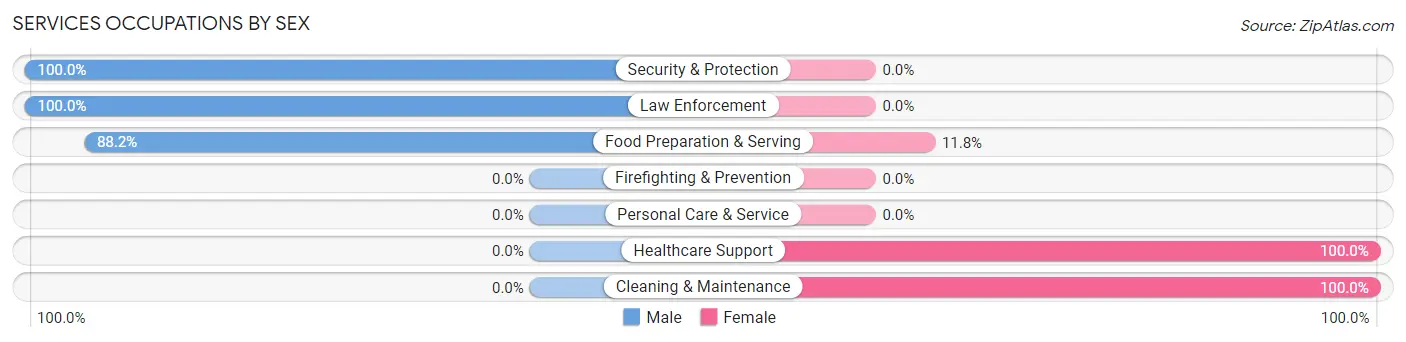
Services Occupations by Sex
Within the Services occupations in Jeff Davis County, the most male-oriented occupations are Security & Protection (100.0%), Law Enforcement (100.0%), and Food Preparation & Serving (88.2%), while the most female-oriented occupations are Healthcare Support (100.0%), Cleaning & Maintenance (100.0%), and Food Preparation & Serving (11.8%).
| Occupation | Male | Female |
| Healthcare Support | 0 (0.0%) | 23 (100.0%) |
| Security & Protection | 7 (100.0%) | 0 (0.0%) |
| Firefighting & Prevention | 0 (0.0%) | 0 (0.0%) |
| Law Enforcement | 7 (100.0%) | 0 (0.0%) |
| Food Preparation & Serving | 30 (88.2%) | 4 (11.8%) |
| Cleaning & Maintenance | 0 (0.0%) | 82 (100.0%) |
| Personal Care & Service | 0 (0.0%) | 0 (0.0%) |
| Total (Category) | 37 (25.3%) | 109 (74.7%) |
| Total (Overall) | 356 (47.6%) | 392 (52.4%) |
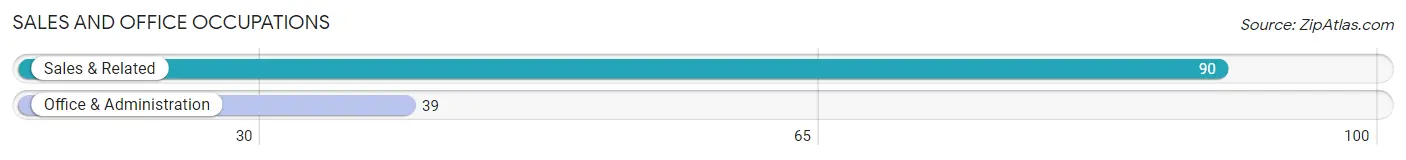
Sales and Office Occupations
The most common Sales and Office occupations in Jeff Davis County are Sales & Related (90 | 12.0%), and Office & Administration (39 | 5.2%).
Sales and Office Occupations by Sex
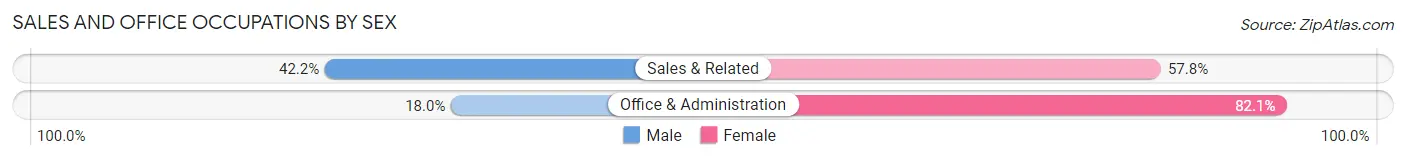
| Occupation | Male | Female |
| Sales & Related | 38 (42.2%) | 52 (57.8%) |
| Office & Administration | 7 (17.9%) | 32 (82.1%) |
| Total (Category) | 45 (34.9%) | 84 (65.1%) |
| Total (Overall) | 356 (47.6%) | 392 (52.4%) |
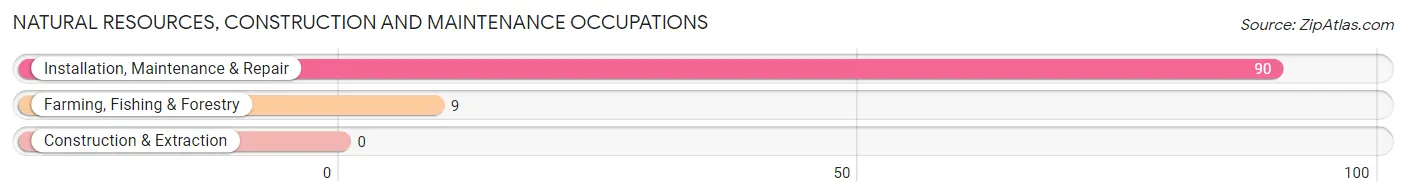
Natural Resources, Construction and Maintenance Occupations
The most common Natural Resources, Construction and Maintenance occupations in Jeff Davis County are Installation, Maintenance & Repair (90 | 12.0%), and Farming, Fishing & Forestry (9 | 1.2%).
Natural Resources, Construction and Maintenance Occupations by Sex
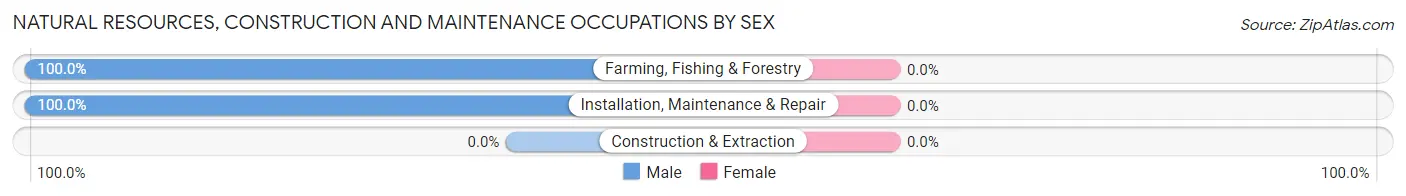
| Occupation | Male | Female |
| Farming, Fishing & Forestry | 9 (100.0%) | 0 (0.0%) |
| Construction & Extraction | 0 (0.0%) | 0 (0.0%) |
| Installation, Maintenance & Repair | 90 (100.0%) | 0 (0.0%) |
| Total (Category) | 99 (100.0%) | 0 (0.0%) |
| Total (Overall) | 356 (47.6%) | 392 (52.4%) |
Production, Transportation and Moving Occupations
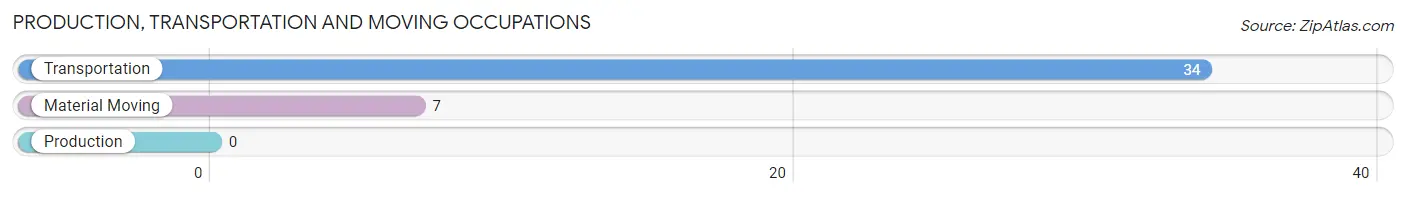
The most common Production, Transportation and Moving occupations in Jeff Davis County are Transportation (34 | 4.5%), and Material Moving (7 | 0.9%).
Production, Transportation and Moving Occupations by Sex
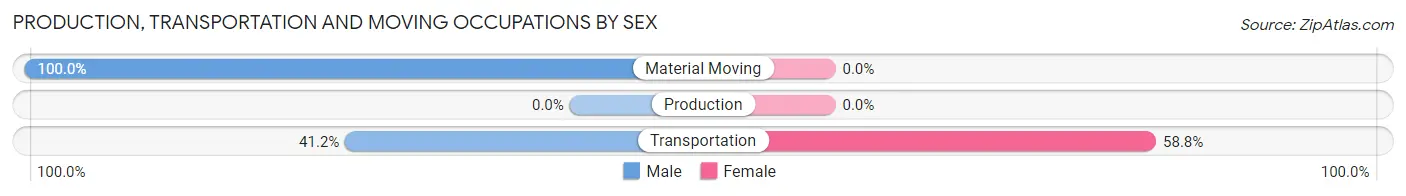
| Occupation | Male | Female |
| Production | 0 (0.0%) | 0 (0.0%) |
| Transportation | 14 (41.2%) | 20 (58.8%) |
| Material Moving | 7 (100.0%) | 0 (0.0%) |
| Total (Category) | 21 (51.2%) | 20 (48.8%) |
| Total (Overall) | 356 (47.6%) | 392 (52.4%) |
Employment Industries by Sex in Jeff Davis County
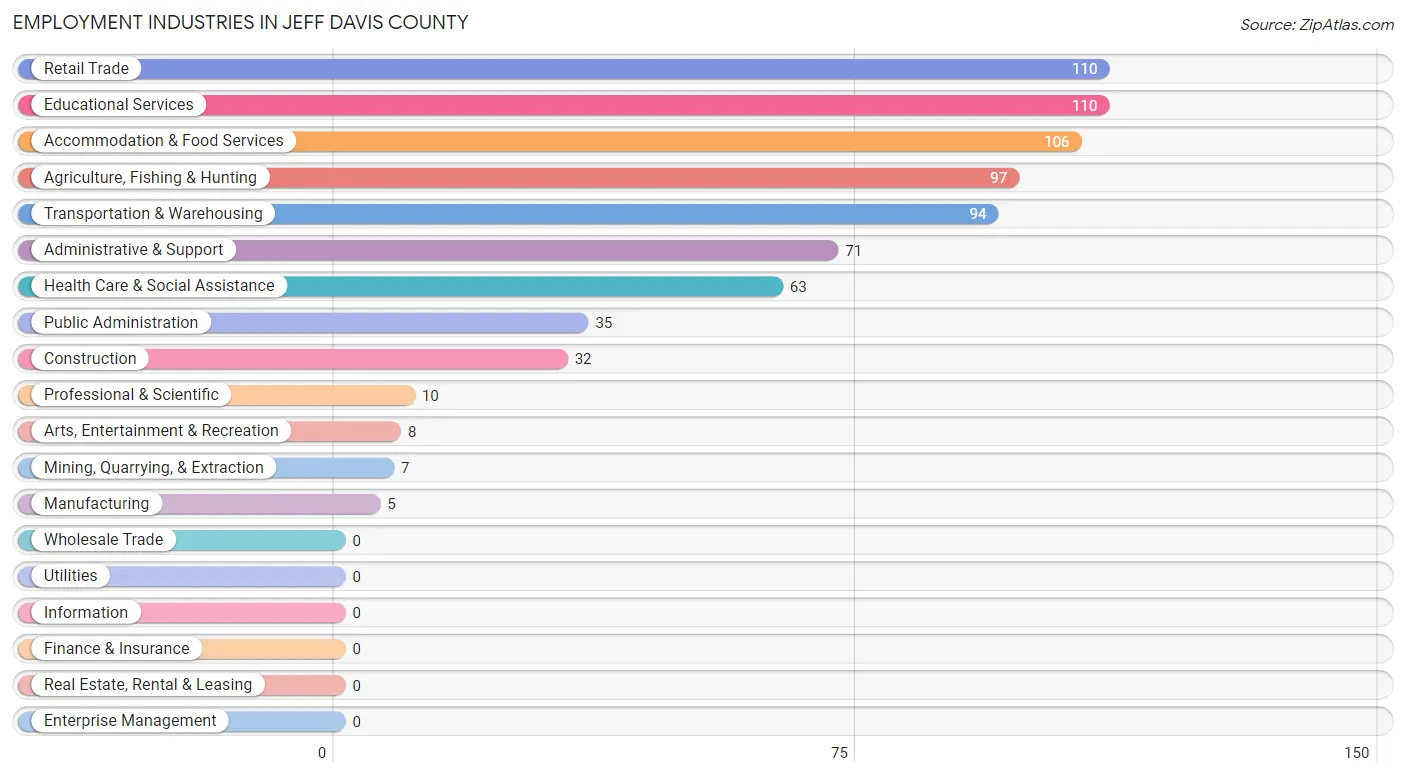
Employment Industries in Jeff Davis County
The major employment industries in Jeff Davis County include Retail Trade (110 | 14.7%), Educational Services (110 | 14.7%), Accommodation & Food Services (106 | 14.2%), Agriculture, Fishing & Hunting (97 | 13.0%), and Transportation & Warehousing (94 | 12.6%).
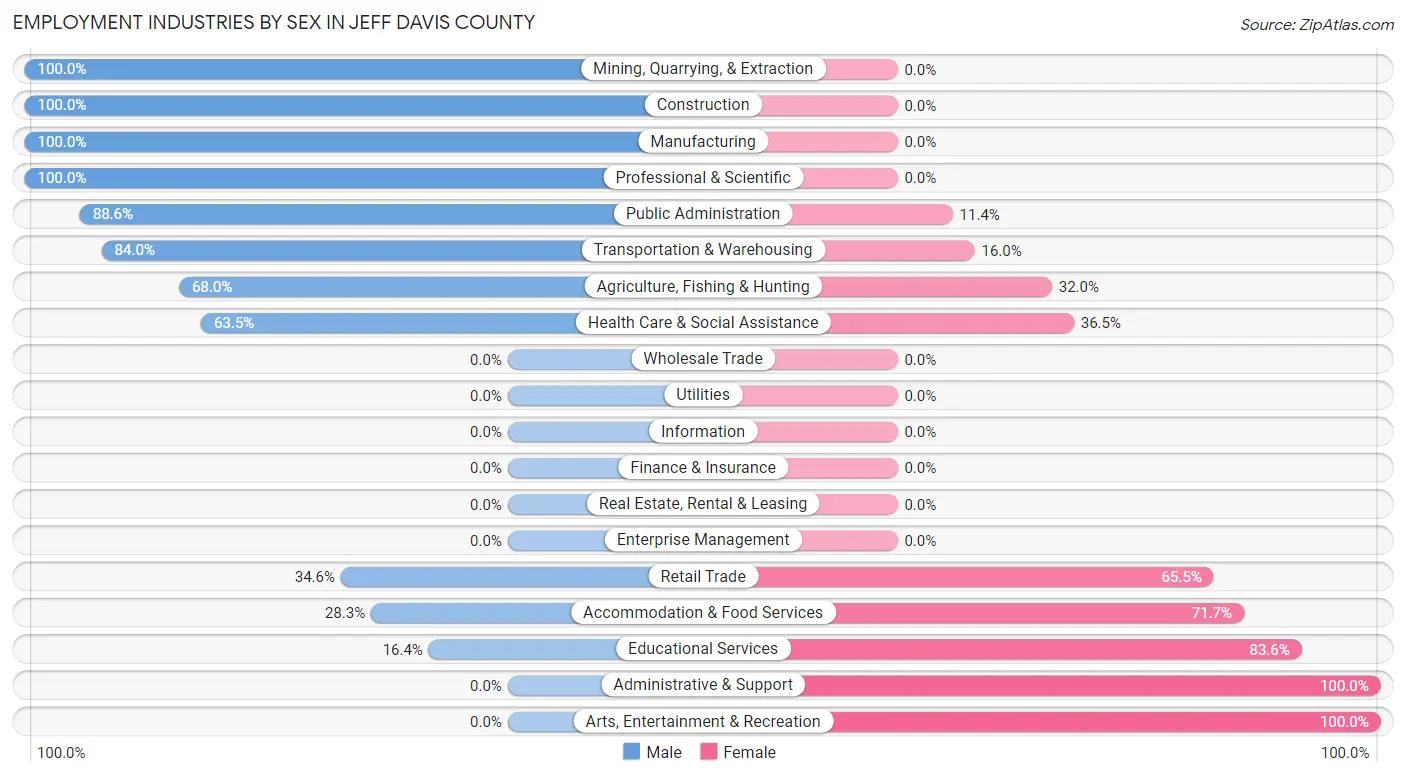
Employment Industries by Sex in Jeff Davis County
The Jeff Davis County industries that see more men than women are Mining, Quarrying, & Extraction (100.0%), Construction (100.0%), and Manufacturing (100.0%), whereas the industries that tend to have a higher number of women are Administrative & Support (100.0%), Arts, Entertainment & Recreation (100.0%), and Educational Services (83.6%).
| Industry | Male | Female |
| Agriculture, Fishing & Hunting | 66 (68.0%) | 31 (32.0%) |
| Mining, Quarrying, & Extraction | 7 (100.0%) | 0 (0.0%) |
| Construction | 32 (100.0%) | 0 (0.0%) |
| Manufacturing | 5 (100.0%) | 0 (0.0%) |
| Wholesale Trade | 0 (0.0%) | 0 (0.0%) |
| Retail Trade | 38 (34.5%) | 72 (65.4%) |
| Transportation & Warehousing | 79 (84.0%) | 15 (16.0%) |
| Utilities | 0 (0.0%) | 0 (0.0%) |
| Information | 0 (0.0%) | 0 (0.0%) |
| Finance & Insurance | 0 (0.0%) | 0 (0.0%) |
| Real Estate, Rental & Leasing | 0 (0.0%) | 0 (0.0%) |
| Professional & Scientific | 10 (100.0%) | 0 (0.0%) |
| Enterprise Management | 0 (0.0%) | 0 (0.0%) |
| Administrative & Support | 0 (0.0%) | 71 (100.0%) |
| Educational Services | 18 (16.4%) | 92 (83.6%) |
| Health Care & Social Assistance | 40 (63.5%) | 23 (36.5%) |
| Arts, Entertainment & Recreation | 0 (0.0%) | 8 (100.0%) |
| Accommodation & Food Services | 30 (28.3%) | 76 (71.7%) |
| Public Administration | 31 (88.6%) | 4 (11.4%) |
| Total | 356 (47.6%) | 392 (52.4%) |
Education in Jeff Davis County
School Enrollment in Jeff Davis County
The most common levels of schooling among the 219 students in Jeff Davis County are high school (105 | 47.9%), middle school (52 | 23.7%), and nursery / preschool (33 | 15.1%).
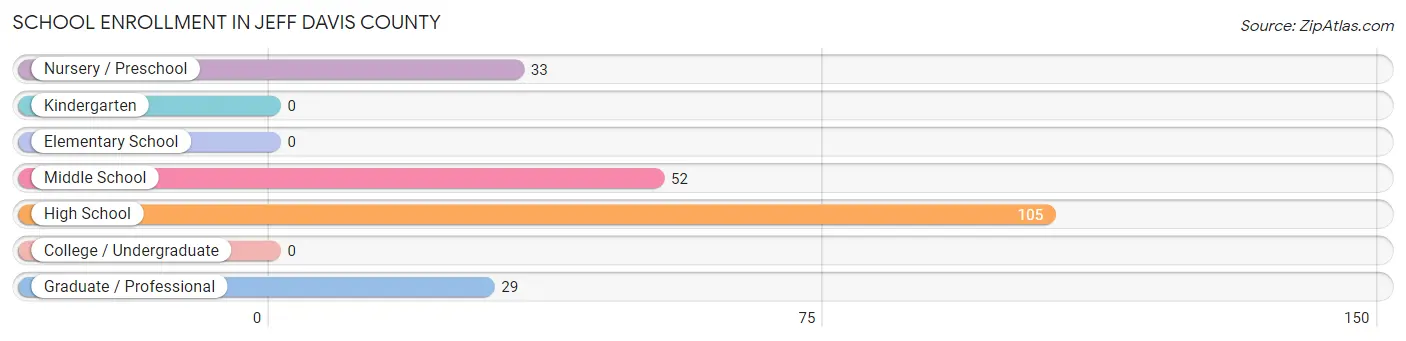
| School Level | # Students | % Students |
| Nursery / Preschool | 33 | 15.1% |
| Kindergarten | 0 | 0.0% |
| Elementary School | 0 | 0.0% |
| Middle School | 52 | 23.7% |
| High School | 105 | 47.9% |
| College / Undergraduate | 0 | 0.0% |
| Graduate / Professional | 29 | 13.2% |
| Total | 219 | 100.0% |
School Enrollment by Age by Funding Source in Jeff Davis County
Out of a total of 219 students who are enrolled in schools in Jeff Davis County, 7 (3.2%) attend a private institution, while the remaining 212 (96.8%) are enrolled in public schools. The age group of 15 to 17 year olds has the highest likelihood of being enrolled in private schools, with 7 (14.0% in the age bracket) enrolled. Conversely, the age group of 3 to 4 year olds has the lowest likelihood of being enrolled in a private school, with 33 (100.0% in the age bracket) attending a public institution.
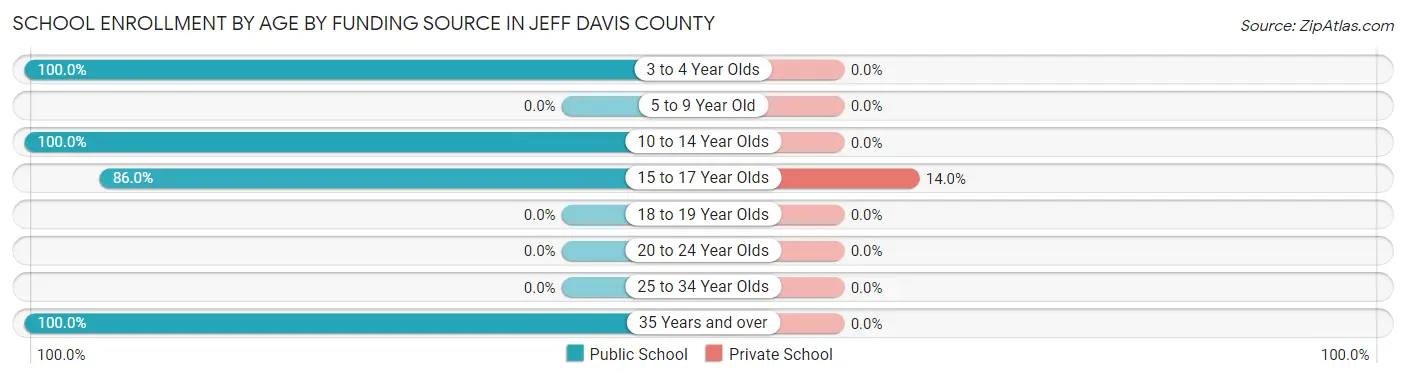
| Age Bracket | Public School | Private School |
| 3 to 4 Year Olds | 33 (100.0%) | 0 (0.0%) |
| 5 to 9 Year Old | 0 (0.0%) | 0 (0.0%) |
| 10 to 14 Year Olds | 107 (100.0%) | 0 (0.0%) |
| 15 to 17 Year Olds | 43 (86.0%) | 7 (14.0%) |
| 18 to 19 Year Olds | 0 (0.0%) | 0 (0.0%) |
| 20 to 24 Year Olds | 0 (0.0%) | 0 (0.0%) |
| 25 to 34 Year Olds | 0 (0.0%) | 0 (0.0%) |
| 35 Years and over | 29 (100.0%) | 0 (0.0%) |
| Total | 212 (96.8%) | 7 (3.2%) |
Educational Attainment by Field of Study in Jeff Davis County
Bio, nature & agricultural (120 | 22.1%), engineering (94 | 17.3%), education (83 | 15.3%), business (62 | 11.4%), and physical & health sciences (59 | 10.9%) are the most common fields of study among 543 individuals in Jeff Davis County who have obtained a bachelor's degree or higher.
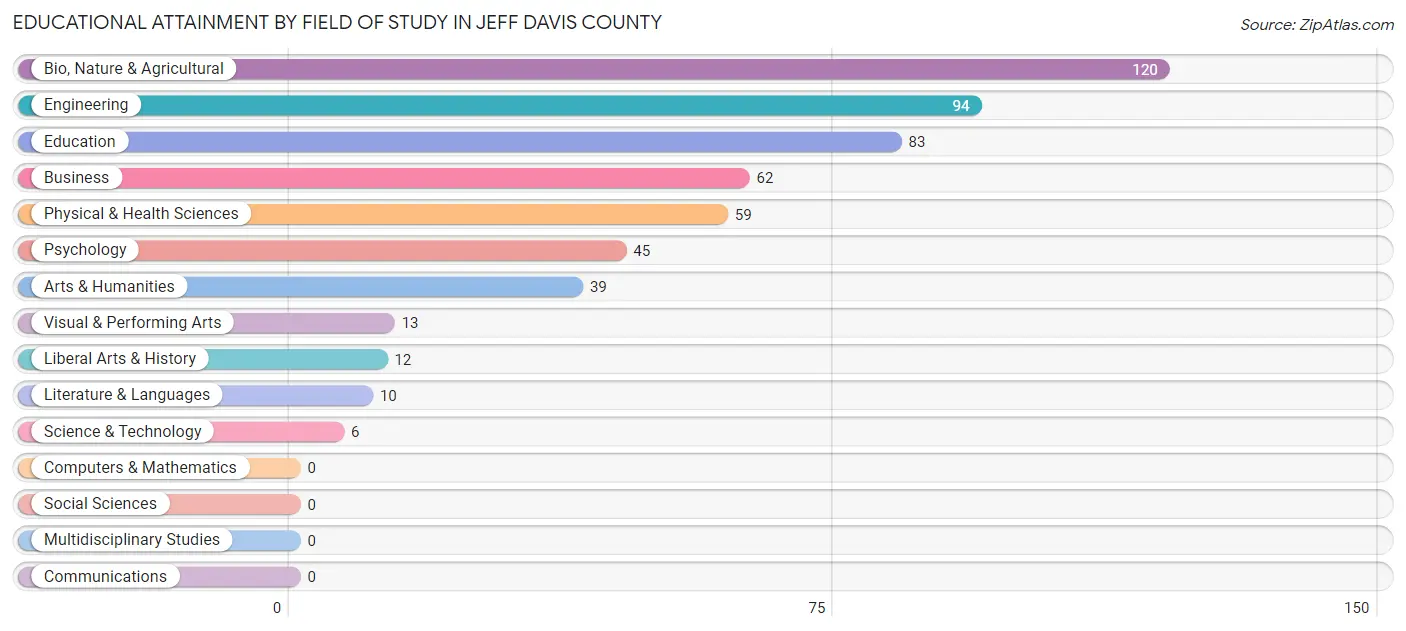
| Field of Study | # Graduates | % Graduates |
| Computers & Mathematics | 0 | 0.0% |
| Bio, Nature & Agricultural | 120 | 22.1% |
| Physical & Health Sciences | 59 | 10.9% |
| Psychology | 45 | 8.3% |
| Social Sciences | 0 | 0.0% |
| Engineering | 94 | 17.3% |
| Multidisciplinary Studies | 0 | 0.0% |
| Science & Technology | 6 | 1.1% |
| Business | 62 | 11.4% |
| Education | 83 | 15.3% |
| Literature & Languages | 10 | 1.8% |
| Liberal Arts & History | 12 | 2.2% |
| Visual & Performing Arts | 13 | 2.4% |
| Communications | 0 | 0.0% |
| Arts & Humanities | 39 | 7.2% |
| Total | 543 | 100.0% |
Transportation & Commute in Jeff Davis County
Vehicle Availability by Sex in Jeff Davis County
The most prevalent vehicle ownership categories in Jeff Davis County are males with 3 vehicles (177, accounting for 53.5%) and females with 3 vehicles (143, making up 48.0%).
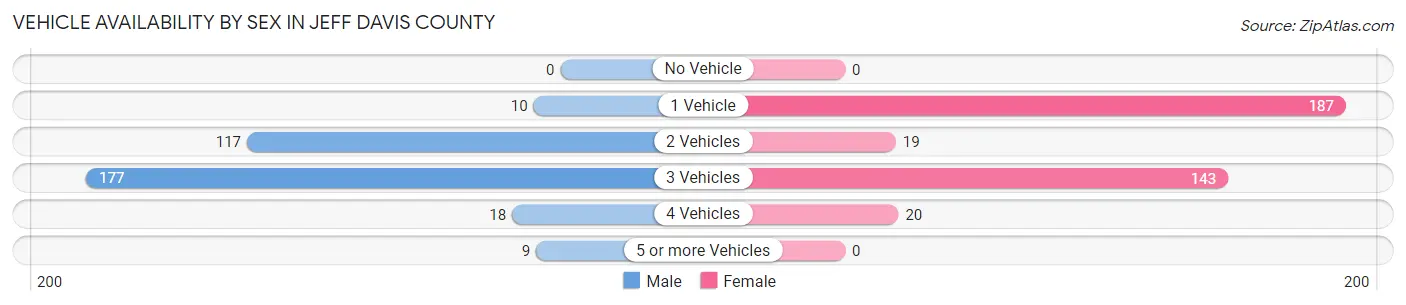
| Vehicles Available | Male | Female |
| No Vehicle | 0 (0.0%) | 0 (0.0%) |
| 1 Vehicle | 10 (3.0%) | 187 (50.7%) |
| 2 Vehicles | 117 (35.3%) | 19 (5.1%) |
| 3 Vehicles | 177 (53.5%) | 143 (38.8%) |
| 4 Vehicles | 18 (5.4%) | 20 (5.4%) |
| 5 or more Vehicles | 9 (2.7%) | 0 (0.0%) |
| Total | 331 (100.0%) | 369 (100.0%) |
Commute Time in Jeff Davis County
The most frequently occuring commute durations in Jeff Davis County are 5 to 9 minutes (160 commuters, 29.5%), less than 5 minutes (115 commuters, 21.2%), and 45 to 59 minutes (73 commuters, 13.5%).
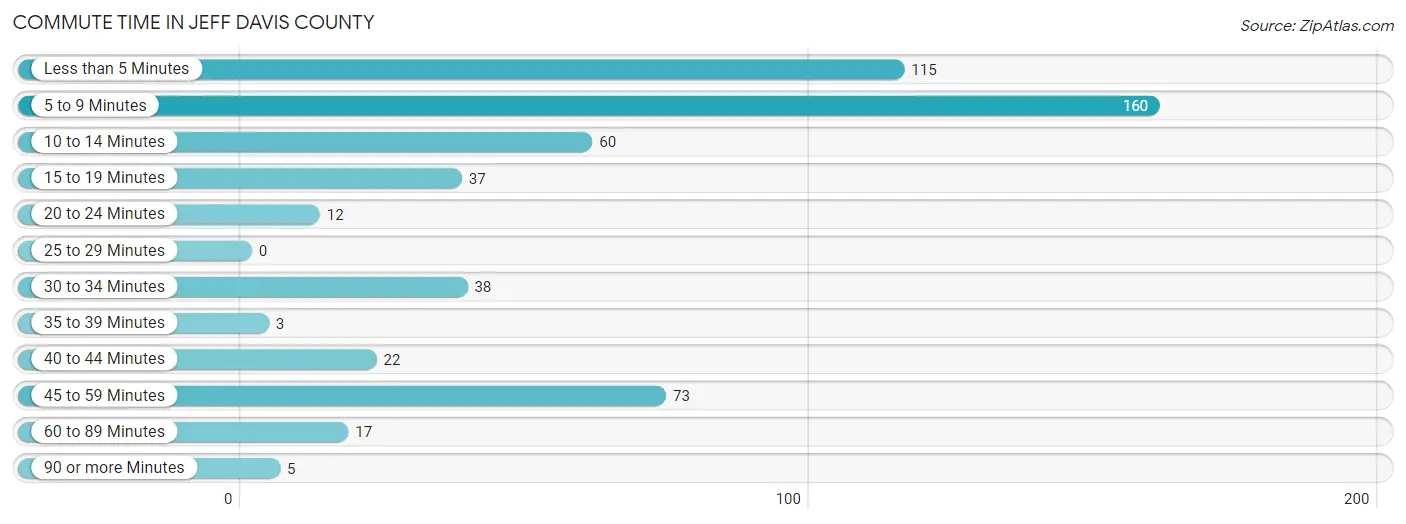
| Commute Time | # Commuters | % Commuters |
| Less than 5 Minutes | 115 | 21.2% |
| 5 to 9 Minutes | 160 | 29.5% |
| 10 to 14 Minutes | 60 | 11.1% |
| 15 to 19 Minutes | 37 | 6.8% |
| 20 to 24 Minutes | 12 | 2.2% |
| 25 to 29 Minutes | 0 | 0.0% |
| 30 to 34 Minutes | 38 | 7.0% |
| 35 to 39 Minutes | 3 | 0.5% |
| 40 to 44 Minutes | 22 | 4.1% |
| 45 to 59 Minutes | 73 | 13.5% |
| 60 to 89 Minutes | 17 | 3.1% |
| 90 or more Minutes | 5 | 0.9% |
Commute Time by Sex in Jeff Davis County
The most common commute times in Jeff Davis County are less than 5 minutes (50 commuters, 21.4%) for males and 5 to 9 minutes (139 commuters, 45.1%) for females.
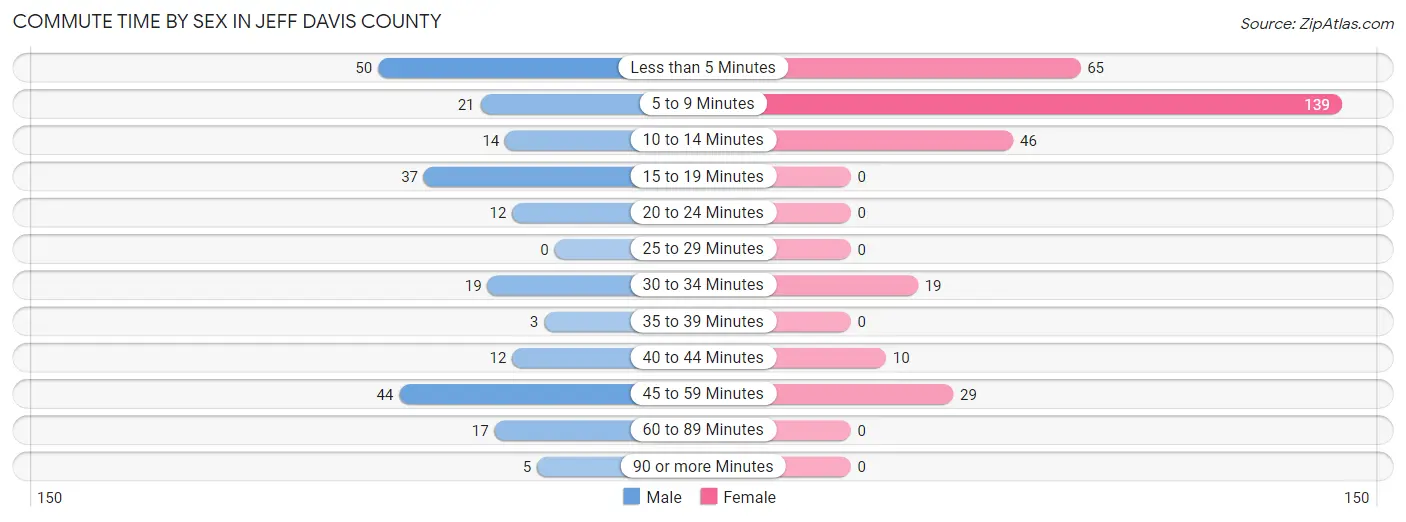
| Commute Time | Male | Female |
| Less than 5 Minutes | 50 (21.4%) | 65 (21.1%) |
| 5 to 9 Minutes | 21 (9.0%) | 139 (45.1%) |
| 10 to 14 Minutes | 14 (6.0%) | 46 (14.9%) |
| 15 to 19 Minutes | 37 (15.8%) | 0 (0.0%) |
| 20 to 24 Minutes | 12 (5.1%) | 0 (0.0%) |
| 25 to 29 Minutes | 0 (0.0%) | 0 (0.0%) |
| 30 to 34 Minutes | 19 (8.1%) | 19 (6.2%) |
| 35 to 39 Minutes | 3 (1.3%) | 0 (0.0%) |
| 40 to 44 Minutes | 12 (5.1%) | 10 (3.3%) |
| 45 to 59 Minutes | 44 (18.8%) | 29 (9.4%) |
| 60 to 89 Minutes | 17 (7.3%) | 0 (0.0%) |
| 90 or more Minutes | 5 (2.1%) | 0 (0.0%) |
Time of Departure to Work by Sex in Jeff Davis County
The most frequent times of departure to work in Jeff Davis County are 7:30 AM to 7:59 AM (66, 28.2%) for males and 7:00 AM to 7:29 AM (101, 32.8%) for females.
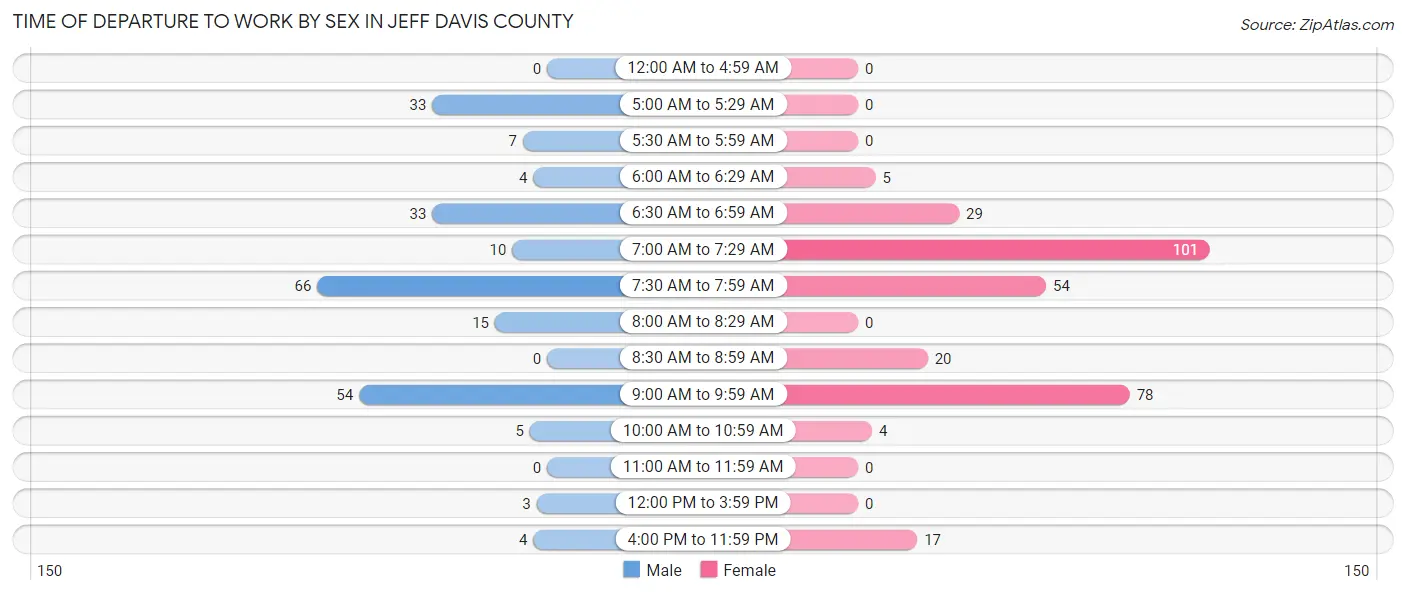
| Time of Departure | Male | Female |
| 12:00 AM to 4:59 AM | 0 (0.0%) | 0 (0.0%) |
| 5:00 AM to 5:29 AM | 33 (14.1%) | 0 (0.0%) |
| 5:30 AM to 5:59 AM | 7 (3.0%) | 0 (0.0%) |
| 6:00 AM to 6:29 AM | 4 (1.7%) | 5 (1.6%) |
| 6:30 AM to 6:59 AM | 33 (14.1%) | 29 (9.4%) |
| 7:00 AM to 7:29 AM | 10 (4.3%) | 101 (32.8%) |
| 7:30 AM to 7:59 AM | 66 (28.2%) | 54 (17.5%) |
| 8:00 AM to 8:29 AM | 15 (6.4%) | 0 (0.0%) |
| 8:30 AM to 8:59 AM | 0 (0.0%) | 20 (6.5%) |
| 9:00 AM to 9:59 AM | 54 (23.1%) | 78 (25.3%) |
| 10:00 AM to 10:59 AM | 5 (2.1%) | 4 (1.3%) |
| 11:00 AM to 11:59 AM | 0 (0.0%) | 0 (0.0%) |
| 12:00 PM to 3:59 PM | 3 (1.3%) | 0 (0.0%) |
| 4:00 PM to 11:59 PM | 4 (1.7%) | 17 (5.5%) |
| Total | 234 (100.0%) | 308 (100.0%) |
Housing Occupancy in Jeff Davis County
Occupancy by Ownership in Jeff Davis County
Of the total 1,095 dwellings in Jeff Davis County, owner-occupied units account for 978 (89.3%), while renter-occupied units make up 117 (10.7%).
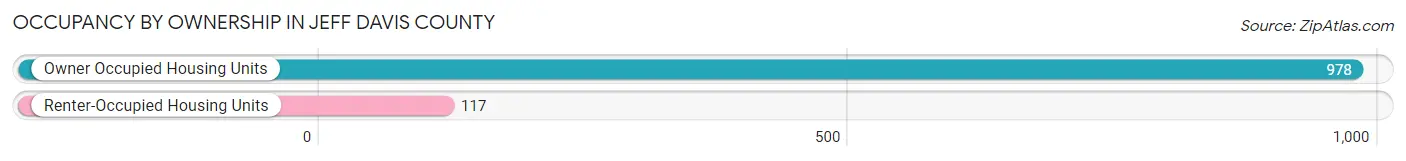
| Occupancy | # Housing Units | % Housing Units |
| Owner Occupied Housing Units | 978 | 89.3% |
| Renter-Occupied Housing Units | 117 | 10.7% |
| Total Occupied Housing Units | 1,095 | 100.0% |
Occupancy by Household Size in Jeff Davis County
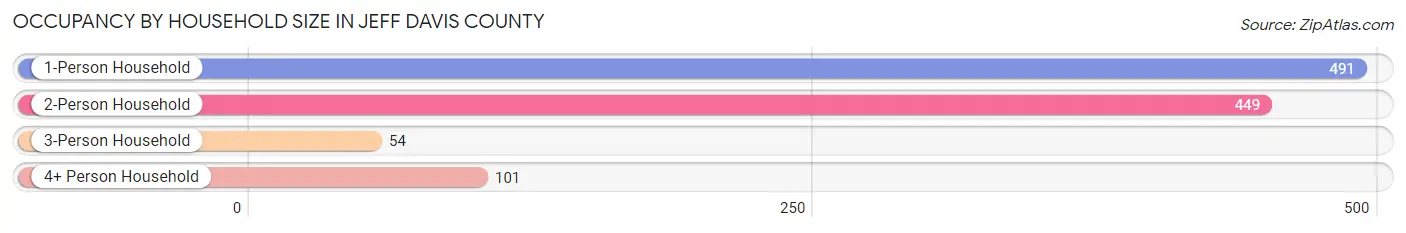
| Household Size | # Housing Units | % Housing Units |
| 1-Person Household | 491 | 44.8% |
| 2-Person Household | 449 | 41.0% |
| 3-Person Household | 54 | 4.9% |
| 4+ Person Household | 101 | 9.2% |
| Total Housing Units | 1,095 | 100.0% |
Occupancy by Ownership by Household Size in Jeff Davis County
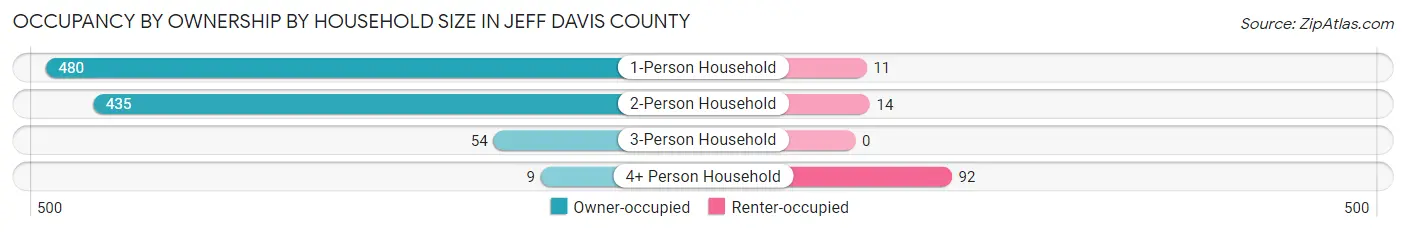
| Household Size | Owner-occupied | Renter-occupied |
| 1-Person Household | 480 (97.8%) | 11 (2.2%) |
| 2-Person Household | 435 (96.9%) | 14 (3.1%) |
| 3-Person Household | 54 (100.0%) | 0 (0.0%) |
| 4+ Person Household | 9 (8.9%) | 92 (91.1%) |
| Total Housing Units | 978 (89.3%) | 117 (10.7%) |
Occupancy by Educational Attainment in Jeff Davis County
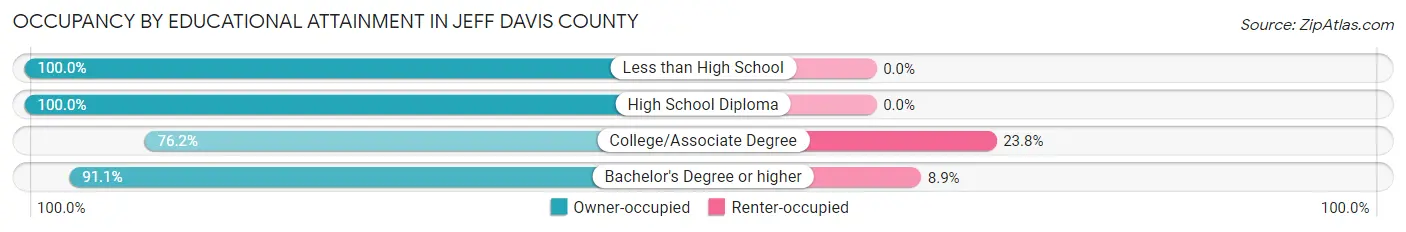
| Household Size | Owner-occupied | Renter-occupied |
| Less than High School | 195 (100.0%) | 0 (0.0%) |
| High School Diploma | 210 (100.0%) | 0 (0.0%) |
| College/Associate Degree | 285 (76.2%) | 89 (23.8%) |
| Bachelor's Degree or higher | 288 (91.1%) | 28 (8.9%) |
Occupancy by Age of Householder in Jeff Davis County
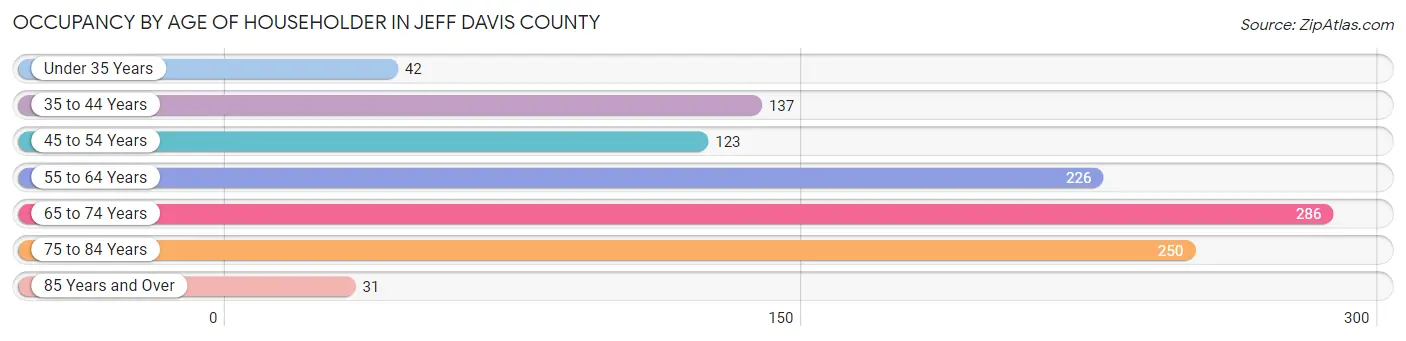
| Age Bracket | # Households | % Households |
| Under 35 Years | 42 | 3.8% |
| 35 to 44 Years | 137 | 12.5% |
| 45 to 54 Years | 123 | 11.2% |
| 55 to 64 Years | 226 | 20.6% |
| 65 to 74 Years | 286 | 26.1% |
| 75 to 84 Years | 250 | 22.8% |
| 85 Years and Over | 31 | 2.8% |
| Total | 1,095 | 100.0% |
Housing Finances in Jeff Davis County
Median Income by Occupancy in Jeff Davis County
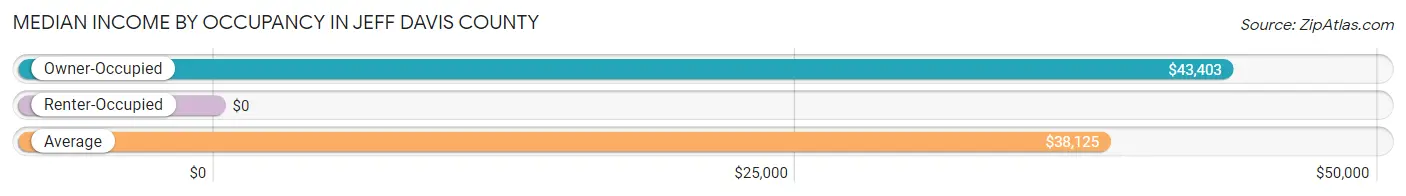
| Occupancy Type | # Households | Median Income |
| Owner-Occupied | 978 (89.3%) | $43,403 |
| Renter-Occupied | 117 (10.7%) | $0 |
| Average | 1,095 (100.0%) | $38,125 |
Occupancy by Householder Income Bracket in Jeff Davis County
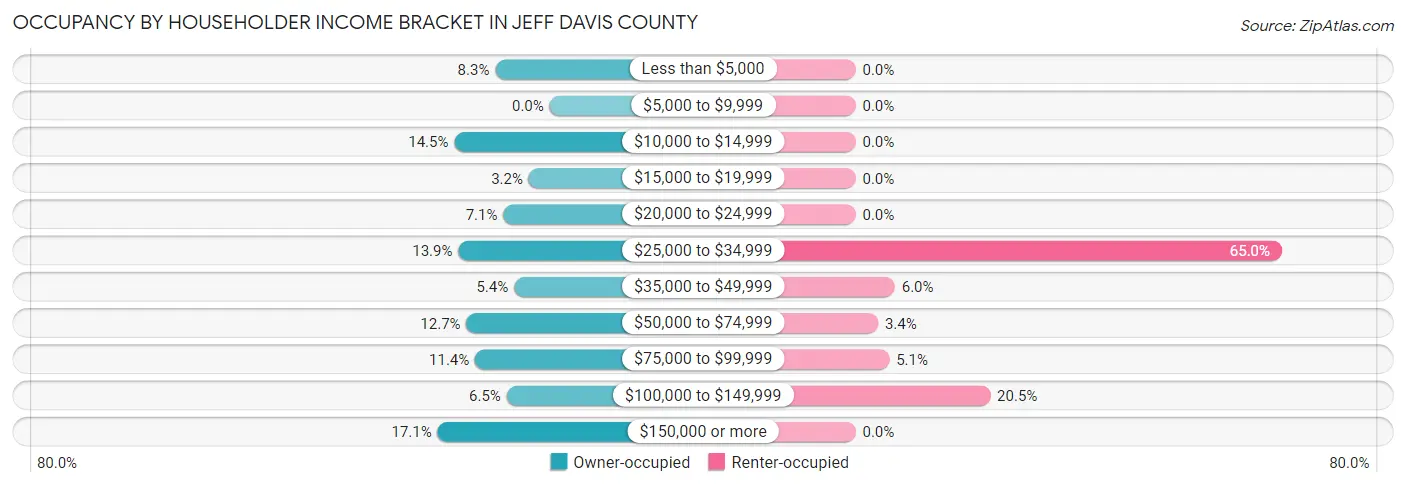
| Income Bracket | Owner-occupied | Renter-occupied |
| Less than $5,000 | 81 (8.3%) | 0 (0.0%) |
| $5,000 to $9,999 | 0 (0.0%) | 0 (0.0%) |
| $10,000 to $14,999 | 142 (14.5%) | 0 (0.0%) |
| $15,000 to $19,999 | 31 (3.2%) | 0 (0.0%) |
| $20,000 to $24,999 | 69 (7.1%) | 0 (0.0%) |
| $25,000 to $34,999 | 136 (13.9%) | 76 (65.0%) |
| $35,000 to $49,999 | 53 (5.4%) | 7 (6.0%) |
| $50,000 to $74,999 | 124 (12.7%) | 4 (3.4%) |
| $75,000 to $99,999 | 111 (11.4%) | 6 (5.1%) |
| $100,000 to $149,999 | 64 (6.5%) | 24 (20.5%) |
| $150,000 or more | 167 (17.1%) | 0 (0.0%) |
| Total | 978 (100.0%) | 117 (100.0%) |
Monthly Housing Cost Tiers in Jeff Davis County
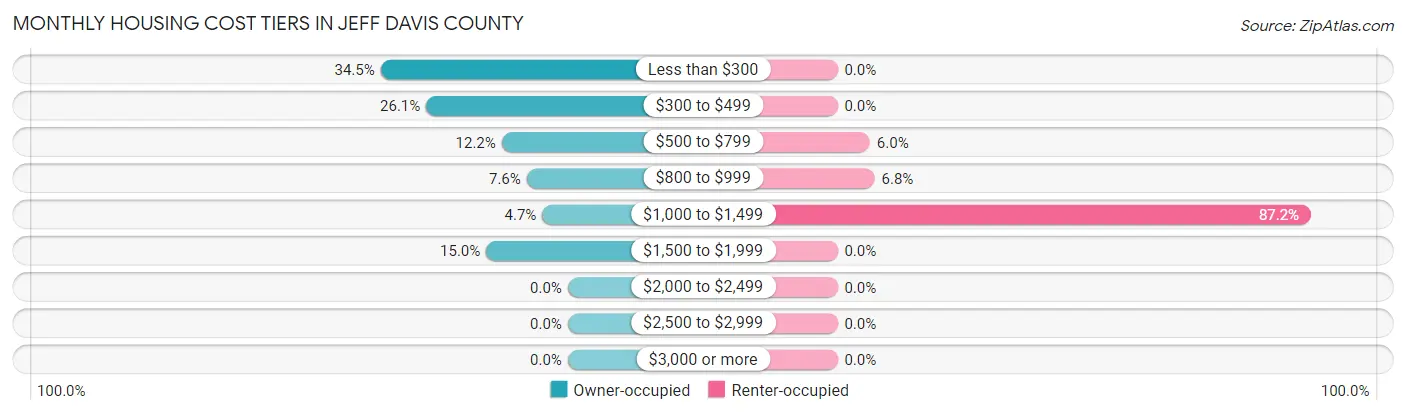
| Monthly Cost | Owner-occupied | Renter-occupied |
| Less than $300 | 337 (34.5%) | 0 (0.0%) |
| $300 to $499 | 255 (26.1%) | 0 (0.0%) |
| $500 to $799 | 119 (12.2%) | 7 (6.0%) |
| $800 to $999 | 74 (7.6%) | 8 (6.8%) |
| $1,000 to $1,499 | 46 (4.7%) | 102 (87.2%) |
| $1,500 to $1,999 | 147 (15.0%) | 0 (0.0%) |
| $2,000 to $2,499 | 0 (0.0%) | 0 (0.0%) |
| $2,500 to $2,999 | 0 (0.0%) | 0 (0.0%) |
| $3,000 or more | 0 (0.0%) | 0 (0.0%) |
| Total | 978 (100.0%) | 117 (100.0%) |
Physical Housing Characteristics in Jeff Davis County
Housing Structures in Jeff Davis County
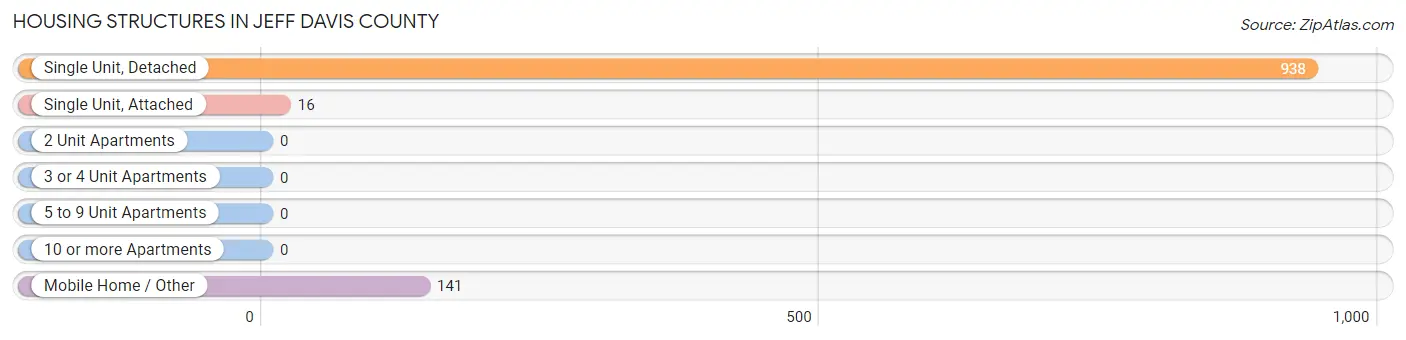
| Structure Type | # Housing Units | % Housing Units |
| Single Unit, Detached | 938 | 85.7% |
| Single Unit, Attached | 16 | 1.5% |
| 2 Unit Apartments | 0 | 0.0% |
| 3 or 4 Unit Apartments | 0 | 0.0% |
| 5 to 9 Unit Apartments | 0 | 0.0% |
| 10 or more Apartments | 0 | 0.0% |
| Mobile Home / Other | 141 | 12.9% |
| Total | 1,095 | 100.0% |
Housing Structures by Occupancy in Jeff Davis County
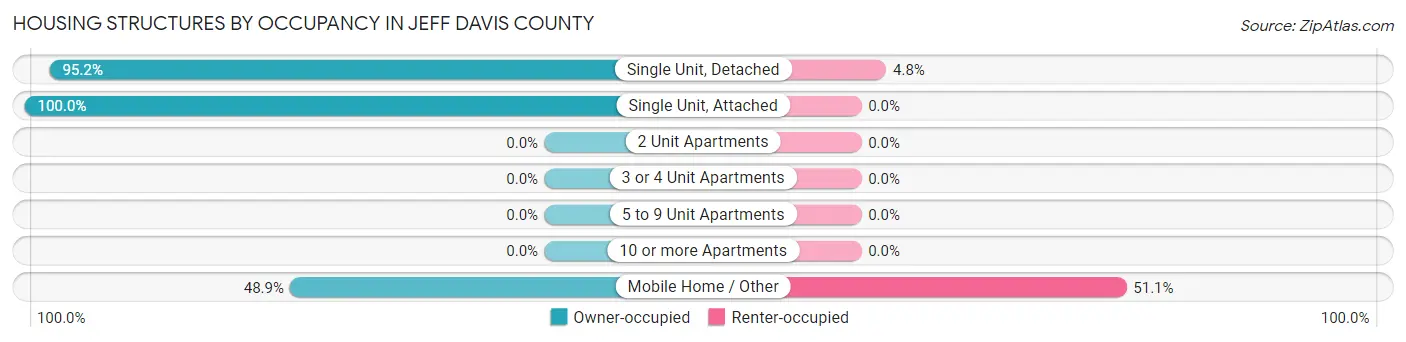
| Structure Type | Owner-occupied | Renter-occupied |
| Single Unit, Detached | 893 (95.2%) | 45 (4.8%) |
| Single Unit, Attached | 16 (100.0%) | 0 (0.0%) |
| 2 Unit Apartments | 0 (0.0%) | 0 (0.0%) |
| 3 or 4 Unit Apartments | 0 (0.0%) | 0 (0.0%) |
| 5 to 9 Unit Apartments | 0 (0.0%) | 0 (0.0%) |
| 10 or more Apartments | 0 (0.0%) | 0 (0.0%) |
| Mobile Home / Other | 69 (48.9%) | 72 (51.1%) |
| Total | 978 (89.3%) | 117 (10.7%) |
Housing Structures by Number of Rooms in Jeff Davis County
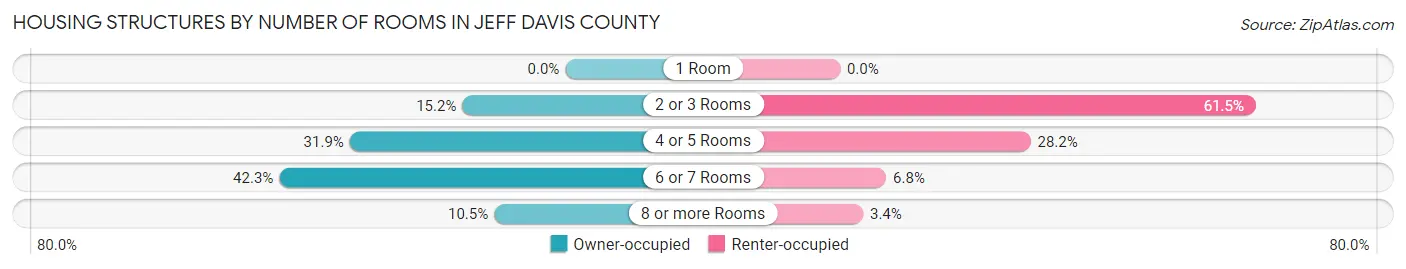
| Number of Rooms | Owner-occupied | Renter-occupied |
| 1 Room | 0 (0.0%) | 0 (0.0%) |
| 2 or 3 Rooms | 149 (15.2%) | 72 (61.5%) |
| 4 or 5 Rooms | 312 (31.9%) | 33 (28.2%) |
| 6 or 7 Rooms | 414 (42.3%) | 8 (6.8%) |
| 8 or more Rooms | 103 (10.5%) | 4 (3.4%) |
| Total | 978 (100.0%) | 117 (100.0%) |
Housing Structure by Heating Type in Jeff Davis County
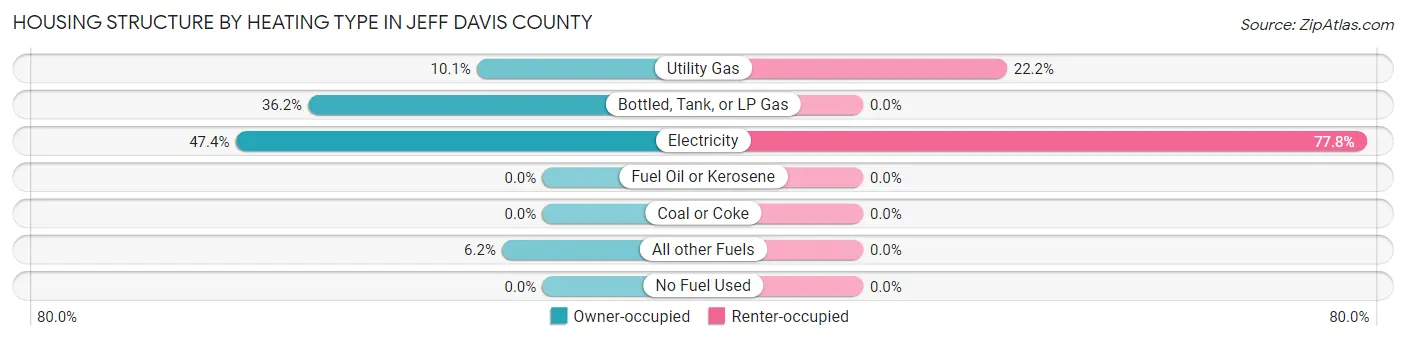
| Heating Type | Owner-occupied | Renter-occupied |
| Utility Gas | 99 (10.1%) | 26 (22.2%) |
| Bottled, Tank, or LP Gas | 354 (36.2%) | 0 (0.0%) |
| Electricity | 464 (47.4%) | 91 (77.8%) |
| Fuel Oil or Kerosene | 0 (0.0%) | 0 (0.0%) |
| Coal or Coke | 0 (0.0%) | 0 (0.0%) |
| All other Fuels | 61 (6.2%) | 0 (0.0%) |
| No Fuel Used | 0 (0.0%) | 0 (0.0%) |
| Total | 978 (100.0%) | 117 (100.0%) |
Household Vehicle Usage in Jeff Davis County
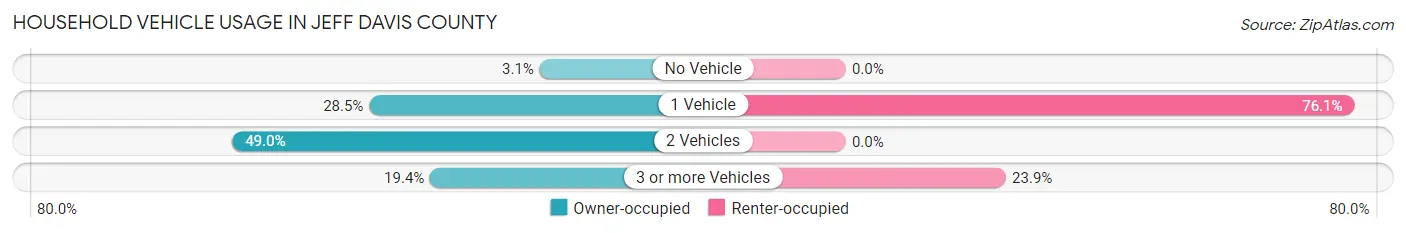
| Vehicles per Household | Owner-occupied | Renter-occupied |
| No Vehicle | 30 (3.1%) | 0 (0.0%) |
| 1 Vehicle | 279 (28.5%) | 89 (76.1%) |
| 2 Vehicles | 479 (49.0%) | 0 (0.0%) |
| 3 or more Vehicles | 190 (19.4%) | 28 (23.9%) |
| Total | 978 (100.0%) | 117 (100.0%) |
Real Estate & Mortgages in Jeff Davis County
Real Estate and Mortgage Overview in Jeff Davis County
| Characteristic | Without Mortgage | With Mortgage |
| Housing Units | 742 | 236 |
| Median Property Value | $158,400 | $213,600 |
| Median Household Income | $31,000 | $130 |
| Monthly Housing Costs | $323 | $0 |
| Real Estate Taxes | $1,160 | $0 |
Property Value by Mortgage Status in Jeff Davis County
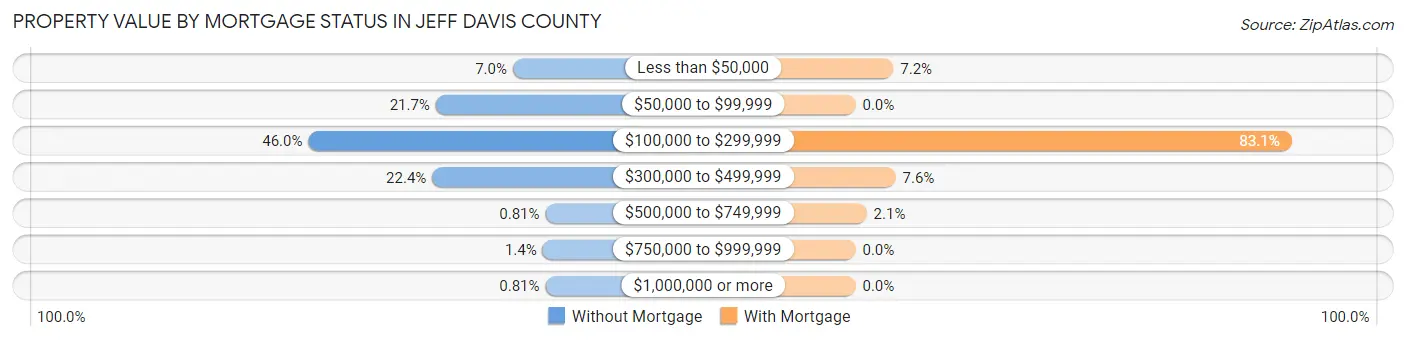
| Property Value | Without Mortgage | With Mortgage |
| Less than $50,000 | 52 (7.0%) | 17 (7.2%) |
| $50,000 to $99,999 | 161 (21.7%) | 0 (0.0%) |
| $100,000 to $299,999 | 341 (46.0%) | 196 (83.1%) |
| $300,000 to $499,999 | 166 (22.4%) | 18 (7.6%) |
| $500,000 to $749,999 | 6 (0.8%) | 5 (2.1%) |
| $750,000 to $999,999 | 10 (1.3%) | 0 (0.0%) |
| $1,000,000 or more | 6 (0.8%) | 0 (0.0%) |
| Total | 742 (100.0%) | 236 (100.0%) |
Household Income by Mortgage Status in Jeff Davis County
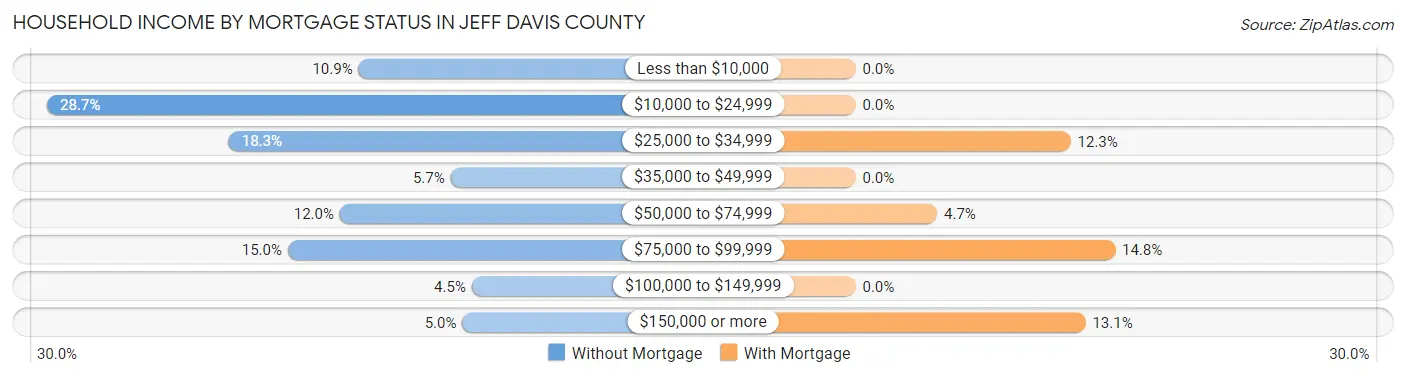
| Household Income | Without Mortgage | With Mortgage |
| Less than $10,000 | 81 (10.9%) | 0 (0.0%) |
| $10,000 to $24,999 | 213 (28.7%) | 0 (0.0%) |
| $25,000 to $34,999 | 136 (18.3%) | 29 (12.3%) |
| $35,000 to $49,999 | 42 (5.7%) | 0 (0.0%) |
| $50,000 to $74,999 | 89 (12.0%) | 11 (4.7%) |
| $75,000 to $99,999 | 111 (15.0%) | 35 (14.8%) |
| $100,000 to $149,999 | 33 (4.4%) | 0 (0.0%) |
| $150,000 or more | 37 (5.0%) | 31 (13.1%) |
| Total | 742 (100.0%) | 236 (100.0%) |
Property Value to Household Income Ratio in Jeff Davis County
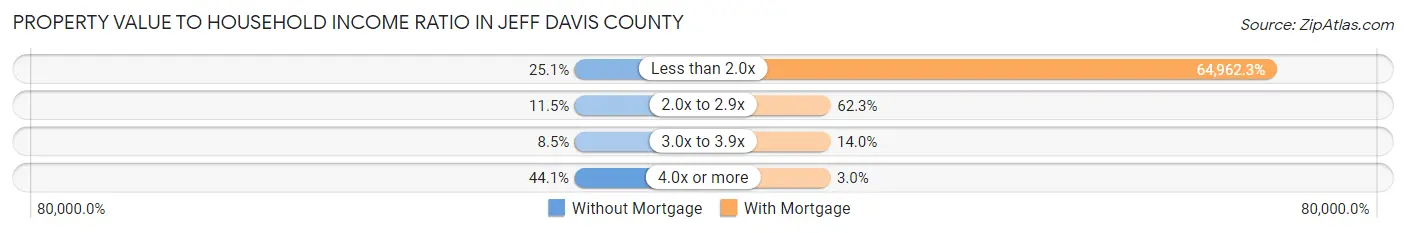
| Value-to-Income Ratio | Without Mortgage | With Mortgage |
| Less than 2.0x | 186 (25.1%) | 153,311 (64,962.3%) |
| 2.0x to 2.9x | 85 (11.5%) | 147 (62.3%) |
| 3.0x to 3.9x | 63 (8.5%) | 33 (14.0%) |
| 4.0x or more | 327 (44.1%) | 7 (3.0%) |
| Total | 742 (100.0%) | 236 (100.0%) |
Real Estate Taxes by Mortgage Status in Jeff Davis County
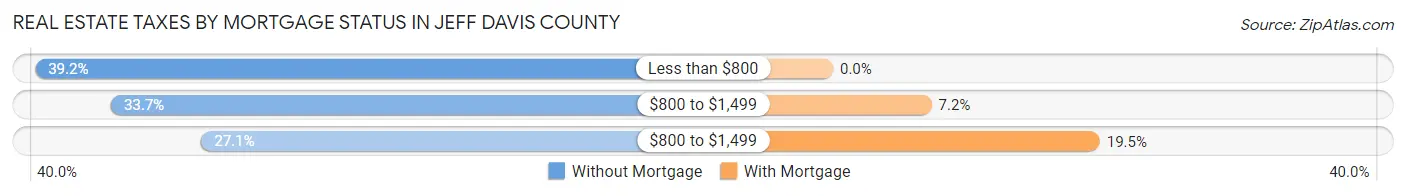
| Property Taxes | Without Mortgage | With Mortgage |
| Less than $800 | 291 (39.2%) | 0 (0.0%) |
| $800 to $1,499 | 250 (33.7%) | 17 (7.2%) |
| $800 to $1,499 | 201 (27.1%) | 46 (19.5%) |
| Total | 742 (100.0%) | 236 (100.0%) |
Health & Disability in Jeff Davis County
Health Insurance Coverage by Age in Jeff Davis County
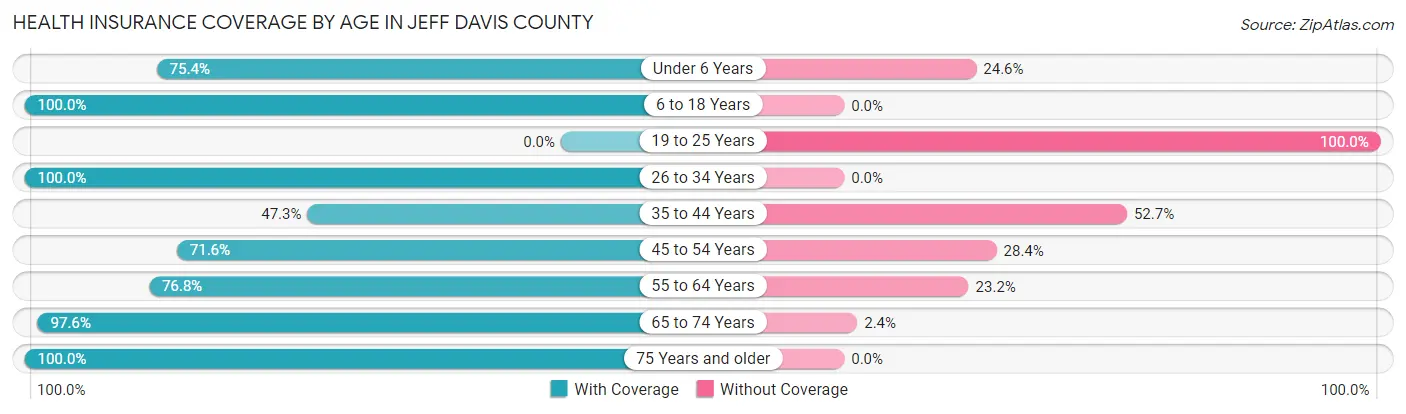
| Age Bracket | With Coverage | Without Coverage |
| Under 6 Years | 101 (75.4%) | 33 (24.6%) |
| 6 to 18 Years | 130 (100.0%) | 0 (0.0%) |
| 19 to 25 Years | 0 (0.0%) | 67 (100.0%) |
| 26 to 34 Years | 98 (100.0%) | 0 (0.0%) |
| 35 to 44 Years | 87 (47.3%) | 97 (52.7%) |
| 45 to 54 Years | 116 (71.6%) | 46 (28.4%) |
| 55 to 64 Years | 265 (76.8%) | 80 (23.2%) |
| 65 to 74 Years | 483 (97.6%) | 12 (2.4%) |
| 75 Years and older | 336 (100.0%) | 0 (0.0%) |
| Total | 1,616 (82.8%) | 335 (17.2%) |
Health Insurance Coverage by Citizenship Status in Jeff Davis County
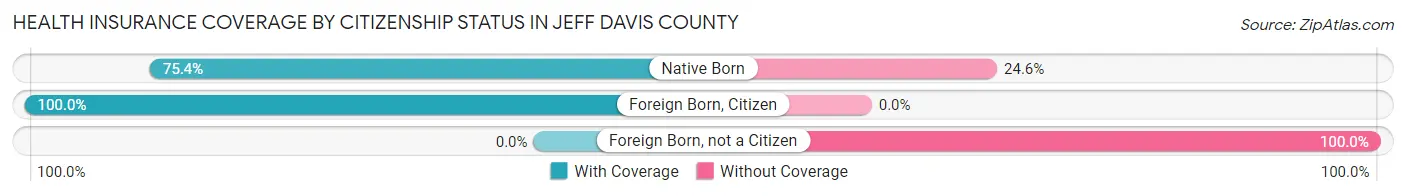
| Citizenship Status | With Coverage | Without Coverage |
| Native Born | 101 (75.4%) | 33 (24.6%) |
| Foreign Born, Citizen | 130 (100.0%) | 0 (0.0%) |
| Foreign Born, not a Citizen | 0 (0.0%) | 67 (100.0%) |
Health Insurance Coverage by Household Income in Jeff Davis County
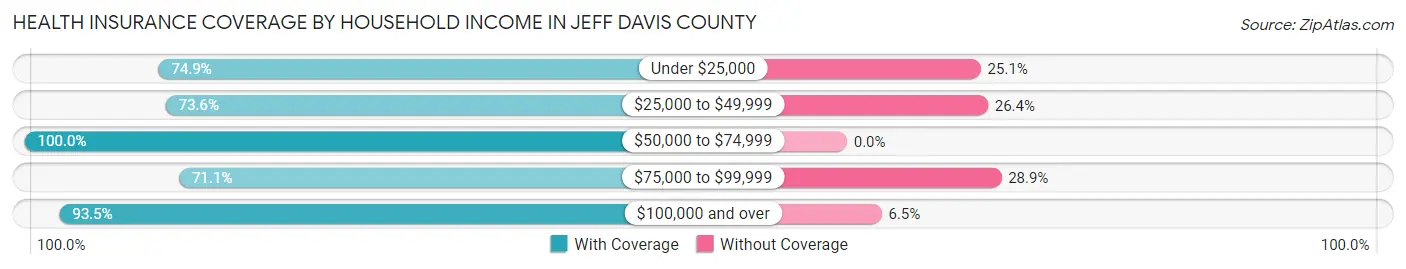
| Household Income | With Coverage | Without Coverage |
| Under $25,000 | 242 (74.9%) | 81 (25.1%) |
| $25,000 to $49,999 | 471 (73.6%) | 169 (26.4%) |
| $50,000 to $74,999 | 230 (100.0%) | 0 (0.0%) |
| $75,000 to $99,999 | 113 (71.1%) | 46 (28.9%) |
| $100,000 and over | 560 (93.5%) | 39 (6.5%) |
Public vs Private Health Insurance Coverage by Age in Jeff Davis County
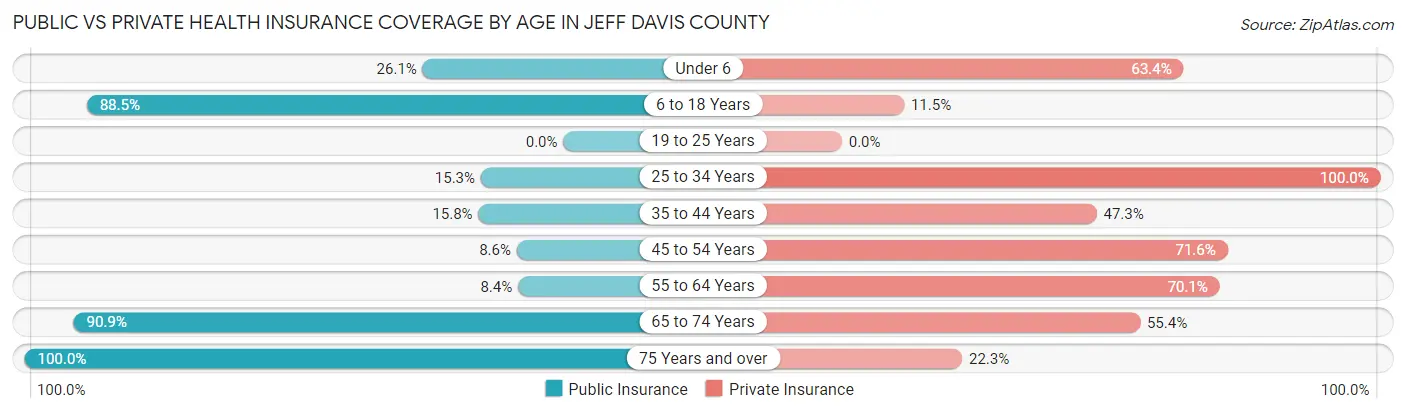
| Age Bracket | Public Insurance | Private Insurance |
| Under 6 | 35 (26.1%) | 85 (63.4%) |
| 6 to 18 Years | 115 (88.5%) | 15 (11.5%) |
| 19 to 25 Years | 0 (0.0%) | 0 (0.0%) |
| 25 to 34 Years | 15 (15.3%) | 98 (100.0%) |
| 35 to 44 Years | 29 (15.8%) | 87 (47.3%) |
| 45 to 54 Years | 14 (8.6%) | 116 (71.6%) |
| 55 to 64 Years | 29 (8.4%) | 242 (70.1%) |
| 65 to 74 Years | 450 (90.9%) | 274 (55.3%) |
| 75 Years and over | 336 (100.0%) | 75 (22.3%) |
| Total | 1,023 (52.4%) | 992 (50.8%) |
Disability Status by Sex by Age in Jeff Davis County
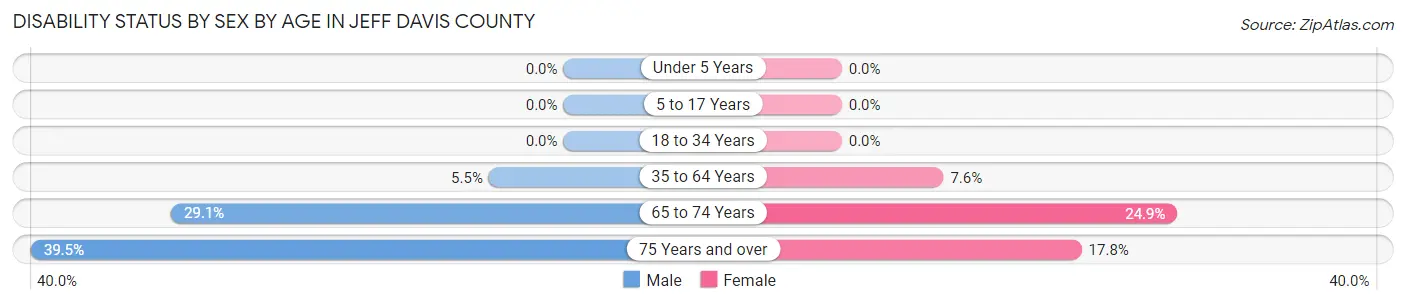
| Age Bracket | Male | Female |
| Under 5 Years | 0 (0.0%) | 0 (0.0%) |
| 5 to 17 Years | 0 (0.0%) | 0 (0.0%) |
| 18 to 34 Years | 0 (0.0%) | 0 (0.0%) |
| 35 to 64 Years | 17 (5.5%) | 29 (7.5%) |
| 65 to 74 Years | 67 (29.1%) | 66 (24.9%) |
| 75 Years and over | 104 (39.5%) | 13 (17.8%) |
Disability Class by Sex by Age in Jeff Davis County
Disability Class: Hearing Difficulty
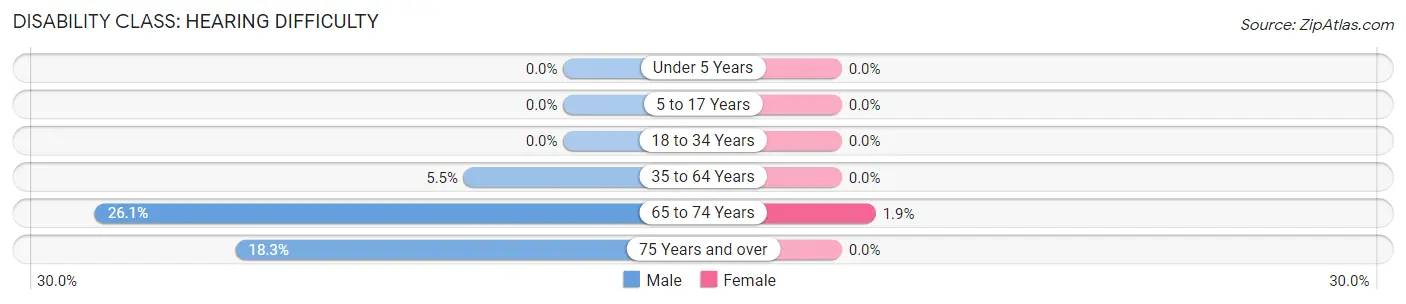
| Age Bracket | Male | Female |
| Under 5 Years | 0 (0.0%) | 0 (0.0%) |
| 5 to 17 Years | 0 (0.0%) | 0 (0.0%) |
| 18 to 34 Years | 0 (0.0%) | 0 (0.0%) |
| 35 to 64 Years | 17 (5.5%) | 0 (0.0%) |
| 65 to 74 Years | 60 (26.1%) | 5 (1.9%) |
| 75 Years and over | 48 (18.2%) | 0 (0.0%) |
Disability Class: Vision Difficulty
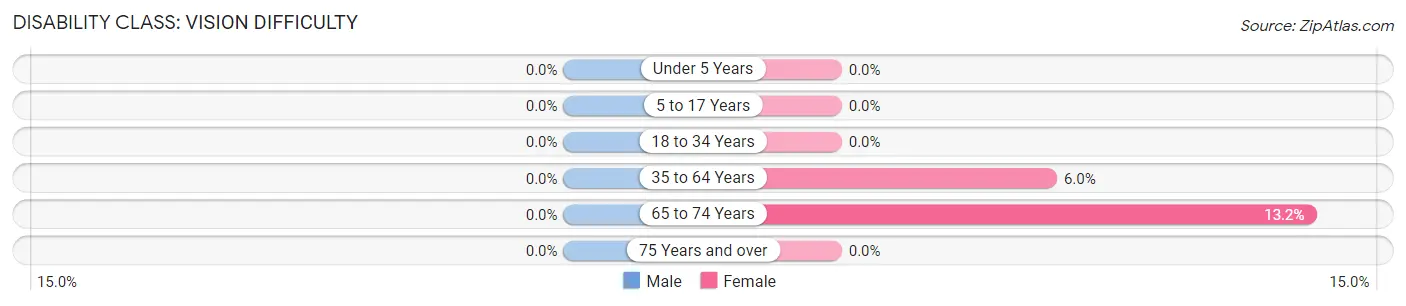
| Age Bracket | Male | Female |
| Under 5 Years | 0 (0.0%) | 0 (0.0%) |
| 5 to 17 Years | 0 (0.0%) | 0 (0.0%) |
| 18 to 34 Years | 0 (0.0%) | 0 (0.0%) |
| 35 to 64 Years | 0 (0.0%) | 23 (6.0%) |
| 65 to 74 Years | 0 (0.0%) | 35 (13.2%) |
| 75 Years and over | 0 (0.0%) | 0 (0.0%) |
Disability Class: Cognitive Difficulty
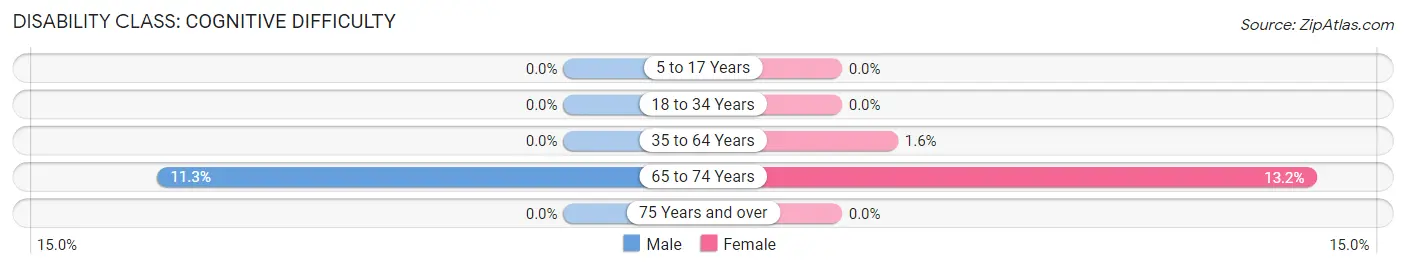
| Age Bracket | Male | Female |
| 5 to 17 Years | 0 (0.0%) | 0 (0.0%) |
| 18 to 34 Years | 0 (0.0%) | 0 (0.0%) |
| 35 to 64 Years | 0 (0.0%) | 6 (1.6%) |
| 65 to 74 Years | 26 (11.3%) | 35 (13.2%) |
| 75 Years and over | 0 (0.0%) | 0 (0.0%) |
Disability Class: Ambulatory Difficulty
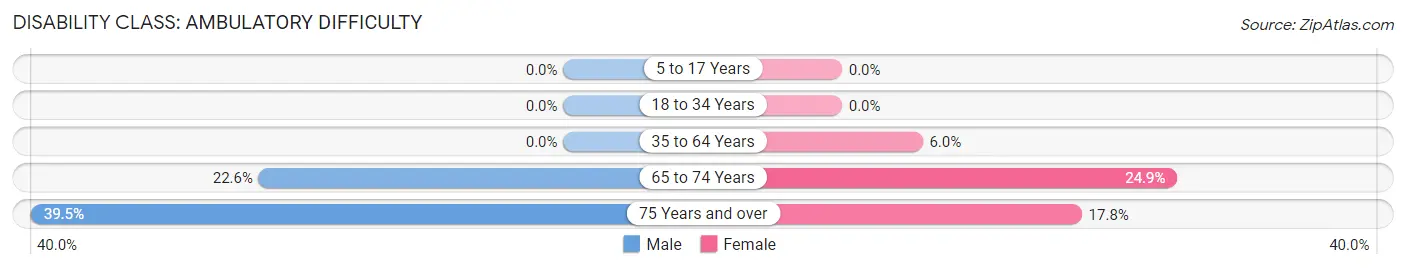
| Age Bracket | Male | Female |
| 5 to 17 Years | 0 (0.0%) | 0 (0.0%) |
| 18 to 34 Years | 0 (0.0%) | 0 (0.0%) |
| 35 to 64 Years | 0 (0.0%) | 23 (6.0%) |
| 65 to 74 Years | 52 (22.6%) | 66 (24.9%) |
| 75 Years and over | 104 (39.5%) | 13 (17.8%) |
Disability Class: Self-Care Difficulty
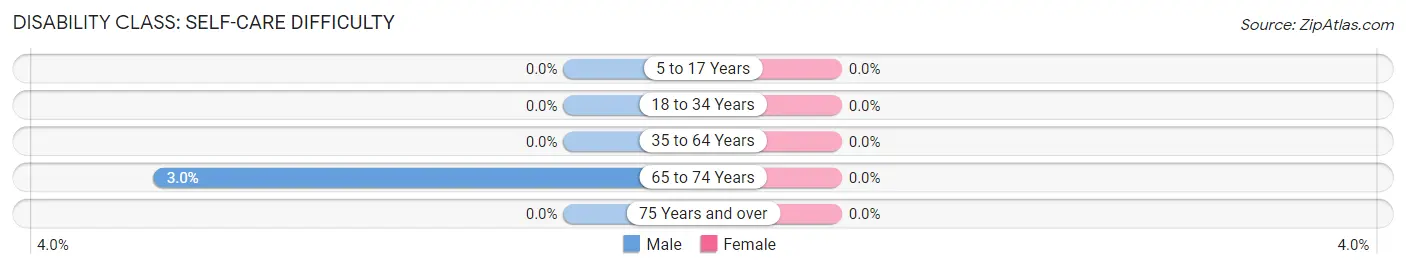
| Age Bracket | Male | Female |
| 5 to 17 Years | 0 (0.0%) | 0 (0.0%) |
| 18 to 34 Years | 0 (0.0%) | 0 (0.0%) |
| 35 to 64 Years | 0 (0.0%) | 0 (0.0%) |
| 65 to 74 Years | 7 (3.0%) | 0 (0.0%) |
| 75 Years and over | 0 (0.0%) | 0 (0.0%) |
Technology Access in Jeff Davis County
Computing Device Access in Jeff Davis County
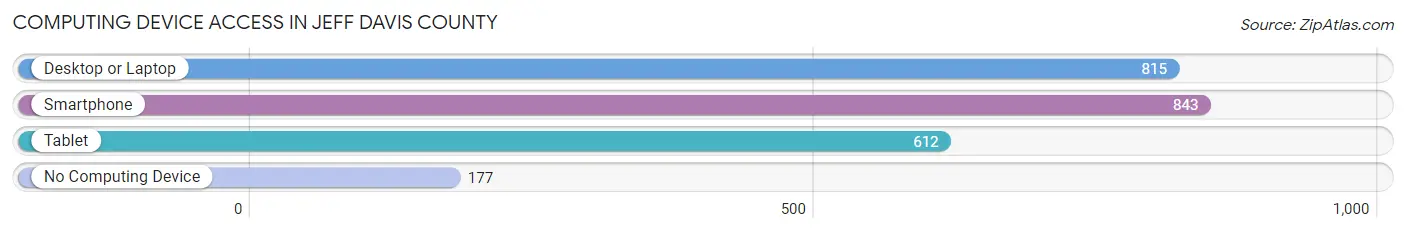
| Device Type | # Households | % Households |
| Desktop or Laptop | 815 | 74.4% |
| Smartphone | 843 | 77.0% |
| Tablet | 612 | 55.9% |
| No Computing Device | 177 | 16.2% |
| Total | 1,095 | 100.0% |
Internet Access in Jeff Davis County
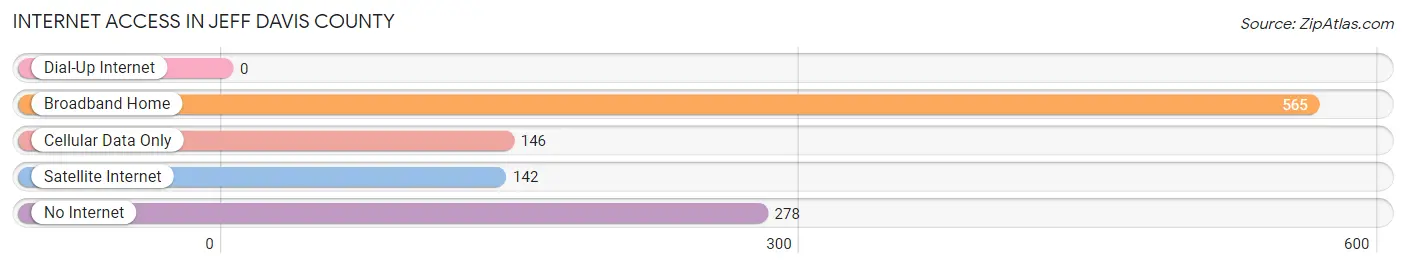
| Internet Type | # Households | % Households |
| Dial-Up Internet | 0 | 0.0% |
| Broadband Home | 565 | 51.6% |
| Cellular Data Only | 146 | 13.3% |
| Satellite Internet | 142 | 13.0% |
| No Internet | 278 | 25.4% |
| Total | 1,095 | 100.0% |
Jeff Davis County Summary
Jeff Davis County is located in the Trans-Pecos region of West Texas. It is bordered by Presidio County to the north, Brewster County to the east, Culberson County to the south, and Pecos County to the west. The county seat is Fort Davis, and the largest city is Marfa. The county was created in 1887 and is named for Jefferson Davis, the President of the Confederate States of America.
Geography
Jeff Davis County covers an area of 2,817 square miles, making it the second-largest county in Texas. The terrain is mostly mountainous, with elevations ranging from 2,000 to 8,000 feet. The Davis Mountains are located in the northern part of the county, and the Chihuahuan Desert covers the southern part. The county is home to several state parks, including Davis Mountains State Park, Big Bend Ranch State Park, and Balmorhea State Park.
The climate is semi-arid, with hot summers and mild winters. The average annual precipitation is 12.5 inches, and the average annual temperature is 64 degrees Fahrenheit.
Demographics
As of the 2010 census, Jeff Davis County had a population of 2,342. The population density was 0.8 people per square mile. The racial makeup of the county was 81.3% White, 0.2% African American, 0.7% Native American, 0.2% Asian, 0.1% Pacific Islander, 15.7% from other races, and 1.8% from two or more races. Hispanic or Latino of any race were 57.2% of the population.
The median income for a household in the county was $30,938, and the median income for a family was $35,000. The per capita income for the county was $14,945. About 18.2% of families and 22.2% of the population were below the poverty line, including 28.2% of those under age 18 and 15.2% of those age 65 or over.
Economy
The economy of Jeff Davis County is largely based on agriculture and tourism. The county is home to several ranches, and the main agricultural products are cattle, sheep, and goats. The county is also home to several tourist attractions, including the Marfa Lights, the McDonald Observatory, and the Fort Davis National Historic Site.
The county is served by two airports, the Marfa Municipal Airport and the Fort Davis Airport. The county is also served by two highways, US Highway 90 and State Highway 118.
Conclusion
Jeff Davis County is a rural county located in the Trans-Pecos region of West Texas. It is home to several state parks, and the economy is largely based on agriculture and tourism. The population is mostly Hispanic or Latino, and the median income is lower than the state average. The county is served by two airports and two highways, and is home to several tourist attractions.
Common Questions
What is Per Capita Income in Jeff Davis County?
Per Capita income in Jeff Davis County is $38,603.
What is the Median Family Income in Jeff Davis County?
Median Family Income in Jeff Davis County is $66,806.
What is the Median Household income in Jeff Davis County?
Median Household Income in Jeff Davis County is $38,125.
What is Income or Wage Gap in Jeff Davis County?
Income or Wage Gap in Jeff Davis County is 18.9%.
Women in Jeff Davis County earn 81.1 cents for every dollar earned by a man.
What is Inequality or Gini Index in Jeff Davis County?
Inequality or Gini Index in Jeff Davis County is 0.54.
What is the Total Population of Jeff Davis County?
Total Population of Jeff Davis County is 1,992.
What is the Total Male Population of Jeff Davis County?
Total Male Population of Jeff Davis County is 1,106.
What is the Total Female Population of Jeff Davis County?
Total Female Population of Jeff Davis County is 886.
What is the Ratio of Males per 100 Females in Jeff Davis County?
There are 124.83 Males per 100 Females in Jeff Davis County.
What is the Ratio of Females per 100 Males in Jeff Davis County?
There are 80.11 Females per 100 Males in Jeff Davis County.
What is the Median Population Age in Jeff Davis County?
Median Population Age in Jeff Davis County is 62.0 Years.
What is the Average Family Size in Jeff Davis County
Average Family Size in Jeff Davis County is 2.4 People.
What is the Average Household Size in Jeff Davis County
Average Household Size in Jeff Davis County is 1.8 People.
How Large is the Labor Force in Jeff Davis County?
There are 748 People in the Labor Forcein in Jeff Davis County.
What is the Percentage of People in the Labor Force in Jeff Davis County?
43.3% of People are in the Labor Force in Jeff Davis County.