Howard County, TX Map & Demographics
Howard County Overview
$32,431
PER CAPITA INCOME
$80,153
AVG FAMILY INCOME
$67,243
AVG HOUSEHOLD INCOME
48.7%
WAGE / INCOME GAP [ % ]
51.3¢/ $1
WAGE / INCOME GAP [ $ ]
0.44
INEQUALITY / GINI INDEX
34,488
TOTAL POPULATION
19,633
MALE POPULATION
14,855
FEMALE POPULATION
132.16
MALES / 100 FEMALES
75.66
FEMALES / 100 MALES
37.6
MEDIAN AGE
3.1
AVG FAMILY SIZE
2.5
AVG HOUSEHOLD SIZE
15,088
LABOR FORCE [ PEOPLE ]
54.3%
PERCENT IN LABOR FORCE
5.2%
UNEMPLOYMENT RATE
Howard County Area Codes
Income in Howard County
Income Overview in Howard County
Per Capita Income in Howard County is $32,431, while median incomes of families and households are $80,153 and $67,243 respectively.
| Characteristic | Number | Measure |
| Per Capita Income | 34,488 | $32,431 |
| Median Family Income | 7,778 | $80,153 |
| Mean Family Income | 7,778 | $98,001 |
| Median Household Income | 12,010 | $67,243 |
| Mean Household Income | 12,010 | $86,876 |
| Income Deficit | 7,778 | $0 |
| Wage / Income Gap (%) | 34,488 | 48.68% |
| Wage / Income Gap ($) | 34,488 | 51.32¢ per $1 |
| Gini / Inequality Index | 34,488 | 0.44 |
Earnings by Sex in Howard County
Average Earnings in Howard County are $41,460, $56,966 for men and $29,237 for women, a difference of 48.7%.
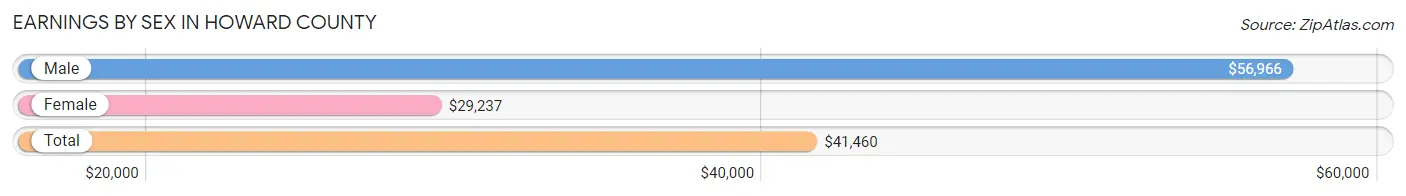
| Sex | Number | Average Earnings |
| Male | 9,887 (60.0%) | $56,966 |
| Female | 6,599 (40.0%) | $29,237 |
| Total | 16,486 (100.0%) | $41,460 |
Earnings by Sex by Income Bracket in Howard County
The most common earnings brackets in Howard County are $100,000+ for men (1,809 | 18.3%) and $25,000 to $29,999 for women (601 | 9.1%).
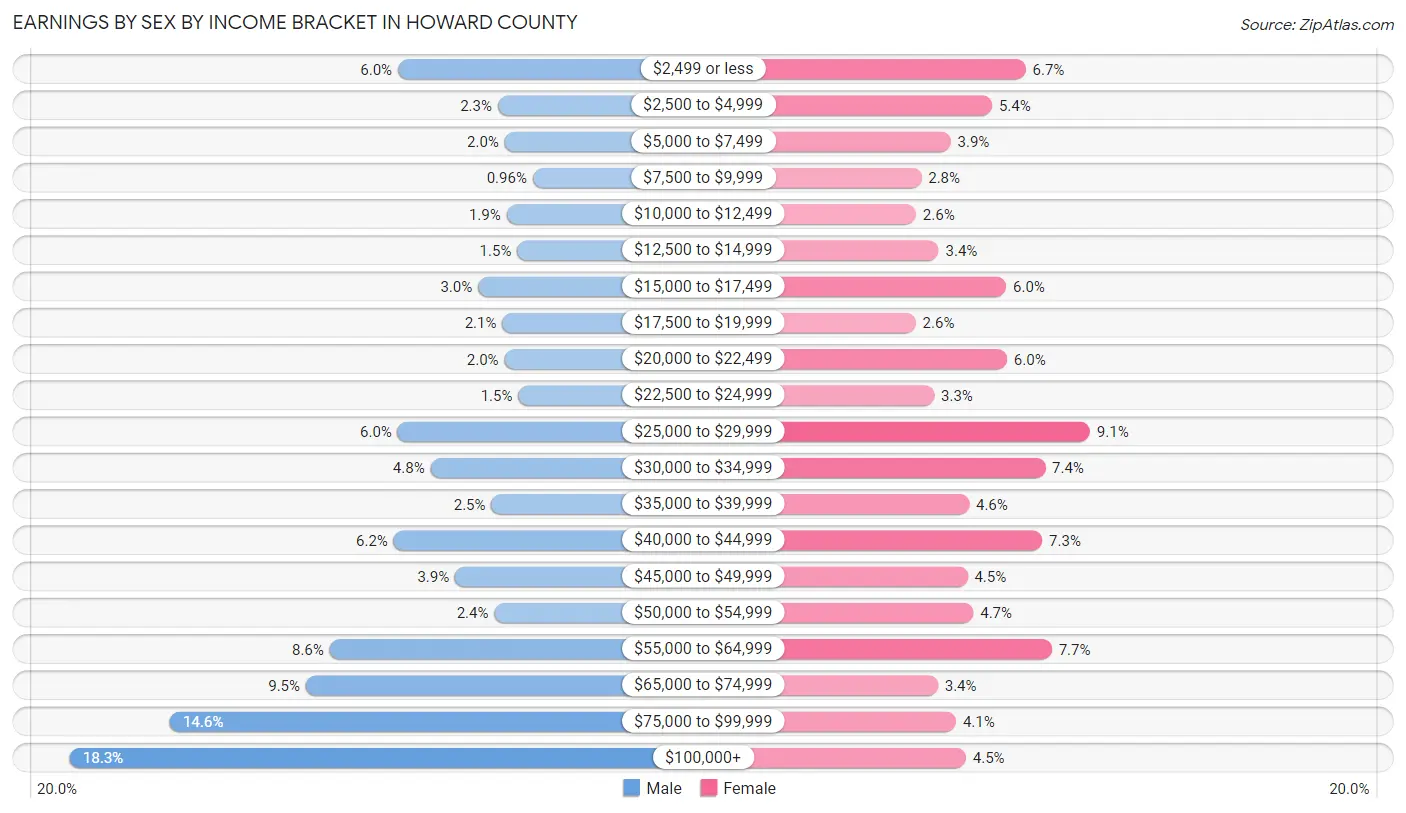
| Income | Male | Female |
| $2,499 or less | 594 (6.0%) | 442 (6.7%) |
| $2,500 to $4,999 | 224 (2.3%) | 359 (5.4%) |
| $5,000 to $7,499 | 199 (2.0%) | 257 (3.9%) |
| $7,500 to $9,999 | 95 (1.0%) | 184 (2.8%) |
| $10,000 to $12,499 | 192 (1.9%) | 171 (2.6%) |
| $12,500 to $14,999 | 152 (1.5%) | 227 (3.4%) |
| $15,000 to $17,499 | 298 (3.0%) | 394 (6.0%) |
| $17,500 to $19,999 | 208 (2.1%) | 170 (2.6%) |
| $20,000 to $22,499 | 200 (2.0%) | 396 (6.0%) |
| $22,500 to $24,999 | 148 (1.5%) | 216 (3.3%) |
| $25,000 to $29,999 | 595 (6.0%) | 601 (9.1%) |
| $30,000 to $34,999 | 474 (4.8%) | 490 (7.4%) |
| $35,000 to $39,999 | 248 (2.5%) | 302 (4.6%) |
| $40,000 to $44,999 | 610 (6.2%) | 483 (7.3%) |
| $45,000 to $49,999 | 383 (3.9%) | 298 (4.5%) |
| $50,000 to $54,999 | 237 (2.4%) | 313 (4.7%) |
| $55,000 to $64,999 | 847 (8.6%) | 507 (7.7%) |
| $65,000 to $74,999 | 935 (9.5%) | 225 (3.4%) |
| $75,000 to $99,999 | 1,439 (14.5%) | 270 (4.1%) |
| $100,000+ | 1,809 (18.3%) | 294 (4.5%) |
| Total | 9,887 (100.0%) | 6,599 (100.0%) |
Earnings by Sex by Educational Attainment in Howard County
Average earnings in Howard County are $63,166 for men and $33,302 for women, a difference of 47.3%. Men with an educational attainment of graduate degree enjoy the highest average annual earnings of $115,417, while those with less than high school education earn the least with $44,939. Women with an educational attainment of graduate degree earn the most with the average annual earnings of $61,477, while those with less than high school education have the smallest earnings of $19,423.
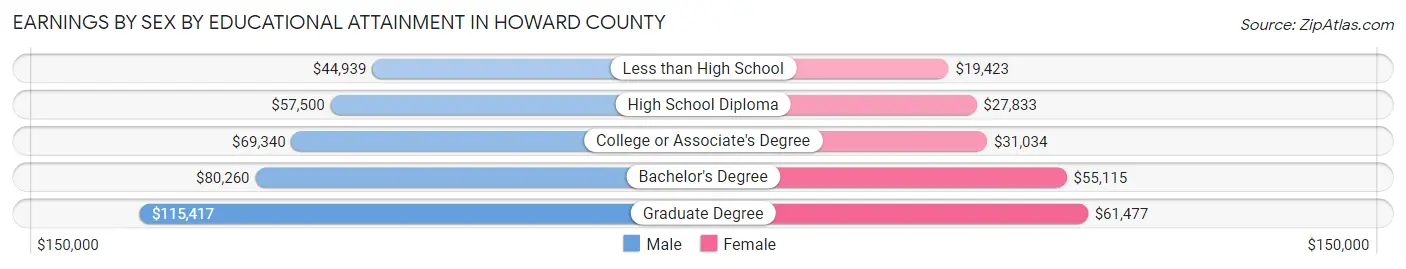
| Educational Attainment | Male Income | Female Income |
| Less than High School | $44,939 | $19,423 |
| High School Diploma | $57,500 | $27,833 |
| College or Associate's Degree | $69,340 | $31,034 |
| Bachelor's Degree | $80,260 | $55,115 |
| Graduate Degree | $115,417 | $61,477 |
| Total | $63,166 | $33,302 |
Family Income in Howard County
Family Income Brackets in Howard County
According to the Howard County family income data, there are 1,587 families falling into the $100,000 to $149,999 income range, which is the most common income bracket and makes up 20.4% of all families. Conversely, the $10,000 to $14,999 income bracket is the least frequent group with only 226 families (2.9%) belonging to this category.
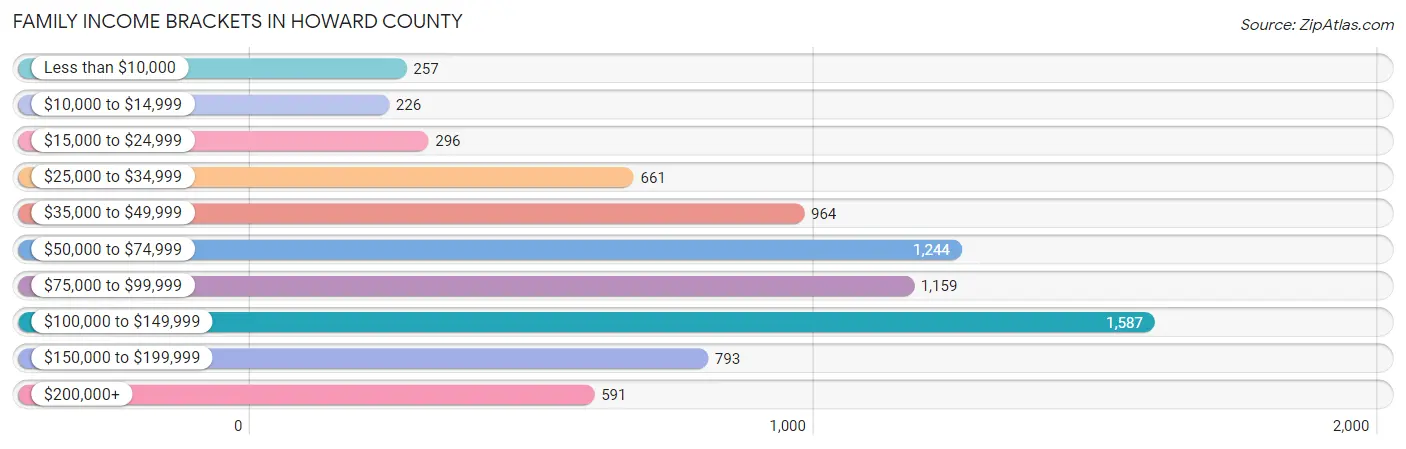
| Income Bracket | # Families | % Families |
| Less than $10,000 | 257 | 3.3% |
| $10,000 to $14,999 | 226 | 2.9% |
| $15,000 to $24,999 | 296 | 3.8% |
| $25,000 to $34,999 | 661 | 8.5% |
| $35,000 to $49,999 | 964 | 12.4% |
| $50,000 to $74,999 | 1,244 | 16.0% |
| $75,000 to $99,999 | 1,159 | 14.9% |
| $100,000 to $149,999 | 1,587 | 20.4% |
| $150,000 to $199,999 | 793 | 10.2% |
| $200,000+ | 591 | 7.6% |
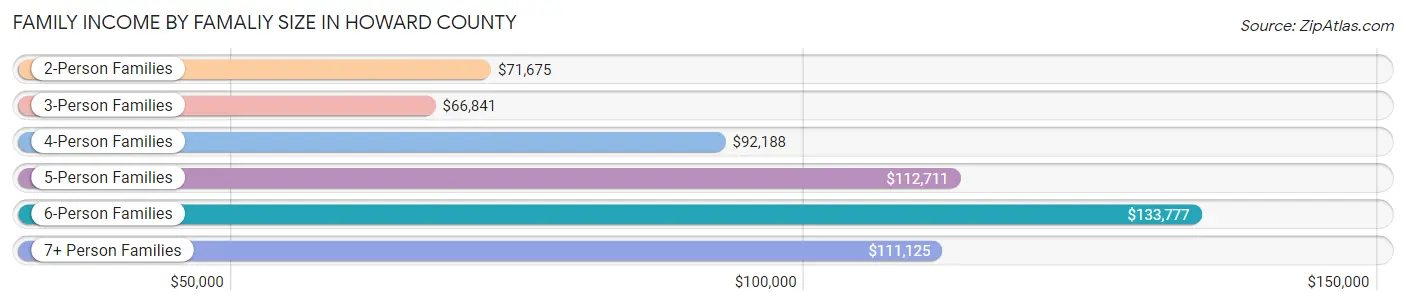
Family Income by Famaliy Size in Howard County
6-person families (200 | 2.6%) account for the highest median family income in Howard County with $133,777 per family, while 2-person families (3,323 | 42.7%) have the highest median income of $35,838 per family member.
| Income Bracket | # Families | Median Income |
| 2-Person Families | 3,323 (42.7%) | $71,675 |
| 3-Person Families | 1,751 (22.5%) | $66,841 |
| 4-Person Families | 1,493 (19.2%) | $92,188 |
| 5-Person Families | 992 (12.8%) | $112,711 |
| 6-Person Families | 200 (2.6%) | $133,777 |
| 7+ Person Families | 19 (0.2%) | $111,125 |
| Total | 7,778 (100.0%) | $80,153 |
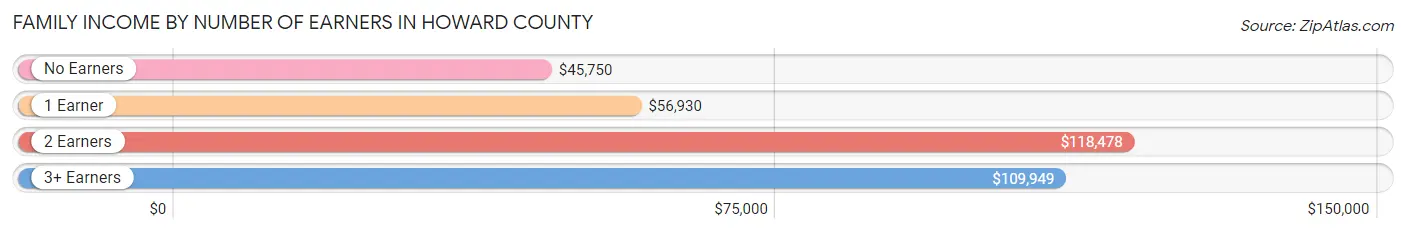
Family Income by Number of Earners in Howard County
The median family income in Howard County is $80,153, with families comprising 2 earners (2,850) having the highest median family income of $118,478, while families with no earners (1,009) have the lowest median family income of $45,750, accounting for 36.6% and 13.0% of families, respectively.
| Number of Earners | # Families | Median Income |
| No Earners | 1,009 (13.0%) | $45,750 |
| 1 Earner | 3,162 (40.6%) | $56,930 |
| 2 Earners | 2,850 (36.6%) | $118,478 |
| 3+ Earners | 757 (9.7%) | $109,949 |
| Total | 7,778 (100.0%) | $80,153 |
Household Income in Howard County
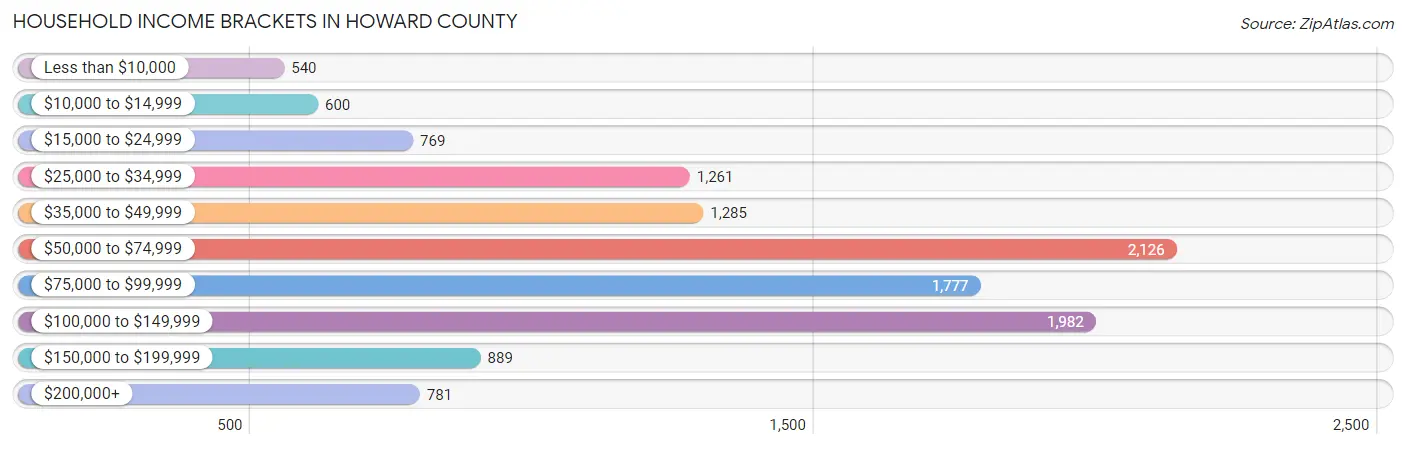
Household Income Brackets in Howard County
With 2,126 households falling in the category, the $50,000 to $74,999 income range is the most frequent in Howard County, accounting for 17.7% of all households. In contrast, only 540 households (4.5%) fall into the less than $10,000 income bracket, making it the least populous group.
| Income Bracket | # Households | % Households |
| Less than $10,000 | 540 | 4.5% |
| $10,000 to $14,999 | 600 | 5.0% |
| $15,000 to $24,999 | 769 | 6.4% |
| $25,000 to $34,999 | 1,261 | 10.5% |
| $35,000 to $49,999 | 1,285 | 10.7% |
| $50,000 to $74,999 | 2,126 | 17.7% |
| $75,000 to $99,999 | 1,777 | 14.8% |
| $100,000 to $149,999 | 1,982 | 16.5% |
| $150,000 to $199,999 | 889 | 7.4% |
| $200,000+ | 781 | 6.5% |
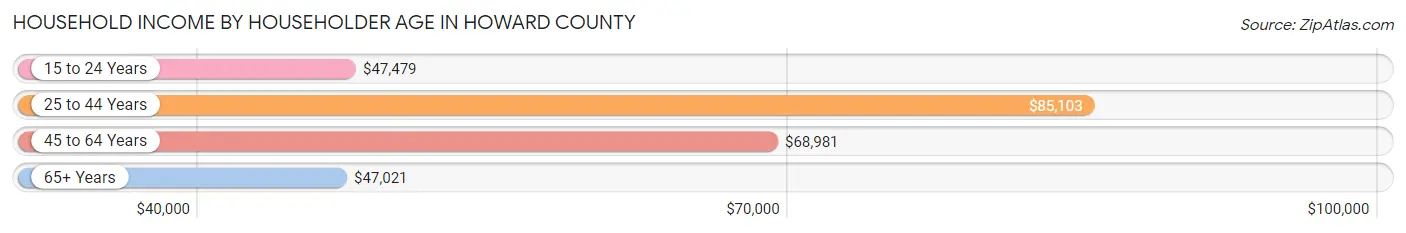
Household Income by Householder Age in Howard County
The median household income in Howard County is $67,243, with the highest median household income of $85,103 found in the 25 to 44 years age bracket for the primary householder. A total of 4,238 households (35.3%) fall into this category. Meanwhile, the 65+ years age bracket for the primary householder has the lowest median household income of $47,021, with 2,548 households (21.2%) in this group.
| Income Bracket | # Households | Median Income |
| 15 to 24 Years | 663 (5.5%) | $47,479 |
| 25 to 44 Years | 4,238 (35.3%) | $85,103 |
| 45 to 64 Years | 4,561 (38.0%) | $68,981 |
| 65+ Years | 2,548 (21.2%) | $47,021 |
| Total | 12,010 (100.0%) | $67,243 |
Poverty in Howard County
Income Below Poverty by Sex and Age in Howard County
With 12.4% poverty level for males and 16.9% for females among the residents of Howard County, 12 to 14 year old males and 18 to 24 year old females are the most vulnerable to poverty, with 125 males (19.3%) and 414 females (35.5%) in their respective age groups living below the poverty level.
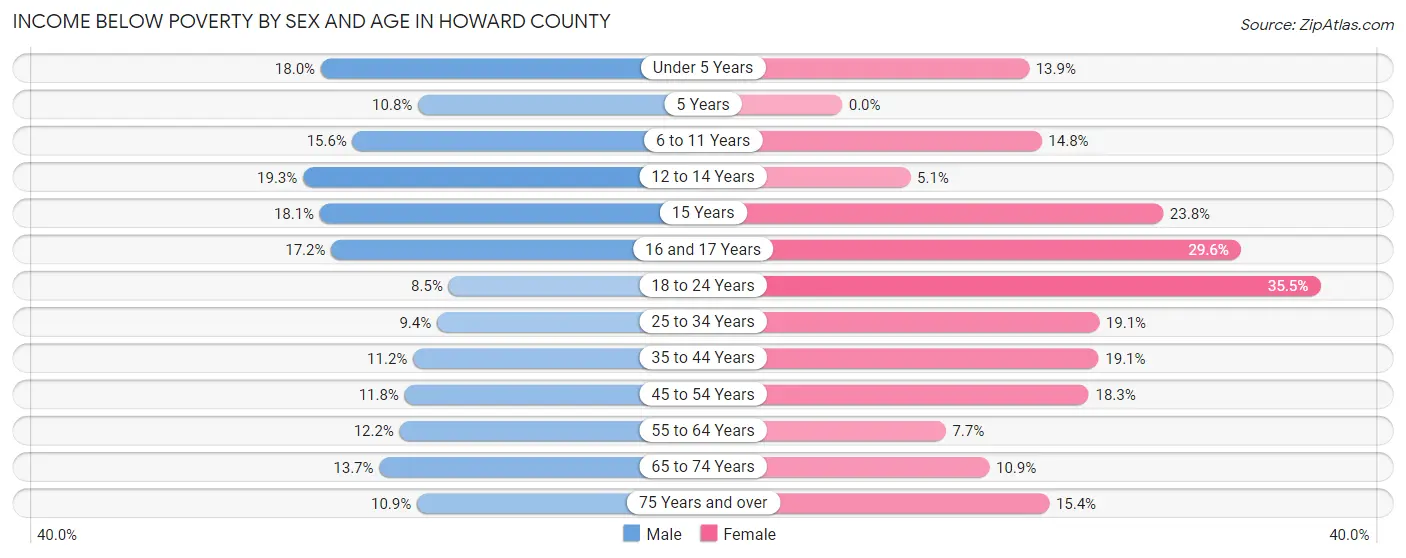
| Age Bracket | Male | Female |
| Under 5 Years | 182 (18.0%) | 132 (13.9%) |
| 5 Years | 22 (10.8%) | 0 (0.0%) |
| 6 to 11 Years | 205 (15.6%) | 195 (14.8%) |
| 12 to 14 Years | 125 (19.3%) | 28 (5.1%) |
| 15 Years | 43 (18.1%) | 41 (23.8%) |
| 16 and 17 Years | 76 (17.2%) | 106 (29.6%) |
| 18 to 24 Years | 143 (8.5%) | 414 (35.5%) |
| 25 to 34 Years | 221 (9.4%) | 402 (19.1%) |
| 35 to 44 Years | 209 (11.2%) | 396 (19.1%) |
| 45 to 54 Years | 317 (11.8%) | 312 (18.3%) |
| 55 to 64 Years | 214 (12.1%) | 135 (7.7%) |
| 65 to 74 Years | 160 (13.7%) | 136 (10.9%) |
| 75 Years and over | 77 (10.9%) | 137 (15.4%) |
| Total | 1,994 (12.4%) | 2,434 (16.9%) |
Income Above Poverty by Sex and Age in Howard County
According to the poverty statistics in Howard County, males aged 18 to 24 years and females aged 5 years are the age groups that are most secure financially, with 91.5% of males and 100.0% of females in these age groups living above the poverty line.
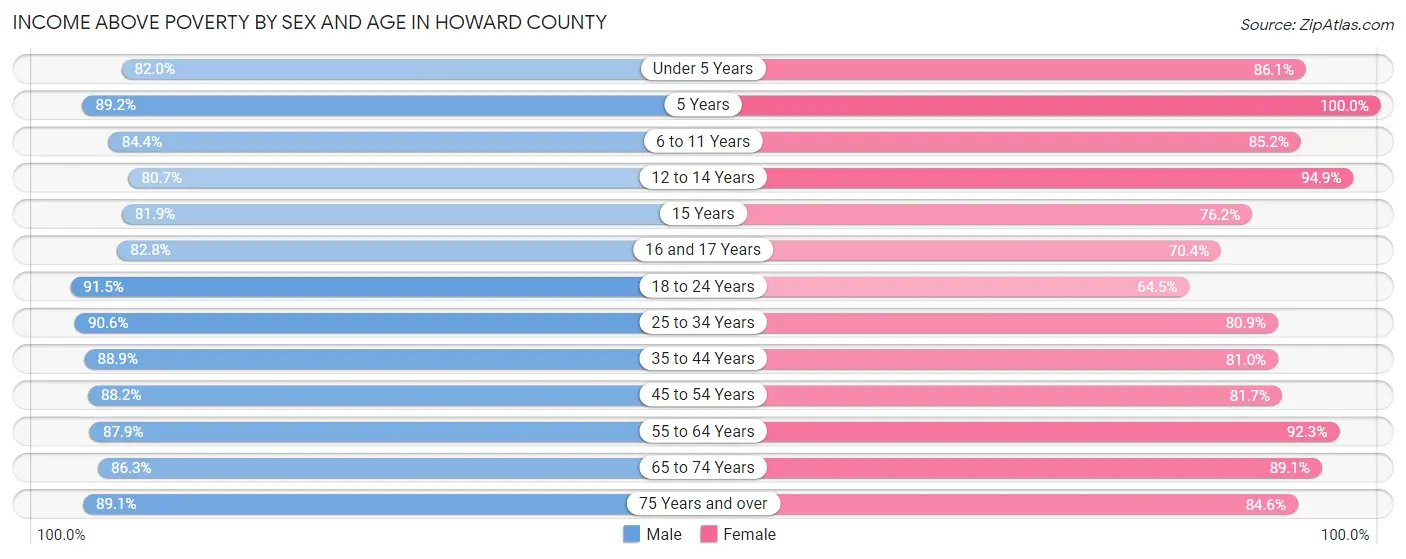
| Age Bracket | Male | Female |
| Under 5 Years | 829 (82.0%) | 819 (86.1%) |
| 5 Years | 182 (89.2%) | 151 (100.0%) |
| 6 to 11 Years | 1,106 (84.4%) | 1,121 (85.2%) |
| 12 to 14 Years | 522 (80.7%) | 524 (94.9%) |
| 15 Years | 195 (81.9%) | 131 (76.2%) |
| 16 and 17 Years | 365 (82.8%) | 252 (70.4%) |
| 18 to 24 Years | 1,537 (91.5%) | 752 (64.5%) |
| 25 to 34 Years | 2,134 (90.6%) | 1,704 (80.9%) |
| 35 to 44 Years | 1,666 (88.8%) | 1,683 (80.9%) |
| 45 to 54 Years | 2,373 (88.2%) | 1,391 (81.7%) |
| 55 to 64 Years | 1,548 (87.8%) | 1,619 (92.3%) |
| 65 to 74 Years | 1,011 (86.3%) | 1,108 (89.1%) |
| 75 Years and over | 632 (89.1%) | 754 (84.6%) |
| Total | 14,100 (87.6%) | 12,009 (83.2%) |
Income Below Poverty Among Married-Couple Families in Howard County
The poverty statistics for married-couple families in Howard County show that 5.5% or 307 of the total 5,616 families live below the poverty line. Families with 3 or 4 children have the highest poverty rate of 13.1%, comprising of 78 families. On the other hand, families with 5 or more children have the lowest poverty rate of 0.0%, which includes 0 families.
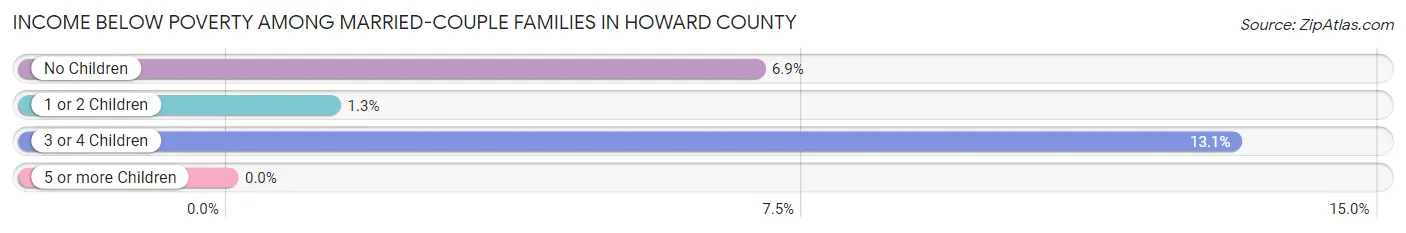
| Children | Above Poverty | Below Poverty |
| No Children | 2,722 (93.1%) | 201 (6.9%) |
| 1 or 2 Children | 2,060 (98.7%) | 28 (1.3%) |
| 3 or 4 Children | 517 (86.9%) | 78 (13.1%) |
| 5 or more Children | 10 (100.0%) | 0 (0.0%) |
| Total | 5,309 (94.5%) | 307 (5.5%) |
Income Below Poverty Among Single-Parent Households in Howard County
According to the poverty data in Howard County, 6.2% or 52 single-father households and 34.2% or 454 single-mother households are living below the poverty line. Among single-father households, those with 3 or 4 children have the highest poverty rate, with 32 households (30.8%) experiencing poverty. Likewise, among single-mother households, those with 5 or more children have the highest poverty rate, with 5 households (100.0%) falling below the poverty line.
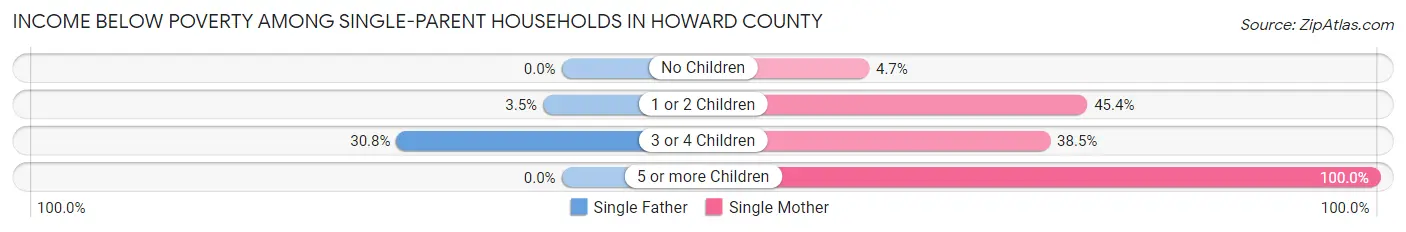
| Children | Single Father | Single Mother |
| No Children | 0 (0.0%) | 15 (4.7%) |
| 1 or 2 Children | 20 (3.5%) | 309 (45.4%) |
| 3 or 4 Children | 32 (30.8%) | 125 (38.5%) |
| 5 or more Children | 0 (0.0%) | 5 (100.0%) |
| Total | 52 (6.2%) | 454 (34.2%) |
Income Below Poverty Among Married-Couple vs Single-Parent Households in Howard County
The poverty data for Howard County shows that 307 of the married-couple family households (5.5%) and 506 of the single-parent households (23.4%) are living below the poverty level. Within the married-couple family households, those with 3 or 4 children have the highest poverty rate, with 78 households (13.1%) falling below the poverty line. Among the single-parent households, those with 5 or more children have the highest poverty rate, with 5 household (100.0%) living below poverty.
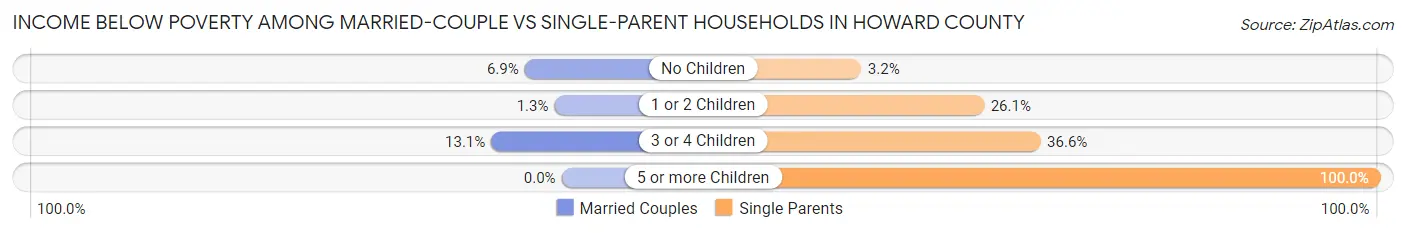
| Children | Married-Couple Families | Single-Parent Households |
| No Children | 201 (6.9%) | 15 (3.2%) |
| 1 or 2 Children | 28 (1.3%) | 329 (26.1%) |
| 3 or 4 Children | 78 (13.1%) | 157 (36.6%) |
| 5 or more Children | 0 (0.0%) | 5 (100.0%) |
| Total | 307 (5.5%) | 506 (23.4%) |
Race in Howard County
The most populous races in Howard County are White / Caucasian (25,493 | 73.9%), Hispanic or Latino (15,398 | 44.7%), and Two or more Races (3,727 | 10.8%).
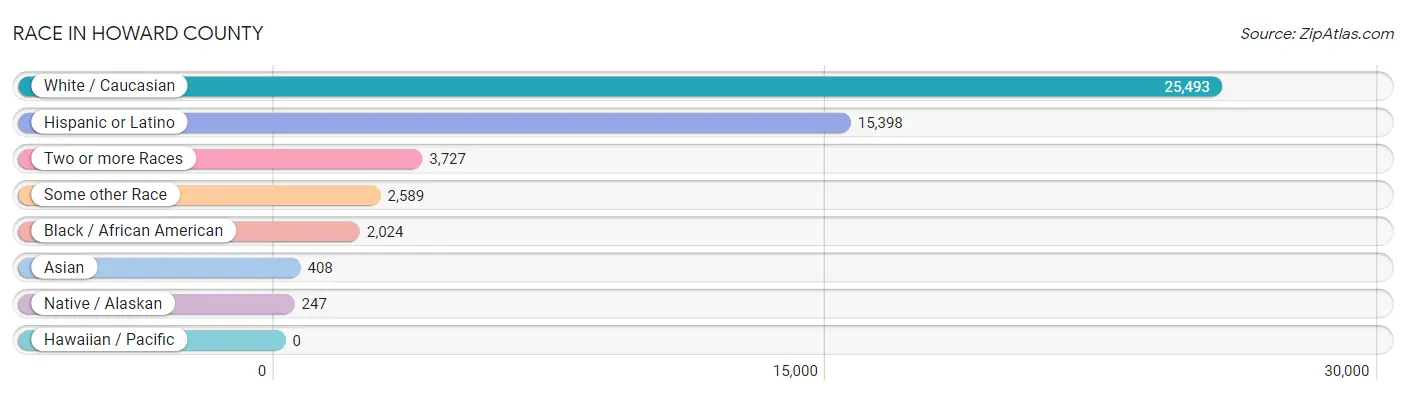
| Race | # Population | % Population |
| Asian | 408 | 1.2% |
| Black / African American | 2,024 | 5.9% |
| Hawaiian / Pacific | 0 | 0.0% |
| Hispanic or Latino | 15,398 | 44.7% |
| Native / Alaskan | 247 | 0.7% |
| White / Caucasian | 25,493 | 73.9% |
| Two or more Races | 3,727 | 10.8% |
| Some other Race | 2,589 | 7.5% |
| Total | 34,488 | 100.0% |
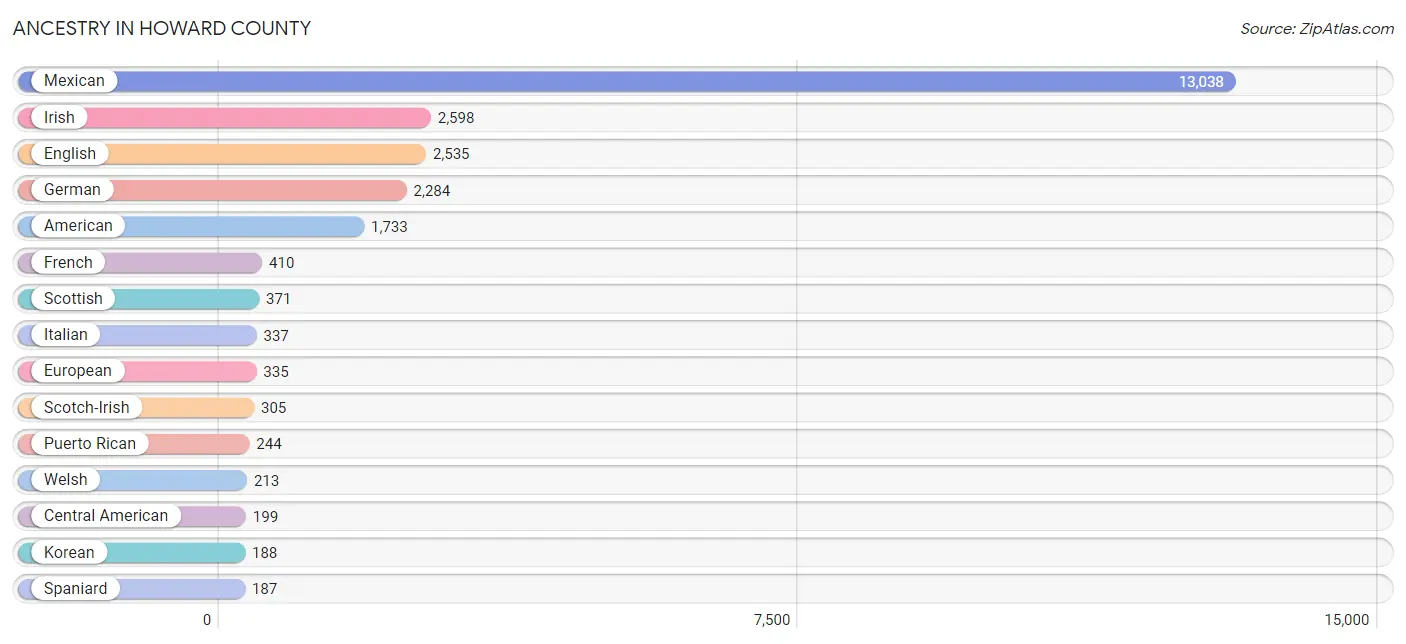
Ancestry in Howard County
The most populous ancestries reported in Howard County are Mexican (13,038 | 37.8%), Irish (2,598 | 7.5%), English (2,535 | 7.3%), German (2,284 | 6.6%), and American (1,733 | 5.0%), together accounting for 64.3% of all Howard County residents.
| Ancestry | # Population | % Population |
| African | 58 | 0.2% |
| Albanian | 10 | 0.0% |
| American | 1,733 | 5.0% |
| Apache | 29 | 0.1% |
| Arab | 60 | 0.2% |
| Argentinean | 6 | 0.0% |
| Armenian | 6 | 0.0% |
| Austrian | 7 | 0.0% |
| Belgian | 10 | 0.0% |
| Bhutanese | 7 | 0.0% |
| Blackfeet | 57 | 0.2% |
| Bolivian | 10 | 0.0% |
| British | 89 | 0.3% |
| Burmese | 96 | 0.3% |
| Canadian | 10 | 0.0% |
| Central American | 199 | 0.6% |
| Central American Indian | 1 | 0.0% |
| Cherokee | 116 | 0.3% |
| Chickasaw | 49 | 0.1% |
| Choctaw | 6 | 0.0% |
| Colombian | 35 | 0.1% |
| Comanche | 13 | 0.0% |
| Cuban | 47 | 0.1% |
| Czech | 72 | 0.2% |
| Danish | 53 | 0.2% |
| Dutch | 90 | 0.3% |
| Dutch West Indian | 12 | 0.0% |
| English | 2,535 | 7.3% |
| European | 335 | 1.0% |
| French | 410 | 1.2% |
| French Canadian | 68 | 0.2% |
| German | 2,284 | 6.6% |
| Greek | 125 | 0.4% |
| Guatemalan | 111 | 0.3% |
| Honduran | 30 | 0.1% |
| Hungarian | 16 | 0.1% |
| Indian (Asian) | 30 | 0.1% |
| Irish | 2,598 | 7.5% |
| Israeli | 18 | 0.1% |
| Italian | 337 | 1.0% |
| Jamaican | 45 | 0.1% |
| Korean | 188 | 0.5% |
| Mexican | 13,038 | 37.8% |
| Mexican American Indian | 11 | 0.0% |
| Nicaraguan | 16 | 0.1% |
| Nigerian | 50 | 0.1% |
| Northern European | 16 | 0.1% |
| Norwegian | 110 | 0.3% |
| Pakistani | 52 | 0.2% |
| Polish | 147 | 0.4% |
| Portuguese | 12 | 0.0% |
| Puerto Rican | 244 | 0.7% |
| Russian | 36 | 0.1% |
| Salvadoran | 34 | 0.1% |
| Scandinavian | 32 | 0.1% |
| Scotch-Irish | 305 | 0.9% |
| Scottish | 371 | 1.1% |
| Sioux | 21 | 0.1% |
| Slavic | 6 | 0.0% |
| South African | 6 | 0.0% |
| South American | 65 | 0.2% |
| Spaniard | 187 | 0.5% |
| Spanish | 187 | 0.5% |
| Spanish American | 12 | 0.0% |
| Subsaharan African | 153 | 0.4% |
| Swedish | 41 | 0.1% |
| Swiss | 11 | 0.0% |
| Thai | 8 | 0.0% |
| Ukrainian | 64 | 0.2% |
| Venezuelan | 14 | 0.0% |
| Vietnamese | 104 | 0.3% |
| Welsh | 213 | 0.6% | View All 72 Rows |
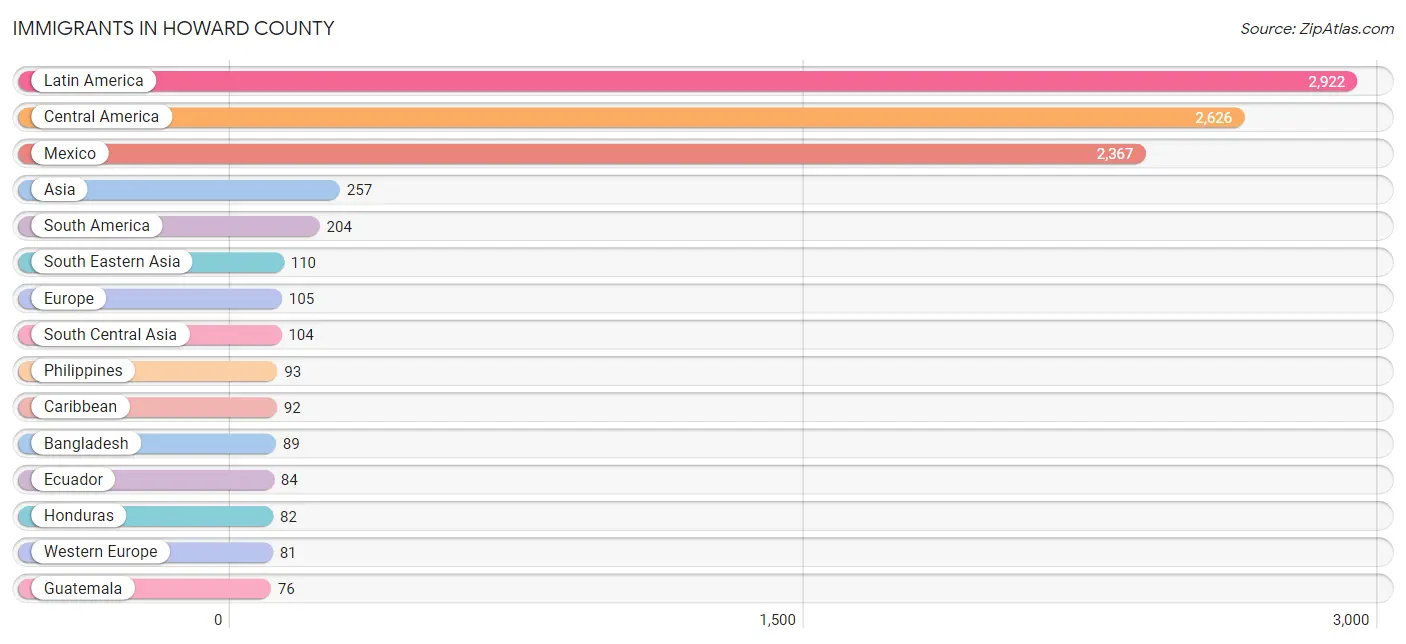
Immigrants in Howard County
The most numerous immigrant groups reported in Howard County came from Latin America (2,922 | 8.5%), Central America (2,626 | 7.6%), Mexico (2,367 | 6.9%), Asia (257 | 0.7%), and South America (204 | 0.6%), together accounting for 24.3% of all Howard County residents.
| Immigration Origin | # Population | % Population |
| Africa | 72 | 0.2% |
| Albania | 10 | 0.0% |
| Argentina | 6 | 0.0% |
| Asia | 257 | 0.7% |
| Australia | 23 | 0.1% |
| Bahamas | 10 | 0.0% |
| Bangladesh | 89 | 0.3% |
| Belize | 19 | 0.1% |
| Bolivia | 10 | 0.0% |
| Cameroon | 39 | 0.1% |
| Caribbean | 92 | 0.3% |
| Central America | 2,626 | 7.6% |
| China | 13 | 0.0% |
| Colombia | 57 | 0.2% |
| Costa Rica | 6 | 0.0% |
| Cuba | 37 | 0.1% |
| Eastern Asia | 25 | 0.1% |
| Eastern Europe | 19 | 0.1% |
| Ecuador | 84 | 0.2% |
| El Salvador | 60 | 0.2% |
| England | 5 | 0.0% |
| Europe | 105 | 0.3% |
| France | 27 | 0.1% |
| Germany | 54 | 0.2% |
| Guatemala | 76 | 0.2% |
| Honduras | 82 | 0.2% |
| Hungary | 9 | 0.0% |
| India | 8 | 0.0% |
| Jamaica | 45 | 0.1% |
| Korea | 12 | 0.0% |
| Latin America | 2,922 | 8.5% |
| Mexico | 2,367 | 6.9% |
| Middle Africa | 39 | 0.1% |
| Nicaragua | 16 | 0.1% |
| Nigeria | 16 | 0.1% |
| Northern Europe | 5 | 0.0% |
| Oceania | 46 | 0.1% |
| Pakistan | 7 | 0.0% |
| Peru | 33 | 0.1% |
| Philippines | 93 | 0.3% |
| South Africa | 6 | 0.0% |
| South America | 204 | 0.6% |
| South Central Asia | 104 | 0.3% |
| South Eastern Asia | 110 | 0.3% |
| Thailand | 17 | 0.1% |
| Venezuela | 14 | 0.0% |
| Western Africa | 27 | 0.1% |
| Western Europe | 81 | 0.2% | View All 48 Rows |
Sex and Age in Howard County
Sex and Age in Howard County
The most populous age groups in Howard County are 50 to 54 Years (1,770 | 9.0%) for men and 30 to 34 Years (1,128 | 7.6%) for women.
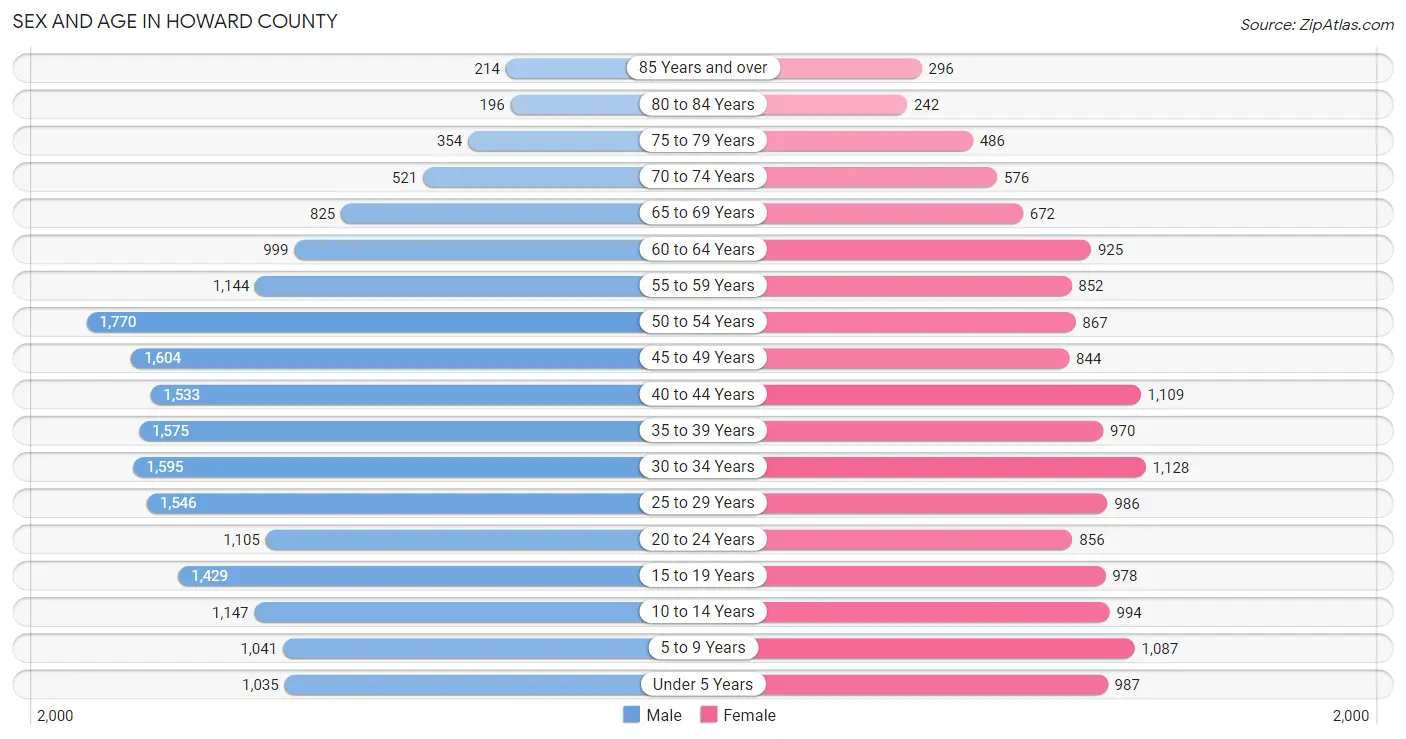
| Age Bracket | Male | Female |
| Under 5 Years | 1,035 (5.3%) | 987 (6.6%) |
| 5 to 9 Years | 1,041 (5.3%) | 1,087 (7.3%) |
| 10 to 14 Years | 1,147 (5.8%) | 994 (6.7%) |
| 15 to 19 Years | 1,429 (7.3%) | 978 (6.6%) |
| 20 to 24 Years | 1,105 (5.6%) | 856 (5.8%) |
| 25 to 29 Years | 1,546 (7.9%) | 986 (6.6%) |
| 30 to 34 Years | 1,595 (8.1%) | 1,128 (7.6%) |
| 35 to 39 Years | 1,575 (8.0%) | 970 (6.5%) |
| 40 to 44 Years | 1,533 (7.8%) | 1,109 (7.5%) |
| 45 to 49 Years | 1,604 (8.2%) | 844 (5.7%) |
| 50 to 54 Years | 1,770 (9.0%) | 867 (5.8%) |
| 55 to 59 Years | 1,144 (5.8%) | 852 (5.7%) |
| 60 to 64 Years | 999 (5.1%) | 925 (6.2%) |
| 65 to 69 Years | 825 (4.2%) | 672 (4.5%) |
| 70 to 74 Years | 521 (2.6%) | 576 (3.9%) |
| 75 to 79 Years | 354 (1.8%) | 486 (3.3%) |
| 80 to 84 Years | 196 (1.0%) | 242 (1.6%) |
| 85 Years and over | 214 (1.1%) | 296 (2.0%) |
| Total | 19,633 (100.0%) | 14,855 (100.0%) |
Families and Households in Howard County
Median Family Size in Howard County
The median family size in Howard County is 3.13 persons per family, with single female/mother families (1,329 | 17.1%) accounting for the largest median family size of 3.53 persons per family. On the other hand, single male/father families (833 | 10.7%) represent the smallest median family size with 2.43 persons per family.
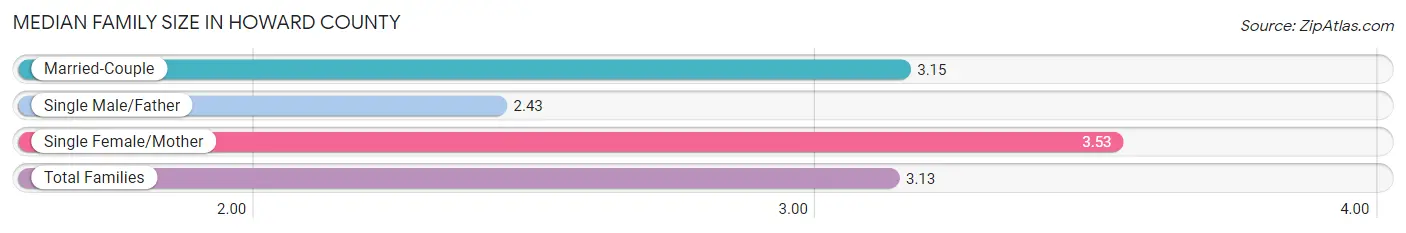
| Family Type | # Families | Family Size |
| Married-Couple | 5,616 (72.2%) | 3.15 |
| Single Male/Father | 833 (10.7%) | 2.43 |
| Single Female/Mother | 1,329 (17.1%) | 3.53 |
| Total Families | 7,778 (100.0%) | 3.13 |
Median Household Size in Howard County
The median household size in Howard County is 2.53 persons per household, with single female/mother households (1,329 | 11.1%) accounting for the largest median household size of 3.87 persons per household. non-family households (4,232 | 35.2%) represent the smallest median household size with 1.18 persons per household.
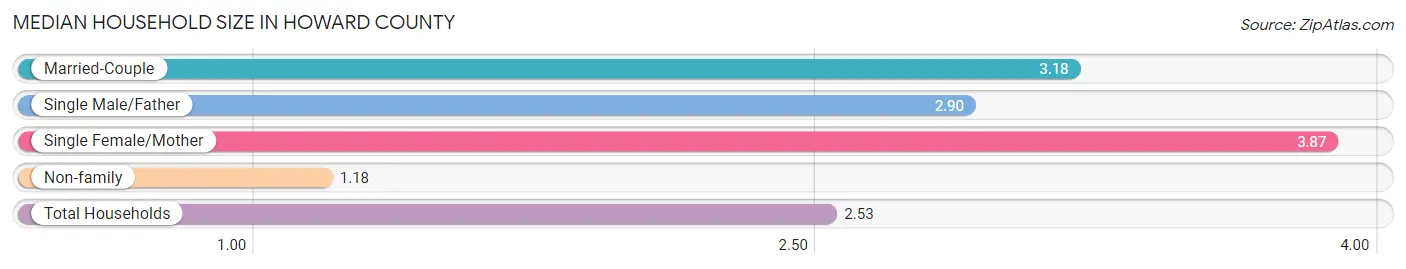
| Household Type | # Households | Household Size |
| Married-Couple | 5,616 (46.8%) | 3.18 |
| Single Male/Father | 833 (6.9%) | 2.90 |
| Single Female/Mother | 1,329 (11.1%) | 3.87 |
| Non-family | 4,232 (35.2%) | 1.18 |
| Total Households | 12,010 (100.0%) | 2.53 |
Household Size by Marriage Status in Howard County
Out of a total of 12,010 households in Howard County, 7,778 (64.8%) are family households, while 4,232 (35.2%) are nonfamily households. The most numerous type of family households are 2-person households, comprising 3,040, and the most common type of nonfamily households are 1-person households, comprising 3,878.
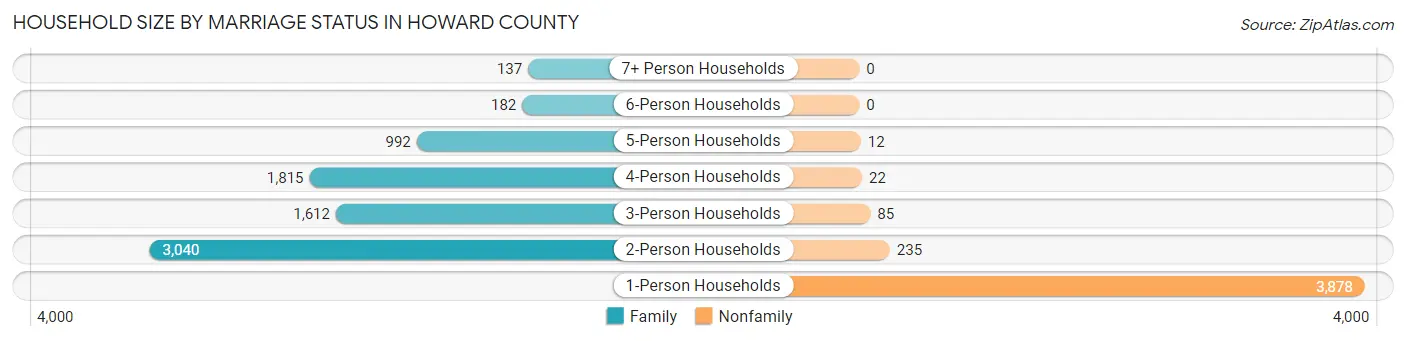
| Household Size | Family Households | Nonfamily Households |
| 1-Person Households | - | 3,878 (32.3%) |
| 2-Person Households | 3,040 (25.3%) | 235 (2.0%) |
| 3-Person Households | 1,612 (13.4%) | 85 (0.7%) |
| 4-Person Households | 1,815 (15.1%) | 22 (0.2%) |
| 5-Person Households | 992 (8.3%) | 12 (0.1%) |
| 6-Person Households | 182 (1.5%) | 0 (0.0%) |
| 7+ Person Households | 137 (1.1%) | 0 (0.0%) |
| Total | 7,778 (64.8%) | 4,232 (35.2%) |
Female Fertility in Howard County
Fertility by Age in Howard County
Average fertility rate in Howard County is 95.0 births per 1,000 women. Women in the age bracket of 20 to 34 years have the highest fertility rate with 180.0 births per 1,000 women. Women in the age bracket of 20 to 34 years acount for 80.1% of all women with births.
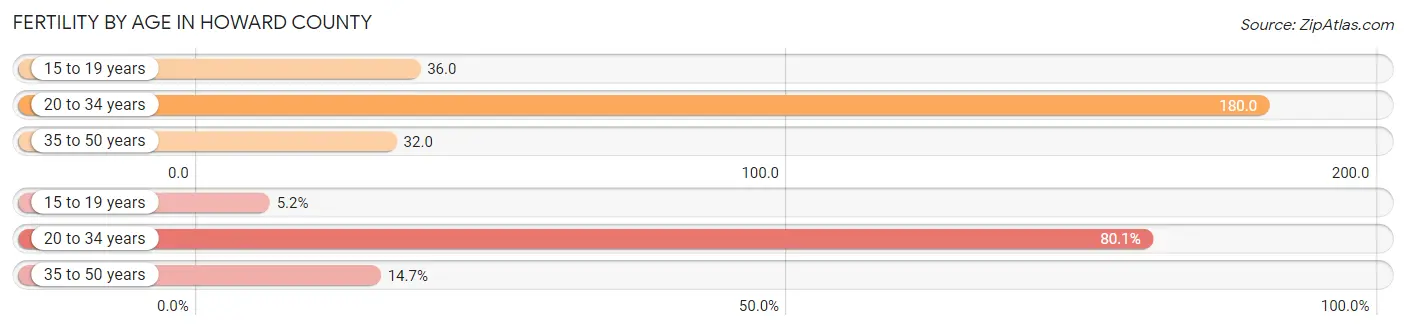
| Age Bracket | Women with Births | Births / 1,000 Women |
| 15 to 19 years | 35 (5.2%) | 36.0 |
| 20 to 34 years | 536 (80.1%) | 180.0 |
| 35 to 50 years | 98 (14.6%) | 32.0 |
| Total | 669 (100.0%) | 95.0 |
Fertility by Age by Marriage Status in Howard County
48.3% of women with births (669) in Howard County are married. The highest percentage of unmarried women with births falls into 20 to 34 years age bracket with 60.6% of them unmarried at the time of birth, while the lowest percentage of unmarried women with births belong to 15 to 19 years age bracket with 0.0% of them unmarried.
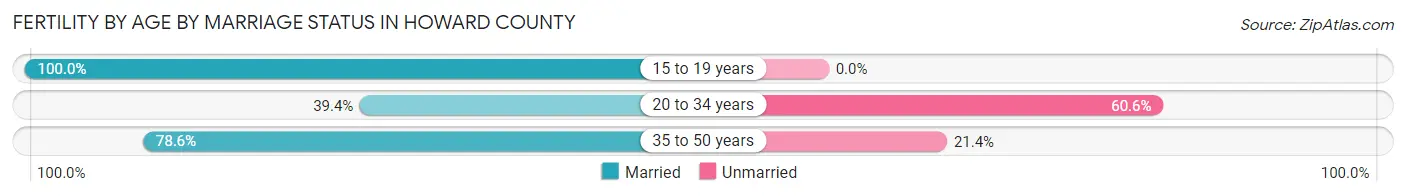
| Age Bracket | Married | Unmarried |
| 15 to 19 years | 35 (100.0%) | 0 (0.0%) |
| 20 to 34 years | 211 (39.4%) | 325 (60.6%) |
| 35 to 50 years | 77 (78.6%) | 21 (21.4%) |
| Total | 323 (48.3%) | 346 (51.7%) |
Fertility by Education in Howard County
Average fertility rate in Howard County is 95.0 births per 1,000 women. Women with the education attainment of high school diploma have the highest fertility rate of 142.0 births per 1,000 women, while women with the education attainment of less than high school have the lowest fertility at 55.0 births per 1,000 women. Women with the education attainment of high school diploma represent 43.5% of all women with births.
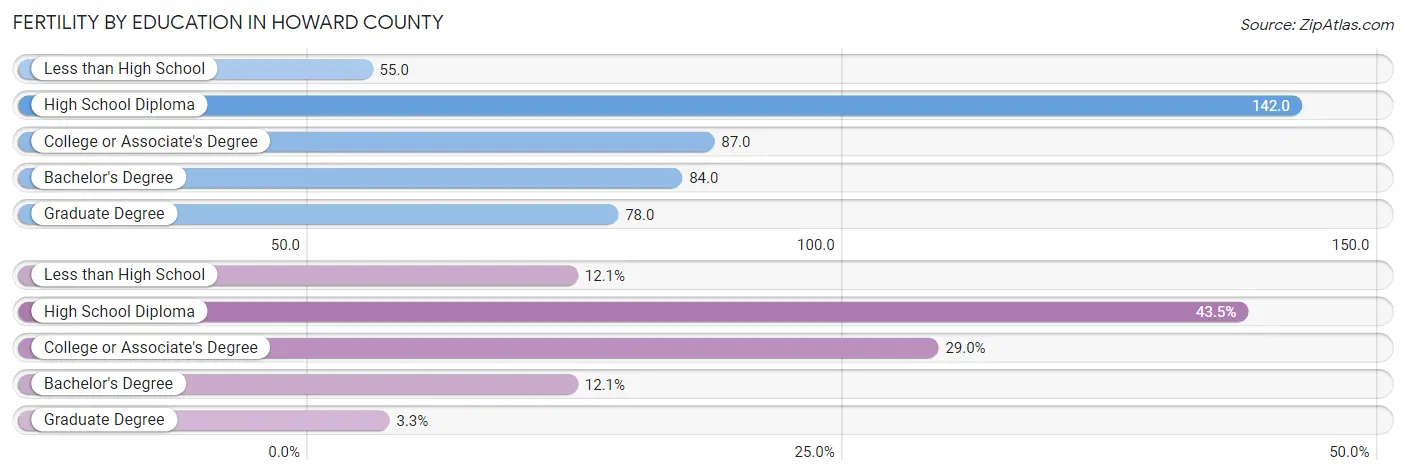
| Educational Attainment | Women with Births | Births / 1,000 Women |
| Less than High School | 81 (12.1%) | 55.0 |
| High School Diploma | 291 (43.5%) | 142.0 |
| College or Associate's Degree | 194 (29.0%) | 87.0 |
| Bachelor's Degree | 81 (12.1%) | 84.0 |
| Graduate Degree | 22 (3.3%) | 78.0 |
| Total | 669 (100.0%) | 95.0 |
Fertility by Education by Marriage Status in Howard County
51.7% of women with births in Howard County are unmarried. Women with the educational attainment of graduate degree are most likely to be married with 100.0% of them married at childbirth, while women with the educational attainment of college or associate's degree are least likely to be married with 70.1% of them unmarried at childbirth.
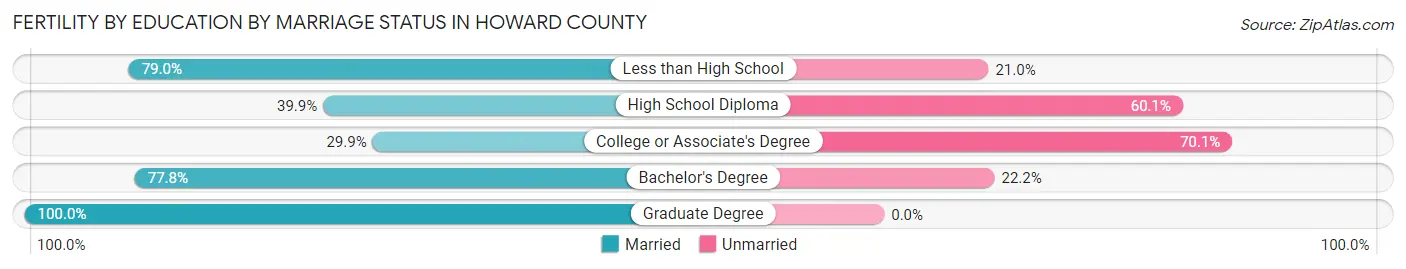
| Educational Attainment | Married | Unmarried |
| Less than High School | 64 (79.0%) | 17 (21.0%) |
| High School Diploma | 116 (39.9%) | 175 (60.1%) |
| College or Associate's Degree | 58 (29.9%) | 136 (70.1%) |
| Bachelor's Degree | 63 (77.8%) | 18 (22.2%) |
| Graduate Degree | 22 (100.0%) | 0 (0.0%) |
| Total | 323 (48.3%) | 346 (51.7%) |
Employment Characteristics in Howard County
Employment by Class of Employer in Howard County
Among the 14,167 employed individuals in Howard County, private company employees (9,904 | 69.9%), local government employees (1,238 | 8.7%), and self-employed (not incorporated) (796 | 5.6%) make up the most common classes of employment.
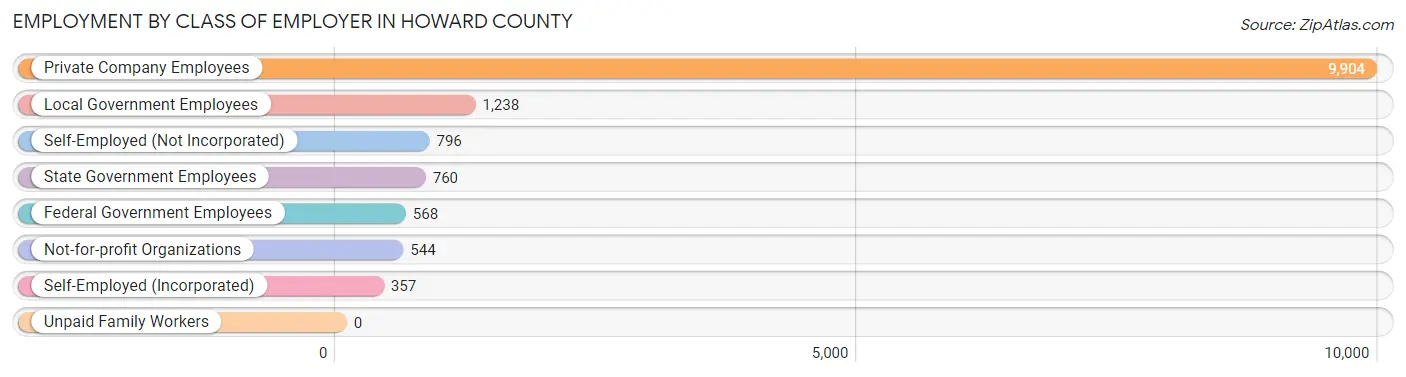
| Employer Class | # Employees | % Employees |
| Private Company Employees | 9,904 | 69.9% |
| Self-Employed (Incorporated) | 357 | 2.5% |
| Self-Employed (Not Incorporated) | 796 | 5.6% |
| Not-for-profit Organizations | 544 | 3.8% |
| Local Government Employees | 1,238 | 8.7% |
| State Government Employees | 760 | 5.4% |
| Federal Government Employees | 568 | 4.0% |
| Unpaid Family Workers | 0 | 0.0% |
| Total | 14,167 | 100.0% |
Employment Status by Age in Howard County
According to the labor force statistics for Howard County, out of the total population over 16 years of age (27,787), 54.3% or 15,088 individuals are in the labor force, with 5.2% or 785 of them unemployed. The age group with the highest labor force participation rate is 25 to 29 years, with 70.5% or 1,785 individuals in the labor force. Within the labor force, the 16 to 19 years age range has the highest percentage of unemployed individuals, with 27.6% or 185 of them being unemployed.
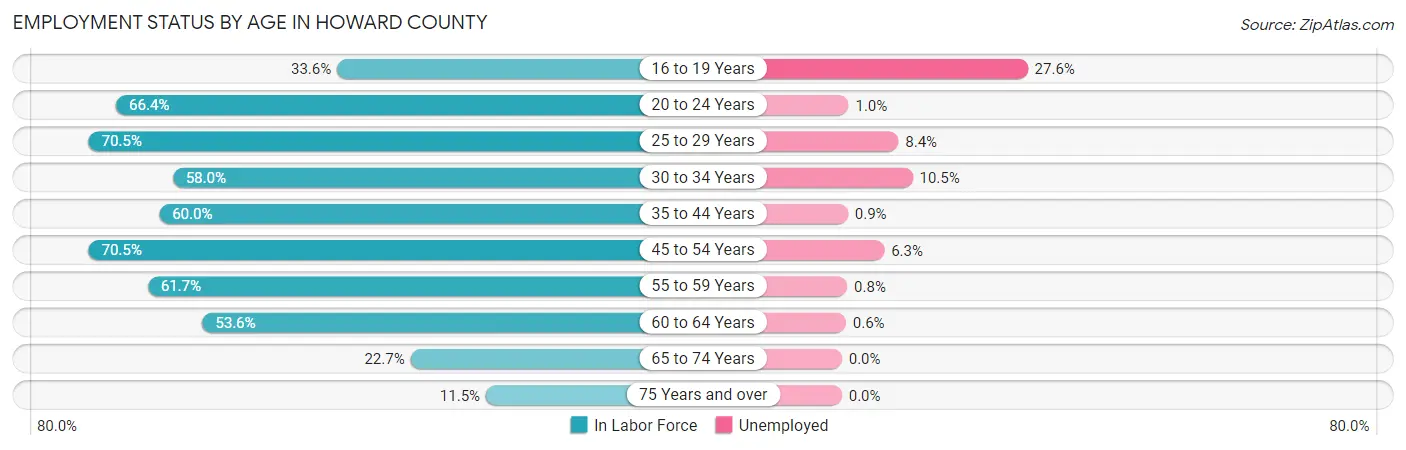
| Age Bracket | In Labor Force | Unemployed |
| 16 to 19 Years | 671 (33.6%) | 185 (27.6%) |
| 20 to 24 Years | 1,302 (66.4%) | 13 (1.0%) |
| 25 to 29 Years | 1,785 (70.5%) | 150 (8.4%) |
| 30 to 34 Years | 1,579 (58.0%) | 166 (10.5%) |
| 35 to 44 Years | 3,112 (60.0%) | 28 (0.9%) |
| 45 to 54 Years | 3,585 (70.5%) | 226 (6.3%) |
| 55 to 59 Years | 1,232 (61.7%) | 10 (0.8%) |
| 60 to 64 Years | 1,031 (53.6%) | 6 (0.6%) |
| 65 to 74 Years | 589 (22.7%) | 0 (0.0%) |
| 75 Years and over | 206 (11.5%) | 0 (0.0%) |
| Total | 15,088 (54.3%) | 785 (5.2%) |
Employment Status by Educational Attainment in Howard County
According to labor force statistics for Howard County, 63.4% of individuals (12,329) out of the total population between 25 and 64 years of age (19,447) are in the labor force, with 4.7% or 579 of them being unemployed. The group with the highest labor force participation rate are those with the educational attainment of bachelor's degree or higher, with 85.8% or 2,227 individuals in the labor force. Within the labor force, individuals with less than high school education have the highest percentage of unemployment, with 8.9% or 136 of them being unemployed.
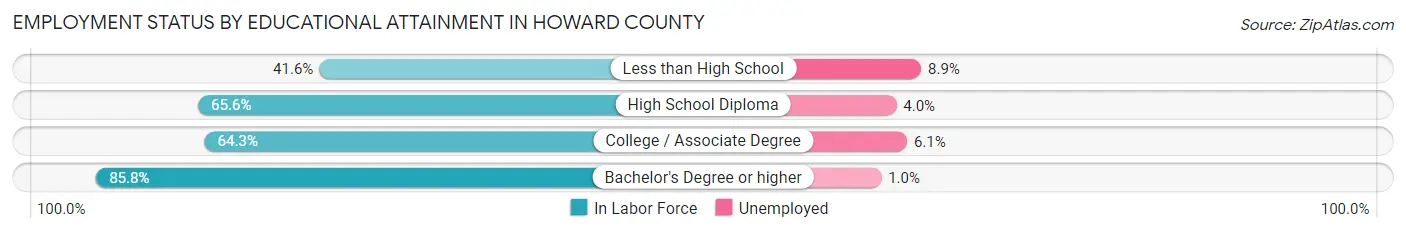
| Educational Attainment | In Labor Force | Unemployed |
| Less than High School | 1,523 (41.6%) | 326 (8.9%) |
| High School Diploma | 4,462 (65.6%) | 272 (4.0%) |
| College / Associate Degree | 4,107 (64.3%) | 390 (6.1%) |
| Bachelor's Degree or higher | 2,227 (85.8%) | 26 (1.0%) |
| Total | 12,329 (63.4%) | 914 (4.7%) |
Employment Occupations by Sex in Howard County
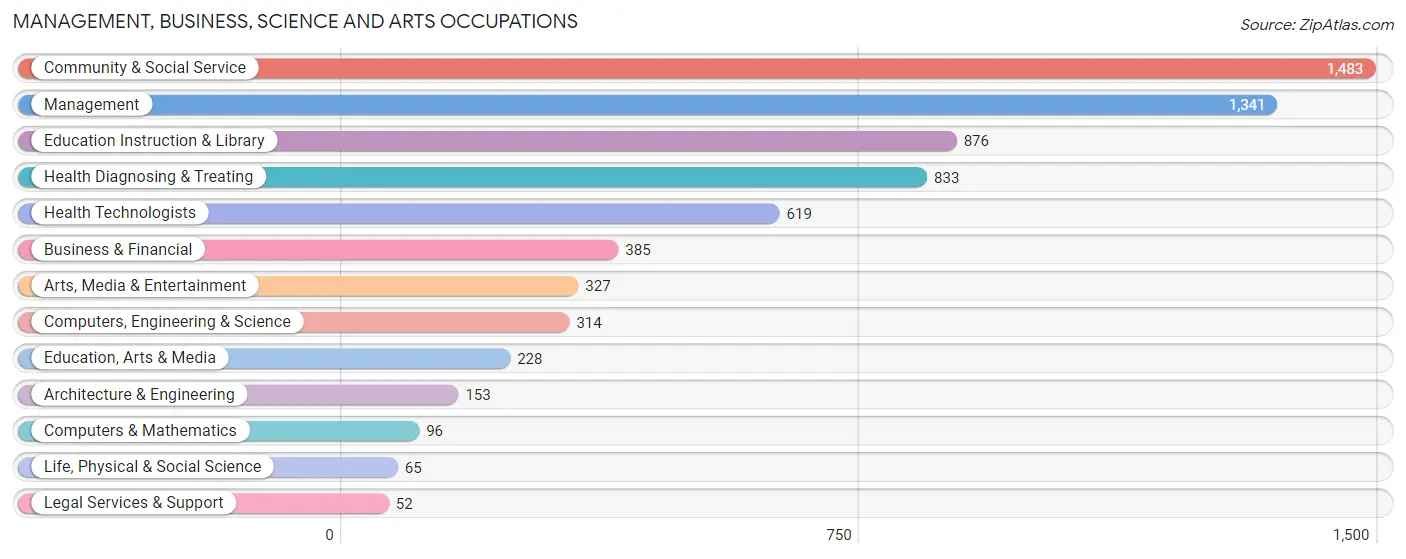
Management, Business, Science and Arts Occupations
The most common Management, Business, Science and Arts occupations in Howard County are Community & Social Service (1,483 | 10.4%), Management (1,341 | 9.4%), Education Instruction & Library (876 | 6.1%), Health Diagnosing & Treating (833 | 5.8%), and Health Technologists (619 | 4.3%).
Management, Business, Science and Arts Occupations by Sex
Within the Management, Business, Science and Arts occupations in Howard County, the most male-oriented occupations are Architecture & Engineering (100.0%), Life, Physical & Social Science (100.0%), and Computers, Engineering & Science (94.3%), while the most female-oriented occupations are Education Instruction & Library (77.4%), Education, Arts & Media (75.0%), and Community & Social Service (67.2%).
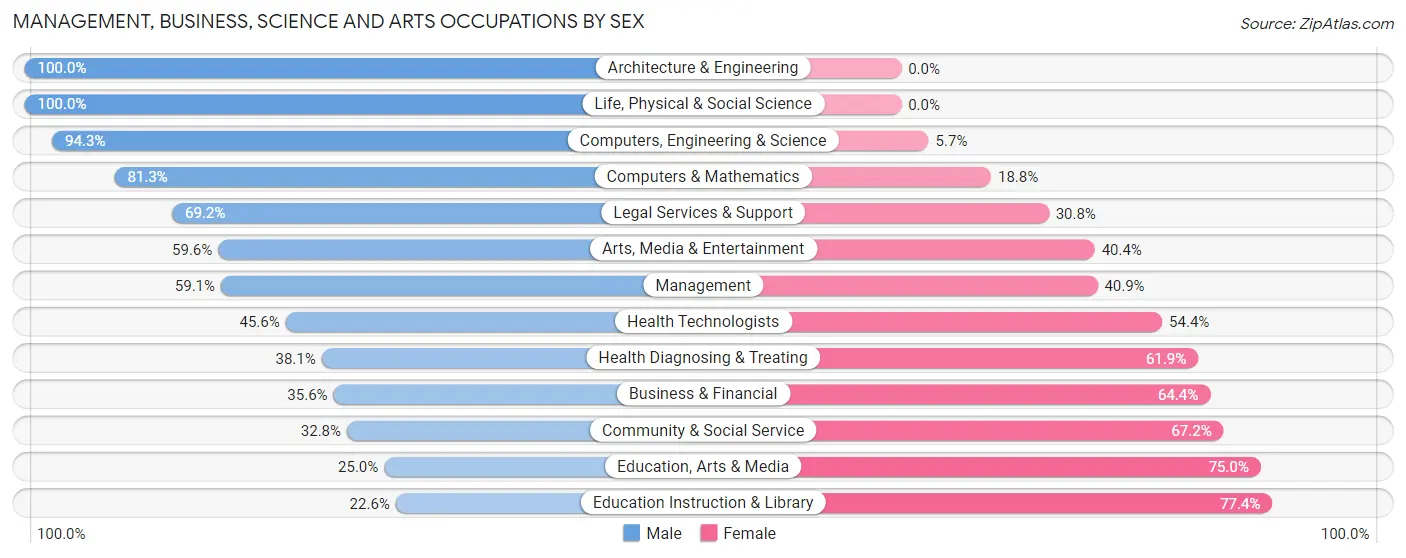
| Occupation | Male | Female |
| Management | 792 (59.1%) | 549 (40.9%) |
| Business & Financial | 137 (35.6%) | 248 (64.4%) |
| Computers, Engineering & Science | 296 (94.3%) | 18 (5.7%) |
| Computers & Mathematics | 78 (81.2%) | 18 (18.8%) |
| Architecture & Engineering | 153 (100.0%) | 0 (0.0%) |
| Life, Physical & Social Science | 65 (100.0%) | 0 (0.0%) |
| Community & Social Service | 486 (32.8%) | 997 (67.2%) |
| Education, Arts & Media | 57 (25.0%) | 171 (75.0%) |
| Legal Services & Support | 36 (69.2%) | 16 (30.8%) |
| Education Instruction & Library | 198 (22.6%) | 678 (77.4%) |
| Arts, Media & Entertainment | 195 (59.6%) | 132 (40.4%) |
| Health Diagnosing & Treating | 317 (38.1%) | 516 (61.9%) |
| Health Technologists | 282 (45.6%) | 337 (54.4%) |
| Total (Category) | 2,028 (46.6%) | 2,328 (53.4%) |
| Total (Overall) | 8,681 (60.8%) | 5,590 (39.2%) |
Services Occupations
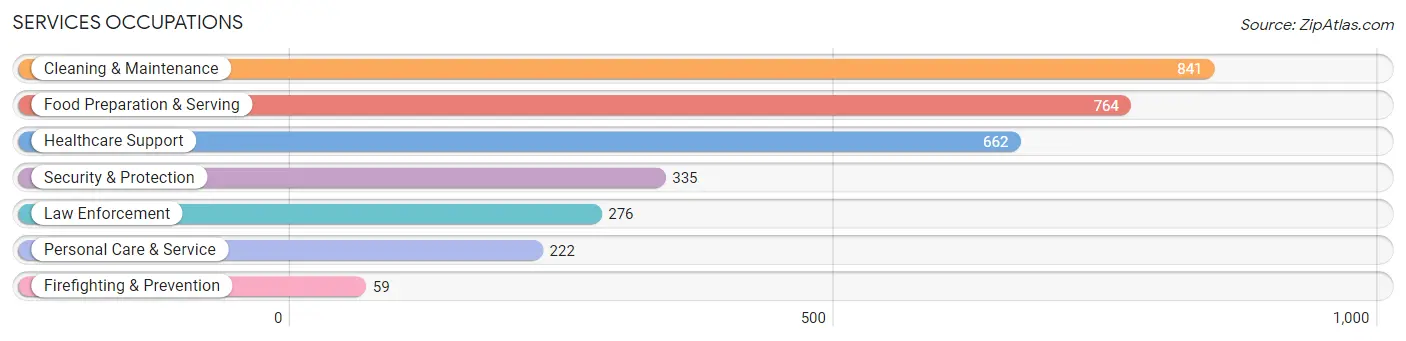
The most common Services occupations in Howard County are Cleaning & Maintenance (841 | 5.9%), Food Preparation & Serving (764 | 5.3%), Healthcare Support (662 | 4.6%), Security & Protection (335 | 2.4%), and Law Enforcement (276 | 1.9%).
Services Occupations by Sex
Within the Services occupations in Howard County, the most male-oriented occupations are Law Enforcement (83.3%), Security & Protection (82.1%), and Firefighting & Prevention (76.3%), while the most female-oriented occupations are Personal Care & Service (85.1%), Healthcare Support (81.6%), and Food Preparation & Serving (46.9%).
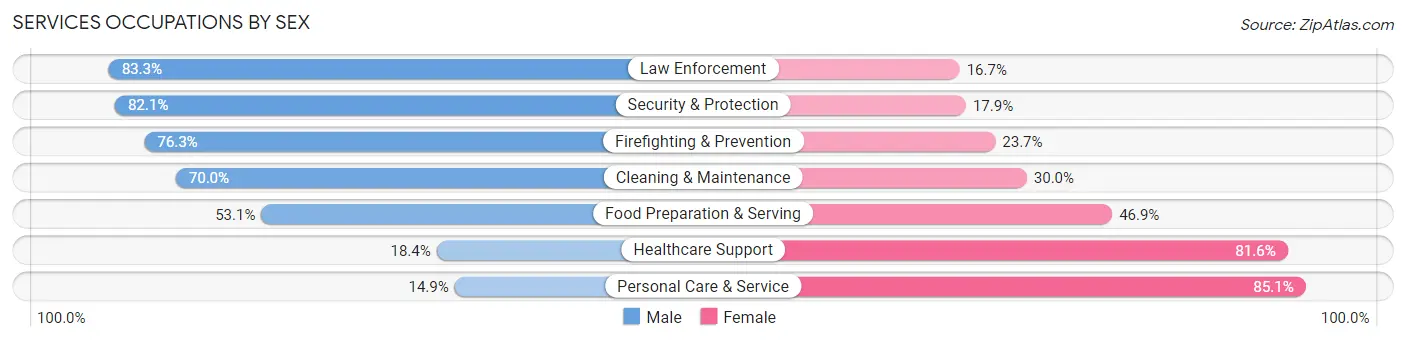
| Occupation | Male | Female |
| Healthcare Support | 122 (18.4%) | 540 (81.6%) |
| Security & Protection | 275 (82.1%) | 60 (17.9%) |
| Firefighting & Prevention | 45 (76.3%) | 14 (23.7%) |
| Law Enforcement | 230 (83.3%) | 46 (16.7%) |
| Food Preparation & Serving | 406 (53.1%) | 358 (46.9%) |
| Cleaning & Maintenance | 589 (70.0%) | 252 (30.0%) |
| Personal Care & Service | 33 (14.9%) | 189 (85.1%) |
| Total (Category) | 1,425 (50.5%) | 1,399 (49.5%) |
| Total (Overall) | 8,681 (60.8%) | 5,590 (39.2%) |
Sales and Office Occupations
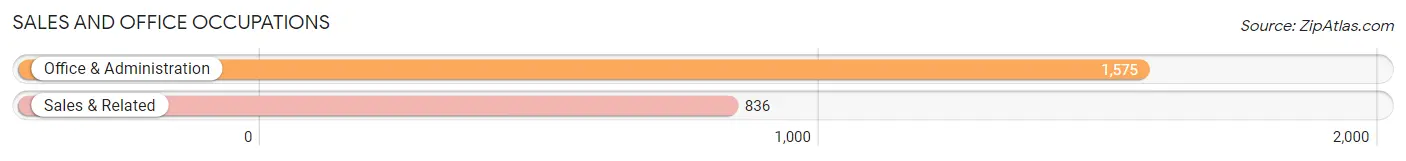
The most common Sales and Office occupations in Howard County are Office & Administration (1,575 | 11.0%), and Sales & Related (836 | 5.9%).
Sales and Office Occupations by Sex
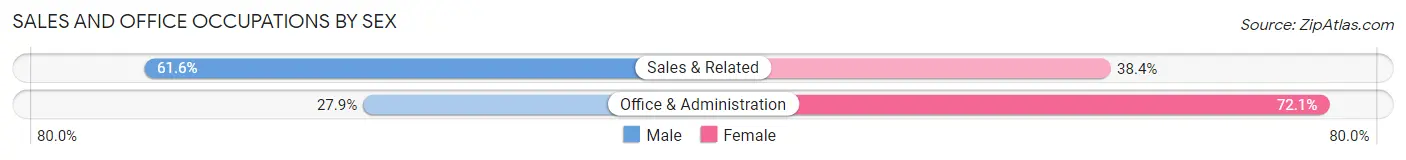
| Occupation | Male | Female |
| Sales & Related | 515 (61.6%) | 321 (38.4%) |
| Office & Administration | 440 (27.9%) | 1,135 (72.1%) |
| Total (Category) | 955 (39.6%) | 1,456 (60.4%) |
| Total (Overall) | 8,681 (60.8%) | 5,590 (39.2%) |
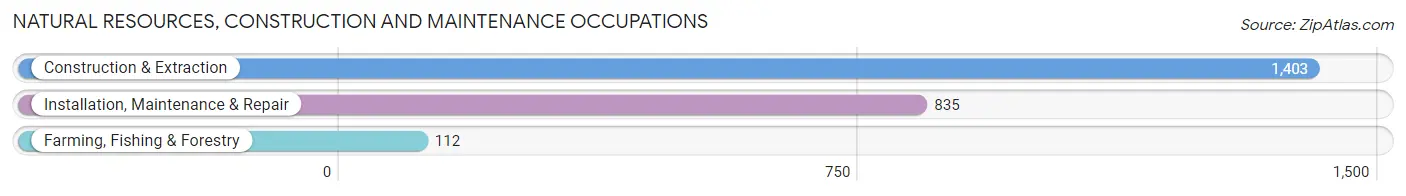
Natural Resources, Construction and Maintenance Occupations
The most common Natural Resources, Construction and Maintenance occupations in Howard County are Construction & Extraction (1,403 | 9.8%), Installation, Maintenance & Repair (835 | 5.9%), and Farming, Fishing & Forestry (112 | 0.8%).
Natural Resources, Construction and Maintenance Occupations by Sex
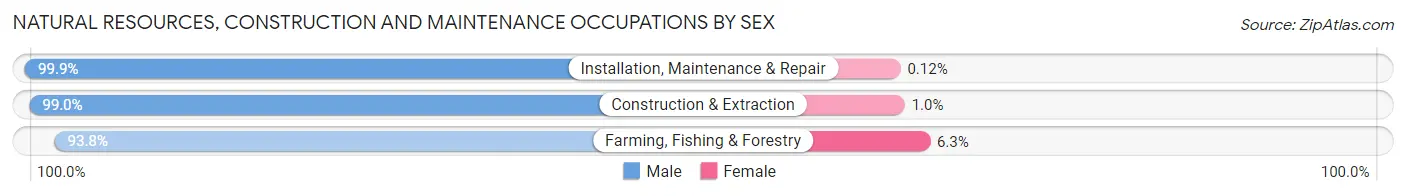
| Occupation | Male | Female |
| Farming, Fishing & Forestry | 105 (93.8%) | 7 (6.2%) |
| Construction & Extraction | 1,389 (99.0%) | 14 (1.0%) |
| Installation, Maintenance & Repair | 834 (99.9%) | 1 (0.1%) |
| Total (Category) | 2,328 (99.1%) | 22 (0.9%) |
| Total (Overall) | 8,681 (60.8%) | 5,590 (39.2%) |
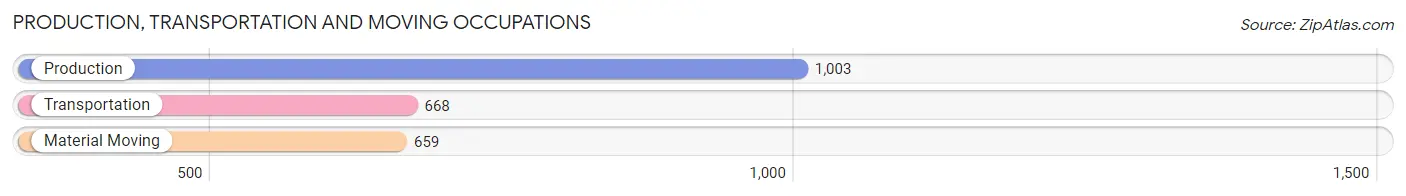
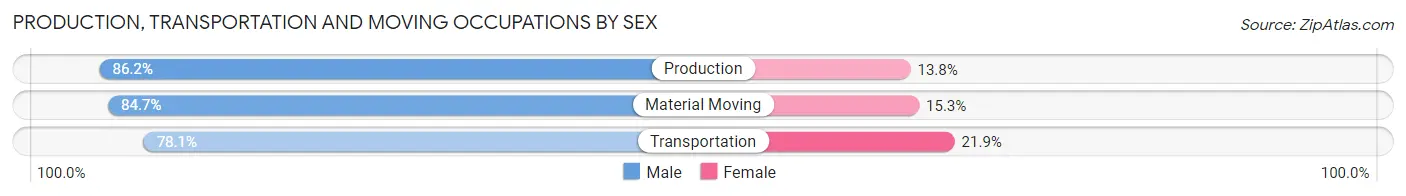
Production, Transportation and Moving Occupations
The most common Production, Transportation and Moving occupations in Howard County are Production (1,003 | 7.0%), Transportation (668 | 4.7%), and Material Moving (659 | 4.6%).
Production, Transportation and Moving Occupations by Sex
| Occupation | Male | Female |
| Production | 865 (86.2%) | 138 (13.8%) |
| Transportation | 522 (78.1%) | 146 (21.9%) |
| Material Moving | 558 (84.7%) | 101 (15.3%) |
| Total (Category) | 1,945 (83.5%) | 385 (16.5%) |
| Total (Overall) | 8,681 (60.8%) | 5,590 (39.2%) |
Employment Industries by Sex in Howard County
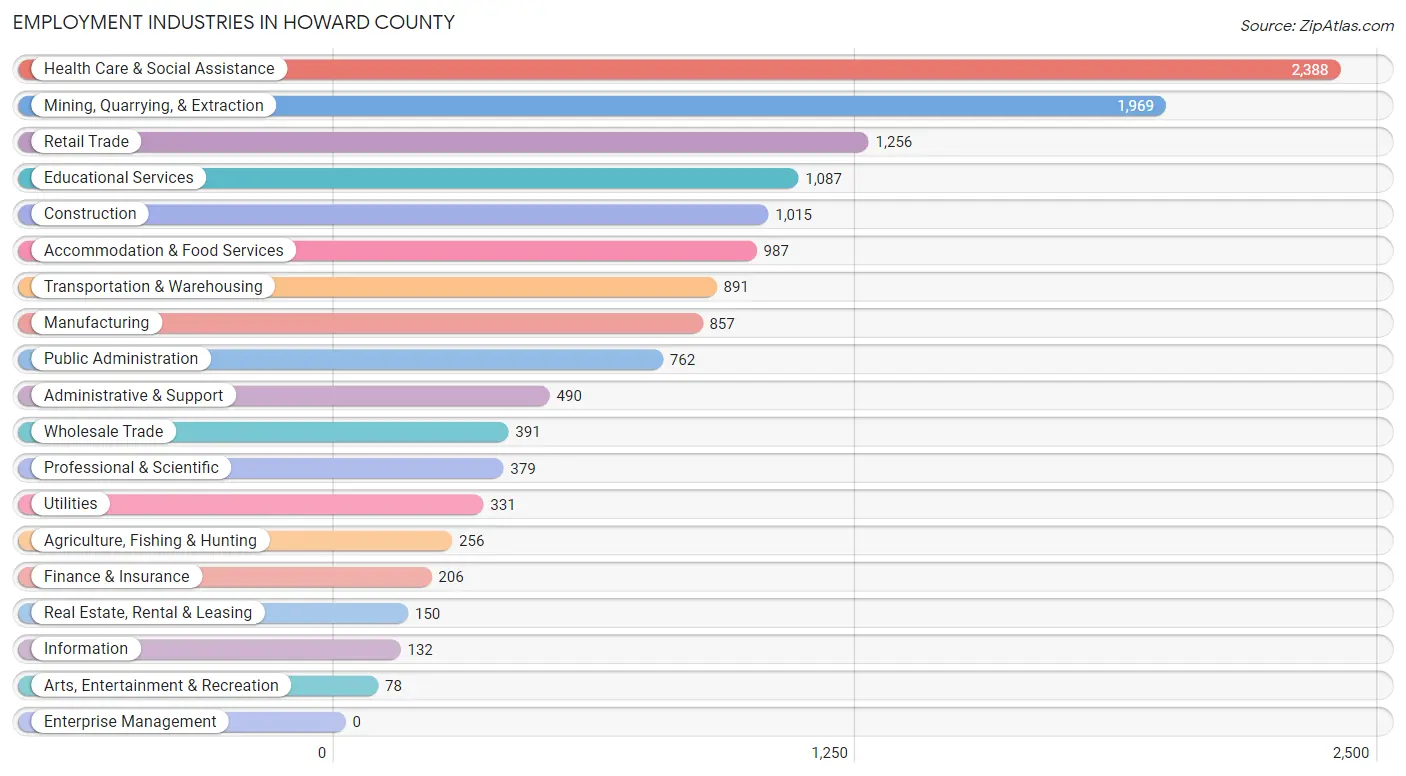
Employment Industries in Howard County
The major employment industries in Howard County include Health Care & Social Assistance (2,388 | 16.7%), Mining, Quarrying, & Extraction (1,969 | 13.8%), Retail Trade (1,256 | 8.8%), Educational Services (1,087 | 7.6%), and Construction (1,015 | 7.1%).
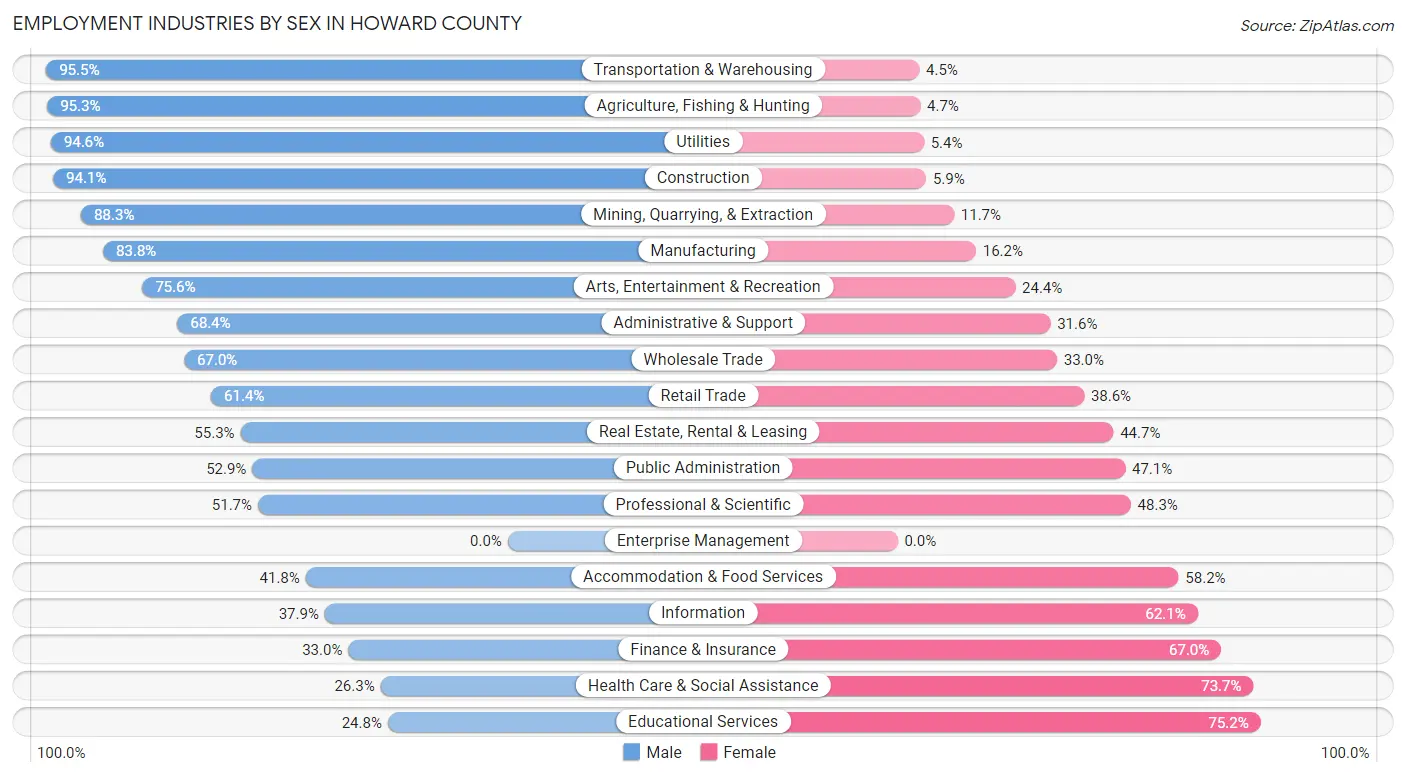
Employment Industries by Sex in Howard County
The Howard County industries that see more men than women are Transportation & Warehousing (95.5%), Agriculture, Fishing & Hunting (95.3%), and Utilities (94.6%), whereas the industries that tend to have a higher number of women are Educational Services (75.2%), Health Care & Social Assistance (73.7%), and Finance & Insurance (67.0%).
| Industry | Male | Female |
| Agriculture, Fishing & Hunting | 244 (95.3%) | 12 (4.7%) |
| Mining, Quarrying, & Extraction | 1,739 (88.3%) | 230 (11.7%) |
| Construction | 955 (94.1%) | 60 (5.9%) |
| Manufacturing | 718 (83.8%) | 139 (16.2%) |
| Wholesale Trade | 262 (67.0%) | 129 (33.0%) |
| Retail Trade | 771 (61.4%) | 485 (38.6%) |
| Transportation & Warehousing | 851 (95.5%) | 40 (4.5%) |
| Utilities | 313 (94.6%) | 18 (5.4%) |
| Information | 50 (37.9%) | 82 (62.1%) |
| Finance & Insurance | 68 (33.0%) | 138 (67.0%) |
| Real Estate, Rental & Leasing | 83 (55.3%) | 67 (44.7%) |
| Professional & Scientific | 196 (51.7%) | 183 (48.3%) |
| Enterprise Management | 0 (0.0%) | 0 (0.0%) |
| Administrative & Support | 335 (68.4%) | 155 (31.6%) |
| Educational Services | 270 (24.8%) | 817 (75.2%) |
| Health Care & Social Assistance | 629 (26.3%) | 1,759 (73.7%) |
| Arts, Entertainment & Recreation | 59 (75.6%) | 19 (24.4%) |
| Accommodation & Food Services | 413 (41.8%) | 574 (58.2%) |
| Public Administration | 403 (52.9%) | 359 (47.1%) |
| Total | 8,681 (60.8%) | 5,590 (39.2%) |
Education in Howard County
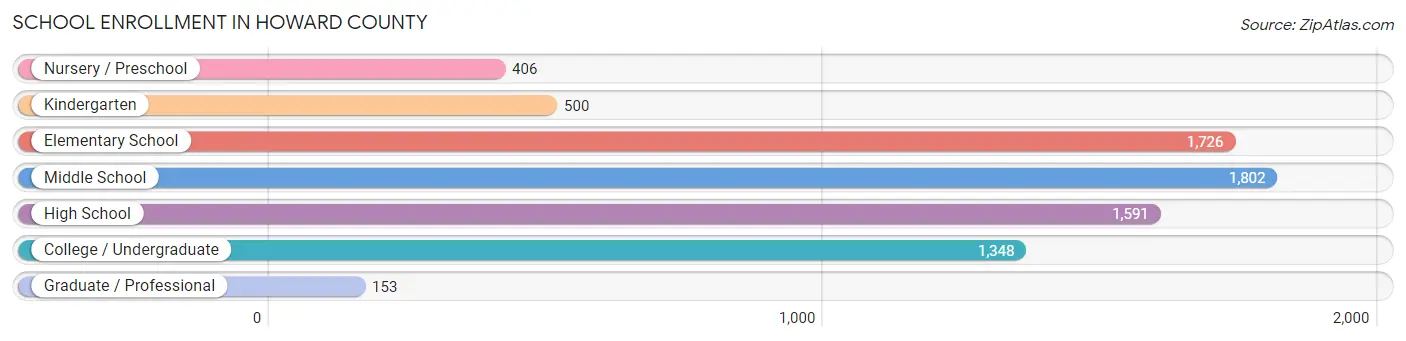
School Enrollment in Howard County
The most common levels of schooling among the 7,526 students in Howard County are middle school (1,802 | 23.9%), elementary school (1,726 | 22.9%), and high school (1,591 | 21.1%).
| School Level | # Students | % Students |
| Nursery / Preschool | 406 | 5.4% |
| Kindergarten | 500 | 6.6% |
| Elementary School | 1,726 | 22.9% |
| Middle School | 1,802 | 23.9% |
| High School | 1,591 | 21.1% |
| College / Undergraduate | 1,348 | 17.9% |
| Graduate / Professional | 153 | 2.0% |
| Total | 7,526 | 100.0% |
School Enrollment by Age by Funding Source in Howard County
Out of a total of 7,526 students who are enrolled in schools in Howard County, 986 (13.1%) attend a private institution, while the remaining 6,540 (86.9%) are enrolled in public schools. The age group of 15 to 17 year olds has the highest likelihood of being enrolled in private schools, with 220 (18.5% in the age bracket) enrolled. Conversely, the age group of 20 to 24 year olds has the lowest likelihood of being enrolled in a private school, with 487 (93.5% in the age bracket) attending a public institution.
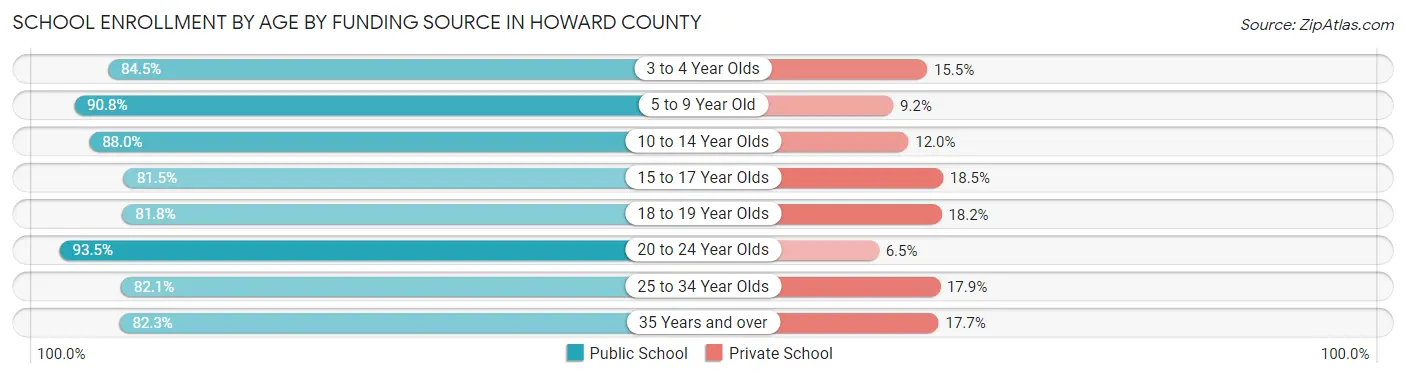
| Age Bracket | Public School | Private School |
| 3 to 4 Year Olds | 272 (84.5%) | 50 (15.5%) |
| 5 to 9 Year Old | 1,881 (90.8%) | 191 (9.2%) |
| 10 to 14 Year Olds | 1,827 (88.0%) | 250 (12.0%) |
| 15 to 17 Year Olds | 971 (81.5%) | 220 (18.5%) |
| 18 to 19 Year Olds | 575 (81.8%) | 128 (18.2%) |
| 20 to 24 Year Olds | 487 (93.5%) | 34 (6.5%) |
| 25 to 34 Year Olds | 279 (82.1%) | 61 (17.9%) |
| 35 Years and over | 247 (82.3%) | 53 (17.7%) |
| Total | 6,540 (86.9%) | 986 (13.1%) |
Educational Attainment by Field of Study in Howard County
Business (714 | 20.2%), education (611 | 17.3%), science & technology (541 | 15.3%), liberal arts & history (306 | 8.6%), and bio, nature & agricultural (210 | 5.9%) are the most common fields of study among 3,538 individuals in Howard County who have obtained a bachelor's degree or higher.
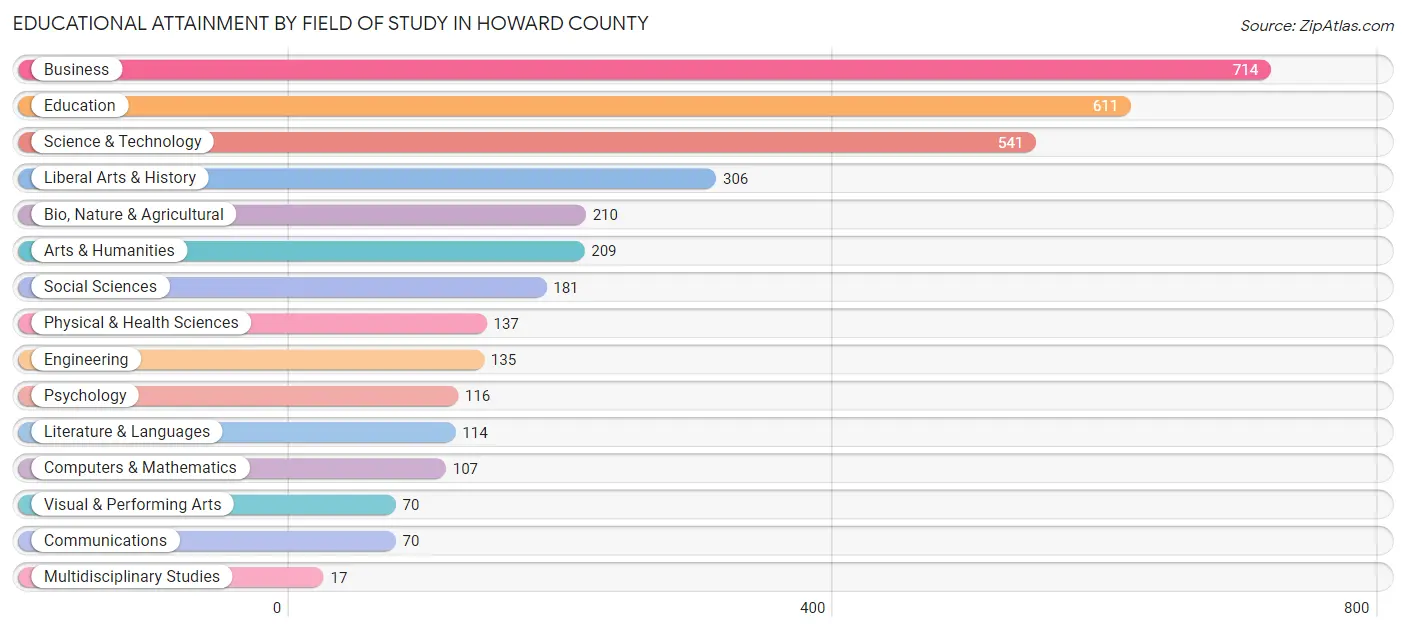
| Field of Study | # Graduates | % Graduates |
| Computers & Mathematics | 107 | 3.0% |
| Bio, Nature & Agricultural | 210 | 5.9% |
| Physical & Health Sciences | 137 | 3.9% |
| Psychology | 116 | 3.3% |
| Social Sciences | 181 | 5.1% |
| Engineering | 135 | 3.8% |
| Multidisciplinary Studies | 17 | 0.5% |
| Science & Technology | 541 | 15.3% |
| Business | 714 | 20.2% |
| Education | 611 | 17.3% |
| Literature & Languages | 114 | 3.2% |
| Liberal Arts & History | 306 | 8.6% |
| Visual & Performing Arts | 70 | 2.0% |
| Communications | 70 | 2.0% |
| Arts & Humanities | 209 | 5.9% |
| Total | 3,538 | 100.0% |
Transportation & Commute in Howard County
Vehicle Availability by Sex in Howard County
The most prevalent vehicle ownership categories in Howard County are males with 2 vehicles (3,337, accounting for 39.0%) and females with 2 vehicles (1,868, making up 60.6%).
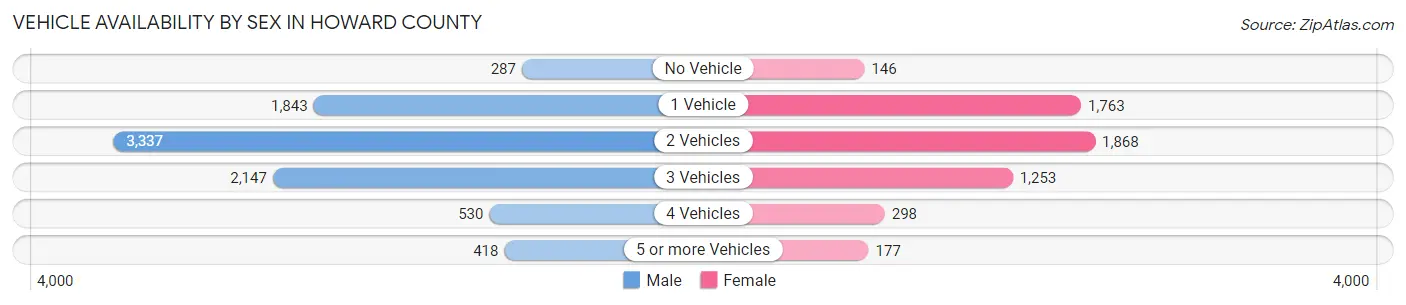
| Vehicles Available | Male | Female |
| No Vehicle | 287 (3.4%) | 146 (2.6%) |
| 1 Vehicle | 1,843 (21.5%) | 1,763 (32.0%) |
| 2 Vehicles | 3,337 (39.0%) | 1,868 (33.9%) |
| 3 Vehicles | 2,147 (25.1%) | 1,253 (22.8%) |
| 4 Vehicles | 530 (6.2%) | 298 (5.4%) |
| 5 or more Vehicles | 418 (4.9%) | 177 (3.2%) |
| Total | 8,562 (100.0%) | 5,505 (100.0%) |
Commute Time in Howard County
The most frequently occuring commute durations in Howard County are 10 to 14 minutes (3,789 commuters, 27.4%), 5 to 9 minutes (2,406 commuters, 17.4%), and 15 to 19 minutes (2,286 commuters, 16.5%).
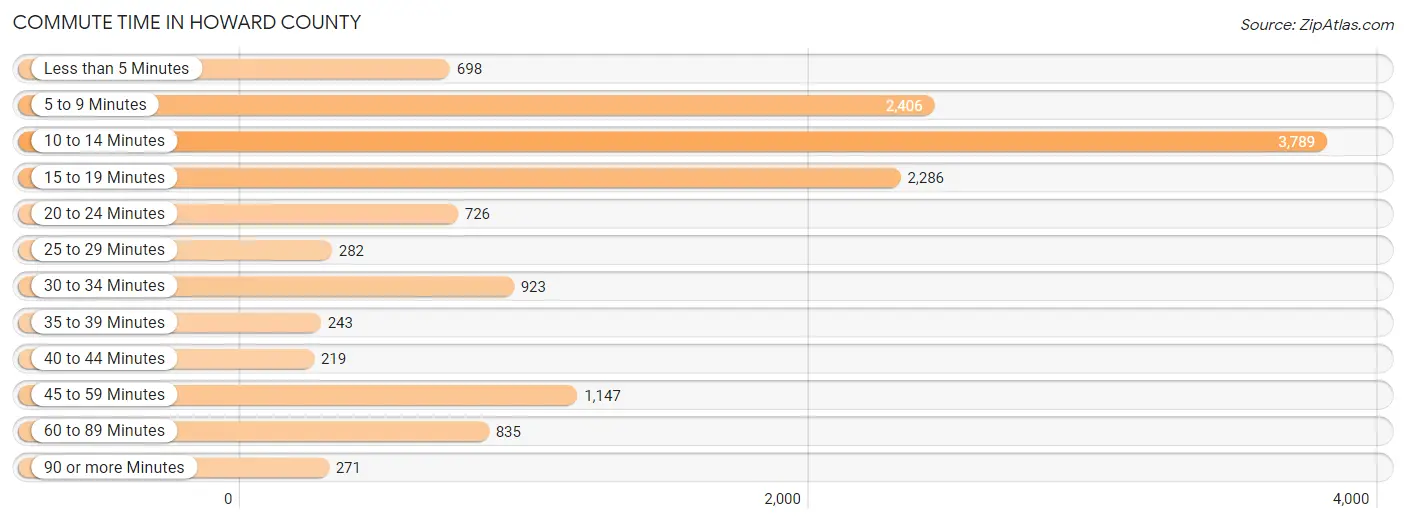
| Commute Time | # Commuters | % Commuters |
| Less than 5 Minutes | 698 | 5.1% |
| 5 to 9 Minutes | 2,406 | 17.4% |
| 10 to 14 Minutes | 3,789 | 27.4% |
| 15 to 19 Minutes | 2,286 | 16.5% |
| 20 to 24 Minutes | 726 | 5.2% |
| 25 to 29 Minutes | 282 | 2.0% |
| 30 to 34 Minutes | 923 | 6.7% |
| 35 to 39 Minutes | 243 | 1.8% |
| 40 to 44 Minutes | 219 | 1.6% |
| 45 to 59 Minutes | 1,147 | 8.3% |
| 60 to 89 Minutes | 835 | 6.0% |
| 90 or more Minutes | 271 | 2.0% |
Commute Time by Sex in Howard County
The most common commute times in Howard County are 10 to 14 minutes (2,049 commuters, 24.2%) for males and 10 to 14 minutes (1,740 commuters, 32.4%) for females.
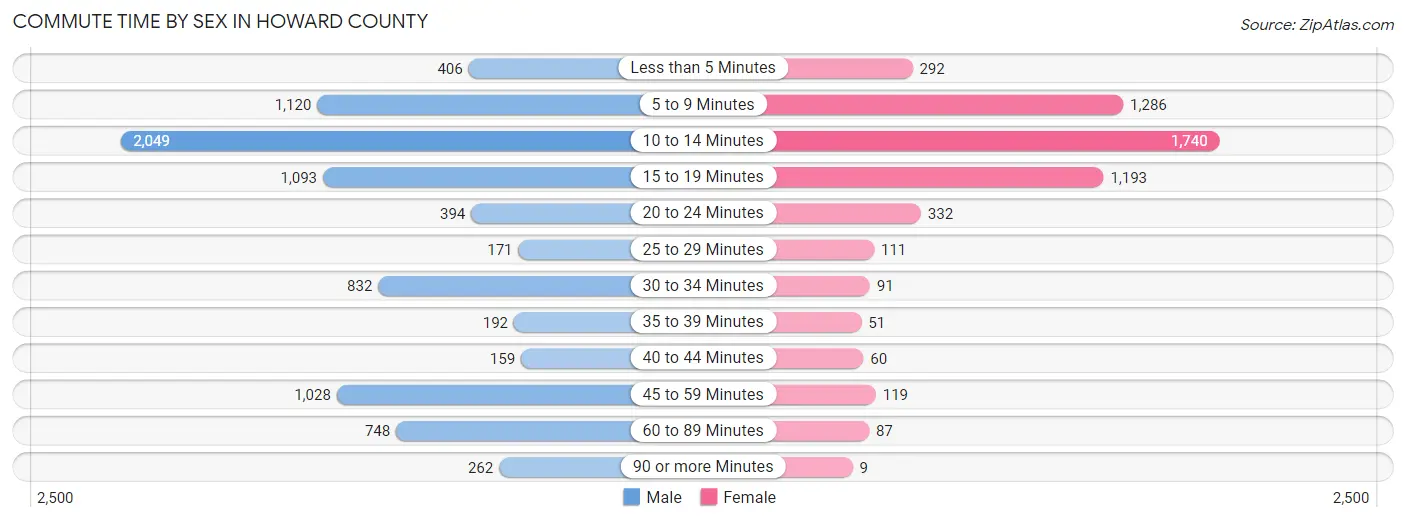
| Commute Time | Male | Female |
| Less than 5 Minutes | 406 (4.8%) | 292 (5.4%) |
| 5 to 9 Minutes | 1,120 (13.3%) | 1,286 (23.9%) |
| 10 to 14 Minutes | 2,049 (24.2%) | 1,740 (32.4%) |
| 15 to 19 Minutes | 1,093 (12.9%) | 1,193 (22.2%) |
| 20 to 24 Minutes | 394 (4.7%) | 332 (6.2%) |
| 25 to 29 Minutes | 171 (2.0%) | 111 (2.1%) |
| 30 to 34 Minutes | 832 (9.8%) | 91 (1.7%) |
| 35 to 39 Minutes | 192 (2.3%) | 51 (0.9%) |
| 40 to 44 Minutes | 159 (1.9%) | 60 (1.1%) |
| 45 to 59 Minutes | 1,028 (12.2%) | 119 (2.2%) |
| 60 to 89 Minutes | 748 (8.8%) | 87 (1.6%) |
| 90 or more Minutes | 262 (3.1%) | 9 (0.2%) |
Time of Departure to Work by Sex in Howard County
The most frequent times of departure to work in Howard County are 7:00 AM to 7:29 AM (1,517, 17.9%) for males and 7:30 AM to 7:59 AM (1,066, 19.9%) for females.
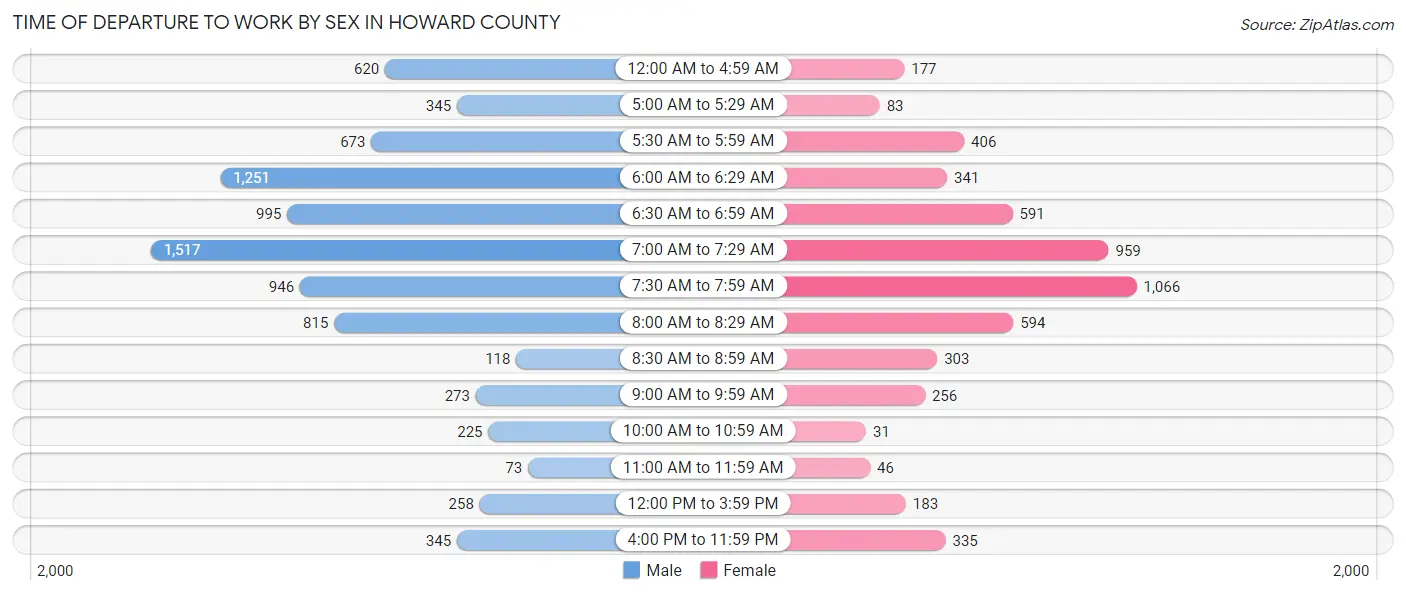
| Time of Departure | Male | Female |
| 12:00 AM to 4:59 AM | 620 (7.3%) | 177 (3.3%) |
| 5:00 AM to 5:29 AM | 345 (4.1%) | 83 (1.5%) |
| 5:30 AM to 5:59 AM | 673 (8.0%) | 406 (7.6%) |
| 6:00 AM to 6:29 AM | 1,251 (14.8%) | 341 (6.4%) |
| 6:30 AM to 6:59 AM | 995 (11.8%) | 591 (11.0%) |
| 7:00 AM to 7:29 AM | 1,517 (17.9%) | 959 (17.9%) |
| 7:30 AM to 7:59 AM | 946 (11.2%) | 1,066 (19.9%) |
| 8:00 AM to 8:29 AM | 815 (9.6%) | 594 (11.1%) |
| 8:30 AM to 8:59 AM | 118 (1.4%) | 303 (5.6%) |
| 9:00 AM to 9:59 AM | 273 (3.2%) | 256 (4.8%) |
| 10:00 AM to 10:59 AM | 225 (2.7%) | 31 (0.6%) |
| 11:00 AM to 11:59 AM | 73 (0.9%) | 46 (0.9%) |
| 12:00 PM to 3:59 PM | 258 (3.0%) | 183 (3.4%) |
| 4:00 PM to 11:59 PM | 345 (4.1%) | 335 (6.2%) |
| Total | 8,454 (100.0%) | 5,371 (100.0%) |
Housing Occupancy in Howard County
Occupancy by Ownership in Howard County
Of the total 12,010 dwellings in Howard County, owner-occupied units account for 8,017 (66.7%), while renter-occupied units make up 3,993 (33.3%).
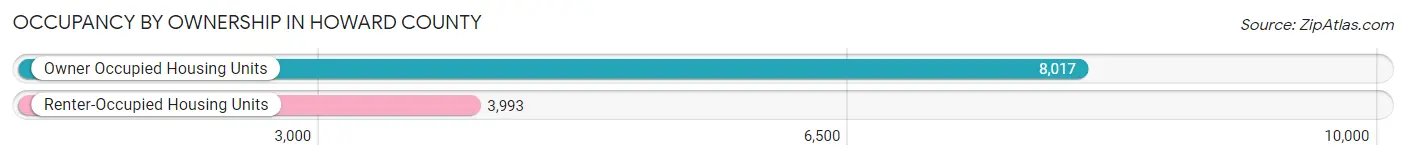
| Occupancy | # Housing Units | % Housing Units |
| Owner Occupied Housing Units | 8,017 | 66.7% |
| Renter-Occupied Housing Units | 3,993 | 33.3% |
| Total Occupied Housing Units | 12,010 | 100.0% |
Occupancy by Household Size in Howard County
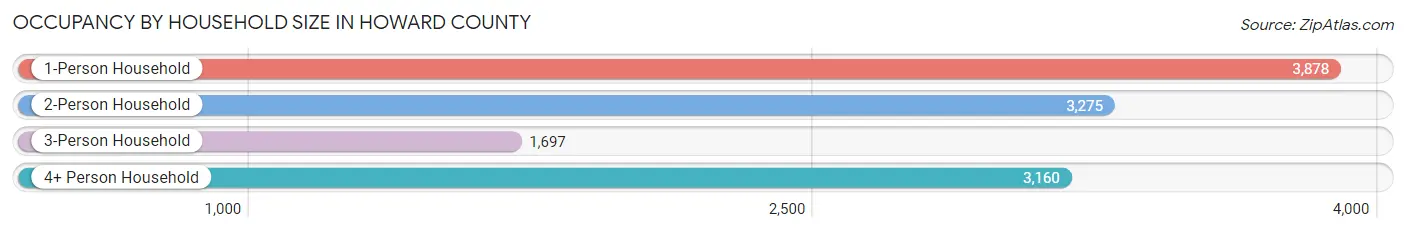
| Household Size | # Housing Units | % Housing Units |
| 1-Person Household | 3,878 | 32.3% |
| 2-Person Household | 3,275 | 27.3% |
| 3-Person Household | 1,697 | 14.1% |
| 4+ Person Household | 3,160 | 26.3% |
| Total Housing Units | 12,010 | 100.0% |
Occupancy by Ownership by Household Size in Howard County
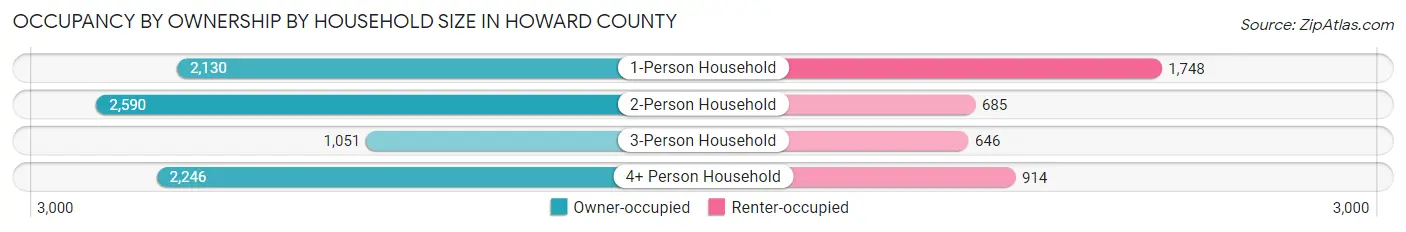
| Household Size | Owner-occupied | Renter-occupied |
| 1-Person Household | 2,130 (54.9%) | 1,748 (45.1%) |
| 2-Person Household | 2,590 (79.1%) | 685 (20.9%) |
| 3-Person Household | 1,051 (61.9%) | 646 (38.1%) |
| 4+ Person Household | 2,246 (71.1%) | 914 (28.9%) |
| Total Housing Units | 8,017 (66.7%) | 3,993 (33.3%) |
Occupancy by Educational Attainment in Howard County
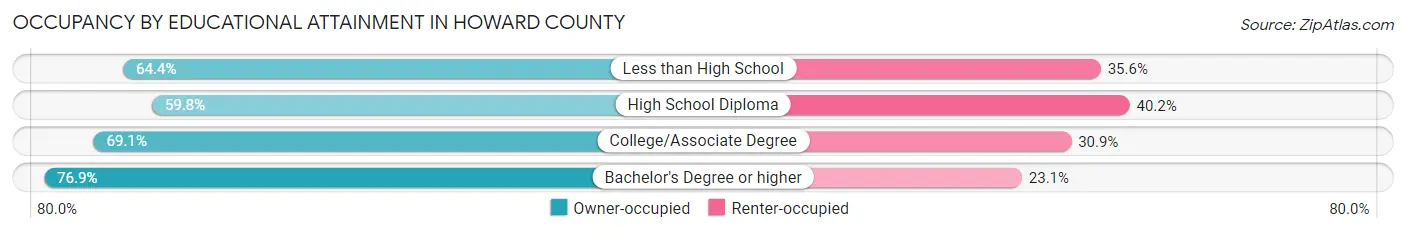
| Household Size | Owner-occupied | Renter-occupied |
| Less than High School | 949 (64.4%) | 525 (35.6%) |
| High School Diploma | 2,402 (59.8%) | 1,614 (40.2%) |
| College/Associate Degree | 3,066 (69.1%) | 1,373 (30.9%) |
| Bachelor's Degree or higher | 1,600 (76.9%) | 481 (23.1%) |
Occupancy by Age of Householder in Howard County
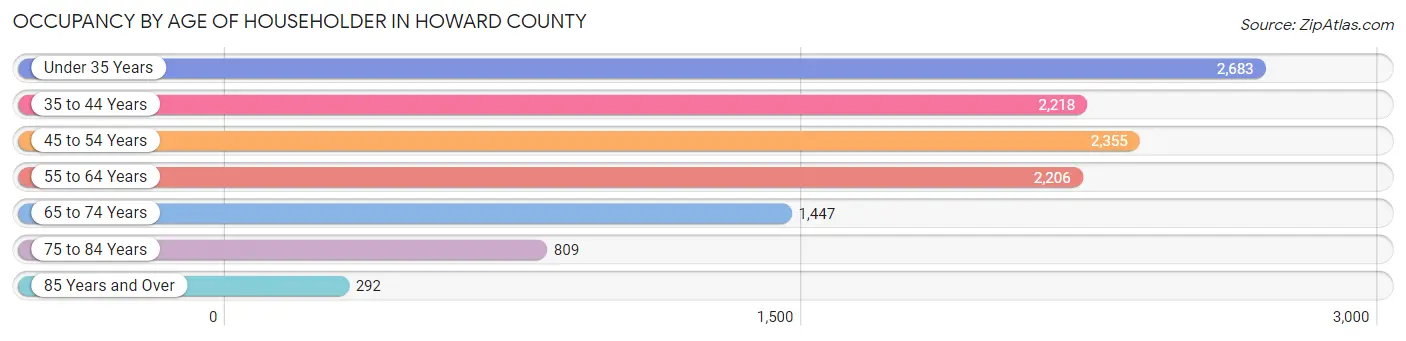
| Age Bracket | # Households | % Households |
| Under 35 Years | 2,683 | 22.3% |
| 35 to 44 Years | 2,218 | 18.5% |
| 45 to 54 Years | 2,355 | 19.6% |
| 55 to 64 Years | 2,206 | 18.4% |
| 65 to 74 Years | 1,447 | 12.0% |
| 75 to 84 Years | 809 | 6.7% |
| 85 Years and Over | 292 | 2.4% |
| Total | 12,010 | 100.0% |
Housing Finances in Howard County
Median Income by Occupancy in Howard County
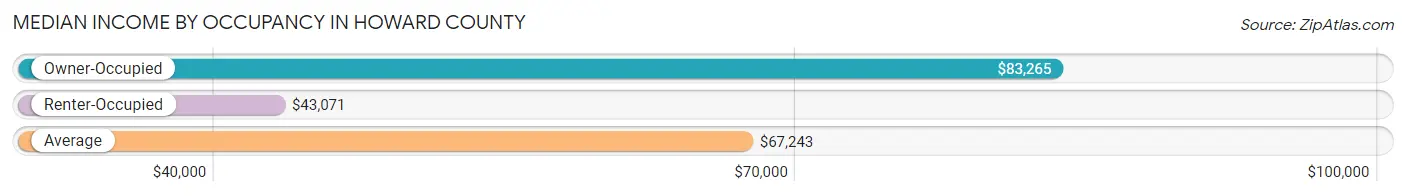
| Occupancy Type | # Households | Median Income |
| Owner-Occupied | 8,017 (66.7%) | $83,265 |
| Renter-Occupied | 3,993 (33.3%) | $43,071 |
| Average | 12,010 (100.0%) | $67,243 |
Occupancy by Householder Income Bracket in Howard County
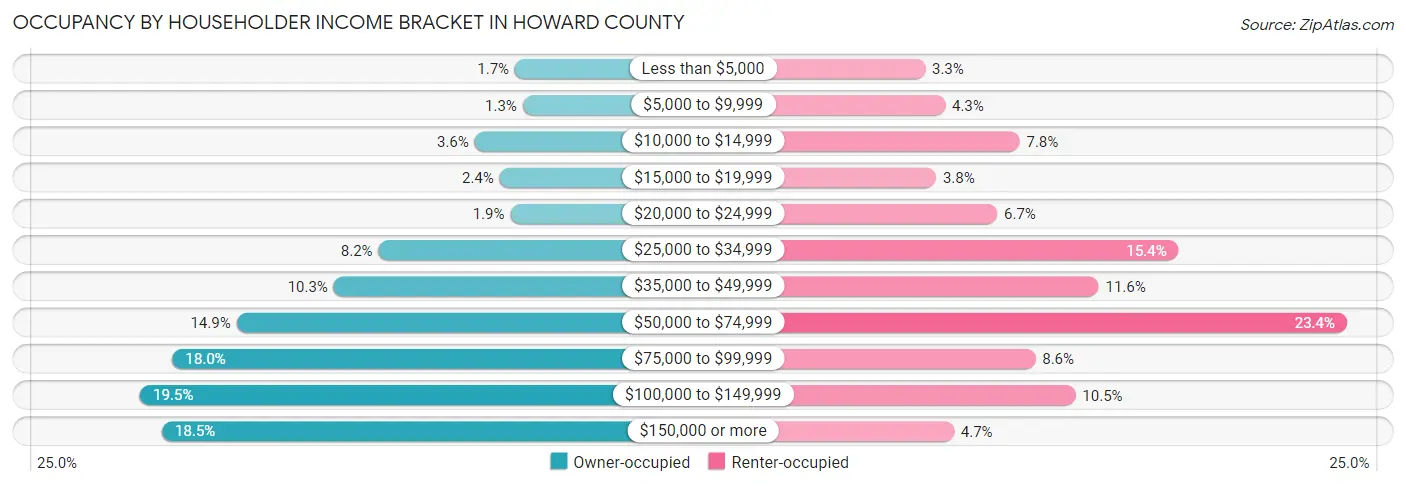
| Income Bracket | Owner-occupied | Renter-occupied |
| Less than $5,000 | 132 (1.7%) | 132 (3.3%) |
| $5,000 to $9,999 | 103 (1.3%) | 170 (4.3%) |
| $10,000 to $14,999 | 286 (3.6%) | 312 (7.8%) |
| $15,000 to $19,999 | 191 (2.4%) | 153 (3.8%) |
| $20,000 to $24,999 | 150 (1.9%) | 269 (6.7%) |
| $25,000 to $34,999 | 653 (8.2%) | 614 (15.4%) |
| $35,000 to $49,999 | 824 (10.3%) | 462 (11.6%) |
| $50,000 to $74,999 | 1,195 (14.9%) | 934 (23.4%) |
| $75,000 to $99,999 | 1,440 (18.0%) | 342 (8.6%) |
| $100,000 to $149,999 | 1,563 (19.5%) | 418 (10.5%) |
| $150,000 or more | 1,480 (18.5%) | 187 (4.7%) |
| Total | 8,017 (100.0%) | 3,993 (100.0%) |
Monthly Housing Cost Tiers in Howard County
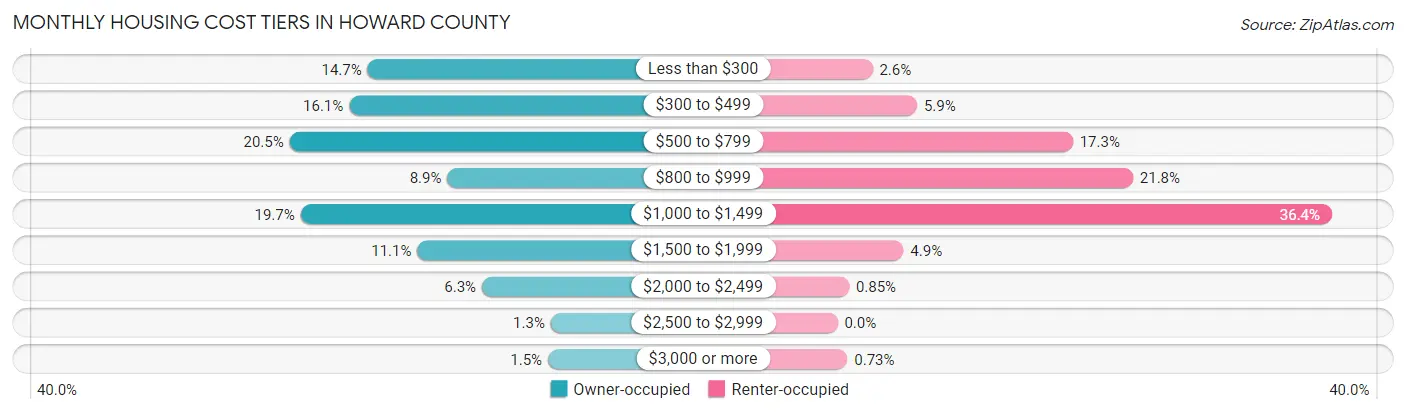
| Monthly Cost | Owner-occupied | Renter-occupied |
| Less than $300 | 1,182 (14.7%) | 103 (2.6%) |
| $300 to $499 | 1,291 (16.1%) | 234 (5.9%) |
| $500 to $799 | 1,643 (20.5%) | 692 (17.3%) |
| $800 to $999 | 711 (8.9%) | 869 (21.8%) |
| $1,000 to $1,499 | 1,578 (19.7%) | 1,454 (36.4%) |
| $1,500 to $1,999 | 888 (11.1%) | 194 (4.9%) |
| $2,000 to $2,499 | 507 (6.3%) | 34 (0.9%) |
| $2,500 to $2,999 | 100 (1.3%) | 0 (0.0%) |
| $3,000 or more | 117 (1.5%) | 29 (0.7%) |
| Total | 8,017 (100.0%) | 3,993 (100.0%) |
Physical Housing Characteristics in Howard County
Housing Structures in Howard County
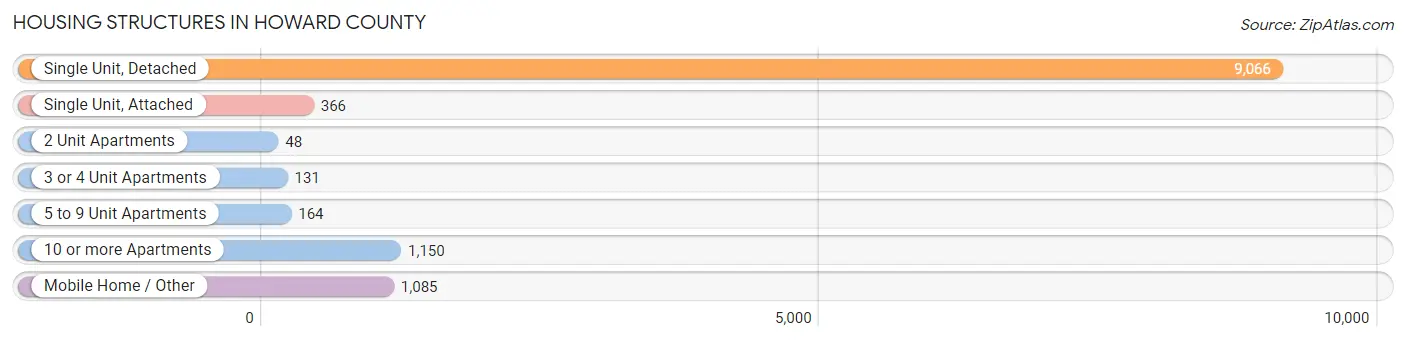
| Structure Type | # Housing Units | % Housing Units |
| Single Unit, Detached | 9,066 | 75.5% |
| Single Unit, Attached | 366 | 3.0% |
| 2 Unit Apartments | 48 | 0.4% |
| 3 or 4 Unit Apartments | 131 | 1.1% |
| 5 to 9 Unit Apartments | 164 | 1.4% |
| 10 or more Apartments | 1,150 | 9.6% |
| Mobile Home / Other | 1,085 | 9.0% |
| Total | 12,010 | 100.0% |
Housing Structures by Occupancy in Howard County
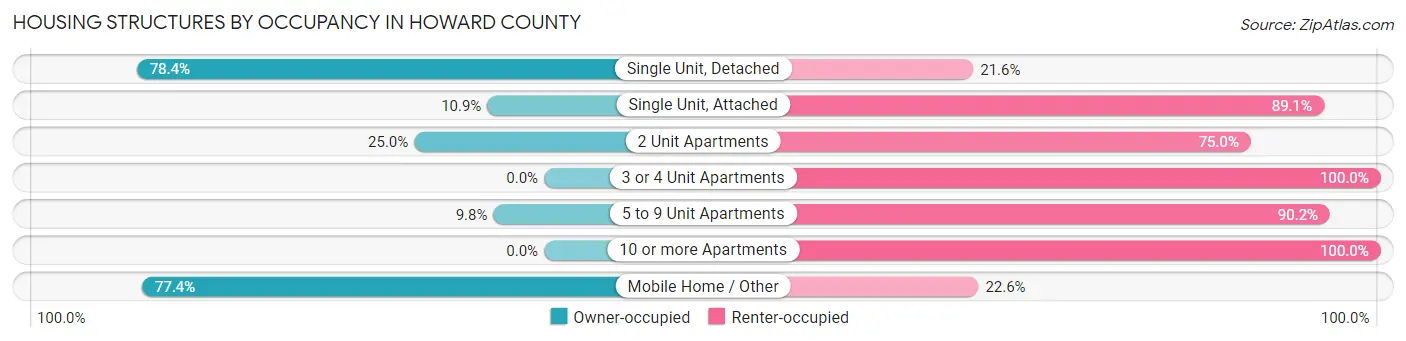
| Structure Type | Owner-occupied | Renter-occupied |
| Single Unit, Detached | 7,109 (78.4%) | 1,957 (21.6%) |
| Single Unit, Attached | 40 (10.9%) | 326 (89.1%) |
| 2 Unit Apartments | 12 (25.0%) | 36 (75.0%) |
| 3 or 4 Unit Apartments | 0 (0.0%) | 131 (100.0%) |
| 5 to 9 Unit Apartments | 16 (9.8%) | 148 (90.2%) |
| 10 or more Apartments | 0 (0.0%) | 1,150 (100.0%) |
| Mobile Home / Other | 840 (77.4%) | 245 (22.6%) |
| Total | 8,017 (66.7%) | 3,993 (33.3%) |
Housing Structures by Number of Rooms in Howard County
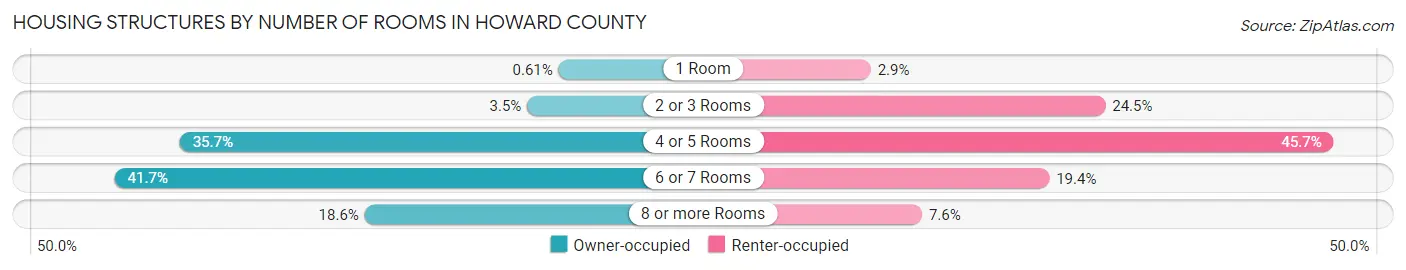
| Number of Rooms | Owner-occupied | Renter-occupied |
| 1 Room | 49 (0.6%) | 114 (2.9%) |
| 2 or 3 Rooms | 282 (3.5%) | 980 (24.5%) |
| 4 or 5 Rooms | 2,858 (35.6%) | 1,823 (45.7%) |
| 6 or 7 Rooms | 3,341 (41.7%) | 773 (19.4%) |
| 8 or more Rooms | 1,487 (18.5%) | 303 (7.6%) |
| Total | 8,017 (100.0%) | 3,993 (100.0%) |
Housing Structure by Heating Type in Howard County
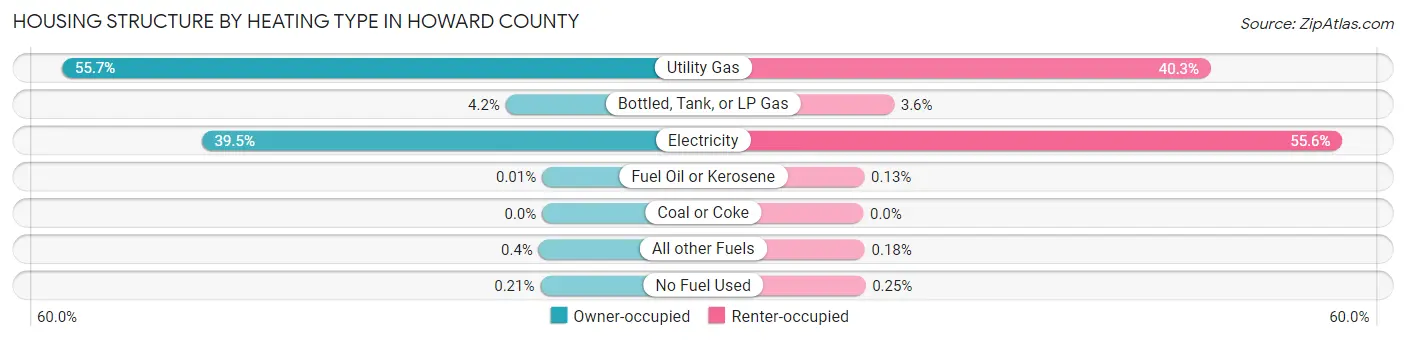
| Heating Type | Owner-occupied | Renter-occupied |
| Utility Gas | 4,463 (55.7%) | 1,610 (40.3%) |
| Bottled, Tank, or LP Gas | 338 (4.2%) | 142 (3.6%) |
| Electricity | 3,166 (39.5%) | 2,219 (55.6%) |
| Fuel Oil or Kerosene | 1 (0.0%) | 5 (0.1%) |
| Coal or Coke | 0 (0.0%) | 0 (0.0%) |
| All other Fuels | 32 (0.4%) | 7 (0.2%) |
| No Fuel Used | 17 (0.2%) | 10 (0.3%) |
| Total | 8,017 (100.0%) | 3,993 (100.0%) |
Household Vehicle Usage in Howard County
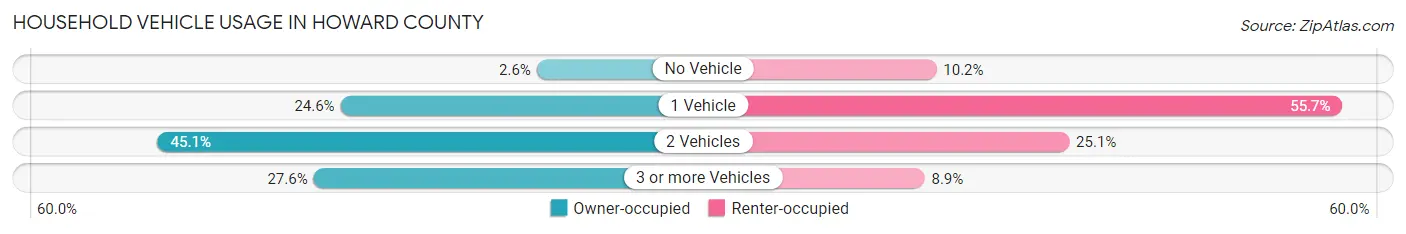
| Vehicles per Household | Owner-occupied | Renter-occupied |
| No Vehicle | 212 (2.6%) | 409 (10.2%) |
| 1 Vehicle | 1,974 (24.6%) | 2,225 (55.7%) |
| 2 Vehicles | 3,615 (45.1%) | 1,003 (25.1%) |
| 3 or more Vehicles | 2,216 (27.6%) | 356 (8.9%) |
| Total | 8,017 (100.0%) | 3,993 (100.0%) |
Real Estate & Mortgages in Howard County
Real Estate and Mortgage Overview in Howard County
| Characteristic | Without Mortgage | With Mortgage |
| Housing Units | 4,413 | 3,604 |
| Median Property Value | $98,200 | $170,600 |
| Median Household Income | $64,728 | $911 |
| Monthly Housing Costs | $457 | $115 |
| Real Estate Taxes | $1,306 | $422 |
Property Value by Mortgage Status in Howard County
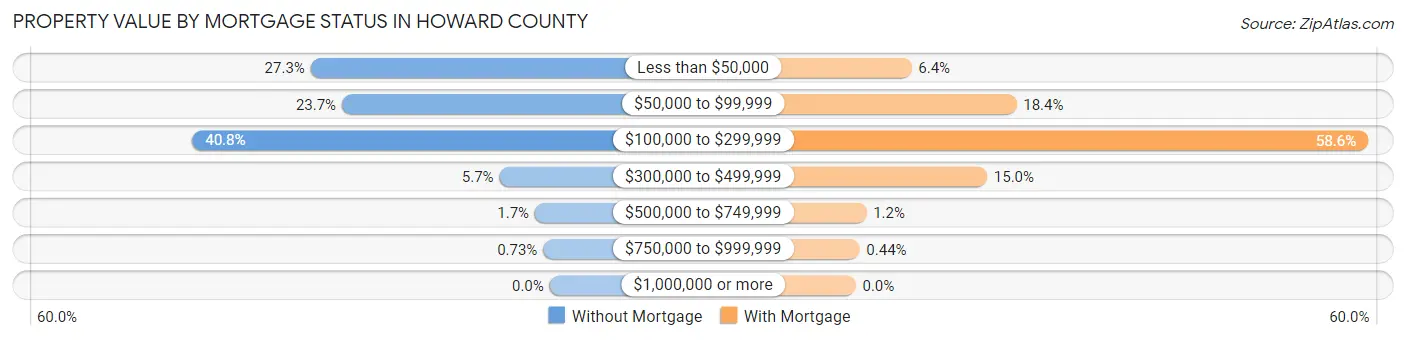
| Property Value | Without Mortgage | With Mortgage |
| Less than $50,000 | 1,205 (27.3%) | 230 (6.4%) |
| $50,000 to $99,999 | 1,047 (23.7%) | 662 (18.4%) |
| $100,000 to $299,999 | 1,802 (40.8%) | 2,111 (58.6%) |
| $300,000 to $499,999 | 253 (5.7%) | 541 (15.0%) |
| $500,000 to $749,999 | 74 (1.7%) | 44 (1.2%) |
| $750,000 to $999,999 | 32 (0.7%) | 16 (0.4%) |
| $1,000,000 or more | 0 (0.0%) | 0 (0.0%) |
| Total | 4,413 (100.0%) | 3,604 (100.0%) |
Household Income by Mortgage Status in Howard County
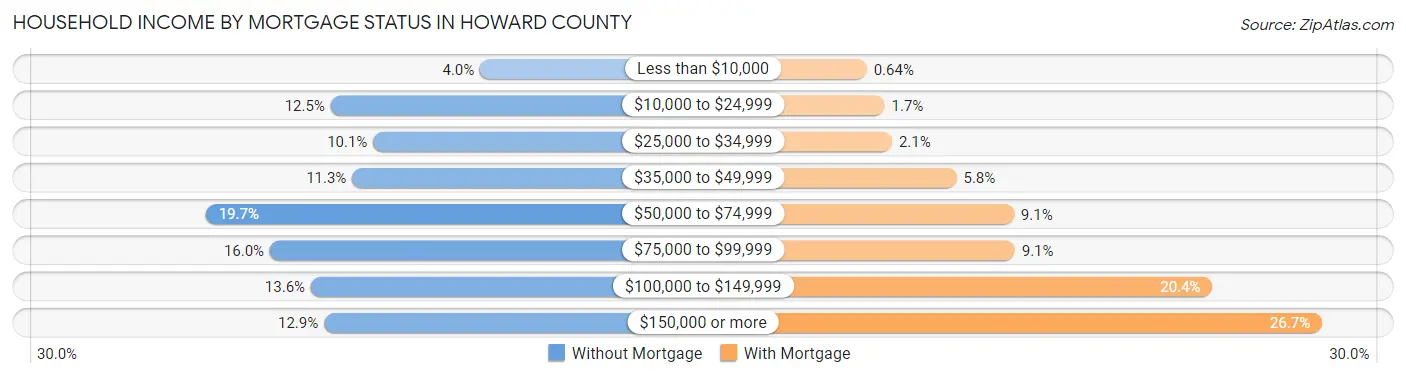
| Household Income | Without Mortgage | With Mortgage |
| Less than $10,000 | 175 (4.0%) | 23 (0.6%) |
| $10,000 to $24,999 | 552 (12.5%) | 60 (1.7%) |
| $25,000 to $34,999 | 445 (10.1%) | 75 (2.1%) |
| $35,000 to $49,999 | 498 (11.3%) | 208 (5.8%) |
| $50,000 to $74,999 | 867 (19.7%) | 326 (9.0%) |
| $75,000 to $99,999 | 705 (16.0%) | 328 (9.1%) |
| $100,000 to $149,999 | 602 (13.6%) | 735 (20.4%) |
| $150,000 or more | 569 (12.9%) | 961 (26.7%) |
| Total | 4,413 (100.0%) | 3,604 (100.0%) |
Property Value to Household Income Ratio in Howard County
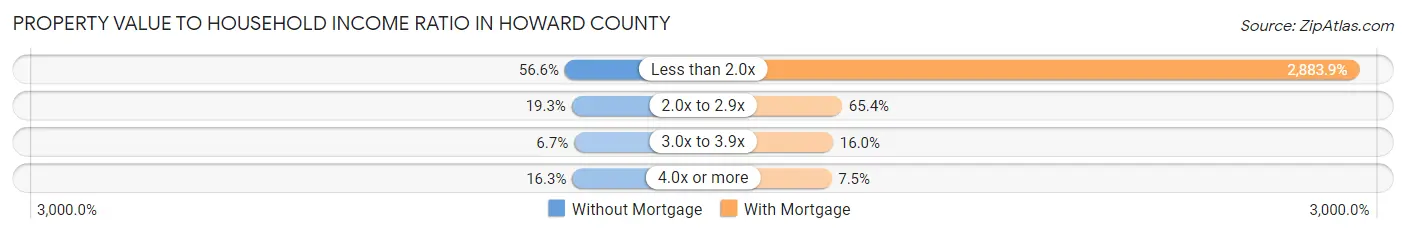
| Value-to-Income Ratio | Without Mortgage | With Mortgage |
| Less than 2.0x | 2,498 (56.6%) | 103,935 (2,883.9%) |
| 2.0x to 2.9x | 853 (19.3%) | 2,356 (65.4%) |
| 3.0x to 3.9x | 296 (6.7%) | 577 (16.0%) |
| 4.0x or more | 718 (16.3%) | 269 (7.5%) |
| Total | 4,413 (100.0%) | 3,604 (100.0%) |
Real Estate Taxes by Mortgage Status in Howard County
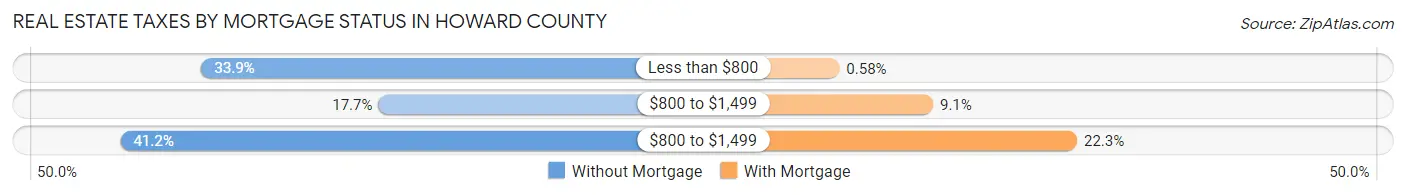
| Property Taxes | Without Mortgage | With Mortgage |
| Less than $800 | 1,494 (33.9%) | 21 (0.6%) |
| $800 to $1,499 | 781 (17.7%) | 329 (9.1%) |
| $800 to $1,499 | 1,820 (41.2%) | 803 (22.3%) |
| Total | 4,413 (100.0%) | 3,604 (100.0%) |
Health & Disability in Howard County
Health Insurance Coverage by Age in Howard County
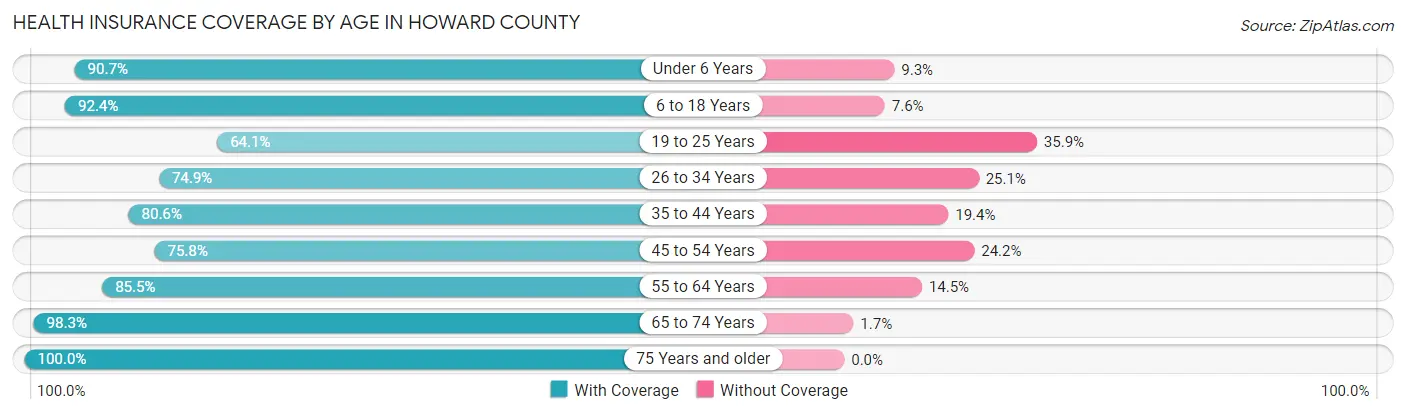
| Age Bracket | With Coverage | Without Coverage |
| Under 6 Years | 2,155 (90.7%) | 222 (9.3%) |
| 6 to 18 Years | 5,133 (92.4%) | 420 (7.6%) |
| 19 to 25 Years | 1,943 (64.1%) | 1,089 (35.9%) |
| 26 to 34 Years | 2,999 (74.9%) | 1,003 (25.1%) |
| 35 to 44 Years | 3,187 (80.6%) | 767 (19.4%) |
| 45 to 54 Years | 3,316 (75.8%) | 1,061 (24.2%) |
| 55 to 64 Years | 3,007 (85.5%) | 509 (14.5%) |
| 65 to 74 Years | 2,374 (98.3%) | 41 (1.7%) |
| 75 Years and older | 1,600 (100.0%) | 0 (0.0%) |
| Total | 25,714 (83.4%) | 5,112 (16.6%) |
Health Insurance Coverage by Citizenship Status in Howard County
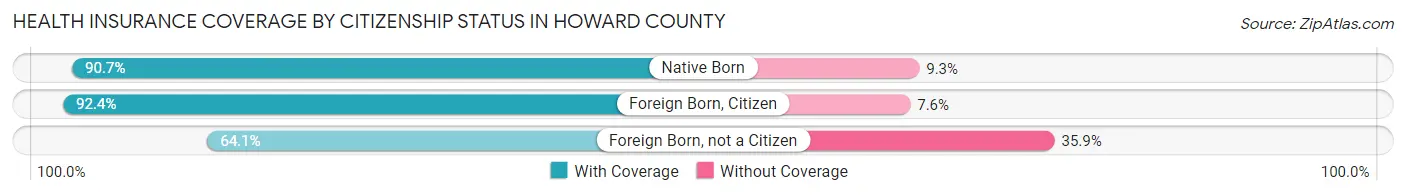
| Citizenship Status | With Coverage | Without Coverage |
| Native Born | 2,155 (90.7%) | 222 (9.3%) |
| Foreign Born, Citizen | 5,133 (92.4%) | 420 (7.6%) |
| Foreign Born, not a Citizen | 1,943 (64.1%) | 1,089 (35.9%) |
Health Insurance Coverage by Household Income in Howard County
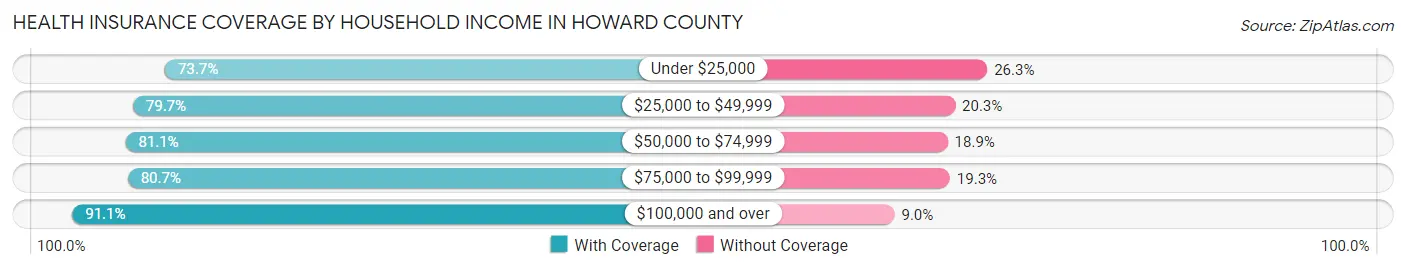
| Household Income | With Coverage | Without Coverage |
| Under $25,000 | 2,523 (73.7%) | 901 (26.3%) |
| $25,000 to $49,999 | 4,609 (79.7%) | 1,173 (20.3%) |
| $50,000 to $74,999 | 3,798 (81.1%) | 885 (18.9%) |
| $75,000 to $99,999 | 4,109 (80.7%) | 984 (19.3%) |
| $100,000 and over | 10,392 (91.0%) | 1,021 (8.9%) |
Public vs Private Health Insurance Coverage by Age in Howard County
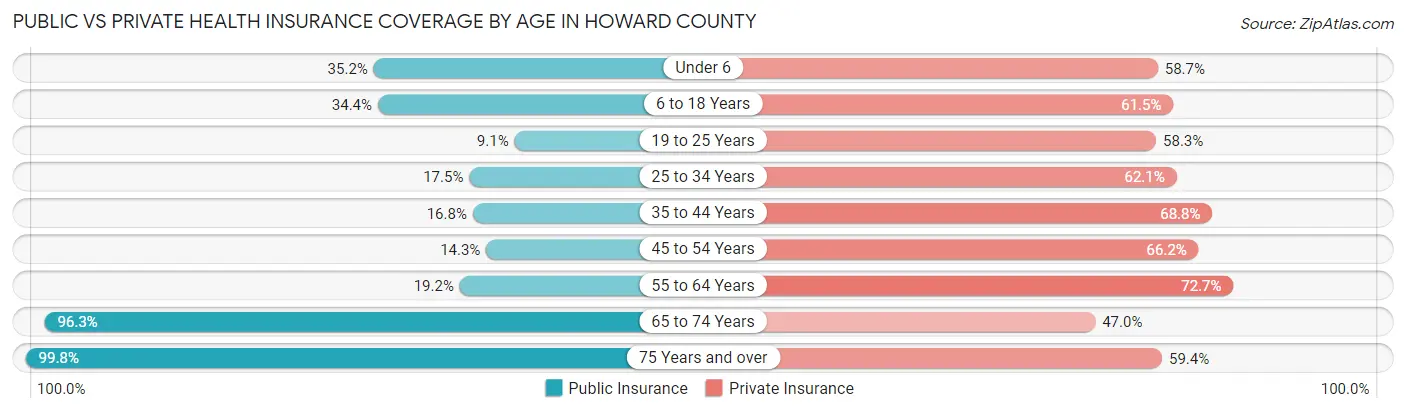
| Age Bracket | Public Insurance | Private Insurance |
| Under 6 | 837 (35.2%) | 1,394 (58.7%) |
| 6 to 18 Years | 1,912 (34.4%) | 3,416 (61.5%) |
| 19 to 25 Years | 275 (9.1%) | 1,769 (58.3%) |
| 25 to 34 Years | 699 (17.5%) | 2,486 (62.1%) |
| 35 to 44 Years | 665 (16.8%) | 2,719 (68.8%) |
| 45 to 54 Years | 627 (14.3%) | 2,899 (66.2%) |
| 55 to 64 Years | 676 (19.2%) | 2,555 (72.7%) |
| 65 to 74 Years | 2,326 (96.3%) | 1,136 (47.0%) |
| 75 Years and over | 1,597 (99.8%) | 951 (59.4%) |
| Total | 9,614 (31.2%) | 19,325 (62.7%) |
Disability Status by Sex by Age in Howard County
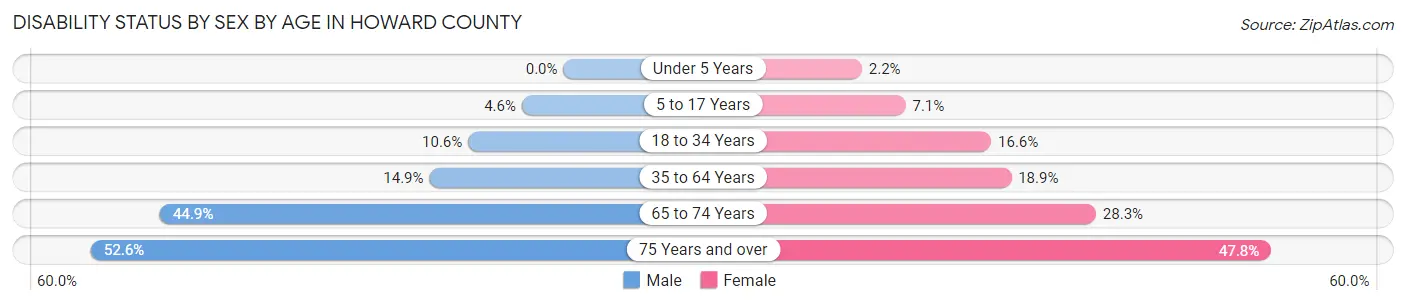
| Age Bracket | Male | Female |
| Under 5 Years | 0 (0.0%) | 22 (2.2%) |
| 5 to 17 Years | 132 (4.6%) | 185 (7.1%) |
| 18 to 34 Years | 435 (10.6%) | 563 (16.6%) |
| 35 to 64 Years | 945 (14.9%) | 1,040 (18.9%) |
| 65 to 74 Years | 526 (44.9%) | 352 (28.3%) |
| 75 Years and over | 373 (52.6%) | 426 (47.8%) |
Disability Class by Sex by Age in Howard County
Disability Class: Hearing Difficulty
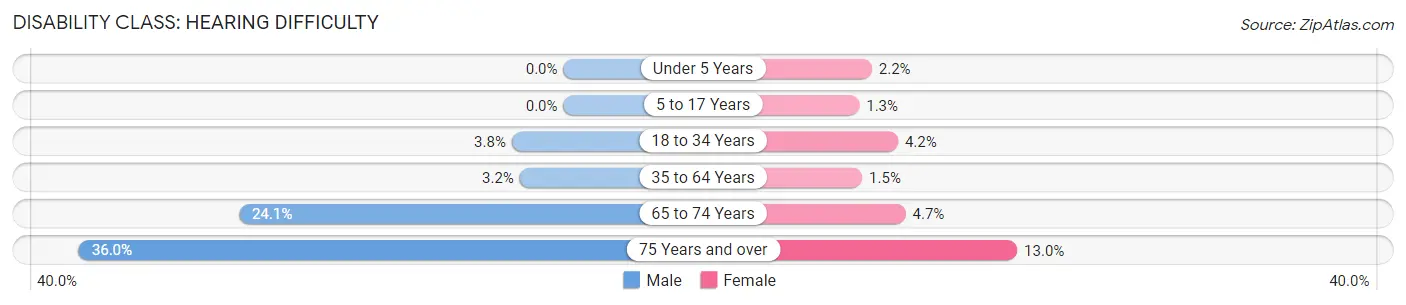
| Age Bracket | Male | Female |
| Under 5 Years | 0 (0.0%) | 22 (2.2%) |
| 5 to 17 Years | 0 (0.0%) | 34 (1.3%) |
| 18 to 34 Years | 157 (3.8%) | 141 (4.2%) |
| 35 to 64 Years | 205 (3.2%) | 83 (1.5%) |
| 65 to 74 Years | 282 (24.1%) | 59 (4.7%) |
| 75 Years and over | 255 (36.0%) | 116 (13.0%) |
Disability Class: Vision Difficulty
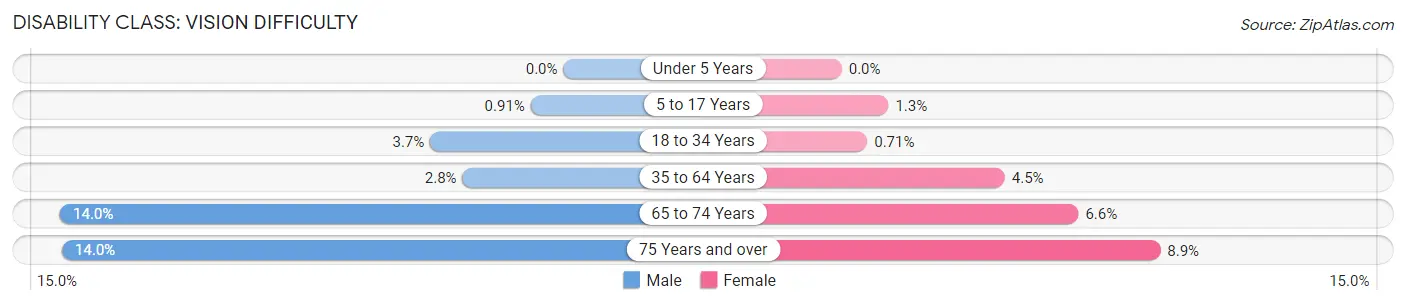
| Age Bracket | Male | Female |
| Under 5 Years | 0 (0.0%) | 0 (0.0%) |
| 5 to 17 Years | 26 (0.9%) | 34 (1.3%) |
| 18 to 34 Years | 152 (3.7%) | 24 (0.7%) |
| 35 to 64 Years | 178 (2.8%) | 250 (4.5%) |
| 65 to 74 Years | 164 (14.0%) | 82 (6.6%) |
| 75 Years and over | 99 (14.0%) | 79 (8.9%) |
Disability Class: Cognitive Difficulty
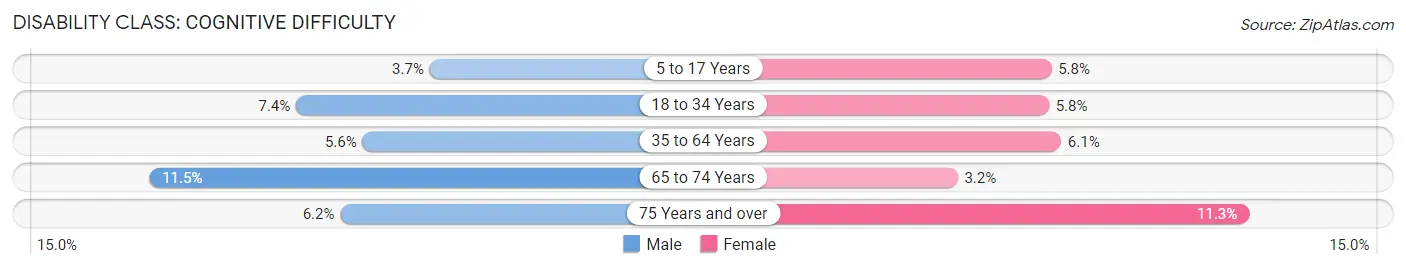
| Age Bracket | Male | Female |
| 5 to 17 Years | 106 (3.7%) | 152 (5.8%) |
| 18 to 34 Years | 305 (7.4%) | 195 (5.8%) |
| 35 to 64 Years | 354 (5.6%) | 336 (6.1%) |
| 65 to 74 Years | 135 (11.5%) | 40 (3.2%) |
| 75 Years and over | 44 (6.2%) | 101 (11.3%) |
Disability Class: Ambulatory Difficulty
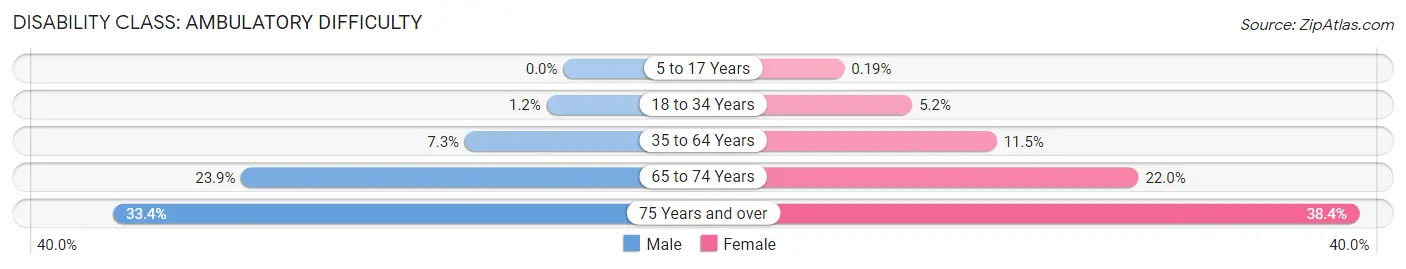
| Age Bracket | Male | Female |
| 5 to 17 Years | 0 (0.0%) | 5 (0.2%) |
| 18 to 34 Years | 51 (1.2%) | 177 (5.2%) |
| 35 to 64 Years | 463 (7.3%) | 634 (11.5%) |
| 65 to 74 Years | 280 (23.9%) | 274 (22.0%) |
| 75 Years and over | 237 (33.4%) | 342 (38.4%) |
Disability Class: Self-Care Difficulty
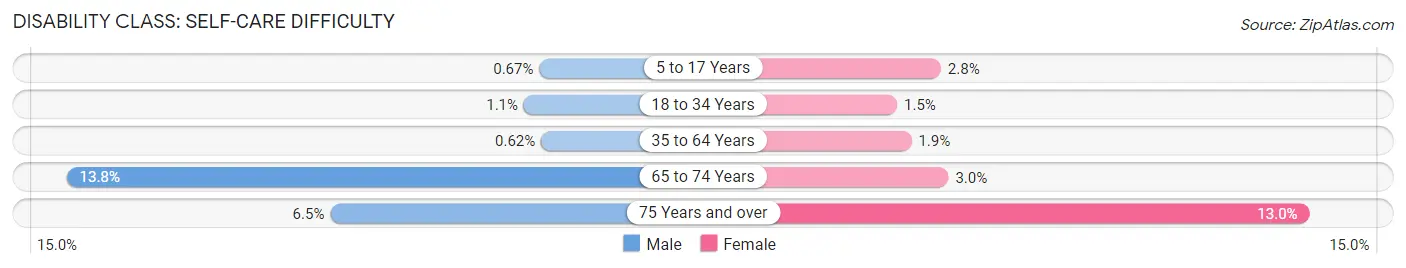
| Age Bracket | Male | Female |
| 5 to 17 Years | 19 (0.7%) | 72 (2.8%) |
| 18 to 34 Years | 45 (1.1%) | 52 (1.5%) |
| 35 to 64 Years | 39 (0.6%) | 107 (1.9%) |
| 65 to 74 Years | 162 (13.8%) | 37 (3.0%) |
| 75 Years and over | 46 (6.5%) | 116 (13.0%) |
Technology Access in Howard County
Computing Device Access in Howard County
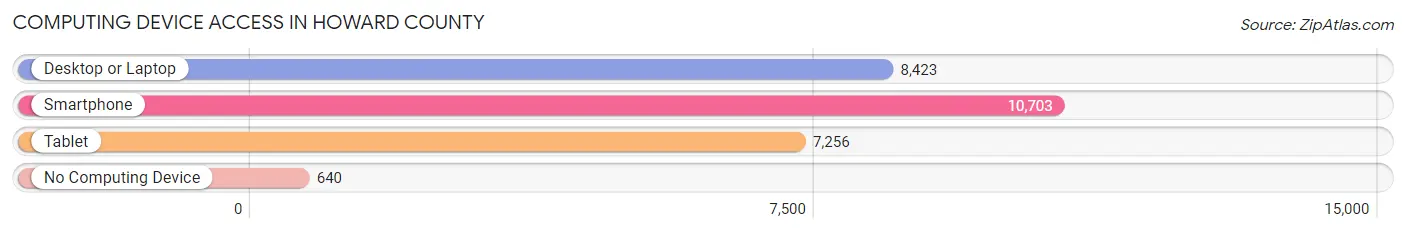
| Device Type | # Households | % Households |
| Desktop or Laptop | 8,423 | 70.1% |
| Smartphone | 10,703 | 89.1% |
| Tablet | 7,256 | 60.4% |
| No Computing Device | 640 | 5.3% |
| Total | 12,010 | 100.0% |
Internet Access in Howard County
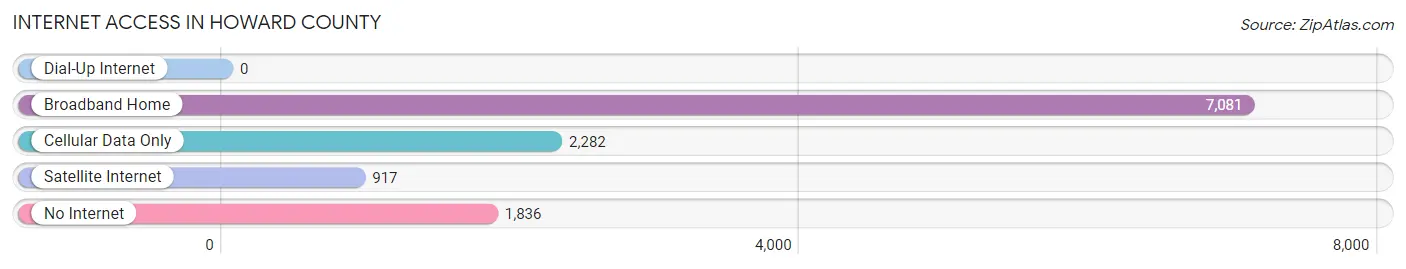
| Internet Type | # Households | % Households |
| Dial-Up Internet | 0 | 0.0% |
| Broadband Home | 7,081 | 59.0% |
| Cellular Data Only | 2,282 | 19.0% |
| Satellite Internet | 917 | 7.6% |
| No Internet | 1,836 | 15.3% |
| Total | 12,010 | 100.0% |
Howard County Summary
Howard County is located in the Big Country region of Texas, and is one of the 254 counties in the state. It is bordered by Martin County to the north, Borden County to the east, Mitchell County to the south, and Glasscock County to the west. The county seat is Big Spring, and the largest city is Big Spring. The county has a total area of 902 square miles, and a population of 35,012 as of the 2010 census.
History
Howard County was established in 1876 from portions of Bexar and Tom Green counties. It was named for Volney E. Howard, a Texas state senator and Confederate soldier. The county was originally part of the Comanche Reservation, and was opened to settlement in 1876. The first settlers were ranchers, and the county quickly became known for its cattle industry.
In the early 1900s, oil was discovered in the county, and the economy shifted to oil production. The discovery of oil led to the development of the city of Big Spring, which quickly became the county seat and the largest city in the county.
Geography
Howard County is located in the Big Country region of Texas, and is bordered by Martin County to the north, Borden County to the east, Mitchell County to the south, and Glasscock County to the west. The county has a total area of 902 square miles, and is mostly flat with some rolling hills. The terrain is mostly covered in grasslands, with some areas of mesquite and cedar trees. The county is home to several lakes, including Lake J.B. Thomas, Lake Colorado City, and Lake Sweetwater.
Economy
The economy of Howard County is largely based on oil and gas production, agriculture, and tourism. Oil and gas production is the largest industry in the county, and is responsible for much of the county’s economic growth. Agriculture is also an important part of the economy, with the county’s main crops being cotton, wheat, and sorghum. Tourism is also an important part of the economy, with the county’s main attractions being the Big Spring State Park and the Comanche National Grassland.
Demographics
As of the 2010 census, the population of Howard County was 35,012. The racial makeup of the county was 75.3% White, 8.2% African American, 0.7% Native American, 0.5% Asian, 0.1% Pacific Islander, 12.7% from other races, and 2.5% from two or more races. Hispanic or Latino of any race were 28.2% of the population.
The median income for a household in the county was $37,945, and the median income for a family was $45,945. The per capita income for the county was $19,945. About 16.2% of families and 20.2% of the population were below the poverty line, including 28.2% of those under age 18 and 11.2% of those age 65 or over.
Common Questions
What is Per Capita Income in Howard County?
Per Capita income in Howard County is $32,431.
What is the Median Family Income in Howard County?
Median Family Income in Howard County is $80,153.
What is the Median Household income in Howard County?
Median Household Income in Howard County is $67,243.
What is Income or Wage Gap in Howard County?
Income or Wage Gap in Howard County is 48.7%.
Women in Howard County earn 51.3 cents for every dollar earned by a man.
What is Inequality or Gini Index in Howard County?
Inequality or Gini Index in Howard County is 0.44.
What is the Total Population of Howard County?
Total Population of Howard County is 34,488.
What is the Total Male Population of Howard County?
Total Male Population of Howard County is 19,633.
What is the Total Female Population of Howard County?
Total Female Population of Howard County is 14,855.
What is the Ratio of Males per 100 Females in Howard County?
There are 132.16 Males per 100 Females in Howard County.
What is the Ratio of Females per 100 Males in Howard County?
There are 75.66 Females per 100 Males in Howard County.
What is the Median Population Age in Howard County?
Median Population Age in Howard County is 37.6 Years.
What is the Average Family Size in Howard County
Average Family Size in Howard County is 3.1 People.
What is the Average Household Size in Howard County
Average Household Size in Howard County is 2.5 People.
How Large is the Labor Force in Howard County?
There are 15,088 People in the Labor Forcein in Howard County.
What is the Percentage of People in the Labor Force in Howard County?
54.3% of People are in the Labor Force in Howard County.
What is the Unemployment Rate in Howard County?
Unemployment Rate in Howard County is 5.2%.