Hood County, TX Map & Demographics
Hood County Map
Hood County Overview
$41,729
PER CAPITA INCOME
$95,940
AVG FAMILY INCOME
$80,013
AVG HOUSEHOLD INCOME
42.4%
WAGE / INCOME GAP [ % ]
57.6¢/ $1
WAGE / INCOME GAP [ $ ]
0.46
INEQUALITY / GINI INDEX
62,459
TOTAL POPULATION
30,357
MALE POPULATION
32,102
FEMALE POPULATION
94.56
MALES / 100 FEMALES
105.75
FEMALES / 100 MALES
46.5
MEDIAN AGE
2.9
AVG FAMILY SIZE
2.5
AVG HOUSEHOLD SIZE
28,181
LABOR FORCE [ PEOPLE ]
55.2%
PERCENT IN LABOR FORCE
5.8%
UNEMPLOYMENT RATE
Income in Hood County
Income Overview in Hood County
Per Capita Income in Hood County is $41,729, while median incomes of families and households are $95,940 and $80,013 respectively.
| Characteristic | Number | Measure |
| Per Capita Income | 62,459 | $41,729 |
| Median Family Income | 17,968 | $95,940 |
| Mean Family Income | 17,968 | $122,286 |
| Median Household Income | 24,734 | $80,013 |
| Mean Household Income | 24,734 | $103,961 |
| Income Deficit | 17,968 | $0 |
| Wage / Income Gap (%) | 62,459 | 42.40% |
| Wage / Income Gap ($) | 62,459 | 57.60¢ per $1 |
| Gini / Inequality Index | 62,459 | 0.46 |
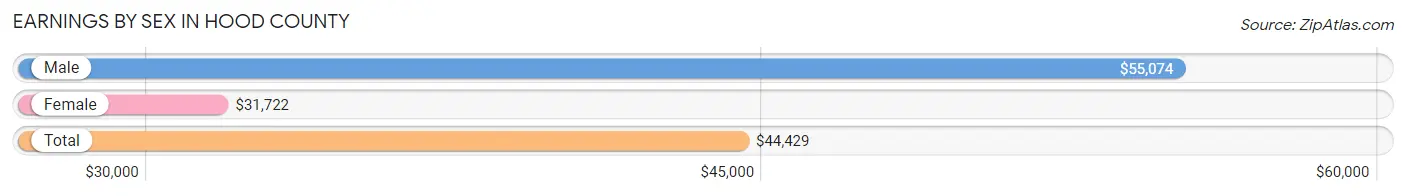
Earnings by Sex in Hood County
Average Earnings in Hood County are $44,429, $55,074 for men and $31,722 for women, a difference of 42.4%.
| Sex | Number | Average Earnings |
| Male | 16,253 (55.2%) | $55,074 |
| Female | 13,182 (44.8%) | $31,722 |
| Total | 29,435 (100.0%) | $44,429 |
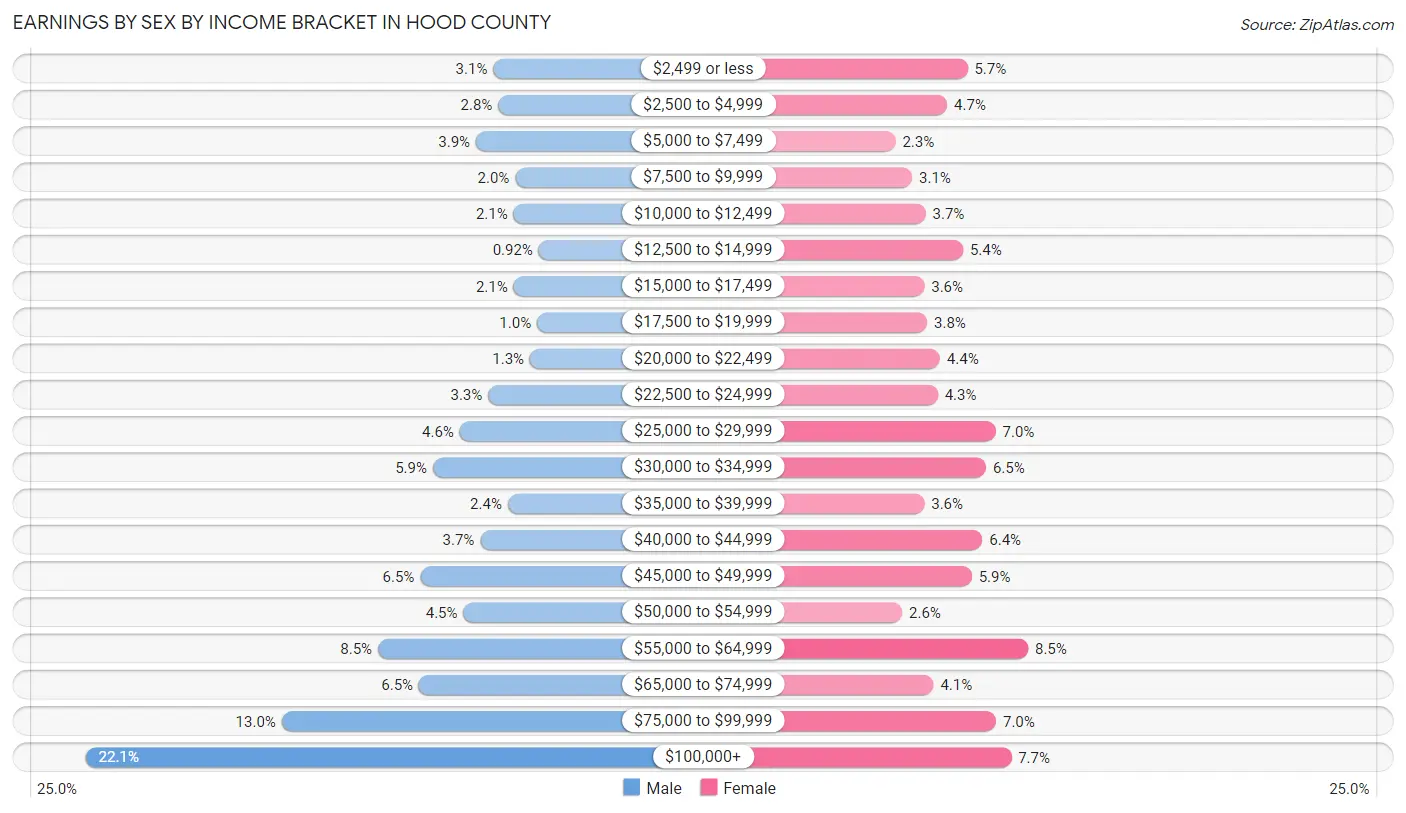
Earnings by Sex by Income Bracket in Hood County
The most common earnings brackets in Hood County are $100,000+ for men (3,598 | 22.1%) and $55,000 to $64,999 for women (1,119 | 8.5%).
| Income | Male | Female |
| $2,499 or less | 495 (3.0%) | 745 (5.7%) |
| $2,500 to $4,999 | 458 (2.8%) | 620 (4.7%) |
| $5,000 to $7,499 | 627 (3.9%) | 300 (2.3%) |
| $7,500 to $9,999 | 328 (2.0%) | 404 (3.1%) |
| $10,000 to $12,499 | 342 (2.1%) | 486 (3.7%) |
| $12,500 to $14,999 | 149 (0.9%) | 717 (5.4%) |
| $15,000 to $17,499 | 341 (2.1%) | 479 (3.6%) |
| $17,500 to $19,999 | 162 (1.0%) | 496 (3.8%) |
| $20,000 to $22,499 | 216 (1.3%) | 575 (4.4%) |
| $22,500 to $24,999 | 535 (3.3%) | 562 (4.3%) |
| $25,000 to $29,999 | 751 (4.6%) | 919 (7.0%) |
| $30,000 to $34,999 | 955 (5.9%) | 860 (6.5%) |
| $35,000 to $39,999 | 385 (2.4%) | 479 (3.6%) |
| $40,000 to $44,999 | 595 (3.7%) | 837 (6.4%) |
| $45,000 to $49,999 | 1,051 (6.5%) | 771 (5.9%) |
| $50,000 to $54,999 | 724 (4.4%) | 341 (2.6%) |
| $55,000 to $64,999 | 1,373 (8.5%) | 1,119 (8.5%) |
| $65,000 to $74,999 | 1,062 (6.5%) | 535 (4.1%) |
| $75,000 to $99,999 | 2,106 (13.0%) | 922 (7.0%) |
| $100,000+ | 3,598 (22.1%) | 1,015 (7.7%) |
| Total | 16,253 (100.0%) | 13,182 (100.0%) |
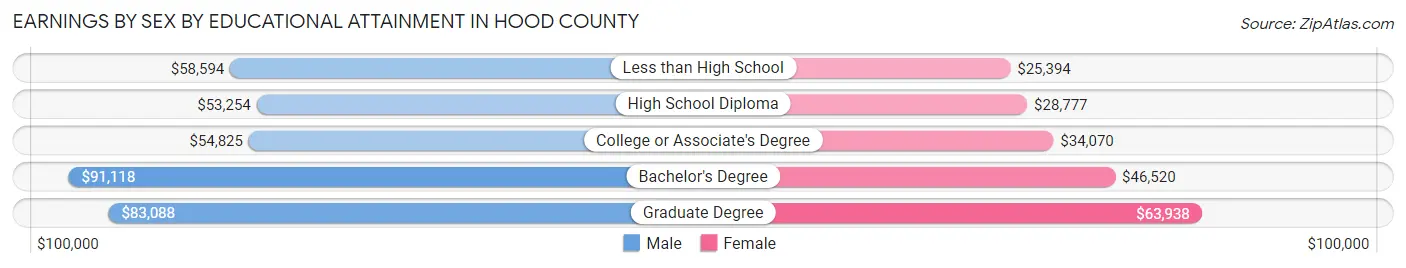
Earnings by Sex by Educational Attainment in Hood County
Average earnings in Hood County are $58,949 for men and $37,905 for women, a difference of 35.7%. Men with an educational attainment of bachelor's degree enjoy the highest average annual earnings of $91,118, while those with high school diploma education earn the least with $53,254. Women with an educational attainment of graduate degree earn the most with the average annual earnings of $63,938, while those with less than high school education have the smallest earnings of $25,394.
| Educational Attainment | Male Income | Female Income |
| Less than High School | $58,594 | $25,394 |
| High School Diploma | $53,254 | $28,777 |
| College or Associate's Degree | $54,825 | $34,070 |
| Bachelor's Degree | $91,118 | $46,520 |
| Graduate Degree | $83,088 | $63,938 |
| Total | $58,949 | $37,905 |
Family Income in Hood County
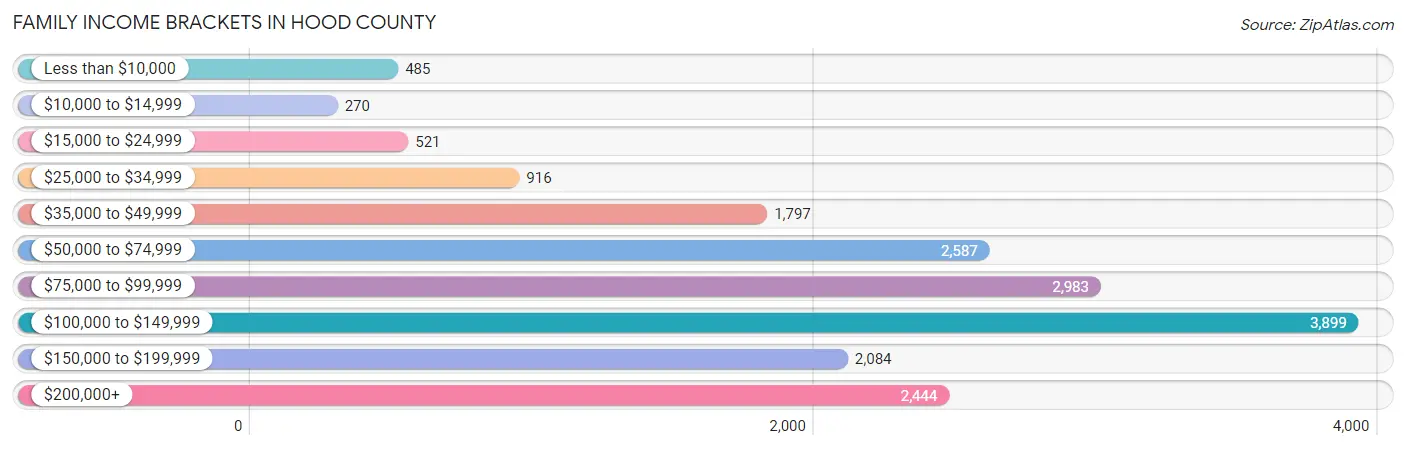
Family Income Brackets in Hood County
According to the Hood County family income data, there are 3,899 families falling into the $100,000 to $149,999 income range, which is the most common income bracket and makes up 21.7% of all families. Conversely, the $10,000 to $14,999 income bracket is the least frequent group with only 270 families (1.5%) belonging to this category.
| Income Bracket | # Families | % Families |
| Less than $10,000 | 485 | 2.7% |
| $10,000 to $14,999 | 270 | 1.5% |
| $15,000 to $24,999 | 521 | 2.9% |
| $25,000 to $34,999 | 916 | 5.1% |
| $35,000 to $49,999 | 1,797 | 10.0% |
| $50,000 to $74,999 | 2,587 | 14.4% |
| $75,000 to $99,999 | 2,983 | 16.6% |
| $100,000 to $149,999 | 3,899 | 21.7% |
| $150,000 to $199,999 | 2,084 | 11.6% |
| $200,000+ | 2,444 | 13.6% |
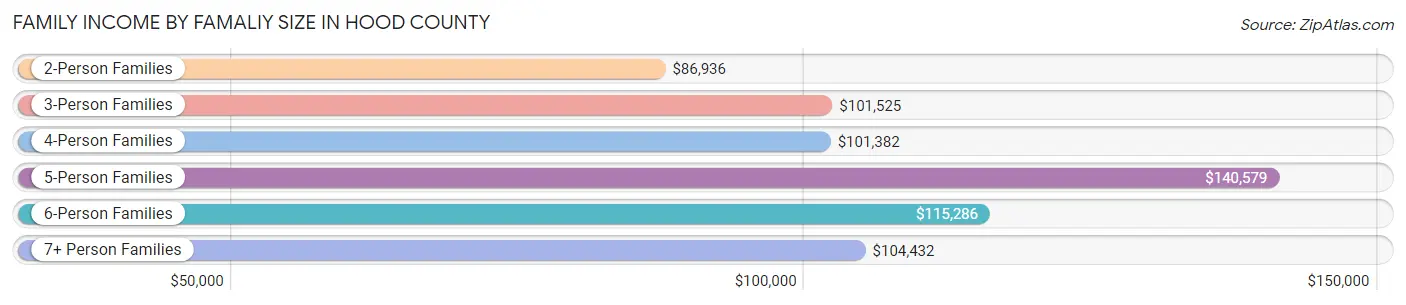
Family Income by Famaliy Size in Hood County
5-person families (1,235 | 6.9%) account for the highest median family income in Hood County with $140,579 per family, while 2-person families (10,202 | 56.8%) have the highest median income of $43,468 per family member.
| Income Bracket | # Families | Median Income |
| 2-Person Families | 10,202 (56.8%) | $86,936 |
| 3-Person Families | 3,321 (18.5%) | $101,525 |
| 4-Person Families | 2,687 (14.9%) | $101,382 |
| 5-Person Families | 1,235 (6.9%) | $140,579 |
| 6-Person Families | 304 (1.7%) | $115,286 |
| 7+ Person Families | 219 (1.2%) | $104,432 |
| Total | 17,968 (100.0%) | $95,940 |
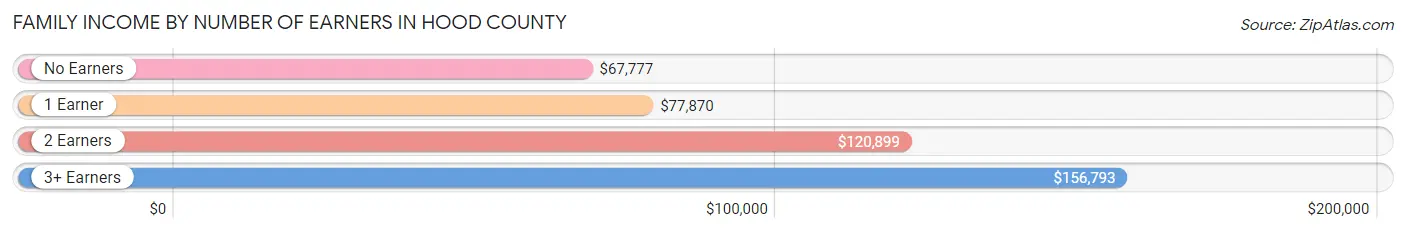
Family Income by Number of Earners in Hood County
The median family income in Hood County is $95,940, with families comprising 3+ earners (1,571) having the highest median family income of $156,793, while families with no earners (3,751) have the lowest median family income of $67,777, accounting for 8.7% and 20.9% of families, respectively.
| Number of Earners | # Families | Median Income |
| No Earners | 3,751 (20.9%) | $67,777 |
| 1 Earner | 6,558 (36.5%) | $77,870 |
| 2 Earners | 6,088 (33.9%) | $120,899 |
| 3+ Earners | 1,571 (8.7%) | $156,793 |
| Total | 17,968 (100.0%) | $95,940 |
Household Income in Hood County
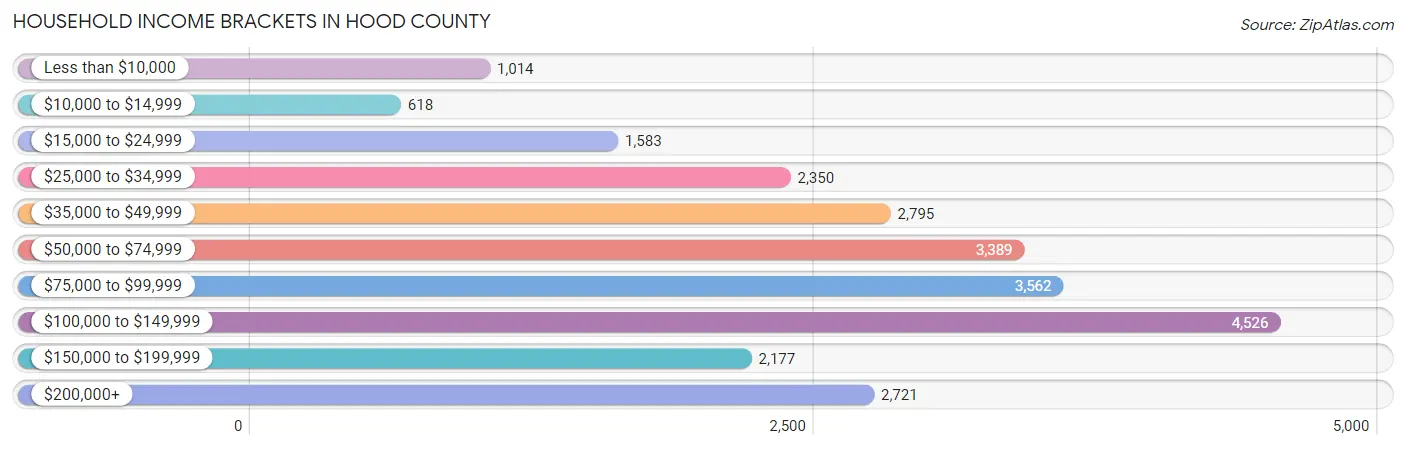
Household Income Brackets in Hood County
With 4,526 households falling in the category, the $100,000 to $149,999 income range is the most frequent in Hood County, accounting for 18.3% of all households. In contrast, only 618 households (2.5%) fall into the $10,000 to $14,999 income bracket, making it the least populous group.
| Income Bracket | # Households | % Households |
| Less than $10,000 | 1,014 | 4.1% |
| $10,000 to $14,999 | 618 | 2.5% |
| $15,000 to $24,999 | 1,583 | 6.4% |
| $25,000 to $34,999 | 2,350 | 9.5% |
| $35,000 to $49,999 | 2,795 | 11.3% |
| $50,000 to $74,999 | 3,389 | 13.7% |
| $75,000 to $99,999 | 3,562 | 14.4% |
| $100,000 to $149,999 | 4,526 | 18.3% |
| $150,000 to $199,999 | 2,177 | 8.8% |
| $200,000+ | 2,721 | 11.0% |
Household Income by Householder Age in Hood County
The median household income in Hood County is $80,013, with the highest median household income of $107,909 found in the 45 to 64 years age bracket for the primary householder. A total of 8,594 households (34.7%) fall into this category. Meanwhile, the 15 to 24 years age bracket for the primary householder has the lowest median household income of $31,054, with 925 households (3.7%) in this group.
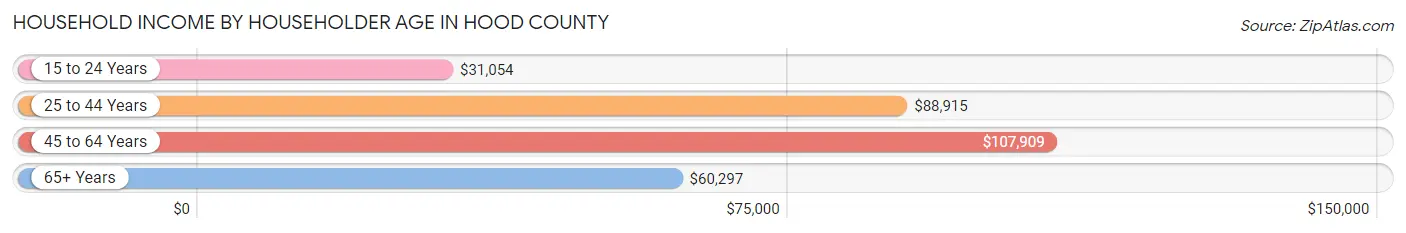
| Income Bracket | # Households | Median Income |
| 15 to 24 Years | 925 (3.7%) | $31,054 |
| 25 to 44 Years | 5,788 (23.4%) | $88,915 |
| 45 to 64 Years | 8,594 (34.7%) | $107,909 |
| 65+ Years | 9,427 (38.1%) | $60,297 |
| Total | 24,734 (100.0%) | $80,013 |
Poverty in Hood County
Income Below Poverty by Sex and Age in Hood County
With 8.5% poverty level for males and 9.2% for females among the residents of Hood County, under 5 year old males and 18 to 24 year old females are the most vulnerable to poverty, with 291 males (21.9%) and 488 females (24.1%) in their respective age groups living below the poverty level.
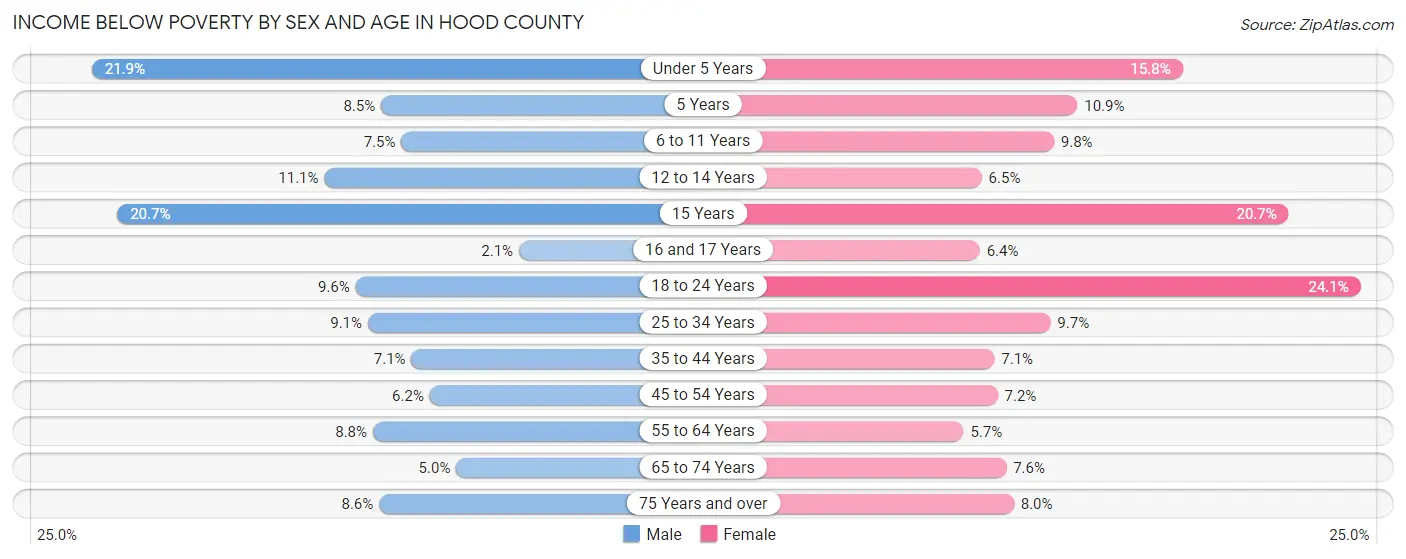
| Age Bracket | Male | Female |
| Under 5 Years | 291 (21.9%) | 298 (15.8%) |
| 5 Years | 22 (8.5%) | 27 (10.9%) |
| 6 to 11 Years | 166 (7.5%) | 188 (9.8%) |
| 12 to 14 Years | 151 (11.1%) | 85 (6.5%) |
| 15 Years | 130 (20.7%) | 51 (20.7%) |
| 16 and 17 Years | 11 (2.1%) | 61 (6.4%) |
| 18 to 24 Years | 195 (9.6%) | 488 (24.1%) |
| 25 to 34 Years | 276 (9.1%) | 322 (9.7%) |
| 35 to 44 Years | 231 (7.0%) | 241 (7.1%) |
| 45 to 54 Years | 219 (6.2%) | 254 (7.2%) |
| 55 to 64 Years | 395 (8.8%) | 273 (5.7%) |
| 65 to 74 Years | 216 (5.0%) | 358 (7.6%) |
| 75 Years and over | 244 (8.6%) | 274 (8.0%) |
| Total | 2,547 (8.5%) | 2,920 (9.2%) |
Income Above Poverty by Sex and Age in Hood County
According to the poverty statistics in Hood County, males aged 16 and 17 years and females aged 55 to 64 years are the age groups that are most secure financially, with 97.9% of males and 94.4% of females in these age groups living above the poverty line.
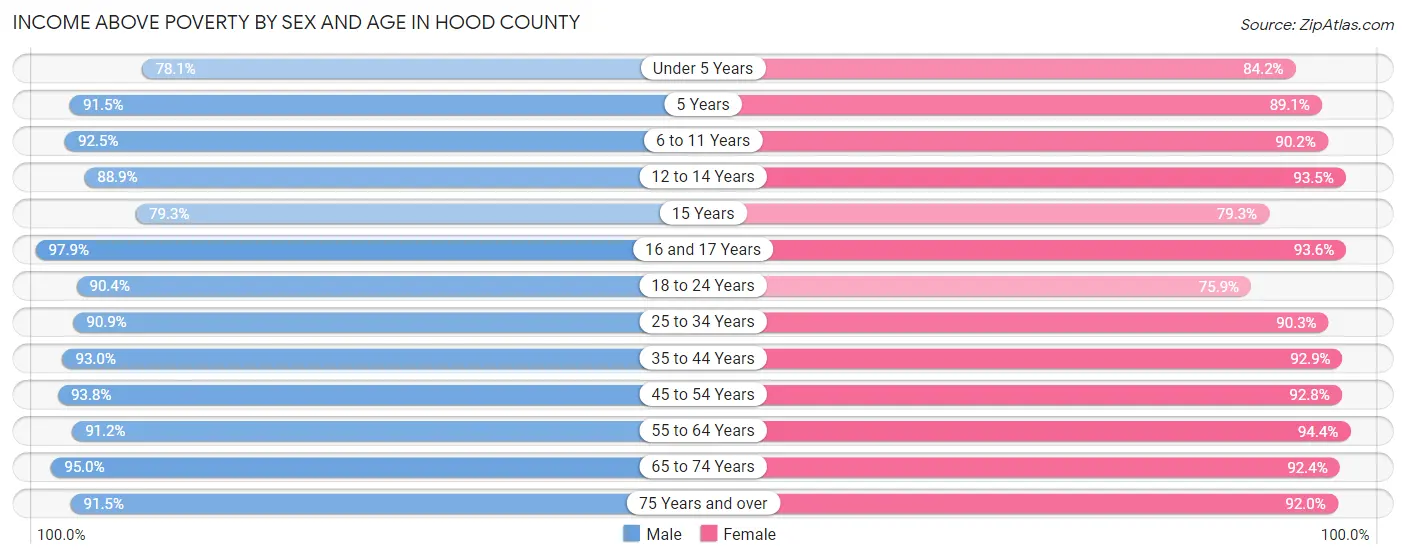
| Age Bracket | Male | Female |
| Under 5 Years | 1,039 (78.1%) | 1,587 (84.2%) |
| 5 Years | 238 (91.5%) | 220 (89.1%) |
| 6 to 11 Years | 2,040 (92.5%) | 1,722 (90.2%) |
| 12 to 14 Years | 1,210 (88.9%) | 1,225 (93.5%) |
| 15 Years | 498 (79.3%) | 195 (79.3%) |
| 16 and 17 Years | 523 (97.9%) | 892 (93.6%) |
| 18 to 24 Years | 1,827 (90.4%) | 1,539 (75.9%) |
| 25 to 34 Years | 2,766 (90.9%) | 3,005 (90.3%) |
| 35 to 44 Years | 3,047 (92.9%) | 3,163 (92.9%) |
| 45 to 54 Years | 3,311 (93.8%) | 3,259 (92.8%) |
| 55 to 64 Years | 4,073 (91.2%) | 4,558 (94.4%) |
| 65 to 74 Years | 4,129 (95.0%) | 4,331 (92.4%) |
| 75 Years and over | 2,611 (91.4%) | 3,159 (92.0%) |
| Total | 27,312 (91.5%) | 28,855 (90.8%) |
Income Below Poverty Among Married-Couple Families in Hood County
The poverty statistics for married-couple families in Hood County show that 4.5% or 682 of the total 15,078 families live below the poverty line. Families with 3 or 4 children have the highest poverty rate of 7.9%, comprising of 68 families. On the other hand, families with 5 or more children have the lowest poverty rate of 0.0%, which includes 0 families.
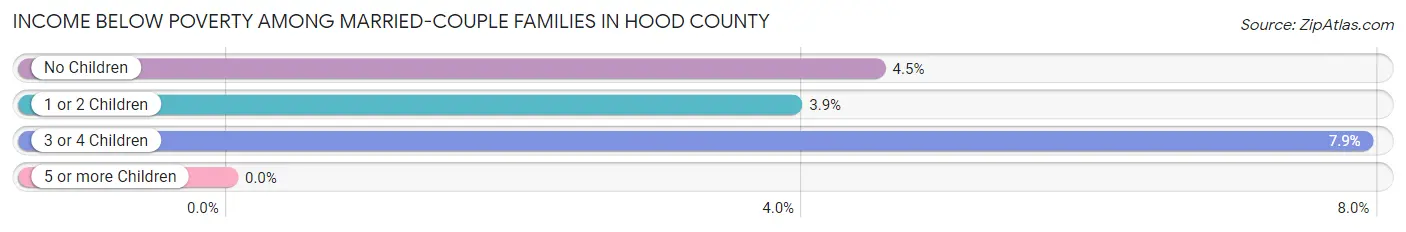
| Children | Above Poverty | Below Poverty |
| No Children | 9,392 (95.5%) | 444 (4.5%) |
| 1 or 2 Children | 4,161 (96.1%) | 170 (3.9%) |
| 3 or 4 Children | 793 (92.1%) | 68 (7.9%) |
| 5 or more Children | 50 (100.0%) | 0 (0.0%) |
| Total | 14,396 (95.5%) | 682 (4.5%) |
Income Below Poverty Among Single-Parent Households in Hood County
According to the poverty data in Hood County, 2.4% or 24 single-father households and 23.1% or 436 single-mother households are living below the poverty line. Among single-father households, those with 1 or 2 children have the highest poverty rate, with 17 households (3.4%) experiencing poverty. Likewise, among single-mother households, those with 5 or more children have the highest poverty rate, with 7 households (100.0%) falling below the poverty line.
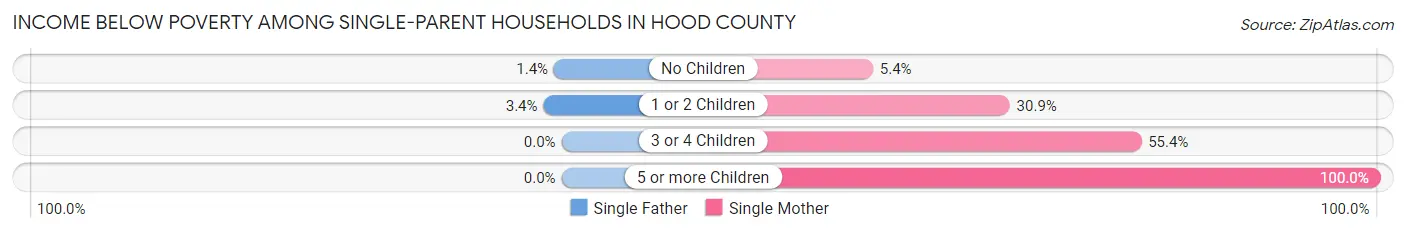
| Children | Single Father | Single Mother |
| No Children | 7 (1.4%) | 37 (5.4%) |
| 1 or 2 Children | 17 (3.4%) | 346 (30.9%) |
| 3 or 4 Children | 0 (0.0%) | 46 (55.4%) |
| 5 or more Children | 0 (0.0%) | 7 (100.0%) |
| Total | 24 (2.4%) | 436 (23.1%) |
Income Below Poverty Among Married-Couple vs Single-Parent Households in Hood County
The poverty data for Hood County shows that 682 of the married-couple family households (4.5%) and 460 of the single-parent households (15.9%) are living below the poverty level. Within the married-couple family households, those with 3 or 4 children have the highest poverty rate, with 68 households (7.9%) falling below the poverty line. Among the single-parent households, those with 5 or more children have the highest poverty rate, with 7 household (100.0%) living below poverty.
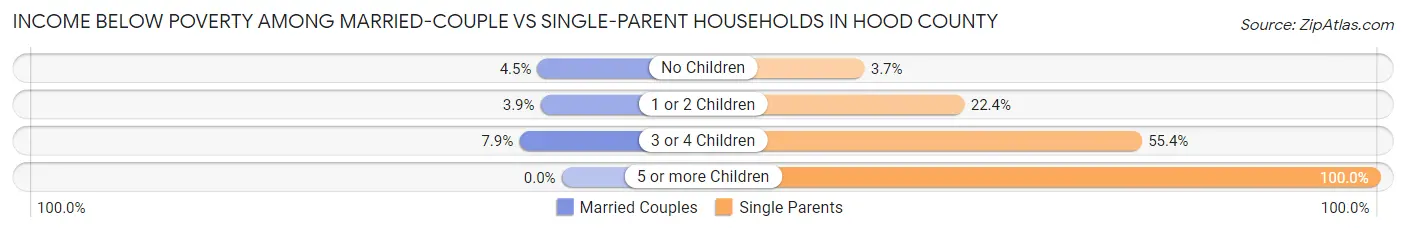
| Children | Married-Couple Families | Single-Parent Households |
| No Children | 444 (4.5%) | 44 (3.7%) |
| 1 or 2 Children | 170 (3.9%) | 363 (22.4%) |
| 3 or 4 Children | 68 (7.9%) | 46 (55.4%) |
| 5 or more Children | 0 (0.0%) | 7 (100.0%) |
| Total | 682 (4.5%) | 460 (15.9%) |
Race in Hood County
The most populous races in Hood County are White / Caucasian (55,583 | 89.0%), Hispanic or Latino (8,186 | 13.1%), and Two or more Races (4,509 | 7.2%).
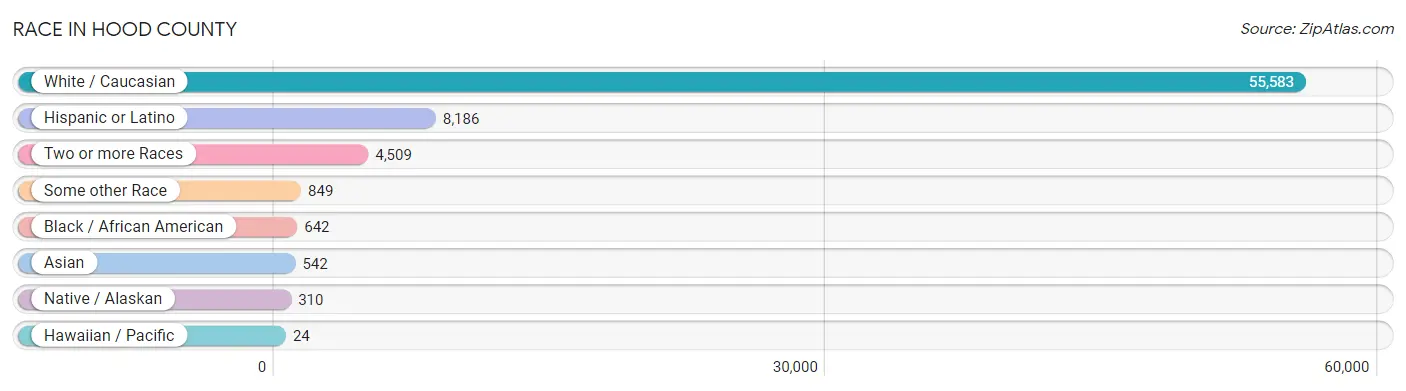
| Race | # Population | % Population |
| Asian | 542 | 0.9% |
| Black / African American | 642 | 1.0% |
| Hawaiian / Pacific | 24 | 0.0% |
| Hispanic or Latino | 8,186 | 13.1% |
| Native / Alaskan | 310 | 0.5% |
| White / Caucasian | 55,583 | 89.0% |
| Two or more Races | 4,509 | 7.2% |
| Some other Race | 849 | 1.4% |
| Total | 62,459 | 100.0% |
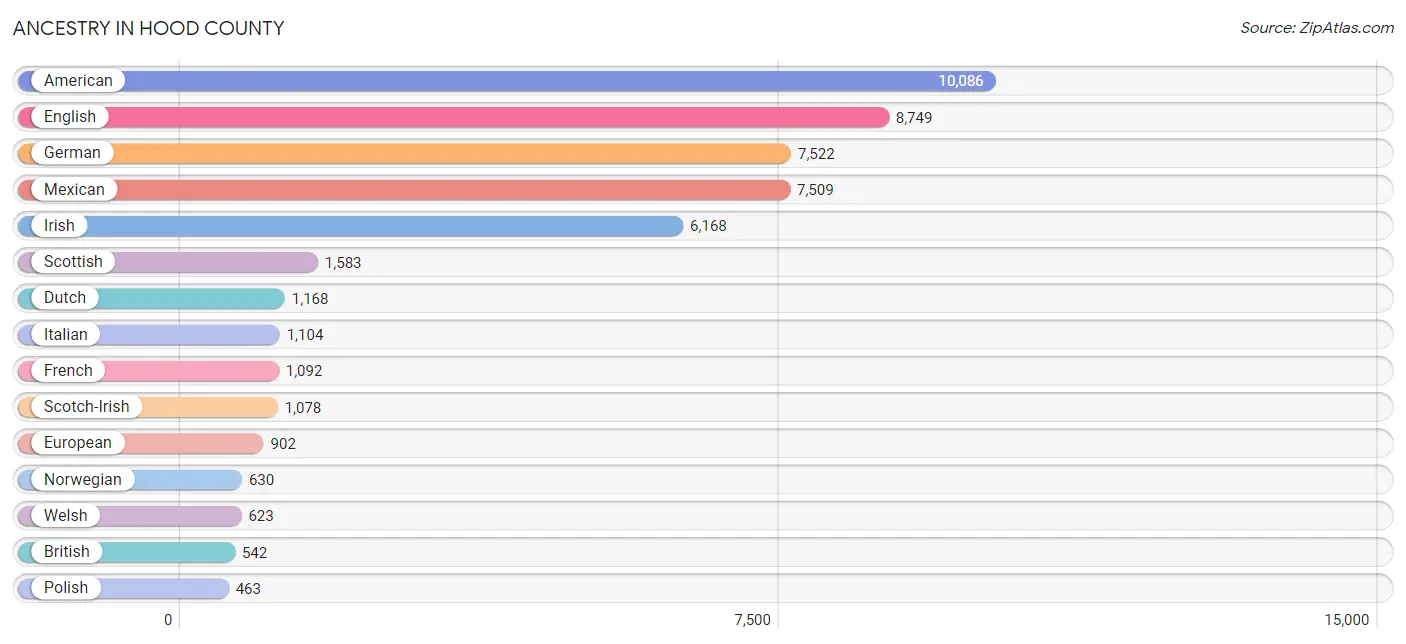
Ancestry in Hood County
The most populous ancestries reported in Hood County are American (10,086 | 16.2%), English (8,749 | 14.0%), German (7,522 | 12.0%), Mexican (7,509 | 12.0%), and Irish (6,168 | 9.9%), together accounting for 64.1% of all Hood County residents.
| Ancestry | # Population | % Population |
| African | 27 | 0.0% |
| Alaska Native | 2 | 0.0% |
| American | 10,086 | 16.2% |
| Apache | 16 | 0.0% |
| Arab | 13 | 0.0% |
| Argentinean | 13 | 0.0% |
| Armenian | 1 | 0.0% |
| Austrian | 15 | 0.0% |
| Bhutanese | 52 | 0.1% |
| Brazilian | 4 | 0.0% |
| British | 542 | 0.9% |
| Burmese | 57 | 0.1% |
| Cajun | 2 | 0.0% |
| Canadian | 109 | 0.2% |
| Central American | 127 | 0.2% |
| Central American Indian | 23 | 0.0% |
| Cherokee | 329 | 0.5% |
| Choctaw | 38 | 0.1% |
| Colombian | 37 | 0.1% |
| Comanche | 22 | 0.0% |
| Cuban | 171 | 0.3% |
| Czech | 336 | 0.5% |
| Czechoslovakian | 40 | 0.1% |
| Danish | 172 | 0.3% |
| Dominican | 4 | 0.0% |
| Dutch | 1,168 | 1.9% |
| Dutch West Indian | 68 | 0.1% |
| Eastern European | 45 | 0.1% |
| English | 8,749 | 14.0% |
| Estonian | 38 | 0.1% |
| European | 902 | 1.4% |
| Filipino | 17 | 0.0% |
| Finnish | 32 | 0.1% |
| French | 1,092 | 1.8% |
| French Canadian | 167 | 0.3% |
| German | 7,522 | 12.0% |
| Greek | 71 | 0.1% |
| Guamanian / Chamorro | 20 | 0.0% |
| Hungarian | 87 | 0.1% |
| Indian (Asian) | 71 | 0.1% |
| Irish | 6,168 | 9.9% |
| Italian | 1,104 | 1.8% |
| Korean | 88 | 0.1% |
| Laotian | 41 | 0.1% |
| Latvian | 9 | 0.0% |
| Lebanese | 13 | 0.0% |
| Mexican | 7,509 | 12.0% |
| Mexican American Indian | 103 | 0.2% |
| Mongolian | 3 | 0.0% |
| Native Hawaiian | 76 | 0.1% |
| Navajo | 13 | 0.0% |
| Nicaraguan | 27 | 0.0% |
| Nigerian | 53 | 0.1% |
| Northern European | 111 | 0.2% |
| Norwegian | 630 | 1.0% |
| Ottawa | 26 | 0.0% |
| Pakistani | 13 | 0.0% |
| Panamanian | 45 | 0.1% |
| Polish | 463 | 0.7% |
| Portuguese | 52 | 0.1% |
| Puerto Rican | 117 | 0.2% |
| Romanian | 15 | 0.0% |
| Russian | 175 | 0.3% |
| Salvadoran | 55 | 0.1% |
| Samoan | 13 | 0.0% |
| Scandinavian | 236 | 0.4% |
| Scotch-Irish | 1,078 | 1.7% |
| Scottish | 1,583 | 2.5% |
| Seminole | 18 | 0.0% |
| South American | 50 | 0.1% |
| Spaniard | 67 | 0.1% |
| Spanish | 71 | 0.1% |
| Sri Lankan | 64 | 0.1% |
| Subsaharan African | 80 | 0.1% |
| Swedish | 432 | 0.7% |
| Swiss | 47 | 0.1% |
| Thai | 101 | 0.2% |
| Ukrainian | 58 | 0.1% |
| Vietnamese | 146 | 0.2% |
| Welsh | 623 | 1.0% |
| West Indian | 4 | 0.0% | View All 81 Rows |
Immigrants in Hood County
The most numerous immigrant groups reported in Hood County came from Latin America (1,671 | 2.7%), Central America (1,641 | 2.6%), Mexico (1,546 | 2.5%), Asia (382 | 0.6%), and Europe (355 | 0.6%), together accounting for 9.0% of all Hood County residents.
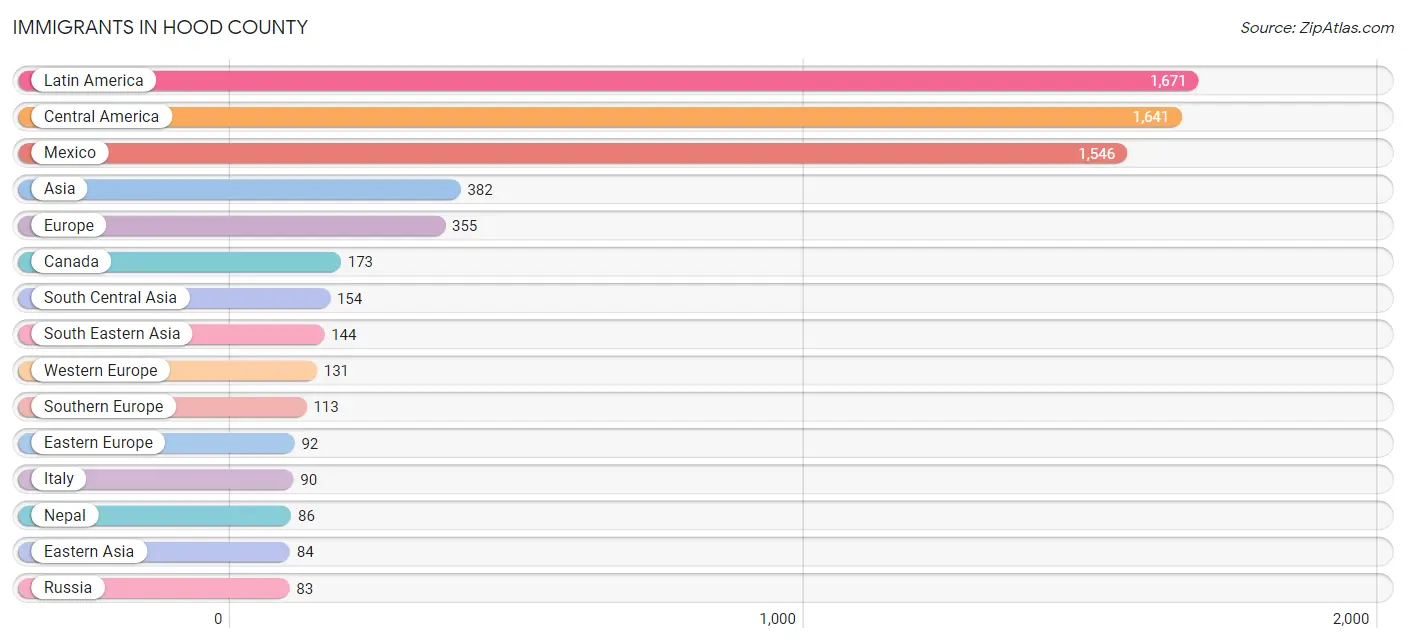
| Immigration Origin | # Population | % Population |
| Africa | 16 | 0.0% |
| Asia | 382 | 0.6% |
| Australia | 12 | 0.0% |
| Bangladesh | 62 | 0.1% |
| Brazil | 1 | 0.0% |
| Canada | 173 | 0.3% |
| Central America | 1,641 | 2.6% |
| China | 48 | 0.1% |
| Colombia | 29 | 0.1% |
| Eastern Asia | 84 | 0.1% |
| Eastern Europe | 92 | 0.2% |
| El Salvador | 50 | 0.1% |
| England | 11 | 0.0% |
| Europe | 355 | 0.6% |
| Fiji | 7 | 0.0% |
| Germany | 71 | 0.1% |
| Greece | 21 | 0.0% |
| Indonesia | 12 | 0.0% |
| Italy | 90 | 0.1% |
| Korea | 36 | 0.1% |
| Latin America | 1,671 | 2.7% |
| Latvia | 9 | 0.0% |
| Malaysia | 17 | 0.0% |
| Mexico | 1,546 | 2.5% |
| Nepal | 86 | 0.1% |
| Netherlands | 60 | 0.1% |
| Nigeria | 10 | 0.0% |
| Northern Europe | 19 | 0.0% |
| Oceania | 46 | 0.1% |
| Pakistan | 6 | 0.0% |
| Panama | 45 | 0.1% |
| Philippines | 74 | 0.1% |
| Portugal | 2 | 0.0% |
| Russia | 83 | 0.1% |
| Singapore | 6 | 0.0% |
| South America | 30 | 0.1% |
| South Central Asia | 154 | 0.3% |
| South Eastern Asia | 144 | 0.2% |
| Southern Europe | 113 | 0.2% |
| Taiwan | 26 | 0.0% |
| Thailand | 13 | 0.0% |
| Vietnam | 22 | 0.0% |
| Western Africa | 10 | 0.0% |
| Western Europe | 131 | 0.2% | View All 44 Rows |
Sex and Age in Hood County
Sex and Age in Hood County
The most populous age groups in Hood County are 55 to 59 Years (2,521 | 8.3%) for men and 65 to 69 Years (2,585 | 8.1%) for women.
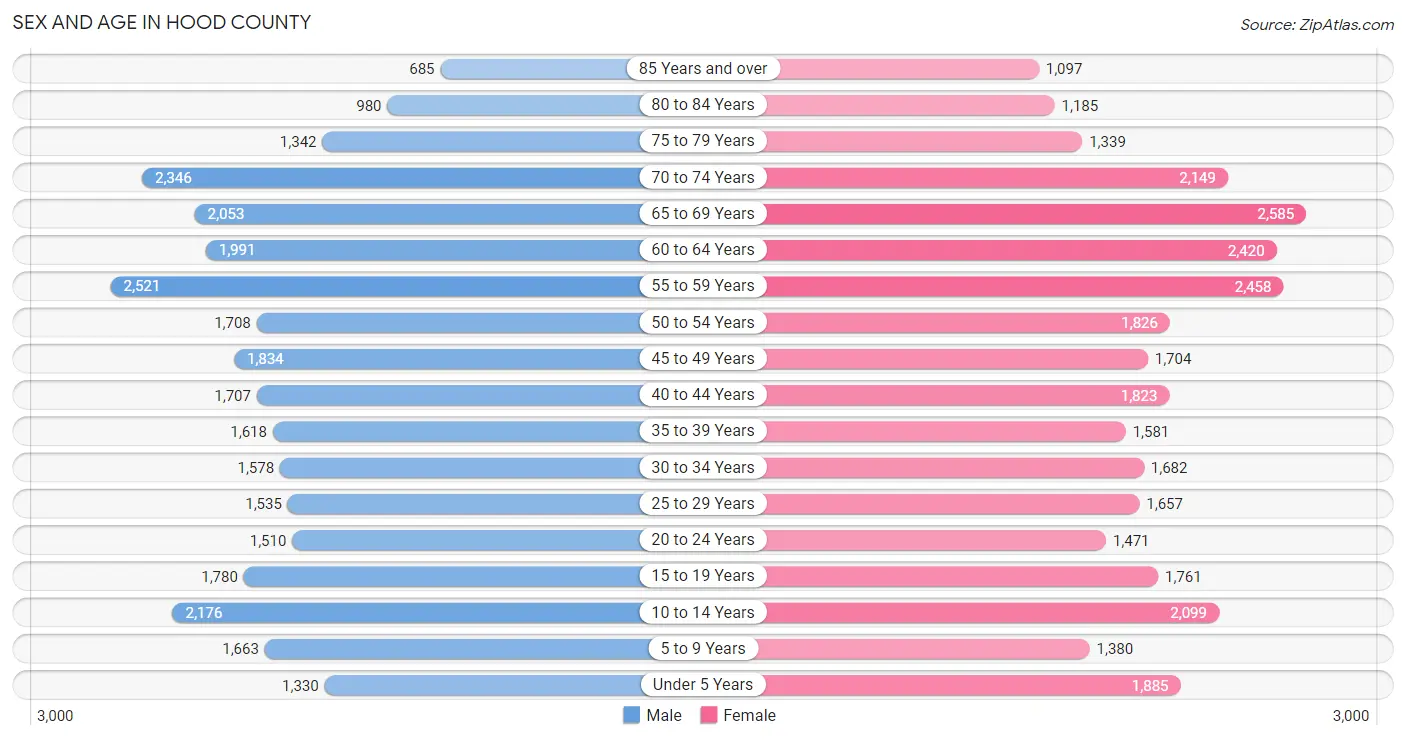
| Age Bracket | Male | Female |
| Under 5 Years | 1,330 (4.4%) | 1,885 (5.9%) |
| 5 to 9 Years | 1,663 (5.5%) | 1,380 (4.3%) |
| 10 to 14 Years | 2,176 (7.2%) | 2,099 (6.5%) |
| 15 to 19 Years | 1,780 (5.9%) | 1,761 (5.5%) |
| 20 to 24 Years | 1,510 (5.0%) | 1,471 (4.6%) |
| 25 to 29 Years | 1,535 (5.1%) | 1,657 (5.2%) |
| 30 to 34 Years | 1,578 (5.2%) | 1,682 (5.2%) |
| 35 to 39 Years | 1,618 (5.3%) | 1,581 (4.9%) |
| 40 to 44 Years | 1,707 (5.6%) | 1,823 (5.7%) |
| 45 to 49 Years | 1,834 (6.0%) | 1,704 (5.3%) |
| 50 to 54 Years | 1,708 (5.6%) | 1,826 (5.7%) |
| 55 to 59 Years | 2,521 (8.3%) | 2,458 (7.7%) |
| 60 to 64 Years | 1,991 (6.6%) | 2,420 (7.5%) |
| 65 to 69 Years | 2,053 (6.8%) | 2,585 (8.1%) |
| 70 to 74 Years | 2,346 (7.7%) | 2,149 (6.7%) |
| 75 to 79 Years | 1,342 (4.4%) | 1,339 (4.2%) |
| 80 to 84 Years | 980 (3.2%) | 1,185 (3.7%) |
| 85 Years and over | 685 (2.3%) | 1,097 (3.4%) |
| Total | 30,357 (100.0%) | 32,102 (100.0%) |
Families and Households in Hood County
Median Family Size in Hood County
The median family size in Hood County is 2.93 persons per family, with married-couple families (15,078 | 83.9%) accounting for the largest median family size of 2.96 persons per family. On the other hand, single female/mother families (1,889 | 10.5%) represent the smallest median family size with 2.70 persons per family.
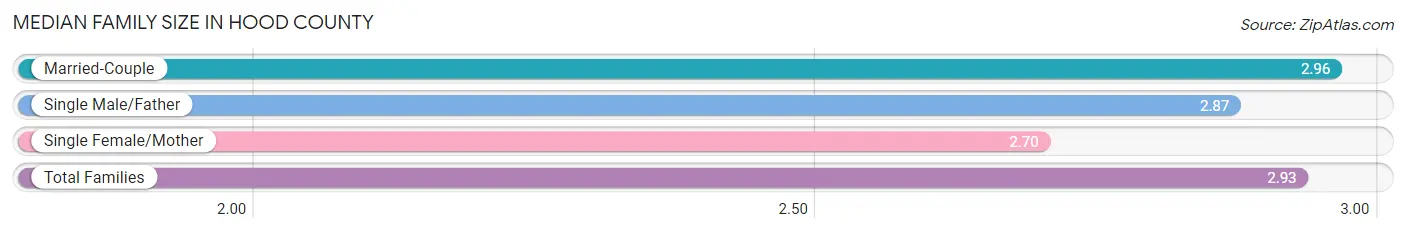
| Family Type | # Families | Family Size |
| Married-Couple | 15,078 (83.9%) | 2.96 |
| Single Male/Father | 1,001 (5.6%) | 2.87 |
| Single Female/Mother | 1,889 (10.5%) | 2.70 |
| Total Families | 17,968 (100.0%) | 2.93 |
Median Household Size in Hood County
The median household size in Hood County is 2.49 persons per household, with single male/father households (1,001 | 4.1%) accounting for the largest median household size of 3.11 persons per household. non-family households (6,766 | 27.4%) represent the smallest median household size with 1.15 persons per household.
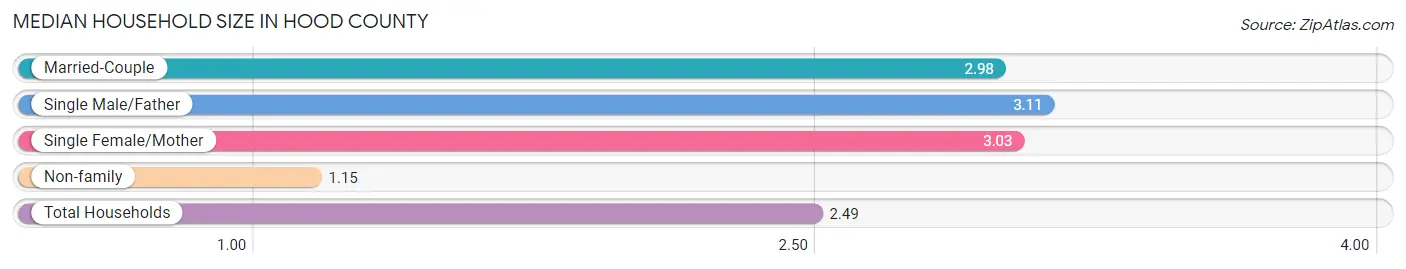
| Household Type | # Households | Household Size |
| Married-Couple | 15,078 (61.0%) | 2.98 |
| Single Male/Father | 1,001 (4.1%) | 3.11 |
| Single Female/Mother | 1,889 (7.6%) | 3.03 |
| Non-family | 6,766 (27.4%) | 1.15 |
| Total Households | 24,734 (100.0%) | 2.49 |
Household Size by Marriage Status in Hood County
Out of a total of 24,734 households in Hood County, 17,968 (72.6%) are family households, while 6,766 (27.4%) are nonfamily households. The most numerous type of family households are 2-person households, comprising 9,664, and the most common type of nonfamily households are 1-person households, comprising 5,932.
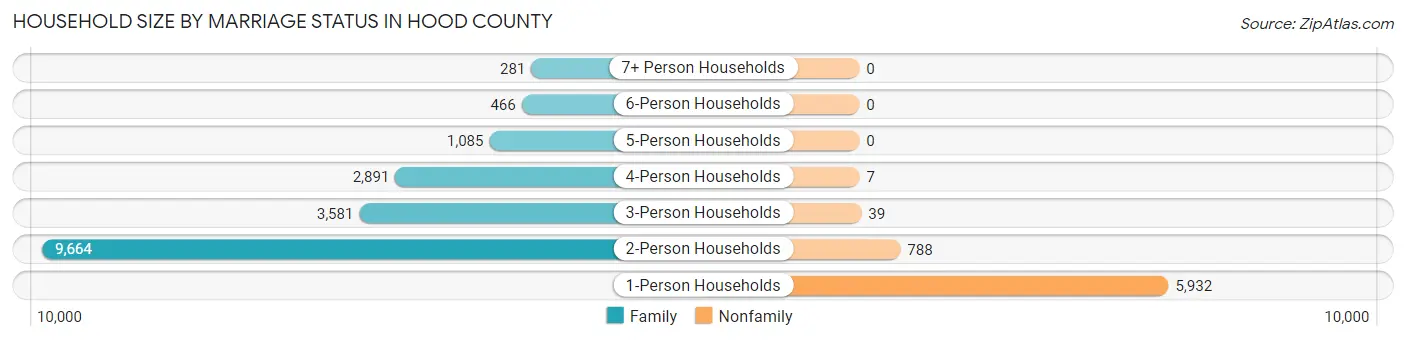
| Household Size | Family Households | Nonfamily Households |
| 1-Person Households | - | 5,932 (24.0%) |
| 2-Person Households | 9,664 (39.1%) | 788 (3.2%) |
| 3-Person Households | 3,581 (14.5%) | 39 (0.2%) |
| 4-Person Households | 2,891 (11.7%) | 7 (0.0%) |
| 5-Person Households | 1,085 (4.4%) | 0 (0.0%) |
| 6-Person Households | 466 (1.9%) | 0 (0.0%) |
| 7+ Person Households | 281 (1.1%) | 0 (0.0%) |
| Total | 17,968 (72.6%) | 6,766 (27.4%) |
Female Fertility in Hood County
Fertility by Age in Hood County
Average fertility rate in Hood County is 68.0 births per 1,000 women. Women in the age bracket of 20 to 34 years have the highest fertility rate with 121.0 births per 1,000 women. Women in the age bracket of 20 to 34 years acount for 70.8% of all women with births.
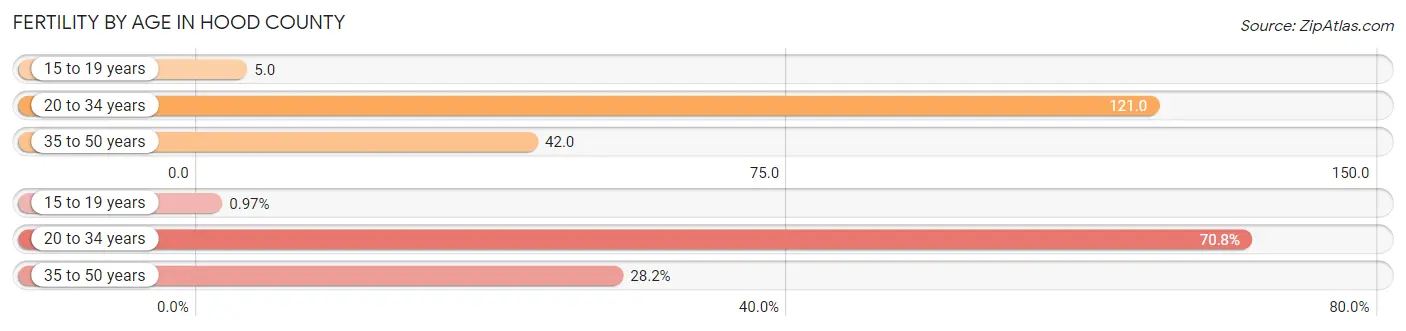
| Age Bracket | Women with Births | Births / 1,000 Women |
| 15 to 19 years | 8 (1.0%) | 5.0 |
| 20 to 34 years | 583 (70.8%) | 121.0 |
| 35 to 50 years | 232 (28.2%) | 42.0 |
| Total | 823 (100.0%) | 68.0 |
Fertility by Age by Marriage Status in Hood County
65.5% of women with births (823) in Hood County are married. The highest percentage of unmarried women with births falls into 15 to 19 years age bracket with 100.0% of them unmarried at the time of birth, while the lowest percentage of unmarried women with births belong to 35 to 50 years age bracket with 15.1% of them unmarried.
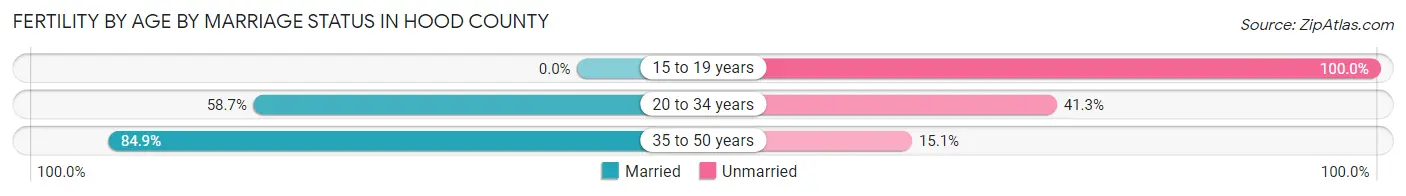
| Age Bracket | Married | Unmarried |
| 15 to 19 years | 0 (0.0%) | 8 (100.0%) |
| 20 to 34 years | 342 (58.7%) | 241 (41.3%) |
| 35 to 50 years | 197 (84.9%) | 35 (15.1%) |
| Total | 539 (65.5%) | 284 (34.5%) |
Fertility by Education in Hood County
Average fertility rate in Hood County is 68.0 births per 1,000 women. Women with the education attainment of high school diploma have the highest fertility rate of 121.0 births per 1,000 women, while women with the education attainment of less than high school have the lowest fertility at 23.0 births per 1,000 women. Women with the education attainment of high school diploma represent 47.3% of all women with births.
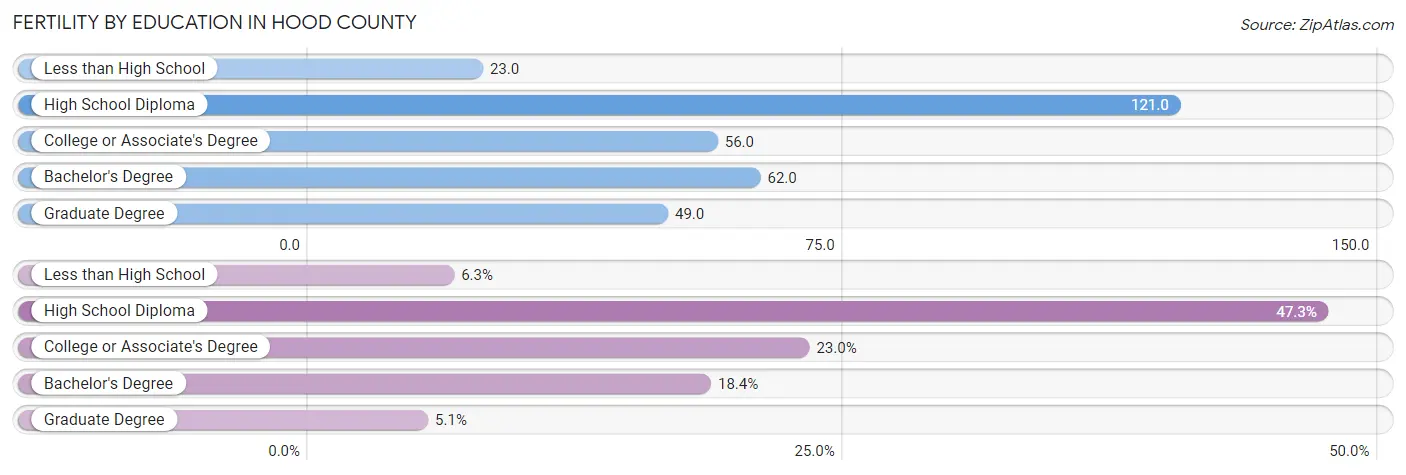
| Educational Attainment | Women with Births | Births / 1,000 Women |
| Less than High School | 52 (6.3%) | 23.0 |
| High School Diploma | 389 (47.3%) | 121.0 |
| College or Associate's Degree | 189 (23.0%) | 56.0 |
| Bachelor's Degree | 151 (18.3%) | 62.0 |
| Graduate Degree | 42 (5.1%) | 49.0 |
| Total | 823 (100.0%) | 68.0 |
Fertility by Education by Marriage Status in Hood County
34.5% of women with births in Hood County are unmarried. Women with the educational attainment of graduate degree are most likely to be married with 100.0% of them married at childbirth, while women with the educational attainment of less than high school are least likely to be married with 100.0% of them unmarried at childbirth.
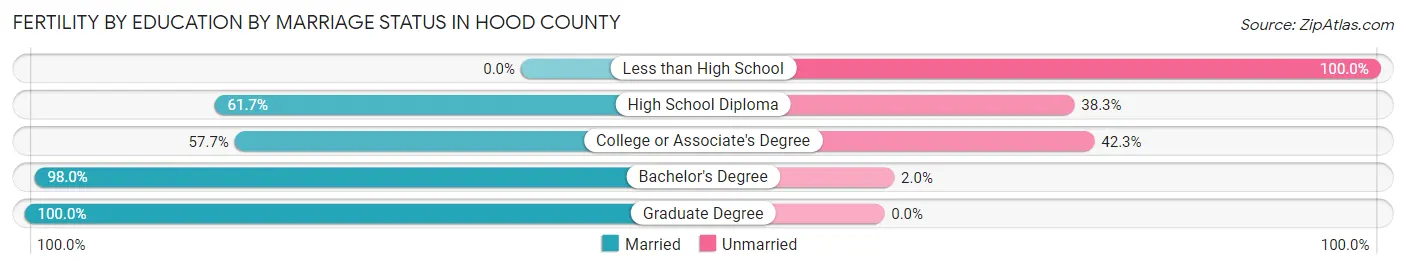
| Educational Attainment | Married | Unmarried |
| Less than High School | 0 (0.0%) | 52 (100.0%) |
| High School Diploma | 240 (61.7%) | 149 (38.3%) |
| College or Associate's Degree | 109 (57.7%) | 80 (42.3%) |
| Bachelor's Degree | 148 (98.0%) | 3 (2.0%) |
| Graduate Degree | 42 (100.0%) | 0 (0.0%) |
| Total | 539 (65.5%) | 284 (34.5%) |
Employment Characteristics in Hood County
Employment by Class of Employer in Hood County
Among the 26,263 employed individuals in Hood County, private company employees (16,866 | 64.2%), local government employees (2,906 | 11.1%), and self-employed (not incorporated) (2,472 | 9.4%) make up the most common classes of employment.
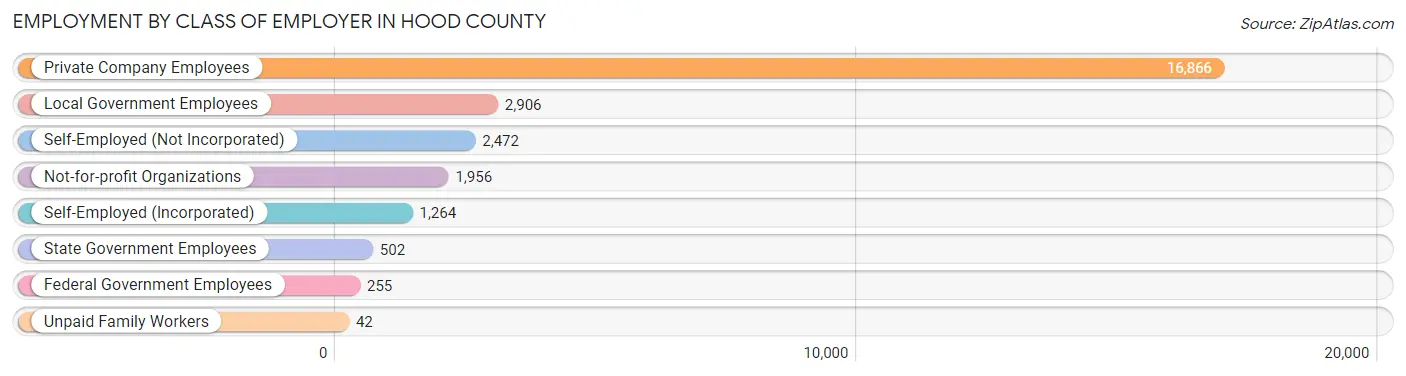
| Employer Class | # Employees | % Employees |
| Private Company Employees | 16,866 | 64.2% |
| Self-Employed (Incorporated) | 1,264 | 4.8% |
| Self-Employed (Not Incorporated) | 2,472 | 9.4% |
| Not-for-profit Organizations | 1,956 | 7.4% |
| Local Government Employees | 2,906 | 11.1% |
| State Government Employees | 502 | 1.9% |
| Federal Government Employees | 255 | 1.0% |
| Unpaid Family Workers | 42 | 0.2% |
| Total | 26,263 | 100.0% |
Employment Status by Age in Hood County
According to the labor force statistics for Hood County, out of the total population over 16 years of age (51,052), 55.2% or 28,181 individuals are in the labor force, with 5.8% or 1,634 of them unemployed. The age group with the highest labor force participation rate is 30 to 34 years, with 81.4% or 2,654 individuals in the labor force. Within the labor force, the 16 to 19 years age range has the highest percentage of unemployed individuals, with 18.9% or 191 of them being unemployed.
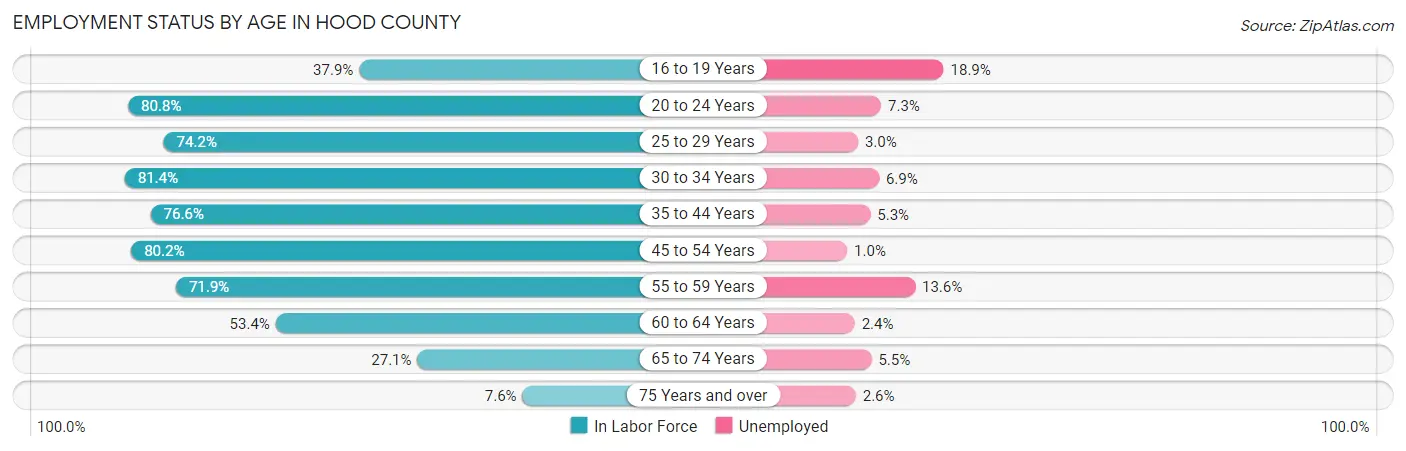
| Age Bracket | In Labor Force | Unemployed |
| 16 to 19 Years | 1,011 (37.9%) | 191 (18.9%) |
| 20 to 24 Years | 2,409 (80.8%) | 176 (7.3%) |
| 25 to 29 Years | 2,368 (74.2%) | 71 (3.0%) |
| 30 to 34 Years | 2,654 (81.4%) | 183 (6.9%) |
| 35 to 44 Years | 5,154 (76.6%) | 273 (5.3%) |
| 45 to 54 Years | 5,672 (80.2%) | 57 (1.0%) |
| 55 to 59 Years | 3,580 (71.9%) | 487 (13.6%) |
| 60 to 64 Years | 2,355 (53.4%) | 57 (2.4%) |
| 65 to 74 Years | 2,475 (27.1%) | 136 (5.5%) |
| 75 Years and over | 504 (7.6%) | 13 (2.6%) |
| Total | 28,181 (55.2%) | 1,634 (5.8%) |
Employment Status by Educational Attainment in Hood County
According to labor force statistics for Hood County, 73.5% of individuals (21,788) out of the total population between 25 and 64 years of age (29,643) are in the labor force, with 5.2% or 1,133 of them being unemployed. The group with the highest labor force participation rate are those with the educational attainment of bachelor's degree or higher, with 79.5% or 7,036 individuals in the labor force. Within the labor force, individuals with less than high school education have the highest percentage of unemployment, with 6.9% or 110 of them being unemployed.
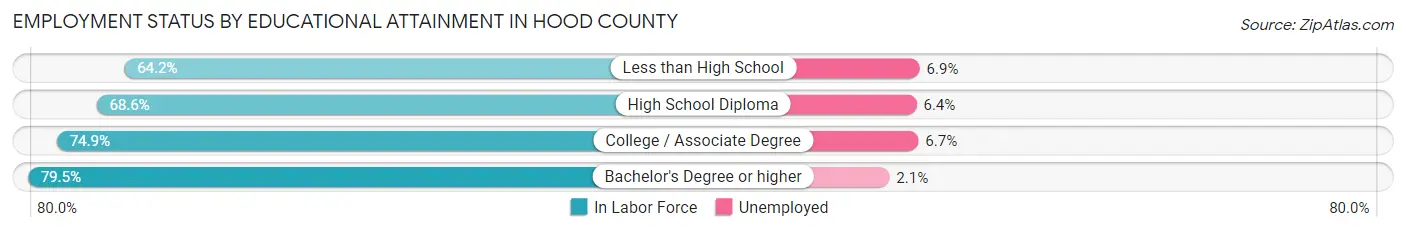
| Educational Attainment | In Labor Force | Unemployed |
| Less than High School | 1,601 (64.2%) | 172 (6.9%) |
| High School Diploma | 6,062 (68.6%) | 566 (6.4%) |
| College / Associate Degree | 7,088 (74.9%) | 634 (6.7%) |
| Bachelor's Degree or higher | 7,036 (79.5%) | 186 (2.1%) |
| Total | 21,788 (73.5%) | 1,541 (5.2%) |
Employment Occupations by Sex in Hood County
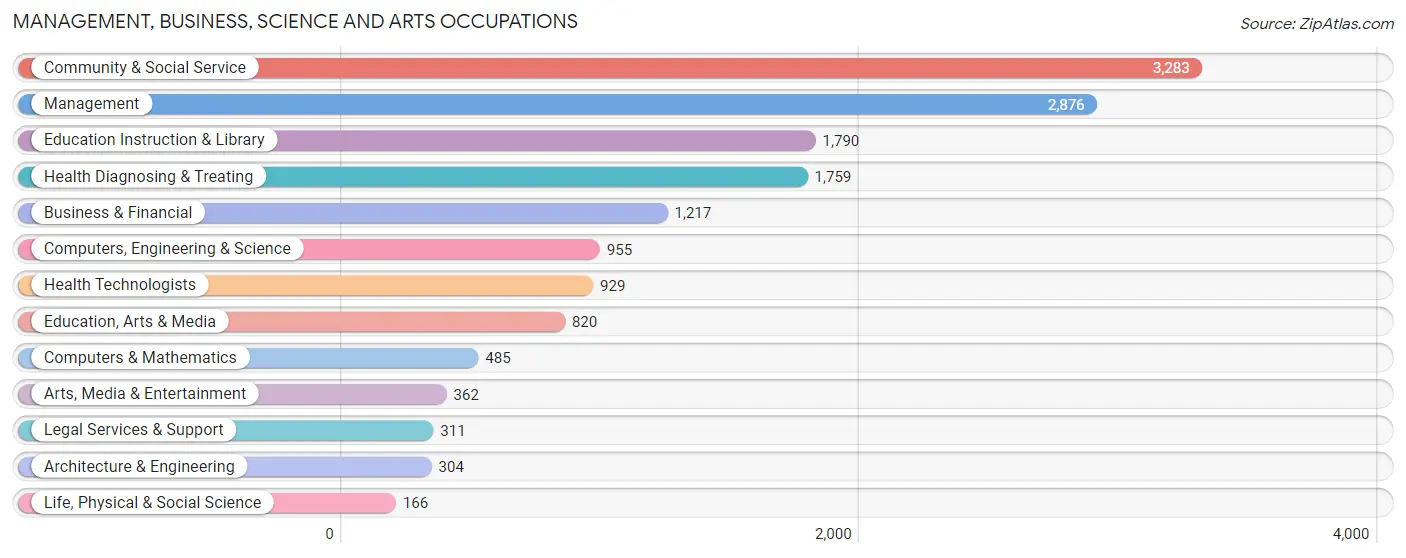
Management, Business, Science and Arts Occupations
The most common Management, Business, Science and Arts occupations in Hood County are Community & Social Service (3,283 | 12.4%), Management (2,876 | 10.8%), Education Instruction & Library (1,790 | 6.7%), Health Diagnosing & Treating (1,759 | 6.6%), and Business & Financial (1,217 | 4.6%).
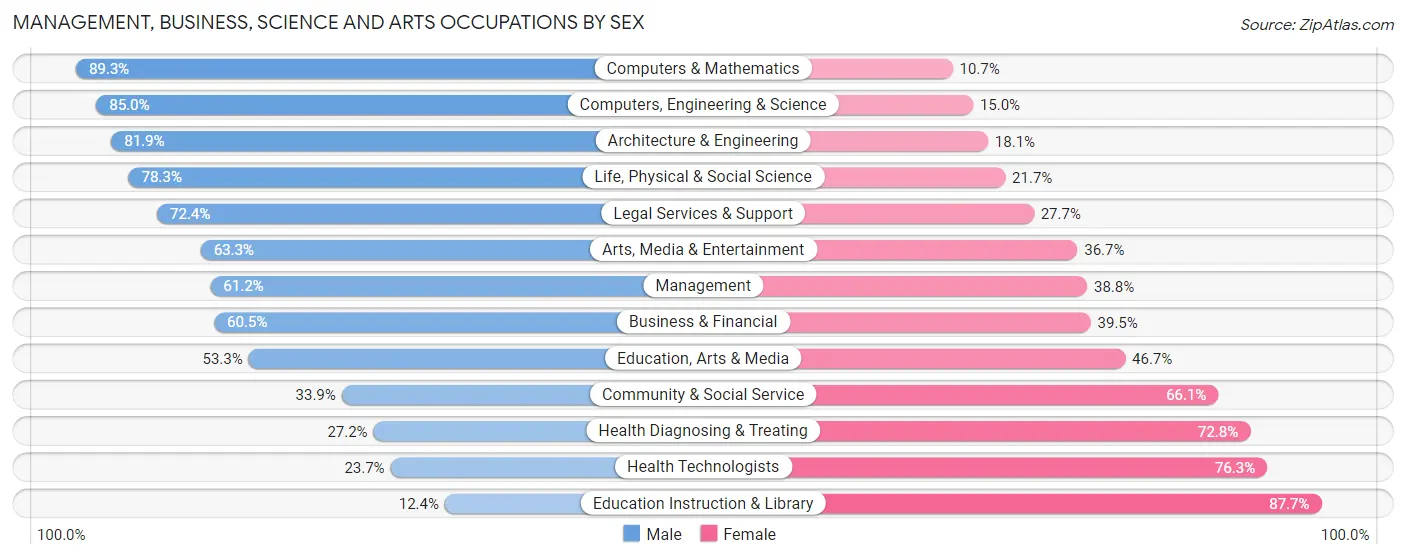
Management, Business, Science and Arts Occupations by Sex
Within the Management, Business, Science and Arts occupations in Hood County, the most male-oriented occupations are Computers & Mathematics (89.3%), Computers, Engineering & Science (85.0%), and Architecture & Engineering (81.9%), while the most female-oriented occupations are Education Instruction & Library (87.6%), Health Technologists (76.3%), and Health Diagnosing & Treating (72.8%).
| Occupation | Male | Female |
| Management | 1,761 (61.2%) | 1,115 (38.8%) |
| Business & Financial | 736 (60.5%) | 481 (39.5%) |
| Computers, Engineering & Science | 812 (85.0%) | 143 (15.0%) |
| Computers & Mathematics | 433 (89.3%) | 52 (10.7%) |
| Architecture & Engineering | 249 (81.9%) | 55 (18.1%) |
| Life, Physical & Social Science | 130 (78.3%) | 36 (21.7%) |
| Community & Social Service | 1,112 (33.9%) | 2,171 (66.1%) |
| Education, Arts & Media | 437 (53.3%) | 383 (46.7%) |
| Legal Services & Support | 225 (72.4%) | 86 (27.7%) |
| Education Instruction & Library | 221 (12.3%) | 1,569 (87.6%) |
| Arts, Media & Entertainment | 229 (63.3%) | 133 (36.7%) |
| Health Diagnosing & Treating | 479 (27.2%) | 1,280 (72.8%) |
| Health Technologists | 220 (23.7%) | 709 (76.3%) |
| Total (Category) | 4,900 (48.6%) | 5,190 (51.4%) |
| Total (Overall) | 14,821 (55.8%) | 11,719 (44.2%) |
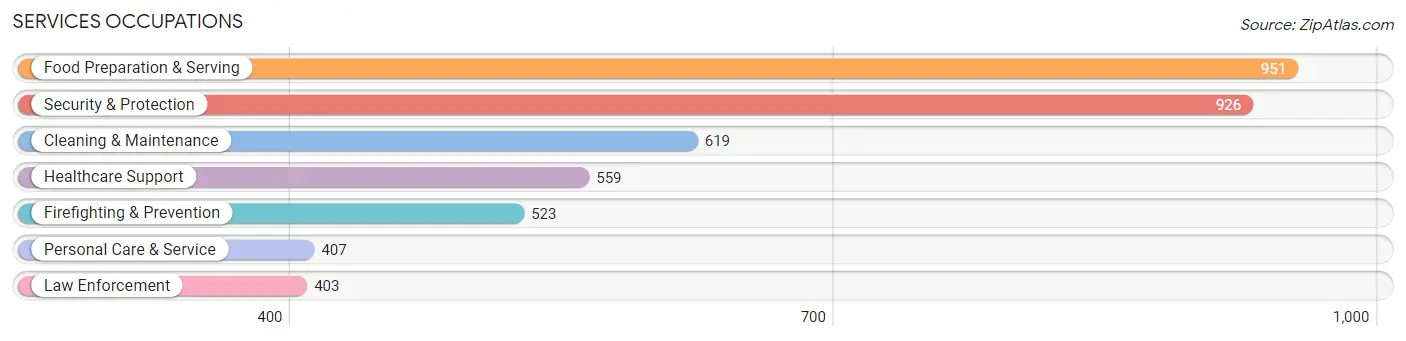
Services Occupations
The most common Services occupations in Hood County are Food Preparation & Serving (951 | 3.6%), Security & Protection (926 | 3.5%), Cleaning & Maintenance (619 | 2.3%), Healthcare Support (559 | 2.1%), and Firefighting & Prevention (523 | 2.0%).
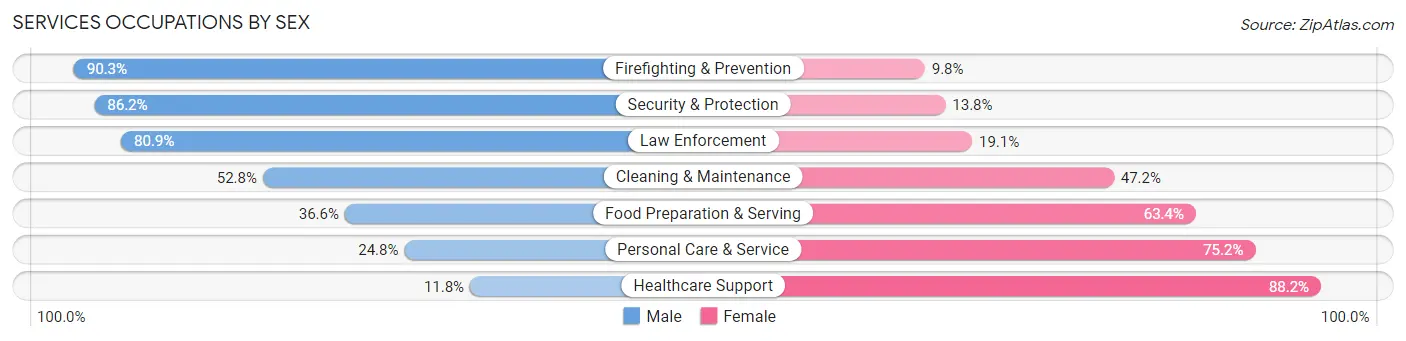
Services Occupations by Sex
Within the Services occupations in Hood County, the most male-oriented occupations are Firefighting & Prevention (90.2%), Security & Protection (86.2%), and Law Enforcement (80.9%), while the most female-oriented occupations are Healthcare Support (88.2%), Personal Care & Service (75.2%), and Food Preparation & Serving (63.4%).
| Occupation | Male | Female |
| Healthcare Support | 66 (11.8%) | 493 (88.2%) |
| Security & Protection | 798 (86.2%) | 128 (13.8%) |
| Firefighting & Prevention | 472 (90.2%) | 51 (9.8%) |
| Law Enforcement | 326 (80.9%) | 77 (19.1%) |
| Food Preparation & Serving | 348 (36.6%) | 603 (63.4%) |
| Cleaning & Maintenance | 327 (52.8%) | 292 (47.2%) |
| Personal Care & Service | 101 (24.8%) | 306 (75.2%) |
| Total (Category) | 1,640 (47.4%) | 1,822 (52.6%) |
| Total (Overall) | 14,821 (55.8%) | 11,719 (44.2%) |
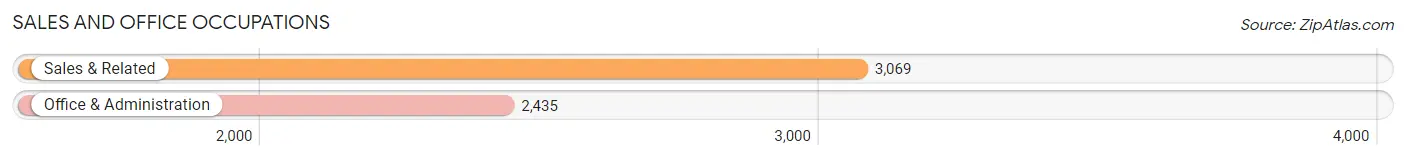
Sales and Office Occupations
The most common Sales and Office occupations in Hood County are Sales & Related (3,069 | 11.6%), and Office & Administration (2,435 | 9.2%).
Sales and Office Occupations by Sex
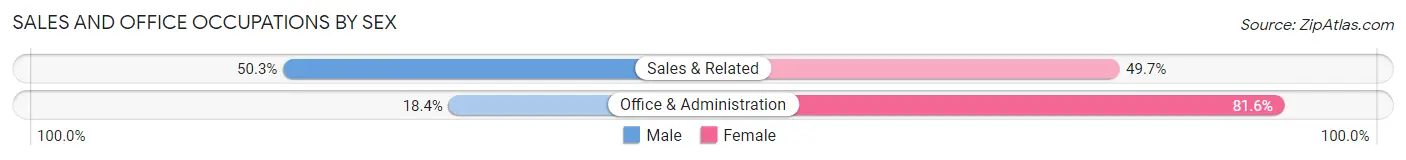
| Occupation | Male | Female |
| Sales & Related | 1,543 (50.3%) | 1,526 (49.7%) |
| Office & Administration | 449 (18.4%) | 1,986 (81.6%) |
| Total (Category) | 1,992 (36.2%) | 3,512 (63.8%) |
| Total (Overall) | 14,821 (55.8%) | 11,719 (44.2%) |
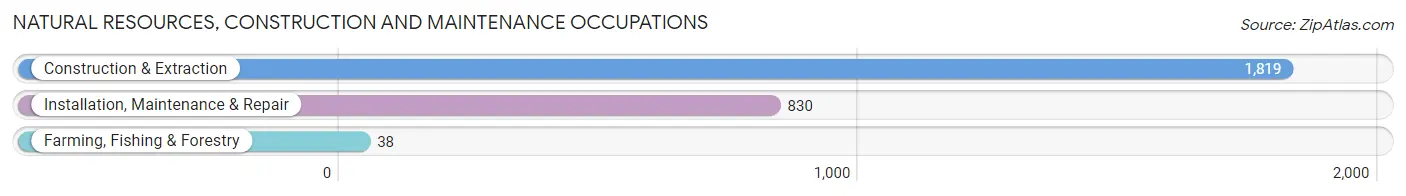
Natural Resources, Construction and Maintenance Occupations
The most common Natural Resources, Construction and Maintenance occupations in Hood County are Construction & Extraction (1,819 | 6.9%), Installation, Maintenance & Repair (830 | 3.1%), and Farming, Fishing & Forestry (38 | 0.1%).
Natural Resources, Construction and Maintenance Occupations by Sex
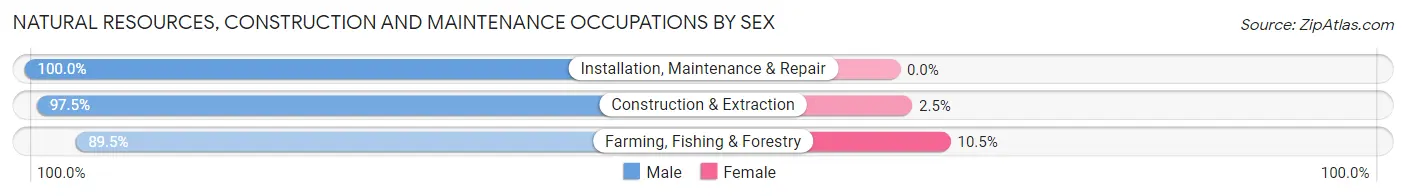
| Occupation | Male | Female |
| Farming, Fishing & Forestry | 34 (89.5%) | 4 (10.5%) |
| Construction & Extraction | 1,773 (97.5%) | 46 (2.5%) |
| Installation, Maintenance & Repair | 830 (100.0%) | 0 (0.0%) |
| Total (Category) | 2,637 (98.1%) | 50 (1.9%) |
| Total (Overall) | 14,821 (55.8%) | 11,719 (44.2%) |
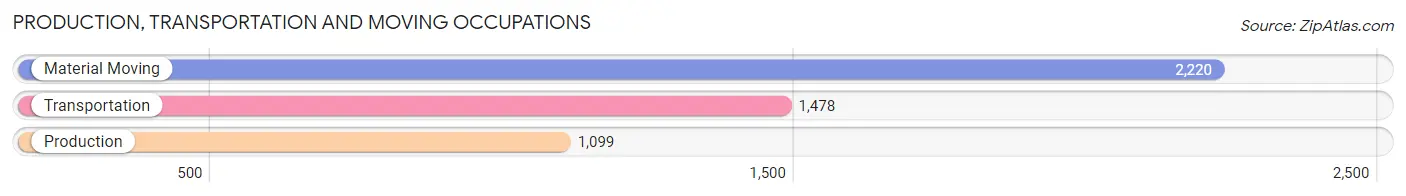
Production, Transportation and Moving Occupations
The most common Production, Transportation and Moving occupations in Hood County are Material Moving (2,220 | 8.4%), Transportation (1,478 | 5.6%), and Production (1,099 | 4.1%).
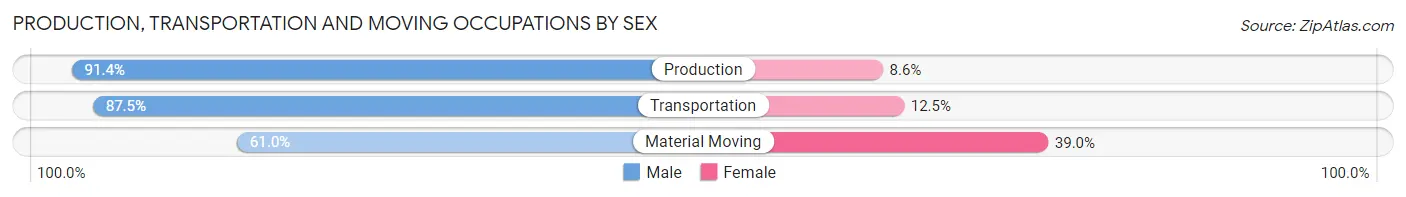
Production, Transportation and Moving Occupations by Sex
| Occupation | Male | Female |
| Production | 1,004 (91.4%) | 95 (8.6%) |
| Transportation | 1,293 (87.5%) | 185 (12.5%) |
| Material Moving | 1,355 (61.0%) | 865 (39.0%) |
| Total (Category) | 3,652 (76.1%) | 1,145 (23.9%) |
| Total (Overall) | 14,821 (55.8%) | 11,719 (44.2%) |
Employment Industries by Sex in Hood County
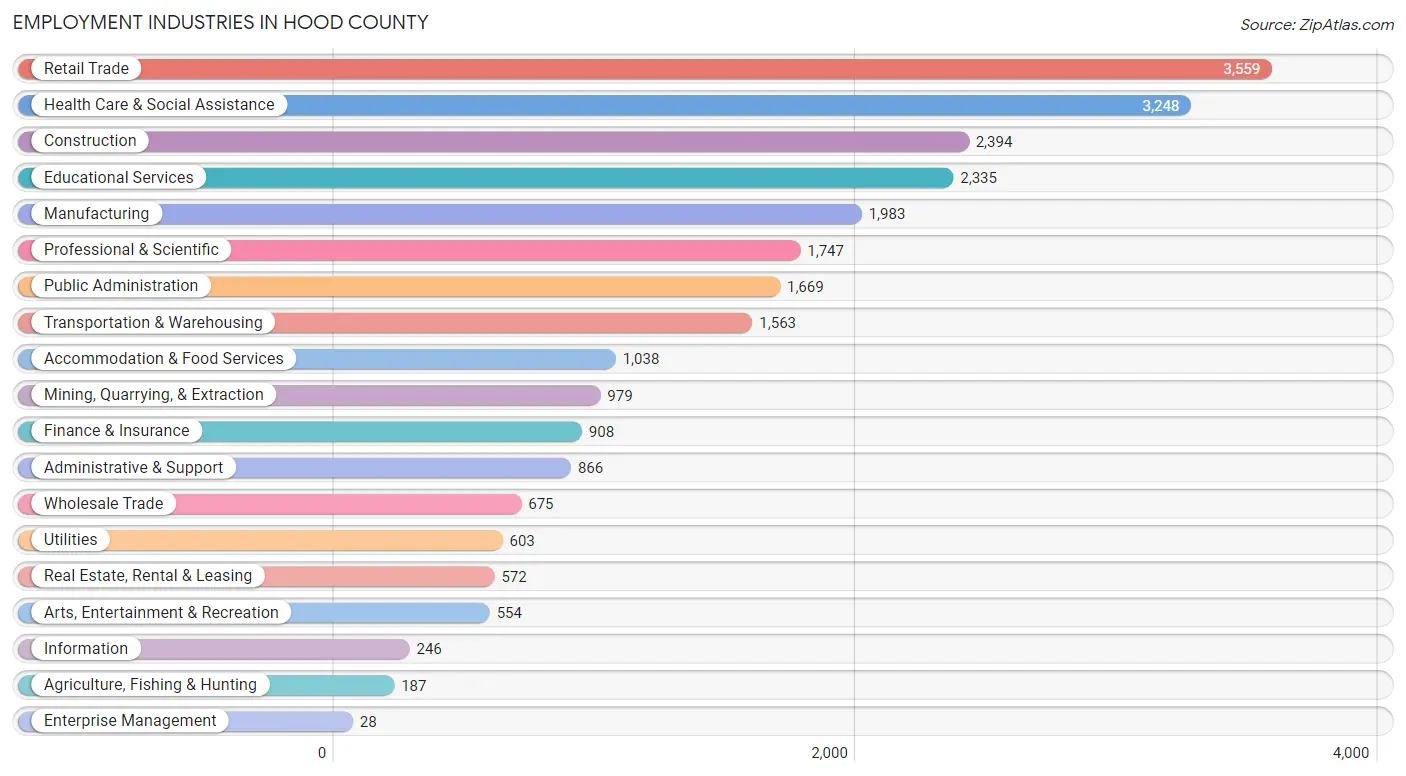
Employment Industries in Hood County
The major employment industries in Hood County include Retail Trade (3,559 | 13.4%), Health Care & Social Assistance (3,248 | 12.2%), Construction (2,394 | 9.0%), Educational Services (2,335 | 8.8%), and Manufacturing (1,983 | 7.5%).
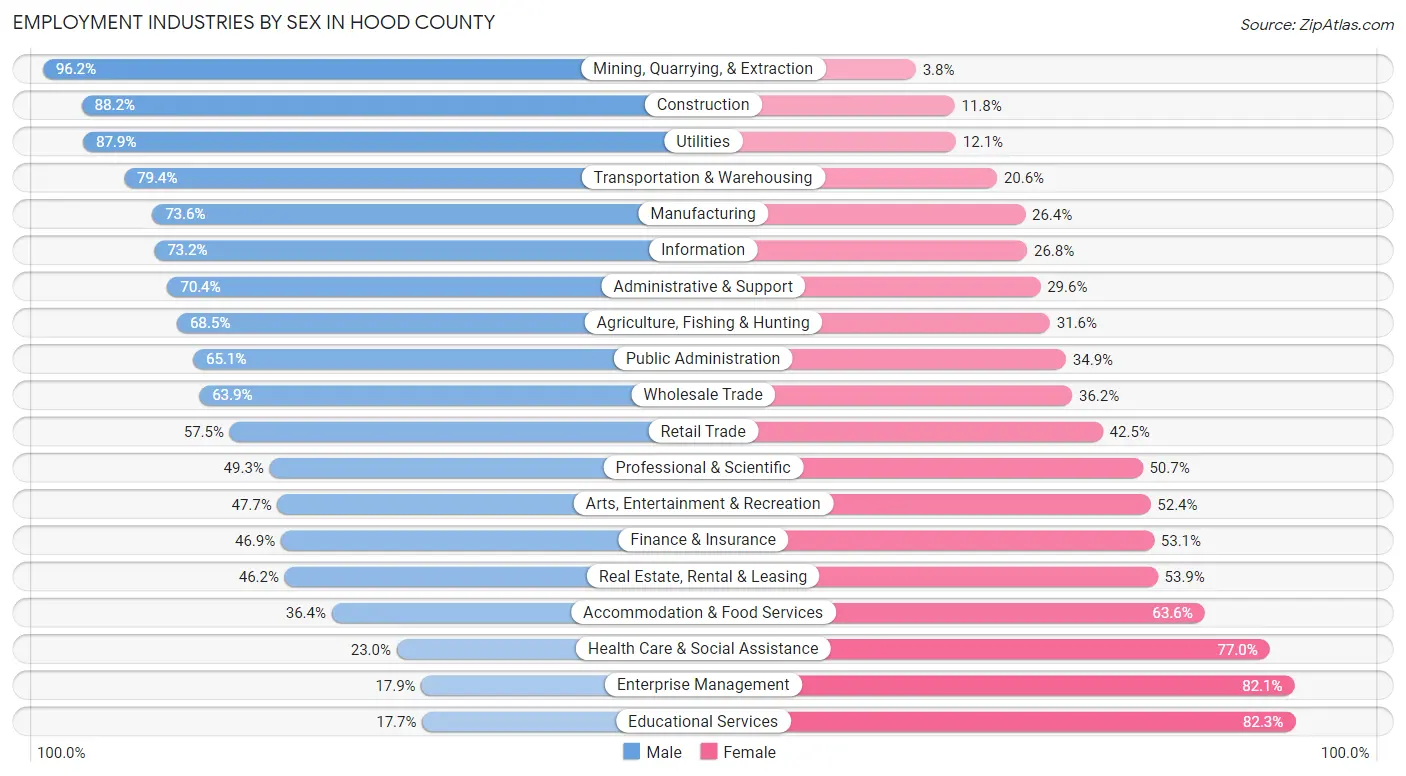
Employment Industries by Sex in Hood County
The Hood County industries that see more men than women are Mining, Quarrying, & Extraction (96.2%), Construction (88.2%), and Utilities (87.9%), whereas the industries that tend to have a higher number of women are Educational Services (82.3%), Enterprise Management (82.1%), and Health Care & Social Assistance (77.0%).
| Industry | Male | Female |
| Agriculture, Fishing & Hunting | 128 (68.4%) | 59 (31.6%) |
| Mining, Quarrying, & Extraction | 942 (96.2%) | 37 (3.8%) |
| Construction | 2,111 (88.2%) | 283 (11.8%) |
| Manufacturing | 1,459 (73.6%) | 524 (26.4%) |
| Wholesale Trade | 431 (63.8%) | 244 (36.1%) |
| Retail Trade | 2,047 (57.5%) | 1,512 (42.5%) |
| Transportation & Warehousing | 1,241 (79.4%) | 322 (20.6%) |
| Utilities | 530 (87.9%) | 73 (12.1%) |
| Information | 180 (73.2%) | 66 (26.8%) |
| Finance & Insurance | 426 (46.9%) | 482 (53.1%) |
| Real Estate, Rental & Leasing | 264 (46.2%) | 308 (53.8%) |
| Professional & Scientific | 861 (49.3%) | 886 (50.7%) |
| Enterprise Management | 5 (17.9%) | 23 (82.1%) |
| Administrative & Support | 610 (70.4%) | 256 (29.6%) |
| Educational Services | 413 (17.7%) | 1,922 (82.3%) |
| Health Care & Social Assistance | 746 (23.0%) | 2,502 (77.0%) |
| Arts, Entertainment & Recreation | 264 (47.6%) | 290 (52.3%) |
| Accommodation & Food Services | 378 (36.4%) | 660 (63.6%) |
| Public Administration | 1,087 (65.1%) | 582 (34.9%) |
| Total | 14,821 (55.8%) | 11,719 (44.2%) |
Education in Hood County
School Enrollment in Hood County
The most common levels of schooling among the 12,078 students in Hood County are middle school (3,274 | 27.1%), high school (3,160 | 26.2%), and elementary school (1,901 | 15.7%).
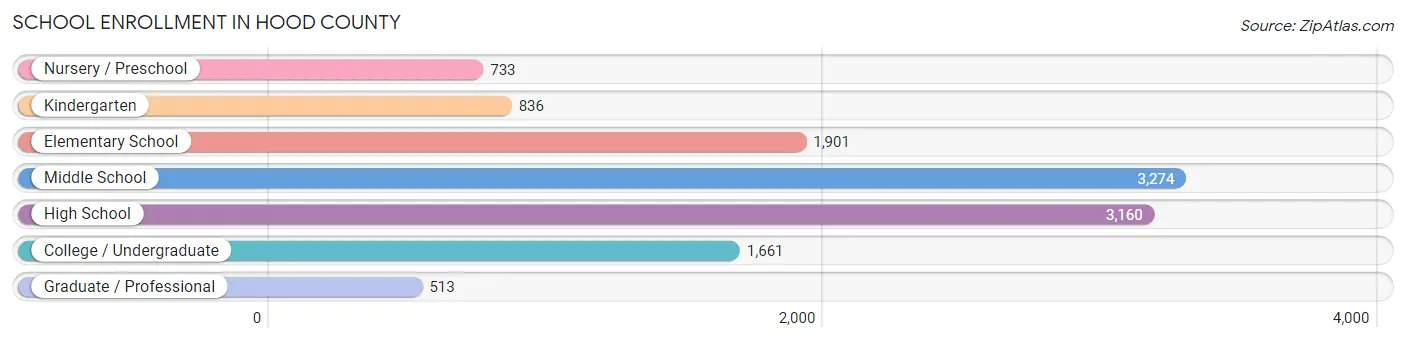
| School Level | # Students | % Students |
| Nursery / Preschool | 733 | 6.1% |
| Kindergarten | 836 | 6.9% |
| Elementary School | 1,901 | 15.7% |
| Middle School | 3,274 | 27.1% |
| High School | 3,160 | 26.2% |
| College / Undergraduate | 1,661 | 13.8% |
| Graduate / Professional | 513 | 4.3% |
| Total | 12,078 | 100.0% |
School Enrollment by Age by Funding Source in Hood County
Out of a total of 12,078 students who are enrolled in schools in Hood County, 1,461 (12.1%) attend a private institution, while the remaining 10,617 (87.9%) are enrolled in public schools. The age group of 3 to 4 year olds has the highest likelihood of being enrolled in private schools, with 222 (38.0% in the age bracket) enrolled. Conversely, the age group of 18 to 19 year olds has the lowest likelihood of being enrolled in a private school, with 655 (97.2% in the age bracket) attending a public institution.
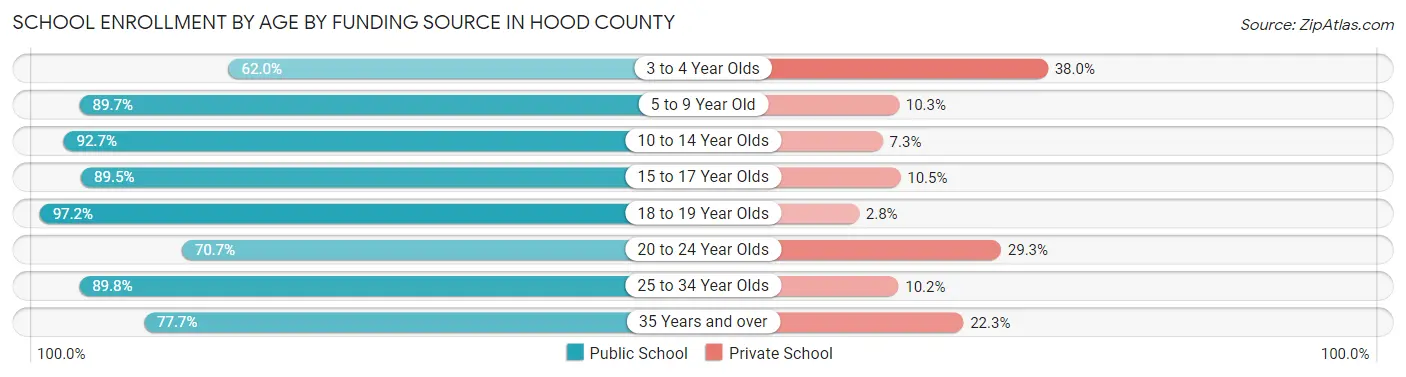
| Age Bracket | Public School | Private School |
| 3 to 4 Year Olds | 362 (62.0%) | 222 (38.0%) |
| 5 to 9 Year Old | 2,413 (89.7%) | 276 (10.3%) |
| 10 to 14 Year Olds | 3,639 (92.7%) | 285 (7.3%) |
| 15 to 17 Year Olds | 1,961 (89.5%) | 231 (10.5%) |
| 18 to 19 Year Olds | 655 (97.2%) | 19 (2.8%) |
| 20 to 24 Year Olds | 541 (70.7%) | 224 (29.3%) |
| 25 to 34 Year Olds | 538 (89.8%) | 61 (10.2%) |
| 35 Years and over | 506 (77.7%) | 145 (22.3%) |
| Total | 10,617 (87.9%) | 1,461 (12.1%) |
Educational Attainment by Field of Study in Hood County
Business (3,477 | 22.7%), education (2,508 | 16.4%), science & technology (1,450 | 9.5%), arts & humanities (1,241 | 8.1%), and engineering (1,043 | 6.8%) are the most common fields of study among 15,341 individuals in Hood County who have obtained a bachelor's degree or higher.
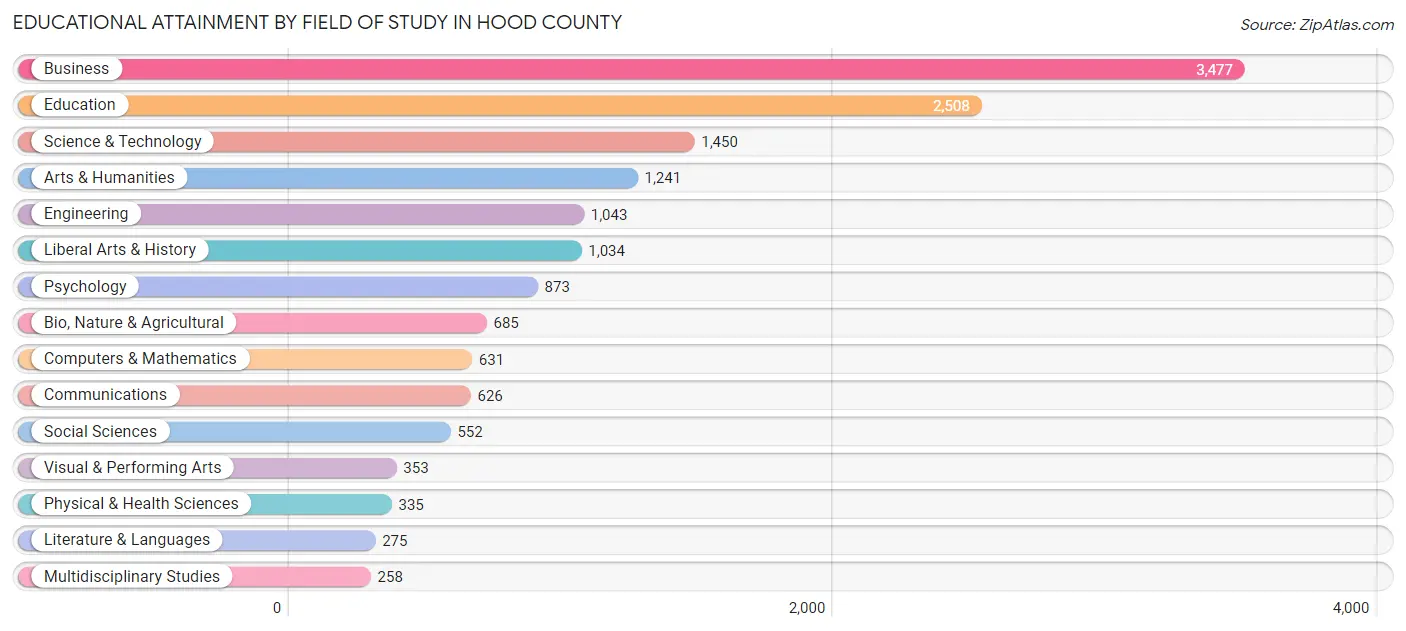
| Field of Study | # Graduates | % Graduates |
| Computers & Mathematics | 631 | 4.1% |
| Bio, Nature & Agricultural | 685 | 4.5% |
| Physical & Health Sciences | 335 | 2.2% |
| Psychology | 873 | 5.7% |
| Social Sciences | 552 | 3.6% |
| Engineering | 1,043 | 6.8% |
| Multidisciplinary Studies | 258 | 1.7% |
| Science & Technology | 1,450 | 9.5% |
| Business | 3,477 | 22.7% |
| Education | 2,508 | 16.4% |
| Literature & Languages | 275 | 1.8% |
| Liberal Arts & History | 1,034 | 6.7% |
| Visual & Performing Arts | 353 | 2.3% |
| Communications | 626 | 4.1% |
| Arts & Humanities | 1,241 | 8.1% |
| Total | 15,341 | 100.0% |
Transportation & Commute in Hood County
Vehicle Availability by Sex in Hood County
The most prevalent vehicle ownership categories in Hood County are males with 2 vehicles (6,875, accounting for 46.9%) and females with 2 vehicles (5,396, making up 59.3%).
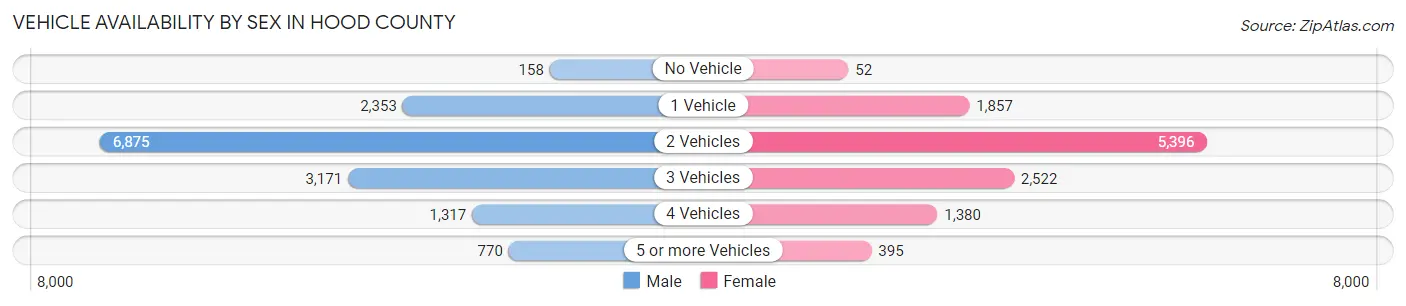
| Vehicles Available | Male | Female |
| No Vehicle | 158 (1.1%) | 52 (0.4%) |
| 1 Vehicle | 2,353 (16.1%) | 1,857 (16.0%) |
| 2 Vehicles | 6,875 (46.9%) | 5,396 (46.5%) |
| 3 Vehicles | 3,171 (21.6%) | 2,522 (21.7%) |
| 4 Vehicles | 1,317 (9.0%) | 1,380 (11.9%) |
| 5 or more Vehicles | 770 (5.3%) | 395 (3.4%) |
| Total | 14,644 (100.0%) | 11,602 (100.0%) |
Commute Time in Hood County
The most frequently occuring commute durations in Hood County are 45 to 59 minutes (3,550 commuters, 15.0%), 60 to 89 minutes (3,038 commuters, 12.9%), and 15 to 19 minutes (3,034 commuters, 12.8%).
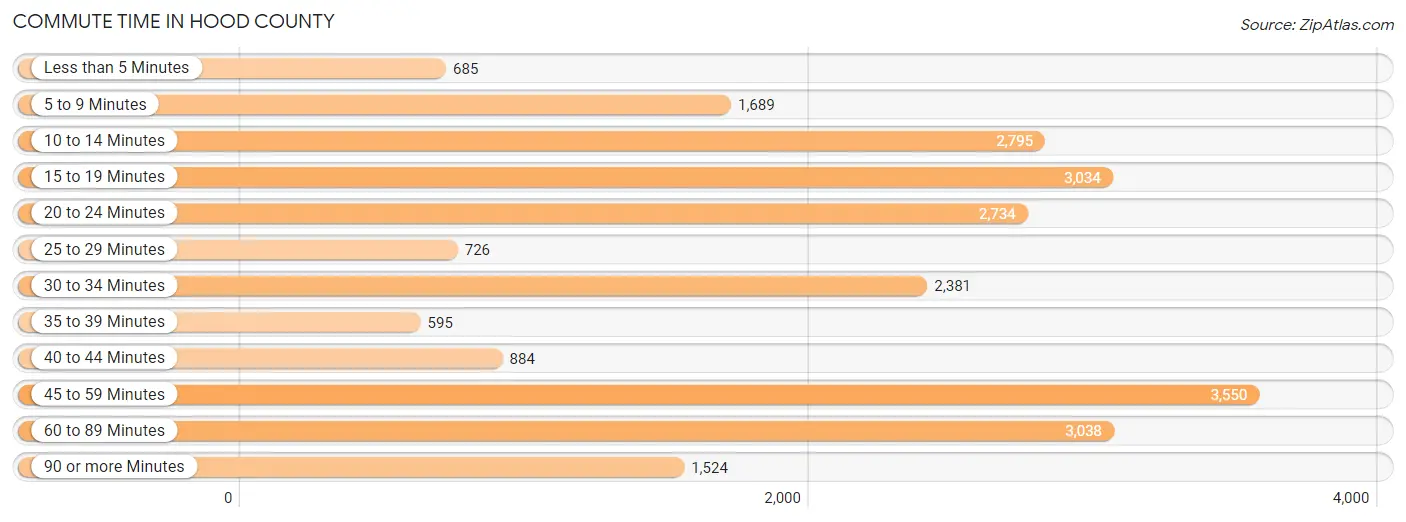
| Commute Time | # Commuters | % Commuters |
| Less than 5 Minutes | 685 | 2.9% |
| 5 to 9 Minutes | 1,689 | 7.1% |
| 10 to 14 Minutes | 2,795 | 11.8% |
| 15 to 19 Minutes | 3,034 | 12.8% |
| 20 to 24 Minutes | 2,734 | 11.6% |
| 25 to 29 Minutes | 726 | 3.1% |
| 30 to 34 Minutes | 2,381 | 10.1% |
| 35 to 39 Minutes | 595 | 2.5% |
| 40 to 44 Minutes | 884 | 3.7% |
| 45 to 59 Minutes | 3,550 | 15.0% |
| 60 to 89 Minutes | 3,038 | 12.9% |
| 90 or more Minutes | 1,524 | 6.5% |
Commute Time by Sex in Hood County
The most common commute times in Hood County are 45 to 59 minutes (2,608 commuters, 19.6%) for males and 20 to 24 minutes (1,623 commuters, 15.7%) for females.
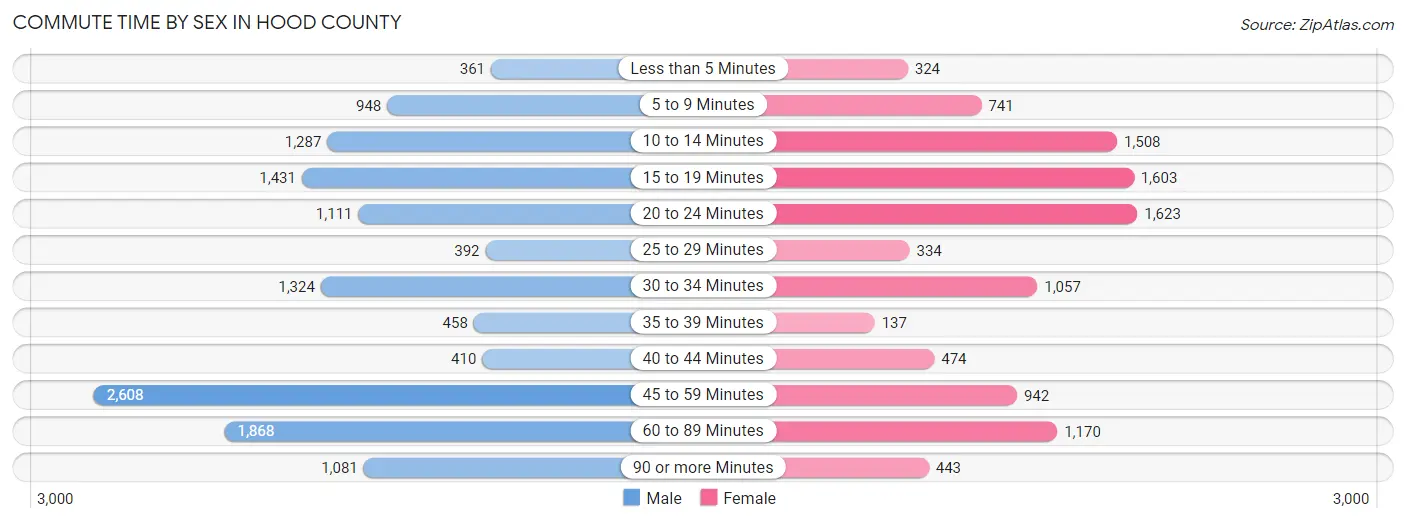
| Commute Time | Male | Female |
| Less than 5 Minutes | 361 (2.7%) | 324 (3.1%) |
| 5 to 9 Minutes | 948 (7.1%) | 741 (7.2%) |
| 10 to 14 Minutes | 1,287 (9.7%) | 1,508 (14.6%) |
| 15 to 19 Minutes | 1,431 (10.8%) | 1,603 (15.5%) |
| 20 to 24 Minutes | 1,111 (8.4%) | 1,623 (15.7%) |
| 25 to 29 Minutes | 392 (2.9%) | 334 (3.2%) |
| 30 to 34 Minutes | 1,324 (10.0%) | 1,057 (10.2%) |
| 35 to 39 Minutes | 458 (3.5%) | 137 (1.3%) |
| 40 to 44 Minutes | 410 (3.1%) | 474 (4.6%) |
| 45 to 59 Minutes | 2,608 (19.6%) | 942 (9.1%) |
| 60 to 89 Minutes | 1,868 (14.1%) | 1,170 (11.3%) |
| 90 or more Minutes | 1,081 (8.1%) | 443 (4.3%) |
Time of Departure to Work by Sex in Hood County
The most frequent times of departure to work in Hood County are 7:00 AM to 7:29 AM (2,854, 21.5%) for males and 7:30 AM to 7:59 AM (2,328, 22.5%) for females.
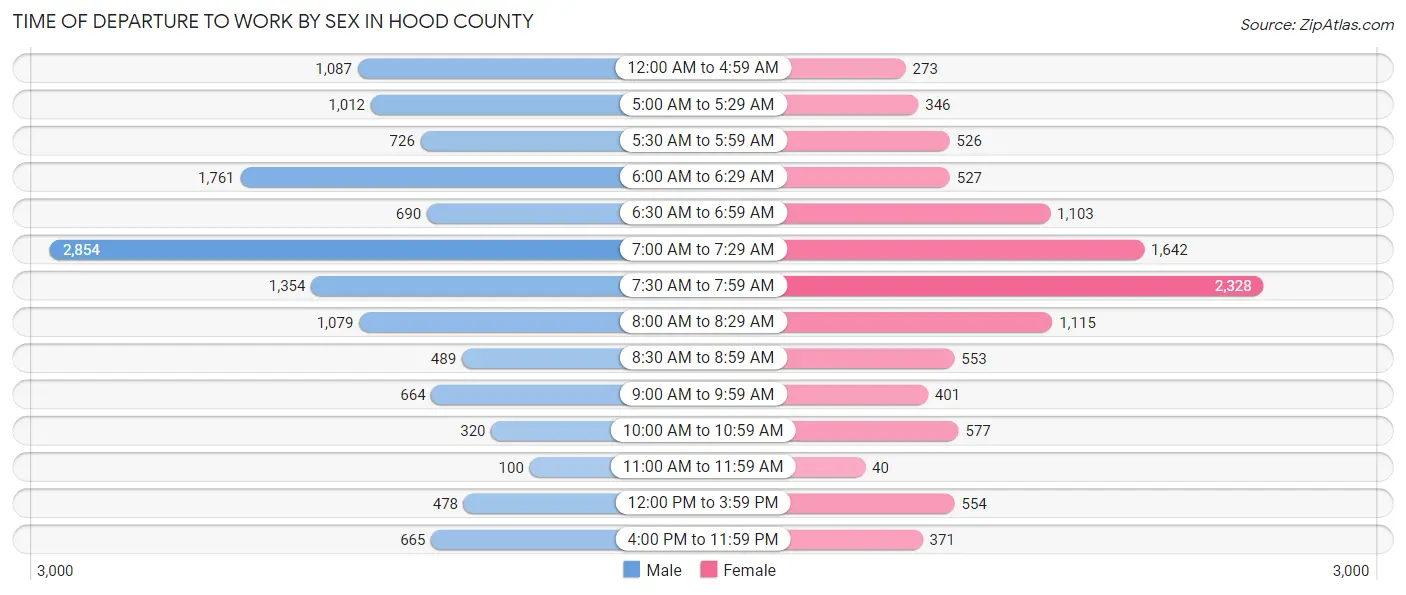
| Time of Departure | Male | Female |
| 12:00 AM to 4:59 AM | 1,087 (8.2%) | 273 (2.6%) |
| 5:00 AM to 5:29 AM | 1,012 (7.6%) | 346 (3.3%) |
| 5:30 AM to 5:59 AM | 726 (5.5%) | 526 (5.1%) |
| 6:00 AM to 6:29 AM | 1,761 (13.3%) | 527 (5.1%) |
| 6:30 AM to 6:59 AM | 690 (5.2%) | 1,103 (10.6%) |
| 7:00 AM to 7:29 AM | 2,854 (21.5%) | 1,642 (15.9%) |
| 7:30 AM to 7:59 AM | 1,354 (10.2%) | 2,328 (22.5%) |
| 8:00 AM to 8:29 AM | 1,079 (8.1%) | 1,115 (10.8%) |
| 8:30 AM to 8:59 AM | 489 (3.7%) | 553 (5.3%) |
| 9:00 AM to 9:59 AM | 664 (5.0%) | 401 (3.9%) |
| 10:00 AM to 10:59 AM | 320 (2.4%) | 577 (5.6%) |
| 11:00 AM to 11:59 AM | 100 (0.7%) | 40 (0.4%) |
| 12:00 PM to 3:59 PM | 478 (3.6%) | 554 (5.3%) |
| 4:00 PM to 11:59 PM | 665 (5.0%) | 371 (3.6%) |
| Total | 13,279 (100.0%) | 10,356 (100.0%) |
Housing Occupancy in Hood County
Occupancy by Ownership in Hood County
Of the total 24,734 dwellings in Hood County, owner-occupied units account for 19,879 (80.4%), while renter-occupied units make up 4,855 (19.6%).
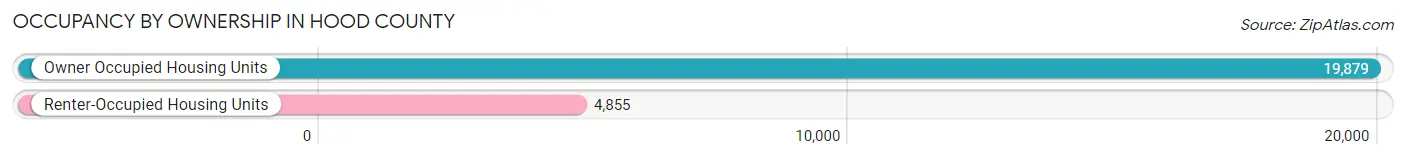
| Occupancy | # Housing Units | % Housing Units |
| Owner Occupied Housing Units | 19,879 | 80.4% |
| Renter-Occupied Housing Units | 4,855 | 19.6% |
| Total Occupied Housing Units | 24,734 | 100.0% |
Occupancy by Household Size in Hood County
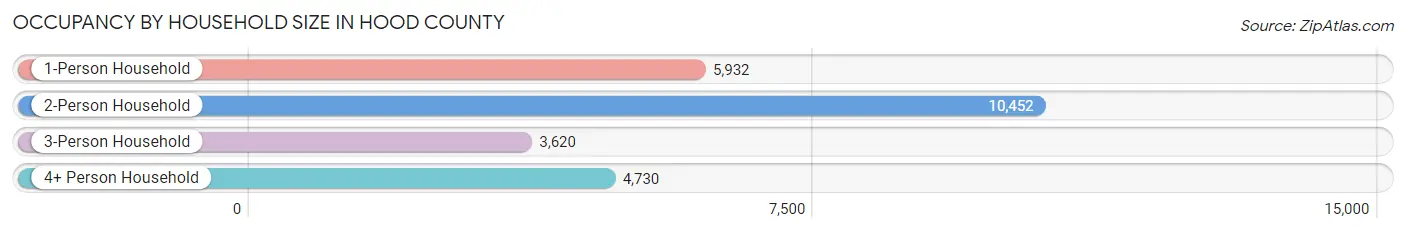
| Household Size | # Housing Units | % Housing Units |
| 1-Person Household | 5,932 | 24.0% |
| 2-Person Household | 10,452 | 42.3% |
| 3-Person Household | 3,620 | 14.6% |
| 4+ Person Household | 4,730 | 19.1% |
| Total Housing Units | 24,734 | 100.0% |
Occupancy by Ownership by Household Size in Hood County
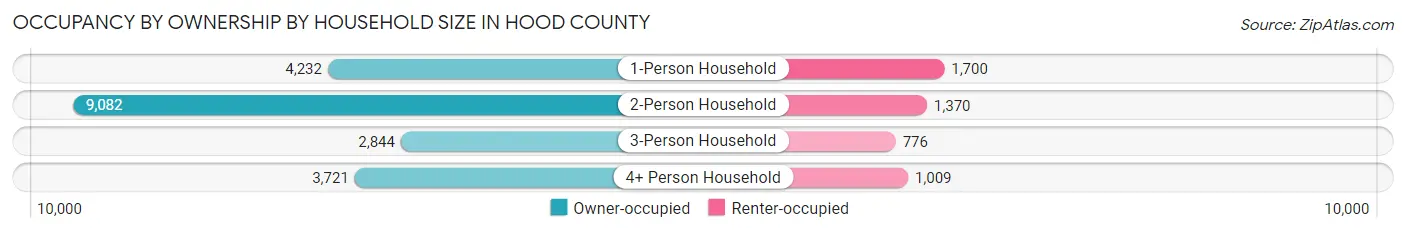
| Household Size | Owner-occupied | Renter-occupied |
| 1-Person Household | 4,232 (71.3%) | 1,700 (28.7%) |
| 2-Person Household | 9,082 (86.9%) | 1,370 (13.1%) |
| 3-Person Household | 2,844 (78.6%) | 776 (21.4%) |
| 4+ Person Household | 3,721 (78.7%) | 1,009 (21.3%) |
| Total Housing Units | 19,879 (80.4%) | 4,855 (19.6%) |
Occupancy by Educational Attainment in Hood County
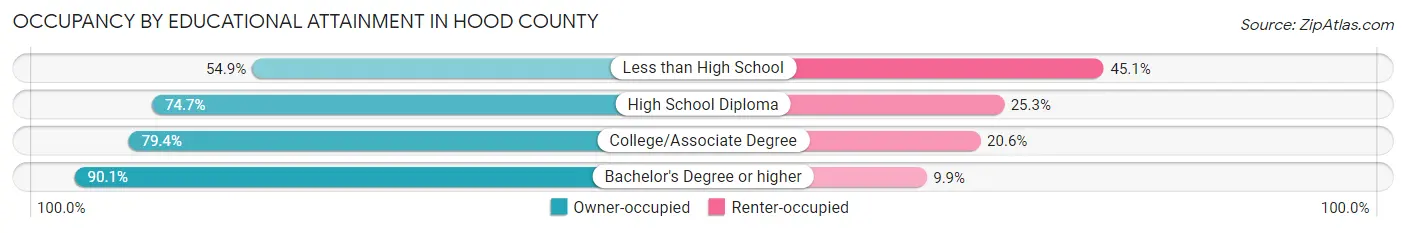
| Household Size | Owner-occupied | Renter-occupied |
| Less than High School | 782 (54.9%) | 642 (45.1%) |
| High School Diploma | 4,906 (74.7%) | 1,661 (25.3%) |
| College/Associate Degree | 6,605 (79.4%) | 1,716 (20.6%) |
| Bachelor's Degree or higher | 7,586 (90.1%) | 836 (9.9%) |
Occupancy by Age of Householder in Hood County
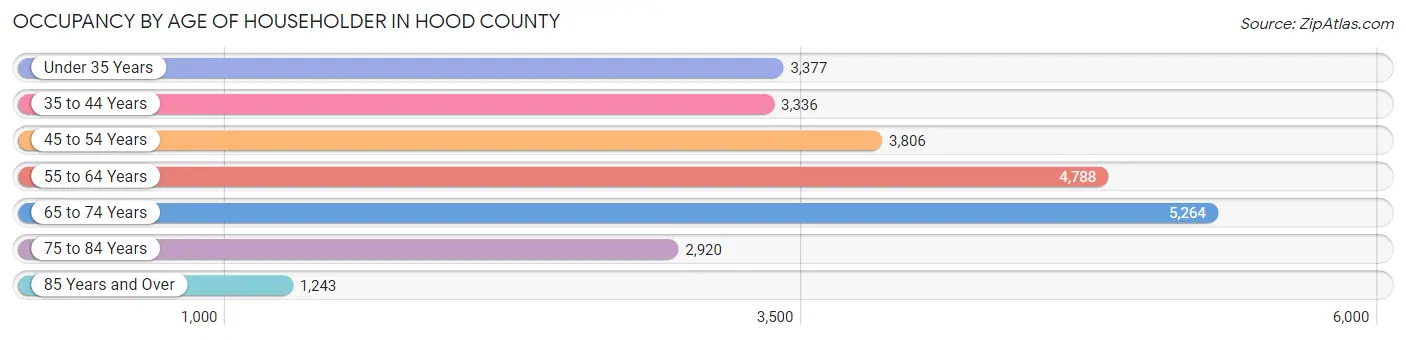
| Age Bracket | # Households | % Households |
| Under 35 Years | 3,377 | 13.7% |
| 35 to 44 Years | 3,336 | 13.5% |
| 45 to 54 Years | 3,806 | 15.4% |
| 55 to 64 Years | 4,788 | 19.4% |
| 65 to 74 Years | 5,264 | 21.3% |
| 75 to 84 Years | 2,920 | 11.8% |
| 85 Years and Over | 1,243 | 5.0% |
| Total | 24,734 | 100.0% |
Housing Finances in Hood County
Median Income by Occupancy in Hood County
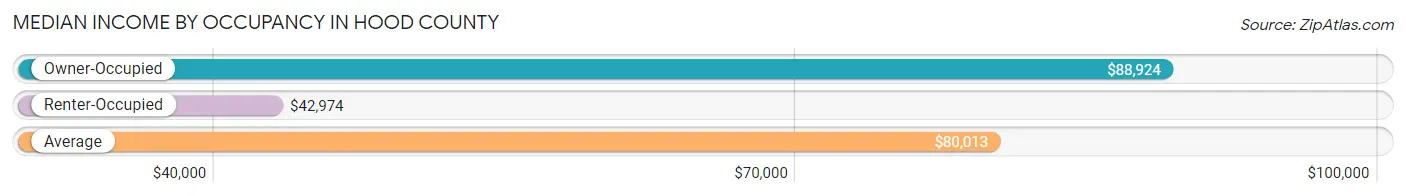
| Occupancy Type | # Households | Median Income |
| Owner-Occupied | 19,879 (80.4%) | $88,924 |
| Renter-Occupied | 4,855 (19.6%) | $42,974 |
| Average | 24,734 (100.0%) | $80,013 |
Occupancy by Householder Income Bracket in Hood County
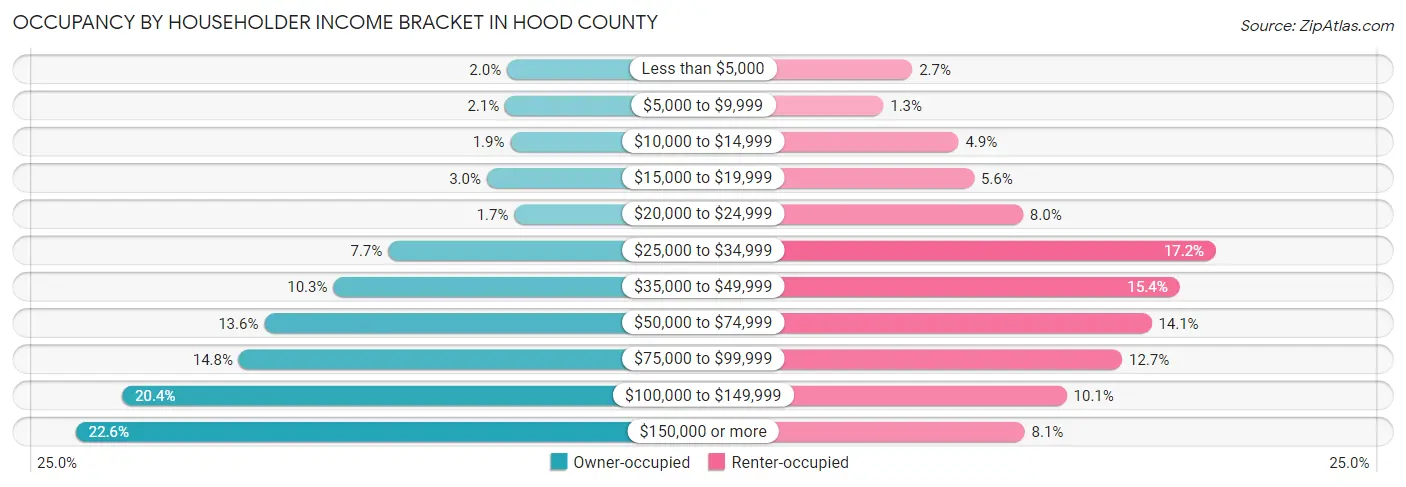
| Income Bracket | Owner-occupied | Renter-occupied |
| Less than $5,000 | 403 (2.0%) | 131 (2.7%) |
| $5,000 to $9,999 | 422 (2.1%) | 64 (1.3%) |
| $10,000 to $14,999 | 371 (1.9%) | 238 (4.9%) |
| $15,000 to $19,999 | 595 (3.0%) | 274 (5.6%) |
| $20,000 to $24,999 | 333 (1.7%) | 387 (8.0%) |
| $25,000 to $34,999 | 1,528 (7.7%) | 833 (17.2%) |
| $35,000 to $49,999 | 2,048 (10.3%) | 749 (15.4%) |
| $50,000 to $74,999 | 2,702 (13.6%) | 684 (14.1%) |
| $75,000 to $99,999 | 2,942 (14.8%) | 616 (12.7%) |
| $100,000 to $149,999 | 4,048 (20.4%) | 488 (10.1%) |
| $150,000 or more | 4,487 (22.6%) | 391 (8.1%) |
| Total | 19,879 (100.0%) | 4,855 (100.0%) |
Monthly Housing Cost Tiers in Hood County
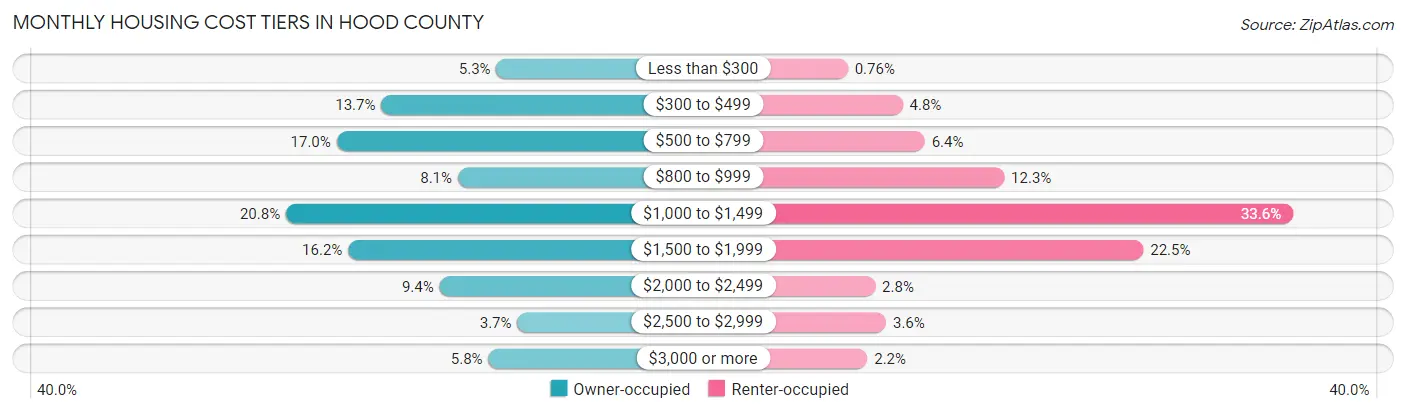
| Monthly Cost | Owner-occupied | Renter-occupied |
| Less than $300 | 1,044 (5.2%) | 37 (0.8%) |
| $300 to $499 | 2,730 (13.7%) | 233 (4.8%) |
| $500 to $799 | 3,383 (17.0%) | 312 (6.4%) |
| $800 to $999 | 1,609 (8.1%) | 596 (12.3%) |
| $1,000 to $1,499 | 4,125 (20.7%) | 1,629 (33.6%) |
| $1,500 to $1,999 | 3,215 (16.2%) | 1,094 (22.5%) |
| $2,000 to $2,499 | 1,876 (9.4%) | 135 (2.8%) |
| $2,500 to $2,999 | 737 (3.7%) | 174 (3.6%) |
| $3,000 or more | 1,160 (5.8%) | 107 (2.2%) |
| Total | 19,879 (100.0%) | 4,855 (100.0%) |
Physical Housing Characteristics in Hood County
Housing Structures in Hood County
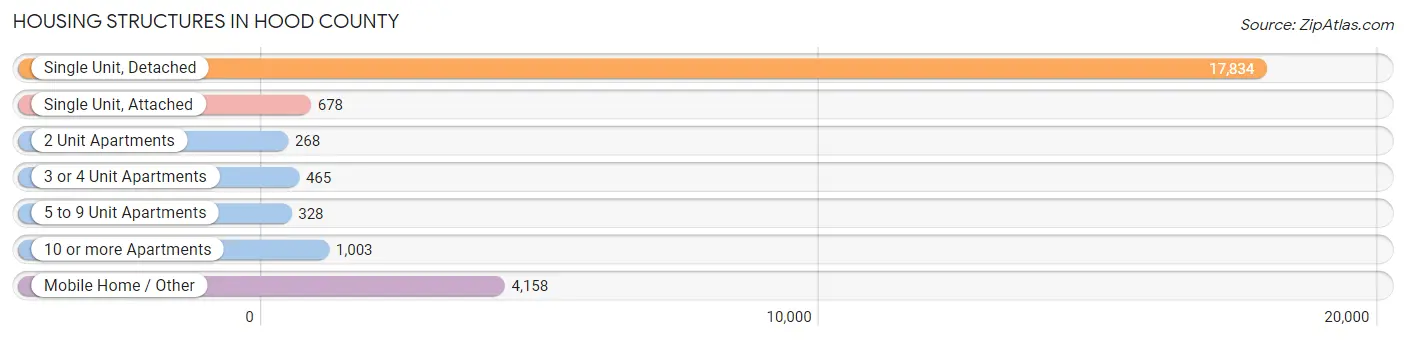
| Structure Type | # Housing Units | % Housing Units |
| Single Unit, Detached | 17,834 | 72.1% |
| Single Unit, Attached | 678 | 2.7% |
| 2 Unit Apartments | 268 | 1.1% |
| 3 or 4 Unit Apartments | 465 | 1.9% |
| 5 to 9 Unit Apartments | 328 | 1.3% |
| 10 or more Apartments | 1,003 | 4.1% |
| Mobile Home / Other | 4,158 | 16.8% |
| Total | 24,734 | 100.0% |
Housing Structures by Occupancy in Hood County
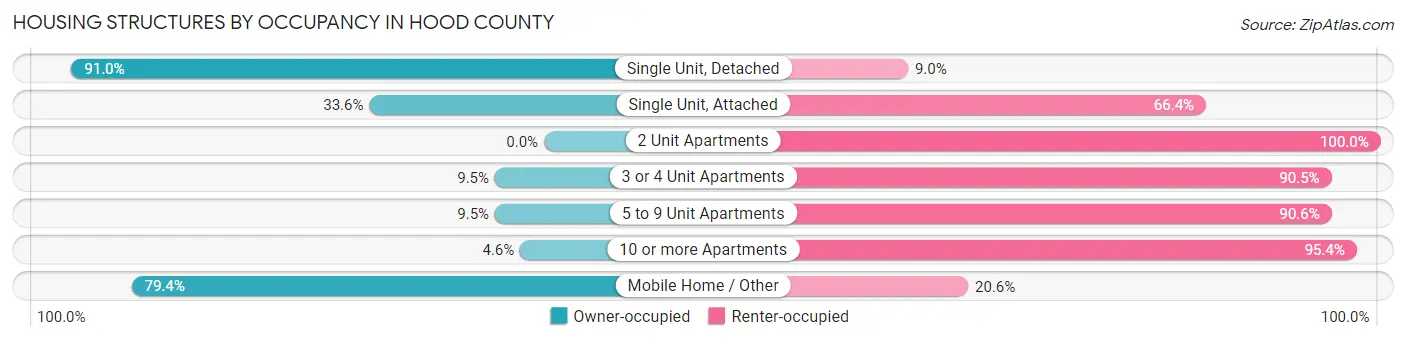
| Structure Type | Owner-occupied | Renter-occupied |
| Single Unit, Detached | 16,228 (91.0%) | 1,606 (9.0%) |
| Single Unit, Attached | 228 (33.6%) | 450 (66.4%) |
| 2 Unit Apartments | 0 (0.0%) | 268 (100.0%) |
| 3 or 4 Unit Apartments | 44 (9.5%) | 421 (90.5%) |
| 5 to 9 Unit Apartments | 31 (9.5%) | 297 (90.5%) |
| 10 or more Apartments | 46 (4.6%) | 957 (95.4%) |
| Mobile Home / Other | 3,302 (79.4%) | 856 (20.6%) |
| Total | 19,879 (80.4%) | 4,855 (19.6%) |
Housing Structures by Number of Rooms in Hood County
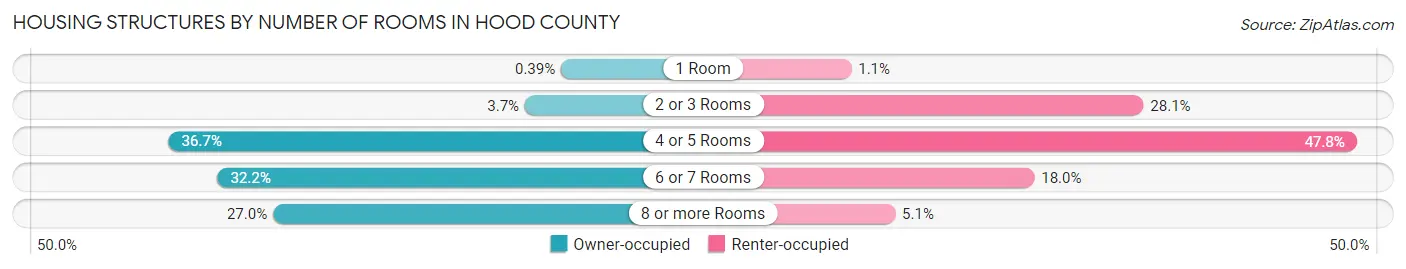
| Number of Rooms | Owner-occupied | Renter-occupied |
| 1 Room | 77 (0.4%) | 51 (1.1%) |
| 2 or 3 Rooms | 741 (3.7%) | 1,363 (28.1%) |
| 4 or 5 Rooms | 7,294 (36.7%) | 2,320 (47.8%) |
| 6 or 7 Rooms | 6,394 (32.2%) | 873 (18.0%) |
| 8 or more Rooms | 5,373 (27.0%) | 248 (5.1%) |
| Total | 19,879 (100.0%) | 4,855 (100.0%) |
Housing Structure by Heating Type in Hood County
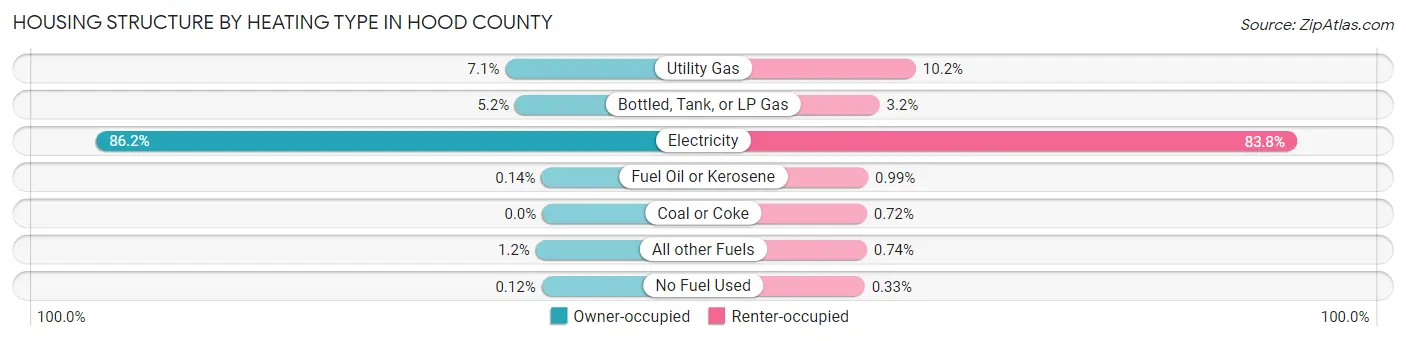
| Heating Type | Owner-occupied | Renter-occupied |
| Utility Gas | 1,416 (7.1%) | 496 (10.2%) |
| Bottled, Tank, or LP Gas | 1,040 (5.2%) | 155 (3.2%) |
| Electricity | 17,125 (86.2%) | 4,069 (83.8%) |
| Fuel Oil or Kerosene | 28 (0.1%) | 48 (1.0%) |
| Coal or Coke | 0 (0.0%) | 35 (0.7%) |
| All other Fuels | 246 (1.2%) | 36 (0.7%) |
| No Fuel Used | 24 (0.1%) | 16 (0.3%) |
| Total | 19,879 (100.0%) | 4,855 (100.0%) |
Household Vehicle Usage in Hood County
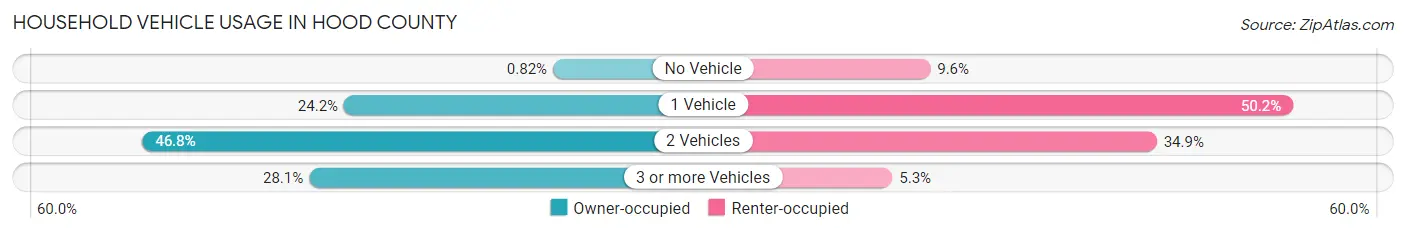
| Vehicles per Household | Owner-occupied | Renter-occupied |
| No Vehicle | 164 (0.8%) | 464 (9.6%) |
| 1 Vehicle | 4,817 (24.2%) | 2,437 (50.2%) |
| 2 Vehicles | 9,305 (46.8%) | 1,696 (34.9%) |
| 3 or more Vehicles | 5,593 (28.1%) | 258 (5.3%) |
| Total | 19,879 (100.0%) | 4,855 (100.0%) |
Real Estate & Mortgages in Hood County
Real Estate and Mortgage Overview in Hood County
| Characteristic | Without Mortgage | With Mortgage |
| Housing Units | 8,879 | 11,000 |
| Median Property Value | $228,700 | $264,000 |
| Median Household Income | $69,470 | $3,077 |
| Monthly Housing Costs | $574 | $1,158 |
| Real Estate Taxes | $2,348 | $253 |
Property Value by Mortgage Status in Hood County
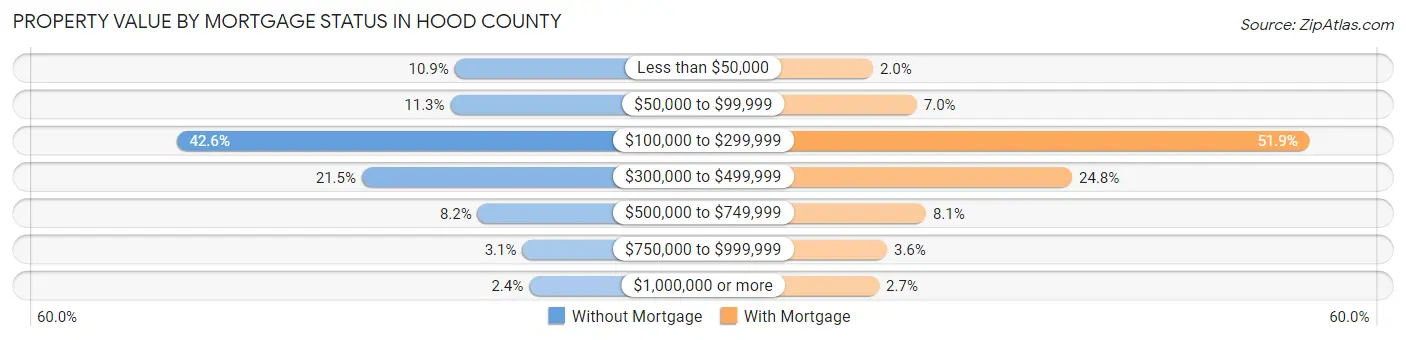
| Property Value | Without Mortgage | With Mortgage |
| Less than $50,000 | 964 (10.9%) | 219 (2.0%) |
| $50,000 to $99,999 | 1,007 (11.3%) | 771 (7.0%) |
| $100,000 to $299,999 | 3,786 (42.6%) | 5,709 (51.9%) |
| $300,000 to $499,999 | 1,905 (21.5%) | 2,723 (24.7%) |
| $500,000 to $749,999 | 731 (8.2%) | 885 (8.1%) |
| $750,000 to $999,999 | 277 (3.1%) | 396 (3.6%) |
| $1,000,000 or more | 209 (2.4%) | 297 (2.7%) |
| Total | 8,879 (100.0%) | 11,000 (100.0%) |
Household Income by Mortgage Status in Hood County
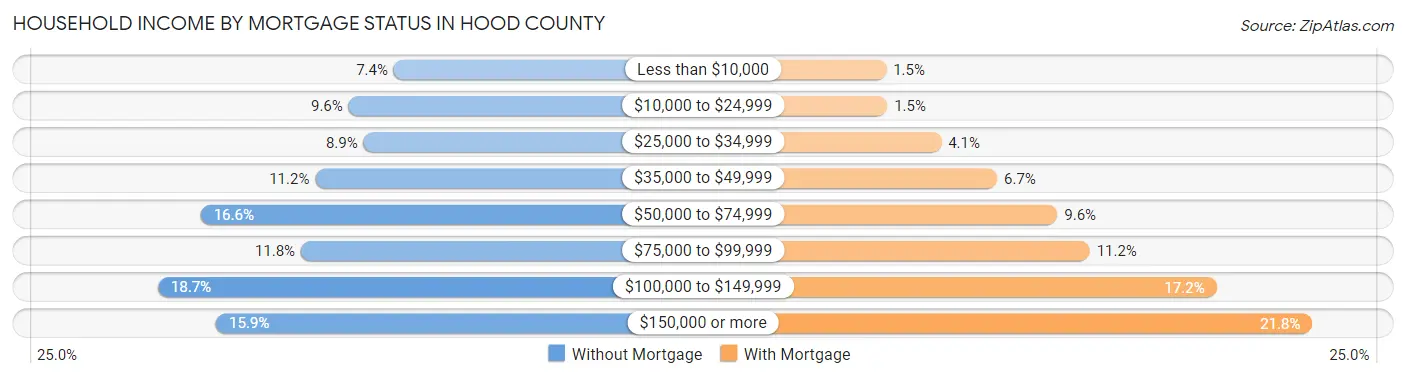
| Household Income | Without Mortgage | With Mortgage |
| Less than $10,000 | 659 (7.4%) | 161 (1.5%) |
| $10,000 to $24,999 | 850 (9.6%) | 166 (1.5%) |
| $25,000 to $34,999 | 787 (8.9%) | 449 (4.1%) |
| $35,000 to $49,999 | 991 (11.2%) | 741 (6.7%) |
| $50,000 to $74,999 | 1,475 (16.6%) | 1,057 (9.6%) |
| $75,000 to $99,999 | 1,051 (11.8%) | 1,227 (11.2%) |
| $100,000 to $149,999 | 1,656 (18.6%) | 1,891 (17.2%) |
| $150,000 or more | 1,410 (15.9%) | 2,392 (21.7%) |
| Total | 8,879 (100.0%) | 11,000 (100.0%) |
Property Value to Household Income Ratio in Hood County
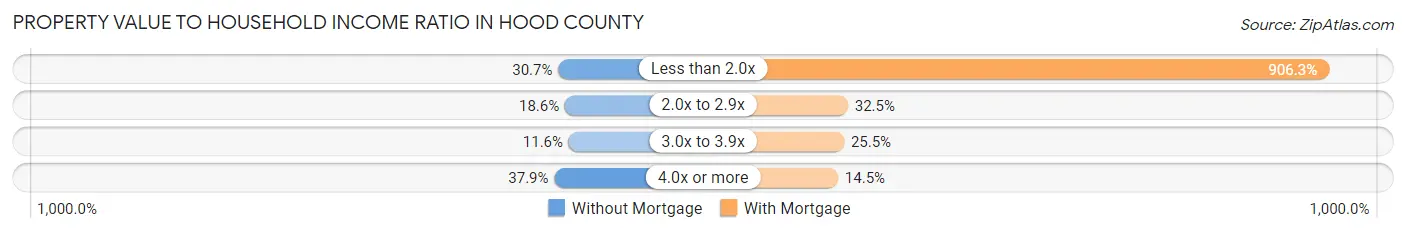
| Value-to-Income Ratio | Without Mortgage | With Mortgage |
| Less than 2.0x | 2,727 (30.7%) | 99,694 (906.3%) |
| 2.0x to 2.9x | 1,647 (18.5%) | 3,574 (32.5%) |
| 3.0x to 3.9x | 1,028 (11.6%) | 2,801 (25.5%) |
| 4.0x or more | 3,364 (37.9%) | 1,593 (14.5%) |
| Total | 8,879 (100.0%) | 11,000 (100.0%) |
Real Estate Taxes by Mortgage Status in Hood County
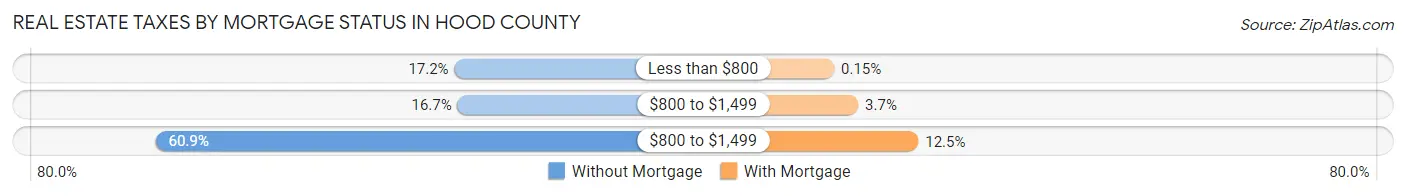
| Property Taxes | Without Mortgage | With Mortgage |
| Less than $800 | 1,526 (17.2%) | 17 (0.2%) |
| $800 to $1,499 | 1,486 (16.7%) | 404 (3.7%) |
| $800 to $1,499 | 5,404 (60.9%) | 1,371 (12.5%) |
| Total | 8,879 (100.0%) | 11,000 (100.0%) |
Health & Disability in Hood County
Health Insurance Coverage by Age in Hood County
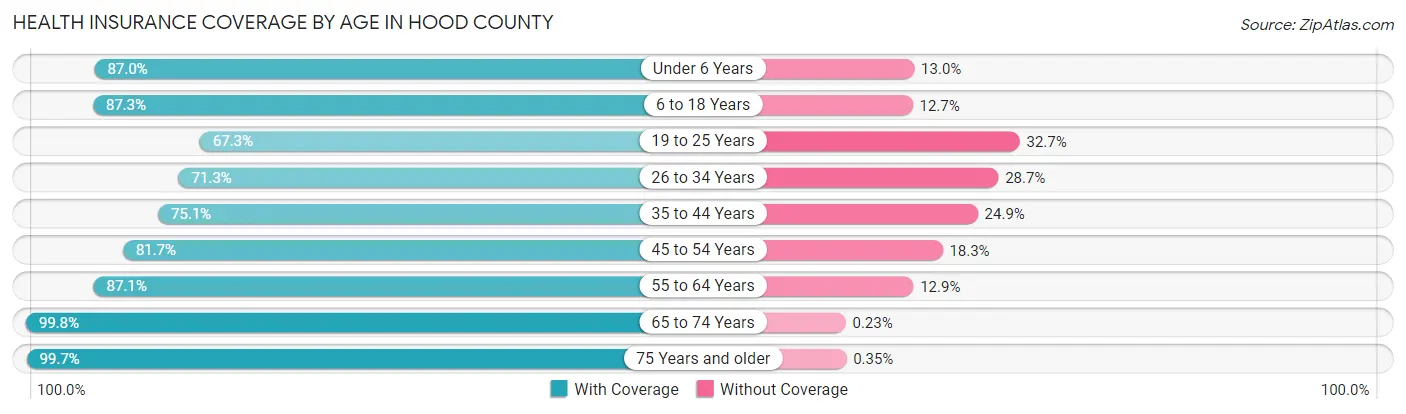
| Age Bracket | With Coverage | Without Coverage |
| Under 6 Years | 3,237 (87.0%) | 485 (13.0%) |
| 6 to 18 Years | 8,611 (87.3%) | 1,255 (12.7%) |
| 19 to 25 Years | 2,898 (67.3%) | 1,407 (32.7%) |
| 26 to 34 Years | 3,878 (71.3%) | 1,561 (28.7%) |
| 35 to 44 Years | 5,017 (75.1%) | 1,661 (24.9%) |
| 45 to 54 Years | 5,754 (81.7%) | 1,289 (18.3%) |
| 55 to 64 Years | 8,103 (87.1%) | 1,196 (12.9%) |
| 65 to 74 Years | 9,013 (99.8%) | 21 (0.2%) |
| 75 Years and older | 6,266 (99.7%) | 22 (0.4%) |
| Total | 52,777 (85.6%) | 8,897 (14.4%) |
Health Insurance Coverage by Citizenship Status in Hood County
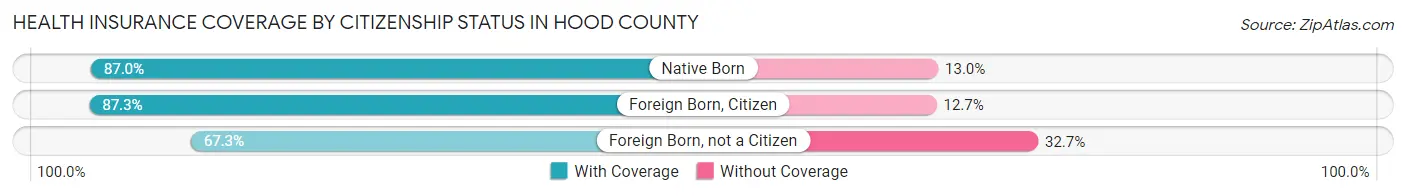
| Citizenship Status | With Coverage | Without Coverage |
| Native Born | 3,237 (87.0%) | 485 (13.0%) |
| Foreign Born, Citizen | 8,611 (87.3%) | 1,255 (12.7%) |
| Foreign Born, not a Citizen | 2,898 (67.3%) | 1,407 (32.7%) |
Health Insurance Coverage by Household Income in Hood County
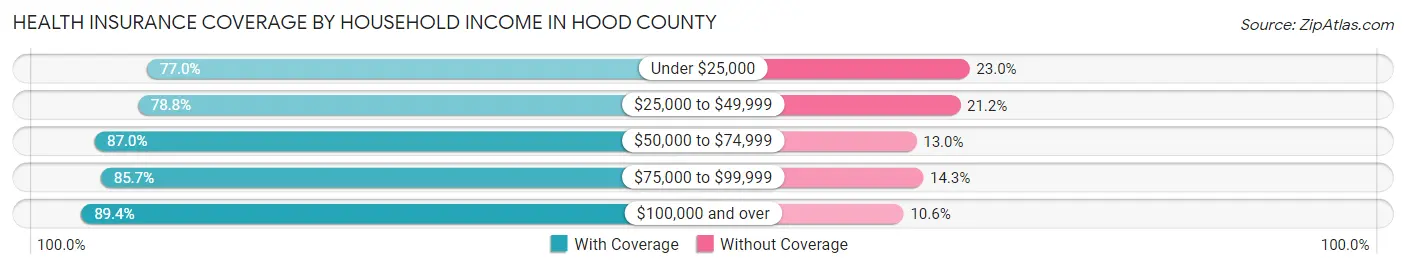
| Household Income | With Coverage | Without Coverage |
| Under $25,000 | 4,286 (77.0%) | 1,278 (23.0%) |
| $25,000 to $49,999 | 8,202 (78.8%) | 2,208 (21.2%) |
| $50,000 to $74,999 | 7,115 (87.0%) | 1,065 (13.0%) |
| $75,000 to $99,999 | 8,047 (85.7%) | 1,341 (14.3%) |
| $100,000 and over | 25,059 (89.4%) | 2,977 (10.6%) |
Public vs Private Health Insurance Coverage by Age in Hood County
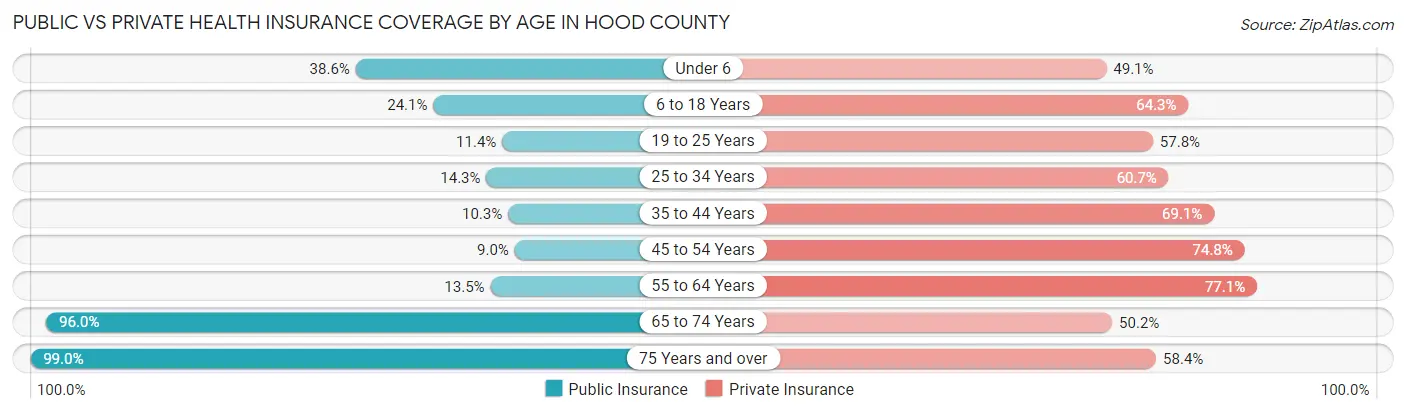
| Age Bracket | Public Insurance | Private Insurance |
| Under 6 | 1,435 (38.6%) | 1,828 (49.1%) |
| 6 to 18 Years | 2,382 (24.1%) | 6,346 (64.3%) |
| 19 to 25 Years | 489 (11.4%) | 2,486 (57.8%) |
| 25 to 34 Years | 777 (14.3%) | 3,300 (60.7%) |
| 35 to 44 Years | 685 (10.3%) | 4,615 (69.1%) |
| 45 to 54 Years | 636 (9.0%) | 5,266 (74.8%) |
| 55 to 64 Years | 1,259 (13.5%) | 7,166 (77.1%) |
| 65 to 74 Years | 8,673 (96.0%) | 4,533 (50.2%) |
| 75 Years and over | 6,222 (99.0%) | 3,669 (58.4%) |
| Total | 22,558 (36.6%) | 39,209 (63.6%) |
Disability Status by Sex by Age in Hood County
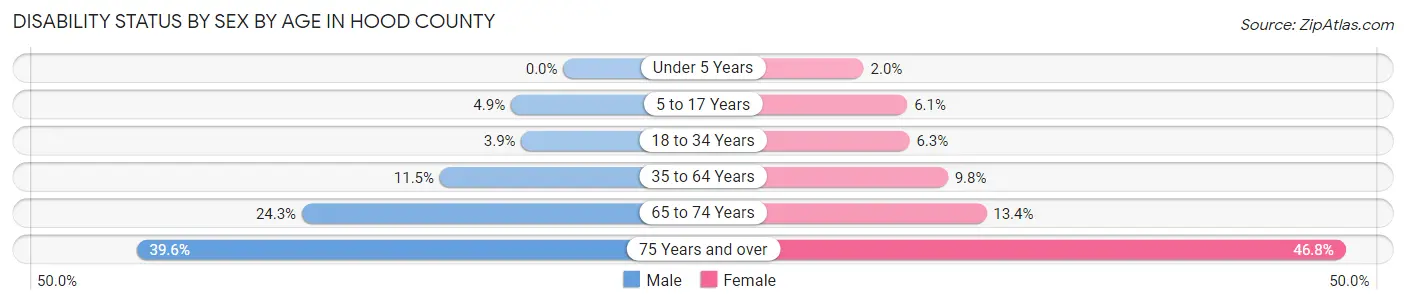
| Age Bracket | Male | Female |
| Under 5 Years | 0 (0.0%) | 38 (2.0%) |
| 5 to 17 Years | 243 (4.9%) | 284 (6.1%) |
| 18 to 34 Years | 198 (3.9%) | 336 (6.3%) |
| 35 to 64 Years | 1,292 (11.5%) | 1,155 (9.8%) |
| 65 to 74 Years | 1,054 (24.3%) | 629 (13.4%) |
| 75 Years and over | 1,131 (39.6%) | 1,605 (46.8%) |
Disability Class by Sex by Age in Hood County
Disability Class: Hearing Difficulty
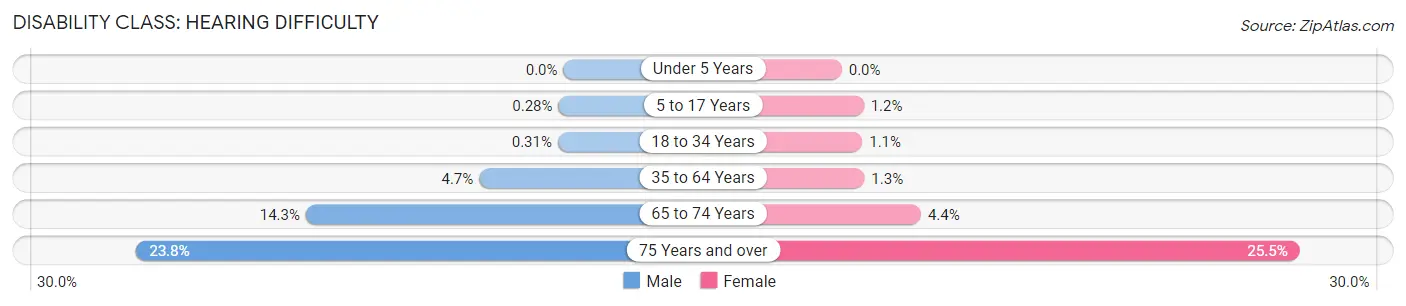
| Age Bracket | Male | Female |
| Under 5 Years | 0 (0.0%) | 0 (0.0%) |
| 5 to 17 Years | 14 (0.3%) | 57 (1.2%) |
| 18 to 34 Years | 16 (0.3%) | 61 (1.1%) |
| 35 to 64 Years | 529 (4.7%) | 148 (1.3%) |
| 65 to 74 Years | 623 (14.3%) | 207 (4.4%) |
| 75 Years and over | 679 (23.8%) | 875 (25.5%) |
Disability Class: Vision Difficulty
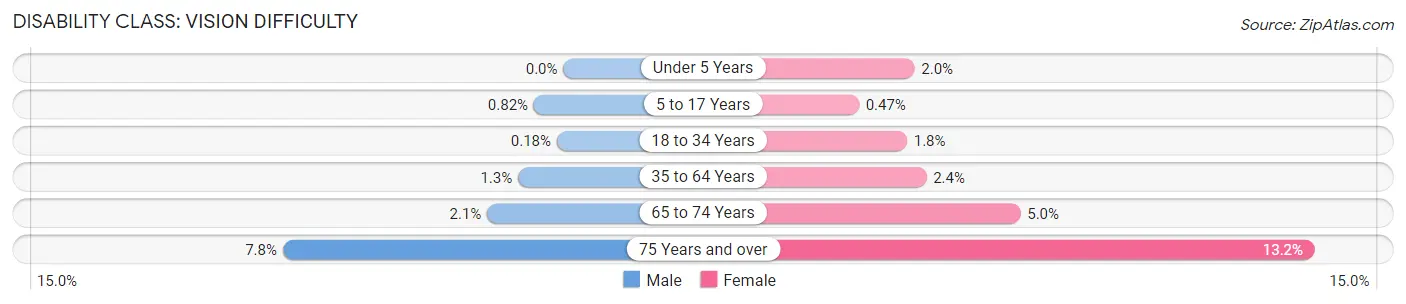
| Age Bracket | Male | Female |
| Under 5 Years | 0 (0.0%) | 38 (2.0%) |
| 5 to 17 Years | 41 (0.8%) | 22 (0.5%) |
| 18 to 34 Years | 9 (0.2%) | 97 (1.8%) |
| 35 to 64 Years | 142 (1.3%) | 276 (2.4%) |
| 65 to 74 Years | 92 (2.1%) | 233 (5.0%) |
| 75 Years and over | 223 (7.8%) | 452 (13.2%) |
Disability Class: Cognitive Difficulty
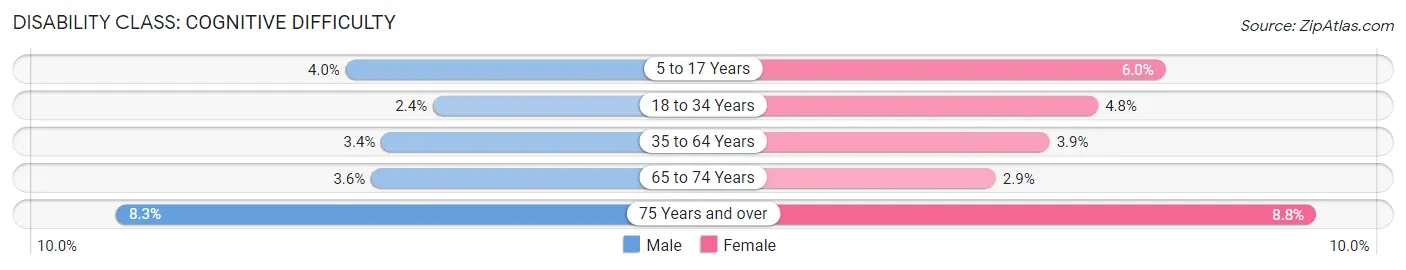
| Age Bracket | Male | Female |
| 5 to 17 Years | 202 (4.0%) | 281 (6.0%) |
| 18 to 34 Years | 123 (2.4%) | 255 (4.8%) |
| 35 to 64 Years | 381 (3.4%) | 453 (3.9%) |
| 65 to 74 Years | 155 (3.6%) | 134 (2.9%) |
| 75 Years and over | 237 (8.3%) | 302 (8.8%) |
Disability Class: Ambulatory Difficulty
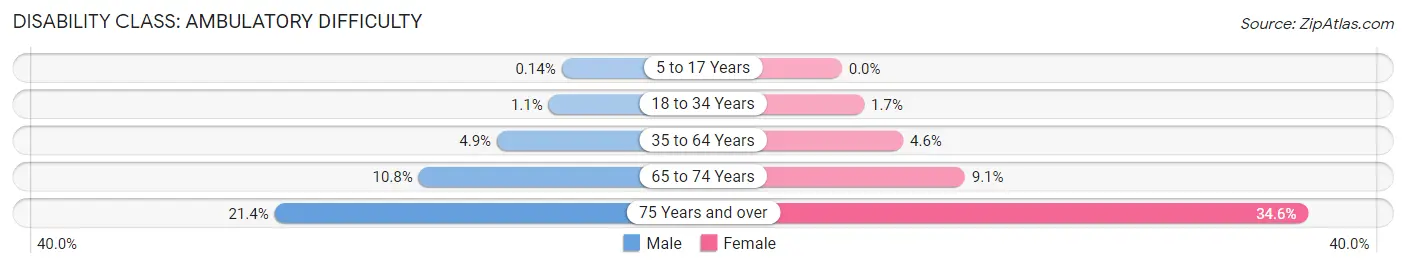
| Age Bracket | Male | Female |
| 5 to 17 Years | 7 (0.1%) | 0 (0.0%) |
| 18 to 34 Years | 56 (1.1%) | 89 (1.7%) |
| 35 to 64 Years | 556 (4.9%) | 534 (4.5%) |
| 65 to 74 Years | 467 (10.7%) | 428 (9.1%) |
| 75 Years and over | 612 (21.4%) | 1,189 (34.6%) |
Disability Class: Self-Care Difficulty
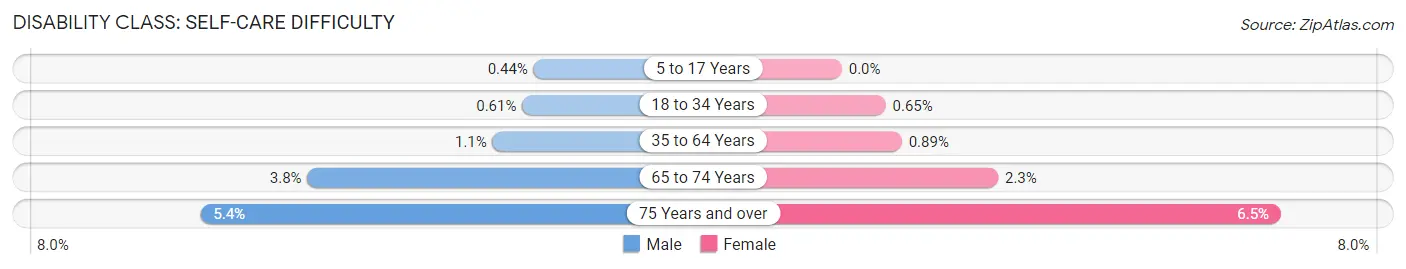
| Age Bracket | Male | Female |
| 5 to 17 Years | 22 (0.4%) | 0 (0.0%) |
| 18 to 34 Years | 31 (0.6%) | 35 (0.6%) |
| 35 to 64 Years | 118 (1.1%) | 105 (0.9%) |
| 65 to 74 Years | 165 (3.8%) | 109 (2.3%) |
| 75 Years and over | 154 (5.4%) | 224 (6.5%) |
Technology Access in Hood County
Computing Device Access in Hood County
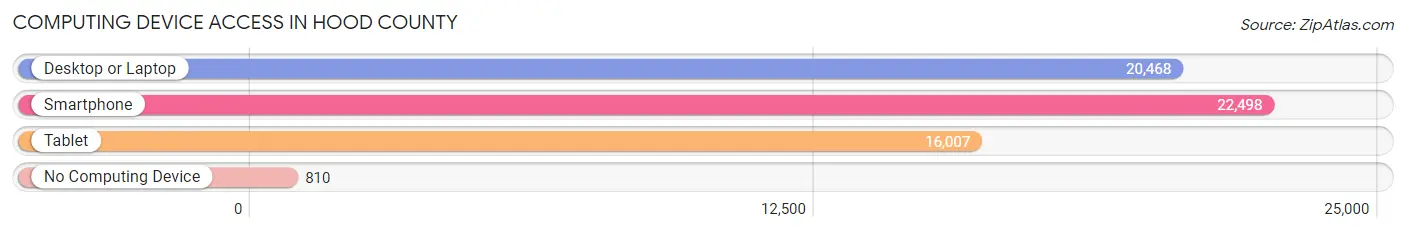
| Device Type | # Households | % Households |
| Desktop or Laptop | 20,468 | 82.8% |
| Smartphone | 22,498 | 91.0% |
| Tablet | 16,007 | 64.7% |
| No Computing Device | 810 | 3.3% |
| Total | 24,734 | 100.0% |
Internet Access in Hood County
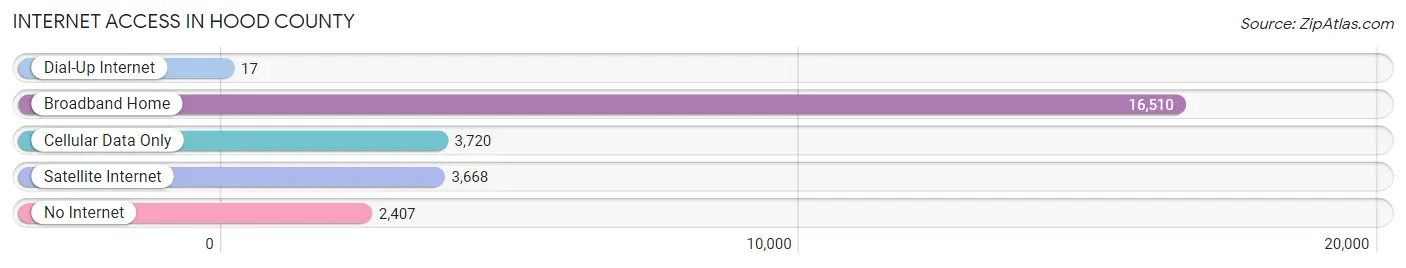
| Internet Type | # Households | % Households |
| Dial-Up Internet | 17 | 0.1% |
| Broadband Home | 16,510 | 66.7% |
| Cellular Data Only | 3,720 | 15.0% |
| Satellite Internet | 3,668 | 14.8% |
| No Internet | 2,407 | 9.7% |
| Total | 24,734 | 100.0% |
Hood County Summary
Hood County is located in the state of Texas, in the United States of America. It is part of the Dallas-Fort Worth-Arlington metropolitan area and is situated in the Cross Timbers region of North Central Texas. The county seat is Granbury, and the county is named after John Bell Hood, a Confederate general in the American Civil War. As of the 2010 census, the population of Hood County was 51,182.
Geography
Hood County is located in the Cross Timbers region of North Central Texas, and is bordered by Johnson County to the north, Somervell County to the east, Erath County to the south, and Parker County to the west. The county covers an area of 545 square miles, of which 543 square miles is land and 2 square miles is water. The county is drained by the Brazos River, which forms its western boundary. The terrain is generally hilly, with elevations ranging from 500 to 1,000 feet above sea level. The highest point in the county is at the summit of Comanche Peak, which rises to 1,845 feet.
Climate
Hood County has a humid subtropical climate, with hot summers and mild winters. The average annual temperature is 64°F, and the average annual precipitation is 33 inches. The wettest month is May, with an average of 4.5 inches of rain, and the driest month is October, with an average of 1.7 inches of rain.
Demographics
As of the 2010 census, there were 51,182 people, 19,845 households, and 14,541 families residing in the county. The population density was 94 people per square mile. The racial makeup of the county was 88.3% White, 4.3% African American, 0.7% Native American, 0.5% Asian, 0.1% Pacific Islander, 4.2% from other races, and 2.0% from two or more races. Hispanic or Latino of any race were 11.2% of the population.
Economy
Hood County has a diversified economy, with a mix of agriculture, manufacturing, and services. The county is home to several large employers, including the Granbury Independent School District, the City of Granbury, and the Hood County Sheriff's Office. The county is also home to several manufacturing companies, including the Granbury Manufacturing Company, which produces a variety of products, including furniture, clothing, and automotive parts.
Agriculture is an important part of the county's economy, with cattle, hay, and wheat being the primary crops. The county is also home to several wineries, including the Granbury Wine Company, which produces a variety of wines.
Tourism is also an important part of the county's economy, with the city of Granbury being a popular destination for visitors. The city is home to several historic sites, including the Granbury Opera House, the Hood County Courthouse, and the Granbury Historic District. The county is also home to several state parks, including Lake Granbury, Lake Whitney, and Dinosaur Valley State Park.
Conclusion
Hood County is a vibrant and diverse county located in the Cross Timbers region of North Central Texas. The county is home to a variety of industries, including agriculture, manufacturing, and services, and is a popular destination for tourists. The county is home to several historic sites, state parks, and wineries, making it a great place to visit and explore.
Common Questions
What is Per Capita Income in Hood County?
Per Capita income in Hood County is $41,729.
What is the Median Family Income in Hood County?
Median Family Income in Hood County is $95,940.
What is the Median Household income in Hood County?
Median Household Income in Hood County is $80,013.
What is Income or Wage Gap in Hood County?
Income or Wage Gap in Hood County is 42.4%.
Women in Hood County earn 57.6 cents for every dollar earned by a man.
What is Inequality or Gini Index in Hood County?
Inequality or Gini Index in Hood County is 0.46.
What is the Total Population of Hood County?
Total Population of Hood County is 62,459.
What is the Total Male Population of Hood County?
Total Male Population of Hood County is 30,357.
What is the Total Female Population of Hood County?
Total Female Population of Hood County is 32,102.
What is the Ratio of Males per 100 Females in Hood County?
There are 94.56 Males per 100 Females in Hood County.
What is the Ratio of Females per 100 Males in Hood County?
There are 105.75 Females per 100 Males in Hood County.
What is the Median Population Age in Hood County?
Median Population Age in Hood County is 46.5 Years.
What is the Average Family Size in Hood County
Average Family Size in Hood County is 2.9 People.
What is the Average Household Size in Hood County
Average Household Size in Hood County is 2.5 People.
How Large is the Labor Force in Hood County?
There are 28,181 People in the Labor Forcein in Hood County.
What is the Percentage of People in the Labor Force in Hood County?
55.2% of People are in the Labor Force in Hood County.
What is the Unemployment Rate in Hood County?
Unemployment Rate in Hood County is 5.8%.