Glasscock County, TX Map & Demographics
Glasscock County Map
Glasscock County Overview
$50,449
PER CAPITA INCOME
$132,945
AVG FAMILY INCOME
$112,188
AVG HOUSEHOLD INCOME
25.3%
WAGE / INCOME GAP [ % ]
74.7¢/ $1
WAGE / INCOME GAP [ $ ]
0.44
INEQUALITY / GINI INDEX
1,068
TOTAL POPULATION
683
MALE POPULATION
385
FEMALE POPULATION
177.40
MALES / 100 FEMALES
56.37
FEMALES / 100 MALES
38.8
MEDIAN AGE
2.9
AVG FAMILY SIZE
2.6
AVG HOUSEHOLD SIZE
469
LABOR FORCE [ PEOPLE ]
55.2%
PERCENT IN LABOR FORCE
1.3%
UNEMPLOYMENT RATE
Glasscock County Area Codes
Income in Glasscock County
Income Overview in Glasscock County
Per Capita Income in Glasscock County is $50,449, while median incomes of families and households are $132,945 and $112,188 respectively.
| Characteristic | Number | Measure |
| Per Capita Income | 1,068 | $50,449 |
| Median Family Income | 341 | $132,945 |
| Mean Family Income | 341 | $152,568 |
| Median Household Income | 415 | $112,188 |
| Mean Household Income | 415 | $133,127 |
| Income Deficit | 341 | $0 |
| Wage / Income Gap (%) | 1,068 | 25.31% |
| Wage / Income Gap ($) | 1,068 | 74.69¢ per $1 |
| Gini / Inequality Index | 1,068 | 0.44 |
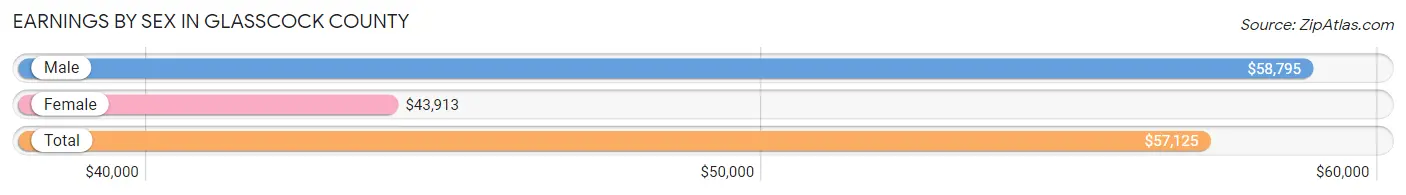
Earnings by Sex in Glasscock County
Average Earnings in Glasscock County are $57,125, $58,795 for men and $43,913 for women, a difference of 25.3%.
| Sex | Number | Average Earnings |
| Male | 381 (72.6%) | $58,795 |
| Female | 144 (27.4%) | $43,913 |
| Total | 525 (100.0%) | $57,125 |
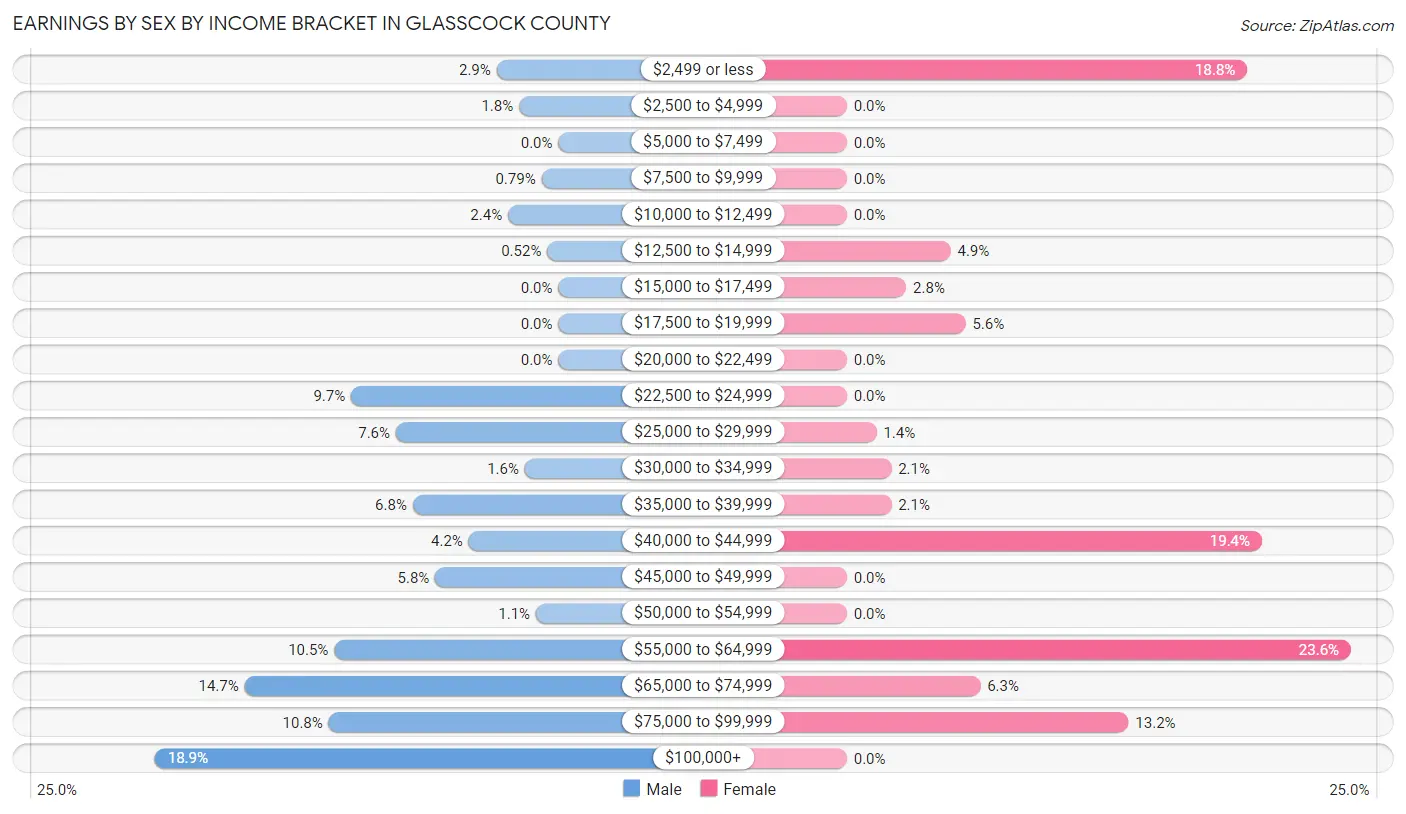
Earnings by Sex by Income Bracket in Glasscock County
The most common earnings brackets in Glasscock County are $100,000+ for men (72 | 18.9%) and $55,000 to $64,999 for women (34 | 23.6%).
| Income | Male | Female |
| $2,499 or less | 11 (2.9%) | 27 (18.8%) |
| $2,500 to $4,999 | 7 (1.8%) | 0 (0.0%) |
| $5,000 to $7,499 | 0 (0.0%) | 0 (0.0%) |
| $7,500 to $9,999 | 3 (0.8%) | 0 (0.0%) |
| $10,000 to $12,499 | 9 (2.4%) | 0 (0.0%) |
| $12,500 to $14,999 | 2 (0.5%) | 7 (4.9%) |
| $15,000 to $17,499 | 0 (0.0%) | 4 (2.8%) |
| $17,500 to $19,999 | 0 (0.0%) | 8 (5.6%) |
| $20,000 to $22,499 | 0 (0.0%) | 0 (0.0%) |
| $22,500 to $24,999 | 37 (9.7%) | 0 (0.0%) |
| $25,000 to $29,999 | 29 (7.6%) | 2 (1.4%) |
| $30,000 to $34,999 | 6 (1.6%) | 3 (2.1%) |
| $35,000 to $39,999 | 26 (6.8%) | 3 (2.1%) |
| $40,000 to $44,999 | 16 (4.2%) | 28 (19.4%) |
| $45,000 to $49,999 | 22 (5.8%) | 0 (0.0%) |
| $50,000 to $54,999 | 4 (1.1%) | 0 (0.0%) |
| $55,000 to $64,999 | 40 (10.5%) | 34 (23.6%) |
| $65,000 to $74,999 | 56 (14.7%) | 9 (6.2%) |
| $75,000 to $99,999 | 41 (10.8%) | 19 (13.2%) |
| $100,000+ | 72 (18.9%) | 0 (0.0%) |
| Total | 381 (100.0%) | 144 (100.0%) |
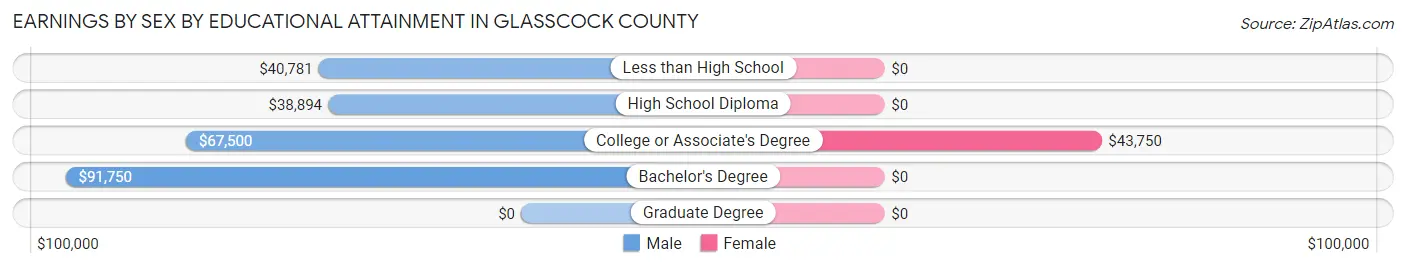
Earnings by Sex by Educational Attainment in Glasscock County
Average earnings in Glasscock County are $65,473 for men and $43,913 for women, a difference of 32.9%. Men with an educational attainment of bachelor's degree enjoy the highest average annual earnings of $91,750, while those with high school diploma education earn the least with $38,894. Women with an educational attainment of college or associate's degree earn the most with the average annual earnings of $43,750, while those with college or associate's degree education have the smallest earnings of $43,750.
| Educational Attainment | Male Income | Female Income |
| Less than High School | $40,781 | $0 |
| High School Diploma | $38,894 | $0 |
| College or Associate's Degree | $67,500 | $43,750 |
| Bachelor's Degree | $91,750 | $0 |
| Graduate Degree | - | - |
| Total | $65,473 | $43,913 |
Family Income in Glasscock County
Family Income Brackets in Glasscock County
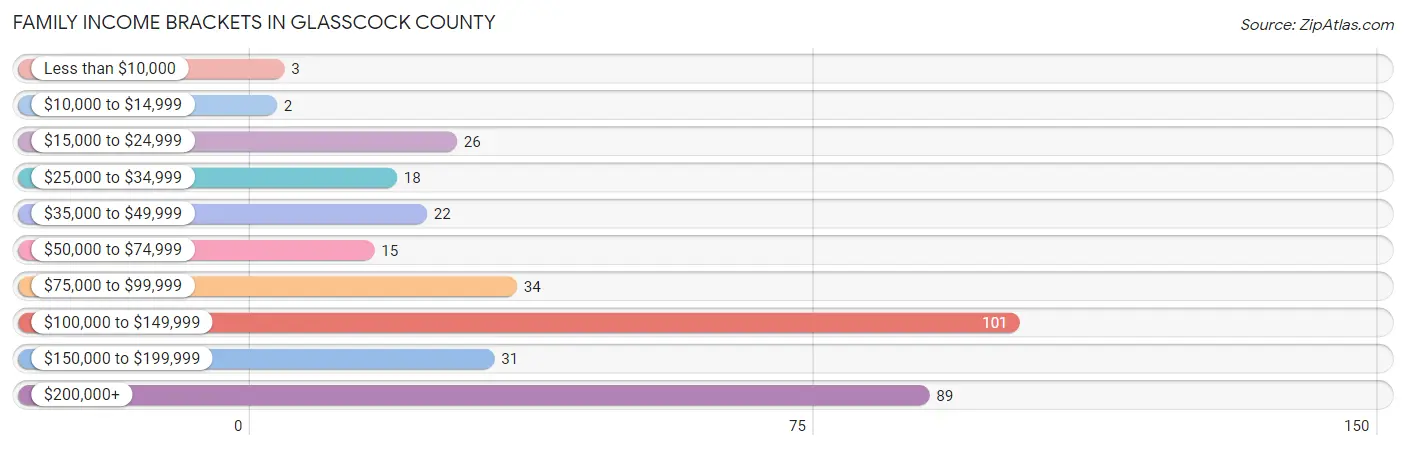
According to the Glasscock County family income data, there are 101 families falling into the $100,000 to $149,999 income range, which is the most common income bracket and makes up 29.6% of all families. Conversely, the $10,000 to $14,999 income bracket is the least frequent group with only 2 families (0.6%) belonging to this category.
| Income Bracket | # Families | % Families |
| Less than $10,000 | 3 | 0.9% |
| $10,000 to $14,999 | 2 | 0.6% |
| $15,000 to $24,999 | 26 | 7.6% |
| $25,000 to $34,999 | 18 | 5.3% |
| $35,000 to $49,999 | 22 | 6.5% |
| $50,000 to $74,999 | 15 | 4.4% |
| $75,000 to $99,999 | 34 | 10.0% |
| $100,000 to $149,999 | 101 | 29.6% |
| $150,000 to $199,999 | 31 | 9.1% |
| $200,000+ | 89 | 26.1% |
Family Income by Famaliy Size in Glasscock County
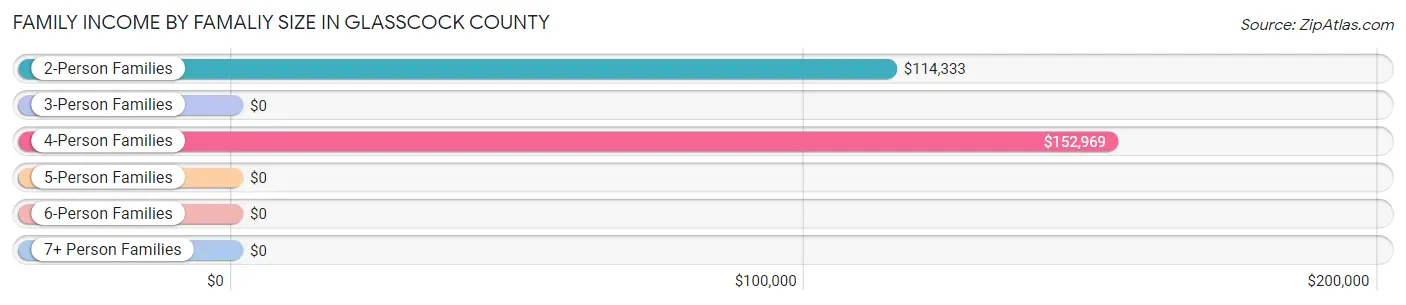
4-person families (23 | 6.7%) account for the highest median family income in Glasscock County with $152,969 per family, while 2-person families (188 | 55.1%) have the highest median income of $57,166 per family member.
| Income Bracket | # Families | Median Income |
| 2-Person Families | 188 (55.1%) | $114,333 |
| 3-Person Families | 66 (19.4%) | $0 |
| 4-Person Families | 23 (6.7%) | $152,969 |
| 5-Person Families | 6 (1.8%) | $0 |
| 6-Person Families | 9 (2.6%) | $0 |
| 7+ Person Families | 49 (14.4%) | $0 |
| Total | 341 (100.0%) | $132,945 |
Family Income by Number of Earners in Glasscock County
| Number of Earners | # Families | Median Income |
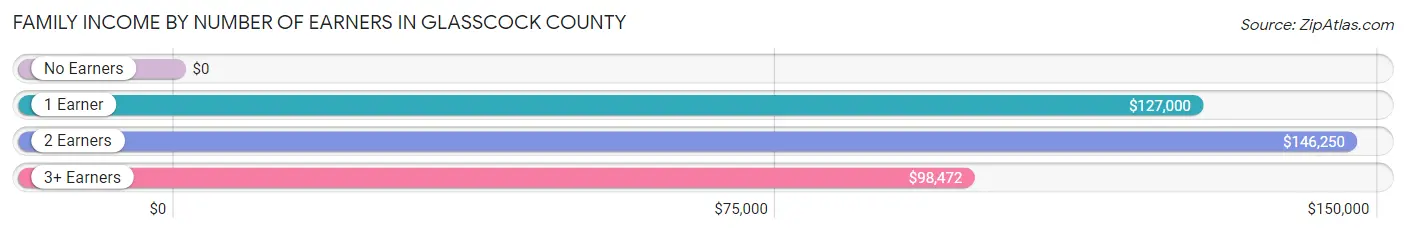
| No Earners | 46 (13.5%) | $0 |
| 1 Earner | 170 (49.8%) | $127,000 |
| 2 Earners | 90 (26.4%) | $146,250 |
| 3+ Earners | 35 (10.3%) | $98,472 |
| Total | 341 (100.0%) | $132,945 |
Household Income in Glasscock County
Household Income Brackets in Glasscock County
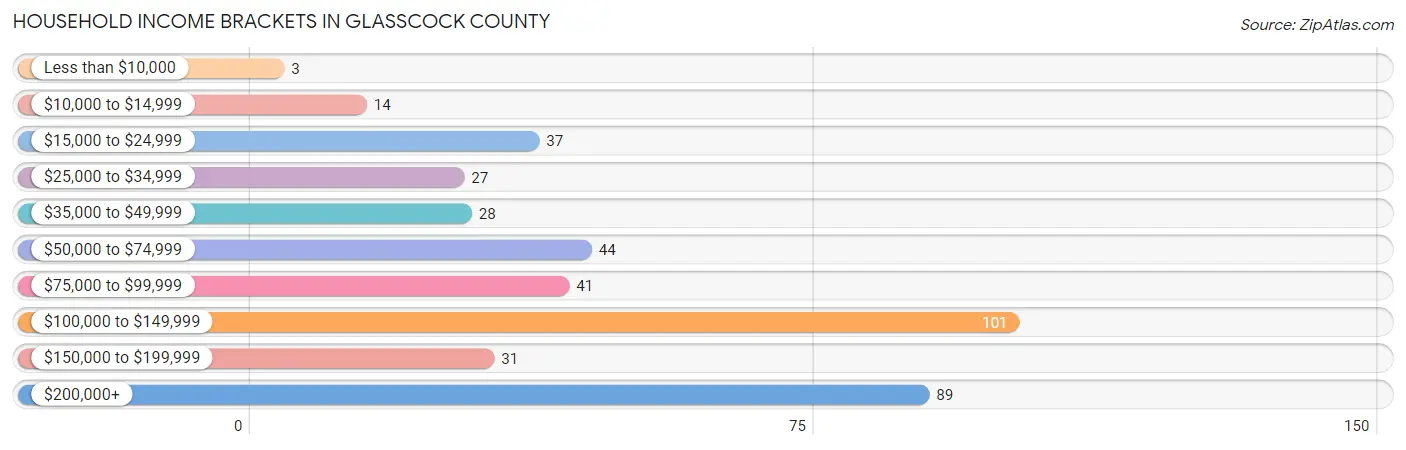
With 101 households falling in the category, the $100,000 to $149,999 income range is the most frequent in Glasscock County, accounting for 24.3% of all households. In contrast, only 3 households (0.7%) fall into the less than $10,000 income bracket, making it the least populous group.
| Income Bracket | # Households | % Households |
| Less than $10,000 | 3 | 0.7% |
| $10,000 to $14,999 | 14 | 3.4% |
| $15,000 to $24,999 | 37 | 8.9% |
| $25,000 to $34,999 | 27 | 6.5% |
| $35,000 to $49,999 | 28 | 6.7% |
| $50,000 to $74,999 | 44 | 10.6% |
| $75,000 to $99,999 | 41 | 9.9% |
| $100,000 to $149,999 | 101 | 24.3% |
| $150,000 to $199,999 | 31 | 7.5% |
| $200,000+ | 89 | 21.4% |
Household Income by Householder Age in Glasscock County
The median household income in Glasscock County is $112,188, with the highest median household income of $134,089 found in the 25 to 44 years age bracket for the primary householder. A total of 141 households (34.0%) fall into this category. Meanwhile, the 15 to 24 years age bracket for the primary householder has the lowest median household income of $0, with 11 households (2.6%) in this group.
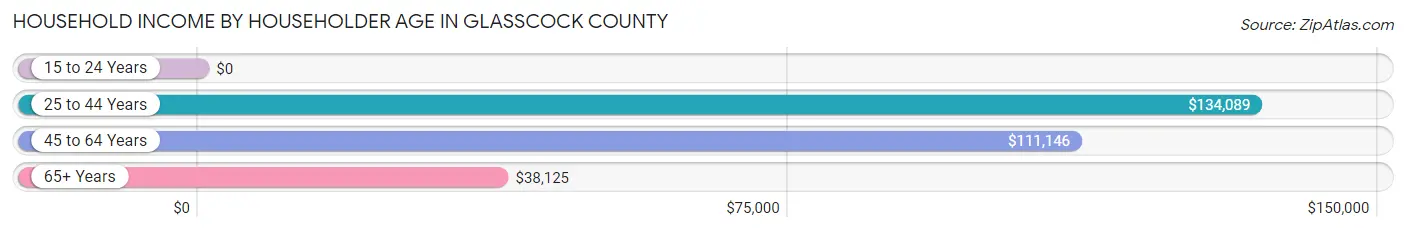
| Income Bracket | # Households | Median Income |
| 15 to 24 Years | 11 (2.6%) | $0 |
| 25 to 44 Years | 141 (34.0%) | $134,089 |
| 45 to 64 Years | 171 (41.2%) | $111,146 |
| 65+ Years | 92 (22.2%) | $38,125 |
| Total | 415 (100.0%) | $112,188 |
Poverty in Glasscock County
Income Below Poverty by Sex and Age in Glasscock County
With 2.6% poverty level for males and 9.9% for females among the residents of Glasscock County, 16 and 17 year old males and 65 to 74 year old females are the most vulnerable to poverty, with 8 males (17.0%) and 12 females (50.0%) in their respective age groups living below the poverty level.
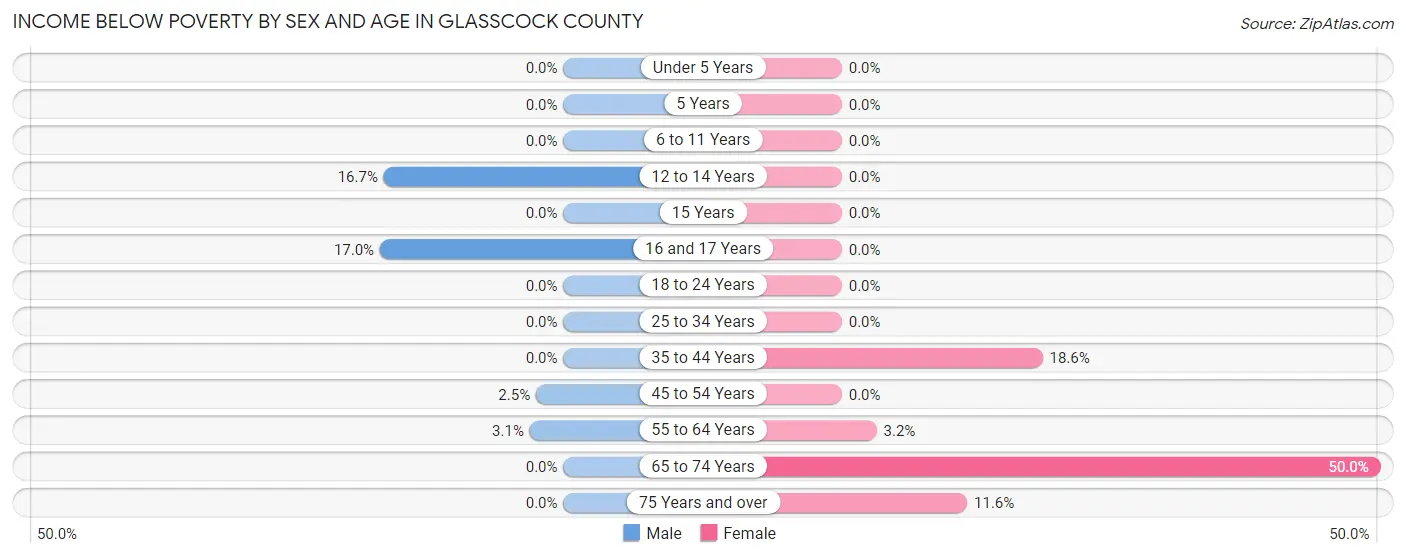
| Age Bracket | Male | Female |
| Under 5 Years | 0 (0.0%) | 0 (0.0%) |
| 5 Years | 0 (0.0%) | 0 (0.0%) |
| 6 to 11 Years | 0 (0.0%) | 0 (0.0%) |
| 12 to 14 Years | 5 (16.7%) | 0 (0.0%) |
| 15 Years | 0 (0.0%) | 0 (0.0%) |
| 16 and 17 Years | 8 (17.0%) | 0 (0.0%) |
| 18 to 24 Years | 0 (0.0%) | 0 (0.0%) |
| 25 to 34 Years | 0 (0.0%) | 0 (0.0%) |
| 35 to 44 Years | 0 (0.0%) | 19 (18.6%) |
| 45 to 54 Years | 3 (2.5%) | 0 (0.0%) |
| 55 to 64 Years | 2 (3.1%) | 2 (3.2%) |
| 65 to 74 Years | 0 (0.0%) | 12 (50.0%) |
| 75 Years and over | 0 (0.0%) | 5 (11.6%) |
| Total | 18 (2.6%) | 38 (9.9%) |
Income Above Poverty by Sex and Age in Glasscock County
According to the poverty statistics in Glasscock County, males aged under 5 years and females aged under 5 years are the age groups that are most secure financially, with 100.0% of males and 100.0% of females in these age groups living above the poverty line.
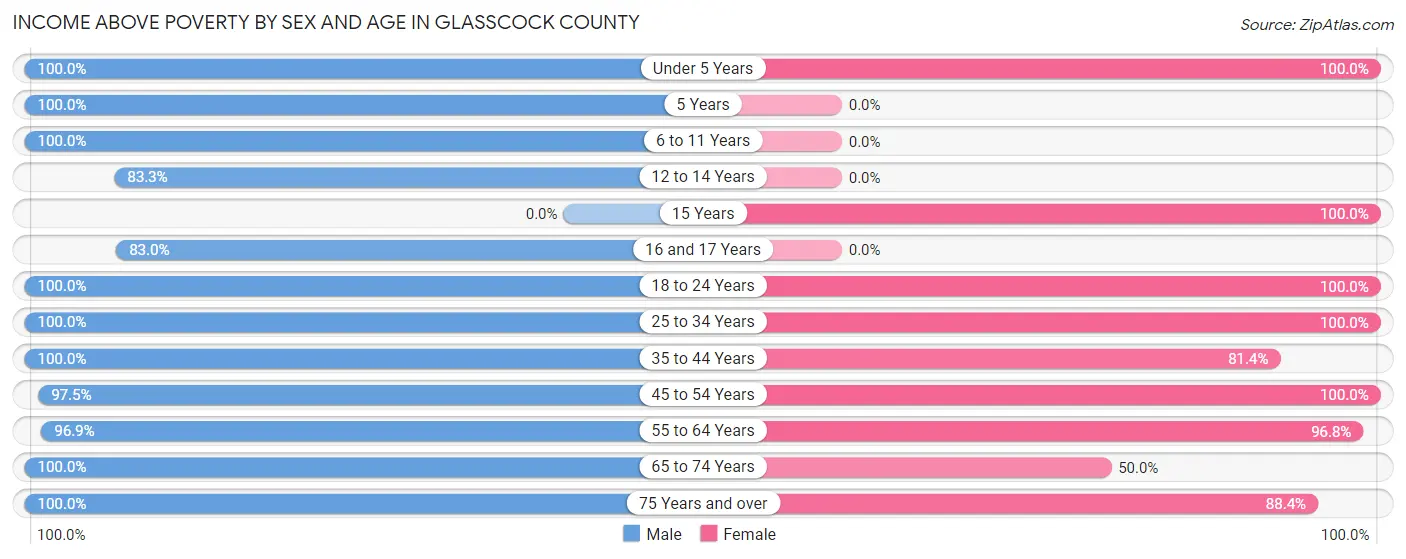
| Age Bracket | Male | Female |
| Under 5 Years | 46 (100.0%) | 30 (100.0%) |
| 5 Years | 37 (100.0%) | 0 (0.0%) |
| 6 to 11 Years | 68 (100.0%) | 0 (0.0%) |
| 12 to 14 Years | 25 (83.3%) | 0 (0.0%) |
| 15 Years | 0 (0.0%) | 7 (100.0%) |
| 16 and 17 Years | 39 (83.0%) | 0 (0.0%) |
| 18 to 24 Years | 42 (100.0%) | 22 (100.0%) |
| 25 to 34 Years | 83 (100.0%) | 43 (100.0%) |
| 35 to 44 Years | 79 (100.0%) | 83 (81.4%) |
| 45 to 54 Years | 115 (97.5%) | 52 (100.0%) |
| 55 to 64 Years | 62 (96.9%) | 60 (96.8%) |
| 65 to 74 Years | 17 (100.0%) | 12 (50.0%) |
| 75 Years and over | 52 (100.0%) | 38 (88.4%) |
| Total | 665 (97.4%) | 347 (90.1%) |
Income Below Poverty Among Married-Couple Families in Glasscock County
The poverty statistics for married-couple families in Glasscock County show that 1.6% or 5 of the total 305 families live below the poverty line. Families with 1 or 2 children have the highest poverty rate of 4.7%, comprising of 3 families. On the other hand, families with 3 or 4 children have the lowest poverty rate of 0.0%, which includes 0 families.
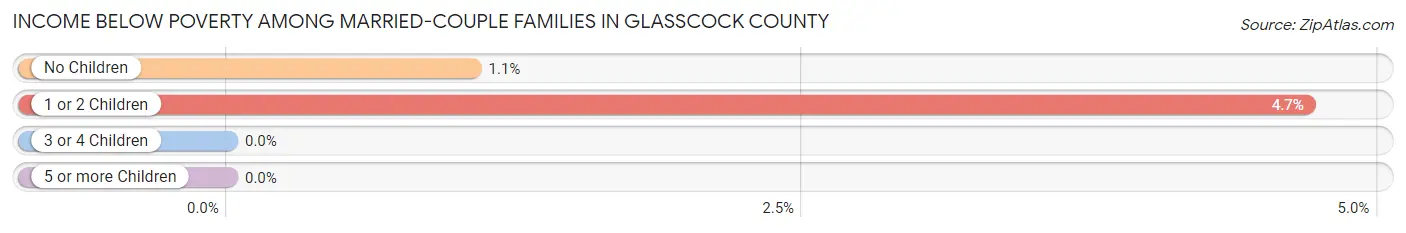
| Children | Above Poverty | Below Poverty |
| No Children | 187 (98.9%) | 2 (1.1%) |
| 1 or 2 Children | 61 (95.3%) | 3 (4.7%) |
| 3 or 4 Children | 15 (100.0%) | 0 (0.0%) |
| 5 or more Children | 37 (100.0%) | 0 (0.0%) |
| Total | 300 (98.4%) | 5 (1.6%) |
Income Below Poverty Among Single-Parent Households in Glasscock County
| Children | Single Father | Single Mother |
| No Children | 0 (0.0%) | 0 (0.0%) |
| 1 or 2 Children | 0 (0.0%) | 0 (0.0%) |
| 3 or 4 Children | 0 (0.0%) | 0 (0.0%) |
| 5 or more Children | 0 (0.0%) | 0 (0.0%) |
| Total | 0 (0.0%) | 0 (0.0%) |
Income Below Poverty Among Married-Couple vs Single-Parent Households in Glasscock County
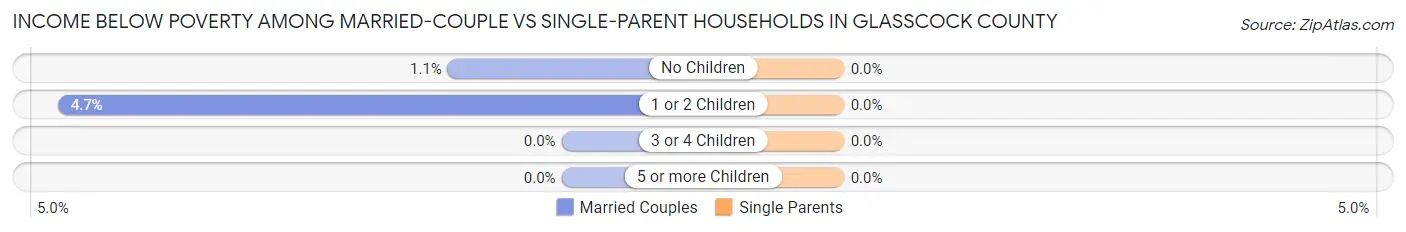
| Children | Married-Couple Families | Single-Parent Households |
| No Children | 2 (1.1%) | 0 (0.0%) |
| 1 or 2 Children | 3 (4.7%) | 0 (0.0%) |
| 3 or 4 Children | 0 (0.0%) | 0 (0.0%) |
| 5 or more Children | 0 (0.0%) | 0 (0.0%) |
| Total | 5 (1.6%) | 0 (0.0%) |
Race in Glasscock County
The most populous races in Glasscock County are White / Caucasian (733 | 68.6%), Hispanic or Latino (334 | 31.3%), and Two or more Races (281 | 26.3%).
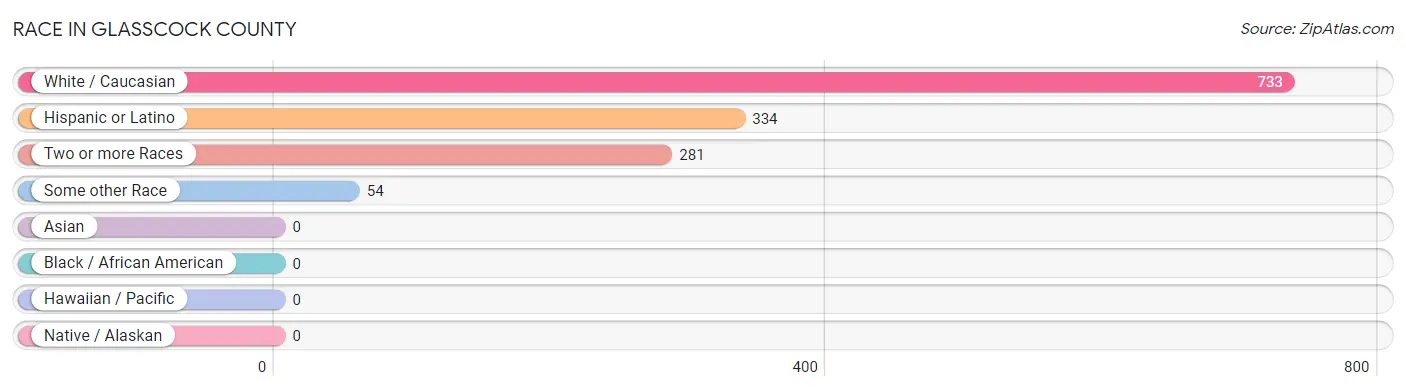
| Race | # Population | % Population |
| Asian | 0 | 0.0% |
| Black / African American | 0 | 0.0% |
| Hawaiian / Pacific | 0 | 0.0% |
| Hispanic or Latino | 334 | 31.3% |
| Native / Alaskan | 0 | 0.0% |
| White / Caucasian | 733 | 68.6% |
| Two or more Races | 281 | 26.3% |
| Some other Race | 54 | 5.1% |
| Total | 1,068 | 100.0% |
Ancestry in Glasscock County
The most populous ancestries reported in Glasscock County are Mexican (334 | 31.3%), German (262 | 24.5%), English (75 | 7.0%), Irish (66 | 6.2%), and Scotch-Irish (53 | 5.0%), together accounting for 74.0% of all Glasscock County residents.
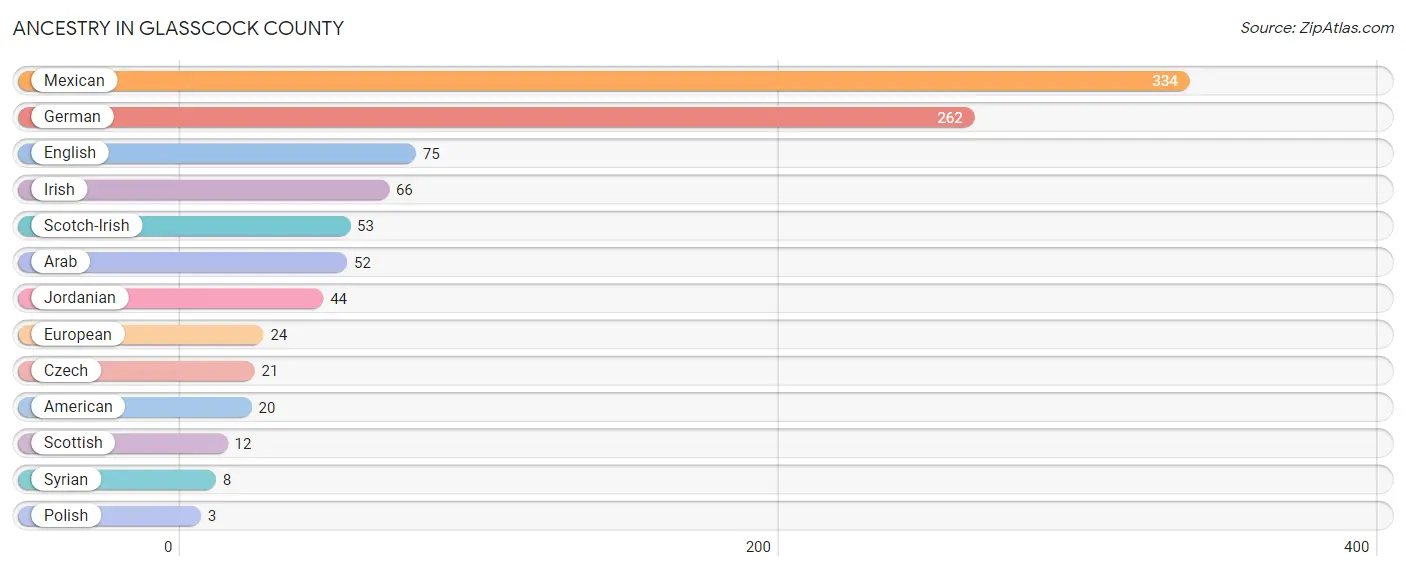
| Ancestry | # Population | % Population |
| American | 20 | 1.9% |
| Arab | 52 | 4.9% |
| Czech | 21 | 2.0% |
| English | 75 | 7.0% |
| European | 24 | 2.2% |
| German | 262 | 24.5% |
| Irish | 66 | 6.2% |
| Jordanian | 44 | 4.1% |
| Mexican | 334 | 31.3% |
| Polish | 3 | 0.3% |
| Scotch-Irish | 53 | 5.0% |
| Scottish | 12 | 1.1% |
| Syrian | 8 | 0.7% | View All 13 Rows |
Immigrants in Glasscock County
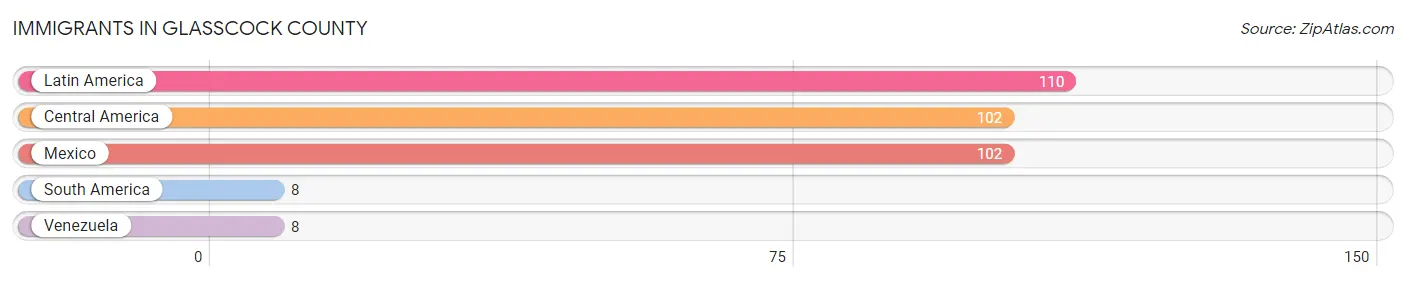
The most numerous immigrant groups reported in Glasscock County came from Latin America (110 | 10.3%), Central America (102 | 9.6%), Mexico (102 | 9.6%), South America (8 | 0.7%), and Venezuela (8 | 0.7%), together accounting for 30.9% of all Glasscock County residents.
| Immigration Origin | # Population | % Population |
| Central America | 102 | 9.6% |
| Latin America | 110 | 10.3% |
| Mexico | 102 | 9.6% |
| South America | 8 | 0.7% |
| Venezuela | 8 | 0.7% | View All 5 Rows |
Sex and Age in Glasscock County
Sex and Age in Glasscock County
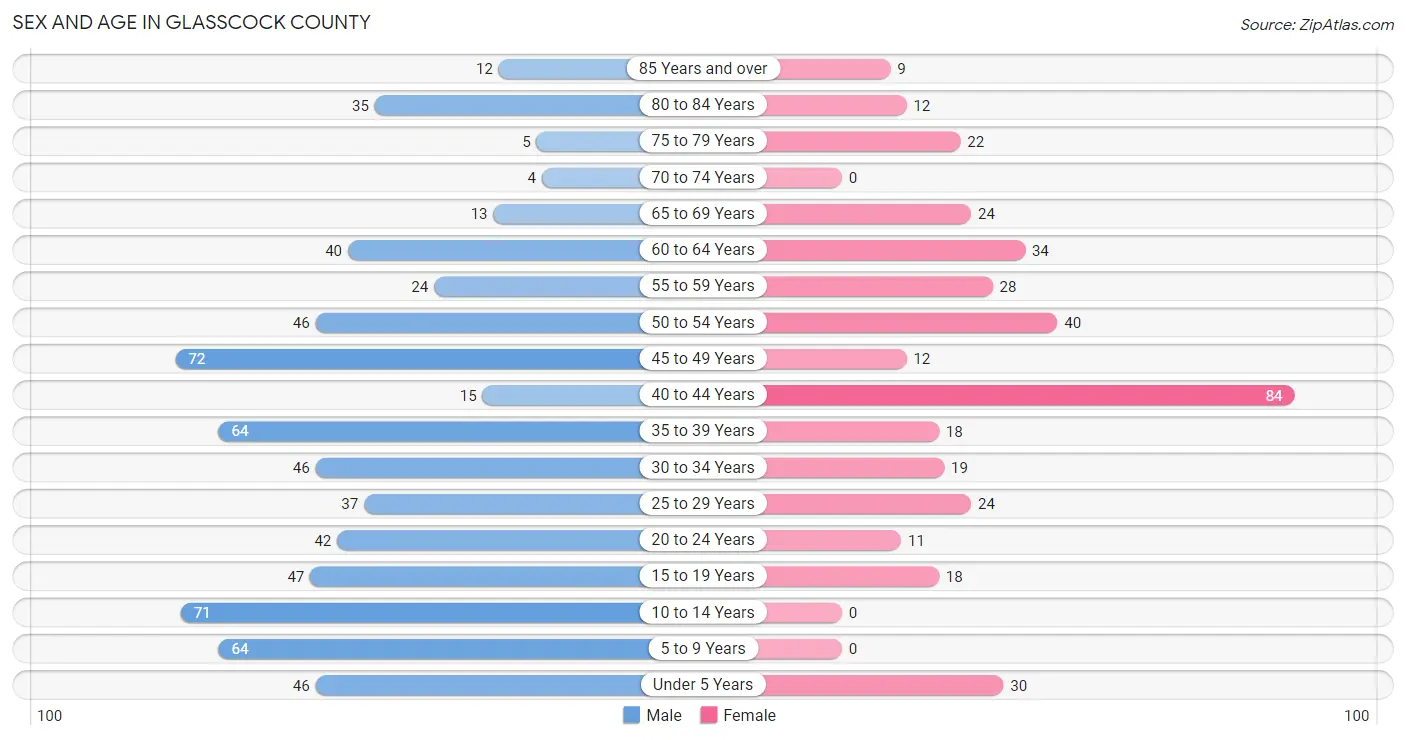
The most populous age groups in Glasscock County are 45 to 49 Years (72 | 10.5%) for men and 40 to 44 Years (84 | 21.8%) for women.
| Age Bracket | Male | Female |
| Under 5 Years | 46 (6.7%) | 30 (7.8%) |
| 5 to 9 Years | 64 (9.4%) | 0 (0.0%) |
| 10 to 14 Years | 71 (10.4%) | 0 (0.0%) |
| 15 to 19 Years | 47 (6.9%) | 18 (4.7%) |
| 20 to 24 Years | 42 (6.1%) | 11 (2.9%) |
| 25 to 29 Years | 37 (5.4%) | 24 (6.2%) |
| 30 to 34 Years | 46 (6.7%) | 19 (4.9%) |
| 35 to 39 Years | 64 (9.4%) | 18 (4.7%) |
| 40 to 44 Years | 15 (2.2%) | 84 (21.8%) |
| 45 to 49 Years | 72 (10.5%) | 12 (3.1%) |
| 50 to 54 Years | 46 (6.7%) | 40 (10.4%) |
| 55 to 59 Years | 24 (3.5%) | 28 (7.3%) |
| 60 to 64 Years | 40 (5.9%) | 34 (8.8%) |
| 65 to 69 Years | 13 (1.9%) | 24 (6.2%) |
| 70 to 74 Years | 4 (0.6%) | 0 (0.0%) |
| 75 to 79 Years | 5 (0.7%) | 22 (5.7%) |
| 80 to 84 Years | 35 (5.1%) | 12 (3.1%) |
| 85 Years and over | 12 (1.8%) | 9 (2.3%) |
| Total | 683 (100.0%) | 385 (100.0%) |
Families and Households in Glasscock County
Median Family Size in Glasscock County
The median family size in Glasscock County is 2.86 persons per family, with single female/mother families (2 | 0.6%) accounting for the largest median family size of 3.5 persons per family. On the other hand, single male/father families (34 | 10.0%) represent the smallest median family size with 1.68 persons per family.
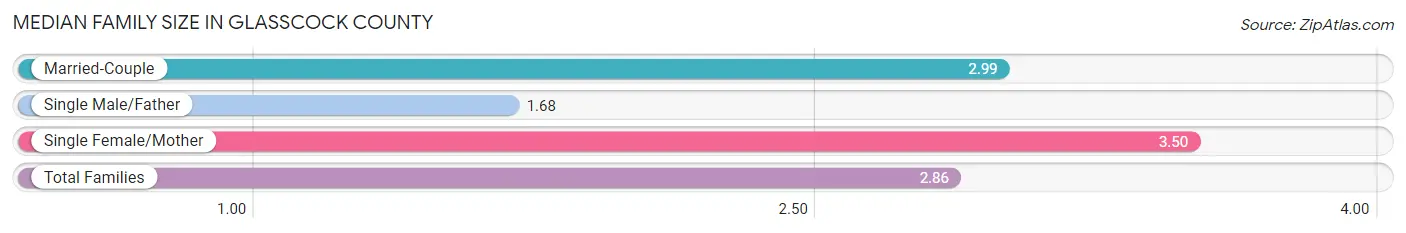
| Family Type | # Families | Family Size |
| Married-Couple | 305 (89.4%) | 2.99 |
| Single Male/Father | 34 (10.0%) | 1.68 |
| Single Female/Mother | 2 (0.6%) | 3.50 |
| Total Families | 341 (100.0%) | 2.86 |
Median Household Size in Glasscock County
The median household size in Glasscock County is 2.57 persons per household, with single female/mother households (2 | 0.5%) accounting for the largest median household size of 3.5 persons per household. non-family households (74 | 17.8%) represent the smallest median household size with 1.07 persons per household.
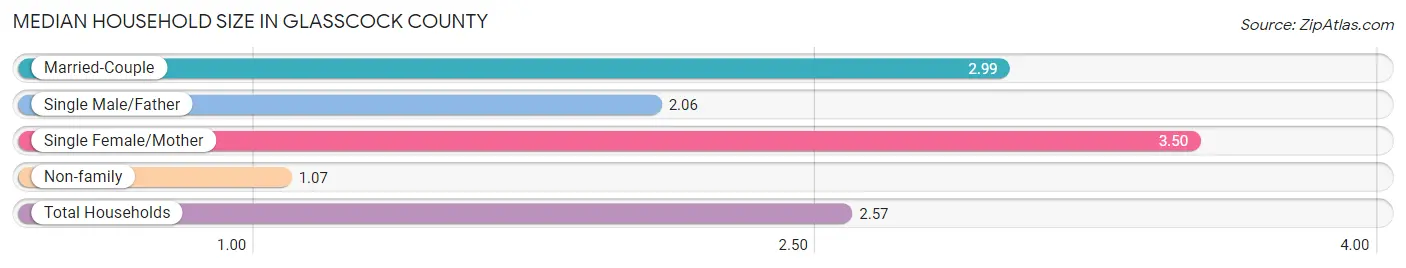
| Household Type | # Households | Household Size |
| Married-Couple | 305 (73.5%) | 2.99 |
| Single Male/Father | 34 (8.2%) | 2.06 |
| Single Female/Mother | 2 (0.5%) | 3.50 |
| Non-family | 74 (17.8%) | 1.07 |
| Total Households | 415 (100.0%) | 2.57 |
Household Size by Marriage Status in Glasscock County
Out of a total of 415 households in Glasscock County, 341 (82.2%) are family households, while 74 (17.8%) are nonfamily households. The most numerous type of family households are 2-person households, comprising 188, and the most common type of nonfamily households are 1-person households, comprising 65.
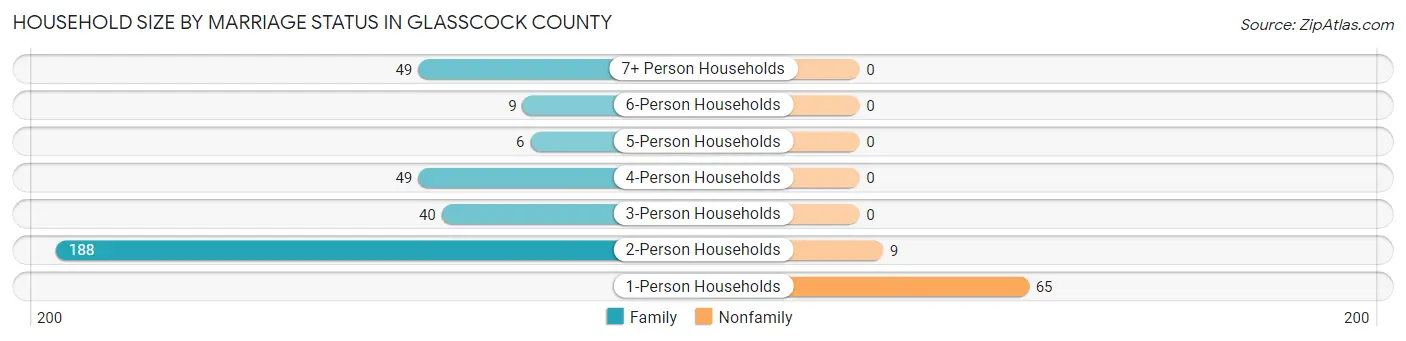
| Household Size | Family Households | Nonfamily Households |
| 1-Person Households | - | 65 (15.7%) |
| 2-Person Households | 188 (45.3%) | 9 (2.2%) |
| 3-Person Households | 40 (9.6%) | 0 (0.0%) |
| 4-Person Households | 49 (11.8%) | 0 (0.0%) |
| 5-Person Households | 6 (1.5%) | 0 (0.0%) |
| 6-Person Households | 9 (2.2%) | 0 (0.0%) |
| 7+ Person Households | 49 (11.8%) | 0 (0.0%) |
| Total | 341 (82.2%) | 74 (17.8%) |
Female Fertility in Glasscock County
Fertility by Age in Glasscock County
Average fertility rate in Glasscock County is 26.0 births per 1,000 women. Women in the age bracket of 35 to 50 years have the highest fertility rate with 41.0 births per 1,000 women. Women in the age bracket of 35 to 50 years acount for 100.0% of all women with births.
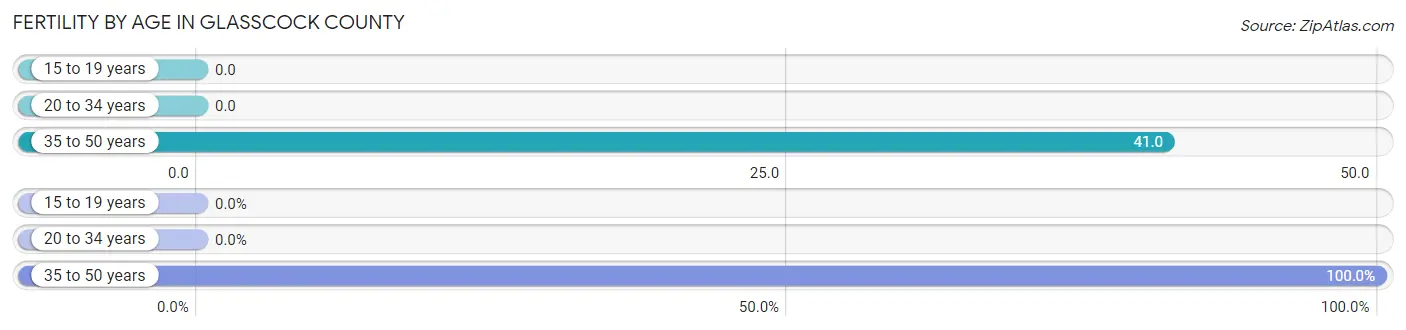
| Age Bracket | Women with Births | Births / 1,000 Women |
| 15 to 19 years | 0 (0.0%) | 0.0 |
| 20 to 34 years | 0 (0.0%) | 0.0 |
| 35 to 50 years | 5 (100.0%) | 41.0 |
| Total | 5 (100.0%) | 26.0 |
Fertility by Age by Marriage Status in Glasscock County
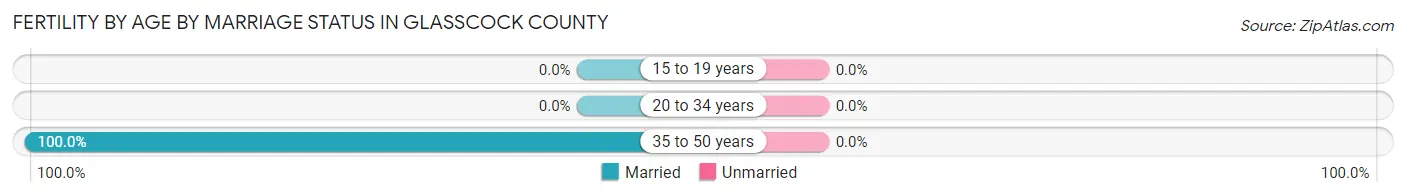
| Age Bracket | Married | Unmarried |
| 15 to 19 years | 0 (0.0%) | 0 (0.0%) |
| 20 to 34 years | 0 (0.0%) | 0 (0.0%) |
| 35 to 50 years | 5 (100.0%) | 0 (0.0%) |
| Total | 5 (100.0%) | 0 (0.0%) |
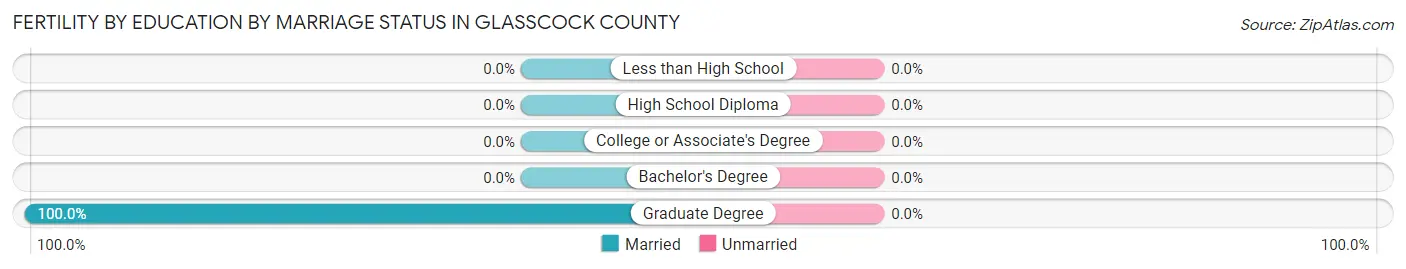
Fertility by Education in Glasscock County
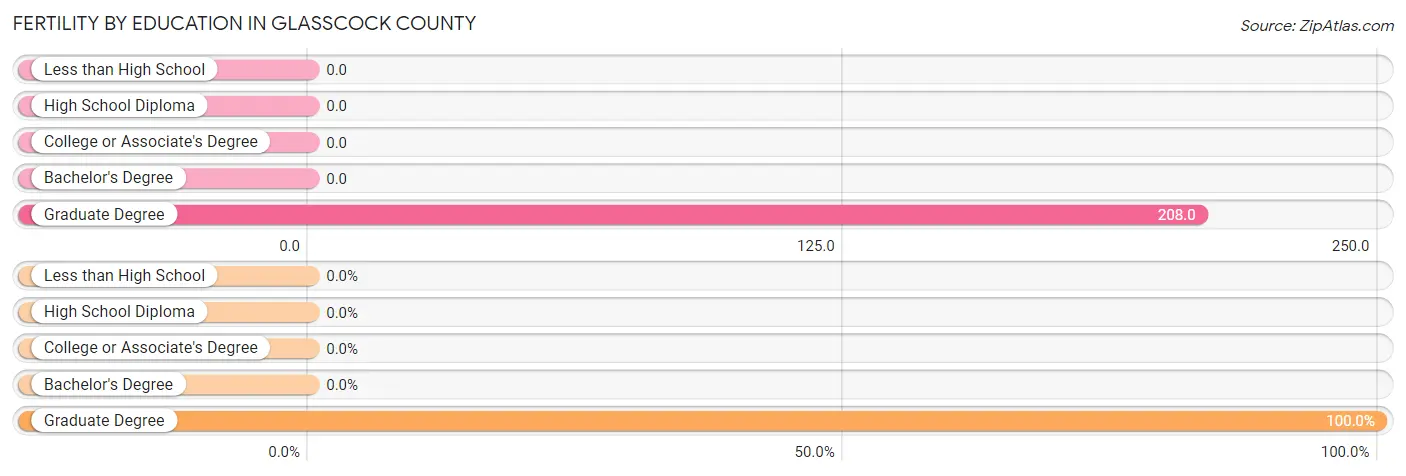
| Educational Attainment | Women with Births | Births / 1,000 Women |
| Less than High School | 0 (0.0%) | 0.0 |
| High School Diploma | 0 (0.0%) | 0.0 |
| College or Associate's Degree | 0 (0.0%) | 0.0 |
| Bachelor's Degree | 0 (0.0%) | 0.0 |
| Graduate Degree | 5 (100.0%) | 208.0 |
| Total | 5 (100.0%) | 26.0 |
Fertility by Education by Marriage Status in Glasscock County
| Educational Attainment | Married | Unmarried |
| Less than High School | 0 (0.0%) | 0 (0.0%) |
| High School Diploma | 0 (0.0%) | 0 (0.0%) |
| College or Associate's Degree | 0 (0.0%) | 0 (0.0%) |
| Bachelor's Degree | 0 (0.0%) | 0 (0.0%) |
| Graduate Degree | 5 (100.0%) | 0 (0.0%) |
| Total | 5 (100.0%) | 0 (0.0%) |
Employment Characteristics in Glasscock County
Employment by Class of Employer in Glasscock County
Among the 455 employed individuals in Glasscock County, private company employees (222 | 48.8%), self-employed (incorporated) (89 | 19.6%), and self-employed (not incorporated) (51 | 11.2%) make up the most common classes of employment.
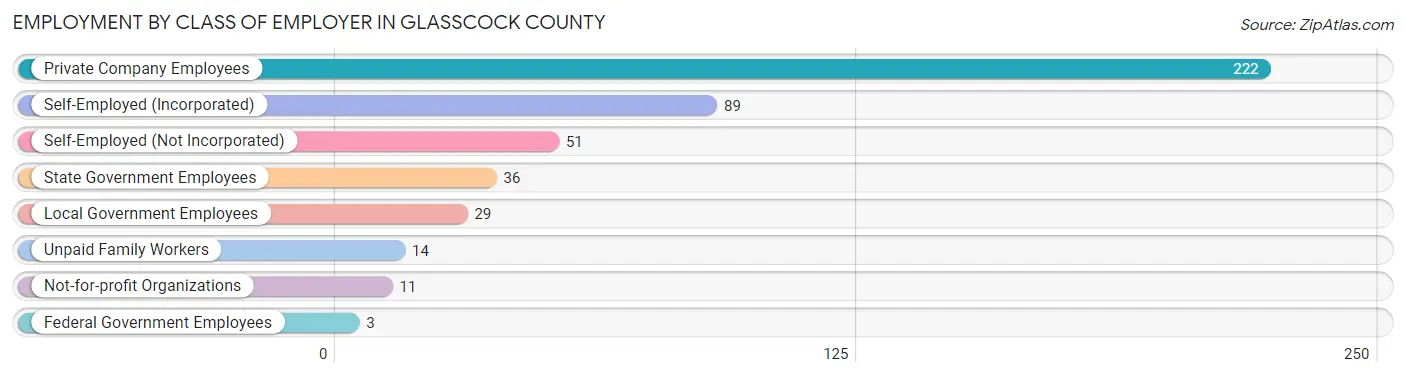
| Employer Class | # Employees | % Employees |
| Private Company Employees | 222 | 48.8% |
| Self-Employed (Incorporated) | 89 | 19.6% |
| Self-Employed (Not Incorporated) | 51 | 11.2% |
| Not-for-profit Organizations | 11 | 2.4% |
| Local Government Employees | 29 | 6.4% |
| State Government Employees | 36 | 7.9% |
| Federal Government Employees | 3 | 0.7% |
| Unpaid Family Workers | 14 | 3.1% |
| Total | 455 | 100.0% |
Employment Status by Age in Glasscock County
According to the labor force statistics for Glasscock County, out of the total population over 16 years of age (850), 55.2% or 469 individuals are in the labor force, with 1.3% or 6 of them unemployed. The age group with the highest labor force participation rate is 45 to 54 years, with 90.6% or 154 individuals in the labor force. Within the labor force, the 35 to 44 years age range has the highest percentage of unemployed individuals, with 5.3% or 6 of them being unemployed.
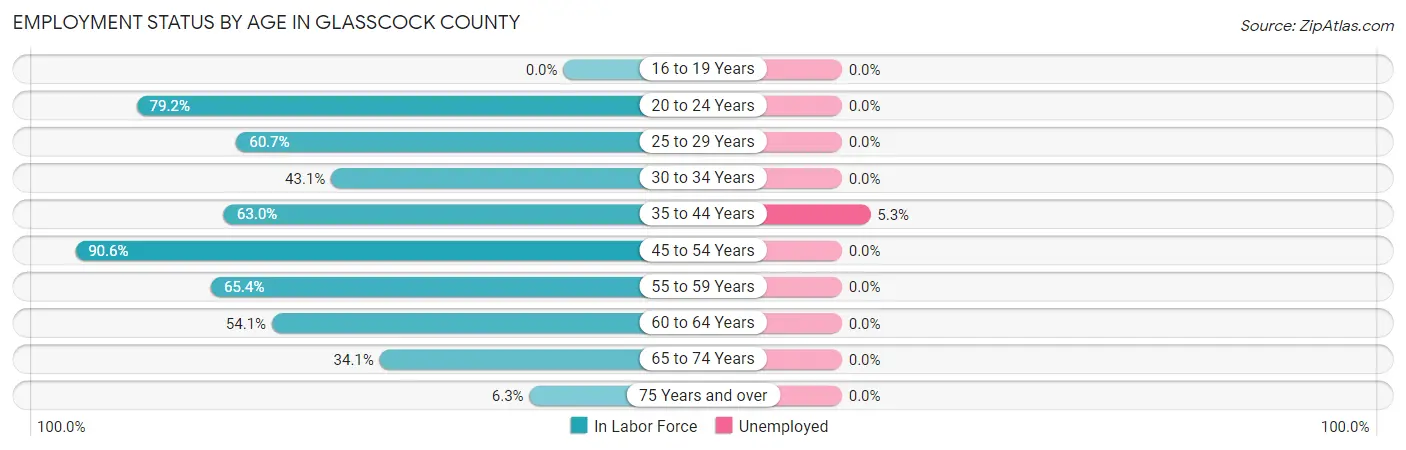
| Age Bracket | In Labor Force | Unemployed |
| 16 to 19 Years | 0 (0.0%) | 0 (0.0%) |
| 20 to 24 Years | 42 (79.2%) | 0 (0.0%) |
| 25 to 29 Years | 37 (60.7%) | 0 (0.0%) |
| 30 to 34 Years | 28 (43.1%) | 0 (0.0%) |
| 35 to 44 Years | 114 (63.0%) | 6 (5.3%) |
| 45 to 54 Years | 154 (90.6%) | 0 (0.0%) |
| 55 to 59 Years | 34 (65.4%) | 0 (0.0%) |
| 60 to 64 Years | 40 (54.1%) | 0 (0.0%) |
| 65 to 74 Years | 14 (34.1%) | 0 (0.0%) |
| 75 Years and over | 6 (6.3%) | 0 (0.0%) |
| Total | 469 (55.2%) | 6 (1.3%) |
Employment Status by Educational Attainment in Glasscock County
According to labor force statistics for Glasscock County, 67.5% of individuals (407) out of the total population between 25 and 64 years of age (603) are in the labor force, with 1.5% or 6 of them being unemployed. The group with the highest labor force participation rate are those with the educational attainment of less than high school, with 92.6% or 87 individuals in the labor force. Within the labor force, individuals with bachelor's degree or higher education have the highest percentage of unemployment, with 4.2% or 6 of them being unemployed.
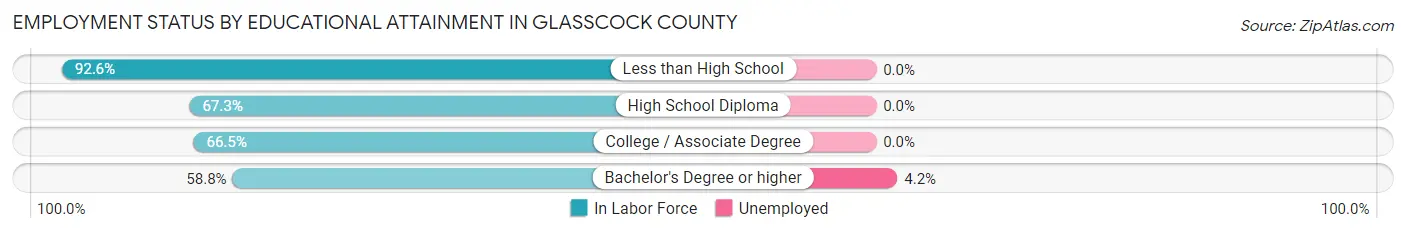
| Educational Attainment | In Labor Force | Unemployed |
| Less than High School | 87 (92.6%) | 0 (0.0%) |
| High School Diploma | 35 (67.3%) | 0 (0.0%) |
| College / Associate Degree | 141 (66.5%) | 0 (0.0%) |
| Bachelor's Degree or higher | 144 (58.8%) | 10 (4.2%) |
| Total | 407 (67.5%) | 9 (1.5%) |
Employment Occupations by Sex in Glasscock County
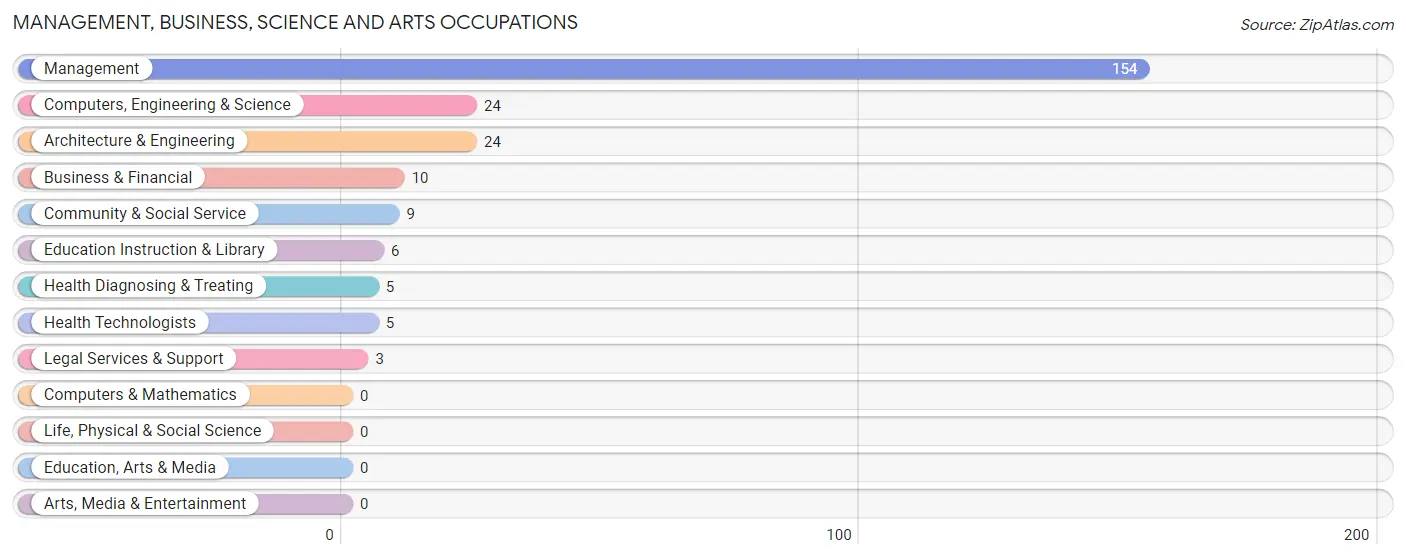
Management, Business, Science and Arts Occupations
The most common Management, Business, Science and Arts occupations in Glasscock County are Management (154 | 33.3%), Computers, Engineering & Science (24 | 5.2%), Architecture & Engineering (24 | 5.2%), Business & Financial (10 | 2.2%), and Community & Social Service (9 | 1.9%).
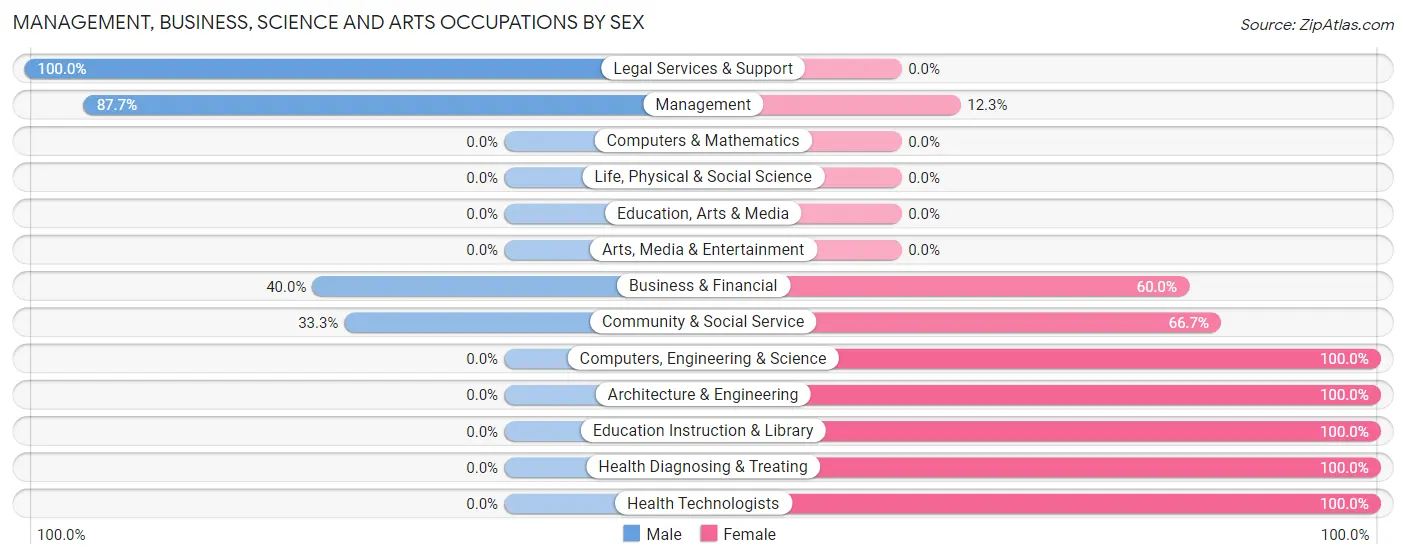
Management, Business, Science and Arts Occupations by Sex
Within the Management, Business, Science and Arts occupations in Glasscock County, the most male-oriented occupations are Legal Services & Support (100.0%), Management (87.7%), and Business & Financial (40.0%), while the most female-oriented occupations are Computers, Engineering & Science (100.0%), Architecture & Engineering (100.0%), and Education Instruction & Library (100.0%).
| Occupation | Male | Female |
| Management | 135 (87.7%) | 19 (12.3%) |
| Business & Financial | 4 (40.0%) | 6 (60.0%) |
| Computers, Engineering & Science | 0 (0.0%) | 24 (100.0%) |
| Computers & Mathematics | 0 (0.0%) | 0 (0.0%) |
| Architecture & Engineering | 0 (0.0%) | 24 (100.0%) |
| Life, Physical & Social Science | 0 (0.0%) | 0 (0.0%) |
| Community & Social Service | 3 (33.3%) | 6 (66.7%) |
| Education, Arts & Media | 0 (0.0%) | 0 (0.0%) |
| Legal Services & Support | 3 (100.0%) | 0 (0.0%) |
| Education Instruction & Library | 0 (0.0%) | 6 (100.0%) |
| Arts, Media & Entertainment | 0 (0.0%) | 0 (0.0%) |
| Health Diagnosing & Treating | 0 (0.0%) | 5 (100.0%) |
| Health Technologists | 0 (0.0%) | 5 (100.0%) |
| Total (Category) | 142 (70.3%) | 60 (29.7%) |
| Total (Overall) | 352 (76.0%) | 111 (24.0%) |
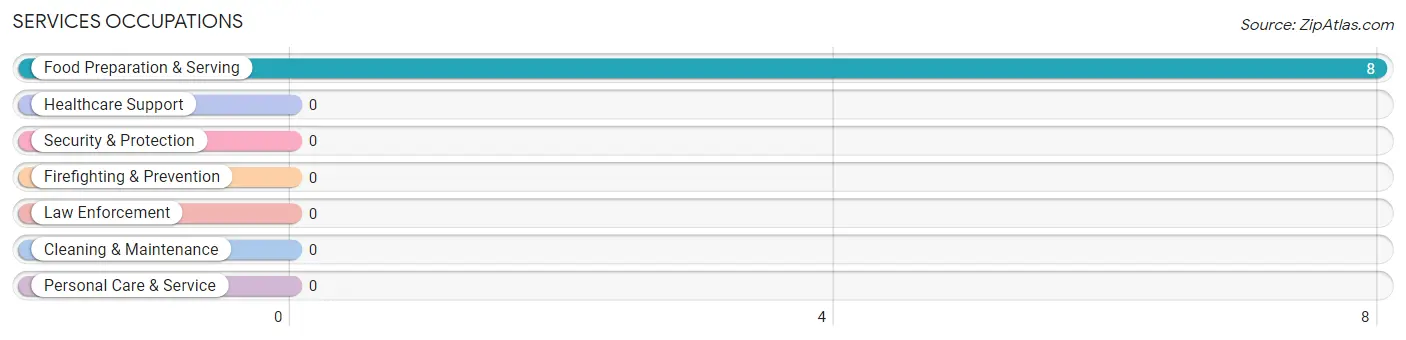
Services Occupations
The most common Services occupations in Glasscock County are , and Food Preparation & Serving (8 | 1.7%).
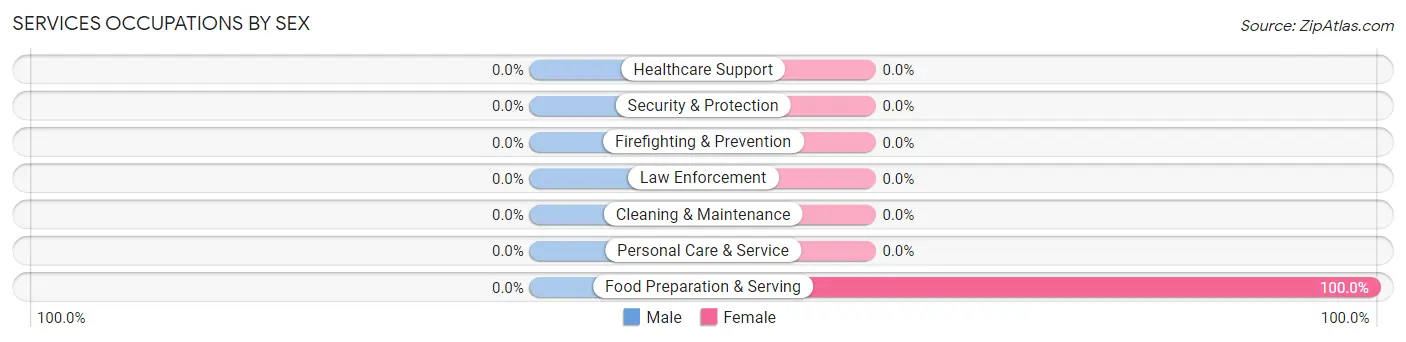
Services Occupations by Sex
| Occupation | Male | Female |
| Healthcare Support | 0 (0.0%) | 0 (0.0%) |
| Security & Protection | 0 (0.0%) | 0 (0.0%) |
| Firefighting & Prevention | 0 (0.0%) | 0 (0.0%) |
| Law Enforcement | 0 (0.0%) | 0 (0.0%) |
| Food Preparation & Serving | 0 (0.0%) | 8 (100.0%) |
| Cleaning & Maintenance | 0 (0.0%) | 0 (0.0%) |
| Personal Care & Service | 0 (0.0%) | 0 (0.0%) |
| Total (Category) | 0 (0.0%) | 8 (100.0%) |
| Total (Overall) | 352 (76.0%) | 111 (24.0%) |
Sales and Office Occupations
The most common Sales and Office occupations in Glasscock County are Office & Administration (33 | 7.1%), and Sales & Related (11 | 2.4%).
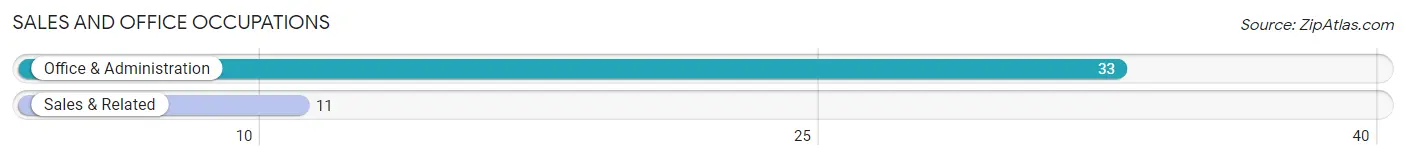
Sales and Office Occupations by Sex

| Occupation | Male | Female |
| Sales & Related | 11 (100.0%) | 0 (0.0%) |
| Office & Administration | 3 (9.1%) | 30 (90.9%) |
| Total (Category) | 14 (31.8%) | 30 (68.2%) |
| Total (Overall) | 352 (76.0%) | 111 (24.0%) |
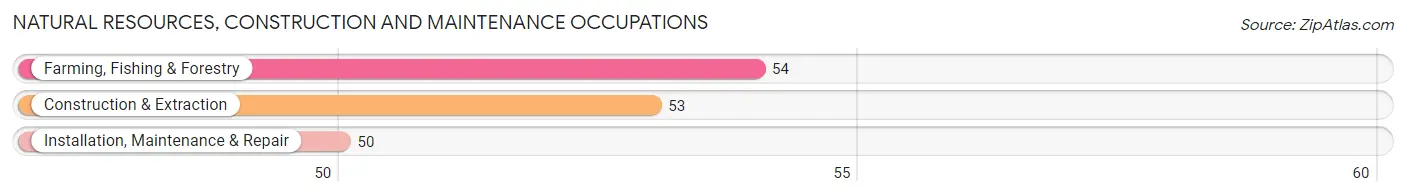
Natural Resources, Construction and Maintenance Occupations
The most common Natural Resources, Construction and Maintenance occupations in Glasscock County are Farming, Fishing & Forestry (54 | 11.7%), Construction & Extraction (53 | 11.5%), and Installation, Maintenance & Repair (50 | 10.8%).
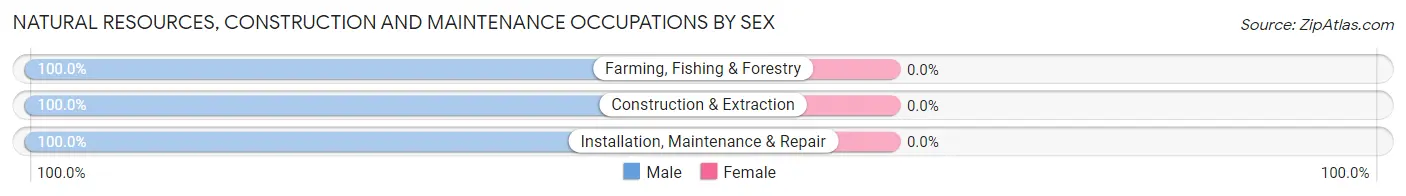
Natural Resources, Construction and Maintenance Occupations by Sex
| Occupation | Male | Female |
| Farming, Fishing & Forestry | 54 (100.0%) | 0 (0.0%) |
| Construction & Extraction | 53 (100.0%) | 0 (0.0%) |
| Installation, Maintenance & Repair | 50 (100.0%) | 0 (0.0%) |
| Total (Category) | 157 (100.0%) | 0 (0.0%) |
| Total (Overall) | 352 (76.0%) | 111 (24.0%) |
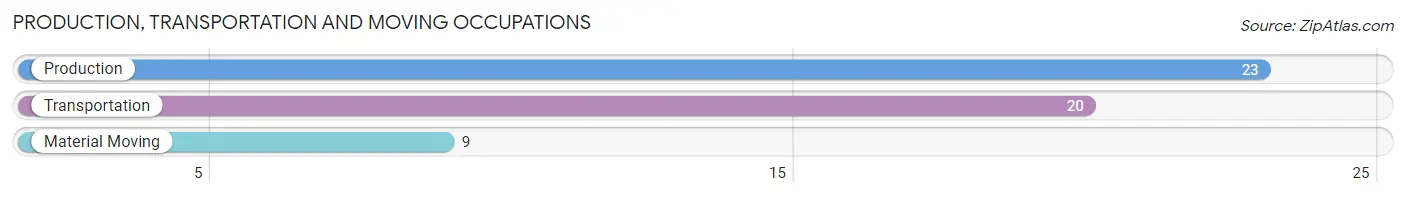
Production, Transportation and Moving Occupations
The most common Production, Transportation and Moving occupations in Glasscock County are Production (23 | 5.0%), Transportation (20 | 4.3%), and Material Moving (9 | 1.9%).
Production, Transportation and Moving Occupations by Sex
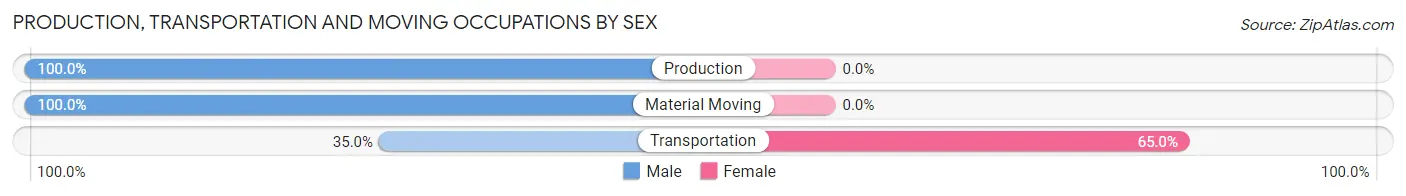
| Occupation | Male | Female |
| Production | 23 (100.0%) | 0 (0.0%) |
| Transportation | 7 (35.0%) | 13 (65.0%) |
| Material Moving | 9 (100.0%) | 0 (0.0%) |
| Total (Category) | 39 (75.0%) | 13 (25.0%) |
| Total (Overall) | 352 (76.0%) | 111 (24.0%) |
Employment Industries by Sex in Glasscock County
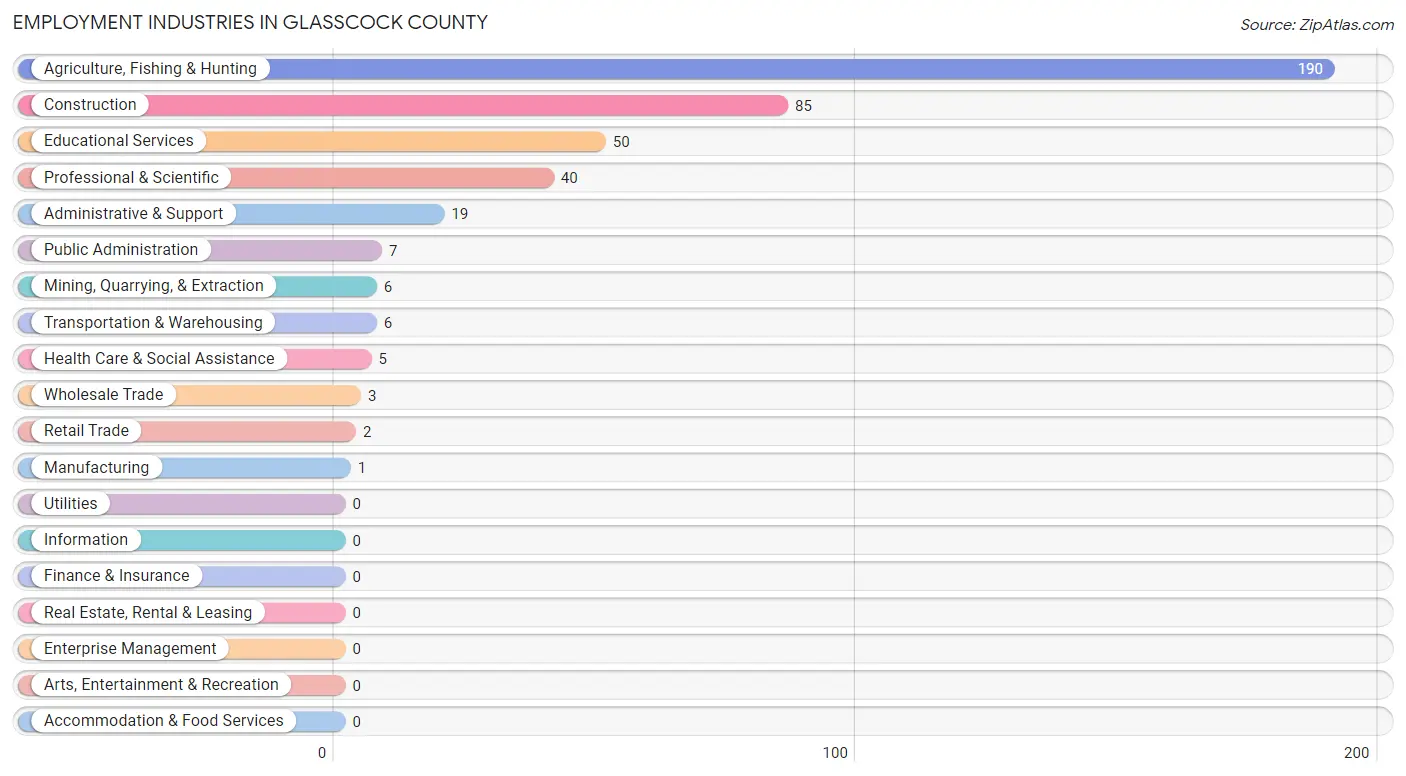
Employment Industries in Glasscock County
The major employment industries in Glasscock County include Agriculture, Fishing & Hunting (190 | 41.0%), Construction (85 | 18.4%), Educational Services (50 | 10.8%), Professional & Scientific (40 | 8.6%), and Administrative & Support (19 | 4.1%).
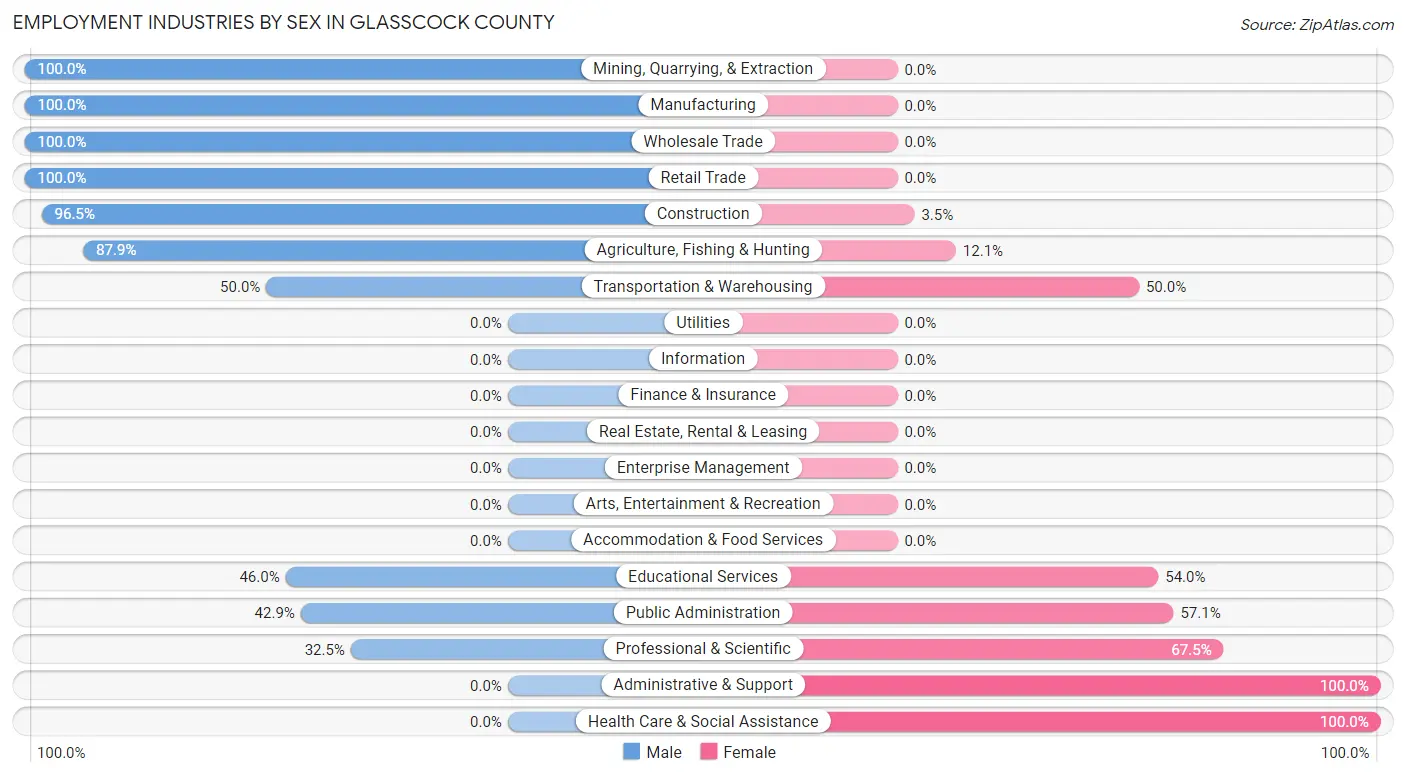
Employment Industries by Sex in Glasscock County
The Glasscock County industries that see more men than women are Mining, Quarrying, & Extraction (100.0%), Manufacturing (100.0%), and Wholesale Trade (100.0%), whereas the industries that tend to have a higher number of women are Administrative & Support (100.0%), Health Care & Social Assistance (100.0%), and Professional & Scientific (67.5%).
| Industry | Male | Female |
| Agriculture, Fishing & Hunting | 167 (87.9%) | 23 (12.1%) |
| Mining, Quarrying, & Extraction | 6 (100.0%) | 0 (0.0%) |
| Construction | 82 (96.5%) | 3 (3.5%) |
| Manufacturing | 1 (100.0%) | 0 (0.0%) |
| Wholesale Trade | 3 (100.0%) | 0 (0.0%) |
| Retail Trade | 2 (100.0%) | 0 (0.0%) |
| Transportation & Warehousing | 3 (50.0%) | 3 (50.0%) |
| Utilities | 0 (0.0%) | 0 (0.0%) |
| Information | 0 (0.0%) | 0 (0.0%) |
| Finance & Insurance | 0 (0.0%) | 0 (0.0%) |
| Real Estate, Rental & Leasing | 0 (0.0%) | 0 (0.0%) |
| Professional & Scientific | 13 (32.5%) | 27 (67.5%) |
| Enterprise Management | 0 (0.0%) | 0 (0.0%) |
| Administrative & Support | 0 (0.0%) | 19 (100.0%) |
| Educational Services | 23 (46.0%) | 27 (54.0%) |
| Health Care & Social Assistance | 0 (0.0%) | 5 (100.0%) |
| Arts, Entertainment & Recreation | 0 (0.0%) | 0 (0.0%) |
| Accommodation & Food Services | 0 (0.0%) | 0 (0.0%) |
| Public Administration | 3 (42.9%) | 4 (57.1%) |
| Total | 352 (76.0%) | 111 (24.0%) |
Education in Glasscock County
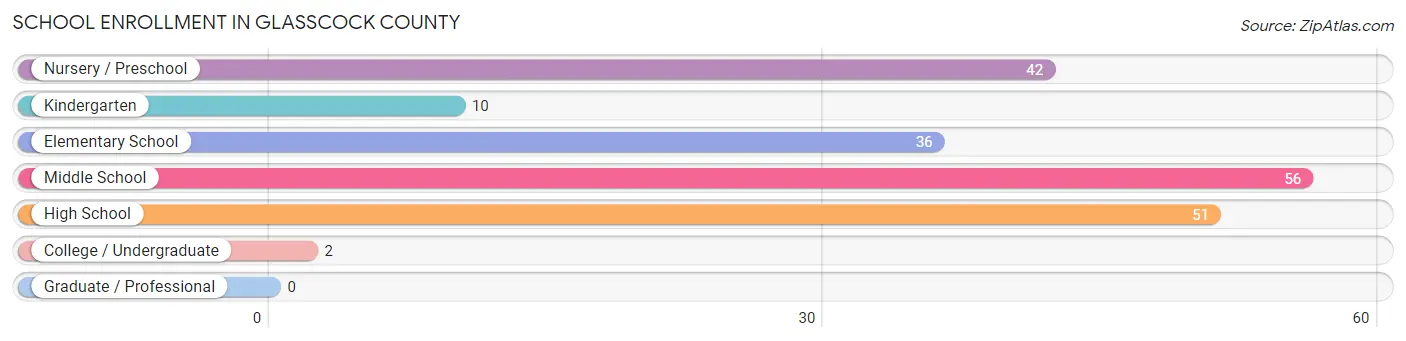
School Enrollment in Glasscock County
The most common levels of schooling among the 197 students in Glasscock County are middle school (56 | 28.4%), high school (51 | 25.9%), and nursery / preschool (42 | 21.3%).
| School Level | # Students | % Students |
| Nursery / Preschool | 42 | 21.3% |
| Kindergarten | 10 | 5.1% |
| Elementary School | 36 | 18.3% |
| Middle School | 56 | 28.4% |
| High School | 51 | 25.9% |
| College / Undergraduate | 2 | 1.0% |
| Graduate / Professional | 0 | 0.0% |
| Total | 197 | 100.0% |
School Enrollment by Age by Funding Source in Glasscock County
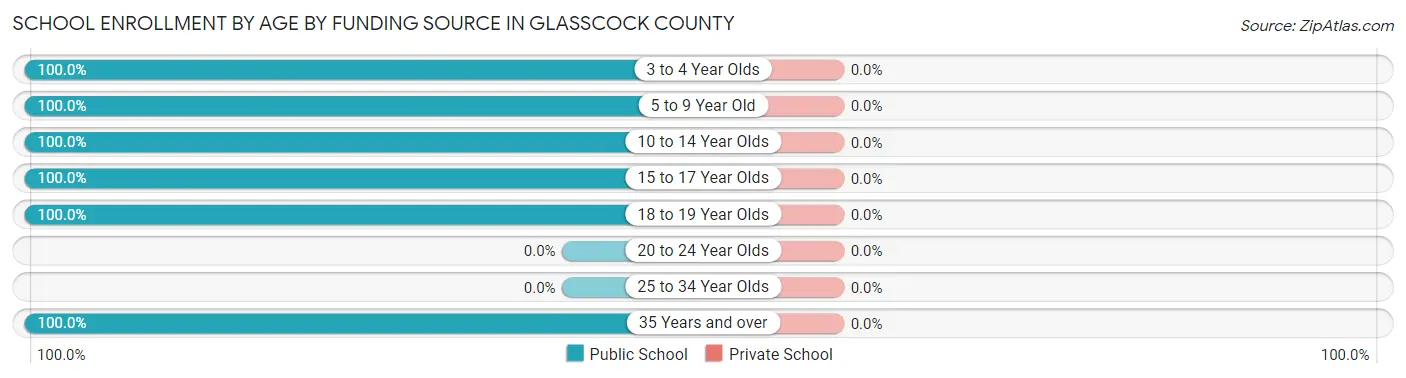
| Age Bracket | Public School | Private School |
| 3 to 4 Year Olds | 15 (100.0%) | 0 (0.0%) |
| 5 to 9 Year Old | 64 (100.0%) | 0 (0.0%) |
| 10 to 14 Year Olds | 65 (100.0%) | 0 (0.0%) |
| 15 to 17 Year Olds | 40 (100.0%) | 0 (0.0%) |
| 18 to 19 Year Olds | 11 (100.0%) | 0 (0.0%) |
| 20 to 24 Year Olds | 0 (0.0%) | 0 (0.0%) |
| 25 to 34 Year Olds | 0 (0.0%) | 0 (0.0%) |
| 35 Years and over | 2 (100.0%) | 0 (0.0%) |
| Total | 197 (100.0%) | 0 (0.0%) |
Educational Attainment by Field of Study in Glasscock County
Bio, nature & agricultural (61 | 20.3%), engineering (60 | 19.9%), business (49 | 16.3%), literature & languages (25 | 8.3%), and physical & health sciences (19 | 6.3%) are the most common fields of study among 301 individuals in Glasscock County who have obtained a bachelor's degree or higher.
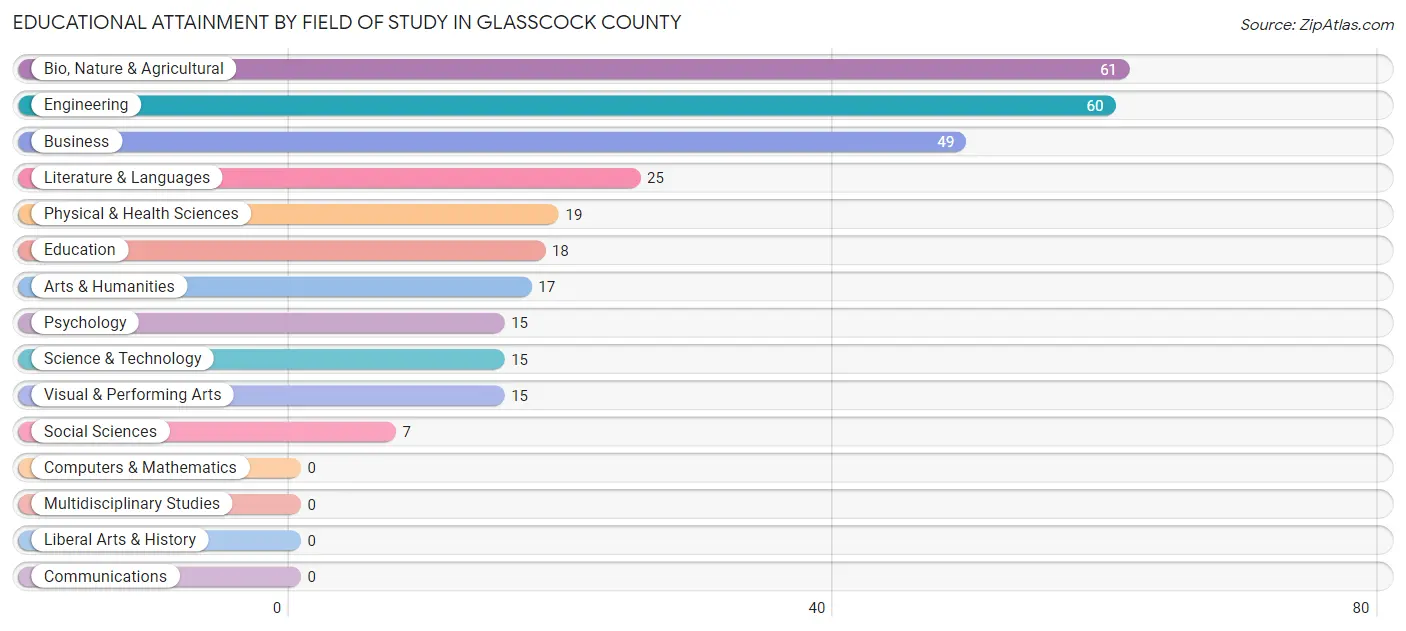
| Field of Study | # Graduates | % Graduates |
| Computers & Mathematics | 0 | 0.0% |
| Bio, Nature & Agricultural | 61 | 20.3% |
| Physical & Health Sciences | 19 | 6.3% |
| Psychology | 15 | 5.0% |
| Social Sciences | 7 | 2.3% |
| Engineering | 60 | 19.9% |
| Multidisciplinary Studies | 0 | 0.0% |
| Science & Technology | 15 | 5.0% |
| Business | 49 | 16.3% |
| Education | 18 | 6.0% |
| Literature & Languages | 25 | 8.3% |
| Liberal Arts & History | 0 | 0.0% |
| Visual & Performing Arts | 15 | 5.0% |
| Communications | 0 | 0.0% |
| Arts & Humanities | 17 | 5.7% |
| Total | 301 | 100.0% |
Transportation & Commute in Glasscock County
Vehicle Availability by Sex in Glasscock County
The most prevalent vehicle ownership categories in Glasscock County are males with 2 vehicles (160, accounting for 45.6%) and females with 2 vehicles (23, making up 153.8%).
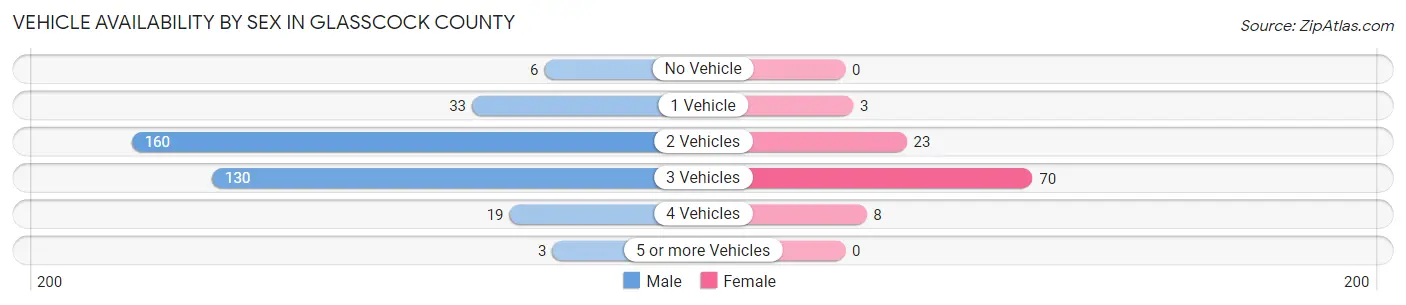
| Vehicles Available | Male | Female |
| No Vehicle | 6 (1.7%) | 0 (0.0%) |
| 1 Vehicle | 33 (9.4%) | 3 (2.9%) |
| 2 Vehicles | 160 (45.6%) | 23 (22.1%) |
| 3 Vehicles | 130 (37.0%) | 70 (67.3%) |
| 4 Vehicles | 19 (5.4%) | 8 (7.7%) |
| 5 or more Vehicles | 3 (0.9%) | 0 (0.0%) |
| Total | 351 (100.0%) | 104 (100.0%) |
Commute Time in Glasscock County
The most frequently occuring commute durations in Glasscock County are less than 5 minutes (89 commuters, 23.5%), 5 to 9 minutes (64 commuters, 16.9%), and 90 or more minutes (37 commuters, 9.8%).
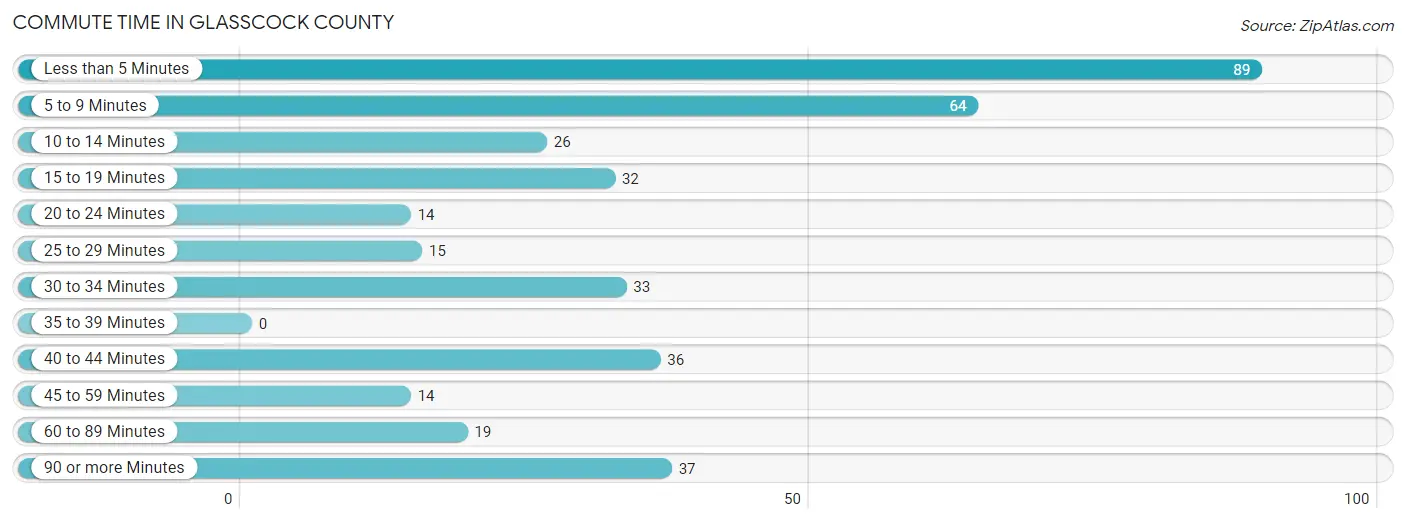
| Commute Time | # Commuters | % Commuters |
| Less than 5 Minutes | 89 | 23.5% |
| 5 to 9 Minutes | 64 | 16.9% |
| 10 to 14 Minutes | 26 | 6.9% |
| 15 to 19 Minutes | 32 | 8.4% |
| 20 to 24 Minutes | 14 | 3.7% |
| 25 to 29 Minutes | 15 | 4.0% |
| 30 to 34 Minutes | 33 | 8.7% |
| 35 to 39 Minutes | 0 | 0.0% |
| 40 to 44 Minutes | 36 | 9.5% |
| 45 to 59 Minutes | 14 | 3.7% |
| 60 to 89 Minutes | 19 | 5.0% |
| 90 or more Minutes | 37 | 9.8% |
Commute Time by Sex in Glasscock County
The most common commute times in Glasscock County are less than 5 minutes (76 commuters, 24.0%) for males and 60 to 89 minutes (19 commuters, 30.2%) for females.
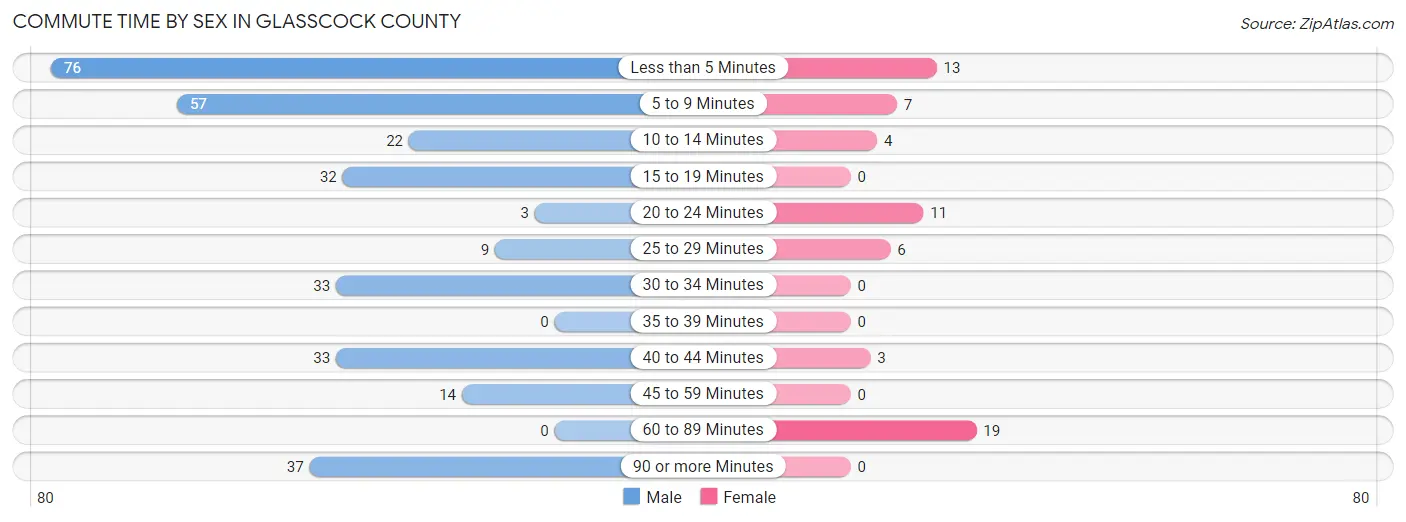
| Commute Time | Male | Female |
| Less than 5 Minutes | 76 (24.0%) | 13 (20.6%) |
| 5 to 9 Minutes | 57 (18.0%) | 7 (11.1%) |
| 10 to 14 Minutes | 22 (7.0%) | 4 (6.4%) |
| 15 to 19 Minutes | 32 (10.1%) | 0 (0.0%) |
| 20 to 24 Minutes | 3 (0.9%) | 11 (17.5%) |
| 25 to 29 Minutes | 9 (2.9%) | 6 (9.5%) |
| 30 to 34 Minutes | 33 (10.4%) | 0 (0.0%) |
| 35 to 39 Minutes | 0 (0.0%) | 0 (0.0%) |
| 40 to 44 Minutes | 33 (10.4%) | 3 (4.8%) |
| 45 to 59 Minutes | 14 (4.4%) | 0 (0.0%) |
| 60 to 89 Minutes | 0 (0.0%) | 19 (30.2%) |
| 90 or more Minutes | 37 (11.7%) | 0 (0.0%) |
Time of Departure to Work by Sex in Glasscock County
The most frequent times of departure to work in Glasscock County are 7:30 AM to 7:59 AM (104, 32.9%) for males and 7:00 AM to 7:29 AM (25, 39.7%) for females.
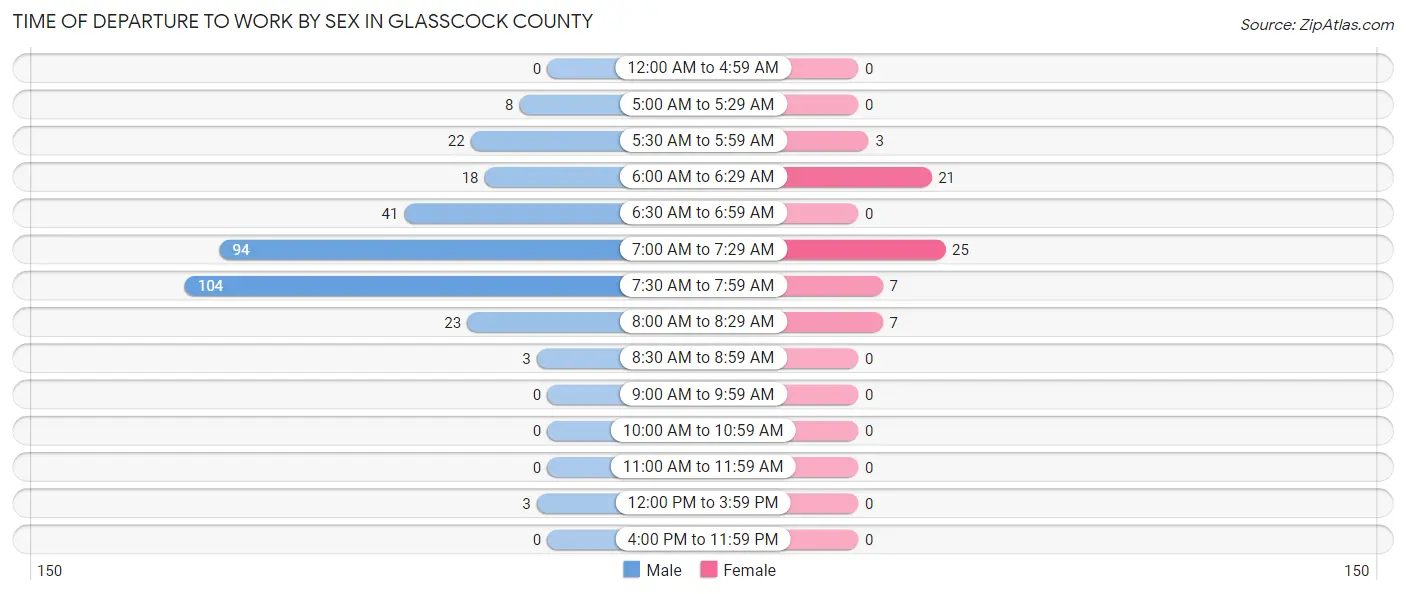
| Time of Departure | Male | Female |
| 12:00 AM to 4:59 AM | 0 (0.0%) | 0 (0.0%) |
| 5:00 AM to 5:29 AM | 8 (2.5%) | 0 (0.0%) |
| 5:30 AM to 5:59 AM | 22 (7.0%) | 3 (4.8%) |
| 6:00 AM to 6:29 AM | 18 (5.7%) | 21 (33.3%) |
| 6:30 AM to 6:59 AM | 41 (13.0%) | 0 (0.0%) |
| 7:00 AM to 7:29 AM | 94 (29.7%) | 25 (39.7%) |
| 7:30 AM to 7:59 AM | 104 (32.9%) | 7 (11.1%) |
| 8:00 AM to 8:29 AM | 23 (7.3%) | 7 (11.1%) |
| 8:30 AM to 8:59 AM | 3 (0.9%) | 0 (0.0%) |
| 9:00 AM to 9:59 AM | 0 (0.0%) | 0 (0.0%) |
| 10:00 AM to 10:59 AM | 0 (0.0%) | 0 (0.0%) |
| 11:00 AM to 11:59 AM | 0 (0.0%) | 0 (0.0%) |
| 12:00 PM to 3:59 PM | 3 (0.9%) | 0 (0.0%) |
| 4:00 PM to 11:59 PM | 0 (0.0%) | 0 (0.0%) |
| Total | 316 (100.0%) | 63 (100.0%) |
Housing Occupancy in Glasscock County
Occupancy by Ownership in Glasscock County
Of the total 415 dwellings in Glasscock County, owner-occupied units account for 257 (61.9%), while renter-occupied units make up 158 (38.1%).
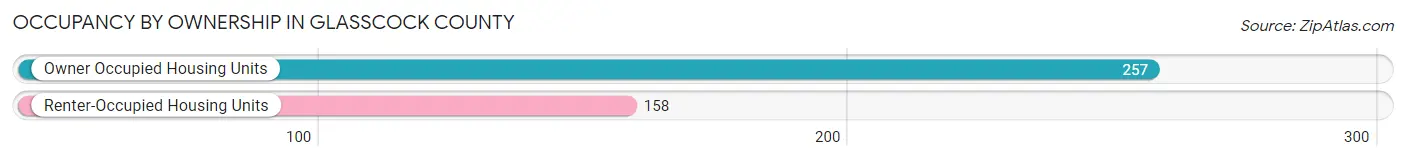
| Occupancy | # Housing Units | % Housing Units |
| Owner Occupied Housing Units | 257 | 61.9% |
| Renter-Occupied Housing Units | 158 | 38.1% |
| Total Occupied Housing Units | 415 | 100.0% |
Occupancy by Household Size in Glasscock County
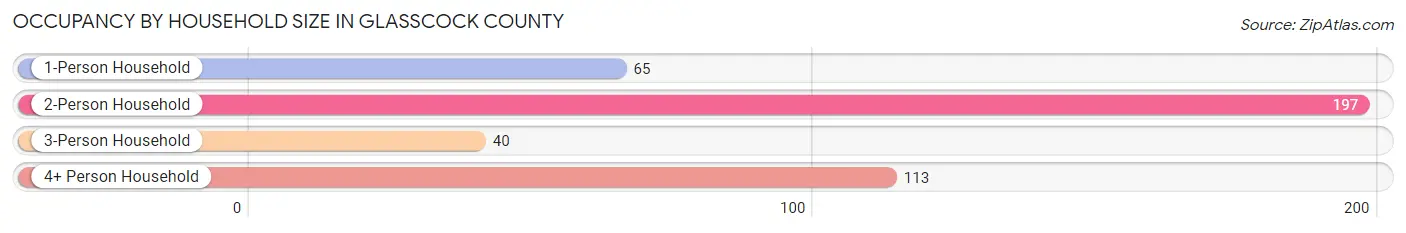
| Household Size | # Housing Units | % Housing Units |
| 1-Person Household | 65 | 15.7% |
| 2-Person Household | 197 | 47.5% |
| 3-Person Household | 40 | 9.6% |
| 4+ Person Household | 113 | 27.2% |
| Total Housing Units | 415 | 100.0% |
Occupancy by Ownership by Household Size in Glasscock County
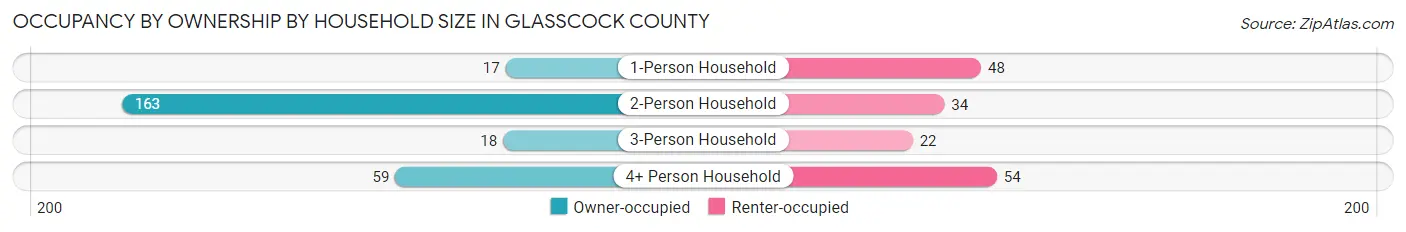
| Household Size | Owner-occupied | Renter-occupied |
| 1-Person Household | 17 (26.2%) | 48 (73.9%) |
| 2-Person Household | 163 (82.7%) | 34 (17.3%) |
| 3-Person Household | 18 (45.0%) | 22 (55.0%) |
| 4+ Person Household | 59 (52.2%) | 54 (47.8%) |
| Total Housing Units | 257 (61.9%) | 158 (38.1%) |
Occupancy by Educational Attainment in Glasscock County
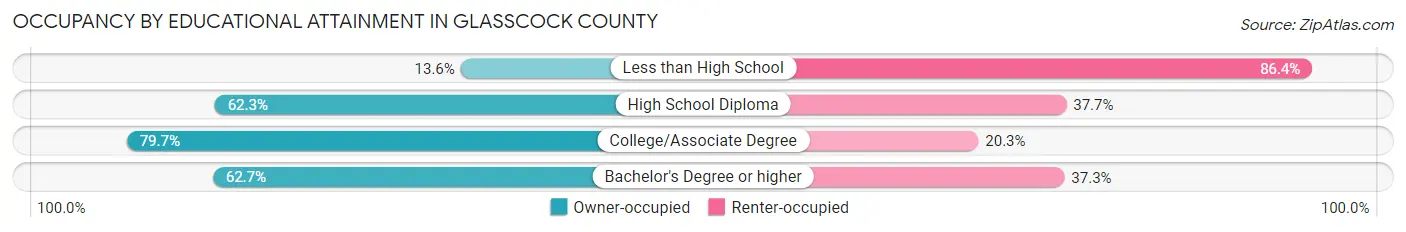
| Household Size | Owner-occupied | Renter-occupied |
| Less than High School | 8 (13.6%) | 51 (86.4%) |
| High School Diploma | 38 (62.3%) | 23 (37.7%) |
| College/Associate Degree | 122 (79.7%) | 31 (20.3%) |
| Bachelor's Degree or higher | 89 (62.7%) | 53 (37.3%) |
Occupancy by Age of Householder in Glasscock County
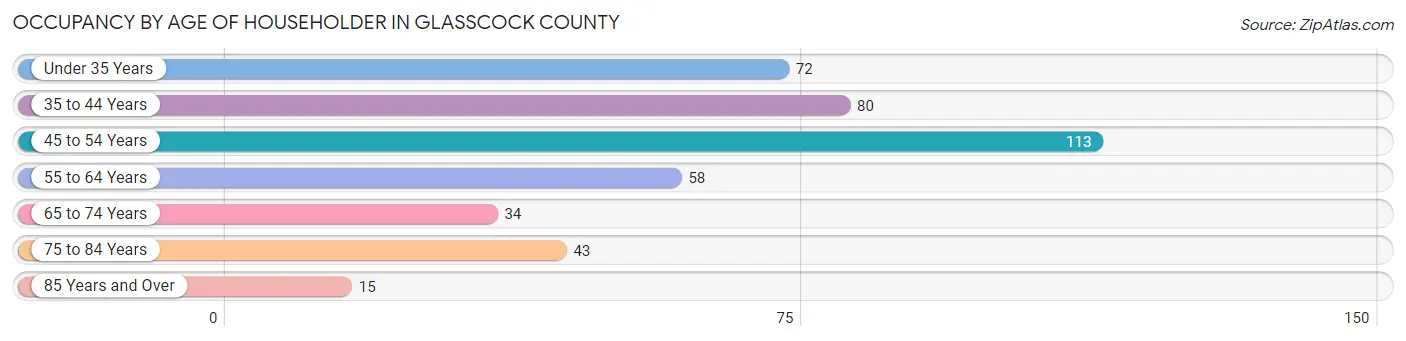
| Age Bracket | # Households | % Households |
| Under 35 Years | 72 | 17.3% |
| 35 to 44 Years | 80 | 19.3% |
| 45 to 54 Years | 113 | 27.2% |
| 55 to 64 Years | 58 | 14.0% |
| 65 to 74 Years | 34 | 8.2% |
| 75 to 84 Years | 43 | 10.4% |
| 85 Years and Over | 15 | 3.6% |
| Total | 415 | 100.0% |
Housing Finances in Glasscock County
Median Income by Occupancy in Glasscock County
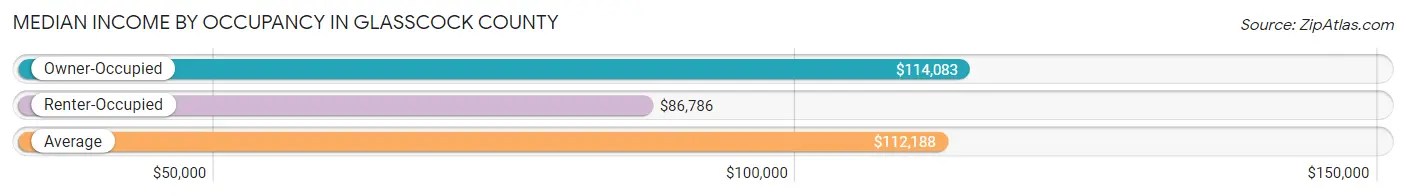
| Occupancy Type | # Households | Median Income |
| Owner-Occupied | 257 (61.9%) | $114,083 |
| Renter-Occupied | 158 (38.1%) | $86,786 |
| Average | 415 (100.0%) | $112,188 |
Occupancy by Householder Income Bracket in Glasscock County
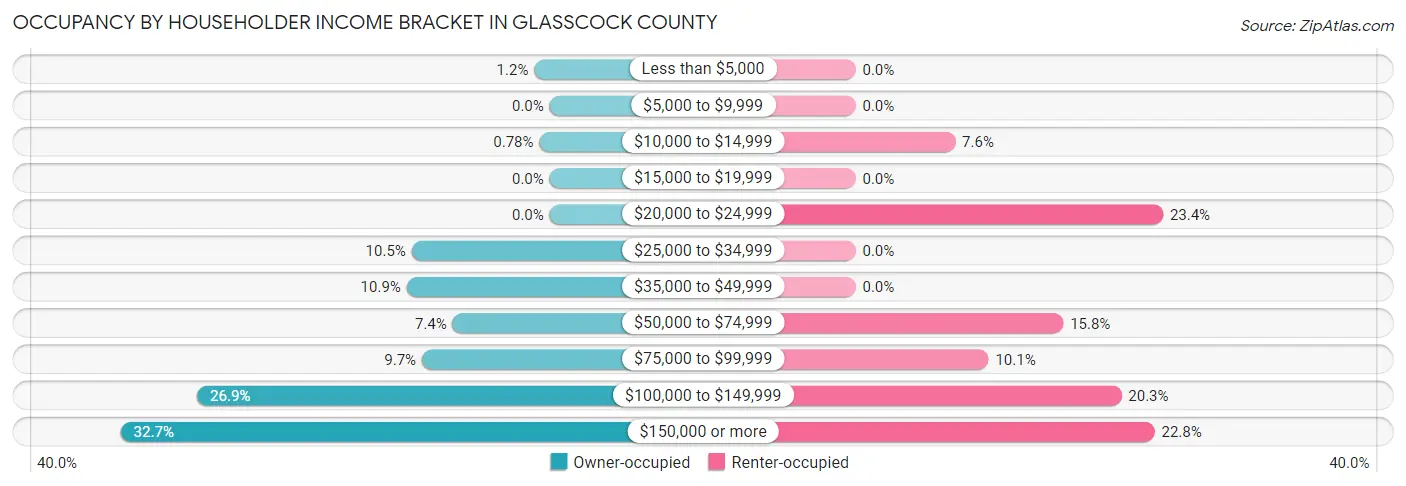
| Income Bracket | Owner-occupied | Renter-occupied |
| Less than $5,000 | 3 (1.2%) | 0 (0.0%) |
| $5,000 to $9,999 | 0 (0.0%) | 0 (0.0%) |
| $10,000 to $14,999 | 2 (0.8%) | 12 (7.6%) |
| $15,000 to $19,999 | 0 (0.0%) | 0 (0.0%) |
| $20,000 to $24,999 | 0 (0.0%) | 37 (23.4%) |
| $25,000 to $34,999 | 27 (10.5%) | 0 (0.0%) |
| $35,000 to $49,999 | 28 (10.9%) | 0 (0.0%) |
| $50,000 to $74,999 | 19 (7.4%) | 25 (15.8%) |
| $75,000 to $99,999 | 25 (9.7%) | 16 (10.1%) |
| $100,000 to $149,999 | 69 (26.9%) | 32 (20.3%) |
| $150,000 or more | 84 (32.7%) | 36 (22.8%) |
| Total | 257 (100.0%) | 158 (100.0%) |
Monthly Housing Cost Tiers in Glasscock County
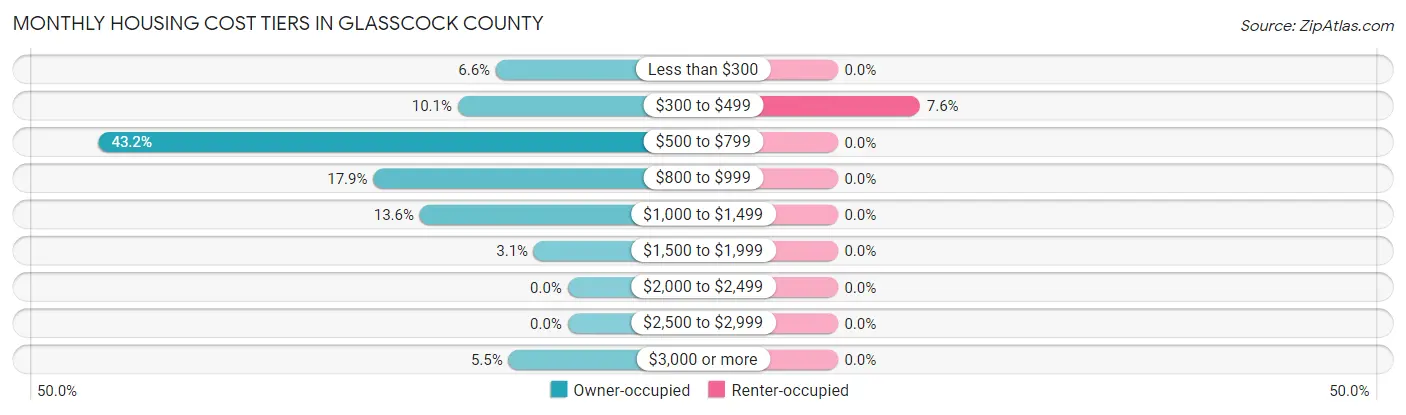
| Monthly Cost | Owner-occupied | Renter-occupied |
| Less than $300 | 17 (6.6%) | 0 (0.0%) |
| $300 to $499 | 26 (10.1%) | 12 (7.6%) |
| $500 to $799 | 111 (43.2%) | 0 (0.0%) |
| $800 to $999 | 46 (17.9%) | 0 (0.0%) |
| $1,000 to $1,499 | 35 (13.6%) | 0 (0.0%) |
| $1,500 to $1,999 | 8 (3.1%) | 0 (0.0%) |
| $2,000 to $2,499 | 0 (0.0%) | 0 (0.0%) |
| $2,500 to $2,999 | 0 (0.0%) | 0 (0.0%) |
| $3,000 or more | 14 (5.4%) | 0 (0.0%) |
| Total | 257 (100.0%) | 158 (100.0%) |
Physical Housing Characteristics in Glasscock County
Housing Structures in Glasscock County
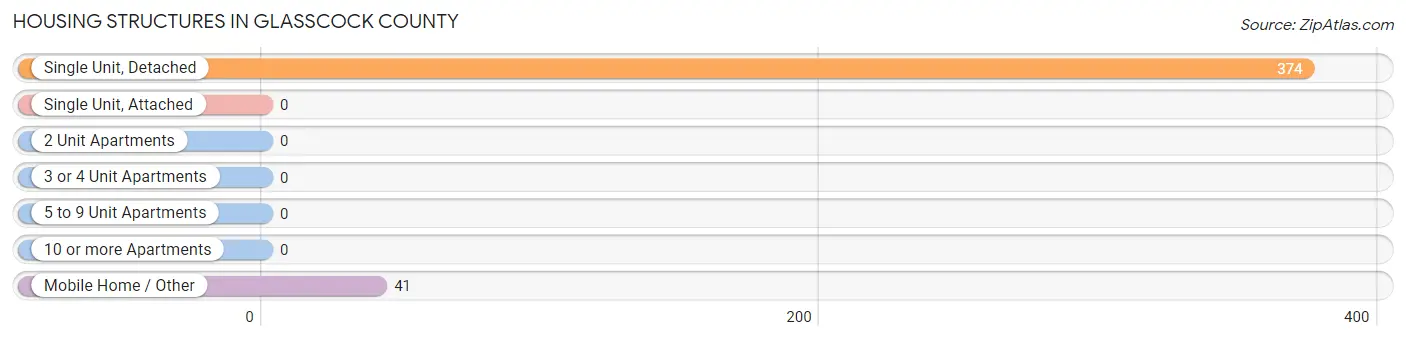
| Structure Type | # Housing Units | % Housing Units |
| Single Unit, Detached | 374 | 90.1% |
| Single Unit, Attached | 0 | 0.0% |
| 2 Unit Apartments | 0 | 0.0% |
| 3 or 4 Unit Apartments | 0 | 0.0% |
| 5 to 9 Unit Apartments | 0 | 0.0% |
| 10 or more Apartments | 0 | 0.0% |
| Mobile Home / Other | 41 | 9.9% |
| Total | 415 | 100.0% |
Housing Structures by Occupancy in Glasscock County
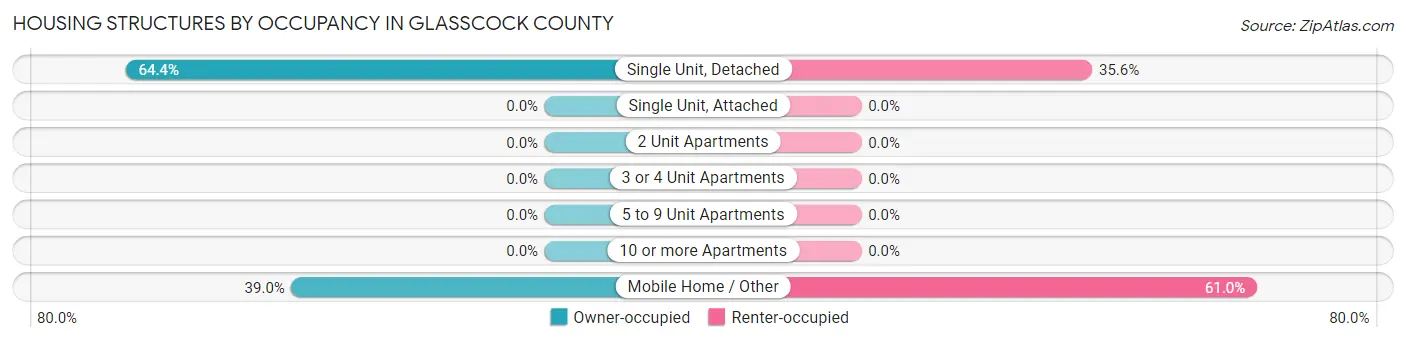
| Structure Type | Owner-occupied | Renter-occupied |
| Single Unit, Detached | 241 (64.4%) | 133 (35.6%) |
| Single Unit, Attached | 0 (0.0%) | 0 (0.0%) |
| 2 Unit Apartments | 0 (0.0%) | 0 (0.0%) |
| 3 or 4 Unit Apartments | 0 (0.0%) | 0 (0.0%) |
| 5 to 9 Unit Apartments | 0 (0.0%) | 0 (0.0%) |
| 10 or more Apartments | 0 (0.0%) | 0 (0.0%) |
| Mobile Home / Other | 16 (39.0%) | 25 (61.0%) |
| Total | 257 (61.9%) | 158 (38.1%) |
Housing Structures by Number of Rooms in Glasscock County
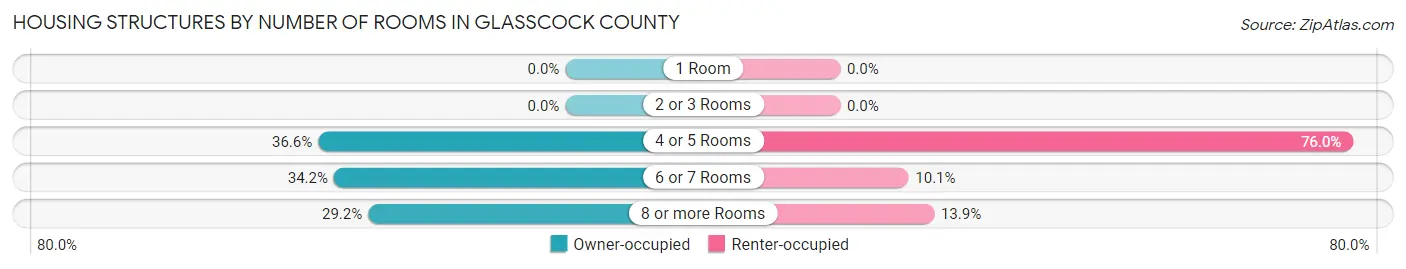
| Number of Rooms | Owner-occupied | Renter-occupied |
| 1 Room | 0 (0.0%) | 0 (0.0%) |
| 2 or 3 Rooms | 0 (0.0%) | 0 (0.0%) |
| 4 or 5 Rooms | 94 (36.6%) | 120 (75.9%) |
| 6 or 7 Rooms | 88 (34.2%) | 16 (10.1%) |
| 8 or more Rooms | 75 (29.2%) | 22 (13.9%) |
| Total | 257 (100.0%) | 158 (100.0%) |
Housing Structure by Heating Type in Glasscock County
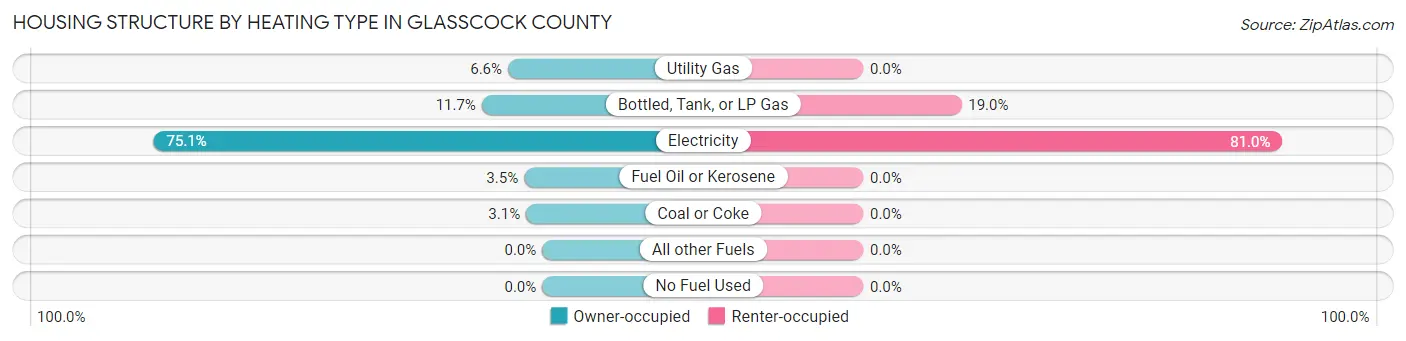
| Heating Type | Owner-occupied | Renter-occupied |
| Utility Gas | 17 (6.6%) | 0 (0.0%) |
| Bottled, Tank, or LP Gas | 30 (11.7%) | 30 (19.0%) |
| Electricity | 193 (75.1%) | 128 (81.0%) |
| Fuel Oil or Kerosene | 9 (3.5%) | 0 (0.0%) |
| Coal or Coke | 8 (3.1%) | 0 (0.0%) |
| All other Fuels | 0 (0.0%) | 0 (0.0%) |
| No Fuel Used | 0 (0.0%) | 0 (0.0%) |
| Total | 257 (100.0%) | 158 (100.0%) |
Household Vehicle Usage in Glasscock County
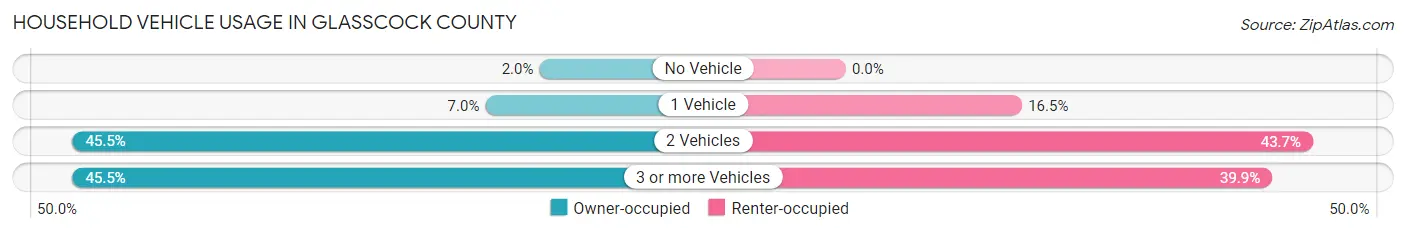
| Vehicles per Household | Owner-occupied | Renter-occupied |
| No Vehicle | 5 (1.9%) | 0 (0.0%) |
| 1 Vehicle | 18 (7.0%) | 26 (16.5%) |
| 2 Vehicles | 117 (45.5%) | 69 (43.7%) |
| 3 or more Vehicles | 117 (45.5%) | 63 (39.9%) |
| Total | 257 (100.0%) | 158 (100.0%) |
Real Estate & Mortgages in Glasscock County
Real Estate and Mortgage Overview in Glasscock County
| Characteristic | Without Mortgage | With Mortgage |
| Housing Units | 181 | 76 |
| Median Property Value | $295,600 | $166,900 |
| Median Household Income | $112,188 | $11 |
| Monthly Housing Costs | $634 | $14 |
| Real Estate Taxes | $1,372 | $0 |
Property Value by Mortgage Status in Glasscock County
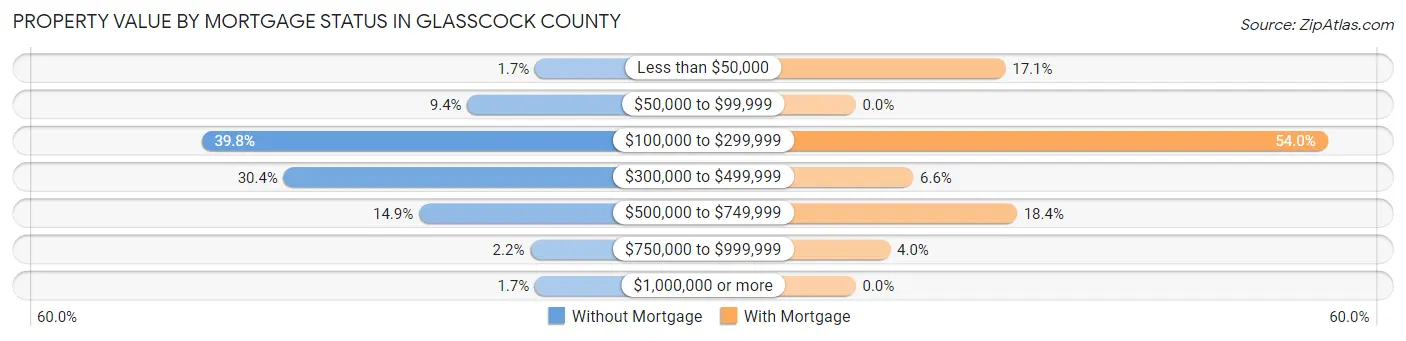
| Property Value | Without Mortgage | With Mortgage |
| Less than $50,000 | 3 (1.7%) | 13 (17.1%) |
| $50,000 to $99,999 | 17 (9.4%) | 0 (0.0%) |
| $100,000 to $299,999 | 72 (39.8%) | 41 (53.9%) |
| $300,000 to $499,999 | 55 (30.4%) | 5 (6.6%) |
| $500,000 to $749,999 | 27 (14.9%) | 14 (18.4%) |
| $750,000 to $999,999 | 4 (2.2%) | 3 (4.0%) |
| $1,000,000 or more | 3 (1.7%) | 0 (0.0%) |
| Total | 181 (100.0%) | 76 (100.0%) |
Household Income by Mortgage Status in Glasscock County
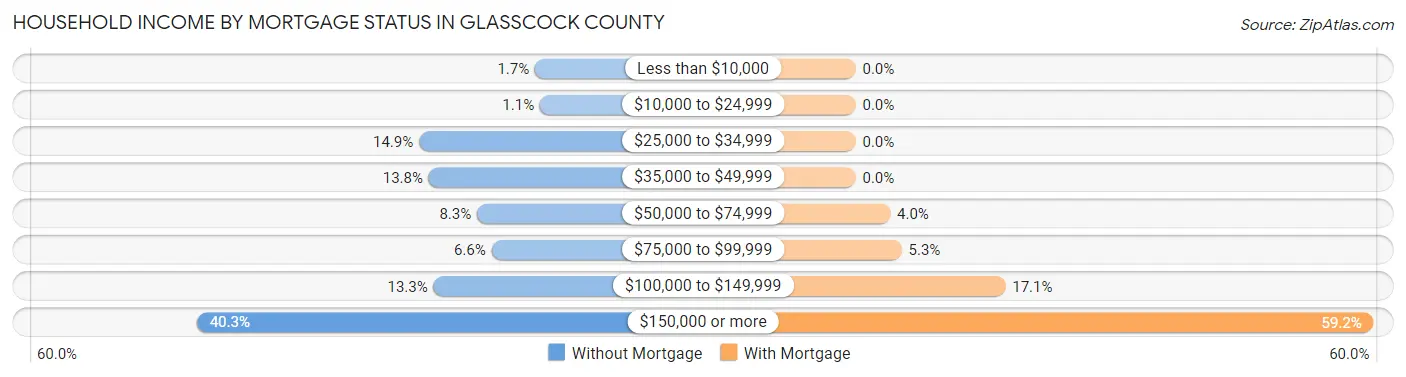
| Household Income | Without Mortgage | With Mortgage |
| Less than $10,000 | 3 (1.7%) | 0 (0.0%) |
| $10,000 to $24,999 | 2 (1.1%) | 0 (0.0%) |
| $25,000 to $34,999 | 27 (14.9%) | 0 (0.0%) |
| $35,000 to $49,999 | 25 (13.8%) | 0 (0.0%) |
| $50,000 to $74,999 | 15 (8.3%) | 3 (4.0%) |
| $75,000 to $99,999 | 12 (6.6%) | 4 (5.3%) |
| $100,000 to $149,999 | 24 (13.3%) | 13 (17.1%) |
| $150,000 or more | 73 (40.3%) | 45 (59.2%) |
| Total | 181 (100.0%) | 76 (100.0%) |
Property Value to Household Income Ratio in Glasscock County
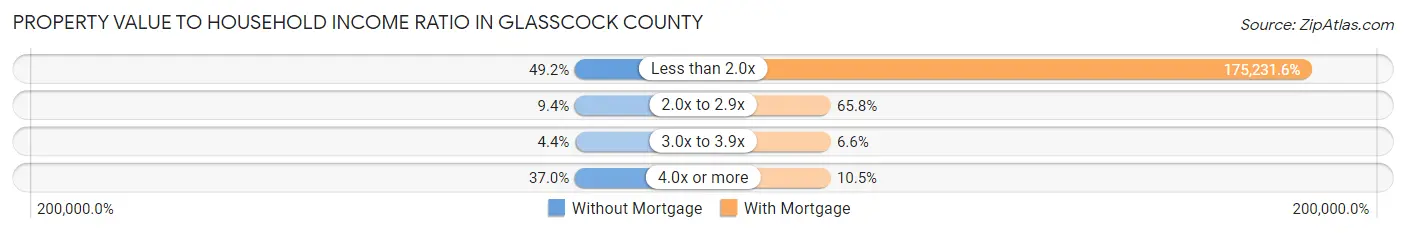
| Value-to-Income Ratio | Without Mortgage | With Mortgage |
| Less than 2.0x | 89 (49.2%) | 133,176 (175,231.6%) |
| 2.0x to 2.9x | 17 (9.4%) | 50 (65.8%) |
| 3.0x to 3.9x | 8 (4.4%) | 5 (6.6%) |
| 4.0x or more | 67 (37.0%) | 8 (10.5%) |
| Total | 181 (100.0%) | 76 (100.0%) |
Real Estate Taxes by Mortgage Status in Glasscock County
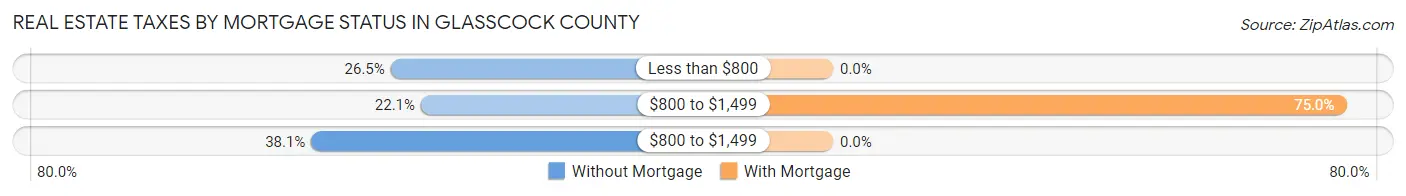
| Property Taxes | Without Mortgage | With Mortgage |
| Less than $800 | 48 (26.5%) | 0 (0.0%) |
| $800 to $1,499 | 40 (22.1%) | 57 (75.0%) |
| $800 to $1,499 | 69 (38.1%) | 0 (0.0%) |
| Total | 181 (100.0%) | 76 (100.0%) |
Health & Disability in Glasscock County
Health Insurance Coverage by Age in Glasscock County
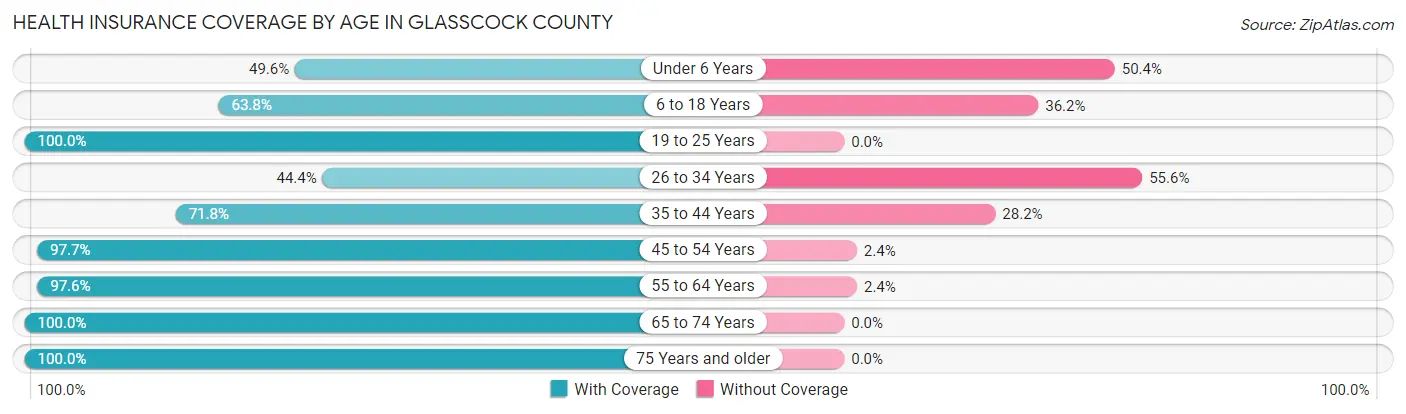
| Age Bracket | With Coverage | Without Coverage |
| Under 6 Years | 56 (49.6%) | 57 (50.4%) |
| 6 to 18 Years | 97 (63.8%) | 55 (36.2%) |
| 19 to 25 Years | 64 (100.0%) | 0 (0.0%) |
| 26 to 34 Years | 56 (44.4%) | 70 (55.6%) |
| 35 to 44 Years | 130 (71.8%) | 51 (28.2%) |
| 45 to 54 Years | 166 (97.7%) | 4 (2.4%) |
| 55 to 64 Years | 123 (97.6%) | 3 (2.4%) |
| 65 to 74 Years | 41 (100.0%) | 0 (0.0%) |
| 75 Years and older | 95 (100.0%) | 0 (0.0%) |
| Total | 828 (77.5%) | 240 (22.5%) |
Health Insurance Coverage by Citizenship Status in Glasscock County
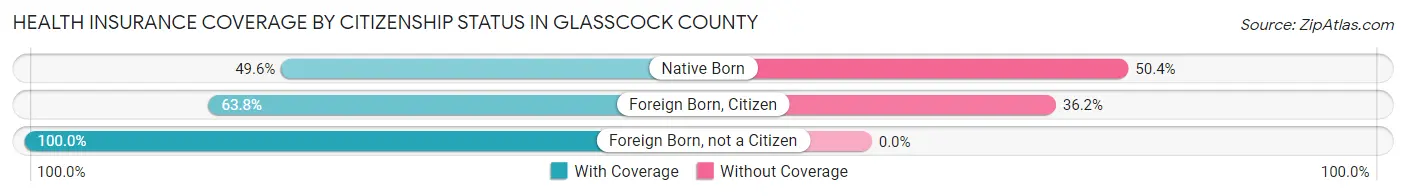
| Citizenship Status | With Coverage | Without Coverage |
| Native Born | 56 (49.6%) | 57 (50.4%) |
| Foreign Born, Citizen | 97 (63.8%) | 55 (36.2%) |
| Foreign Born, not a Citizen | 64 (100.0%) | 0 (0.0%) |
Health Insurance Coverage by Household Income in Glasscock County
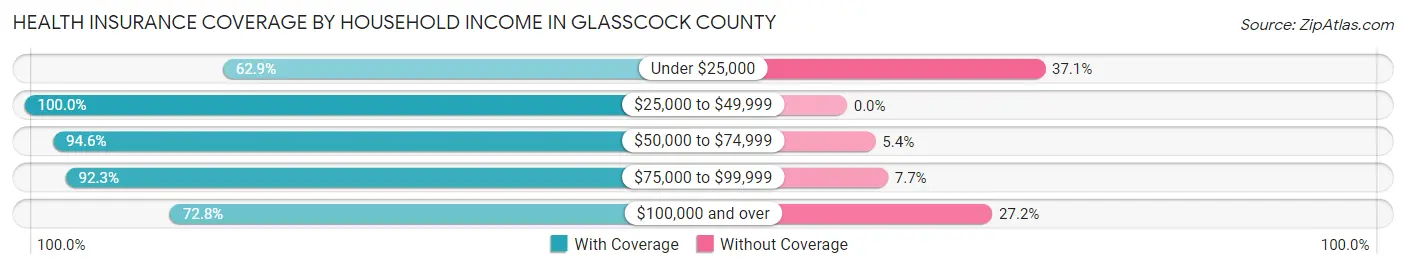
| Household Income | With Coverage | Without Coverage |
| Under $25,000 | 66 (62.9%) | 39 (37.1%) |
| $25,000 to $49,999 | 96 (100.0%) | 0 (0.0%) |
| $50,000 to $74,999 | 53 (94.6%) | 3 (5.4%) |
| $75,000 to $99,999 | 108 (92.3%) | 9 (7.7%) |
| $100,000 and over | 505 (72.8%) | 189 (27.2%) |
Public vs Private Health Insurance Coverage by Age in Glasscock County
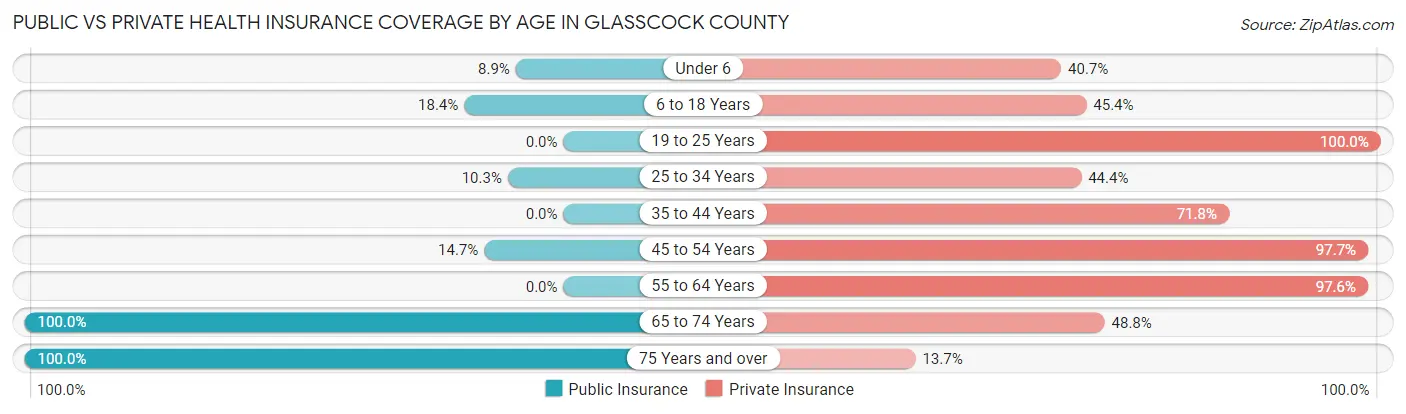
| Age Bracket | Public Insurance | Private Insurance |
| Under 6 | 10 (8.8%) | 46 (40.7%) |
| 6 to 18 Years | 28 (18.4%) | 69 (45.4%) |
| 19 to 25 Years | 0 (0.0%) | 64 (100.0%) |
| 25 to 34 Years | 13 (10.3%) | 56 (44.4%) |
| 35 to 44 Years | 0 (0.0%) | 130 (71.8%) |
| 45 to 54 Years | 25 (14.7%) | 166 (97.7%) |
| 55 to 64 Years | 0 (0.0%) | 123 (97.6%) |
| 65 to 74 Years | 41 (100.0%) | 20 (48.8%) |
| 75 Years and over | 95 (100.0%) | 13 (13.7%) |
| Total | 212 (19.9%) | 687 (64.3%) |
Disability Status by Sex by Age in Glasscock County
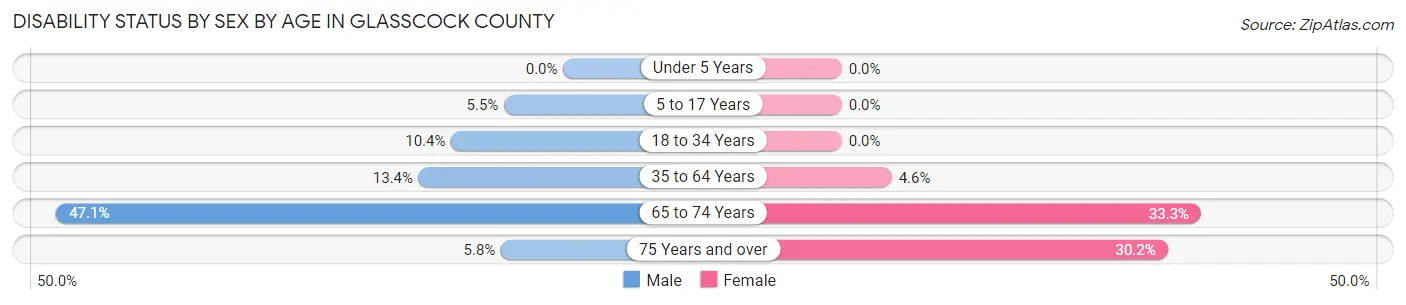
| Age Bracket | Male | Female |
| Under 5 Years | 0 (0.0%) | 0 (0.0%) |
| 5 to 17 Years | 10 (5.5%) | 0 (0.0%) |
| 18 to 34 Years | 13 (10.4%) | 0 (0.0%) |
| 35 to 64 Years | 35 (13.4%) | 10 (4.6%) |
| 65 to 74 Years | 8 (47.1%) | 8 (33.3%) |
| 75 Years and over | 3 (5.8%) | 13 (30.2%) |
Disability Class by Sex by Age in Glasscock County
Disability Class: Hearing Difficulty
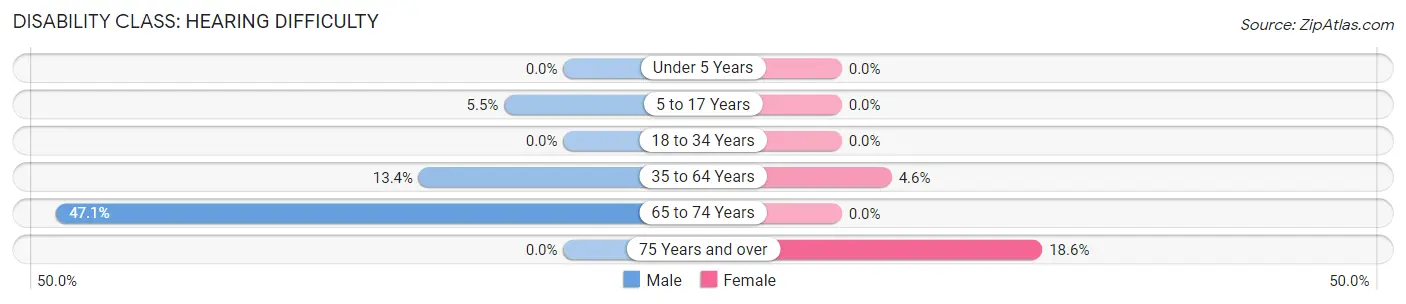
| Age Bracket | Male | Female |
| Under 5 Years | 0 (0.0%) | 0 (0.0%) |
| 5 to 17 Years | 10 (5.5%) | 0 (0.0%) |
| 18 to 34 Years | 0 (0.0%) | 0 (0.0%) |
| 35 to 64 Years | 35 (13.4%) | 10 (4.6%) |
| 65 to 74 Years | 8 (47.1%) | 0 (0.0%) |
| 75 Years and over | 0 (0.0%) | 8 (18.6%) |
Disability Class: Vision Difficulty
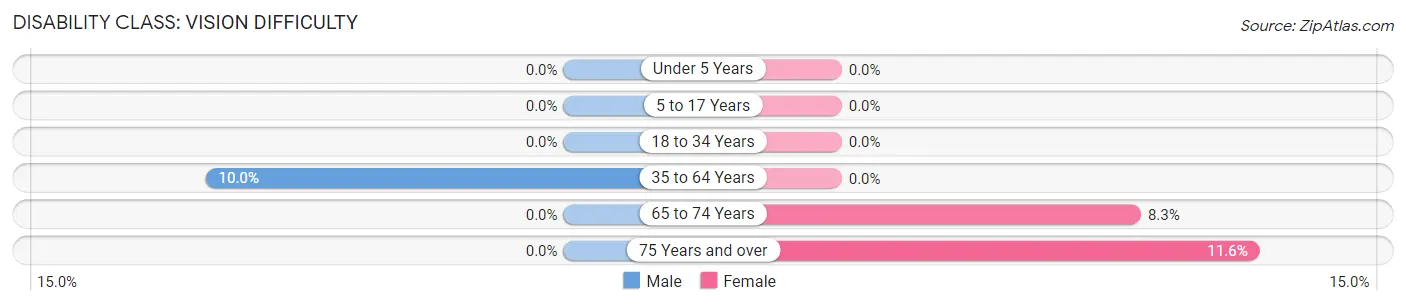
| Age Bracket | Male | Female |
| Under 5 Years | 0 (0.0%) | 0 (0.0%) |
| 5 to 17 Years | 0 (0.0%) | 0 (0.0%) |
| 18 to 34 Years | 0 (0.0%) | 0 (0.0%) |
| 35 to 64 Years | 26 (10.0%) | 0 (0.0%) |
| 65 to 74 Years | 0 (0.0%) | 2 (8.3%) |
| 75 Years and over | 0 (0.0%) | 5 (11.6%) |
Disability Class: Cognitive Difficulty
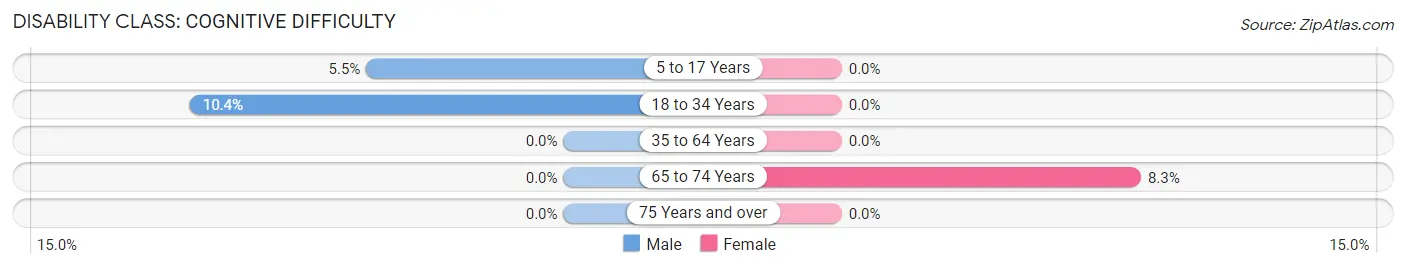
| Age Bracket | Male | Female |
| 5 to 17 Years | 10 (5.5%) | 0 (0.0%) |
| 18 to 34 Years | 13 (10.4%) | 0 (0.0%) |
| 35 to 64 Years | 0 (0.0%) | 0 (0.0%) |
| 65 to 74 Years | 0 (0.0%) | 2 (8.3%) |
| 75 Years and over | 0 (0.0%) | 0 (0.0%) |
Disability Class: Ambulatory Difficulty
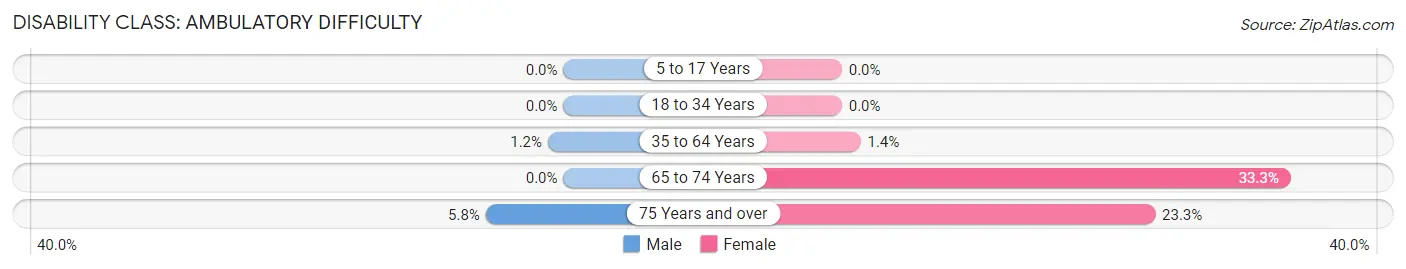
| Age Bracket | Male | Female |
| 5 to 17 Years | 0 (0.0%) | 0 (0.0%) |
| 18 to 34 Years | 0 (0.0%) | 0 (0.0%) |
| 35 to 64 Years | 3 (1.1%) | 3 (1.4%) |
| 65 to 74 Years | 0 (0.0%) | 8 (33.3%) |
| 75 Years and over | 3 (5.8%) | 10 (23.3%) |
Disability Class: Self-Care Difficulty
| Age Bracket | Male | Female |
| 5 to 17 Years | 0 (0.0%) | 0 (0.0%) |
| 18 to 34 Years | 0 (0.0%) | 0 (0.0%) |
| 35 to 64 Years | 0 (0.0%) | 0 (0.0%) |
| 65 to 74 Years | 0 (0.0%) | 0 (0.0%) |
| 75 Years and over | 0 (0.0%) | 0 (0.0%) |
Technology Access in Glasscock County
Computing Device Access in Glasscock County
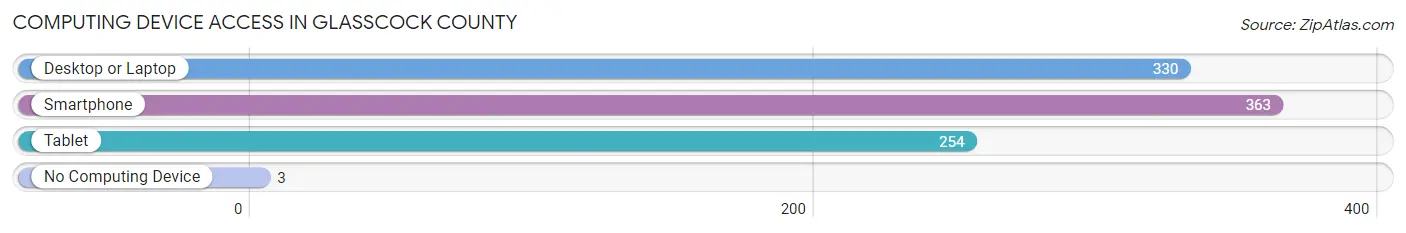
| Device Type | # Households | % Households |
| Desktop or Laptop | 330 | 79.5% |
| Smartphone | 363 | 87.5% |
| Tablet | 254 | 61.2% |
| No Computing Device | 3 | 0.7% |
| Total | 415 | 100.0% |
Internet Access in Glasscock County
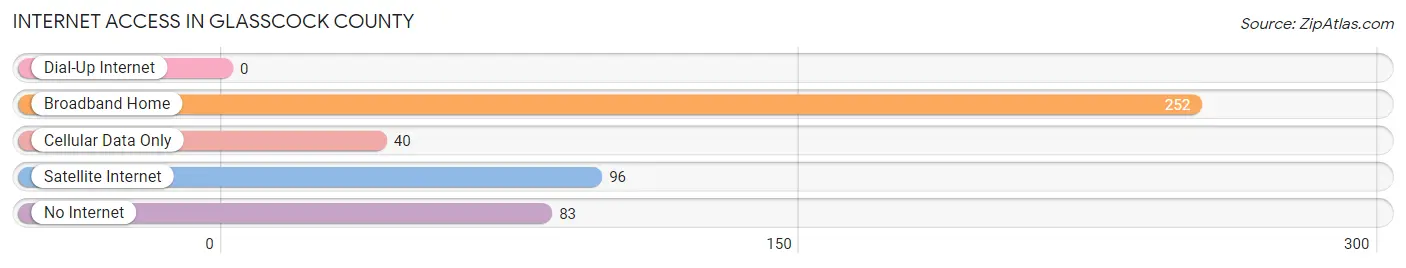
| Internet Type | # Households | % Households |
| Dial-Up Internet | 0 | 0.0% |
| Broadband Home | 252 | 60.7% |
| Cellular Data Only | 40 | 9.6% |
| Satellite Internet | 96 | 23.1% |
| No Internet | 83 | 20.0% |
| Total | 415 | 100.0% |
Glasscock County Summary
History
Located in the heart of the Permian Basin in West Texas, Glasscock County was established in 1887 and named after George Washington Glasscock, a prominent rancher and Confederate veteran. The county was originally part of Tom Green County, but was split off in 1887. The county seat is Garden City, which was established in 1891.
The first settlers in the area were ranchers, who were attracted to the area by the abundance of grass and water. The first cattle ranch in the county was established in 1876 by John and William Glasscock. The ranch was located on the Glasscock-Tom Green County line, and the brothers ran their cattle on both sides of the line.
The first settlers in the county were mostly ranchers, but by the early 1900s, the population had grown to include farmers, merchants, and other professionals. The county was largely agricultural, with cotton, corn, and wheat being the main crops.
The discovery of oil in the 1920s changed the face of Glasscock County. Oil and gas production quickly became the main industry in the county, and the population grew rapidly. By 1930, the population had grown to over 10,000, and the county seat of Garden City had become a bustling oil town.
The oil boom of the 1920s and 1930s brought prosperity to the county, but it also brought problems. The influx of people and money led to an increase in crime, and the county was plagued by bootlegging, gambling, and prostitution. The county also experienced a number of labor disputes, as oil workers sought better wages and working conditions.
The oil boom eventually ended, and the population of Glasscock County began to decline. By the 1970s, the population had dropped to just over 5,000. The county has since stabilized, and the population is now around 6,000.
Geography
Glasscock County is located in the Permian Basin region of West Texas. The county is bordered by Tom Green County to the north, Reagan County to the east, Upton County to the south, and Midland County to the west.
The county is mostly flat, with elevations ranging from 2,000 to 3,000 feet above sea level. The terrain is mostly covered in grasslands, with some areas of mesquite and cactus. The county is drained by the Colorado River, which flows through the northern part of the county.
Economy
Glasscock County is largely rural, and the economy is based on agriculture and oil and gas production. The county is home to several large oil and gas companies, including Chevron, ExxonMobil, and ConocoPhillips.
Agriculture is also an important part of the economy. The county is home to several large farms, which produce cotton, corn, wheat, and other crops.
Demographics
As of the 2010 census, Glasscock County had a population of 6,062. The population is largely white (90.2%), with small percentages of African American (3.2%), Hispanic (3.7%), and Native American (1.2%) residents.
The median household income in the county is $45,813, and the median family income is $51,917. The per capita income is $20,945. The unemployment rate is 4.2%.
Conclusion
Glasscock County is a rural county located in the Permian Basin region of West Texas. The county was established in 1887 and is named after George Washington Glasscock, a prominent rancher and Confederate veteran. The county is largely agricultural, with oil and gas production being the main industry. The population is largely white, with small percentages of African American, Hispanic, and Native American residents. The median household income is $45,813, and the unemployment rate is 4.2%.
Common Questions
What is Per Capita Income in Glasscock County?
Per Capita income in Glasscock County is $50,449.
What is the Median Family Income in Glasscock County?
Median Family Income in Glasscock County is $132,945.
What is the Median Household income in Glasscock County?
Median Household Income in Glasscock County is $112,188.
What is Income or Wage Gap in Glasscock County?
Income or Wage Gap in Glasscock County is 25.3%.
Women in Glasscock County earn 74.7 cents for every dollar earned by a man.
What is Inequality or Gini Index in Glasscock County?
Inequality or Gini Index in Glasscock County is 0.44.
What is the Total Population of Glasscock County?
Total Population of Glasscock County is 1,068.
What is the Total Male Population of Glasscock County?
Total Male Population of Glasscock County is 683.
What is the Total Female Population of Glasscock County?
Total Female Population of Glasscock County is 385.
What is the Ratio of Males per 100 Females in Glasscock County?
There are 177.40 Males per 100 Females in Glasscock County.
What is the Ratio of Females per 100 Males in Glasscock County?
There are 56.37 Females per 100 Males in Glasscock County.
What is the Median Population Age in Glasscock County?
Median Population Age in Glasscock County is 38.8 Years.
What is the Average Family Size in Glasscock County
Average Family Size in Glasscock County is 2.9 People.
What is the Average Household Size in Glasscock County
Average Household Size in Glasscock County is 2.6 People.
How Large is the Labor Force in Glasscock County?
There are 469 People in the Labor Forcein in Glasscock County.
What is the Percentage of People in the Labor Force in Glasscock County?
55.2% of People are in the Labor Force in Glasscock County.
What is the Unemployment Rate in Glasscock County?
Unemployment Rate in Glasscock County is 1.3%.