Culberson County, TX Map & Demographics
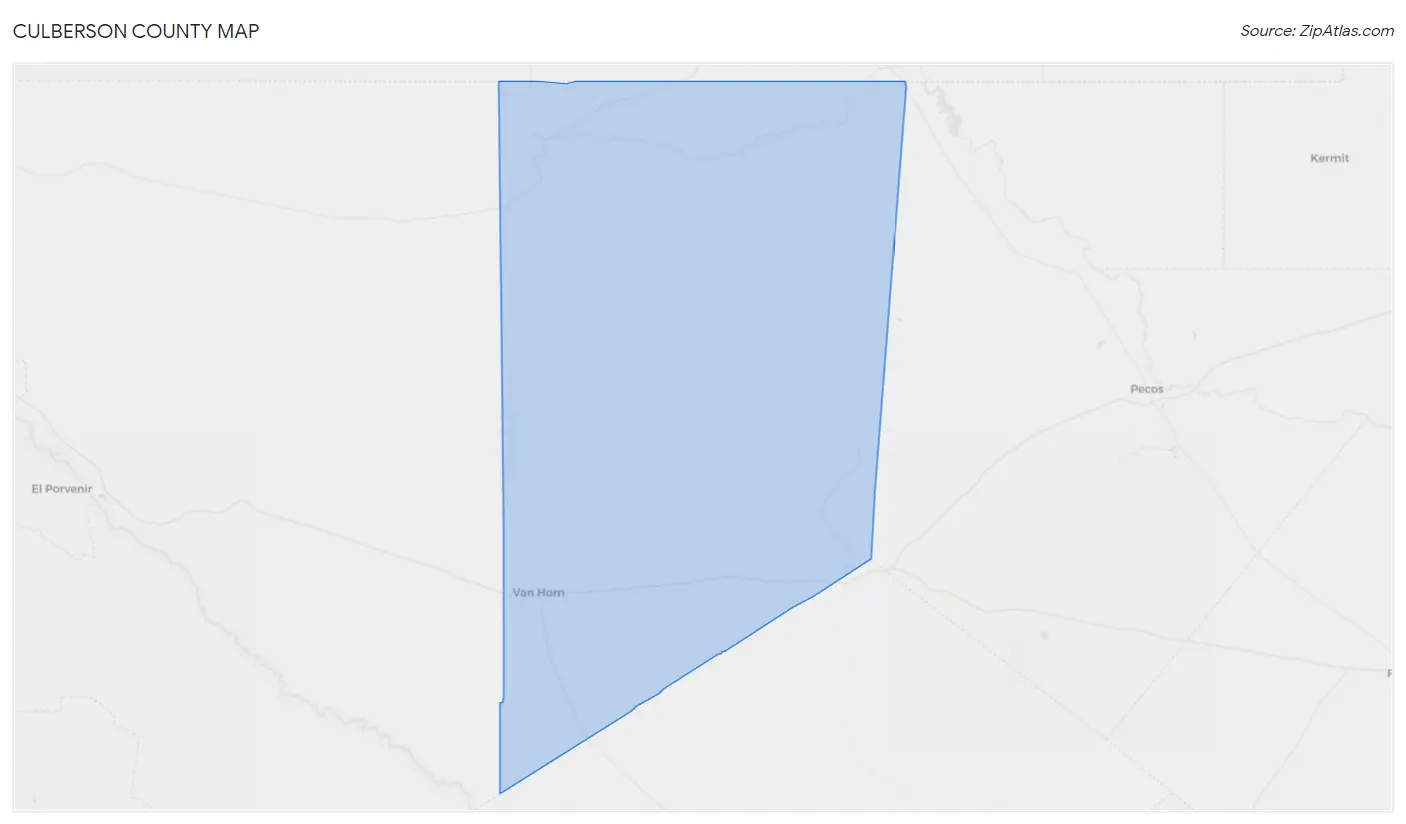
Culberson County Map
Culberson County Overview
$29,295
PER CAPITA INCOME
$46,513
AVG FAMILY INCOME
$35,924
AVG HOUSEHOLD INCOME
43.0%
WAGE / INCOME GAP [ % ]
57.0¢/ $1
WAGE / INCOME GAP [ $ ]
0.43
INEQUALITY / GINI INDEX
2,181
TOTAL POPULATION
1,343
MALE POPULATION
838
FEMALE POPULATION
160.26
MALES / 100 FEMALES
62.40
FEMALES / 100 MALES
47.5
MEDIAN AGE
4.6
AVG FAMILY SIZE
3.4
AVG HOUSEHOLD SIZE
1,035
LABOR FORCE [ PEOPLE ]
55.4%
PERCENT IN LABOR FORCE
10.1%
UNEMPLOYMENT RATE
Culberson County Area Codes
Income in Culberson County
Income Overview in Culberson County
Per Capita Income in Culberson County is $29,295, while median incomes of families and households are $46,513 and $35,924 respectively.
| Characteristic | Number | Measure |
| Per Capita Income | 2,181 | $29,295 |
| Median Family Income | 343 | $46,513 |
| Mean Family Income | 343 | $53,272 |
| Median Household Income | 629 | $35,924 |
| Mean Household Income | 629 | $48,200 |
| Income Deficit | 343 | $0 |
| Wage / Income Gap (%) | 2,181 | 43.00% |
| Wage / Income Gap ($) | 2,181 | 57.00¢ per $1 |
| Gini / Inequality Index | 2,181 | 0.43 |
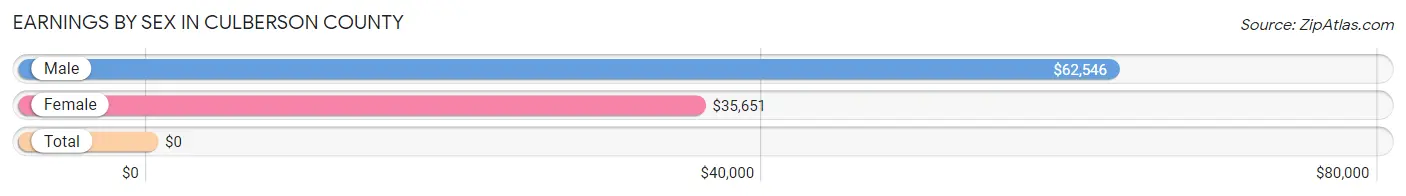
Earnings by Sex in Culberson County
| Sex | Number | Average Earnings |
| Male | 678 (63.8%) | $62,546 |
| Female | 385 (36.2%) | $35,651 |
| Total | 1,063 (100.0%) | $0 |
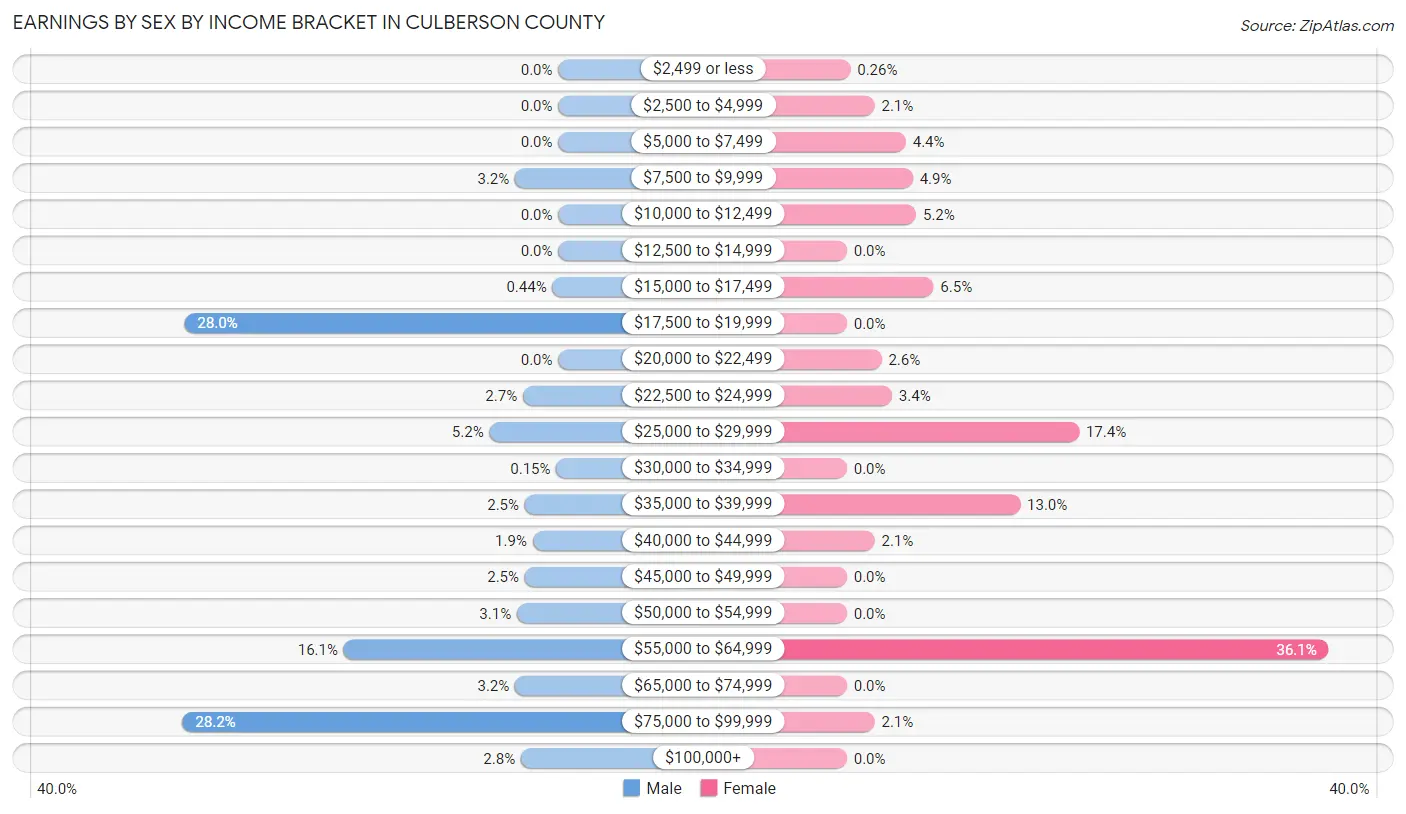
Earnings by Sex by Income Bracket in Culberson County
The most common earnings brackets in Culberson County are $75,000 to $99,999 for men (191 | 28.2%) and $55,000 to $64,999 for women (139 | 36.1%).
| Income | Male | Female |
| $2,499 or less | 0 (0.0%) | 1 (0.3%) |
| $2,500 to $4,999 | 0 (0.0%) | 8 (2.1%) |
| $5,000 to $7,499 | 0 (0.0%) | 17 (4.4%) |
| $7,500 to $9,999 | 22 (3.2%) | 19 (4.9%) |
| $10,000 to $12,499 | 0 (0.0%) | 20 (5.2%) |
| $12,500 to $14,999 | 0 (0.0%) | 0 (0.0%) |
| $15,000 to $17,499 | 3 (0.4%) | 25 (6.5%) |
| $17,500 to $19,999 | 190 (28.0%) | 0 (0.0%) |
| $20,000 to $22,499 | 0 (0.0%) | 10 (2.6%) |
| $22,500 to $24,999 | 18 (2.6%) | 13 (3.4%) |
| $25,000 to $29,999 | 35 (5.2%) | 67 (17.4%) |
| $30,000 to $34,999 | 1 (0.2%) | 0 (0.0%) |
| $35,000 to $39,999 | 17 (2.5%) | 50 (13.0%) |
| $40,000 to $44,999 | 13 (1.9%) | 8 (2.1%) |
| $45,000 to $49,999 | 17 (2.5%) | 0 (0.0%) |
| $50,000 to $54,999 | 21 (3.1%) | 0 (0.0%) |
| $55,000 to $64,999 | 109 (16.1%) | 139 (36.1%) |
| $65,000 to $74,999 | 22 (3.2%) | 0 (0.0%) |
| $75,000 to $99,999 | 191 (28.2%) | 8 (2.1%) |
| $100,000+ | 19 (2.8%) | 0 (0.0%) |
| Total | 678 (100.0%) | 385 (100.0%) |
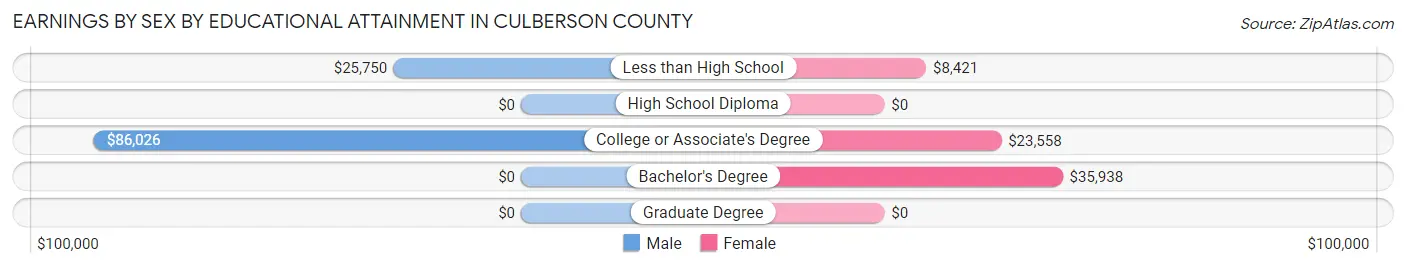
Earnings by Sex by Educational Attainment in Culberson County
| Educational Attainment | Male Income | Female Income |
| Less than High School | $25,750 | $8,421 |
| High School Diploma | - | - |
| College or Associate's Degree | $86,026 | $23,558 |
| Bachelor's Degree | - | - |
| Graduate Degree | - | - |
| Total | $63,670 | $0 |
Family Income in Culberson County
Family Income Brackets in Culberson County
According to the Culberson County family income data, there are 111 families falling into the $50,000 to $74,999 income range, which is the most common income bracket and makes up 32.4% of all families.
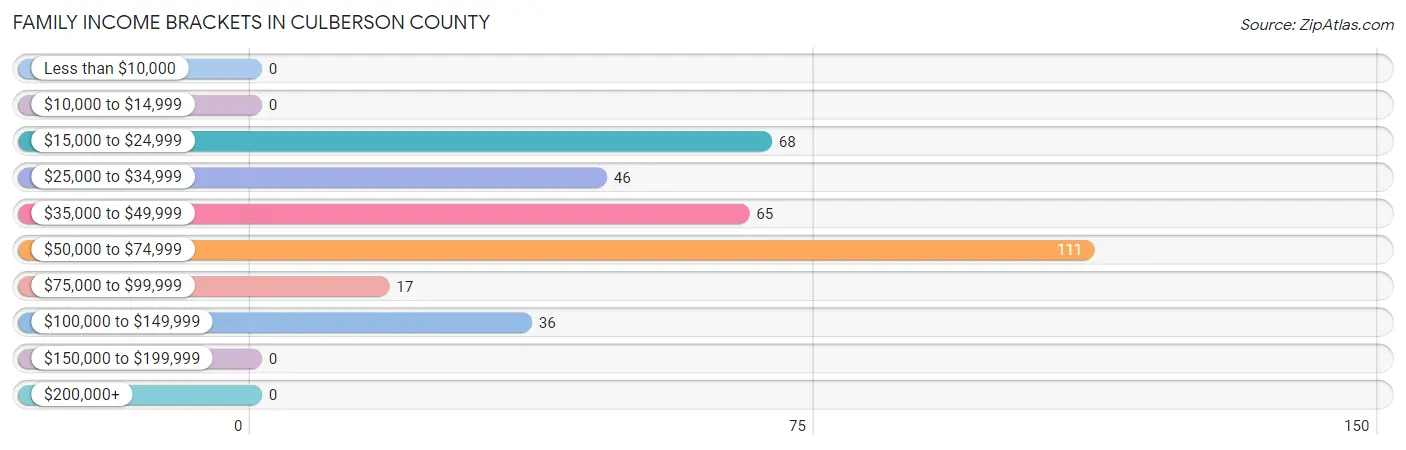
| Income Bracket | # Families | % Families |
| Less than $10,000 | 0 | 0.0% |
| $10,000 to $14,999 | 0 | 0.0% |
| $15,000 to $24,999 | 68 | 19.8% |
| $25,000 to $34,999 | 46 | 13.4% |
| $35,000 to $49,999 | 65 | 19.0% |
| $50,000 to $74,999 | 111 | 32.4% |
| $75,000 to $99,999 | 17 | 5.0% |
| $100,000 to $149,999 | 36 | 10.5% |
| $150,000 to $199,999 | 0 | 0.0% |
| $200,000+ | 0 | 0.0% |
Family Income by Famaliy Size in Culberson County
3-person families (34 | 9.9%) account for the highest median family income in Culberson County with $65,909 per family, while 3-person families (34 | 9.9%) have the highest median income of $21,970 per family member.
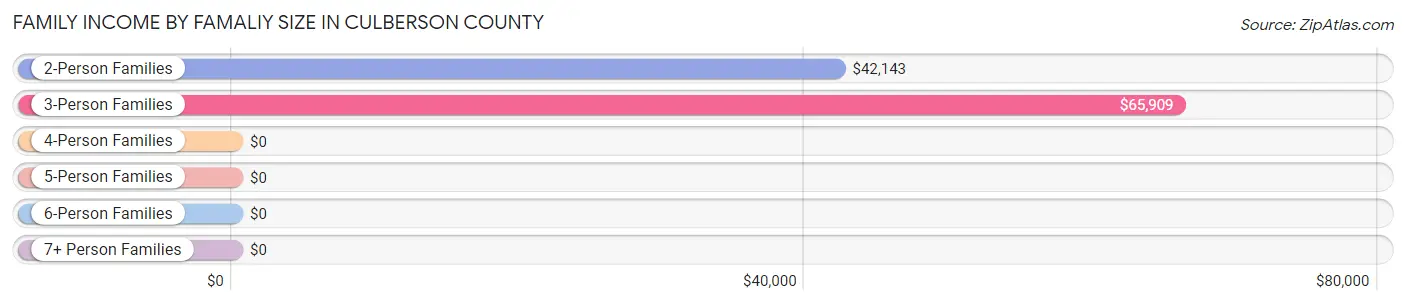
| Income Bracket | # Families | Median Income |
| 2-Person Families | 254 (74.1%) | $42,143 |
| 3-Person Families | 34 (9.9%) | $65,909 |
| 4-Person Families | 33 (9.6%) | $0 |
| 5-Person Families | 0 (0.0%) | $0 |
| 6-Person Families | 22 (6.4%) | $0 |
| 7+ Person Families | 0 (0.0%) | $0 |
| Total | 343 (100.0%) | $46,513 |
Family Income by Number of Earners in Culberson County
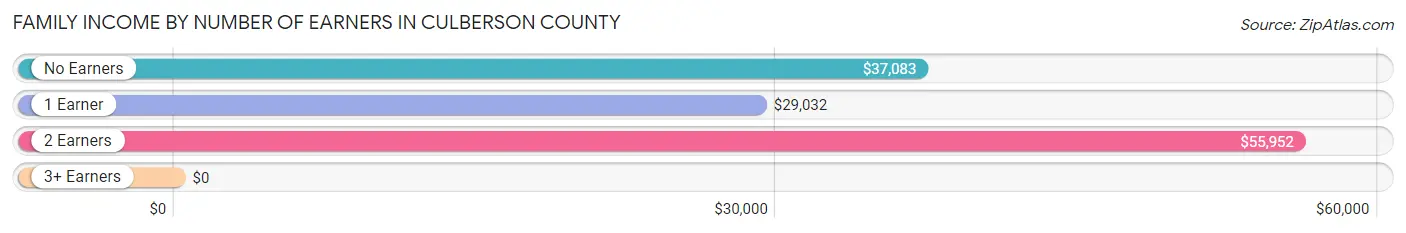
| Number of Earners | # Families | Median Income |
| No Earners | 115 (33.5%) | $37,083 |
| 1 Earner | 114 (33.2%) | $29,032 |
| 2 Earners | 82 (23.9%) | $55,952 |
| 3+ Earners | 32 (9.3%) | $0 |
| Total | 343 (100.0%) | $46,513 |
Household Income in Culberson County
Household Income Brackets in Culberson County
With 124 households falling in the category, the $50,000 to $74,999 income range is the most frequent in Culberson County, accounting for 19.7% of all households.
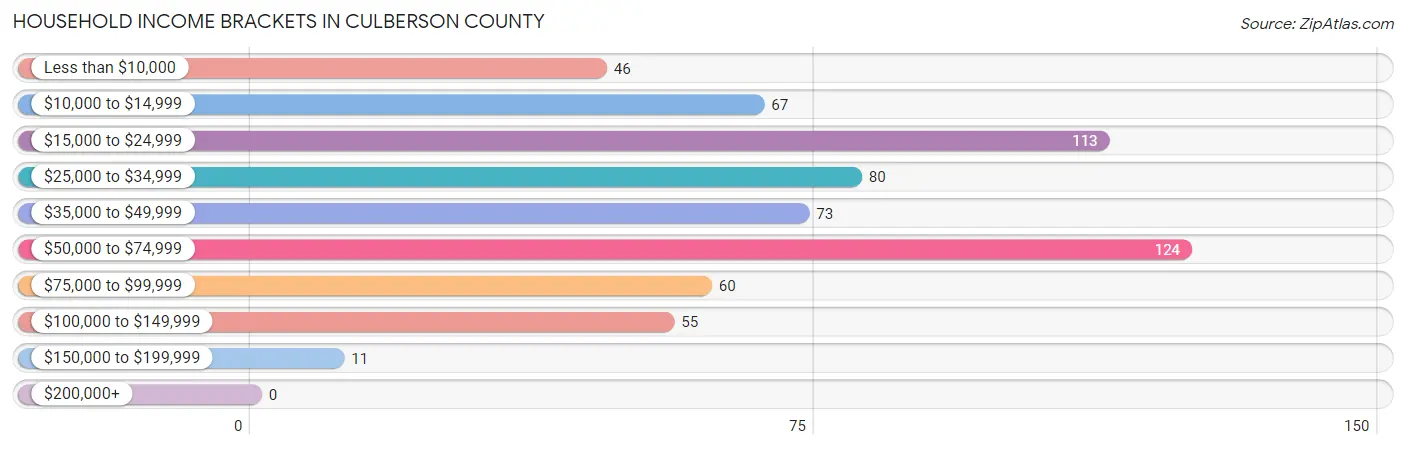
| Income Bracket | # Households | % Households |
| Less than $10,000 | 46 | 7.3% |
| $10,000 to $14,999 | 67 | 10.7% |
| $15,000 to $24,999 | 113 | 18.0% |
| $25,000 to $34,999 | 80 | 12.7% |
| $35,000 to $49,999 | 73 | 11.6% |
| $50,000 to $74,999 | 124 | 19.7% |
| $75,000 to $99,999 | 60 | 9.5% |
| $100,000 to $149,999 | 55 | 8.7% |
| $150,000 to $199,999 | 11 | 1.7% |
| $200,000+ | 0 | 0.0% |
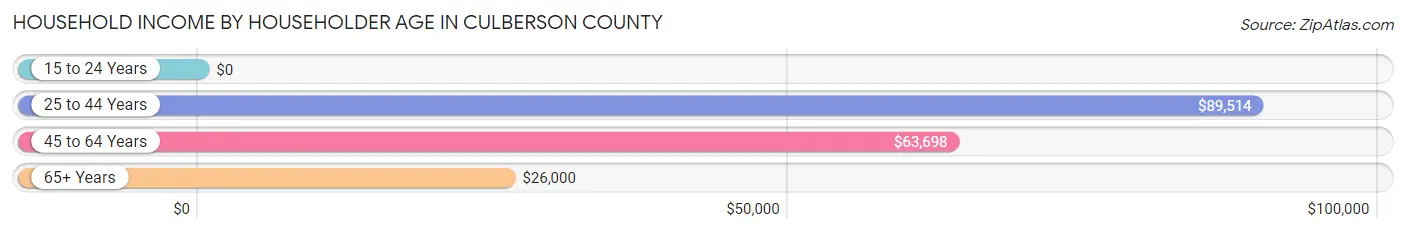
Household Income by Householder Age in Culberson County
The median household income in Culberson County is $35,924, with the highest median household income of $89,514 found in the 25 to 44 years age bracket for the primary householder. A total of 95 households (15.1%) fall into this category. Meanwhile, the 15 to 24 years age bracket for the primary householder has the lowest median household income of $0, with 3 households (0.5%) in this group.
| Income Bracket | # Households | Median Income |
| 15 to 24 Years | 3 (0.5%) | $0 |
| 25 to 44 Years | 95 (15.1%) | $89,514 |
| 45 to 64 Years | 143 (22.7%) | $63,698 |
| 65+ Years | 388 (61.7%) | $26,000 |
| Total | 629 (100.0%) | $35,924 |
Poverty in Culberson County
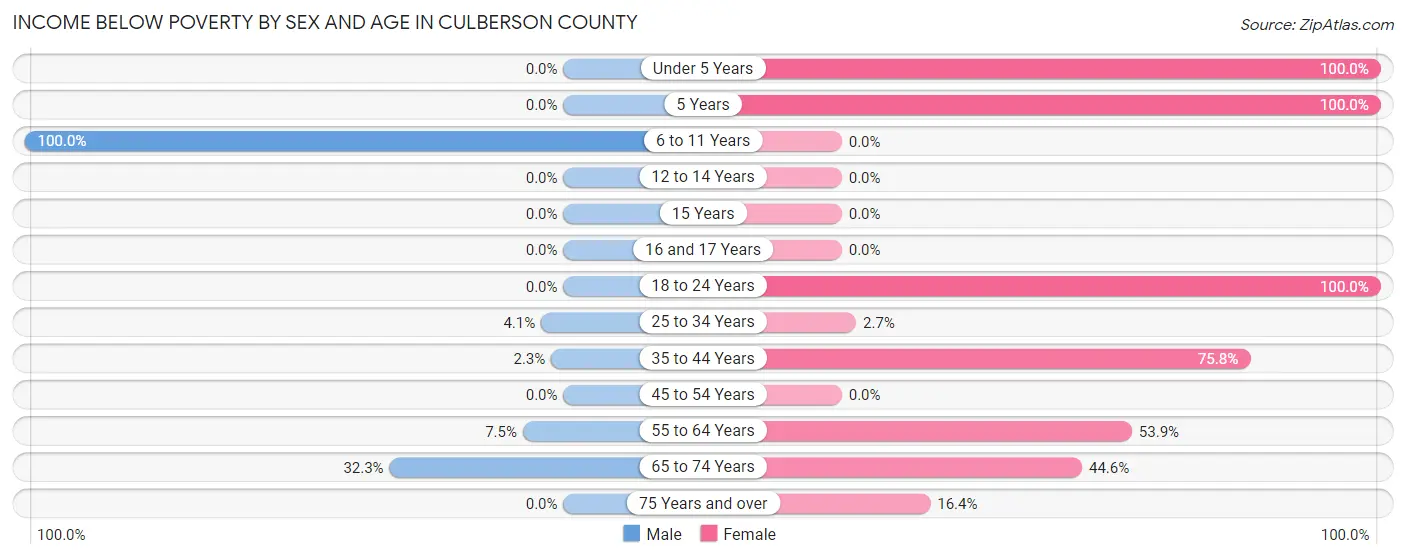
Income Below Poverty by Sex and Age in Culberson County
With 16.8% poverty level for males and 30.7% for females among the residents of Culberson County, 6 to 11 year old males and under 5 year old females are the most vulnerable to poverty, with 154 males (100.0%) and 33 females (100.0%) in their respective age groups living below the poverty level.
| Age Bracket | Male | Female |
| Under 5 Years | 0 (0.0%) | 33 (100.0%) |
| 5 Years | 0 (0.0%) | 34 (100.0%) |
| 6 to 11 Years | 154 (100.0%) | 0 (0.0%) |
| 12 to 14 Years | 0 (0.0%) | 0 (0.0%) |
| 15 Years | 0 (0.0%) | 0 (0.0%) |
| 16 and 17 Years | 0 (0.0%) | 0 (0.0%) |
| 18 to 24 Years | 0 (0.0%) | 54 (100.0%) |
| 25 to 34 Years | 7 (4.1%) | 3 (2.6%) |
| 35 to 44 Years | 4 (2.3%) | 25 (75.8%) |
| 45 to 54 Years | 0 (0.0%) | 0 (0.0%) |
| 55 to 64 Years | 7 (7.5%) | 35 (53.8%) |
| 65 to 74 Years | 51 (32.3%) | 62 (44.6%) |
| 75 Years and over | 0 (0.0%) | 11 (16.4%) |
| Total | 223 (16.8%) | 257 (30.7%) |
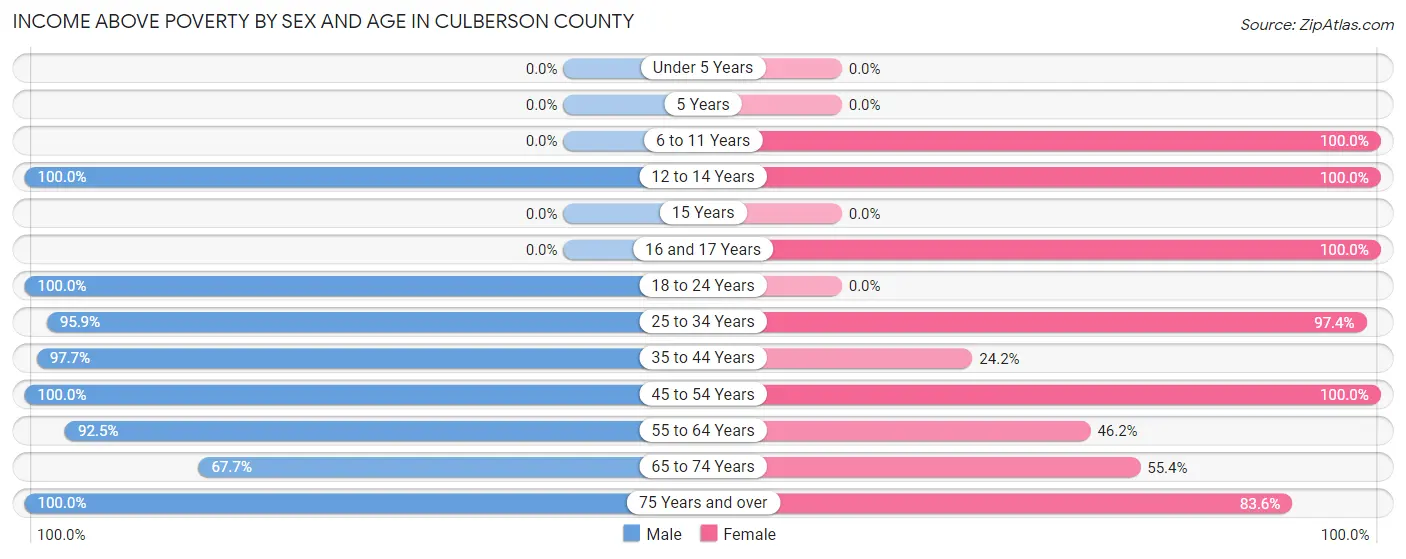
Income Above Poverty by Sex and Age in Culberson County
According to the poverty statistics in Culberson County, males aged 12 to 14 years and females aged 6 to 11 years are the age groups that are most secure financially, with 100.0% of males and 100.0% of females in these age groups living above the poverty line.
| Age Bracket | Male | Female |
| Under 5 Years | 0 (0.0%) | 0 (0.0%) |
| 5 Years | 0 (0.0%) | 0 (0.0%) |
| 6 to 11 Years | 0 (0.0%) | 43 (100.0%) |
| 12 to 14 Years | 35 (100.0%) | 14 (100.0%) |
| 15 Years | 0 (0.0%) | 0 (0.0%) |
| 16 and 17 Years | 0 (0.0%) | 19 (100.0%) |
| 18 to 24 Years | 98 (100.0%) | 0 (0.0%) |
| 25 to 34 Years | 162 (95.9%) | 110 (97.4%) |
| 35 to 44 Years | 172 (97.7%) | 8 (24.2%) |
| 45 to 54 Years | 338 (100.0%) | 222 (100.0%) |
| 55 to 64 Years | 86 (92.5%) | 30 (46.2%) |
| 65 to 74 Years | 107 (67.7%) | 77 (55.4%) |
| 75 Years and over | 109 (100.0%) | 56 (83.6%) |
| Total | 1,107 (83.2%) | 579 (69.3%) |
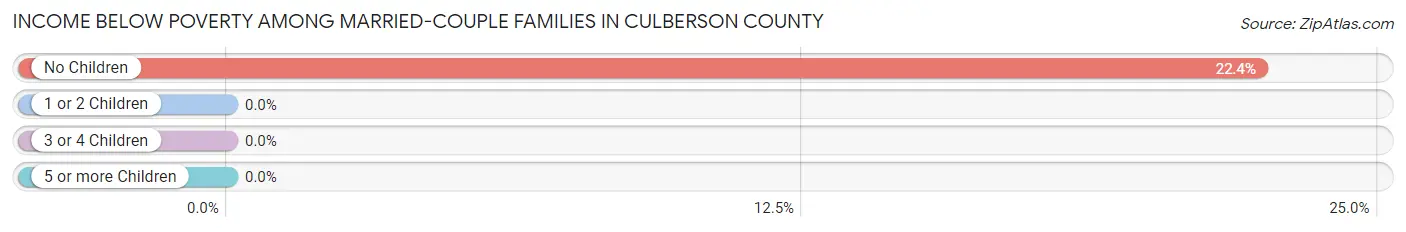
Income Below Poverty Among Married-Couple Families in Culberson County
The poverty statistics for married-couple families in Culberson County show that 18.1% or 39 of the total 215 families live below the poverty line. Families with no children have the highest poverty rate of 22.4%, comprising of 39 families. On the other hand, families with 1 or 2 children have the lowest poverty rate of 0.0%, which includes 0 families.
| Children | Above Poverty | Below Poverty |
| No Children | 135 (77.6%) | 39 (22.4%) |
| 1 or 2 Children | 19 (100.0%) | 0 (0.0%) |
| 3 or 4 Children | 22 (100.0%) | 0 (0.0%) |
| 5 or more Children | 0 (0.0%) | 0 (0.0%) |
| Total | 176 (81.9%) | 39 (18.1%) |
Income Below Poverty Among Single-Parent Households in Culberson County
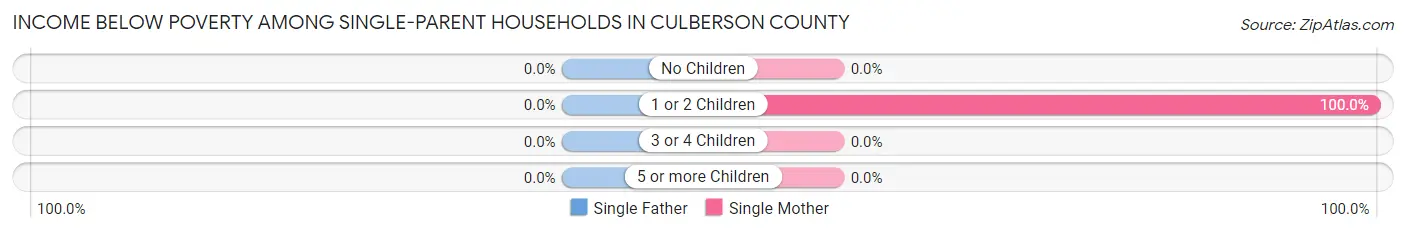
| Children | Single Father | Single Mother |
| No Children | 0 (0.0%) | 0 (0.0%) |
| 1 or 2 Children | 0 (0.0%) | 28 (100.0%) |
| 3 or 4 Children | 0 (0.0%) | 0 (0.0%) |
| 5 or more Children | 0 (0.0%) | 0 (0.0%) |
| Total | 0 (0.0%) | 28 (52.8%) |
Income Below Poverty Among Married-Couple vs Single-Parent Households in Culberson County
The poverty data for Culberson County shows that 39 of the married-couple family households (18.1%) and 28 of the single-parent households (21.9%) are living below the poverty level. Within the married-couple family households, those with no children have the highest poverty rate, with 39 households (22.4%) falling below the poverty line. Among the single-parent households, those with 1 or 2 children have the highest poverty rate, with 28 household (100.0%) living below poverty.
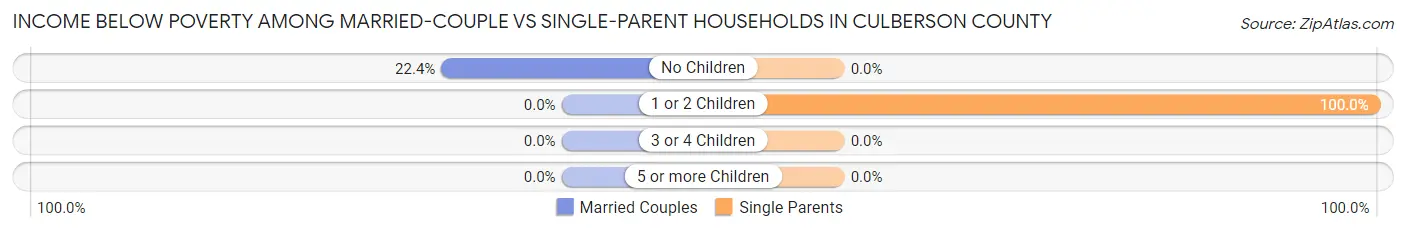
| Children | Married-Couple Families | Single-Parent Households |
| No Children | 39 (22.4%) | 0 (0.0%) |
| 1 or 2 Children | 0 (0.0%) | 28 (100.0%) |
| 3 or 4 Children | 0 (0.0%) | 0 (0.0%) |
| 5 or more Children | 0 (0.0%) | 0 (0.0%) |
| Total | 39 (18.1%) | 28 (21.9%) |
Race in Culberson County
The most populous races in Culberson County are Hispanic or Latino (1,774 | 81.3%), White / Caucasian (986 | 45.2%), and Two or more Races (802 | 36.8%).
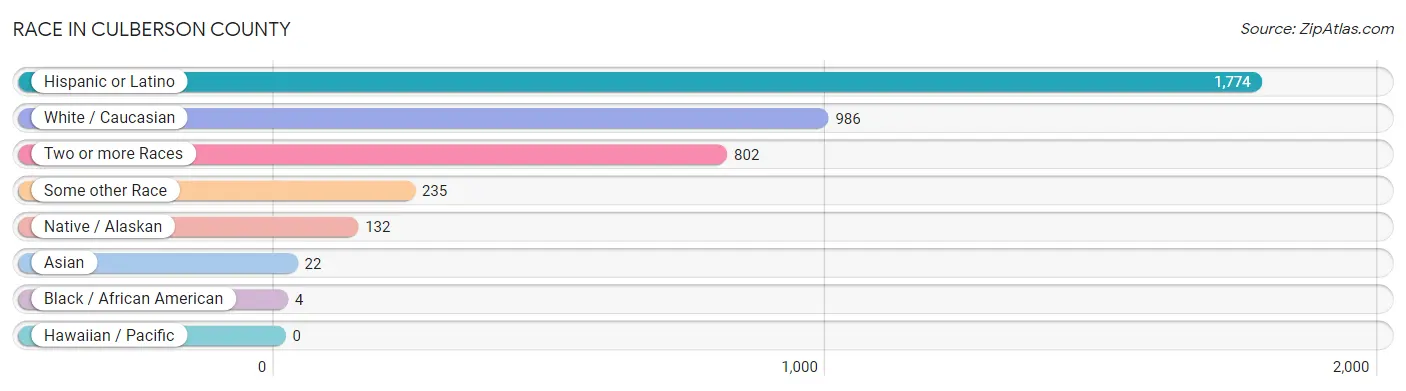
| Race | # Population | % Population |
| Asian | 22 | 1.0% |
| Black / African American | 4 | 0.2% |
| Hawaiian / Pacific | 0 | 0.0% |
| Hispanic or Latino | 1,774 | 81.3% |
| Native / Alaskan | 132 | 6.0% |
| White / Caucasian | 986 | 45.2% |
| Two or more Races | 802 | 36.8% |
| Some other Race | 235 | 10.8% |
| Total | 2,181 | 100.0% |
Ancestry in Culberson County
The most populous ancestries reported in Culberson County are Mexican (1,739 | 79.7%), German (113 | 5.2%), Navajo (109 | 5.0%), Irish (75 | 3.4%), and American (47 | 2.1%), together accounting for 95.5% of all Culberson County residents.
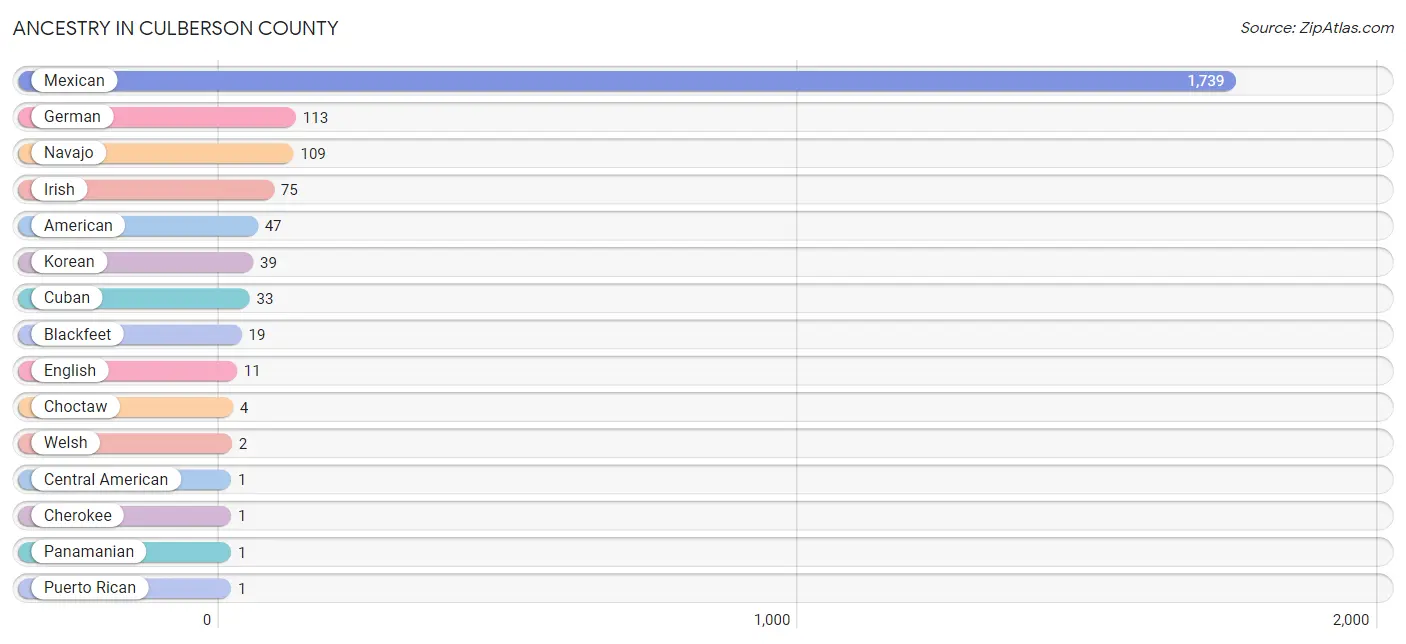
| Ancestry | # Population | % Population |
| American | 47 | 2.1% |
| Blackfeet | 19 | 0.9% |
| Central American | 1 | 0.1% |
| Cherokee | 1 | 0.1% |
| Choctaw | 4 | 0.2% |
| Cuban | 33 | 1.5% |
| English | 11 | 0.5% |
| German | 113 | 5.2% |
| Irish | 75 | 3.4% |
| Korean | 39 | 1.8% |
| Mexican | 1,739 | 79.7% |
| Navajo | 109 | 5.0% |
| Panamanian | 1 | 0.1% |
| Puerto Rican | 1 | 0.1% |
| Welsh | 2 | 0.1% | View All 15 Rows |
Immigrants in Culberson County
The most numerous immigrant groups reported in Culberson County came from Central America (189 | 8.7%), Latin America (189 | 8.7%), Mexico (189 | 8.7%), Asia (8 | 0.4%), and Philippines (8 | 0.4%), together accounting for 26.7% of all Culberson County residents.
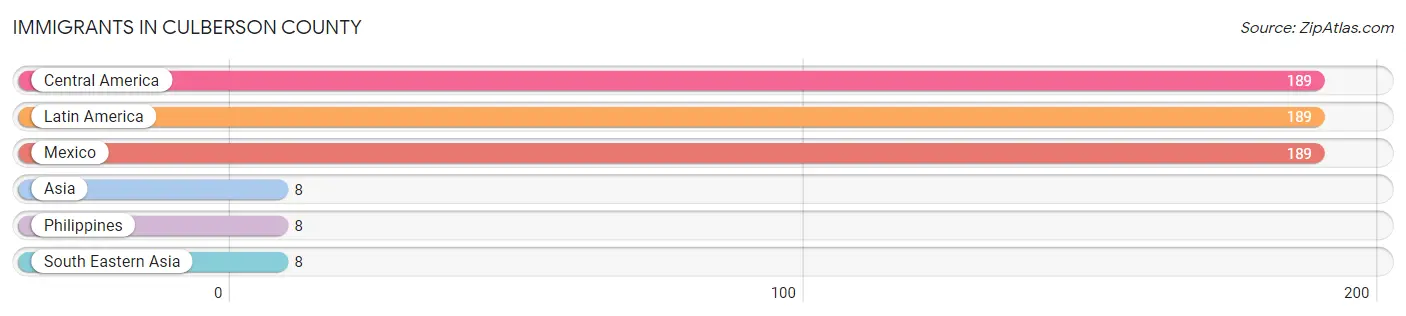
| Immigration Origin | # Population | % Population |
| Asia | 8 | 0.4% |
| Central America | 189 | 8.7% |
| Latin America | 189 | 8.7% |
| Mexico | 189 | 8.7% |
| Philippines | 8 | 0.4% |
| South Eastern Asia | 8 | 0.4% | View All 6 Rows |
Sex and Age in Culberson County
Sex and Age in Culberson County
The most populous age groups in Culberson County are 45 to 49 Years (172 | 12.8%) for men and 45 to 49 Years (214 | 25.5%) for women.
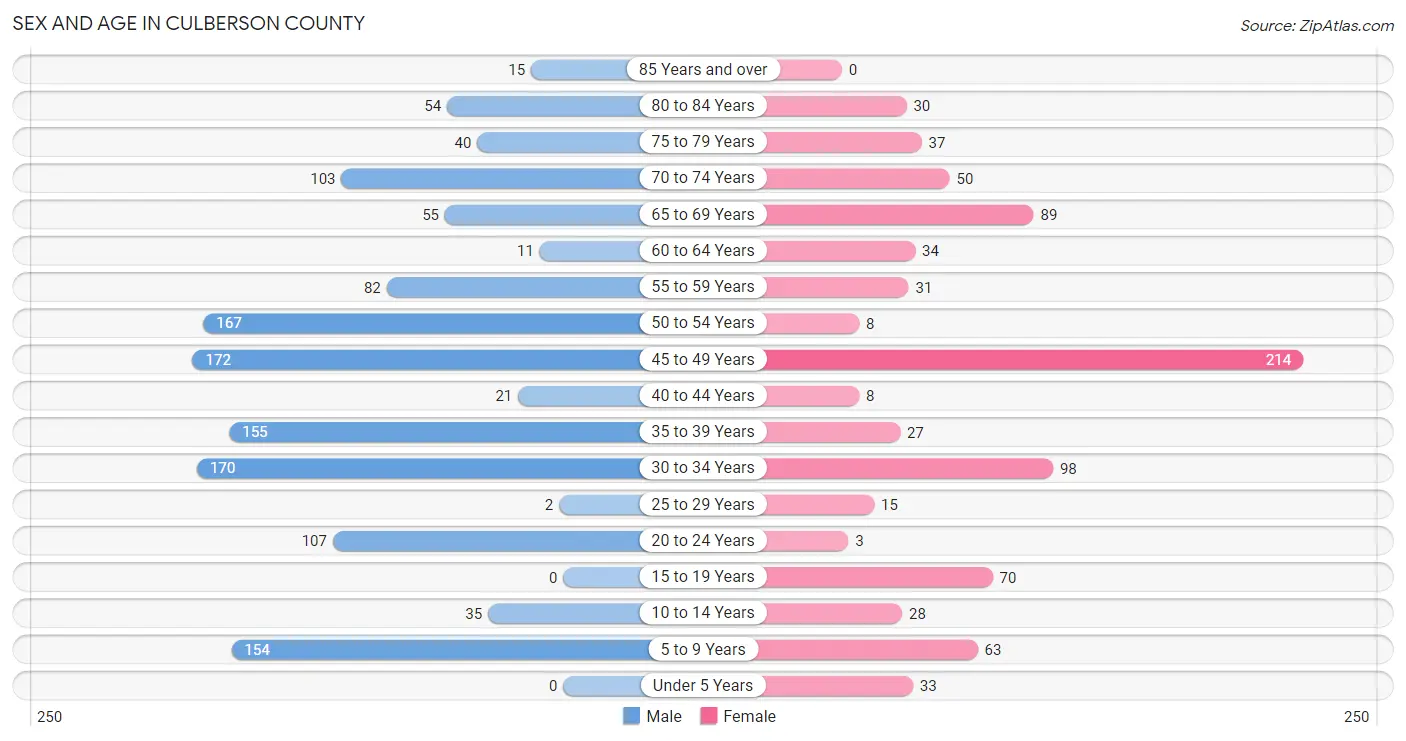
| Age Bracket | Male | Female |
| Under 5 Years | 0 (0.0%) | 33 (3.9%) |
| 5 to 9 Years | 154 (11.5%) | 63 (7.5%) |
| 10 to 14 Years | 35 (2.6%) | 28 (3.3%) |
| 15 to 19 Years | 0 (0.0%) | 70 (8.4%) |
| 20 to 24 Years | 107 (8.0%) | 3 (0.4%) |
| 25 to 29 Years | 2 (0.2%) | 15 (1.8%) |
| 30 to 34 Years | 170 (12.7%) | 98 (11.7%) |
| 35 to 39 Years | 155 (11.5%) | 27 (3.2%) |
| 40 to 44 Years | 21 (1.6%) | 8 (0.9%) |
| 45 to 49 Years | 172 (12.8%) | 214 (25.5%) |
| 50 to 54 Years | 167 (12.4%) | 8 (0.9%) |
| 55 to 59 Years | 82 (6.1%) | 31 (3.7%) |
| 60 to 64 Years | 11 (0.8%) | 34 (4.1%) |
| 65 to 69 Years | 55 (4.1%) | 89 (10.6%) |
| 70 to 74 Years | 103 (7.7%) | 50 (6.0%) |
| 75 to 79 Years | 40 (3.0%) | 37 (4.4%) |
| 80 to 84 Years | 54 (4.0%) | 30 (3.6%) |
| 85 Years and over | 15 (1.1%) | 0 (0.0%) |
| Total | 1,343 (100.0%) | 838 (100.0%) |
Families and Households in Culberson County
Median Family Size in Culberson County
The median family size in Culberson County is 4.62 persons per family, with single female/mother families (53 | 15.4%) accounting for the largest median family size of 11.45 persons per family. On the other hand, married-couple families (215 | 62.7%) represent the smallest median family size with 2.80 persons per family.
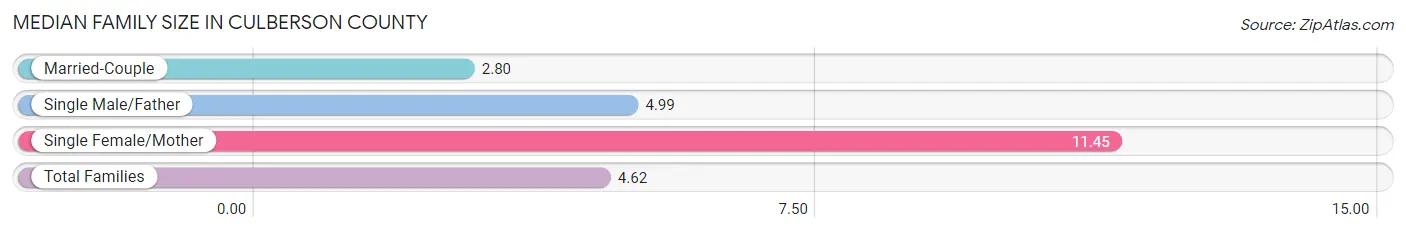
| Family Type | # Families | Family Size |
| Married-Couple | 215 (62.7%) | 2.80 |
| Single Male/Father | 75 (21.9%) | 4.99 |
| Single Female/Mother | 53 (15.4%) | 11.45 |
| Total Families | 343 (100.0%) | 4.62 |
Median Household Size in Culberson County
The median household size in Culberson County is 3.40 persons per household, with single female/mother households (53 | 8.4%) accounting for the largest median household size of 13.51 persons per household. non-family households (286 | 45.5%) represent the smallest median household size with 1.57 persons per household.
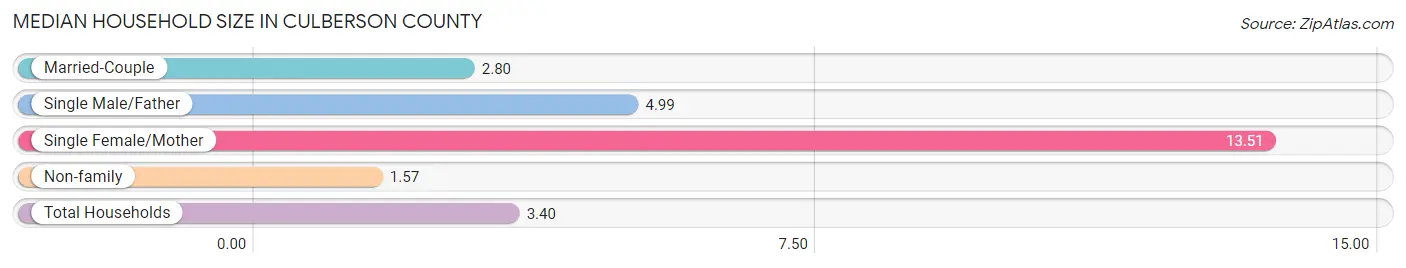
| Household Type | # Households | Household Size |
| Married-Couple | 215 (34.2%) | 2.80 |
| Single Male/Father | 75 (11.9%) | 4.99 |
| Single Female/Mother | 53 (8.4%) | 13.51 |
| Non-family | 286 (45.5%) | 1.57 |
| Total Households | 629 (100.0%) | 3.40 |
Household Size by Marriage Status in Culberson County
Out of a total of 629 households in Culberson County, 343 (54.5%) are family households, while 286 (45.5%) are nonfamily households. The most numerous type of family households are 2-person households, comprising 254, and the most common type of nonfamily households are 1-person households, comprising 275.
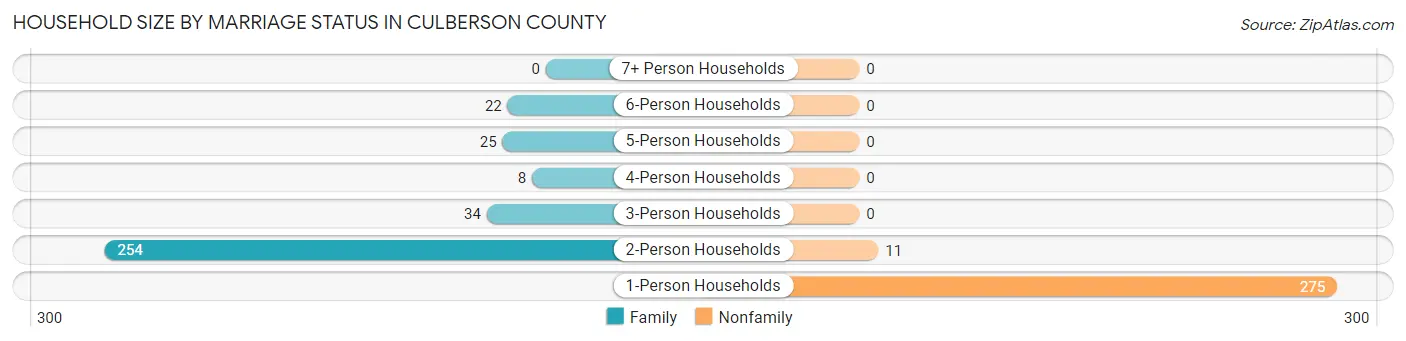
| Household Size | Family Households | Nonfamily Households |
| 1-Person Households | - | 275 (43.7%) |
| 2-Person Households | 254 (40.4%) | 11 (1.8%) |
| 3-Person Households | 34 (5.4%) | 0 (0.0%) |
| 4-Person Households | 8 (1.3%) | 0 (0.0%) |
| 5-Person Households | 25 (4.0%) | 0 (0.0%) |
| 6-Person Households | 22 (3.5%) | 0 (0.0%) |
| 7+ Person Households | 0 (0.0%) | 0 (0.0%) |
| Total | 343 (54.5%) | 286 (45.5%) |
Female Fertility in Culberson County
Fertility by Age in Culberson County
| Age Bracket | Women with Births | Births / 1,000 Women |
| 15 to 19 years | 0 (0.0%) | 0.0 |
| 20 to 34 years | 0 (0.0%) | 0.0 |
| 35 to 50 years | 0 (0.0%) | 0.0 |
| Total | 0 (0.0%) | 0.0 |
Fertility by Age by Marriage Status in Culberson County
| Age Bracket | Married | Unmarried |
| 15 to 19 years | 0 (0.0%) | 0 (0.0%) |
| 20 to 34 years | 0 (0.0%) | 0 (0.0%) |
| 35 to 50 years | 0 (0.0%) | 0 (0.0%) |
| Total | 0 (0.0%) | 0 (0.0%) |
Fertility by Education in Culberson County
| Educational Attainment | Women with Births | Births / 1,000 Women |
| Less than High School | 0 (0.0%) | 0.0 |
| High School Diploma | 0 (0.0%) | 0.0 |
| College or Associate's Degree | 0 (0.0%) | 0.0 |
| Bachelor's Degree | 0 (0.0%) | 0.0 |
| Graduate Degree | 0 (0.0%) | 0.0 |
| Total | 0 (0.0%) | 0.0 |
Fertility by Education by Marriage Status in Culberson County
| Educational Attainment | Married | Unmarried |
| Less than High School | 0 (0.0%) | 0 (0.0%) |
| High School Diploma | 0 (0.0%) | 0 (0.0%) |
| College or Associate's Degree | 0 (0.0%) | 0 (0.0%) |
| Bachelor's Degree | 0 (0.0%) | 0 (0.0%) |
| Graduate Degree | 0 (0.0%) | 0 (0.0%) |
| Total | 0 (0.0%) | 0 (0.0%) |
Employment Characteristics in Culberson County
Employment by Class of Employer in Culberson County
Among the 911 employed individuals in Culberson County, private company employees (444 | 48.7%), self-employed (not incorporated) (217 | 23.8%), and local government employees (149 | 16.4%) make up the most common classes of employment.
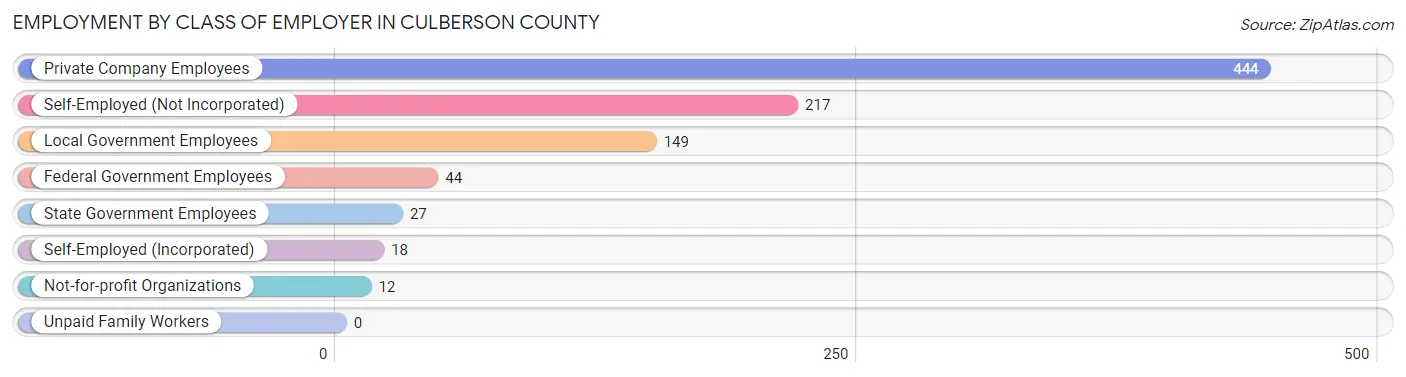
| Employer Class | # Employees | % Employees |
| Private Company Employees | 444 | 48.7% |
| Self-Employed (Incorporated) | 18 | 2.0% |
| Self-Employed (Not Incorporated) | 217 | 23.8% |
| Not-for-profit Organizations | 12 | 1.3% |
| Local Government Employees | 149 | 16.4% |
| State Government Employees | 27 | 3.0% |
| Federal Government Employees | 44 | 4.8% |
| Unpaid Family Workers | 0 | 0.0% |
| Total | 911 | 100.0% |
Employment Status by Age in Culberson County
According to the labor force statistics for Culberson County, out of the total population over 16 years of age (1,868), 55.4% or 1,035 individuals are in the labor force, with 10.1% or 105 of them unemployed. The age group with the highest labor force participation rate is 20 to 24 years, with 91.8% or 101 individuals in the labor force. Within the labor force, the 20 to 24 years age range has the highest percentage of unemployed individuals, with 97.0% or 98 of them being unemployed.
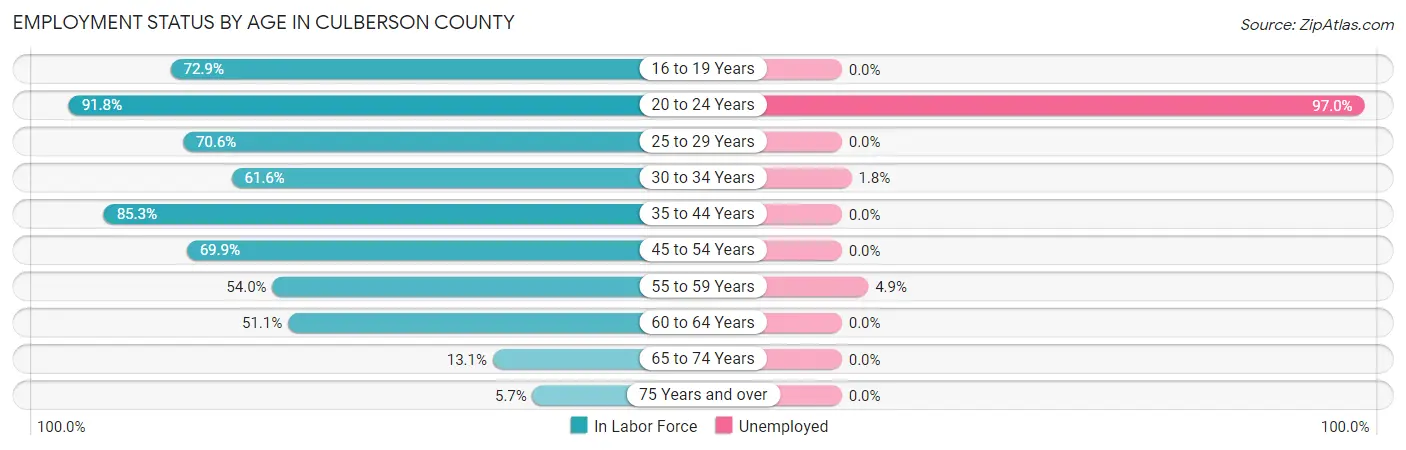
| Age Bracket | In Labor Force | Unemployed |
| 16 to 19 Years | 51 (72.9%) | 0 (0.0%) |
| 20 to 24 Years | 101 (91.8%) | 98 (97.0%) |
| 25 to 29 Years | 12 (70.6%) | 0 (0.0%) |
| 30 to 34 Years | 165 (61.6%) | 3 (1.8%) |
| 35 to 44 Years | 180 (85.3%) | 0 (0.0%) |
| 45 to 54 Years | 392 (69.9%) | 0 (0.0%) |
| 55 to 59 Years | 61 (54.0%) | 3 (4.9%) |
| 60 to 64 Years | 23 (51.1%) | 0 (0.0%) |
| 65 to 74 Years | 39 (13.1%) | 0 (0.0%) |
| 75 Years and over | 10 (5.7%) | 0 (0.0%) |
| Total | 1,035 (55.4%) | 105 (10.1%) |
Employment Status by Educational Attainment in Culberson County
According to labor force statistics for Culberson County, 68.6% of individuals (833) out of the total population between 25 and 64 years of age (1,215) are in the labor force, with 0.7% or 6 of them being unemployed. The group with the highest labor force participation rate are those with the educational attainment of college / associate degree, with 99.6% or 224 individuals in the labor force. Within the labor force, individuals with less than high school education have the highest percentage of unemployment, with 4.3% or 3 of them being unemployed.
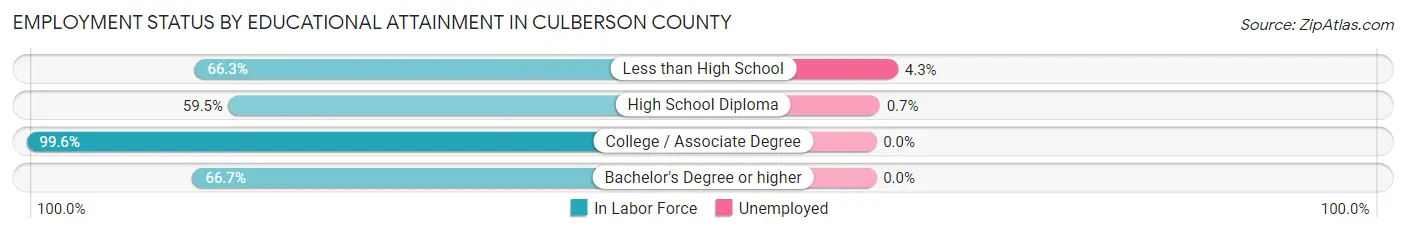
| Educational Attainment | In Labor Force | Unemployed |
| Less than High School | 69 (66.3%) | 4 (4.3%) |
| High School Diploma | 422 (59.5%) | 5 (0.7%) |
| College / Associate Degree | 224 (99.6%) | 0 (0.0%) |
| Bachelor's Degree or higher | 118 (66.7%) | 0 (0.0%) |
| Total | 833 (68.6%) | 9 (0.7%) |
Employment Occupations by Sex in Culberson County
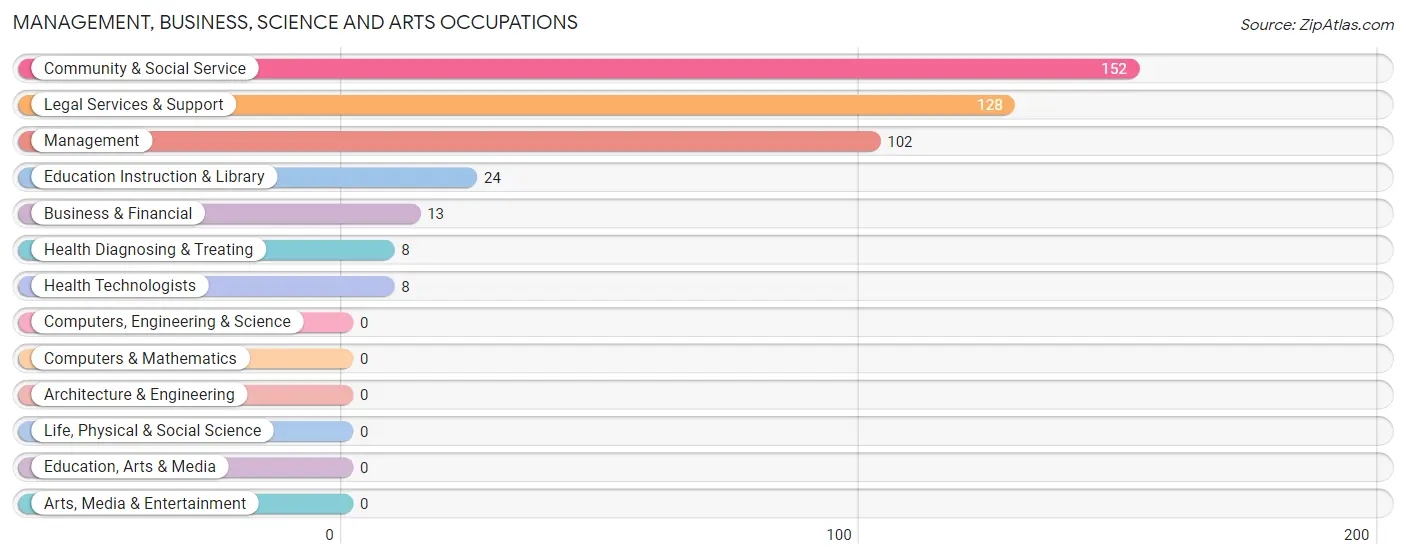
Management, Business, Science and Arts Occupations
The most common Management, Business, Science and Arts occupations in Culberson County are Community & Social Service (152 | 16.3%), Legal Services & Support (128 | 13.8%), Management (102 | 11.0%), Education Instruction & Library (24 | 2.6%), and Business & Financial (13 | 1.4%).
Management, Business, Science and Arts Occupations by Sex
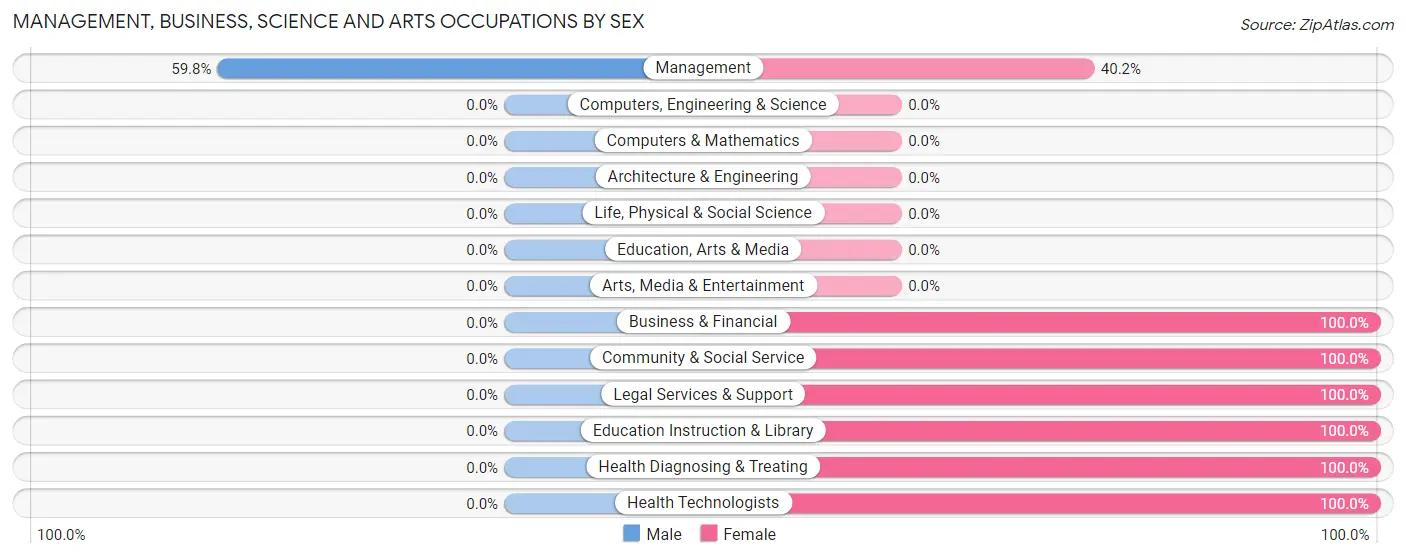
| Occupation | Male | Female |
| Management | 61 (59.8%) | 41 (40.2%) |
| Business & Financial | 0 (0.0%) | 13 (100.0%) |
| Computers, Engineering & Science | 0 (0.0%) | 0 (0.0%) |
| Computers & Mathematics | 0 (0.0%) | 0 (0.0%) |
| Architecture & Engineering | 0 (0.0%) | 0 (0.0%) |
| Life, Physical & Social Science | 0 (0.0%) | 0 (0.0%) |
| Community & Social Service | 0 (0.0%) | 152 (100.0%) |
| Education, Arts & Media | 0 (0.0%) | 0 (0.0%) |
| Legal Services & Support | 0 (0.0%) | 128 (100.0%) |
| Education Instruction & Library | 0 (0.0%) | 24 (100.0%) |
| Arts, Media & Entertainment | 0 (0.0%) | 0 (0.0%) |
| Health Diagnosing & Treating | 0 (0.0%) | 8 (100.0%) |
| Health Technologists | 0 (0.0%) | 8 (100.0%) |
| Total (Category) | 61 (22.2%) | 214 (77.8%) |
| Total (Overall) | 576 (61.9%) | 354 (38.1%) |
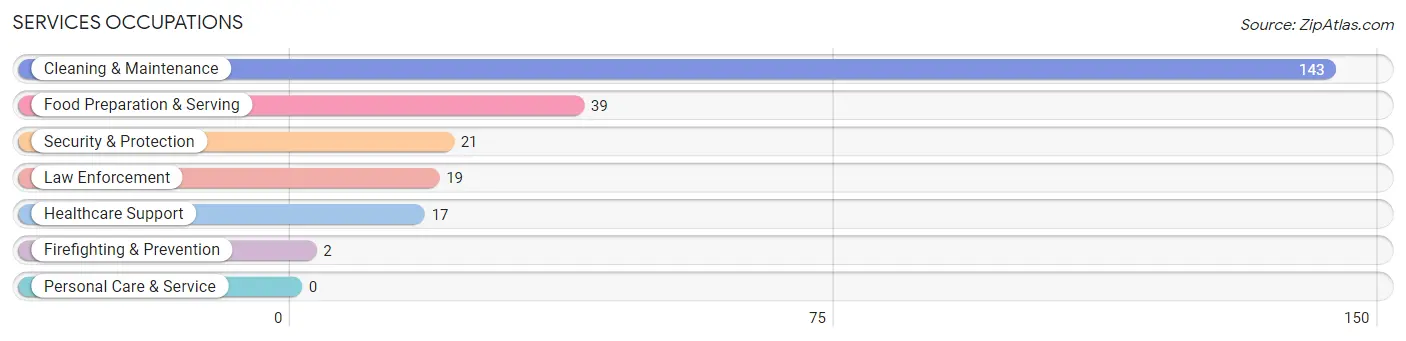
Services Occupations
The most common Services occupations in Culberson County are Cleaning & Maintenance (143 | 15.4%), Food Preparation & Serving (39 | 4.2%), Security & Protection (21 | 2.3%), Law Enforcement (19 | 2.0%), and Healthcare Support (17 | 1.8%).
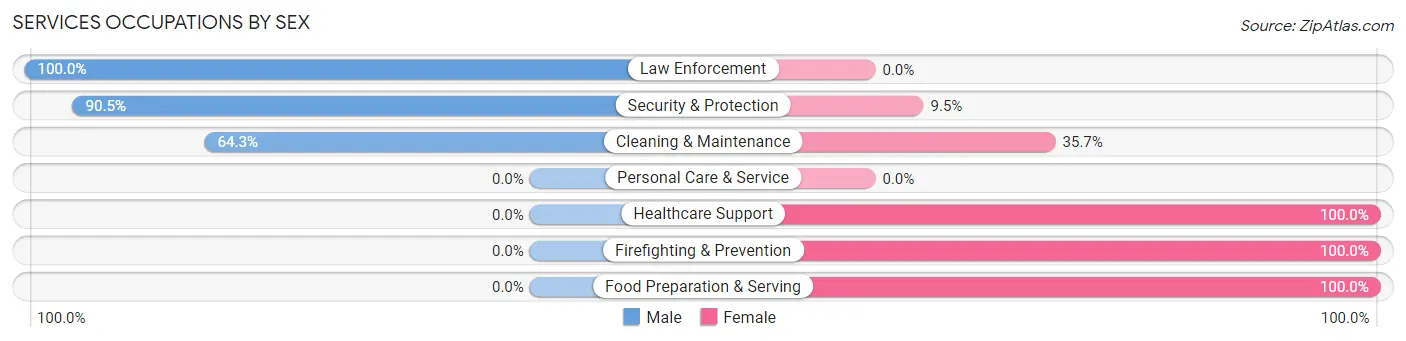
Services Occupations by Sex
Within the Services occupations in Culberson County, the most male-oriented occupations are Law Enforcement (100.0%), Security & Protection (90.5%), and Cleaning & Maintenance (64.3%), while the most female-oriented occupations are Healthcare Support (100.0%), Firefighting & Prevention (100.0%), and Food Preparation & Serving (100.0%).
| Occupation | Male | Female |
| Healthcare Support | 0 (0.0%) | 17 (100.0%) |
| Security & Protection | 19 (90.5%) | 2 (9.5%) |
| Firefighting & Prevention | 0 (0.0%) | 2 (100.0%) |
| Law Enforcement | 19 (100.0%) | 0 (0.0%) |
| Food Preparation & Serving | 0 (0.0%) | 39 (100.0%) |
| Cleaning & Maintenance | 92 (64.3%) | 51 (35.7%) |
| Personal Care & Service | 0 (0.0%) | 0 (0.0%) |
| Total (Category) | 111 (50.4%) | 109 (49.5%) |
| Total (Overall) | 576 (61.9%) | 354 (38.1%) |
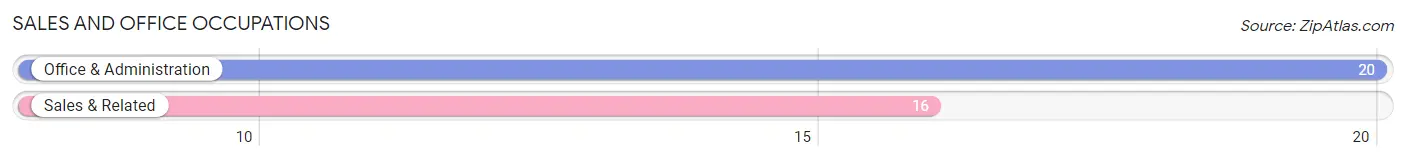
Sales and Office Occupations
The most common Sales and Office occupations in Culberson County are Office & Administration (20 | 2.1%), and Sales & Related (16 | 1.7%).
Sales and Office Occupations by Sex
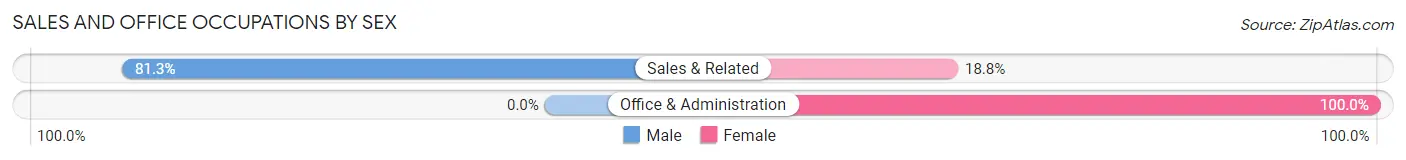
| Occupation | Male | Female |
| Sales & Related | 13 (81.2%) | 3 (18.8%) |
| Office & Administration | 0 (0.0%) | 20 (100.0%) |
| Total (Category) | 13 (36.1%) | 23 (63.9%) |
| Total (Overall) | 576 (61.9%) | 354 (38.1%) |
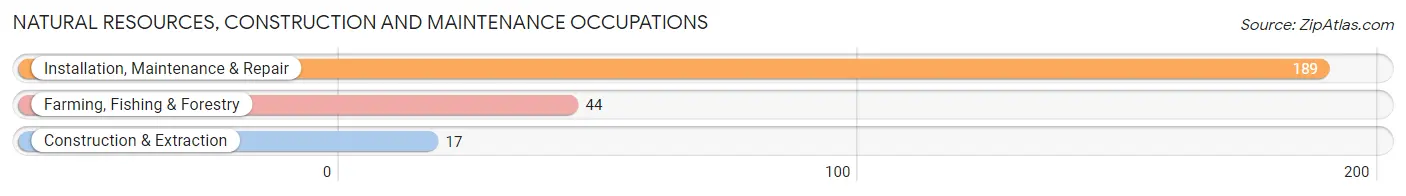
Natural Resources, Construction and Maintenance Occupations
The most common Natural Resources, Construction and Maintenance occupations in Culberson County are Installation, Maintenance & Repair (189 | 20.3%), Farming, Fishing & Forestry (44 | 4.7%), and Construction & Extraction (17 | 1.8%).
Natural Resources, Construction and Maintenance Occupations by Sex
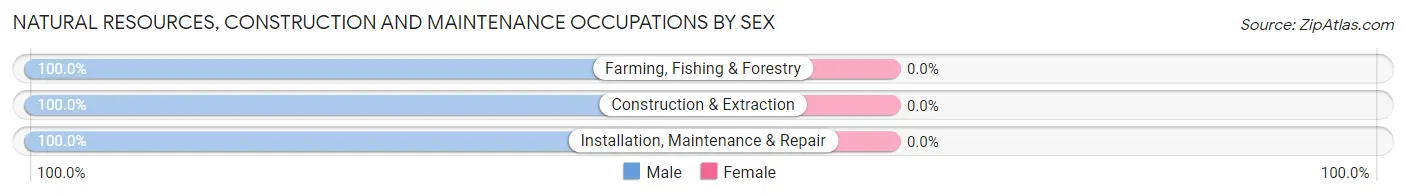
| Occupation | Male | Female |
| Farming, Fishing & Forestry | 44 (100.0%) | 0 (0.0%) |
| Construction & Extraction | 17 (100.0%) | 0 (0.0%) |
| Installation, Maintenance & Repair | 189 (100.0%) | 0 (0.0%) |
| Total (Category) | 250 (100.0%) | 0 (0.0%) |
| Total (Overall) | 576 (61.9%) | 354 (38.1%) |
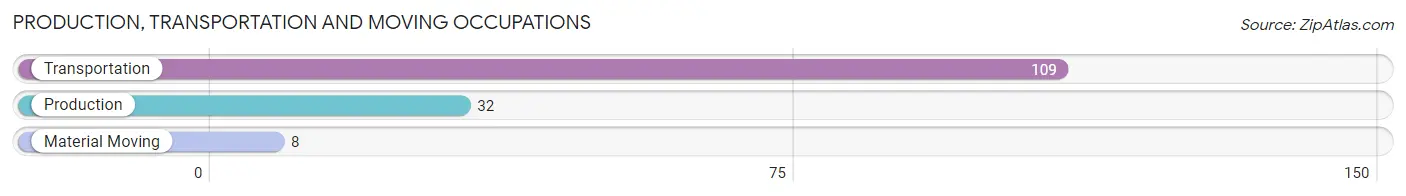
Production, Transportation and Moving Occupations
The most common Production, Transportation and Moving occupations in Culberson County are Transportation (109 | 11.7%), Production (32 | 3.4%), and Material Moving (8 | 0.9%).
Production, Transportation and Moving Occupations by Sex
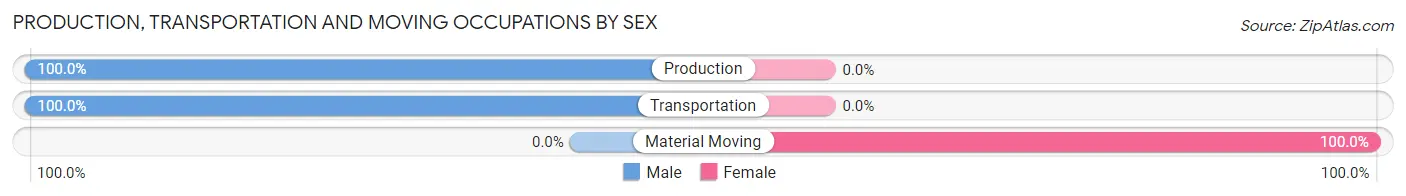
| Occupation | Male | Female |
| Production | 32 (100.0%) | 0 (0.0%) |
| Transportation | 109 (100.0%) | 0 (0.0%) |
| Material Moving | 0 (0.0%) | 8 (100.0%) |
| Total (Category) | 141 (94.6%) | 8 (5.4%) |
| Total (Overall) | 576 (61.9%) | 354 (38.1%) |
Employment Industries by Sex in Culberson County
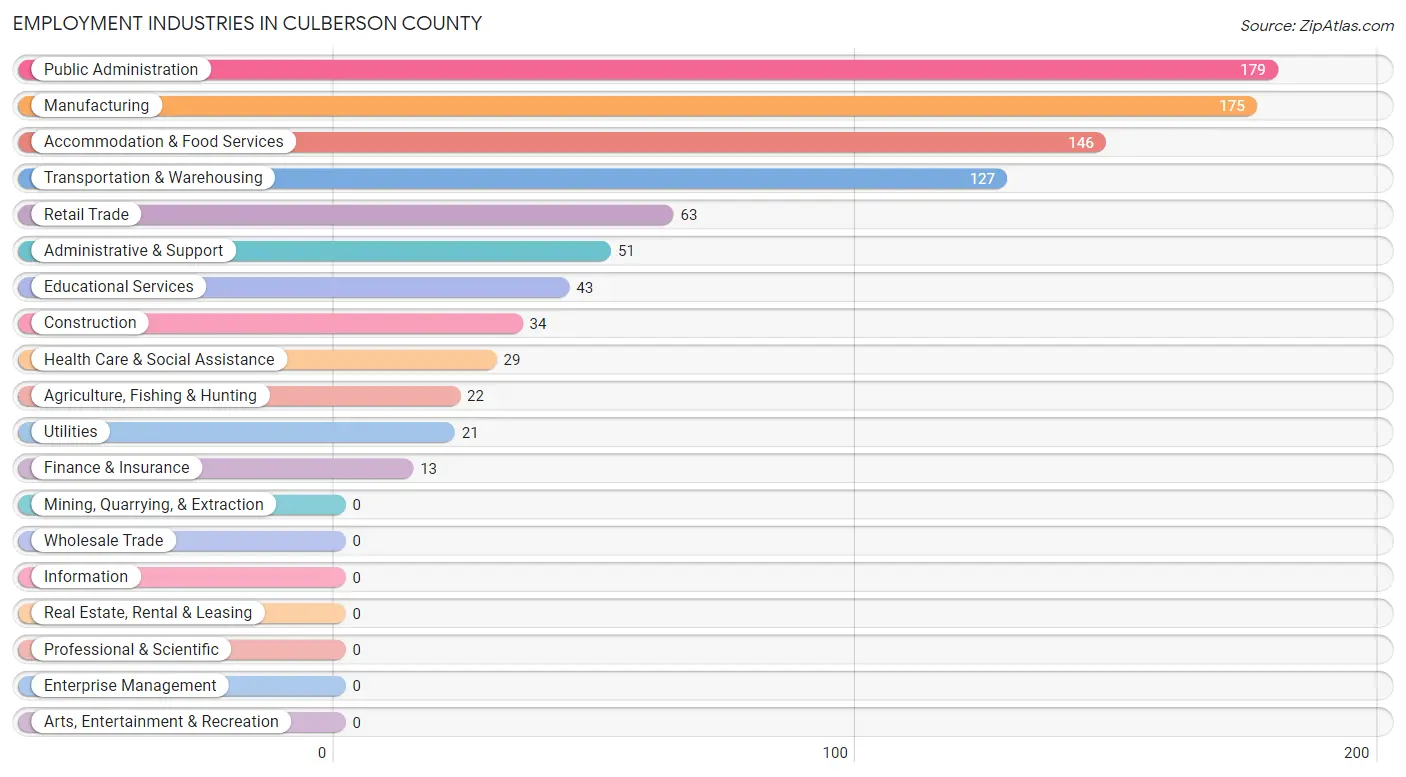
Employment Industries in Culberson County
The major employment industries in Culberson County include Public Administration (179 | 19.3%), Manufacturing (175 | 18.8%), Accommodation & Food Services (146 | 15.7%), Transportation & Warehousing (127 | 13.7%), and Retail Trade (63 | 6.8%).
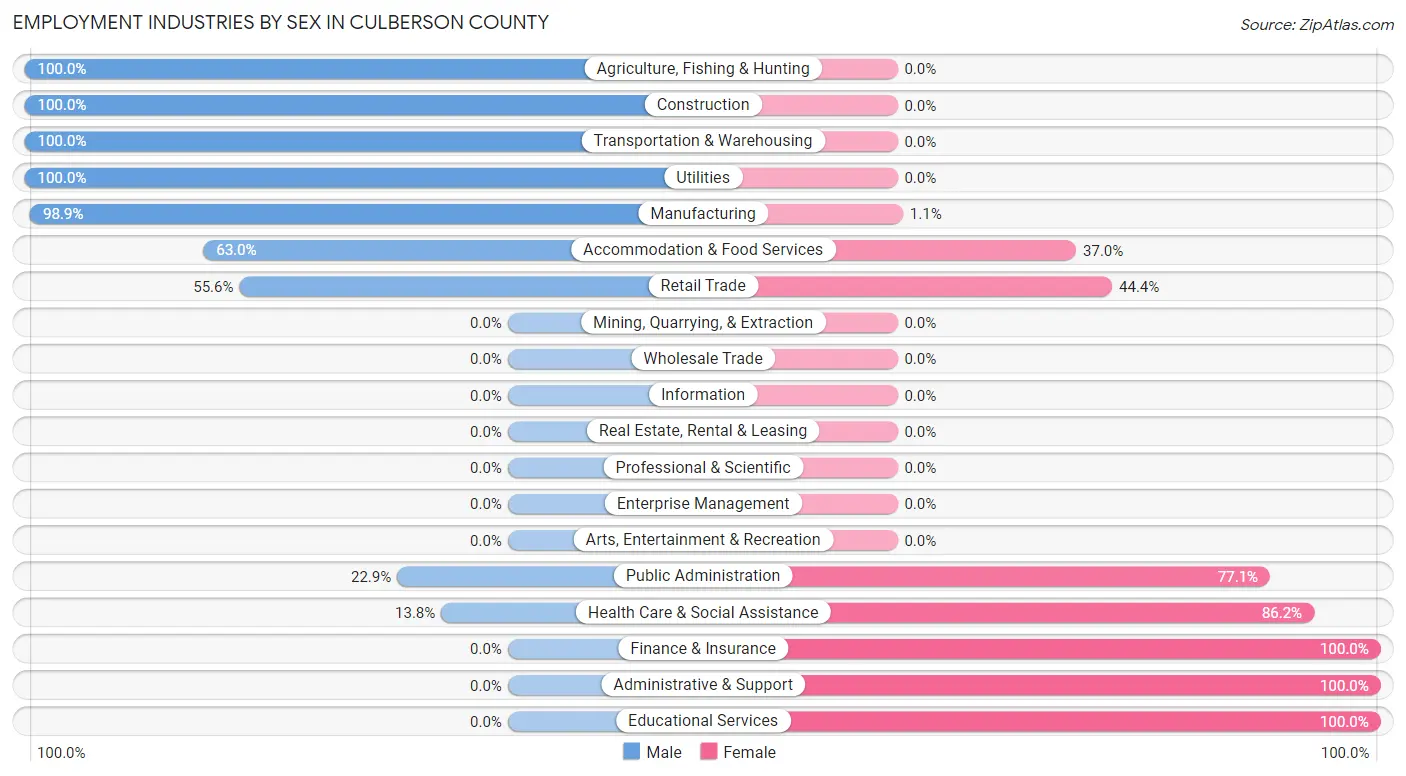
Employment Industries by Sex in Culberson County
The Culberson County industries that see more men than women are Agriculture, Fishing & Hunting (100.0%), Construction (100.0%), and Transportation & Warehousing (100.0%), whereas the industries that tend to have a higher number of women are Finance & Insurance (100.0%), Administrative & Support (100.0%), and Educational Services (100.0%).
| Industry | Male | Female |
| Agriculture, Fishing & Hunting | 22 (100.0%) | 0 (0.0%) |
| Mining, Quarrying, & Extraction | 0 (0.0%) | 0 (0.0%) |
| Construction | 34 (100.0%) | 0 (0.0%) |
| Manufacturing | 173 (98.9%) | 2 (1.1%) |
| Wholesale Trade | 0 (0.0%) | 0 (0.0%) |
| Retail Trade | 35 (55.6%) | 28 (44.4%) |
| Transportation & Warehousing | 127 (100.0%) | 0 (0.0%) |
| Utilities | 21 (100.0%) | 0 (0.0%) |
| Information | 0 (0.0%) | 0 (0.0%) |
| Finance & Insurance | 0 (0.0%) | 13 (100.0%) |
| Real Estate, Rental & Leasing | 0 (0.0%) | 0 (0.0%) |
| Professional & Scientific | 0 (0.0%) | 0 (0.0%) |
| Enterprise Management | 0 (0.0%) | 0 (0.0%) |
| Administrative & Support | 0 (0.0%) | 51 (100.0%) |
| Educational Services | 0 (0.0%) | 43 (100.0%) |
| Health Care & Social Assistance | 4 (13.8%) | 25 (86.2%) |
| Arts, Entertainment & Recreation | 0 (0.0%) | 0 (0.0%) |
| Accommodation & Food Services | 92 (63.0%) | 54 (37.0%) |
| Public Administration | 41 (22.9%) | 138 (77.1%) |
| Total | 576 (61.9%) | 354 (38.1%) |
Education in Culberson County
School Enrollment in Culberson County
The most common levels of schooling among the 111 students in Culberson County are middle school (63 | 56.8%), elementary school (29 | 26.1%), and high school (19 | 17.1%).
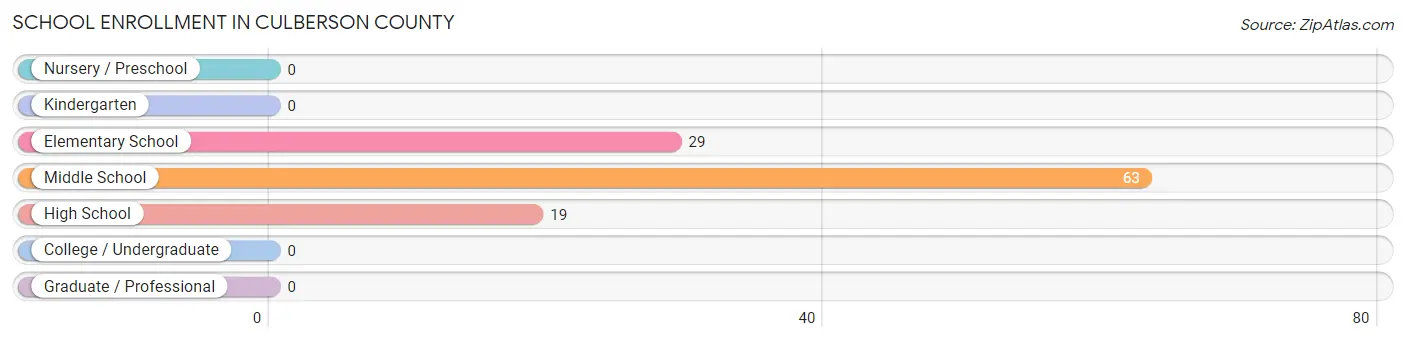
| School Level | # Students | % Students |
| Nursery / Preschool | 0 | 0.0% |
| Kindergarten | 0 | 0.0% |
| Elementary School | 29 | 26.1% |
| Middle School | 63 | 56.8% |
| High School | 19 | 17.1% |
| College / Undergraduate | 0 | 0.0% |
| Graduate / Professional | 0 | 0.0% |
| Total | 111 | 100.0% |
School Enrollment by Age by Funding Source in Culberson County
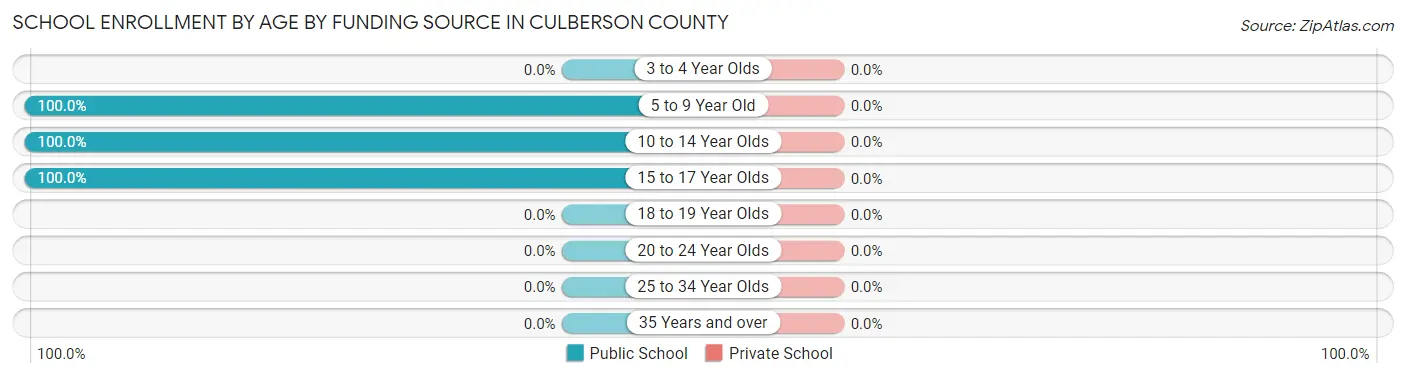
| Age Bracket | Public School | Private School |
| 3 to 4 Year Olds | 0 (0.0%) | 0 (0.0%) |
| 5 to 9 Year Old | 29 (100.0%) | 0 (0.0%) |
| 10 to 14 Year Olds | 63 (100.0%) | 0 (0.0%) |
| 15 to 17 Year Olds | 19 (100.0%) | 0 (0.0%) |
| 18 to 19 Year Olds | 0 (0.0%) | 0 (0.0%) |
| 20 to 24 Year Olds | 0 (0.0%) | 0 (0.0%) |
| 25 to 34 Year Olds | 0 (0.0%) | 0 (0.0%) |
| 35 Years and over | 0 (0.0%) | 0 (0.0%) |
| Total | 111 (100.0%) | 0 (0.0%) |
Educational Attainment by Field of Study in Culberson County
Business (60 | 33.9%), psychology (46 | 26.0%), bio, nature & agricultural (32 | 18.1%), education (18 | 10.2%), and computers & mathematics (11 | 6.2%) are the most common fields of study among 177 individuals in Culberson County who have obtained a bachelor's degree or higher.
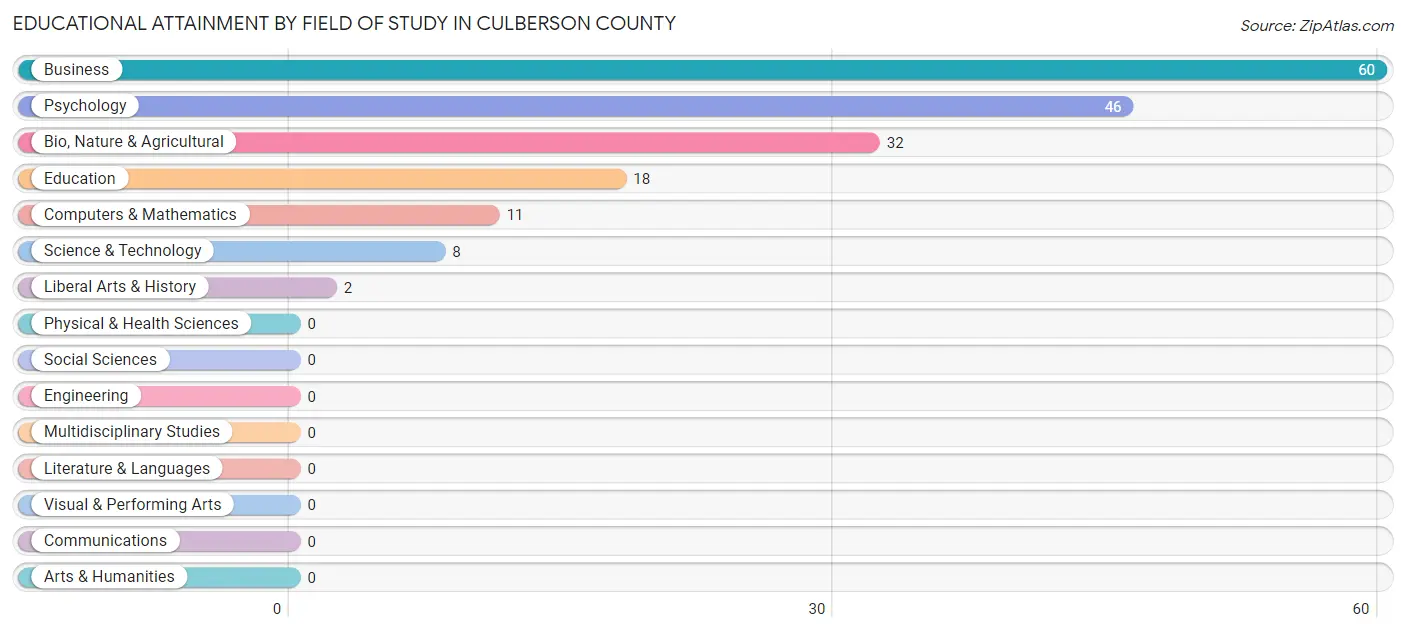
| Field of Study | # Graduates | % Graduates |
| Computers & Mathematics | 11 | 6.2% |
| Bio, Nature & Agricultural | 32 | 18.1% |
| Physical & Health Sciences | 0 | 0.0% |
| Psychology | 46 | 26.0% |
| Social Sciences | 0 | 0.0% |
| Engineering | 0 | 0.0% |
| Multidisciplinary Studies | 0 | 0.0% |
| Science & Technology | 8 | 4.5% |
| Business | 60 | 33.9% |
| Education | 18 | 10.2% |
| Literature & Languages | 0 | 0.0% |
| Liberal Arts & History | 2 | 1.1% |
| Visual & Performing Arts | 0 | 0.0% |
| Communications | 0 | 0.0% |
| Arts & Humanities | 0 | 0.0% |
| Total | 177 | 100.0% |
Transportation & Commute in Culberson County
Vehicle Availability by Sex in Culberson County
The most prevalent vehicle ownership categories in Culberson County are males with 2 vehicles (277, accounting for 48.4%) and females with 2 vehicles (262, making up 82.7%).
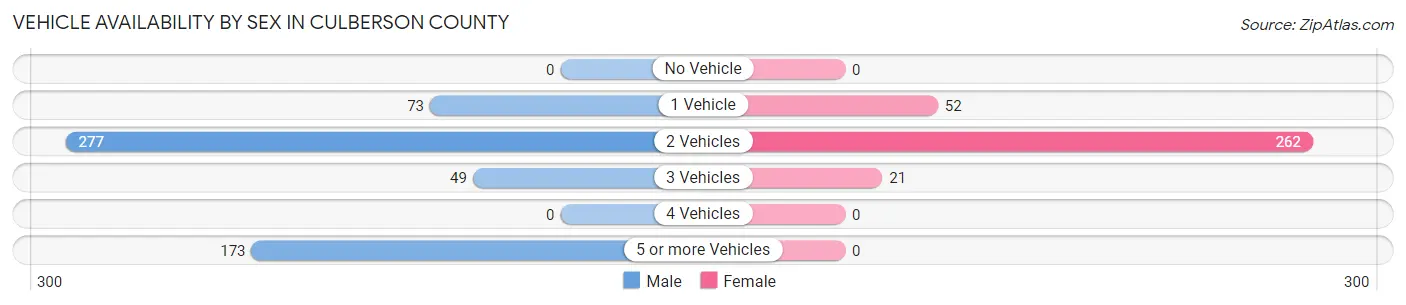
| Vehicles Available | Male | Female |
| No Vehicle | 0 (0.0%) | 0 (0.0%) |
| 1 Vehicle | 73 (12.8%) | 52 (15.5%) |
| 2 Vehicles | 277 (48.4%) | 262 (78.2%) |
| 3 Vehicles | 49 (8.6%) | 21 (6.3%) |
| 4 Vehicles | 0 (0.0%) | 0 (0.0%) |
| 5 or more Vehicles | 173 (30.2%) | 0 (0.0%) |
| Total | 572 (100.0%) | 335 (100.0%) |
Commute Time in Culberson County
The most frequently occuring commute durations in Culberson County are less than 5 minutes (301 commuters, 33.4%), 30 to 34 minutes (206 commuters, 22.9%), and 5 to 9 minutes (174 commuters, 19.3%).
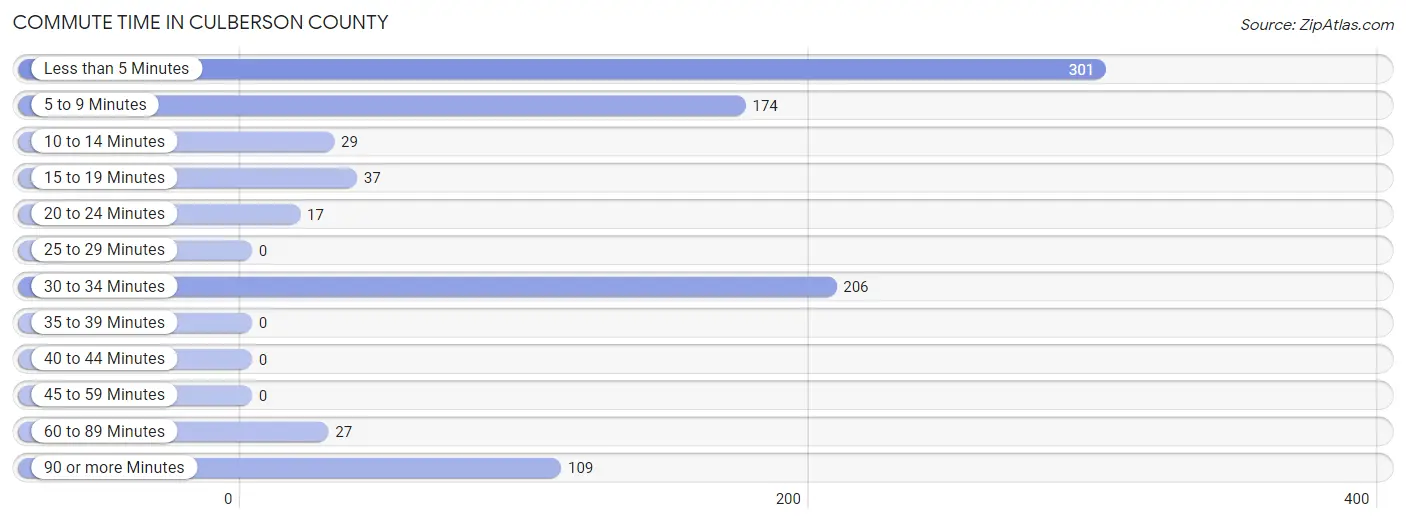
| Commute Time | # Commuters | % Commuters |
| Less than 5 Minutes | 301 | 33.4% |
| 5 to 9 Minutes | 174 | 19.3% |
| 10 to 14 Minutes | 29 | 3.2% |
| 15 to 19 Minutes | 37 | 4.1% |
| 20 to 24 Minutes | 17 | 1.9% |
| 25 to 29 Minutes | 0 | 0.0% |
| 30 to 34 Minutes | 206 | 22.9% |
| 35 to 39 Minutes | 0 | 0.0% |
| 40 to 44 Minutes | 0 | 0.0% |
| 45 to 59 Minutes | 0 | 0.0% |
| 60 to 89 Minutes | 27 | 3.0% |
| 90 or more Minutes | 109 | 12.1% |
Commute Time by Sex in Culberson County
The most common commute times in Culberson County are 30 to 34 minutes (204 commuters, 35.7%) for males and less than 5 minutes (238 commuters, 72.6%) for females.
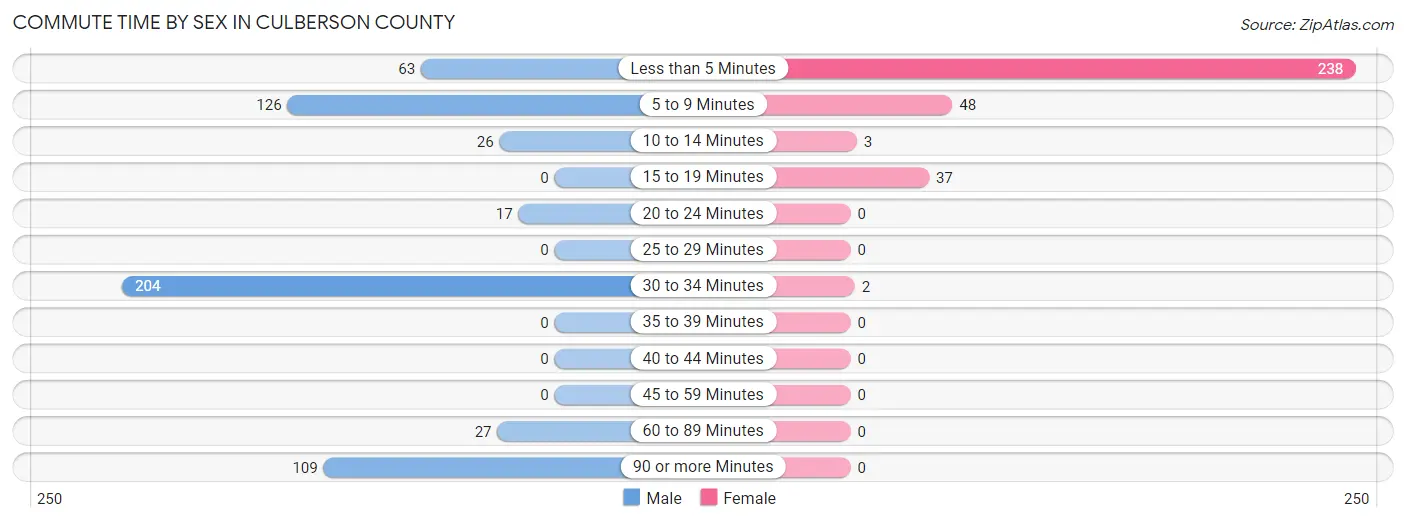
| Commute Time | Male | Female |
| Less than 5 Minutes | 63 (11.0%) | 238 (72.6%) |
| 5 to 9 Minutes | 126 (22.0%) | 48 (14.6%) |
| 10 to 14 Minutes | 26 (4.5%) | 3 (0.9%) |
| 15 to 19 Minutes | 0 (0.0%) | 37 (11.3%) |
| 20 to 24 Minutes | 17 (3.0%) | 0 (0.0%) |
| 25 to 29 Minutes | 0 (0.0%) | 0 (0.0%) |
| 30 to 34 Minutes | 204 (35.7%) | 2 (0.6%) |
| 35 to 39 Minutes | 0 (0.0%) | 0 (0.0%) |
| 40 to 44 Minutes | 0 (0.0%) | 0 (0.0%) |
| 45 to 59 Minutes | 0 (0.0%) | 0 (0.0%) |
| 60 to 89 Minutes | 27 (4.7%) | 0 (0.0%) |
| 90 or more Minutes | 109 (19.1%) | 0 (0.0%) |
Time of Departure to Work by Sex in Culberson County
The most frequent times of departure to work in Culberson County are 12:00 PM to 3:59 PM (199, 34.8%) for males and 7:30 AM to 7:59 AM (128, 39.0%) for females.
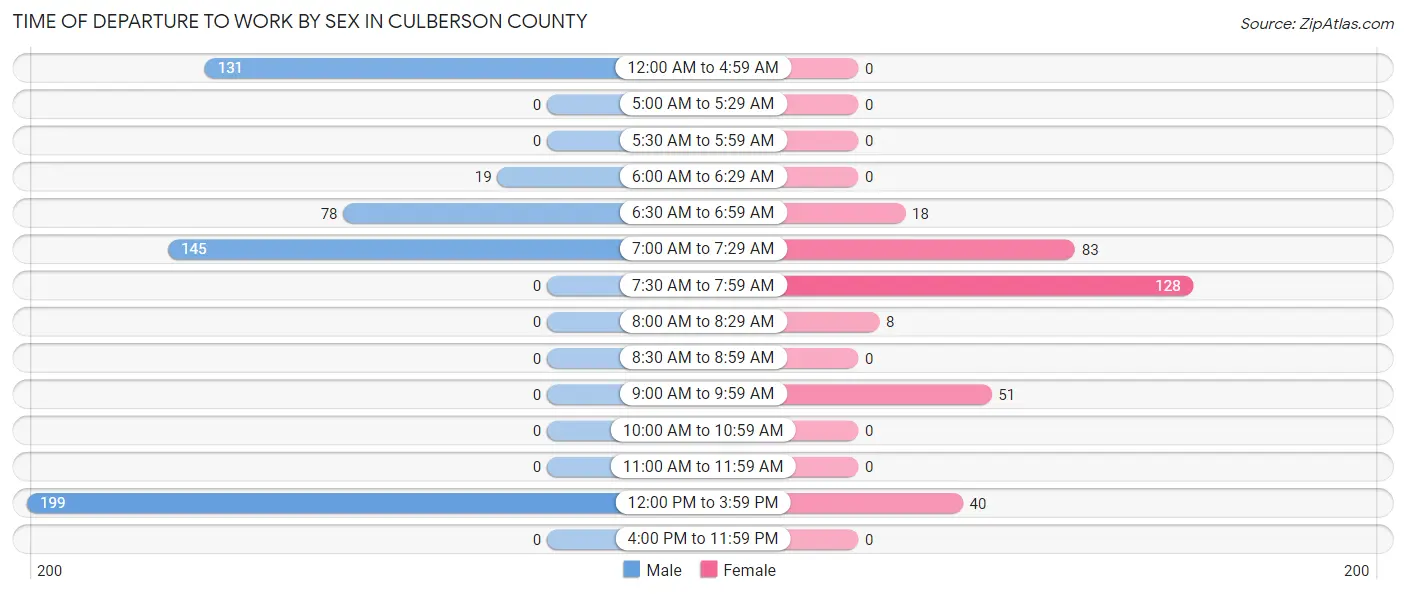
| Time of Departure | Male | Female |
| 12:00 AM to 4:59 AM | 131 (22.9%) | 0 (0.0%) |
| 5:00 AM to 5:29 AM | 0 (0.0%) | 0 (0.0%) |
| 5:30 AM to 5:59 AM | 0 (0.0%) | 0 (0.0%) |
| 6:00 AM to 6:29 AM | 19 (3.3%) | 0 (0.0%) |
| 6:30 AM to 6:59 AM | 78 (13.6%) | 18 (5.5%) |
| 7:00 AM to 7:29 AM | 145 (25.4%) | 83 (25.3%) |
| 7:30 AM to 7:59 AM | 0 (0.0%) | 128 (39.0%) |
| 8:00 AM to 8:29 AM | 0 (0.0%) | 8 (2.4%) |
| 8:30 AM to 8:59 AM | 0 (0.0%) | 0 (0.0%) |
| 9:00 AM to 9:59 AM | 0 (0.0%) | 51 (15.5%) |
| 10:00 AM to 10:59 AM | 0 (0.0%) | 0 (0.0%) |
| 11:00 AM to 11:59 AM | 0 (0.0%) | 0 (0.0%) |
| 12:00 PM to 3:59 PM | 199 (34.8%) | 40 (12.2%) |
| 4:00 PM to 11:59 PM | 0 (0.0%) | 0 (0.0%) |
| Total | 572 (100.0%) | 328 (100.0%) |
Housing Occupancy in Culberson County
Occupancy by Ownership in Culberson County
Of the total 629 dwellings in Culberson County, owner-occupied units account for 477 (75.8%), while renter-occupied units make up 152 (24.2%).
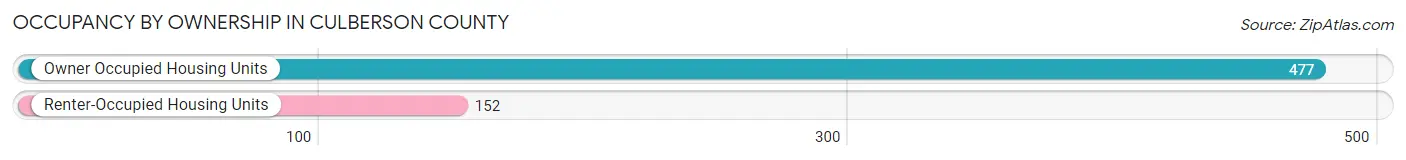
| Occupancy | # Housing Units | % Housing Units |
| Owner Occupied Housing Units | 477 | 75.8% |
| Renter-Occupied Housing Units | 152 | 24.2% |
| Total Occupied Housing Units | 629 | 100.0% |
Occupancy by Household Size in Culberson County
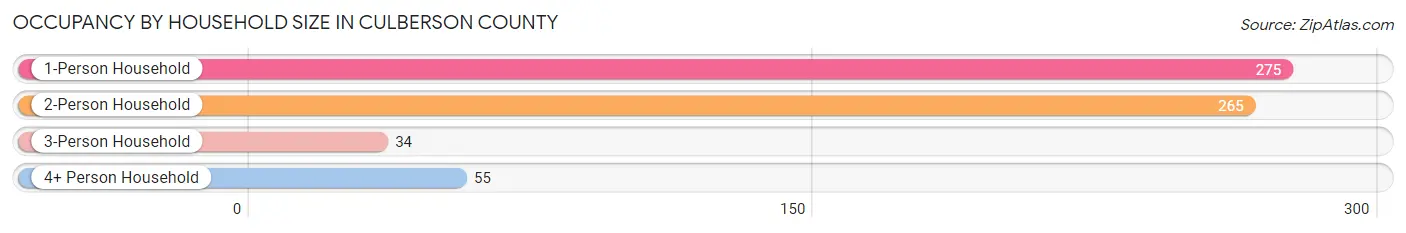
| Household Size | # Housing Units | % Housing Units |
| 1-Person Household | 275 | 43.7% |
| 2-Person Household | 265 | 42.1% |
| 3-Person Household | 34 | 5.4% |
| 4+ Person Household | 55 | 8.7% |
| Total Housing Units | 629 | 100.0% |
Occupancy by Ownership by Household Size in Culberson County
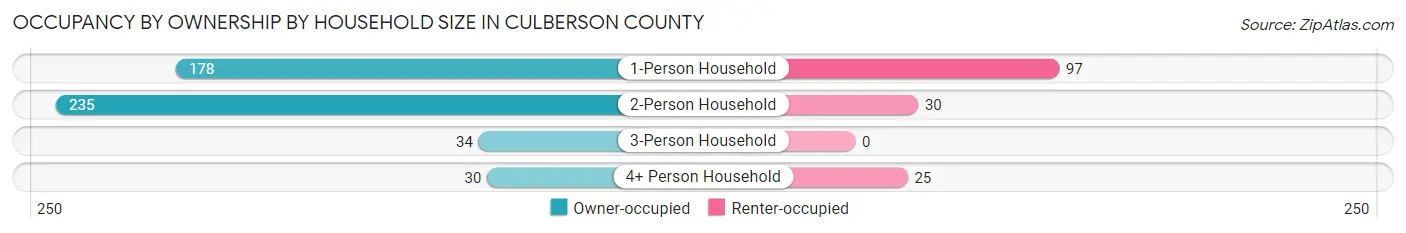
| Household Size | Owner-occupied | Renter-occupied |
| 1-Person Household | 178 (64.7%) | 97 (35.3%) |
| 2-Person Household | 235 (88.7%) | 30 (11.3%) |
| 3-Person Household | 34 (100.0%) | 0 (0.0%) |
| 4+ Person Household | 30 (54.5%) | 25 (45.5%) |
| Total Housing Units | 477 (75.8%) | 152 (24.2%) |
Occupancy by Educational Attainment in Culberson County
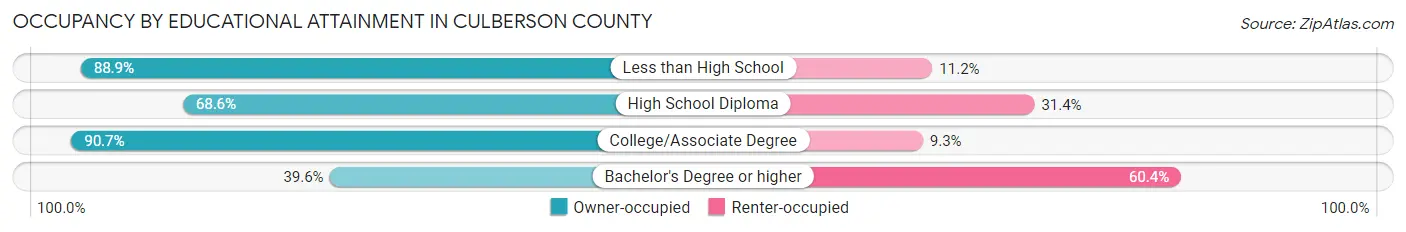
| Household Size | Owner-occupied | Renter-occupied |
| Less than High School | 263 (88.8%) | 33 (11.2%) |
| High School Diploma | 129 (68.6%) | 59 (31.4%) |
| College/Associate Degree | 49 (90.7%) | 5 (9.3%) |
| Bachelor's Degree or higher | 36 (39.6%) | 55 (60.4%) |
Occupancy by Age of Householder in Culberson County
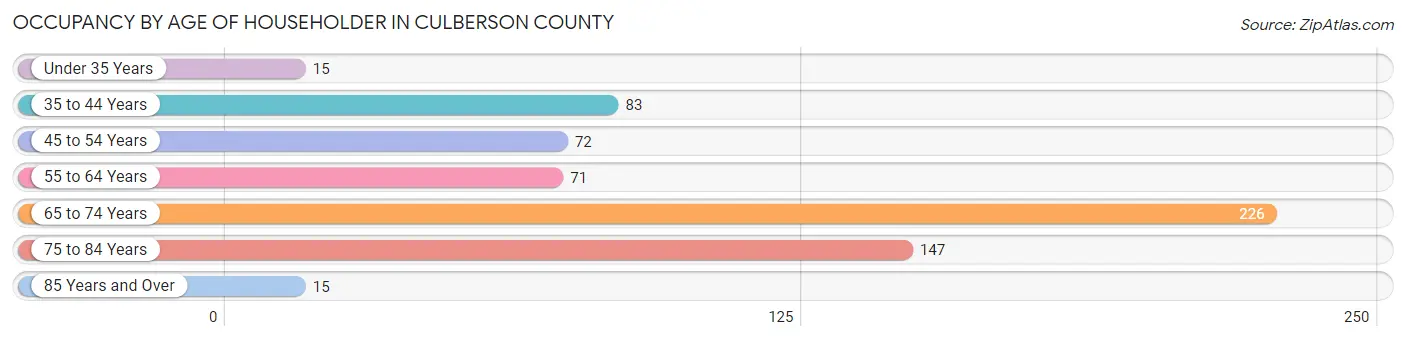
| Age Bracket | # Households | % Households |
| Under 35 Years | 15 | 2.4% |
| 35 to 44 Years | 83 | 13.2% |
| 45 to 54 Years | 72 | 11.5% |
| 55 to 64 Years | 71 | 11.3% |
| 65 to 74 Years | 226 | 35.9% |
| 75 to 84 Years | 147 | 23.4% |
| 85 Years and Over | 15 | 2.4% |
| Total | 629 | 100.0% |
Housing Finances in Culberson County
Median Income by Occupancy in Culberson County
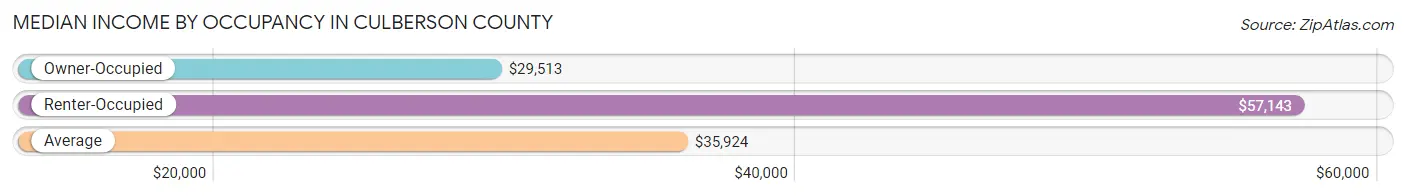
| Occupancy Type | # Households | Median Income |
| Owner-Occupied | 477 (75.8%) | $29,513 |
| Renter-Occupied | 152 (24.2%) | $57,143 |
| Average | 629 (100.0%) | $35,924 |
Occupancy by Householder Income Bracket in Culberson County
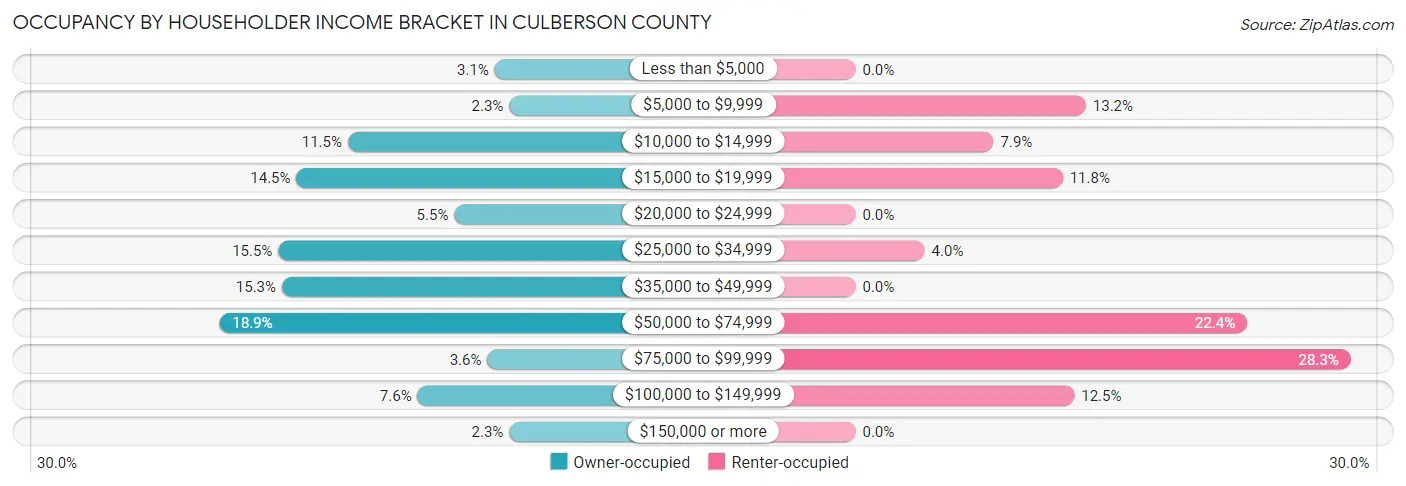
| Income Bracket | Owner-occupied | Renter-occupied |
| Less than $5,000 | 15 (3.1%) | 0 (0.0%) |
| $5,000 to $9,999 | 11 (2.3%) | 20 (13.2%) |
| $10,000 to $14,999 | 55 (11.5%) | 12 (7.9%) |
| $15,000 to $19,999 | 69 (14.5%) | 18 (11.8%) |
| $20,000 to $24,999 | 26 (5.4%) | 0 (0.0%) |
| $25,000 to $34,999 | 74 (15.5%) | 6 (4.0%) |
| $35,000 to $49,999 | 73 (15.3%) | 0 (0.0%) |
| $50,000 to $74,999 | 90 (18.9%) | 34 (22.4%) |
| $75,000 to $99,999 | 17 (3.6%) | 43 (28.3%) |
| $100,000 to $149,999 | 36 (7.5%) | 19 (12.5%) |
| $150,000 or more | 11 (2.3%) | 0 (0.0%) |
| Total | 477 (100.0%) | 152 (100.0%) |
Monthly Housing Cost Tiers in Culberson County
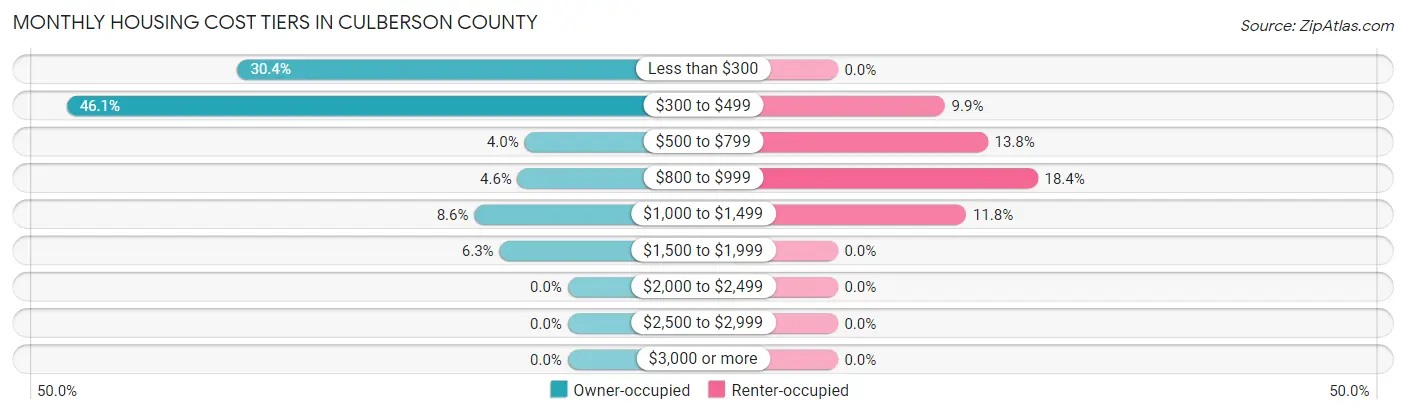
| Monthly Cost | Owner-occupied | Renter-occupied |
| Less than $300 | 145 (30.4%) | 0 (0.0%) |
| $300 to $499 | 220 (46.1%) | 15 (9.9%) |
| $500 to $799 | 19 (4.0%) | 21 (13.8%) |
| $800 to $999 | 22 (4.6%) | 28 (18.4%) |
| $1,000 to $1,499 | 41 (8.6%) | 18 (11.8%) |
| $1,500 to $1,999 | 30 (6.3%) | 0 (0.0%) |
| $2,000 to $2,499 | 0 (0.0%) | 0 (0.0%) |
| $2,500 to $2,999 | 0 (0.0%) | 0 (0.0%) |
| $3,000 or more | 0 (0.0%) | 0 (0.0%) |
| Total | 477 (100.0%) | 152 (100.0%) |
Physical Housing Characteristics in Culberson County
Housing Structures in Culberson County
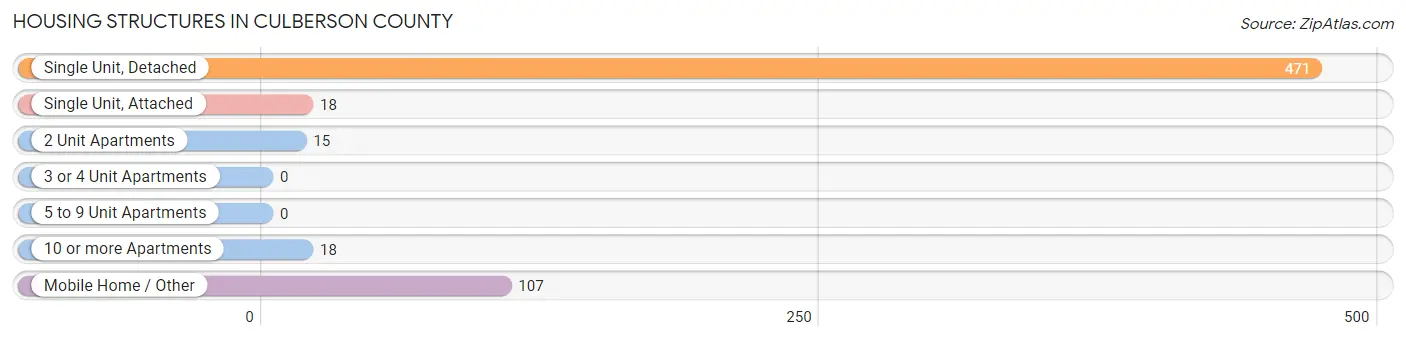
| Structure Type | # Housing Units | % Housing Units |
| Single Unit, Detached | 471 | 74.9% |
| Single Unit, Attached | 18 | 2.9% |
| 2 Unit Apartments | 15 | 2.4% |
| 3 or 4 Unit Apartments | 0 | 0.0% |
| 5 to 9 Unit Apartments | 0 | 0.0% |
| 10 or more Apartments | 18 | 2.9% |
| Mobile Home / Other | 107 | 17.0% |
| Total | 629 | 100.0% |
Housing Structures by Occupancy in Culberson County
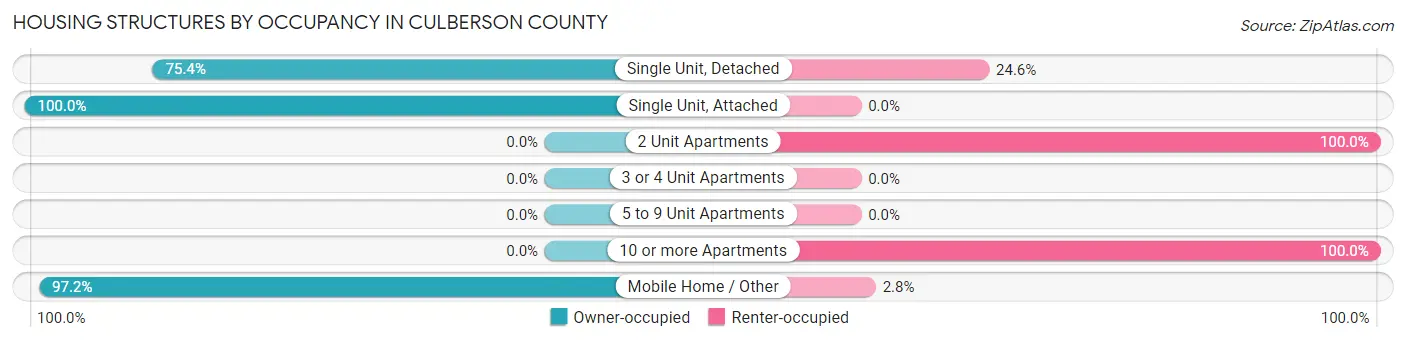
| Structure Type | Owner-occupied | Renter-occupied |
| Single Unit, Detached | 355 (75.4%) | 116 (24.6%) |
| Single Unit, Attached | 18 (100.0%) | 0 (0.0%) |
| 2 Unit Apartments | 0 (0.0%) | 15 (100.0%) |
| 3 or 4 Unit Apartments | 0 (0.0%) | 0 (0.0%) |
| 5 to 9 Unit Apartments | 0 (0.0%) | 0 (0.0%) |
| 10 or more Apartments | 0 (0.0%) | 18 (100.0%) |
| Mobile Home / Other | 104 (97.2%) | 3 (2.8%) |
| Total | 477 (75.8%) | 152 (24.2%) |
Housing Structures by Number of Rooms in Culberson County
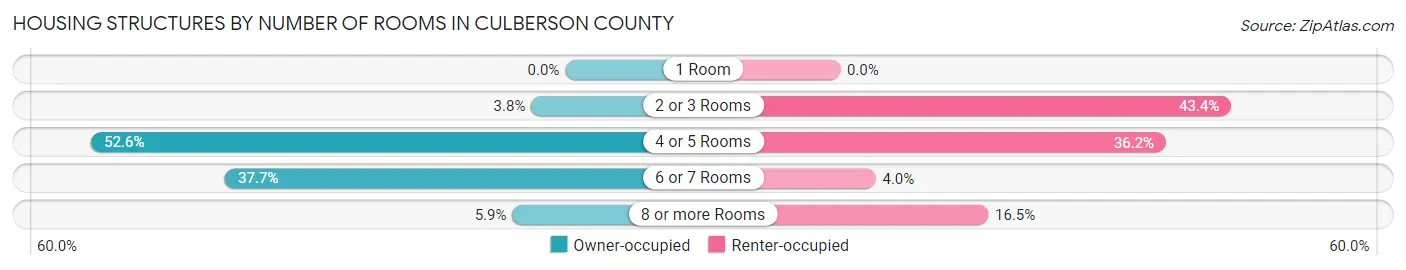
| Number of Rooms | Owner-occupied | Renter-occupied |
| 1 Room | 0 (0.0%) | 0 (0.0%) |
| 2 or 3 Rooms | 18 (3.8%) | 66 (43.4%) |
| 4 or 5 Rooms | 251 (52.6%) | 55 (36.2%) |
| 6 or 7 Rooms | 180 (37.7%) | 6 (4.0%) |
| 8 or more Rooms | 28 (5.9%) | 25 (16.5%) |
| Total | 477 (100.0%) | 152 (100.0%) |
Housing Structure by Heating Type in Culberson County
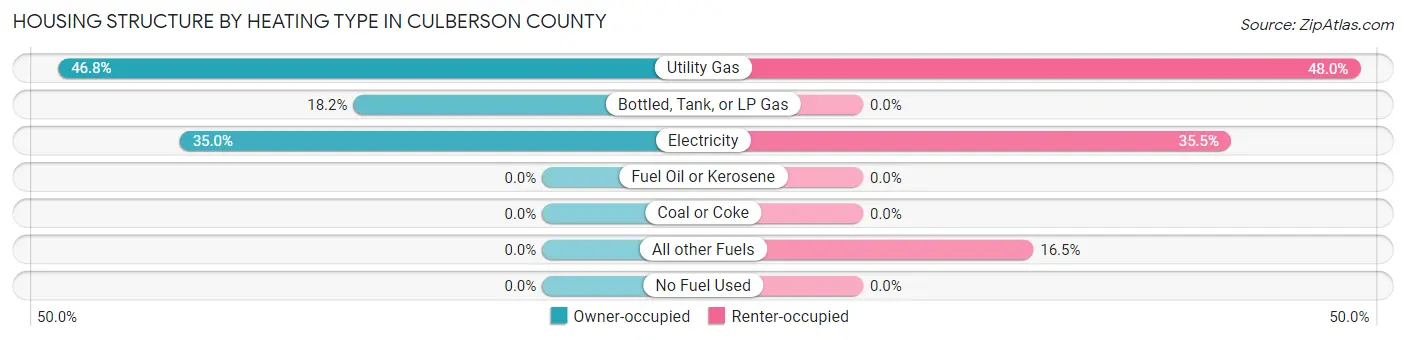
| Heating Type | Owner-occupied | Renter-occupied |
| Utility Gas | 223 (46.8%) | 73 (48.0%) |
| Bottled, Tank, or LP Gas | 87 (18.2%) | 0 (0.0%) |
| Electricity | 167 (35.0%) | 54 (35.5%) |
| Fuel Oil or Kerosene | 0 (0.0%) | 0 (0.0%) |
| Coal or Coke | 0 (0.0%) | 0 (0.0%) |
| All other Fuels | 0 (0.0%) | 25 (16.5%) |
| No Fuel Used | 0 (0.0%) | 0 (0.0%) |
| Total | 477 (100.0%) | 152 (100.0%) |
Household Vehicle Usage in Culberson County
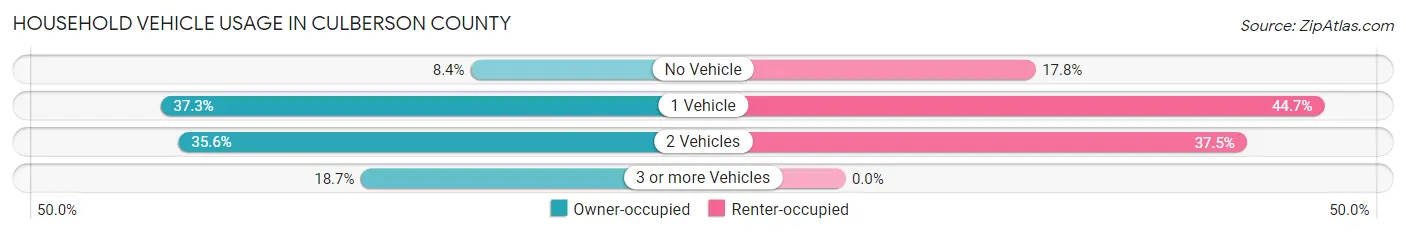
| Vehicles per Household | Owner-occupied | Renter-occupied |
| No Vehicle | 40 (8.4%) | 27 (17.8%) |
| 1 Vehicle | 178 (37.3%) | 68 (44.7%) |
| 2 Vehicles | 170 (35.6%) | 57 (37.5%) |
| 3 or more Vehicles | 89 (18.7%) | 0 (0.0%) |
| Total | 477 (100.0%) | 152 (100.0%) |
Real Estate & Mortgages in Culberson County
Real Estate and Mortgage Overview in Culberson County
| Characteristic | Without Mortgage | With Mortgage |
| Housing Units | 376 | 101 |
| Median Property Value | $80,300 | $117,800 |
| Median Household Income | $28,008 | $11 |
| Monthly Housing Costs | $336 | $0 |
| Real Estate Taxes | $688 | $11 |
Property Value by Mortgage Status in Culberson County
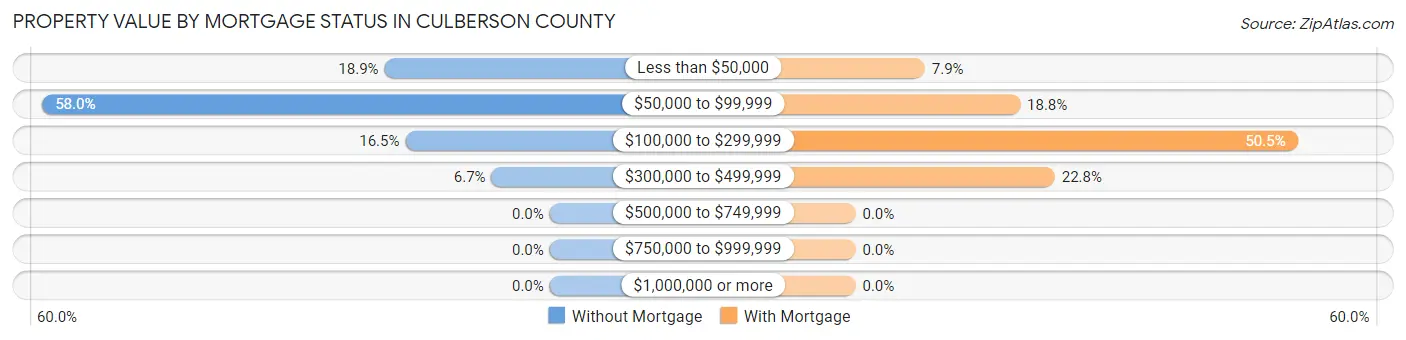
| Property Value | Without Mortgage | With Mortgage |
| Less than $50,000 | 71 (18.9%) | 8 (7.9%) |
| $50,000 to $99,999 | 218 (58.0%) | 19 (18.8%) |
| $100,000 to $299,999 | 62 (16.5%) | 51 (50.5%) |
| $300,000 to $499,999 | 25 (6.7%) | 23 (22.8%) |
| $500,000 to $749,999 | 0 (0.0%) | 0 (0.0%) |
| $750,000 to $999,999 | 0 (0.0%) | 0 (0.0%) |
| $1,000,000 or more | 0 (0.0%) | 0 (0.0%) |
| Total | 376 (100.0%) | 101 (100.0%) |
Household Income by Mortgage Status in Culberson County
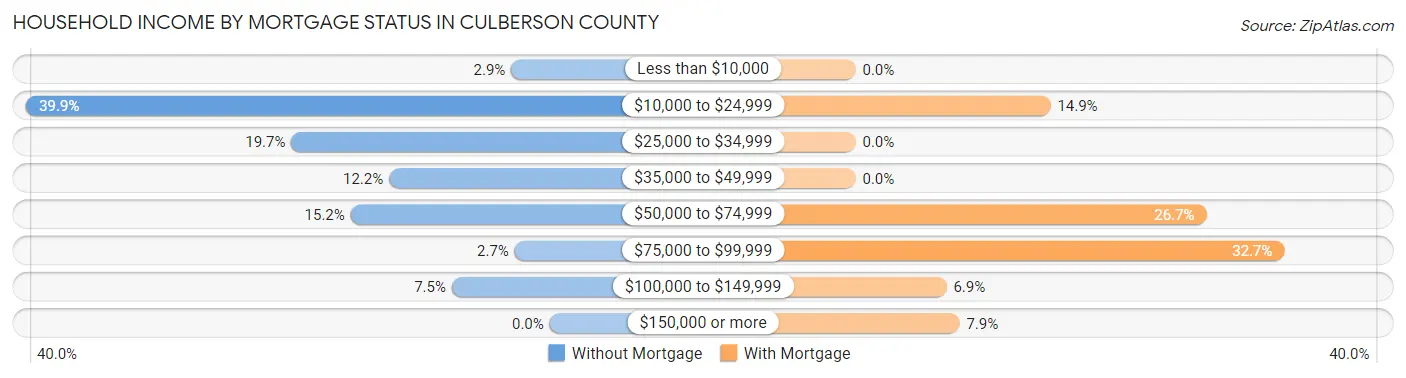
| Household Income | Without Mortgage | With Mortgage |
| Less than $10,000 | 11 (2.9%) | 0 (0.0%) |
| $10,000 to $24,999 | 150 (39.9%) | 15 (14.8%) |
| $25,000 to $34,999 | 74 (19.7%) | 0 (0.0%) |
| $35,000 to $49,999 | 46 (12.2%) | 0 (0.0%) |
| $50,000 to $74,999 | 57 (15.2%) | 27 (26.7%) |
| $75,000 to $99,999 | 10 (2.7%) | 33 (32.7%) |
| $100,000 to $149,999 | 28 (7.4%) | 7 (6.9%) |
| $150,000 or more | 0 (0.0%) | 8 (7.9%) |
| Total | 376 (100.0%) | 101 (100.0%) |
Property Value to Household Income Ratio in Culberson County
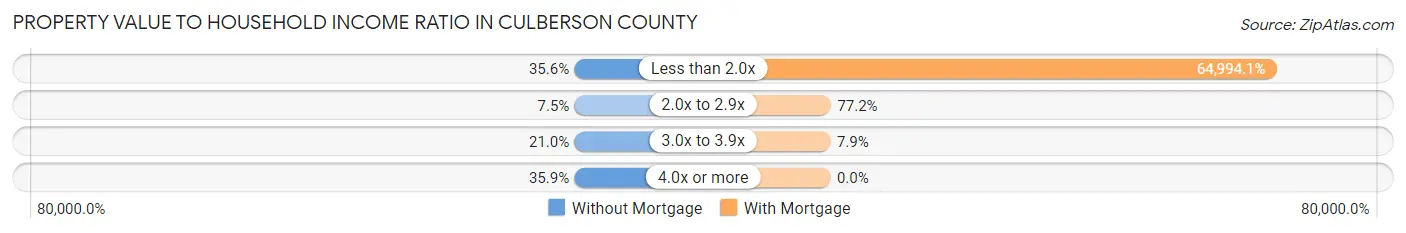
| Value-to-Income Ratio | Without Mortgage | With Mortgage |
| Less than 2.0x | 134 (35.6%) | 65,644 (64,994.1%) |
| 2.0x to 2.9x | 28 (7.4%) | 78 (77.2%) |
| 3.0x to 3.9x | 79 (21.0%) | 8 (7.9%) |
| 4.0x or more | 135 (35.9%) | 0 (0.0%) |
| Total | 376 (100.0%) | 101 (100.0%) |
Real Estate Taxes by Mortgage Status in Culberson County
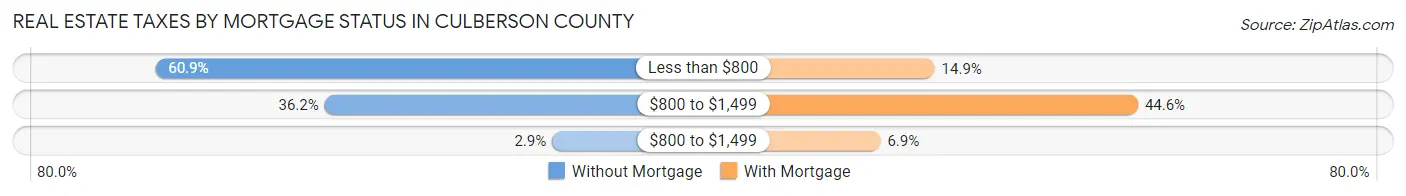
| Property Taxes | Without Mortgage | With Mortgage |
| Less than $800 | 229 (60.9%) | 15 (14.8%) |
| $800 to $1,499 | 136 (36.2%) | 45 (44.6%) |
| $800 to $1,499 | 11 (2.9%) | 7 (6.9%) |
| Total | 376 (100.0%) | 101 (100.0%) |
Health & Disability in Culberson County
Health Insurance Coverage by Age in Culberson County
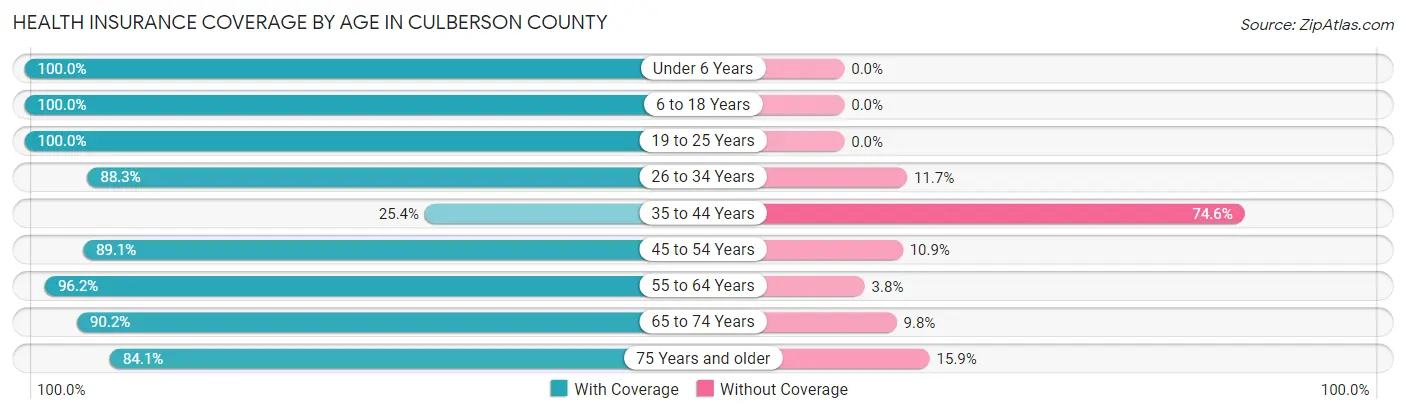
| Age Bracket | With Coverage | Without Coverage |
| Under 6 Years | 67 (100.0%) | 0 (0.0%) |
| 6 to 18 Years | 265 (100.0%) | 0 (0.0%) |
| 19 to 25 Years | 152 (100.0%) | 0 (0.0%) |
| 26 to 34 Years | 249 (88.3%) | 33 (11.7%) |
| 35 to 44 Years | 53 (25.4%) | 156 (74.6%) |
| 45 to 54 Years | 499 (89.1%) | 61 (10.9%) |
| 55 to 64 Years | 152 (96.2%) | 6 (3.8%) |
| 65 to 74 Years | 268 (90.2%) | 29 (9.8%) |
| 75 Years and older | 148 (84.1%) | 28 (15.9%) |
| Total | 1,853 (85.6%) | 313 (14.4%) |
Health Insurance Coverage by Citizenship Status in Culberson County
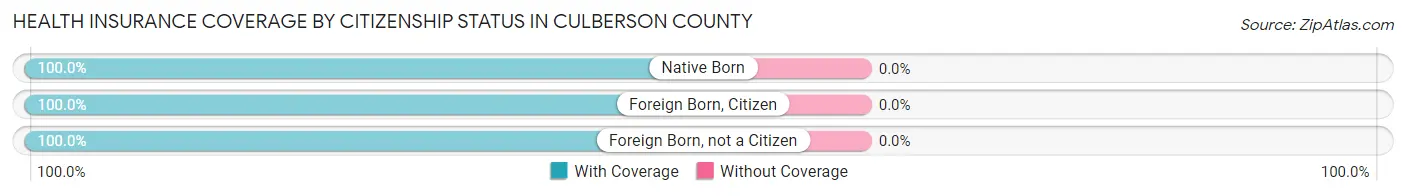
| Citizenship Status | With Coverage | Without Coverage |
| Native Born | 67 (100.0%) | 0 (0.0%) |
| Foreign Born, Citizen | 265 (100.0%) | 0 (0.0%) |
| Foreign Born, not a Citizen | 152 (100.0%) | 0 (0.0%) |
Health Insurance Coverage by Household Income in Culberson County
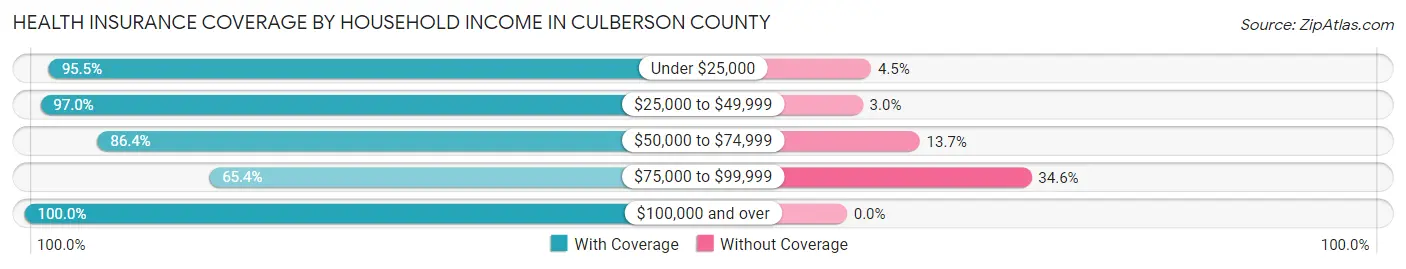
| Household Income | With Coverage | Without Coverage |
| Under $25,000 | 316 (95.5%) | 15 (4.5%) |
| $25,000 to $49,999 | 457 (97.0%) | 14 (3.0%) |
| $50,000 to $74,999 | 424 (86.4%) | 67 (13.7%) |
| $75,000 to $99,999 | 365 (65.4%) | 193 (34.6%) |
| $100,000 and over | 289 (100.0%) | 0 (0.0%) |
Public vs Private Health Insurance Coverage by Age in Culberson County
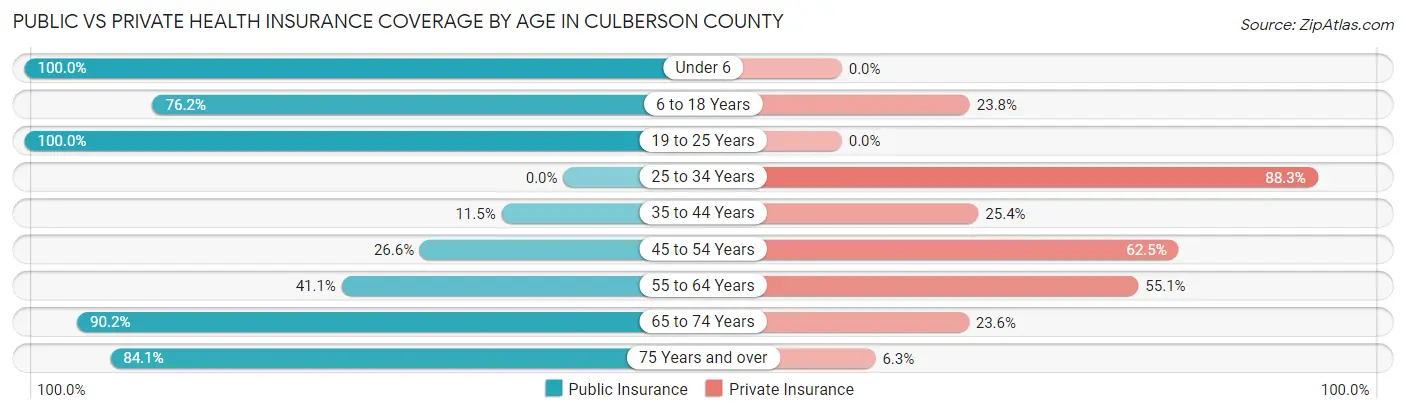
| Age Bracket | Public Insurance | Private Insurance |
| Under 6 | 67 (100.0%) | 0 (0.0%) |
| 6 to 18 Years | 202 (76.2%) | 63 (23.8%) |
| 19 to 25 Years | 152 (100.0%) | 0 (0.0%) |
| 25 to 34 Years | 0 (0.0%) | 249 (88.3%) |
| 35 to 44 Years | 24 (11.5%) | 53 (25.4%) |
| 45 to 54 Years | 149 (26.6%) | 350 (62.5%) |
| 55 to 64 Years | 65 (41.1%) | 87 (55.1%) |
| 65 to 74 Years | 268 (90.2%) | 70 (23.6%) |
| 75 Years and over | 148 (84.1%) | 11 (6.2%) |
| Total | 1,075 (49.6%) | 883 (40.8%) |
Disability Status by Sex by Age in Culberson County
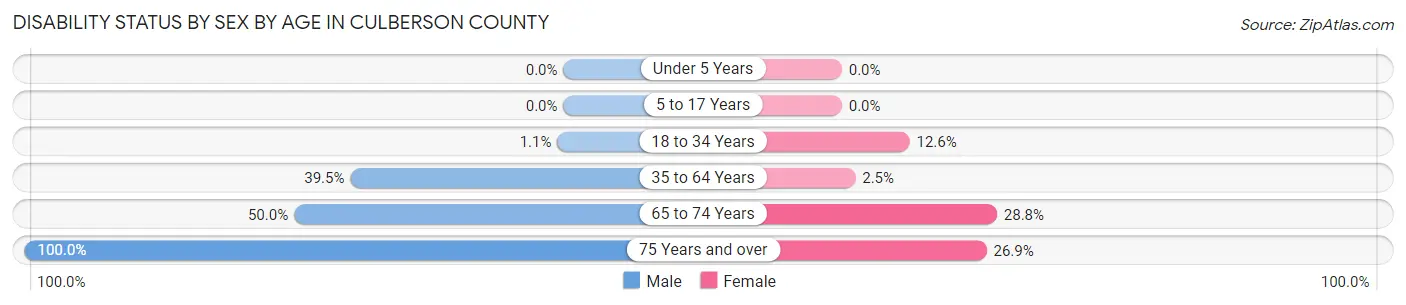
| Age Bracket | Male | Female |
| Under 5 Years | 0 (0.0%) | 0 (0.0%) |
| 5 to 17 Years | 0 (0.0%) | 0 (0.0%) |
| 18 to 34 Years | 3 (1.1%) | 21 (12.6%) |
| 35 to 64 Years | 240 (39.5%) | 8 (2.5%) |
| 65 to 74 Years | 79 (50.0%) | 40 (28.8%) |
| 75 Years and over | 109 (100.0%) | 18 (26.9%) |
Disability Class by Sex by Age in Culberson County
Disability Class: Hearing Difficulty
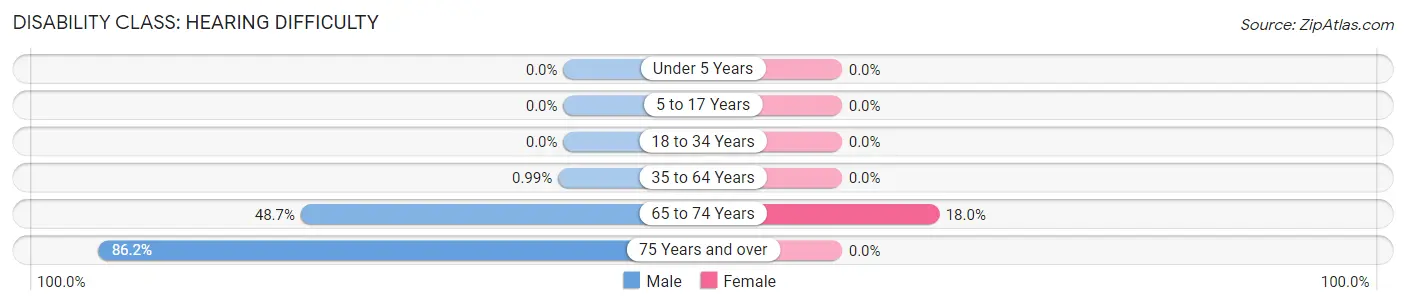
| Age Bracket | Male | Female |
| Under 5 Years | 0 (0.0%) | 0 (0.0%) |
| 5 to 17 Years | 0 (0.0%) | 0 (0.0%) |
| 18 to 34 Years | 0 (0.0%) | 0 (0.0%) |
| 35 to 64 Years | 6 (1.0%) | 0 (0.0%) |
| 65 to 74 Years | 77 (48.7%) | 25 (18.0%) |
| 75 Years and over | 94 (86.2%) | 0 (0.0%) |
Disability Class: Vision Difficulty
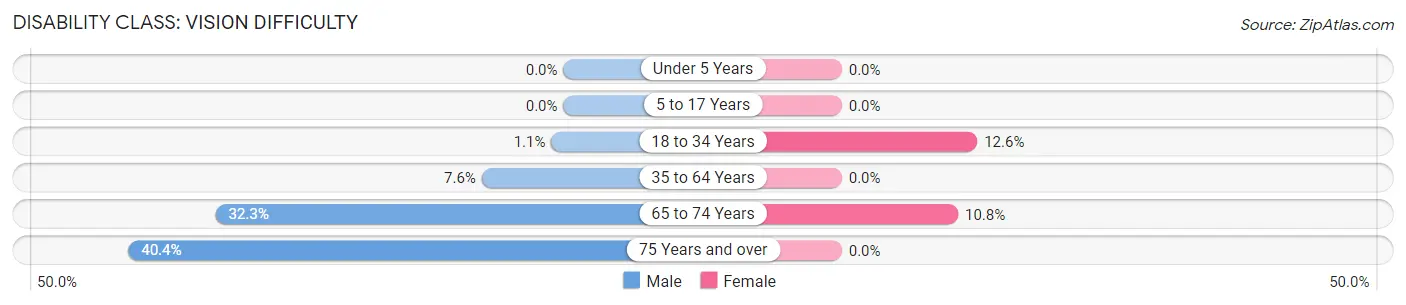
| Age Bracket | Male | Female |
| Under 5 Years | 0 (0.0%) | 0 (0.0%) |
| 5 to 17 Years | 0 (0.0%) | 0 (0.0%) |
| 18 to 34 Years | 3 (1.1%) | 21 (12.6%) |
| 35 to 64 Years | 46 (7.6%) | 0 (0.0%) |
| 65 to 74 Years | 51 (32.3%) | 15 (10.8%) |
| 75 Years and over | 44 (40.4%) | 0 (0.0%) |
Disability Class: Cognitive Difficulty
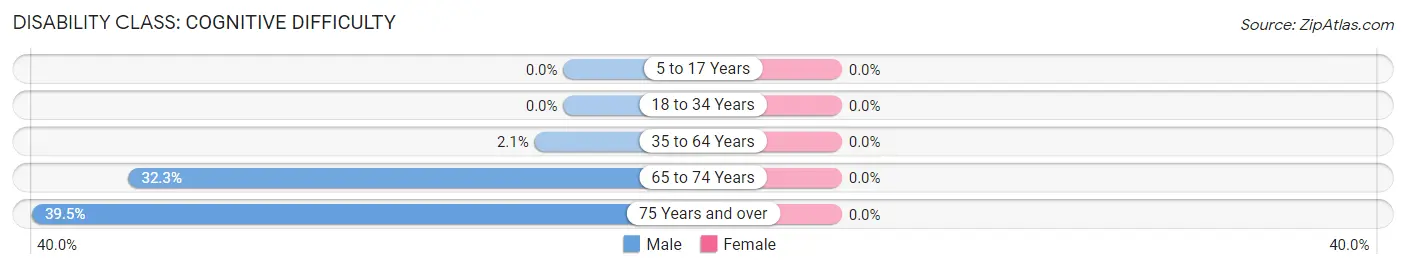
| Age Bracket | Male | Female |
| 5 to 17 Years | 0 (0.0%) | 0 (0.0%) |
| 18 to 34 Years | 0 (0.0%) | 0 (0.0%) |
| 35 to 64 Years | 13 (2.1%) | 0 (0.0%) |
| 65 to 74 Years | 51 (32.3%) | 0 (0.0%) |
| 75 Years and over | 43 (39.5%) | 0 (0.0%) |
Disability Class: Ambulatory Difficulty
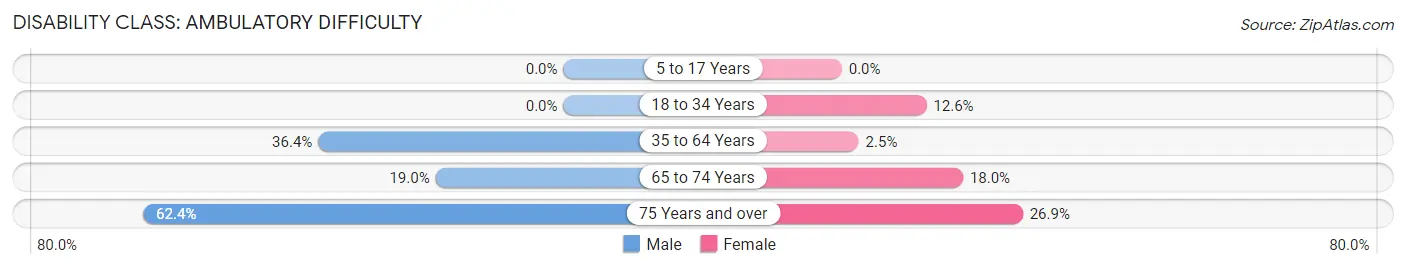
| Age Bracket | Male | Female |
| 5 to 17 Years | 0 (0.0%) | 0 (0.0%) |
| 18 to 34 Years | 0 (0.0%) | 21 (12.6%) |
| 35 to 64 Years | 221 (36.4%) | 8 (2.5%) |
| 65 to 74 Years | 30 (19.0%) | 25 (18.0%) |
| 75 Years and over | 68 (62.4%) | 18 (26.9%) |
Disability Class: Self-Care Difficulty
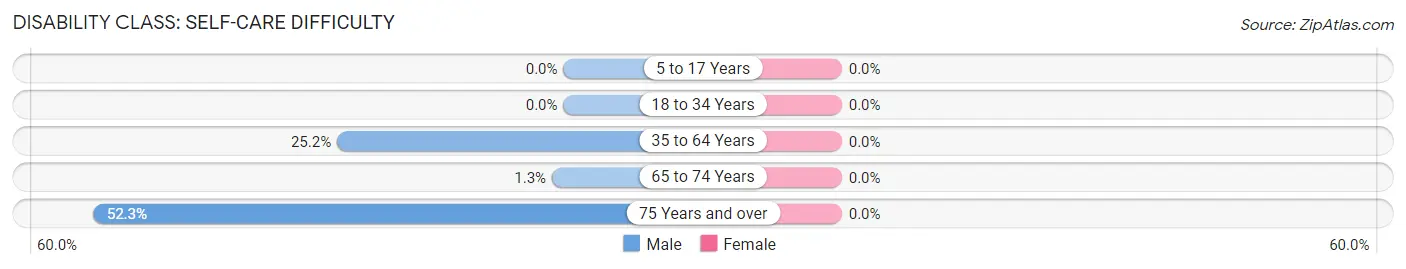
| Age Bracket | Male | Female |
| 5 to 17 Years | 0 (0.0%) | 0 (0.0%) |
| 18 to 34 Years | 0 (0.0%) | 0 (0.0%) |
| 35 to 64 Years | 153 (25.2%) | 0 (0.0%) |
| 65 to 74 Years | 2 (1.3%) | 0 (0.0%) |
| 75 Years and over | 57 (52.3%) | 0 (0.0%) |
Technology Access in Culberson County
Computing Device Access in Culberson County
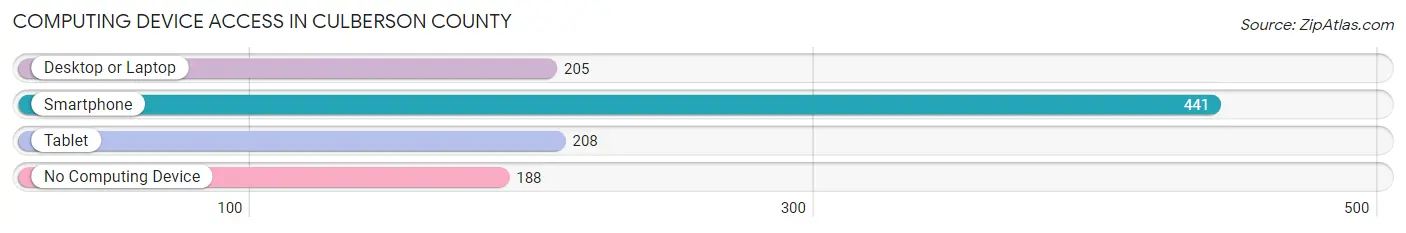
| Device Type | # Households | % Households |
| Desktop or Laptop | 205 | 32.6% |
| Smartphone | 441 | 70.1% |
| Tablet | 208 | 33.1% |
| No Computing Device | 188 | 29.9% |
| Total | 629 | 100.0% |
Internet Access in Culberson County
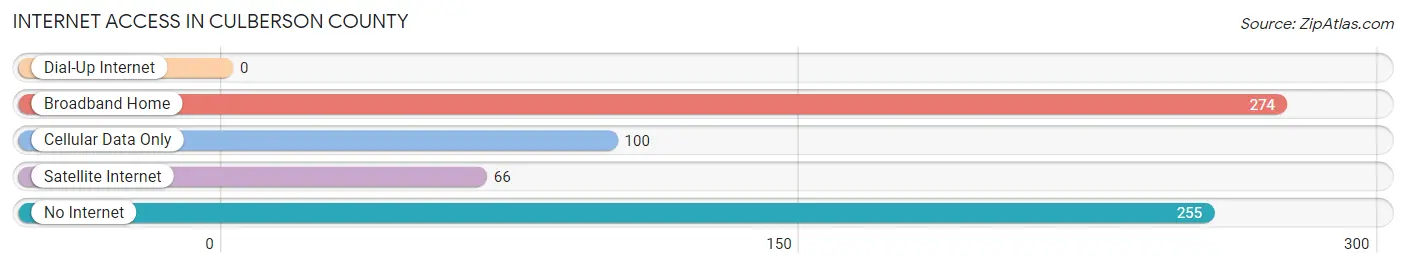
| Internet Type | # Households | % Households |
| Dial-Up Internet | 0 | 0.0% |
| Broadband Home | 274 | 43.6% |
| Cellular Data Only | 100 | 15.9% |
| Satellite Internet | 66 | 10.5% |
| No Internet | 255 | 40.5% |
| Total | 629 | 100.0% |
Culberson County Summary
Culberson County is located in the Trans-Pecos region of West Texas. It is bordered by Hudspeth County to the north, Jeff Davis County to the east, and Presidio County to the south. The county seat is Van Horn, and the largest city is Van Horn. The county has a total area of 2,945 square miles, of which 2,945 square miles is land and 0.2 square miles is water.
History
Culberson County was created in 1911 from parts of El Paso and Hudspeth counties. It was named for David B. Culberson, a former U.S. Representative from Texas. The county was originally part of the Mescalero Apache Reservation, which was established in 1873. The reservation was dissolved in 1883, and the land was opened for settlement.
Geography
Culberson County is located in the Trans-Pecos region of West Texas. It is bordered by Hudspeth County to the north, Jeff Davis County to the east, and Presidio County to the south. The county has a total area of 2,945 square miles, of which 2,945 square miles is land and 0.2 square miles is water. The terrain is mostly flat to rolling plains, with some rugged hills and canyons. The highest point in the county is Guadalupe Peak, which has an elevation of 8,749 feet.
The county is home to several state parks, including Guadalupe Mountains National Park, which is located in the northern part of the county. The park is home to the highest peak in Texas, Guadalupe Peak, as well as the second highest peak in the state, El Capitan. The park also features a variety of wildlife, including deer, mountain lions, and bighorn sheep.
Economy
Culberson County has a largely agricultural economy. The county is home to several large ranches, including the historic W.T. Waggoner Ranch, which is the largest ranch in the United States. The county is also home to several oil and gas fields, which provide jobs and revenue for the county.
The county is also home to several tourist attractions, including the Guadalupe Mountains National Park, the Van Horn Astronomical Observatory, and the Van Horn Historic District. These attractions bring in visitors from all over the world, providing an economic boost to the county.
Demographics
As of the 2010 census, the population of Culberson County was 2,398. The racial makeup of the county was 75.3% White, 0.7% African American, 0.3% Native American, 0.1% Asian, 0.1% Pacific Islander, 21.7% from other races, and 1.8% from two or more races. Hispanic or Latino of any race were 57.3% of the population.
The median income for a household in the county was $30,938, and the median income for a family was $35,625. The per capita income for the county was $14,945. About 17.2% of families and 21.3% of the population were below the poverty line, including 28.3% of those under age 18 and 15.2% of those age 65 or over.
Common Questions
What is Per Capita Income in Culberson County?
Per Capita income in Culberson County is $29,295.
What is the Median Family Income in Culberson County?
Median Family Income in Culberson County is $46,513.
What is the Median Household income in Culberson County?
Median Household Income in Culberson County is $35,924.
What is Income or Wage Gap in Culberson County?
Income or Wage Gap in Culberson County is 43.0%.
Women in Culberson County earn 57.0 cents for every dollar earned by a man.
What is Inequality or Gini Index in Culberson County?
Inequality or Gini Index in Culberson County is 0.43.
What is the Total Population of Culberson County?
Total Population of Culberson County is 2,181.
What is the Total Male Population of Culberson County?
Total Male Population of Culberson County is 1,343.
What is the Total Female Population of Culberson County?
Total Female Population of Culberson County is 838.
What is the Ratio of Males per 100 Females in Culberson County?
There are 160.26 Males per 100 Females in Culberson County.
What is the Ratio of Females per 100 Males in Culberson County?
There are 62.40 Females per 100 Males in Culberson County.
What is the Median Population Age in Culberson County?
Median Population Age in Culberson County is 47.5 Years.
What is the Average Family Size in Culberson County
Average Family Size in Culberson County is 4.6 People.
What is the Average Household Size in Culberson County
Average Household Size in Culberson County is 3.4 People.
How Large is the Labor Force in Culberson County?
There are 1,035 People in the Labor Forcein in Culberson County.
What is the Percentage of People in the Labor Force in Culberson County?
55.4% of People are in the Labor Force in Culberson County.
What is the Unemployment Rate in Culberson County?
Unemployment Rate in Culberson County is 10.1%.