Crockett County, TX Map & Demographics
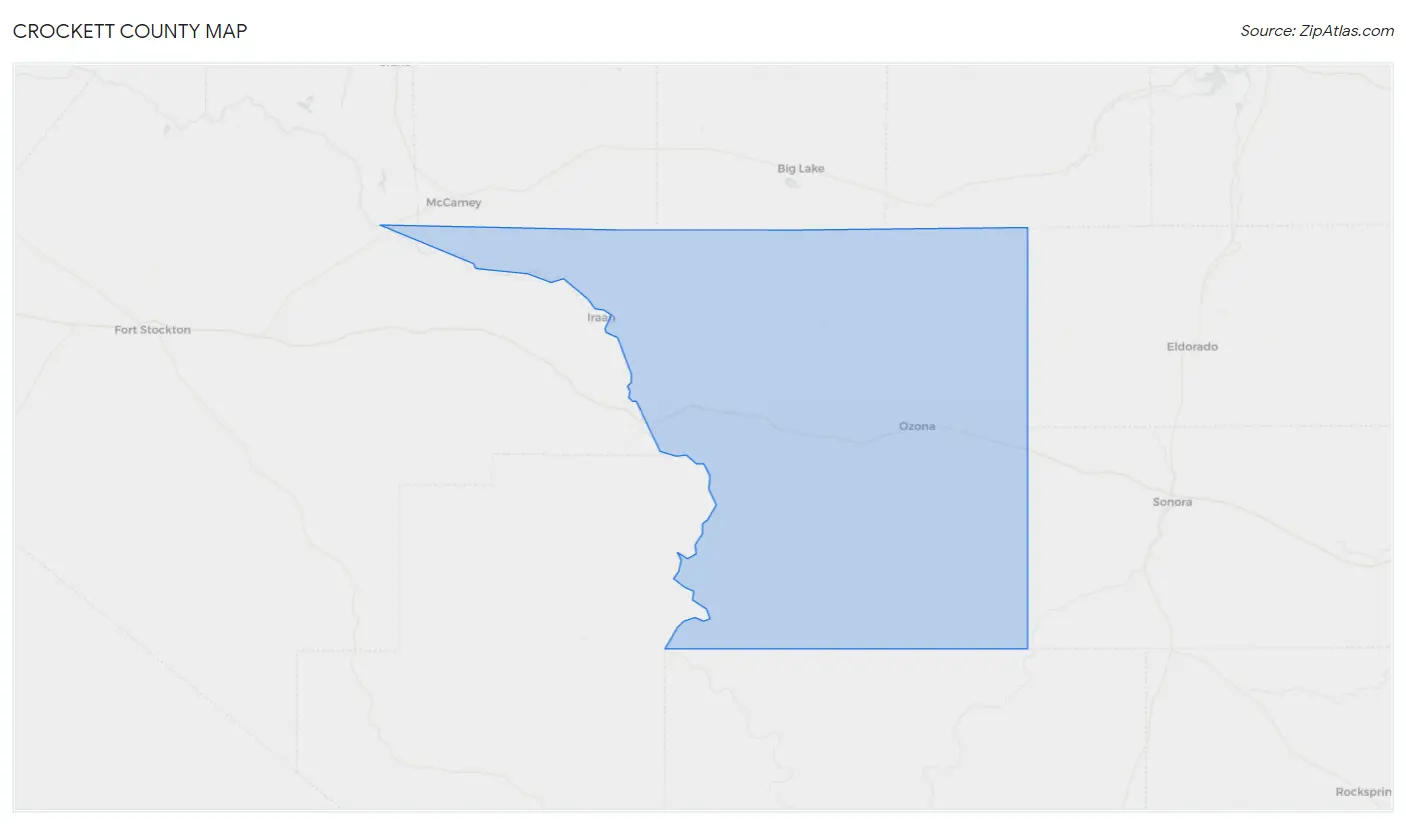
Crockett County Map
Crockett County Overview
$35,942
PER CAPITA INCOME
$76,684
AVG FAMILY INCOME
$64,103
AVG HOUSEHOLD INCOME
42.2%
WAGE / INCOME GAP [ % ]
57.8¢/ $1
WAGE / INCOME GAP [ $ ]
0.36
INEQUALITY / GINI INDEX
2,949
TOTAL POPULATION
1,575
MALE POPULATION
1,374
FEMALE POPULATION
114.63
MALES / 100 FEMALES
87.24
FEMALES / 100 MALES
50.0
MEDIAN AGE
2.8
AVG FAMILY SIZE
2.2
AVG HOUSEHOLD SIZE
1,589
LABOR FORCE [ PEOPLE ]
63.8%
PERCENT IN LABOR FORCE
2.0%
UNEMPLOYMENT RATE
Income in Crockett County
Income Overview in Crockett County
Per Capita Income in Crockett County is $35,942, while median incomes of families and households are $76,684 and $64,103 respectively.
| Characteristic | Number | Measure |
| Per Capita Income | 2,949 | $35,942 |
| Median Family Income | 905 | $76,684 |
| Mean Family Income | 905 | $90,867 |
| Median Household Income | 1,289 | $64,103 |
| Mean Household Income | 1,289 | $80,443 |
| Income Deficit | 905 | $0 |
| Wage / Income Gap (%) | 2,949 | 42.18% |
| Wage / Income Gap ($) | 2,949 | 57.82¢ per $1 |
| Gini / Inequality Index | 2,949 | 0.36 |
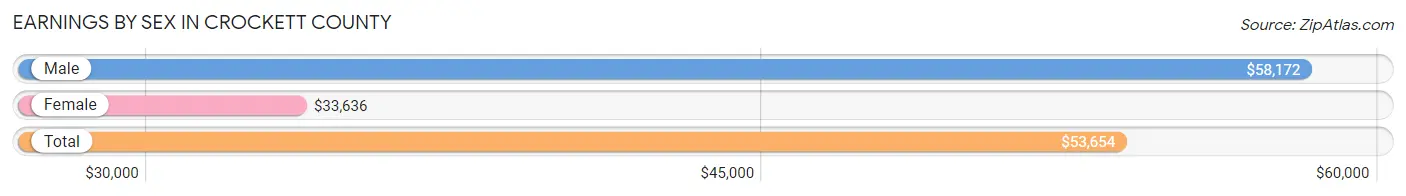
Earnings by Sex in Crockett County
Average Earnings in Crockett County are $53,654, $58,172 for men and $33,636 for women, a difference of 42.2%.
| Sex | Number | Average Earnings |
| Male | 892 (54.3%) | $58,172 |
| Female | 752 (45.7%) | $33,636 |
| Total | 1,644 (100.0%) | $53,654 |
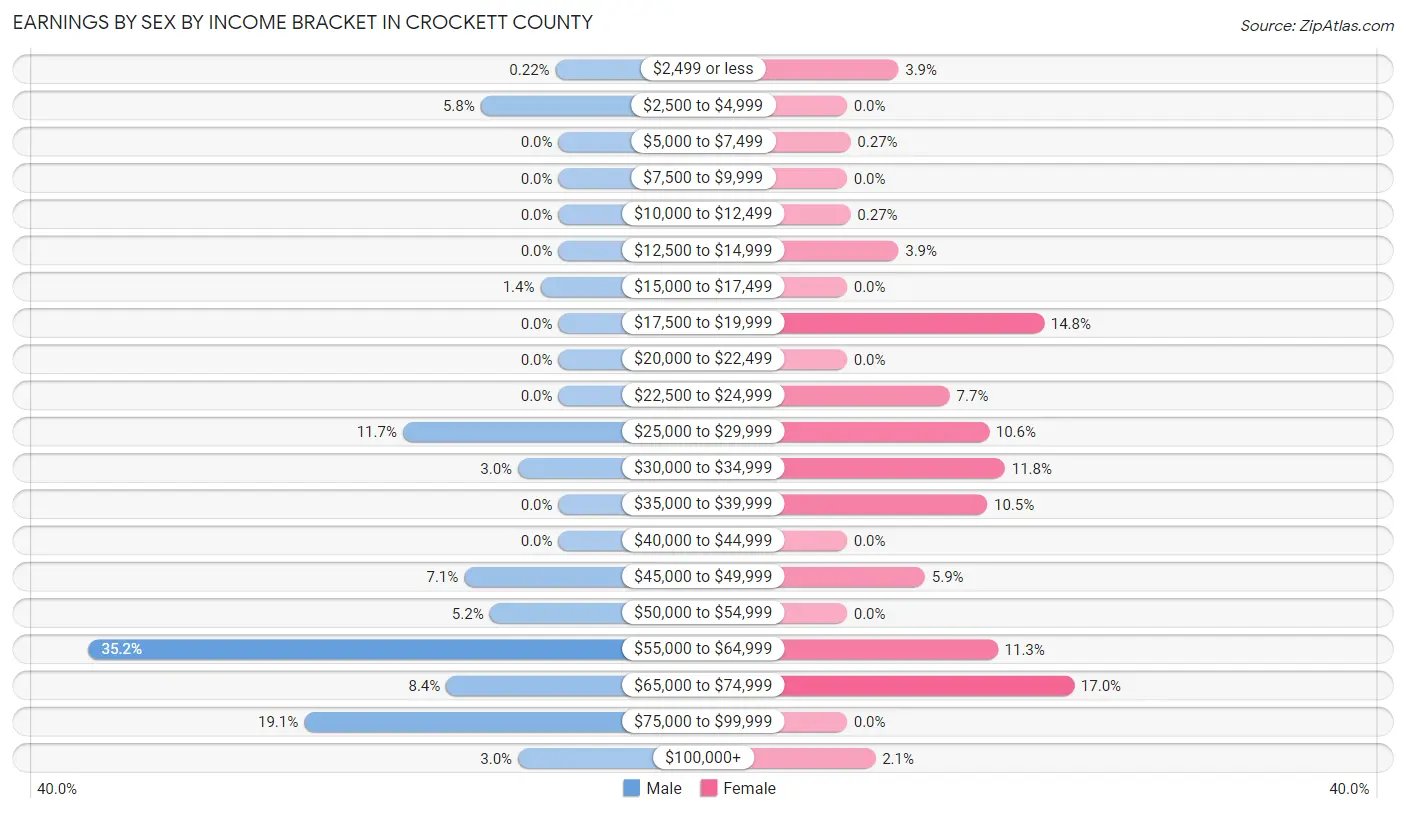
Earnings by Sex by Income Bracket in Crockett County
The most common earnings brackets in Crockett County are $55,000 to $64,999 for men (314 | 35.2%) and $65,000 to $74,999 for women (128 | 17.0%).
| Income | Male | Female |
| $2,499 or less | 2 (0.2%) | 29 (3.9%) |
| $2,500 to $4,999 | 52 (5.8%) | 0 (0.0%) |
| $5,000 to $7,499 | 0 (0.0%) | 2 (0.3%) |
| $7,500 to $9,999 | 0 (0.0%) | 0 (0.0%) |
| $10,000 to $12,499 | 0 (0.0%) | 2 (0.3%) |
| $12,500 to $14,999 | 0 (0.0%) | 29 (3.9%) |
| $15,000 to $17,499 | 12 (1.3%) | 0 (0.0%) |
| $17,500 to $19,999 | 0 (0.0%) | 111 (14.8%) |
| $20,000 to $22,499 | 0 (0.0%) | 0 (0.0%) |
| $22,500 to $24,999 | 0 (0.0%) | 58 (7.7%) |
| $25,000 to $29,999 | 104 (11.7%) | 80 (10.6%) |
| $30,000 to $34,999 | 27 (3.0%) | 89 (11.8%) |
| $35,000 to $39,999 | 0 (0.0%) | 79 (10.5%) |
| $40,000 to $44,999 | 0 (0.0%) | 0 (0.0%) |
| $45,000 to $49,999 | 63 (7.1%) | 44 (5.9%) |
| $50,000 to $54,999 | 46 (5.2%) | 0 (0.0%) |
| $55,000 to $64,999 | 314 (35.2%) | 85 (11.3%) |
| $65,000 to $74,999 | 75 (8.4%) | 128 (17.0%) |
| $75,000 to $99,999 | 170 (19.1%) | 0 (0.0%) |
| $100,000+ | 27 (3.0%) | 16 (2.1%) |
| Total | 892 (100.0%) | 752 (100.0%) |
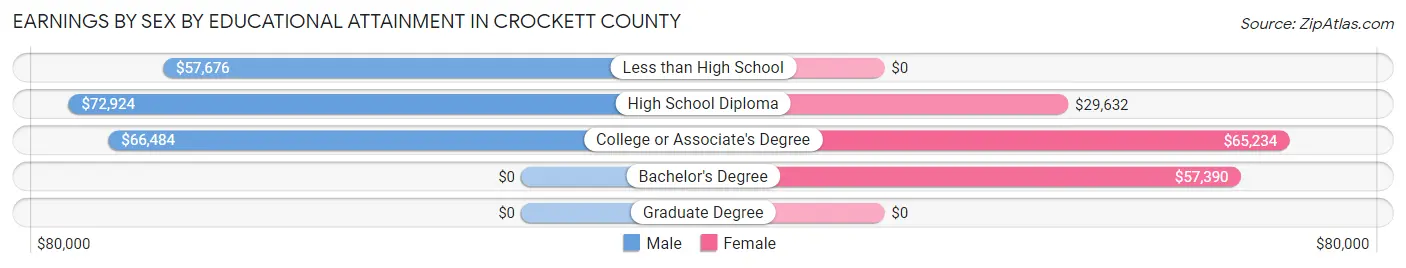
Earnings by Sex by Educational Attainment in Crockett County
Average earnings in Crockett County are $58,377 for men and $34,631 for women, a difference of 40.7%. Men with an educational attainment of high school diploma enjoy the highest average annual earnings of $72,924, while those with less than high school education earn the least with $57,676. Women with an educational attainment of college or associate's degree earn the most with the average annual earnings of $65,234, while those with high school diploma education have the smallest earnings of $29,632.
| Educational Attainment | Male Income | Female Income |
| Less than High School | $57,676 | $0 |
| High School Diploma | $72,924 | $29,632 |
| College or Associate's Degree | $66,484 | $65,234 |
| Bachelor's Degree | - | - |
| Graduate Degree | - | - |
| Total | $58,377 | $34,631 |
Family Income in Crockett County
Family Income Brackets in Crockett County
According to the Crockett County family income data, there are 245 families falling into the $100,000 to $149,999 income range, which is the most common income bracket and makes up 27.1% of all families.
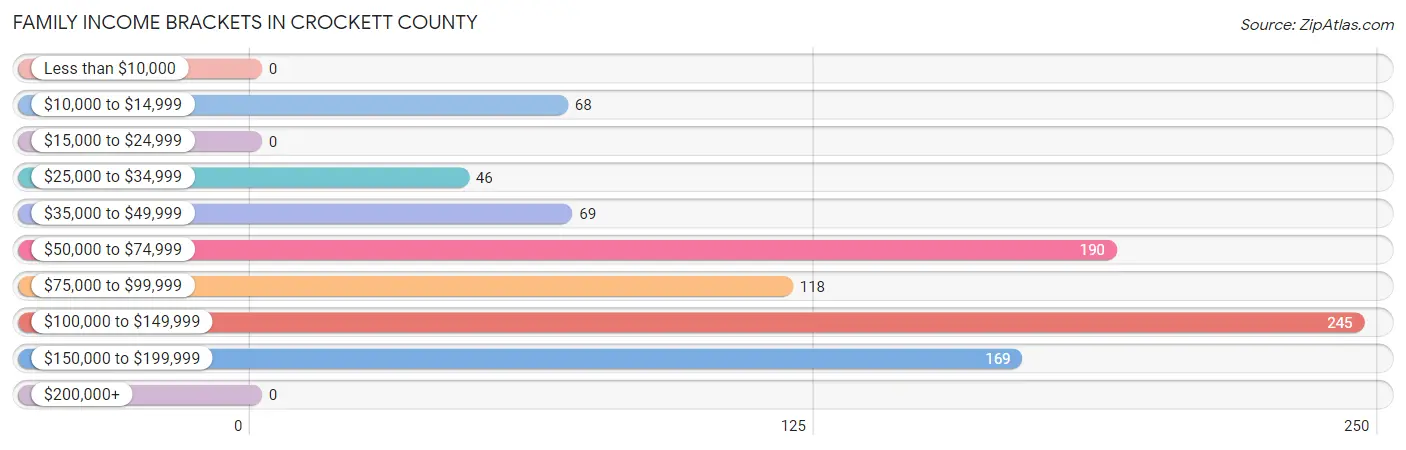
| Income Bracket | # Families | % Families |
| Less than $10,000 | 0 | 0.0% |
| $10,000 to $14,999 | 68 | 7.5% |
| $15,000 to $24,999 | 0 | 0.0% |
| $25,000 to $34,999 | 46 | 5.1% |
| $35,000 to $49,999 | 69 | 7.6% |
| $50,000 to $74,999 | 190 | 21.0% |
| $75,000 to $99,999 | 118 | 13.0% |
| $100,000 to $149,999 | 245 | 27.1% |
| $150,000 to $199,999 | 169 | 18.7% |
| $200,000+ | 0 | 0.0% |
Family Income by Famaliy Size in Crockett County
3-person families (285 | 31.5%) account for the highest median family income in Crockett County with $137,023 per family, while 3-person families (285 | 31.5%) have the highest median income of $45,674 per family member.
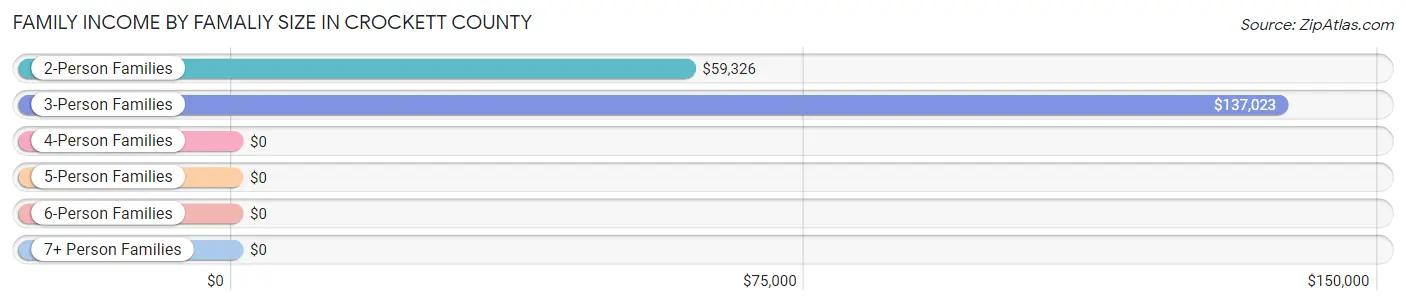
| Income Bracket | # Families | Median Income |
| 2-Person Families | 544 (60.1%) | $59,326 |
| 3-Person Families | 285 (31.5%) | $137,023 |
| 4-Person Families | 46 (5.1%) | $0 |
| 5-Person Families | 0 (0.0%) | $0 |
| 6-Person Families | 0 (0.0%) | $0 |
| 7+ Person Families | 30 (3.3%) | $0 |
| Total | 905 (100.0%) | $76,684 |
Family Income by Number of Earners in Crockett County
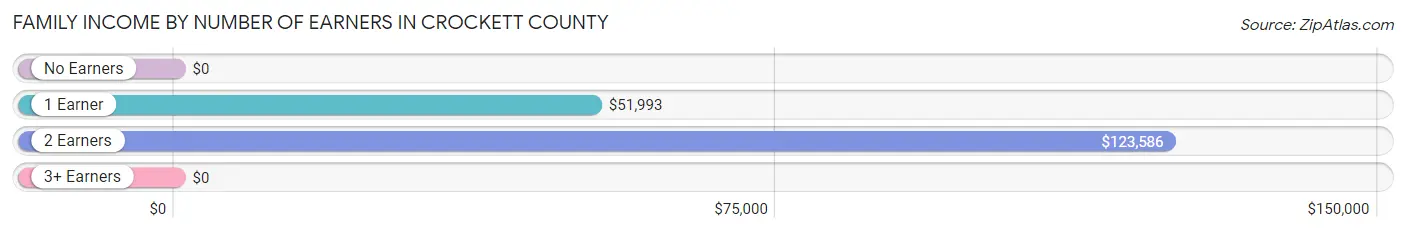
| Number of Earners | # Families | Median Income |
| No Earners | 34 (3.8%) | $0 |
| 1 Earner | 383 (42.3%) | $51,993 |
| 2 Earners | 475 (52.5%) | $123,586 |
| 3+ Earners | 13 (1.4%) | $0 |
| Total | 905 (100.0%) | $76,684 |
Household Income in Crockett County
Household Income Brackets in Crockett County
With 302 households falling in the category, the $100,000 to $149,999 income range is the most frequent in Crockett County, accounting for 23.4% of all households.
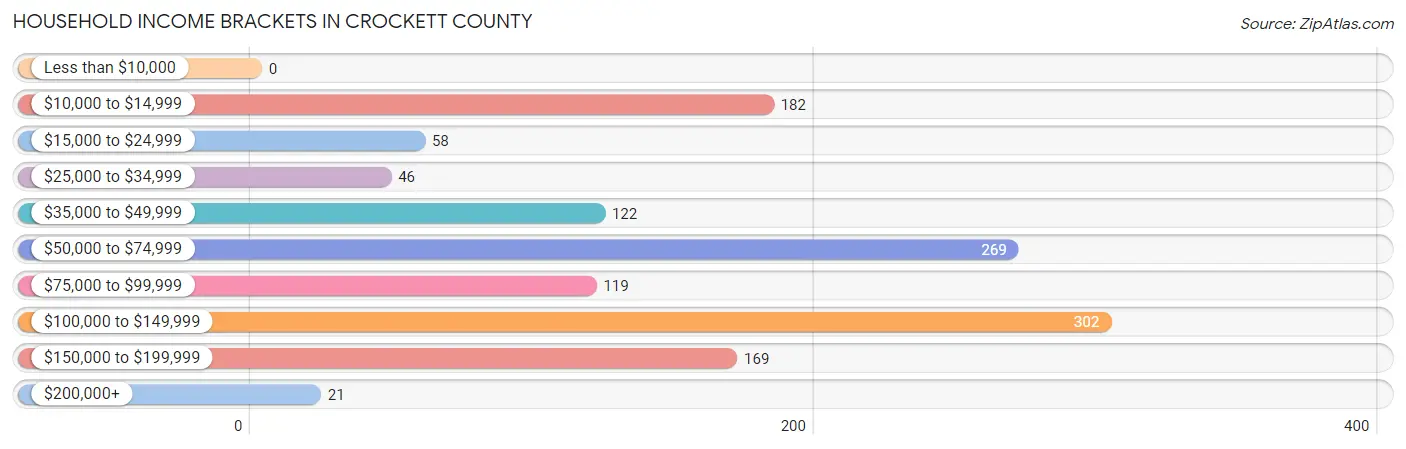
| Income Bracket | # Households | % Households |
| Less than $10,000 | 0 | 0.0% |
| $10,000 to $14,999 | 182 | 14.1% |
| $15,000 to $24,999 | 58 | 4.5% |
| $25,000 to $34,999 | 46 | 3.6% |
| $35,000 to $49,999 | 122 | 9.5% |
| $50,000 to $74,999 | 269 | 20.9% |
| $75,000 to $99,999 | 119 | 9.2% |
| $100,000 to $149,999 | 302 | 23.4% |
| $150,000 to $199,999 | 169 | 13.1% |
| $200,000+ | 21 | 1.6% |
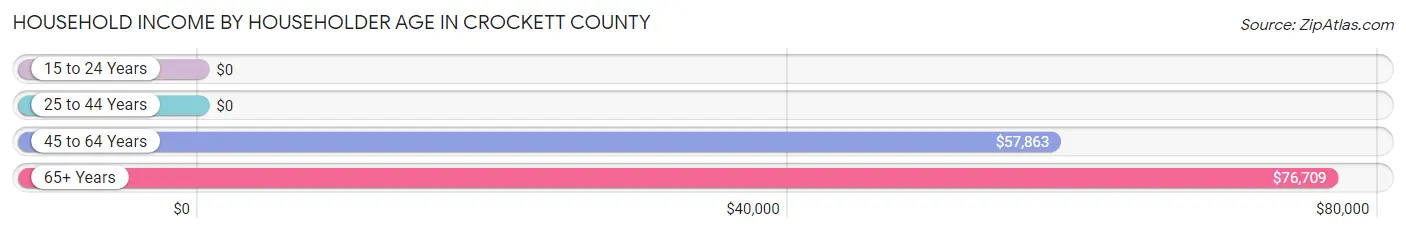
Household Income by Householder Age in Crockett County
The median household income in Crockett County is $64,103, with the highest median household income of $76,709 found in the 65+ years age bracket for the primary householder. A total of 379 households (29.4%) fall into this category. Meanwhile, the 15 to 24 years age bracket for the primary householder has the lowest median household income of $0, with 43 households (3.3%) in this group.
| Income Bracket | # Households | Median Income |
| 15 to 24 Years | 43 (3.3%) | $0 |
| 25 to 44 Years | 346 (26.8%) | $0 |
| 45 to 64 Years | 521 (40.4%) | $57,863 |
| 65+ Years | 379 (29.4%) | $76,709 |
| Total | 1,289 (100.0%) | $64,103 |
Poverty in Crockett County
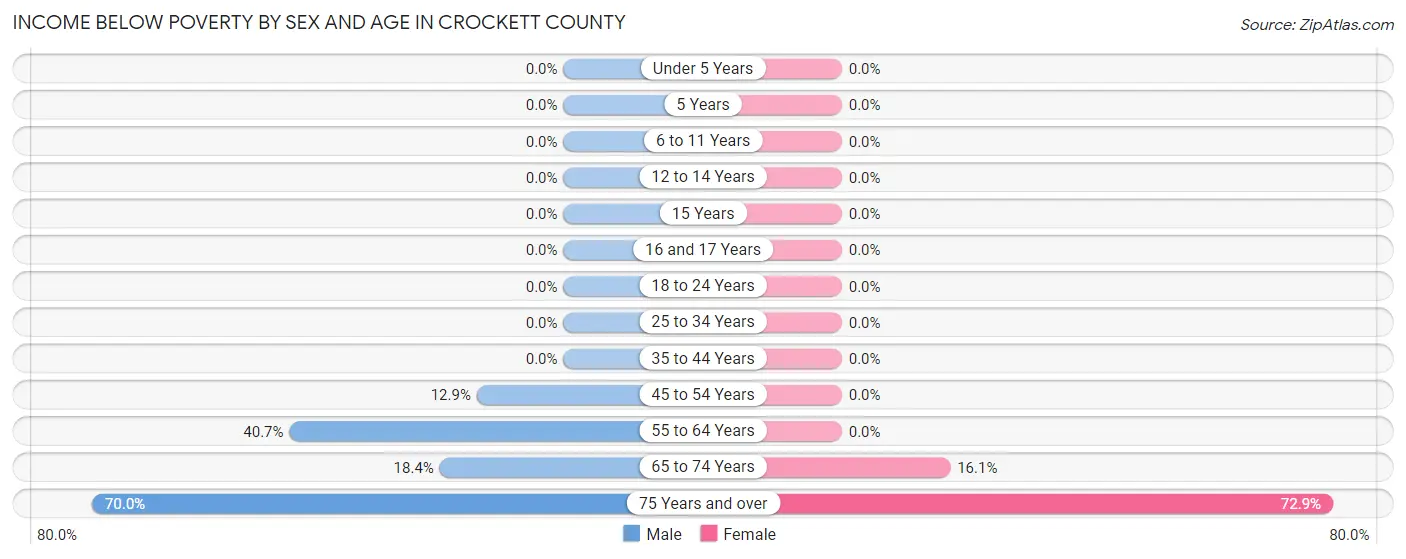
Income Below Poverty by Sex and Age in Crockett County
With 12.2% poverty level for males and 6.1% for females among the residents of Crockett County, 75 year old and over males and 75 year old and over females are the most vulnerable to poverty, with 21 males (70.0%) and 35 females (72.9%) in their respective age groups living below the poverty level.
| Age Bracket | Male | Female |
| Under 5 Years | 0 (0.0%) | 0 (0.0%) |
| 5 Years | 0 (0.0%) | 0 (0.0%) |
| 6 to 11 Years | 0 (0.0%) | 0 (0.0%) |
| 12 to 14 Years | 0 (0.0%) | 0 (0.0%) |
| 15 Years | 0 (0.0%) | 0 (0.0%) |
| 16 and 17 Years | 0 (0.0%) | 0 (0.0%) |
| 18 to 24 Years | 0 (0.0%) | 0 (0.0%) |
| 25 to 34 Years | 0 (0.0%) | 0 (0.0%) |
| 35 to 44 Years | 0 (0.0%) | 0 (0.0%) |
| 45 to 54 Years | 31 (12.9%) | 0 (0.0%) |
| 55 to 64 Years | 83 (40.7%) | 0 (0.0%) |
| 65 to 74 Years | 52 (18.4%) | 47 (16.1%) |
| 75 Years and over | 21 (70.0%) | 35 (72.9%) |
| Total | 187 (12.2%) | 82 (6.1%) |
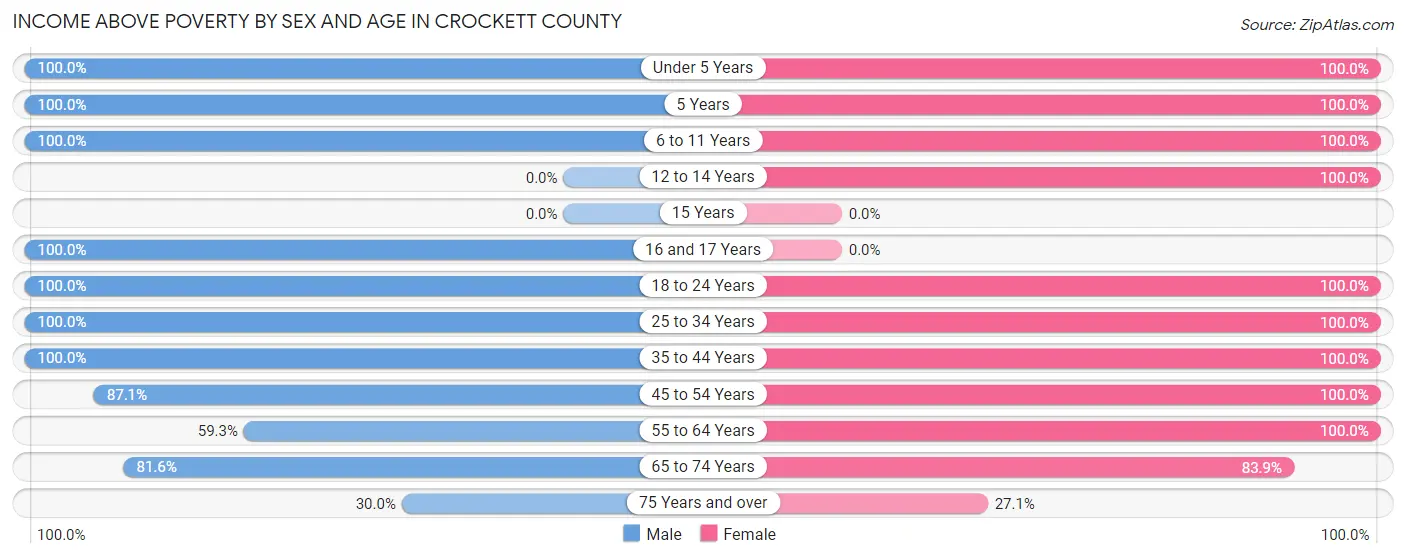
Income Above Poverty by Sex and Age in Crockett County
According to the poverty statistics in Crockett County, males aged under 5 years and females aged under 5 years are the age groups that are most secure financially, with 100.0% of males and 100.0% of females in these age groups living above the poverty line.
| Age Bracket | Male | Female |
| Under 5 Years | 86 (100.0%) | 13 (100.0%) |
| 5 Years | 17 (100.0%) | 24 (100.0%) |
| 6 to 11 Years | 108 (100.0%) | 52 (100.0%) |
| 12 to 14 Years | 0 (0.0%) | 159 (100.0%) |
| 15 Years | 0 (0.0%) | 0 (0.0%) |
| 16 and 17 Years | 72 (100.0%) | 0 (0.0%) |
| 18 to 24 Years | 37 (100.0%) | 33 (100.0%) |
| 25 to 34 Years | 386 (100.0%) | 203 (100.0%) |
| 35 to 44 Years | 71 (100.0%) | 89 (100.0%) |
| 45 to 54 Years | 210 (87.1%) | 153 (100.0%) |
| 55 to 64 Years | 121 (59.3%) | 287 (100.0%) |
| 65 to 74 Years | 231 (81.6%) | 245 (83.9%) |
| 75 Years and over | 9 (30.0%) | 13 (27.1%) |
| Total | 1,348 (87.8%) | 1,271 (93.9%) |
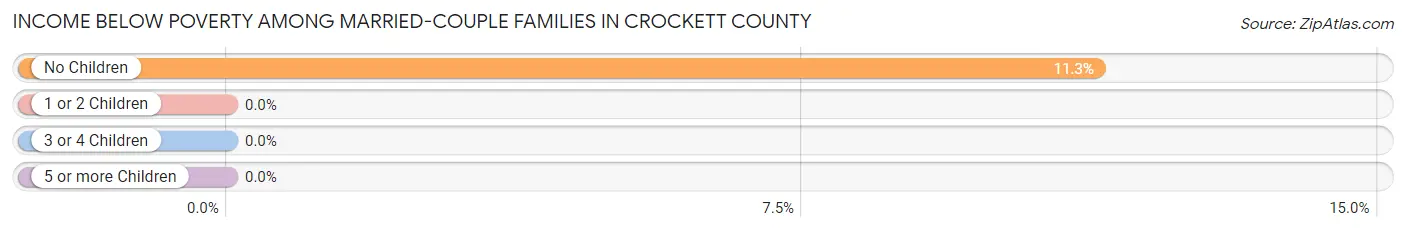
Income Below Poverty Among Married-Couple Families in Crockett County
The poverty statistics for married-couple families in Crockett County show that 8.3% or 68 of the total 816 families live below the poverty line. Families with no children have the highest poverty rate of 11.3%, comprising of 68 families. On the other hand, families with 1 or 2 children have the lowest poverty rate of 0.0%, which includes 0 families.
| Children | Above Poverty | Below Poverty |
| No Children | 532 (88.7%) | 68 (11.3%) |
| 1 or 2 Children | 186 (100.0%) | 0 (0.0%) |
| 3 or 4 Children | 0 (0.0%) | 0 (0.0%) |
| 5 or more Children | 30 (100.0%) | 0 (0.0%) |
| Total | 748 (91.7%) | 68 (8.3%) |
Income Below Poverty Among Single-Parent Households in Crockett County
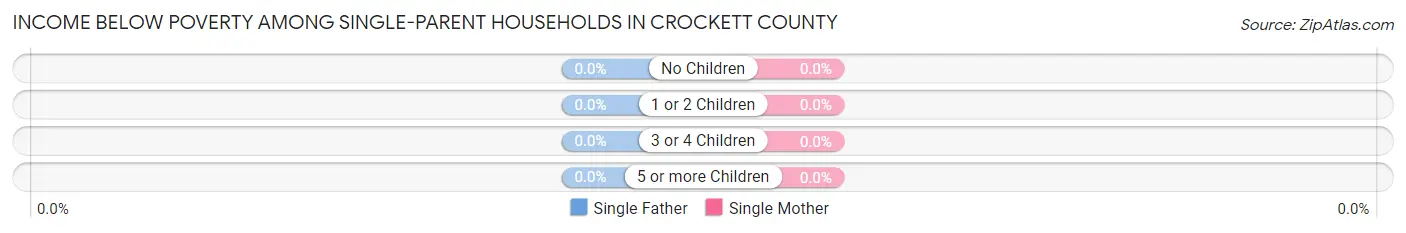
| Children | Single Father | Single Mother |
| No Children | 0 (0.0%) | 0 (0.0%) |
| 1 or 2 Children | 0 (0.0%) | 0 (0.0%) |
| 3 or 4 Children | 0 (0.0%) | 0 (0.0%) |
| 5 or more Children | 0 (0.0%) | 0 (0.0%) |
| Total | 0 (0.0%) | 0 (0.0%) |
Income Below Poverty Among Married-Couple vs Single-Parent Households in Crockett County
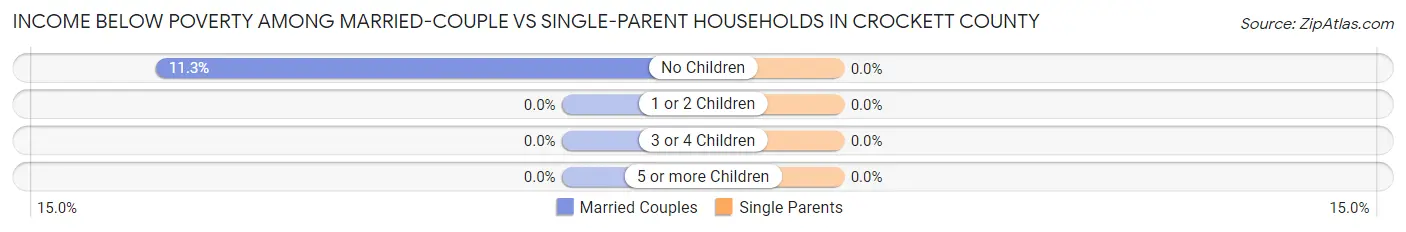
| Children | Married-Couple Families | Single-Parent Households |
| No Children | 68 (11.3%) | 0 (0.0%) |
| 1 or 2 Children | 0 (0.0%) | 0 (0.0%) |
| 3 or 4 Children | 0 (0.0%) | 0 (0.0%) |
| 5 or more Children | 0 (0.0%) | 0 (0.0%) |
| Total | 68 (8.3%) | 0 (0.0%) |
Race in Crockett County
The most populous races in Crockett County are Hispanic or Latino (1,728 | 58.6%), Some other Race (1,295 | 43.9%), and White / Caucasian (1,247 | 42.3%).
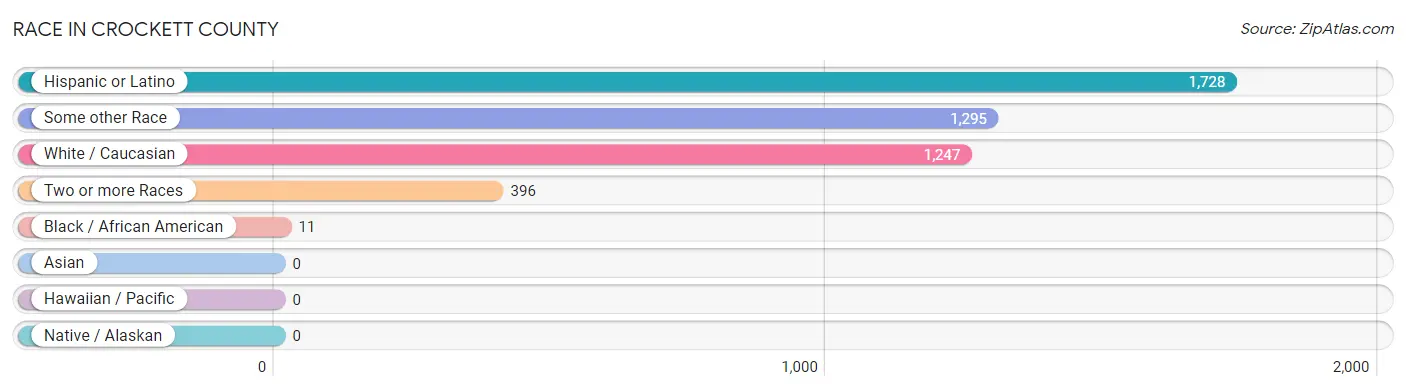
| Race | # Population | % Population |
| Asian | 0 | 0.0% |
| Black / African American | 11 | 0.4% |
| Hawaiian / Pacific | 0 | 0.0% |
| Hispanic or Latino | 1,728 | 58.6% |
| Native / Alaskan | 0 | 0.0% |
| White / Caucasian | 1,247 | 42.3% |
| Two or more Races | 396 | 13.4% |
| Some other Race | 1,295 | 43.9% |
| Total | 2,949 | 100.0% |
Ancestry in Crockett County
The most populous ancestries reported in Crockett County are Mexican (1,728 | 58.6%), German (119 | 4.0%), English (100 | 3.4%), Irish (75 | 2.5%), and American (45 | 1.5%), together accounting for 70.1% of all Crockett County residents.
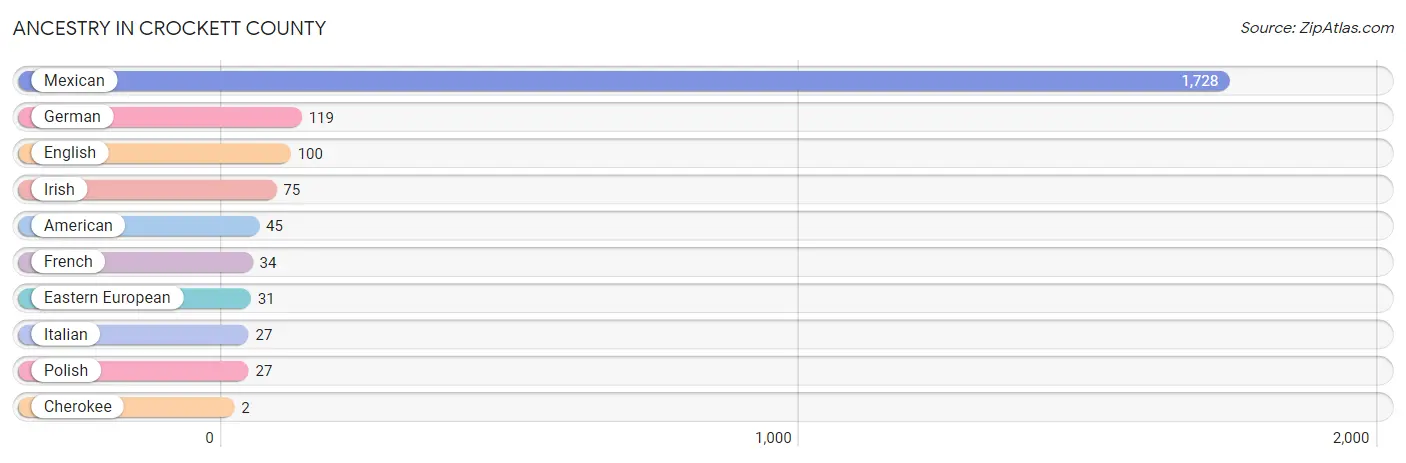
| Ancestry | # Population | % Population |
| American | 45 | 1.5% |
| Cherokee | 2 | 0.1% |
| Eastern European | 31 | 1.1% |
| English | 100 | 3.4% |
| French | 34 | 1.1% |
| German | 119 | 4.0% |
| Irish | 75 | 2.5% |
| Italian | 27 | 0.9% |
| Mexican | 1,728 | 58.6% |
| Polish | 27 | 0.9% | View All 10 Rows |
Immigrants in Crockett County
The most numerous immigrant groups reported in Crockett County came from Central America (333 | 11.3%), Latin America (333 | 11.3%), and Mexico (333 | 11.3%), together accounting for 33.9% of all Crockett County residents.
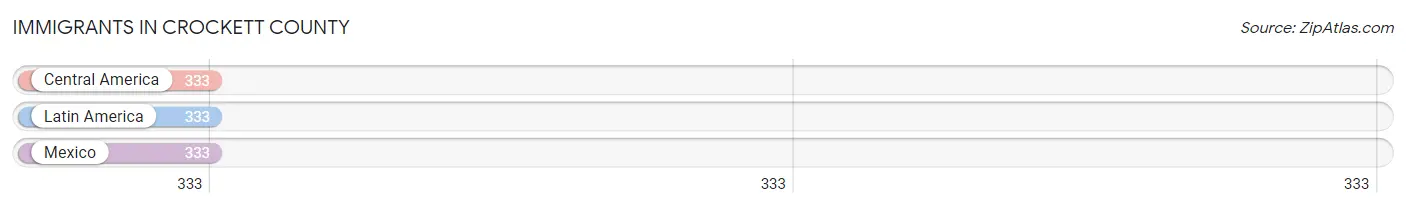
| Immigration Origin | # Population | % Population |
| Central America | 333 | 11.3% |
| Latin America | 333 | 11.3% |
| Mexico | 333 | 11.3% | View All 3 Rows |
Sex and Age in Crockett County
Sex and Age in Crockett County
The most populous age groups in Crockett County are 30 to 34 Years (286 | 18.2%) for men and 70 to 74 Years (234 | 17.0%) for women.
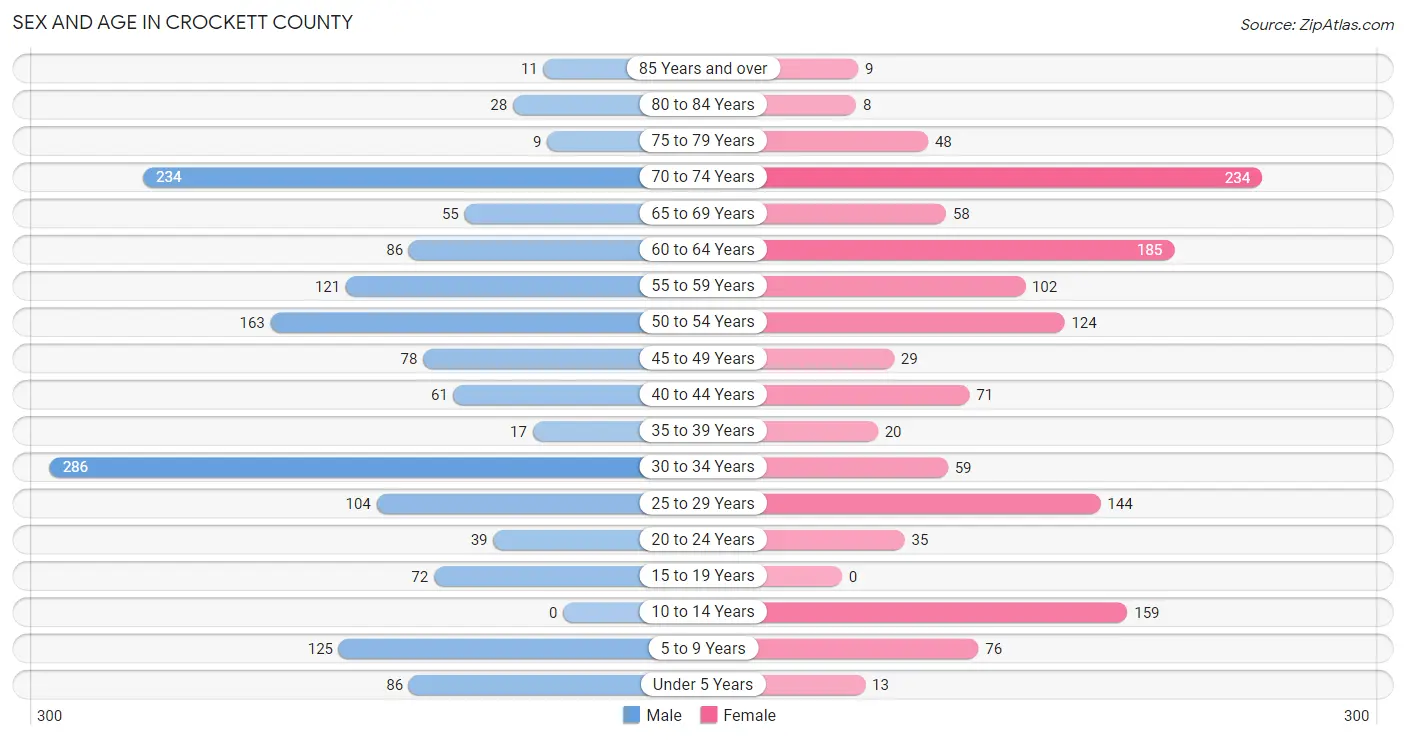
| Age Bracket | Male | Female |
| Under 5 Years | 86 (5.5%) | 13 (0.9%) |
| 5 to 9 Years | 125 (7.9%) | 76 (5.5%) |
| 10 to 14 Years | 0 (0.0%) | 159 (11.6%) |
| 15 to 19 Years | 72 (4.6%) | 0 (0.0%) |
| 20 to 24 Years | 39 (2.5%) | 35 (2.5%) |
| 25 to 29 Years | 104 (6.6%) | 144 (10.5%) |
| 30 to 34 Years | 286 (18.2%) | 59 (4.3%) |
| 35 to 39 Years | 17 (1.1%) | 20 (1.5%) |
| 40 to 44 Years | 61 (3.9%) | 71 (5.2%) |
| 45 to 49 Years | 78 (5.0%) | 29 (2.1%) |
| 50 to 54 Years | 163 (10.3%) | 124 (9.0%) |
| 55 to 59 Years | 121 (7.7%) | 102 (7.4%) |
| 60 to 64 Years | 86 (5.5%) | 185 (13.5%) |
| 65 to 69 Years | 55 (3.5%) | 58 (4.2%) |
| 70 to 74 Years | 234 (14.9%) | 234 (17.0%) |
| 75 to 79 Years | 9 (0.6%) | 48 (3.5%) |
| 80 to 84 Years | 28 (1.8%) | 8 (0.6%) |
| 85 Years and over | 11 (0.7%) | 9 (0.7%) |
| Total | 1,575 (100.0%) | 1,374 (100.0%) |
Families and Households in Crockett County
Median Family Size in Crockett County
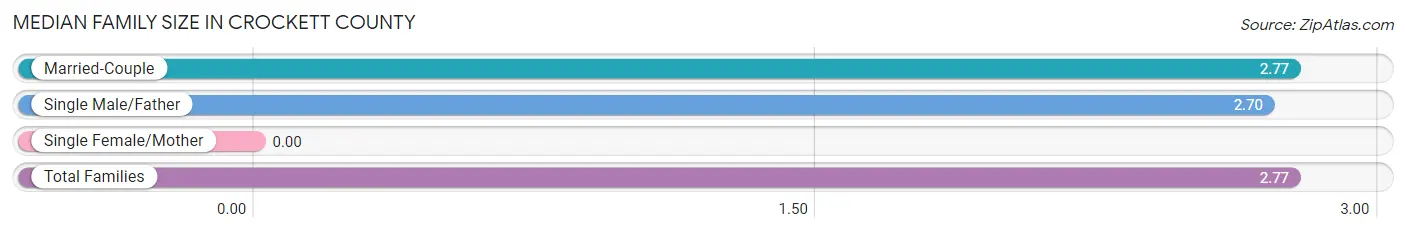
| Family Type | # Families | Family Size |
| Married-Couple | 816 (90.2%) | 2.77 |
| Single Male/Father | 89 (9.8%) | 2.70 |
| Single Female/Mother | 0 (0.0%) | - |
| Total Families | 905 (100.0%) | 2.77 |
Median Household Size in Crockett County
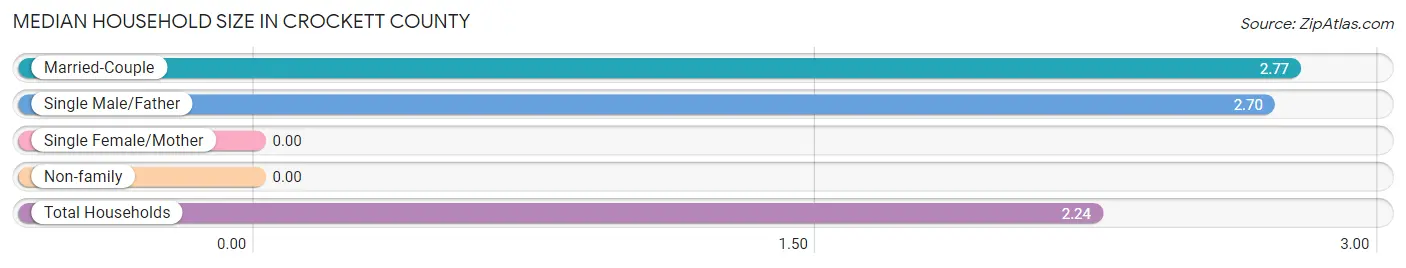
| Household Type | # Households | Household Size |
| Married-Couple | 816 (63.3%) | 2.77 |
| Single Male/Father | 89 (6.9%) | 2.70 |
| Single Female/Mother | 0 (0.0%) | - |
| Non-family | 384 (29.8%) | - |
| Total Households | 1,289 (100.0%) | 2.24 |
Household Size by Marriage Status in Crockett County
Out of a total of 1,289 households in Crockett County, 905 (70.2%) are family households, while 384 (29.8%) are nonfamily households. The most numerous type of family households are 2-person households, comprising 544, and the most common type of nonfamily households are 1-person households, comprising 384.
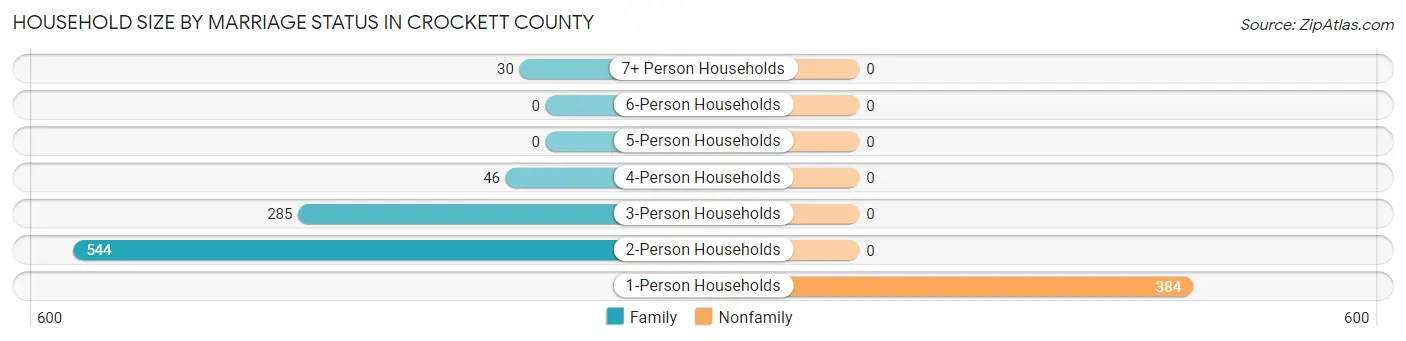
| Household Size | Family Households | Nonfamily Households |
| 1-Person Households | - | 384 (29.8%) |
| 2-Person Households | 544 (42.2%) | 0 (0.0%) |
| 3-Person Households | 285 (22.1%) | 0 (0.0%) |
| 4-Person Households | 46 (3.6%) | 0 (0.0%) |
| 5-Person Households | 0 (0.0%) | 0 (0.0%) |
| 6-Person Households | 0 (0.0%) | 0 (0.0%) |
| 7+ Person Households | 30 (2.3%) | 0 (0.0%) |
| Total | 905 (70.2%) | 384 (29.8%) |
Female Fertility in Crockett County
Fertility by Age in Crockett County
Average fertility rate in Crockett County is 168.0 births per 1,000 women. Women in the age bracket of 20 to 34 years have the highest fertility rate with 252.0 births per 1,000 women. Women in the age bracket of 20 to 34 years acount for 100.0% of all women with births.
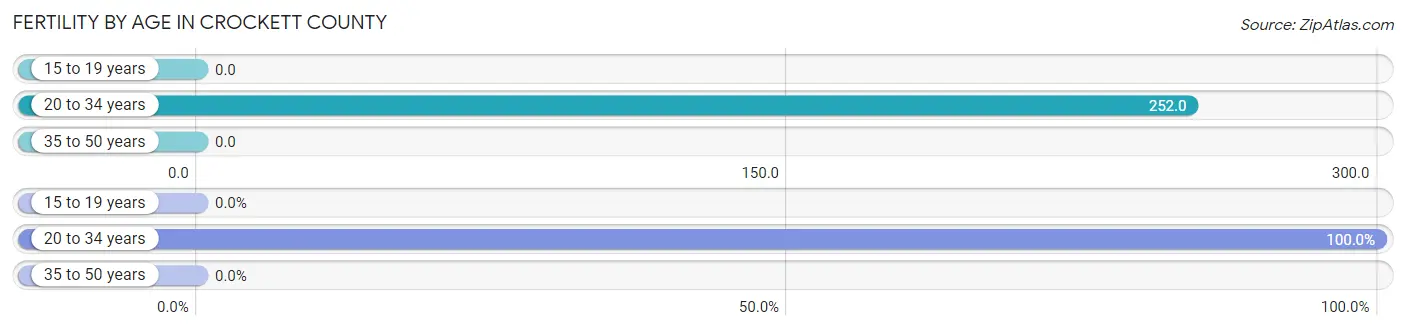
| Age Bracket | Women with Births | Births / 1,000 Women |
| 15 to 19 years | 0 (0.0%) | 0.0 |
| 20 to 34 years | 60 (100.0%) | 252.0 |
| 35 to 50 years | 0 (0.0%) | 0.0 |
| Total | 60 (100.0%) | 168.0 |
Fertility by Age by Marriage Status in Crockett County
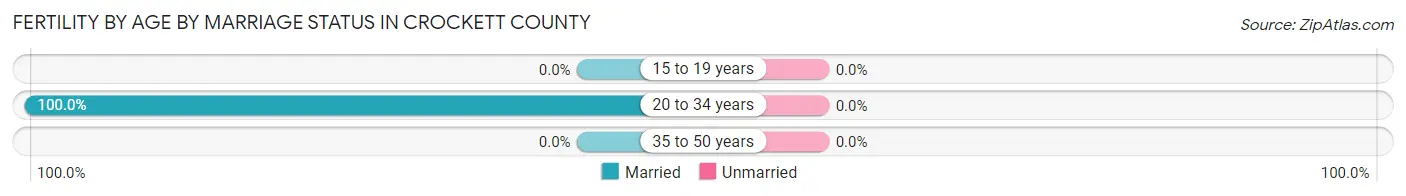
| Age Bracket | Married | Unmarried |
| 15 to 19 years | 0 (0.0%) | 0 (0.0%) |
| 20 to 34 years | 60 (100.0%) | 0 (0.0%) |
| 35 to 50 years | 0 (0.0%) | 0 (0.0%) |
| Total | 60 (100.0%) | 0 (0.0%) |
Fertility by Education in Crockett County
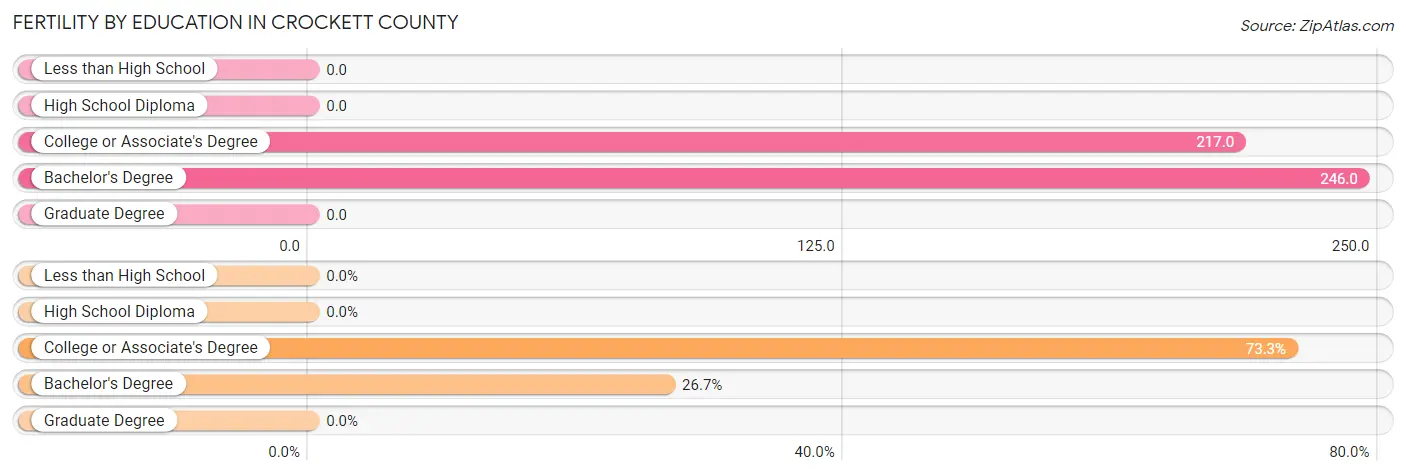
| Educational Attainment | Women with Births | Births / 1,000 Women |
| Less than High School | 0 (0.0%) | 0.0 |
| High School Diploma | 0 (0.0%) | 0.0 |
| College or Associate's Degree | 44 (73.3%) | 217.0 |
| Bachelor's Degree | 16 (26.7%) | 246.0 |
| Graduate Degree | 0 (0.0%) | 0.0 |
| Total | 60 (100.0%) | 168.0 |
Fertility by Education by Marriage Status in Crockett County
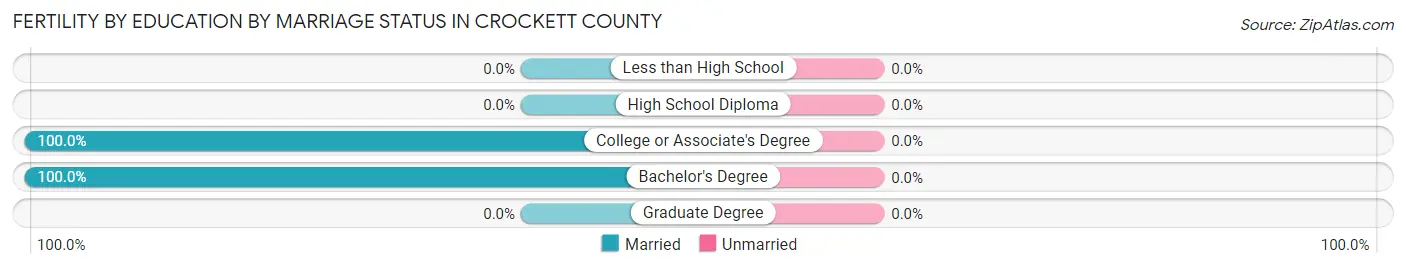
| Educational Attainment | Married | Unmarried |
| Less than High School | 0 (0.0%) | 0 (0.0%) |
| High School Diploma | 0 (0.0%) | 0 (0.0%) |
| College or Associate's Degree | 44 (100.0%) | 0 (0.0%) |
| Bachelor's Degree | 16 (100.0%) | 0 (0.0%) |
| Graduate Degree | 0 (0.0%) | 0 (0.0%) |
| Total | 60 (100.0%) | 0 (0.0%) |
Employment Characteristics in Crockett County
Employment by Class of Employer in Crockett County
Among the 1,558 employed individuals in Crockett County, private company employees (801 | 51.4%), state government employees (252 | 16.2%), and self-employed (incorporated) (249 | 16.0%) make up the most common classes of employment.
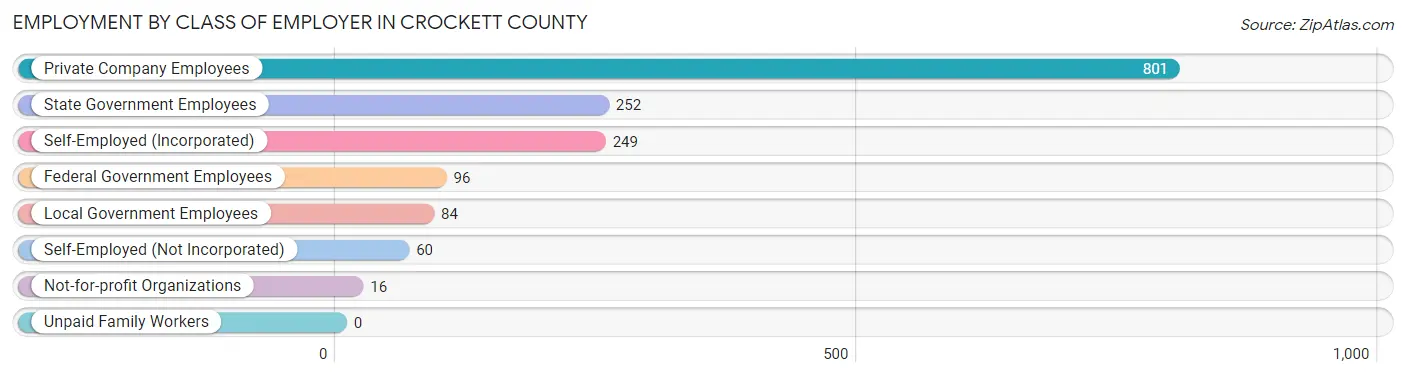
| Employer Class | # Employees | % Employees |
| Private Company Employees | 801 | 51.4% |
| Self-Employed (Incorporated) | 249 | 16.0% |
| Self-Employed (Not Incorporated) | 60 | 3.8% |
| Not-for-profit Organizations | 16 | 1.0% |
| Local Government Employees | 84 | 5.4% |
| State Government Employees | 252 | 16.2% |
| Federal Government Employees | 96 | 6.2% |
| Unpaid Family Workers | 0 | 0.0% |
| Total | 1,558 | 100.0% |
Employment Status by Age in Crockett County
According to the labor force statistics for Crockett County, out of the total population over 16 years of age (2,490), 63.8% or 1,589 individuals are in the labor force, with 2.0% or 32 of them unemployed. The age group with the highest labor force participation rate is 25 to 29 years, with 99.2% or 246 individuals in the labor force. Within the labor force, the 45 to 54 years age range has the highest percentage of unemployed individuals, with 9.5% or 31 of them being unemployed.
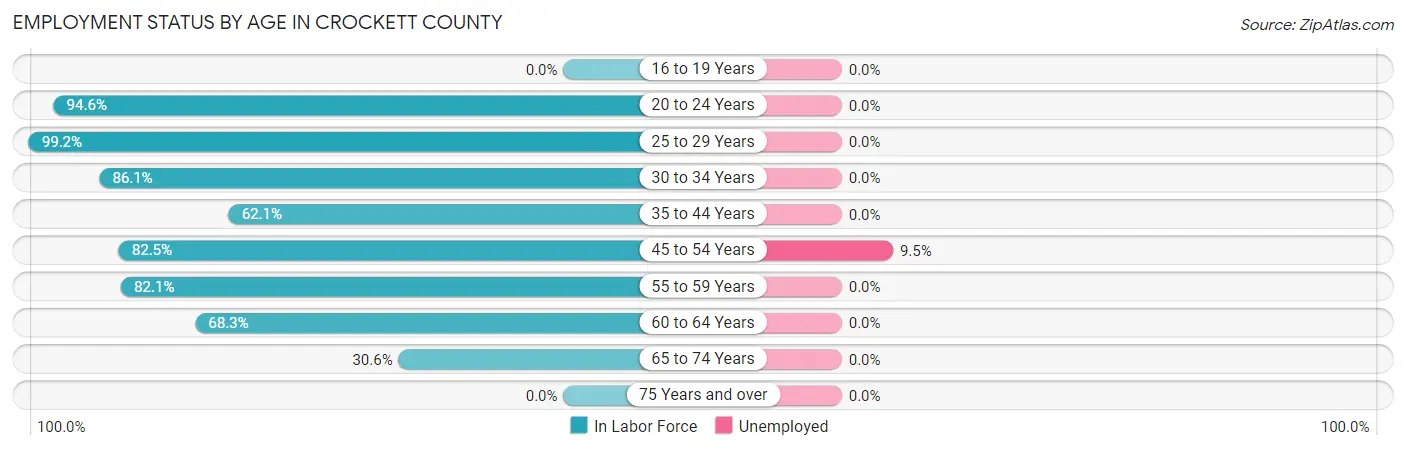
| Age Bracket | In Labor Force | Unemployed |
| 16 to 19 Years | 0 (0.0%) | 0 (0.0%) |
| 20 to 24 Years | 70 (94.6%) | 0 (0.0%) |
| 25 to 29 Years | 246 (99.2%) | 0 (0.0%) |
| 30 to 34 Years | 297 (86.1%) | 0 (0.0%) |
| 35 to 44 Years | 105 (62.1%) | 0 (0.0%) |
| 45 to 54 Years | 325 (82.5%) | 31 (9.5%) |
| 55 to 59 Years | 183 (82.1%) | 0 (0.0%) |
| 60 to 64 Years | 185 (68.3%) | 0 (0.0%) |
| 65 to 74 Years | 178 (30.6%) | 0 (0.0%) |
| 75 Years and over | 0 (0.0%) | 0 (0.0%) |
| Total | 1,589 (63.8%) | 32 (2.0%) |
Employment Status by Educational Attainment in Crockett County
According to labor force statistics for Crockett County, 81.3% of individuals (1,341) out of the total population between 25 and 64 years of age (1,650) are in the labor force, with 2.3% or 31 of them being unemployed. The group with the highest labor force participation rate are those with the educational attainment of college / associate degree, with 98.8% or 414 individuals in the labor force. Within the labor force, individuals with college / associate degree education have the highest percentage of unemployment, with 7.5% or 31 of them being unemployed.
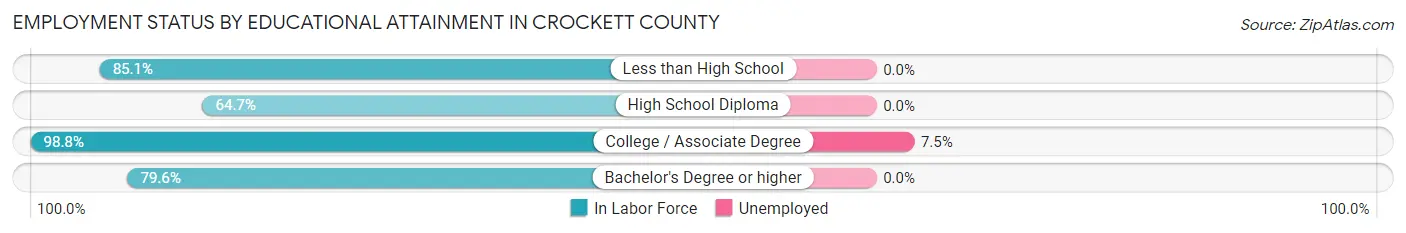
| Educational Attainment | In Labor Force | Unemployed |
| Less than High School | 405 (85.1%) | 0 (0.0%) |
| High School Diploma | 342 (64.7%) | 0 (0.0%) |
| College / Associate Degree | 414 (98.8%) | 31 (7.5%) |
| Bachelor's Degree or higher | 180 (79.6%) | 0 (0.0%) |
| Total | 1,341 (81.3%) | 38 (2.3%) |
Employment Occupations by Sex in Crockett County
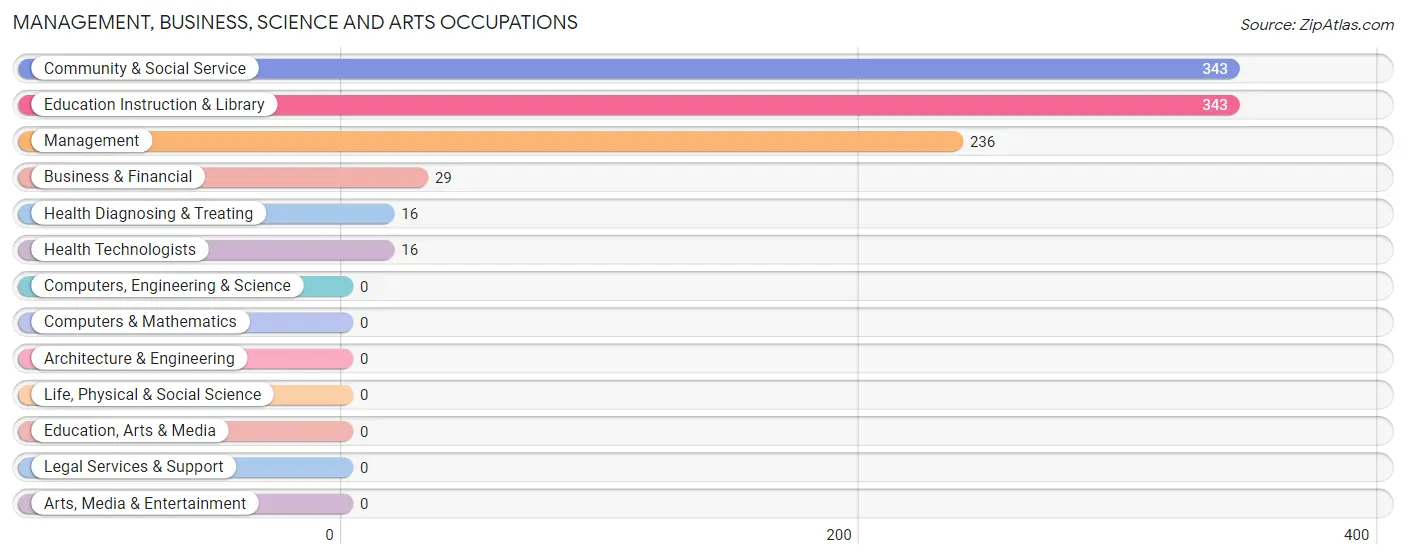
Management, Business, Science and Arts Occupations
The most common Management, Business, Science and Arts occupations in Crockett County are Community & Social Service (343 | 22.0%), Education Instruction & Library (343 | 22.0%), Management (236 | 15.1%), Business & Financial (29 | 1.9%), and Health Diagnosing & Treating (16 | 1.0%).
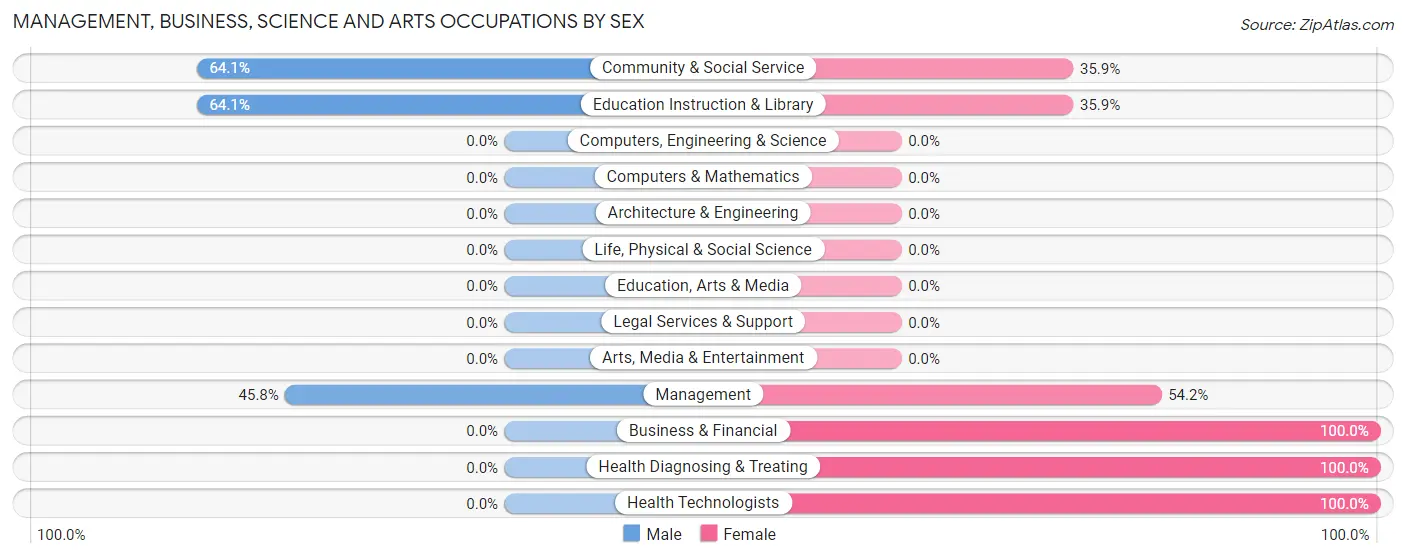
Management, Business, Science and Arts Occupations by Sex
Within the Management, Business, Science and Arts occupations in Crockett County, the most male-oriented occupations are Community & Social Service (64.1%), Education Instruction & Library (64.1%), and Management (45.8%), while the most female-oriented occupations are Business & Financial (100.0%), Health Diagnosing & Treating (100.0%), and Health Technologists (100.0%).
| Occupation | Male | Female |
| Management | 108 (45.8%) | 128 (54.2%) |
| Business & Financial | 0 (0.0%) | 29 (100.0%) |
| Computers, Engineering & Science | 0 (0.0%) | 0 (0.0%) |
| Computers & Mathematics | 0 (0.0%) | 0 (0.0%) |
| Architecture & Engineering | 0 (0.0%) | 0 (0.0%) |
| Life, Physical & Social Science | 0 (0.0%) | 0 (0.0%) |
| Community & Social Service | 220 (64.1%) | 123 (35.9%) |
| Education, Arts & Media | 0 (0.0%) | 0 (0.0%) |
| Legal Services & Support | 0 (0.0%) | 0 (0.0%) |
| Education Instruction & Library | 220 (64.1%) | 123 (35.9%) |
| Arts, Media & Entertainment | 0 (0.0%) | 0 (0.0%) |
| Health Diagnosing & Treating | 0 (0.0%) | 16 (100.0%) |
| Health Technologists | 0 (0.0%) | 16 (100.0%) |
| Total (Category) | 328 (52.6%) | 296 (47.4%) |
| Total (Overall) | 810 (52.0%) | 748 (48.0%) |
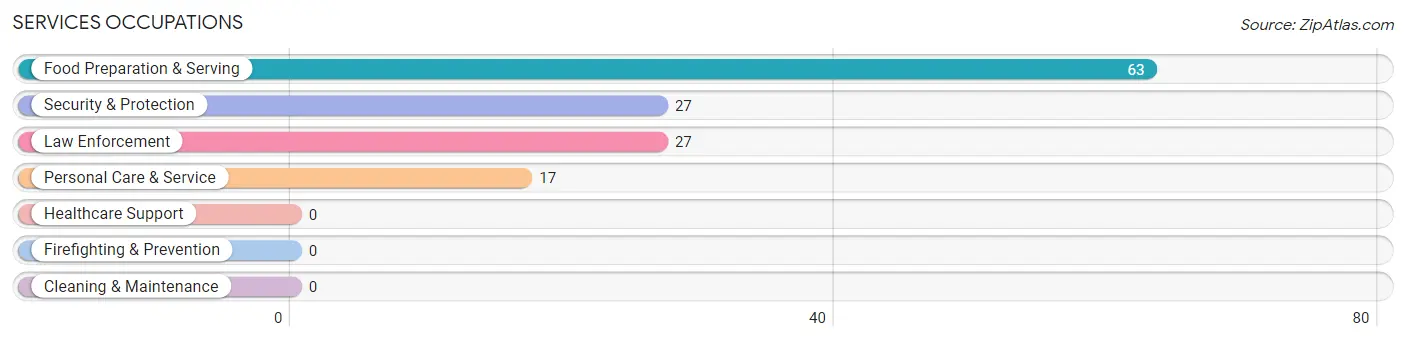
Services Occupations
The most common Services occupations in Crockett County are Food Preparation & Serving (63 | 4.0%), Security & Protection (27 | 1.7%), Law Enforcement (27 | 1.7%), and Personal Care & Service (17 | 1.1%).
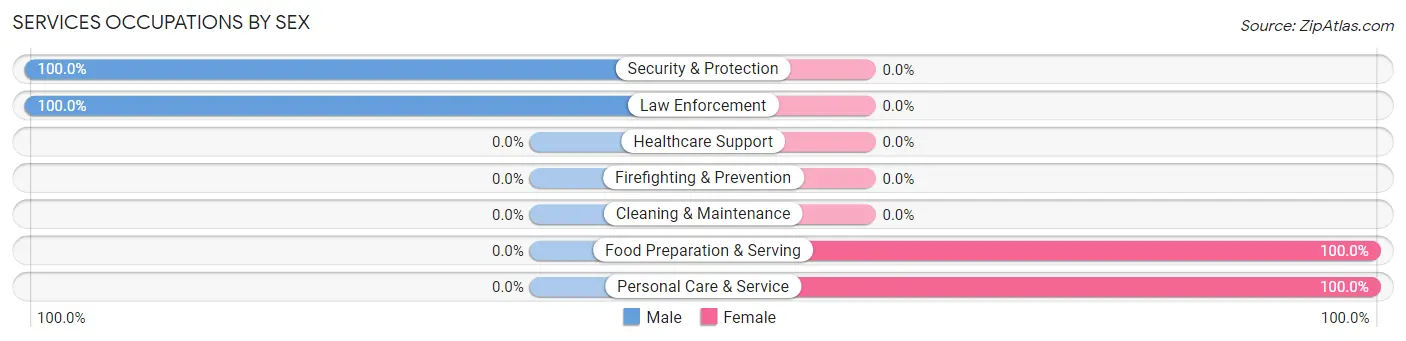
Services Occupations by Sex
Within the Services occupations in Crockett County, the most male-oriented occupations are Security & Protection (100.0%), and Law Enforcement (100.0%), while the most female-oriented occupations are Food Preparation & Serving (100.0%), and Personal Care & Service (100.0%).
| Occupation | Male | Female |
| Healthcare Support | 0 (0.0%) | 0 (0.0%) |
| Security & Protection | 27 (100.0%) | 0 (0.0%) |
| Firefighting & Prevention | 0 (0.0%) | 0 (0.0%) |
| Law Enforcement | 27 (100.0%) | 0 (0.0%) |
| Food Preparation & Serving | 0 (0.0%) | 63 (100.0%) |
| Cleaning & Maintenance | 0 (0.0%) | 0 (0.0%) |
| Personal Care & Service | 0 (0.0%) | 17 (100.0%) |
| Total (Category) | 27 (25.2%) | 80 (74.8%) |
| Total (Overall) | 810 (52.0%) | 748 (48.0%) |
Sales and Office Occupations
The most common Sales and Office occupations in Crockett County are Office & Administration (200 | 12.8%), and Sales & Related (62 | 4.0%).
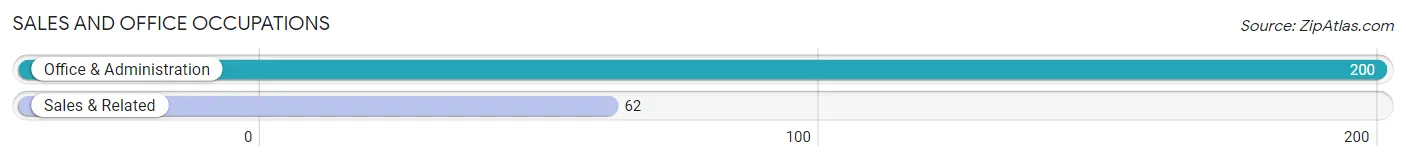
Sales and Office Occupations by Sex
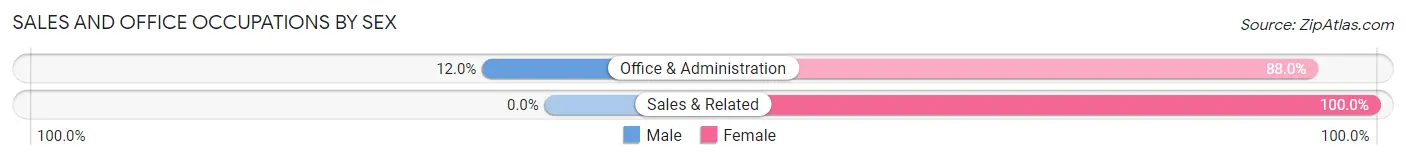
| Occupation | Male | Female |
| Sales & Related | 0 (0.0%) | 62 (100.0%) |
| Office & Administration | 24 (12.0%) | 176 (88.0%) |
| Total (Category) | 24 (9.2%) | 238 (90.8%) |
| Total (Overall) | 810 (52.0%) | 748 (48.0%) |
Natural Resources, Construction and Maintenance Occupations
The most common Natural Resources, Construction and Maintenance occupations in Crockett County are Construction & Extraction (207 | 13.3%), Installation, Maintenance & Repair (128 | 8.2%), and Farming, Fishing & Forestry (44 | 2.8%).
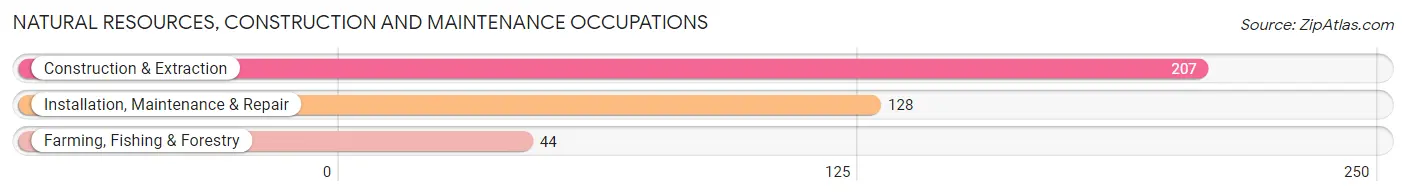
Natural Resources, Construction and Maintenance Occupations by Sex
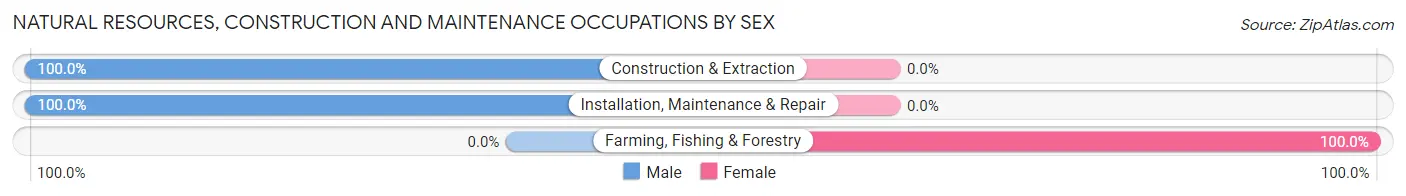
| Occupation | Male | Female |
| Farming, Fishing & Forestry | 0 (0.0%) | 44 (100.0%) |
| Construction & Extraction | 207 (100.0%) | 0 (0.0%) |
| Installation, Maintenance & Repair | 128 (100.0%) | 0 (0.0%) |
| Total (Category) | 335 (88.4%) | 44 (11.6%) |
| Total (Overall) | 810 (52.0%) | 748 (48.0%) |
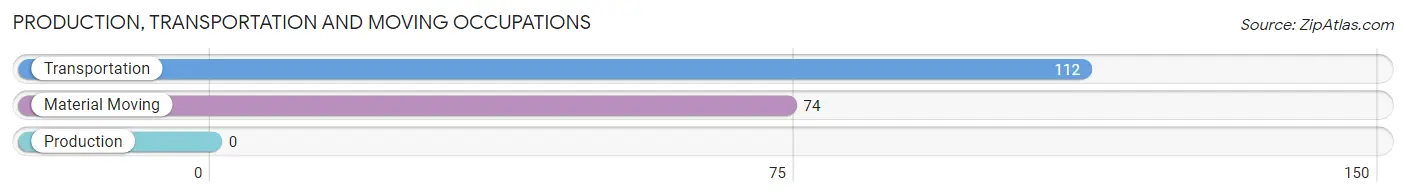
Production, Transportation and Moving Occupations
The most common Production, Transportation and Moving occupations in Crockett County are Transportation (112 | 7.2%), and Material Moving (74 | 4.8%).
Production, Transportation and Moving Occupations by Sex
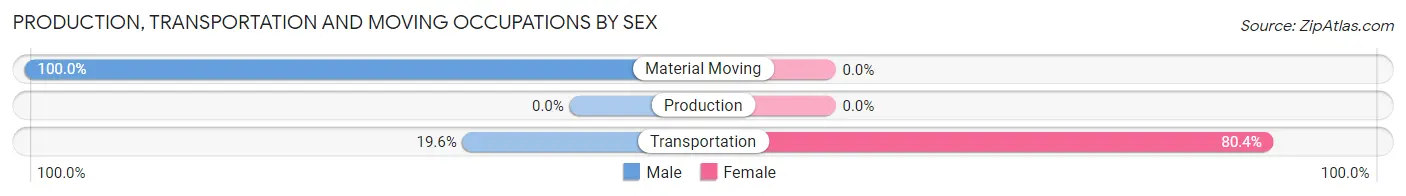
| Occupation | Male | Female |
| Production | 0 (0.0%) | 0 (0.0%) |
| Transportation | 22 (19.6%) | 90 (80.4%) |
| Material Moving | 74 (100.0%) | 0 (0.0%) |
| Total (Category) | 96 (51.6%) | 90 (48.4%) |
| Total (Overall) | 810 (52.0%) | 748 (48.0%) |
Employment Industries by Sex in Crockett County
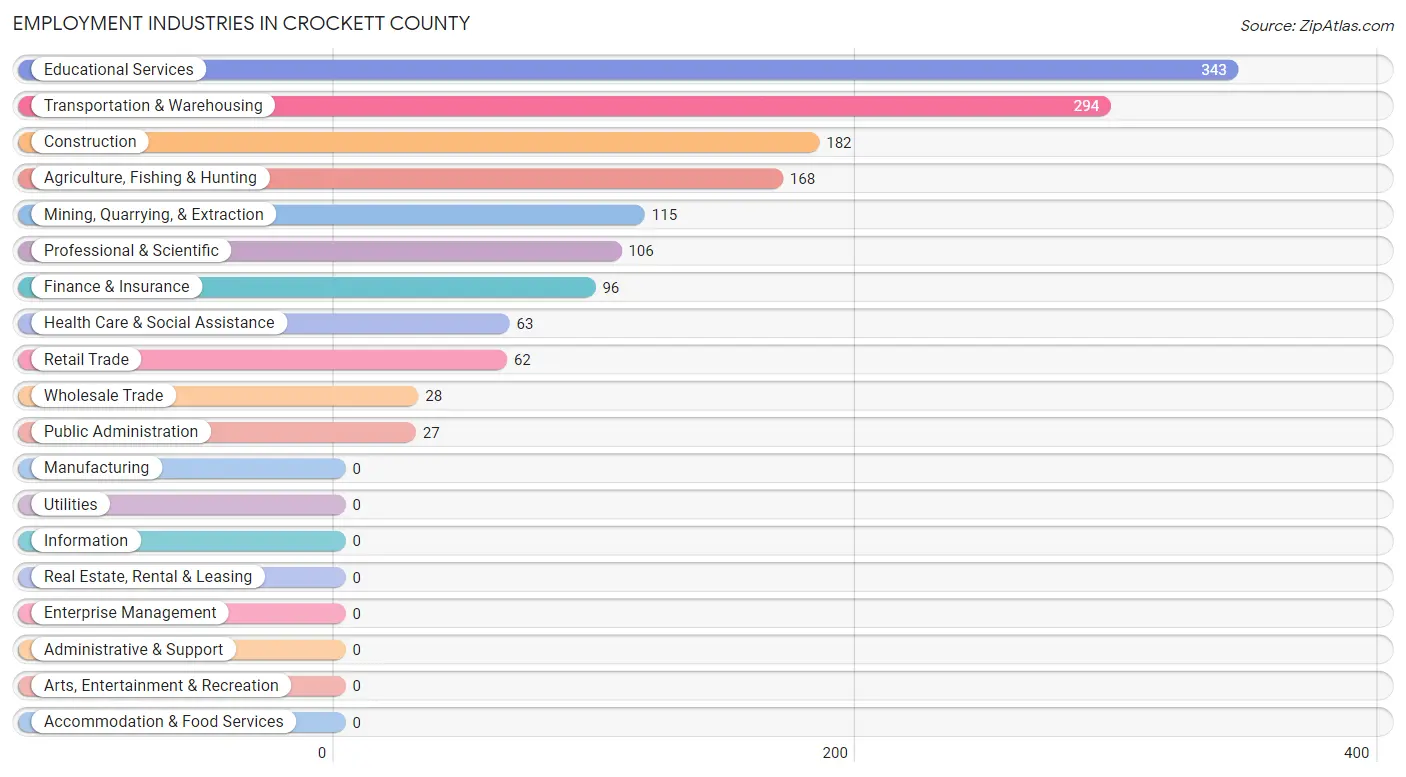
Employment Industries in Crockett County
The major employment industries in Crockett County include Educational Services (343 | 22.0%), Transportation & Warehousing (294 | 18.9%), Construction (182 | 11.7%), Agriculture, Fishing & Hunting (168 | 10.8%), and Mining, Quarrying, & Extraction (115 | 7.4%).
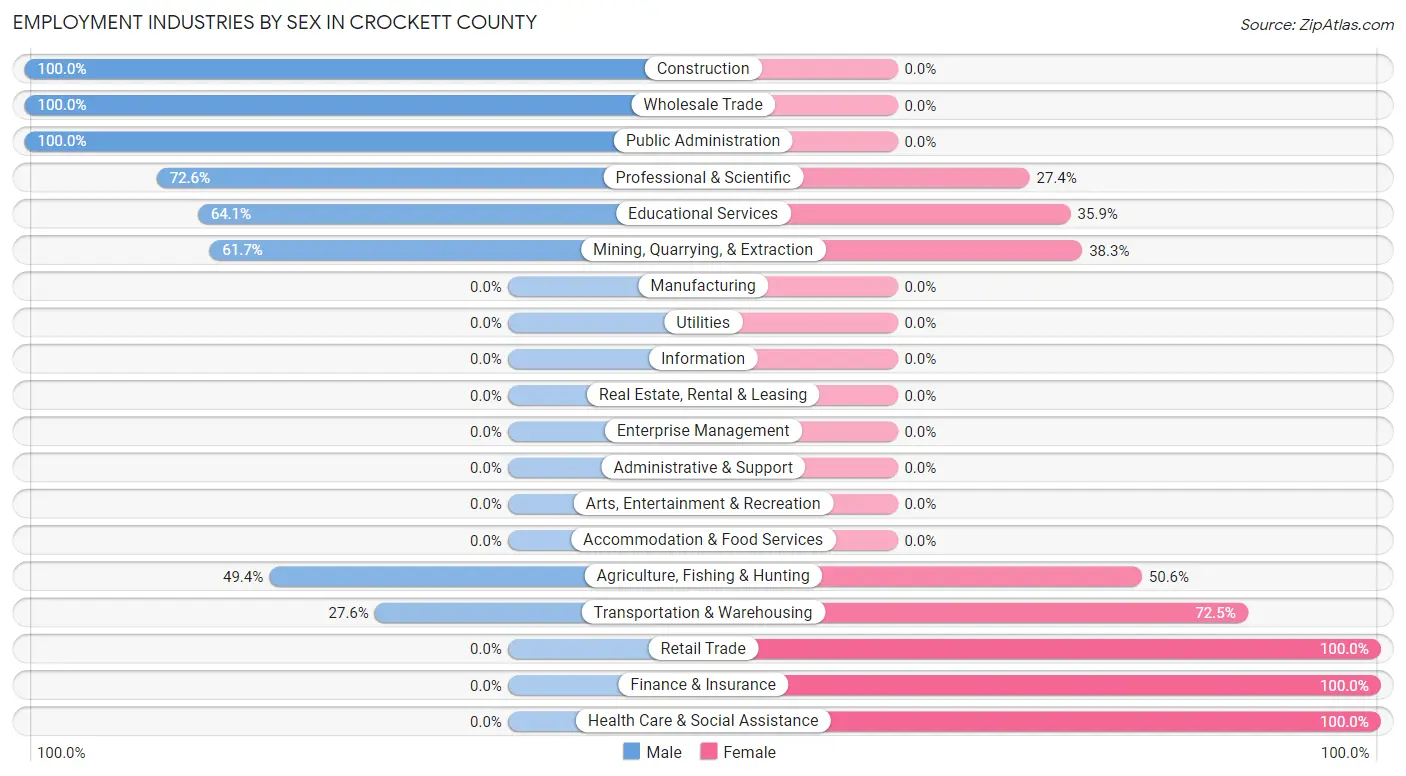
Employment Industries by Sex in Crockett County
The Crockett County industries that see more men than women are Construction (100.0%), Wholesale Trade (100.0%), and Public Administration (100.0%), whereas the industries that tend to have a higher number of women are Retail Trade (100.0%), Finance & Insurance (100.0%), and Health Care & Social Assistance (100.0%).
| Industry | Male | Female |
| Agriculture, Fishing & Hunting | 83 (49.4%) | 85 (50.6%) |
| Mining, Quarrying, & Extraction | 71 (61.7%) | 44 (38.3%) |
| Construction | 182 (100.0%) | 0 (0.0%) |
| Manufacturing | 0 (0.0%) | 0 (0.0%) |
| Wholesale Trade | 28 (100.0%) | 0 (0.0%) |
| Retail Trade | 0 (0.0%) | 62 (100.0%) |
| Transportation & Warehousing | 81 (27.6%) | 213 (72.5%) |
| Utilities | 0 (0.0%) | 0 (0.0%) |
| Information | 0 (0.0%) | 0 (0.0%) |
| Finance & Insurance | 0 (0.0%) | 96 (100.0%) |
| Real Estate, Rental & Leasing | 0 (0.0%) | 0 (0.0%) |
| Professional & Scientific | 77 (72.6%) | 29 (27.4%) |
| Enterprise Management | 0 (0.0%) | 0 (0.0%) |
| Administrative & Support | 0 (0.0%) | 0 (0.0%) |
| Educational Services | 220 (64.1%) | 123 (35.9%) |
| Health Care & Social Assistance | 0 (0.0%) | 63 (100.0%) |
| Arts, Entertainment & Recreation | 0 (0.0%) | 0 (0.0%) |
| Accommodation & Food Services | 0 (0.0%) | 0 (0.0%) |
| Public Administration | 27 (100.0%) | 0 (0.0%) |
| Total | 810 (52.0%) | 748 (48.0%) |
Education in Crockett County
School Enrollment in Crockett County
The most common levels of schooling among the 432 students in Crockett County are middle school (159 | 36.8%), elementary school (133 | 30.8%), and high school (72 | 16.7%).
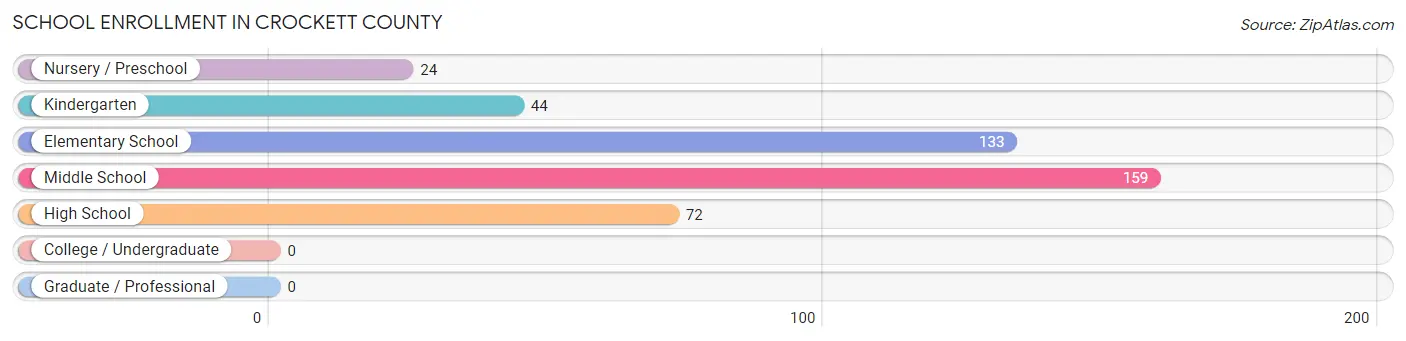
| School Level | # Students | % Students |
| Nursery / Preschool | 24 | 5.6% |
| Kindergarten | 44 | 10.2% |
| Elementary School | 133 | 30.8% |
| Middle School | 159 | 36.8% |
| High School | 72 | 16.7% |
| College / Undergraduate | 0 | 0.0% |
| Graduate / Professional | 0 | 0.0% |
| Total | 432 | 100.0% |
School Enrollment by Age by Funding Source in Crockett County
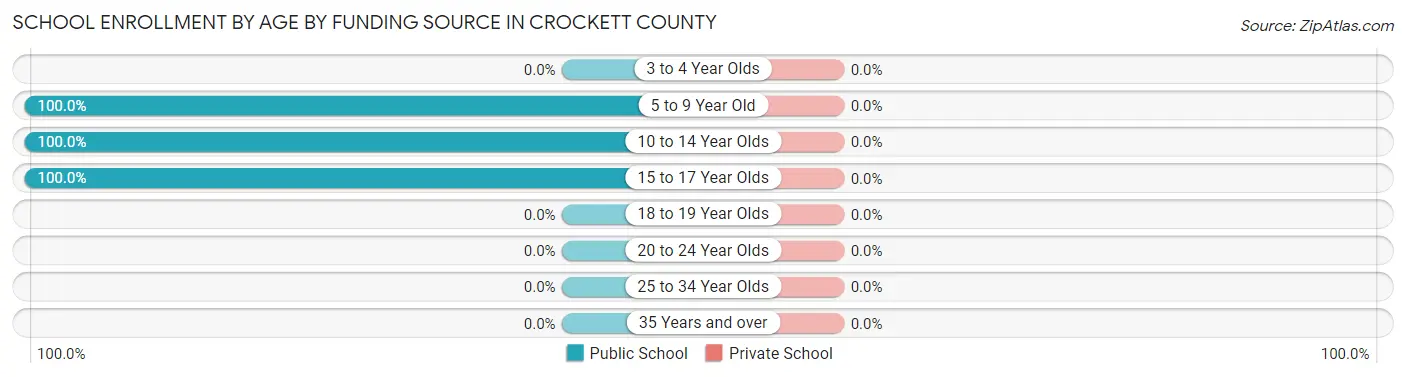
| Age Bracket | Public School | Private School |
| 3 to 4 Year Olds | 0 (0.0%) | 0 (0.0%) |
| 5 to 9 Year Old | 201 (100.0%) | 0 (0.0%) |
| 10 to 14 Year Olds | 159 (100.0%) | 0 (0.0%) |
| 15 to 17 Year Olds | 72 (100.0%) | 0 (0.0%) |
| 18 to 19 Year Olds | 0 (0.0%) | 0 (0.0%) |
| 20 to 24 Year Olds | 0 (0.0%) | 0 (0.0%) |
| 25 to 34 Year Olds | 0 (0.0%) | 0 (0.0%) |
| 35 Years and over | 0 (0.0%) | 0 (0.0%) |
| Total | 432 (100.0%) | 0 (0.0%) |
Educational Attainment by Field of Study in Crockett County
Education (185 | 48.8%), bio, nature & agricultural (46 | 12.1%), physical & health sciences (43 | 11.4%), literature & languages (32 | 8.4%), and business (29 | 7.6%) are the most common fields of study among 379 individuals in Crockett County who have obtained a bachelor's degree or higher.
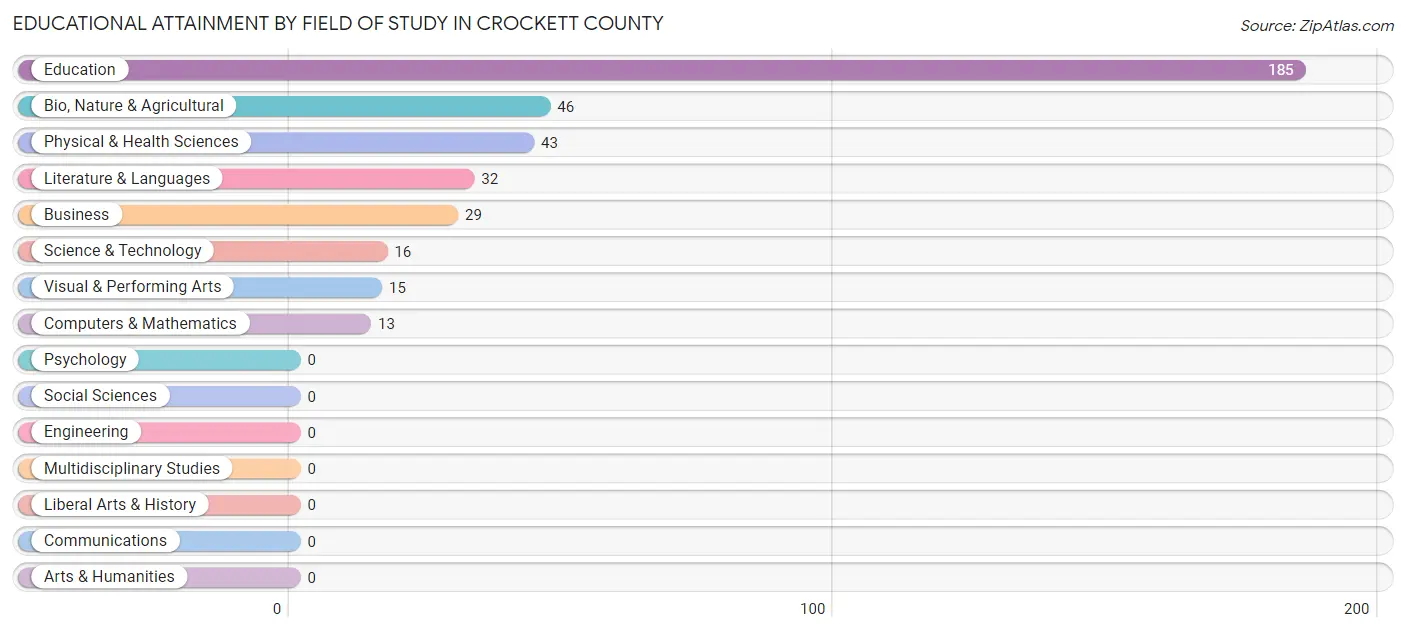
| Field of Study | # Graduates | % Graduates |
| Computers & Mathematics | 13 | 3.4% |
| Bio, Nature & Agricultural | 46 | 12.1% |
| Physical & Health Sciences | 43 | 11.4% |
| Psychology | 0 | 0.0% |
| Social Sciences | 0 | 0.0% |
| Engineering | 0 | 0.0% |
| Multidisciplinary Studies | 0 | 0.0% |
| Science & Technology | 16 | 4.2% |
| Business | 29 | 7.6% |
| Education | 185 | 48.8% |
| Literature & Languages | 32 | 8.4% |
| Liberal Arts & History | 0 | 0.0% |
| Visual & Performing Arts | 15 | 4.0% |
| Communications | 0 | 0.0% |
| Arts & Humanities | 0 | 0.0% |
| Total | 379 | 100.0% |
Transportation & Commute in Crockett County
Vehicle Availability by Sex in Crockett County
The most prevalent vehicle ownership categories in Crockett County are males with 2 vehicles (374, accounting for 46.2%) and females with 2 vehicles (254, making up 50.0%).
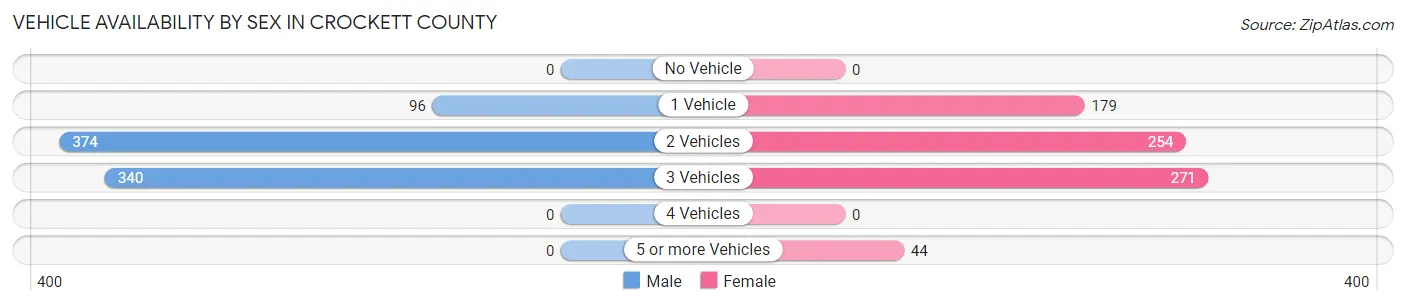
| Vehicles Available | Male | Female |
| No Vehicle | 0 (0.0%) | 0 (0.0%) |
| 1 Vehicle | 96 (11.8%) | 179 (23.9%) |
| 2 Vehicles | 374 (46.2%) | 254 (34.0%) |
| 3 Vehicles | 340 (42.0%) | 271 (36.2%) |
| 4 Vehicles | 0 (0.0%) | 0 (0.0%) |
| 5 or more Vehicles | 0 (0.0%) | 44 (5.9%) |
| Total | 810 (100.0%) | 748 (100.0%) |
Commute Time in Crockett County
The most frequently occuring commute durations in Crockett County are 5 to 9 minutes (475 commuters, 32.3%), less than 5 minutes (339 commuters, 23.1%), and 90 or more minutes (319 commuters, 21.7%).
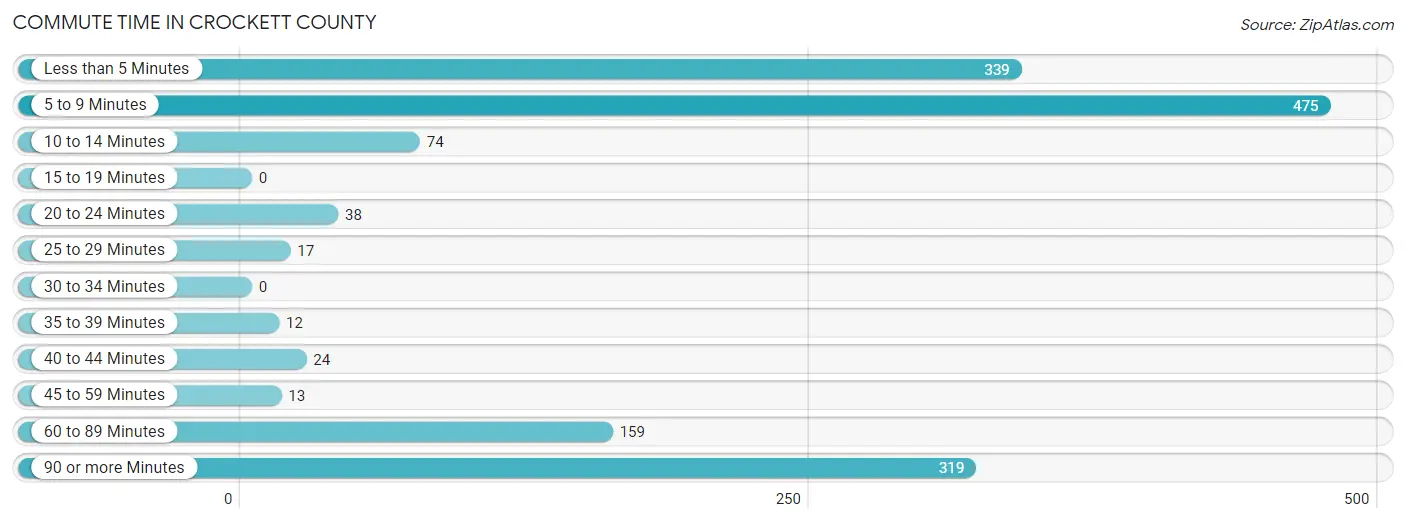
| Commute Time | # Commuters | % Commuters |
| Less than 5 Minutes | 339 | 23.1% |
| 5 to 9 Minutes | 475 | 32.3% |
| 10 to 14 Minutes | 74 | 5.0% |
| 15 to 19 Minutes | 0 | 0.0% |
| 20 to 24 Minutes | 38 | 2.6% |
| 25 to 29 Minutes | 17 | 1.2% |
| 30 to 34 Minutes | 0 | 0.0% |
| 35 to 39 Minutes | 12 | 0.8% |
| 40 to 44 Minutes | 24 | 1.6% |
| 45 to 59 Minutes | 13 | 0.9% |
| 60 to 89 Minutes | 159 | 10.8% |
| 90 or more Minutes | 319 | 21.7% |
Commute Time by Sex in Crockett County
The most common commute times in Crockett County are 90 or more minutes (319 commuters, 39.4%) for males and 5 to 9 minutes (426 commuters, 64.5%) for females.
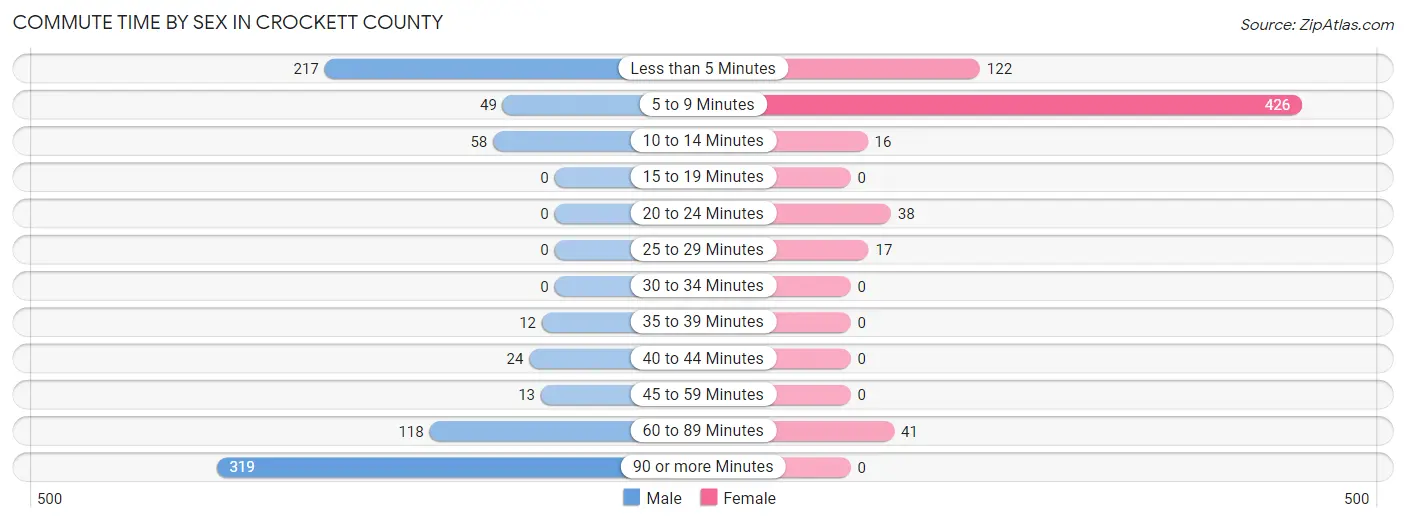
| Commute Time | Male | Female |
| Less than 5 Minutes | 217 (26.8%) | 122 (18.5%) |
| 5 to 9 Minutes | 49 (6.0%) | 426 (64.5%) |
| 10 to 14 Minutes | 58 (7.2%) | 16 (2.4%) |
| 15 to 19 Minutes | 0 (0.0%) | 0 (0.0%) |
| 20 to 24 Minutes | 0 (0.0%) | 38 (5.8%) |
| 25 to 29 Minutes | 0 (0.0%) | 17 (2.6%) |
| 30 to 34 Minutes | 0 (0.0%) | 0 (0.0%) |
| 35 to 39 Minutes | 12 (1.5%) | 0 (0.0%) |
| 40 to 44 Minutes | 24 (3.0%) | 0 (0.0%) |
| 45 to 59 Minutes | 13 (1.6%) | 0 (0.0%) |
| 60 to 89 Minutes | 118 (14.6%) | 41 (6.2%) |
| 90 or more Minutes | 319 (39.4%) | 0 (0.0%) |
Time of Departure to Work by Sex in Crockett County
The most frequent times of departure to work in Crockett County are 7:00 AM to 7:29 AM (238, 29.4%) for males and 7:00 AM to 7:29 AM (304, 46.1%) for females.
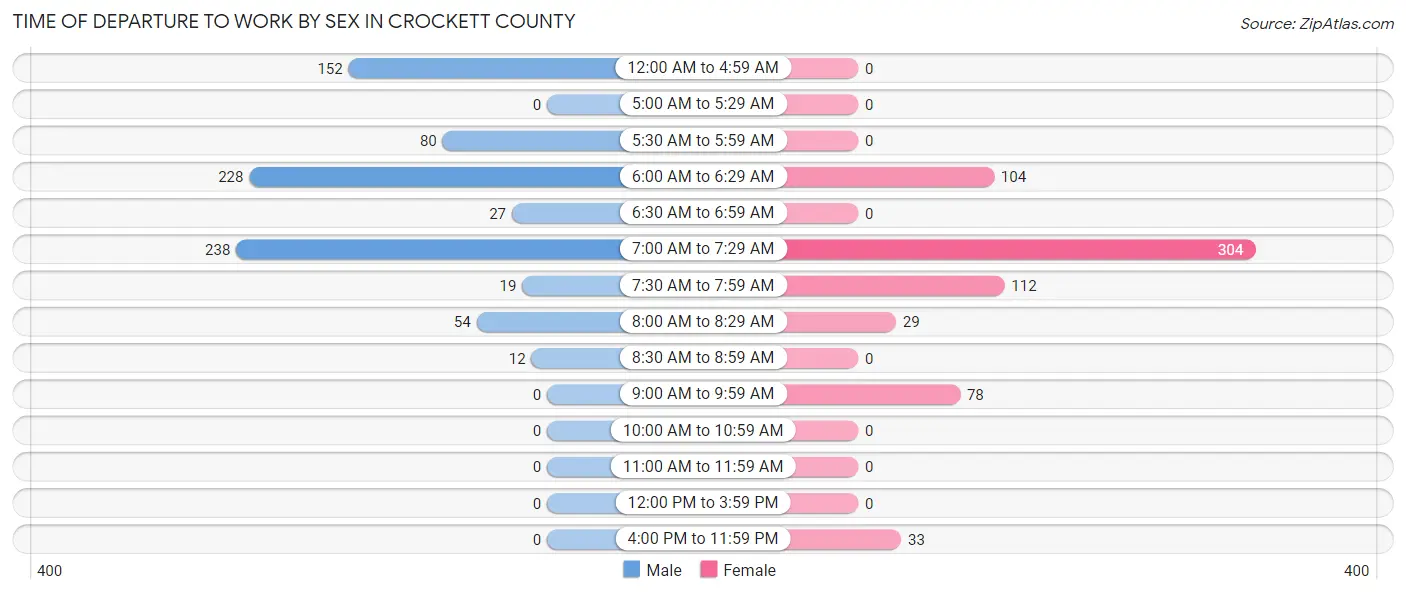
| Time of Departure | Male | Female |
| 12:00 AM to 4:59 AM | 152 (18.8%) | 0 (0.0%) |
| 5:00 AM to 5:29 AM | 0 (0.0%) | 0 (0.0%) |
| 5:30 AM to 5:59 AM | 80 (9.9%) | 0 (0.0%) |
| 6:00 AM to 6:29 AM | 228 (28.1%) | 104 (15.8%) |
| 6:30 AM to 6:59 AM | 27 (3.3%) | 0 (0.0%) |
| 7:00 AM to 7:29 AM | 238 (29.4%) | 304 (46.1%) |
| 7:30 AM to 7:59 AM | 19 (2.4%) | 112 (17.0%) |
| 8:00 AM to 8:29 AM | 54 (6.7%) | 29 (4.4%) |
| 8:30 AM to 8:59 AM | 12 (1.5%) | 0 (0.0%) |
| 9:00 AM to 9:59 AM | 0 (0.0%) | 78 (11.8%) |
| 10:00 AM to 10:59 AM | 0 (0.0%) | 0 (0.0%) |
| 11:00 AM to 11:59 AM | 0 (0.0%) | 0 (0.0%) |
| 12:00 PM to 3:59 PM | 0 (0.0%) | 0 (0.0%) |
| 4:00 PM to 11:59 PM | 0 (0.0%) | 33 (5.0%) |
| Total | 810 (100.0%) | 660 (100.0%) |
Housing Occupancy in Crockett County
Occupancy by Ownership in Crockett County
Of the total 1,289 dwellings in Crockett County, owner-occupied units account for 932 (72.3%), while renter-occupied units make up 357 (27.7%).
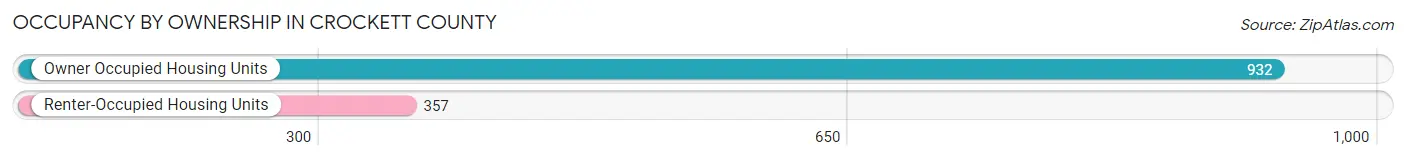
| Occupancy | # Housing Units | % Housing Units |
| Owner Occupied Housing Units | 932 | 72.3% |
| Renter-Occupied Housing Units | 357 | 27.7% |
| Total Occupied Housing Units | 1,289 | 100.0% |
Occupancy by Household Size in Crockett County
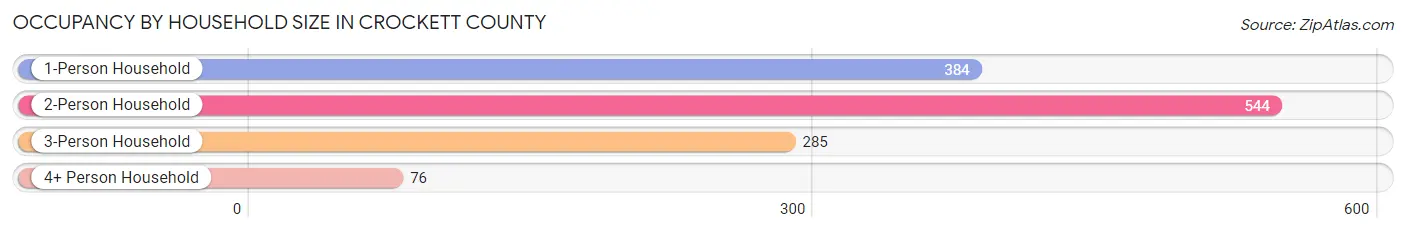
| Household Size | # Housing Units | % Housing Units |
| 1-Person Household | 384 | 29.8% |
| 2-Person Household | 544 | 42.2% |
| 3-Person Household | 285 | 22.1% |
| 4+ Person Household | 76 | 5.9% |
| Total Housing Units | 1,289 | 100.0% |
Occupancy by Ownership by Household Size in Crockett County
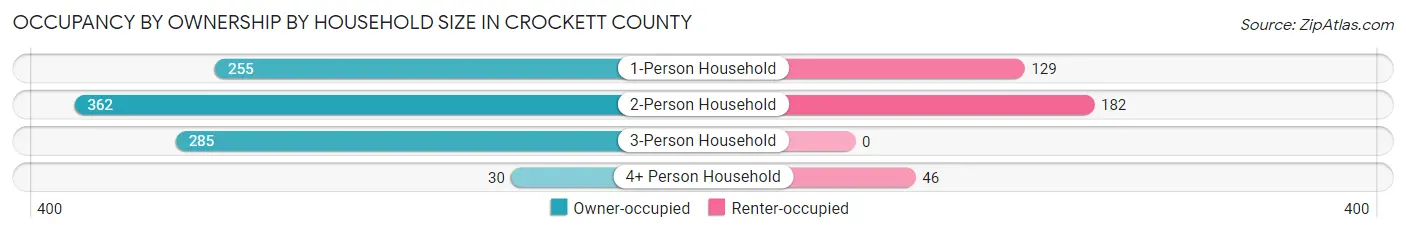
| Household Size | Owner-occupied | Renter-occupied |
| 1-Person Household | 255 (66.4%) | 129 (33.6%) |
| 2-Person Household | 362 (66.5%) | 182 (33.5%) |
| 3-Person Household | 285 (100.0%) | 0 (0.0%) |
| 4+ Person Household | 30 (39.5%) | 46 (60.5%) |
| Total Housing Units | 932 (72.3%) | 357 (27.7%) |
Occupancy by Educational Attainment in Crockett County
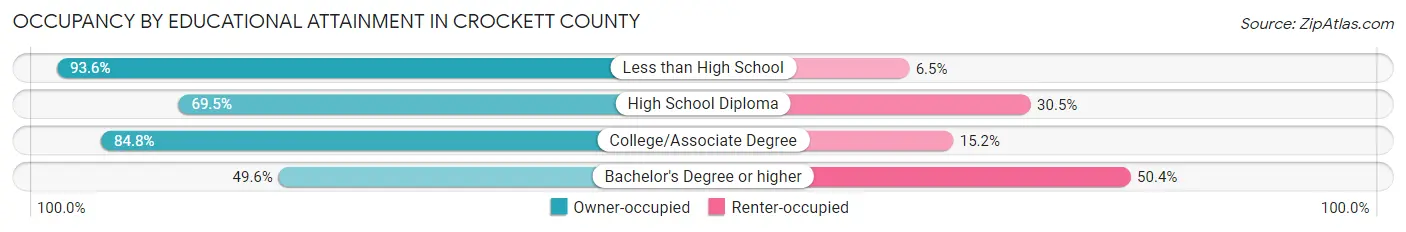
| Household Size | Owner-occupied | Renter-occupied |
| Less than High School | 145 (93.5%) | 10 (6.5%) |
| High School Diploma | 355 (69.5%) | 156 (30.5%) |
| College/Associate Degree | 296 (84.8%) | 53 (15.2%) |
| Bachelor's Degree or higher | 136 (49.6%) | 138 (50.4%) |
Occupancy by Age of Householder in Crockett County
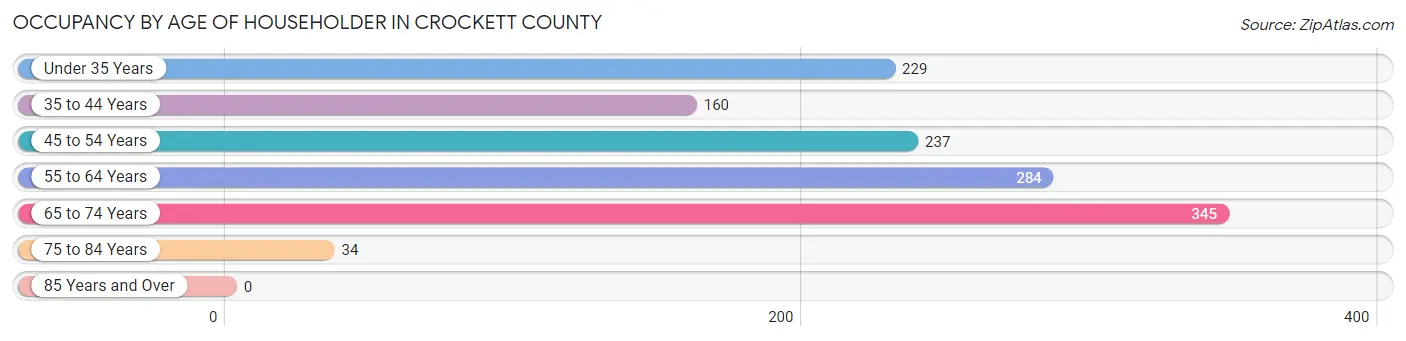
| Age Bracket | # Households | % Households |
| Under 35 Years | 229 | 17.8% |
| 35 to 44 Years | 160 | 12.4% |
| 45 to 54 Years | 237 | 18.4% |
| 55 to 64 Years | 284 | 22.0% |
| 65 to 74 Years | 345 | 26.8% |
| 75 to 84 Years | 34 | 2.6% |
| 85 Years and Over | 0 | 0.0% |
| Total | 1,289 | 100.0% |
Housing Finances in Crockett County
Median Income by Occupancy in Crockett County
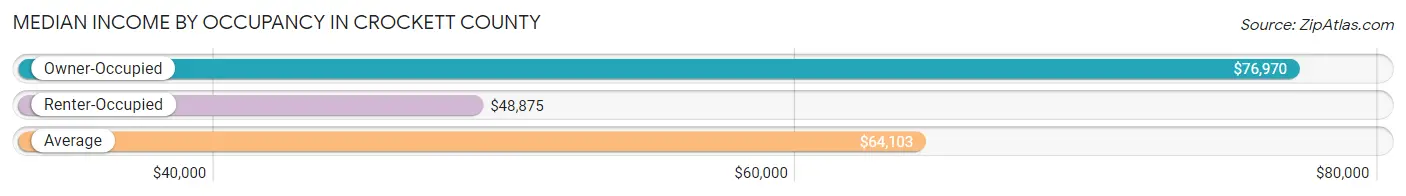
| Occupancy Type | # Households | Median Income |
| Owner-Occupied | 932 (72.3%) | $76,970 |
| Renter-Occupied | 357 (27.7%) | $48,875 |
| Average | 1,289 (100.0%) | $64,103 |
Occupancy by Householder Income Bracket in Crockett County
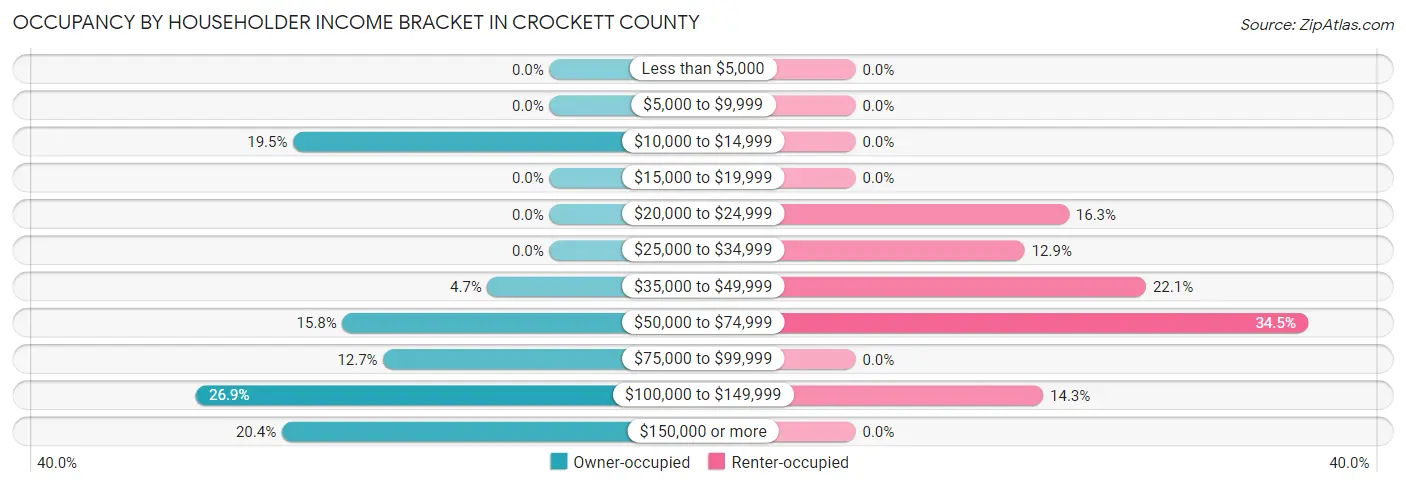
| Income Bracket | Owner-occupied | Renter-occupied |
| Less than $5,000 | 0 (0.0%) | 0 (0.0%) |
| $5,000 to $9,999 | 0 (0.0%) | 0 (0.0%) |
| $10,000 to $14,999 | 182 (19.5%) | 0 (0.0%) |
| $15,000 to $19,999 | 0 (0.0%) | 0 (0.0%) |
| $20,000 to $24,999 | 0 (0.0%) | 58 (16.3%) |
| $25,000 to $34,999 | 0 (0.0%) | 46 (12.9%) |
| $35,000 to $49,999 | 44 (4.7%) | 79 (22.1%) |
| $50,000 to $74,999 | 147 (15.8%) | 123 (34.4%) |
| $75,000 to $99,999 | 118 (12.7%) | 0 (0.0%) |
| $100,000 to $149,999 | 251 (26.9%) | 51 (14.3%) |
| $150,000 or more | 190 (20.4%) | 0 (0.0%) |
| Total | 932 (100.0%) | 357 (100.0%) |
Monthly Housing Cost Tiers in Crockett County
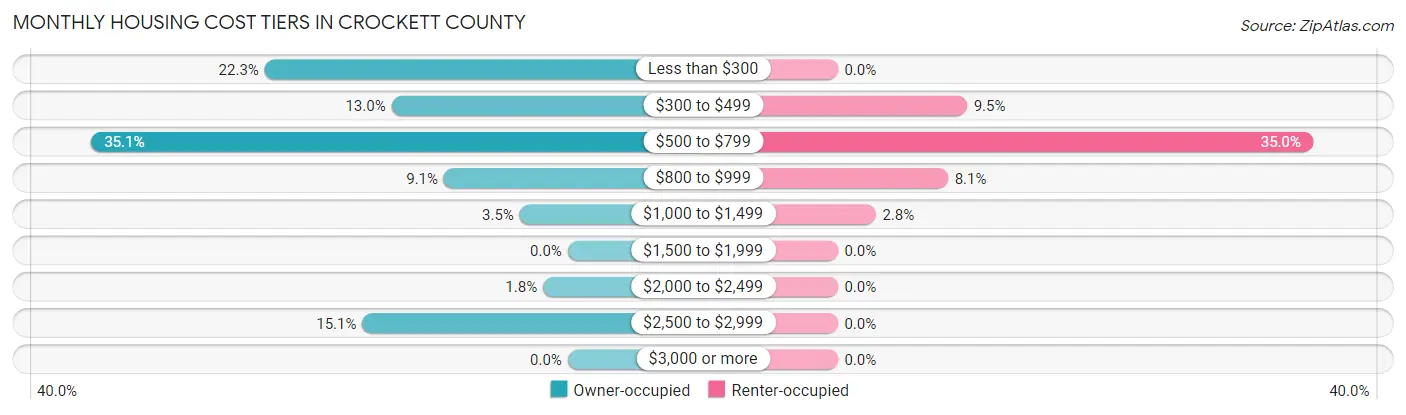
| Monthly Cost | Owner-occupied | Renter-occupied |
| Less than $300 | 208 (22.3%) | 0 (0.0%) |
| $300 to $499 | 121 (13.0%) | 34 (9.5%) |
| $500 to $799 | 327 (35.1%) | 125 (35.0%) |
| $800 to $999 | 85 (9.1%) | 29 (8.1%) |
| $1,000 to $1,499 | 33 (3.5%) | 10 (2.8%) |
| $1,500 to $1,999 | 0 (0.0%) | 0 (0.0%) |
| $2,000 to $2,499 | 17 (1.8%) | 0 (0.0%) |
| $2,500 to $2,999 | 141 (15.1%) | 0 (0.0%) |
| $3,000 or more | 0 (0.0%) | 0 (0.0%) |
| Total | 932 (100.0%) | 357 (100.0%) |
Physical Housing Characteristics in Crockett County
Housing Structures in Crockett County
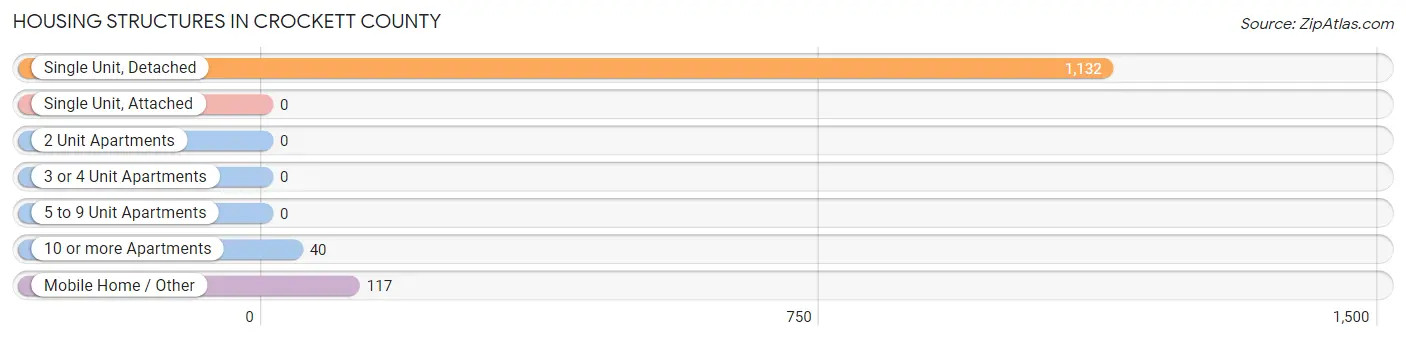
| Structure Type | # Housing Units | % Housing Units |
| Single Unit, Detached | 1,132 | 87.8% |
| Single Unit, Attached | 0 | 0.0% |
| 2 Unit Apartments | 0 | 0.0% |
| 3 or 4 Unit Apartments | 0 | 0.0% |
| 5 to 9 Unit Apartments | 0 | 0.0% |
| 10 or more Apartments | 40 | 3.1% |
| Mobile Home / Other | 117 | 9.1% |
| Total | 1,289 | 100.0% |
Housing Structures by Occupancy in Crockett County
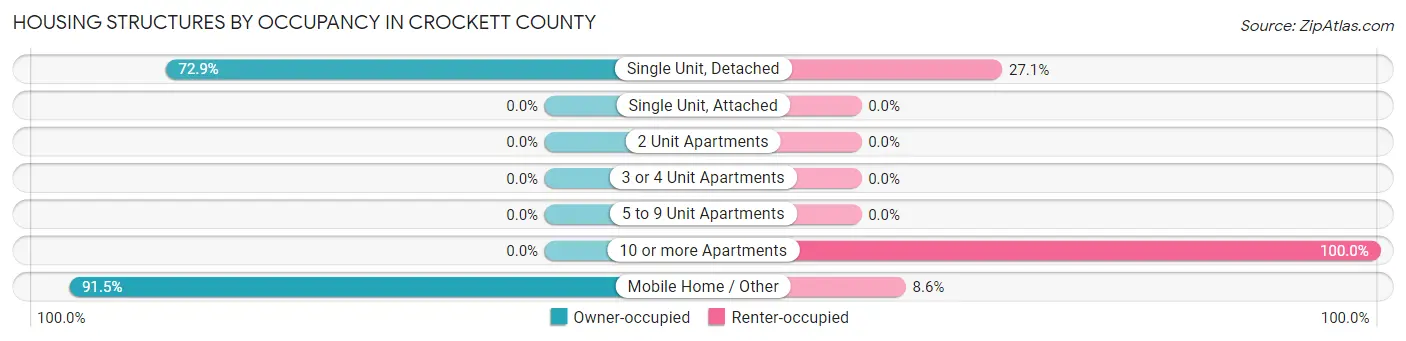
| Structure Type | Owner-occupied | Renter-occupied |
| Single Unit, Detached | 825 (72.9%) | 307 (27.1%) |
| Single Unit, Attached | 0 (0.0%) | 0 (0.0%) |
| 2 Unit Apartments | 0 (0.0%) | 0 (0.0%) |
| 3 or 4 Unit Apartments | 0 (0.0%) | 0 (0.0%) |
| 5 to 9 Unit Apartments | 0 (0.0%) | 0 (0.0%) |
| 10 or more Apartments | 0 (0.0%) | 40 (100.0%) |
| Mobile Home / Other | 107 (91.4%) | 10 (8.6%) |
| Total | 932 (72.3%) | 357 (27.7%) |
Housing Structures by Number of Rooms in Crockett County
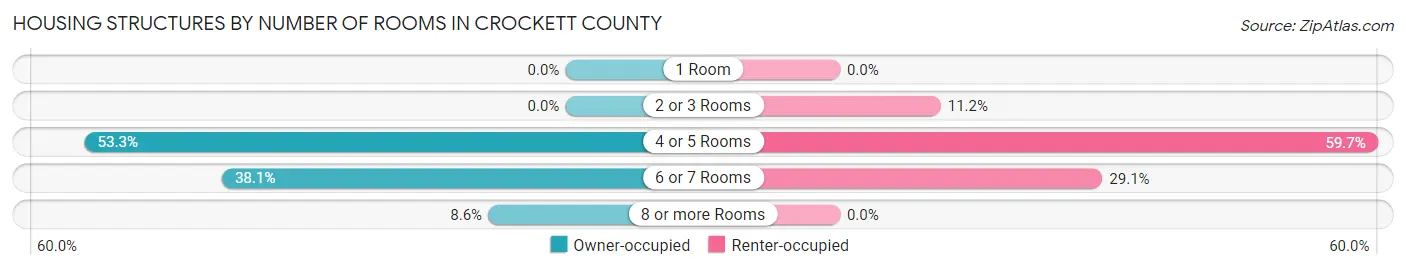
| Number of Rooms | Owner-occupied | Renter-occupied |
| 1 Room | 0 (0.0%) | 0 (0.0%) |
| 2 or 3 Rooms | 0 (0.0%) | 40 (11.2%) |
| 4 or 5 Rooms | 497 (53.3%) | 213 (59.7%) |
| 6 or 7 Rooms | 355 (38.1%) | 104 (29.1%) |
| 8 or more Rooms | 80 (8.6%) | 0 (0.0%) |
| Total | 932 (100.0%) | 357 (100.0%) |
Housing Structure by Heating Type in Crockett County
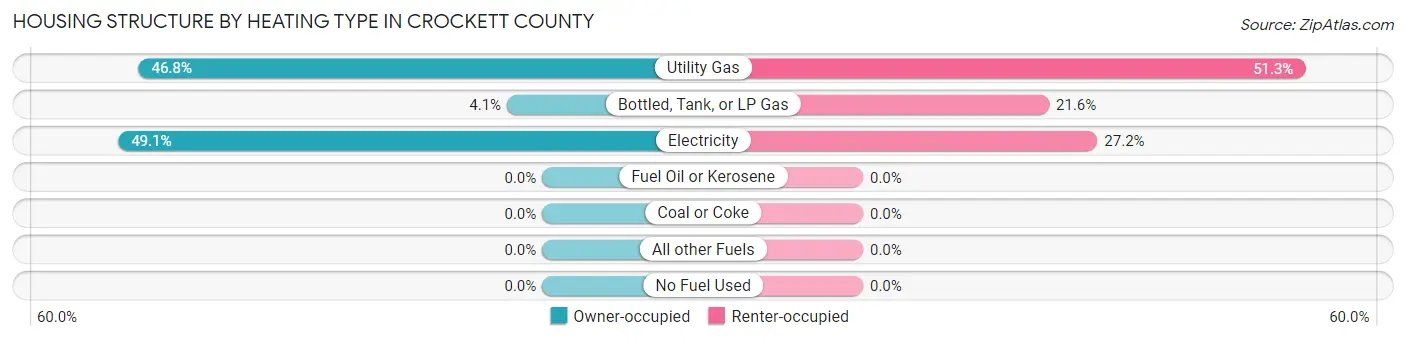
| Heating Type | Owner-occupied | Renter-occupied |
| Utility Gas | 436 (46.8%) | 183 (51.3%) |
| Bottled, Tank, or LP Gas | 38 (4.1%) | 77 (21.6%) |
| Electricity | 458 (49.1%) | 97 (27.2%) |
| Fuel Oil or Kerosene | 0 (0.0%) | 0 (0.0%) |
| Coal or Coke | 0 (0.0%) | 0 (0.0%) |
| All other Fuels | 0 (0.0%) | 0 (0.0%) |
| No Fuel Used | 0 (0.0%) | 0 (0.0%) |
| Total | 932 (100.0%) | 357 (100.0%) |
Household Vehicle Usage in Crockett County
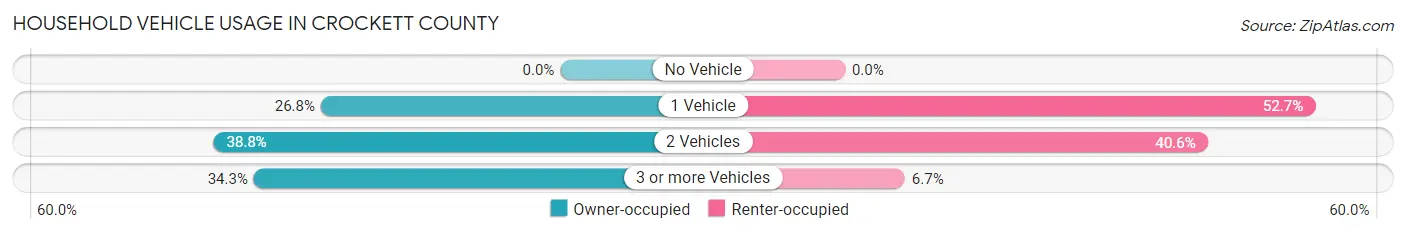
| Vehicles per Household | Owner-occupied | Renter-occupied |
| No Vehicle | 0 (0.0%) | 0 (0.0%) |
| 1 Vehicle | 250 (26.8%) | 188 (52.7%) |
| 2 Vehicles | 362 (38.8%) | 145 (40.6%) |
| 3 or more Vehicles | 320 (34.3%) | 24 (6.7%) |
| Total | 932 (100.0%) | 357 (100.0%) |
Real Estate & Mortgages in Crockett County
Real Estate and Mortgage Overview in Crockett County
| Characteristic | Without Mortgage | With Mortgage |
| Housing Units | 661 | 271 |
| Median Property Value | $175,400 | $0 |
| Median Household Income | $76,239 | $141 |
| Monthly Housing Costs | $501 | $0 |
| Real Estate Taxes | $682 | $0 |
Property Value by Mortgage Status in Crockett County
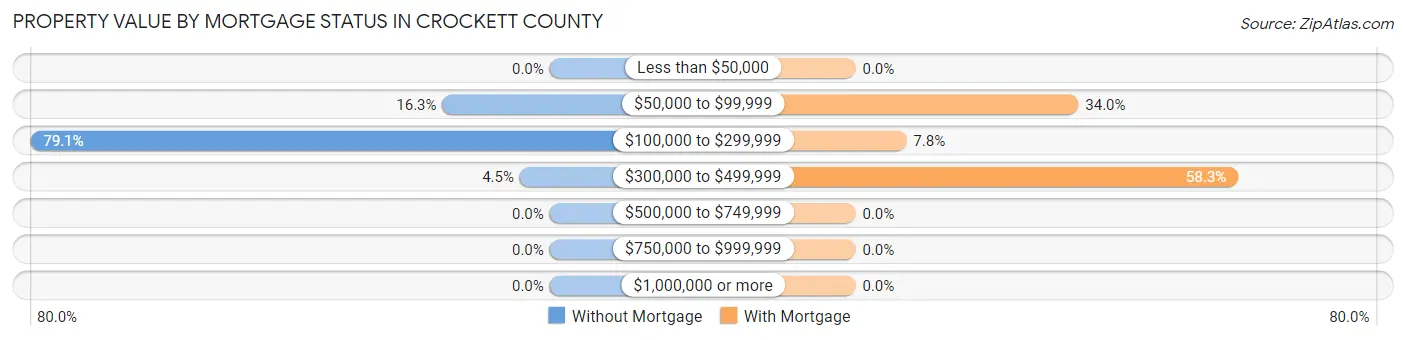
| Property Value | Without Mortgage | With Mortgage |
| Less than $50,000 | 0 (0.0%) | 0 (0.0%) |
| $50,000 to $99,999 | 108 (16.3%) | 92 (34.0%) |
| $100,000 to $299,999 | 523 (79.1%) | 21 (7.7%) |
| $300,000 to $499,999 | 30 (4.5%) | 158 (58.3%) |
| $500,000 to $749,999 | 0 (0.0%) | 0 (0.0%) |
| $750,000 to $999,999 | 0 (0.0%) | 0 (0.0%) |
| $1,000,000 or more | 0 (0.0%) | 0 (0.0%) |
| Total | 661 (100.0%) | 271 (100.0%) |
Household Income by Mortgage Status in Crockett County
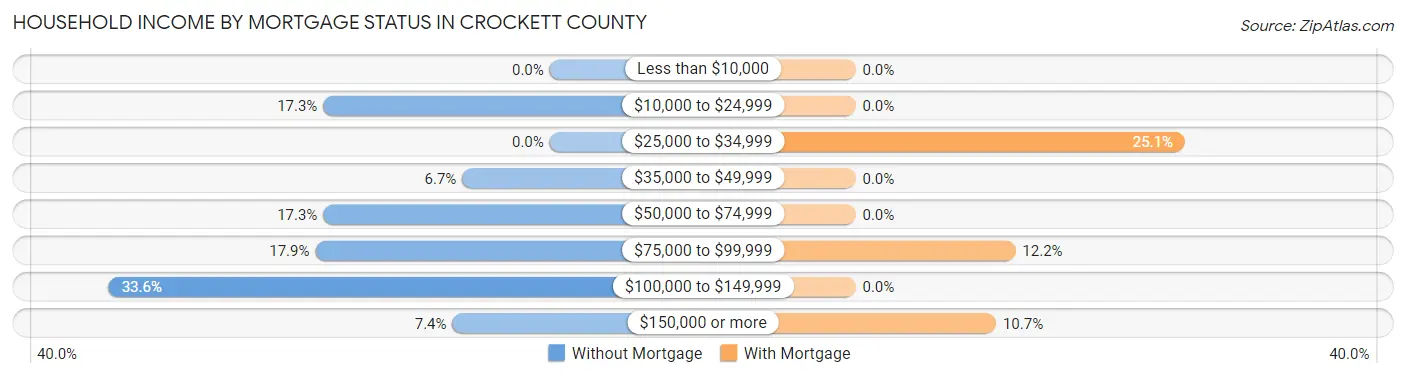
| Household Income | Without Mortgage | With Mortgage |
| Less than $10,000 | 0 (0.0%) | 0 (0.0%) |
| $10,000 to $24,999 | 114 (17.2%) | 0 (0.0%) |
| $25,000 to $34,999 | 0 (0.0%) | 68 (25.1%) |
| $35,000 to $49,999 | 44 (6.7%) | 0 (0.0%) |
| $50,000 to $74,999 | 114 (17.2%) | 0 (0.0%) |
| $75,000 to $99,999 | 118 (17.8%) | 33 (12.2%) |
| $100,000 to $149,999 | 222 (33.6%) | 0 (0.0%) |
| $150,000 or more | 49 (7.4%) | 29 (10.7%) |
| Total | 661 (100.0%) | 271 (100.0%) |
Property Value to Household Income Ratio in Crockett County
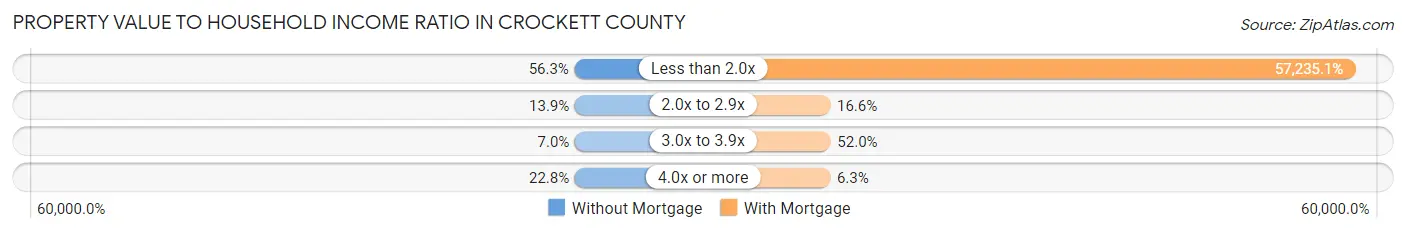
| Value-to-Income Ratio | Without Mortgage | With Mortgage |
| Less than 2.0x | 372 (56.3%) | 155,107 (57,235.1%) |
| 2.0x to 2.9x | 92 (13.9%) | 45 (16.6%) |
| 3.0x to 3.9x | 46 (7.0%) | 141 (52.0%) |
| 4.0x or more | 151 (22.8%) | 17 (6.3%) |
| Total | 661 (100.0%) | 271 (100.0%) |
Real Estate Taxes by Mortgage Status in Crockett County
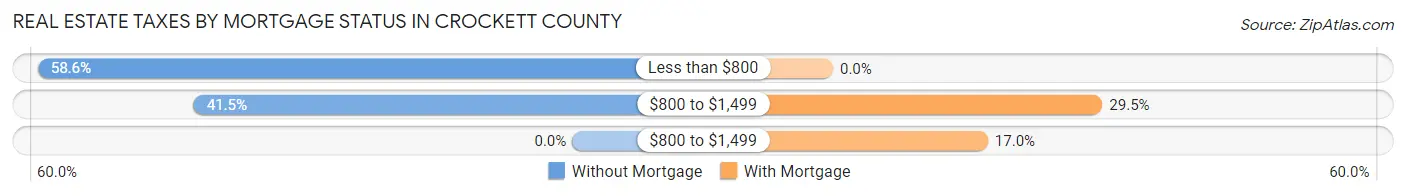
| Property Taxes | Without Mortgage | With Mortgage |
| Less than $800 | 387 (58.6%) | 0 (0.0%) |
| $800 to $1,499 | 274 (41.4%) | 80 (29.5%) |
| $800 to $1,499 | 0 (0.0%) | 46 (17.0%) |
| Total | 661 (100.0%) | 271 (100.0%) |
Health & Disability in Crockett County
Health Insurance Coverage by Age in Crockett County
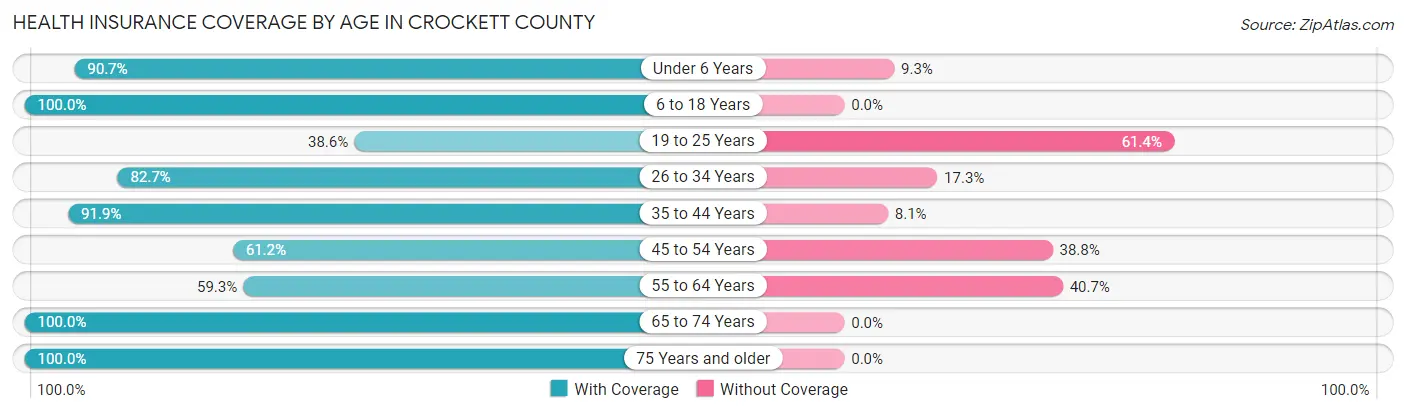
| Age Bracket | With Coverage | Without Coverage |
| Under 6 Years | 127 (90.7%) | 13 (9.3%) |
| 6 to 18 Years | 391 (100.0%) | 0 (0.0%) |
| 19 to 25 Years | 27 (38.6%) | 43 (61.4%) |
| 26 to 34 Years | 487 (82.7%) | 102 (17.3%) |
| 35 to 44 Years | 147 (91.9%) | 13 (8.1%) |
| 45 to 54 Years | 241 (61.2%) | 153 (38.8%) |
| 55 to 64 Years | 291 (59.3%) | 200 (40.7%) |
| 65 to 74 Years | 575 (100.0%) | 0 (0.0%) |
| 75 Years and older | 78 (100.0%) | 0 (0.0%) |
| Total | 2,364 (81.9%) | 524 (18.1%) |
Health Insurance Coverage by Citizenship Status in Crockett County
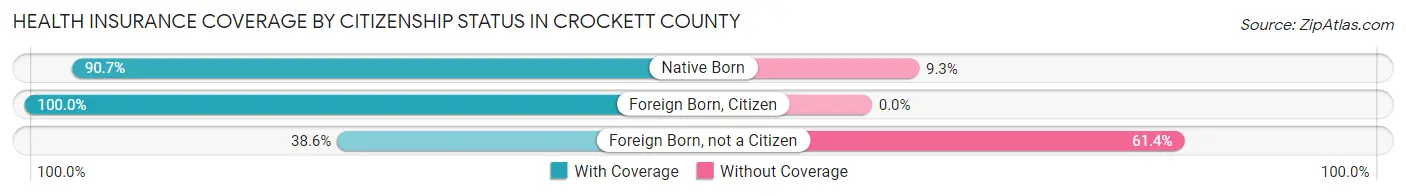
| Citizenship Status | With Coverage | Without Coverage |
| Native Born | 127 (90.7%) | 13 (9.3%) |
| Foreign Born, Citizen | 391 (100.0%) | 0 (0.0%) |
| Foreign Born, not a Citizen | 27 (38.6%) | 43 (61.4%) |
Health Insurance Coverage by Household Income in Crockett County
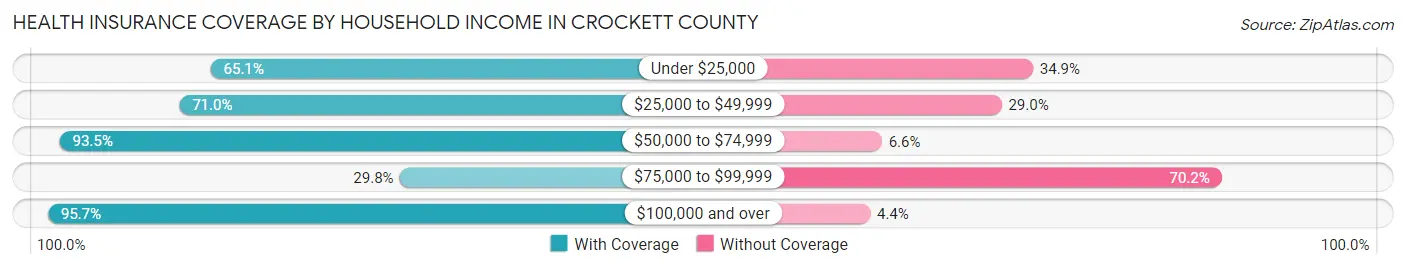
| Household Income | With Coverage | Without Coverage |
| Under $25,000 | 213 (65.1%) | 114 (34.9%) |
| $25,000 to $49,999 | 223 (71.0%) | 91 (29.0%) |
| $50,000 to $74,999 | 471 (93.4%) | 33 (6.6%) |
| $75,000 to $99,999 | 95 (29.8%) | 224 (70.2%) |
| $100,000 and over | 1,362 (95.7%) | 62 (4.3%) |
Public vs Private Health Insurance Coverage by Age in Crockett County
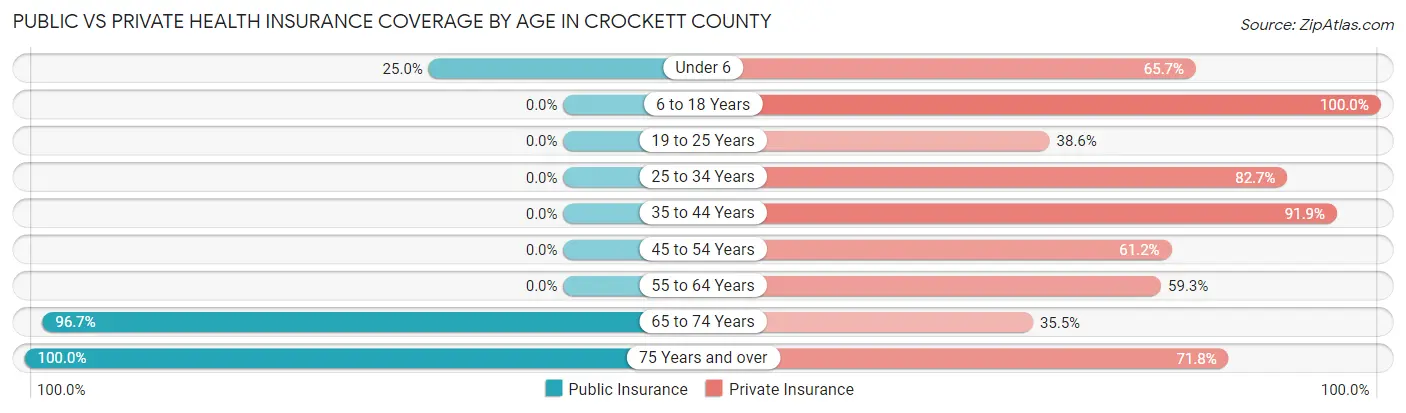
| Age Bracket | Public Insurance | Private Insurance |
| Under 6 | 35 (25.0%) | 92 (65.7%) |
| 6 to 18 Years | 0 (0.0%) | 391 (100.0%) |
| 19 to 25 Years | 0 (0.0%) | 27 (38.6%) |
| 25 to 34 Years | 0 (0.0%) | 487 (82.7%) |
| 35 to 44 Years | 0 (0.0%) | 147 (91.9%) |
| 45 to 54 Years | 0 (0.0%) | 241 (61.2%) |
| 55 to 64 Years | 0 (0.0%) | 291 (59.3%) |
| 65 to 74 Years | 556 (96.7%) | 204 (35.5%) |
| 75 Years and over | 78 (100.0%) | 56 (71.8%) |
| Total | 669 (23.2%) | 1,936 (67.0%) |
Disability Status by Sex by Age in Crockett County
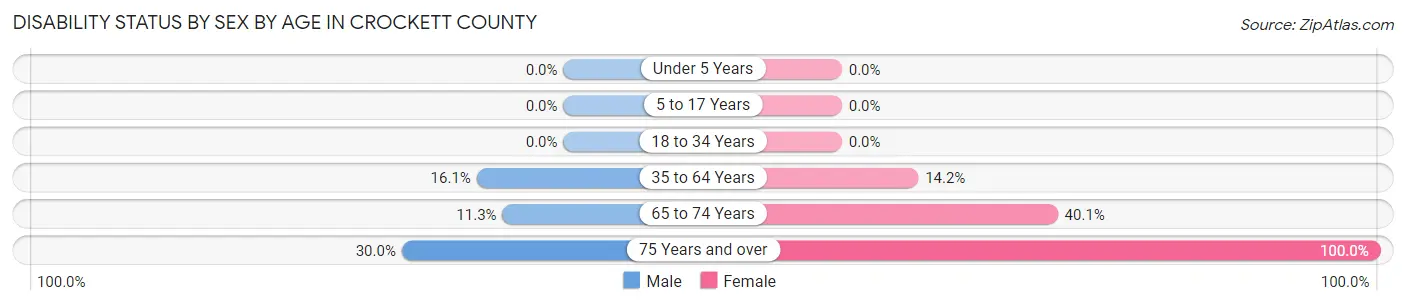
| Age Bracket | Male | Female |
| Under 5 Years | 0 (0.0%) | 0 (0.0%) |
| 5 to 17 Years | 0 (0.0%) | 0 (0.0%) |
| 18 to 34 Years | 0 (0.0%) | 0 (0.0%) |
| 35 to 64 Years | 83 (16.1%) | 75 (14.2%) |
| 65 to 74 Years | 32 (11.3%) | 117 (40.1%) |
| 75 Years and over | 9 (30.0%) | 48 (100.0%) |
Disability Class by Sex by Age in Crockett County
Disability Class: Hearing Difficulty
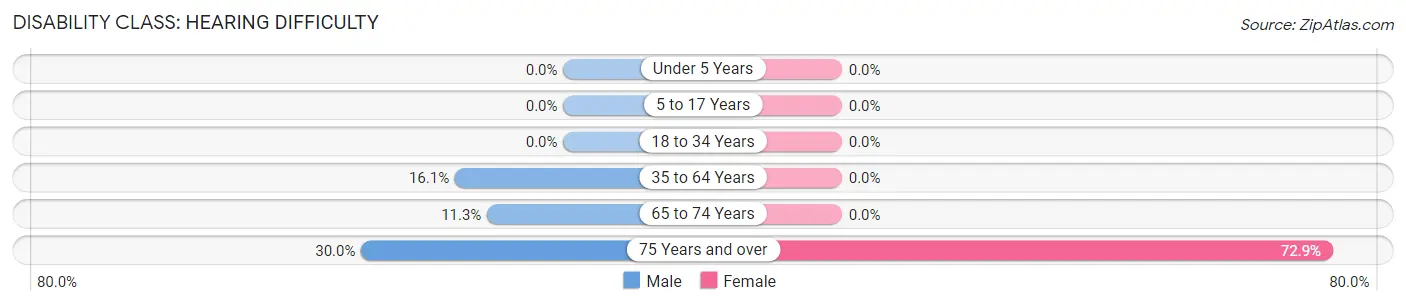
| Age Bracket | Male | Female |
| Under 5 Years | 0 (0.0%) | 0 (0.0%) |
| 5 to 17 Years | 0 (0.0%) | 0 (0.0%) |
| 18 to 34 Years | 0 (0.0%) | 0 (0.0%) |
| 35 to 64 Years | 83 (16.1%) | 0 (0.0%) |
| 65 to 74 Years | 32 (11.3%) | 0 (0.0%) |
| 75 Years and over | 9 (30.0%) | 35 (72.9%) |
Disability Class: Vision Difficulty
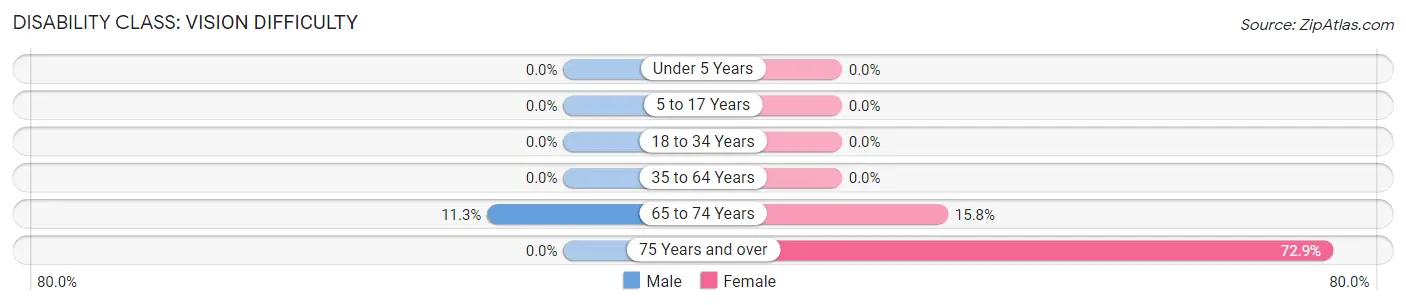
| Age Bracket | Male | Female |
| Under 5 Years | 0 (0.0%) | 0 (0.0%) |
| 5 to 17 Years | 0 (0.0%) | 0 (0.0%) |
| 18 to 34 Years | 0 (0.0%) | 0 (0.0%) |
| 35 to 64 Years | 0 (0.0%) | 0 (0.0%) |
| 65 to 74 Years | 32 (11.3%) | 46 (15.8%) |
| 75 Years and over | 0 (0.0%) | 35 (72.9%) |
Disability Class: Cognitive Difficulty
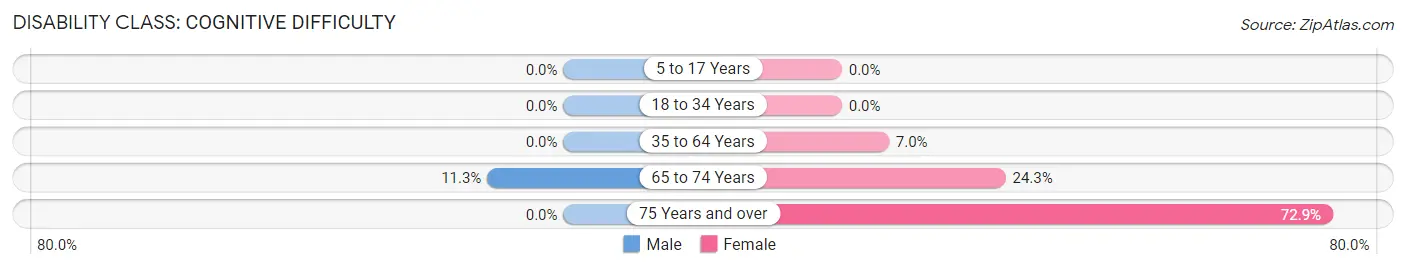
| Age Bracket | Male | Female |
| 5 to 17 Years | 0 (0.0%) | 0 (0.0%) |
| 18 to 34 Years | 0 (0.0%) | 0 (0.0%) |
| 35 to 64 Years | 0 (0.0%) | 37 (7.0%) |
| 65 to 74 Years | 32 (11.3%) | 71 (24.3%) |
| 75 Years and over | 0 (0.0%) | 35 (72.9%) |
Disability Class: Ambulatory Difficulty
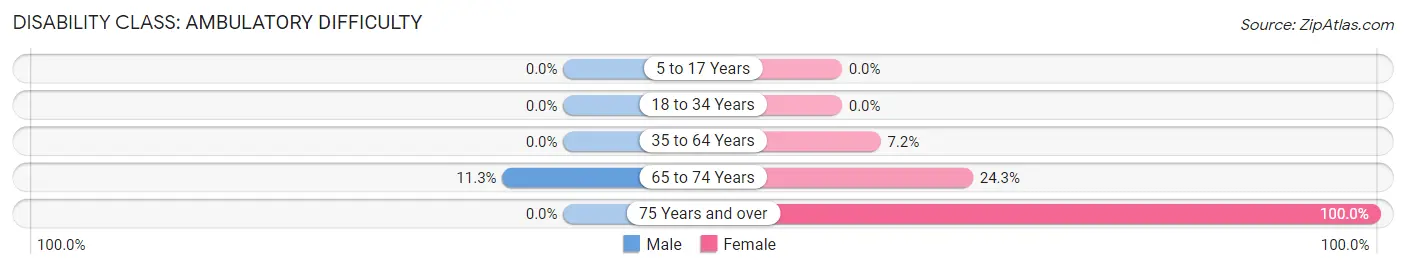
| Age Bracket | Male | Female |
| 5 to 17 Years | 0 (0.0%) | 0 (0.0%) |
| 18 to 34 Years | 0 (0.0%) | 0 (0.0%) |
| 35 to 64 Years | 0 (0.0%) | 38 (7.2%) |
| 65 to 74 Years | 32 (11.3%) | 71 (24.3%) |
| 75 Years and over | 0 (0.0%) | 48 (100.0%) |
Disability Class: Self-Care Difficulty
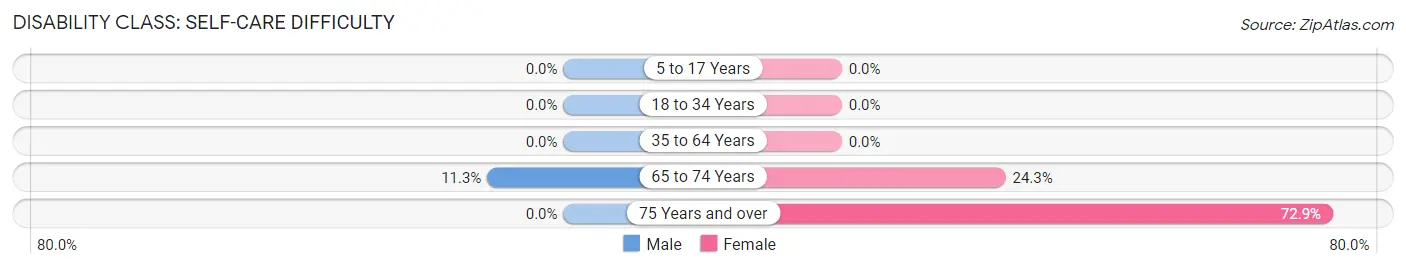
| Age Bracket | Male | Female |
| 5 to 17 Years | 0 (0.0%) | 0 (0.0%) |
| 18 to 34 Years | 0 (0.0%) | 0 (0.0%) |
| 35 to 64 Years | 0 (0.0%) | 0 (0.0%) |
| 65 to 74 Years | 32 (11.3%) | 71 (24.3%) |
| 75 Years and over | 0 (0.0%) | 35 (72.9%) |
Technology Access in Crockett County
Computing Device Access in Crockett County
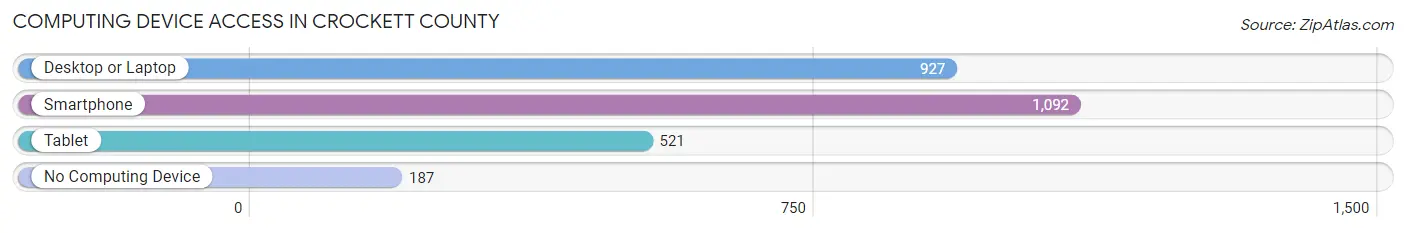
| Device Type | # Households | % Households |
| Desktop or Laptop | 927 | 71.9% |
| Smartphone | 1,092 | 84.7% |
| Tablet | 521 | 40.4% |
| No Computing Device | 187 | 14.5% |
| Total | 1,289 | 100.0% |
Internet Access in Crockett County
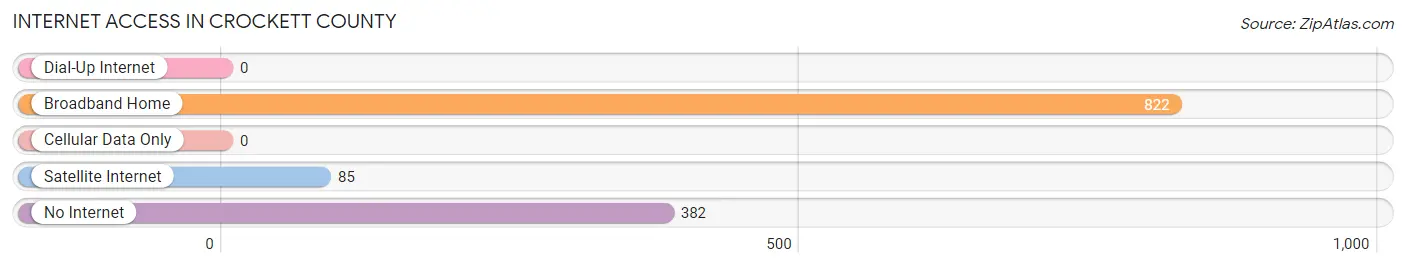
| Internet Type | # Households | % Households |
| Dial-Up Internet | 0 | 0.0% |
| Broadband Home | 822 | 63.8% |
| Cellular Data Only | 0 | 0.0% |
| Satellite Internet | 85 | 6.6% |
| No Internet | 382 | 29.6% |
| Total | 1,289 | 100.0% |
Crockett County Summary
Crockett County is located in the state of Texas, in the United States of America. It is located in the Edwards Plateau region of the state, and is bordered by Val Verde County to the north, Sutton County to the east, Schleicher County to the south, and Reagan County to the west. The county seat is Ozona, and the county has a total area of 1,521 square miles.
History
Crockett County was established in 1875, and was named after the famous frontiersman and Texas hero, Davy Crockett. The county was originally part of Bexar County, and was later divided into two parts, with the western part becoming Crockett County. The county was organized in 1891, and the first county seat was located in the town of Hayrick. The county seat was moved to Ozona in 1895.
Geography
Crockett County is located in the Edwards Plateau region of Texas, and is characterized by rolling hills and rugged terrain. The county is home to several rivers, including the Pecos River, which forms the northern border of the county. The county is also home to several creeks, including the San Solomon, which flows through the county from east to west. The county is also home to several lakes, including Lake O.H. Ivie, which is the largest lake in the county.
The climate of Crockett County is semi-arid, with hot summers and mild winters. The average annual temperature is around 68 degrees Fahrenheit, and the average annual precipitation is around 19 inches.
Economy
The economy of Crockett County is largely based on agriculture and ranching. The county is home to several large ranches, and the main crops grown in the county are cotton, sorghum, and wheat. The county is also home to several oil and gas fields, and the county is home to several oil and gas production companies.
The county is also home to several manufacturing companies, including a large paper mill in Ozona. The county is also home to several retail stores, restaurants, and other businesses.
Demographics
As of the 2010 census, the population of Crockett County was 3,719. The population is largely white, with around 90% of the population being white. The median household income in the county is around $37,000, and the median home value is around $90,000. The unemployment rate in the county is around 4.5%.
Conclusion
Crockett County is a rural county located in the Edwards Plateau region of Texas. The county is home to several ranches and farms, and is also home to several oil and gas fields. The county is largely white, and the median household income is around $37,000. The county is home to several businesses, and the unemployment rate is around 4.5%.
Common Questions
What is Per Capita Income in Crockett County?
Per Capita income in Crockett County is $35,942.
What is the Median Family Income in Crockett County?
Median Family Income in Crockett County is $76,684.
What is the Median Household income in Crockett County?
Median Household Income in Crockett County is $64,103.
What is Income or Wage Gap in Crockett County?
Income or Wage Gap in Crockett County is 42.2%.
Women in Crockett County earn 57.8 cents for every dollar earned by a man.
What is Inequality or Gini Index in Crockett County?
Inequality or Gini Index in Crockett County is 0.36.
What is the Total Population of Crockett County?
Total Population of Crockett County is 2,949.
What is the Total Male Population of Crockett County?
Total Male Population of Crockett County is 1,575.
What is the Total Female Population of Crockett County?
Total Female Population of Crockett County is 1,374.
What is the Ratio of Males per 100 Females in Crockett County?
There are 114.63 Males per 100 Females in Crockett County.
What is the Ratio of Females per 100 Males in Crockett County?
There are 87.24 Females per 100 Males in Crockett County.
What is the Median Population Age in Crockett County?
Median Population Age in Crockett County is 50.0 Years.
What is the Average Family Size in Crockett County
Average Family Size in Crockett County is 2.8 People.
What is the Average Household Size in Crockett County
Average Household Size in Crockett County is 2.2 People.
How Large is the Labor Force in Crockett County?
There are 1,589 People in the Labor Forcein in Crockett County.
What is the Percentage of People in the Labor Force in Crockett County?
63.8% of People are in the Labor Force in Crockett County.
What is the Unemployment Rate in Crockett County?
Unemployment Rate in Crockett County is 2.0%.