Crane County, TX Map & Demographics
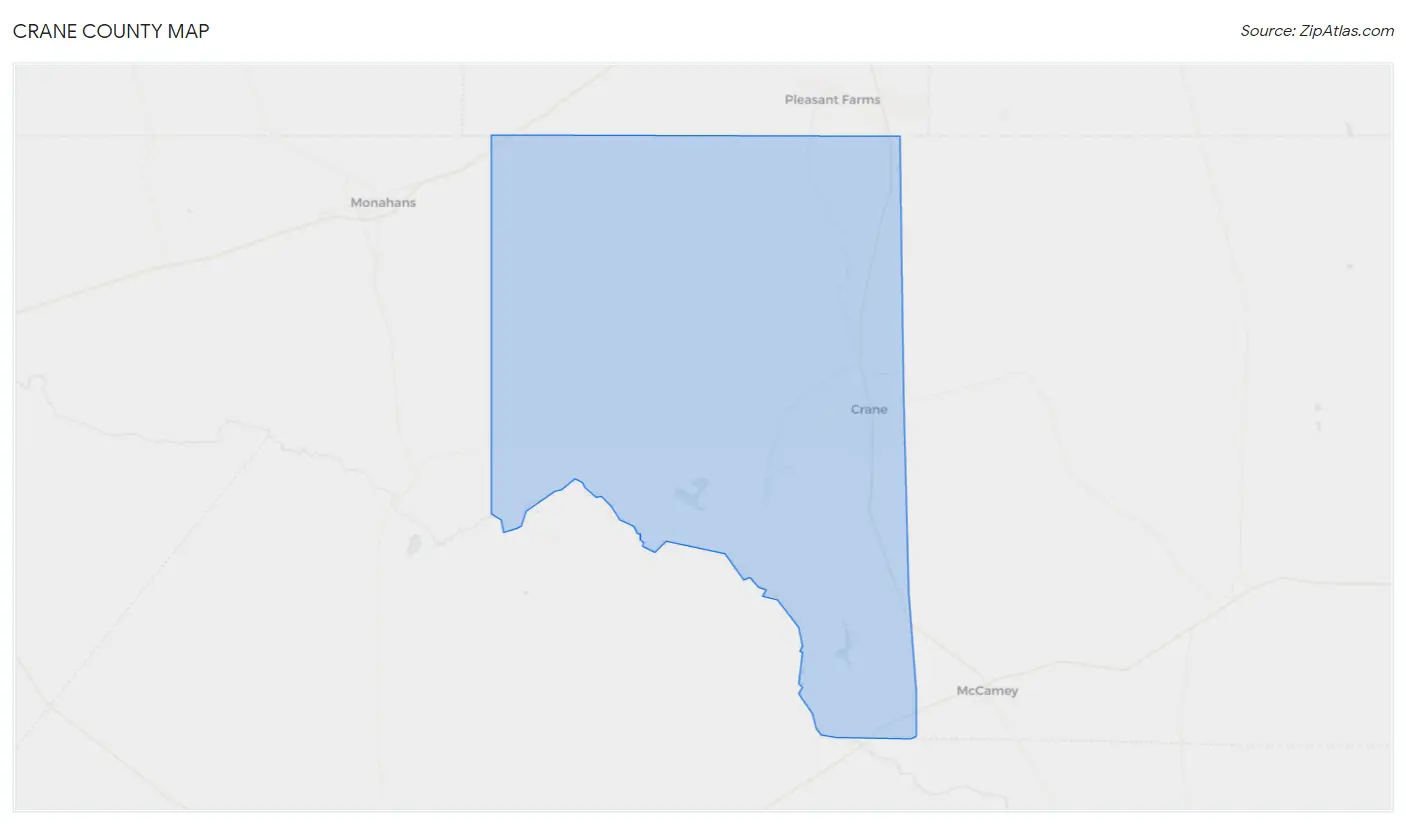
Crane County Map
Crane County Overview
$31,973
PER CAPITA INCOME
$82,402
AVG FAMILY INCOME
$71,364
AVG HOUSEHOLD INCOME
39.3%
WAGE / INCOME GAP [ % ]
60.7¢/ $1
WAGE / INCOME GAP [ $ ]
0.39
INEQUALITY / GINI INDEX
4,636
TOTAL POPULATION
2,293
MALE POPULATION
2,343
FEMALE POPULATION
97.87
MALES / 100 FEMALES
102.18
FEMALES / 100 MALES
37.9
MEDIAN AGE
3.4
AVG FAMILY SIZE
2.7
AVG HOUSEHOLD SIZE
2,312
LABOR FORCE [ PEOPLE ]
63.2%
PERCENT IN LABOR FORCE
3.0%
UNEMPLOYMENT RATE
Crane County Area Codes
Income in Crane County
Income Overview in Crane County
Per Capita Income in Crane County is $31,973, while median incomes of families and households are $82,402 and $71,364 respectively.
| Characteristic | Number | Measure |
| Per Capita Income | 4,636 | $31,973 |
| Median Family Income | 1,139 | $82,402 |
| Mean Family Income | 1,139 | $95,829 |
| Median Household Income | 1,670 | $71,364 |
| Mean Household Income | 1,670 | $83,614 |
| Income Deficit | 1,139 | $0 |
| Wage / Income Gap (%) | 4,636 | 39.28% |
| Wage / Income Gap ($) | 4,636 | 60.72¢ per $1 |
| Gini / Inequality Index | 4,636 | 0.39 |
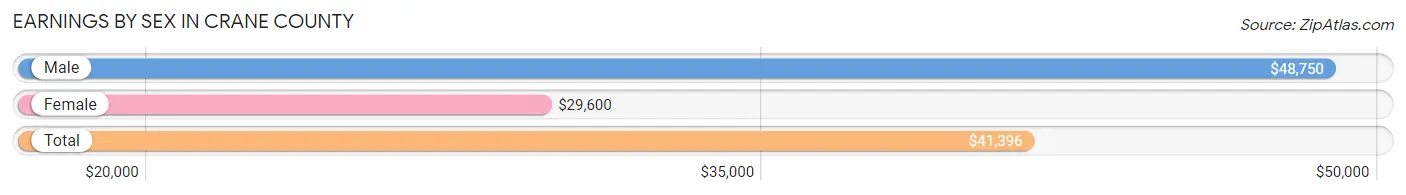
Earnings by Sex in Crane County
Average Earnings in Crane County are $41,396, $48,750 for men and $29,600 for women, a difference of 39.3%.
| Sex | Number | Average Earnings |
| Male | 1,613 (65.8%) | $48,750 |
| Female | 840 (34.2%) | $29,600 |
| Total | 2,453 (100.0%) | $41,396 |
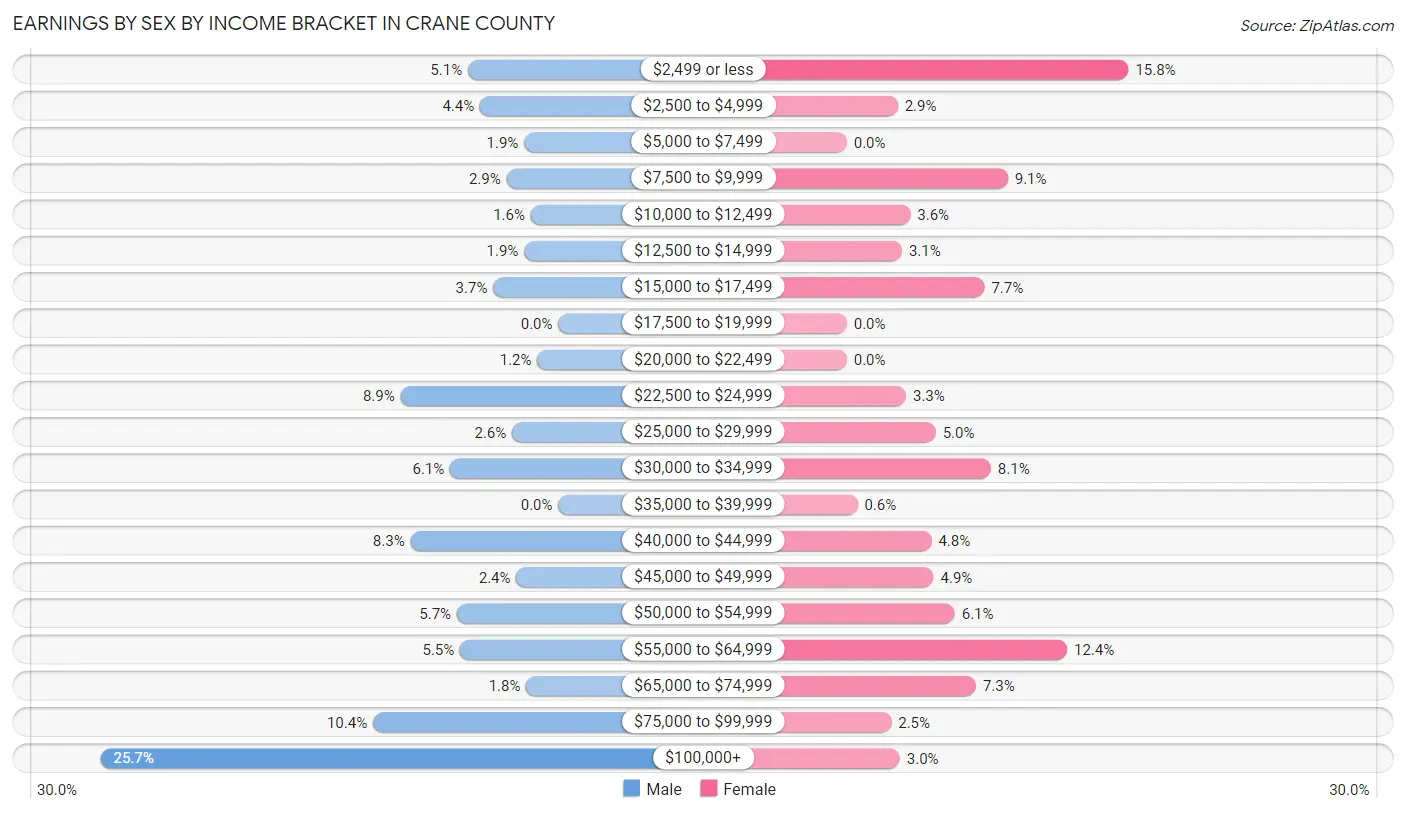
Earnings by Sex by Income Bracket in Crane County
The most common earnings brackets in Crane County are $100,000+ for men (415 | 25.7%) and $2,499 or less for women (133 | 15.8%).
| Income | Male | Female |
| $2,499 or less | 82 (5.1%) | 133 (15.8%) |
| $2,500 to $4,999 | 71 (4.4%) | 24 (2.9%) |
| $5,000 to $7,499 | 31 (1.9%) | 0 (0.0%) |
| $7,500 to $9,999 | 47 (2.9%) | 76 (9.0%) |
| $10,000 to $12,499 | 25 (1.5%) | 30 (3.6%) |
| $12,500 to $14,999 | 31 (1.9%) | 26 (3.1%) |
| $15,000 to $17,499 | 59 (3.7%) | 65 (7.7%) |
| $17,500 to $19,999 | 0 (0.0%) | 0 (0.0%) |
| $20,000 to $22,499 | 19 (1.2%) | 0 (0.0%) |
| $22,500 to $24,999 | 143 (8.9%) | 28 (3.3%) |
| $25,000 to $29,999 | 42 (2.6%) | 42 (5.0%) |
| $30,000 to $34,999 | 98 (6.1%) | 68 (8.1%) |
| $35,000 to $39,999 | 0 (0.0%) | 5 (0.6%) |
| $40,000 to $44,999 | 134 (8.3%) | 40 (4.8%) |
| $45,000 to $49,999 | 38 (2.4%) | 41 (4.9%) |
| $50,000 to $54,999 | 92 (5.7%) | 51 (6.1%) |
| $55,000 to $64,999 | 89 (5.5%) | 104 (12.4%) |
| $65,000 to $74,999 | 29 (1.8%) | 61 (7.3%) |
| $75,000 to $99,999 | 168 (10.4%) | 21 (2.5%) |
| $100,000+ | 415 (25.7%) | 25 (3.0%) |
| Total | 1,613 (100.0%) | 840 (100.0%) |
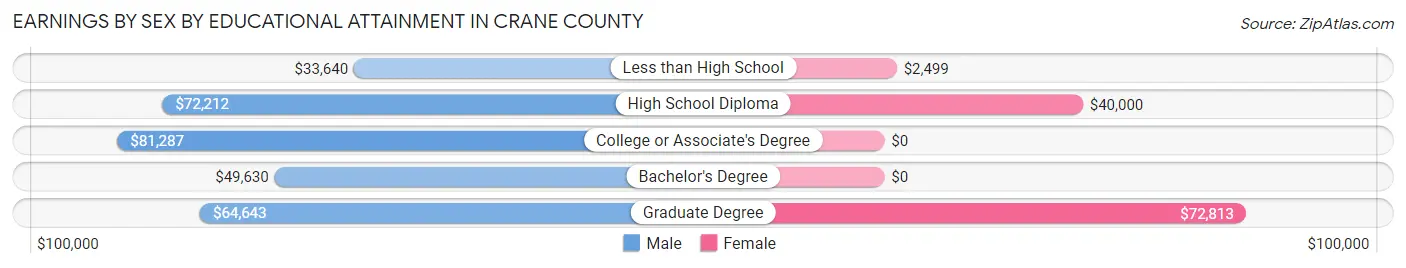
Earnings by Sex by Educational Attainment in Crane County
Average earnings in Crane County are $53,942 for men and $34,896 for women, a difference of 35.3%. Men with an educational attainment of college or associate's degree enjoy the highest average annual earnings of $81,287, while those with less than high school education earn the least with $33,640. Women with an educational attainment of graduate degree earn the most with the average annual earnings of $72,813, while those with less than high school education have the smallest earnings of $2,499.
| Educational Attainment | Male Income | Female Income |
| Less than High School | $33,640 | $2,499 |
| High School Diploma | $72,212 | $40,000 |
| College or Associate's Degree | $81,287 | $0 |
| Bachelor's Degree | $49,630 | $0 |
| Graduate Degree | $64,643 | $72,813 |
| Total | $53,942 | $34,896 |
Family Income in Crane County
Family Income Brackets in Crane County
According to the Crane County family income data, there are 271 families falling into the $100,000 to $149,999 income range, which is the most common income bracket and makes up 23.8% of all families.
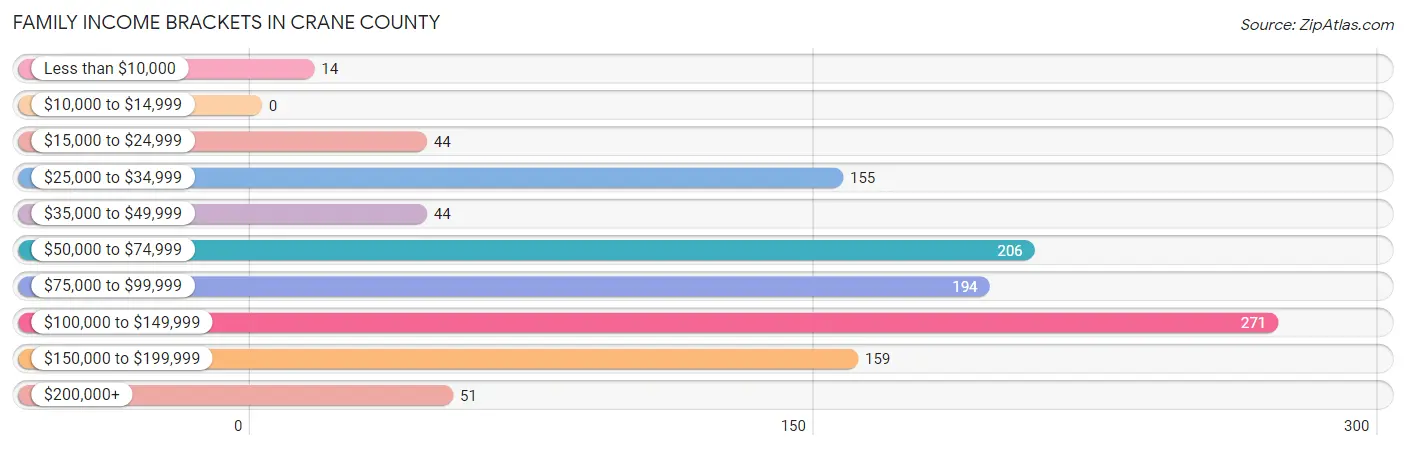
| Income Bracket | # Families | % Families |
| Less than $10,000 | 14 | 1.2% |
| $10,000 to $14,999 | 0 | 0.0% |
| $15,000 to $24,999 | 44 | 3.9% |
| $25,000 to $34,999 | 155 | 13.6% |
| $35,000 to $49,999 | 44 | 3.9% |
| $50,000 to $74,999 | 206 | 18.1% |
| $75,000 to $99,999 | 194 | 17.0% |
| $100,000 to $149,999 | 271 | 23.8% |
| $150,000 to $199,999 | 159 | 14.0% |
| $200,000+ | 51 | 4.5% |
Family Income by Famaliy Size in Crane County
3-person families (344 | 30.2%) account for the highest median family income in Crane County with $145,326 per family, while 3-person families (344 | 30.2%) have the highest median income of $48,442 per family member.
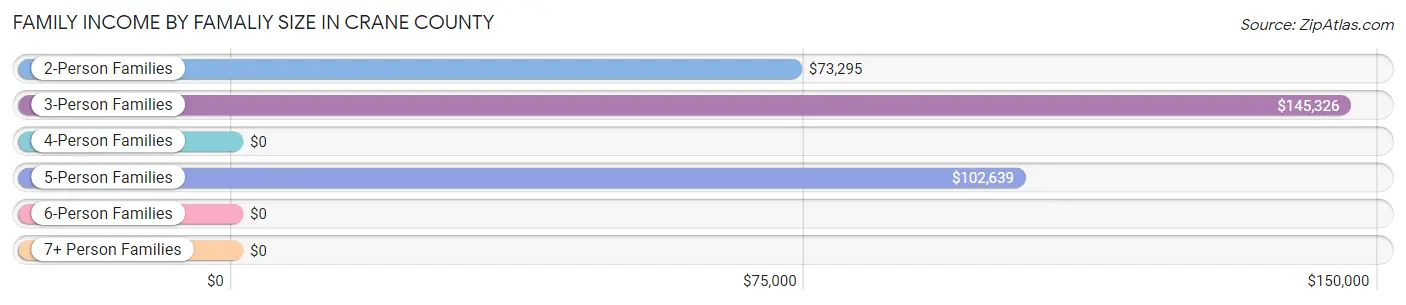
| Income Bracket | # Families | Median Income |
| 2-Person Families | 555 (48.7%) | $73,295 |
| 3-Person Families | 344 (30.2%) | $145,326 |
| 4-Person Families | 122 (10.7%) | $0 |
| 5-Person Families | 54 (4.7%) | $102,639 |
| 6-Person Families | 64 (5.6%) | $0 |
| 7+ Person Families | 0 (0.0%) | $0 |
| Total | 1,139 (100.0%) | $82,402 |
Family Income by Number of Earners in Crane County
The median family income in Crane County is $82,402, with families comprising 2 earners (461) having the highest median family income of $129,063, while families with no earners (167) have the lowest median family income of $33,451, accounting for 40.5% and 14.7% of families, respectively.
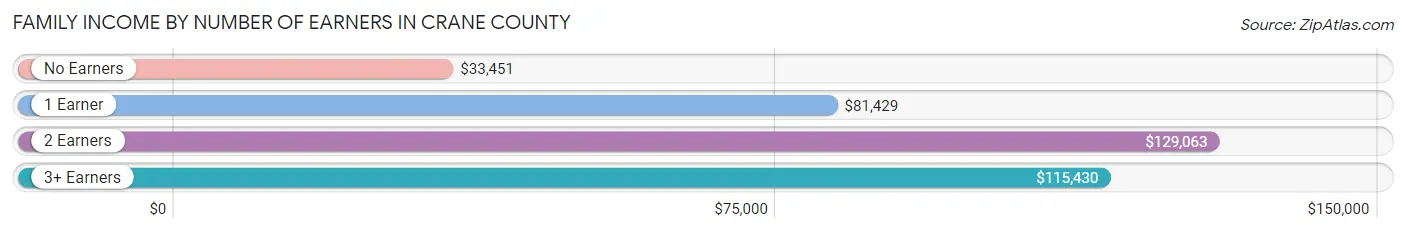
| Number of Earners | # Families | Median Income |
| No Earners | 167 (14.7%) | $33,451 |
| 1 Earner | 396 (34.8%) | $81,429 |
| 2 Earners | 461 (40.5%) | $129,063 |
| 3+ Earners | 115 (10.1%) | $115,430 |
| Total | 1,139 (100.0%) | $82,402 |
Household Income in Crane County
Household Income Brackets in Crane County
With 319 households falling in the category, the $100,000 to $149,999 income range is the most frequent in Crane County, accounting for 19.1% of all households. In contrast, only 40 households (2.4%) fall into the less than $10,000 income bracket, making it the least populous group.
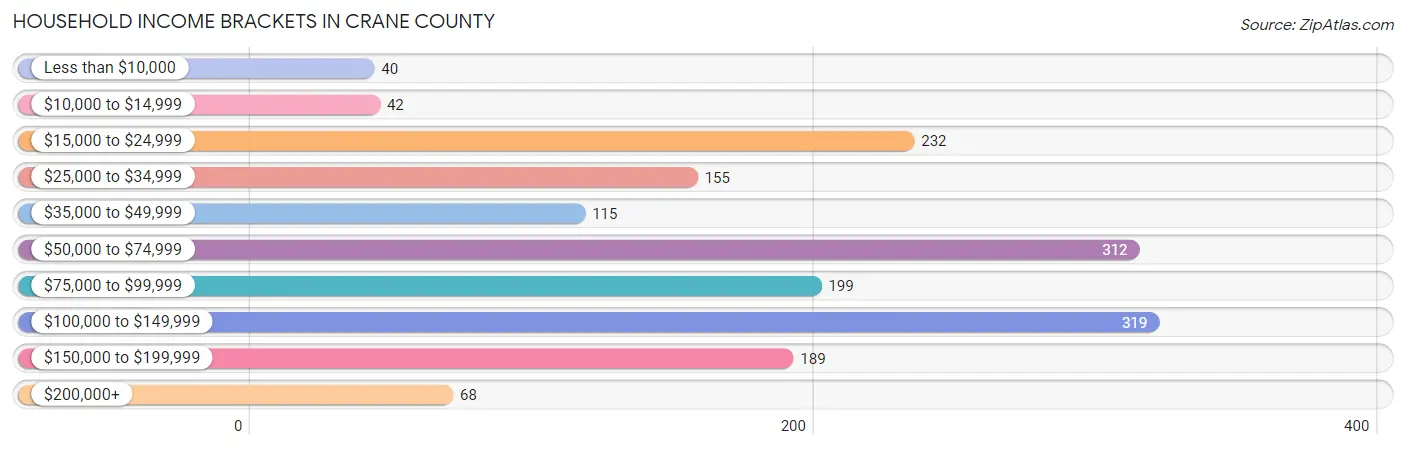
| Income Bracket | # Households | % Households |
| Less than $10,000 | 40 | 2.4% |
| $10,000 to $14,999 | 42 | 2.5% |
| $15,000 to $24,999 | 232 | 13.9% |
| $25,000 to $34,999 | 155 | 9.3% |
| $35,000 to $49,999 | 115 | 6.9% |
| $50,000 to $74,999 | 312 | 18.7% |
| $75,000 to $99,999 | 199 | 11.9% |
| $100,000 to $149,999 | 319 | 19.1% |
| $150,000 to $199,999 | 189 | 11.3% |
| $200,000+ | 68 | 4.1% |
Household Income by Householder Age in Crane County
The median household income in Crane County is $71,364, with the highest median household income of $90,208 found in the 45 to 64 years age bracket for the primary householder. A total of 615 households (36.8%) fall into this category. Meanwhile, the 15 to 24 years age bracket for the primary householder has the lowest median household income of $0, with 60 households (3.6%) in this group.
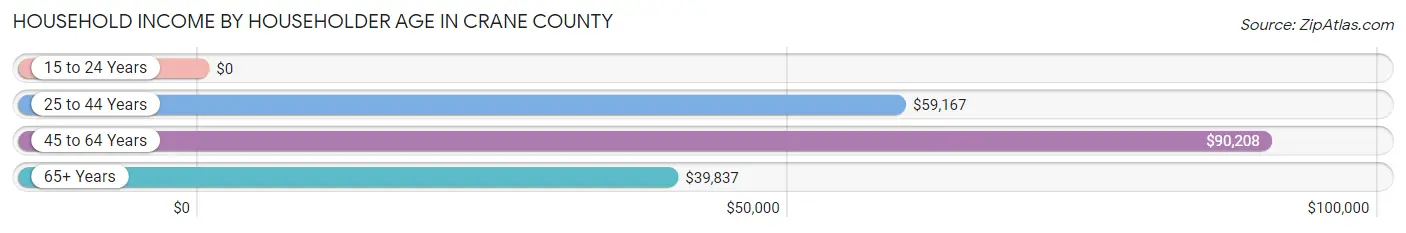
| Income Bracket | # Households | Median Income |
| 15 to 24 Years | 60 (3.6%) | $0 |
| 25 to 44 Years | 612 (36.6%) | $59,167 |
| 45 to 64 Years | 615 (36.8%) | $90,208 |
| 65+ Years | 383 (22.9%) | $39,837 |
| Total | 1,670 (100.0%) | $71,364 |
Poverty in Crane County
Income Below Poverty by Sex and Age in Crane County
With 4.4% poverty level for males and 3.2% for females among the residents of Crane County, 75 year old and over males and 25 to 34 year old females are the most vulnerable to poverty, with 8 males (13.1%) and 33 females (16.6%) in their respective age groups living below the poverty level.
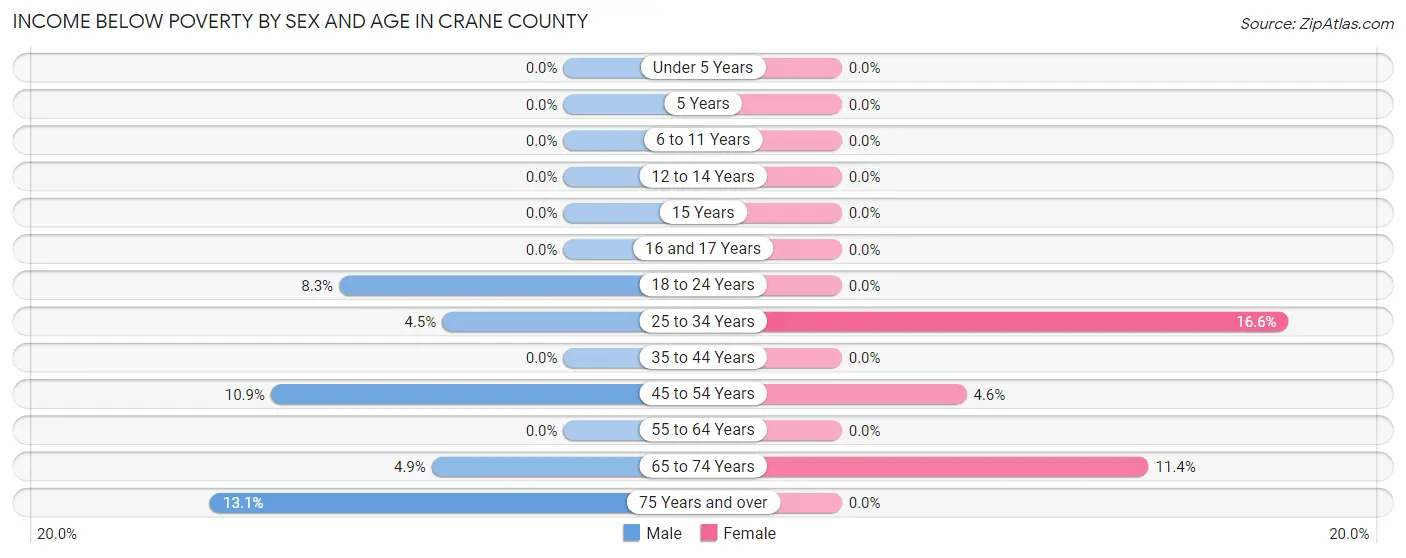
| Age Bracket | Male | Female |
| Under 5 Years | 0 (0.0%) | 0 (0.0%) |
| 5 Years | 0 (0.0%) | 0 (0.0%) |
| 6 to 11 Years | 0 (0.0%) | 0 (0.0%) |
| 12 to 14 Years | 0 (0.0%) | 0 (0.0%) |
| 15 Years | 0 (0.0%) | 0 (0.0%) |
| 16 and 17 Years | 0 (0.0%) | 0 (0.0%) |
| 18 to 24 Years | 26 (8.3%) | 0 (0.0%) |
| 25 to 34 Years | 10 (4.5%) | 33 (16.6%) |
| 35 to 44 Years | 0 (0.0%) | 0 (0.0%) |
| 45 to 54 Years | 43 (10.9%) | 18 (4.6%) |
| 55 to 64 Years | 0 (0.0%) | 0 (0.0%) |
| 65 to 74 Years | 11 (4.9%) | 23 (11.4%) |
| 75 Years and over | 8 (13.1%) | 0 (0.0%) |
| Total | 98 (4.4%) | 74 (3.2%) |
Income Above Poverty by Sex and Age in Crane County
According to the poverty statistics in Crane County, males aged under 5 years and females aged under 5 years are the age groups that are most secure financially, with 100.0% of males and 100.0% of females in these age groups living above the poverty line.
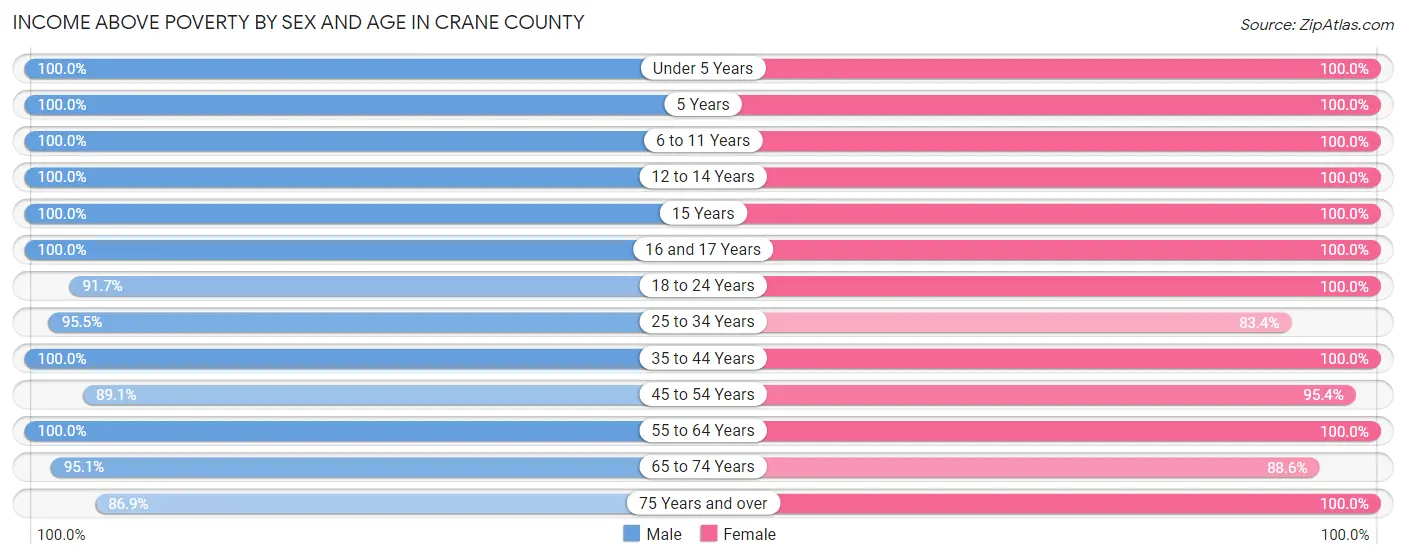
| Age Bracket | Male | Female |
| Under 5 Years | 131 (100.0%) | 313 (100.0%) |
| 5 Years | 31 (100.0%) | 10 (100.0%) |
| 6 to 11 Years | 111 (100.0%) | 87 (100.0%) |
| 12 to 14 Years | 55 (100.0%) | 172 (100.0%) |
| 15 Years | 19 (100.0%) | 49 (100.0%) |
| 16 and 17 Years | 101 (100.0%) | 119 (100.0%) |
| 18 to 24 Years | 286 (91.7%) | 229 (100.0%) |
| 25 to 34 Years | 212 (95.5%) | 166 (83.4%) |
| 35 to 44 Years | 336 (100.0%) | 224 (100.0%) |
| 45 to 54 Years | 353 (89.1%) | 371 (95.4%) |
| 55 to 64 Years | 228 (100.0%) | 191 (100.0%) |
| 65 to 74 Years | 214 (95.1%) | 179 (88.6%) |
| 75 Years and over | 53 (86.9%) | 102 (100.0%) |
| Total | 2,130 (95.6%) | 2,212 (96.8%) |
Income Below Poverty Among Married-Couple Families in Crane County
The poverty statistics for married-couple families in Crane County show that 1.4% or 14 of the total 976 families live below the poverty line. Families with no children have the highest poverty rate of 2.5%, comprising of 14 families. On the other hand, families with 1 or 2 children have the lowest poverty rate of 0.0%, which includes 0 families.
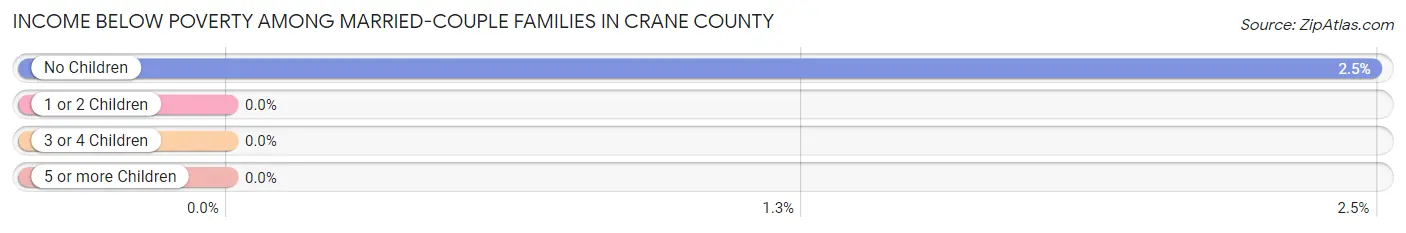
| Children | Above Poverty | Below Poverty |
| No Children | 549 (97.5%) | 14 (2.5%) |
| 1 or 2 Children | 362 (100.0%) | 0 (0.0%) |
| 3 or 4 Children | 51 (100.0%) | 0 (0.0%) |
| 5 or more Children | 0 (0.0%) | 0 (0.0%) |
| Total | 962 (98.6%) | 14 (1.4%) |
Income Below Poverty Among Single-Parent Households in Crane County
| Children | Single Father | Single Mother |
| No Children | 0 (0.0%) | 0 (0.0%) |
| 1 or 2 Children | 0 (0.0%) | 0 (0.0%) |
| 3 or 4 Children | 0 (0.0%) | 0 (0.0%) |
| 5 or more Children | 0 (0.0%) | 0 (0.0%) |
| Total | 0 (0.0%) | 0 (0.0%) |
Income Below Poverty Among Married-Couple vs Single-Parent Households in Crane County
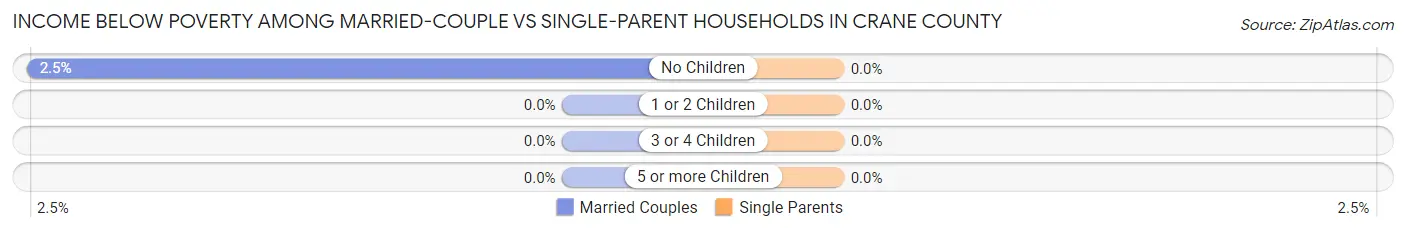
| Children | Married-Couple Families | Single-Parent Households |
| No Children | 14 (2.5%) | 0 (0.0%) |
| 1 or 2 Children | 0 (0.0%) | 0 (0.0%) |
| 3 or 4 Children | 0 (0.0%) | 0 (0.0%) |
| 5 or more Children | 0 (0.0%) | 0 (0.0%) |
| Total | 14 (1.4%) | 0 (0.0%) |
Race in Crane County
The most populous races in Crane County are Hispanic or Latino (3,055 | 65.9%), Some other Race (2,016 | 43.5%), and White / Caucasian (1,871 | 40.4%).
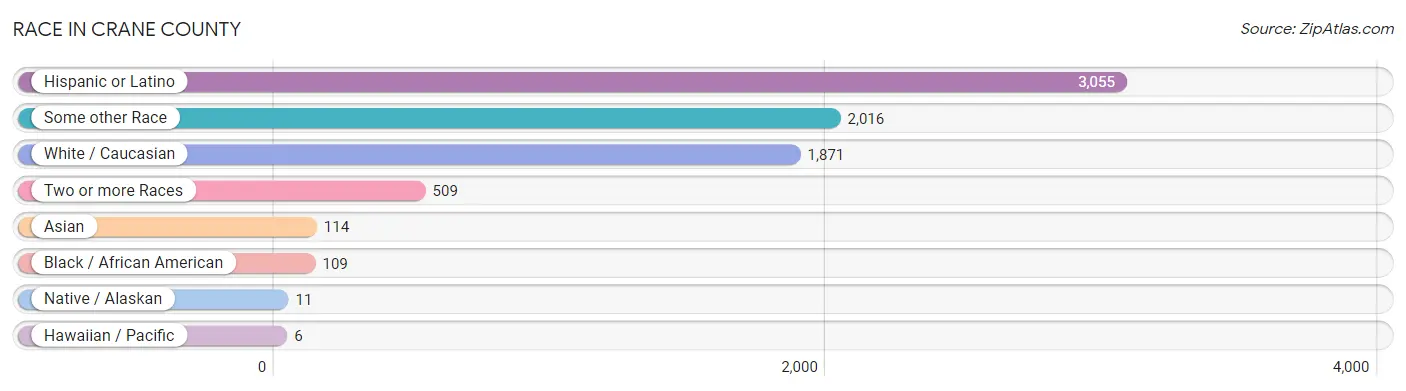
| Race | # Population | % Population |
| Asian | 114 | 2.5% |
| Black / African American | 109 | 2.4% |
| Hawaiian / Pacific | 6 | 0.1% |
| Hispanic or Latino | 3,055 | 65.9% |
| Native / Alaskan | 11 | 0.2% |
| White / Caucasian | 1,871 | 40.4% |
| Two or more Races | 509 | 11.0% |
| Some other Race | 2,016 | 43.5% |
| Total | 4,636 | 100.0% |
Ancestry in Crane County
The most populous ancestries reported in Crane County are Mexican (2,955 | 63.7%), English (305 | 6.6%), American (194 | 4.2%), German (171 | 3.7%), and French (101 | 2.2%), together accounting for 80.4% of all Crane County residents.
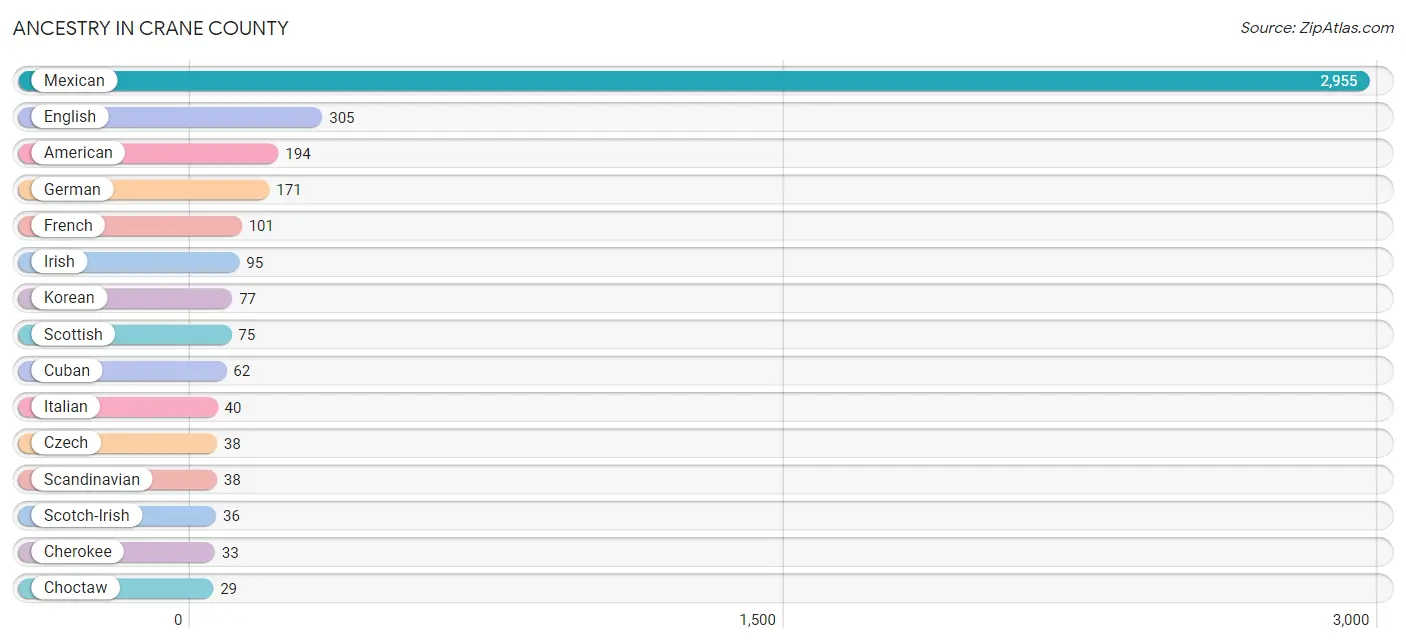
| Ancestry | # Population | % Population |
| African | 10 | 0.2% |
| Alaska Native | 1 | 0.0% |
| American | 194 | 4.2% |
| Arab | 11 | 0.2% |
| British | 10 | 0.2% |
| Cherokee | 33 | 0.7% |
| Choctaw | 29 | 0.6% |
| Comanche | 26 | 0.6% |
| Cuban | 62 | 1.3% |
| Czech | 38 | 0.8% |
| Danish | 13 | 0.3% |
| Dutch | 24 | 0.5% |
| English | 305 | 6.6% |
| European | 22 | 0.5% |
| French | 101 | 2.2% |
| German | 171 | 3.7% |
| Guamanian / Chamorro | 19 | 0.4% |
| Indonesian | 28 | 0.6% |
| Irish | 95 | 2.1% |
| Italian | 40 | 0.9% |
| Korean | 77 | 1.7% |
| Mexican | 2,955 | 63.7% |
| Moroccan | 11 | 0.2% |
| Pakistani | 4 | 0.1% |
| Portuguese | 13 | 0.3% |
| Puerto Rican | 24 | 0.5% |
| Scandinavian | 38 | 0.8% |
| Scotch-Irish | 36 | 0.8% |
| Scottish | 75 | 1.6% |
| Sri Lankan | 5 | 0.1% |
| Subsaharan African | 10 | 0.2% | View All 31 Rows |
Immigrants in Crane County
The most numerous immigrant groups reported in Crane County came from Latin America (1,033 | 22.3%), Central America (971 | 20.9%), Mexico (966 | 20.8%), Asia (87 | 1.9%), and South Eastern Asia (87 | 1.9%), together accounting for 67.8% of all Crane County residents.
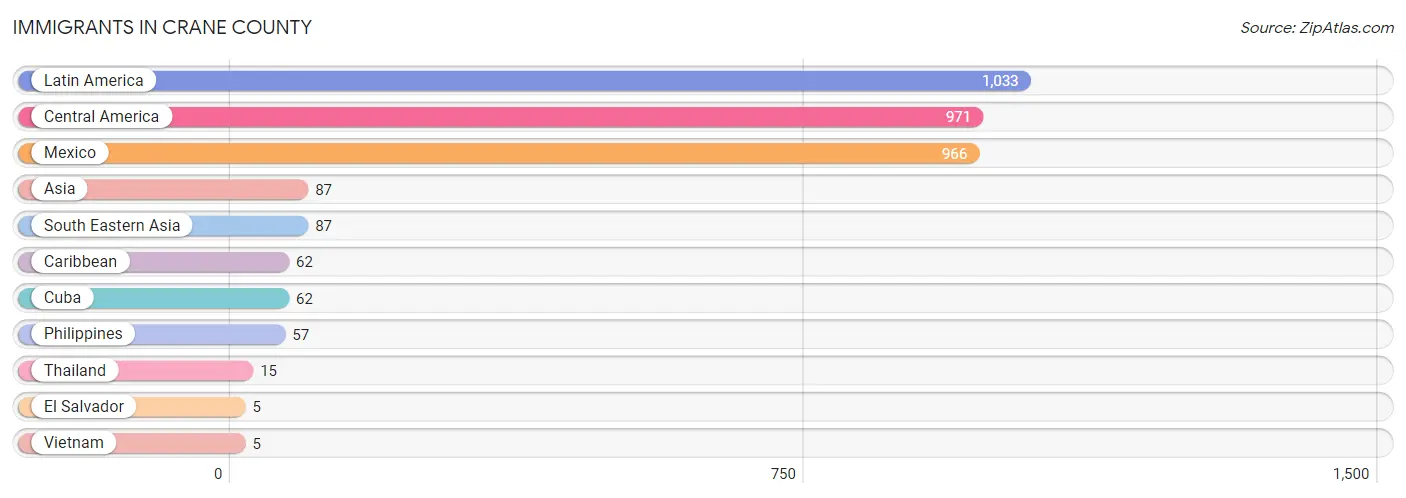
| Immigration Origin | # Population | % Population |
| Asia | 87 | 1.9% |
| Caribbean | 62 | 1.3% |
| Central America | 971 | 20.9% |
| Cuba | 62 | 1.3% |
| El Salvador | 5 | 0.1% |
| Latin America | 1,033 | 22.3% |
| Mexico | 966 | 20.8% |
| Philippines | 57 | 1.2% |
| South Eastern Asia | 87 | 1.9% |
| Thailand | 15 | 0.3% |
| Vietnam | 5 | 0.1% | View All 11 Rows |
Sex and Age in Crane County
Sex and Age in Crane County
The most populous age groups in Crane County are 50 to 54 Years (268 | 11.7%) for men and 15 to 19 Years (329 | 14.0%) for women.
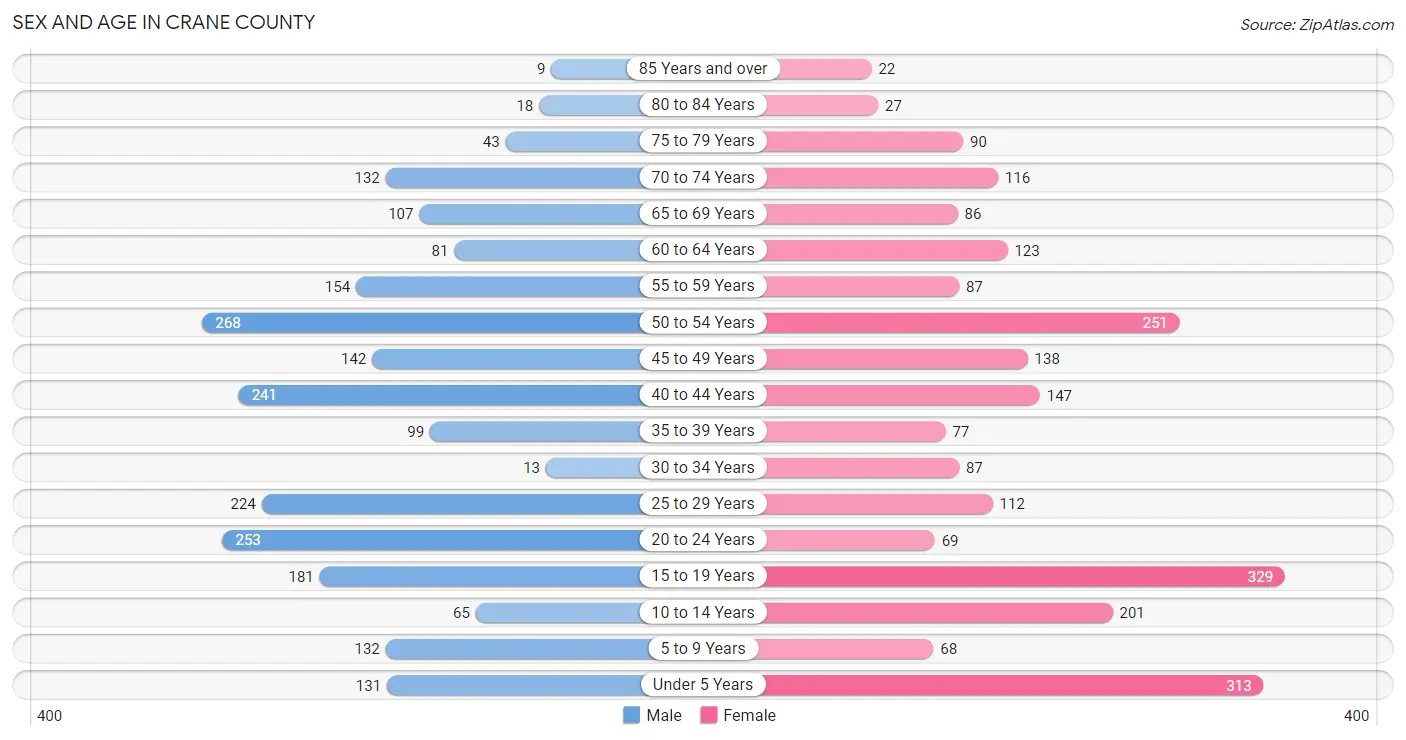
| Age Bracket | Male | Female |
| Under 5 Years | 131 (5.7%) | 313 (13.4%) |
| 5 to 9 Years | 132 (5.8%) | 68 (2.9%) |
| 10 to 14 Years | 65 (2.8%) | 201 (8.6%) |
| 15 to 19 Years | 181 (7.9%) | 329 (14.0%) |
| 20 to 24 Years | 253 (11.0%) | 69 (2.9%) |
| 25 to 29 Years | 224 (9.8%) | 112 (4.8%) |
| 30 to 34 Years | 13 (0.6%) | 87 (3.7%) |
| 35 to 39 Years | 99 (4.3%) | 77 (3.3%) |
| 40 to 44 Years | 241 (10.5%) | 147 (6.3%) |
| 45 to 49 Years | 142 (6.2%) | 138 (5.9%) |
| 50 to 54 Years | 268 (11.7%) | 251 (10.7%) |
| 55 to 59 Years | 154 (6.7%) | 87 (3.7%) |
| 60 to 64 Years | 81 (3.5%) | 123 (5.2%) |
| 65 to 69 Years | 107 (4.7%) | 86 (3.7%) |
| 70 to 74 Years | 132 (5.8%) | 116 (5.0%) |
| 75 to 79 Years | 43 (1.9%) | 90 (3.8%) |
| 80 to 84 Years | 18 (0.8%) | 27 (1.1%) |
| 85 Years and over | 9 (0.4%) | 22 (0.9%) |
| Total | 2,293 (100.0%) | 2,343 (100.0%) |
Families and Households in Crane County
Median Family Size in Crane County
The median family size in Crane County is 3.40 persons per family, with single female/mother families (119 | 10.4%) accounting for the largest median family size of 4.52 persons per family. On the other hand, single male/father families (44 | 3.9%) represent the smallest median family size with 2.11 persons per family.
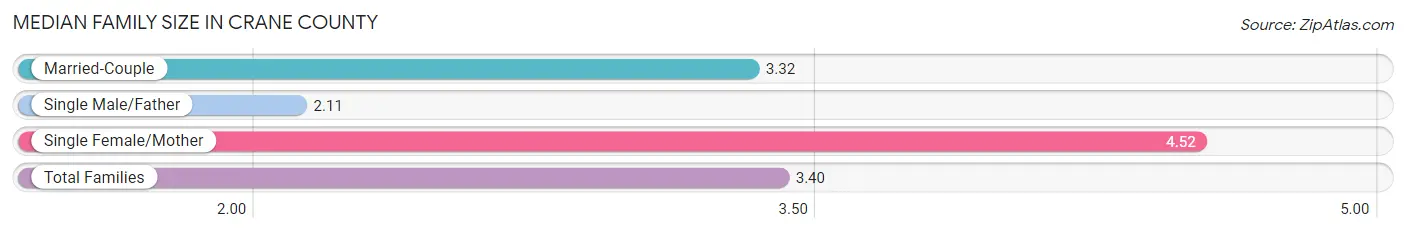
| Family Type | # Families | Family Size |
| Married-Couple | 976 (85.7%) | 3.32 |
| Single Male/Father | 44 (3.9%) | 2.11 |
| Single Female/Mother | 119 (10.4%) | 4.52 |
| Total Families | 1,139 (100.0%) | 3.40 |
Median Household Size in Crane County
The median household size in Crane County is 2.70 persons per household, with single female/mother households (119 | 7.1%) accounting for the largest median household size of 4.63 persons per household. non-family households (531 | 31.8%) represent the smallest median household size with 1.13 persons per household.
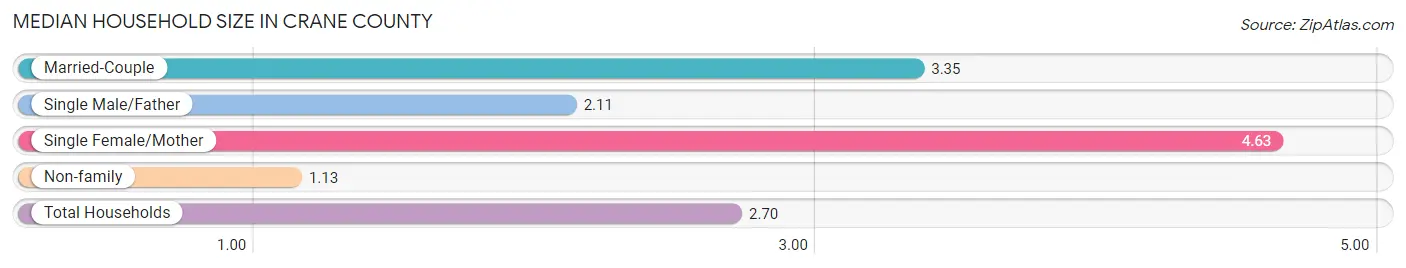
| Household Type | # Households | Household Size |
| Married-Couple | 976 (58.4%) | 3.35 |
| Single Male/Father | 44 (2.6%) | 2.11 |
| Single Female/Mother | 119 (7.1%) | 4.63 |
| Non-family | 531 (31.8%) | 1.13 |
| Total Households | 1,670 (100.0%) | 2.70 |
Household Size by Marriage Status in Crane County
Out of a total of 1,670 households in Crane County, 1,139 (68.2%) are family households, while 531 (31.8%) are nonfamily households. The most numerous type of family households are 2-person households, comprising 555, and the most common type of nonfamily households are 1-person households, comprising 465.
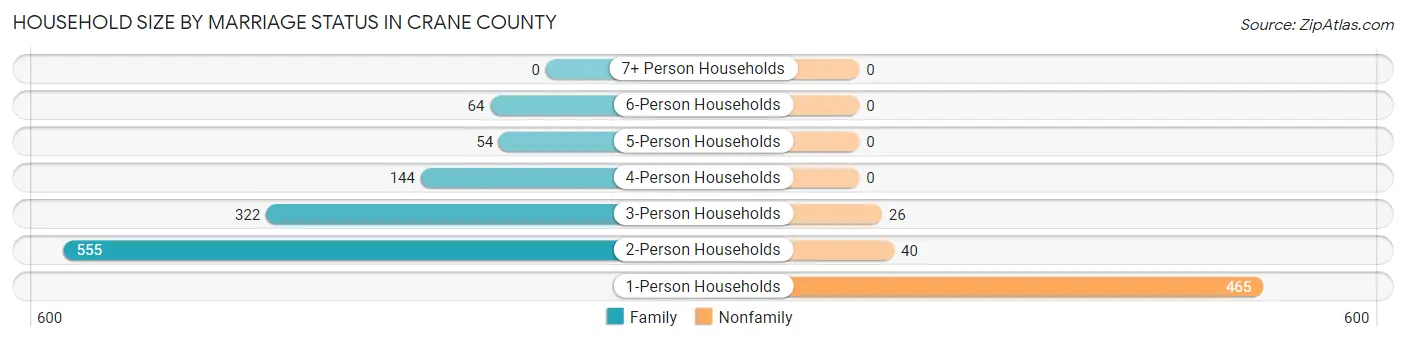
| Household Size | Family Households | Nonfamily Households |
| 1-Person Households | - | 465 (27.8%) |
| 2-Person Households | 555 (33.2%) | 40 (2.4%) |
| 3-Person Households | 322 (19.3%) | 26 (1.6%) |
| 4-Person Households | 144 (8.6%) | 0 (0.0%) |
| 5-Person Households | 54 (3.2%) | 0 (0.0%) |
| 6-Person Households | 64 (3.8%) | 0 (0.0%) |
| 7+ Person Households | 0 (0.0%) | 0 (0.0%) |
| Total | 1,139 (68.2%) | 531 (31.8%) |
Female Fertility in Crane County
Fertility by Age in Crane County
Average fertility rate in Crane County is 56.0 births per 1,000 women. Women in the age bracket of 15 to 19 years have the highest fertility rate with 140.0 births per 1,000 women. Women in the age bracket of 15 to 19 years acount for 80.7% of all women with births.
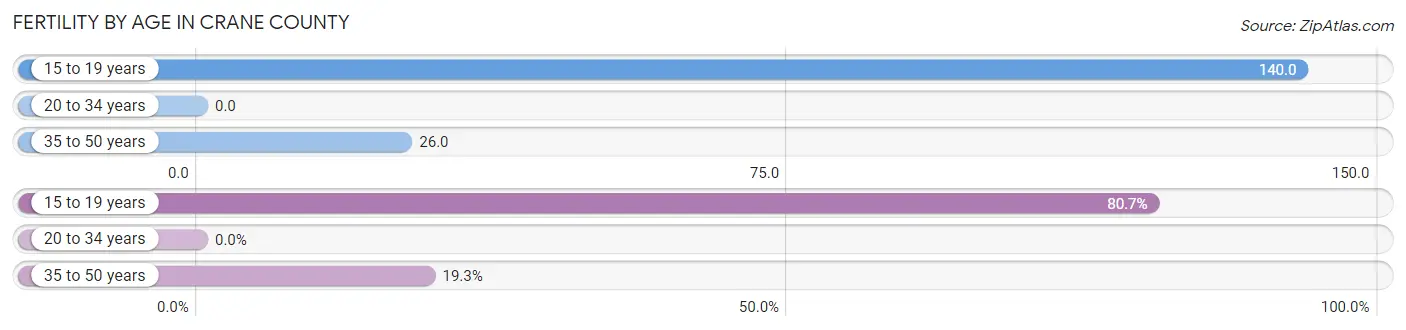
| Age Bracket | Women with Births | Births / 1,000 Women |
| 15 to 19 years | 46 (80.7%) | 140.0 |
| 20 to 34 years | 0 (0.0%) | 0.0 |
| 35 to 50 years | 11 (19.3%) | 26.0 |
| Total | 57 (100.0%) | 56.0 |
Fertility by Age by Marriage Status in Crane County
80.7% of women with births (57) in Crane County are married. The highest percentage of unmarried women with births falls into 35 to 50 years age bracket with 100.0% of them unmarried at the time of birth, while the lowest percentage of unmarried women with births belong to 15 to 19 years age bracket with 0.0% of them unmarried.
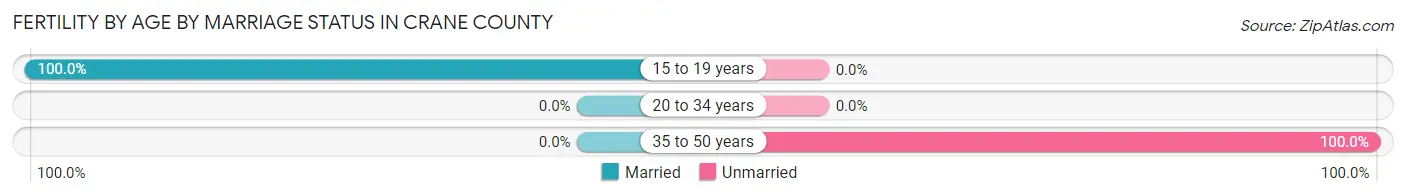
| Age Bracket | Married | Unmarried |
| 15 to 19 years | 46 (100.0%) | 0 (0.0%) |
| 20 to 34 years | 0 (0.0%) | 0 (0.0%) |
| 35 to 50 years | 0 (0.0%) | 11 (100.0%) |
| Total | 46 (80.7%) | 11 (19.3%) |
Fertility by Education in Crane County
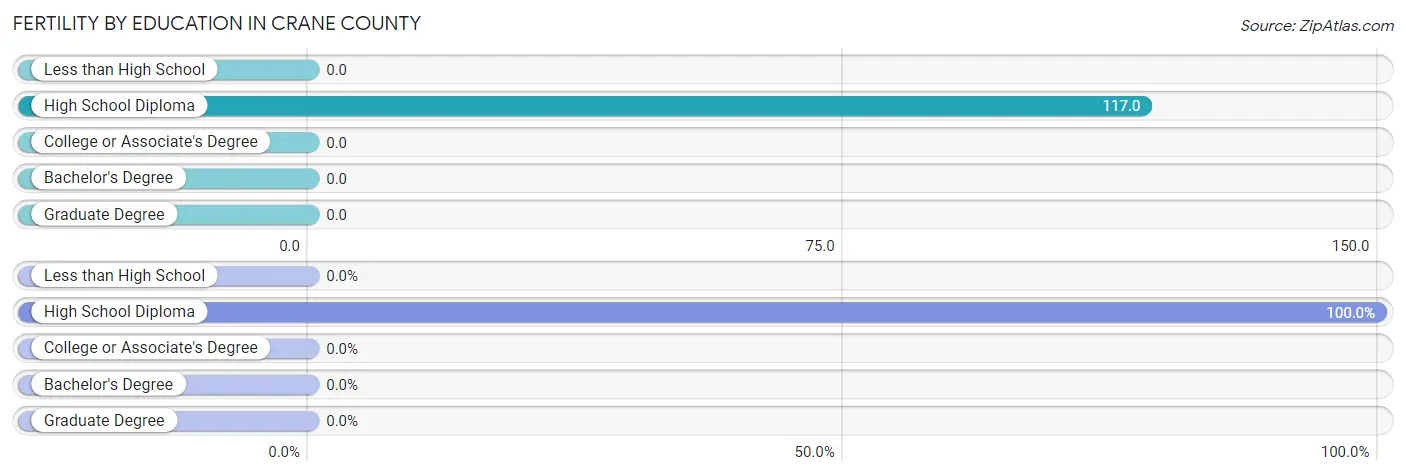
| Educational Attainment | Women with Births | Births / 1,000 Women |
| Less than High School | 0 (0.0%) | 0.0 |
| High School Diploma | 57 (100.0%) | 117.0 |
| College or Associate's Degree | 0 (0.0%) | 0.0 |
| Bachelor's Degree | 0 (0.0%) | 0.0 |
| Graduate Degree | 0 (0.0%) | 0.0 |
| Total | 57 (100.0%) | 56.0 |
Fertility by Education by Marriage Status in Crane County
19.3% of women with births in Crane County are unmarried. Women with the educational attainment of high school diploma are most likely to be married with 80.7% of them married at childbirth, while women with the educational attainment of high school diploma are least likely to be married with 19.3% of them unmarried at childbirth.
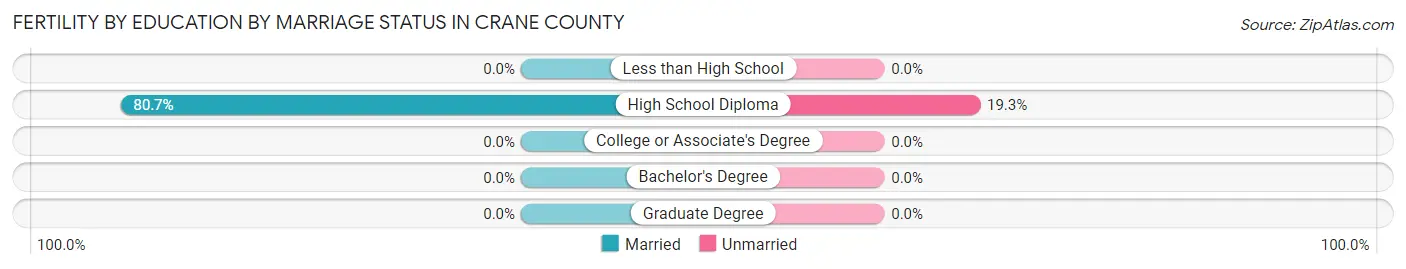
| Educational Attainment | Married | Unmarried |
| Less than High School | 0 (0.0%) | 0 (0.0%) |
| High School Diploma | 46 (80.7%) | 11 (19.3%) |
| College or Associate's Degree | 0 (0.0%) | 0 (0.0%) |
| Bachelor's Degree | 0 (0.0%) | 0 (0.0%) |
| Graduate Degree | 0 (0.0%) | 0 (0.0%) |
| Total | 46 (80.7%) | 11 (19.3%) |
Employment Characteristics in Crane County
Employment by Class of Employer in Crane County
Among the 2,237 employed individuals in Crane County, private company employees (1,453 | 64.9%), local government employees (351 | 15.7%), and self-employed (not incorporated) (131 | 5.9%) make up the most common classes of employment.
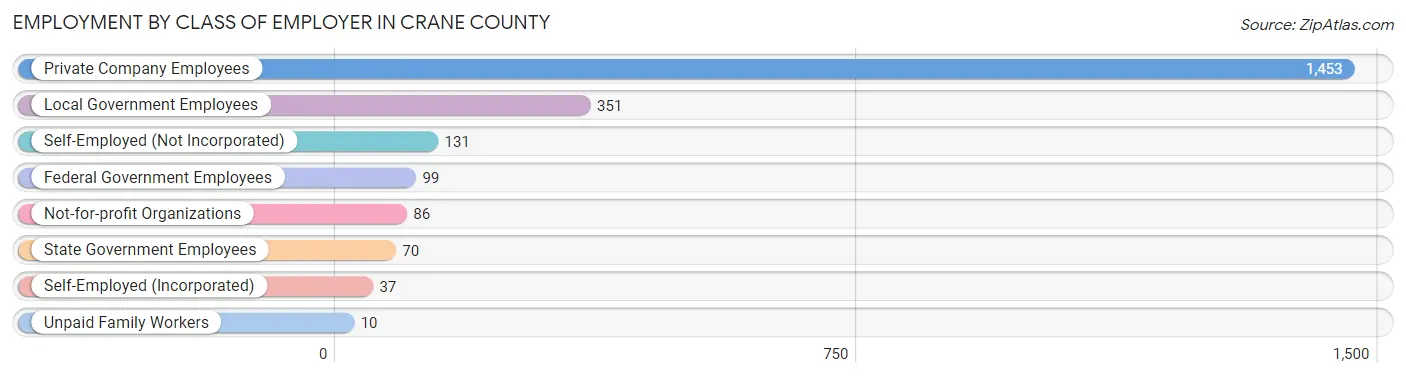
| Employer Class | # Employees | % Employees |
| Private Company Employees | 1,453 | 64.9% |
| Self-Employed (Incorporated) | 37 | 1.7% |
| Self-Employed (Not Incorporated) | 131 | 5.9% |
| Not-for-profit Organizations | 86 | 3.8% |
| Local Government Employees | 351 | 15.7% |
| State Government Employees | 70 | 3.1% |
| Federal Government Employees | 99 | 4.4% |
| Unpaid Family Workers | 10 | 0.4% |
| Total | 2,237 | 100.0% |
Employment Status by Age in Crane County
According to the labor force statistics for Crane County, out of the total population over 16 years of age (3,658), 63.2% or 2,312 individuals are in the labor force, with 3.0% or 69 of them unemployed. The age group with the highest labor force participation rate is 25 to 29 years, with 94.0% or 316 individuals in the labor force. Within the labor force, the 30 to 34 years age range has the highest percentage of unemployed individuals, with 21.6% or 19 of them being unemployed.
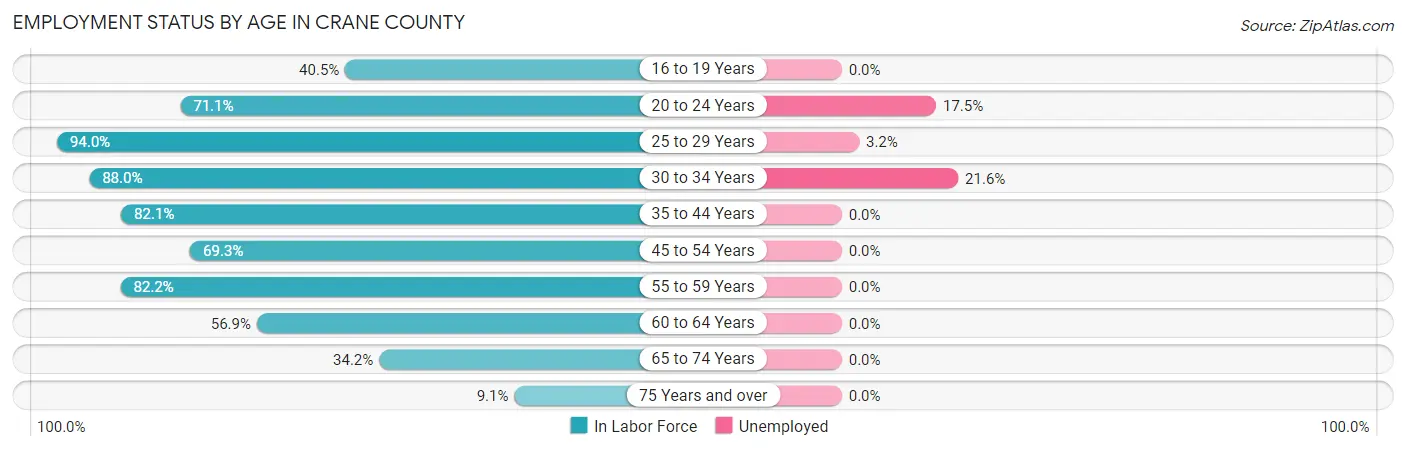
| Age Bracket | In Labor Force | Unemployed |
| 16 to 19 Years | 179 (40.5%) | 0 (0.0%) |
| 20 to 24 Years | 229 (71.1%) | 40 (17.5%) |
| 25 to 29 Years | 316 (94.0%) | 10 (3.2%) |
| 30 to 34 Years | 88 (88.0%) | 19 (21.6%) |
| 35 to 44 Years | 463 (82.1%) | 0 (0.0%) |
| 45 to 54 Years | 554 (69.3%) | 0 (0.0%) |
| 55 to 59 Years | 198 (82.2%) | 0 (0.0%) |
| 60 to 64 Years | 116 (56.9%) | 0 (0.0%) |
| 65 to 74 Years | 151 (34.2%) | 0 (0.0%) |
| 75 Years and over | 19 (9.1%) | 0 (0.0%) |
| Total | 2,312 (63.2%) | 69 (3.0%) |
Employment Status by Educational Attainment in Crane County
According to labor force statistics for Crane County, 77.3% of individuals (1,735) out of the total population between 25 and 64 years of age (2,244) are in the labor force, with 1.7% or 29 of them being unemployed. The group with the highest labor force participation rate are those with the educational attainment of bachelor's degree or higher, with 96.2% or 375 individuals in the labor force. Within the labor force, individuals with high school diploma education have the highest percentage of unemployment, with 4.2% or 29 of them being unemployed.
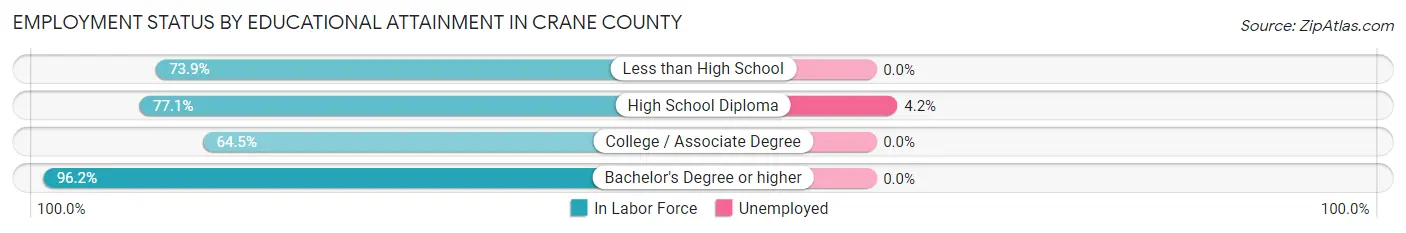
| Educational Attainment | In Labor Force | Unemployed |
| Less than High School | 411 (73.9%) | 0 (0.0%) |
| High School Diploma | 686 (77.1%) | 37 (4.2%) |
| College / Associate Degree | 263 (64.5%) | 0 (0.0%) |
| Bachelor's Degree or higher | 375 (96.2%) | 0 (0.0%) |
| Total | 1,735 (77.3%) | 38 (1.7%) |
Employment Occupations by Sex in Crane County
Management, Business, Science and Arts Occupations
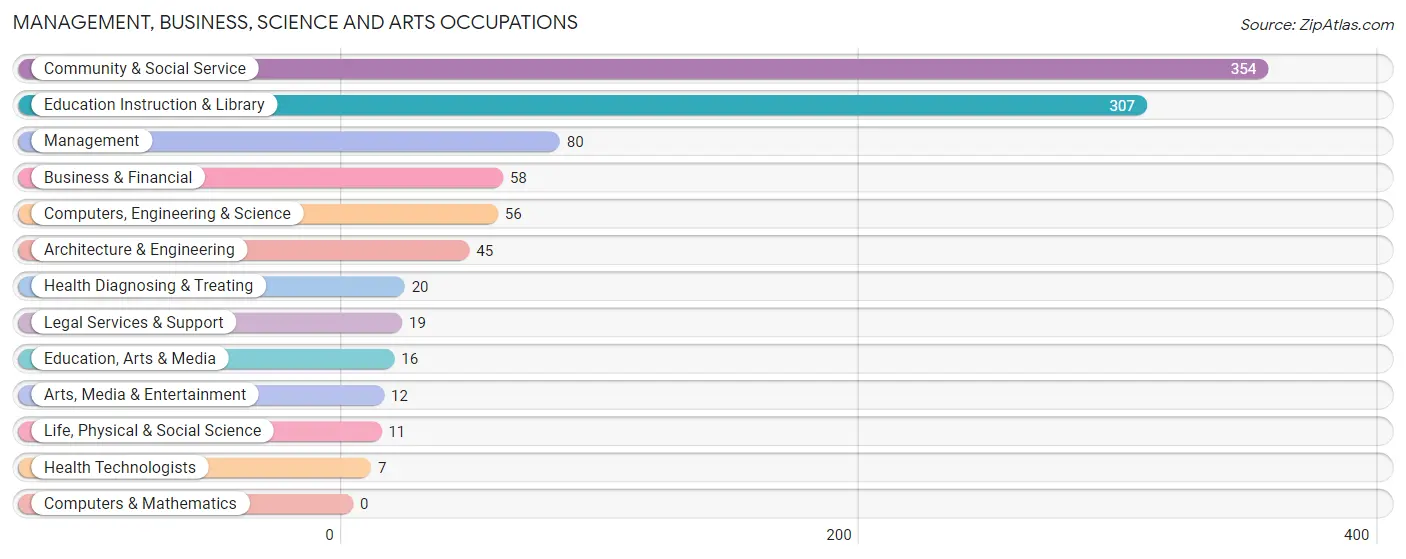
The most common Management, Business, Science and Arts occupations in Crane County are Community & Social Service (354 | 15.8%), Education Instruction & Library (307 | 13.7%), Management (80 | 3.6%), Business & Financial (58 | 2.6%), and Computers, Engineering & Science (56 | 2.5%).
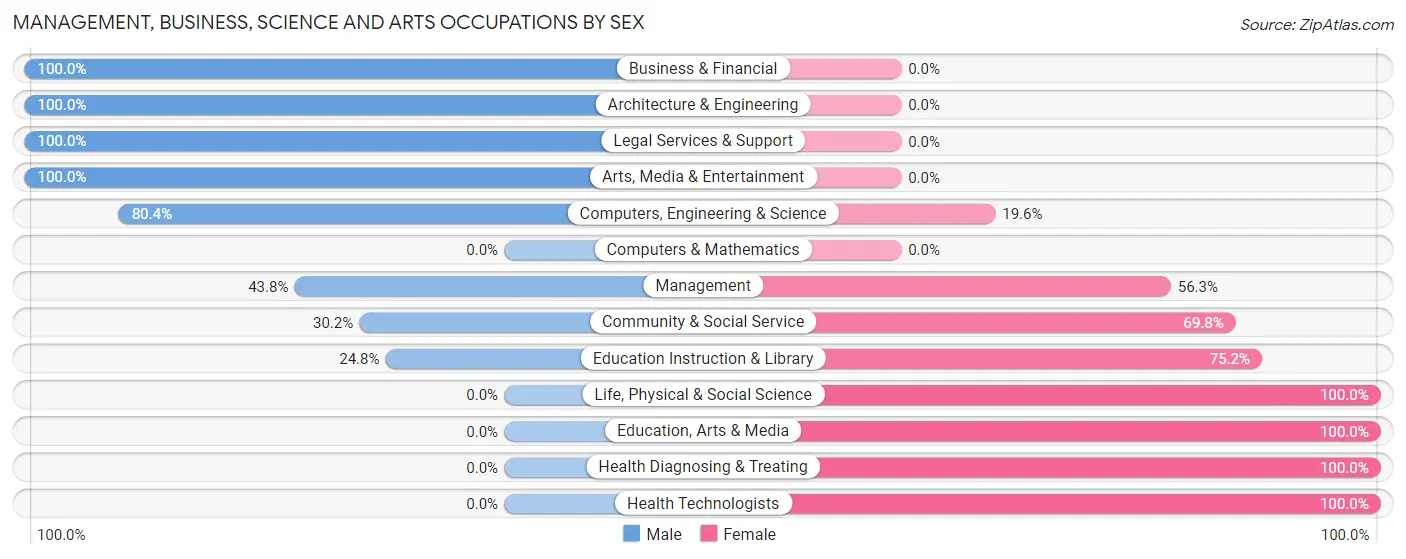
Management, Business, Science and Arts Occupations by Sex
Within the Management, Business, Science and Arts occupations in Crane County, the most male-oriented occupations are Business & Financial (100.0%), Architecture & Engineering (100.0%), and Legal Services & Support (100.0%), while the most female-oriented occupations are Life, Physical & Social Science (100.0%), Education, Arts & Media (100.0%), and Health Diagnosing & Treating (100.0%).
| Occupation | Male | Female |
| Management | 35 (43.8%) | 45 (56.2%) |
| Business & Financial | 58 (100.0%) | 0 (0.0%) |
| Computers, Engineering & Science | 45 (80.4%) | 11 (19.6%) |
| Computers & Mathematics | 0 (0.0%) | 0 (0.0%) |
| Architecture & Engineering | 45 (100.0%) | 0 (0.0%) |
| Life, Physical & Social Science | 0 (0.0%) | 11 (100.0%) |
| Community & Social Service | 107 (30.2%) | 247 (69.8%) |
| Education, Arts & Media | 0 (0.0%) | 16 (100.0%) |
| Legal Services & Support | 19 (100.0%) | 0 (0.0%) |
| Education Instruction & Library | 76 (24.8%) | 231 (75.2%) |
| Arts, Media & Entertainment | 12 (100.0%) | 0 (0.0%) |
| Health Diagnosing & Treating | 0 (0.0%) | 20 (100.0%) |
| Health Technologists | 0 (0.0%) | 7 (100.0%) |
| Total (Category) | 245 (43.1%) | 323 (56.9%) |
| Total (Overall) | 1,488 (66.3%) | 756 (33.7%) |
Services Occupations
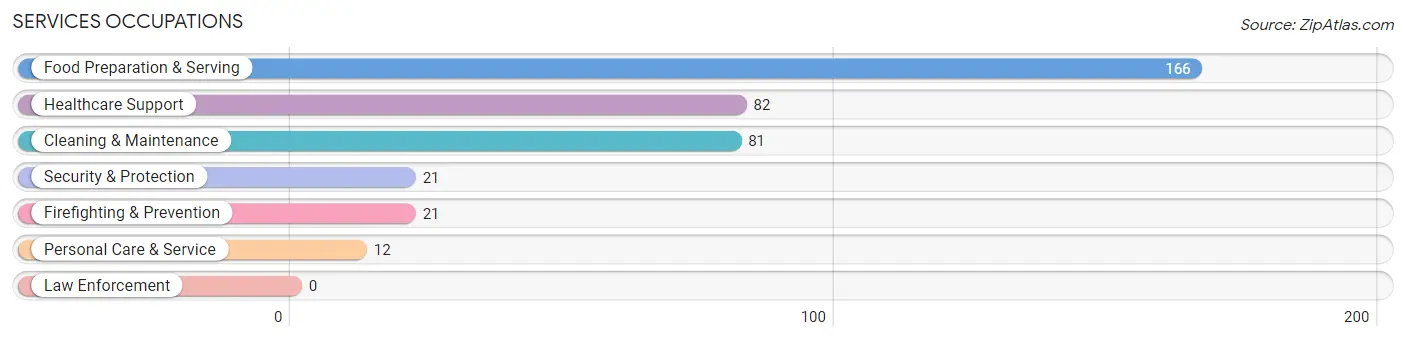
The most common Services occupations in Crane County are Food Preparation & Serving (166 | 7.4%), Healthcare Support (82 | 3.6%), Cleaning & Maintenance (81 | 3.6%), Security & Protection (21 | 0.9%), and Firefighting & Prevention (21 | 0.9%).
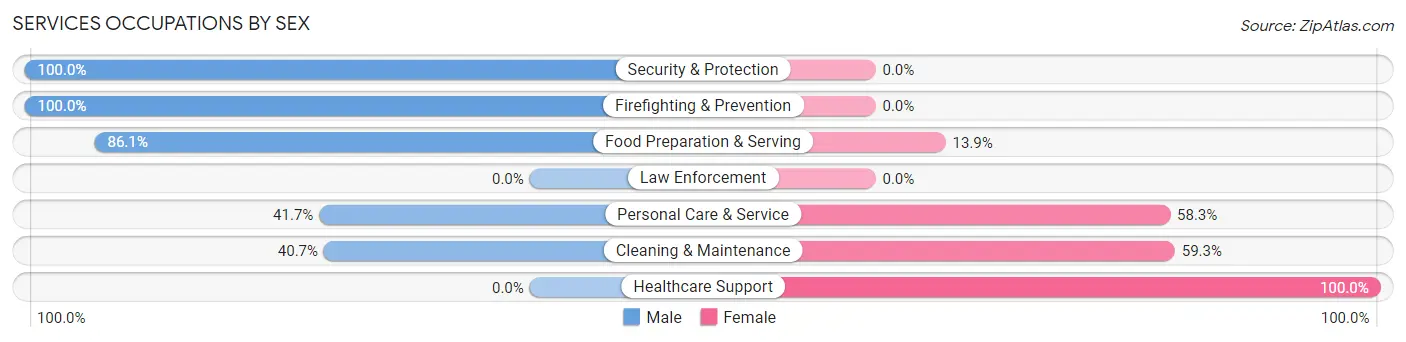
Services Occupations by Sex
Within the Services occupations in Crane County, the most male-oriented occupations are Security & Protection (100.0%), Firefighting & Prevention (100.0%), and Food Preparation & Serving (86.1%), while the most female-oriented occupations are Healthcare Support (100.0%), Cleaning & Maintenance (59.3%), and Personal Care & Service (58.3%).
| Occupation | Male | Female |
| Healthcare Support | 0 (0.0%) | 82 (100.0%) |
| Security & Protection | 21 (100.0%) | 0 (0.0%) |
| Firefighting & Prevention | 21 (100.0%) | 0 (0.0%) |
| Law Enforcement | 0 (0.0%) | 0 (0.0%) |
| Food Preparation & Serving | 143 (86.1%) | 23 (13.9%) |
| Cleaning & Maintenance | 33 (40.7%) | 48 (59.3%) |
| Personal Care & Service | 5 (41.7%) | 7 (58.3%) |
| Total (Category) | 202 (55.8%) | 160 (44.2%) |
| Total (Overall) | 1,488 (66.3%) | 756 (33.7%) |
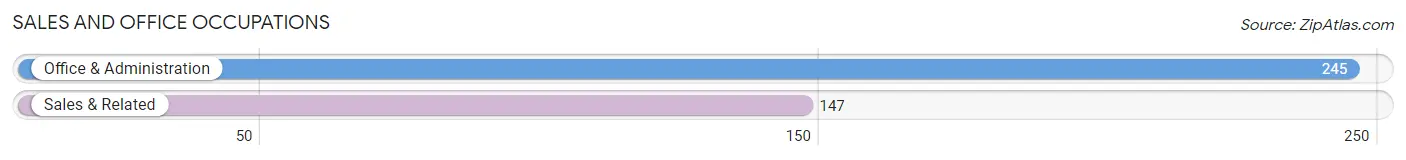
Sales and Office Occupations
The most common Sales and Office occupations in Crane County are Office & Administration (245 | 10.9%), and Sales & Related (147 | 6.6%).
Sales and Office Occupations by Sex

| Occupation | Male | Female |
| Sales & Related | 114 (77.5%) | 33 (22.5%) |
| Office & Administration | 35 (14.3%) | 210 (85.7%) |
| Total (Category) | 149 (38.0%) | 243 (62.0%) |
| Total (Overall) | 1,488 (66.3%) | 756 (33.7%) |
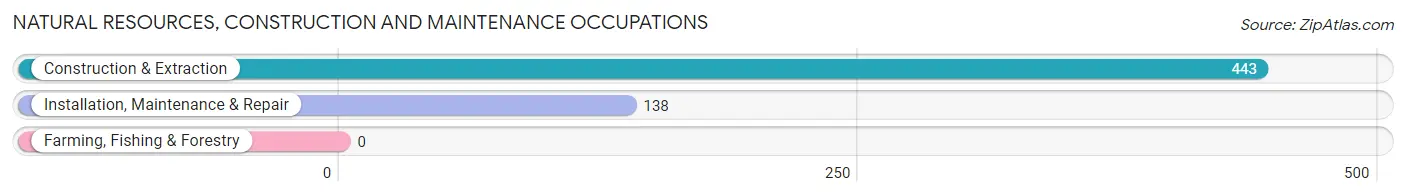
Natural Resources, Construction and Maintenance Occupations
The most common Natural Resources, Construction and Maintenance occupations in Crane County are Construction & Extraction (443 | 19.7%), and Installation, Maintenance & Repair (138 | 6.1%).
Natural Resources, Construction and Maintenance Occupations by Sex
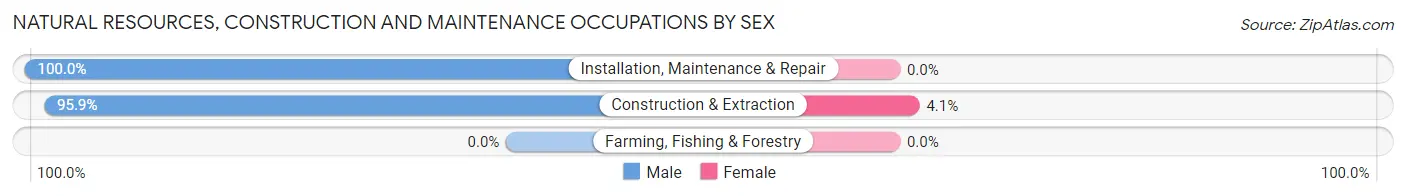
| Occupation | Male | Female |
| Farming, Fishing & Forestry | 0 (0.0%) | 0 (0.0%) |
| Construction & Extraction | 425 (95.9%) | 18 (4.1%) |
| Installation, Maintenance & Repair | 138 (100.0%) | 0 (0.0%) |
| Total (Category) | 563 (96.9%) | 18 (3.1%) |
| Total (Overall) | 1,488 (66.3%) | 756 (33.7%) |
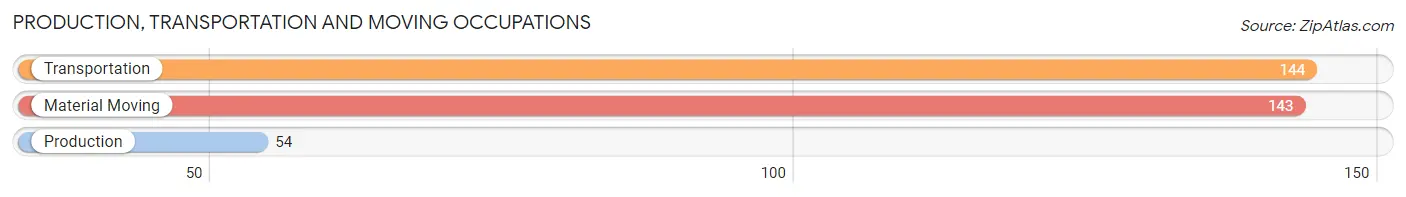
Production, Transportation and Moving Occupations
The most common Production, Transportation and Moving occupations in Crane County are Transportation (144 | 6.4%), Material Moving (143 | 6.4%), and Production (54 | 2.4%).
Production, Transportation and Moving Occupations by Sex
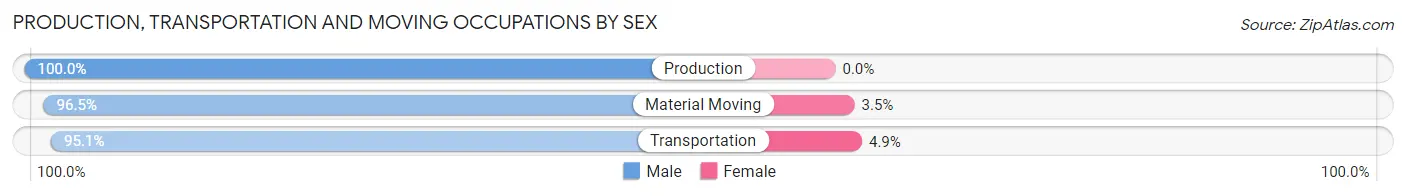
| Occupation | Male | Female |
| Production | 54 (100.0%) | 0 (0.0%) |
| Transportation | 137 (95.1%) | 7 (4.9%) |
| Material Moving | 138 (96.5%) | 5 (3.5%) |
| Total (Category) | 329 (96.5%) | 12 (3.5%) |
| Total (Overall) | 1,488 (66.3%) | 756 (33.7%) |
Employment Industries by Sex in Crane County
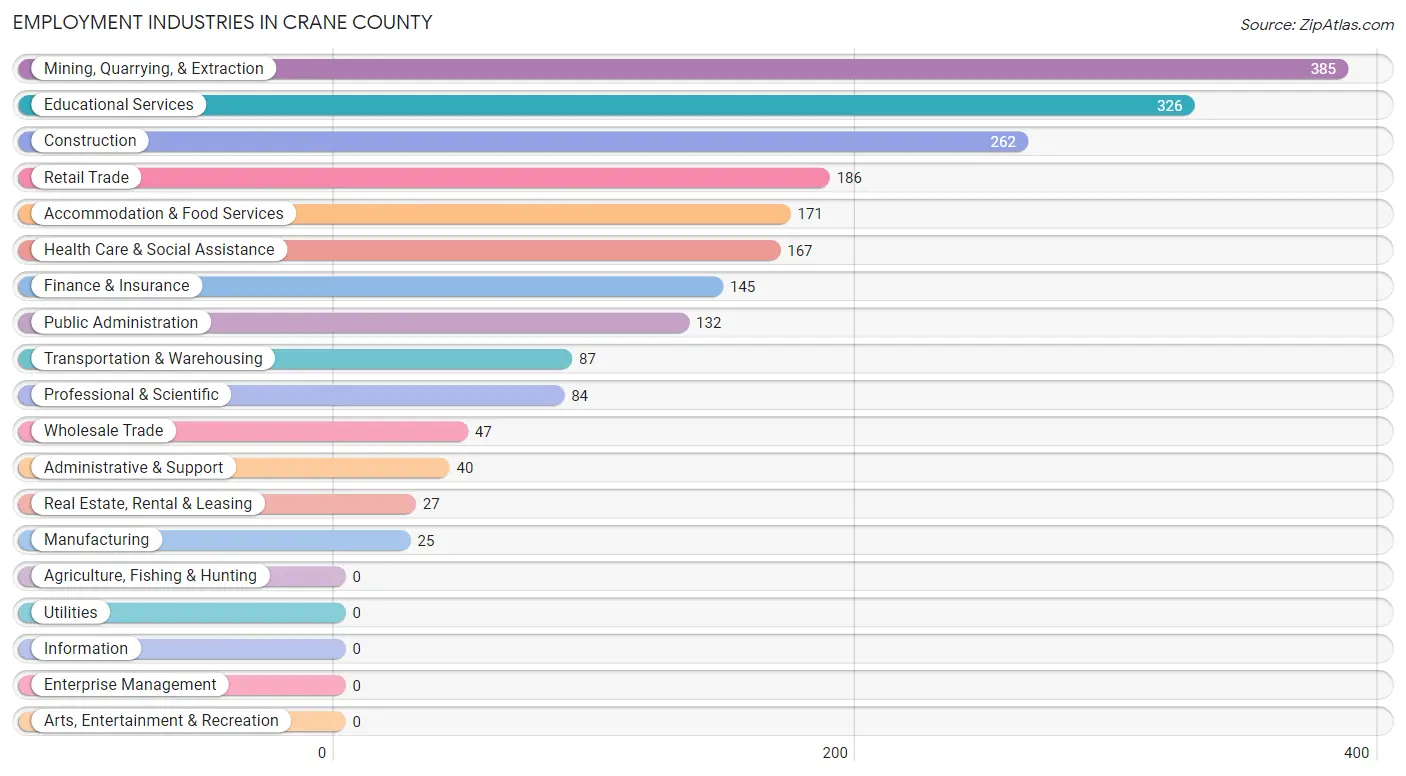
Employment Industries in Crane County
The major employment industries in Crane County include Mining, Quarrying, & Extraction (385 | 17.2%), Educational Services (326 | 14.5%), Construction (262 | 11.7%), Retail Trade (186 | 8.3%), and Accommodation & Food Services (171 | 7.6%).
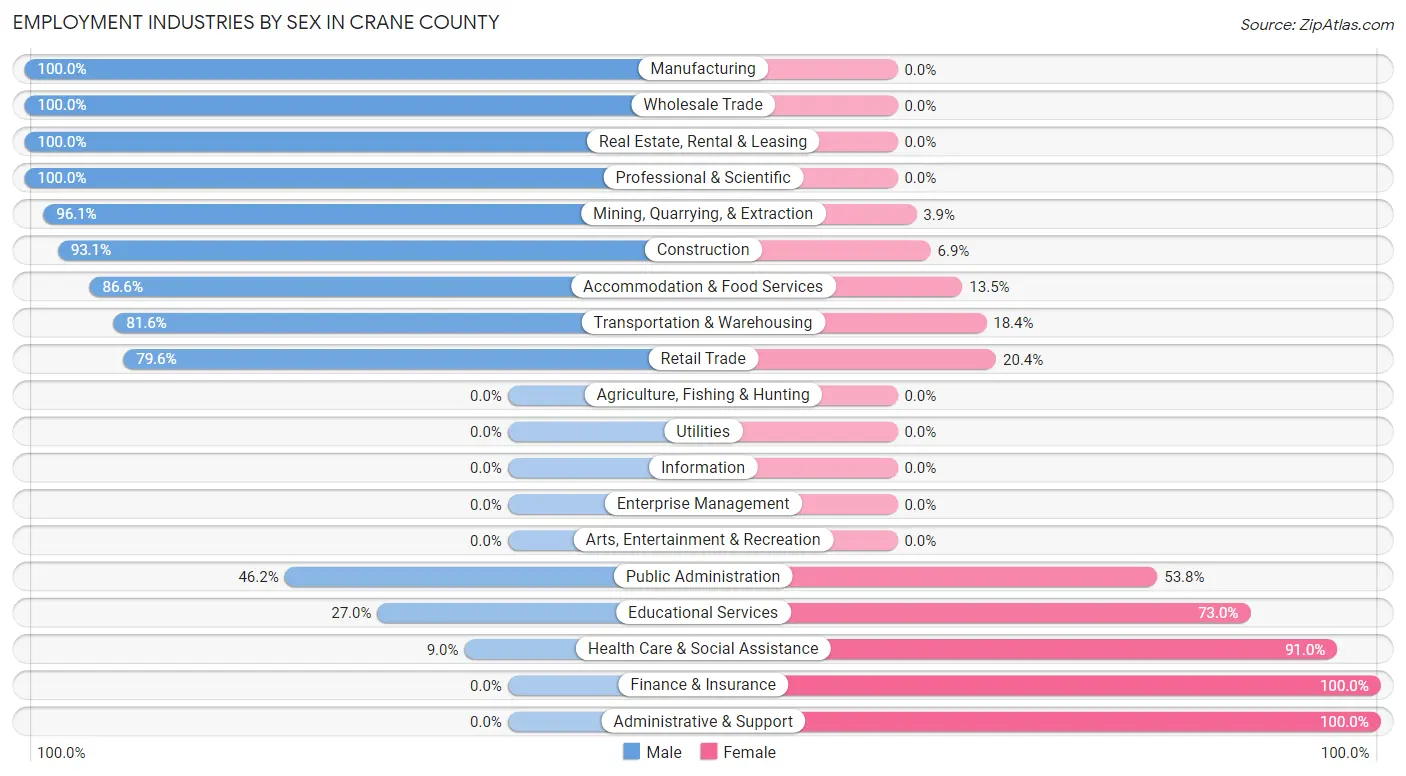
Employment Industries by Sex in Crane County
The Crane County industries that see more men than women are Manufacturing (100.0%), Wholesale Trade (100.0%), and Real Estate, Rental & Leasing (100.0%), whereas the industries that tend to have a higher number of women are Finance & Insurance (100.0%), Administrative & Support (100.0%), and Health Care & Social Assistance (91.0%).
| Industry | Male | Female |
| Agriculture, Fishing & Hunting | 0 (0.0%) | 0 (0.0%) |
| Mining, Quarrying, & Extraction | 370 (96.1%) | 15 (3.9%) |
| Construction | 244 (93.1%) | 18 (6.9%) |
| Manufacturing | 25 (100.0%) | 0 (0.0%) |
| Wholesale Trade | 47 (100.0%) | 0 (0.0%) |
| Retail Trade | 148 (79.6%) | 38 (20.4%) |
| Transportation & Warehousing | 71 (81.6%) | 16 (18.4%) |
| Utilities | 0 (0.0%) | 0 (0.0%) |
| Information | 0 (0.0%) | 0 (0.0%) |
| Finance & Insurance | 0 (0.0%) | 145 (100.0%) |
| Real Estate, Rental & Leasing | 27 (100.0%) | 0 (0.0%) |
| Professional & Scientific | 84 (100.0%) | 0 (0.0%) |
| Enterprise Management | 0 (0.0%) | 0 (0.0%) |
| Administrative & Support | 0 (0.0%) | 40 (100.0%) |
| Educational Services | 88 (27.0%) | 238 (73.0%) |
| Health Care & Social Assistance | 15 (9.0%) | 152 (91.0%) |
| Arts, Entertainment & Recreation | 0 (0.0%) | 0 (0.0%) |
| Accommodation & Food Services | 148 (86.6%) | 23 (13.5%) |
| Public Administration | 61 (46.2%) | 71 (53.8%) |
| Total | 1,488 (66.3%) | 756 (33.7%) |
Education in Crane County
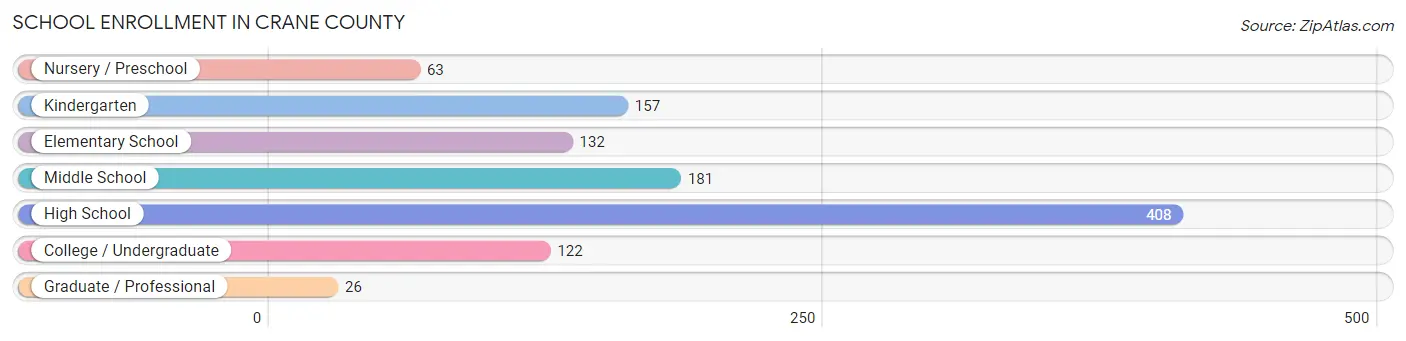
School Enrollment in Crane County
The most common levels of schooling among the 1,089 students in Crane County are high school (408 | 37.5%), middle school (181 | 16.6%), and kindergarten (157 | 14.4%).
| School Level | # Students | % Students |
| Nursery / Preschool | 63 | 5.8% |
| Kindergarten | 157 | 14.4% |
| Elementary School | 132 | 12.1% |
| Middle School | 181 | 16.6% |
| High School | 408 | 37.5% |
| College / Undergraduate | 122 | 11.2% |
| Graduate / Professional | 26 | 2.4% |
| Total | 1,089 | 100.0% |
School Enrollment by Age by Funding Source in Crane County
Out of a total of 1,089 students who are enrolled in schools in Crane County, 91 (8.4%) attend a private institution, while the remaining 998 (91.6%) are enrolled in public schools. The age group of 5 to 9 year old has the highest likelihood of being enrolled in private schools, with 58 (40.3% in the age bracket) enrolled. Conversely, the age group of 3 to 4 year olds has the lowest likelihood of being enrolled in a private school, with 179 (100.0% in the age bracket) attending a public institution.
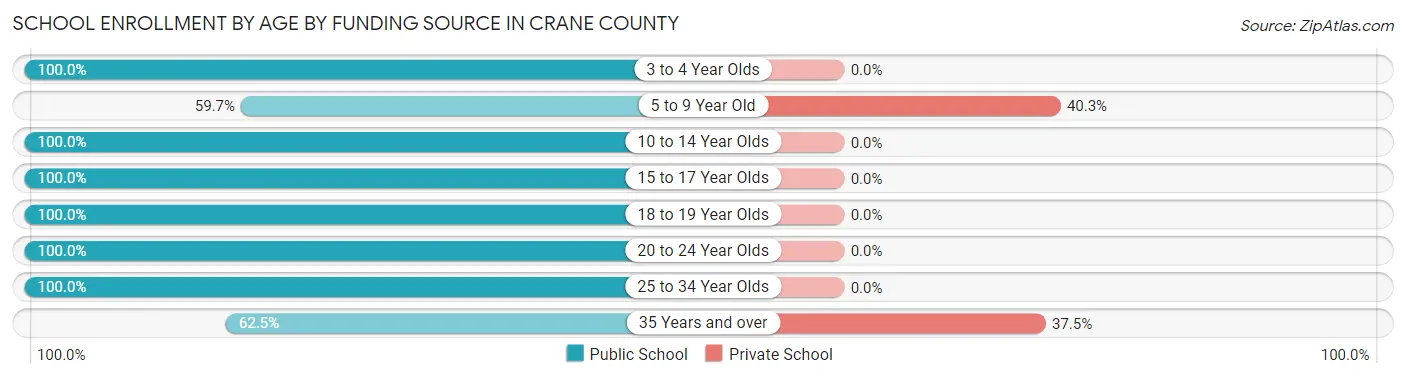
| Age Bracket | Public School | Private School |
| 3 to 4 Year Olds | 179 (100.0%) | 0 (0.0%) |
| 5 to 9 Year Old | 86 (59.7%) | 58 (40.3%) |
| 10 to 14 Year Olds | 266 (100.0%) | 0 (0.0%) |
| 15 to 17 Year Olds | 288 (100.0%) | 0 (0.0%) |
| 18 to 19 Year Olds | 19 (100.0%) | 0 (0.0%) |
| 20 to 24 Year Olds | 66 (100.0%) | 0 (0.0%) |
| 25 to 34 Year Olds | 39 (100.0%) | 0 (0.0%) |
| 35 Years and over | 55 (62.5%) | 33 (37.5%) |
| Total | 998 (91.6%) | 91 (8.4%) |
Educational Attainment by Field of Study in Crane County
Education (164 | 32.5%), arts & humanities (79 | 15.6%), bio, nature & agricultural (53 | 10.5%), science & technology (49 | 9.7%), and computers & mathematics (34 | 6.7%) are the most common fields of study among 505 individuals in Crane County who have obtained a bachelor's degree or higher.
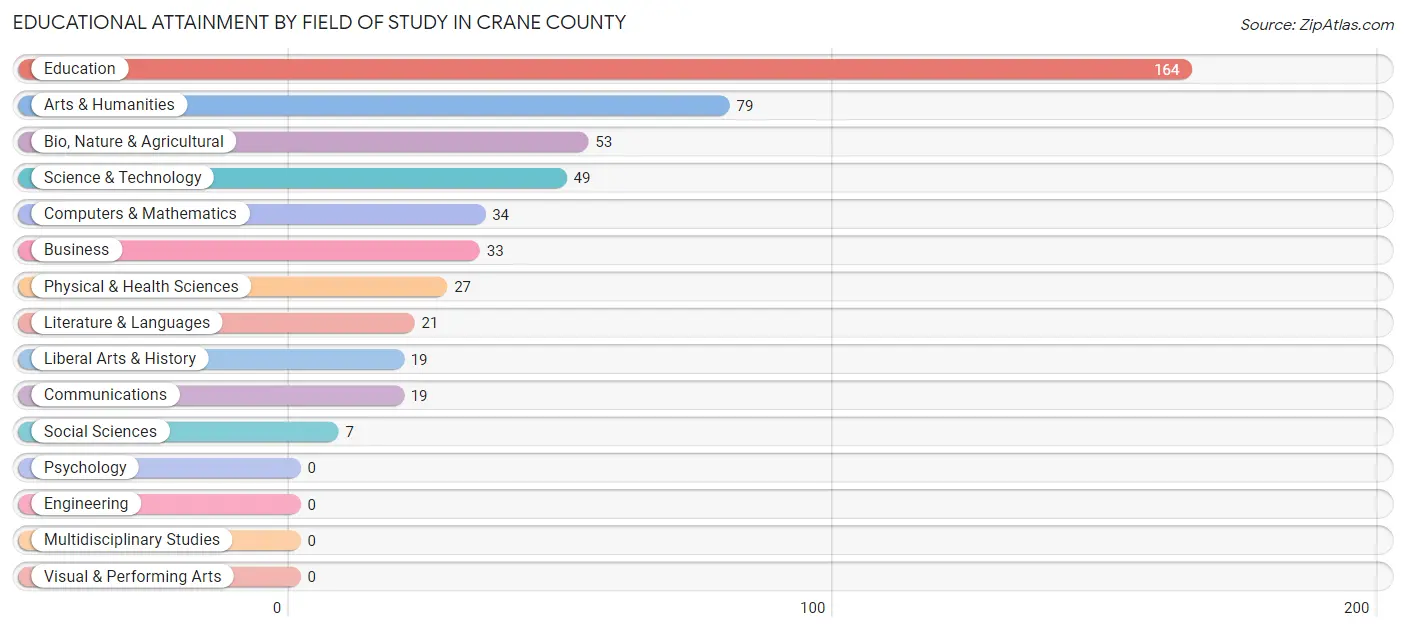
| Field of Study | # Graduates | % Graduates |
| Computers & Mathematics | 34 | 6.7% |
| Bio, Nature & Agricultural | 53 | 10.5% |
| Physical & Health Sciences | 27 | 5.3% |
| Psychology | 0 | 0.0% |
| Social Sciences | 7 | 1.4% |
| Engineering | 0 | 0.0% |
| Multidisciplinary Studies | 0 | 0.0% |
| Science & Technology | 49 | 9.7% |
| Business | 33 | 6.5% |
| Education | 164 | 32.5% |
| Literature & Languages | 21 | 4.2% |
| Liberal Arts & History | 19 | 3.8% |
| Visual & Performing Arts | 0 | 0.0% |
| Communications | 19 | 3.8% |
| Arts & Humanities | 79 | 15.6% |
| Total | 505 | 100.0% |
Transportation & Commute in Crane County
Vehicle Availability by Sex in Crane County
The most prevalent vehicle ownership categories in Crane County are males with 2 vehicles (463, accounting for 31.1%) and females with 2 vehicles (200, making up 61.8%).
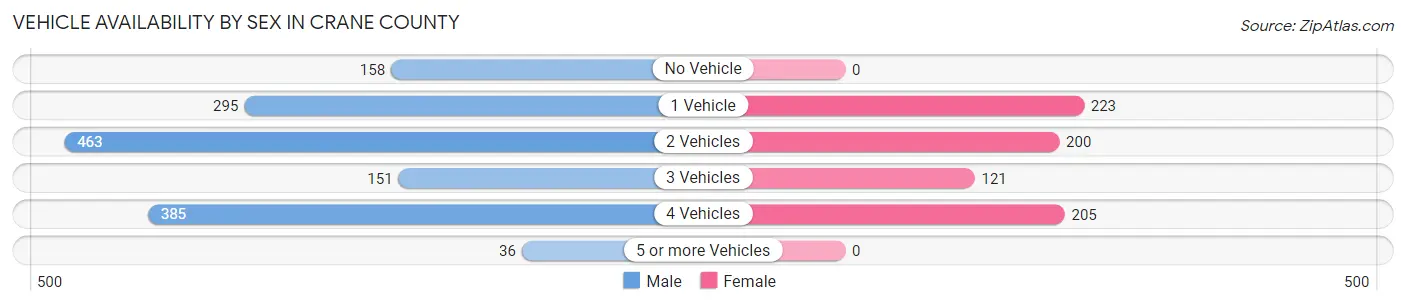
| Vehicles Available | Male | Female |
| No Vehicle | 158 (10.6%) | 0 (0.0%) |
| 1 Vehicle | 295 (19.8%) | 223 (29.8%) |
| 2 Vehicles | 463 (31.1%) | 200 (26.7%) |
| 3 Vehicles | 151 (10.2%) | 121 (16.2%) |
| 4 Vehicles | 385 (25.9%) | 205 (27.4%) |
| 5 or more Vehicles | 36 (2.4%) | 0 (0.0%) |
| Total | 1,488 (100.0%) | 749 (100.0%) |
Commute Time in Crane County
The most frequently occuring commute durations in Crane County are 5 to 9 minutes (623 commuters, 28.2%), less than 5 minutes (362 commuters, 16.4%), and 60 to 89 minutes (224 commuters, 10.1%).
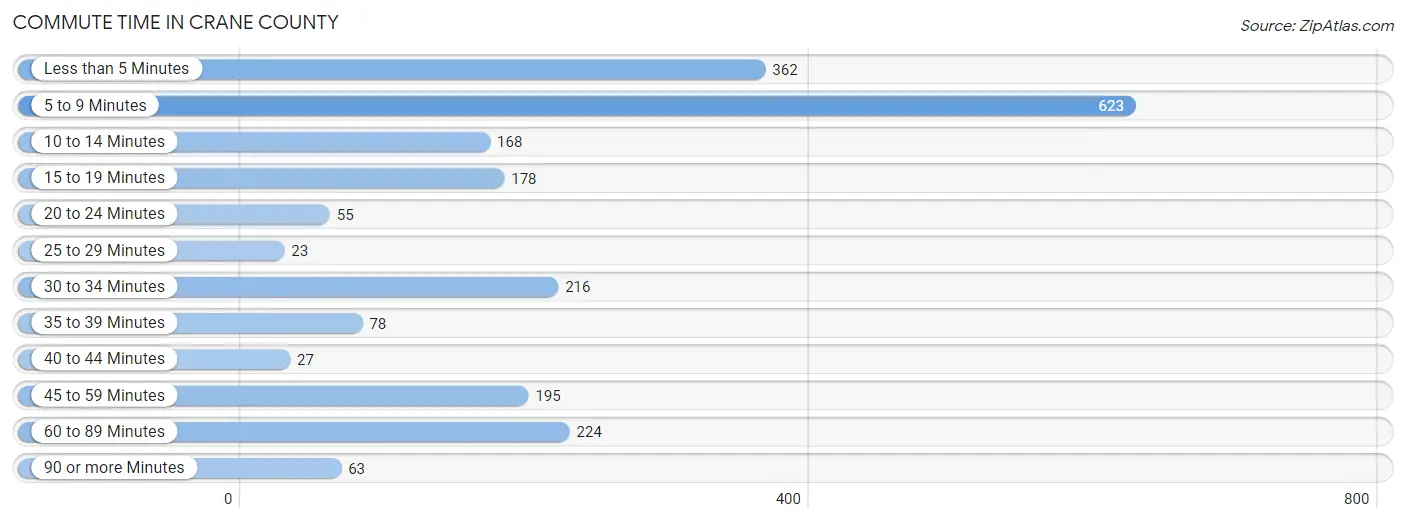
| Commute Time | # Commuters | % Commuters |
| Less than 5 Minutes | 362 | 16.4% |
| 5 to 9 Minutes | 623 | 28.2% |
| 10 to 14 Minutes | 168 | 7.6% |
| 15 to 19 Minutes | 178 | 8.1% |
| 20 to 24 Minutes | 55 | 2.5% |
| 25 to 29 Minutes | 23 | 1.0% |
| 30 to 34 Minutes | 216 | 9.8% |
| 35 to 39 Minutes | 78 | 3.5% |
| 40 to 44 Minutes | 27 | 1.2% |
| 45 to 59 Minutes | 195 | 8.8% |
| 60 to 89 Minutes | 224 | 10.1% |
| 90 or more Minutes | 63 | 2.9% |
Commute Time by Sex in Crane County
The most common commute times in Crane County are 5 to 9 minutes (326 commuters, 22.3%) for males and 5 to 9 minutes (297 commuters, 39.7%) for females.
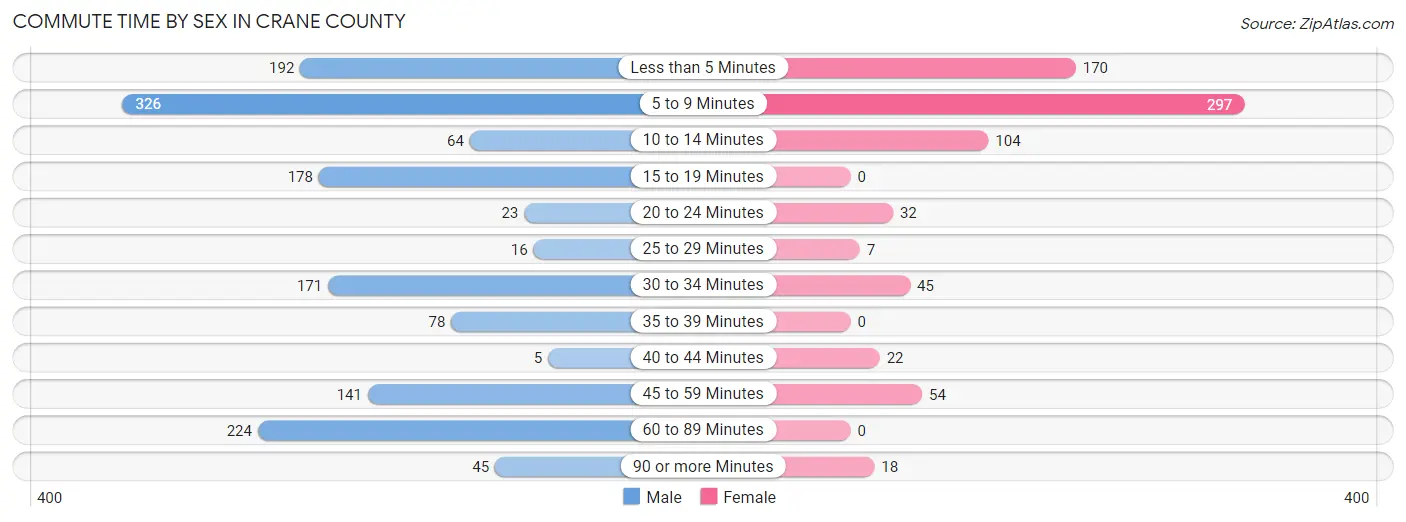
| Commute Time | Male | Female |
| Less than 5 Minutes | 192 (13.1%) | 170 (22.7%) |
| 5 to 9 Minutes | 326 (22.3%) | 297 (39.7%) |
| 10 to 14 Minutes | 64 (4.4%) | 104 (13.9%) |
| 15 to 19 Minutes | 178 (12.2%) | 0 (0.0%) |
| 20 to 24 Minutes | 23 (1.6%) | 32 (4.3%) |
| 25 to 29 Minutes | 16 (1.1%) | 7 (0.9%) |
| 30 to 34 Minutes | 171 (11.7%) | 45 (6.0%) |
| 35 to 39 Minutes | 78 (5.3%) | 0 (0.0%) |
| 40 to 44 Minutes | 5 (0.3%) | 22 (2.9%) |
| 45 to 59 Minutes | 141 (9.6%) | 54 (7.2%) |
| 60 to 89 Minutes | 224 (15.3%) | 0 (0.0%) |
| 90 or more Minutes | 45 (3.1%) | 18 (2.4%) |
Time of Departure to Work by Sex in Crane County
The most frequent times of departure to work in Crane County are 6:30 AM to 6:59 AM (296, 20.2%) for males and 7:00 AM to 7:29 AM (268, 35.8%) for females.
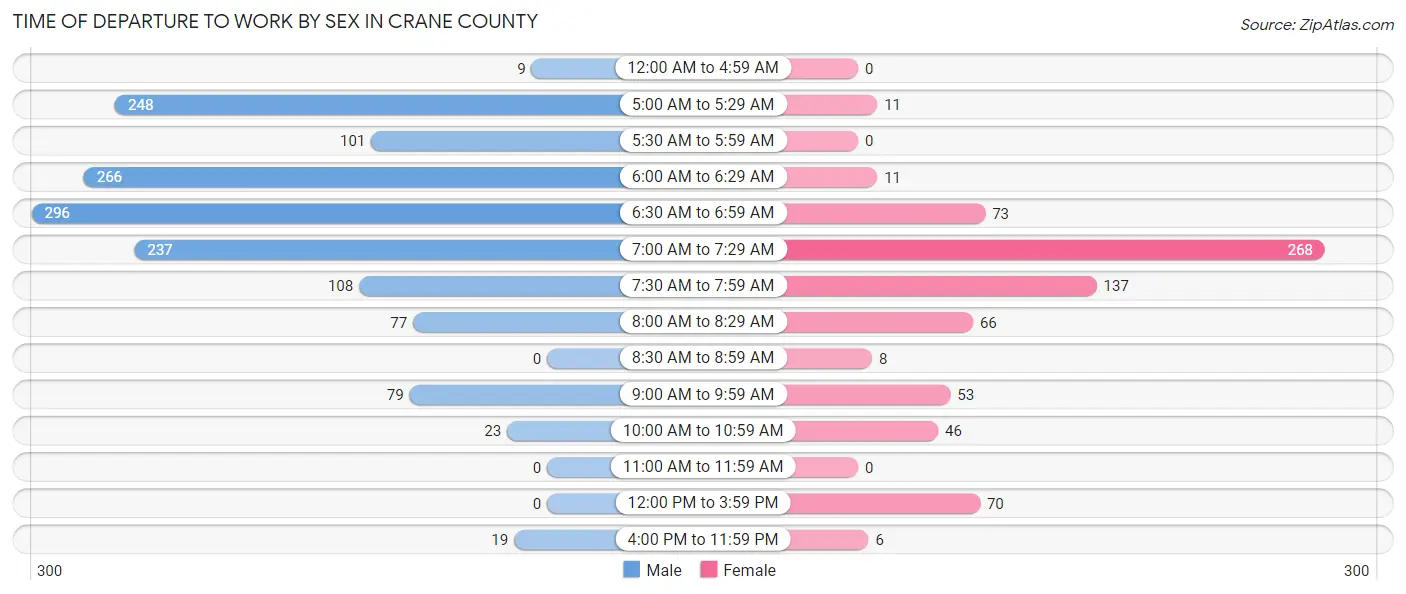
| Time of Departure | Male | Female |
| 12:00 AM to 4:59 AM | 9 (0.6%) | 0 (0.0%) |
| 5:00 AM to 5:29 AM | 248 (17.0%) | 11 (1.5%) |
| 5:30 AM to 5:59 AM | 101 (6.9%) | 0 (0.0%) |
| 6:00 AM to 6:29 AM | 266 (18.2%) | 11 (1.5%) |
| 6:30 AM to 6:59 AM | 296 (20.2%) | 73 (9.8%) |
| 7:00 AM to 7:29 AM | 237 (16.2%) | 268 (35.8%) |
| 7:30 AM to 7:59 AM | 108 (7.4%) | 137 (18.3%) |
| 8:00 AM to 8:29 AM | 77 (5.3%) | 66 (8.8%) |
| 8:30 AM to 8:59 AM | 0 (0.0%) | 8 (1.1%) |
| 9:00 AM to 9:59 AM | 79 (5.4%) | 53 (7.1%) |
| 10:00 AM to 10:59 AM | 23 (1.6%) | 46 (6.1%) |
| 11:00 AM to 11:59 AM | 0 (0.0%) | 0 (0.0%) |
| 12:00 PM to 3:59 PM | 0 (0.0%) | 70 (9.3%) |
| 4:00 PM to 11:59 PM | 19 (1.3%) | 6 (0.8%) |
| Total | 1,463 (100.0%) | 749 (100.0%) |
Housing Occupancy in Crane County
Occupancy by Ownership in Crane County
Of the total 1,670 dwellings in Crane County, owner-occupied units account for 1,427 (85.5%), while renter-occupied units make up 243 (14.5%).
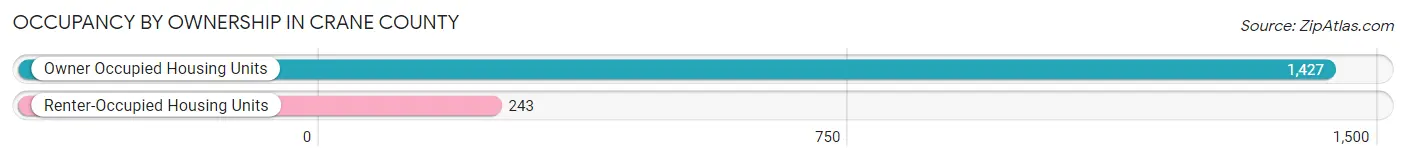
| Occupancy | # Housing Units | % Housing Units |
| Owner Occupied Housing Units | 1,427 | 85.5% |
| Renter-Occupied Housing Units | 243 | 14.5% |
| Total Occupied Housing Units | 1,670 | 100.0% |
Occupancy by Household Size in Crane County
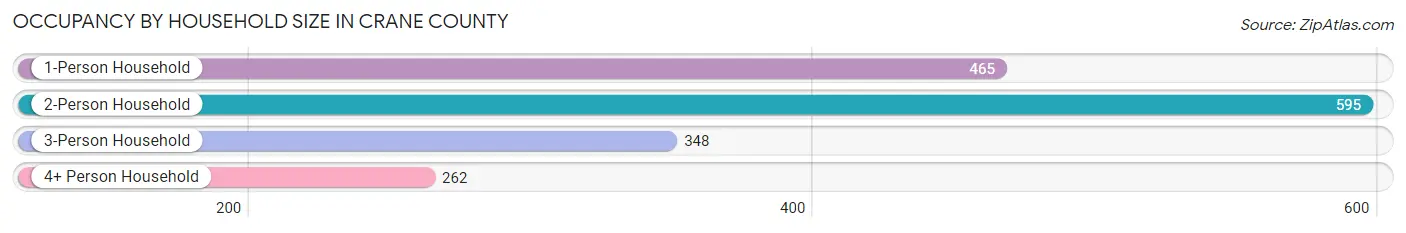
| Household Size | # Housing Units | % Housing Units |
| 1-Person Household | 465 | 27.8% |
| 2-Person Household | 595 | 35.6% |
| 3-Person Household | 348 | 20.8% |
| 4+ Person Household | 262 | 15.7% |
| Total Housing Units | 1,670 | 100.0% |
Occupancy by Ownership by Household Size in Crane County
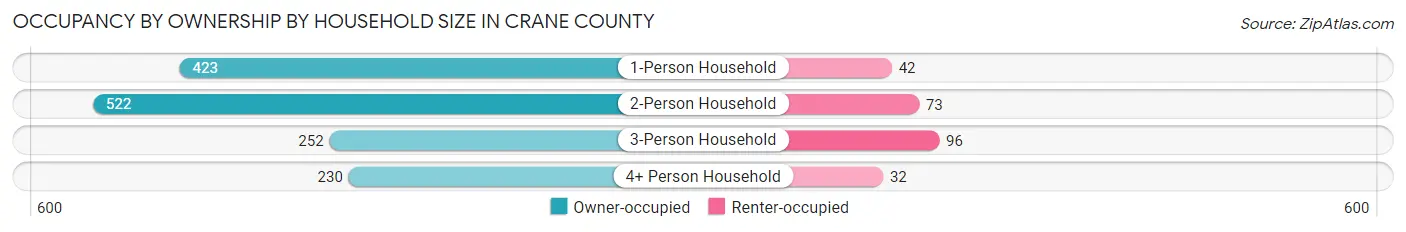
| Household Size | Owner-occupied | Renter-occupied |
| 1-Person Household | 423 (91.0%) | 42 (9.0%) |
| 2-Person Household | 522 (87.7%) | 73 (12.3%) |
| 3-Person Household | 252 (72.4%) | 96 (27.6%) |
| 4+ Person Household | 230 (87.8%) | 32 (12.2%) |
| Total Housing Units | 1,427 (85.5%) | 243 (14.5%) |
Occupancy by Educational Attainment in Crane County
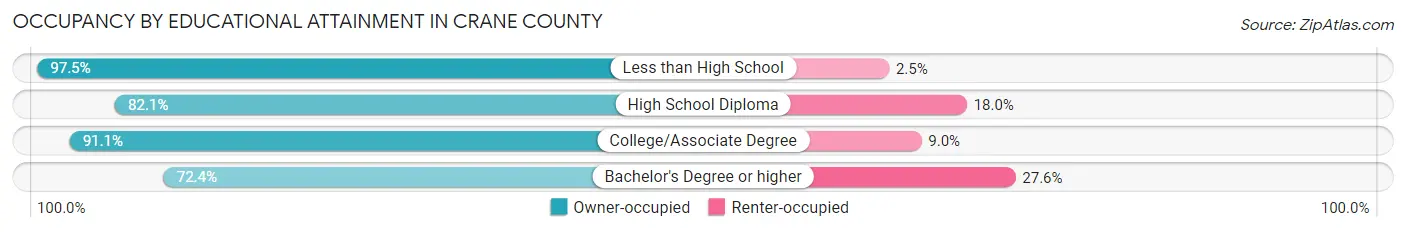
| Household Size | Owner-occupied | Renter-occupied |
| Less than High School | 345 (97.5%) | 9 (2.5%) |
| High School Diploma | 585 (82.1%) | 128 (17.9%) |
| College/Associate Degree | 295 (91.0%) | 29 (8.9%) |
| Bachelor's Degree or higher | 202 (72.4%) | 77 (27.6%) |
Occupancy by Age of Householder in Crane County
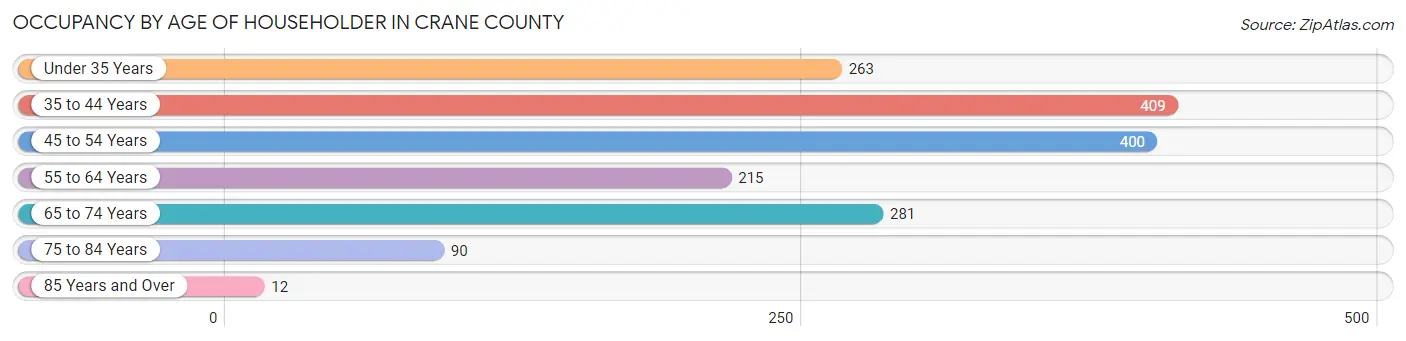
| Age Bracket | # Households | % Households |
| Under 35 Years | 263 | 15.8% |
| 35 to 44 Years | 409 | 24.5% |
| 45 to 54 Years | 400 | 23.9% |
| 55 to 64 Years | 215 | 12.9% |
| 65 to 74 Years | 281 | 16.8% |
| 75 to 84 Years | 90 | 5.4% |
| 85 Years and Over | 12 | 0.7% |
| Total | 1,670 | 100.0% |
Housing Finances in Crane County
Median Income by Occupancy in Crane County
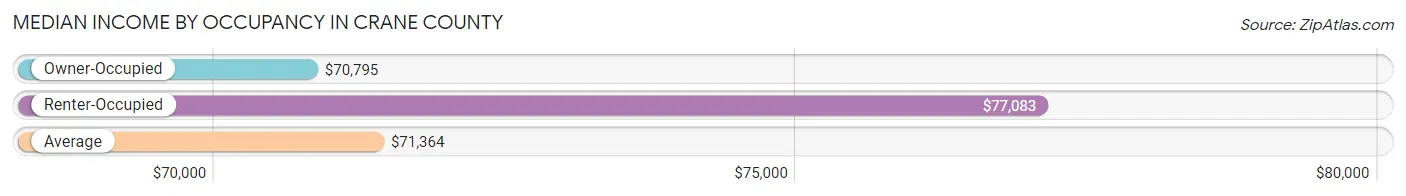
| Occupancy Type | # Households | Median Income |
| Owner-Occupied | 1,427 (85.5%) | $70,795 |
| Renter-Occupied | 243 (14.5%) | $77,083 |
| Average | 1,670 (100.0%) | $71,364 |
Occupancy by Householder Income Bracket in Crane County
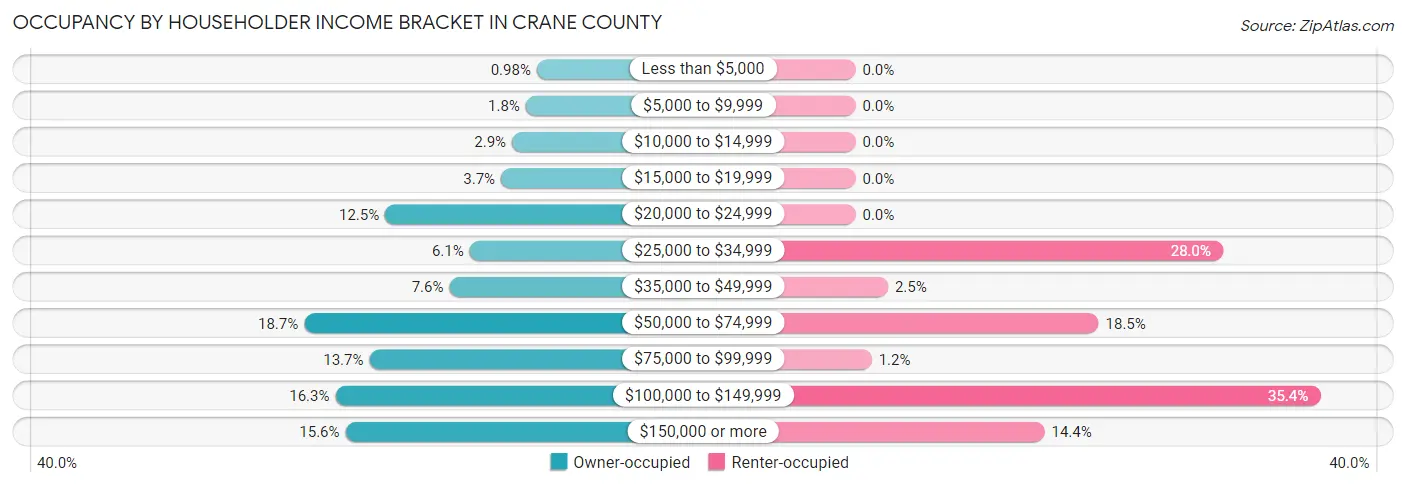
| Income Bracket | Owner-occupied | Renter-occupied |
| Less than $5,000 | 14 (1.0%) | 0 (0.0%) |
| $5,000 to $9,999 | 26 (1.8%) | 0 (0.0%) |
| $10,000 to $14,999 | 41 (2.9%) | 0 (0.0%) |
| $15,000 to $19,999 | 53 (3.7%) | 0 (0.0%) |
| $20,000 to $24,999 | 179 (12.5%) | 0 (0.0%) |
| $25,000 to $34,999 | 87 (6.1%) | 68 (28.0%) |
| $35,000 to $49,999 | 109 (7.6%) | 6 (2.5%) |
| $50,000 to $74,999 | 267 (18.7%) | 45 (18.5%) |
| $75,000 to $99,999 | 196 (13.7%) | 3 (1.2%) |
| $100,000 to $149,999 | 233 (16.3%) | 86 (35.4%) |
| $150,000 or more | 222 (15.6%) | 35 (14.4%) |
| Total | 1,427 (100.0%) | 243 (100.0%) |
Monthly Housing Cost Tiers in Crane County
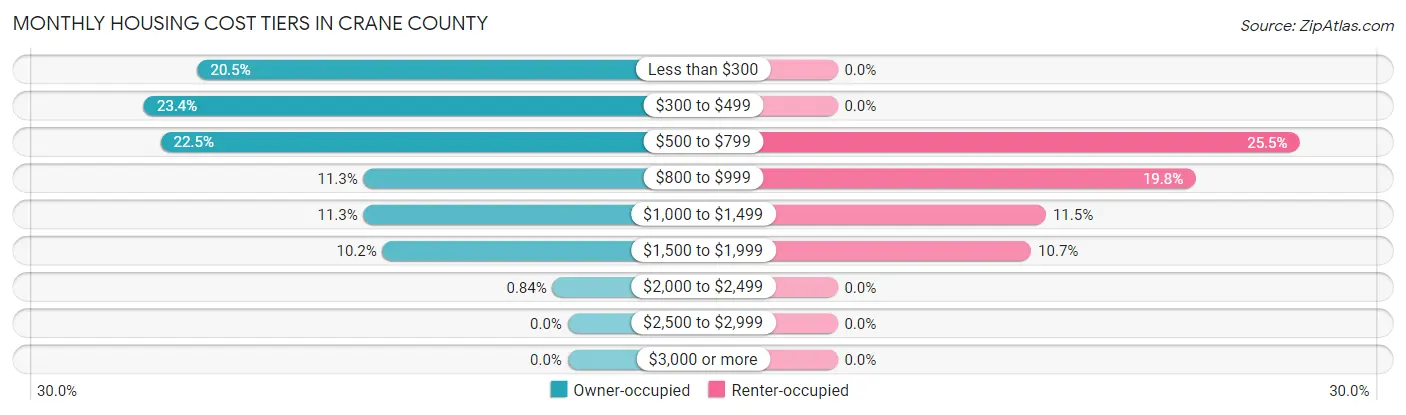
| Monthly Cost | Owner-occupied | Renter-occupied |
| Less than $300 | 292 (20.5%) | 0 (0.0%) |
| $300 to $499 | 334 (23.4%) | 0 (0.0%) |
| $500 to $799 | 321 (22.5%) | 62 (25.5%) |
| $800 to $999 | 161 (11.3%) | 48 (19.8%) |
| $1,000 to $1,499 | 161 (11.3%) | 28 (11.5%) |
| $1,500 to $1,999 | 146 (10.2%) | 26 (10.7%) |
| $2,000 to $2,499 | 12 (0.8%) | 0 (0.0%) |
| $2,500 to $2,999 | 0 (0.0%) | 0 (0.0%) |
| $3,000 or more | 0 (0.0%) | 0 (0.0%) |
| Total | 1,427 (100.0%) | 243 (100.0%) |
Physical Housing Characteristics in Crane County
Housing Structures in Crane County
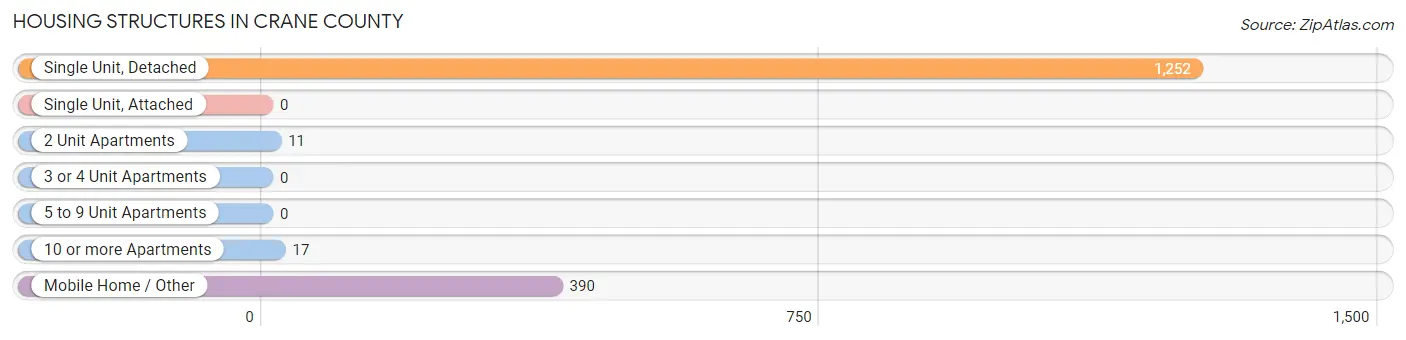
| Structure Type | # Housing Units | % Housing Units |
| Single Unit, Detached | 1,252 | 75.0% |
| Single Unit, Attached | 0 | 0.0% |
| 2 Unit Apartments | 11 | 0.7% |
| 3 or 4 Unit Apartments | 0 | 0.0% |
| 5 to 9 Unit Apartments | 0 | 0.0% |
| 10 or more Apartments | 17 | 1.0% |
| Mobile Home / Other | 390 | 23.4% |
| Total | 1,670 | 100.0% |
Housing Structures by Occupancy in Crane County
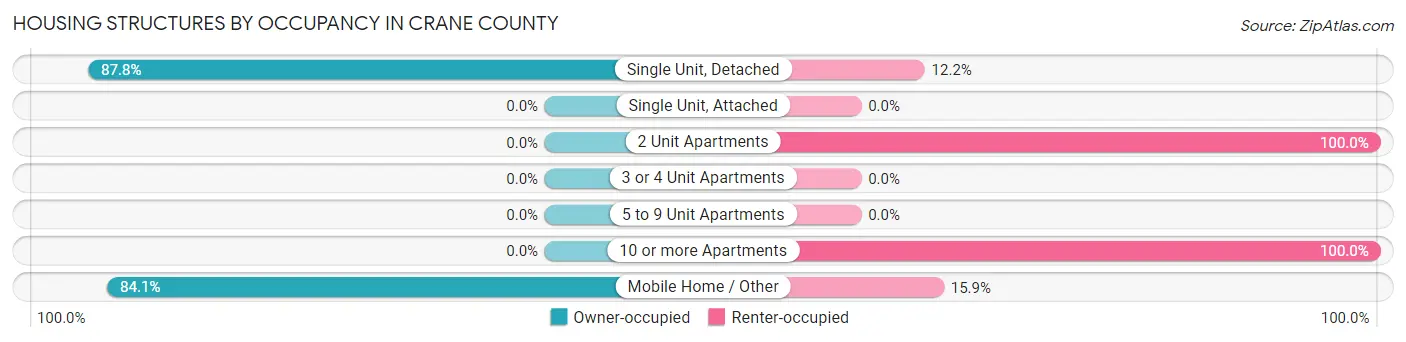
| Structure Type | Owner-occupied | Renter-occupied |
| Single Unit, Detached | 1,099 (87.8%) | 153 (12.2%) |
| Single Unit, Attached | 0 (0.0%) | 0 (0.0%) |
| 2 Unit Apartments | 0 (0.0%) | 11 (100.0%) |
| 3 or 4 Unit Apartments | 0 (0.0%) | 0 (0.0%) |
| 5 to 9 Unit Apartments | 0 (0.0%) | 0 (0.0%) |
| 10 or more Apartments | 0 (0.0%) | 17 (100.0%) |
| Mobile Home / Other | 328 (84.1%) | 62 (15.9%) |
| Total | 1,427 (85.5%) | 243 (14.5%) |
Housing Structures by Number of Rooms in Crane County
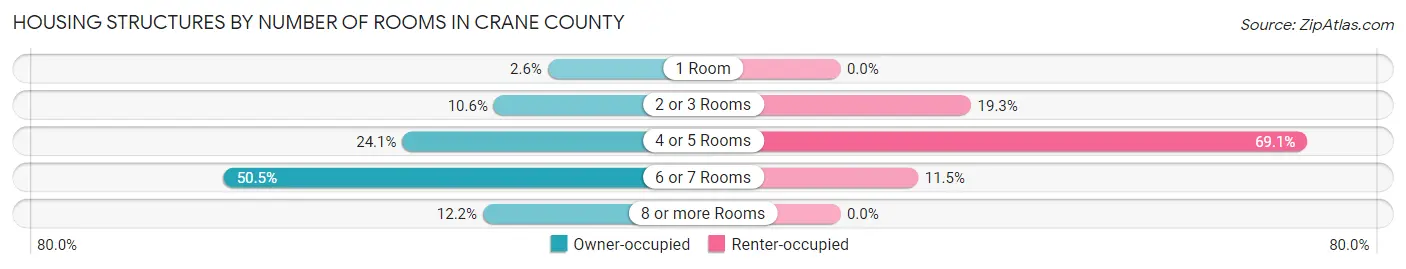
| Number of Rooms | Owner-occupied | Renter-occupied |
| 1 Room | 37 (2.6%) | 0 (0.0%) |
| 2 or 3 Rooms | 151 (10.6%) | 47 (19.3%) |
| 4 or 5 Rooms | 344 (24.1%) | 168 (69.1%) |
| 6 or 7 Rooms | 721 (50.5%) | 28 (11.5%) |
| 8 or more Rooms | 174 (12.2%) | 0 (0.0%) |
| Total | 1,427 (100.0%) | 243 (100.0%) |
Housing Structure by Heating Type in Crane County
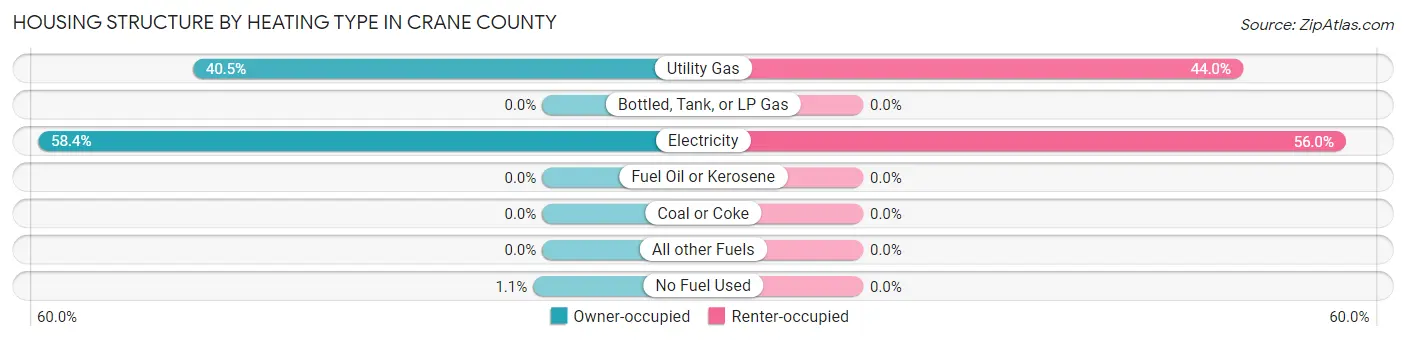
| Heating Type | Owner-occupied | Renter-occupied |
| Utility Gas | 578 (40.5%) | 107 (44.0%) |
| Bottled, Tank, or LP Gas | 0 (0.0%) | 0 (0.0%) |
| Electricity | 834 (58.4%) | 136 (56.0%) |
| Fuel Oil or Kerosene | 0 (0.0%) | 0 (0.0%) |
| Coal or Coke | 0 (0.0%) | 0 (0.0%) |
| All other Fuels | 0 (0.0%) | 0 (0.0%) |
| No Fuel Used | 15 (1.1%) | 0 (0.0%) |
| Total | 1,427 (100.0%) | 243 (100.0%) |
Household Vehicle Usage in Crane County
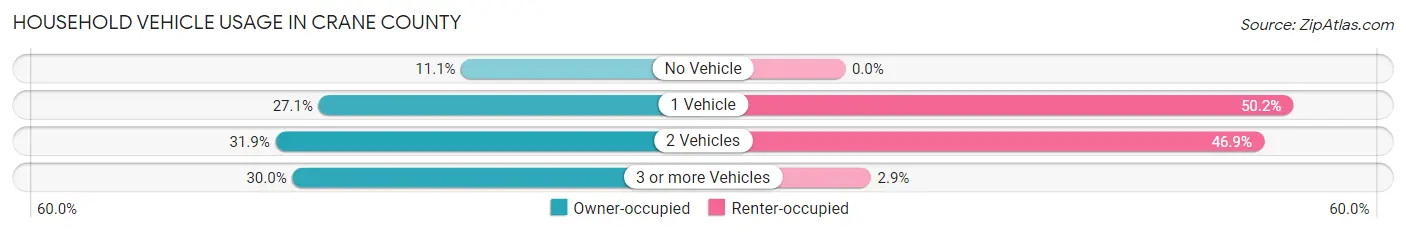
| Vehicles per Household | Owner-occupied | Renter-occupied |
| No Vehicle | 158 (11.1%) | 0 (0.0%) |
| 1 Vehicle | 386 (27.1%) | 122 (50.2%) |
| 2 Vehicles | 455 (31.9%) | 114 (46.9%) |
| 3 or more Vehicles | 428 (30.0%) | 7 (2.9%) |
| Total | 1,427 (100.0%) | 243 (100.0%) |
Real Estate & Mortgages in Crane County
Real Estate and Mortgage Overview in Crane County
| Characteristic | Without Mortgage | With Mortgage |
| Housing Units | 982 | 445 |
| Median Property Value | $98,100 | $179,300 |
| Median Household Income | $52,278 | $86 |
| Monthly Housing Costs | $429 | $0 |
| Real Estate Taxes | $1,595 | $67 |
Property Value by Mortgage Status in Crane County
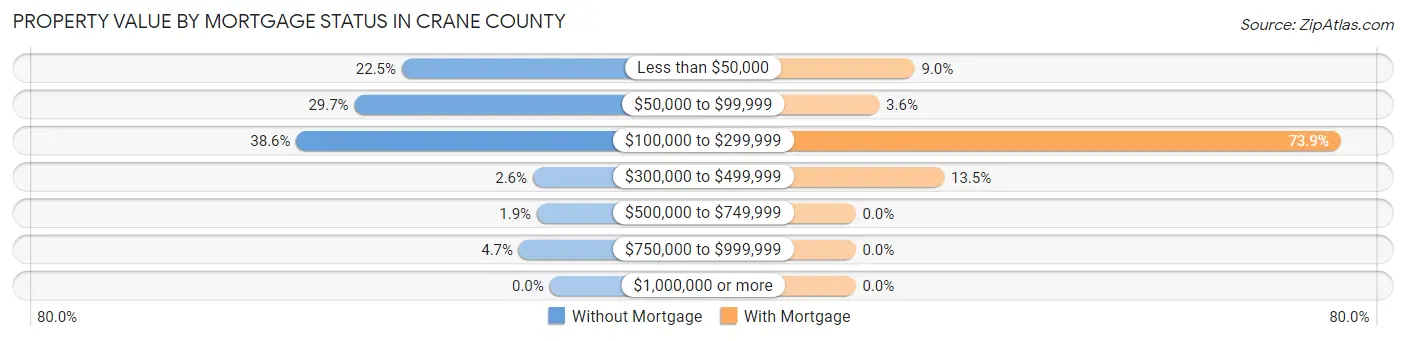
| Property Value | Without Mortgage | With Mortgage |
| Less than $50,000 | 221 (22.5%) | 40 (9.0%) |
| $50,000 to $99,999 | 292 (29.7%) | 16 (3.6%) |
| $100,000 to $299,999 | 379 (38.6%) | 329 (73.9%) |
| $300,000 to $499,999 | 25 (2.5%) | 60 (13.5%) |
| $500,000 to $749,999 | 19 (1.9%) | 0 (0.0%) |
| $750,000 to $999,999 | 46 (4.7%) | 0 (0.0%) |
| $1,000,000 or more | 0 (0.0%) | 0 (0.0%) |
| Total | 982 (100.0%) | 445 (100.0%) |
Household Income by Mortgage Status in Crane County
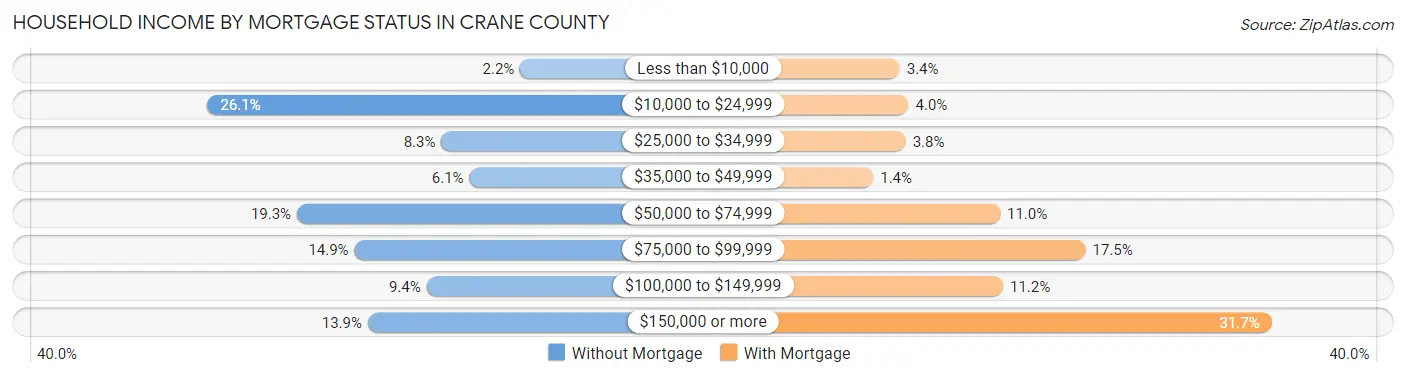
| Household Income | Without Mortgage | With Mortgage |
| Less than $10,000 | 22 (2.2%) | 15 (3.4%) |
| $10,000 to $24,999 | 256 (26.1%) | 18 (4.0%) |
| $25,000 to $34,999 | 81 (8.3%) | 17 (3.8%) |
| $35,000 to $49,999 | 60 (6.1%) | 6 (1.3%) |
| $50,000 to $74,999 | 189 (19.3%) | 49 (11.0%) |
| $75,000 to $99,999 | 146 (14.9%) | 78 (17.5%) |
| $100,000 to $149,999 | 92 (9.4%) | 50 (11.2%) |
| $150,000 or more | 136 (13.9%) | 141 (31.7%) |
| Total | 982 (100.0%) | 445 (100.0%) |
Property Value to Household Income Ratio in Crane County
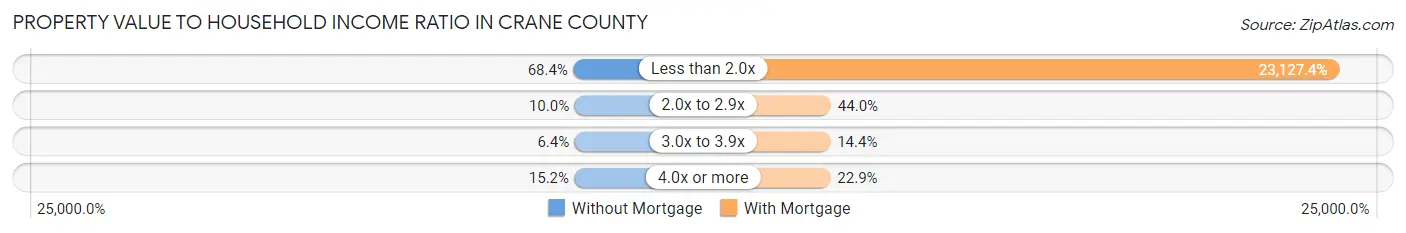
| Value-to-Income Ratio | Without Mortgage | With Mortgage |
| Less than 2.0x | 672 (68.4%) | 102,917 (23,127.4%) |
| 2.0x to 2.9x | 98 (10.0%) | 196 (44.0%) |
| 3.0x to 3.9x | 63 (6.4%) | 64 (14.4%) |
| 4.0x or more | 149 (15.2%) | 102 (22.9%) |
| Total | 982 (100.0%) | 445 (100.0%) |
Real Estate Taxes by Mortgage Status in Crane County
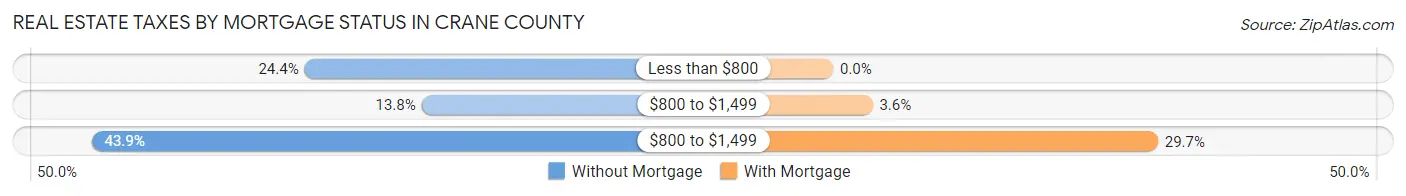
| Property Taxes | Without Mortgage | With Mortgage |
| Less than $800 | 240 (24.4%) | 0 (0.0%) |
| $800 to $1,499 | 135 (13.8%) | 16 (3.6%) |
| $800 to $1,499 | 431 (43.9%) | 132 (29.7%) |
| Total | 982 (100.0%) | 445 (100.0%) |
Health & Disability in Crane County
Health Insurance Coverage by Age in Crane County
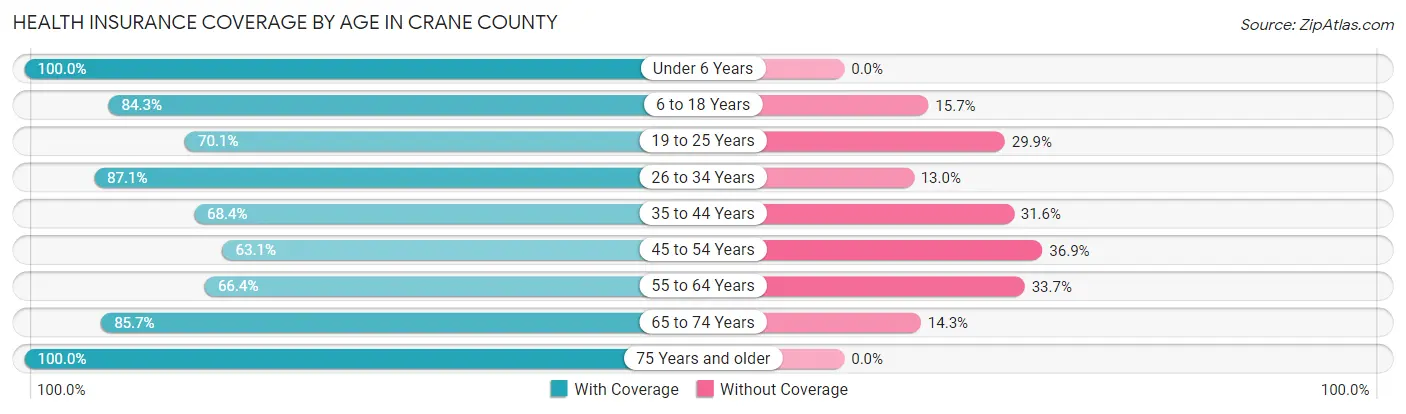
| Age Bracket | With Coverage | Without Coverage |
| Under 6 Years | 485 (100.0%) | 0 (0.0%) |
| 6 to 18 Years | 656 (84.3%) | 122 (15.7%) |
| 19 to 25 Years | 358 (70.1%) | 153 (29.9%) |
| 26 to 34 Years | 336 (87.1%) | 50 (13.0%) |
| 35 to 44 Years | 383 (68.4%) | 177 (31.6%) |
| 45 to 54 Years | 495 (63.1%) | 290 (36.9%) |
| 55 to 64 Years | 278 (66.3%) | 141 (33.7%) |
| 65 to 74 Years | 366 (85.7%) | 61 (14.3%) |
| 75 Years and older | 163 (100.0%) | 0 (0.0%) |
| Total | 3,520 (78.0%) | 994 (22.0%) |
Health Insurance Coverage by Citizenship Status in Crane County
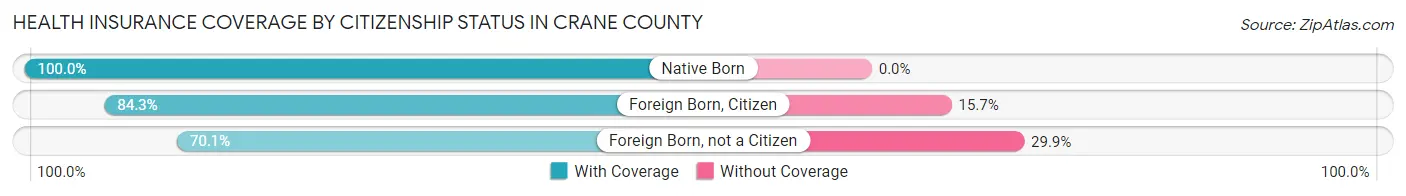
| Citizenship Status | With Coverage | Without Coverage |
| Native Born | 485 (100.0%) | 0 (0.0%) |
| Foreign Born, Citizen | 656 (84.3%) | 122 (15.7%) |
| Foreign Born, not a Citizen | 358 (70.1%) | 153 (29.9%) |
Health Insurance Coverage by Household Income in Crane County
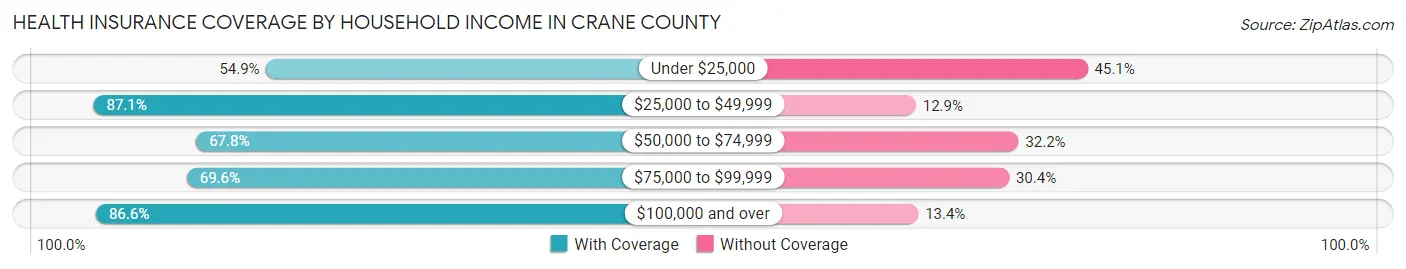
| Household Income | With Coverage | Without Coverage |
| Under $25,000 | 225 (54.9%) | 185 (45.1%) |
| $25,000 to $49,999 | 680 (87.1%) | 101 (12.9%) |
| $50,000 to $74,999 | 618 (67.8%) | 293 (32.2%) |
| $75,000 to $99,999 | 378 (69.6%) | 165 (30.4%) |
| $100,000 and over | 1,619 (86.6%) | 250 (13.4%) |
Public vs Private Health Insurance Coverage by Age in Crane County
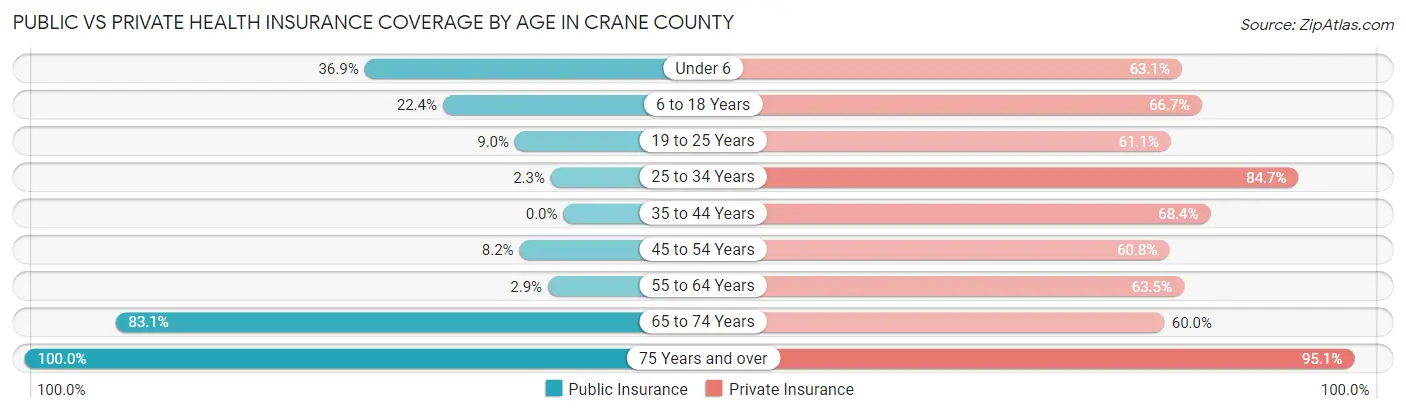
| Age Bracket | Public Insurance | Private Insurance |
| Under 6 | 179 (36.9%) | 306 (63.1%) |
| 6 to 18 Years | 174 (22.4%) | 519 (66.7%) |
| 19 to 25 Years | 46 (9.0%) | 312 (61.1%) |
| 25 to 34 Years | 9 (2.3%) | 327 (84.7%) |
| 35 to 44 Years | 0 (0.0%) | 383 (68.4%) |
| 45 to 54 Years | 64 (8.2%) | 477 (60.8%) |
| 55 to 64 Years | 12 (2.9%) | 266 (63.5%) |
| 65 to 74 Years | 355 (83.1%) | 256 (60.0%) |
| 75 Years and over | 163 (100.0%) | 155 (95.1%) |
| Total | 1,002 (22.2%) | 3,001 (66.5%) |
Disability Status by Sex by Age in Crane County
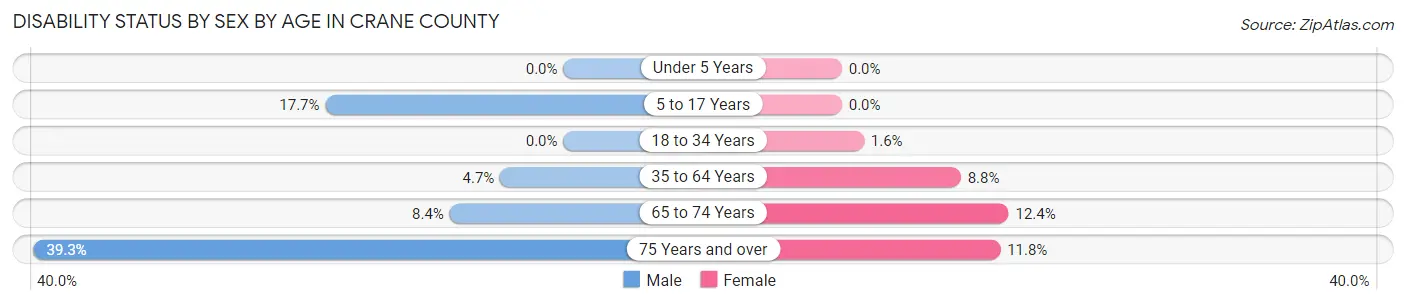
| Age Bracket | Male | Female |
| Under 5 Years | 0 (0.0%) | 0 (0.0%) |
| 5 to 17 Years | 56 (17.7%) | 0 (0.0%) |
| 18 to 34 Years | 0 (0.0%) | 7 (1.6%) |
| 35 to 64 Years | 45 (4.7%) | 71 (8.8%) |
| 65 to 74 Years | 19 (8.4%) | 25 (12.4%) |
| 75 Years and over | 24 (39.3%) | 12 (11.8%) |
Disability Class by Sex by Age in Crane County
Disability Class: Hearing Difficulty
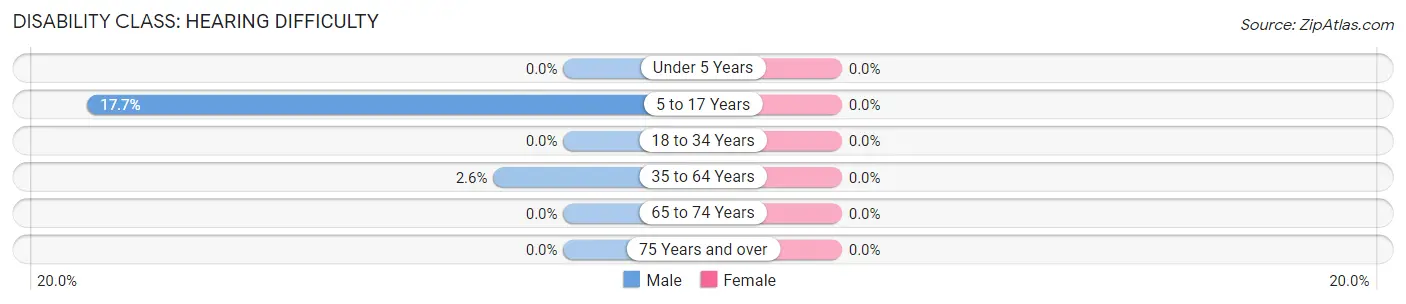
| Age Bracket | Male | Female |
| Under 5 Years | 0 (0.0%) | 0 (0.0%) |
| 5 to 17 Years | 56 (17.7%) | 0 (0.0%) |
| 18 to 34 Years | 0 (0.0%) | 0 (0.0%) |
| 35 to 64 Years | 25 (2.6%) | 0 (0.0%) |
| 65 to 74 Years | 0 (0.0%) | 0 (0.0%) |
| 75 Years and over | 0 (0.0%) | 0 (0.0%) |
Disability Class: Vision Difficulty
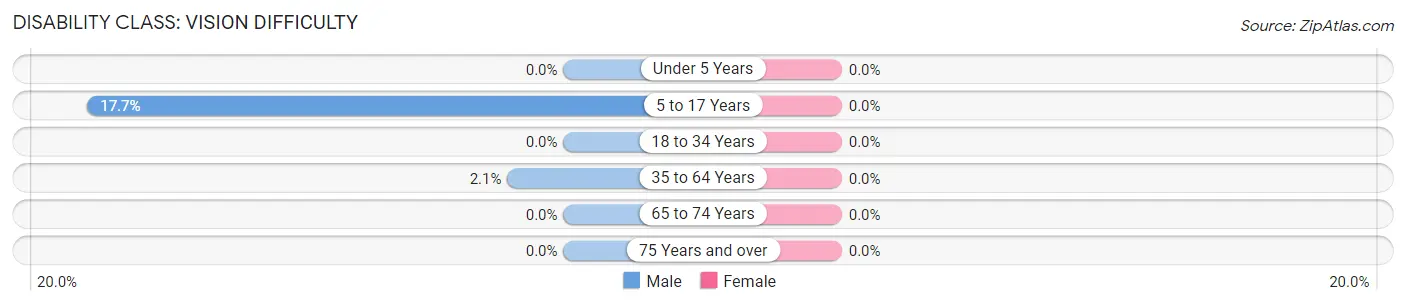
| Age Bracket | Male | Female |
| Under 5 Years | 0 (0.0%) | 0 (0.0%) |
| 5 to 17 Years | 56 (17.7%) | 0 (0.0%) |
| 18 to 34 Years | 0 (0.0%) | 0 (0.0%) |
| 35 to 64 Years | 20 (2.1%) | 0 (0.0%) |
| 65 to 74 Years | 0 (0.0%) | 0 (0.0%) |
| 75 Years and over | 0 (0.0%) | 0 (0.0%) |
Disability Class: Cognitive Difficulty
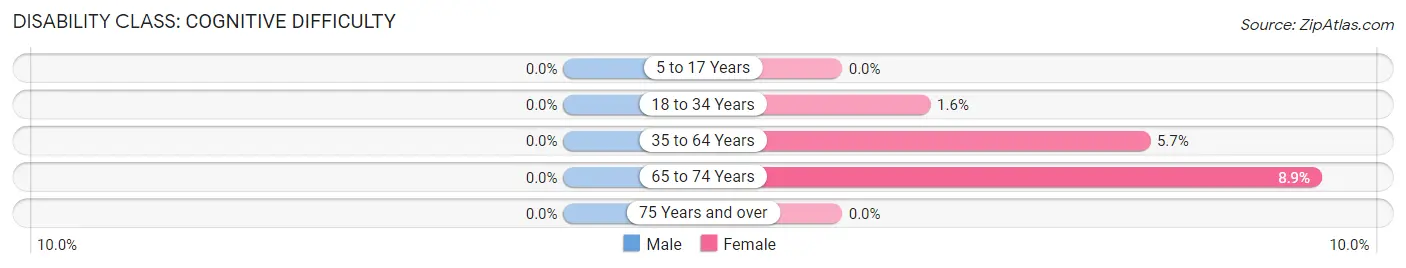
| Age Bracket | Male | Female |
| 5 to 17 Years | 0 (0.0%) | 0 (0.0%) |
| 18 to 34 Years | 0 (0.0%) | 7 (1.6%) |
| 35 to 64 Years | 0 (0.0%) | 46 (5.7%) |
| 65 to 74 Years | 0 (0.0%) | 18 (8.9%) |
| 75 Years and over | 0 (0.0%) | 0 (0.0%) |
Disability Class: Ambulatory Difficulty
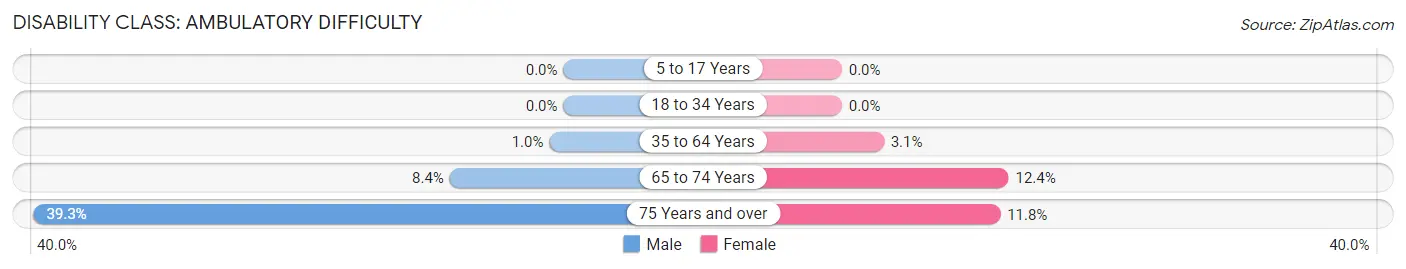
| Age Bracket | Male | Female |
| 5 to 17 Years | 0 (0.0%) | 0 (0.0%) |
| 18 to 34 Years | 0 (0.0%) | 0 (0.0%) |
| 35 to 64 Years | 10 (1.0%) | 25 (3.1%) |
| 65 to 74 Years | 19 (8.4%) | 25 (12.4%) |
| 75 Years and over | 24 (39.3%) | 12 (11.8%) |
Disability Class: Self-Care Difficulty
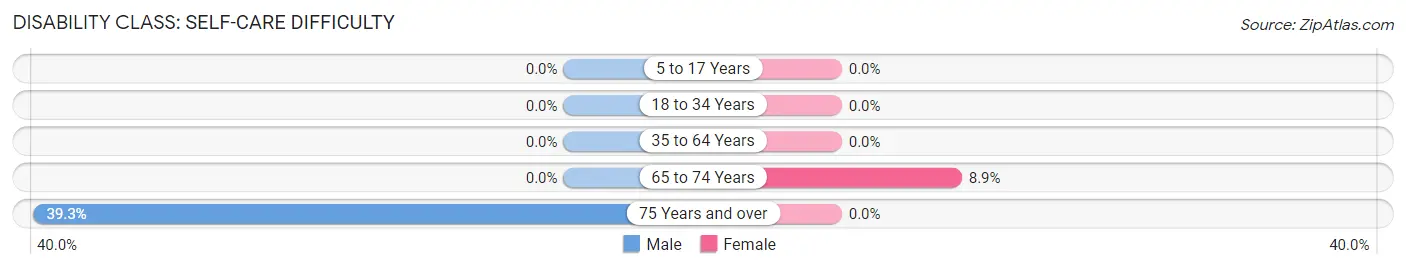
| Age Bracket | Male | Female |
| 5 to 17 Years | 0 (0.0%) | 0 (0.0%) |
| 18 to 34 Years | 0 (0.0%) | 0 (0.0%) |
| 35 to 64 Years | 0 (0.0%) | 0 (0.0%) |
| 65 to 74 Years | 0 (0.0%) | 18 (8.9%) |
| 75 Years and over | 24 (39.3%) | 0 (0.0%) |
Technology Access in Crane County
Computing Device Access in Crane County
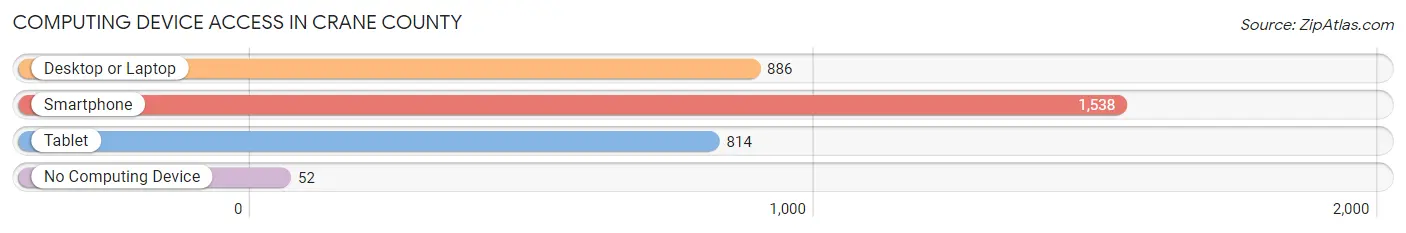
| Device Type | # Households | % Households |
| Desktop or Laptop | 886 | 53.0% |
| Smartphone | 1,538 | 92.1% |
| Tablet | 814 | 48.7% |
| No Computing Device | 52 | 3.1% |
| Total | 1,670 | 100.0% |
Internet Access in Crane County
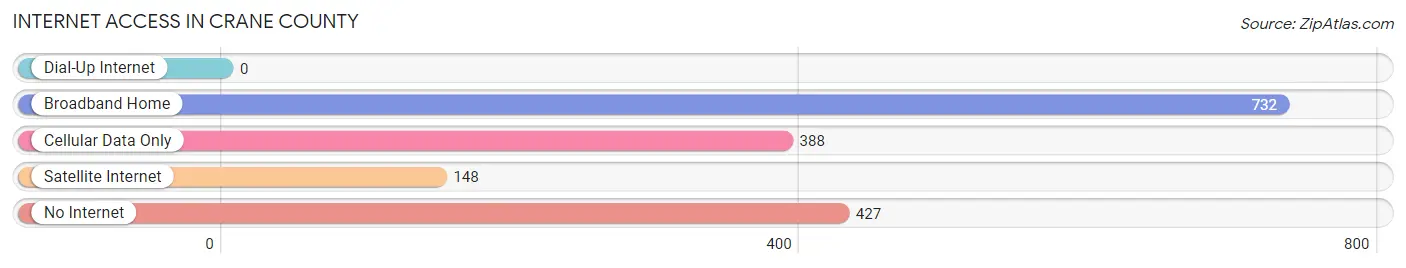
| Internet Type | # Households | % Households |
| Dial-Up Internet | 0 | 0.0% |
| Broadband Home | 732 | 43.8% |
| Cellular Data Only | 388 | 23.2% |
| Satellite Internet | 148 | 8.9% |
| No Internet | 427 | 25.6% |
| Total | 1,670 | 100.0% |
Crane County Summary
Crane County is located in the western part of Texas, in the Permian Basin region. It is bordered by Upton County to the north, Reagan County to the east, Pecos County to the south, and Loving and Winkler Counties to the west. The county seat is Crane, and the county has a total area of 890 square miles.
History
Crane County was established in 1887 from parts of Tom Green and Pecos Counties. It was named for William Carey Crane, a prominent Texas politician and businessman. The county was originally populated by Native American tribes, including the Apache, Comanche, and Kiowa.
In the early 1900s, the county experienced a population boom due to the discovery of oil in the area. The oil industry brought jobs and economic growth to the region, and the population of Crane County grew rapidly.
Geography
Crane County is located in the western part of Texas, in the Permian Basin region. It is bordered by Upton County to the north, Reagan County to the east, Pecos County to the south, and Loving and Winkler Counties to the west. The county seat is Crane, and the county has a total area of 890 square miles.
The terrain of Crane County is mostly flat, with some rolling hills in the northern part of the county. The county is mostly covered in grasslands, with some areas of mesquite and cactus. The Pecos River runs through the county, and there are several small lakes and reservoirs in the area.
Economy
Crane County’s economy is largely based on the oil and gas industry. The county is home to several oil and gas companies, and the industry provides jobs and economic growth to the region.
In addition to the oil and gas industry, Crane County also has a strong agricultural sector. The county is home to several farms and ranches, and the main crops grown in the area are cotton, sorghum, and wheat.
Demographics
As of the 2010 census, Crane County had a population of 4,375. The population is mostly white (83.3%), with small percentages of Hispanic (14.2%), African American (1.2%), and Native American (0.7%) residents.
The median household income in Crane County is $45,938, and the median home value is $90,400. The unemployment rate is 4.2%, and the poverty rate is 16.2%.
Conclusion
Crane County is located in the western part of Texas, in the Permian Basin region. It was established in 1887 and is named for William Carey Crane, a prominent Texas politician and businessman. The county’s economy is largely based on the oil and gas industry, and it also has a strong agricultural sector. As of the 2010 census, Crane County had a population of 4,375, with a median household income of $45,938 and a median home value of $90,400.
Common Questions
What is Per Capita Income in Crane County?
Per Capita income in Crane County is $31,973.
What is the Median Family Income in Crane County?
Median Family Income in Crane County is $82,402.
What is the Median Household income in Crane County?
Median Household Income in Crane County is $71,364.
What is Income or Wage Gap in Crane County?
Income or Wage Gap in Crane County is 39.3%.
Women in Crane County earn 60.7 cents for every dollar earned by a man.
What is Inequality or Gini Index in Crane County?
Inequality or Gini Index in Crane County is 0.39.
What is the Total Population of Crane County?
Total Population of Crane County is 4,636.
What is the Total Male Population of Crane County?
Total Male Population of Crane County is 2,293.
What is the Total Female Population of Crane County?
Total Female Population of Crane County is 2,343.
What is the Ratio of Males per 100 Females in Crane County?
There are 97.87 Males per 100 Females in Crane County.
What is the Ratio of Females per 100 Males in Crane County?
There are 102.18 Females per 100 Males in Crane County.
What is the Median Population Age in Crane County?
Median Population Age in Crane County is 37.9 Years.
What is the Average Family Size in Crane County
Average Family Size in Crane County is 3.4 People.
What is the Average Household Size in Crane County
Average Household Size in Crane County is 2.7 People.
How Large is the Labor Force in Crane County?
There are 2,312 People in the Labor Forcein in Crane County.
What is the Percentage of People in the Labor Force in Crane County?
63.2% of People are in the Labor Force in Crane County.
What is the Unemployment Rate in Crane County?
Unemployment Rate in Crane County is 3.0%.