Brewster County, TX Map & Demographics
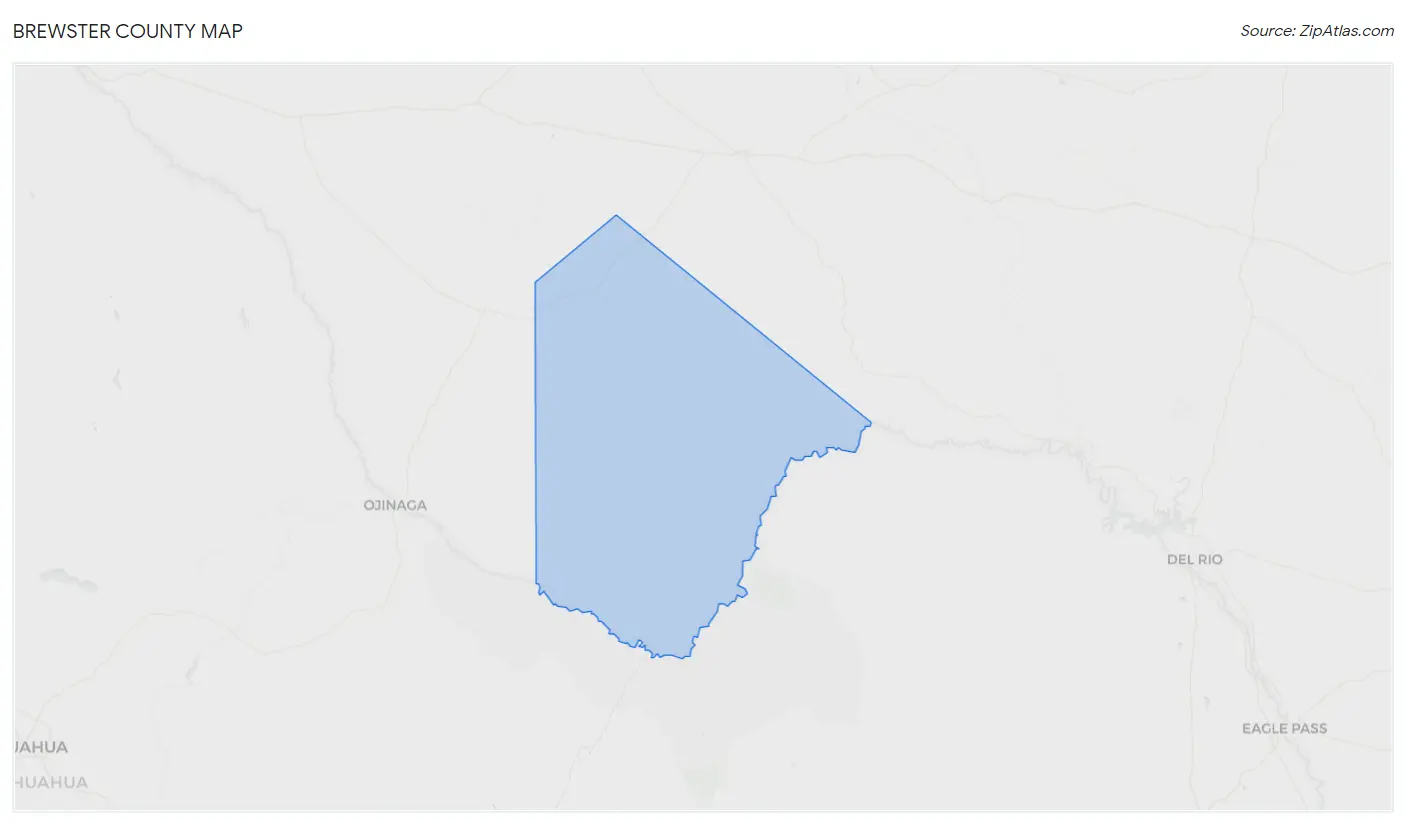
Brewster County Map
Brewster County Overview
$35,516
PER CAPITA INCOME
$71,094
AVG FAMILY INCOME
$47,747
AVG HOUSEHOLD INCOME
24.3%
WAGE / INCOME GAP [ % ]
75.7¢/ $1
WAGE / INCOME GAP [ $ ]
0.46
INEQUALITY / GINI INDEX
9,454
TOTAL POPULATION
4,578
MALE POPULATION
4,876
FEMALE POPULATION
93.89
MALES / 100 FEMALES
106.51
FEMALES / 100 MALES
46.1
MEDIAN AGE
2.5
AVG FAMILY SIZE
1.9
AVG HOUSEHOLD SIZE
4,920
LABOR FORCE [ PEOPLE ]
62.4%
PERCENT IN LABOR FORCE
3.0%
UNEMPLOYMENT RATE
Brewster County Area Codes
Income in Brewster County
Income Overview in Brewster County
Per Capita Income in Brewster County is $35,516, while median incomes of families and households are $71,094 and $47,747 respectively.
| Characteristic | Number | Measure |
| Per Capita Income | 9,454 | $35,516 |
| Median Family Income | 2,588 | $71,094 |
| Mean Family Income | 2,588 | $91,656 |
| Median Household Income | 4,958 | $47,747 |
| Mean Household Income | 4,958 | $69,449 |
| Income Deficit | 2,588 | $0 |
| Wage / Income Gap (%) | 9,454 | 24.33% |
| Wage / Income Gap ($) | 9,454 | 75.67¢ per $1 |
| Gini / Inequality Index | 9,454 | 0.46 |
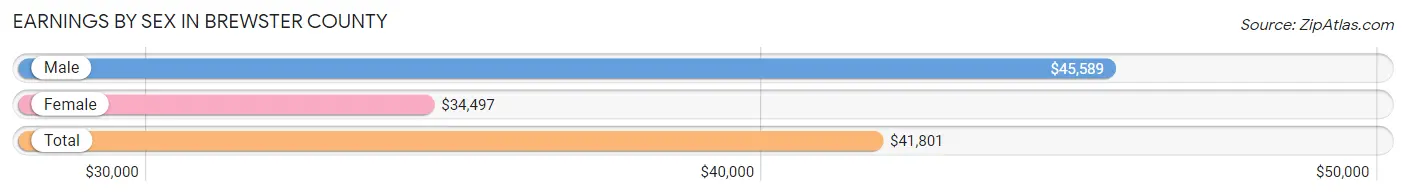
Earnings by Sex in Brewster County
Average Earnings in Brewster County are $41,801, $45,589 for men and $34,497 for women, a difference of 24.3%.
| Sex | Number | Average Earnings |
| Male | 2,905 (56.0%) | $45,589 |
| Female | 2,283 (44.0%) | $34,497 |
| Total | 5,188 (100.0%) | $41,801 |
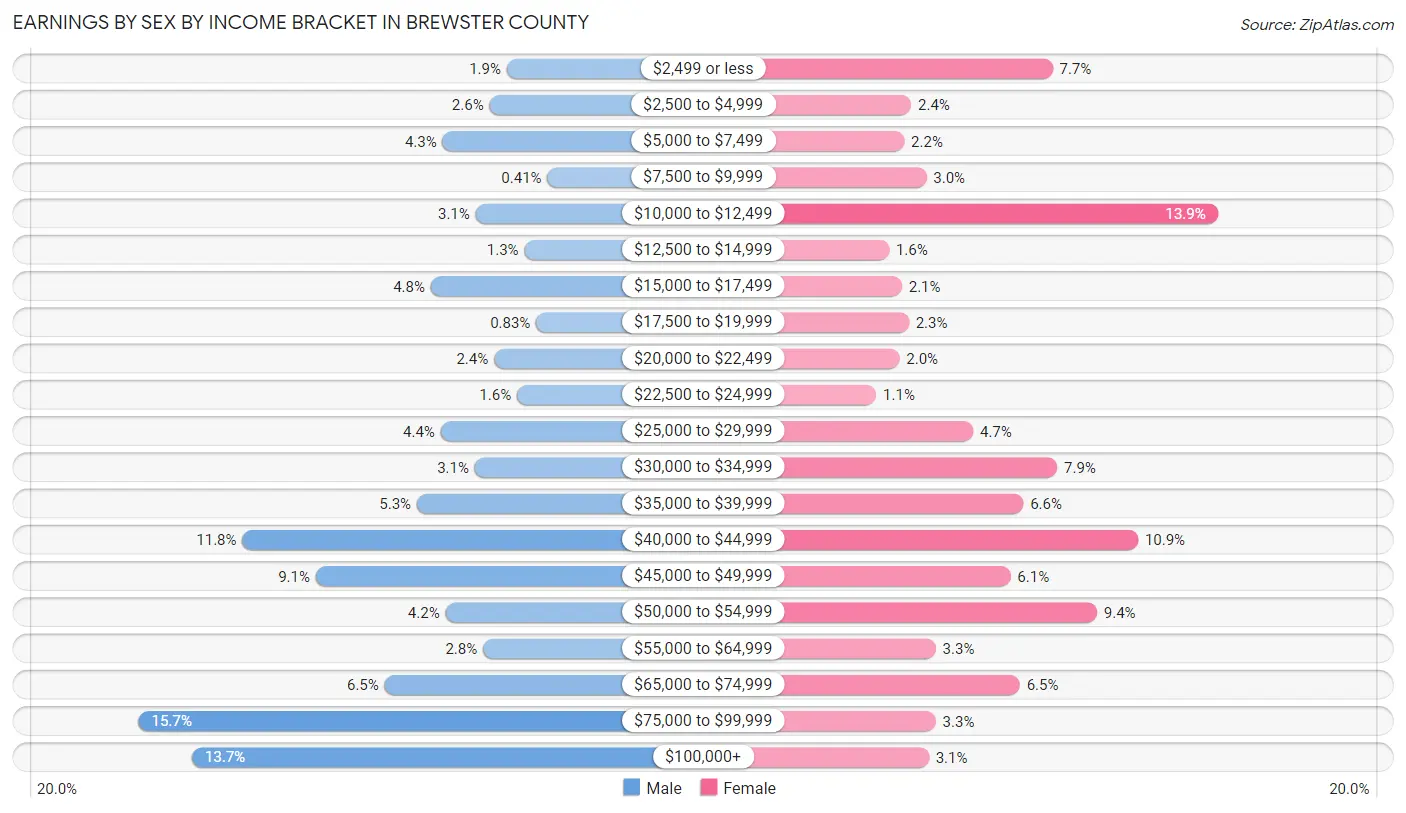
Earnings by Sex by Income Bracket in Brewster County
The most common earnings brackets in Brewster County are $75,000 to $99,999 for men (457 | 15.7%) and $10,000 to $12,499 for women (317 | 13.9%).
| Income | Male | Female |
| $2,499 or less | 56 (1.9%) | 176 (7.7%) |
| $2,500 to $4,999 | 75 (2.6%) | 55 (2.4%) |
| $5,000 to $7,499 | 126 (4.3%) | 49 (2.1%) |
| $7,500 to $9,999 | 12 (0.4%) | 68 (3.0%) |
| $10,000 to $12,499 | 90 (3.1%) | 317 (13.9%) |
| $12,500 to $14,999 | 37 (1.3%) | 36 (1.6%) |
| $15,000 to $17,499 | 139 (4.8%) | 47 (2.1%) |
| $17,500 to $19,999 | 24 (0.8%) | 53 (2.3%) |
| $20,000 to $22,499 | 70 (2.4%) | 45 (2.0%) |
| $22,500 to $24,999 | 45 (1.5%) | 25 (1.1%) |
| $25,000 to $29,999 | 128 (4.4%) | 108 (4.7%) |
| $30,000 to $34,999 | 91 (3.1%) | 180 (7.9%) |
| $35,000 to $39,999 | 154 (5.3%) | 151 (6.6%) |
| $40,000 to $44,999 | 344 (11.8%) | 249 (10.9%) |
| $45,000 to $49,999 | 264 (9.1%) | 140 (6.1%) |
| $50,000 to $54,999 | 123 (4.2%) | 214 (9.4%) |
| $55,000 to $64,999 | 82 (2.8%) | 76 (3.3%) |
| $65,000 to $74,999 | 189 (6.5%) | 148 (6.5%) |
| $75,000 to $99,999 | 457 (15.7%) | 76 (3.3%) |
| $100,000+ | 399 (13.7%) | 70 (3.1%) |
| Total | 2,905 (100.0%) | 2,283 (100.0%) |
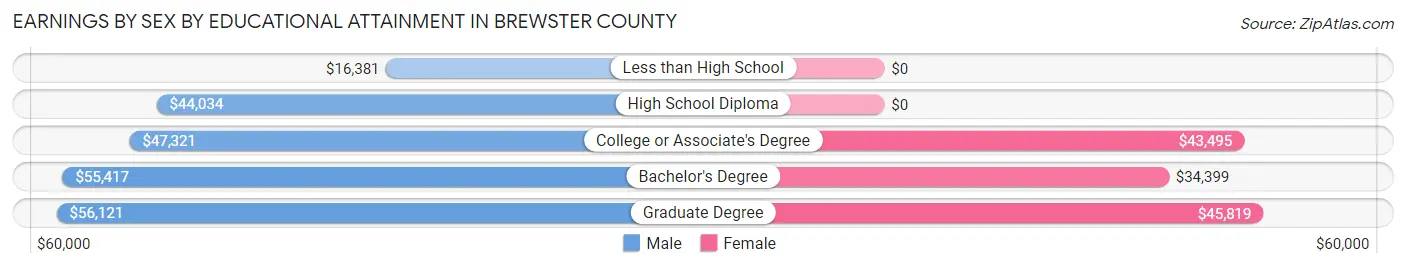
Earnings by Sex by Educational Attainment in Brewster County
Average earnings in Brewster County are $46,212 for men and $37,083 for women, a difference of 19.8%. Men with an educational attainment of graduate degree enjoy the highest average annual earnings of $56,121, while those with less than high school education earn the least with $16,381. Women with an educational attainment of graduate degree earn the most with the average annual earnings of $45,819, while those with bachelor's degree education have the smallest earnings of $34,399.
| Educational Attainment | Male Income | Female Income |
| Less than High School | $16,381 | $0 |
| High School Diploma | $44,034 | $0 |
| College or Associate's Degree | $47,321 | $43,495 |
| Bachelor's Degree | $55,417 | $34,399 |
| Graduate Degree | $56,121 | $45,819 |
| Total | $46,212 | $37,083 |
Family Income in Brewster County
Family Income Brackets in Brewster County
According to the Brewster County family income data, there are 655 families falling into the $100,000 to $149,999 income range, which is the most common income bracket and makes up 25.3% of all families. Conversely, the $10,000 to $14,999 income bracket is the least frequent group with only 39 families (1.5%) belonging to this category.
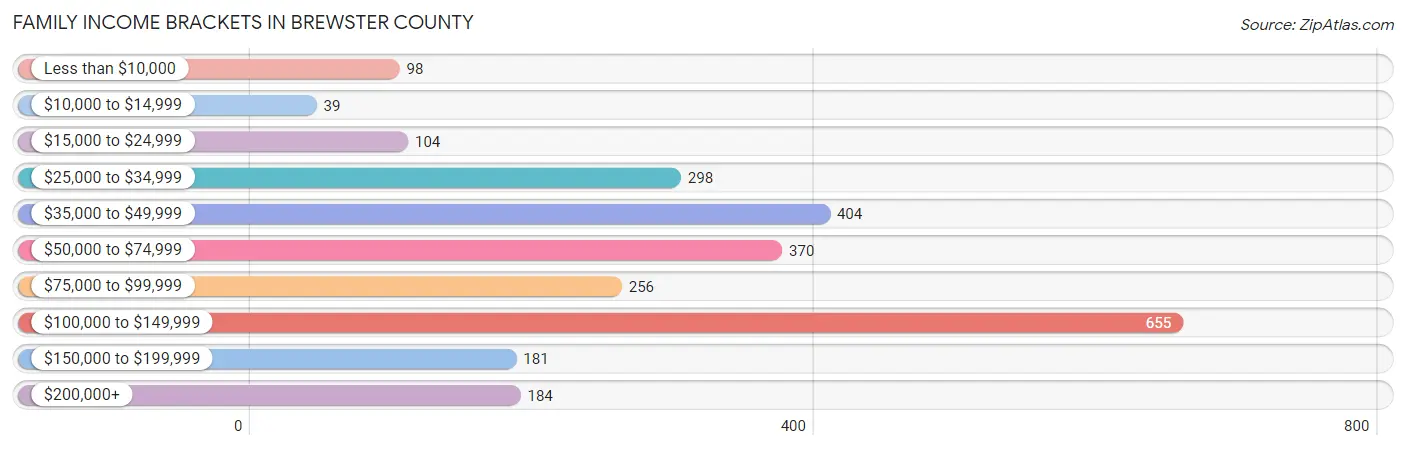
| Income Bracket | # Families | % Families |
| Less than $10,000 | 98 | 3.8% |
| $10,000 to $14,999 | 39 | 1.5% |
| $15,000 to $24,999 | 104 | 4.0% |
| $25,000 to $34,999 | 298 | 11.5% |
| $35,000 to $49,999 | 404 | 15.6% |
| $50,000 to $74,999 | 370 | 14.3% |
| $75,000 to $99,999 | 256 | 9.9% |
| $100,000 to $149,999 | 655 | 25.3% |
| $150,000 to $199,999 | 181 | 7.0% |
| $200,000+ | 184 | 7.1% |
Family Income by Famaliy Size in Brewster County
4-person families (429 | 16.6%) account for the highest median family income in Brewster County with $106,976 per family, while 2-person families (1,528 | 59.0%) have the highest median income of $30,852 per family member.
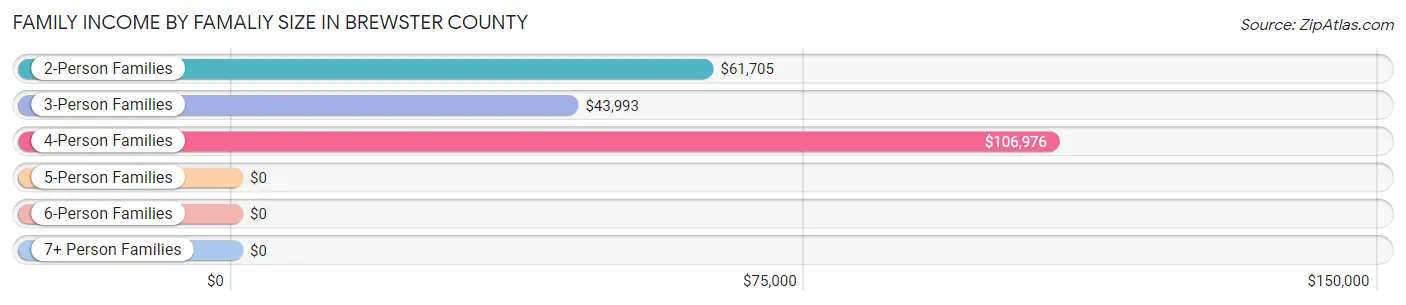
| Income Bracket | # Families | Median Income |
| 2-Person Families | 1,528 (59.0%) | $61,705 |
| 3-Person Families | 502 (19.4%) | $43,993 |
| 4-Person Families | 429 (16.6%) | $106,976 |
| 5-Person Families | 92 (3.5%) | $0 |
| 6-Person Families | 37 (1.4%) | $0 |
| 7+ Person Families | 0 (0.0%) | $0 |
| Total | 2,588 (100.0%) | $71,094 |
Family Income by Number of Earners in Brewster County
The median family income in Brewster County is $71,094, with families comprising 3+ earners (159) having the highest median family income of $113,552, while families with no earners (485) have the lowest median family income of $41,985, accounting for 6.1% and 18.7% of families, respectively.
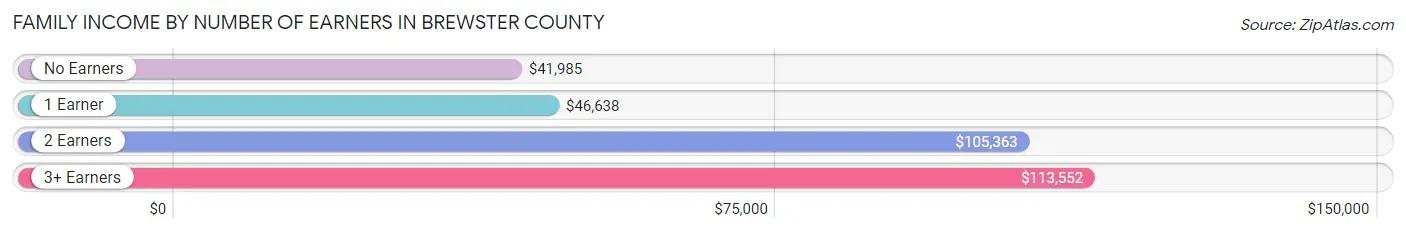
| Number of Earners | # Families | Median Income |
| No Earners | 485 (18.7%) | $41,985 |
| 1 Earner | 820 (31.7%) | $46,638 |
| 2 Earners | 1,124 (43.4%) | $105,363 |
| 3+ Earners | 159 (6.1%) | $113,552 |
| Total | 2,588 (100.0%) | $71,094 |
Household Income in Brewster County
Household Income Brackets in Brewster County
With 863 households falling in the category, the $35,000 to $49,999 income range is the most frequent in Brewster County, accounting for 17.4% of all households. In contrast, only 188 households (3.8%) fall into the $200,000+ income bracket, making it the least populous group.
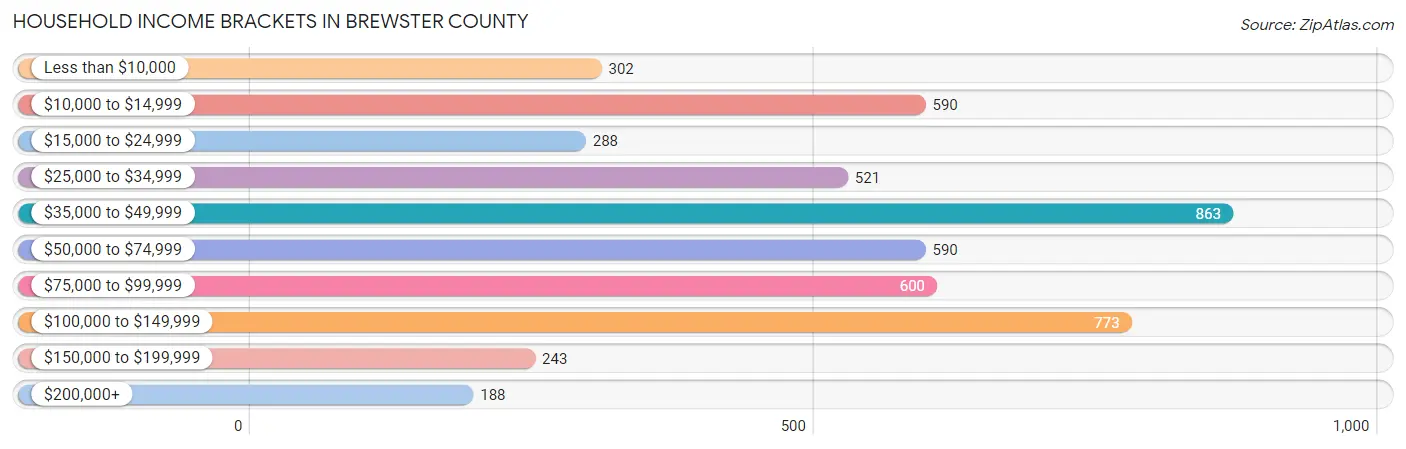
| Income Bracket | # Households | % Households |
| Less than $10,000 | 302 | 6.1% |
| $10,000 to $14,999 | 590 | 11.9% |
| $15,000 to $24,999 | 288 | 5.8% |
| $25,000 to $34,999 | 521 | 10.5% |
| $35,000 to $49,999 | 863 | 17.4% |
| $50,000 to $74,999 | 590 | 11.9% |
| $75,000 to $99,999 | 600 | 12.1% |
| $100,000 to $149,999 | 773 | 15.6% |
| $150,000 to $199,999 | 243 | 4.9% |
| $200,000+ | 188 | 3.8% |
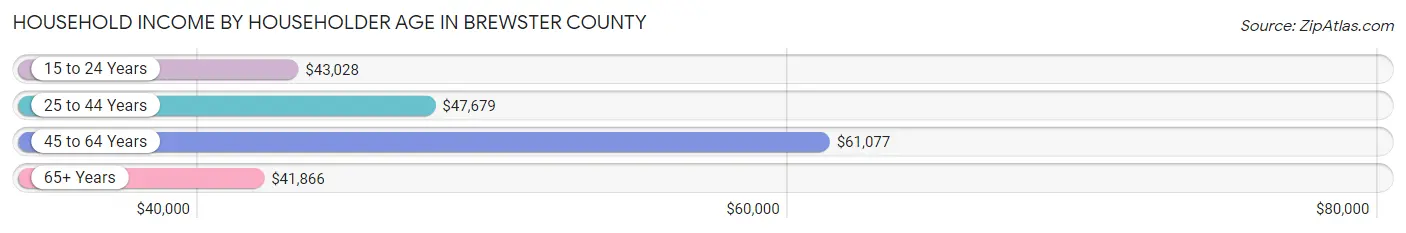
Household Income by Householder Age in Brewster County
The median household income in Brewster County is $47,747, with the highest median household income of $61,077 found in the 45 to 64 years age bracket for the primary householder. A total of 1,566 households (31.6%) fall into this category. Meanwhile, the 65+ years age bracket for the primary householder has the lowest median household income of $41,866, with 1,501 households (30.3%) in this group.
| Income Bracket | # Households | Median Income |
| 15 to 24 Years | 285 (5.8%) | $43,028 |
| 25 to 44 Years | 1,606 (32.4%) | $47,679 |
| 45 to 64 Years | 1,566 (31.6%) | $61,077 |
| 65+ Years | 1,501 (30.3%) | $41,866 |
| Total | 4,958 (100.0%) | $47,747 |
Poverty in Brewster County
Income Below Poverty by Sex and Age in Brewster County
With 13.5% poverty level for males and 17.7% for females among the residents of Brewster County, 18 to 24 year old males and 75 year old and over females are the most vulnerable to poverty, with 137 males (48.4%) and 213 females (51.4%) in their respective age groups living below the poverty level.
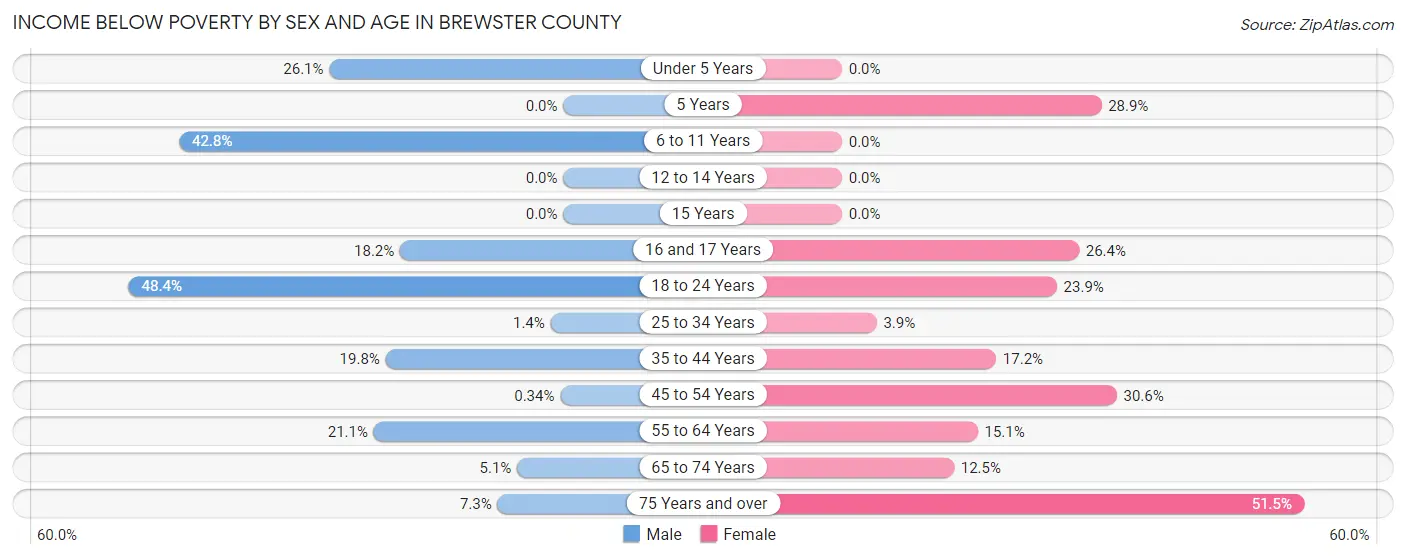
| Age Bracket | Male | Female |
| Under 5 Years | 43 (26.1%) | 0 (0.0%) |
| 5 Years | 0 (0.0%) | 39 (28.9%) |
| 6 to 11 Years | 107 (42.8%) | 0 (0.0%) |
| 12 to 14 Years | 0 (0.0%) | 0 (0.0%) |
| 15 Years | 0 (0.0%) | 0 (0.0%) |
| 16 and 17 Years | 2 (18.2%) | 38 (26.4%) |
| 18 to 24 Years | 137 (48.4%) | 39 (23.9%) |
| 25 to 34 Years | 10 (1.4%) | 18 (3.9%) |
| 35 to 44 Years | 111 (19.8%) | 99 (17.2%) |
| 45 to 54 Years | 2 (0.3%) | 205 (30.6%) |
| 55 to 64 Years | 129 (21.1%) | 98 (15.1%) |
| 65 to 74 Years | 37 (5.1%) | 90 (12.5%) |
| 75 Years and over | 28 (7.3%) | 213 (51.4%) |
| Total | 606 (13.5%) | 839 (17.7%) |
Income Above Poverty by Sex and Age in Brewster County
According to the poverty statistics in Brewster County, males aged 5 years and females aged under 5 years are the age groups that are most secure financially, with 100.0% of males and 100.0% of females in these age groups living above the poverty line.
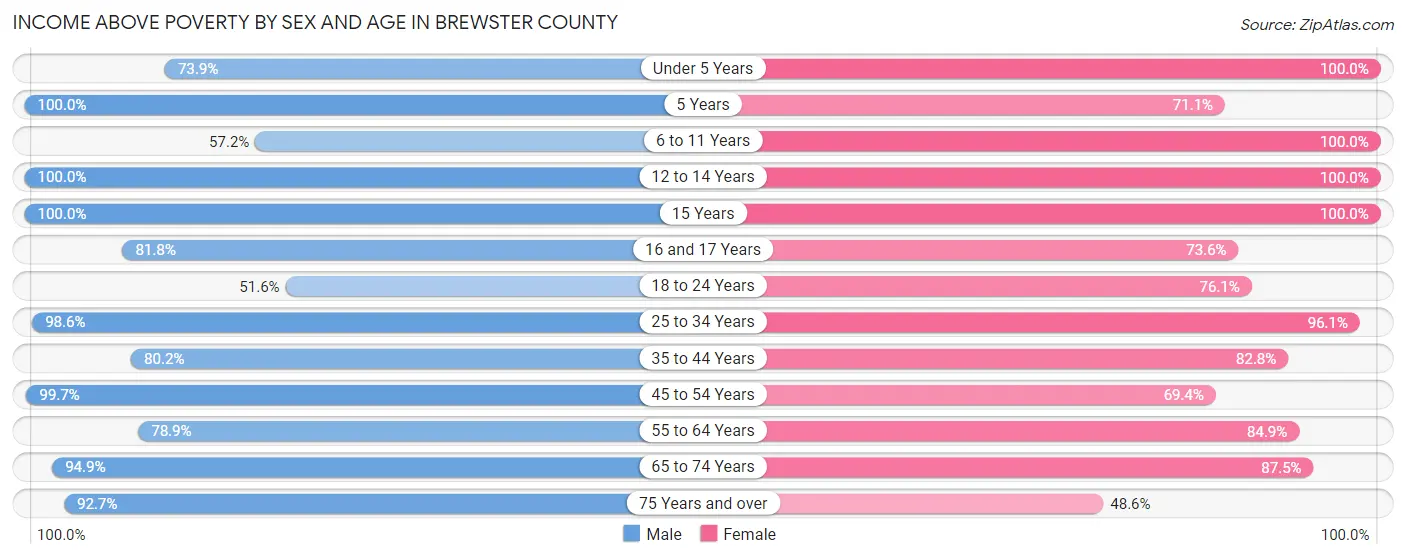
| Age Bracket | Male | Female |
| Under 5 Years | 122 (73.9%) | 284 (100.0%) |
| 5 Years | 67 (100.0%) | 96 (71.1%) |
| 6 to 11 Years | 143 (57.2%) | 271 (100.0%) |
| 12 to 14 Years | 119 (100.0%) | 207 (100.0%) |
| 15 Years | 30 (100.0%) | 41 (100.0%) |
| 16 and 17 Years | 9 (81.8%) | 106 (73.6%) |
| 18 to 24 Years | 146 (51.6%) | 124 (76.1%) |
| 25 to 34 Years | 693 (98.6%) | 448 (96.1%) |
| 35 to 44 Years | 450 (80.2%) | 478 (82.8%) |
| 45 to 54 Years | 587 (99.7%) | 465 (69.4%) |
| 55 to 64 Years | 482 (78.9%) | 550 (84.9%) |
| 65 to 74 Years | 683 (94.9%) | 632 (87.5%) |
| 75 Years and over | 354 (92.7%) | 201 (48.5%) |
| Total | 3,885 (86.5%) | 3,903 (82.3%) |
Income Below Poverty Among Married-Couple Families in Brewster County
The poverty statistics for married-couple families in Brewster County show that 1.9% or 39 of the total 1,995 families live below the poverty line. Families with no children have the highest poverty rate of 2.8%, comprising of 39 families. On the other hand, families with 1 or 2 children have the lowest poverty rate of 0.0%, which includes 0 families.
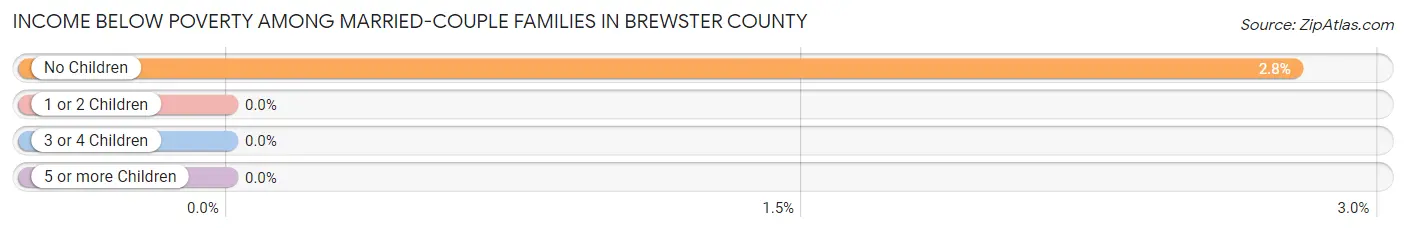
| Children | Above Poverty | Below Poverty |
| No Children | 1,365 (97.2%) | 39 (2.8%) |
| 1 or 2 Children | 552 (100.0%) | 0 (0.0%) |
| 3 or 4 Children | 39 (100.0%) | 0 (0.0%) |
| 5 or more Children | 0 (0.0%) | 0 (0.0%) |
| Total | 1,956 (98.1%) | 39 (1.9%) |
Income Below Poverty Among Single-Parent Households in Brewster County
According to the poverty data in Brewster County, 31.6% or 67 single-father households and 23.9% or 91 single-mother households are living below the poverty line. Among single-father households, those with 3 or 4 children have the highest poverty rate, with 67 households (100.0%) experiencing poverty. Likewise, among single-mother households, those with no children have the highest poverty rate, with 71 households (84.5%) falling below the poverty line.
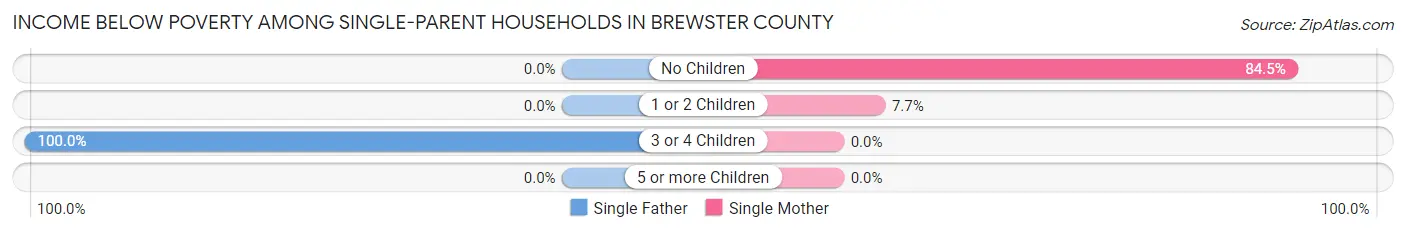
| Children | Single Father | Single Mother |
| No Children | 0 (0.0%) | 71 (84.5%) |
| 1 or 2 Children | 0 (0.0%) | 20 (7.7%) |
| 3 or 4 Children | 67 (100.0%) | 0 (0.0%) |
| 5 or more Children | 0 (0.0%) | 0 (0.0%) |
| Total | 67 (31.6%) | 91 (23.9%) |
Income Below Poverty Among Married-Couple vs Single-Parent Households in Brewster County
The poverty data for Brewster County shows that 39 of the married-couple family households (1.9%) and 158 of the single-parent households (26.6%) are living below the poverty level. Within the married-couple family households, those with no children have the highest poverty rate, with 39 households (2.8%) falling below the poverty line. Among the single-parent households, those with 3 or 4 children have the highest poverty rate, with 67 household (64.4%) living below poverty.
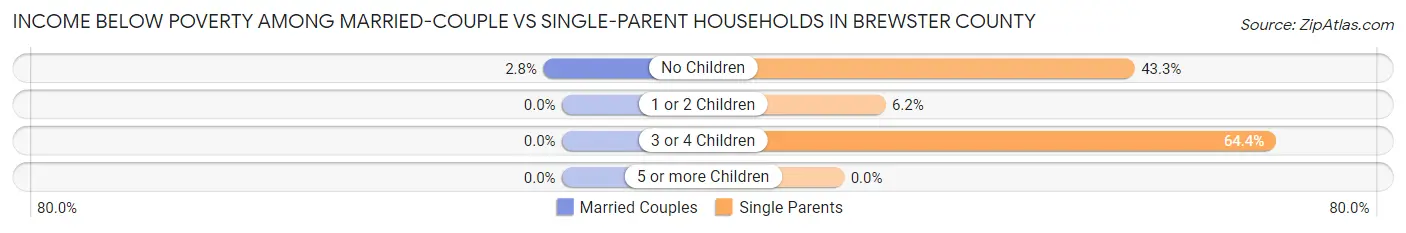
| Children | Married-Couple Families | Single-Parent Households |
| No Children | 39 (2.8%) | 71 (43.3%) |
| 1 or 2 Children | 0 (0.0%) | 20 (6.1%) |
| 3 or 4 Children | 0 (0.0%) | 67 (64.4%) |
| 5 or more Children | 0 (0.0%) | 0 (0.0%) |
| Total | 39 (1.9%) | 158 (26.6%) |
Race in Brewster County
The most populous races in Brewster County are White / Caucasian (7,494 | 79.3%), Hispanic or Latino (4,304 | 45.5%), and Two or more Races (1,210 | 12.8%).
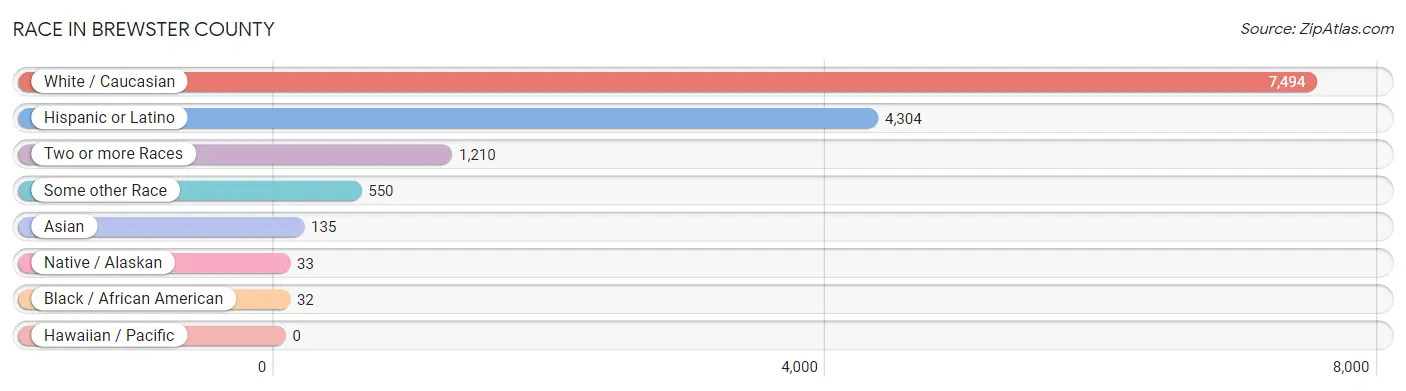
| Race | # Population | % Population |
| Asian | 135 | 1.4% |
| Black / African American | 32 | 0.3% |
| Hawaiian / Pacific | 0 | 0.0% |
| Hispanic or Latino | 4,304 | 45.5% |
| Native / Alaskan | 33 | 0.4% |
| White / Caucasian | 7,494 | 79.3% |
| Two or more Races | 1,210 | 12.8% |
| Some other Race | 550 | 5.8% |
| Total | 9,454 | 100.0% |
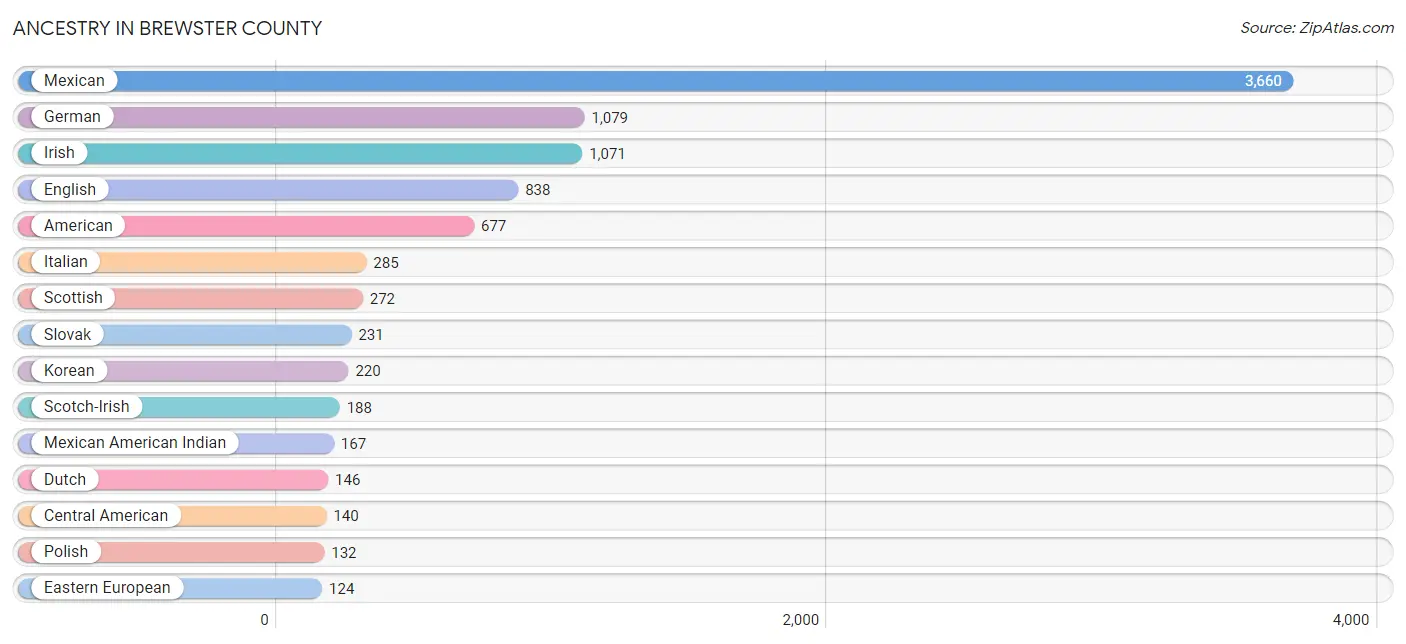
Ancestry in Brewster County
The most populous ancestries reported in Brewster County are Mexican (3,660 | 38.7%), German (1,079 | 11.4%), Irish (1,071 | 11.3%), English (838 | 8.9%), and American (677 | 7.2%), together accounting for 77.5% of all Brewster County residents.
| Ancestry | # Population | % Population |
| American | 677 | 7.2% |
| Apache | 32 | 0.3% |
| Argentinean | 9 | 0.1% |
| Austrian | 48 | 0.5% |
| Bhutanese | 52 | 0.5% |
| Blackfeet | 4 | 0.0% |
| British | 100 | 1.1% |
| Burmese | 10 | 0.1% |
| Central American | 140 | 1.5% |
| Comanche | 20 | 0.2% |
| Czech | 30 | 0.3% |
| Danish | 5 | 0.1% |
| Dutch | 146 | 1.5% |
| Eastern European | 124 | 1.3% |
| English | 838 | 8.9% |
| European | 69 | 0.7% |
| French | 90 | 0.9% |
| French Canadian | 9 | 0.1% |
| German | 1,079 | 11.4% |
| Greek | 30 | 0.3% |
| Guatemalan | 72 | 0.8% |
| Hungarian | 19 | 0.2% |
| Indian (Asian) | 18 | 0.2% |
| Irish | 1,071 | 11.3% |
| Iroquois | 5 | 0.1% |
| Italian | 285 | 3.0% |
| Korean | 220 | 2.3% |
| Mexican | 3,660 | 38.7% |
| Mexican American Indian | 167 | 1.8% |
| Nicaraguan | 68 | 0.7% |
| Norwegian | 65 | 0.7% |
| Polish | 132 | 1.4% |
| Portuguese | 27 | 0.3% |
| Puerto Rican | 79 | 0.8% |
| Russian | 12 | 0.1% |
| Scandinavian | 20 | 0.2% |
| Scotch-Irish | 188 | 2.0% |
| Scottish | 272 | 2.9% |
| Serbian | 79 | 0.8% |
| Slavic | 44 | 0.5% |
| Slovak | 231 | 2.4% |
| South American | 9 | 0.1% |
| Spaniard | 53 | 0.6% |
| Spanish | 59 | 0.6% |
| Sri Lankan | 7 | 0.1% |
| Swedish | 104 | 1.1% |
| Swiss | 15 | 0.2% |
| Welsh | 8 | 0.1% | View All 48 Rows |
Immigrants in Brewster County
The most numerous immigrant groups reported in Brewster County came from Central America (680 | 7.2%), Latin America (680 | 7.2%), Mexico (608 | 6.4%), Asia (118 | 1.3%), and South Eastern Asia (107 | 1.1%), together accounting for 23.2% of all Brewster County residents.
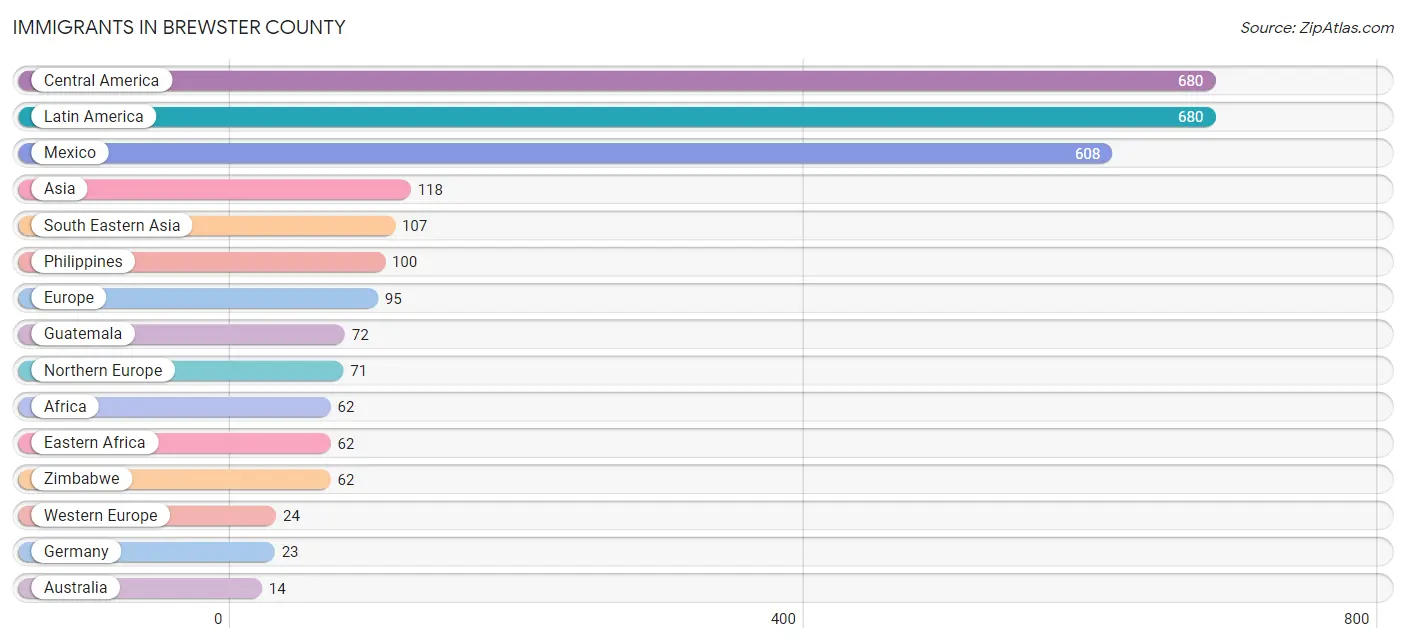
| Immigration Origin | # Population | % Population |
| Africa | 62 | 0.7% |
| Asia | 118 | 1.3% |
| Australia | 14 | 0.2% |
| Central America | 680 | 7.2% |
| China | 11 | 0.1% |
| Eastern Africa | 62 | 0.7% |
| Eastern Asia | 11 | 0.1% |
| Europe | 95 | 1.0% |
| Germany | 23 | 0.2% |
| Guatemala | 72 | 0.8% |
| Latin America | 680 | 7.2% |
| Mexico | 608 | 6.4% |
| Netherlands | 1 | 0.0% |
| Northern Europe | 71 | 0.7% |
| Oceania | 14 | 0.2% |
| Philippines | 100 | 1.1% |
| South Eastern Asia | 107 | 1.1% |
| Vietnam | 7 | 0.1% |
| Western Europe | 24 | 0.3% |
| Zimbabwe | 62 | 0.7% | View All 20 Rows |
Sex and Age in Brewster County
Sex and Age in Brewster County
The most populous age groups in Brewster County are 65 to 69 Years (436 | 9.5%) for men and 50 to 54 Years (419 | 8.6%) for women.
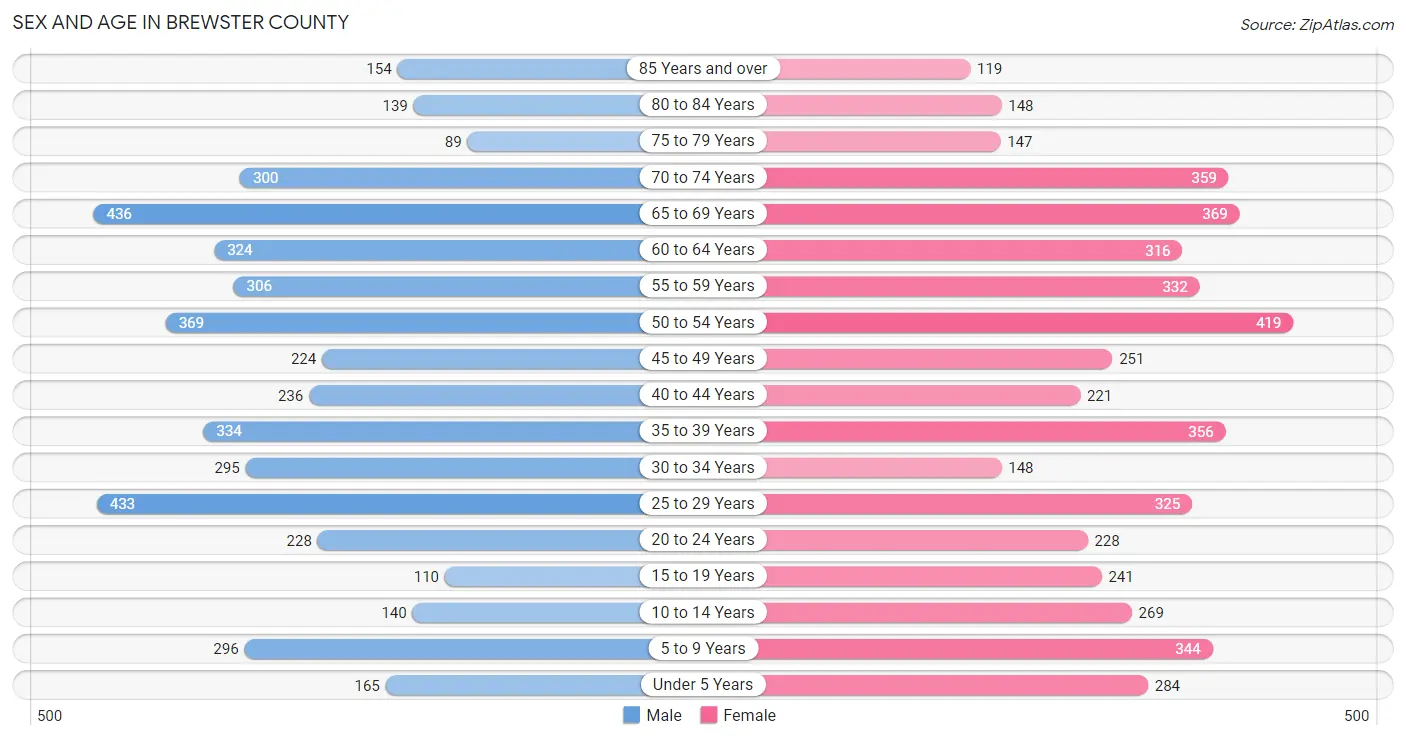
| Age Bracket | Male | Female |
| Under 5 Years | 165 (3.6%) | 284 (5.8%) |
| 5 to 9 Years | 296 (6.5%) | 344 (7.0%) |
| 10 to 14 Years | 140 (3.1%) | 269 (5.5%) |
| 15 to 19 Years | 110 (2.4%) | 241 (4.9%) |
| 20 to 24 Years | 228 (5.0%) | 228 (4.7%) |
| 25 to 29 Years | 433 (9.5%) | 325 (6.7%) |
| 30 to 34 Years | 295 (6.4%) | 148 (3.0%) |
| 35 to 39 Years | 334 (7.3%) | 356 (7.3%) |
| 40 to 44 Years | 236 (5.2%) | 221 (4.5%) |
| 45 to 49 Years | 224 (4.9%) | 251 (5.1%) |
| 50 to 54 Years | 369 (8.1%) | 419 (8.6%) |
| 55 to 59 Years | 306 (6.7%) | 332 (6.8%) |
| 60 to 64 Years | 324 (7.1%) | 316 (6.5%) |
| 65 to 69 Years | 436 (9.5%) | 369 (7.6%) |
| 70 to 74 Years | 300 (6.6%) | 359 (7.4%) |
| 75 to 79 Years | 89 (1.9%) | 147 (3.0%) |
| 80 to 84 Years | 139 (3.0%) | 148 (3.0%) |
| 85 Years and over | 154 (3.4%) | 119 (2.4%) |
| Total | 4,578 (100.0%) | 4,876 (100.0%) |
Families and Households in Brewster County
Median Family Size in Brewster County
The median family size in Brewster County is 2.53 persons per family, with married-couple families (1,995 | 77.1%) accounting for the largest median family size of 2.62 persons per family. On the other hand, single male/father families (212 | 8.2%) represent the smallest median family size with 2.15 persons per family.
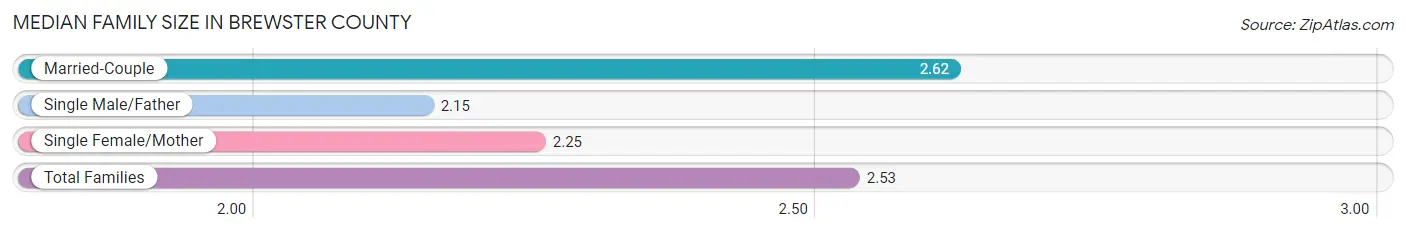
| Family Type | # Families | Family Size |
| Married-Couple | 1,995 (77.1%) | 2.62 |
| Single Male/Father | 212 (8.2%) | 2.15 |
| Single Female/Mother | 381 (14.7%) | 2.25 |
| Total Families | 2,588 (100.0%) | 2.53 |
Median Household Size in Brewster County
The median household size in Brewster County is 1.86 persons per household, with married-couple households (1,995 | 40.2%) accounting for the largest median household size of 2.64 persons per household. non-family households (2,370 | 47.8%) represent the smallest median household size with 1.08 persons per household.
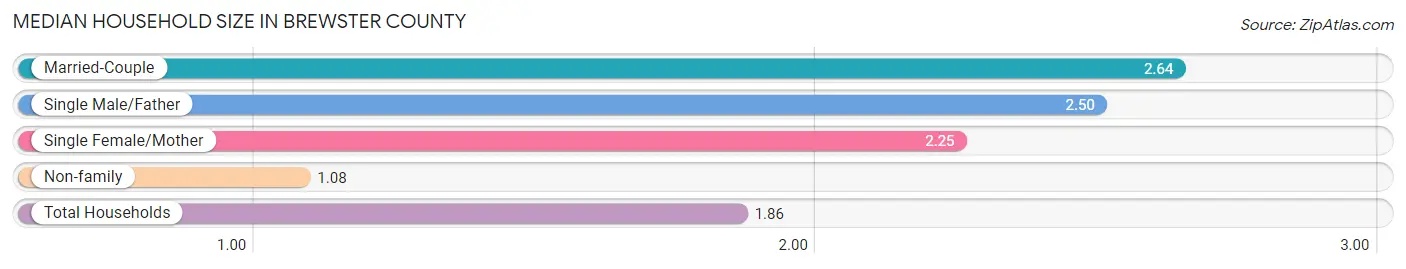
| Household Type | # Households | Household Size |
| Married-Couple | 1,995 (40.2%) | 2.64 |
| Single Male/Father | 212 (4.3%) | 2.50 |
| Single Female/Mother | 381 (7.7%) | 2.25 |
| Non-family | 2,370 (47.8%) | 1.08 |
| Total Households | 4,958 (100.0%) | 1.86 |
Household Size by Marriage Status in Brewster County
Out of a total of 4,958 households in Brewster County, 2,588 (52.2%) are family households, while 2,370 (47.8%) are nonfamily households. The most numerous type of family households are 2-person households, comprising 1,502, and the most common type of nonfamily households are 1-person households, comprising 2,060.
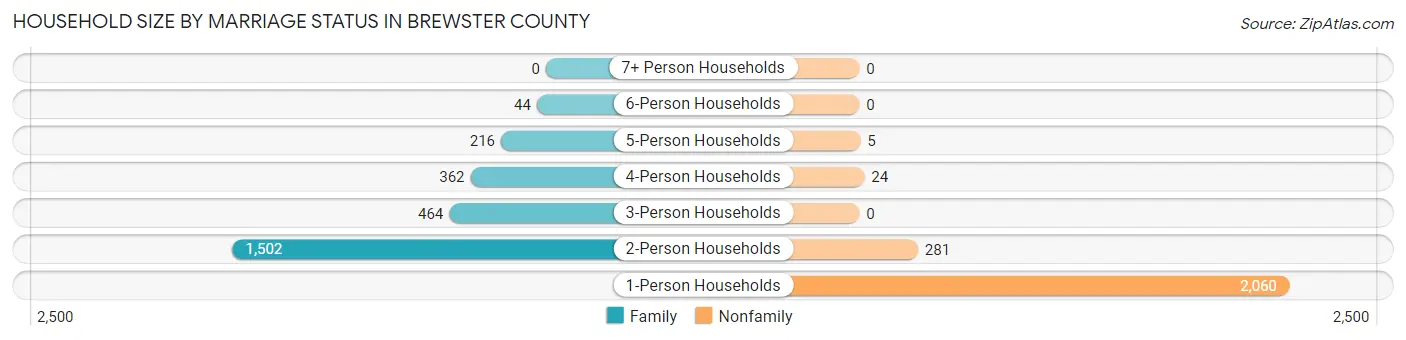
| Household Size | Family Households | Nonfamily Households |
| 1-Person Households | - | 2,060 (41.5%) |
| 2-Person Households | 1,502 (30.3%) | 281 (5.7%) |
| 3-Person Households | 464 (9.4%) | 0 (0.0%) |
| 4-Person Households | 362 (7.3%) | 24 (0.5%) |
| 5-Person Households | 216 (4.4%) | 5 (0.1%) |
| 6-Person Households | 44 (0.9%) | 0 (0.0%) |
| 7+ Person Households | 0 (0.0%) | 0 (0.0%) |
| Total | 2,588 (52.2%) | 2,370 (47.8%) |
Female Fertility in Brewster County
Fertility by Age in Brewster County
Average fertility rate in Brewster County is 47.0 births per 1,000 women. Women in the age bracket of 20 to 34 years have the highest fertility rate with 124.0 births per 1,000 women. Women in the age bracket of 20 to 34 years acount for 100.0% of all women with births.
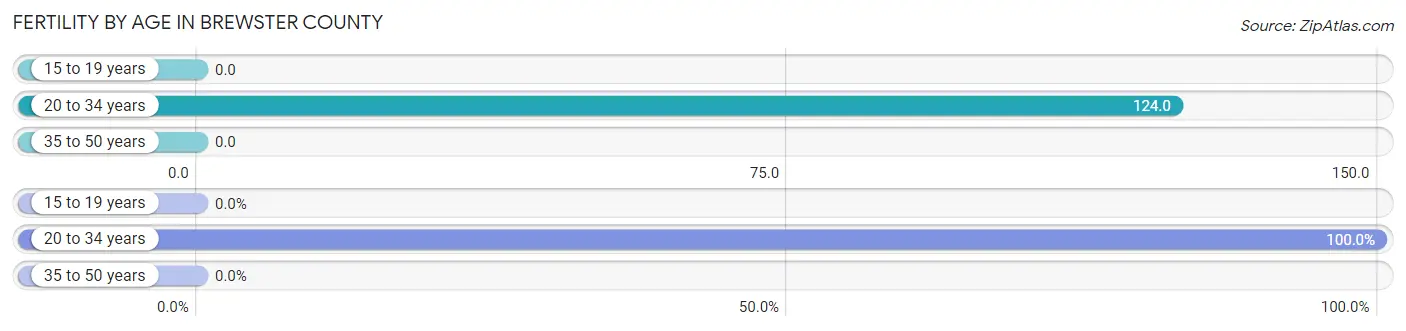
| Age Bracket | Women with Births | Births / 1,000 Women |
| 15 to 19 years | 0 (0.0%) | 0.0 |
| 20 to 34 years | 87 (100.0%) | 124.0 |
| 35 to 50 years | 0 (0.0%) | 0.0 |
| Total | 87 (100.0%) | 47.0 |
Fertility by Age by Marriage Status in Brewster County
74.7% of women with births (87) in Brewster County are married. The highest percentage of unmarried women with births falls into 20 to 34 years age bracket with 25.3% of them unmarried at the time of birth, while the lowest percentage of unmarried women with births belong to 20 to 34 years age bracket with 25.3% of them unmarried.
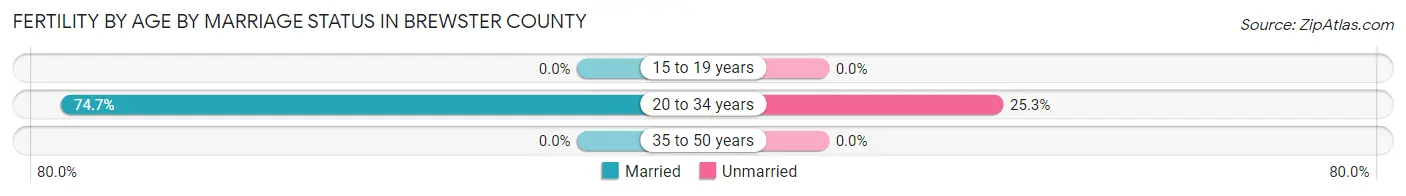
| Age Bracket | Married | Unmarried |
| 15 to 19 years | 0 (0.0%) | 0 (0.0%) |
| 20 to 34 years | 65 (74.7%) | 22 (25.3%) |
| 35 to 50 years | 0 (0.0%) | 0 (0.0%) |
| Total | 65 (74.7%) | 22 (25.3%) |
Fertility by Education in Brewster County
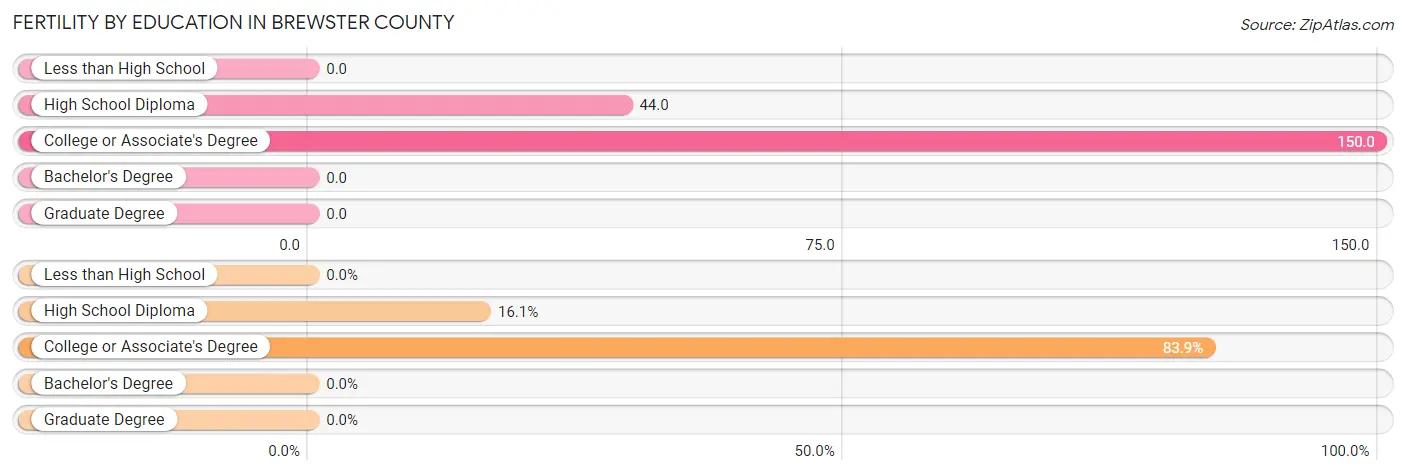
| Educational Attainment | Women with Births | Births / 1,000 Women |
| Less than High School | 0 (0.0%) | 0.0 |
| High School Diploma | 14 (16.1%) | 44.0 |
| College or Associate's Degree | 73 (83.9%) | 150.0 |
| Bachelor's Degree | 0 (0.0%) | 0.0 |
| Graduate Degree | 0 (0.0%) | 0.0 |
| Total | 87 (100.0%) | 47.0 |
Fertility by Education by Marriage Status in Brewster County
25.3% of women with births in Brewster County are unmarried. Women with the educational attainment of college or associate's degree are most likely to be married with 87.7% of them married at childbirth, while women with the educational attainment of high school diploma are least likely to be married with 92.9% of them unmarried at childbirth.
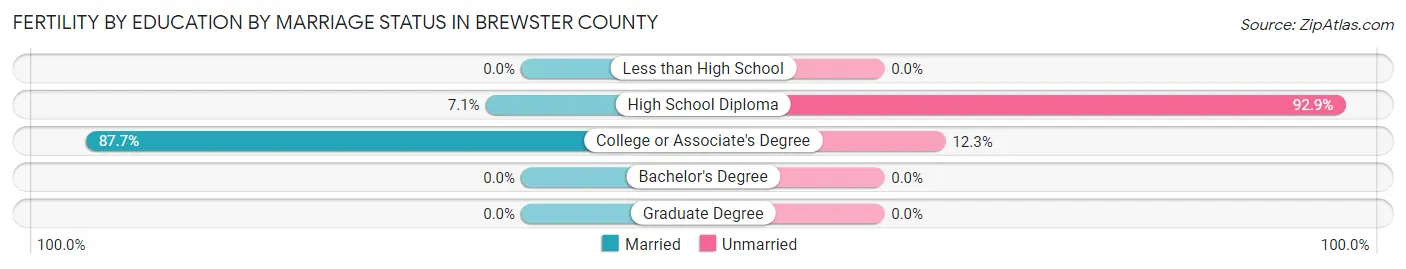
| Educational Attainment | Married | Unmarried |
| Less than High School | 0 (0.0%) | 0 (0.0%) |
| High School Diploma | 1 (7.1%) | 13 (92.9%) |
| College or Associate's Degree | 64 (87.7%) | 9 (12.3%) |
| Bachelor's Degree | 0 (0.0%) | 0 (0.0%) |
| Graduate Degree | 0 (0.0%) | 0 (0.0%) |
| Total | 65 (74.7%) | 22 (25.3%) |
Employment Characteristics in Brewster County
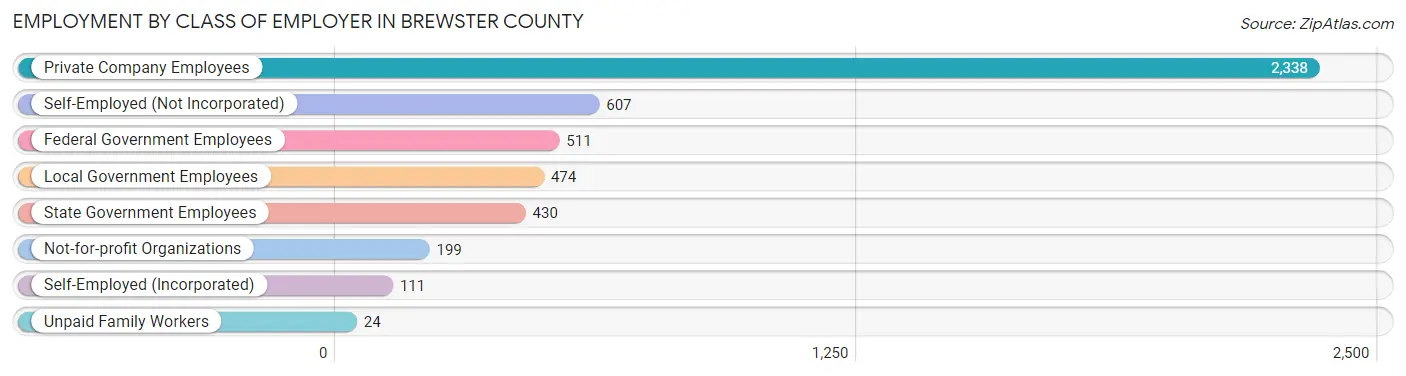
Employment by Class of Employer in Brewster County
Among the 4,694 employed individuals in Brewster County, private company employees (2,338 | 49.8%), self-employed (not incorporated) (607 | 12.9%), and federal government employees (511 | 10.9%) make up the most common classes of employment.
| Employer Class | # Employees | % Employees |
| Private Company Employees | 2,338 | 49.8% |
| Self-Employed (Incorporated) | 111 | 2.4% |
| Self-Employed (Not Incorporated) | 607 | 12.9% |
| Not-for-profit Organizations | 199 | 4.2% |
| Local Government Employees | 474 | 10.1% |
| State Government Employees | 430 | 9.2% |
| Federal Government Employees | 511 | 10.9% |
| Unpaid Family Workers | 24 | 0.5% |
| Total | 4,694 | 100.0% |
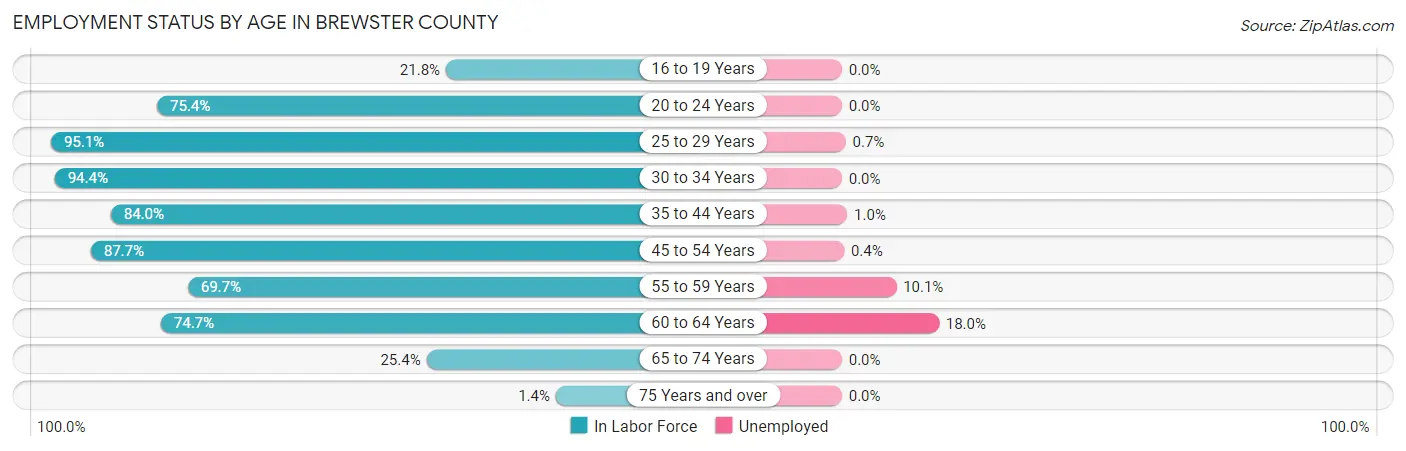
Employment Status by Age in Brewster County
According to the labor force statistics for Brewster County, out of the total population over 16 years of age (7,885), 62.4% or 4,920 individuals are in the labor force, with 3.0% or 148 of them unemployed. The age group with the highest labor force participation rate is 25 to 29 years, with 95.1% or 721 individuals in the labor force. Within the labor force, the 60 to 64 years age range has the highest percentage of unemployed individuals, with 18.0% or 86 of them being unemployed.
| Age Bracket | In Labor Force | Unemployed |
| 16 to 19 Years | 61 (21.8%) | 0 (0.0%) |
| 20 to 24 Years | 344 (75.4%) | 0 (0.0%) |
| 25 to 29 Years | 721 (95.1%) | 5 (0.7%) |
| 30 to 34 Years | 418 (94.4%) | 0 (0.0%) |
| 35 to 44 Years | 963 (84.0%) | 10 (1.0%) |
| 45 to 54 Years | 1,108 (87.7%) | 4 (0.4%) |
| 55 to 59 Years | 445 (69.7%) | 45 (10.1%) |
| 60 to 64 Years | 478 (74.7%) | 86 (18.0%) |
| 65 to 74 Years | 372 (25.4%) | 0 (0.0%) |
| 75 Years and over | 11 (1.4%) | 0 (0.0%) |
| Total | 4,920 (62.4%) | 148 (3.0%) |
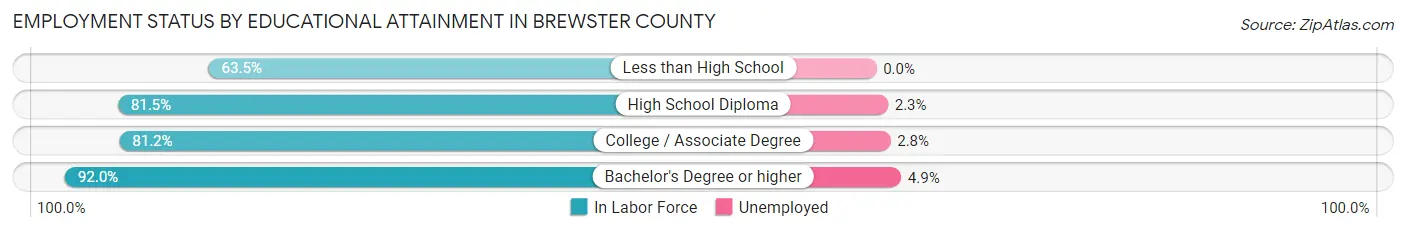
Employment Status by Educational Attainment in Brewster County
According to labor force statistics for Brewster County, 84.6% of individuals (4,136) out of the total population between 25 and 64 years of age (4,889) are in the labor force, with 3.6% or 149 of them being unemployed. The group with the highest labor force participation rate are those with the educational attainment of bachelor's degree or higher, with 92.0% or 2,223 individuals in the labor force. Within the labor force, individuals with bachelor's degree or higher education have the highest percentage of unemployment, with 4.9% or 109 of them being unemployed.
| Educational Attainment | In Labor Force | Unemployed |
| Less than High School | 352 (63.5%) | 0 (0.0%) |
| High School Diploma | 611 (81.5%) | 17 (2.3%) |
| College / Associate Degree | 949 (81.2%) | 33 (2.8%) |
| Bachelor's Degree or higher | 2,223 (92.0%) | 118 (4.9%) |
| Total | 4,136 (84.6%) | 176 (3.6%) |
Employment Occupations by Sex in Brewster County
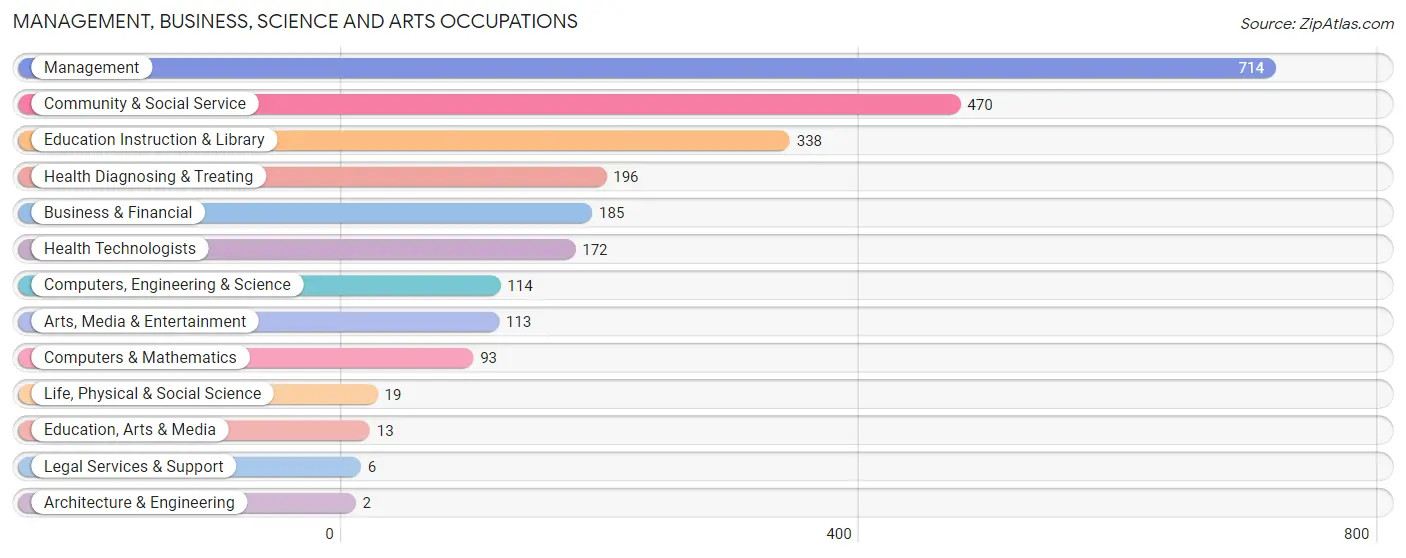
Management, Business, Science and Arts Occupations
The most common Management, Business, Science and Arts occupations in Brewster County are Management (714 | 15.0%), Community & Social Service (470 | 9.9%), Education Instruction & Library (338 | 7.1%), Health Diagnosing & Treating (196 | 4.1%), and Business & Financial (185 | 3.9%).
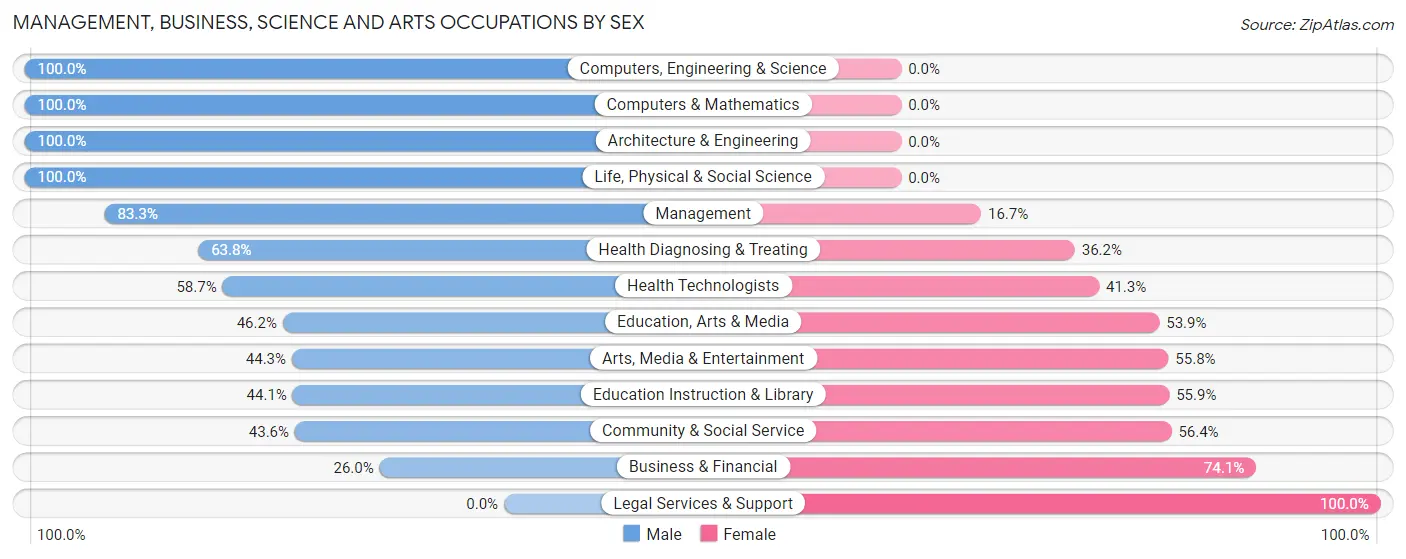
Management, Business, Science and Arts Occupations by Sex
Within the Management, Business, Science and Arts occupations in Brewster County, the most male-oriented occupations are Computers, Engineering & Science (100.0%), Computers & Mathematics (100.0%), and Architecture & Engineering (100.0%), while the most female-oriented occupations are Legal Services & Support (100.0%), Business & Financial (74.1%), and Community & Social Service (56.4%).
| Occupation | Male | Female |
| Management | 595 (83.3%) | 119 (16.7%) |
| Business & Financial | 48 (26.0%) | 137 (74.1%) |
| Computers, Engineering & Science | 114 (100.0%) | 0 (0.0%) |
| Computers & Mathematics | 93 (100.0%) | 0 (0.0%) |
| Architecture & Engineering | 2 (100.0%) | 0 (0.0%) |
| Life, Physical & Social Science | 19 (100.0%) | 0 (0.0%) |
| Community & Social Service | 205 (43.6%) | 265 (56.4%) |
| Education, Arts & Media | 6 (46.2%) | 7 (53.8%) |
| Legal Services & Support | 0 (0.0%) | 6 (100.0%) |
| Education Instruction & Library | 149 (44.1%) | 189 (55.9%) |
| Arts, Media & Entertainment | 50 (44.3%) | 63 (55.7%) |
| Health Diagnosing & Treating | 125 (63.8%) | 71 (36.2%) |
| Health Technologists | 101 (58.7%) | 71 (41.3%) |
| Total (Category) | 1,087 (64.7%) | 592 (35.3%) |
| Total (Overall) | 2,683 (56.2%) | 2,089 (43.8%) |
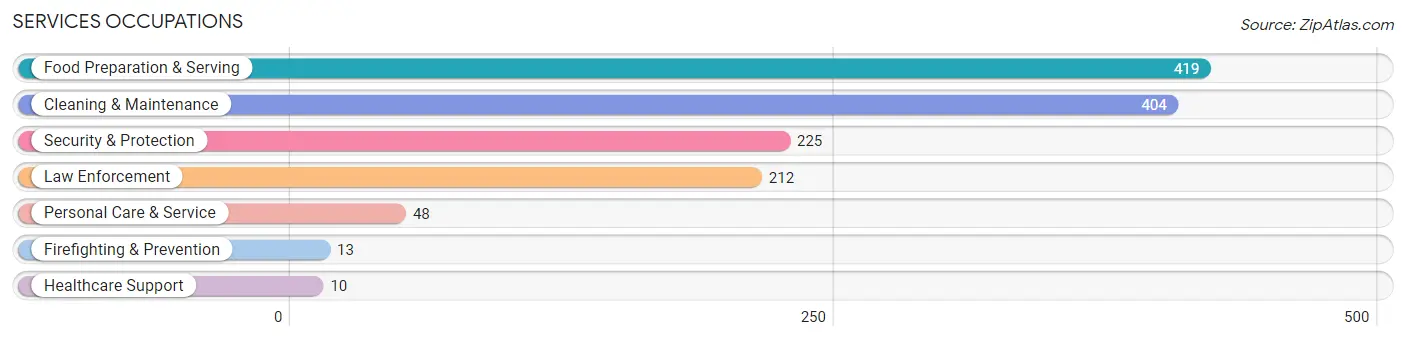
Services Occupations
The most common Services occupations in Brewster County are Food Preparation & Serving (419 | 8.8%), Cleaning & Maintenance (404 | 8.5%), Security & Protection (225 | 4.7%), Law Enforcement (212 | 4.4%), and Personal Care & Service (48 | 1.0%).
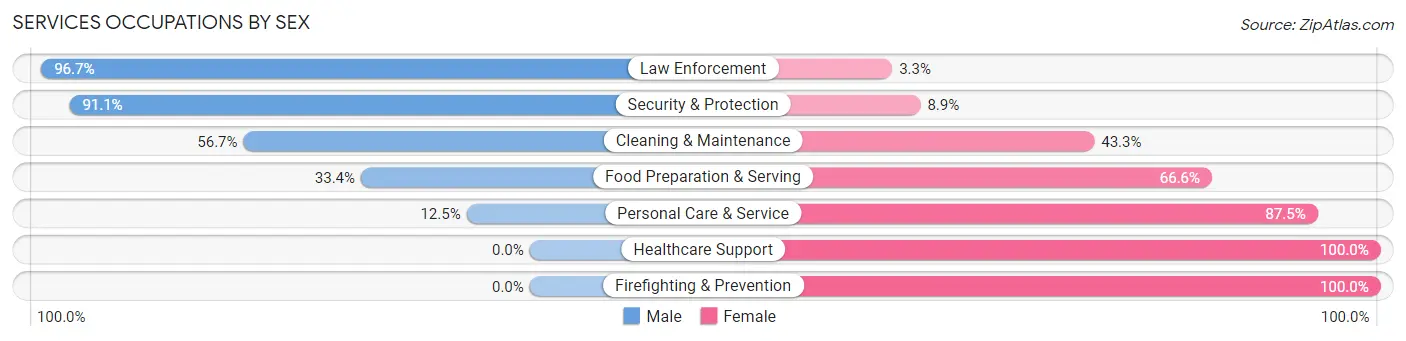
Services Occupations by Sex
Within the Services occupations in Brewster County, the most male-oriented occupations are Law Enforcement (96.7%), Security & Protection (91.1%), and Cleaning & Maintenance (56.7%), while the most female-oriented occupations are Healthcare Support (100.0%), Firefighting & Prevention (100.0%), and Personal Care & Service (87.5%).
| Occupation | Male | Female |
| Healthcare Support | 0 (0.0%) | 10 (100.0%) |
| Security & Protection | 205 (91.1%) | 20 (8.9%) |
| Firefighting & Prevention | 0 (0.0%) | 13 (100.0%) |
| Law Enforcement | 205 (96.7%) | 7 (3.3%) |
| Food Preparation & Serving | 140 (33.4%) | 279 (66.6%) |
| Cleaning & Maintenance | 229 (56.7%) | 175 (43.3%) |
| Personal Care & Service | 6 (12.5%) | 42 (87.5%) |
| Total (Category) | 580 (52.4%) | 526 (47.6%) |
| Total (Overall) | 2,683 (56.2%) | 2,089 (43.8%) |
Sales and Office Occupations
The most common Sales and Office occupations in Brewster County are Office & Administration (665 | 13.9%), and Sales & Related (542 | 11.4%).
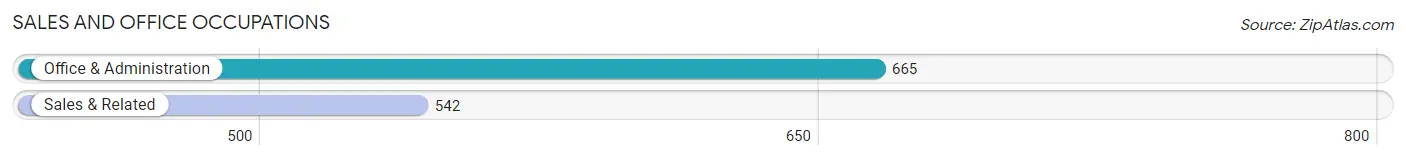
Sales and Office Occupations by Sex
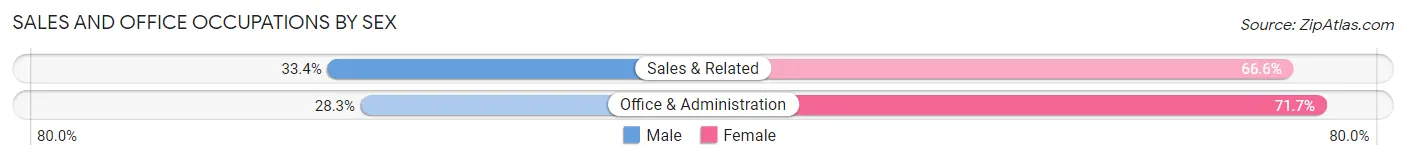
| Occupation | Male | Female |
| Sales & Related | 181 (33.4%) | 361 (66.6%) |
| Office & Administration | 188 (28.3%) | 477 (71.7%) |
| Total (Category) | 369 (30.6%) | 838 (69.4%) |
| Total (Overall) | 2,683 (56.2%) | 2,089 (43.8%) |
Natural Resources, Construction and Maintenance Occupations
The most common Natural Resources, Construction and Maintenance occupations in Brewster County are Installation, Maintenance & Repair (176 | 3.7%), Construction & Extraction (165 | 3.5%), and Farming, Fishing & Forestry (32 | 0.7%).
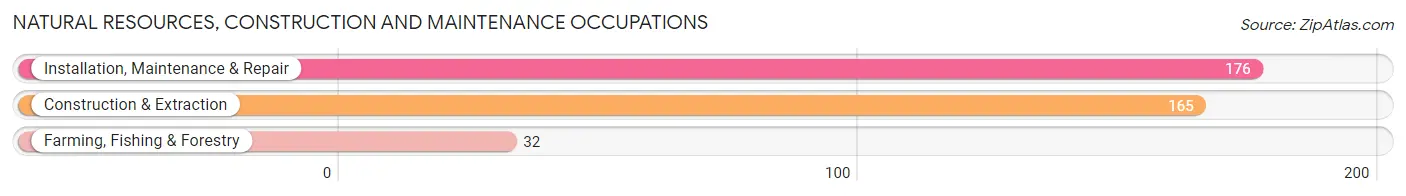
Natural Resources, Construction and Maintenance Occupations by Sex
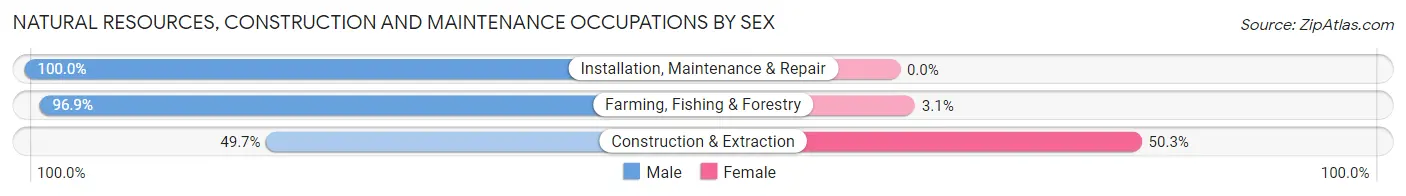
| Occupation | Male | Female |
| Farming, Fishing & Forestry | 31 (96.9%) | 1 (3.1%) |
| Construction & Extraction | 82 (49.7%) | 83 (50.3%) |
| Installation, Maintenance & Repair | 176 (100.0%) | 0 (0.0%) |
| Total (Category) | 289 (77.5%) | 84 (22.5%) |
| Total (Overall) | 2,683 (56.2%) | 2,089 (43.8%) |
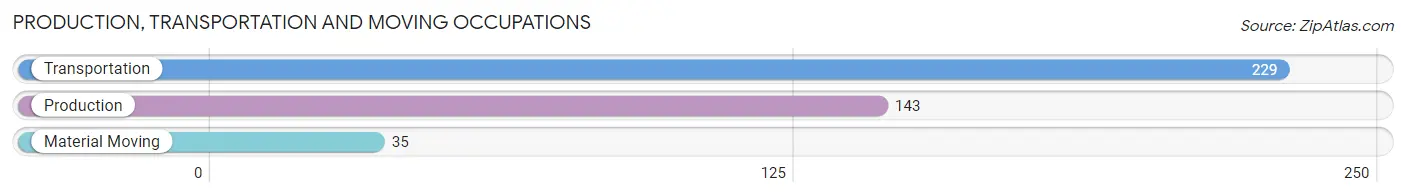
Production, Transportation and Moving Occupations
The most common Production, Transportation and Moving occupations in Brewster County are Transportation (229 | 4.8%), Production (143 | 3.0%), and Material Moving (35 | 0.7%).
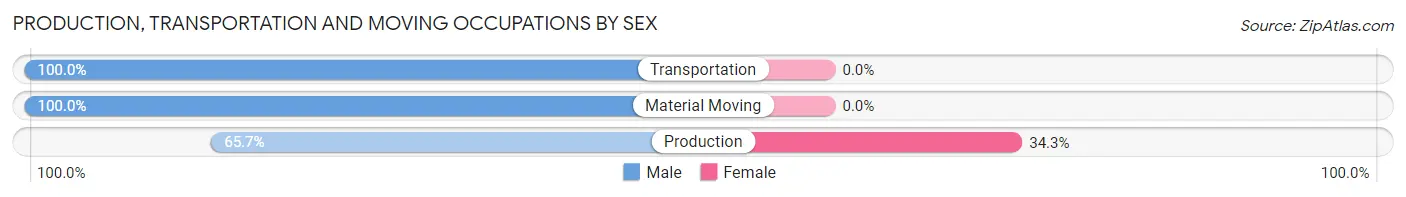
Production, Transportation and Moving Occupations by Sex
| Occupation | Male | Female |
| Production | 94 (65.7%) | 49 (34.3%) |
| Transportation | 229 (100.0%) | 0 (0.0%) |
| Material Moving | 35 (100.0%) | 0 (0.0%) |
| Total (Category) | 358 (88.0%) | 49 (12.0%) |
| Total (Overall) | 2,683 (56.2%) | 2,089 (43.8%) |
Employment Industries by Sex in Brewster County
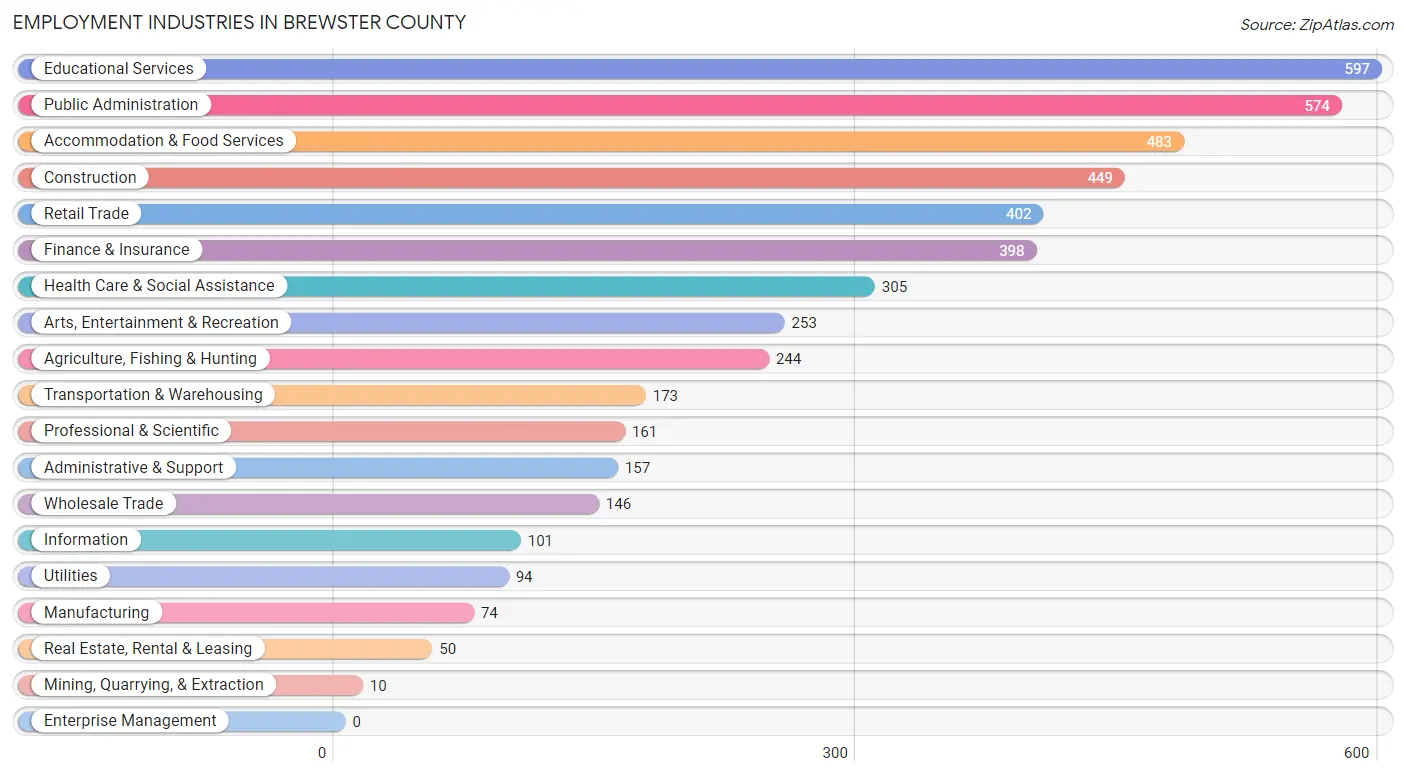
Employment Industries in Brewster County
The major employment industries in Brewster County include Educational Services (597 | 12.5%), Public Administration (574 | 12.0%), Accommodation & Food Services (483 | 10.1%), Construction (449 | 9.4%), and Retail Trade (402 | 8.4%).
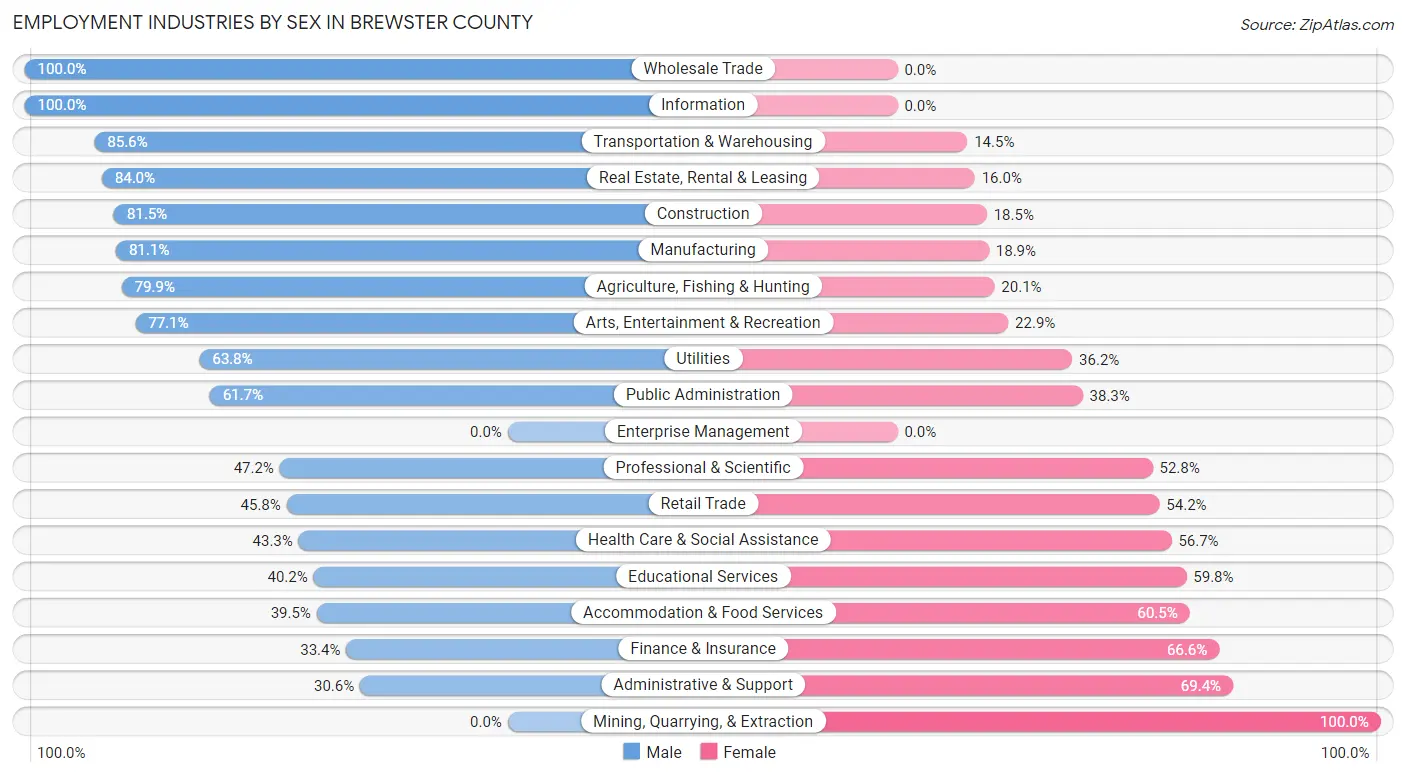
Employment Industries by Sex in Brewster County
The Brewster County industries that see more men than women are Wholesale Trade (100.0%), Information (100.0%), and Transportation & Warehousing (85.6%), whereas the industries that tend to have a higher number of women are Mining, Quarrying, & Extraction (100.0%), Administrative & Support (69.4%), and Finance & Insurance (66.6%).
| Industry | Male | Female |
| Agriculture, Fishing & Hunting | 195 (79.9%) | 49 (20.1%) |
| Mining, Quarrying, & Extraction | 0 (0.0%) | 10 (100.0%) |
| Construction | 366 (81.5%) | 83 (18.5%) |
| Manufacturing | 60 (81.1%) | 14 (18.9%) |
| Wholesale Trade | 146 (100.0%) | 0 (0.0%) |
| Retail Trade | 184 (45.8%) | 218 (54.2%) |
| Transportation & Warehousing | 148 (85.6%) | 25 (14.4%) |
| Utilities | 60 (63.8%) | 34 (36.2%) |
| Information | 101 (100.0%) | 0 (0.0%) |
| Finance & Insurance | 133 (33.4%) | 265 (66.6%) |
| Real Estate, Rental & Leasing | 42 (84.0%) | 8 (16.0%) |
| Professional & Scientific | 76 (47.2%) | 85 (52.8%) |
| Enterprise Management | 0 (0.0%) | 0 (0.0%) |
| Administrative & Support | 48 (30.6%) | 109 (69.4%) |
| Educational Services | 240 (40.2%) | 357 (59.8%) |
| Health Care & Social Assistance | 132 (43.3%) | 173 (56.7%) |
| Arts, Entertainment & Recreation | 195 (77.1%) | 58 (22.9%) |
| Accommodation & Food Services | 191 (39.5%) | 292 (60.5%) |
| Public Administration | 354 (61.7%) | 220 (38.3%) |
| Total | 2,683 (56.2%) | 2,089 (43.8%) |
Education in Brewster County
School Enrollment in Brewster County
The most common levels of schooling among the 2,038 students in Brewster County are college / undergraduate (542 | 26.6%), elementary school (380 | 18.6%), and high school (318 | 15.6%).
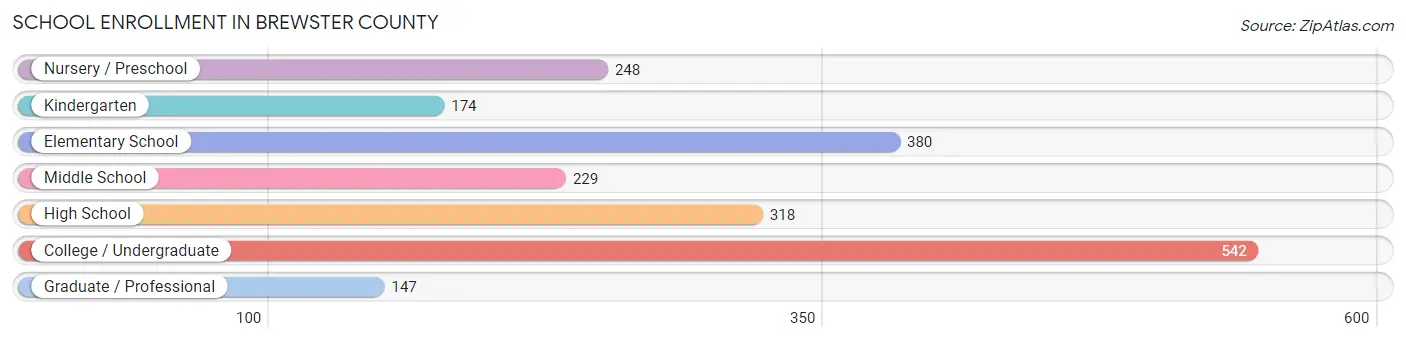
| School Level | # Students | % Students |
| Nursery / Preschool | 248 | 12.2% |
| Kindergarten | 174 | 8.5% |
| Elementary School | 380 | 18.6% |
| Middle School | 229 | 11.2% |
| High School | 318 | 15.6% |
| College / Undergraduate | 542 | 26.6% |
| Graduate / Professional | 147 | 7.2% |
| Total | 2,038 | 100.0% |
School Enrollment by Age by Funding Source in Brewster County
Out of a total of 2,038 students who are enrolled in schools in Brewster County, 228 (11.2%) attend a private institution, while the remaining 1,810 (88.8%) are enrolled in public schools. The age group of 18 to 19 year olds has the highest likelihood of being enrolled in private schools, with 32 (45.7% in the age bracket) enrolled. Conversely, the age group of 10 to 14 year olds has the lowest likelihood of being enrolled in a private school, with 409 (100.0% in the age bracket) attending a public institution.
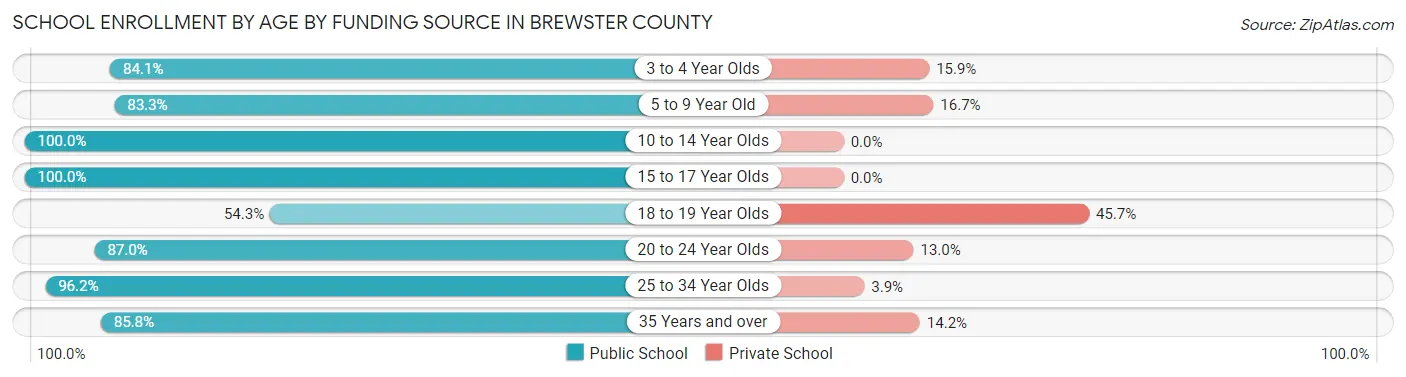
| Age Bracket | Public School | Private School |
| 3 to 4 Year Olds | 95 (84.1%) | 18 (15.9%) |
| 5 to 9 Year Old | 533 (83.3%) | 107 (16.7%) |
| 10 to 14 Year Olds | 409 (100.0%) | 0 (0.0%) |
| 15 to 17 Year Olds | 185 (100.0%) | 0 (0.0%) |
| 18 to 19 Year Olds | 38 (54.3%) | 32 (45.7%) |
| 20 to 24 Year Olds | 274 (87.0%) | 41 (13.0%) |
| 25 to 34 Year Olds | 125 (96.2%) | 5 (3.8%) |
| 35 Years and over | 151 (85.8%) | 25 (14.2%) |
| Total | 1,810 (88.8%) | 228 (11.2%) |
Educational Attainment by Field of Study in Brewster County
Business (602 | 17.2%), bio, nature & agricultural (521 | 14.9%), arts & humanities (405 | 11.6%), science & technology (348 | 10.0%), and education (300 | 8.6%) are the most common fields of study among 3,489 individuals in Brewster County who have obtained a bachelor's degree or higher.
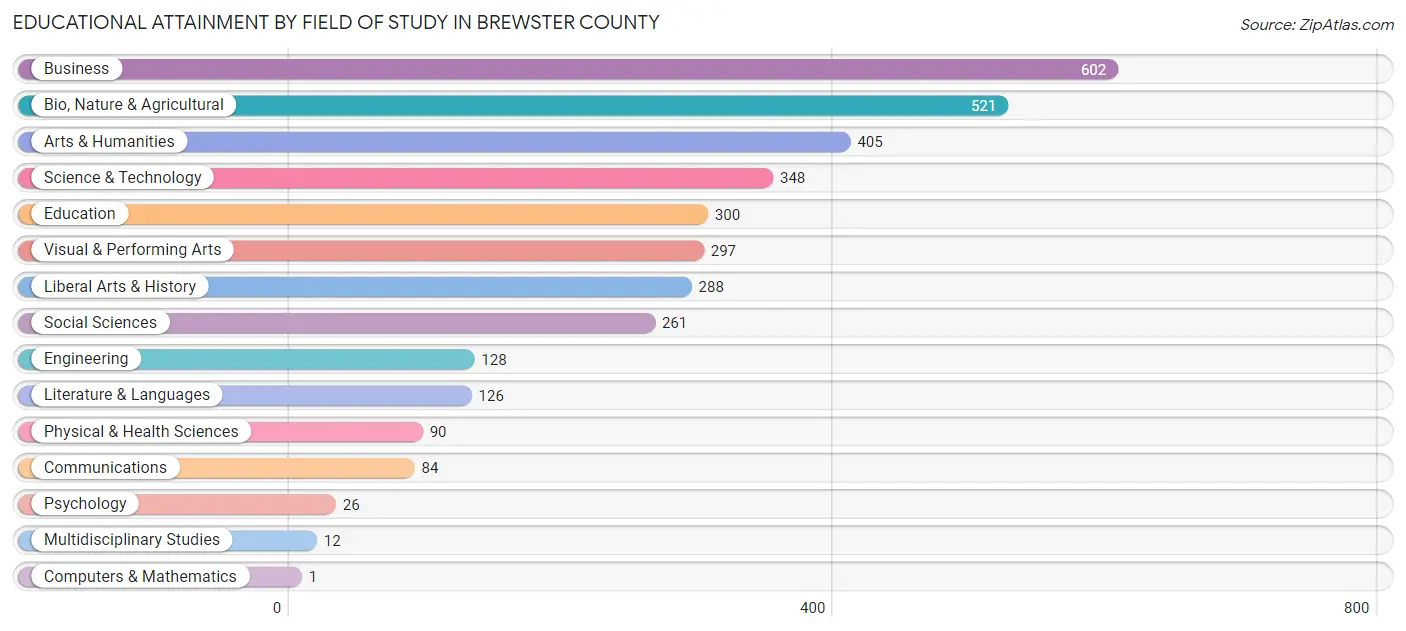
| Field of Study | # Graduates | % Graduates |
| Computers & Mathematics | 1 | 0.0% |
| Bio, Nature & Agricultural | 521 | 14.9% |
| Physical & Health Sciences | 90 | 2.6% |
| Psychology | 26 | 0.7% |
| Social Sciences | 261 | 7.5% |
| Engineering | 128 | 3.7% |
| Multidisciplinary Studies | 12 | 0.3% |
| Science & Technology | 348 | 10.0% |
| Business | 602 | 17.2% |
| Education | 300 | 8.6% |
| Literature & Languages | 126 | 3.6% |
| Liberal Arts & History | 288 | 8.3% |
| Visual & Performing Arts | 297 | 8.5% |
| Communications | 84 | 2.4% |
| Arts & Humanities | 405 | 11.6% |
| Total | 3,489 | 100.0% |
Transportation & Commute in Brewster County
Vehicle Availability by Sex in Brewster County
The most prevalent vehicle ownership categories in Brewster County are males with 2 vehicles (1,141, accounting for 43.6%) and females with 2 vehicles (1,002, making up 55.7%).
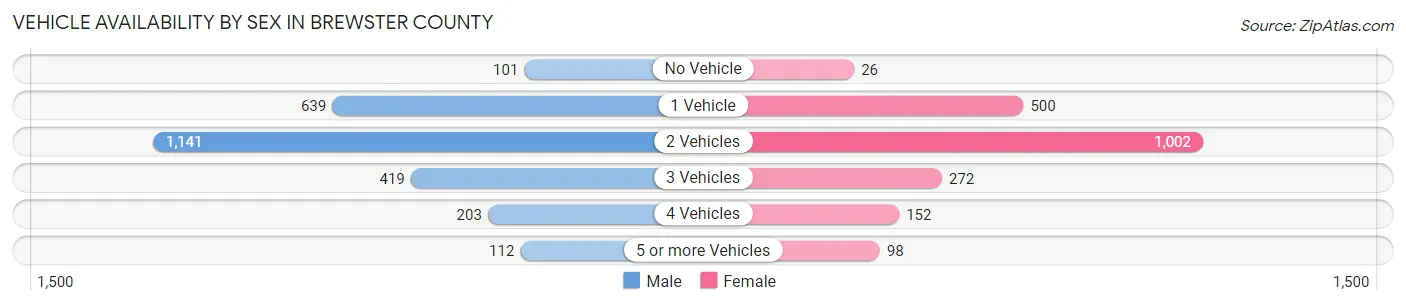
| Vehicles Available | Male | Female |
| No Vehicle | 101 (3.9%) | 26 (1.3%) |
| 1 Vehicle | 639 (24.4%) | 500 (24.4%) |
| 2 Vehicles | 1,141 (43.6%) | 1,002 (48.9%) |
| 3 Vehicles | 419 (16.0%) | 272 (13.3%) |
| 4 Vehicles | 203 (7.8%) | 152 (7.4%) |
| 5 or more Vehicles | 112 (4.3%) | 98 (4.8%) |
| Total | 2,615 (100.0%) | 2,050 (100.0%) |
Commute Time in Brewster County
The most frequently occuring commute durations in Brewster County are 5 to 9 minutes (1,276 commuters, 30.4%), less than 5 minutes (770 commuters, 18.4%), and 10 to 14 minutes (539 commuters, 12.9%).
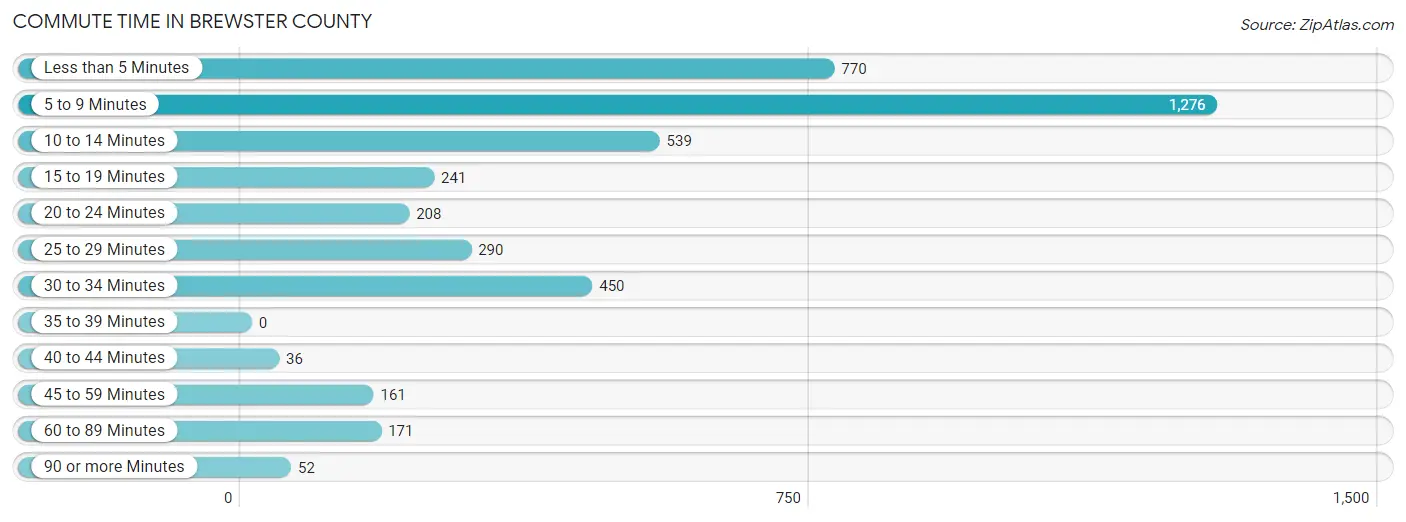
| Commute Time | # Commuters | % Commuters |
| Less than 5 Minutes | 770 | 18.4% |
| 5 to 9 Minutes | 1,276 | 30.4% |
| 10 to 14 Minutes | 539 | 12.9% |
| 15 to 19 Minutes | 241 | 5.8% |
| 20 to 24 Minutes | 208 | 5.0% |
| 25 to 29 Minutes | 290 | 6.9% |
| 30 to 34 Minutes | 450 | 10.7% |
| 35 to 39 Minutes | 0 | 0.0% |
| 40 to 44 Minutes | 36 | 0.9% |
| 45 to 59 Minutes | 161 | 3.8% |
| 60 to 89 Minutes | 171 | 4.1% |
| 90 or more Minutes | 52 | 1.2% |
Commute Time by Sex in Brewster County
The most common commute times in Brewster County are 5 to 9 minutes (748 commuters, 31.7%) for males and 5 to 9 minutes (528 commuters, 28.8%) for females.
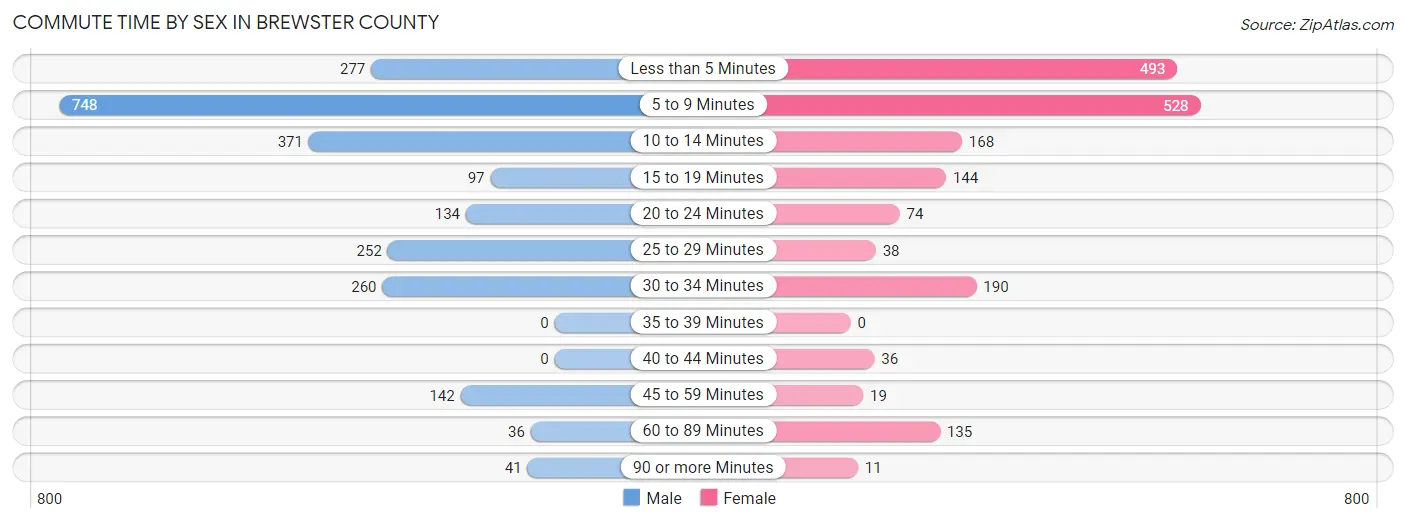
| Commute Time | Male | Female |
| Less than 5 Minutes | 277 (11.7%) | 493 (26.9%) |
| 5 to 9 Minutes | 748 (31.7%) | 528 (28.8%) |
| 10 to 14 Minutes | 371 (15.7%) | 168 (9.1%) |
| 15 to 19 Minutes | 97 (4.1%) | 144 (7.8%) |
| 20 to 24 Minutes | 134 (5.7%) | 74 (4.0%) |
| 25 to 29 Minutes | 252 (10.7%) | 38 (2.1%) |
| 30 to 34 Minutes | 260 (11.0%) | 190 (10.3%) |
| 35 to 39 Minutes | 0 (0.0%) | 0 (0.0%) |
| 40 to 44 Minutes | 0 (0.0%) | 36 (2.0%) |
| 45 to 59 Minutes | 142 (6.0%) | 19 (1.0%) |
| 60 to 89 Minutes | 36 (1.5%) | 135 (7.3%) |
| 90 or more Minutes | 41 (1.7%) | 11 (0.6%) |
Time of Departure to Work by Sex in Brewster County
The most frequent times of departure to work in Brewster County are 7:00 AM to 7:29 AM (533, 22.6%) for males and 7:00 AM to 7:29 AM (399, 21.7%) for females.
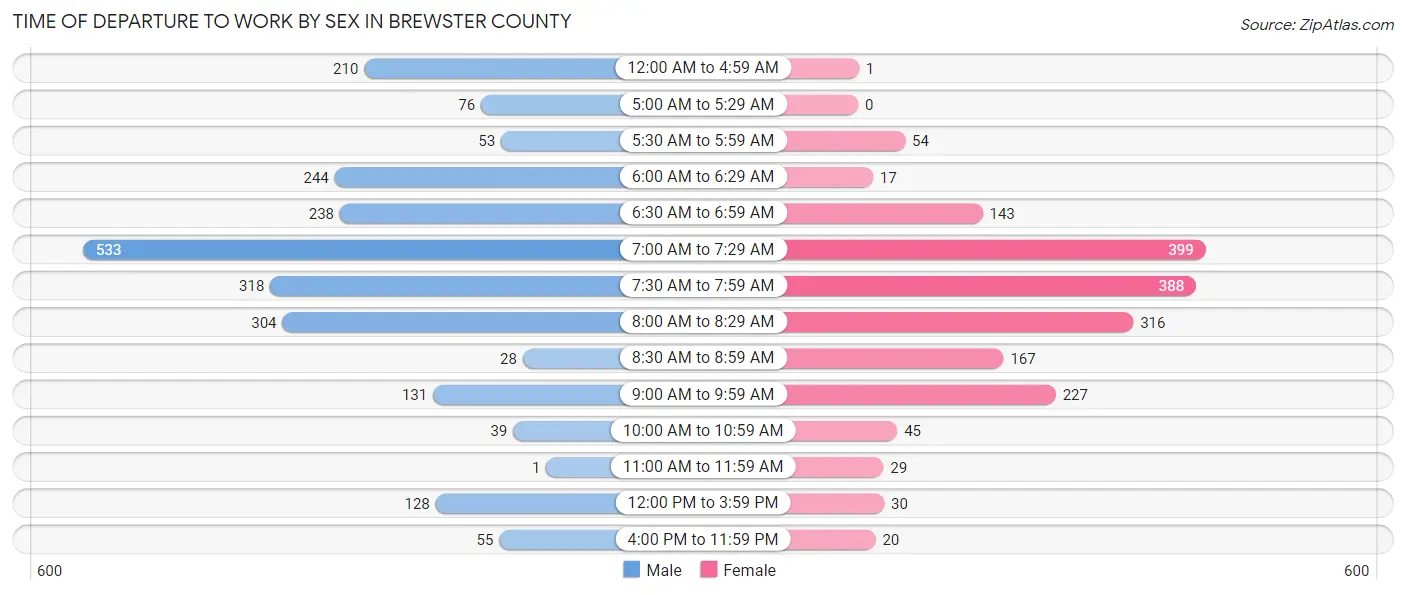
| Time of Departure | Male | Female |
| 12:00 AM to 4:59 AM | 210 (8.9%) | 1 (0.1%) |
| 5:00 AM to 5:29 AM | 76 (3.2%) | 0 (0.0%) |
| 5:30 AM to 5:59 AM | 53 (2.2%) | 54 (2.9%) |
| 6:00 AM to 6:29 AM | 244 (10.3%) | 17 (0.9%) |
| 6:30 AM to 6:59 AM | 238 (10.1%) | 143 (7.8%) |
| 7:00 AM to 7:29 AM | 533 (22.6%) | 399 (21.7%) |
| 7:30 AM to 7:59 AM | 318 (13.5%) | 388 (21.1%) |
| 8:00 AM to 8:29 AM | 304 (12.9%) | 316 (17.2%) |
| 8:30 AM to 8:59 AM | 28 (1.2%) | 167 (9.1%) |
| 9:00 AM to 9:59 AM | 131 (5.6%) | 227 (12.4%) |
| 10:00 AM to 10:59 AM | 39 (1.7%) | 45 (2.5%) |
| 11:00 AM to 11:59 AM | 1 (0.0%) | 29 (1.6%) |
| 12:00 PM to 3:59 PM | 128 (5.4%) | 30 (1.6%) |
| 4:00 PM to 11:59 PM | 55 (2.3%) | 20 (1.1%) |
| Total | 2,358 (100.0%) | 1,836 (100.0%) |
Housing Occupancy in Brewster County
Occupancy by Ownership in Brewster County
Of the total 4,958 dwellings in Brewster County, owner-occupied units account for 2,968 (59.9%), while renter-occupied units make up 1,990 (40.1%).
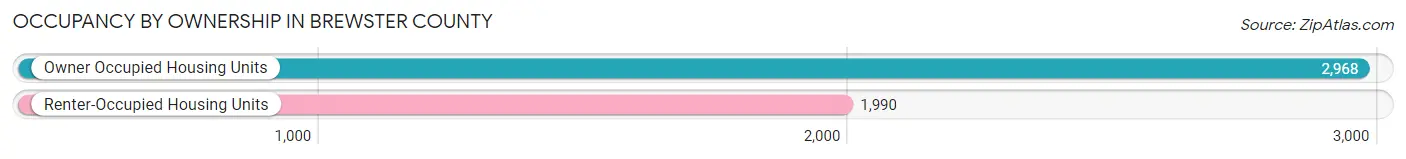
| Occupancy | # Housing Units | % Housing Units |
| Owner Occupied Housing Units | 2,968 | 59.9% |
| Renter-Occupied Housing Units | 1,990 | 40.1% |
| Total Occupied Housing Units | 4,958 | 100.0% |
Occupancy by Household Size in Brewster County
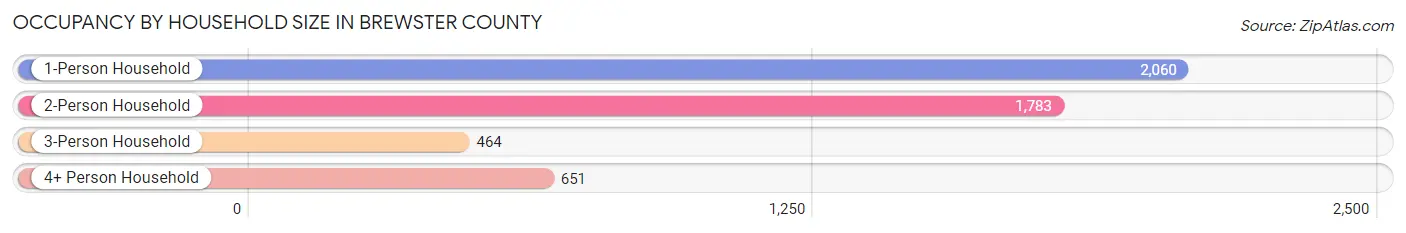
| Household Size | # Housing Units | % Housing Units |
| 1-Person Household | 2,060 | 41.5% |
| 2-Person Household | 1,783 | 36.0% |
| 3-Person Household | 464 | 9.4% |
| 4+ Person Household | 651 | 13.1% |
| Total Housing Units | 4,958 | 100.0% |
Occupancy by Ownership by Household Size in Brewster County
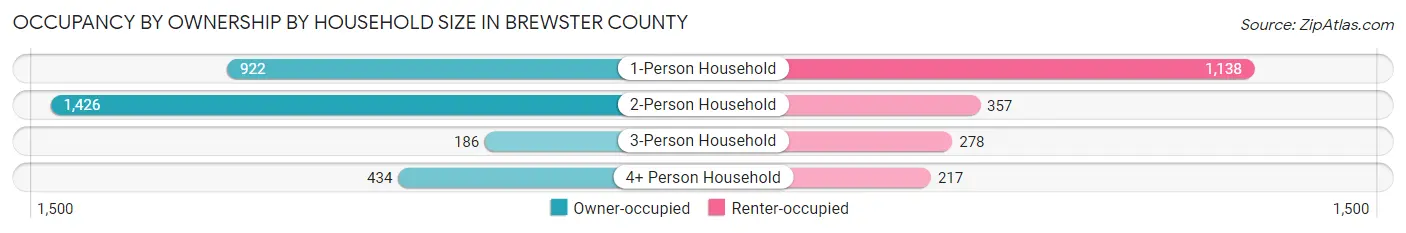
| Household Size | Owner-occupied | Renter-occupied |
| 1-Person Household | 922 (44.8%) | 1,138 (55.2%) |
| 2-Person Household | 1,426 (80.0%) | 357 (20.0%) |
| 3-Person Household | 186 (40.1%) | 278 (59.9%) |
| 4+ Person Household | 434 (66.7%) | 217 (33.3%) |
| Total Housing Units | 2,968 (59.9%) | 1,990 (40.1%) |
Occupancy by Educational Attainment in Brewster County
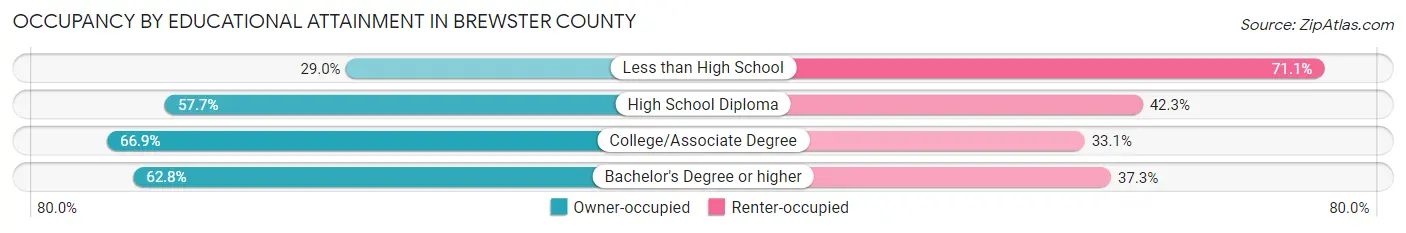
| Household Size | Owner-occupied | Renter-occupied |
| Less than High School | 141 (28.9%) | 346 (71.1%) |
| High School Diploma | 385 (57.7%) | 282 (42.3%) |
| College/Associate Degree | 884 (66.9%) | 437 (33.1%) |
| Bachelor's Degree or higher | 1,558 (62.7%) | 925 (37.2%) |
Occupancy by Age of Householder in Brewster County
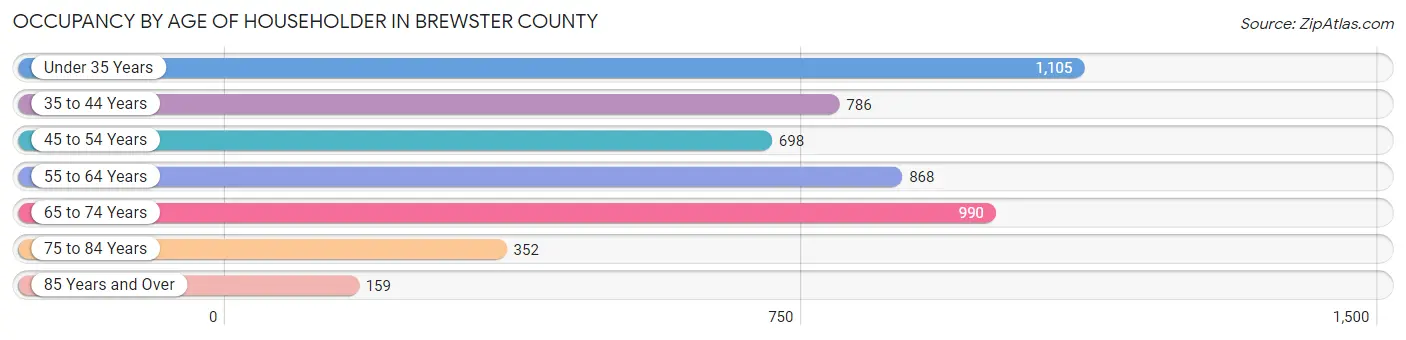
| Age Bracket | # Households | % Households |
| Under 35 Years | 1,105 | 22.3% |
| 35 to 44 Years | 786 | 15.9% |
| 45 to 54 Years | 698 | 14.1% |
| 55 to 64 Years | 868 | 17.5% |
| 65 to 74 Years | 990 | 20.0% |
| 75 to 84 Years | 352 | 7.1% |
| 85 Years and Over | 159 | 3.2% |
| Total | 4,958 | 100.0% |
Housing Finances in Brewster County
Median Income by Occupancy in Brewster County
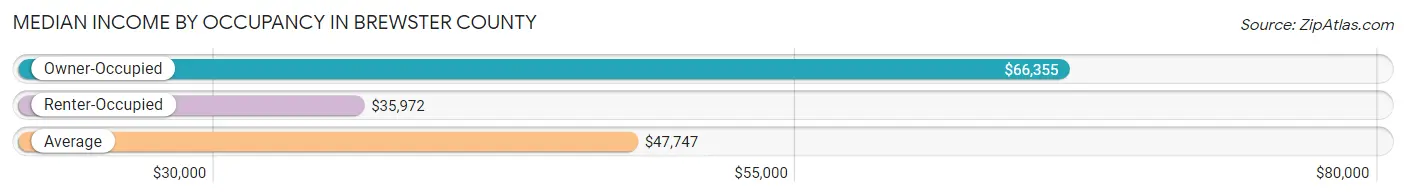
| Occupancy Type | # Households | Median Income |
| Owner-Occupied | 2,968 (59.9%) | $66,355 |
| Renter-Occupied | 1,990 (40.1%) | $35,972 |
| Average | 4,958 (100.0%) | $47,747 |
Occupancy by Householder Income Bracket in Brewster County
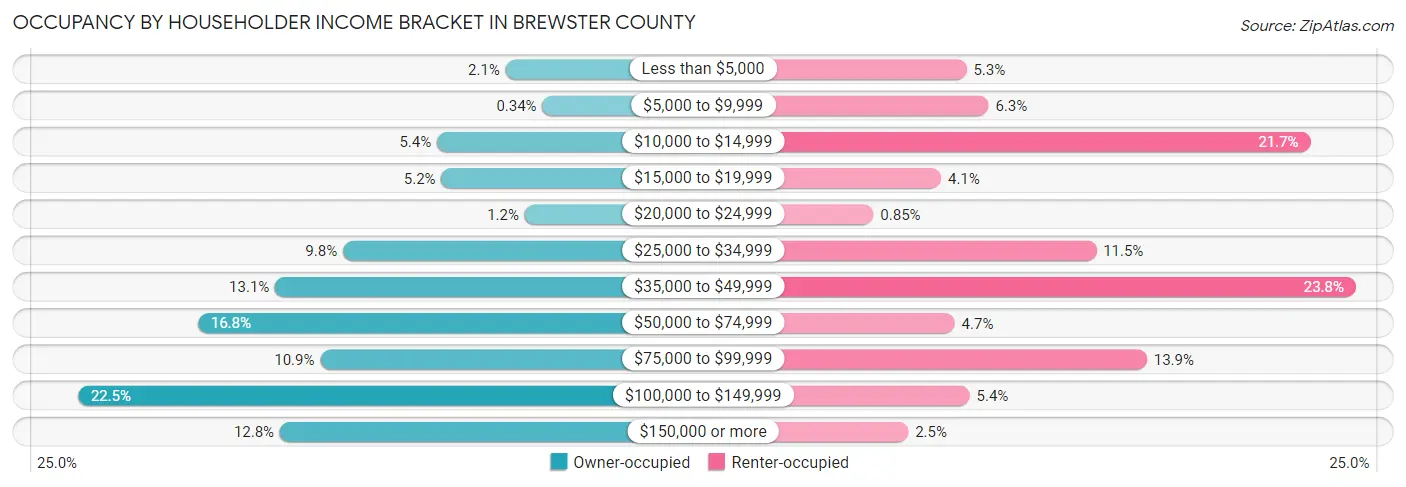
| Income Bracket | Owner-occupied | Renter-occupied |
| Less than $5,000 | 62 (2.1%) | 105 (5.3%) |
| $5,000 to $9,999 | 10 (0.3%) | 126 (6.3%) |
| $10,000 to $14,999 | 159 (5.4%) | 431 (21.7%) |
| $15,000 to $19,999 | 153 (5.1%) | 81 (4.1%) |
| $20,000 to $24,999 | 35 (1.2%) | 17 (0.9%) |
| $25,000 to $34,999 | 292 (9.8%) | 228 (11.5%) |
| $35,000 to $49,999 | 388 (13.1%) | 474 (23.8%) |
| $50,000 to $74,999 | 497 (16.8%) | 94 (4.7%) |
| $75,000 to $99,999 | 324 (10.9%) | 276 (13.9%) |
| $100,000 to $149,999 | 667 (22.5%) | 108 (5.4%) |
| $150,000 or more | 381 (12.8%) | 50 (2.5%) |
| Total | 2,968 (100.0%) | 1,990 (100.0%) |
Monthly Housing Cost Tiers in Brewster County
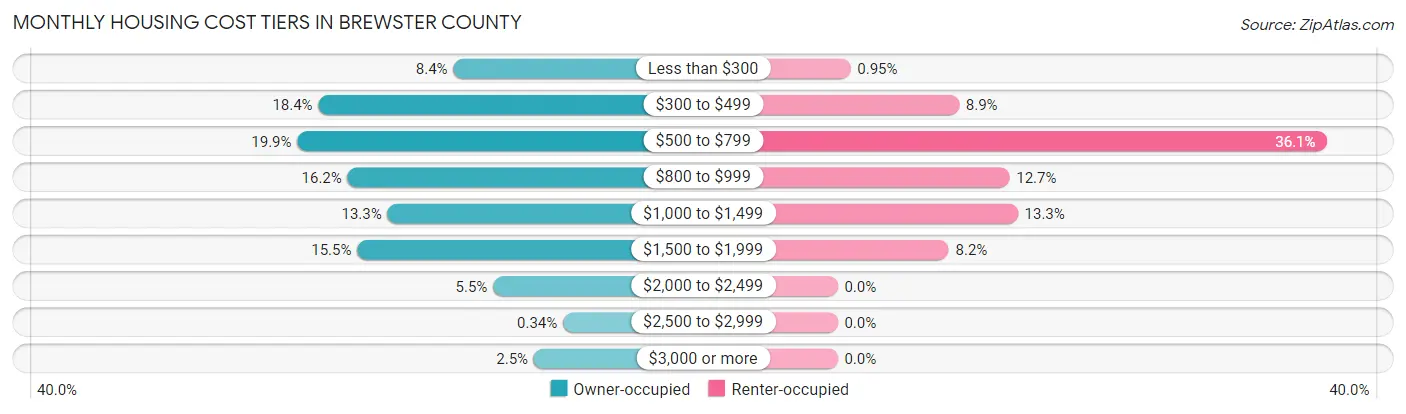
| Monthly Cost | Owner-occupied | Renter-occupied |
| Less than $300 | 250 (8.4%) | 19 (0.9%) |
| $300 to $499 | 545 (18.4%) | 178 (8.9%) |
| $500 to $799 | 591 (19.9%) | 718 (36.1%) |
| $800 to $999 | 481 (16.2%) | 252 (12.7%) |
| $1,000 to $1,499 | 394 (13.3%) | 264 (13.3%) |
| $1,500 to $1,999 | 460 (15.5%) | 163 (8.2%) |
| $2,000 to $2,499 | 163 (5.5%) | 0 (0.0%) |
| $2,500 to $2,999 | 10 (0.3%) | 0 (0.0%) |
| $3,000 or more | 74 (2.5%) | 0 (0.0%) |
| Total | 2,968 (100.0%) | 1,990 (100.0%) |
Physical Housing Characteristics in Brewster County
Housing Structures in Brewster County
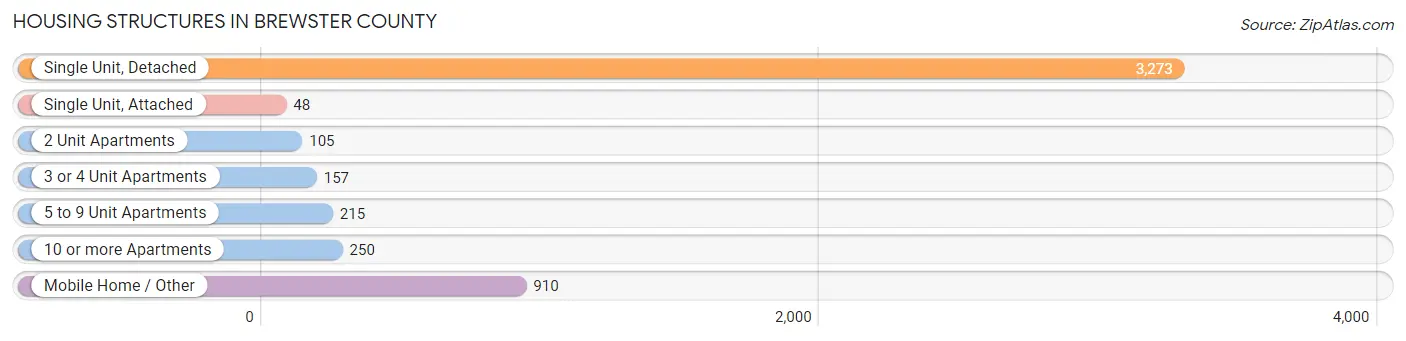
| Structure Type | # Housing Units | % Housing Units |
| Single Unit, Detached | 3,273 | 66.0% |
| Single Unit, Attached | 48 | 1.0% |
| 2 Unit Apartments | 105 | 2.1% |
| 3 or 4 Unit Apartments | 157 | 3.2% |
| 5 to 9 Unit Apartments | 215 | 4.3% |
| 10 or more Apartments | 250 | 5.0% |
| Mobile Home / Other | 910 | 18.3% |
| Total | 4,958 | 100.0% |
Housing Structures by Occupancy in Brewster County
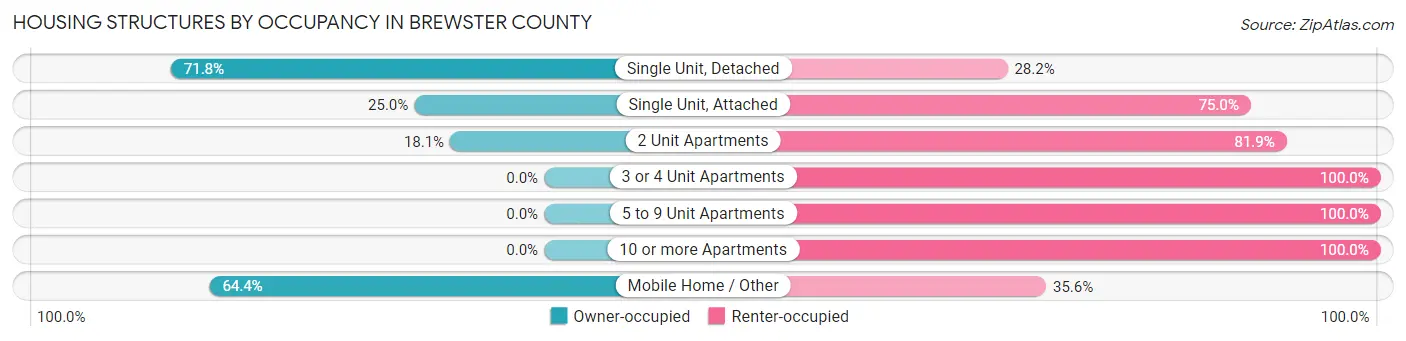
| Structure Type | Owner-occupied | Renter-occupied |
| Single Unit, Detached | 2,351 (71.8%) | 922 (28.2%) |
| Single Unit, Attached | 12 (25.0%) | 36 (75.0%) |
| 2 Unit Apartments | 19 (18.1%) | 86 (81.9%) |
| 3 or 4 Unit Apartments | 0 (0.0%) | 157 (100.0%) |
| 5 to 9 Unit Apartments | 0 (0.0%) | 215 (100.0%) |
| 10 or more Apartments | 0 (0.0%) | 250 (100.0%) |
| Mobile Home / Other | 586 (64.4%) | 324 (35.6%) |
| Total | 2,968 (59.9%) | 1,990 (40.1%) |
Housing Structures by Number of Rooms in Brewster County
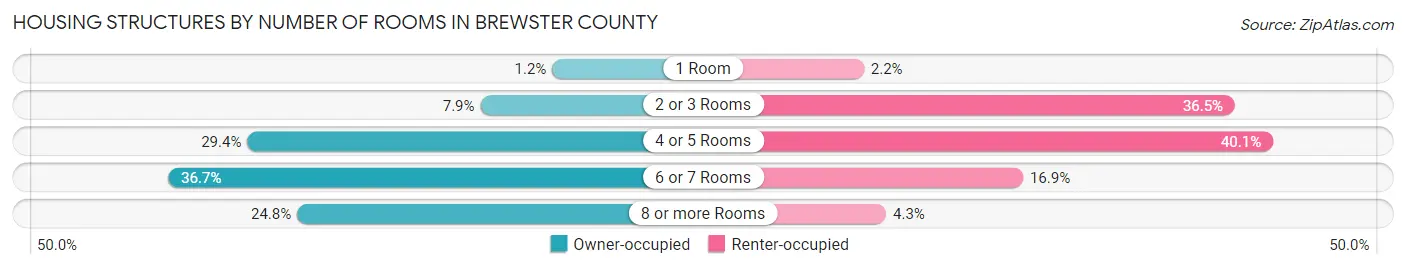
| Number of Rooms | Owner-occupied | Renter-occupied |
| 1 Room | 36 (1.2%) | 44 (2.2%) |
| 2 or 3 Rooms | 233 (7.9%) | 727 (36.5%) |
| 4 or 5 Rooms | 873 (29.4%) | 797 (40.1%) |
| 6 or 7 Rooms | 1,090 (36.7%) | 337 (16.9%) |
| 8 or more Rooms | 736 (24.8%) | 85 (4.3%) |
| Total | 2,968 (100.0%) | 1,990 (100.0%) |
Housing Structure by Heating Type in Brewster County
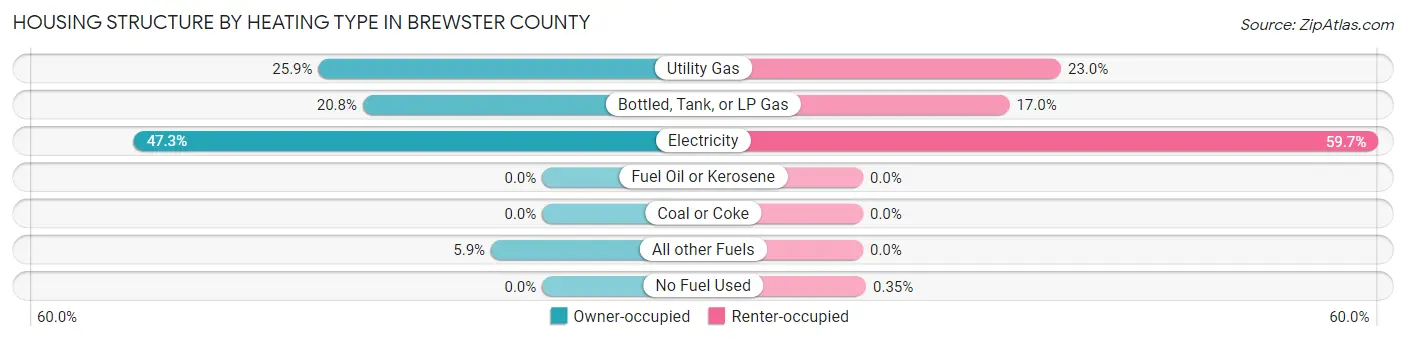
| Heating Type | Owner-occupied | Renter-occupied |
| Utility Gas | 770 (25.9%) | 457 (23.0%) |
| Bottled, Tank, or LP Gas | 617 (20.8%) | 338 (17.0%) |
| Electricity | 1,405 (47.3%) | 1,188 (59.7%) |
| Fuel Oil or Kerosene | 0 (0.0%) | 0 (0.0%) |
| Coal or Coke | 0 (0.0%) | 0 (0.0%) |
| All other Fuels | 176 (5.9%) | 0 (0.0%) |
| No Fuel Used | 0 (0.0%) | 7 (0.4%) |
| Total | 2,968 (100.0%) | 1,990 (100.0%) |
Household Vehicle Usage in Brewster County
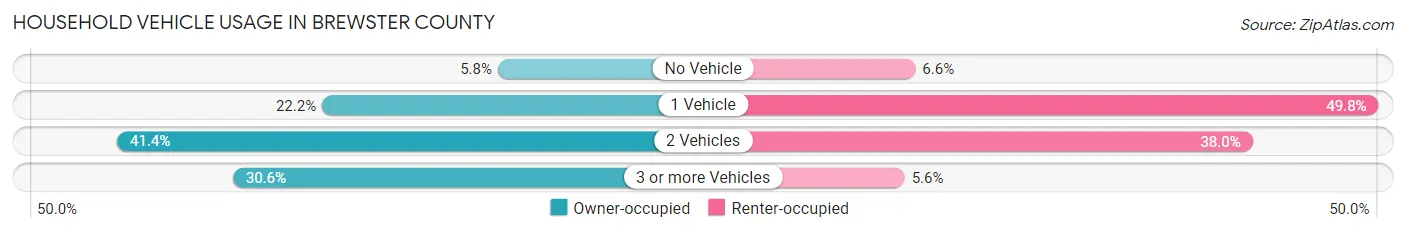
| Vehicles per Household | Owner-occupied | Renter-occupied |
| No Vehicle | 173 (5.8%) | 131 (6.6%) |
| 1 Vehicle | 660 (22.2%) | 991 (49.8%) |
| 2 Vehicles | 1,228 (41.4%) | 757 (38.0%) |
| 3 or more Vehicles | 907 (30.6%) | 111 (5.6%) |
| Total | 2,968 (100.0%) | 1,990 (100.0%) |
Real Estate & Mortgages in Brewster County
Real Estate and Mortgage Overview in Brewster County
| Characteristic | Without Mortgage | With Mortgage |
| Housing Units | 1,644 | 1,324 |
| Median Property Value | $201,200 | $199,700 |
| Median Household Income | $50,062 | $253 |
| Monthly Housing Costs | $521 | $74 |
| Real Estate Taxes | $2,284 | $118 |
Property Value by Mortgage Status in Brewster County
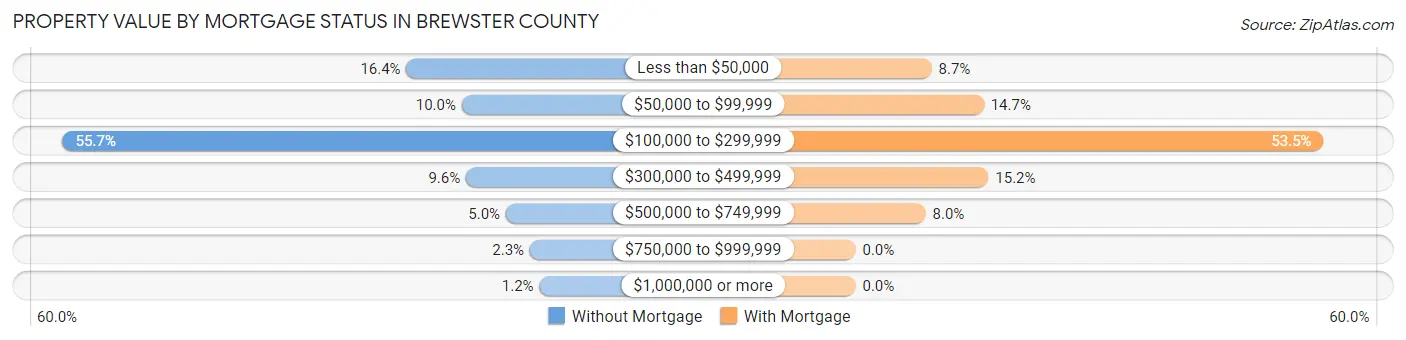
| Property Value | Without Mortgage | With Mortgage |
| Less than $50,000 | 269 (16.4%) | 115 (8.7%) |
| $50,000 to $99,999 | 165 (10.0%) | 194 (14.6%) |
| $100,000 to $299,999 | 915 (55.7%) | 708 (53.5%) |
| $300,000 to $499,999 | 157 (9.6%) | 201 (15.2%) |
| $500,000 to $749,999 | 82 (5.0%) | 106 (8.0%) |
| $750,000 to $999,999 | 37 (2.2%) | 0 (0.0%) |
| $1,000,000 or more | 19 (1.2%) | 0 (0.0%) |
| Total | 1,644 (100.0%) | 1,324 (100.0%) |
Household Income by Mortgage Status in Brewster County
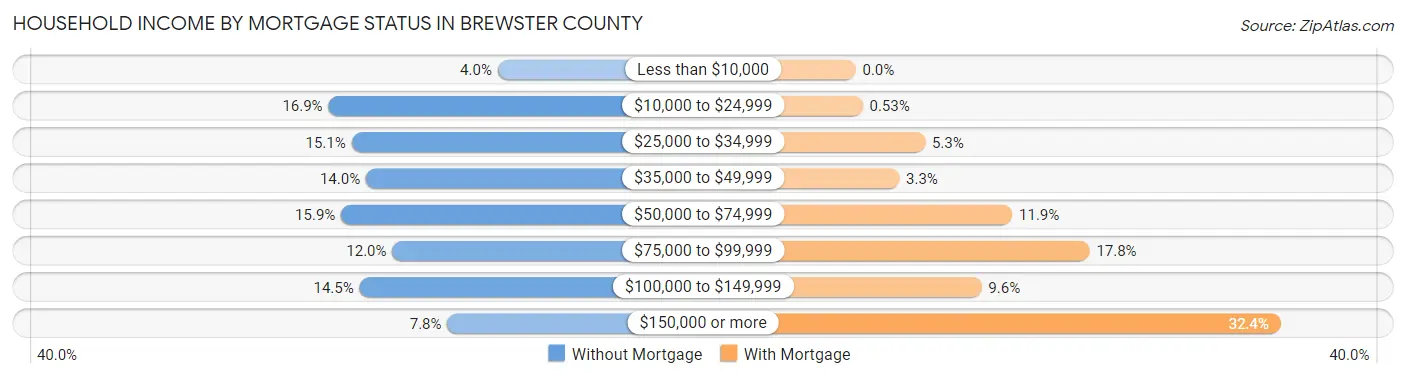
| Household Income | Without Mortgage | With Mortgage |
| Less than $10,000 | 65 (4.0%) | 0 (0.0%) |
| $10,000 to $24,999 | 277 (16.9%) | 7 (0.5%) |
| $25,000 to $34,999 | 248 (15.1%) | 70 (5.3%) |
| $35,000 to $49,999 | 230 (14.0%) | 44 (3.3%) |
| $50,000 to $74,999 | 261 (15.9%) | 158 (11.9%) |
| $75,000 to $99,999 | 197 (12.0%) | 236 (17.8%) |
| $100,000 to $149,999 | 238 (14.5%) | 127 (9.6%) |
| $150,000 or more | 128 (7.8%) | 429 (32.4%) |
| Total | 1,644 (100.0%) | 1,324 (100.0%) |
Property Value to Household Income Ratio in Brewster County
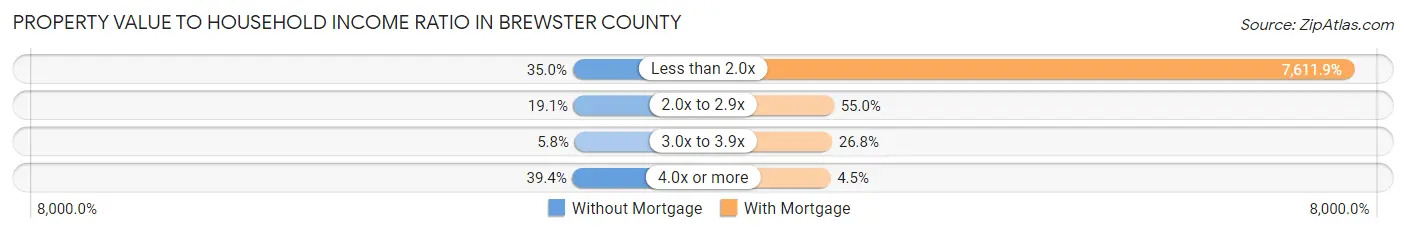
| Value-to-Income Ratio | Without Mortgage | With Mortgage |
| Less than 2.0x | 576 (35.0%) | 100,781 (7,611.9%) |
| 2.0x to 2.9x | 314 (19.1%) | 728 (55.0%) |
| 3.0x to 3.9x | 96 (5.8%) | 355 (26.8%) |
| 4.0x or more | 647 (39.4%) | 60 (4.5%) |
| Total | 1,644 (100.0%) | 1,324 (100.0%) |
Real Estate Taxes by Mortgage Status in Brewster County
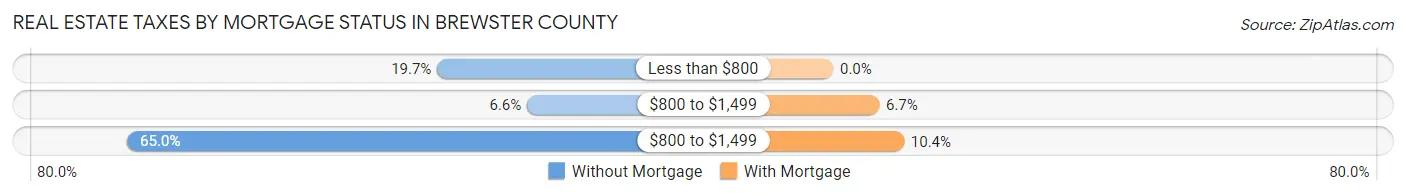
| Property Taxes | Without Mortgage | With Mortgage |
| Less than $800 | 324 (19.7%) | 0 (0.0%) |
| $800 to $1,499 | 108 (6.6%) | 89 (6.7%) |
| $800 to $1,499 | 1,069 (65.0%) | 137 (10.3%) |
| Total | 1,644 (100.0%) | 1,324 (100.0%) |
Health & Disability in Brewster County
Health Insurance Coverage by Age in Brewster County
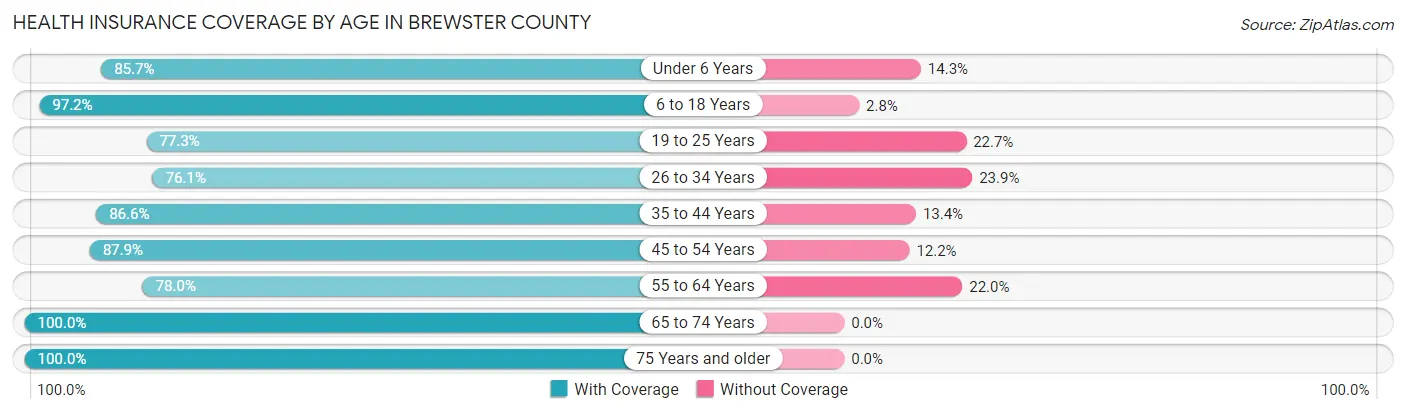
| Age Bracket | With Coverage | Without Coverage |
| Under 6 Years | 558 (85.7%) | 93 (14.3%) |
| 6 to 18 Years | 1,056 (97.2%) | 30 (2.8%) |
| 19 to 25 Years | 571 (77.3%) | 168 (22.7%) |
| 26 to 34 Years | 766 (76.1%) | 240 (23.9%) |
| 35 to 44 Years | 986 (86.6%) | 152 (13.4%) |
| 45 to 54 Years | 1,106 (87.8%) | 153 (12.1%) |
| 55 to 64 Years | 982 (78.0%) | 277 (22.0%) |
| 65 to 74 Years | 1,442 (100.0%) | 0 (0.0%) |
| 75 Years and older | 796 (100.0%) | 0 (0.0%) |
| Total | 8,263 (88.1%) | 1,113 (11.9%) |
Health Insurance Coverage by Citizenship Status in Brewster County
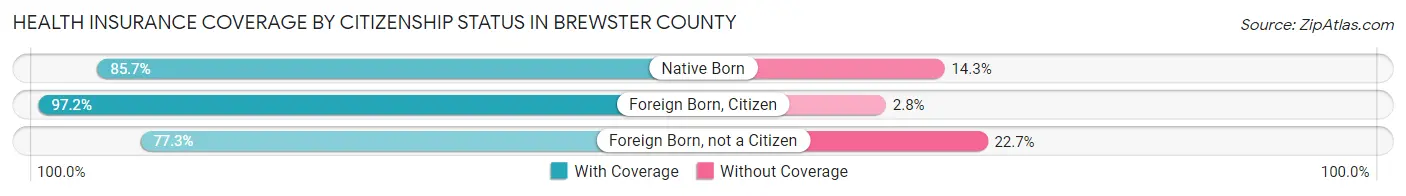
| Citizenship Status | With Coverage | Without Coverage |
| Native Born | 558 (85.7%) | 93 (14.3%) |
| Foreign Born, Citizen | 1,056 (97.2%) | 30 (2.8%) |
| Foreign Born, not a Citizen | 571 (77.3%) | 168 (22.7%) |
Health Insurance Coverage by Household Income in Brewster County
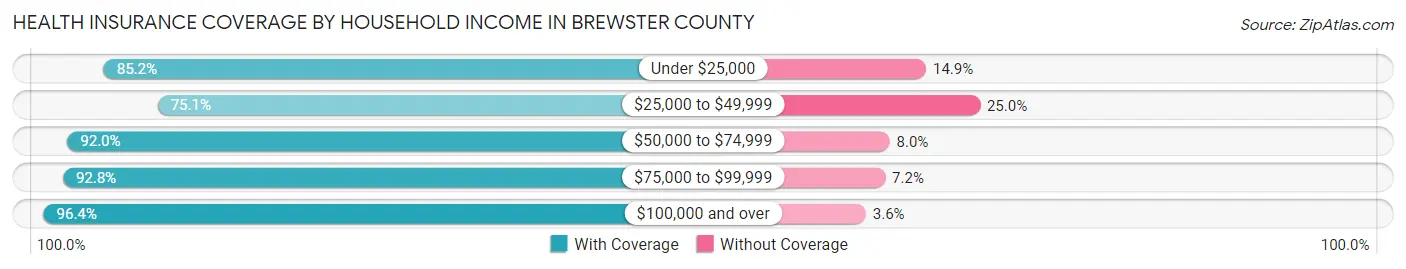
| Household Income | With Coverage | Without Coverage |
| Under $25,000 | 1,325 (85.2%) | 231 (14.8%) |
| $25,000 to $49,999 | 1,730 (75.0%) | 575 (24.9%) |
| $50,000 to $74,999 | 872 (92.0%) | 76 (8.0%) |
| $75,000 to $99,999 | 878 (92.8%) | 68 (7.2%) |
| $100,000 and over | 3,323 (96.4%) | 123 (3.6%) |
Public vs Private Health Insurance Coverage by Age in Brewster County
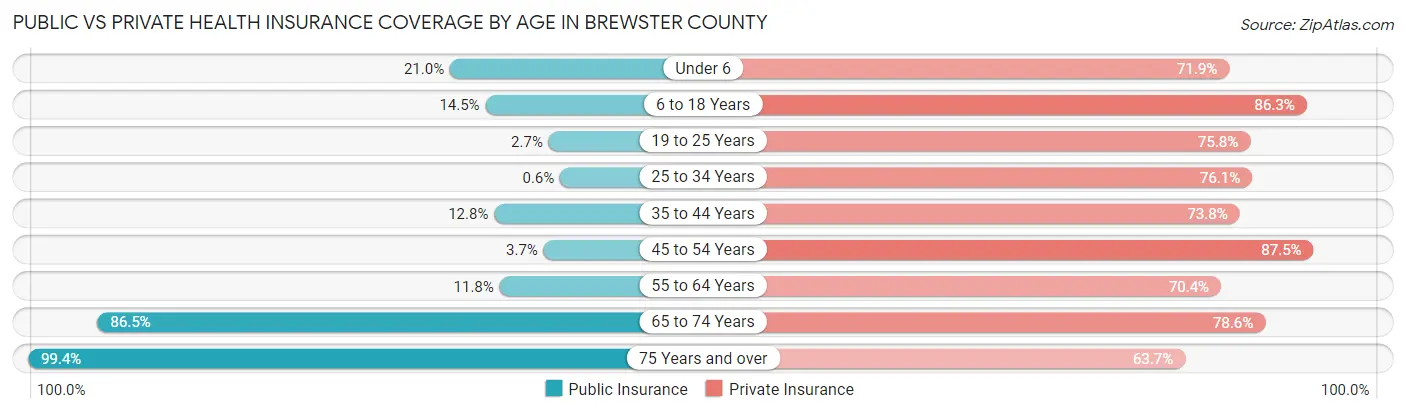
| Age Bracket | Public Insurance | Private Insurance |
| Under 6 | 137 (21.0%) | 468 (71.9%) |
| 6 to 18 Years | 157 (14.5%) | 937 (86.3%) |
| 19 to 25 Years | 20 (2.7%) | 560 (75.8%) |
| 25 to 34 Years | 6 (0.6%) | 766 (76.1%) |
| 35 to 44 Years | 146 (12.8%) | 840 (73.8%) |
| 45 to 54 Years | 46 (3.6%) | 1,102 (87.5%) |
| 55 to 64 Years | 149 (11.8%) | 886 (70.4%) |
| 65 to 74 Years | 1,247 (86.5%) | 1,133 (78.6%) |
| 75 Years and over | 791 (99.4%) | 507 (63.7%) |
| Total | 2,699 (28.8%) | 7,199 (76.8%) |
Disability Status by Sex by Age in Brewster County
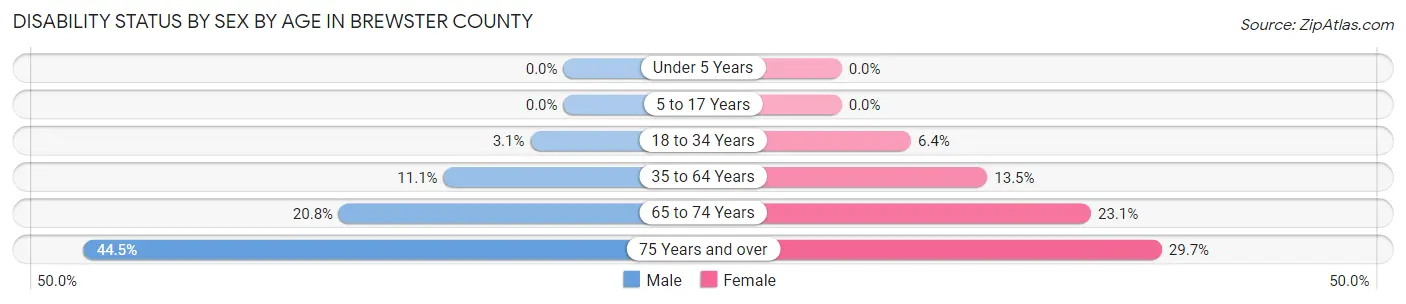
| Age Bracket | Male | Female |
| Under 5 Years | 0 (0.0%) | 0 (0.0%) |
| 5 to 17 Years | 0 (0.0%) | 0 (0.0%) |
| 18 to 34 Years | 31 (3.1%) | 48 (6.4%) |
| 35 to 64 Years | 196 (11.1%) | 256 (13.5%) |
| 65 to 74 Years | 150 (20.8%) | 167 (23.1%) |
| 75 Years and over | 170 (44.5%) | 123 (29.7%) |
Disability Class by Sex by Age in Brewster County
Disability Class: Hearing Difficulty
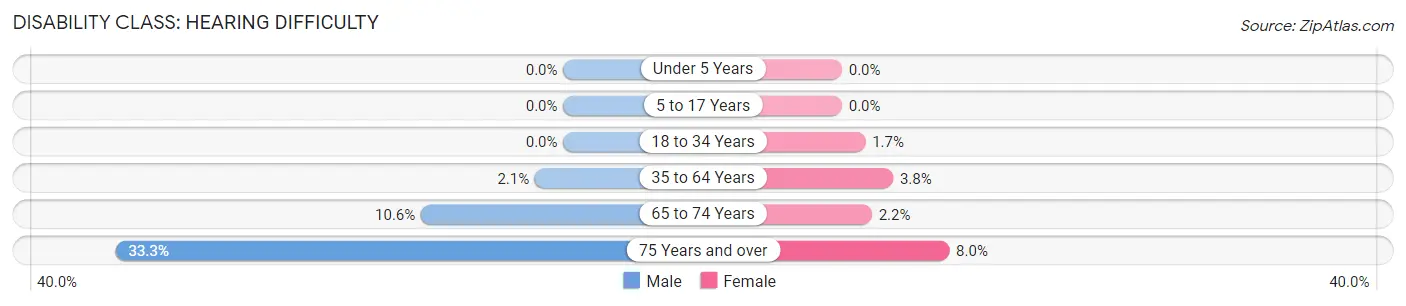
| Age Bracket | Male | Female |
| Under 5 Years | 0 (0.0%) | 0 (0.0%) |
| 5 to 17 Years | 0 (0.0%) | 0 (0.0%) |
| 18 to 34 Years | 0 (0.0%) | 13 (1.7%) |
| 35 to 64 Years | 37 (2.1%) | 72 (3.8%) |
| 65 to 74 Years | 76 (10.6%) | 16 (2.2%) |
| 75 Years and over | 127 (33.3%) | 33 (8.0%) |
Disability Class: Vision Difficulty
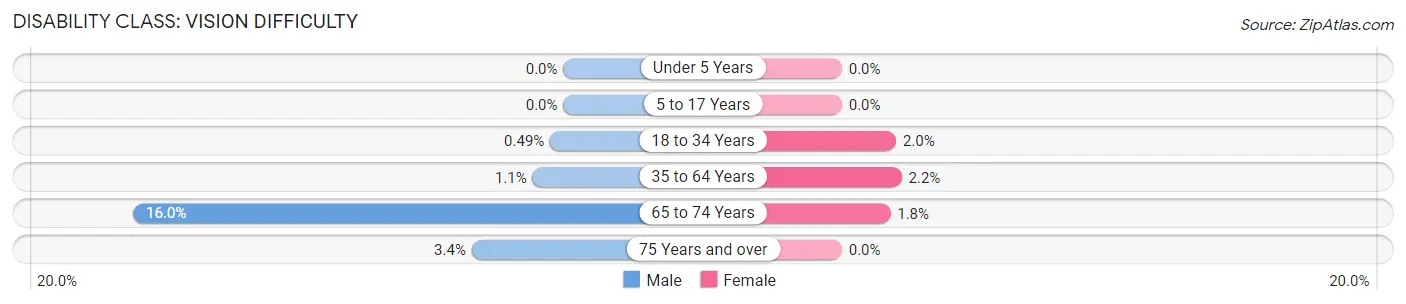
| Age Bracket | Male | Female |
| Under 5 Years | 0 (0.0%) | 0 (0.0%) |
| 5 to 17 Years | 0 (0.0%) | 0 (0.0%) |
| 18 to 34 Years | 5 (0.5%) | 15 (2.0%) |
| 35 to 64 Years | 20 (1.1%) | 42 (2.2%) |
| 65 to 74 Years | 115 (16.0%) | 13 (1.8%) |
| 75 Years and over | 13 (3.4%) | 0 (0.0%) |
Disability Class: Cognitive Difficulty
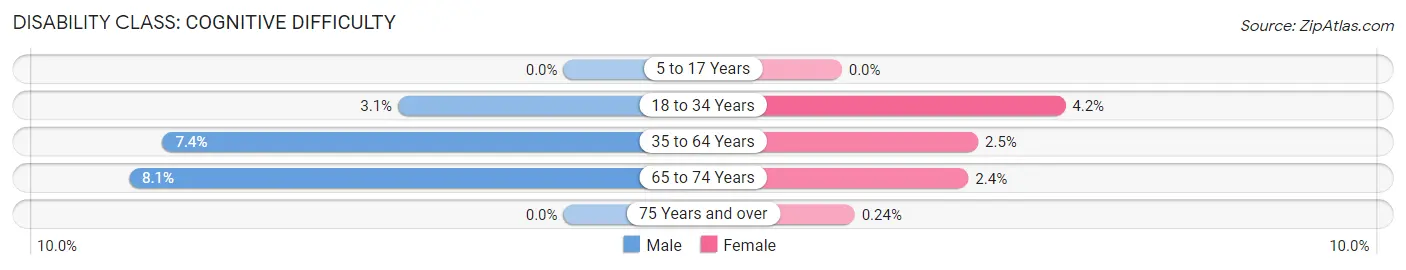
| Age Bracket | Male | Female |
| 5 to 17 Years | 0 (0.0%) | 0 (0.0%) |
| 18 to 34 Years | 31 (3.1%) | 31 (4.2%) |
| 35 to 64 Years | 131 (7.4%) | 48 (2.5%) |
| 65 to 74 Years | 58 (8.1%) | 17 (2.4%) |
| 75 Years and over | 0 (0.0%) | 1 (0.2%) |
Disability Class: Ambulatory Difficulty
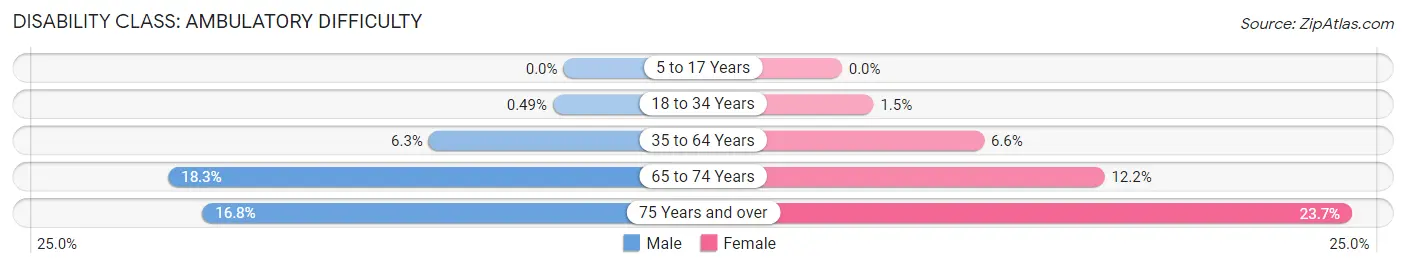
| Age Bracket | Male | Female |
| 5 to 17 Years | 0 (0.0%) | 0 (0.0%) |
| 18 to 34 Years | 5 (0.5%) | 11 (1.5%) |
| 35 to 64 Years | 110 (6.2%) | 125 (6.6%) |
| 65 to 74 Years | 132 (18.3%) | 88 (12.2%) |
| 75 Years and over | 64 (16.8%) | 98 (23.7%) |
Disability Class: Self-Care Difficulty
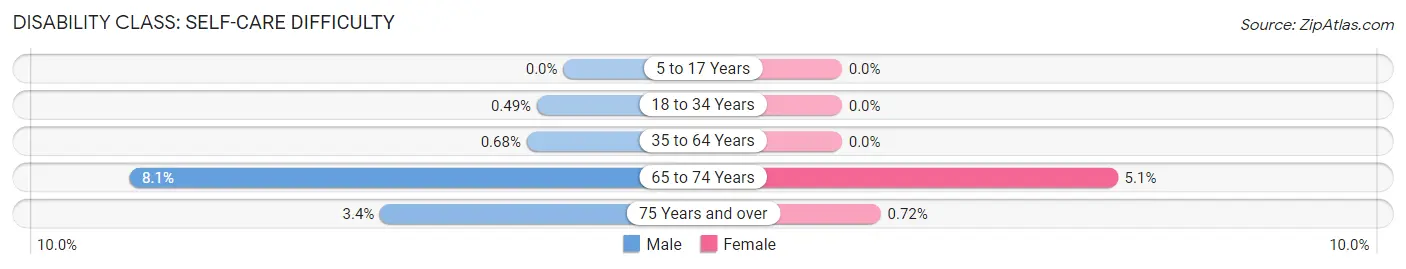
| Age Bracket | Male | Female |
| 5 to 17 Years | 0 (0.0%) | 0 (0.0%) |
| 18 to 34 Years | 5 (0.5%) | 0 (0.0%) |
| 35 to 64 Years | 12 (0.7%) | 0 (0.0%) |
| 65 to 74 Years | 58 (8.1%) | 37 (5.1%) |
| 75 Years and over | 13 (3.4%) | 3 (0.7%) |
Technology Access in Brewster County
Computing Device Access in Brewster County
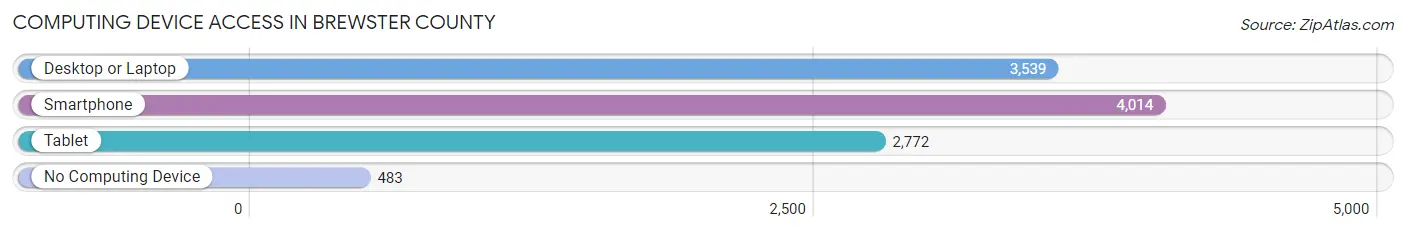
| Device Type | # Households | % Households |
| Desktop or Laptop | 3,539 | 71.4% |
| Smartphone | 4,014 | 81.0% |
| Tablet | 2,772 | 55.9% |
| No Computing Device | 483 | 9.7% |
| Total | 4,958 | 100.0% |
Internet Access in Brewster County
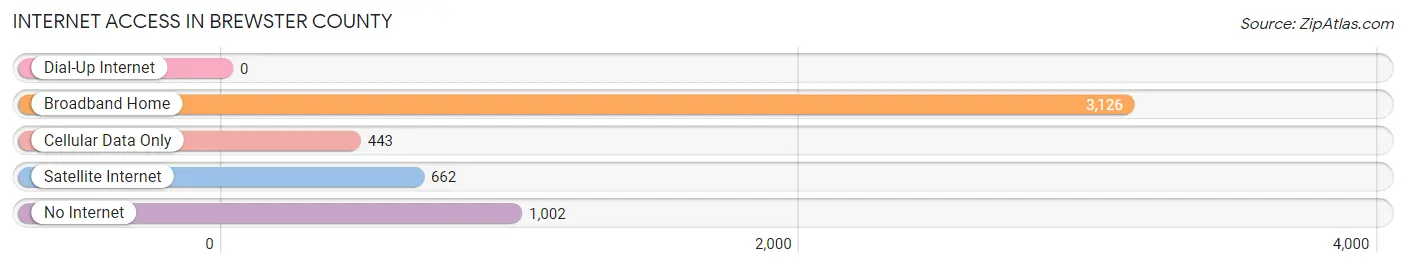
| Internet Type | # Households | % Households |
| Dial-Up Internet | 0 | 0.0% |
| Broadband Home | 3,126 | 63.0% |
| Cellular Data Only | 443 | 8.9% |
| Satellite Internet | 662 | 13.4% |
| No Internet | 1,002 | 20.2% |
| Total | 4,958 | 100.0% |
Brewster County Summary
Brewster County is located in the western part of Texas, and is the largest county in the state. It is bordered by Jeff Davis County to the north, Presidio County to the east, Pecos County to the south, and Culberson County to the west. Brewster County is part of the Trans-Pecos region of Texas, and is known for its rugged terrain and vast expanses of desert.
History
Brewster County was established in 1887, and was named after Colonel Henry Brewster, who was a prominent figure in the Texas Revolution. The county was originally part of Presidio County, but was later split off to form its own county. The county seat is Alpine, which was established in 1882.
The area that is now Brewster County was originally inhabited by Native American tribes, including the Apache, Comanche, and Kiowa. The first Europeans to settle in the area were ranchers and miners, who were attracted to the area by the abundance of natural resources.
Geography
Brewster County covers an area of 6,193 square miles, making it the largest county in Texas. The county is located in the Trans-Pecos region of Texas, and is characterized by its rugged terrain and vast expanses of desert. The county is home to several mountain ranges, including the Chisos Mountains, Davis Mountains, and Glass Mountains. The highest point in the county is Emory Peak, which is located in the Chisos Mountains and has an elevation of 7,825 feet.
The county is also home to several rivers and creeks, including the Rio Grande, which forms the county’s southern border. The Rio Grande is a major source of water for the county, and is used for irrigation and other agricultural purposes.
Economy
Brewster County’s economy is largely based on agriculture and tourism. The county is home to several large ranches, which produce cattle, sheep, and goats. The county is also home to several large farms, which produce a variety of crops, including cotton, corn, and wheat.
Tourism is also an important part of the county’s economy. The county is home to several national parks and monuments, including Big Bend National Park, which is located in the Chisos Mountains. The county is also home to several historic sites, including the Fort Davis National Historic Site.
Demographics
As of the 2010 census, Brewster County had a population of 9,232. The population is largely composed of White (77.2%), Hispanic (17.3%), and Native American (2.2%) individuals. The median household income in the county is $37,945, and the median age is 38.7 years.
Brewster County is a largely rural county, with only a few small towns and cities. The largest city in the county is Alpine, which has a population of 5,905. Other cities in the county include Marathon, which has a population of 430, and Terlingua, which has a population of 393.
Conclusion
Brewster County is a large county located in the western part of Texas. The county is characterized by its rugged terrain and vast expanses of desert, and is home to several mountain ranges and rivers. The county’s economy is largely based on agriculture and tourism, and the population is largely composed of White, Hispanic, and Native American individuals. Brewster County is a largely rural county, with only a few small towns and cities.
Common Questions
What is Per Capita Income in Brewster County?
Per Capita income in Brewster County is $35,516.
What is the Median Family Income in Brewster County?
Median Family Income in Brewster County is $71,094.
What is the Median Household income in Brewster County?
Median Household Income in Brewster County is $47,747.
What is Income or Wage Gap in Brewster County?
Income or Wage Gap in Brewster County is 24.3%.
Women in Brewster County earn 75.7 cents for every dollar earned by a man.
What is Inequality or Gini Index in Brewster County?
Inequality or Gini Index in Brewster County is 0.46.
What is the Total Population of Brewster County?
Total Population of Brewster County is 9,454.
What is the Total Male Population of Brewster County?
Total Male Population of Brewster County is 4,578.
What is the Total Female Population of Brewster County?
Total Female Population of Brewster County is 4,876.
What is the Ratio of Males per 100 Females in Brewster County?
There are 93.89 Males per 100 Females in Brewster County.
What is the Ratio of Females per 100 Males in Brewster County?
There are 106.51 Females per 100 Males in Brewster County.
What is the Median Population Age in Brewster County?
Median Population Age in Brewster County is 46.1 Years.
What is the Average Family Size in Brewster County
Average Family Size in Brewster County is 2.5 People.
What is the Average Household Size in Brewster County
Average Household Size in Brewster County is 1.9 People.
How Large is the Labor Force in Brewster County?
There are 4,920 People in the Labor Forcein in Brewster County.
What is the Percentage of People in the Labor Force in Brewster County?
62.4% of People are in the Labor Force in Brewster County.
What is the Unemployment Rate in Brewster County?
Unemployment Rate in Brewster County is 3.0%.