Bastrop County, TX Map & Demographics
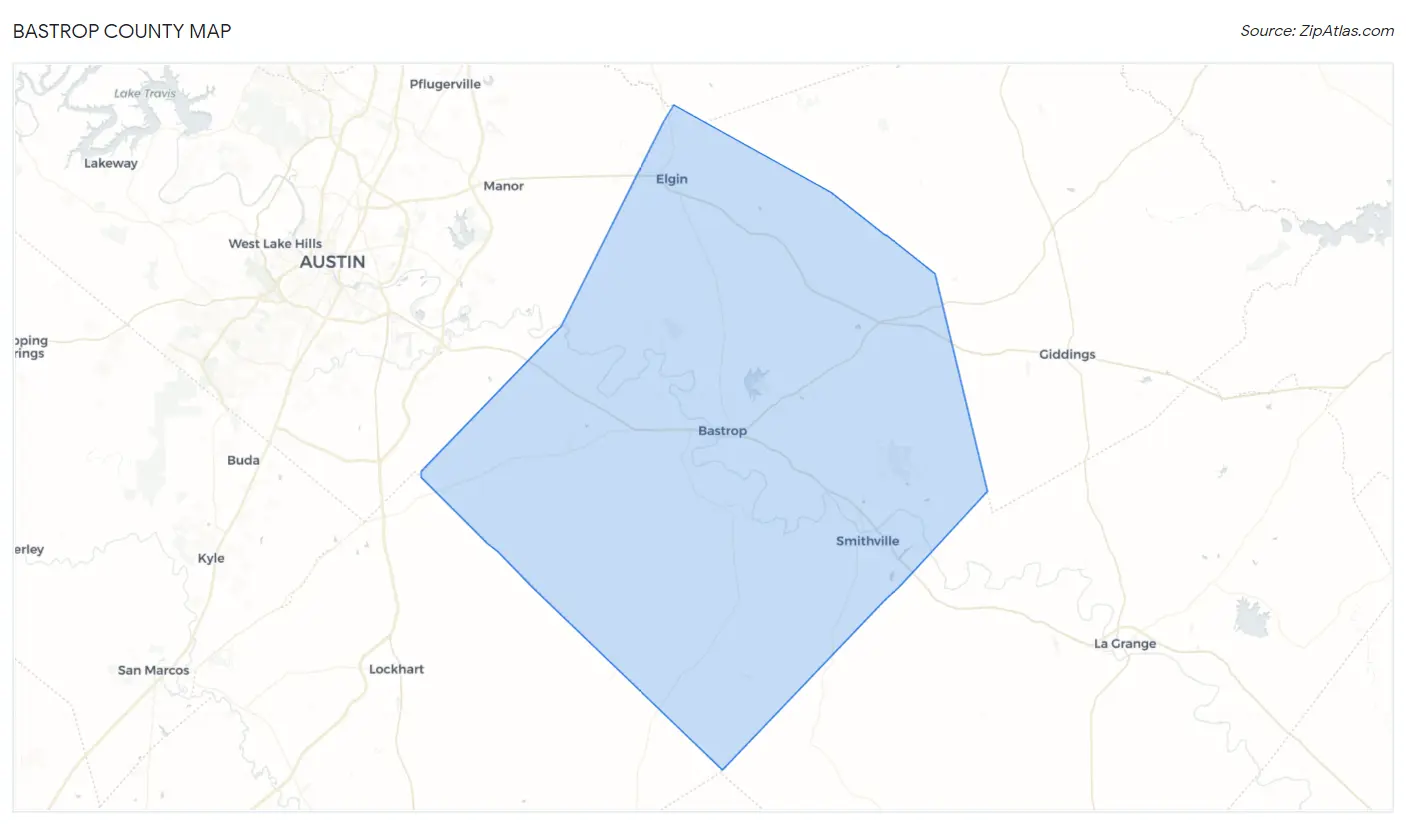
Bastrop County Map
Bastrop County Overview
$34,079
PER CAPITA INCOME
$92,732
AVG FAMILY INCOME
$80,151
AVG HOUSEHOLD INCOME
23.4%
WAGE / INCOME GAP [ % ]
76.6¢/ $1
WAGE / INCOME GAP [ $ ]
$11,160
FAMILY INCOME DEFICIT
0.42
INEQUALITY / GINI INDEX
98,435
TOTAL POPULATION
49,988
MALE POPULATION
48,447
FEMALE POPULATION
103.18
MALES / 100 FEMALES
96.92
FEMALES / 100 MALES
38.0
MEDIAN AGE
3.4
AVG FAMILY SIZE
2.9
AVG HOUSEHOLD SIZE
47,570
LABOR FORCE [ PEOPLE ]
62.6%
PERCENT IN LABOR FORCE
4.4%
UNEMPLOYMENT RATE
Income in Bastrop County
Income Overview in Bastrop County
Per Capita Income in Bastrop County is $34,079, while median incomes of families and households are $92,732 and $80,151 respectively.
| Characteristic | Number | Measure |
| Per Capita Income | 98,435 | $34,079 |
| Median Family Income | 23,758 | $92,732 |
| Mean Family Income | 23,758 | $107,601 |
| Median Household Income | 33,259 | $80,151 |
| Mean Household Income | 33,259 | $97,636 |
| Income Deficit | 23,758 | $11,160 |
| Wage / Income Gap (%) | 98,435 | 23.44% |
| Wage / Income Gap ($) | 98,435 | 76.56¢ per $1 |
| Gini / Inequality Index | 98,435 | 0.42 |
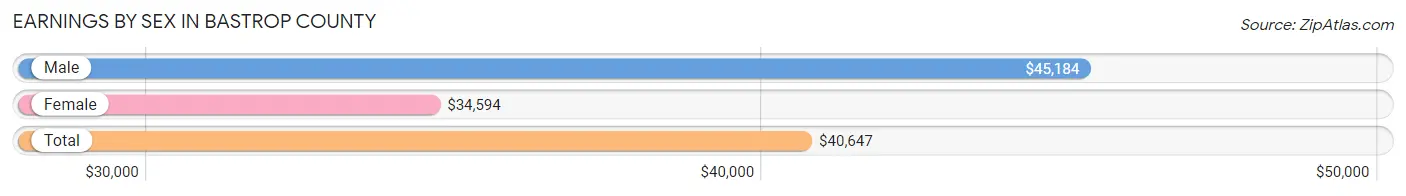
Earnings by Sex in Bastrop County
Average Earnings in Bastrop County are $40,647, $45,184 for men and $34,594 for women, a difference of 23.4%.
| Sex | Number | Average Earnings |
| Male | 27,696 (54.8%) | $45,184 |
| Female | 22,836 (45.2%) | $34,594 |
| Total | 50,532 (100.0%) | $40,647 |
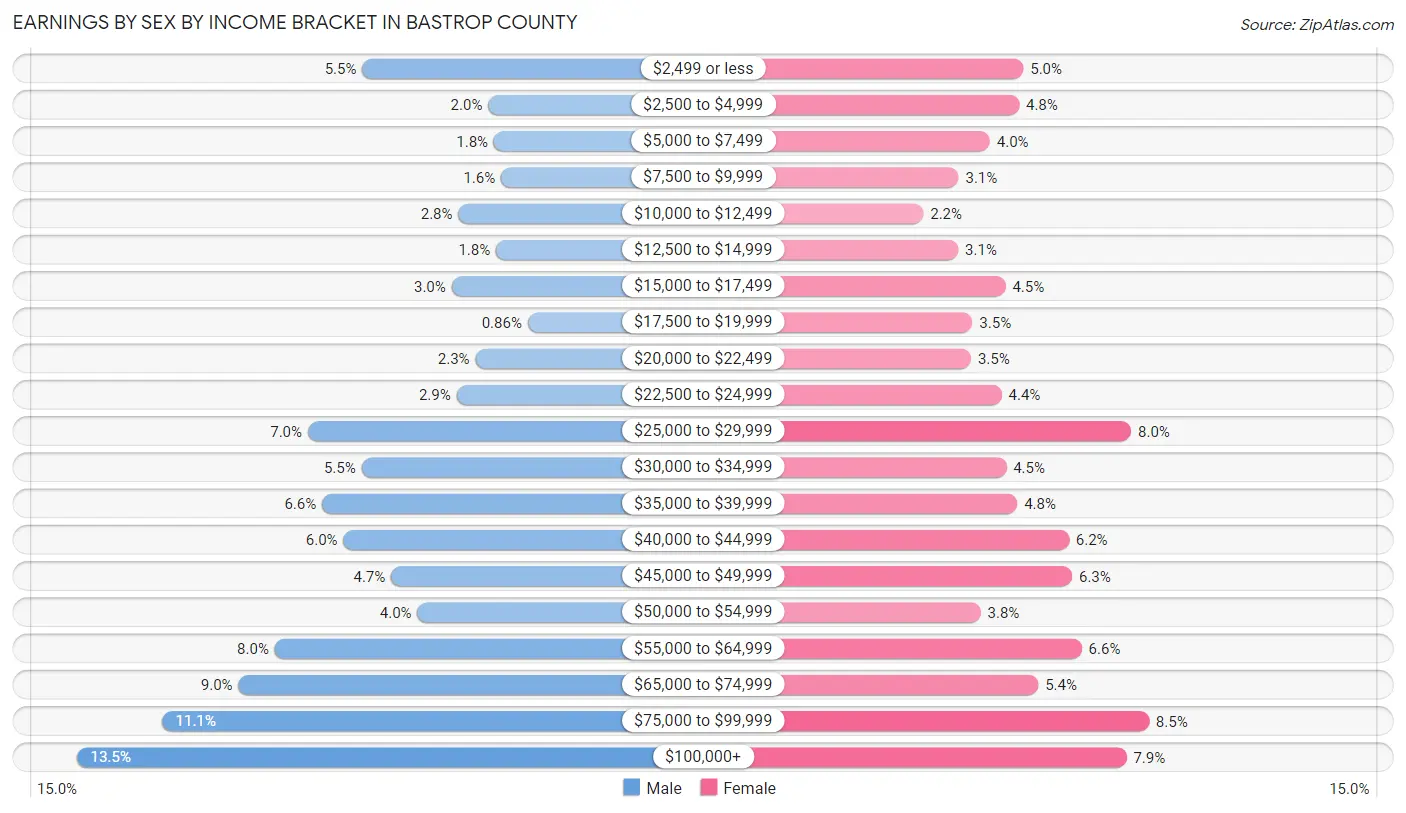
Earnings by Sex by Income Bracket in Bastrop County
The most common earnings brackets in Bastrop County are $100,000+ for men (3,742 | 13.5%) and $75,000 to $99,999 for women (1,939 | 8.5%).
| Income | Male | Female |
| $2,499 or less | 1,525 (5.5%) | 1,133 (5.0%) |
| $2,500 to $4,999 | 545 (2.0%) | 1,105 (4.8%) |
| $5,000 to $7,499 | 501 (1.8%) | 918 (4.0%) |
| $7,500 to $9,999 | 445 (1.6%) | 717 (3.1%) |
| $10,000 to $12,499 | 779 (2.8%) | 491 (2.1%) |
| $12,500 to $14,999 | 484 (1.8%) | 714 (3.1%) |
| $15,000 to $17,499 | 830 (3.0%) | 1,019 (4.5%) |
| $17,500 to $19,999 | 238 (0.9%) | 806 (3.5%) |
| $20,000 to $22,499 | 645 (2.3%) | 797 (3.5%) |
| $22,500 to $24,999 | 792 (2.9%) | 994 (4.3%) |
| $25,000 to $29,999 | 1,951 (7.0%) | 1,825 (8.0%) |
| $30,000 to $34,999 | 1,532 (5.5%) | 1,022 (4.5%) |
| $35,000 to $39,999 | 1,838 (6.6%) | 1,094 (4.8%) |
| $40,000 to $44,999 | 1,674 (6.0%) | 1,426 (6.2%) |
| $45,000 to $49,999 | 1,301 (4.7%) | 1,445 (6.3%) |
| $50,000 to $54,999 | 1,097 (4.0%) | 859 (3.8%) |
| $55,000 to $64,999 | 2,207 (8.0%) | 1,508 (6.6%) |
| $65,000 to $74,999 | 2,491 (9.0%) | 1,229 (5.4%) |
| $75,000 to $99,999 | 3,079 (11.1%) | 1,939 (8.5%) |
| $100,000+ | 3,742 (13.5%) | 1,795 (7.9%) |
| Total | 27,696 (100.0%) | 22,836 (100.0%) |
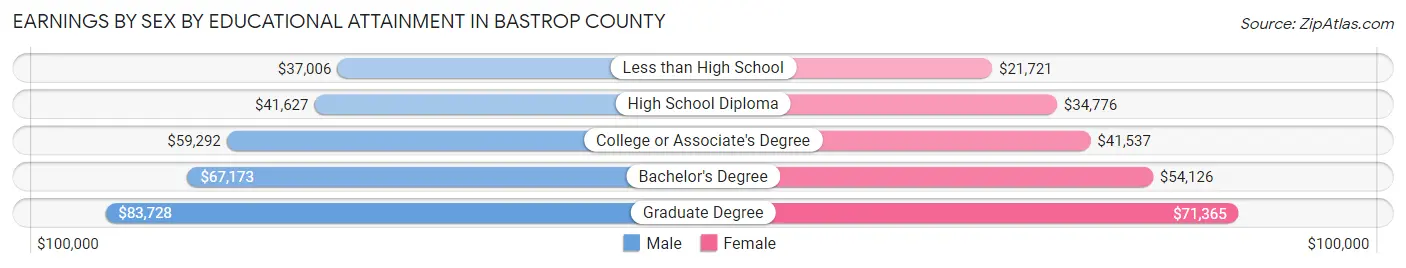
Earnings by Sex by Educational Attainment in Bastrop County
Average earnings in Bastrop County are $52,636 for men and $41,002 for women, a difference of 22.1%. Men with an educational attainment of graduate degree enjoy the highest average annual earnings of $83,728, while those with less than high school education earn the least with $37,006. Women with an educational attainment of graduate degree earn the most with the average annual earnings of $71,365, while those with less than high school education have the smallest earnings of $21,721.
| Educational Attainment | Male Income | Female Income |
| Less than High School | $37,006 | $21,721 |
| High School Diploma | $41,627 | $34,776 |
| College or Associate's Degree | $59,292 | $41,537 |
| Bachelor's Degree | $67,173 | $54,126 |
| Graduate Degree | $83,728 | $71,365 |
| Total | $52,636 | $41,002 |
Family Income in Bastrop County
Family Income Brackets in Bastrop County
According to the Bastrop County family income data, there are 5,559 families falling into the $100,000 to $149,999 income range, which is the most common income bracket and makes up 23.4% of all families. Conversely, the $10,000 to $14,999 income bracket is the least frequent group with only 238 families (1.0%) belonging to this category.
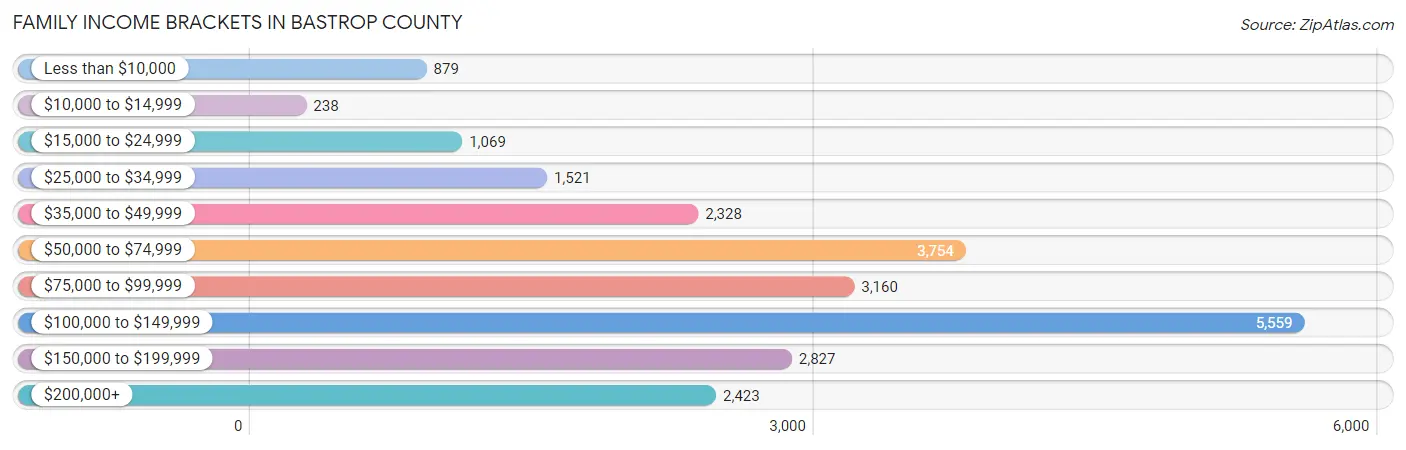
| Income Bracket | # Families | % Families |
| Less than $10,000 | 879 | 3.7% |
| $10,000 to $14,999 | 238 | 1.0% |
| $15,000 to $24,999 | 1,069 | 4.5% |
| $25,000 to $34,999 | 1,521 | 6.4% |
| $35,000 to $49,999 | 2,328 | 9.8% |
| $50,000 to $74,999 | 3,754 | 15.8% |
| $75,000 to $99,999 | 3,160 | 13.3% |
| $100,000 to $149,999 | 5,559 | 23.4% |
| $150,000 to $199,999 | 2,827 | 11.9% |
| $200,000+ | 2,423 | 10.2% |
Family Income by Famaliy Size in Bastrop County
7+ person families (594 | 2.5%) account for the highest median family income in Bastrop County with $115,410 per family, while 2-person families (10,262 | 43.2%) have the highest median income of $44,174 per family member.
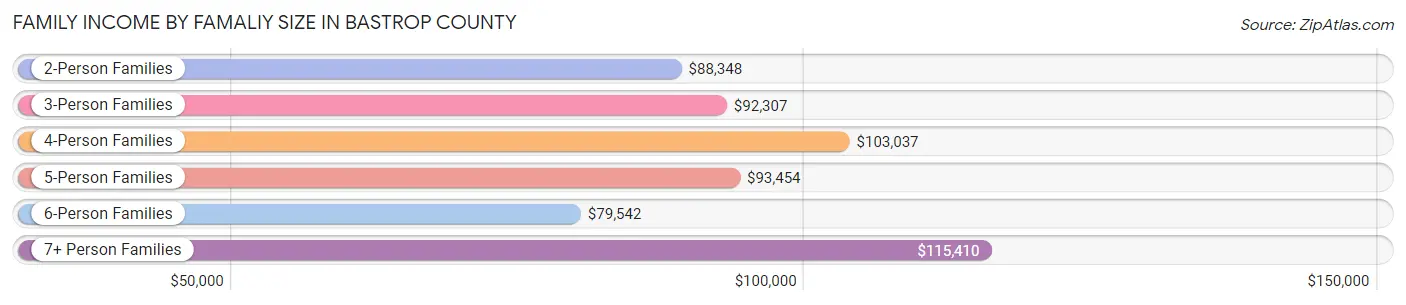
| Income Bracket | # Families | Median Income |
| 2-Person Families | 10,262 (43.2%) | $88,348 |
| 3-Person Families | 5,173 (21.8%) | $92,307 |
| 4-Person Families | 4,168 (17.5%) | $103,037 |
| 5-Person Families | 2,535 (10.7%) | $93,454 |
| 6-Person Families | 1,026 (4.3%) | $79,542 |
| 7+ Person Families | 594 (2.5%) | $115,410 |
| Total | 23,758 (100.0%) | $92,732 |
Family Income by Number of Earners in Bastrop County
The median family income in Bastrop County is $92,732, with families comprising 3+ earners (3,529) having the highest median family income of $123,054, while families with no earners (3,480) have the lowest median family income of $44,643, accounting for 14.8% and 14.6% of families, respectively.
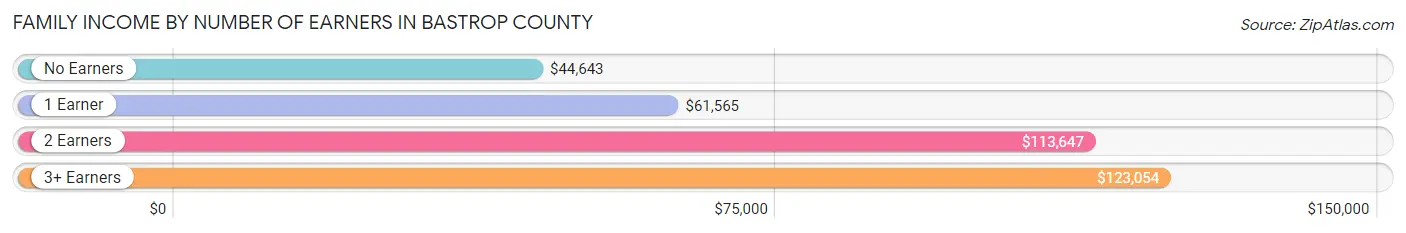
| Number of Earners | # Families | Median Income |
| No Earners | 3,480 (14.6%) | $44,643 |
| 1 Earner | 7,087 (29.8%) | $61,565 |
| 2 Earners | 9,662 (40.7%) | $113,647 |
| 3+ Earners | 3,529 (14.8%) | $123,054 |
| Total | 23,758 (100.0%) | $92,732 |
Household Income in Bastrop County
Household Income Brackets in Bastrop County
With 6,818 households falling in the category, the $100,000 to $149,999 income range is the most frequent in Bastrop County, accounting for 20.5% of all households. In contrast, only 1,197 households (3.6%) fall into the $10,000 to $14,999 income bracket, making it the least populous group.
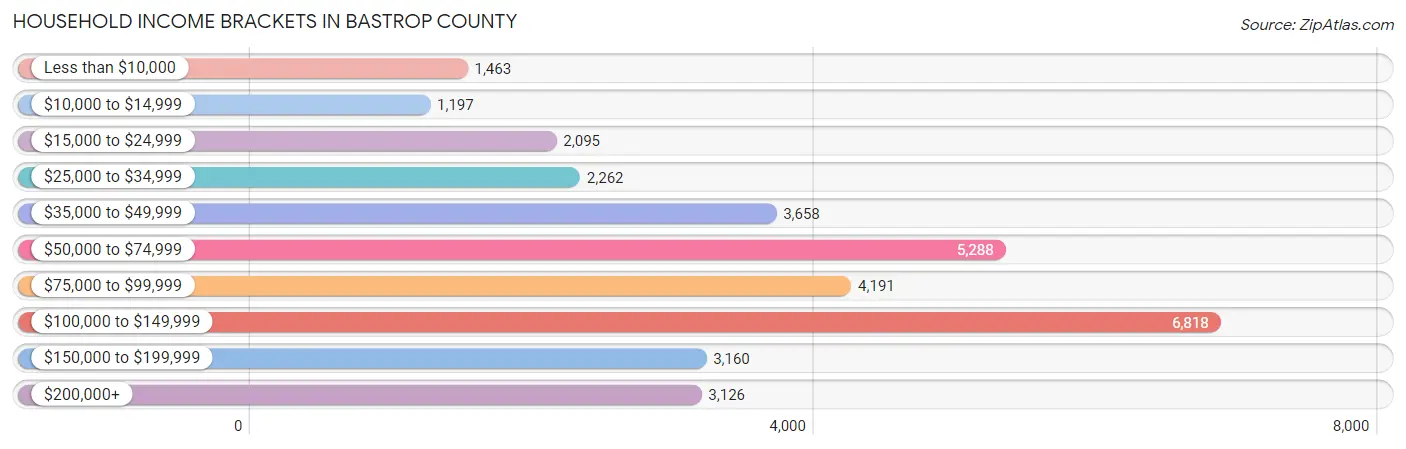
| Income Bracket | # Households | % Households |
| Less than $10,000 | 1,463 | 4.4% |
| $10,000 to $14,999 | 1,197 | 3.6% |
| $15,000 to $24,999 | 2,095 | 6.3% |
| $25,000 to $34,999 | 2,262 | 6.8% |
| $35,000 to $49,999 | 3,658 | 11.0% |
| $50,000 to $74,999 | 5,288 | 15.9% |
| $75,000 to $99,999 | 4,191 | 12.6% |
| $100,000 to $149,999 | 6,818 | 20.5% |
| $150,000 to $199,999 | 3,160 | 9.5% |
| $200,000+ | 3,126 | 9.4% |
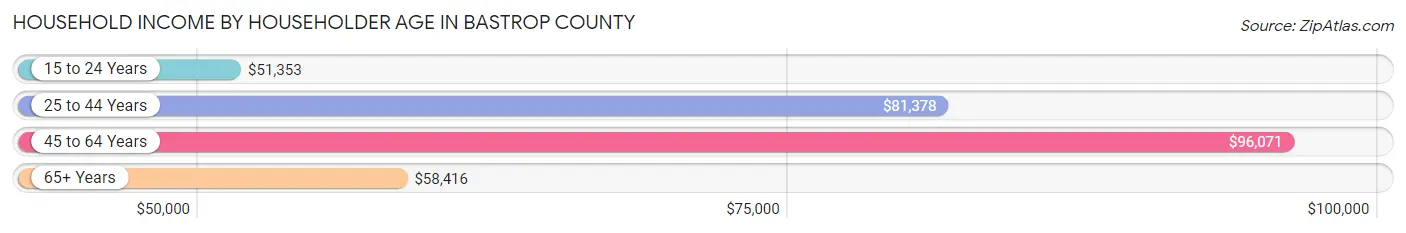
Household Income by Householder Age in Bastrop County
The median household income in Bastrop County is $80,151, with the highest median household income of $96,071 found in the 45 to 64 years age bracket for the primary householder. A total of 13,599 households (40.9%) fall into this category. Meanwhile, the 15 to 24 years age bracket for the primary householder has the lowest median household income of $51,353, with 944 households (2.8%) in this group.
| Income Bracket | # Households | Median Income |
| 15 to 24 Years | 944 (2.8%) | $51,353 |
| 25 to 44 Years | 10,085 (30.3%) | $81,378 |
| 45 to 64 Years | 13,599 (40.9%) | $96,071 |
| 65+ Years | 8,631 (26.0%) | $58,416 |
| Total | 33,259 (100.0%) | $80,151 |
Poverty in Bastrop County
Income Below Poverty by Sex and Age in Bastrop County
With 12.4% poverty level for males and 11.5% for females among the residents of Bastrop County, 12 to 14 year old males and 25 to 34 year old females are the most vulnerable to poverty, with 778 males (34.5%) and 986 females (17.9%) in their respective age groups living below the poverty level.
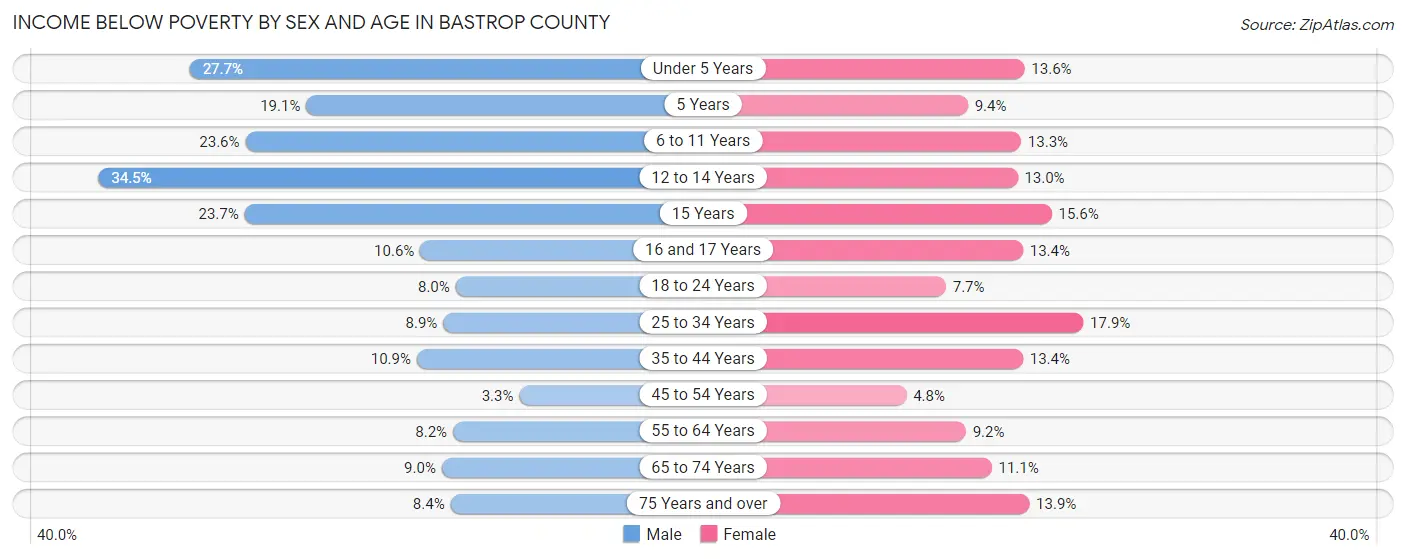
| Age Bracket | Male | Female |
| Under 5 Years | 851 (27.7%) | 435 (13.6%) |
| 5 Years | 118 (19.1%) | 63 (9.3%) |
| 6 to 11 Years | 968 (23.6%) | 441 (13.3%) |
| 12 to 14 Years | 778 (34.5%) | 432 (13.0%) |
| 15 Years | 191 (23.7%) | 140 (15.6%) |
| 16 and 17 Years | 154 (10.6%) | 167 (13.4%) |
| 18 to 24 Years | 348 (8.0%) | 314 (7.7%) |
| 25 to 34 Years | 507 (8.9%) | 986 (17.9%) |
| 35 to 44 Years | 655 (10.9%) | 739 (13.4%) |
| 45 to 54 Years | 194 (3.3%) | 294 (4.8%) |
| 55 to 64 Years | 547 (8.2%) | 600 (9.2%) |
| 65 to 74 Years | 435 (9.0%) | 558 (11.1%) |
| 75 Years and over | 181 (8.4%) | 358 (13.9%) |
| Total | 5,927 (12.4%) | 5,527 (11.5%) |
Income Above Poverty by Sex and Age in Bastrop County
According to the poverty statistics in Bastrop County, males aged 45 to 54 years and females aged 45 to 54 years are the age groups that are most secure financially, with 96.7% of males and 95.2% of females in these age groups living above the poverty line.
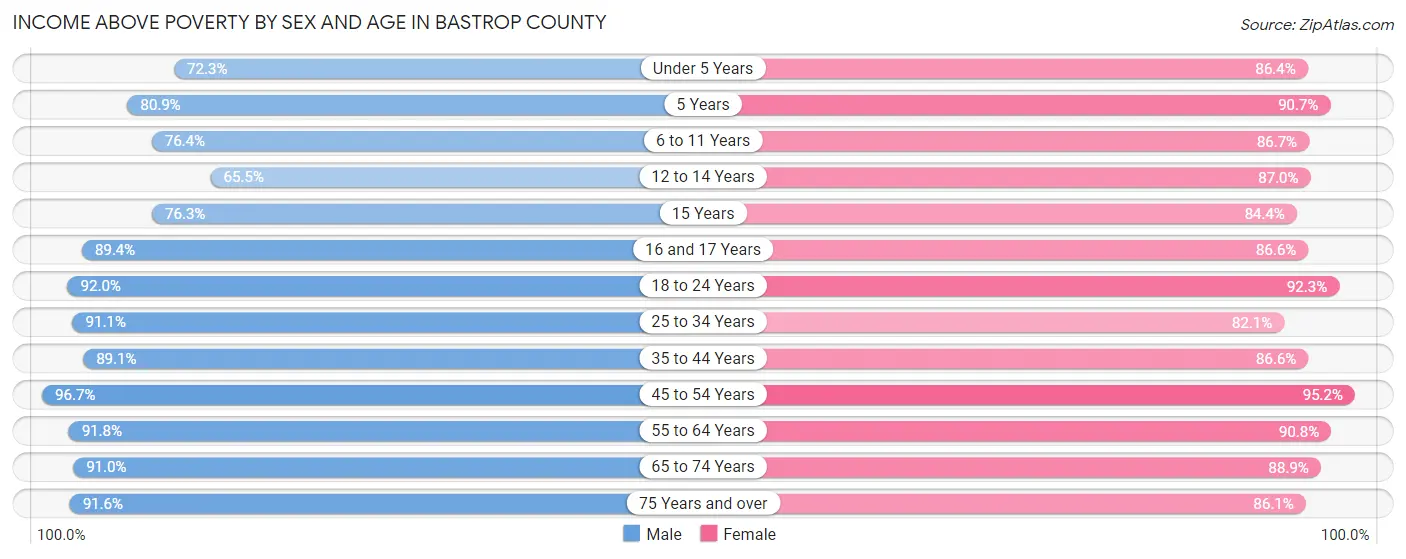
| Age Bracket | Male | Female |
| Under 5 Years | 2,217 (72.3%) | 2,772 (86.4%) |
| 5 Years | 500 (80.9%) | 611 (90.6%) |
| 6 to 11 Years | 3,132 (76.4%) | 2,874 (86.7%) |
| 12 to 14 Years | 1,476 (65.5%) | 2,881 (87.0%) |
| 15 Years | 616 (76.3%) | 759 (84.4%) |
| 16 and 17 Years | 1,295 (89.4%) | 1,076 (86.6%) |
| 18 to 24 Years | 4,001 (92.0%) | 3,754 (92.3%) |
| 25 to 34 Years | 5,178 (91.1%) | 4,517 (82.1%) |
| 35 to 44 Years | 5,364 (89.1%) | 4,760 (86.6%) |
| 45 to 54 Years | 5,747 (96.7%) | 5,856 (95.2%) |
| 55 to 64 Years | 6,120 (91.8%) | 5,925 (90.8%) |
| 65 to 74 Years | 4,383 (91.0%) | 4,462 (88.9%) |
| 75 Years and over | 1,978 (91.6%) | 2,216 (86.1%) |
| Total | 42,007 (87.6%) | 42,463 (88.5%) |
Income Below Poverty Among Married-Couple Families in Bastrop County
The poverty statistics for married-couple families in Bastrop County show that 6.5% or 1,165 of the total 18,063 families live below the poverty line. Families with 3 or 4 children have the highest poverty rate of 19.3%, comprising of 404 families. On the other hand, families with no children have the lowest poverty rate of 3.0%, which includes 303 families.
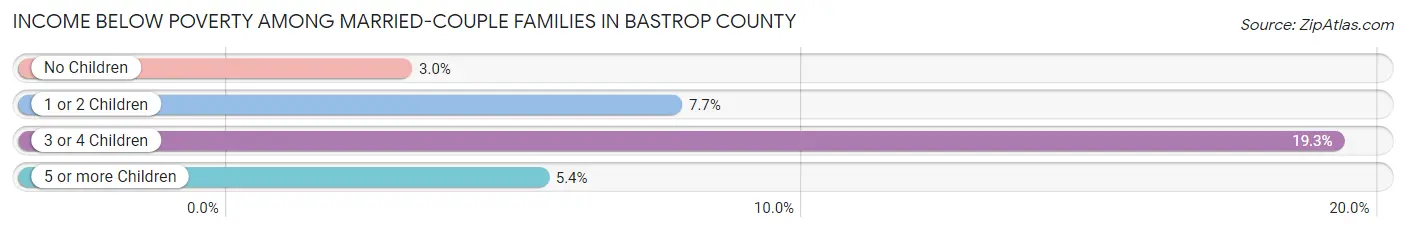
| Children | Above Poverty | Below Poverty |
| No Children | 9,703 (97.0%) | 303 (3.0%) |
| 1 or 2 Children | 5,396 (92.3%) | 452 (7.7%) |
| 3 or 4 Children | 1,694 (80.7%) | 404 (19.3%) |
| 5 or more Children | 105 (94.6%) | 6 (5.4%) |
| Total | 16,898 (93.5%) | 1,165 (6.5%) |
Income Below Poverty Among Single-Parent Households in Bastrop County
According to the poverty data in Bastrop County, 14.7% or 237 single-father households and 20.2% or 823 single-mother households are living below the poverty line. Among single-father households, those with 1 or 2 children have the highest poverty rate, with 142 households (20.6%) experiencing poverty. Likewise, among single-mother households, those with 3 or 4 children have the highest poverty rate, with 298 households (61.7%) falling below the poverty line.
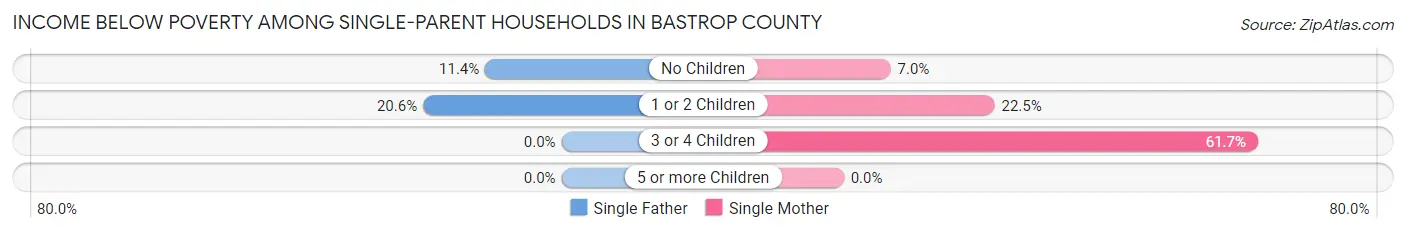
| Children | Single Father | Single Mother |
| No Children | 95 (11.4%) | 128 (7.0%) |
| 1 or 2 Children | 142 (20.6%) | 397 (22.5%) |
| 3 or 4 Children | 0 (0.0%) | 298 (61.7%) |
| 5 or more Children | 0 (0.0%) | 0 (0.0%) |
| Total | 237 (14.7%) | 823 (20.2%) |
Income Below Poverty Among Married-Couple vs Single-Parent Households in Bastrop County
The poverty data for Bastrop County shows that 1,165 of the married-couple family households (6.5%) and 1,060 of the single-parent households (18.6%) are living below the poverty level. Within the married-couple family households, those with 3 or 4 children have the highest poverty rate, with 404 households (19.3%) falling below the poverty line. Among the single-parent households, those with 3 or 4 children have the highest poverty rate, with 298 household (52.6%) living below poverty.
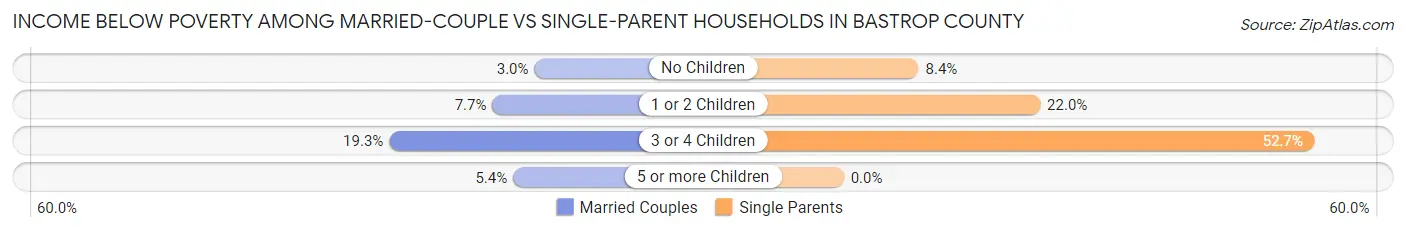
| Children | Married-Couple Families | Single-Parent Households |
| No Children | 303 (3.0%) | 223 (8.4%) |
| 1 or 2 Children | 452 (7.7%) | 539 (22.0%) |
| 3 or 4 Children | 404 (19.3%) | 298 (52.6%) |
| 5 or more Children | 6 (5.4%) | 0 (0.0%) |
| Total | 1,165 (6.5%) | 1,060 (18.6%) |
Race in Bastrop County
The most populous races in Bastrop County are White / Caucasian (59,508 | 60.5%), Hispanic or Latino (40,570 | 41.2%), and Some other Race (16,903 | 17.2%).
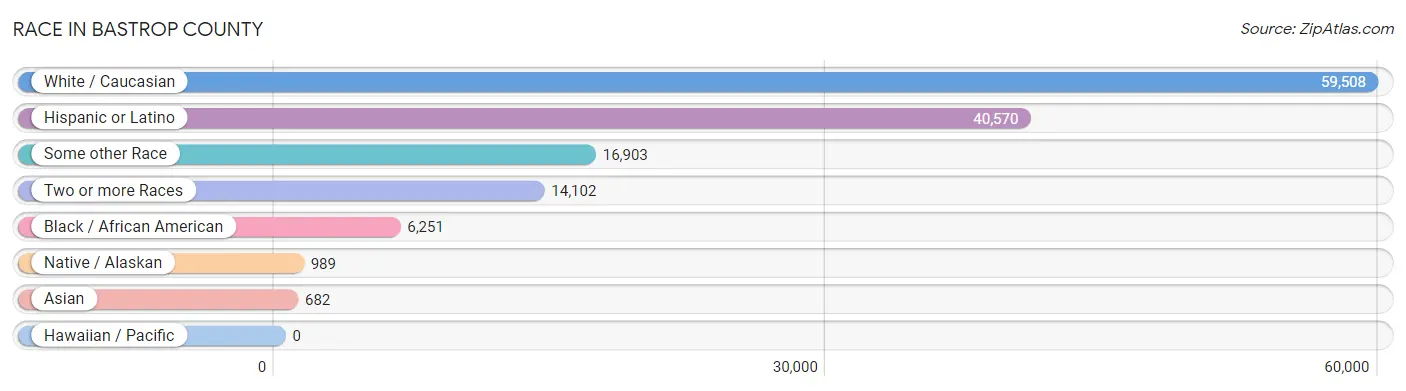
| Race | # Population | % Population |
| Asian | 682 | 0.7% |
| Black / African American | 6,251 | 6.4% |
| Hawaiian / Pacific | 0 | 0.0% |
| Hispanic or Latino | 40,570 | 41.2% |
| Native / Alaskan | 989 | 1.0% |
| White / Caucasian | 59,508 | 60.5% |
| Two or more Races | 14,102 | 14.3% |
| Some other Race | 16,903 | 17.2% |
| Total | 98,435 | 100.0% |
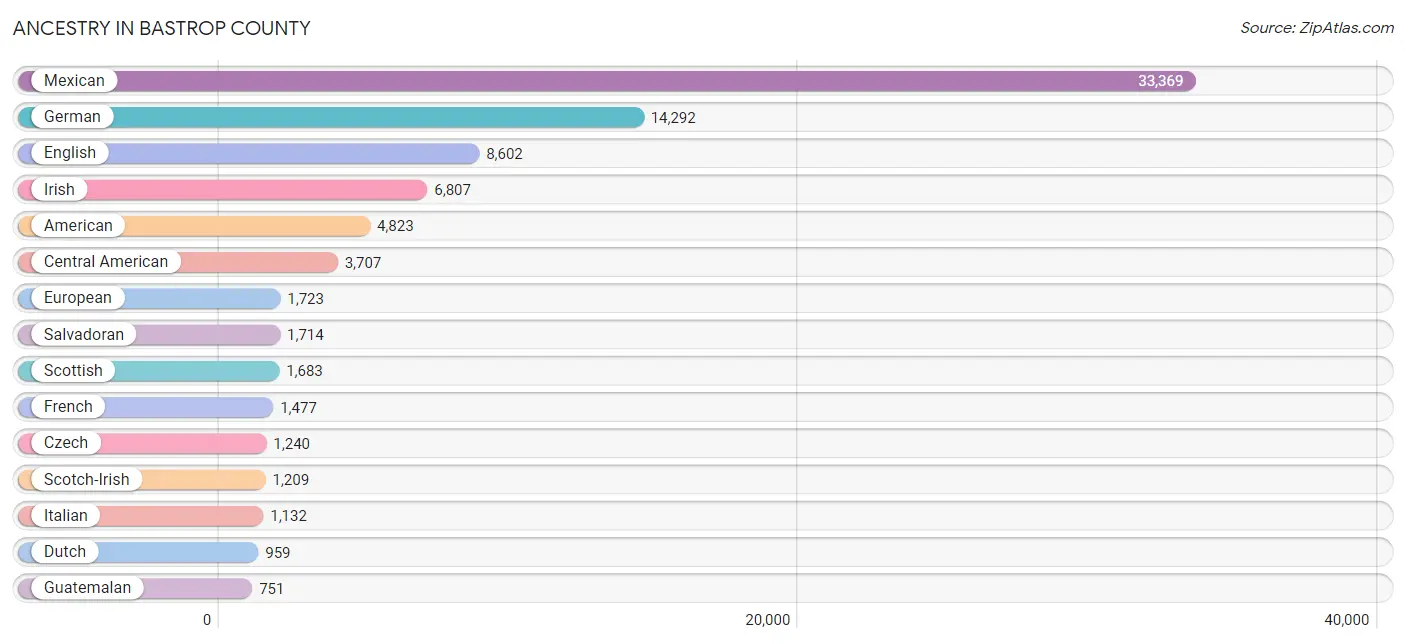
Ancestry in Bastrop County
The most populous ancestries reported in Bastrop County are Mexican (33,369 | 33.9%), German (14,292 | 14.5%), English (8,602 | 8.7%), Irish (6,807 | 6.9%), and American (4,823 | 4.9%), together accounting for 69.0% of all Bastrop County residents.
| Ancestry | # Population | % Population |
| African | 108 | 0.1% |
| American | 4,823 | 4.9% |
| Apache | 174 | 0.2% |
| Arab | 305 | 0.3% |
| Argentinean | 21 | 0.0% |
| Austrian | 210 | 0.2% |
| Belgian | 283 | 0.3% |
| Bhutanese | 251 | 0.3% |
| Blackfeet | 104 | 0.1% |
| Brazilian | 32 | 0.0% |
| British | 716 | 0.7% |
| Burmese | 34 | 0.0% |
| Cajun | 5 | 0.0% |
| Canadian | 3 | 0.0% |
| Central American | 3,707 | 3.8% |
| Central American Indian | 73 | 0.1% |
| Cherokee | 323 | 0.3% |
| Chickasaw | 44 | 0.0% |
| Chippewa | 22 | 0.0% |
| Choctaw | 93 | 0.1% |
| Colombian | 108 | 0.1% |
| Comanche | 95 | 0.1% |
| Creek | 57 | 0.1% |
| Croatian | 57 | 0.1% |
| Cuban | 237 | 0.2% |
| Czech | 1,240 | 1.3% |
| Czechoslovakian | 117 | 0.1% |
| Danish | 90 | 0.1% |
| Dominican | 20 | 0.0% |
| Dutch | 959 | 1.0% |
| Eastern European | 146 | 0.2% |
| Egyptian | 22 | 0.0% |
| English | 8,602 | 8.7% |
| European | 1,723 | 1.8% |
| French | 1,477 | 1.5% |
| French American Indian | 78 | 0.1% |
| French Canadian | 249 | 0.3% |
| German | 14,292 | 14.5% |
| Greek | 70 | 0.1% |
| Guatemalan | 751 | 0.8% |
| Honduran | 622 | 0.6% |
| Hungarian | 109 | 0.1% |
| Indian (Asian) | 298 | 0.3% |
| Iranian | 63 | 0.1% |
| Irish | 6,807 | 6.9% |
| Israeli | 35 | 0.0% |
| Italian | 1,132 | 1.1% |
| Jamaican | 22 | 0.0% |
| Korean | 313 | 0.3% |
| Lebanese | 265 | 0.3% |
| Lithuanian | 45 | 0.1% |
| Luxembourger | 13 | 0.0% |
| Malaysian | 17 | 0.0% |
| Mexican | 33,369 | 33.9% |
| Mexican American Indian | 401 | 0.4% |
| Native Hawaiian | 86 | 0.1% |
| Navajo | 48 | 0.1% |
| New Zealander | 58 | 0.1% |
| Nicaraguan | 526 | 0.5% |
| Northern European | 235 | 0.2% |
| Norwegian | 536 | 0.5% |
| Pakistani | 36 | 0.0% |
| Panamanian | 94 | 0.1% |
| Peruvian | 24 | 0.0% |
| Polish | 706 | 0.7% |
| Portuguese | 46 | 0.1% |
| Puerto Rican | 668 | 0.7% |
| Russian | 478 | 0.5% |
| Salvadoran | 1,714 | 1.7% |
| Scandinavian | 129 | 0.1% |
| Scotch-Irish | 1,209 | 1.2% |
| Scottish | 1,683 | 1.7% |
| Seminole | 189 | 0.2% |
| Sioux | 44 | 0.0% |
| Slovene | 34 | 0.0% |
| South African | 38 | 0.0% |
| South American | 153 | 0.2% |
| South American Indian | 14 | 0.0% |
| Spaniard | 515 | 0.5% |
| Spanish | 276 | 0.3% |
| Sri Lankan | 144 | 0.2% |
| Subsaharan African | 146 | 0.2% |
| Swedish | 631 | 0.6% |
| Swiss | 402 | 0.4% |
| Syrian | 18 | 0.0% |
| Thai | 45 | 0.1% |
| Ukrainian | 11 | 0.0% |
| Welsh | 566 | 0.6% | View All 88 Rows |
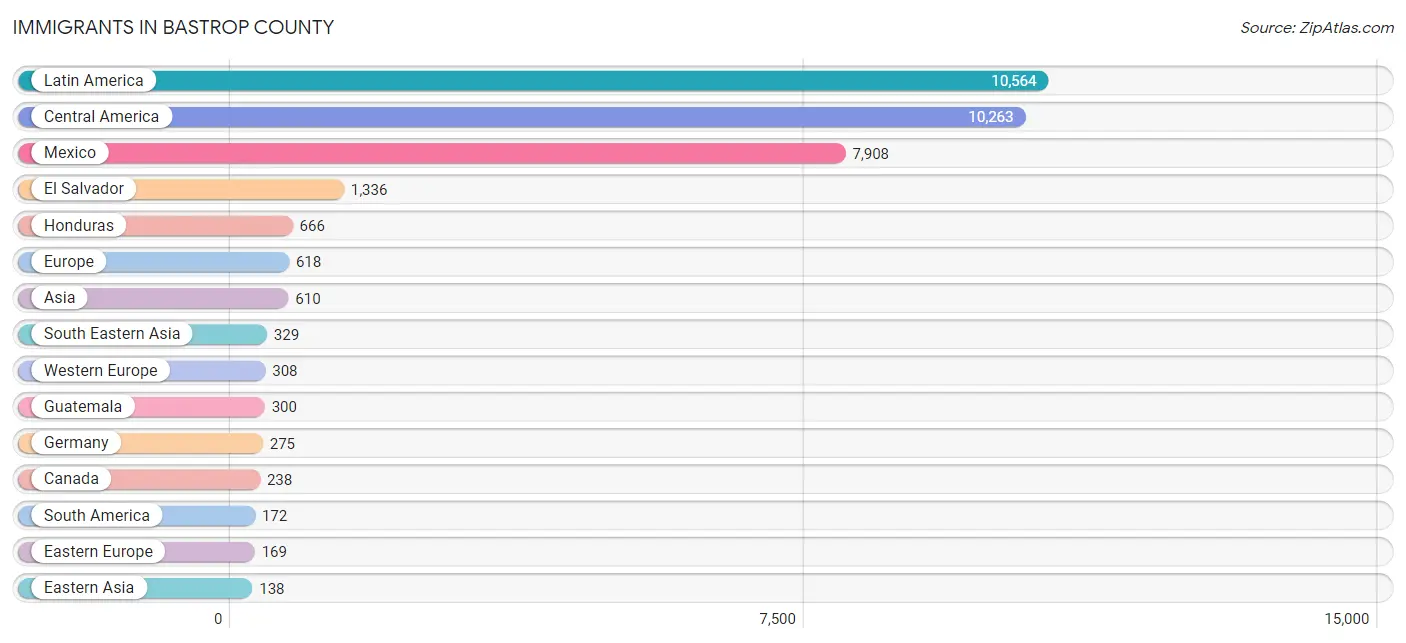
Immigrants in Bastrop County
The most numerous immigrant groups reported in Bastrop County came from Latin America (10,564 | 10.7%), Central America (10,263 | 10.4%), Mexico (7,908 | 8.0%), El Salvador (1,336 | 1.4%), and Honduras (666 | 0.7%), together accounting for 31.2% of all Bastrop County residents.
| Immigration Origin | # Population | % Population |
| Africa | 53 | 0.1% |
| Asia | 610 | 0.6% |
| Australia | 17 | 0.0% |
| Bolivia | 13 | 0.0% |
| Canada | 238 | 0.2% |
| Caribbean | 129 | 0.1% |
| Central America | 10,263 | 10.4% |
| Chile | 60 | 0.1% |
| China | 120 | 0.1% |
| Colombia | 79 | 0.1% |
| Cuba | 117 | 0.1% |
| Dominican Republic | 12 | 0.0% |
| Eastern Africa | 19 | 0.0% |
| Eastern Asia | 138 | 0.1% |
| Eastern Europe | 169 | 0.2% |
| El Salvador | 1,336 | 1.4% |
| England | 49 | 0.1% |
| Europe | 618 | 0.6% |
| France | 17 | 0.0% |
| Germany | 275 | 0.3% |
| Greece | 15 | 0.0% |
| Guatemala | 300 | 0.3% |
| Honduras | 666 | 0.7% |
| Hungary | 23 | 0.0% |
| India | 45 | 0.1% |
| Iran | 63 | 0.1% |
| Israel | 35 | 0.0% |
| Italy | 23 | 0.0% |
| Japan | 6 | 0.0% |
| Korea | 12 | 0.0% |
| Laos | 29 | 0.0% |
| Latin America | 10,564 | 10.7% |
| Malaysia | 1 | 0.0% |
| Mexico | 7,908 | 8.0% |
| Netherlands | 16 | 0.0% |
| Northern Africa | 16 | 0.0% |
| Northern Europe | 103 | 0.1% |
| Oceania | 69 | 0.1% |
| Panama | 53 | 0.1% |
| Peru | 20 | 0.0% |
| Philippines | 92 | 0.1% |
| Poland | 133 | 0.1% |
| South Africa | 18 | 0.0% |
| South America | 172 | 0.2% |
| South Central Asia | 108 | 0.1% |
| South Eastern Asia | 329 | 0.3% |
| Southern Europe | 38 | 0.0% |
| Taiwan | 58 | 0.1% |
| Thailand | 131 | 0.1% |
| Vietnam | 76 | 0.1% |
| Western Asia | 35 | 0.0% |
| Western Europe | 308 | 0.3% | View All 52 Rows |
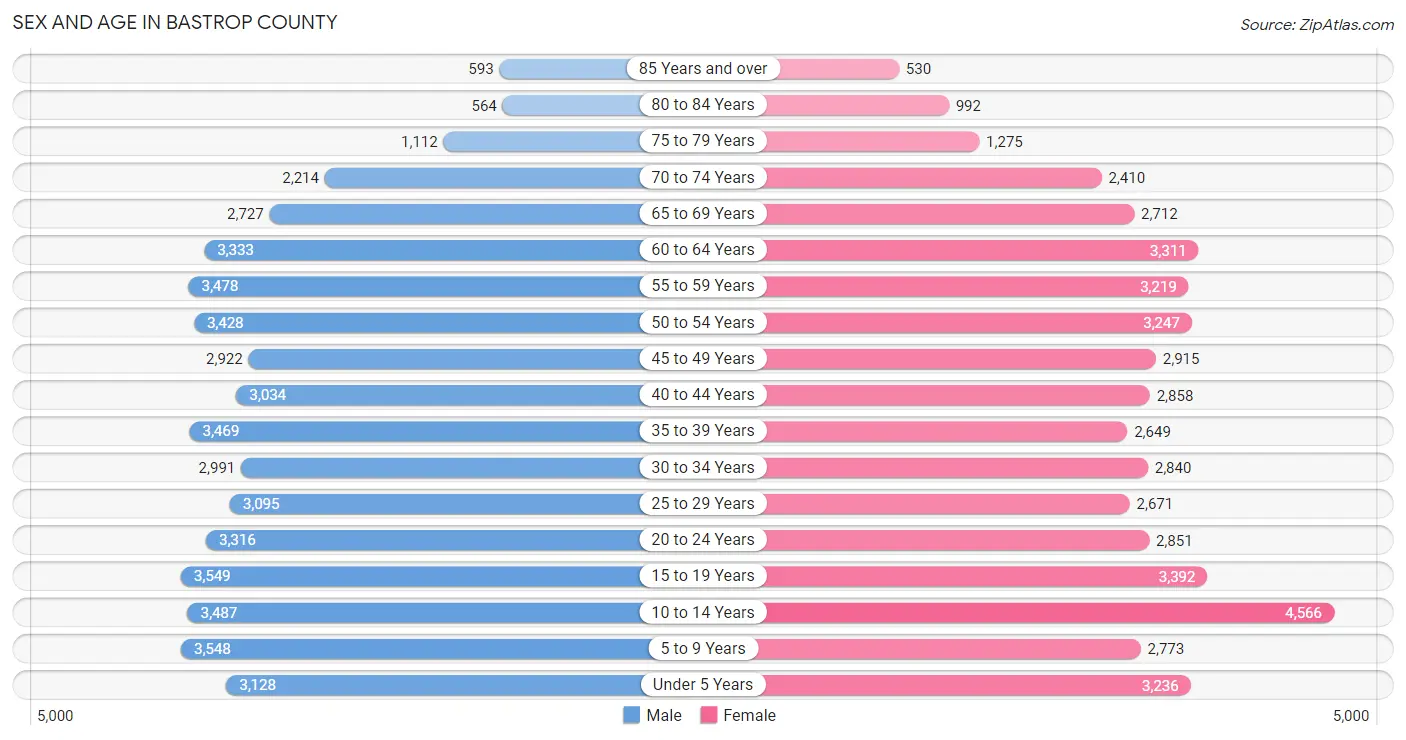
Sex and Age in Bastrop County
Sex and Age in Bastrop County
The most populous age groups in Bastrop County are 15 to 19 Years (3,549 | 7.1%) for men and 10 to 14 Years (4,566 | 9.4%) for women.
| Age Bracket | Male | Female |
| Under 5 Years | 3,128 (6.3%) | 3,236 (6.7%) |
| 5 to 9 Years | 3,548 (7.1%) | 2,773 (5.7%) |
| 10 to 14 Years | 3,487 (7.0%) | 4,566 (9.4%) |
| 15 to 19 Years | 3,549 (7.1%) | 3,392 (7.0%) |
| 20 to 24 Years | 3,316 (6.6%) | 2,851 (5.9%) |
| 25 to 29 Years | 3,095 (6.2%) | 2,671 (5.5%) |
| 30 to 34 Years | 2,991 (6.0%) | 2,840 (5.9%) |
| 35 to 39 Years | 3,469 (6.9%) | 2,649 (5.5%) |
| 40 to 44 Years | 3,034 (6.1%) | 2,858 (5.9%) |
| 45 to 49 Years | 2,922 (5.9%) | 2,915 (6.0%) |
| 50 to 54 Years | 3,428 (6.9%) | 3,247 (6.7%) |
| 55 to 59 Years | 3,478 (7.0%) | 3,219 (6.6%) |
| 60 to 64 Years | 3,333 (6.7%) | 3,311 (6.8%) |
| 65 to 69 Years | 2,727 (5.5%) | 2,712 (5.6%) |
| 70 to 74 Years | 2,214 (4.4%) | 2,410 (5.0%) |
| 75 to 79 Years | 1,112 (2.2%) | 1,275 (2.6%) |
| 80 to 84 Years | 564 (1.1%) | 992 (2.1%) |
| 85 Years and over | 593 (1.2%) | 530 (1.1%) |
| Total | 49,988 (100.0%) | 48,447 (100.0%) |
Families and Households in Bastrop County
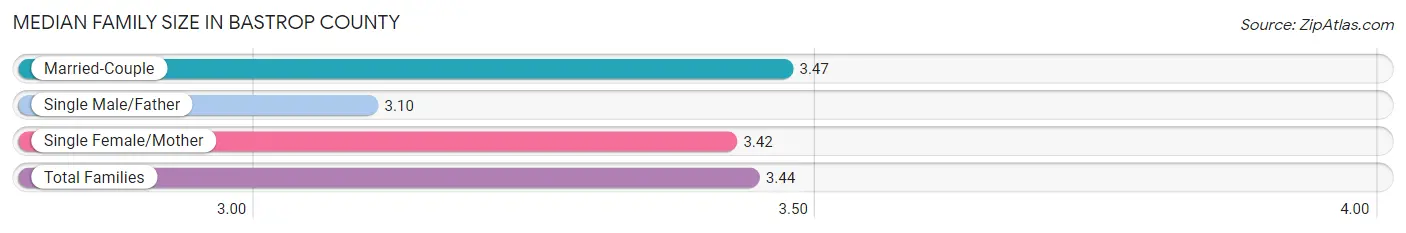
Median Family Size in Bastrop County
The median family size in Bastrop County is 3.44 persons per family, with married-couple families (18,063 | 76.0%) accounting for the largest median family size of 3.47 persons per family. On the other hand, single male/father families (1,616 | 6.8%) represent the smallest median family size with 3.10 persons per family.
| Family Type | # Families | Family Size |
| Married-Couple | 18,063 (76.0%) | 3.47 |
| Single Male/Father | 1,616 (6.8%) | 3.10 |
| Single Female/Mother | 4,079 (17.2%) | 3.42 |
| Total Families | 23,758 (100.0%) | 3.44 |
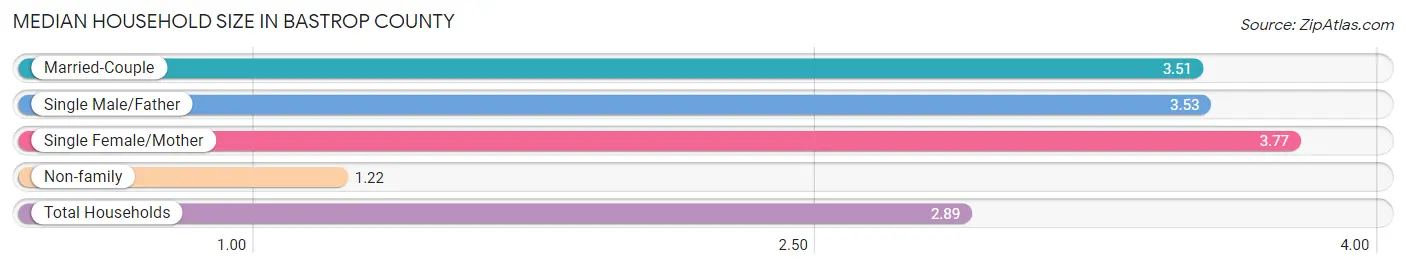
Median Household Size in Bastrop County
The median household size in Bastrop County is 2.89 persons per household, with single female/mother households (4,079 | 12.3%) accounting for the largest median household size of 3.77 persons per household. non-family households (9,501 | 28.6%) represent the smallest median household size with 1.22 persons per household.
| Household Type | # Households | Household Size |
| Married-Couple | 18,063 (54.3%) | 3.51 |
| Single Male/Father | 1,616 (4.9%) | 3.53 |
| Single Female/Mother | 4,079 (12.3%) | 3.77 |
| Non-family | 9,501 (28.6%) | 1.22 |
| Total Households | 33,259 (100.0%) | 2.89 |
Household Size by Marriage Status in Bastrop County
Out of a total of 33,259 households in Bastrop County, 23,758 (71.4%) are family households, while 9,501 (28.6%) are nonfamily households. The most numerous type of family households are 2-person households, comprising 9,578, and the most common type of nonfamily households are 1-person households, comprising 7,894.
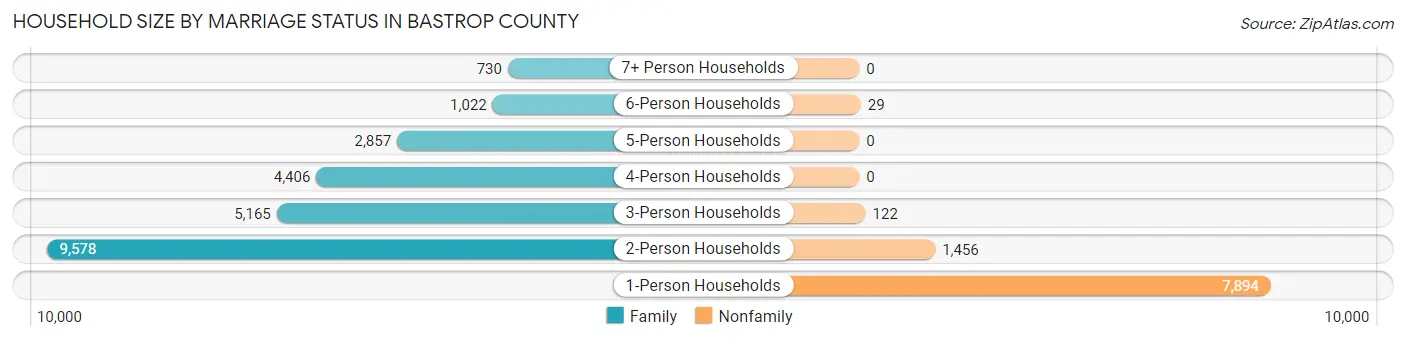
| Household Size | Family Households | Nonfamily Households |
| 1-Person Households | - | 7,894 (23.7%) |
| 2-Person Households | 9,578 (28.8%) | 1,456 (4.4%) |
| 3-Person Households | 5,165 (15.5%) | 122 (0.4%) |
| 4-Person Households | 4,406 (13.3%) | 0 (0.0%) |
| 5-Person Households | 2,857 (8.6%) | 0 (0.0%) |
| 6-Person Households | 1,022 (3.1%) | 29 (0.1%) |
| 7+ Person Households | 730 (2.2%) | 0 (0.0%) |
| Total | 23,758 (71.4%) | 9,501 (28.6%) |
Female Fertility in Bastrop County
Fertility by Age in Bastrop County
Average fertility rate in Bastrop County is 39.0 births per 1,000 women. Women in the age bracket of 20 to 34 years have the highest fertility rate with 58.0 births per 1,000 women. Women in the age bracket of 20 to 34 years acount for 59.0% of all women with births.
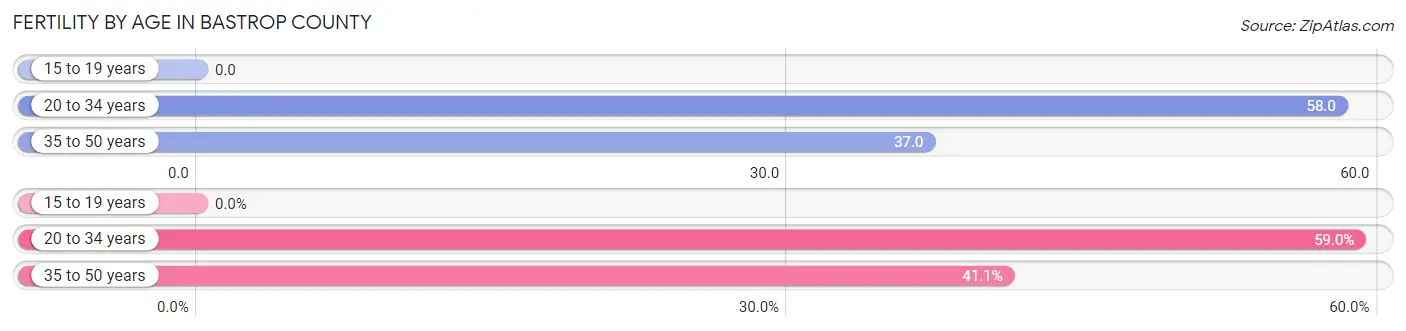
| Age Bracket | Women with Births | Births / 1,000 Women |
| 15 to 19 years | 0 (0.0%) | 0.0 |
| 20 to 34 years | 481 (59.0%) | 58.0 |
| 35 to 50 years | 335 (41.0%) | 37.0 |
| Total | 816 (100.0%) | 39.0 |
Fertility by Age by Marriage Status in Bastrop County
71.4% of women with births (816) in Bastrop County are married. The highest percentage of unmarried women with births falls into 20 to 34 years age bracket with 40.7% of them unmarried at the time of birth, while the lowest percentage of unmarried women with births belong to 35 to 50 years age bracket with 11.0% of them unmarried.
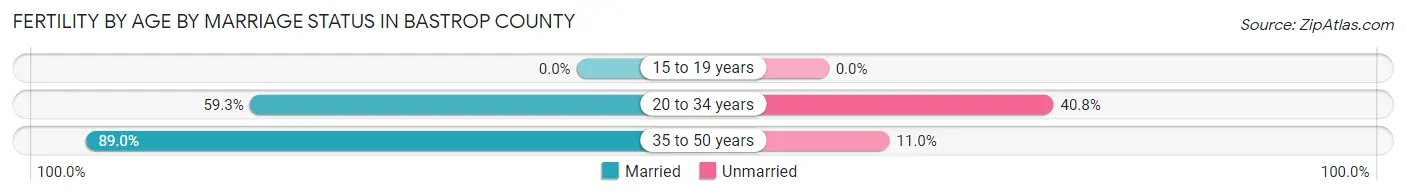
| Age Bracket | Married | Unmarried |
| 15 to 19 years | 0 (0.0%) | 0 (0.0%) |
| 20 to 34 years | 285 (59.3%) | 196 (40.7%) |
| 35 to 50 years | 298 (89.0%) | 37 (11.0%) |
| Total | 583 (71.5%) | 233 (28.5%) |
Fertility by Education in Bastrop County
Average fertility rate in Bastrop County is 39.0 births per 1,000 women. Women with the education attainment of high school diploma have the highest fertility rate of 58.0 births per 1,000 women, while women with the education attainment of less than high school have the lowest fertility at 8.0 births per 1,000 women. Women with the education attainment of high school diploma represent 42.5% of all women with births.
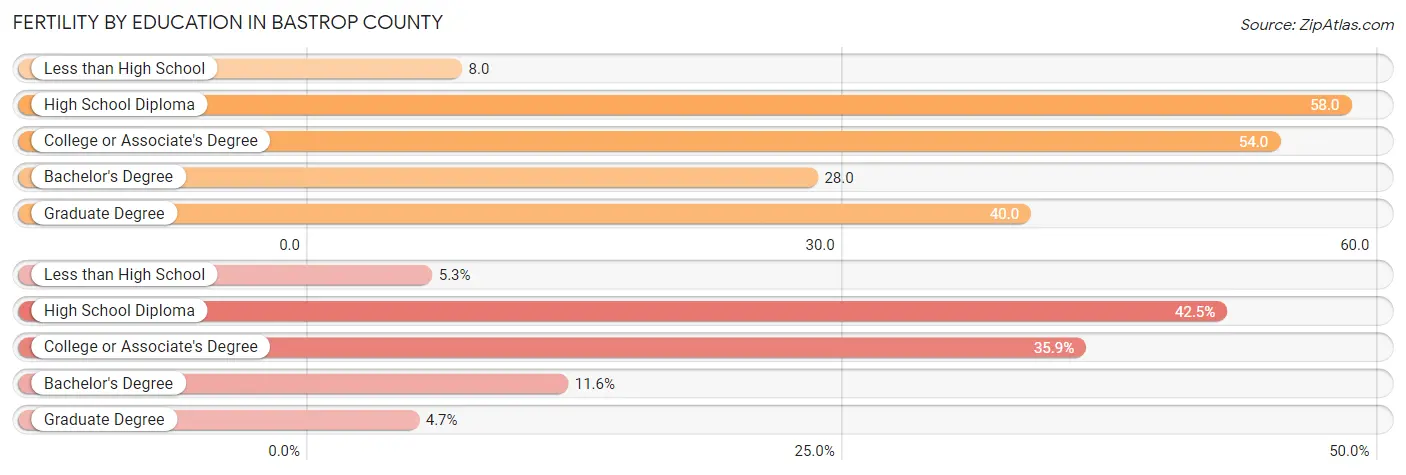
| Educational Attainment | Women with Births | Births / 1,000 Women |
| Less than High School | 43 (5.3%) | 8.0 |
| High School Diploma | 347 (42.5%) | 58.0 |
| College or Associate's Degree | 293 (35.9%) | 54.0 |
| Bachelor's Degree | 95 (11.6%) | 28.0 |
| Graduate Degree | 38 (4.7%) | 40.0 |
| Total | 816 (100.0%) | 39.0 |
Fertility by Education by Marriage Status in Bastrop County
28.5% of women with births in Bastrop County are unmarried. Women with the educational attainment of less than high school are most likely to be married with 100.0% of them married at childbirth, while women with the educational attainment of bachelor's degree are least likely to be married with 46.3% of them unmarried at childbirth.
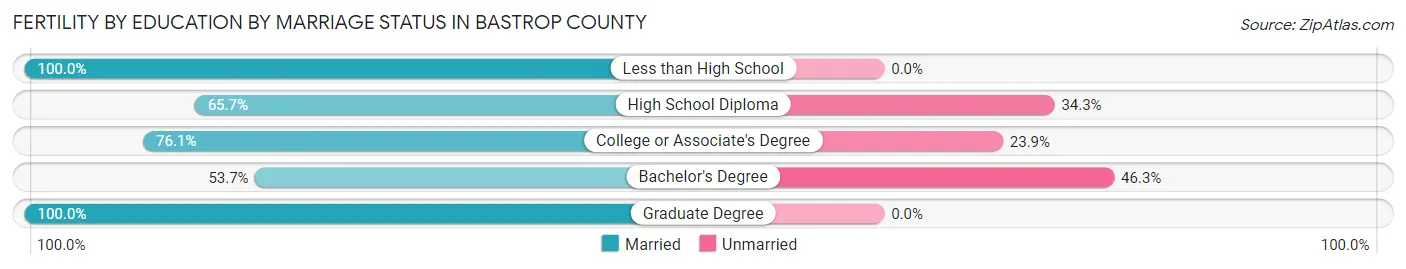
| Educational Attainment | Married | Unmarried |
| Less than High School | 43 (100.0%) | 0 (0.0%) |
| High School Diploma | 228 (65.7%) | 119 (34.3%) |
| College or Associate's Degree | 223 (76.1%) | 70 (23.9%) |
| Bachelor's Degree | 51 (53.7%) | 44 (46.3%) |
| Graduate Degree | 38 (100.0%) | 0 (0.0%) |
| Total | 583 (71.5%) | 233 (28.5%) |
Employment Characteristics in Bastrop County
Employment by Class of Employer in Bastrop County
Among the 44,714 employed individuals in Bastrop County, private company employees (28,941 | 64.7%), local government employees (3,767 | 8.4%), and state government employees (3,349 | 7.5%) make up the most common classes of employment.
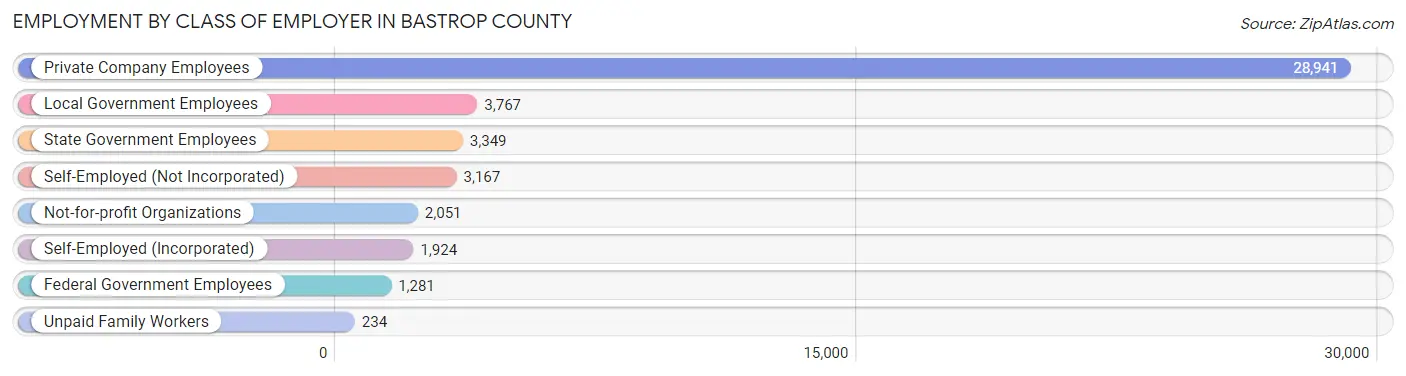
| Employer Class | # Employees | % Employees |
| Private Company Employees | 28,941 | 64.7% |
| Self-Employed (Incorporated) | 1,924 | 4.3% |
| Self-Employed (Not Incorporated) | 3,167 | 7.1% |
| Not-for-profit Organizations | 2,051 | 4.6% |
| Local Government Employees | 3,767 | 8.4% |
| State Government Employees | 3,349 | 7.5% |
| Federal Government Employees | 1,281 | 2.9% |
| Unpaid Family Workers | 234 | 0.5% |
| Total | 44,714 | 100.0% |
Employment Status by Age in Bastrop County
According to the labor force statistics for Bastrop County, out of the total population over 16 years of age (75,991), 62.6% or 47,570 individuals are in the labor force, with 4.4% or 2,093 of them unemployed. The age group with the highest labor force participation rate is 25 to 29 years, with 81.8% or 4,717 individuals in the labor force. Within the labor force, the 16 to 19 years age range has the highest percentage of unemployed individuals, with 12.5% or 305 of them being unemployed.
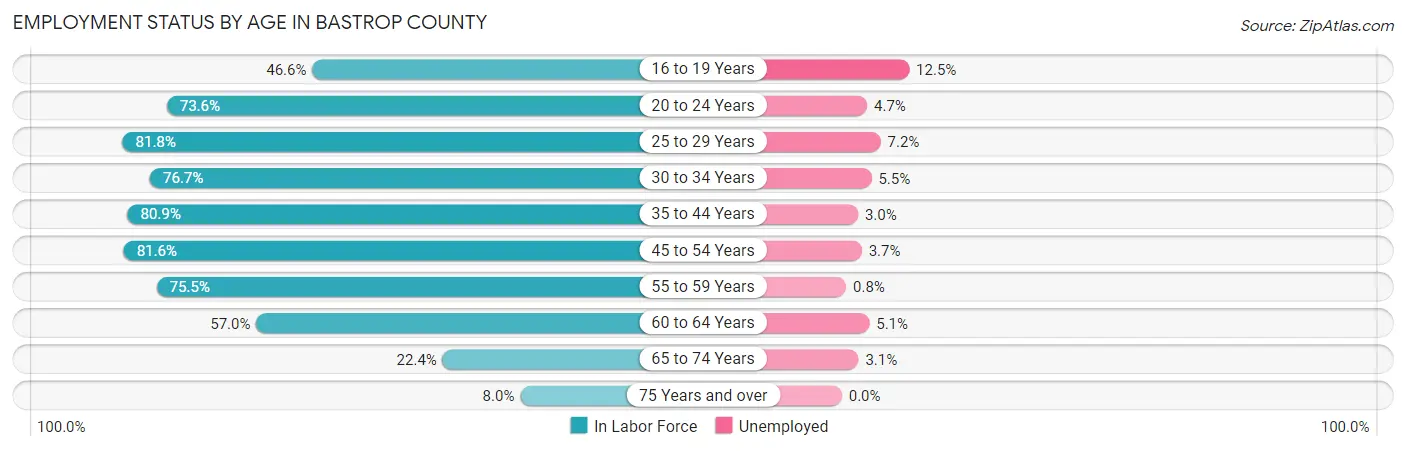
| Age Bracket | In Labor Force | Unemployed |
| 16 to 19 Years | 2,440 (46.6%) | 305 (12.5%) |
| 20 to 24 Years | 4,539 (73.6%) | 213 (4.7%) |
| 25 to 29 Years | 4,717 (81.8%) | 340 (7.2%) |
| 30 to 34 Years | 4,472 (76.7%) | 246 (5.5%) |
| 35 to 44 Years | 9,716 (80.9%) | 291 (3.0%) |
| 45 to 54 Years | 10,210 (81.6%) | 378 (3.7%) |
| 55 to 59 Years | 5,056 (75.5%) | 40 (0.8%) |
| 60 to 64 Years | 3,787 (57.0%) | 193 (5.1%) |
| 65 to 74 Years | 2,254 (22.4%) | 70 (3.1%) |
| 75 Years and over | 405 (8.0%) | 0 (0.0%) |
| Total | 47,570 (62.6%) | 2,093 (4.4%) |
Employment Status by Educational Attainment in Bastrop County
According to labor force statistics for Bastrop County, 76.7% of individuals (37,936) out of the total population between 25 and 64 years of age (49,460) are in the labor force, with 3.9% or 1,480 of them being unemployed. The group with the highest labor force participation rate are those with the educational attainment of bachelor's degree or higher, with 86.6% or 9,302 individuals in the labor force. Within the labor force, individuals with bachelor's degree or higher education have the highest percentage of unemployment, with 5.4% or 502 of them being unemployed.
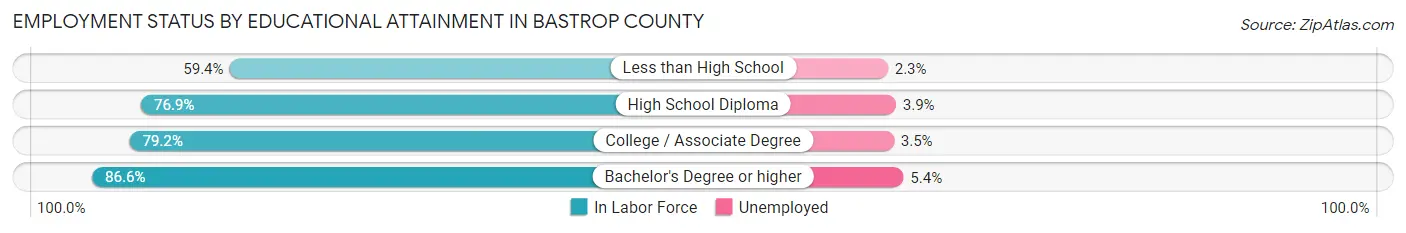
| Educational Attainment | In Labor Force | Unemployed |
| Less than High School | 4,978 (59.4%) | 193 (2.3%) |
| High School Diploma | 12,063 (76.9%) | 612 (3.9%) |
| College / Associate Degree | 11,604 (79.2%) | 513 (3.5%) |
| Bachelor's Degree or higher | 9,302 (86.6%) | 580 (5.4%) |
| Total | 37,936 (76.7%) | 1,929 (3.9%) |
Employment Occupations by Sex in Bastrop County
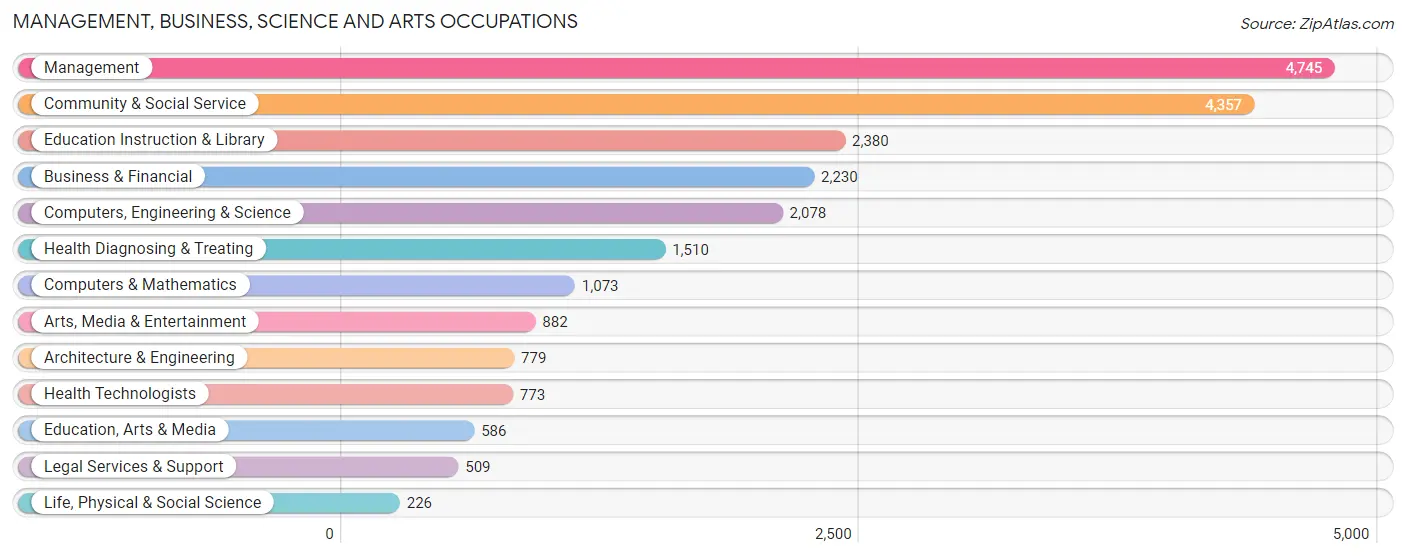
Management, Business, Science and Arts Occupations
The most common Management, Business, Science and Arts occupations in Bastrop County are Management (4,745 | 10.5%), Community & Social Service (4,357 | 9.6%), Education Instruction & Library (2,380 | 5.2%), Business & Financial (2,230 | 4.9%), and Computers, Engineering & Science (2,078 | 4.6%).
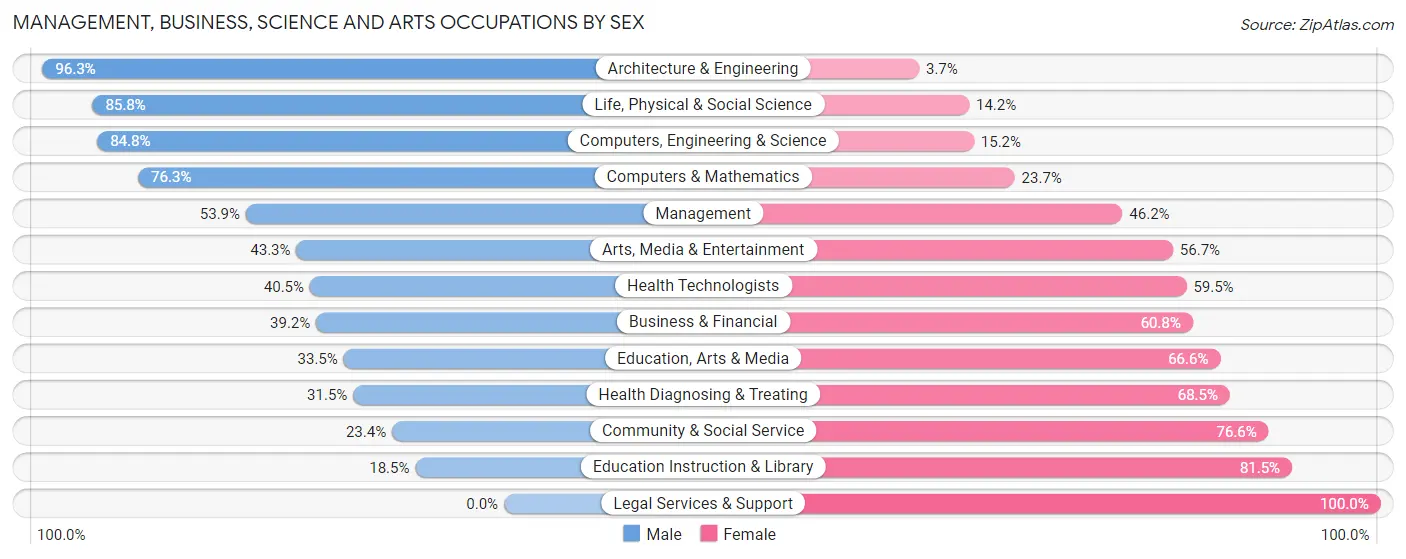
Management, Business, Science and Arts Occupations by Sex
Within the Management, Business, Science and Arts occupations in Bastrop County, the most male-oriented occupations are Architecture & Engineering (96.3%), Life, Physical & Social Science (85.8%), and Computers, Engineering & Science (84.8%), while the most female-oriented occupations are Legal Services & Support (100.0%), Education Instruction & Library (81.5%), and Community & Social Service (76.6%).
| Occupation | Male | Female |
| Management | 2,555 (53.8%) | 2,190 (46.2%) |
| Business & Financial | 874 (39.2%) | 1,356 (60.8%) |
| Computers, Engineering & Science | 1,763 (84.8%) | 315 (15.2%) |
| Computers & Mathematics | 819 (76.3%) | 254 (23.7%) |
| Architecture & Engineering | 750 (96.3%) | 29 (3.7%) |
| Life, Physical & Social Science | 194 (85.8%) | 32 (14.2%) |
| Community & Social Service | 1,018 (23.4%) | 3,339 (76.6%) |
| Education, Arts & Media | 196 (33.5%) | 390 (66.5%) |
| Legal Services & Support | 0 (0.0%) | 509 (100.0%) |
| Education Instruction & Library | 440 (18.5%) | 1,940 (81.5%) |
| Arts, Media & Entertainment | 382 (43.3%) | 500 (56.7%) |
| Health Diagnosing & Treating | 475 (31.5%) | 1,035 (68.5%) |
| Health Technologists | 313 (40.5%) | 460 (59.5%) |
| Total (Category) | 6,685 (44.8%) | 8,235 (55.2%) |
| Total (Overall) | 25,056 (55.2%) | 20,316 (44.8%) |
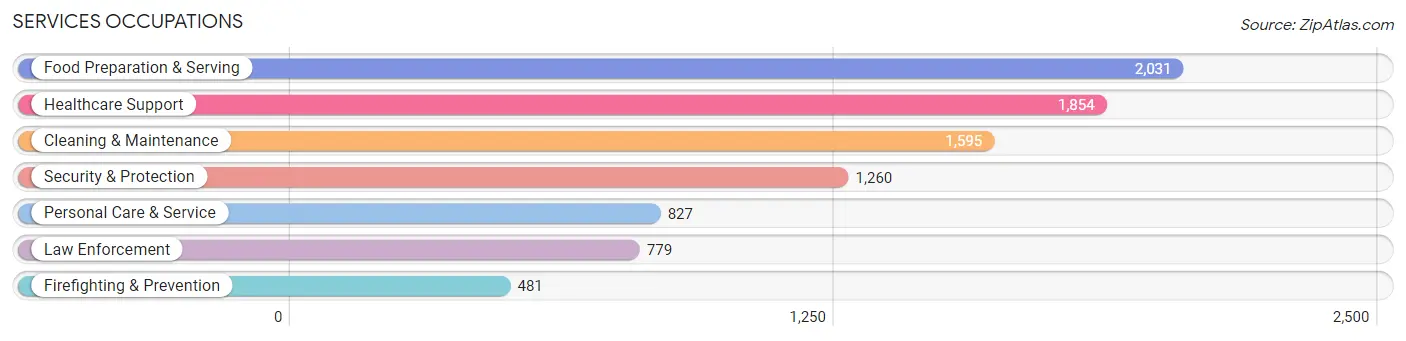
Services Occupations
The most common Services occupations in Bastrop County are Food Preparation & Serving (2,031 | 4.5%), Healthcare Support (1,854 | 4.1%), Cleaning & Maintenance (1,595 | 3.5%), Security & Protection (1,260 | 2.8%), and Personal Care & Service (827 | 1.8%).
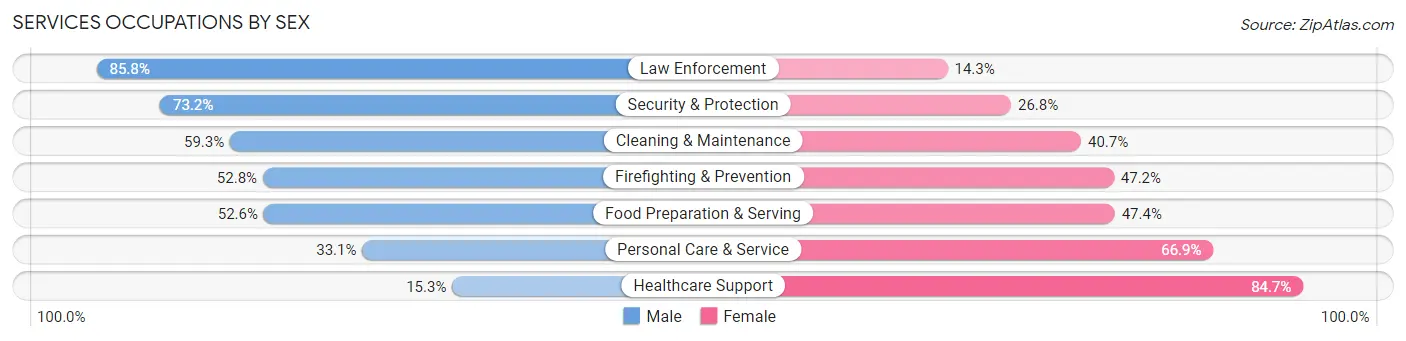
Services Occupations by Sex
Within the Services occupations in Bastrop County, the most male-oriented occupations are Law Enforcement (85.8%), Security & Protection (73.2%), and Cleaning & Maintenance (59.3%), while the most female-oriented occupations are Healthcare Support (84.7%), Personal Care & Service (66.9%), and Food Preparation & Serving (47.4%).
| Occupation | Male | Female |
| Healthcare Support | 284 (15.3%) | 1,570 (84.7%) |
| Security & Protection | 922 (73.2%) | 338 (26.8%) |
| Firefighting & Prevention | 254 (52.8%) | 227 (47.2%) |
| Law Enforcement | 668 (85.8%) | 111 (14.2%) |
| Food Preparation & Serving | 1,069 (52.6%) | 962 (47.4%) |
| Cleaning & Maintenance | 946 (59.3%) | 649 (40.7%) |
| Personal Care & Service | 274 (33.1%) | 553 (66.9%) |
| Total (Category) | 3,495 (46.2%) | 4,072 (53.8%) |
| Total (Overall) | 25,056 (55.2%) | 20,316 (44.8%) |
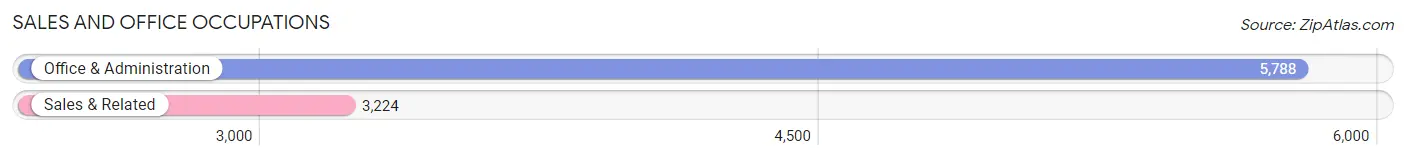
Sales and Office Occupations
The most common Sales and Office occupations in Bastrop County are Office & Administration (5,788 | 12.8%), and Sales & Related (3,224 | 7.1%).
Sales and Office Occupations by Sex
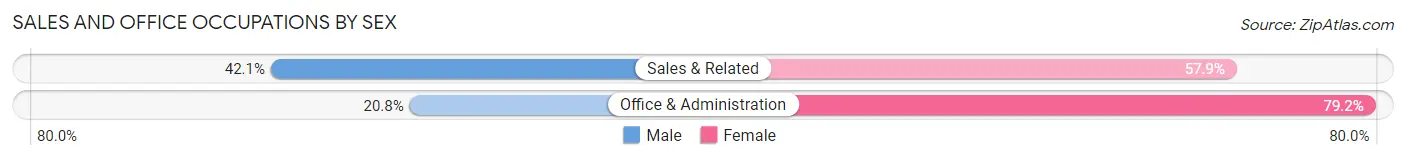
| Occupation | Male | Female |
| Sales & Related | 1,358 (42.1%) | 1,866 (57.9%) |
| Office & Administration | 1,203 (20.8%) | 4,585 (79.2%) |
| Total (Category) | 2,561 (28.4%) | 6,451 (71.6%) |
| Total (Overall) | 25,056 (55.2%) | 20,316 (44.8%) |
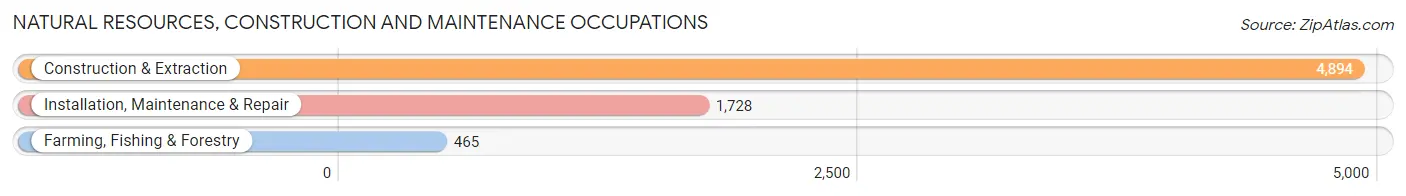
Natural Resources, Construction and Maintenance Occupations
The most common Natural Resources, Construction and Maintenance occupations in Bastrop County are Construction & Extraction (4,894 | 10.8%), Installation, Maintenance & Repair (1,728 | 3.8%), and Farming, Fishing & Forestry (465 | 1.0%).
Natural Resources, Construction and Maintenance Occupations by Sex
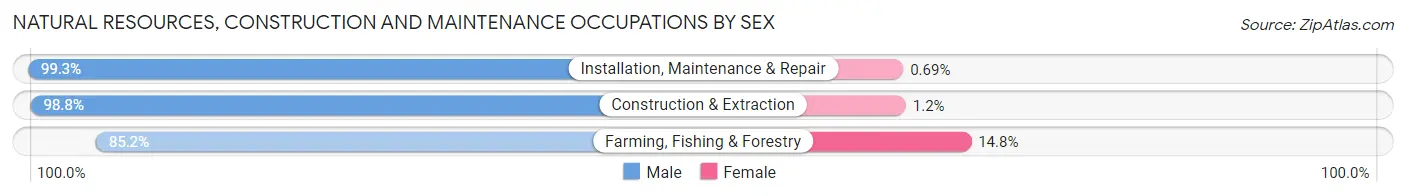
| Occupation | Male | Female |
| Farming, Fishing & Forestry | 396 (85.2%) | 69 (14.8%) |
| Construction & Extraction | 4,834 (98.8%) | 60 (1.2%) |
| Installation, Maintenance & Repair | 1,716 (99.3%) | 12 (0.7%) |
| Total (Category) | 6,946 (98.0%) | 141 (2.0%) |
| Total (Overall) | 25,056 (55.2%) | 20,316 (44.8%) |
Production, Transportation and Moving Occupations
The most common Production, Transportation and Moving occupations in Bastrop County are Transportation (2,855 | 6.3%), Production (2,160 | 4.8%), and Material Moving (1,771 | 3.9%).
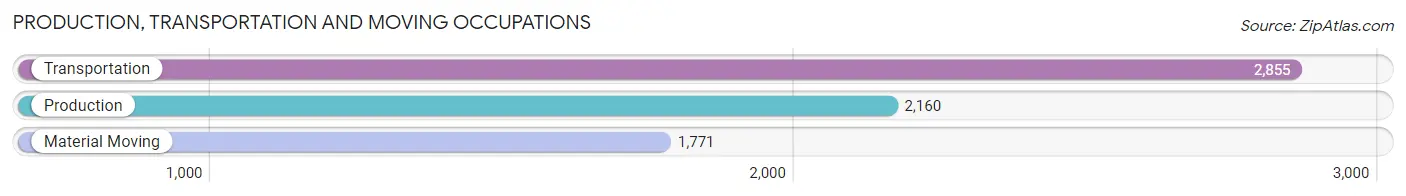
Production, Transportation and Moving Occupations by Sex
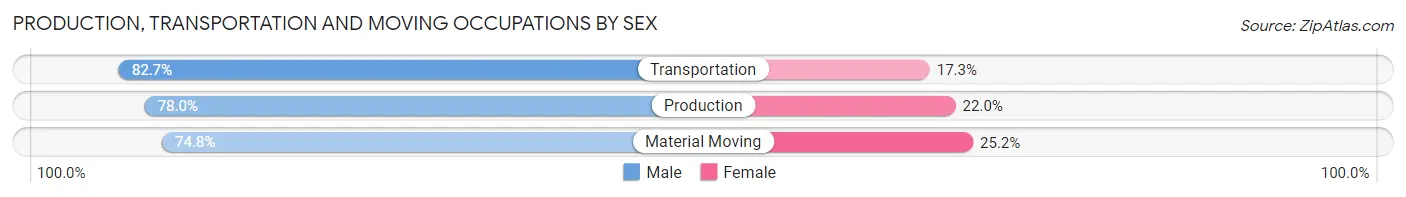
| Occupation | Male | Female |
| Production | 1,684 (78.0%) | 476 (22.0%) |
| Transportation | 2,361 (82.7%) | 494 (17.3%) |
| Material Moving | 1,324 (74.8%) | 447 (25.2%) |
| Total (Category) | 5,369 (79.1%) | 1,417 (20.9%) |
| Total (Overall) | 25,056 (55.2%) | 20,316 (44.8%) |
Employment Industries by Sex in Bastrop County
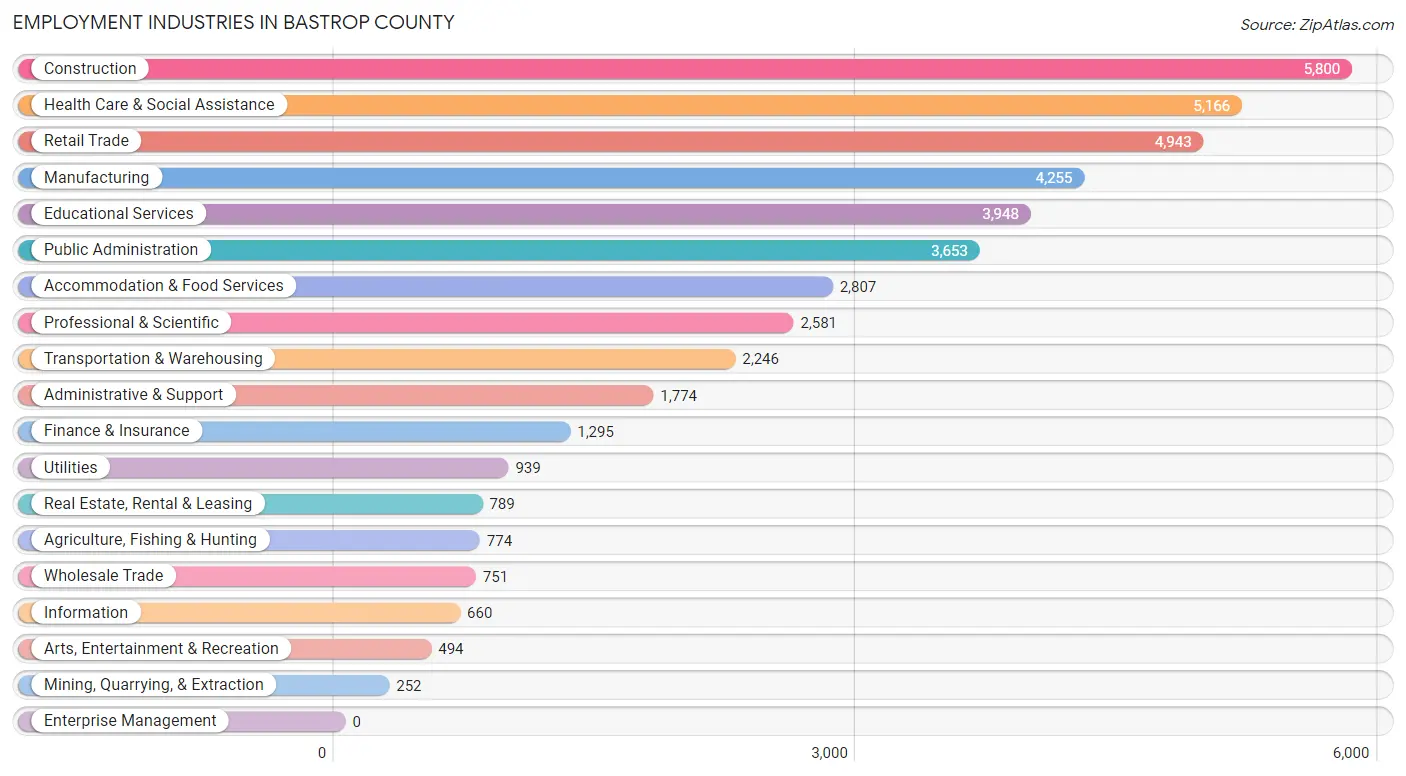
Employment Industries in Bastrop County
The major employment industries in Bastrop County include Construction (5,800 | 12.8%), Health Care & Social Assistance (5,166 | 11.4%), Retail Trade (4,943 | 10.9%), Manufacturing (4,255 | 9.4%), and Educational Services (3,948 | 8.7%).
Employment Industries by Sex in Bastrop County
The Bastrop County industries that see more men than women are Construction (94.8%), Mining, Quarrying, & Extraction (91.3%), and Manufacturing (77.9%), whereas the industries that tend to have a higher number of women are Finance & Insurance (77.3%), Health Care & Social Assistance (76.8%), and Educational Services (69.8%).
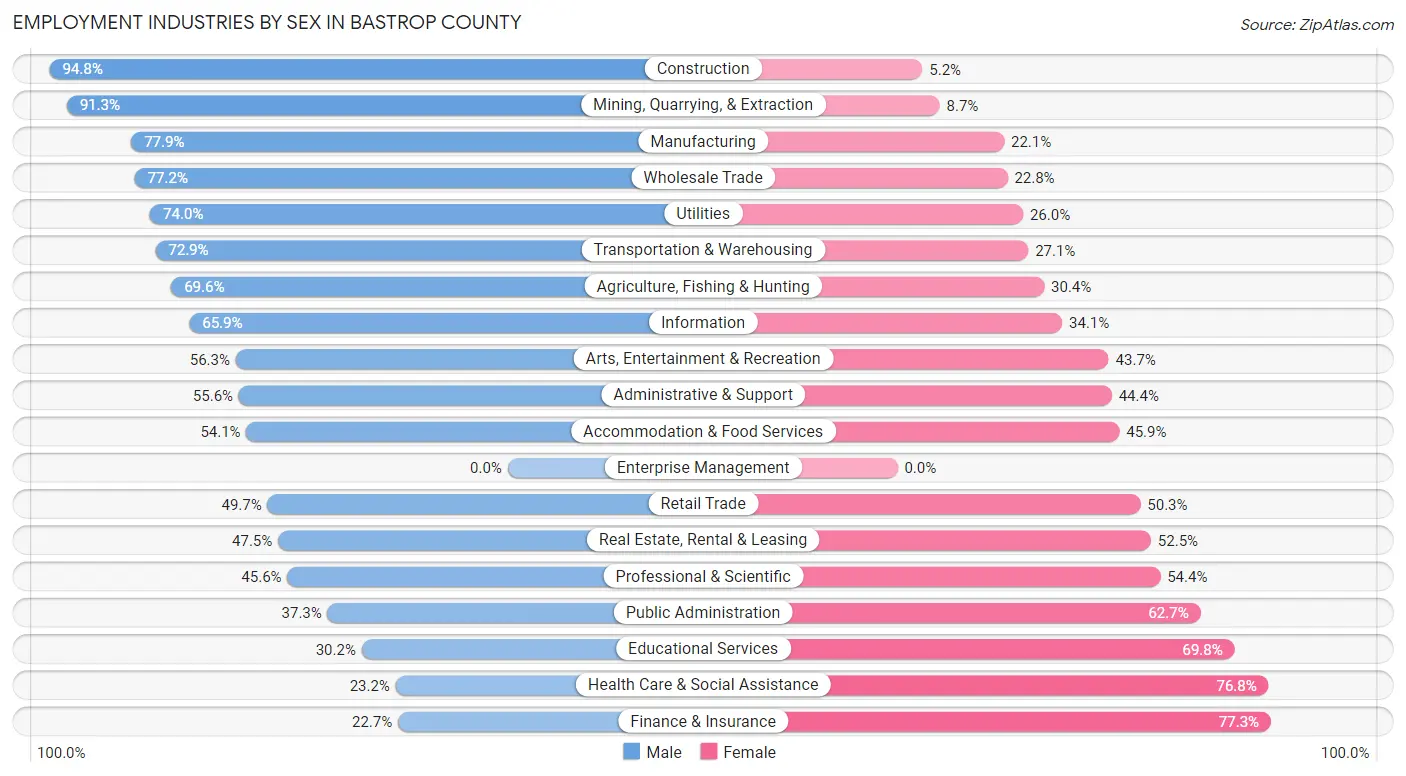
| Industry | Male | Female |
| Agriculture, Fishing & Hunting | 539 (69.6%) | 235 (30.4%) |
| Mining, Quarrying, & Extraction | 230 (91.3%) | 22 (8.7%) |
| Construction | 5,501 (94.8%) | 299 (5.2%) |
| Manufacturing | 3,316 (77.9%) | 939 (22.1%) |
| Wholesale Trade | 580 (77.2%) | 171 (22.8%) |
| Retail Trade | 2,457 (49.7%) | 2,486 (50.3%) |
| Transportation & Warehousing | 1,638 (72.9%) | 608 (27.1%) |
| Utilities | 695 (74.0%) | 244 (26.0%) |
| Information | 435 (65.9%) | 225 (34.1%) |
| Finance & Insurance | 294 (22.7%) | 1,001 (77.3%) |
| Real Estate, Rental & Leasing | 375 (47.5%) | 414 (52.5%) |
| Professional & Scientific | 1,177 (45.6%) | 1,404 (54.4%) |
| Enterprise Management | 0 (0.0%) | 0 (0.0%) |
| Administrative & Support | 987 (55.6%) | 787 (44.4%) |
| Educational Services | 1,193 (30.2%) | 2,755 (69.8%) |
| Health Care & Social Assistance | 1,198 (23.2%) | 3,968 (76.8%) |
| Arts, Entertainment & Recreation | 278 (56.3%) | 216 (43.7%) |
| Accommodation & Food Services | 1,518 (54.1%) | 1,289 (45.9%) |
| Public Administration | 1,362 (37.3%) | 2,291 (62.7%) |
| Total | 25,056 (55.2%) | 20,316 (44.8%) |
Education in Bastrop County
School Enrollment in Bastrop County
The most common levels of schooling among the 21,845 students in Bastrop County are middle school (6,154 | 28.2%), high school (5,812 | 26.6%), and elementary school (4,626 | 21.2%).
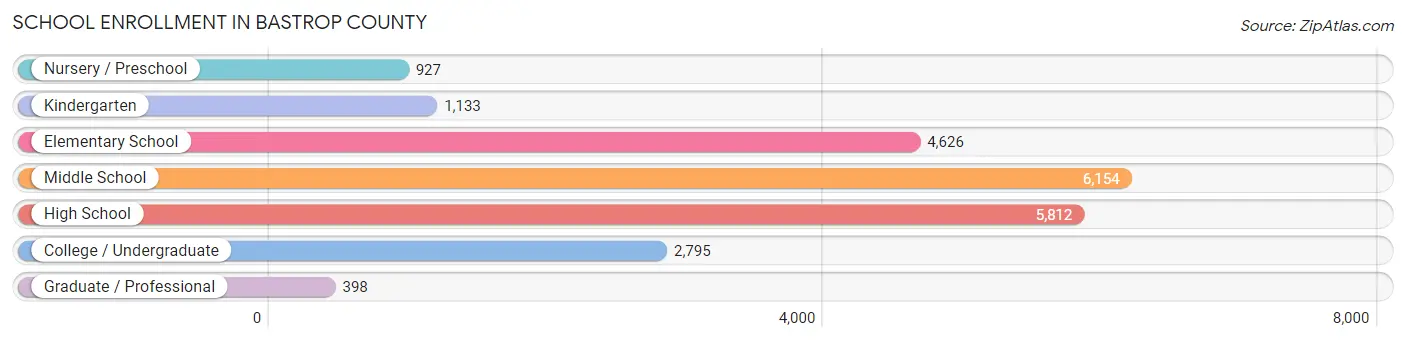
| School Level | # Students | % Students |
| Nursery / Preschool | 927 | 4.2% |
| Kindergarten | 1,133 | 5.2% |
| Elementary School | 4,626 | 21.2% |
| Middle School | 6,154 | 28.2% |
| High School | 5,812 | 26.6% |
| College / Undergraduate | 2,795 | 12.8% |
| Graduate / Professional | 398 | 1.8% |
| Total | 21,845 | 100.0% |
School Enrollment by Age by Funding Source in Bastrop County
Out of a total of 21,845 students who are enrolled in schools in Bastrop County, 2,949 (13.5%) attend a private institution, while the remaining 18,896 (86.5%) are enrolled in public schools. The age group of 25 to 34 year olds has the highest likelihood of being enrolled in private schools, with 235 (44.3% in the age bracket) enrolled. Conversely, the age group of 18 to 19 year olds has the lowest likelihood of being enrolled in a private school, with 1,263 (95.2% in the age bracket) attending a public institution.
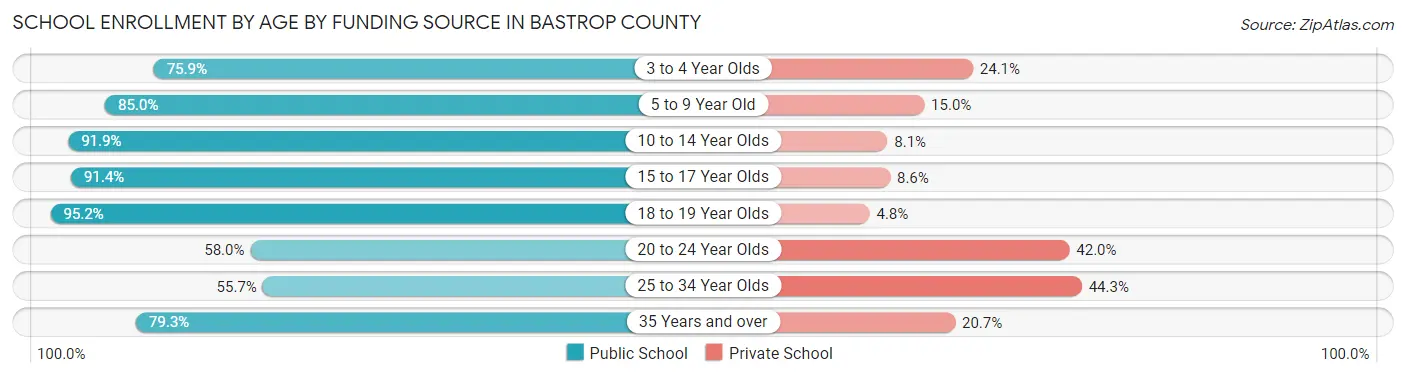
| Age Bracket | Public School | Private School |
| 3 to 4 Year Olds | 587 (75.9%) | 186 (24.1%) |
| 5 to 9 Year Old | 4,496 (85.0%) | 793 (15.0%) |
| 10 to 14 Year Olds | 7,098 (91.9%) | 628 (8.1%) |
| 15 to 17 Year Olds | 3,916 (91.4%) | 370 (8.6%) |
| 18 to 19 Year Olds | 1,263 (95.2%) | 64 (4.8%) |
| 20 to 24 Year Olds | 732 (58.0%) | 531 (42.0%) |
| 25 to 34 Year Olds | 295 (55.7%) | 235 (44.3%) |
| 35 Years and over | 516 (79.3%) | 135 (20.7%) |
| Total | 18,896 (86.5%) | 2,949 (13.5%) |
Educational Attainment by Field of Study in Bastrop County
Business (2,909 | 18.5%), education (2,097 | 13.3%), social sciences (1,477 | 9.4%), arts & humanities (1,169 | 7.4%), and science & technology (1,135 | 7.2%) are the most common fields of study among 15,759 individuals in Bastrop County who have obtained a bachelor's degree or higher.
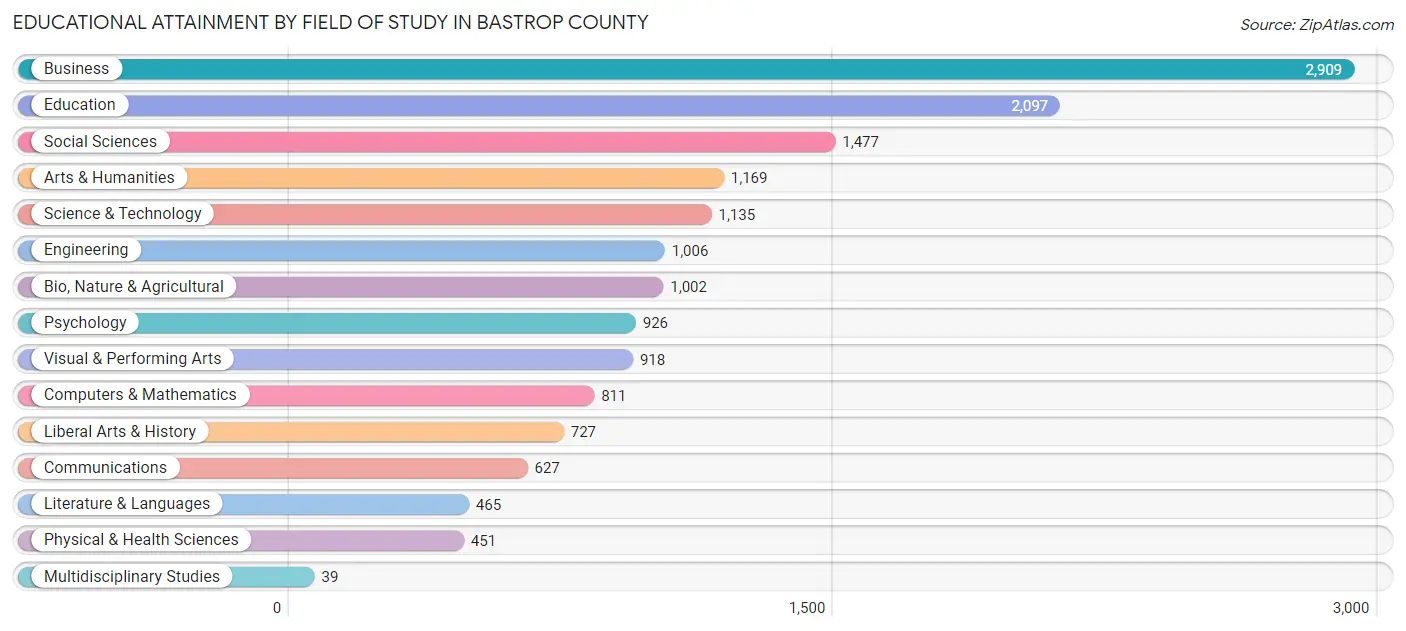
| Field of Study | # Graduates | % Graduates |
| Computers & Mathematics | 811 | 5.1% |
| Bio, Nature & Agricultural | 1,002 | 6.4% |
| Physical & Health Sciences | 451 | 2.9% |
| Psychology | 926 | 5.9% |
| Social Sciences | 1,477 | 9.4% |
| Engineering | 1,006 | 6.4% |
| Multidisciplinary Studies | 39 | 0.3% |
| Science & Technology | 1,135 | 7.2% |
| Business | 2,909 | 18.5% |
| Education | 2,097 | 13.3% |
| Literature & Languages | 465 | 2.9% |
| Liberal Arts & History | 727 | 4.6% |
| Visual & Performing Arts | 918 | 5.8% |
| Communications | 627 | 4.0% |
| Arts & Humanities | 1,169 | 7.4% |
| Total | 15,759 | 100.0% |
Transportation & Commute in Bastrop County
Vehicle Availability by Sex in Bastrop County
The most prevalent vehicle ownership categories in Bastrop County are males with 2 vehicles (8,724, accounting for 35.5%) and females with 2 vehicles (7,163, making up 43.7%).
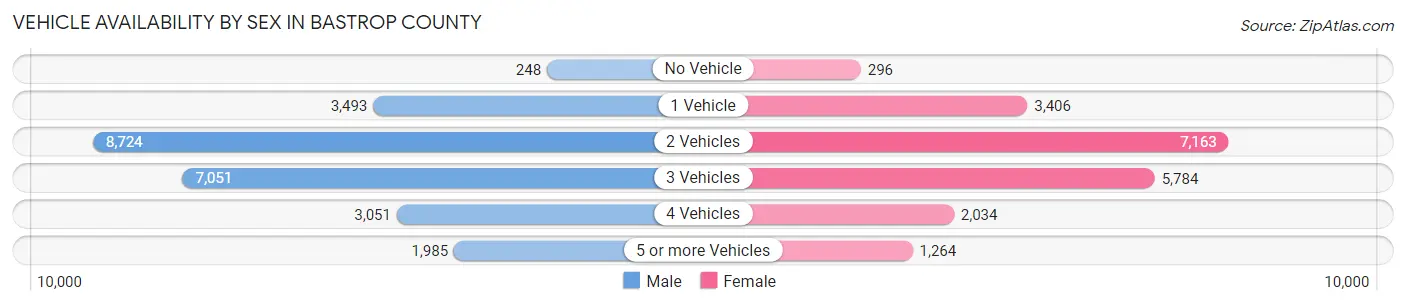
| Vehicles Available | Male | Female |
| No Vehicle | 248 (1.0%) | 296 (1.5%) |
| 1 Vehicle | 3,493 (14.2%) | 3,406 (17.1%) |
| 2 Vehicles | 8,724 (35.5%) | 7,163 (35.9%) |
| 3 Vehicles | 7,051 (28.7%) | 5,784 (29.0%) |
| 4 Vehicles | 3,051 (12.4%) | 2,034 (10.2%) |
| 5 or more Vehicles | 1,985 (8.1%) | 1,264 (6.3%) |
| Total | 24,552 (100.0%) | 19,947 (100.0%) |
Commute Time in Bastrop County
The most frequently occuring commute durations in Bastrop County are 45 to 59 minutes (6,975 commuters, 17.4%), 60 to 89 minutes (6,843 commuters, 17.0%), and 30 to 34 minutes (5,463 commuters, 13.6%).
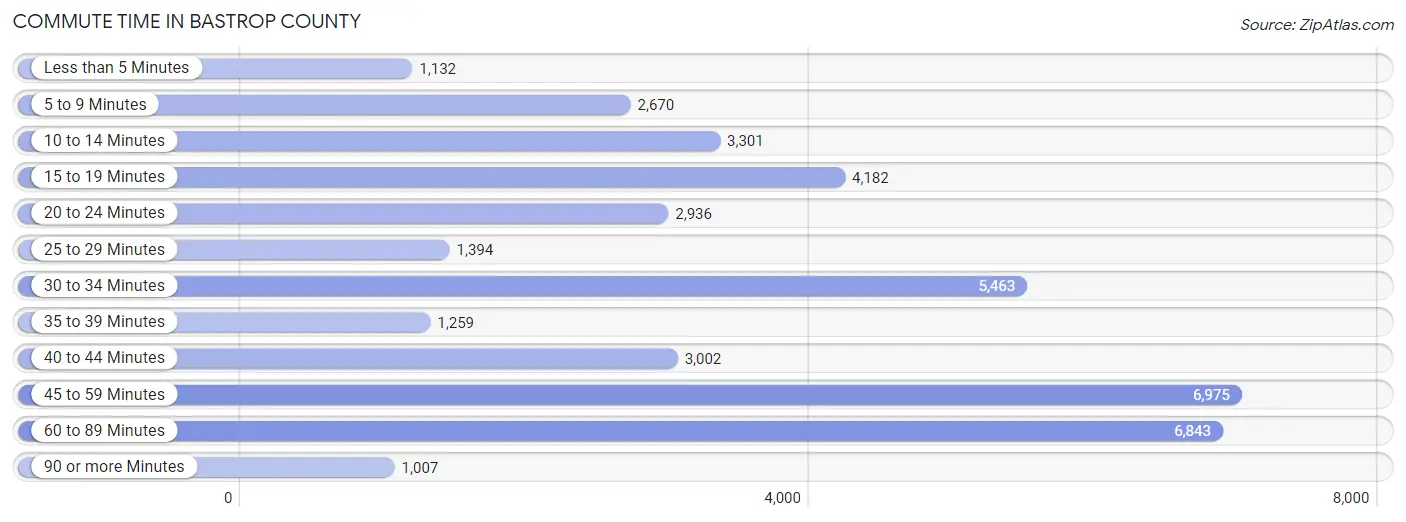
| Commute Time | # Commuters | % Commuters |
| Less than 5 Minutes | 1,132 | 2.8% |
| 5 to 9 Minutes | 2,670 | 6.7% |
| 10 to 14 Minutes | 3,301 | 8.2% |
| 15 to 19 Minutes | 4,182 | 10.4% |
| 20 to 24 Minutes | 2,936 | 7.3% |
| 25 to 29 Minutes | 1,394 | 3.5% |
| 30 to 34 Minutes | 5,463 | 13.6% |
| 35 to 39 Minutes | 1,259 | 3.1% |
| 40 to 44 Minutes | 3,002 | 7.5% |
| 45 to 59 Minutes | 6,975 | 17.4% |
| 60 to 89 Minutes | 6,843 | 17.0% |
| 90 or more Minutes | 1,007 | 2.5% |
Commute Time by Sex in Bastrop County
The most common commute times in Bastrop County are 60 to 89 minutes (5,111 commuters, 22.5%) for males and 45 to 59 minutes (2,782 commuters, 15.9%) for females.
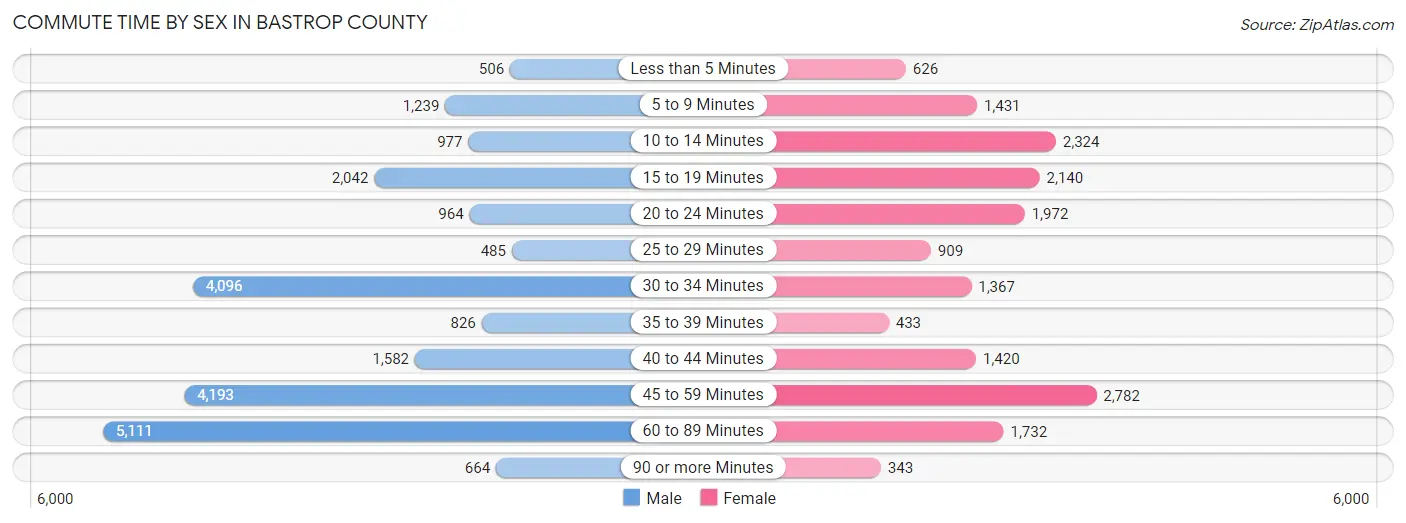
| Commute Time | Male | Female |
| Less than 5 Minutes | 506 (2.2%) | 626 (3.6%) |
| 5 to 9 Minutes | 1,239 (5.5%) | 1,431 (8.2%) |
| 10 to 14 Minutes | 977 (4.3%) | 2,324 (13.3%) |
| 15 to 19 Minutes | 2,042 (9.0%) | 2,140 (12.2%) |
| 20 to 24 Minutes | 964 (4.3%) | 1,972 (11.3%) |
| 25 to 29 Minutes | 485 (2.1%) | 909 (5.2%) |
| 30 to 34 Minutes | 4,096 (18.1%) | 1,367 (7.8%) |
| 35 to 39 Minutes | 826 (3.6%) | 433 (2.5%) |
| 40 to 44 Minutes | 1,582 (7.0%) | 1,420 (8.1%) |
| 45 to 59 Minutes | 4,193 (18.5%) | 2,782 (15.9%) |
| 60 to 89 Minutes | 5,111 (22.5%) | 1,732 (9.9%) |
| 90 or more Minutes | 664 (2.9%) | 343 (2.0%) |
Time of Departure to Work by Sex in Bastrop County
The most frequent times of departure to work in Bastrop County are 6:00 AM to 6:29 AM (3,420, 15.1%) for males and 7:00 AM to 7:29 AM (2,655, 15.2%) for females.
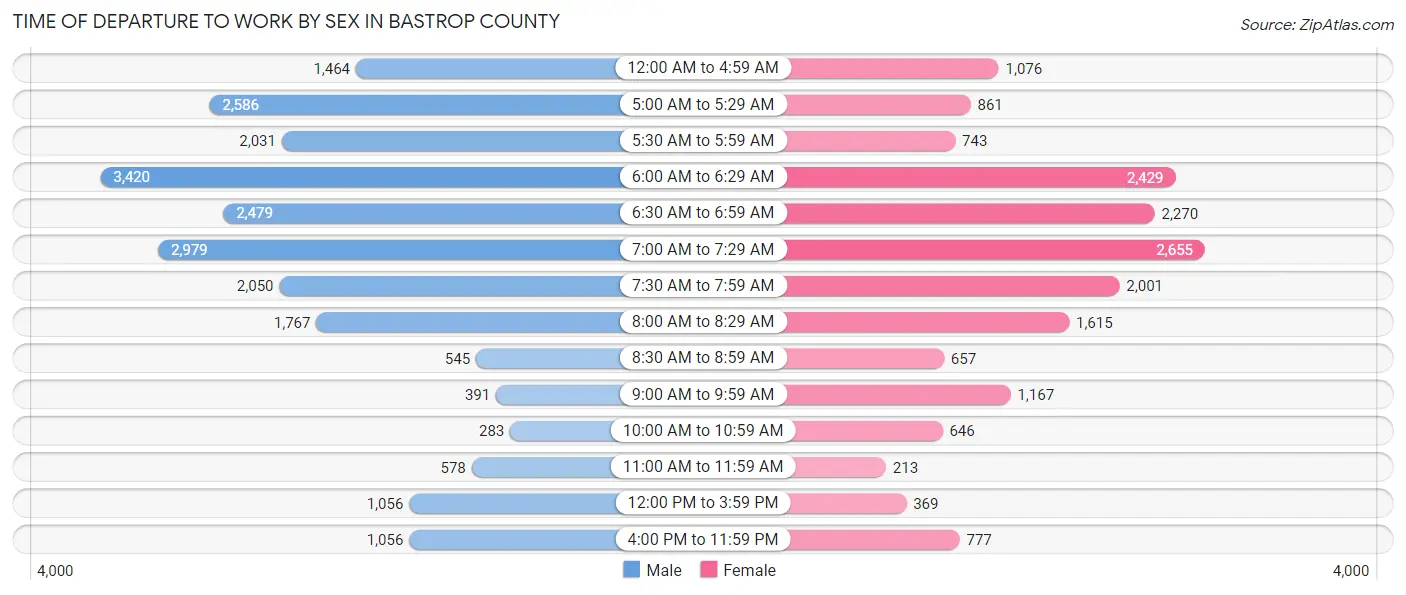
| Time of Departure | Male | Female |
| 12:00 AM to 4:59 AM | 1,464 (6.5%) | 1,076 (6.2%) |
| 5:00 AM to 5:29 AM | 2,586 (11.4%) | 861 (4.9%) |
| 5:30 AM to 5:59 AM | 2,031 (8.9%) | 743 (4.3%) |
| 6:00 AM to 6:29 AM | 3,420 (15.1%) | 2,429 (13.9%) |
| 6:30 AM to 6:59 AM | 2,479 (10.9%) | 2,270 (13.0%) |
| 7:00 AM to 7:29 AM | 2,979 (13.1%) | 2,655 (15.2%) |
| 7:30 AM to 7:59 AM | 2,050 (9.0%) | 2,001 (11.5%) |
| 8:00 AM to 8:29 AM | 1,767 (7.8%) | 1,615 (9.2%) |
| 8:30 AM to 8:59 AM | 545 (2.4%) | 657 (3.8%) |
| 9:00 AM to 9:59 AM | 391 (1.7%) | 1,167 (6.7%) |
| 10:00 AM to 10:59 AM | 283 (1.3%) | 646 (3.7%) |
| 11:00 AM to 11:59 AM | 578 (2.5%) | 213 (1.2%) |
| 12:00 PM to 3:59 PM | 1,056 (4.7%) | 369 (2.1%) |
| 4:00 PM to 11:59 PM | 1,056 (4.7%) | 777 (4.4%) |
| Total | 22,685 (100.0%) | 17,479 (100.0%) |
Housing Occupancy in Bastrop County
Occupancy by Ownership in Bastrop County
Of the total 33,259 dwellings in Bastrop County, owner-occupied units account for 25,884 (77.8%), while renter-occupied units make up 7,375 (22.2%).
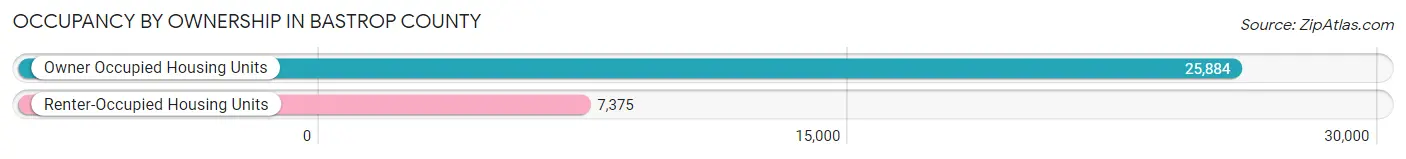
| Occupancy | # Housing Units | % Housing Units |
| Owner Occupied Housing Units | 25,884 | 77.8% |
| Renter-Occupied Housing Units | 7,375 | 22.2% |
| Total Occupied Housing Units | 33,259 | 100.0% |
Occupancy by Household Size in Bastrop County
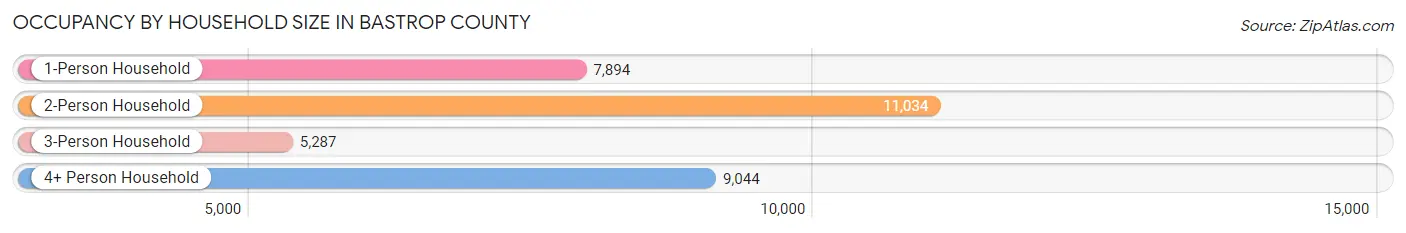
| Household Size | # Housing Units | % Housing Units |
| 1-Person Household | 7,894 | 23.7% |
| 2-Person Household | 11,034 | 33.2% |
| 3-Person Household | 5,287 | 15.9% |
| 4+ Person Household | 9,044 | 27.2% |
| Total Housing Units | 33,259 | 100.0% |
Occupancy by Ownership by Household Size in Bastrop County
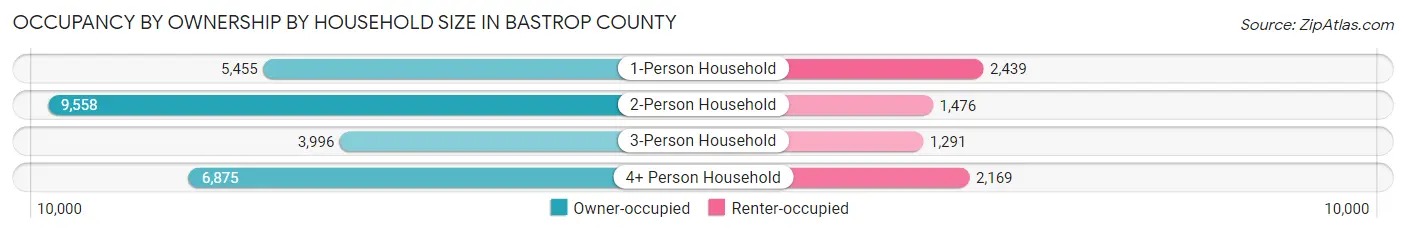
| Household Size | Owner-occupied | Renter-occupied |
| 1-Person Household | 5,455 (69.1%) | 2,439 (30.9%) |
| 2-Person Household | 9,558 (86.6%) | 1,476 (13.4%) |
| 3-Person Household | 3,996 (75.6%) | 1,291 (24.4%) |
| 4+ Person Household | 6,875 (76.0%) | 2,169 (24.0%) |
| Total Housing Units | 25,884 (77.8%) | 7,375 (22.2%) |
Occupancy by Educational Attainment in Bastrop County
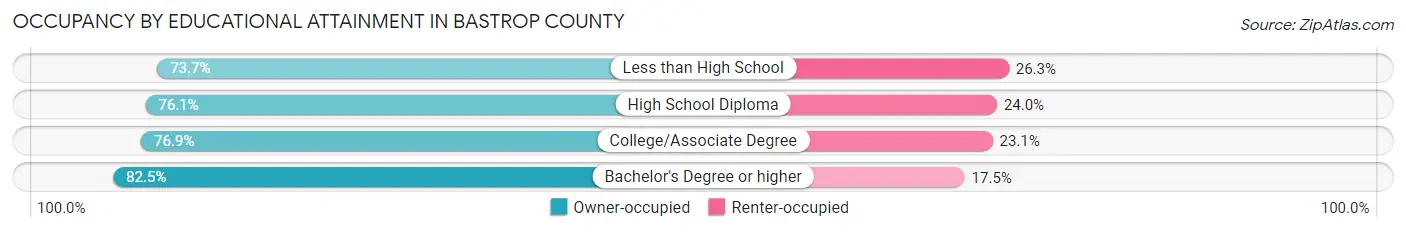
| Household Size | Owner-occupied | Renter-occupied |
| Less than High School | 3,372 (73.7%) | 1,203 (26.3%) |
| High School Diploma | 6,655 (76.0%) | 2,096 (23.9%) |
| College/Associate Degree | 8,037 (76.9%) | 2,413 (23.1%) |
| Bachelor's Degree or higher | 7,820 (82.5%) | 1,663 (17.5%) |
Occupancy by Age of Householder in Bastrop County
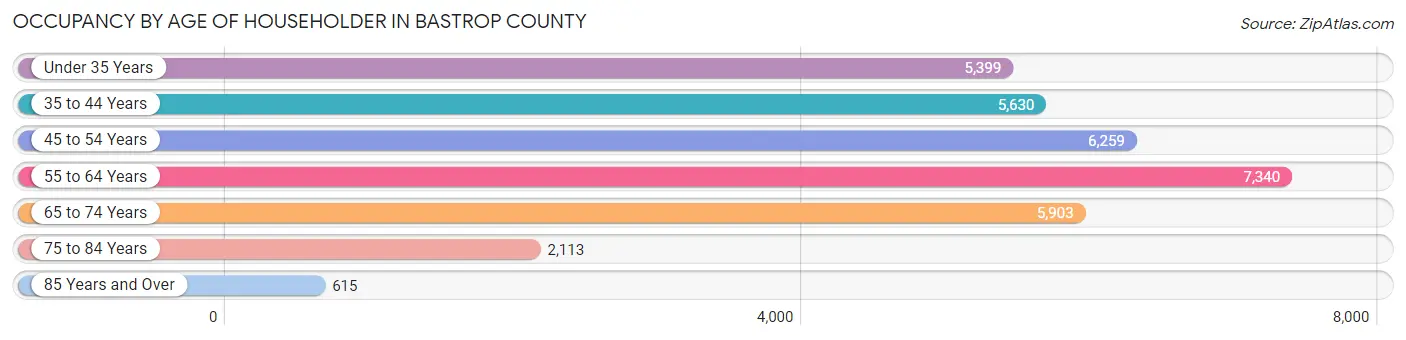
| Age Bracket | # Households | % Households |
| Under 35 Years | 5,399 | 16.2% |
| 35 to 44 Years | 5,630 | 16.9% |
| 45 to 54 Years | 6,259 | 18.8% |
| 55 to 64 Years | 7,340 | 22.1% |
| 65 to 74 Years | 5,903 | 17.7% |
| 75 to 84 Years | 2,113 | 6.4% |
| 85 Years and Over | 615 | 1.8% |
| Total | 33,259 | 100.0% |
Housing Finances in Bastrop County
Median Income by Occupancy in Bastrop County
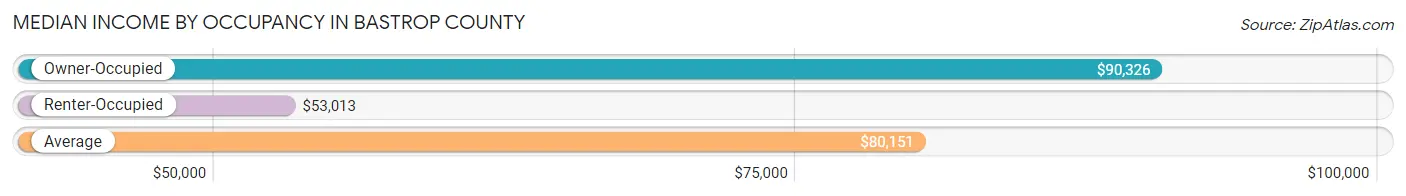
| Occupancy Type | # Households | Median Income |
| Owner-Occupied | 25,884 (77.8%) | $90,326 |
| Renter-Occupied | 7,375 (22.2%) | $53,013 |
| Average | 33,259 (100.0%) | $80,151 |
Occupancy by Householder Income Bracket in Bastrop County

| Income Bracket | Owner-occupied | Renter-occupied |
| Less than $5,000 | 509 (2.0%) | 253 (3.4%) |
| $5,000 to $9,999 | 331 (1.3%) | 369 (5.0%) |
| $10,000 to $14,999 | 700 (2.7%) | 500 (6.8%) |
| $15,000 to $19,999 | 782 (3.0%) | 134 (1.8%) |
| $20,000 to $24,999 | 757 (2.9%) | 428 (5.8%) |
| $25,000 to $34,999 | 1,649 (6.4%) | 603 (8.2%) |
| $35,000 to $49,999 | 2,616 (10.1%) | 1,040 (14.1%) |
| $50,000 to $74,999 | 3,922 (15.1%) | 1,372 (18.6%) |
| $75,000 to $99,999 | 3,348 (12.9%) | 837 (11.4%) |
| $100,000 to $149,999 | 5,603 (21.6%) | 1,228 (16.7%) |
| $150,000 or more | 5,667 (21.9%) | 611 (8.3%) |
| Total | 25,884 (100.0%) | 7,375 (100.0%) |
Monthly Housing Cost Tiers in Bastrop County
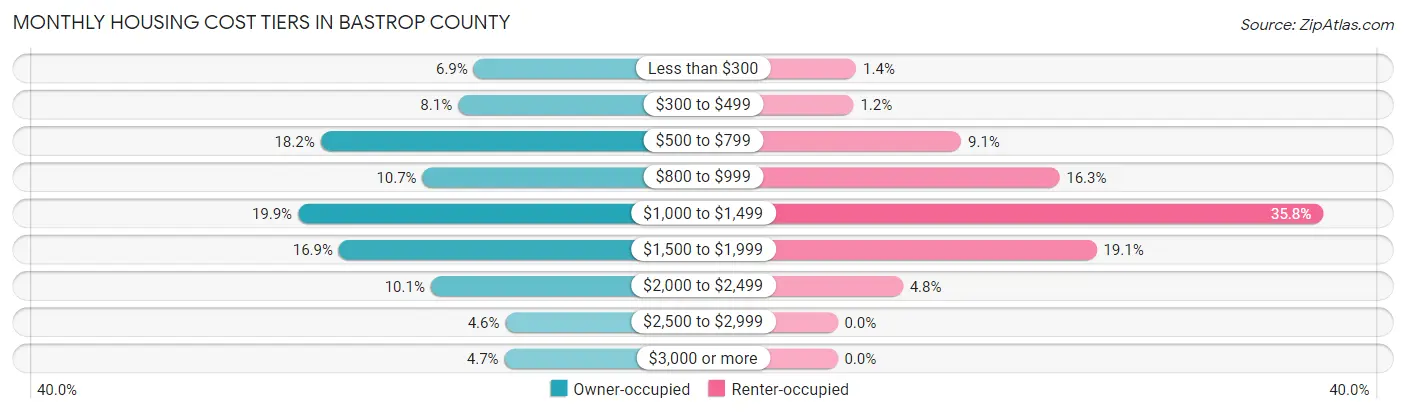
| Monthly Cost | Owner-occupied | Renter-occupied |
| Less than $300 | 1,794 (6.9%) | 102 (1.4%) |
| $300 to $499 | 2,092 (8.1%) | 87 (1.2%) |
| $500 to $799 | 4,713 (18.2%) | 672 (9.1%) |
| $800 to $999 | 2,770 (10.7%) | 1,205 (16.3%) |
| $1,000 to $1,499 | 5,142 (19.9%) | 2,637 (35.8%) |
| $1,500 to $1,999 | 4,364 (16.9%) | 1,407 (19.1%) |
| $2,000 to $2,499 | 2,611 (10.1%) | 355 (4.8%) |
| $2,500 to $2,999 | 1,191 (4.6%) | 0 (0.0%) |
| $3,000 or more | 1,207 (4.7%) | 0 (0.0%) |
| Total | 25,884 (100.0%) | 7,375 (100.0%) |
Physical Housing Characteristics in Bastrop County
Housing Structures in Bastrop County
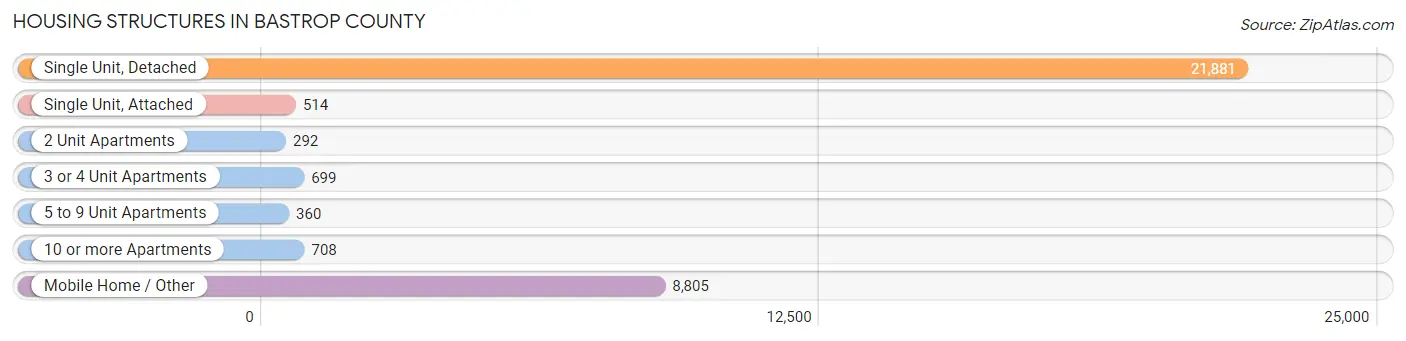
| Structure Type | # Housing Units | % Housing Units |
| Single Unit, Detached | 21,881 | 65.8% |
| Single Unit, Attached | 514 | 1.5% |
| 2 Unit Apartments | 292 | 0.9% |
| 3 or 4 Unit Apartments | 699 | 2.1% |
| 5 to 9 Unit Apartments | 360 | 1.1% |
| 10 or more Apartments | 708 | 2.1% |
| Mobile Home / Other | 8,805 | 26.5% |
| Total | 33,259 | 100.0% |
Housing Structures by Occupancy in Bastrop County
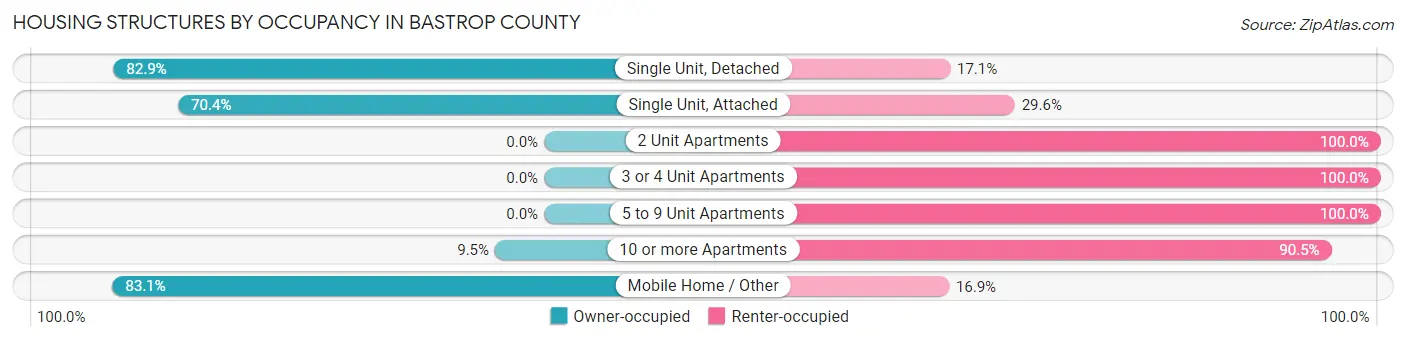
| Structure Type | Owner-occupied | Renter-occupied |
| Single Unit, Detached | 18,138 (82.9%) | 3,743 (17.1%) |
| Single Unit, Attached | 362 (70.4%) | 152 (29.6%) |
| 2 Unit Apartments | 0 (0.0%) | 292 (100.0%) |
| 3 or 4 Unit Apartments | 0 (0.0%) | 699 (100.0%) |
| 5 to 9 Unit Apartments | 0 (0.0%) | 360 (100.0%) |
| 10 or more Apartments | 67 (9.5%) | 641 (90.5%) |
| Mobile Home / Other | 7,317 (83.1%) | 1,488 (16.9%) |
| Total | 25,884 (77.8%) | 7,375 (22.2%) |
Housing Structures by Number of Rooms in Bastrop County
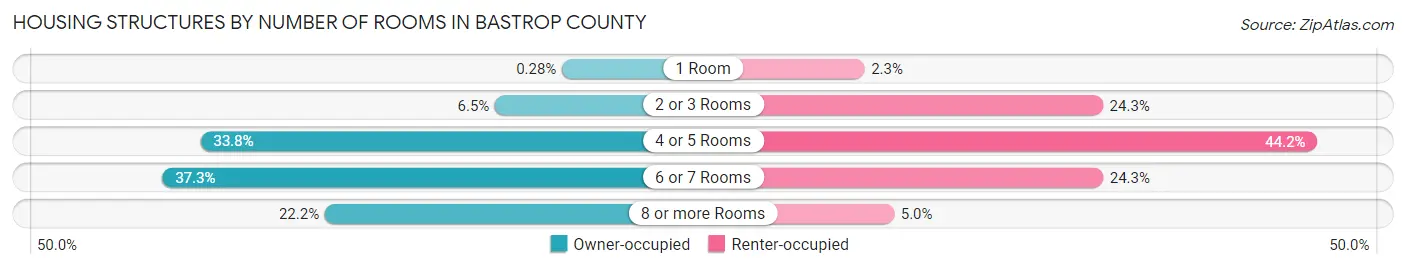
| Number of Rooms | Owner-occupied | Renter-occupied |
| 1 Room | 72 (0.3%) | 166 (2.2%) |
| 2 or 3 Rooms | 1,676 (6.5%) | 1,792 (24.3%) |
| 4 or 5 Rooms | 8,737 (33.8%) | 3,257 (44.2%) |
| 6 or 7 Rooms | 9,647 (37.3%) | 1,793 (24.3%) |
| 8 or more Rooms | 5,752 (22.2%) | 367 (5.0%) |
| Total | 25,884 (100.0%) | 7,375 (100.0%) |
Housing Structure by Heating Type in Bastrop County
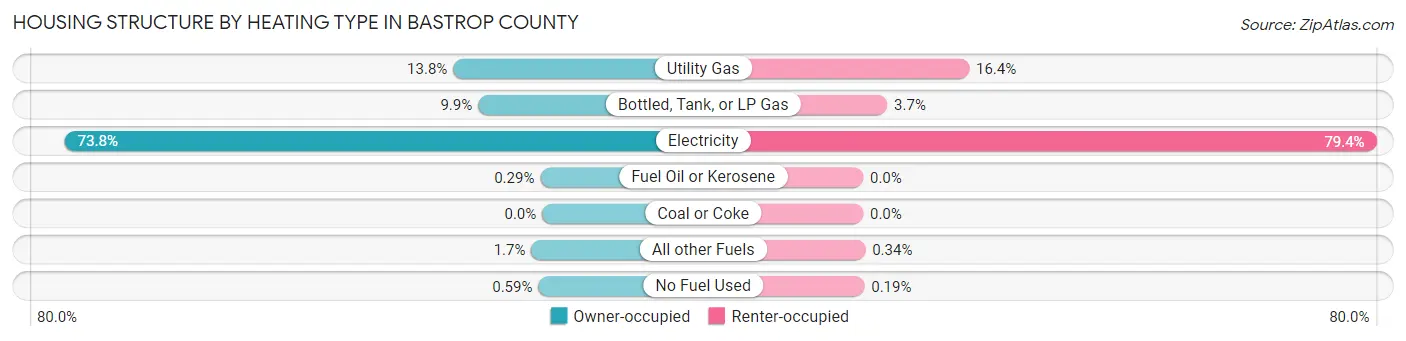
| Heating Type | Owner-occupied | Renter-occupied |
| Utility Gas | 3,560 (13.8%) | 1,208 (16.4%) |
| Bottled, Tank, or LP Gas | 2,562 (9.9%) | 275 (3.7%) |
| Electricity | 19,103 (73.8%) | 5,853 (79.4%) |
| Fuel Oil or Kerosene | 74 (0.3%) | 0 (0.0%) |
| Coal or Coke | 0 (0.0%) | 0 (0.0%) |
| All other Fuels | 433 (1.7%) | 25 (0.3%) |
| No Fuel Used | 152 (0.6%) | 14 (0.2%) |
| Total | 25,884 (100.0%) | 7,375 (100.0%) |
Household Vehicle Usage in Bastrop County
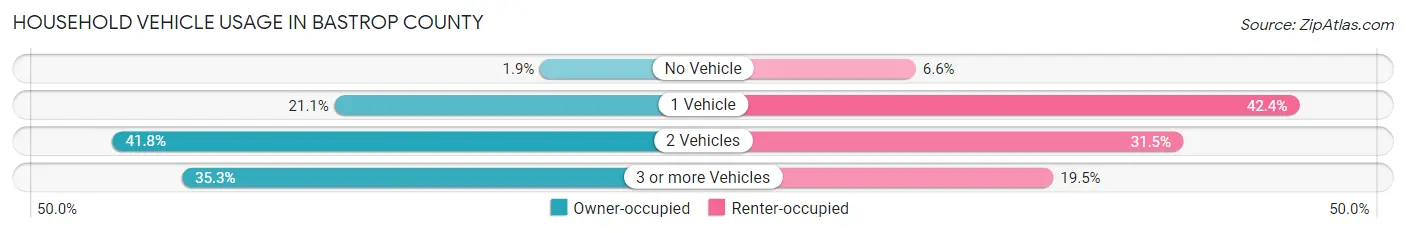
| Vehicles per Household | Owner-occupied | Renter-occupied |
| No Vehicle | 485 (1.9%) | 488 (6.6%) |
| 1 Vehicle | 5,450 (21.1%) | 3,126 (42.4%) |
| 2 Vehicles | 10,815 (41.8%) | 2,326 (31.5%) |
| 3 or more Vehicles | 9,134 (35.3%) | 1,435 (19.5%) |
| Total | 25,884 (100.0%) | 7,375 (100.0%) |
Real Estate & Mortgages in Bastrop County
Real Estate and Mortgage Overview in Bastrop County
| Characteristic | Without Mortgage | With Mortgage |
| Housing Units | 11,712 | 14,172 |
| Median Property Value | $213,000 | $257,100 |
| Median Household Income | $66,020 | $4,026 |
| Monthly Housing Costs | $634 | $1,207 |
| Real Estate Taxes | $3,017 | $720 |
Property Value by Mortgage Status in Bastrop County
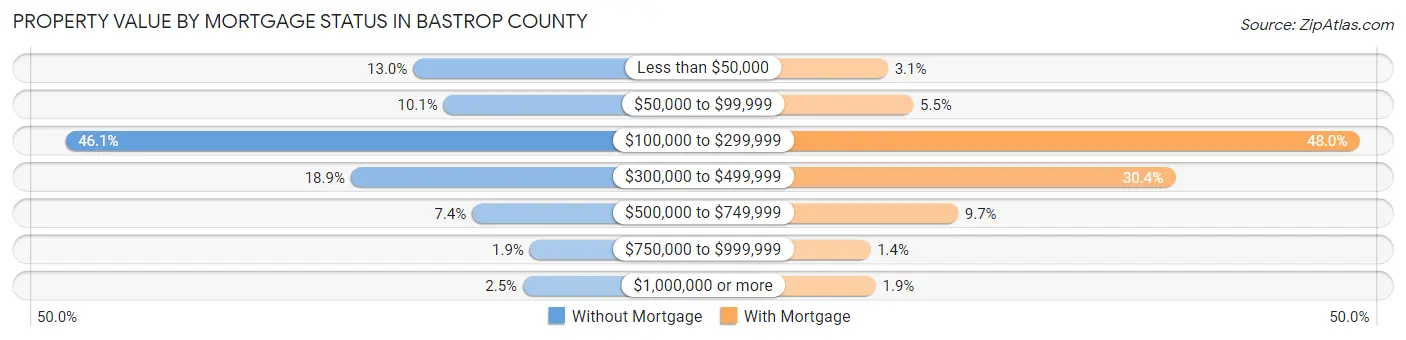
| Property Value | Without Mortgage | With Mortgage |
| Less than $50,000 | 1,523 (13.0%) | 434 (3.1%) |
| $50,000 to $99,999 | 1,183 (10.1%) | 776 (5.5%) |
| $100,000 to $299,999 | 5,403 (46.1%) | 6,800 (48.0%) |
| $300,000 to $499,999 | 2,218 (18.9%) | 4,312 (30.4%) |
| $500,000 to $749,999 | 865 (7.4%) | 1,381 (9.7%) |
| $750,000 to $999,999 | 222 (1.9%) | 198 (1.4%) |
| $1,000,000 or more | 298 (2.5%) | 271 (1.9%) |
| Total | 11,712 (100.0%) | 14,172 (100.0%) |
Household Income by Mortgage Status in Bastrop County
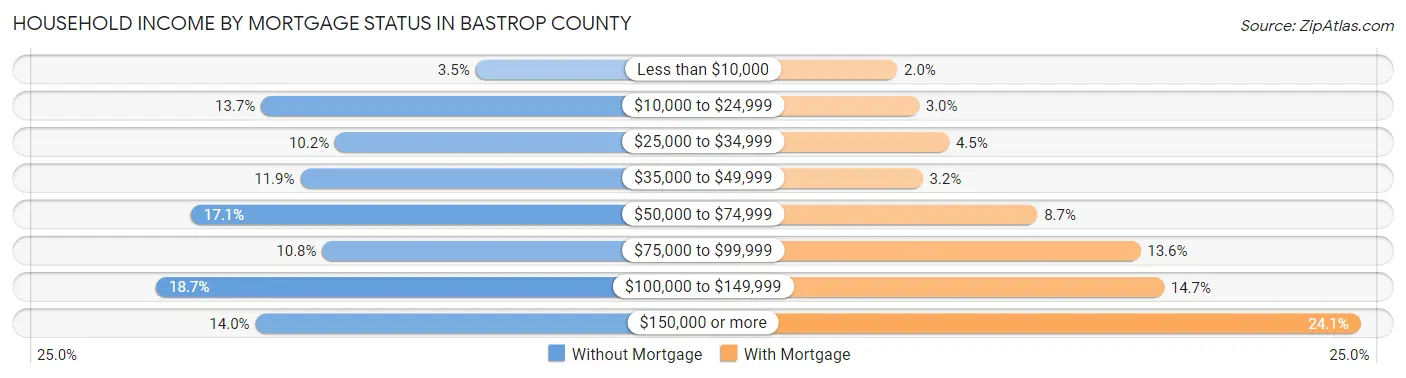
| Household Income | Without Mortgage | With Mortgage |
| Less than $10,000 | 413 (3.5%) | 281 (2.0%) |
| $10,000 to $24,999 | 1,609 (13.7%) | 427 (3.0%) |
| $25,000 to $34,999 | 1,197 (10.2%) | 630 (4.4%) |
| $35,000 to $49,999 | 1,390 (11.9%) | 452 (3.2%) |
| $50,000 to $74,999 | 2,000 (17.1%) | 1,226 (8.6%) |
| $75,000 to $99,999 | 1,267 (10.8%) | 1,922 (13.6%) |
| $100,000 to $149,999 | 2,195 (18.7%) | 2,081 (14.7%) |
| $150,000 or more | 1,641 (14.0%) | 3,408 (24.0%) |
| Total | 11,712 (100.0%) | 14,172 (100.0%) |
Property Value to Household Income Ratio in Bastrop County
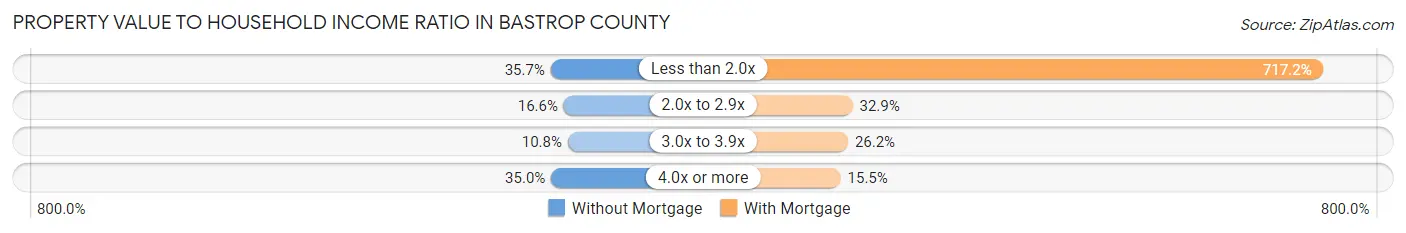
| Value-to-Income Ratio | Without Mortgage | With Mortgage |
| Less than 2.0x | 4,177 (35.7%) | 101,638 (717.2%) |
| 2.0x to 2.9x | 1,947 (16.6%) | 4,658 (32.9%) |
| 3.0x to 3.9x | 1,261 (10.8%) | 3,716 (26.2%) |
| 4.0x or more | 4,097 (35.0%) | 2,203 (15.5%) |
| Total | 11,712 (100.0%) | 14,172 (100.0%) |
Real Estate Taxes by Mortgage Status in Bastrop County
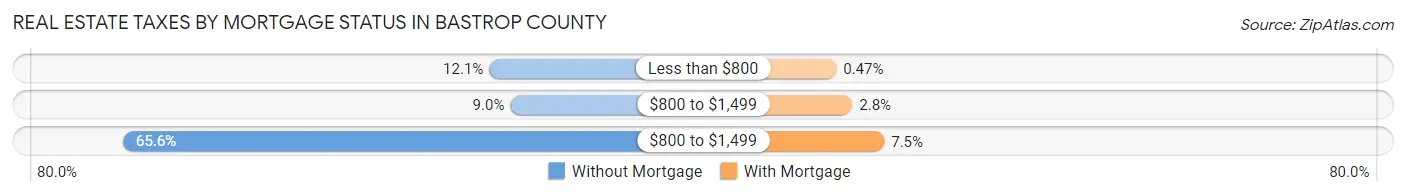
| Property Taxes | Without Mortgage | With Mortgage |
| Less than $800 | 1,420 (12.1%) | 67 (0.5%) |
| $800 to $1,499 | 1,059 (9.0%) | 400 (2.8%) |
| $800 to $1,499 | 7,687 (65.6%) | 1,061 (7.5%) |
| Total | 11,712 (100.0%) | 14,172 (100.0%) |
Health & Disability in Bastrop County
Health Insurance Coverage by Age in Bastrop County
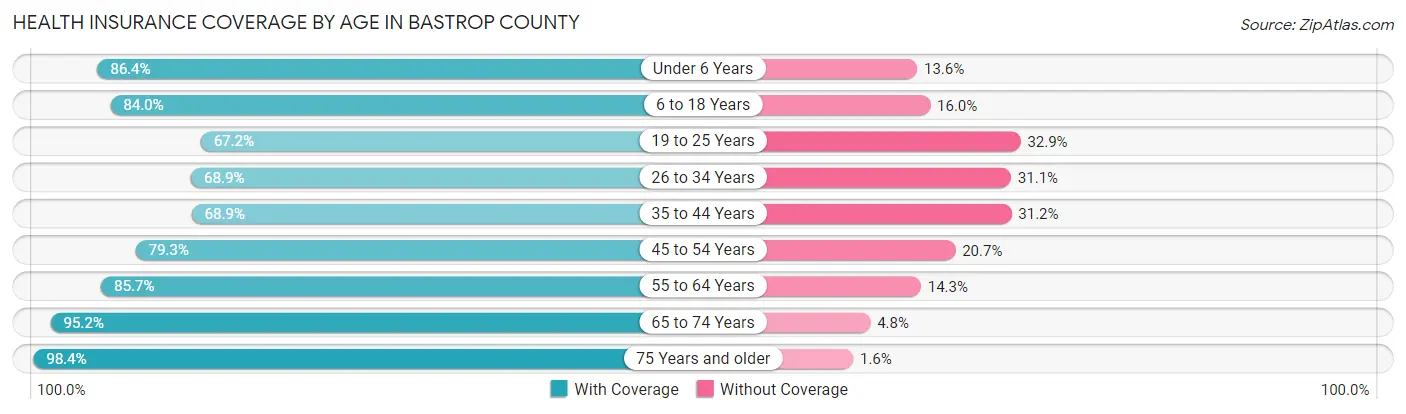
| Age Bracket | With Coverage | Without Coverage |
| Under 6 Years | 6,630 (86.4%) | 1,040 (13.6%) |
| 6 to 18 Years | 15,576 (84.0%) | 2,966 (16.0%) |
| 19 to 25 Years | 5,522 (67.1%) | 2,701 (32.9%) |
| 26 to 34 Years | 7,104 (68.9%) | 3,202 (31.1%) |
| 35 to 44 Years | 7,930 (68.9%) | 3,588 (31.1%) |
| 45 to 54 Years | 9,589 (79.3%) | 2,502 (20.7%) |
| 55 to 64 Years | 11,309 (85.7%) | 1,883 (14.3%) |
| 65 to 74 Years | 9,363 (95.2%) | 475 (4.8%) |
| 75 Years and older | 4,656 (98.4%) | 77 (1.6%) |
| Total | 77,679 (80.8%) | 18,434 (19.2%) |
Health Insurance Coverage by Citizenship Status in Bastrop County
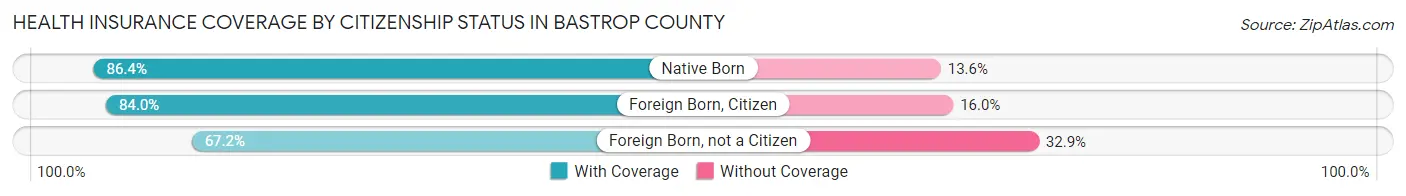
| Citizenship Status | With Coverage | Without Coverage |
| Native Born | 6,630 (86.4%) | 1,040 (13.6%) |
| Foreign Born, Citizen | 15,576 (84.0%) | 2,966 (16.0%) |
| Foreign Born, not a Citizen | 5,522 (67.1%) | 2,701 (32.9%) |
Health Insurance Coverage by Household Income in Bastrop County
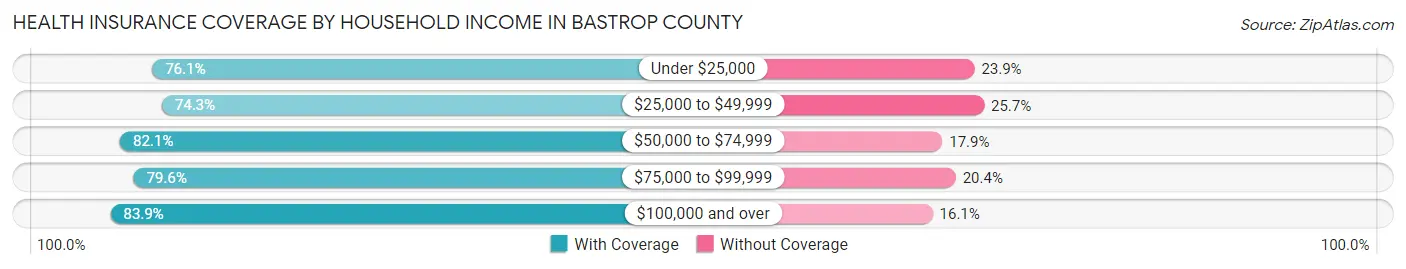
| Household Income | With Coverage | Without Coverage |
| Under $25,000 | 7,072 (76.1%) | 2,224 (23.9%) |
| $25,000 to $49,999 | 10,593 (74.3%) | 3,668 (25.7%) |
| $50,000 to $74,999 | 12,251 (82.1%) | 2,670 (17.9%) |
| $75,000 to $99,999 | 11,268 (79.6%) | 2,890 (20.4%) |
| $100,000 and over | 36,373 (83.9%) | 6,971 (16.1%) |
Public vs Private Health Insurance Coverage by Age in Bastrop County
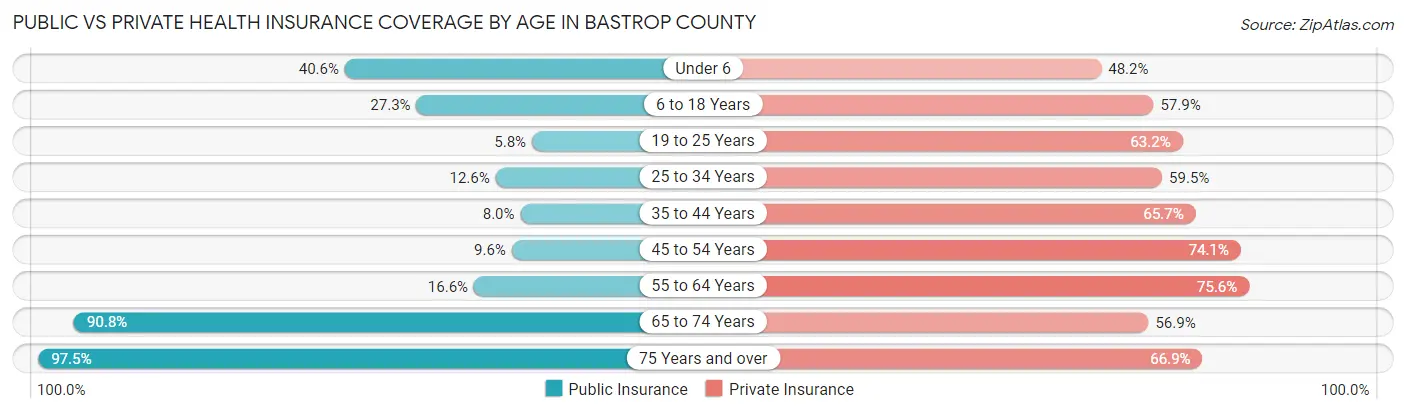
| Age Bracket | Public Insurance | Private Insurance |
| Under 6 | 3,111 (40.6%) | 3,694 (48.2%) |
| 6 to 18 Years | 5,057 (27.3%) | 10,726 (57.9%) |
| 19 to 25 Years | 479 (5.8%) | 5,199 (63.2%) |
| 25 to 34 Years | 1,297 (12.6%) | 6,128 (59.5%) |
| 35 to 44 Years | 919 (8.0%) | 7,561 (65.6%) |
| 45 to 54 Years | 1,159 (9.6%) | 8,954 (74.1%) |
| 55 to 64 Years | 2,190 (16.6%) | 9,973 (75.6%) |
| 65 to 74 Years | 8,937 (90.8%) | 5,601 (56.9%) |
| 75 Years and over | 4,613 (97.5%) | 3,168 (66.9%) |
| Total | 27,762 (28.9%) | 61,004 (63.5%) |
Disability Status by Sex by Age in Bastrop County
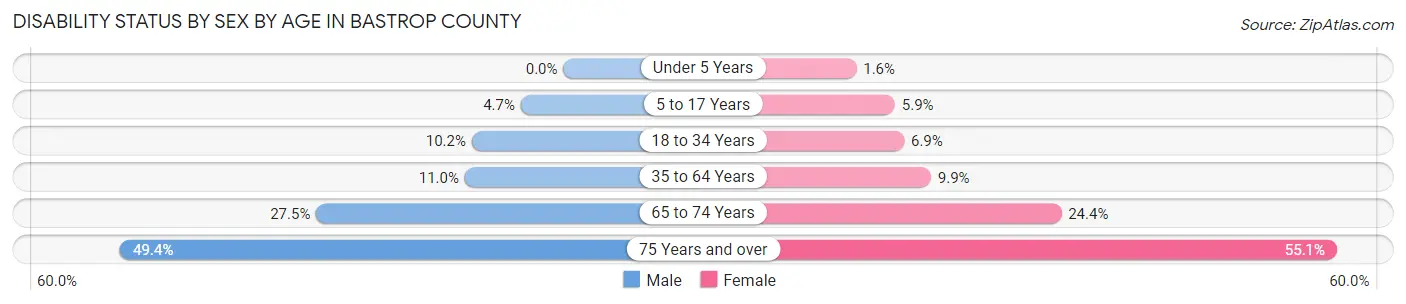
| Age Bracket | Male | Female |
| Under 5 Years | 0 (0.0%) | 52 (1.6%) |
| 5 to 17 Years | 440 (4.7%) | 560 (5.9%) |
| 18 to 34 Years | 1,023 (10.2%) | 663 (6.9%) |
| 35 to 64 Years | 2,045 (11.0%) | 1,803 (9.9%) |
| 65 to 74 Years | 1,326 (27.5%) | 1,227 (24.4%) |
| 75 Years and over | 1,066 (49.4%) | 1,419 (55.1%) |
Disability Class by Sex by Age in Bastrop County
Disability Class: Hearing Difficulty
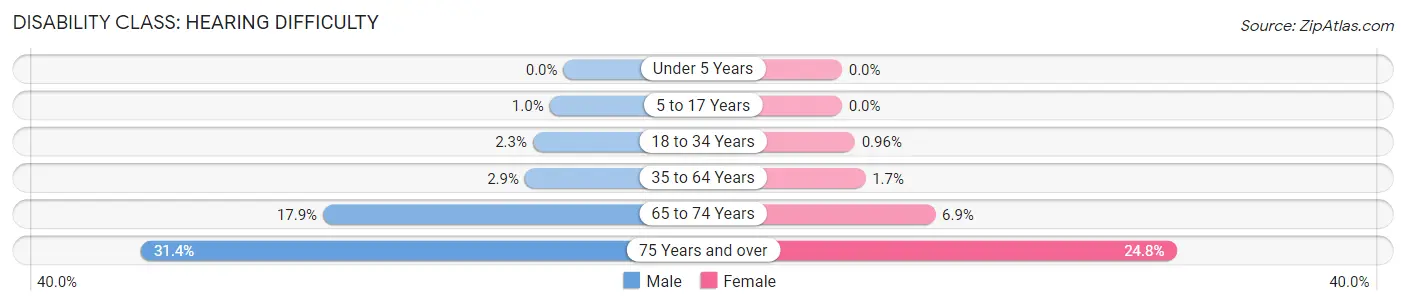
| Age Bracket | Male | Female |
| Under 5 Years | 0 (0.0%) | 0 (0.0%) |
| 5 to 17 Years | 96 (1.0%) | 0 (0.0%) |
| 18 to 34 Years | 228 (2.3%) | 92 (1.0%) |
| 35 to 64 Years | 532 (2.9%) | 316 (1.7%) |
| 65 to 74 Years | 860 (17.8%) | 348 (6.9%) |
| 75 Years and over | 677 (31.4%) | 639 (24.8%) |
Disability Class: Vision Difficulty
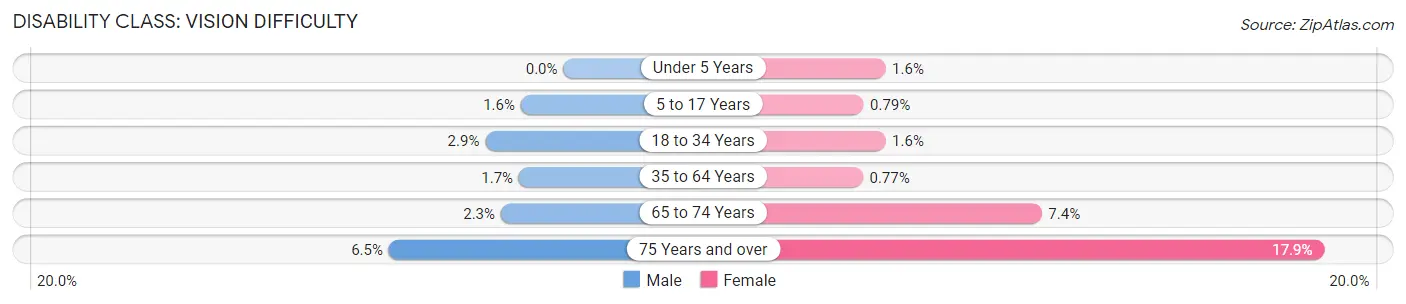
| Age Bracket | Male | Female |
| Under 5 Years | 0 (0.0%) | 52 (1.6%) |
| 5 to 17 Years | 147 (1.6%) | 75 (0.8%) |
| 18 to 34 Years | 291 (2.9%) | 154 (1.6%) |
| 35 to 64 Years | 308 (1.7%) | 140 (0.8%) |
| 65 to 74 Years | 112 (2.3%) | 372 (7.4%) |
| 75 Years and over | 140 (6.5%) | 461 (17.9%) |
Disability Class: Cognitive Difficulty
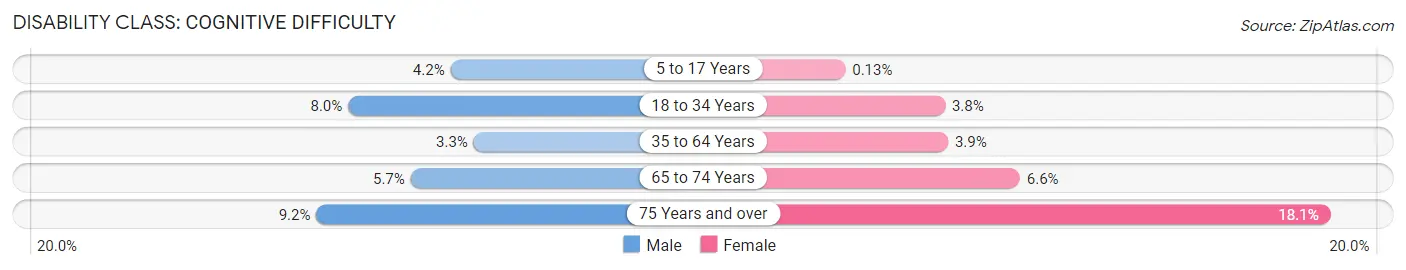
| Age Bracket | Male | Female |
| 5 to 17 Years | 389 (4.2%) | 12 (0.1%) |
| 18 to 34 Years | 802 (8.0%) | 367 (3.8%) |
| 35 to 64 Years | 620 (3.3%) | 716 (3.9%) |
| 65 to 74 Years | 273 (5.7%) | 332 (6.6%) |
| 75 Years and over | 198 (9.2%) | 467 (18.1%) |
Disability Class: Ambulatory Difficulty
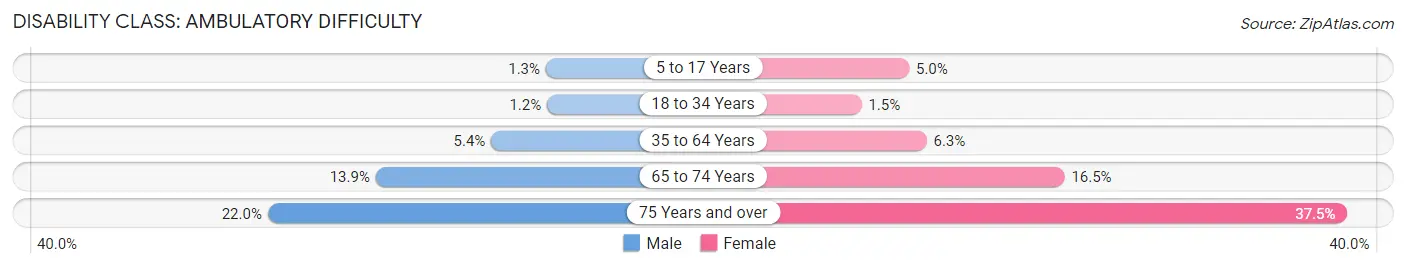
| Age Bracket | Male | Female |
| 5 to 17 Years | 121 (1.3%) | 473 (5.0%) |
| 18 to 34 Years | 121 (1.2%) | 140 (1.5%) |
| 35 to 64 Years | 999 (5.4%) | 1,143 (6.3%) |
| 65 to 74 Years | 671 (13.9%) | 830 (16.5%) |
| 75 Years and over | 474 (22.0%) | 966 (37.5%) |
Disability Class: Self-Care Difficulty
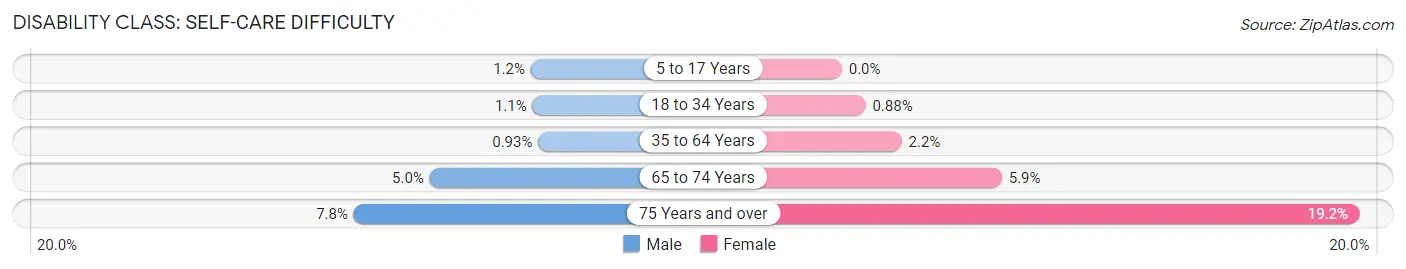
| Age Bracket | Male | Female |
| 5 to 17 Years | 112 (1.2%) | 0 (0.0%) |
| 18 to 34 Years | 114 (1.1%) | 84 (0.9%) |
| 35 to 64 Years | 173 (0.9%) | 403 (2.2%) |
| 65 to 74 Years | 239 (5.0%) | 298 (5.9%) |
| 75 Years and over | 168 (7.8%) | 495 (19.2%) |
Technology Access in Bastrop County
Computing Device Access in Bastrop County
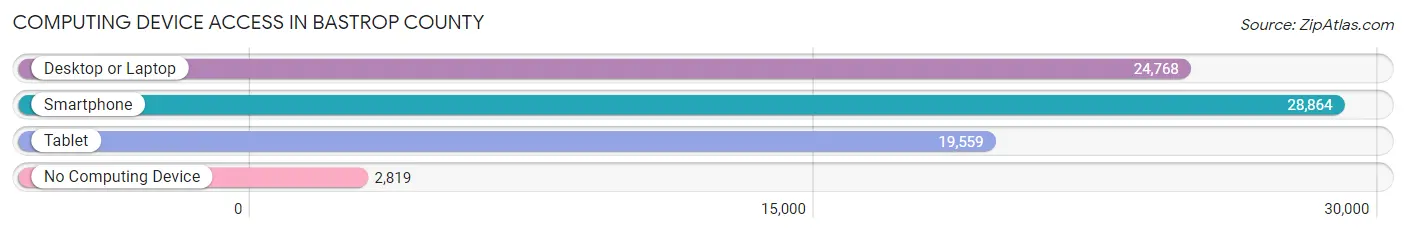
| Device Type | # Households | % Households |
| Desktop or Laptop | 24,768 | 74.5% |
| Smartphone | 28,864 | 86.8% |
| Tablet | 19,559 | 58.8% |
| No Computing Device | 2,819 | 8.5% |
| Total | 33,259 | 100.0% |
Internet Access in Bastrop County
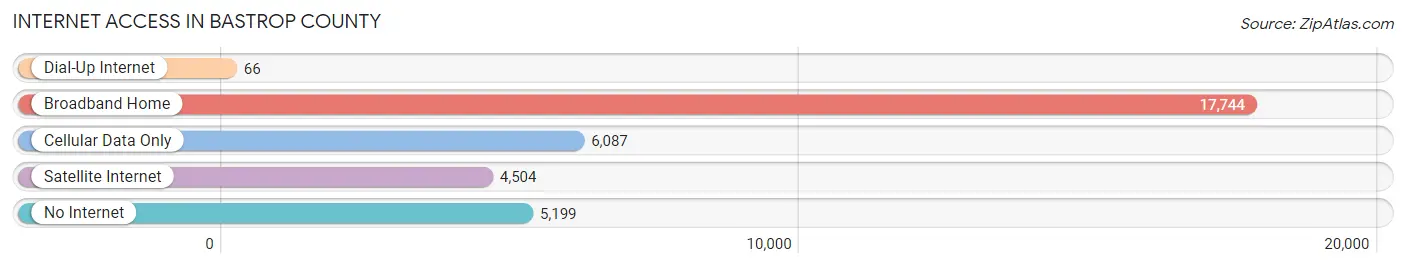
| Internet Type | # Households | % Households |
| Dial-Up Internet | 66 | 0.2% |
| Broadband Home | 17,744 | 53.3% |
| Cellular Data Only | 6,087 | 18.3% |
| Satellite Internet | 4,504 | 13.5% |
| No Internet | 5,199 | 15.6% |
| Total | 33,259 | 100.0% |
Bastrop County Summary
Bastrop County is located in the central part of Texas, about 30 miles southeast of Austin. It is bordered by Lee, Fayette, Caldwell, Travis, and Williamson counties. The county seat is Bastrop, and the county has a population of 81,719 as of the 2020 census.
History
Bastrop County was established in 1834 and named after Felipe Enrique Neri, Baron de Bastrop, a Dutch-born empresario who helped Stephen F. Austin settle the area. The county was originally part of the Mexican state of Coahuila y Tejas, and was part of the Republic of Texas after it declared independence in 1836.
During the Civil War, Bastrop County was a major site of the Battle of Bastrop, which was fought between Confederate and Union forces in 1862. The county was also the site of the infamous Camp Groce, a Confederate prisoner-of-war camp.
Geography
Bastrop County covers an area of 896 square miles, making it the 25th largest county in Texas. The terrain is mostly flat, with some rolling hills in the western part of the county. The Colorado River runs through the county, and there are several small lakes and reservoirs. The climate is humid subtropical, with hot summers and mild winters.
Economy
The economy of Bastrop County is largely based on agriculture, with cotton, corn, and hay being the main crops. The county is also home to several manufacturing companies, including Dell Computers, which has a large manufacturing facility in the city of Round Rock. Tourism is also an important part of the economy, with Bastrop State Park and the Lost Pines Forest being popular attractions.
Demographics
As of the 2020 census, the population of Bastrop County was 81,719, with a population density of 91 people per square mile. The racial makeup of the county was 79.2% White, 11.3% Hispanic or Latino, 6.2% Black or African American, 1.3% Asian, and 2.0% other. The median household income was $60,945, and the median home value was $213,400.
Conclusion
Bastrop County is a vibrant and diverse county in central Texas. It has a rich history, beautiful geography, and a strong economy. The county is home to a variety of industries, from agriculture to manufacturing, and is a popular tourist destination. The population is diverse, with a mix of races and ethnicities, and a median household income that is higher than the state average.
Common Questions
What is Per Capita Income in Bastrop County?
Per Capita income in Bastrop County is $34,079.
What is the Median Family Income in Bastrop County?
Median Family Income in Bastrop County is $92,732.
What is the Median Household income in Bastrop County?
Median Household Income in Bastrop County is $80,151.
What is Income or Wage Gap in Bastrop County?
Income or Wage Gap in Bastrop County is 23.4%.
Women in Bastrop County earn 76.6 cents for every dollar earned by a man.
What is Family Income Deficit in Bastrop County?
Family Income Deficit in Bastrop County is $11,160.
Families that are below poverty line in Bastrop County earn $11,160 less on average than the poverty threshold level.
What is Inequality or Gini Index in Bastrop County?
Inequality or Gini Index in Bastrop County is 0.42.
What is the Total Population of Bastrop County?
Total Population of Bastrop County is 98,435.
What is the Total Male Population of Bastrop County?
Total Male Population of Bastrop County is 49,988.
What is the Total Female Population of Bastrop County?
Total Female Population of Bastrop County is 48,447.
What is the Ratio of Males per 100 Females in Bastrop County?
There are 103.18 Males per 100 Females in Bastrop County.
What is the Ratio of Females per 100 Males in Bastrop County?
There are 96.92 Females per 100 Males in Bastrop County.
What is the Median Population Age in Bastrop County?
Median Population Age in Bastrop County is 38.0 Years.
What is the Average Family Size in Bastrop County
Average Family Size in Bastrop County is 3.4 People.
What is the Average Household Size in Bastrop County
Average Household Size in Bastrop County is 2.9 People.
How Large is the Labor Force in Bastrop County?
There are 47,570 People in the Labor Forcein in Bastrop County.
What is the Percentage of People in the Labor Force in Bastrop County?
62.6% of People are in the Labor Force in Bastrop County.
What is the Unemployment Rate in Bastrop County?
Unemployment Rate in Bastrop County is 4.4%.