Andrews County, TX Map & Demographics
Andrews County Map
Andrews County Overview
$39,749
PER CAPITA INCOME
$93,796
AVG FAMILY INCOME
$86,458
AVG HOUSEHOLD INCOME
38.2%
WAGE / INCOME GAP [ % ]
61.8¢/ $1
WAGE / INCOME GAP [ $ ]
$13,369
FAMILY INCOME DEFICIT
0.46
INEQUALITY / GINI INDEX
18,362
TOTAL POPULATION
9,274
MALE POPULATION
9,088
FEMALE POPULATION
102.05
MALES / 100 FEMALES
97.99
FEMALES / 100 MALES
32.4
MEDIAN AGE
3.1
AVG FAMILY SIZE
2.8
AVG HOUSEHOLD SIZE
9,517
LABOR FORCE [ PEOPLE ]
71.2%
PERCENT IN LABOR FORCE
2.7%
UNEMPLOYMENT RATE
Andrews County Area Codes
Income in Andrews County
Income Overview in Andrews County
Per Capita Income in Andrews County is $39,749, while median incomes of families and households are $93,796 and $86,458 respectively.
| Characteristic | Number | Measure |
| Per Capita Income | 18,362 | $39,749 |
| Median Family Income | 5,149 | $93,796 |
| Mean Family Income | 5,149 | $116,381 |
| Median Household Income | 6,603 | $86,458 |
| Mean Household Income | 6,603 | $112,085 |
| Income Deficit | 5,149 | $13,369 |
| Wage / Income Gap (%) | 18,362 | 38.16% |
| Wage / Income Gap ($) | 18,362 | 61.84¢ per $1 |
| Gini / Inequality Index | 18,362 | 0.46 |
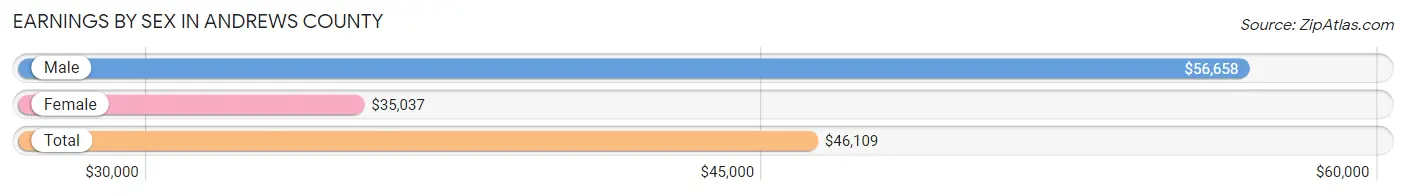
Earnings by Sex in Andrews County
Average Earnings in Andrews County are $46,109, $56,658 for men and $35,037 for women, a difference of 38.2%.
| Sex | Number | Average Earnings |
| Male | 5,684 (56.6%) | $56,658 |
| Female | 4,360 (43.4%) | $35,037 |
| Total | 10,044 (100.0%) | $46,109 |
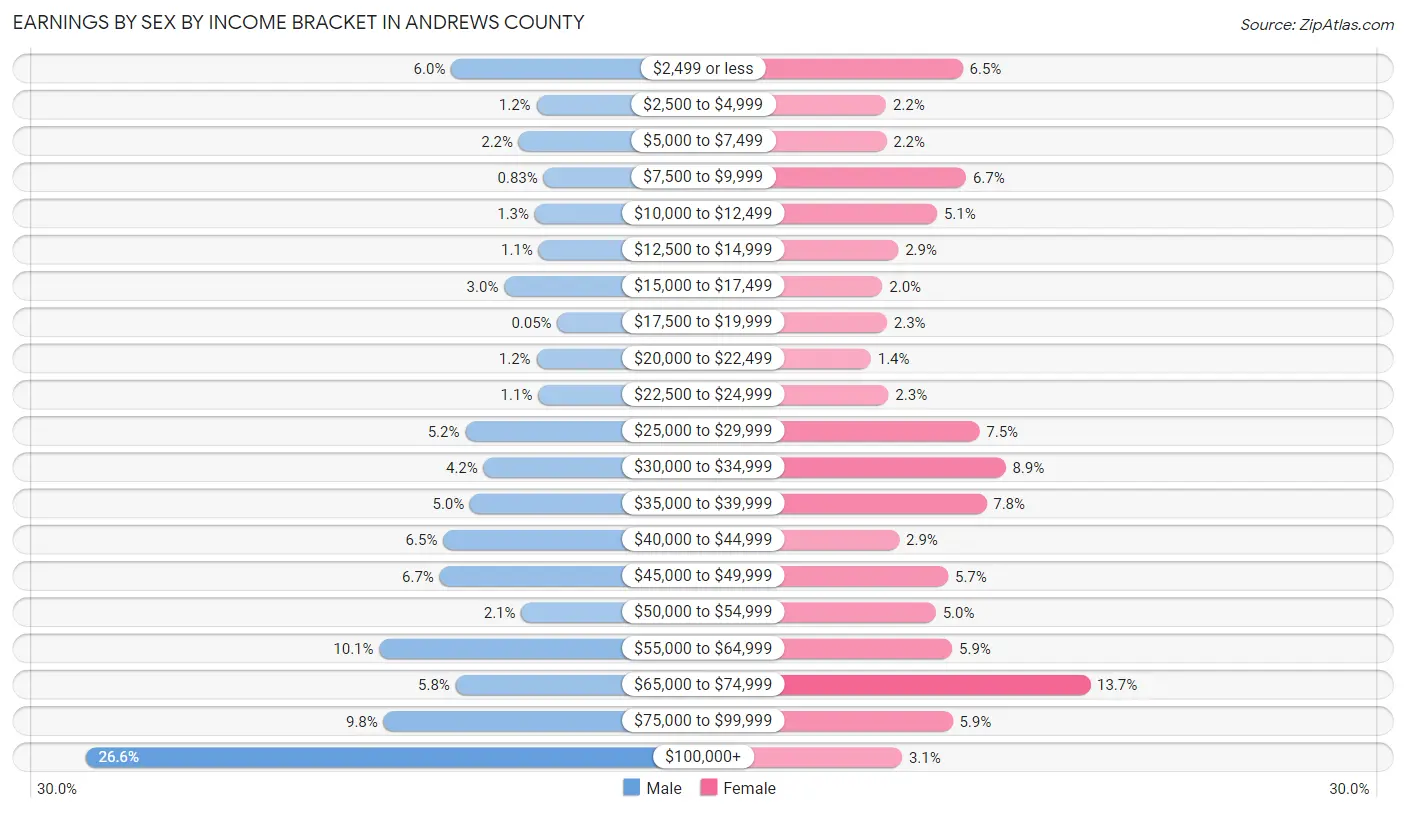
Earnings by Sex by Income Bracket in Andrews County
The most common earnings brackets in Andrews County are $100,000+ for men (1,510 | 26.6%) and $65,000 to $74,999 for women (596 | 13.7%).
| Income | Male | Female |
| $2,499 or less | 342 (6.0%) | 284 (6.5%) |
| $2,500 to $4,999 | 70 (1.2%) | 96 (2.2%) |
| $5,000 to $7,499 | 126 (2.2%) | 97 (2.2%) |
| $7,500 to $9,999 | 47 (0.8%) | 292 (6.7%) |
| $10,000 to $12,499 | 75 (1.3%) | 221 (5.1%) |
| $12,500 to $14,999 | 63 (1.1%) | 126 (2.9%) |
| $15,000 to $17,499 | 173 (3.0%) | 87 (2.0%) |
| $17,500 to $19,999 | 3 (0.1%) | 98 (2.2%) |
| $20,000 to $22,499 | 70 (1.2%) | 59 (1.3%) |
| $22,500 to $24,999 | 64 (1.1%) | 102 (2.3%) |
| $25,000 to $29,999 | 297 (5.2%) | 325 (7.4%) |
| $30,000 to $34,999 | 239 (4.2%) | 389 (8.9%) |
| $35,000 to $39,999 | 282 (5.0%) | 342 (7.8%) |
| $40,000 to $44,999 | 368 (6.5%) | 128 (2.9%) |
| $45,000 to $49,999 | 379 (6.7%) | 248 (5.7%) |
| $50,000 to $54,999 | 118 (2.1%) | 218 (5.0%) |
| $55,000 to $64,999 | 572 (10.1%) | 258 (5.9%) |
| $65,000 to $74,999 | 328 (5.8%) | 596 (13.7%) |
| $75,000 to $99,999 | 558 (9.8%) | 259 (5.9%) |
| $100,000+ | 1,510 (26.6%) | 135 (3.1%) |
| Total | 5,684 (100.0%) | 4,360 (100.0%) |
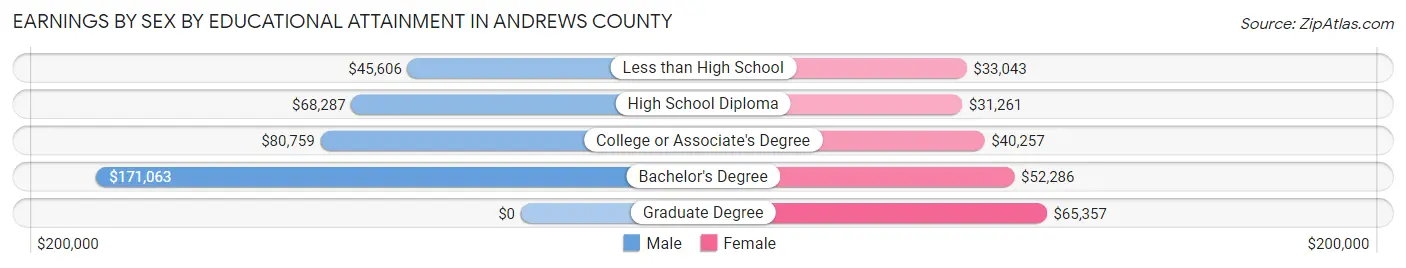
Earnings by Sex by Educational Attainment in Andrews County
Average earnings in Andrews County are $62,867 for men and $40,370 for women, a difference of 35.8%. Men with an educational attainment of bachelor's degree enjoy the highest average annual earnings of $171,063, while those with less than high school education earn the least with $45,606. Women with an educational attainment of graduate degree earn the most with the average annual earnings of $65,357, while those with high school diploma education have the smallest earnings of $31,261.
| Educational Attainment | Male Income | Female Income |
| Less than High School | $45,606 | $33,043 |
| High School Diploma | $68,287 | $31,261 |
| College or Associate's Degree | $80,759 | $40,257 |
| Bachelor's Degree | $171,063 | $52,286 |
| Graduate Degree | - | - |
| Total | $62,867 | $40,370 |
Family Income in Andrews County
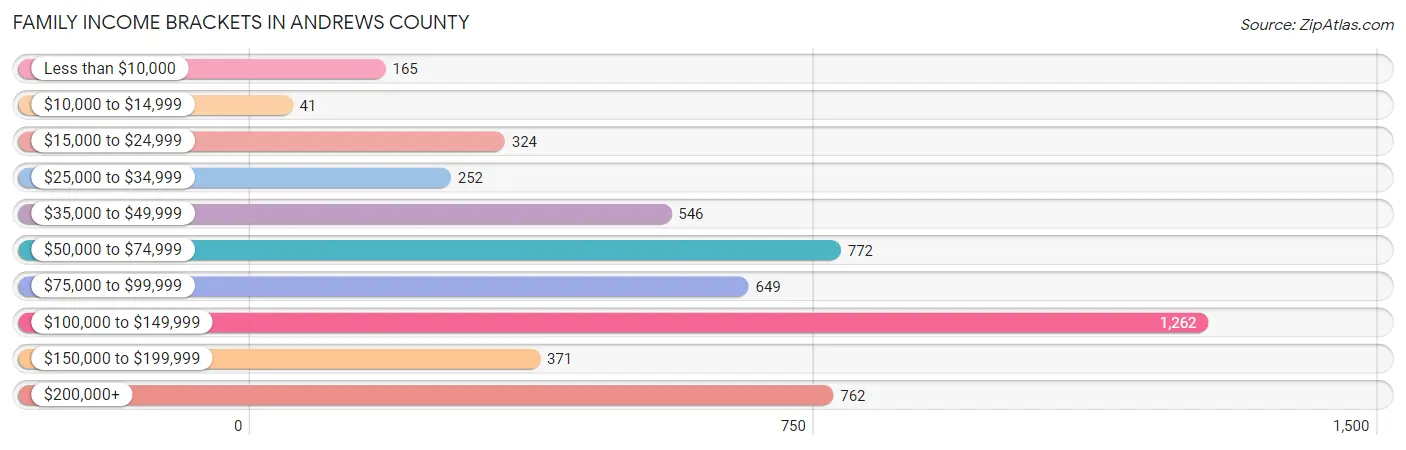
Family Income Brackets in Andrews County
According to the Andrews County family income data, there are 1,262 families falling into the $100,000 to $149,999 income range, which is the most common income bracket and makes up 24.5% of all families. Conversely, the $10,000 to $14,999 income bracket is the least frequent group with only 41 families (0.8%) belonging to this category.
| Income Bracket | # Families | % Families |
| Less than $10,000 | 165 | 3.2% |
| $10,000 to $14,999 | 41 | 0.8% |
| $15,000 to $24,999 | 324 | 6.3% |
| $25,000 to $34,999 | 252 | 4.9% |
| $35,000 to $49,999 | 546 | 10.6% |
| $50,000 to $74,999 | 772 | 15.0% |
| $75,000 to $99,999 | 649 | 12.6% |
| $100,000 to $149,999 | 1,262 | 24.5% |
| $150,000 to $199,999 | 371 | 7.2% |
| $200,000+ | 762 | 14.8% |
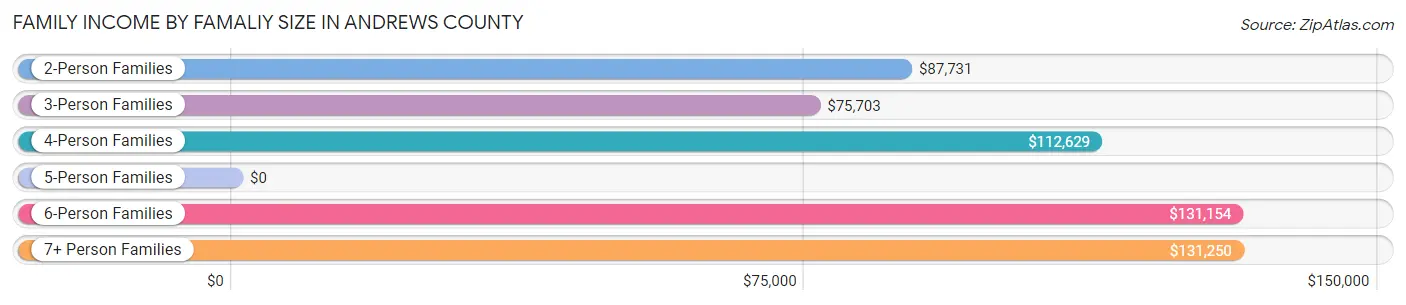
Family Income by Famaliy Size in Andrews County
7+ person families (142 | 2.8%) account for the highest median family income in Andrews County with $131,250 per family, while 2-person families (1,809 | 35.1%) have the highest median income of $43,866 per family member.
| Income Bracket | # Families | Median Income |
| 2-Person Families | 1,809 (35.1%) | $87,731 |
| 3-Person Families | 944 (18.3%) | $75,703 |
| 4-Person Families | 1,369 (26.6%) | $112,629 |
| 5-Person Families | 677 (13.2%) | $0 |
| 6-Person Families | 208 (4.0%) | $131,154 |
| 7+ Person Families | 142 (2.8%) | $131,250 |
| Total | 5,149 (100.0%) | $93,796 |
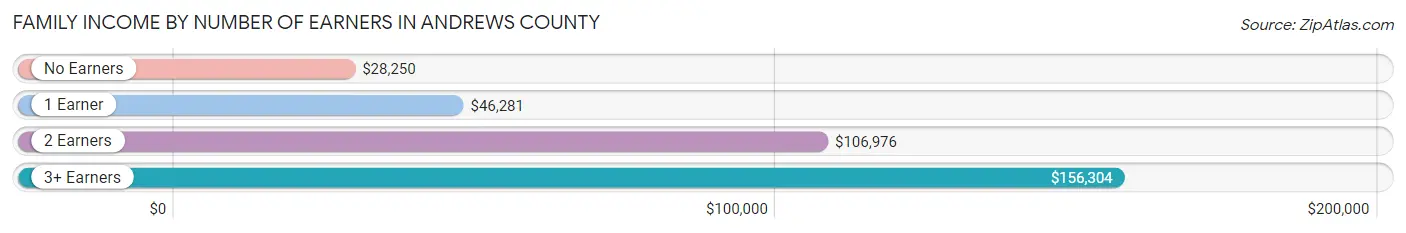
Family Income by Number of Earners in Andrews County
The median family income in Andrews County is $93,796, with families comprising 3+ earners (880) having the highest median family income of $156,304, while families with no earners (399) have the lowest median family income of $28,250, accounting for 17.1% and 7.7% of families, respectively.
| Number of Earners | # Families | Median Income |
| No Earners | 399 (7.7%) | $28,250 |
| 1 Earner | 1,527 (29.7%) | $46,281 |
| 2 Earners | 2,343 (45.5%) | $106,976 |
| 3+ Earners | 880 (17.1%) | $156,304 |
| Total | 5,149 (100.0%) | $93,796 |
Household Income in Andrews County
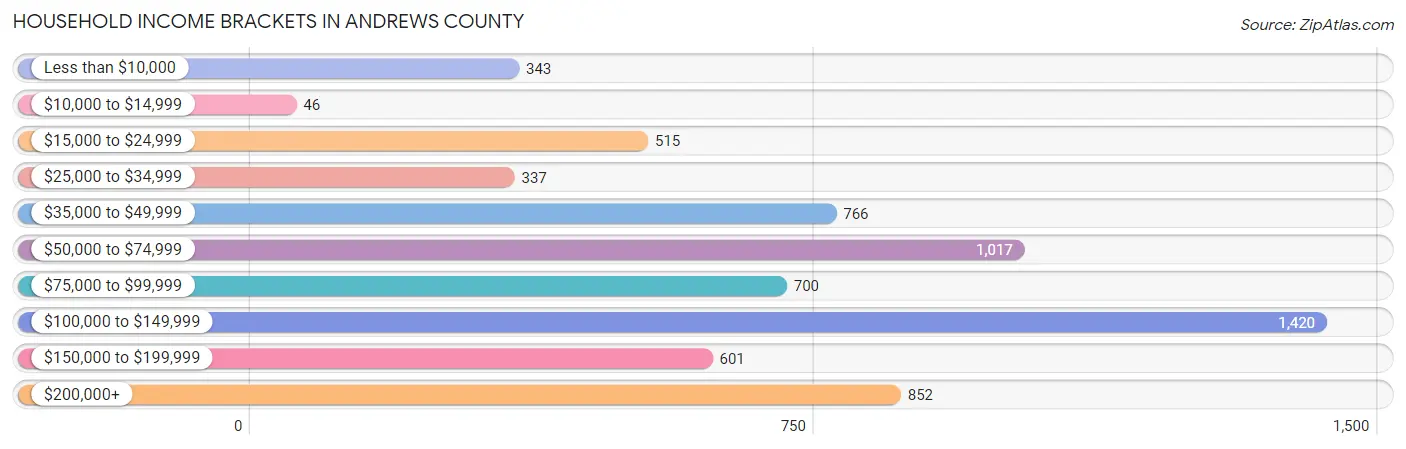
Household Income Brackets in Andrews County
With 1,420 households falling in the category, the $100,000 to $149,999 income range is the most frequent in Andrews County, accounting for 21.5% of all households. In contrast, only 46 households (0.7%) fall into the $10,000 to $14,999 income bracket, making it the least populous group.
| Income Bracket | # Households | % Households |
| Less than $10,000 | 343 | 5.2% |
| $10,000 to $14,999 | 46 | 0.7% |
| $15,000 to $24,999 | 515 | 7.8% |
| $25,000 to $34,999 | 337 | 5.1% |
| $35,000 to $49,999 | 766 | 11.6% |
| $50,000 to $74,999 | 1,017 | 15.4% |
| $75,000 to $99,999 | 700 | 10.6% |
| $100,000 to $149,999 | 1,420 | 21.5% |
| $150,000 to $199,999 | 601 | 9.1% |
| $200,000+ | 852 | 12.9% |
Household Income by Householder Age in Andrews County
The median household income in Andrews County is $86,458, with the highest median household income of $112,558 found in the 45 to 64 years age bracket for the primary householder. A total of 2,303 households (34.9%) fall into this category. Meanwhile, the 65+ years age bracket for the primary householder has the lowest median household income of $56,316, with 1,160 households (17.6%) in this group.
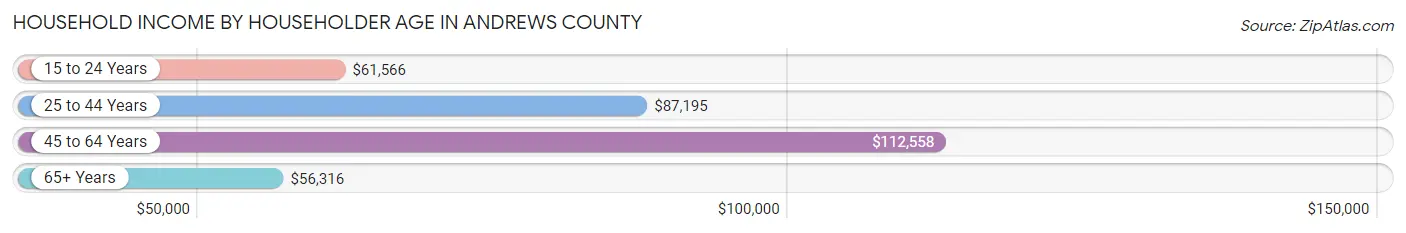
| Income Bracket | # Households | Median Income |
| 15 to 24 Years | 506 (7.7%) | $61,566 |
| 25 to 44 Years | 2,634 (39.9%) | $87,195 |
| 45 to 64 Years | 2,303 (34.9%) | $112,558 |
| 65+ Years | 1,160 (17.6%) | $56,316 |
| Total | 6,603 (100.0%) | $86,458 |
Poverty in Andrews County
Income Below Poverty by Sex and Age in Andrews County
With 11.0% poverty level for males and 12.9% for females among the residents of Andrews County, 6 to 11 year old males and 5 year old females are the most vulnerable to poverty, with 230 males (25.6%) and 33 females (28.7%) in their respective age groups living below the poverty level.
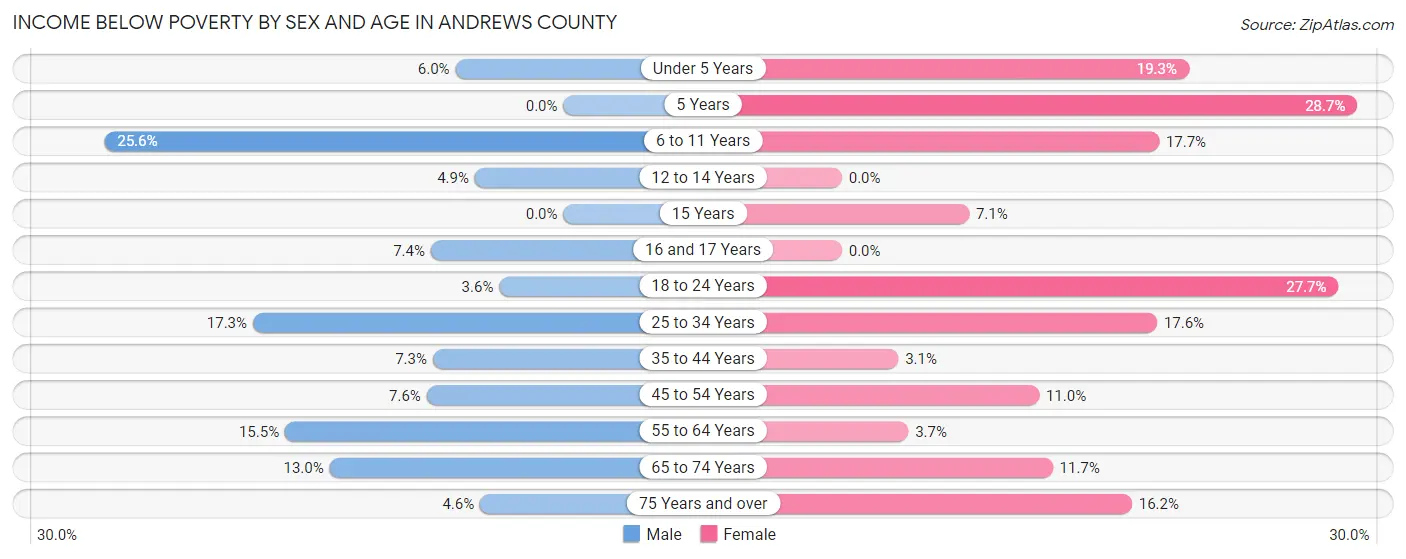
| Age Bracket | Male | Female |
| Under 5 Years | 46 (6.0%) | 142 (19.3%) |
| 5 Years | 0 (0.0%) | 33 (28.7%) |
| 6 to 11 Years | 230 (25.6%) | 210 (17.7%) |
| 12 to 14 Years | 33 (4.9%) | 0 (0.0%) |
| 15 Years | 0 (0.0%) | 16 (7.1%) |
| 16 and 17 Years | 31 (7.4%) | 0 (0.0%) |
| 18 to 24 Years | 30 (3.6%) | 232 (27.7%) |
| 25 to 34 Years | 239 (17.3%) | 222 (17.5%) |
| 35 to 44 Years | 93 (7.3%) | 37 (3.1%) |
| 45 to 54 Years | 79 (7.6%) | 114 (11.0%) |
| 55 to 64 Years | 148 (15.5%) | 41 (3.7%) |
| 65 to 74 Years | 75 (13.0%) | 68 (11.7%) |
| 75 Years and over | 11 (4.6%) | 47 (16.2%) |
| Total | 1,015 (11.0%) | 1,162 (12.9%) |
Income Above Poverty by Sex and Age in Andrews County
According to the poverty statistics in Andrews County, males aged 5 years and females aged 12 to 14 years are the age groups that are most secure financially, with 100.0% of males and 100.0% of females in these age groups living above the poverty line.
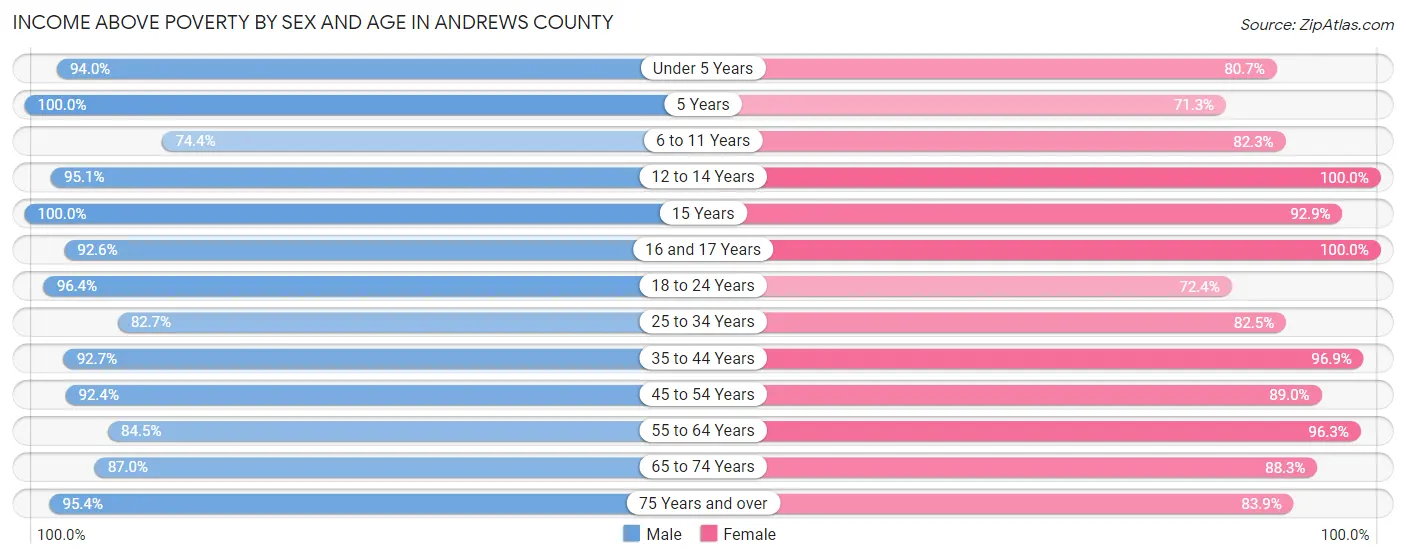
| Age Bracket | Male | Female |
| Under 5 Years | 720 (94.0%) | 593 (80.7%) |
| 5 Years | 66 (100.0%) | 82 (71.3%) |
| 6 to 11 Years | 670 (74.4%) | 979 (82.3%) |
| 12 to 14 Years | 636 (95.1%) | 258 (100.0%) |
| 15 Years | 71 (100.0%) | 210 (92.9%) |
| 16 and 17 Years | 389 (92.6%) | 208 (100.0%) |
| 18 to 24 Years | 811 (96.4%) | 607 (72.4%) |
| 25 to 34 Years | 1,143 (82.7%) | 1,043 (82.5%) |
| 35 to 44 Years | 1,187 (92.7%) | 1,142 (96.9%) |
| 45 to 54 Years | 959 (92.4%) | 924 (89.0%) |
| 55 to 64 Years | 807 (84.5%) | 1,066 (96.3%) |
| 65 to 74 Years | 501 (87.0%) | 511 (88.3%) |
| 75 Years and over | 226 (95.4%) | 244 (83.9%) |
| Total | 8,186 (89.0%) | 7,867 (87.1%) |
Income Below Poverty Among Married-Couple Families in Andrews County
The poverty statistics for married-couple families in Andrews County show that 10.2% or 412 of the total 4,027 families live below the poverty line. Families with 5 or more children have the highest poverty rate of 87.5%, comprising of 14 families. On the other hand, families with 1 or 2 children have the lowest poverty rate of 4.4%, which includes 66 families.
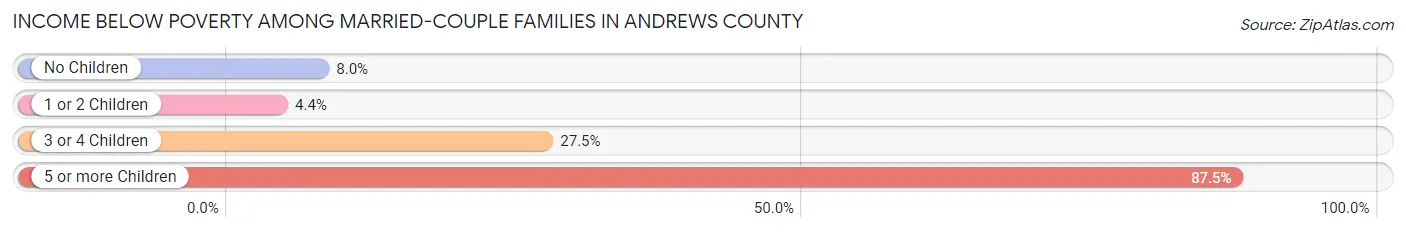
| Children | Above Poverty | Below Poverty |
| No Children | 1,667 (92.0%) | 144 (8.0%) |
| 1 or 2 Children | 1,449 (95.6%) | 66 (4.4%) |
| 3 or 4 Children | 497 (72.6%) | 188 (27.5%) |
| 5 or more Children | 2 (12.5%) | 14 (87.5%) |
| Total | 3,615 (89.8%) | 412 (10.2%) |
Income Below Poverty Among Single-Parent Households in Andrews County
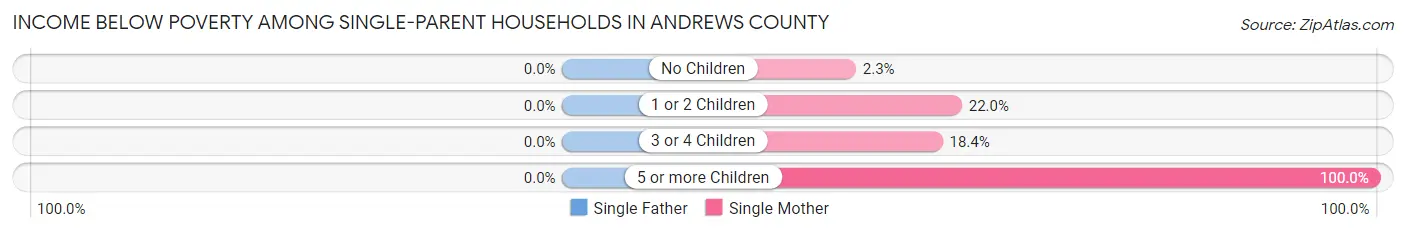
| Children | Single Father | Single Mother |
| No Children | 0 (0.0%) | 10 (2.3%) |
| 1 or 2 Children | 0 (0.0%) | 44 (22.0%) |
| 3 or 4 Children | 0 (0.0%) | 37 (18.4%) |
| 5 or more Children | 0 (0.0%) | 13 (100.0%) |
| Total | 0 (0.0%) | 104 (12.2%) |
Income Below Poverty Among Married-Couple vs Single-Parent Households in Andrews County
The poverty data for Andrews County shows that 412 of the married-couple family households (10.2%) and 104 of the single-parent households (9.3%) are living below the poverty level. Within the married-couple family households, those with 5 or more children have the highest poverty rate, with 14 households (87.5%) falling below the poverty line. Among the single-parent households, those with 5 or more children have the highest poverty rate, with 13 household (100.0%) living below poverty.
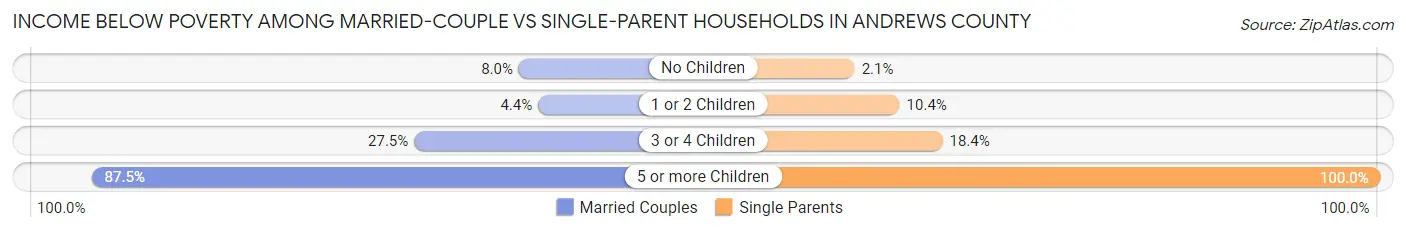
| Children | Married-Couple Families | Single-Parent Households |
| No Children | 144 (8.0%) | 10 (2.1%) |
| 1 or 2 Children | 66 (4.4%) | 44 (10.4%) |
| 3 or 4 Children | 188 (27.5%) | 37 (18.4%) |
| 5 or more Children | 14 (87.5%) | 13 (100.0%) |
| Total | 412 (10.2%) | 104 (9.3%) |
Race in Andrews County
The most populous races in Andrews County are White / Caucasian (12,484 | 68.0%), Hispanic or Latino (10,638 | 57.9%), and Two or more Races (3,211 | 17.5%).
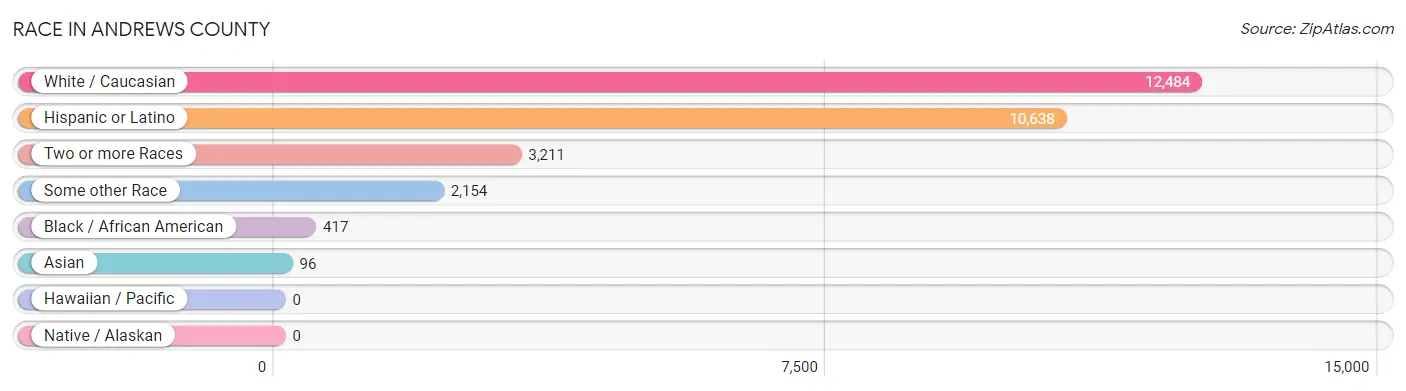
| Race | # Population | % Population |
| Asian | 96 | 0.5% |
| Black / African American | 417 | 2.3% |
| Hawaiian / Pacific | 0 | 0.0% |
| Hispanic or Latino | 10,638 | 57.9% |
| Native / Alaskan | 0 | 0.0% |
| White / Caucasian | 12,484 | 68.0% |
| Two or more Races | 3,211 | 17.5% |
| Some other Race | 2,154 | 11.7% |
| Total | 18,362 | 100.0% |
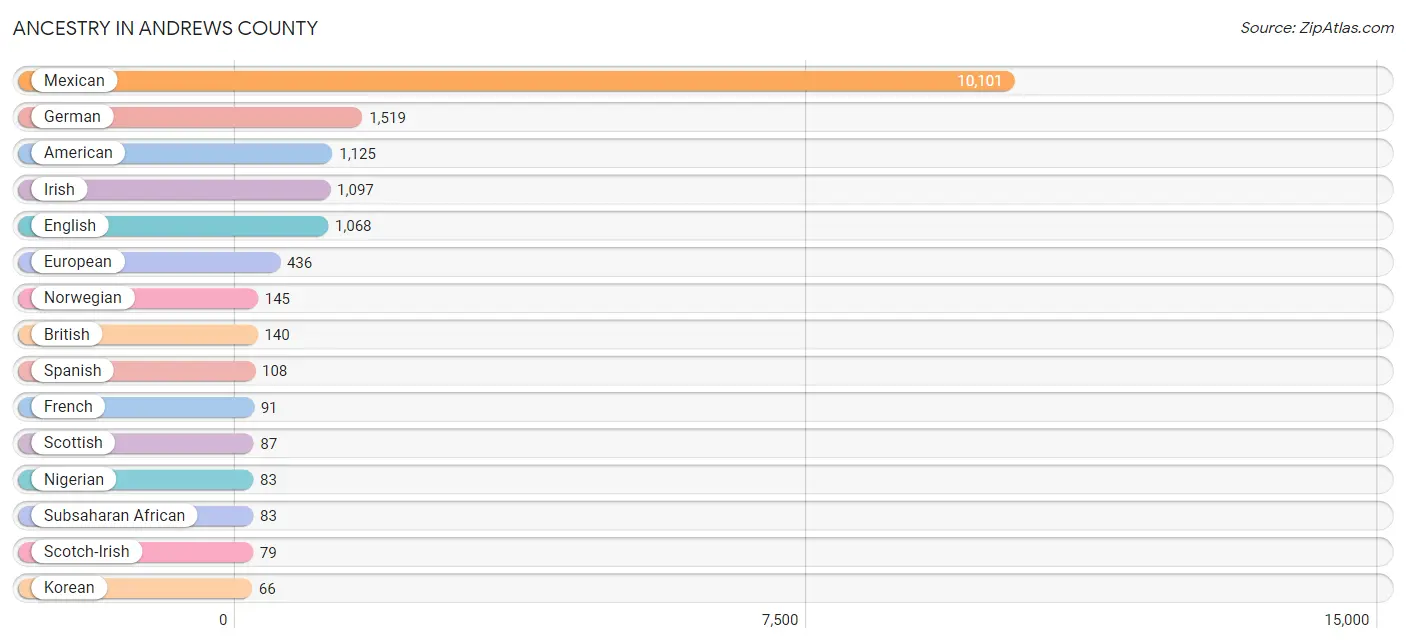
Ancestry in Andrews County
The most populous ancestries reported in Andrews County are Mexican (10,101 | 55.0%), German (1,519 | 8.3%), American (1,125 | 6.1%), Irish (1,097 | 6.0%), and English (1,068 | 5.8%), together accounting for 81.2% of all Andrews County residents.
| Ancestry | # Population | % Population |
| American | 1,125 | 6.1% |
| British | 140 | 0.8% |
| Burmese | 26 | 0.1% |
| Central American | 64 | 0.4% |
| Central American Indian | 19 | 0.1% |
| Cherokee | 13 | 0.1% |
| Comanche | 42 | 0.2% |
| Czech | 20 | 0.1% |
| Dutch | 12 | 0.1% |
| Eastern European | 31 | 0.2% |
| English | 1,068 | 5.8% |
| European | 436 | 2.4% |
| French | 91 | 0.5% |
| French Canadian | 5 | 0.0% |
| German | 1,519 | 8.3% |
| Guatemalan | 45 | 0.3% |
| Honduran | 19 | 0.1% |
| Hungarian | 32 | 0.2% |
| Indian (Asian) | 9 | 0.1% |
| Irish | 1,097 | 6.0% |
| Italian | 16 | 0.1% |
| Korean | 66 | 0.4% |
| Mexican | 10,101 | 55.0% |
| Nigerian | 83 | 0.4% |
| Northern European | 9 | 0.1% |
| Norwegian | 145 | 0.8% |
| Polish | 35 | 0.2% |
| Portuguese | 44 | 0.2% |
| Puerto Rican | 40 | 0.2% |
| Russian | 31 | 0.2% |
| Samoan | 14 | 0.1% |
| Scandinavian | 57 | 0.3% |
| Scotch-Irish | 79 | 0.4% |
| Scottish | 87 | 0.5% |
| Spaniard | 5 | 0.0% |
| Spanish | 108 | 0.6% |
| Sri Lankan | 25 | 0.1% |
| Subsaharan African | 83 | 0.4% |
| Swedish | 42 | 0.2% | View All 39 Rows |
Immigrants in Andrews County
The most numerous immigrant groups reported in Andrews County came from Central America (3,056 | 16.6%), Latin America (3,056 | 16.6%), Mexico (3,023 | 16.5%), Africa (76 | 0.4%), and Nigeria (76 | 0.4%), together accounting for 50.6% of all Andrews County residents.

| Immigration Origin | # Population | % Population |
| Africa | 76 | 0.4% |
| Asia | 74 | 0.4% |
| Canada | 5 | 0.0% |
| Central America | 3,056 | 16.6% |
| Eastern Asia | 21 | 0.1% |
| Eastern Europe | 11 | 0.1% |
| Europe | 11 | 0.1% |
| Guatemala | 14 | 0.1% |
| Honduras | 19 | 0.1% |
| Korea | 21 | 0.1% |
| Latin America | 3,056 | 16.6% |
| Mexico | 3,023 | 16.5% |
| Nigeria | 76 | 0.4% |
| Philippines | 53 | 0.3% |
| South Eastern Asia | 53 | 0.3% |
| Western Africa | 76 | 0.4% | View All 16 Rows |
Sex and Age in Andrews County
Sex and Age in Andrews County
The most populous age groups in Andrews County are 10 to 14 Years (908 | 9.8%) for men and 5 to 9 Years (952 | 10.5%) for women.
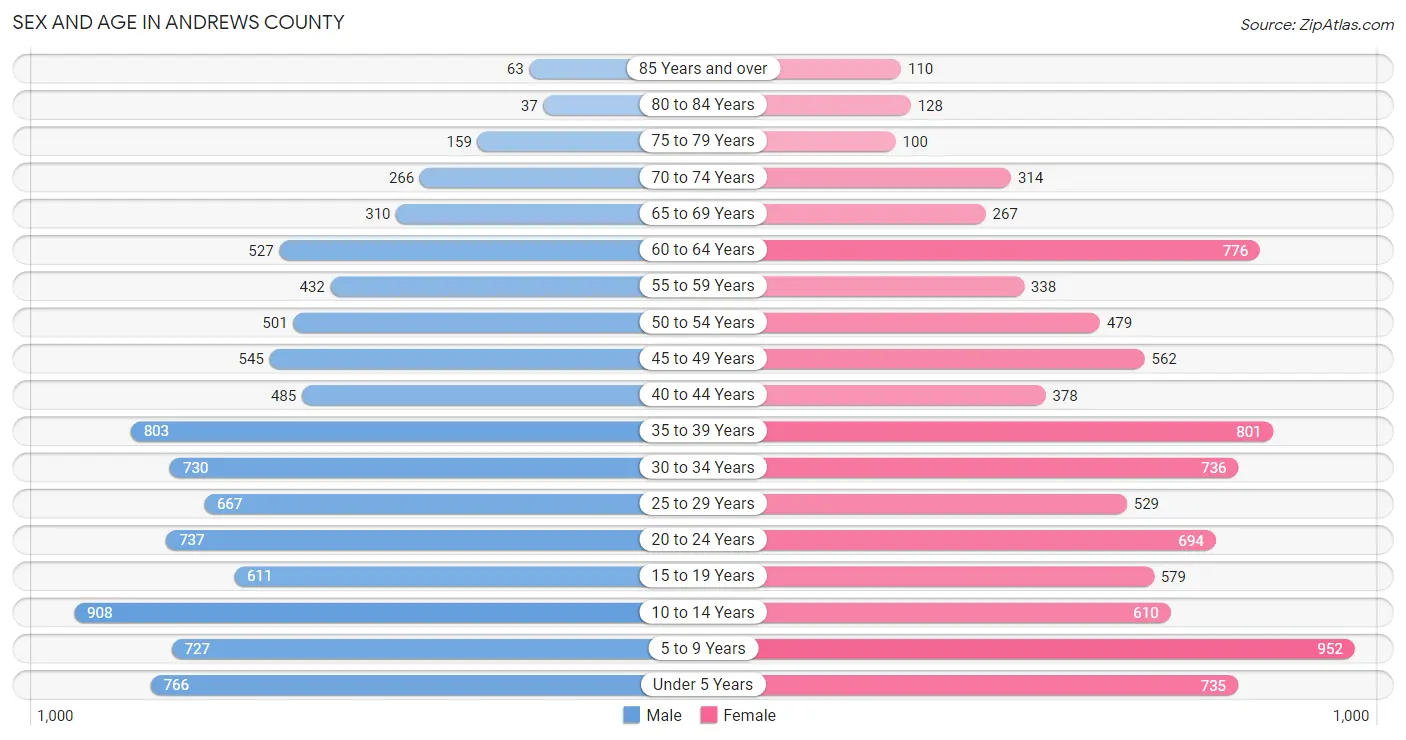
| Age Bracket | Male | Female |
| Under 5 Years | 766 (8.3%) | 735 (8.1%) |
| 5 to 9 Years | 727 (7.8%) | 952 (10.5%) |
| 10 to 14 Years | 908 (9.8%) | 610 (6.7%) |
| 15 to 19 Years | 611 (6.6%) | 579 (6.4%) |
| 20 to 24 Years | 737 (8.0%) | 694 (7.6%) |
| 25 to 29 Years | 667 (7.2%) | 529 (5.8%) |
| 30 to 34 Years | 730 (7.9%) | 736 (8.1%) |
| 35 to 39 Years | 803 (8.7%) | 801 (8.8%) |
| 40 to 44 Years | 485 (5.2%) | 378 (4.2%) |
| 45 to 49 Years | 545 (5.9%) | 562 (6.2%) |
| 50 to 54 Years | 501 (5.4%) | 479 (5.3%) |
| 55 to 59 Years | 432 (4.7%) | 338 (3.7%) |
| 60 to 64 Years | 527 (5.7%) | 776 (8.5%) |
| 65 to 69 Years | 310 (3.3%) | 267 (2.9%) |
| 70 to 74 Years | 266 (2.9%) | 314 (3.5%) |
| 75 to 79 Years | 159 (1.7%) | 100 (1.1%) |
| 80 to 84 Years | 37 (0.4%) | 128 (1.4%) |
| 85 Years and over | 63 (0.7%) | 110 (1.2%) |
| Total | 9,274 (100.0%) | 9,088 (100.0%) |
Families and Households in Andrews County
Median Family Size in Andrews County
The median family size in Andrews County is 3.15 persons per family, with married-couple families (4,027 | 78.2%) accounting for the largest median family size of 3.26 persons per family. On the other hand, single male/father families (268 | 5.2%) represent the smallest median family size with 2.30 persons per family.
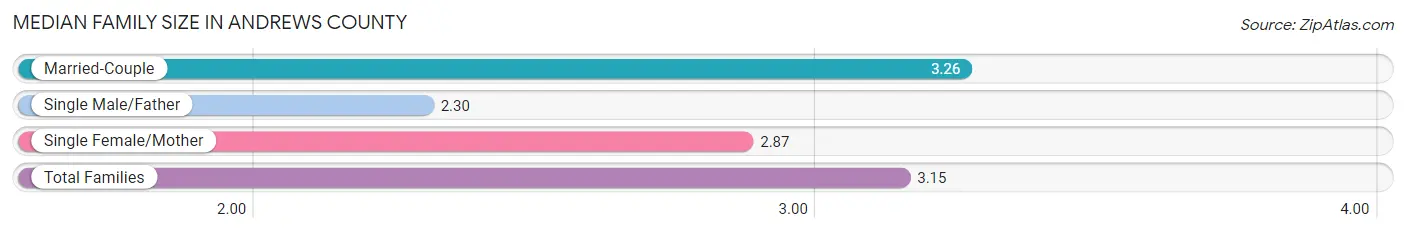
| Family Type | # Families | Family Size |
| Married-Couple | 4,027 (78.2%) | 3.26 |
| Single Male/Father | 268 (5.2%) | 2.30 |
| Single Female/Mother | 854 (16.6%) | 2.87 |
| Total Families | 5,149 (100.0%) | 3.15 |
Median Household Size in Andrews County
The median household size in Andrews County is 2.76 persons per household, with married-couple households (4,027 | 61.0%) accounting for the largest median household size of 3.28 persons per household. non-family households (1,454 | 22.0%) represent the smallest median household size with 1.12 persons per household.
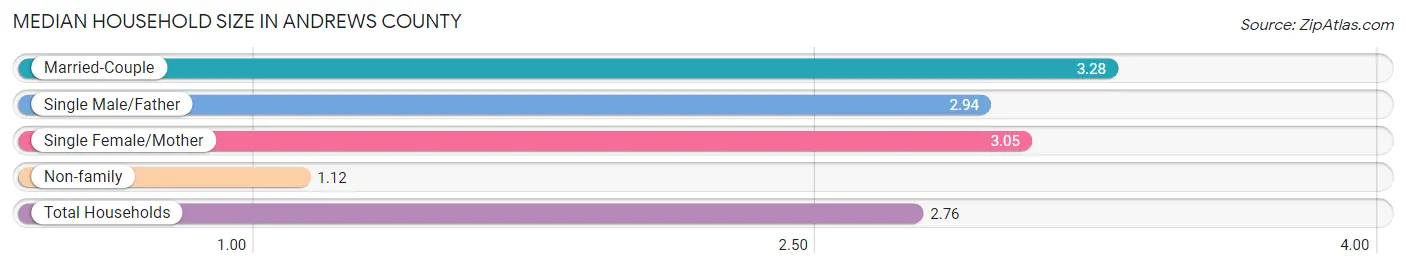
| Household Type | # Households | Household Size |
| Married-Couple | 4,027 (61.0%) | 3.28 |
| Single Male/Father | 268 (4.1%) | 2.94 |
| Single Female/Mother | 854 (12.9%) | 3.05 |
| Non-family | 1,454 (22.0%) | 1.12 |
| Total Households | 6,603 (100.0%) | 2.76 |
Household Size by Marriage Status in Andrews County
Out of a total of 6,603 households in Andrews County, 5,149 (78.0%) are family households, while 1,454 (22.0%) are nonfamily households. The most numerous type of family households are 2-person households, comprising 1,736, and the most common type of nonfamily households are 1-person households, comprising 1,271.
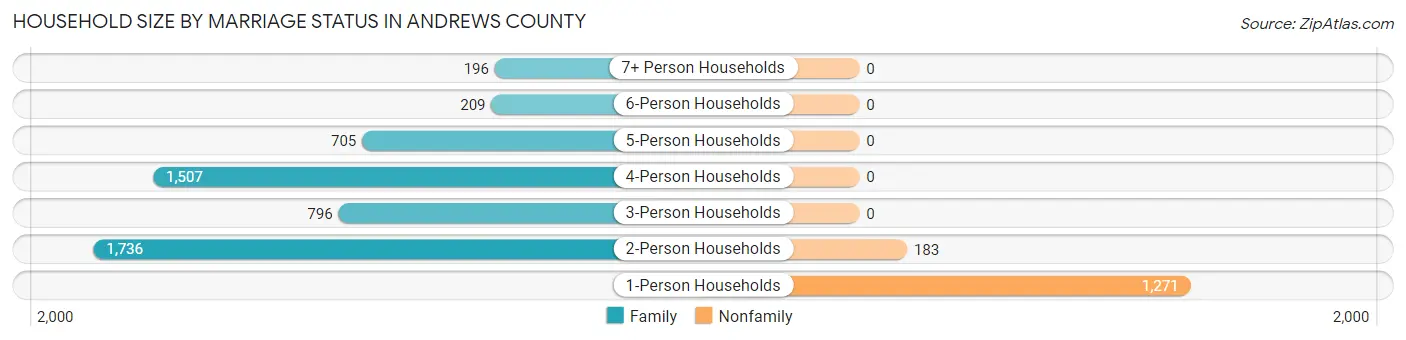
| Household Size | Family Households | Nonfamily Households |
| 1-Person Households | - | 1,271 (19.3%) |
| 2-Person Households | 1,736 (26.3%) | 183 (2.8%) |
| 3-Person Households | 796 (12.1%) | 0 (0.0%) |
| 4-Person Households | 1,507 (22.8%) | 0 (0.0%) |
| 5-Person Households | 705 (10.7%) | 0 (0.0%) |
| 6-Person Households | 209 (3.2%) | 0 (0.0%) |
| 7+ Person Households | 196 (3.0%) | 0 (0.0%) |
| Total | 5,149 (78.0%) | 1,454 (22.0%) |
Female Fertility in Andrews County
Fertility by Age in Andrews County
Average fertility rate in Andrews County is 95.0 births per 1,000 women. Women in the age bracket of 20 to 34 years have the highest fertility rate with 153.0 births per 1,000 women. Women in the age bracket of 20 to 34 years acount for 73.3% of all women with births.
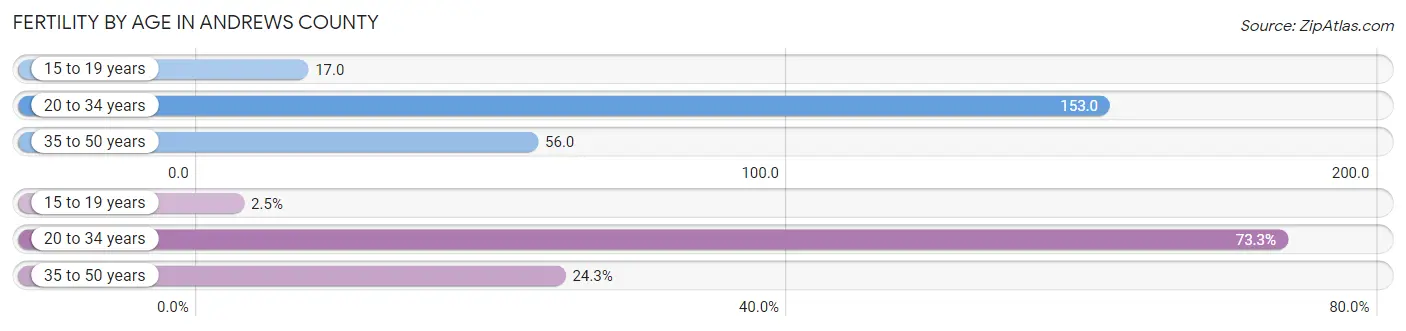
| Age Bracket | Women with Births | Births / 1,000 Women |
| 15 to 19 years | 10 (2.5%) | 17.0 |
| 20 to 34 years | 299 (73.3%) | 153.0 |
| 35 to 50 years | 99 (24.3%) | 56.0 |
| Total | 408 (100.0%) | 95.0 |
Fertility by Age by Marriage Status in Andrews County
88.0% of women with births (408) in Andrews County are married. The highest percentage of unmarried women with births falls into 15 to 19 years age bracket with 100.0% of them unmarried at the time of birth, while the lowest percentage of unmarried women with births belong to 35 to 50 years age bracket with 0.0% of them unmarried.
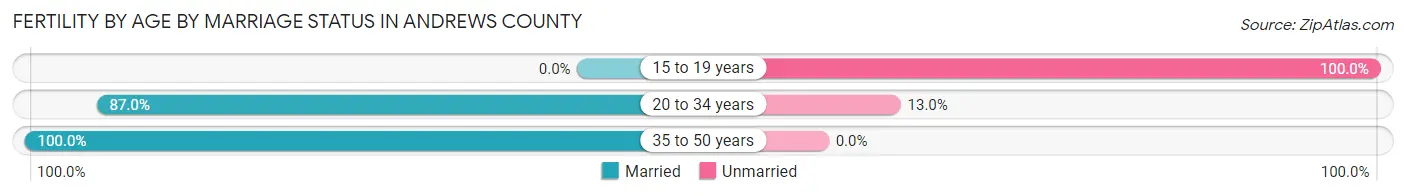
| Age Bracket | Married | Unmarried |
| 15 to 19 years | 0 (0.0%) | 10 (100.0%) |
| 20 to 34 years | 260 (87.0%) | 39 (13.0%) |
| 35 to 50 years | 99 (100.0%) | 0 (0.0%) |
| Total | 359 (88.0%) | 49 (12.0%) |
Fertility by Education in Andrews County
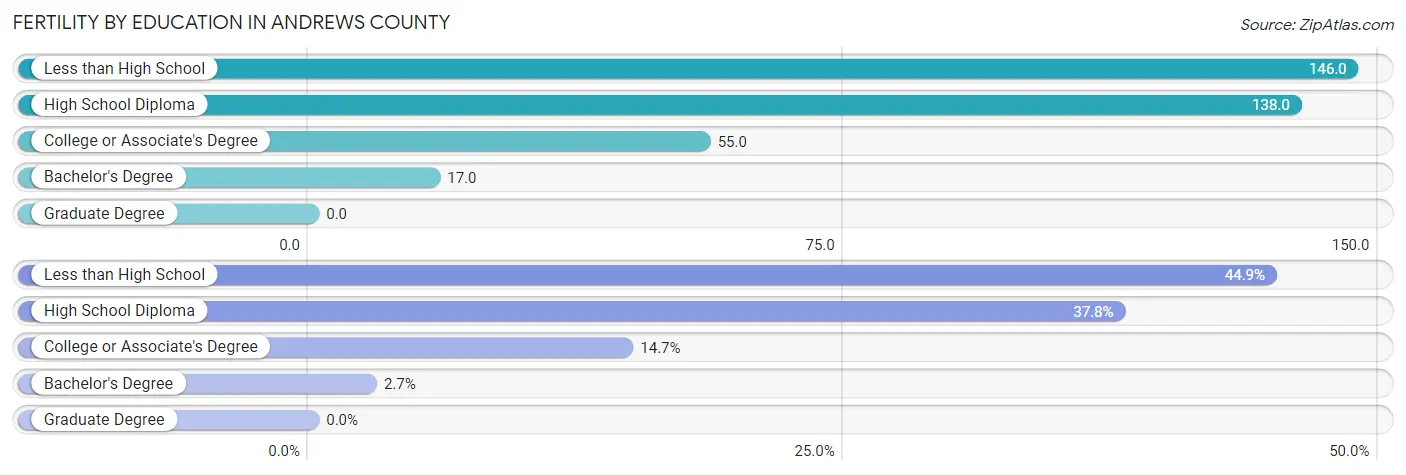
| Educational Attainment | Women with Births | Births / 1,000 Women |
| Less than High School | 183 (44.9%) | 146.0 |
| High School Diploma | 154 (37.8%) | 138.0 |
| College or Associate's Degree | 60 (14.7%) | 55.0 |
| Bachelor's Degree | 11 (2.7%) | 17.0 |
| Graduate Degree | 0 (0.0%) | 0.0 |
| Total | 408 (100.0%) | 95.0 |
Fertility by Education by Marriage Status in Andrews County
12.0% of women with births in Andrews County are unmarried. Women with the educational attainment of high school diploma are most likely to be married with 100.0% of them married at childbirth, while women with the educational attainment of college or associate's degree are least likely to be married with 65.0% of them unmarried at childbirth.
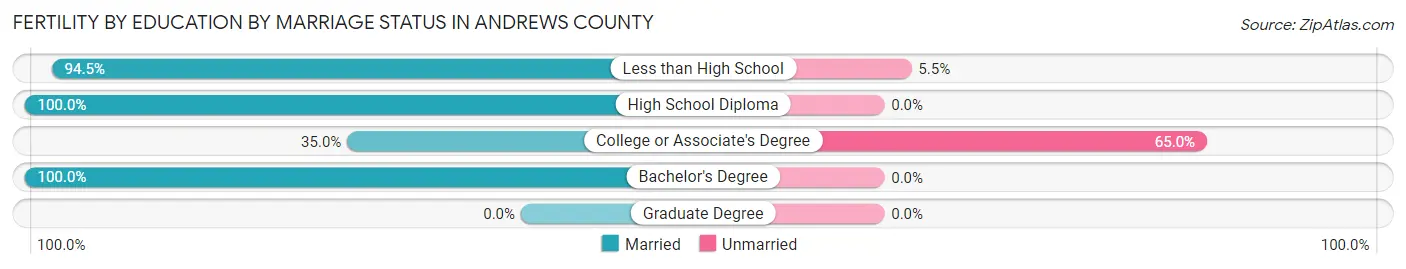
| Educational Attainment | Married | Unmarried |
| Less than High School | 173 (94.5%) | 10 (5.5%) |
| High School Diploma | 154 (100.0%) | 0 (0.0%) |
| College or Associate's Degree | 21 (35.0%) | 39 (65.0%) |
| Bachelor's Degree | 11 (100.0%) | 0 (0.0%) |
| Graduate Degree | 0 (0.0%) | 0 (0.0%) |
| Total | 359 (88.0%) | 49 (12.0%) |
Employment Characteristics in Andrews County
Employment by Class of Employer in Andrews County
Among the 9,009 employed individuals in Andrews County, private company employees (6,824 | 75.7%), local government employees (744 | 8.3%), and self-employed (incorporated) (438 | 4.9%) make up the most common classes of employment.
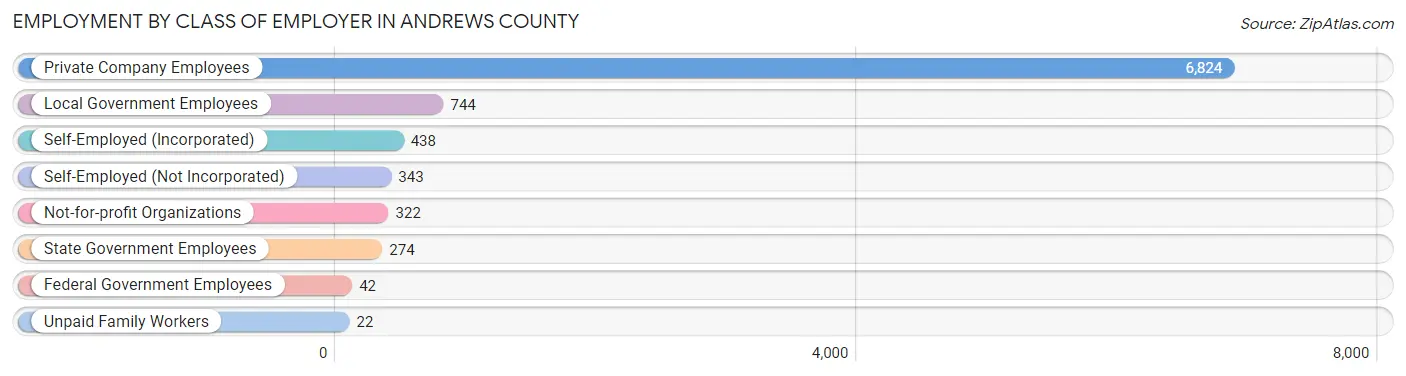
| Employer Class | # Employees | % Employees |
| Private Company Employees | 6,824 | 75.7% |
| Self-Employed (Incorporated) | 438 | 4.9% |
| Self-Employed (Not Incorporated) | 343 | 3.8% |
| Not-for-profit Organizations | 322 | 3.6% |
| Local Government Employees | 744 | 8.3% |
| State Government Employees | 274 | 3.0% |
| Federal Government Employees | 42 | 0.5% |
| Unpaid Family Workers | 22 | 0.2% |
| Total | 9,009 | 100.0% |
Employment Status by Age in Andrews County
According to the labor force statistics for Andrews County, out of the total population over 16 years of age (13,367), 71.2% or 9,517 individuals are in the labor force, with 2.7% or 257 of them unemployed. The age group with the highest labor force participation rate is 35 to 44 years, with 87.2% or 2,151 individuals in the labor force. Within the labor force, the 75 years and over age range has the highest percentage of unemployed individuals, with 56.0% or 14 of them being unemployed.
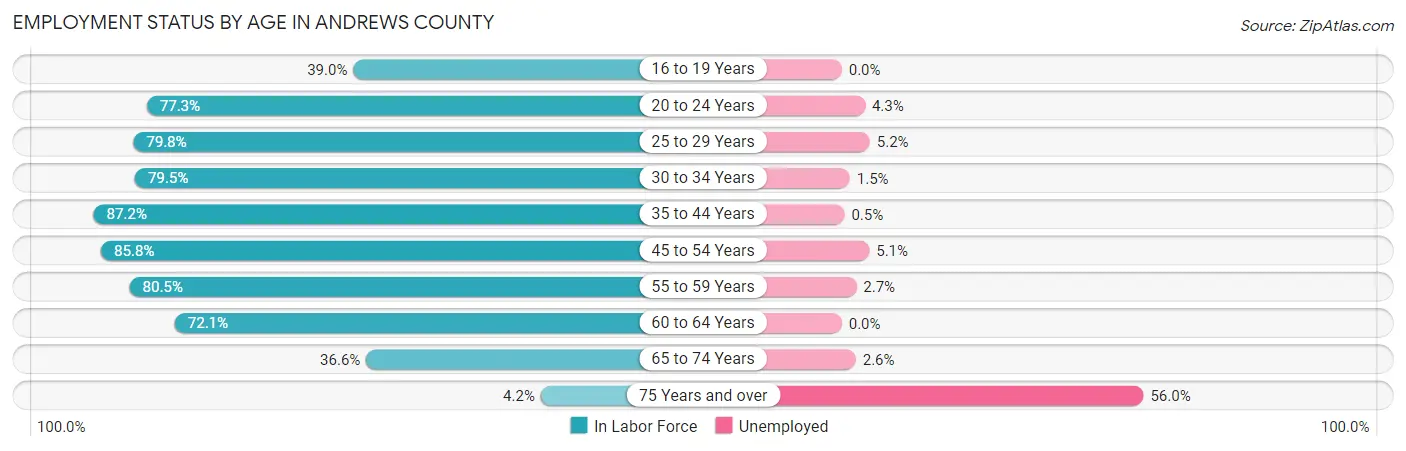
| Age Bracket | In Labor Force | Unemployed |
| 16 to 19 Years | 348 (39.0%) | 0 (0.0%) |
| 20 to 24 Years | 1,106 (77.3%) | 48 (4.3%) |
| 25 to 29 Years | 954 (79.8%) | 50 (5.2%) |
| 30 to 34 Years | 1,165 (79.5%) | 17 (1.5%) |
| 35 to 44 Years | 2,151 (87.2%) | 11 (0.5%) |
| 45 to 54 Years | 1,791 (85.8%) | 91 (5.1%) |
| 55 to 59 Years | 620 (80.5%) | 17 (2.7%) |
| 60 to 64 Years | 939 (72.1%) | 0 (0.0%) |
| 65 to 74 Years | 423 (36.6%) | 11 (2.6%) |
| 75 Years and over | 25 (4.2%) | 14 (56.0%) |
| Total | 9,517 (71.2%) | 257 (2.7%) |
Employment Status by Educational Attainment in Andrews County
According to labor force statistics for Andrews County, 82.0% of individuals (7,617) out of the total population between 25 and 64 years of age (9,289) are in the labor force, with 2.4% or 183 of them being unemployed. The group with the highest labor force participation rate are those with the educational attainment of bachelor's degree or higher, with 93.5% or 1,706 individuals in the labor force. Within the labor force, individuals with college / associate degree education have the highest percentage of unemployment, with 3.4% or 65 of them being unemployed.
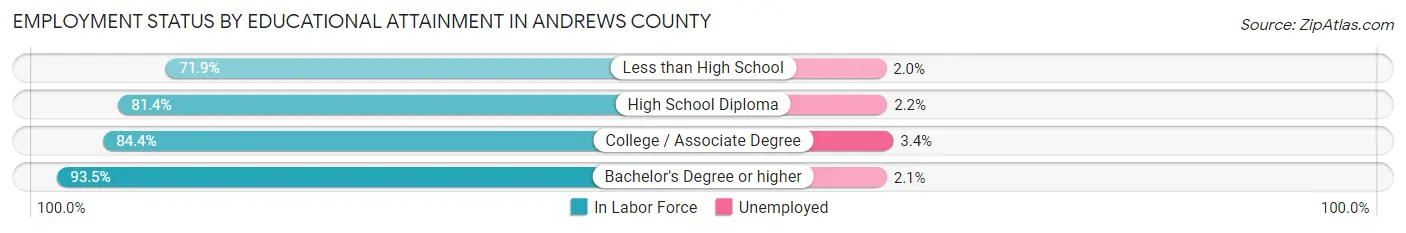
| Educational Attainment | In Labor Force | Unemployed |
| Less than High School | 1,731 (71.9%) | 48 (2.0%) |
| High School Diploma | 2,278 (81.4%) | 62 (2.2%) |
| College / Associate Degree | 1,906 (84.4%) | 77 (3.4%) |
| Bachelor's Degree or higher | 1,706 (93.5%) | 38 (2.1%) |
| Total | 7,617 (82.0%) | 223 (2.4%) |
Employment Occupations by Sex in Andrews County
Management, Business, Science and Arts Occupations
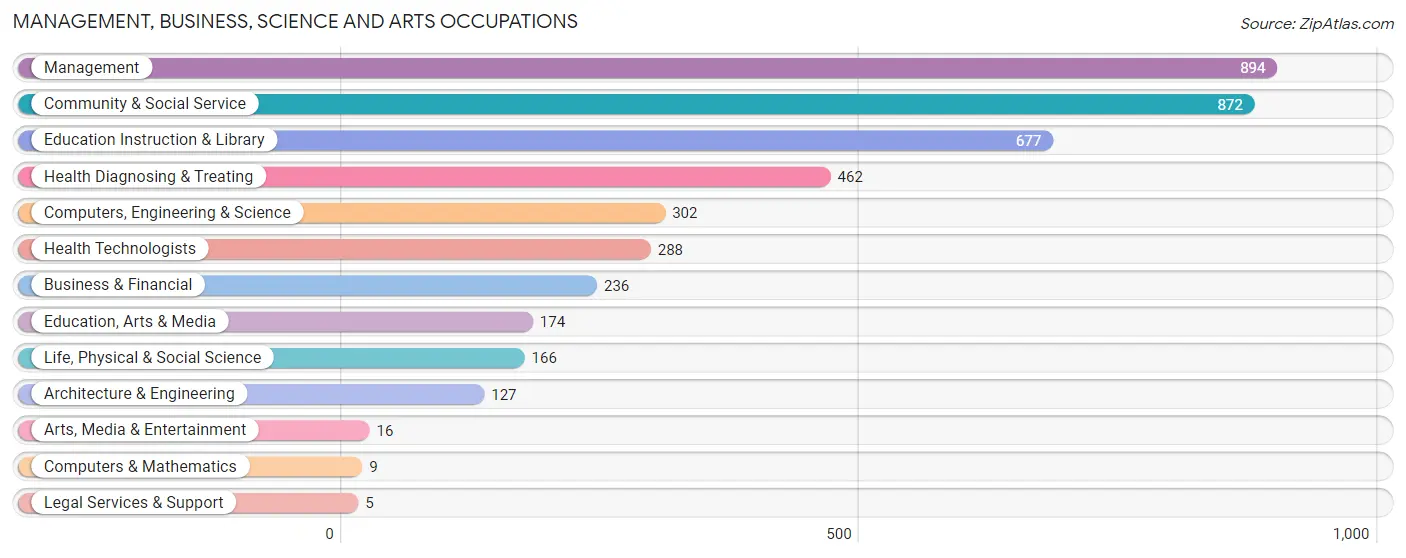
The most common Management, Business, Science and Arts occupations in Andrews County are Management (894 | 9.7%), Community & Social Service (872 | 9.4%), Education Instruction & Library (677 | 7.3%), Health Diagnosing & Treating (462 | 5.0%), and Computers, Engineering & Science (302 | 3.3%).
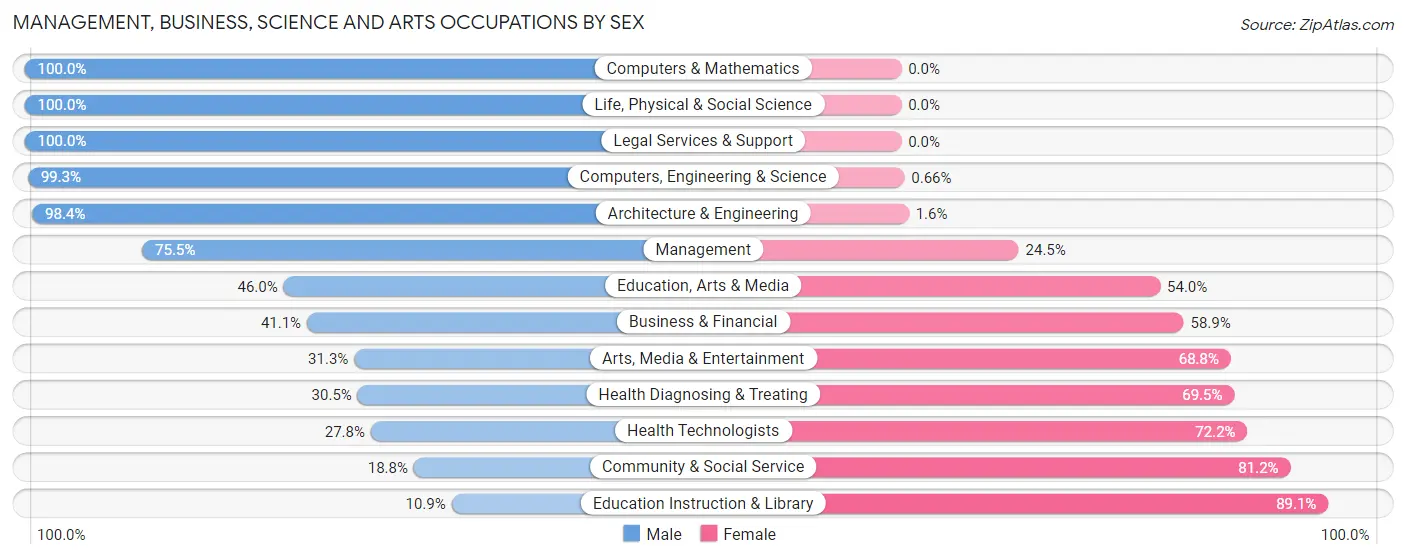
Management, Business, Science and Arts Occupations by Sex
Within the Management, Business, Science and Arts occupations in Andrews County, the most male-oriented occupations are Computers & Mathematics (100.0%), Life, Physical & Social Science (100.0%), and Legal Services & Support (100.0%), while the most female-oriented occupations are Education Instruction & Library (89.1%), Community & Social Service (81.2%), and Health Technologists (72.2%).
| Occupation | Male | Female |
| Management | 675 (75.5%) | 219 (24.5%) |
| Business & Financial | 97 (41.1%) | 139 (58.9%) |
| Computers, Engineering & Science | 300 (99.3%) | 2 (0.7%) |
| Computers & Mathematics | 9 (100.0%) | 0 (0.0%) |
| Architecture & Engineering | 125 (98.4%) | 2 (1.6%) |
| Life, Physical & Social Science | 166 (100.0%) | 0 (0.0%) |
| Community & Social Service | 164 (18.8%) | 708 (81.2%) |
| Education, Arts & Media | 80 (46.0%) | 94 (54.0%) |
| Legal Services & Support | 5 (100.0%) | 0 (0.0%) |
| Education Instruction & Library | 74 (10.9%) | 603 (89.1%) |
| Arts, Media & Entertainment | 5 (31.2%) | 11 (68.8%) |
| Health Diagnosing & Treating | 141 (30.5%) | 321 (69.5%) |
| Health Technologists | 80 (27.8%) | 208 (72.2%) |
| Total (Category) | 1,377 (49.8%) | 1,389 (50.2%) |
| Total (Overall) | 5,286 (57.1%) | 3,978 (42.9%) |
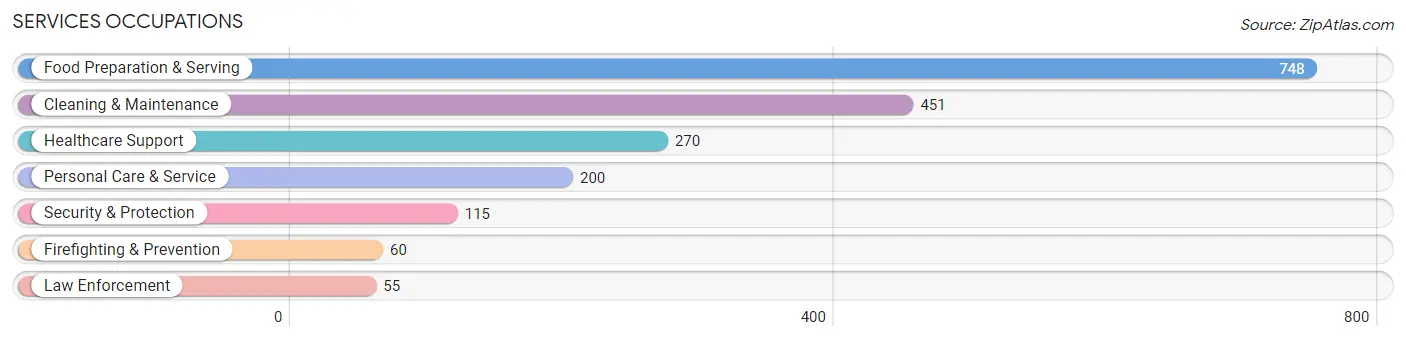
Services Occupations
The most common Services occupations in Andrews County are Food Preparation & Serving (748 | 8.1%), Cleaning & Maintenance (451 | 4.9%), Healthcare Support (270 | 2.9%), Personal Care & Service (200 | 2.2%), and Security & Protection (115 | 1.2%).
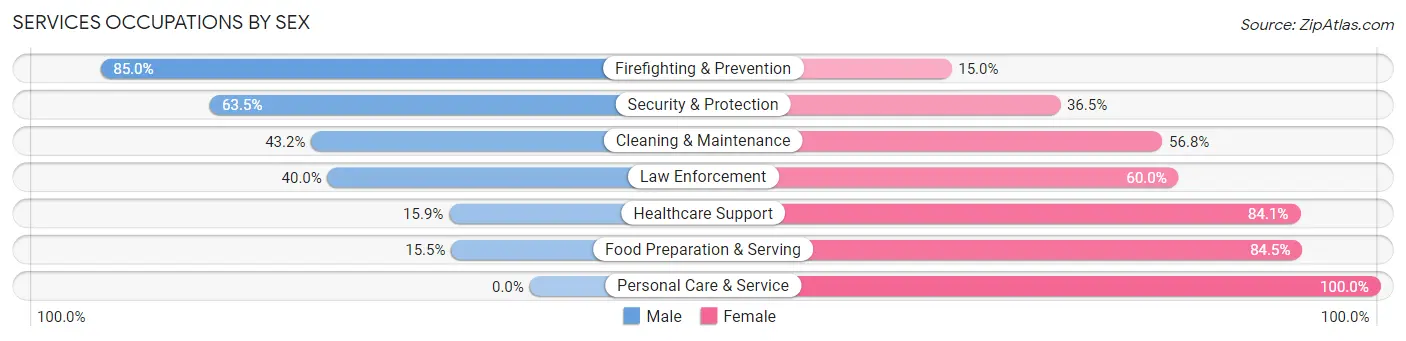
Services Occupations by Sex
Within the Services occupations in Andrews County, the most male-oriented occupations are Firefighting & Prevention (85.0%), Security & Protection (63.5%), and Cleaning & Maintenance (43.2%), while the most female-oriented occupations are Personal Care & Service (100.0%), Food Preparation & Serving (84.5%), and Healthcare Support (84.1%).
| Occupation | Male | Female |
| Healthcare Support | 43 (15.9%) | 227 (84.1%) |
| Security & Protection | 73 (63.5%) | 42 (36.5%) |
| Firefighting & Prevention | 51 (85.0%) | 9 (15.0%) |
| Law Enforcement | 22 (40.0%) | 33 (60.0%) |
| Food Preparation & Serving | 116 (15.5%) | 632 (84.5%) |
| Cleaning & Maintenance | 195 (43.2%) | 256 (56.8%) |
| Personal Care & Service | 0 (0.0%) | 200 (100.0%) |
| Total (Category) | 427 (23.9%) | 1,357 (76.1%) |
| Total (Overall) | 5,286 (57.1%) | 3,978 (42.9%) |
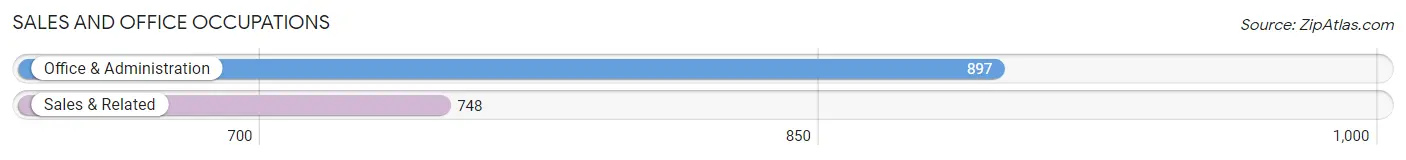
Sales and Office Occupations
The most common Sales and Office occupations in Andrews County are Office & Administration (897 | 9.7%), and Sales & Related (748 | 8.1%).
Sales and Office Occupations by Sex
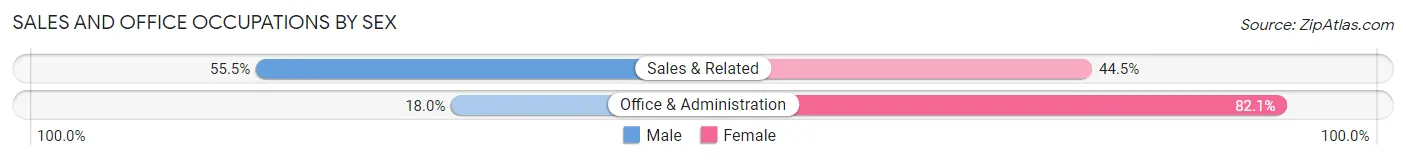
| Occupation | Male | Female |
| Sales & Related | 415 (55.5%) | 333 (44.5%) |
| Office & Administration | 161 (17.9%) | 736 (82.1%) |
| Total (Category) | 576 (35.0%) | 1,069 (65.0%) |
| Total (Overall) | 5,286 (57.1%) | 3,978 (42.9%) |
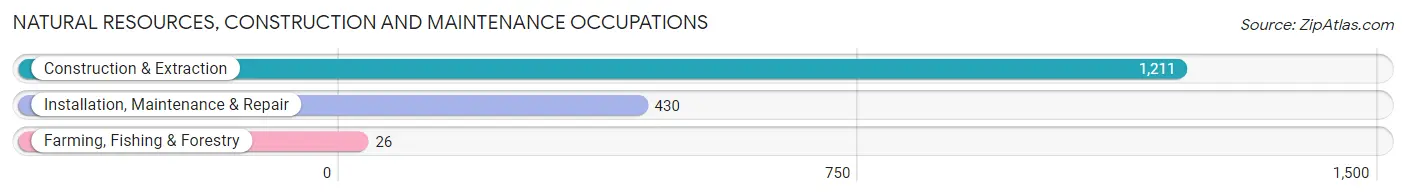
Natural Resources, Construction and Maintenance Occupations
The most common Natural Resources, Construction and Maintenance occupations in Andrews County are Construction & Extraction (1,211 | 13.1%), Installation, Maintenance & Repair (430 | 4.6%), and Farming, Fishing & Forestry (26 | 0.3%).
Natural Resources, Construction and Maintenance Occupations by Sex
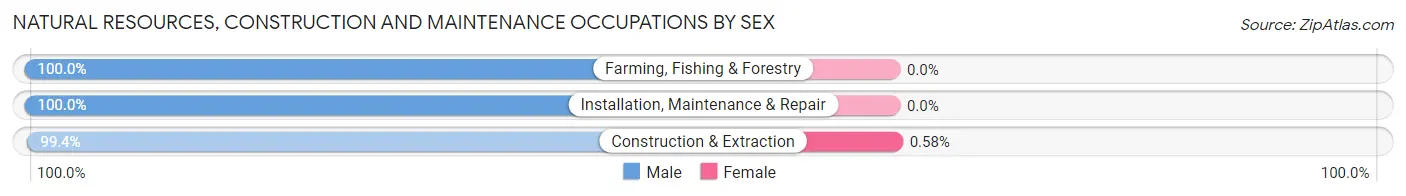
| Occupation | Male | Female |
| Farming, Fishing & Forestry | 26 (100.0%) | 0 (0.0%) |
| Construction & Extraction | 1,204 (99.4%) | 7 (0.6%) |
| Installation, Maintenance & Repair | 430 (100.0%) | 0 (0.0%) |
| Total (Category) | 1,660 (99.6%) | 7 (0.4%) |
| Total (Overall) | 5,286 (57.1%) | 3,978 (42.9%) |
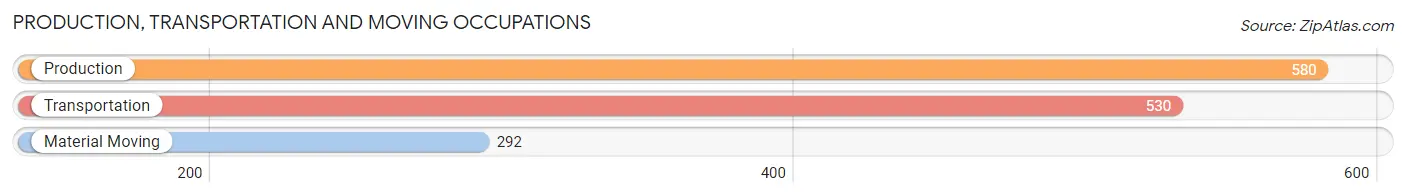
Production, Transportation and Moving Occupations
The most common Production, Transportation and Moving occupations in Andrews County are Production (580 | 6.3%), Transportation (530 | 5.7%), and Material Moving (292 | 3.2%).
Production, Transportation and Moving Occupations by Sex
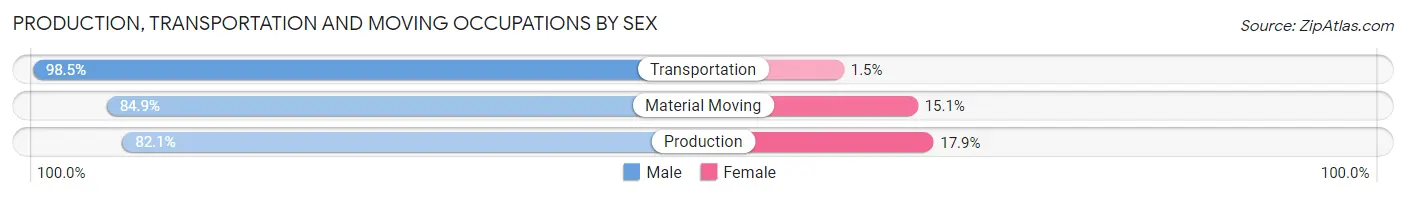
| Occupation | Male | Female |
| Production | 476 (82.1%) | 104 (17.9%) |
| Transportation | 522 (98.5%) | 8 (1.5%) |
| Material Moving | 248 (84.9%) | 44 (15.1%) |
| Total (Category) | 1,246 (88.9%) | 156 (11.1%) |
| Total (Overall) | 5,286 (57.1%) | 3,978 (42.9%) |
Employment Industries by Sex in Andrews County
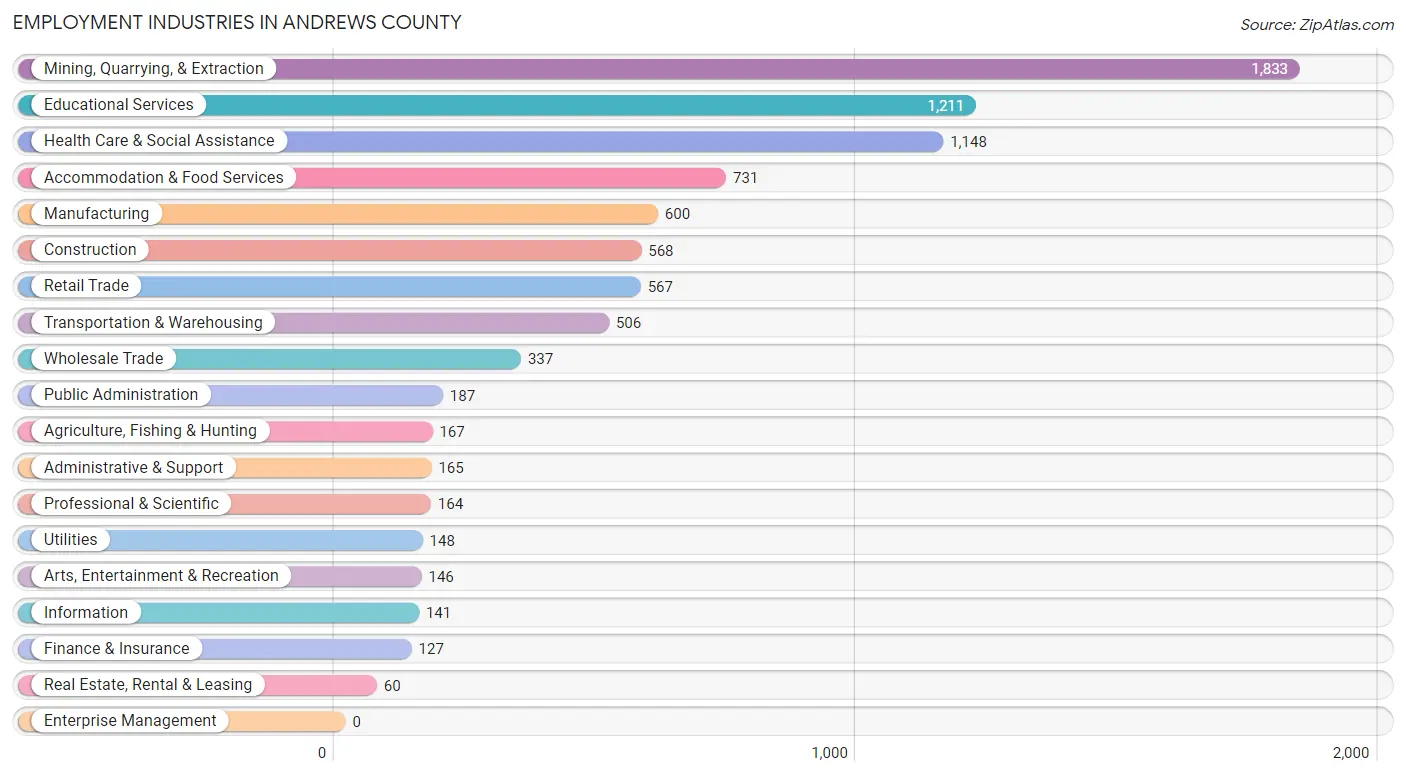
Employment Industries in Andrews County
The major employment industries in Andrews County include Mining, Quarrying, & Extraction (1,833 | 19.8%), Educational Services (1,211 | 13.1%), Health Care & Social Assistance (1,148 | 12.4%), Accommodation & Food Services (731 | 7.9%), and Manufacturing (600 | 6.5%).
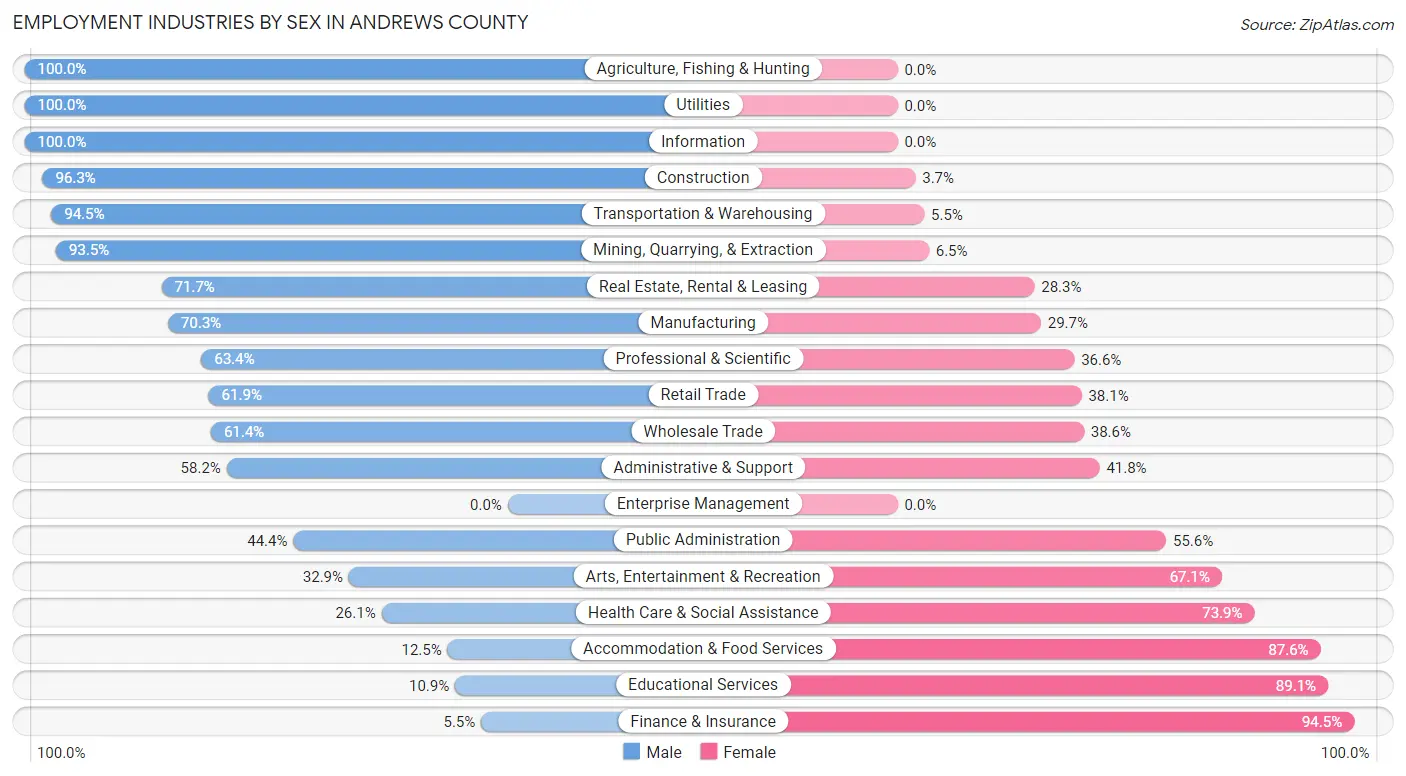
Employment Industries by Sex in Andrews County
The Andrews County industries that see more men than women are Agriculture, Fishing & Hunting (100.0%), Utilities (100.0%), and Information (100.0%), whereas the industries that tend to have a higher number of women are Finance & Insurance (94.5%), Educational Services (89.1%), and Accommodation & Food Services (87.5%).
| Industry | Male | Female |
| Agriculture, Fishing & Hunting | 167 (100.0%) | 0 (0.0%) |
| Mining, Quarrying, & Extraction | 1,714 (93.5%) | 119 (6.5%) |
| Construction | 547 (96.3%) | 21 (3.7%) |
| Manufacturing | 422 (70.3%) | 178 (29.7%) |
| Wholesale Trade | 207 (61.4%) | 130 (38.6%) |
| Retail Trade | 351 (61.9%) | 216 (38.1%) |
| Transportation & Warehousing | 478 (94.5%) | 28 (5.5%) |
| Utilities | 148 (100.0%) | 0 (0.0%) |
| Information | 141 (100.0%) | 0 (0.0%) |
| Finance & Insurance | 7 (5.5%) | 120 (94.5%) |
| Real Estate, Rental & Leasing | 43 (71.7%) | 17 (28.3%) |
| Professional & Scientific | 104 (63.4%) | 60 (36.6%) |
| Enterprise Management | 0 (0.0%) | 0 (0.0%) |
| Administrative & Support | 96 (58.2%) | 69 (41.8%) |
| Educational Services | 132 (10.9%) | 1,079 (89.1%) |
| Health Care & Social Assistance | 300 (26.1%) | 848 (73.9%) |
| Arts, Entertainment & Recreation | 48 (32.9%) | 98 (67.1%) |
| Accommodation & Food Services | 91 (12.4%) | 640 (87.5%) |
| Public Administration | 83 (44.4%) | 104 (55.6%) |
| Total | 5,286 (57.1%) | 3,978 (42.9%) |
Education in Andrews County
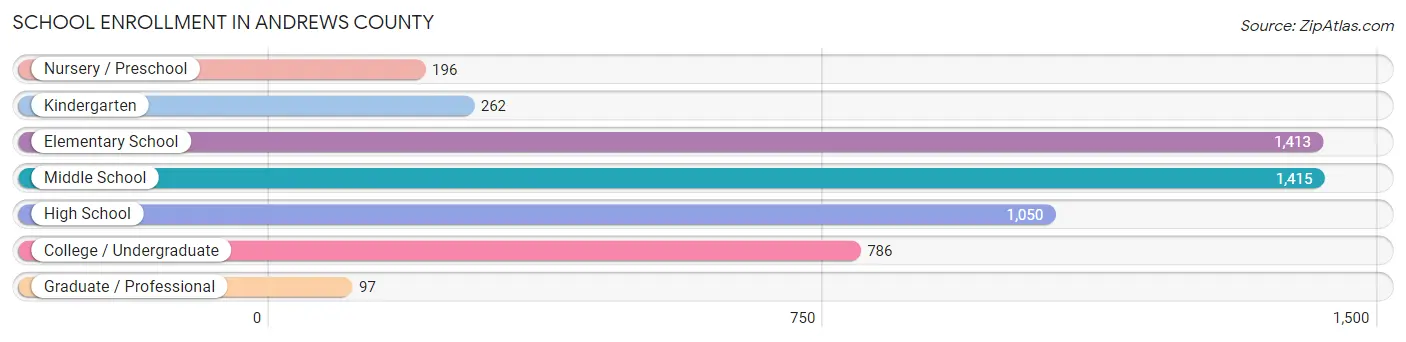
School Enrollment in Andrews County
The most common levels of schooling among the 5,219 students in Andrews County are middle school (1,415 | 27.1%), elementary school (1,413 | 27.1%), and high school (1,050 | 20.1%).
| School Level | # Students | % Students |
| Nursery / Preschool | 196 | 3.8% |
| Kindergarten | 262 | 5.0% |
| Elementary School | 1,413 | 27.1% |
| Middle School | 1,415 | 27.1% |
| High School | 1,050 | 20.1% |
| College / Undergraduate | 786 | 15.1% |
| Graduate / Professional | 97 | 1.9% |
| Total | 5,219 | 100.0% |
School Enrollment by Age by Funding Source in Andrews County
Out of a total of 5,219 students who are enrolled in schools in Andrews County, 438 (8.4%) attend a private institution, while the remaining 4,781 (91.6%) are enrolled in public schools. The age group of 3 to 4 year olds has the highest likelihood of being enrolled in private schools, with 60 (45.8% in the age bracket) enrolled. Conversely, the age group of 35 years and over has the lowest likelihood of being enrolled in a private school, with 350 (100.0% in the age bracket) attending a public institution.
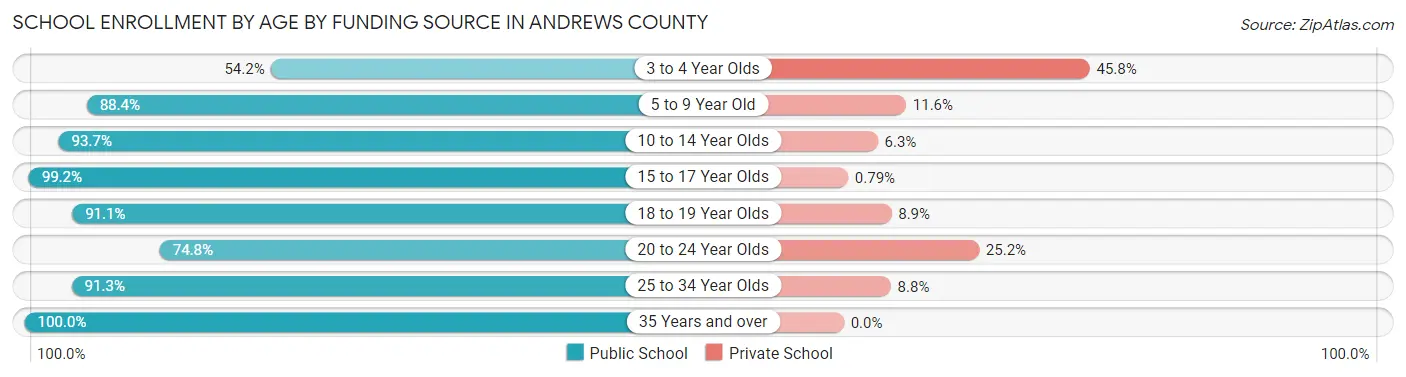
| Age Bracket | Public School | Private School |
| 3 to 4 Year Olds | 71 (54.2%) | 60 (45.8%) |
| 5 to 9 Year Old | 1,481 (88.4%) | 194 (11.6%) |
| 10 to 14 Year Olds | 1,422 (93.7%) | 96 (6.3%) |
| 15 to 17 Year Olds | 884 (99.2%) | 7 (0.8%) |
| 18 to 19 Year Olds | 185 (91.1%) | 18 (8.9%) |
| 20 to 24 Year Olds | 98 (74.8%) | 33 (25.2%) |
| 25 to 34 Year Olds | 292 (91.2%) | 28 (8.7%) |
| 35 Years and over | 350 (100.0%) | 0 (0.0%) |
| Total | 4,781 (91.6%) | 438 (8.4%) |
Educational Attainment by Field of Study in Andrews County
Education (508 | 20.9%), arts & humanities (437 | 18.0%), science & technology (322 | 13.3%), bio, nature & agricultural (270 | 11.1%), and business (158 | 6.5%) are the most common fields of study among 2,427 individuals in Andrews County who have obtained a bachelor's degree or higher.
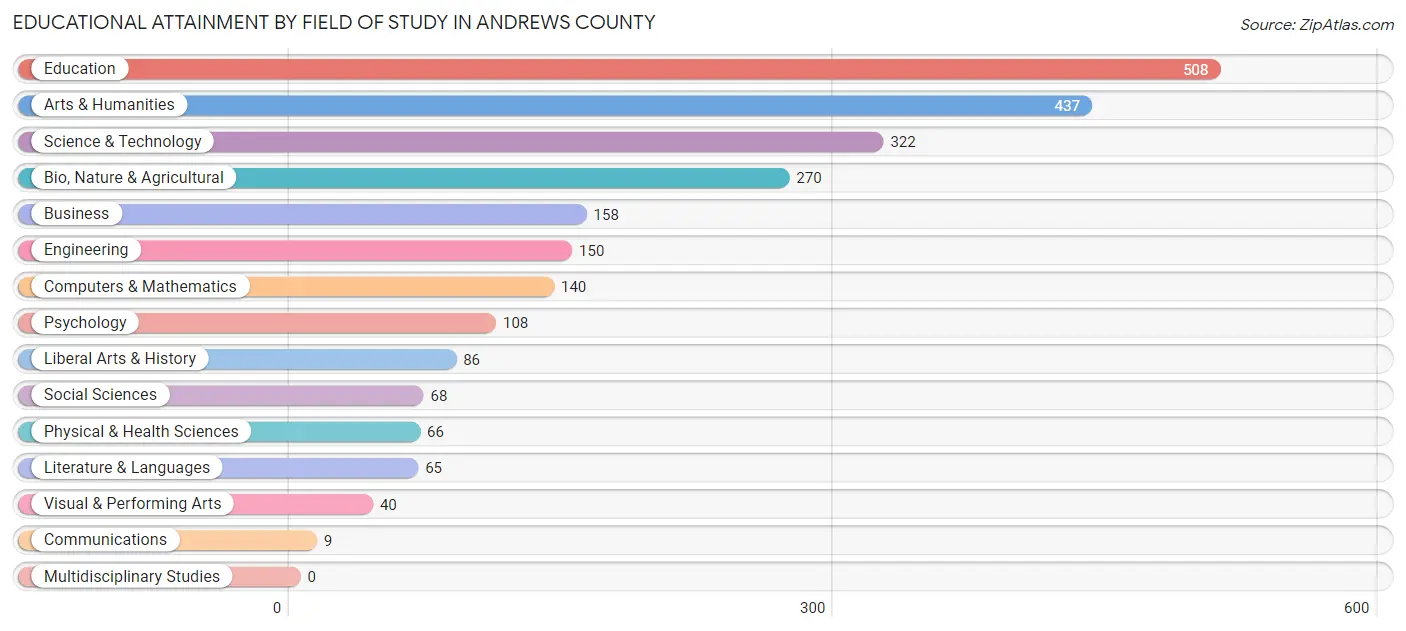
| Field of Study | # Graduates | % Graduates |
| Computers & Mathematics | 140 | 5.8% |
| Bio, Nature & Agricultural | 270 | 11.1% |
| Physical & Health Sciences | 66 | 2.7% |
| Psychology | 108 | 4.4% |
| Social Sciences | 68 | 2.8% |
| Engineering | 150 | 6.2% |
| Multidisciplinary Studies | 0 | 0.0% |
| Science & Technology | 322 | 13.3% |
| Business | 158 | 6.5% |
| Education | 508 | 20.9% |
| Literature & Languages | 65 | 2.7% |
| Liberal Arts & History | 86 | 3.5% |
| Visual & Performing Arts | 40 | 1.7% |
| Communications | 9 | 0.4% |
| Arts & Humanities | 437 | 18.0% |
| Total | 2,427 | 100.0% |
Transportation & Commute in Andrews County
Vehicle Availability by Sex in Andrews County
The most prevalent vehicle ownership categories in Andrews County are males with 2 vehicles (2,152, accounting for 41.3%) and females with 2 vehicles (1,154, making up 56.6%).
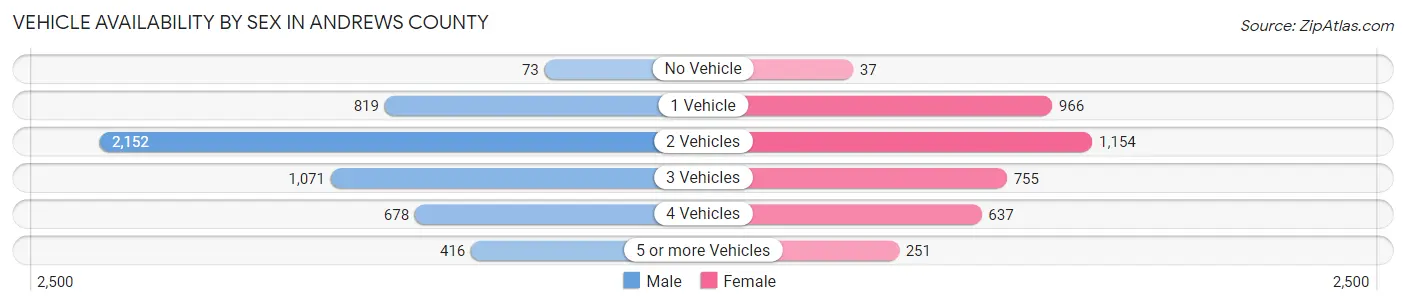
| Vehicles Available | Male | Female |
| No Vehicle | 73 (1.4%) | 37 (1.0%) |
| 1 Vehicle | 819 (15.7%) | 966 (25.4%) |
| 2 Vehicles | 2,152 (41.3%) | 1,154 (30.4%) |
| 3 Vehicles | 1,071 (20.6%) | 755 (19.9%) |
| 4 Vehicles | 678 (13.0%) | 637 (16.8%) |
| 5 or more Vehicles | 416 (8.0%) | 251 (6.6%) |
| Total | 5,209 (100.0%) | 3,800 (100.0%) |
Commute Time in Andrews County
The most frequently occuring commute durations in Andrews County are 5 to 9 minutes (1,744 commuters, 19.9%), 10 to 14 minutes (1,715 commuters, 19.5%), and less than 5 minutes (1,080 commuters, 12.3%).
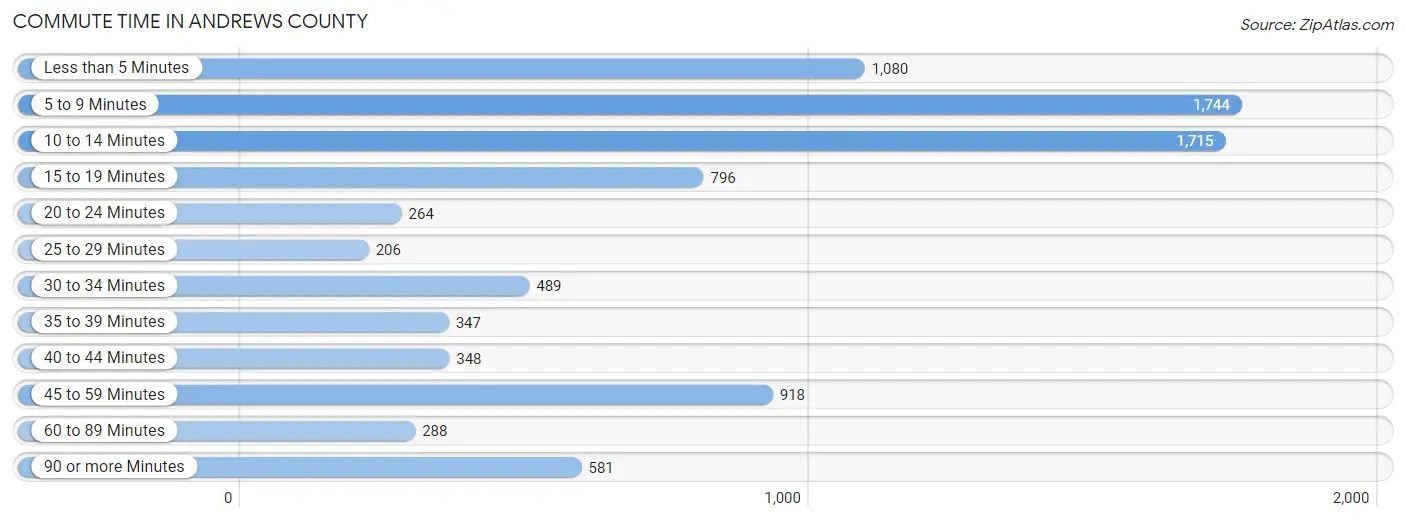
| Commute Time | # Commuters | % Commuters |
| Less than 5 Minutes | 1,080 | 12.3% |
| 5 to 9 Minutes | 1,744 | 19.9% |
| 10 to 14 Minutes | 1,715 | 19.5% |
| 15 to 19 Minutes | 796 | 9.1% |
| 20 to 24 Minutes | 264 | 3.0% |
| 25 to 29 Minutes | 206 | 2.4% |
| 30 to 34 Minutes | 489 | 5.6% |
| 35 to 39 Minutes | 347 | 4.0% |
| 40 to 44 Minutes | 348 | 4.0% |
| 45 to 59 Minutes | 918 | 10.5% |
| 60 to 89 Minutes | 288 | 3.3% |
| 90 or more Minutes | 581 | 6.6% |
Commute Time by Sex in Andrews County
The most common commute times in Andrews County are 10 to 14 minutes (923 commuters, 18.3%) for males and 5 to 9 minutes (943 commuters, 25.2%) for females.
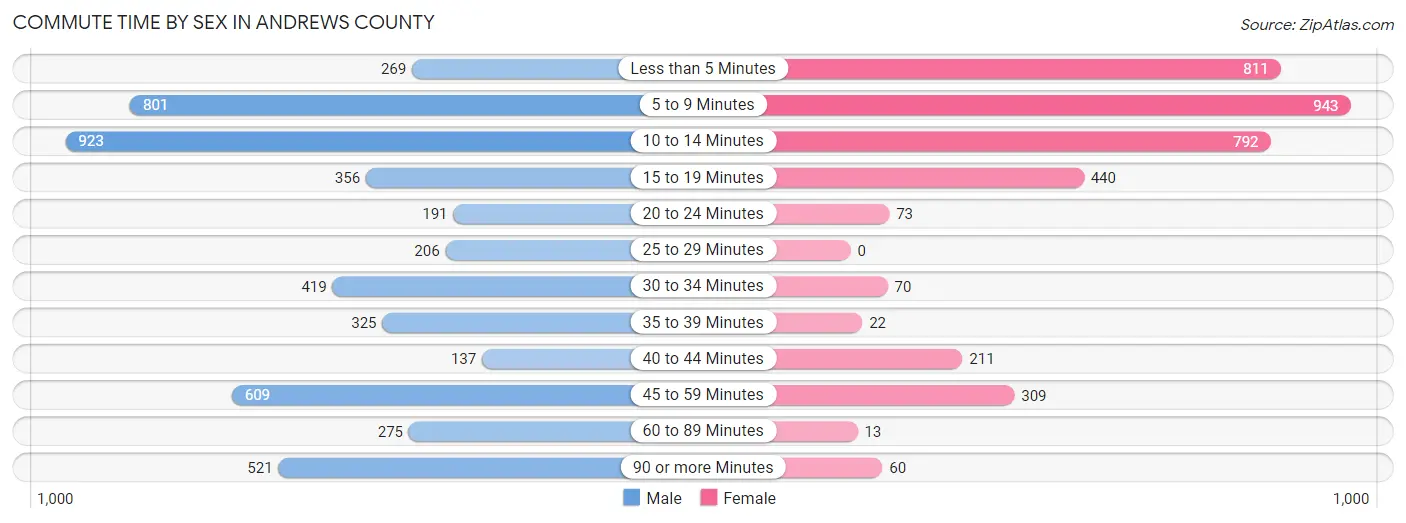
| Commute Time | Male | Female |
| Less than 5 Minutes | 269 (5.3%) | 811 (21.7%) |
| 5 to 9 Minutes | 801 (15.9%) | 943 (25.2%) |
| 10 to 14 Minutes | 923 (18.3%) | 792 (21.1%) |
| 15 to 19 Minutes | 356 (7.1%) | 440 (11.7%) |
| 20 to 24 Minutes | 191 (3.8%) | 73 (1.9%) |
| 25 to 29 Minutes | 206 (4.1%) | 0 (0.0%) |
| 30 to 34 Minutes | 419 (8.3%) | 70 (1.9%) |
| 35 to 39 Minutes | 325 (6.5%) | 22 (0.6%) |
| 40 to 44 Minutes | 137 (2.7%) | 211 (5.6%) |
| 45 to 59 Minutes | 609 (12.1%) | 309 (8.3%) |
| 60 to 89 Minutes | 275 (5.5%) | 13 (0.4%) |
| 90 or more Minutes | 521 (10.3%) | 60 (1.6%) |
Time of Departure to Work by Sex in Andrews County
The most frequent times of departure to work in Andrews County are 7:00 AM to 7:29 AM (1,043, 20.7%) for males and 7:30 AM to 7:59 AM (859, 22.9%) for females.
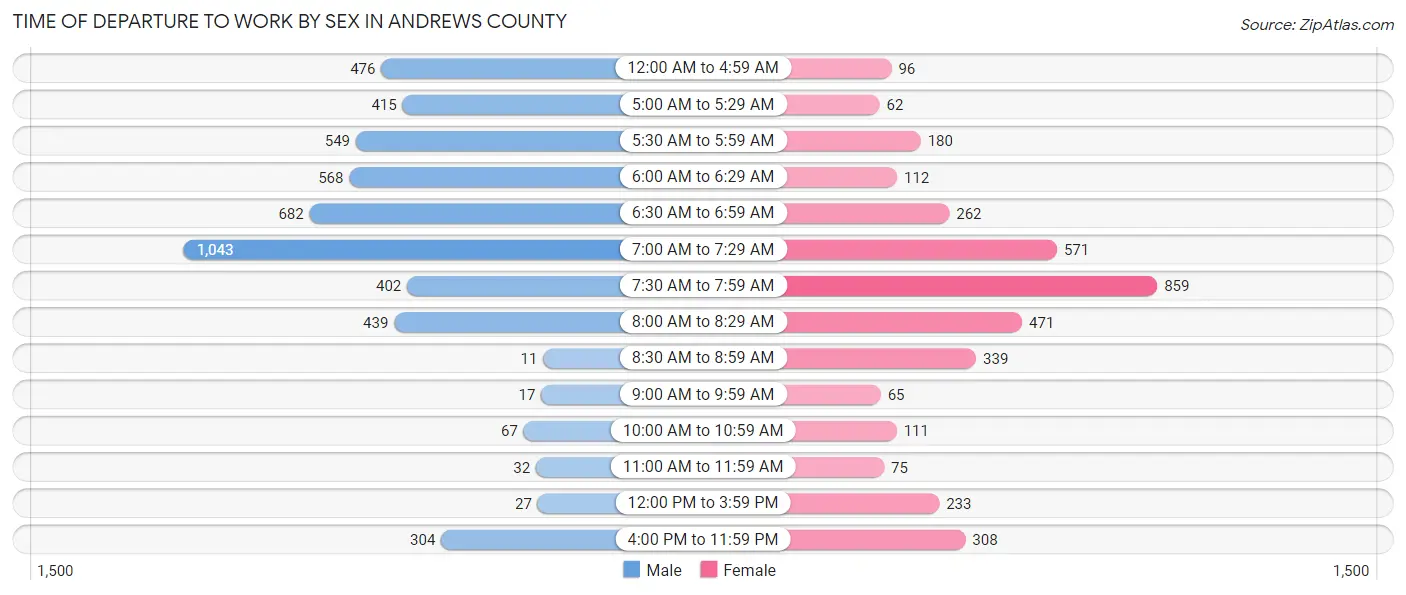
| Time of Departure | Male | Female |
| 12:00 AM to 4:59 AM | 476 (9.5%) | 96 (2.6%) |
| 5:00 AM to 5:29 AM | 415 (8.3%) | 62 (1.7%) |
| 5:30 AM to 5:59 AM | 549 (10.9%) | 180 (4.8%) |
| 6:00 AM to 6:29 AM | 568 (11.3%) | 112 (3.0%) |
| 6:30 AM to 6:59 AM | 682 (13.6%) | 262 (7.0%) |
| 7:00 AM to 7:29 AM | 1,043 (20.7%) | 571 (15.2%) |
| 7:30 AM to 7:59 AM | 402 (8.0%) | 859 (22.9%) |
| 8:00 AM to 8:29 AM | 439 (8.7%) | 471 (12.6%) |
| 8:30 AM to 8:59 AM | 11 (0.2%) | 339 (9.0%) |
| 9:00 AM to 9:59 AM | 17 (0.3%) | 65 (1.7%) |
| 10:00 AM to 10:59 AM | 67 (1.3%) | 111 (3.0%) |
| 11:00 AM to 11:59 AM | 32 (0.6%) | 75 (2.0%) |
| 12:00 PM to 3:59 PM | 27 (0.5%) | 233 (6.2%) |
| 4:00 PM to 11:59 PM | 304 (6.0%) | 308 (8.2%) |
| Total | 5,032 (100.0%) | 3,744 (100.0%) |
Housing Occupancy in Andrews County
Occupancy by Ownership in Andrews County
Of the total 6,603 dwellings in Andrews County, owner-occupied units account for 4,789 (72.5%), while renter-occupied units make up 1,814 (27.5%).
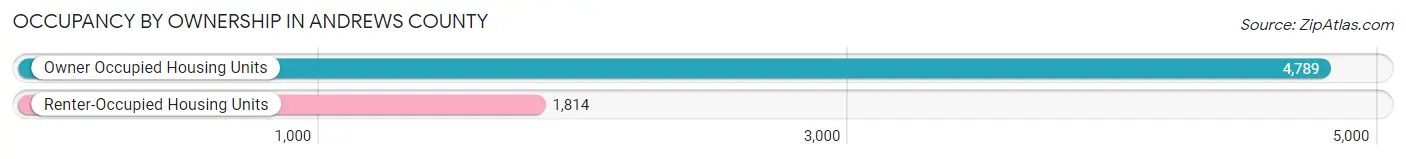
| Occupancy | # Housing Units | % Housing Units |
| Owner Occupied Housing Units | 4,789 | 72.5% |
| Renter-Occupied Housing Units | 1,814 | 27.5% |
| Total Occupied Housing Units | 6,603 | 100.0% |
Occupancy by Household Size in Andrews County
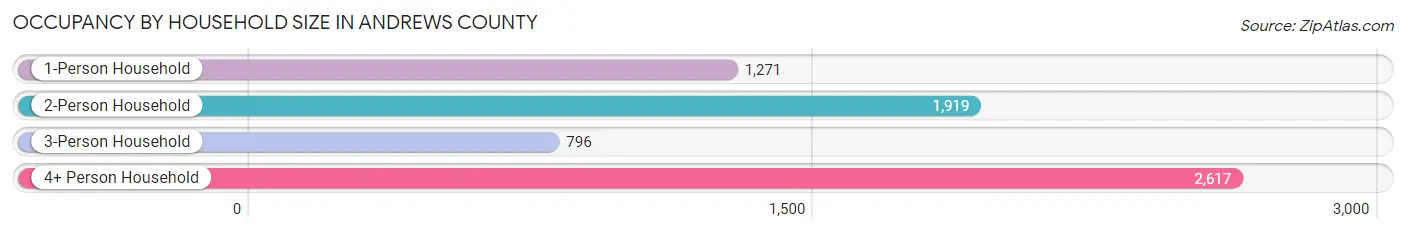
| Household Size | # Housing Units | % Housing Units |
| 1-Person Household | 1,271 | 19.3% |
| 2-Person Household | 1,919 | 29.1% |
| 3-Person Household | 796 | 12.1% |
| 4+ Person Household | 2,617 | 39.6% |
| Total Housing Units | 6,603 | 100.0% |
Occupancy by Ownership by Household Size in Andrews County
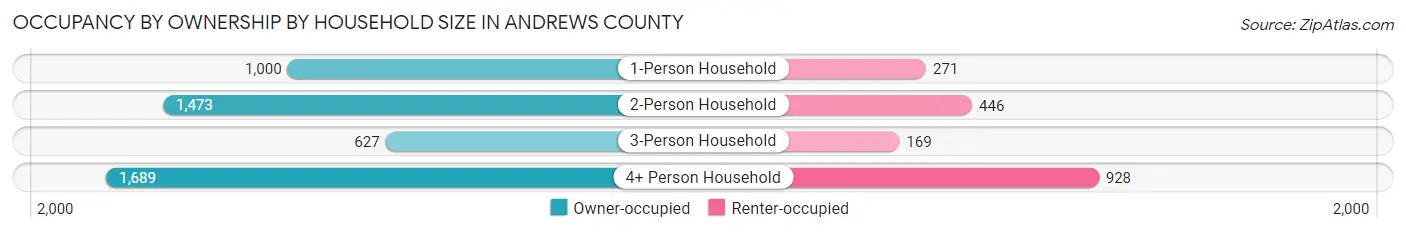
| Household Size | Owner-occupied | Renter-occupied |
| 1-Person Household | 1,000 (78.7%) | 271 (21.3%) |
| 2-Person Household | 1,473 (76.8%) | 446 (23.2%) |
| 3-Person Household | 627 (78.8%) | 169 (21.2%) |
| 4+ Person Household | 1,689 (64.5%) | 928 (35.5%) |
| Total Housing Units | 4,789 (72.5%) | 1,814 (27.5%) |
Occupancy by Educational Attainment in Andrews County
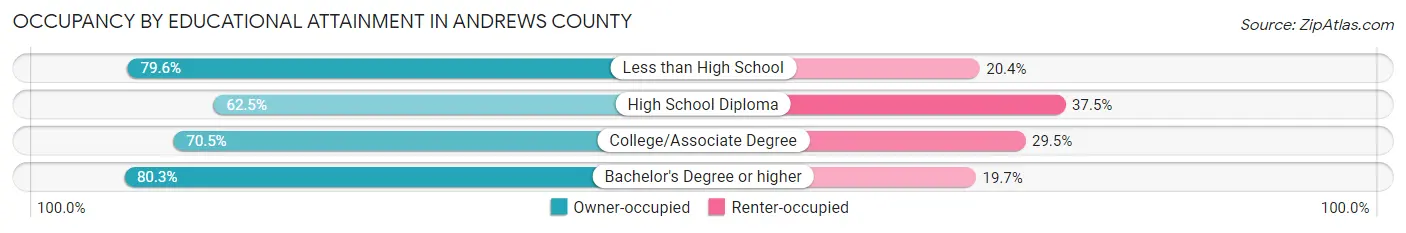
| Household Size | Owner-occupied | Renter-occupied |
| Less than High School | 1,312 (79.6%) | 337 (20.4%) |
| High School Diploma | 1,170 (62.5%) | 701 (37.5%) |
| College/Associate Degree | 1,211 (70.5%) | 507 (29.5%) |
| Bachelor's Degree or higher | 1,096 (80.3%) | 269 (19.7%) |
Occupancy by Age of Householder in Andrews County
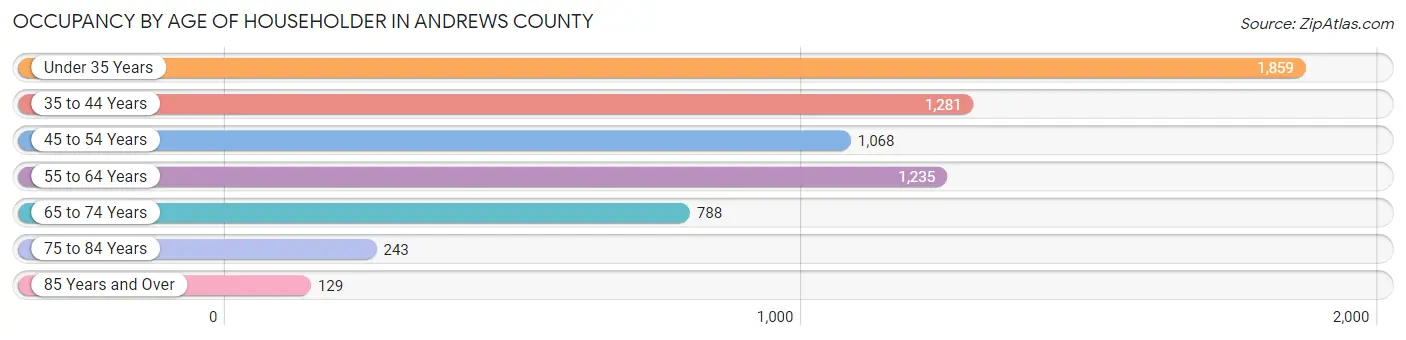
| Age Bracket | # Households | % Households |
| Under 35 Years | 1,859 | 28.1% |
| 35 to 44 Years | 1,281 | 19.4% |
| 45 to 54 Years | 1,068 | 16.2% |
| 55 to 64 Years | 1,235 | 18.7% |
| 65 to 74 Years | 788 | 11.9% |
| 75 to 84 Years | 243 | 3.7% |
| 85 Years and Over | 129 | 1.9% |
| Total | 6,603 | 100.0% |
Housing Finances in Andrews County
Median Income by Occupancy in Andrews County
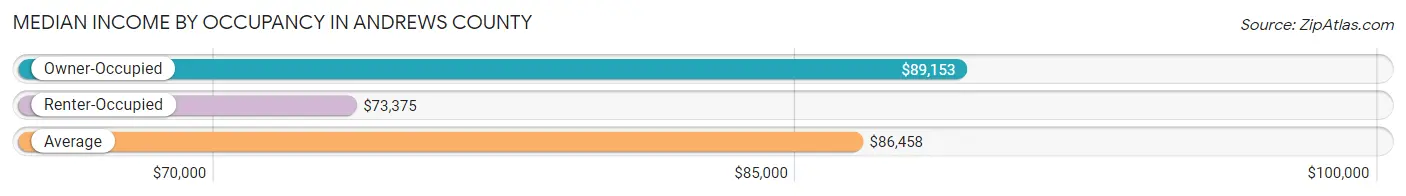
| Occupancy Type | # Households | Median Income |
| Owner-Occupied | 4,789 (72.5%) | $89,153 |
| Renter-Occupied | 1,814 (27.5%) | $73,375 |
| Average | 6,603 (100.0%) | $86,458 |
Occupancy by Householder Income Bracket in Andrews County
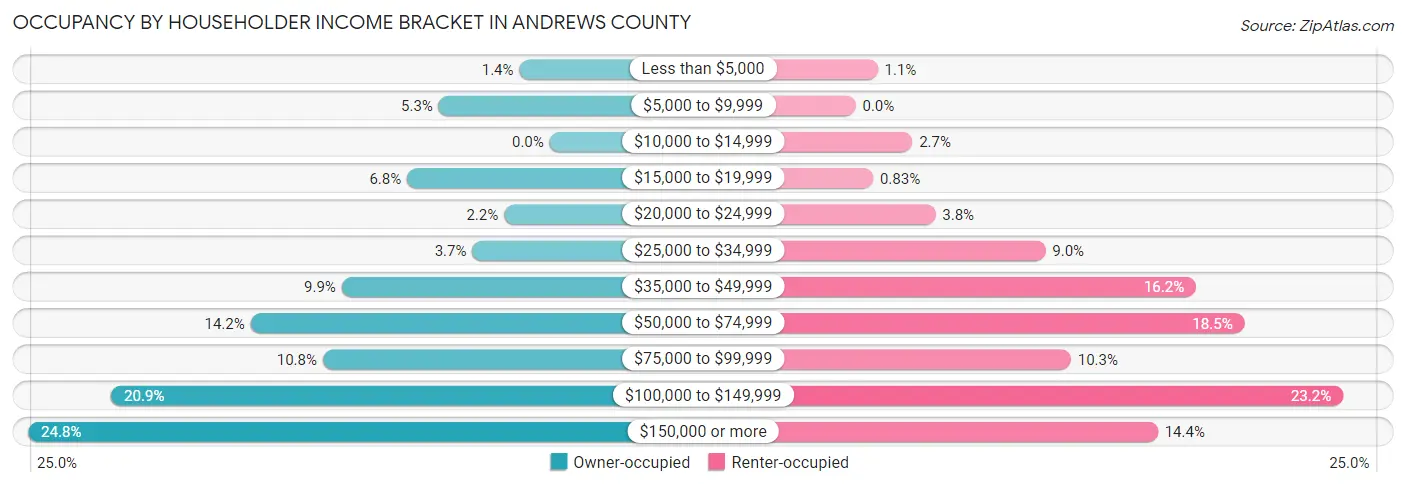
| Income Bracket | Owner-occupied | Renter-occupied |
| Less than $5,000 | 69 (1.4%) | 19 (1.1%) |
| $5,000 to $9,999 | 253 (5.3%) | 0 (0.0%) |
| $10,000 to $14,999 | 0 (0.0%) | 49 (2.7%) |
| $15,000 to $19,999 | 325 (6.8%) | 15 (0.8%) |
| $20,000 to $24,999 | 104 (2.2%) | 69 (3.8%) |
| $25,000 to $34,999 | 176 (3.7%) | 164 (9.0%) |
| $35,000 to $49,999 | 474 (9.9%) | 294 (16.2%) |
| $50,000 to $74,999 | 682 (14.2%) | 336 (18.5%) |
| $75,000 to $99,999 | 517 (10.8%) | 186 (10.2%) |
| $100,000 to $149,999 | 1,000 (20.9%) | 421 (23.2%) |
| $150,000 or more | 1,189 (24.8%) | 261 (14.4%) |
| Total | 4,789 (100.0%) | 1,814 (100.0%) |
Monthly Housing Cost Tiers in Andrews County
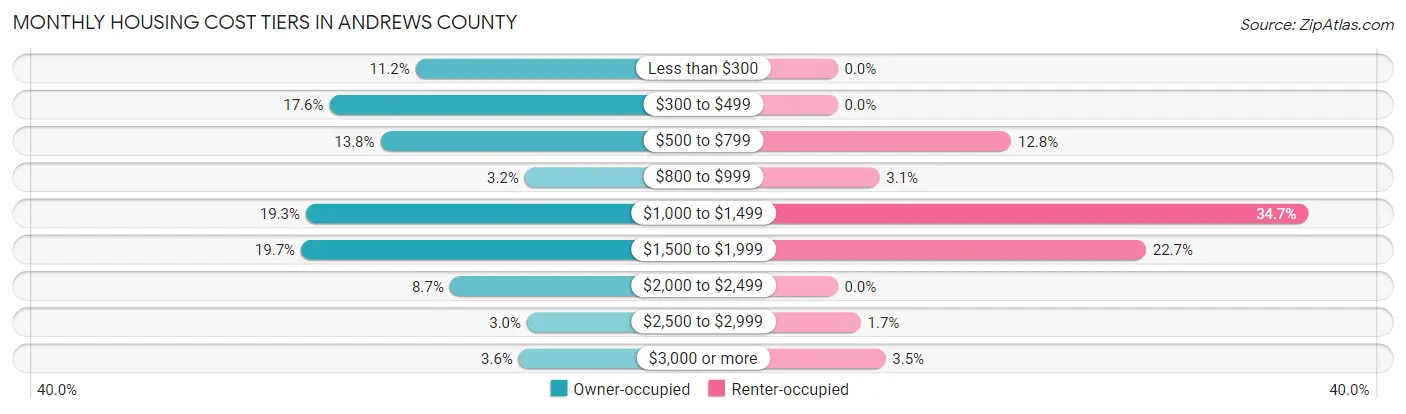
| Monthly Cost | Owner-occupied | Renter-occupied |
| Less than $300 | 537 (11.2%) | 0 (0.0%) |
| $300 to $499 | 841 (17.6%) | 0 (0.0%) |
| $500 to $799 | 661 (13.8%) | 232 (12.8%) |
| $800 to $999 | 152 (3.2%) | 56 (3.1%) |
| $1,000 to $1,499 | 924 (19.3%) | 629 (34.7%) |
| $1,500 to $1,999 | 941 (19.7%) | 412 (22.7%) |
| $2,000 to $2,499 | 416 (8.7%) | 0 (0.0%) |
| $2,500 to $2,999 | 144 (3.0%) | 31 (1.7%) |
| $3,000 or more | 173 (3.6%) | 64 (3.5%) |
| Total | 4,789 (100.0%) | 1,814 (100.0%) |
Physical Housing Characteristics in Andrews County
Housing Structures in Andrews County
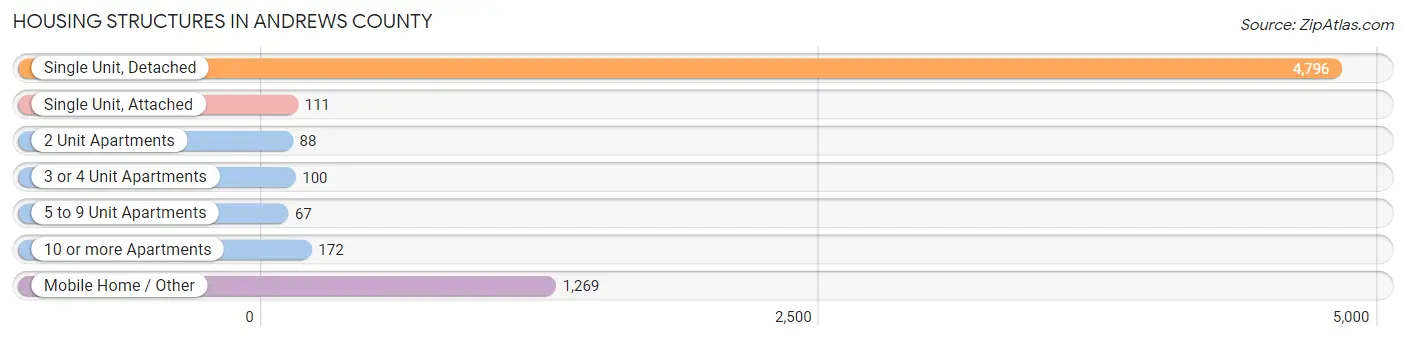
| Structure Type | # Housing Units | % Housing Units |
| Single Unit, Detached | 4,796 | 72.6% |
| Single Unit, Attached | 111 | 1.7% |
| 2 Unit Apartments | 88 | 1.3% |
| 3 or 4 Unit Apartments | 100 | 1.5% |
| 5 to 9 Unit Apartments | 67 | 1.0% |
| 10 or more Apartments | 172 | 2.6% |
| Mobile Home / Other | 1,269 | 19.2% |
| Total | 6,603 | 100.0% |
Housing Structures by Occupancy in Andrews County
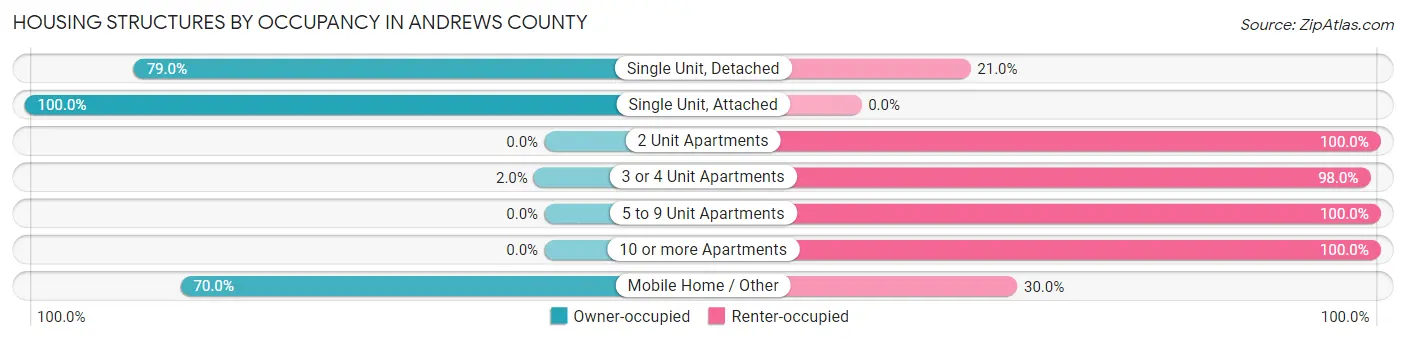
| Structure Type | Owner-occupied | Renter-occupied |
| Single Unit, Detached | 3,788 (79.0%) | 1,008 (21.0%) |
| Single Unit, Attached | 111 (100.0%) | 0 (0.0%) |
| 2 Unit Apartments | 0 (0.0%) | 88 (100.0%) |
| 3 or 4 Unit Apartments | 2 (2.0%) | 98 (98.0%) |
| 5 to 9 Unit Apartments | 0 (0.0%) | 67 (100.0%) |
| 10 or more Apartments | 0 (0.0%) | 172 (100.0%) |
| Mobile Home / Other | 888 (70.0%) | 381 (30.0%) |
| Total | 4,789 (72.5%) | 1,814 (27.5%) |
Housing Structures by Number of Rooms in Andrews County
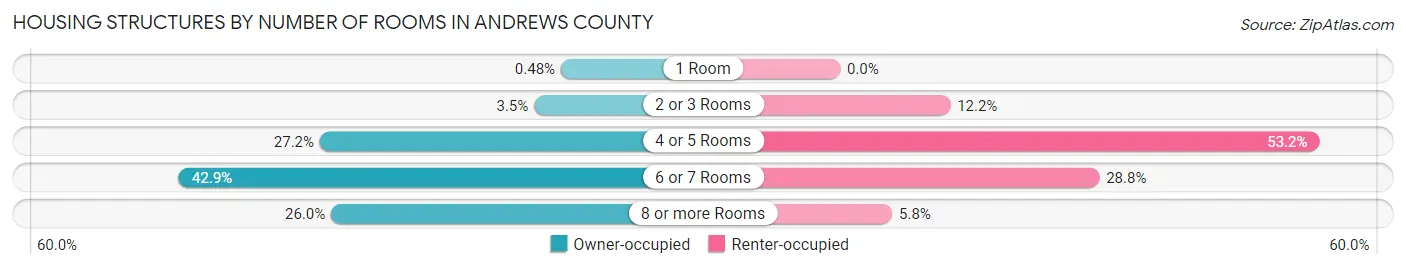
| Number of Rooms | Owner-occupied | Renter-occupied |
| 1 Room | 23 (0.5%) | 0 (0.0%) |
| 2 or 3 Rooms | 165 (3.5%) | 222 (12.2%) |
| 4 or 5 Rooms | 1,304 (27.2%) | 965 (53.2%) |
| 6 or 7 Rooms | 2,053 (42.9%) | 522 (28.8%) |
| 8 or more Rooms | 1,244 (26.0%) | 105 (5.8%) |
| Total | 4,789 (100.0%) | 1,814 (100.0%) |
Housing Structure by Heating Type in Andrews County
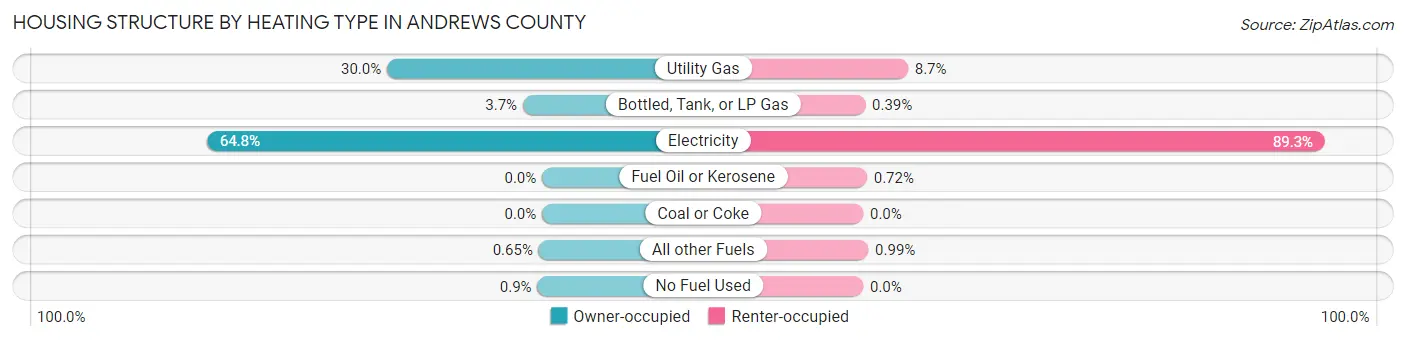
| Heating Type | Owner-occupied | Renter-occupied |
| Utility Gas | 1,435 (30.0%) | 157 (8.6%) |
| Bottled, Tank, or LP Gas | 177 (3.7%) | 7 (0.4%) |
| Electricity | 3,103 (64.8%) | 1,619 (89.2%) |
| Fuel Oil or Kerosene | 0 (0.0%) | 13 (0.7%) |
| Coal or Coke | 0 (0.0%) | 0 (0.0%) |
| All other Fuels | 31 (0.6%) | 18 (1.0%) |
| No Fuel Used | 43 (0.9%) | 0 (0.0%) |
| Total | 4,789 (100.0%) | 1,814 (100.0%) |
Household Vehicle Usage in Andrews County
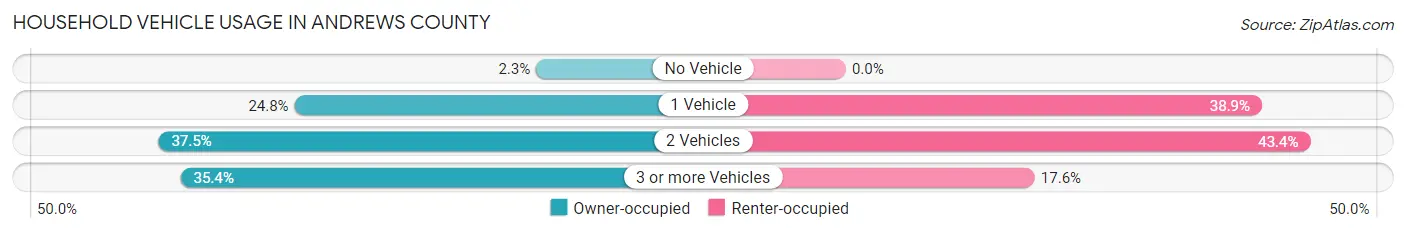
| Vehicles per Household | Owner-occupied | Renter-occupied |
| No Vehicle | 108 (2.3%) | 0 (0.0%) |
| 1 Vehicle | 1,188 (24.8%) | 706 (38.9%) |
| 2 Vehicles | 1,796 (37.5%) | 788 (43.4%) |
| 3 or more Vehicles | 1,697 (35.4%) | 320 (17.6%) |
| Total | 4,789 (100.0%) | 1,814 (100.0%) |
Real Estate & Mortgages in Andrews County
Real Estate and Mortgage Overview in Andrews County
| Characteristic | Without Mortgage | With Mortgage |
| Housing Units | 2,471 | 2,318 |
| Median Property Value | $131,700 | $197,500 |
| Median Household Income | $69,135 | $683 |
| Monthly Housing Costs | $464 | $171 |
| Real Estate Taxes | $1,504 | $107 |
Property Value by Mortgage Status in Andrews County
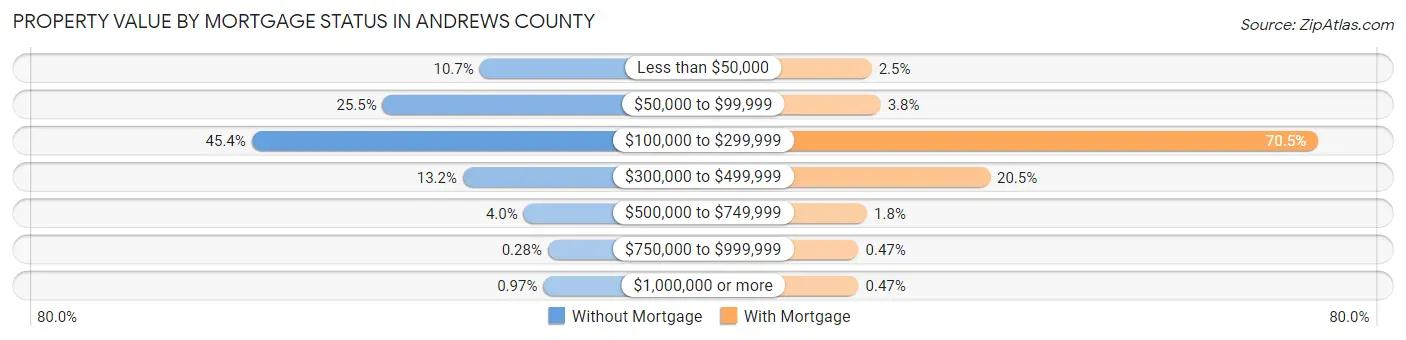
| Property Value | Without Mortgage | With Mortgage |
| Less than $50,000 | 264 (10.7%) | 57 (2.5%) |
| $50,000 to $99,999 | 629 (25.5%) | 89 (3.8%) |
| $100,000 to $299,999 | 1,122 (45.4%) | 1,634 (70.5%) |
| $300,000 to $499,999 | 327 (13.2%) | 475 (20.5%) |
| $500,000 to $749,999 | 98 (4.0%) | 41 (1.8%) |
| $750,000 to $999,999 | 7 (0.3%) | 11 (0.5%) |
| $1,000,000 or more | 24 (1.0%) | 11 (0.5%) |
| Total | 2,471 (100.0%) | 2,318 (100.0%) |
Household Income by Mortgage Status in Andrews County
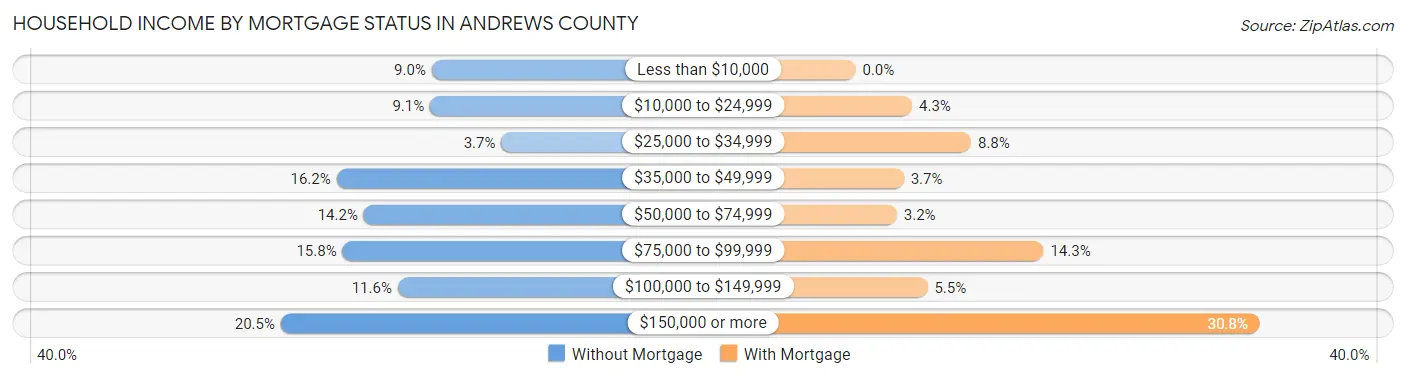
| Household Income | Without Mortgage | With Mortgage |
| Less than $10,000 | 222 (9.0%) | 0 (0.0%) |
| $10,000 to $24,999 | 225 (9.1%) | 100 (4.3%) |
| $25,000 to $34,999 | 91 (3.7%) | 204 (8.8%) |
| $35,000 to $49,999 | 401 (16.2%) | 85 (3.7%) |
| $50,000 to $74,999 | 350 (14.2%) | 73 (3.2%) |
| $75,000 to $99,999 | 390 (15.8%) | 332 (14.3%) |
| $100,000 to $149,999 | 286 (11.6%) | 127 (5.5%) |
| $150,000 or more | 506 (20.5%) | 714 (30.8%) |
| Total | 2,471 (100.0%) | 2,318 (100.0%) |
Property Value to Household Income Ratio in Andrews County
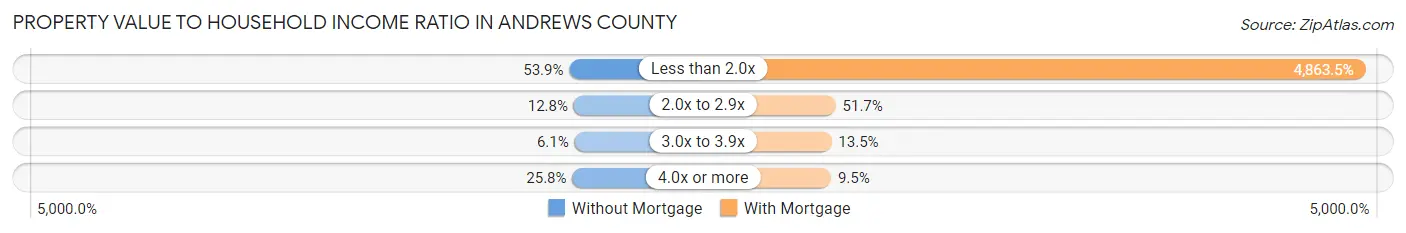
| Value-to-Income Ratio | Without Mortgage | With Mortgage |
| Less than 2.0x | 1,331 (53.9%) | 112,736 (4,863.5%) |
| 2.0x to 2.9x | 316 (12.8%) | 1,199 (51.7%) |
| 3.0x to 3.9x | 150 (6.1%) | 312 (13.5%) |
| 4.0x or more | 638 (25.8%) | 219 (9.5%) |
| Total | 2,471 (100.0%) | 2,318 (100.0%) |
Real Estate Taxes by Mortgage Status in Andrews County
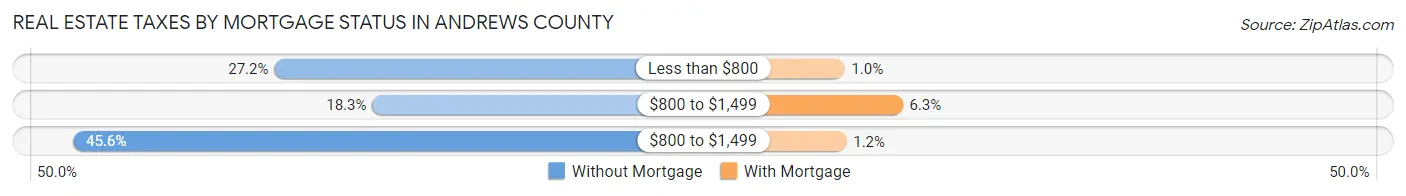
| Property Taxes | Without Mortgage | With Mortgage |
| Less than $800 | 672 (27.2%) | 24 (1.0%) |
| $800 to $1,499 | 451 (18.2%) | 147 (6.3%) |
| $800 to $1,499 | 1,126 (45.6%) | 28 (1.2%) |
| Total | 2,471 (100.0%) | 2,318 (100.0%) |
Health & Disability in Andrews County
Health Insurance Coverage by Age in Andrews County
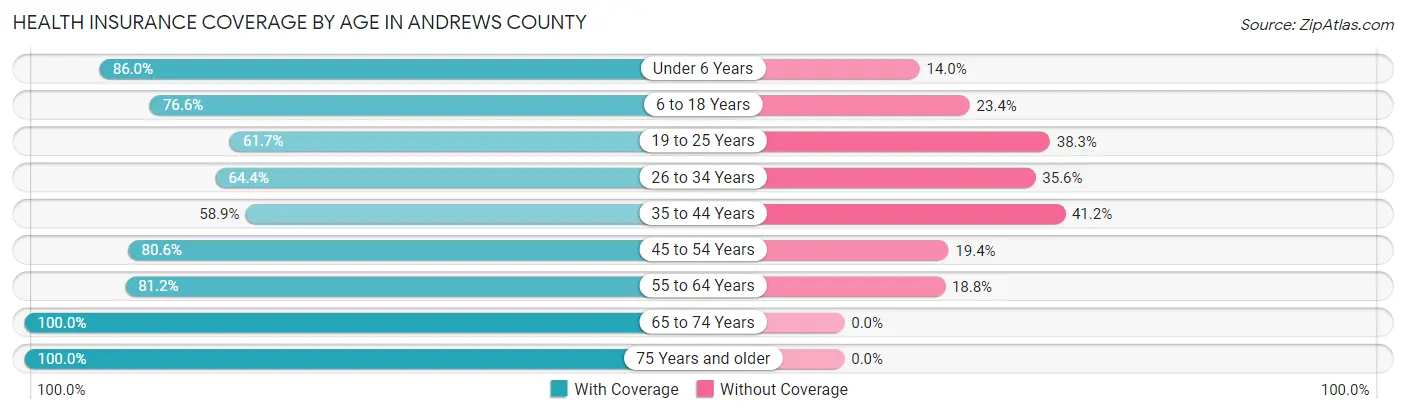
| Age Bracket | With Coverage | Without Coverage |
| Under 6 Years | 1,446 (86.0%) | 236 (14.0%) |
| 6 to 18 Years | 3,140 (76.6%) | 958 (23.4%) |
| 19 to 25 Years | 1,173 (61.7%) | 729 (38.3%) |
| 26 to 34 Years | 1,460 (64.4%) | 808 (35.6%) |
| 35 to 44 Years | 1,447 (58.9%) | 1,012 (41.1%) |
| 45 to 54 Years | 1,673 (80.6%) | 403 (19.4%) |
| 55 to 64 Years | 1,675 (81.2%) | 387 (18.8%) |
| 65 to 74 Years | 1,155 (100.0%) | 0 (0.0%) |
| 75 Years and older | 528 (100.0%) | 0 (0.0%) |
| Total | 13,697 (75.1%) | 4,533 (24.9%) |
Health Insurance Coverage by Citizenship Status in Andrews County
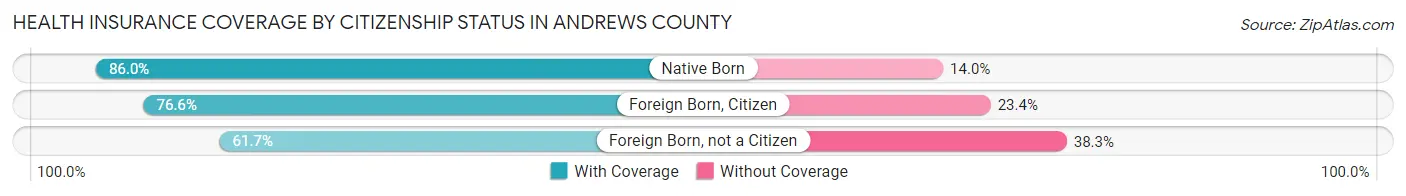
| Citizenship Status | With Coverage | Without Coverage |
| Native Born | 1,446 (86.0%) | 236 (14.0%) |
| Foreign Born, Citizen | 3,140 (76.6%) | 958 (23.4%) |
| Foreign Born, not a Citizen | 1,173 (61.7%) | 729 (38.3%) |
Health Insurance Coverage by Household Income in Andrews County
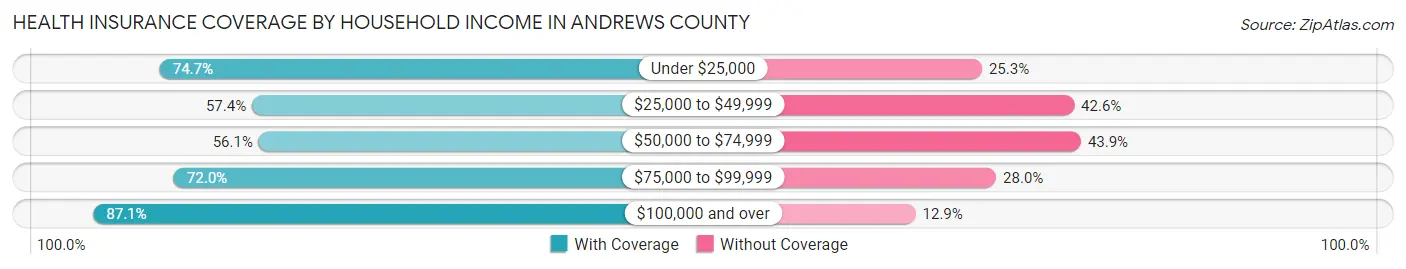
| Household Income | With Coverage | Without Coverage |
| Under $25,000 | 1,459 (74.7%) | 495 (25.3%) |
| $25,000 to $49,999 | 1,610 (57.4%) | 1,195 (42.6%) |
| $50,000 to $74,999 | 1,415 (56.1%) | 1,106 (43.9%) |
| $75,000 to $99,999 | 1,537 (72.0%) | 597 (28.0%) |
| $100,000 and over | 7,676 (87.1%) | 1,136 (12.9%) |
Public vs Private Health Insurance Coverage by Age in Andrews County
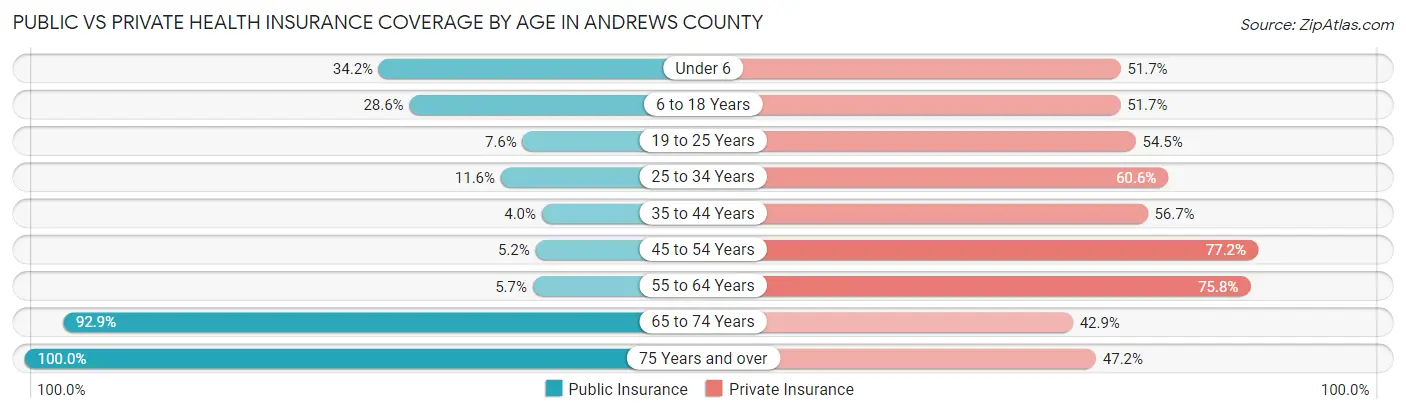
| Age Bracket | Public Insurance | Private Insurance |
| Under 6 | 576 (34.2%) | 870 (51.7%) |
| 6 to 18 Years | 1,171 (28.6%) | 2,118 (51.7%) |
| 19 to 25 Years | 144 (7.6%) | 1,037 (54.5%) |
| 25 to 34 Years | 263 (11.6%) | 1,374 (60.6%) |
| 35 to 44 Years | 98 (4.0%) | 1,395 (56.7%) |
| 45 to 54 Years | 107 (5.1%) | 1,603 (77.2%) |
| 55 to 64 Years | 117 (5.7%) | 1,563 (75.8%) |
| 65 to 74 Years | 1,073 (92.9%) | 495 (42.9%) |
| 75 Years and over | 528 (100.0%) | 249 (47.2%) |
| Total | 4,077 (22.4%) | 10,704 (58.7%) |
Disability Status by Sex by Age in Andrews County
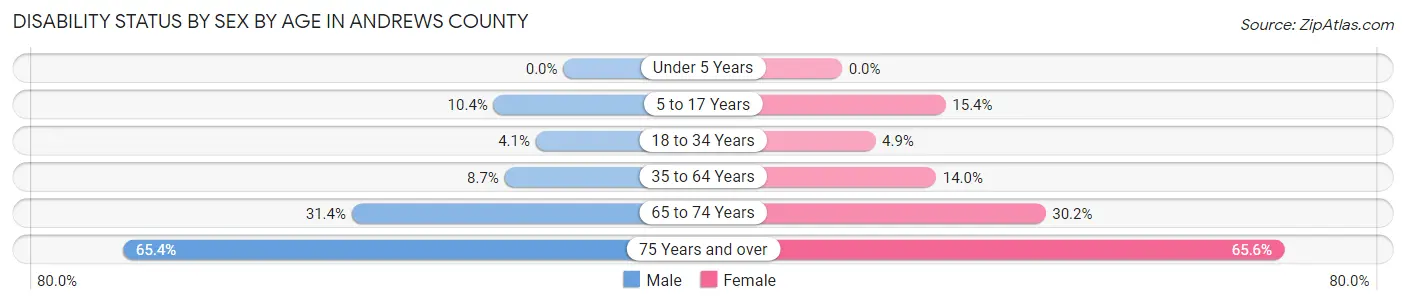
| Age Bracket | Male | Female |
| Under 5 Years | 0 (0.0%) | 0 (0.0%) |
| 5 to 17 Years | 220 (10.3%) | 307 (15.4%) |
| 18 to 34 Years | 91 (4.1%) | 104 (4.9%) |
| 35 to 64 Years | 285 (8.7%) | 464 (14.0%) |
| 65 to 74 Years | 181 (31.4%) | 175 (30.2%) |
| 75 Years and over | 155 (65.4%) | 191 (65.6%) |
Disability Class by Sex by Age in Andrews County
Disability Class: Hearing Difficulty
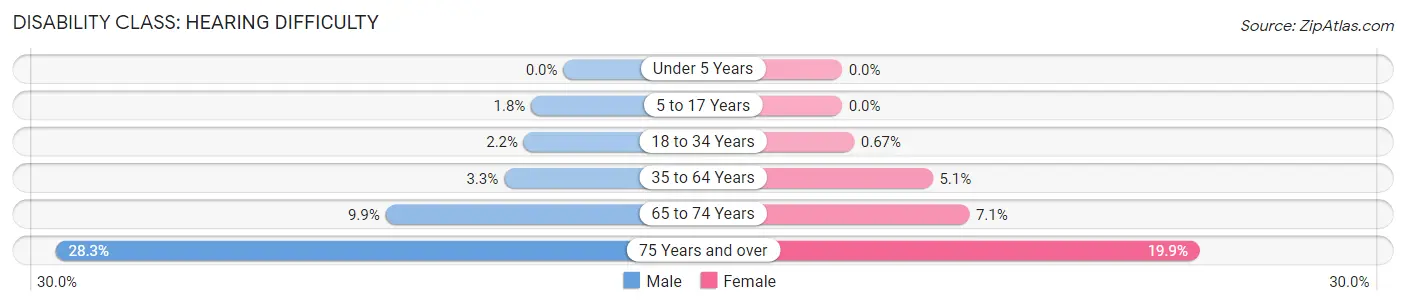
| Age Bracket | Male | Female |
| Under 5 Years | 0 (0.0%) | 0 (0.0%) |
| 5 to 17 Years | 38 (1.8%) | 0 (0.0%) |
| 18 to 34 Years | 49 (2.2%) | 14 (0.7%) |
| 35 to 64 Years | 108 (3.3%) | 168 (5.1%) |
| 65 to 74 Years | 57 (9.9%) | 41 (7.1%) |
| 75 Years and over | 67 (28.3%) | 58 (19.9%) |
Disability Class: Vision Difficulty
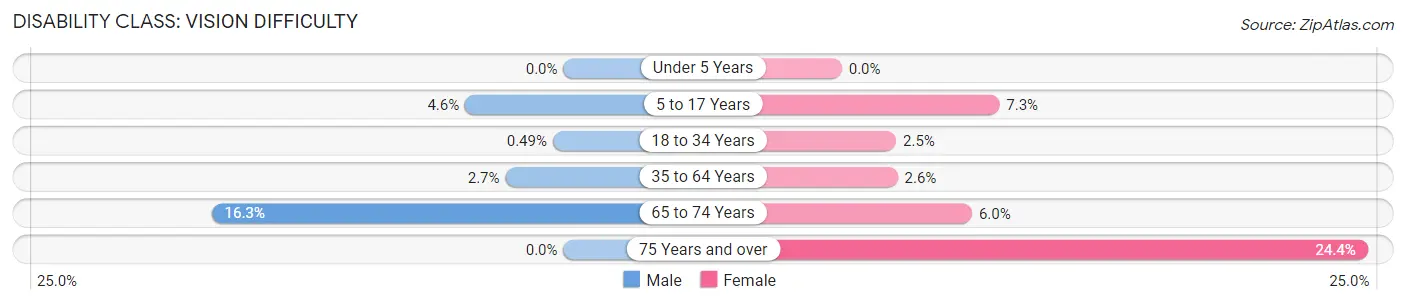
| Age Bracket | Male | Female |
| Under 5 Years | 0 (0.0%) | 0 (0.0%) |
| 5 to 17 Years | 97 (4.6%) | 146 (7.3%) |
| 18 to 34 Years | 11 (0.5%) | 53 (2.5%) |
| 35 to 64 Years | 88 (2.7%) | 86 (2.6%) |
| 65 to 74 Years | 94 (16.3%) | 35 (6.0%) |
| 75 Years and over | 0 (0.0%) | 71 (24.4%) |
Disability Class: Cognitive Difficulty
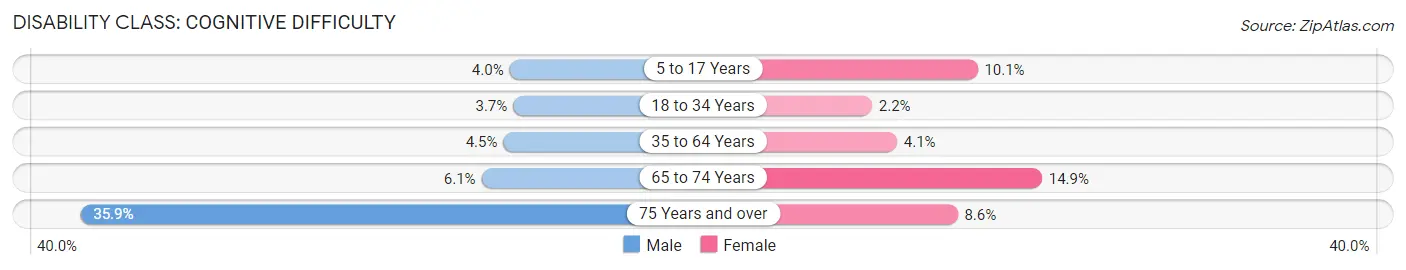
| Age Bracket | Male | Female |
| 5 to 17 Years | 85 (4.0%) | 201 (10.1%) |
| 18 to 34 Years | 83 (3.7%) | 47 (2.2%) |
| 35 to 64 Years | 146 (4.5%) | 136 (4.1%) |
| 65 to 74 Years | 35 (6.1%) | 86 (14.8%) |
| 75 Years and over | 85 (35.9%) | 25 (8.6%) |
Disability Class: Ambulatory Difficulty
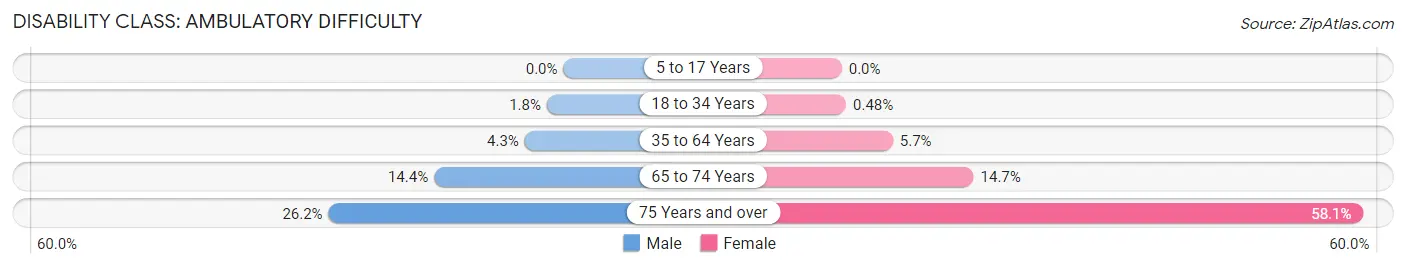
| Age Bracket | Male | Female |
| 5 to 17 Years | 0 (0.0%) | 0 (0.0%) |
| 18 to 34 Years | 41 (1.8%) | 10 (0.5%) |
| 35 to 64 Years | 141 (4.3%) | 189 (5.7%) |
| 65 to 74 Years | 83 (14.4%) | 85 (14.7%) |
| 75 Years and over | 62 (26.2%) | 169 (58.1%) |
Disability Class: Self-Care Difficulty
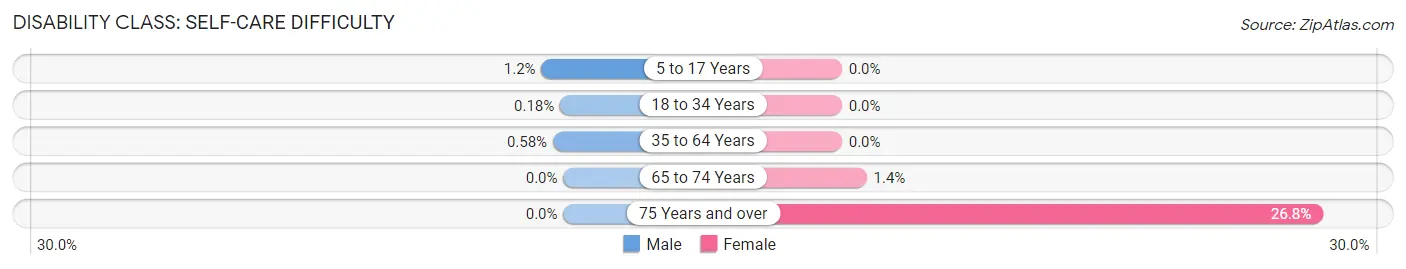
| Age Bracket | Male | Female |
| 5 to 17 Years | 26 (1.2%) | 0 (0.0%) |
| 18 to 34 Years | 4 (0.2%) | 0 (0.0%) |
| 35 to 64 Years | 19 (0.6%) | 0 (0.0%) |
| 65 to 74 Years | 0 (0.0%) | 8 (1.4%) |
| 75 Years and over | 0 (0.0%) | 78 (26.8%) |
Technology Access in Andrews County
Computing Device Access in Andrews County
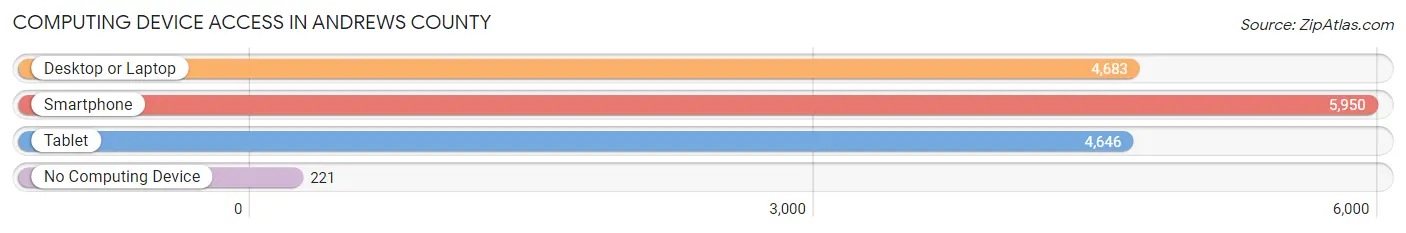
| Device Type | # Households | % Households |
| Desktop or Laptop | 4,683 | 70.9% |
| Smartphone | 5,950 | 90.1% |
| Tablet | 4,646 | 70.4% |
| No Computing Device | 221 | 3.4% |
| Total | 6,603 | 100.0% |
Internet Access in Andrews County
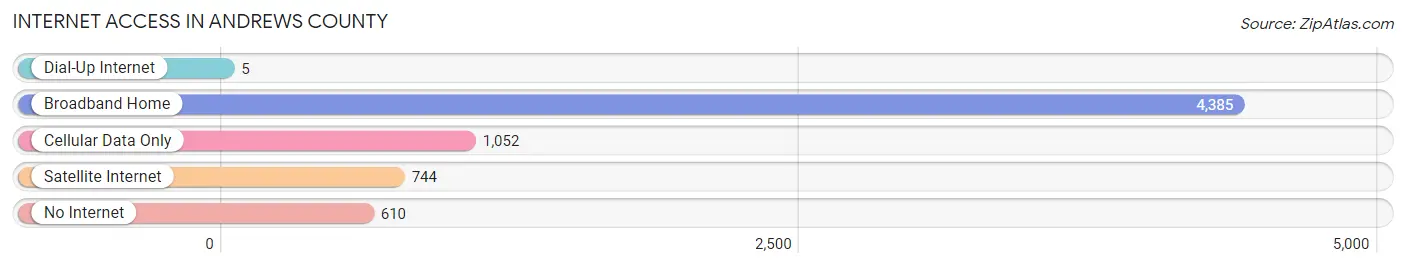
| Internet Type | # Households | % Households |
| Dial-Up Internet | 5 | 0.1% |
| Broadband Home | 4,385 | 66.4% |
| Cellular Data Only | 1,052 | 15.9% |
| Satellite Internet | 744 | 11.3% |
| No Internet | 610 | 9.2% |
| Total | 6,603 | 100.0% |
Andrews County Summary
Andrews County is located in the western part of the state of Texas, in the Permian Basin region. It is bordered by Martin County to the north, Ector County to the east, Midland County to the south, and Winkler County to the west. The county seat is Andrews, and the county has a total area of 902 square miles.
History
Andrews County was established in 1876 and named after Richard Andrews, a soldier in the Texas Revolution. The county was originally part of Bexar County, but was later divided into several smaller counties. The first settlers in the area were ranchers, who were attracted by the abundance of grass and water. The first town in the county was established in 1883, and was named Andrews in honor of Richard Andrews.
In the early 1900s, the county began to experience an oil boom, and the population began to grow rapidly. The first oil well was drilled in 1921, and by the end of the decade, the county had become one of the leading oil-producing counties in the state. The oil industry has continued to be a major part of the county’s economy, and today, Andrews County is one of the top oil-producing counties in the United States.
Geography
Andrews County is located in the western part of the state of Texas, in the Permian Basin region. It is bordered by Martin County to the north, Ector County to the east, Midland County to the south, and Winkler County to the west. The county seat is Andrews, and the county has a total area of 902 square miles.
The terrain of Andrews County is mostly flat, with some rolling hills in the northern part of the county. The county is located in the semi-arid climate zone, and the average annual precipitation is about 17 inches. The county is home to several lakes, including Lake Andrews, Lake J.B. Thomas, and Lake E.V. Spence.
Economy
The economy of Andrews County is largely based on the oil and gas industry. The county is one of the top oil-producing counties in the United States, and the oil and gas industry accounts for a large portion of the county’s economy. In addition to oil and gas, the county also has a strong agricultural sector, with cotton, sorghum, and wheat being the main crops.
The county also has a growing tourism industry, with several attractions, such as the Andrews County Museum, the Andrews County Historical Museum, and the Andrews County Fair. The county is also home to several golf courses, and is a popular destination for hunting and fishing.
Demographics
As of the 2010 census, Andrews County had a population of 14,786. The population was spread out, with 49.7% male and 50.3% female. The median age was 33.7 years, and the median household income was $50,945.
The racial makeup of the county was 79.2% White, 0.7% African American, 0.7% Native American, 0.3% Asian, 0.1% Pacific Islander, 17.3% from other races, and 2.1% from two or more races. Hispanic or Latino of any race were 44.2% of the population.
The largest ancestry groups in Andrews County were German (17.3%), English (14.2%), Irish (13.2%), and Mexican (12.2%). The majority of the population (90.2%) spoke English as their primary language, while 5.2% spoke Spanish.
Common Questions
What is Per Capita Income in Andrews County?
Per Capita income in Andrews County is $39,749.
What is the Median Family Income in Andrews County?
Median Family Income in Andrews County is $93,796.
What is the Median Household income in Andrews County?
Median Household Income in Andrews County is $86,458.
What is Income or Wage Gap in Andrews County?
Income or Wage Gap in Andrews County is 38.2%.
Women in Andrews County earn 61.8 cents for every dollar earned by a man.
What is Family Income Deficit in Andrews County?
Family Income Deficit in Andrews County is $13,369.
Families that are below poverty line in Andrews County earn $13,369 less on average than the poverty threshold level.
What is Inequality or Gini Index in Andrews County?
Inequality or Gini Index in Andrews County is 0.46.
What is the Total Population of Andrews County?
Total Population of Andrews County is 18,362.
What is the Total Male Population of Andrews County?
Total Male Population of Andrews County is 9,274.
What is the Total Female Population of Andrews County?
Total Female Population of Andrews County is 9,088.
What is the Ratio of Males per 100 Females in Andrews County?
There are 102.05 Males per 100 Females in Andrews County.
What is the Ratio of Females per 100 Males in Andrews County?
There are 97.99 Females per 100 Males in Andrews County.
What is the Median Population Age in Andrews County?
Median Population Age in Andrews County is 32.4 Years.
What is the Average Family Size in Andrews County
Average Family Size in Andrews County is 3.1 People.
What is the Average Household Size in Andrews County
Average Household Size in Andrews County is 2.8 People.
How Large is the Labor Force in Andrews County?
There are 9,517 People in the Labor Forcein in Andrews County.
What is the Percentage of People in the Labor Force in Andrews County?
71.2% of People are in the Labor Force in Andrews County.
What is the Unemployment Rate in Andrews County?
Unemployment Rate in Andrews County is 2.7%.