Guamanian/Chamorro vs White/Caucasian Single Female Poverty
COMPARE
Guamanian/Chamorro
White/Caucasian
Single Female Poverty
Single Female Poverty Comparison
Guamanians/Chamorros
Whites/Caucasians
21.6%
SINGLE FEMALE POVERTY
13.7/ 100
METRIC RATING
213th/ 347
METRIC RANK
22.7%
SINGLE FEMALE POVERTY
0.6/ 100
METRIC RATING
259th/ 347
METRIC RANK
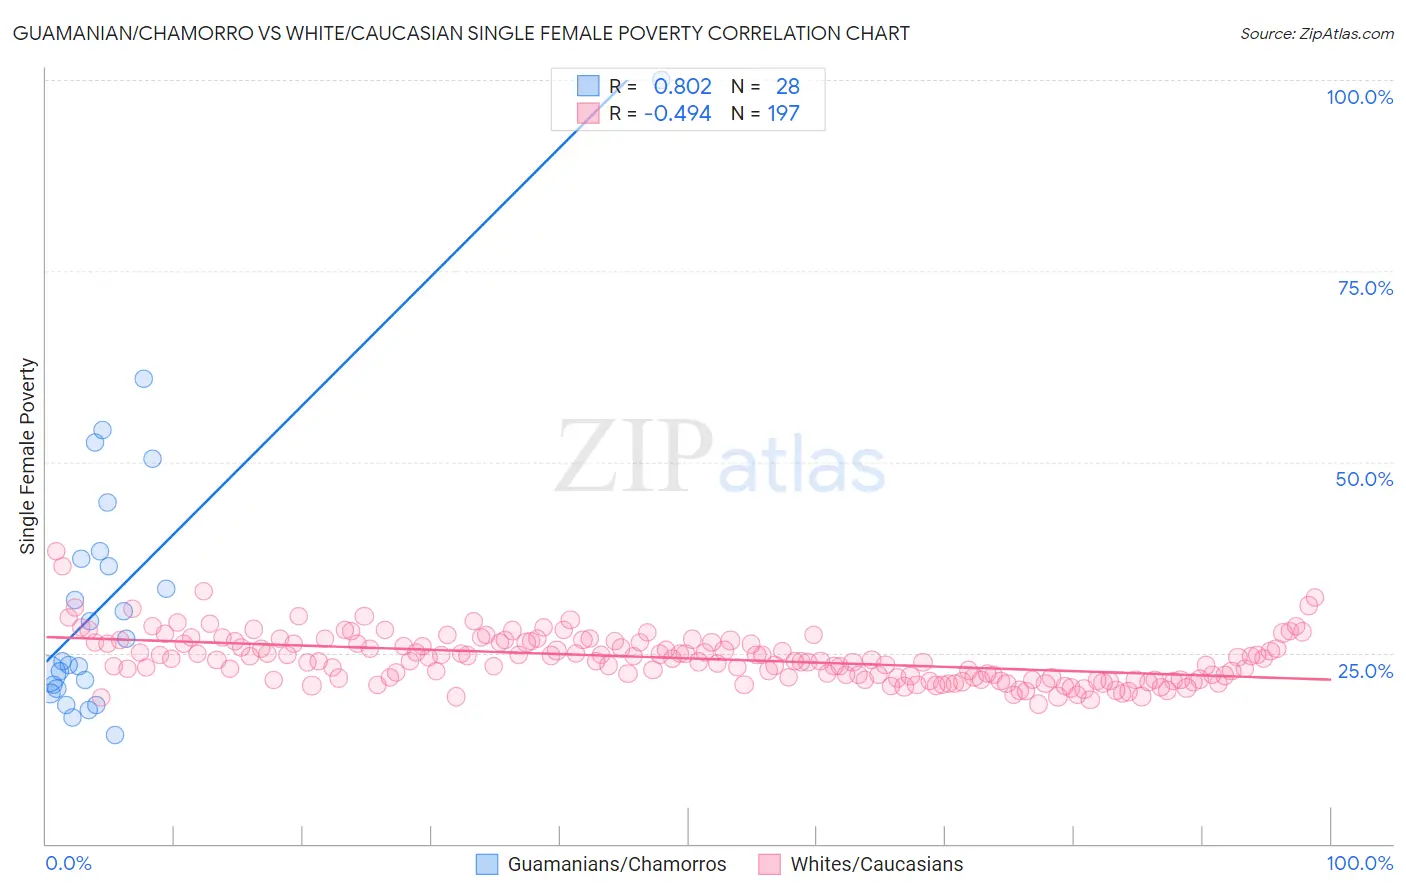
Guamanian/Chamorro vs White/Caucasian Single Female Poverty Correlation Chart
The statistical analysis conducted on geographies consisting of 220,498,532 people shows a very strong positive correlation between the proportion of Guamanians/Chamorros and poverty level among single females in the United States with a correlation coefficient (R) of 0.802 and weighted average of 21.6%. Similarly, the statistical analysis conducted on geographies consisting of 560,395,051 people shows a moderate negative correlation between the proportion of Whites/Caucasians and poverty level among single females in the United States with a correlation coefficient (R) of -0.494 and weighted average of 22.7%, a difference of 5.1%.
Single Female Poverty Correlation Summary
| Measurement | Guamanian/Chamorro | White/Caucasian |
| Minimum | 14.3% | 18.3% |
| Maximum | 100.0% | 38.3% |
| Range | 85.7% | 20.0% |
| Mean | 32.5% | 24.3% |
| Median | 25.4% | 24.0% |
| Interquartile 25% (IQ1) | 20.5% | 21.6% |
| Interquartile 75% (IQ3) | 37.8% | 26.4% |
| Interquartile Range (IQR) | 17.3% | 4.8% |
| Standard Deviation (Sample) | 18.3% | 3.2% |
| Standard Deviation (Population) | 18.0% | 3.2% |
Similar Demographics by Single Female Poverty
Demographics Similar to Guamanians/Chamorros by Single Female Poverty
In terms of single female poverty, the demographic groups most similar to Guamanians/Chamorros are Jamaican (21.6%, a difference of 0.030%), Icelander (21.6%, a difference of 0.040%), Immigrants from Nicaragua (21.6%, a difference of 0.060%), Immigrants from Panama (21.6%, a difference of 0.080%), and Immigrants from Eastern Africa (21.6%, a difference of 0.17%).
| Demographics | Rating | Rank | Single Female Poverty |
| Belgians | 16.1 /100 | #206 | Poor 21.5% |
| Ghanaians | 15.7 /100 | #207 | Poor 21.6% |
| Haitians | 15.4 /100 | #208 | Poor 21.6% |
| Immigrants | Eastern Africa | 15.1 /100 | #209 | Poor 21.6% |
| Immigrants | Panama | 14.4 /100 | #210 | Poor 21.6% |
| Icelanders | 14.0 /100 | #211 | Poor 21.6% |
| Jamaicans | 14.0 /100 | #212 | Poor 21.6% |
| Guamanians/Chamorros | 13.7 /100 | #213 | Poor 21.6% |
| Immigrants | Nicaragua | 13.3 /100 | #214 | Poor 21.6% |
| Ecuadorians | 12.3 /100 | #215 | Poor 21.6% |
| Immigrants | Barbados | 12.2 /100 | #216 | Poor 21.7% |
| Immigrants | St. Vincent and the Grenadines | 11.7 /100 | #217 | Poor 21.7% |
| Nepalese | 9.7 /100 | #218 | Tragic 21.7% |
| Panamanians | 9.4 /100 | #219 | Tragic 21.7% |
| Germans | 8.3 /100 | #220 | Tragic 21.8% |
Demographics Similar to Whites/Caucasians by Single Female Poverty
In terms of single female poverty, the demographic groups most similar to Whites/Caucasians are Celtic (22.7%, a difference of 0.080%), Bahamian (22.7%, a difference of 0.14%), Sudanese (22.6%, a difference of 0.34%), Immigrants from Cabo Verde (22.8%, a difference of 0.34%), and Immigrants from Belize (22.6%, a difference of 0.48%).
| Demographics | Rating | Rank | Single Female Poverty |
| Delaware | 1.0 /100 | #252 | Tragic 22.5% |
| Immigrants | Liberia | 0.9 /100 | #253 | Tragic 22.5% |
| Immigrants | Burma/Myanmar | 0.8 /100 | #254 | Tragic 22.6% |
| Immigrants | Sudan | 0.8 /100 | #255 | Tragic 22.6% |
| Immigrants | Belize | 0.8 /100 | #256 | Tragic 22.6% |
| Sudanese | 0.7 /100 | #257 | Tragic 22.6% |
| Bahamians | 0.6 /100 | #258 | Tragic 22.7% |
| Whites/Caucasians | 0.6 /100 | #259 | Tragic 22.7% |
| Celtics | 0.5 /100 | #260 | Tragic 22.7% |
| Immigrants | Cabo Verde | 0.4 /100 | #261 | Tragic 22.8% |
| British West Indians | 0.4 /100 | #262 | Tragic 22.8% |
| Scotch-Irish | 0.3 /100 | #263 | Tragic 22.9% |
| Immigrants | Laos | 0.3 /100 | #264 | Tragic 22.9% |
| Central Americans | 0.2 /100 | #265 | Tragic 23.0% |
| Immigrants | Micronesia | 0.2 /100 | #266 | Tragic 23.0% |