Guamanian/Chamorro vs Immigrants from Guatemala Single Female Poverty
COMPARE
Guamanian/Chamorro
Immigrants from Guatemala
Single Female Poverty
Single Female Poverty Comparison
Guamanians/Chamorros
Immigrants from Guatemala
21.6%
SINGLE FEMALE POVERTY
13.7/ 100
METRIC RATING
213th/ 347
METRIC RANK
24.1%
SINGLE FEMALE POVERTY
0.0/ 100
METRIC RATING
285th/ 347
METRIC RANK
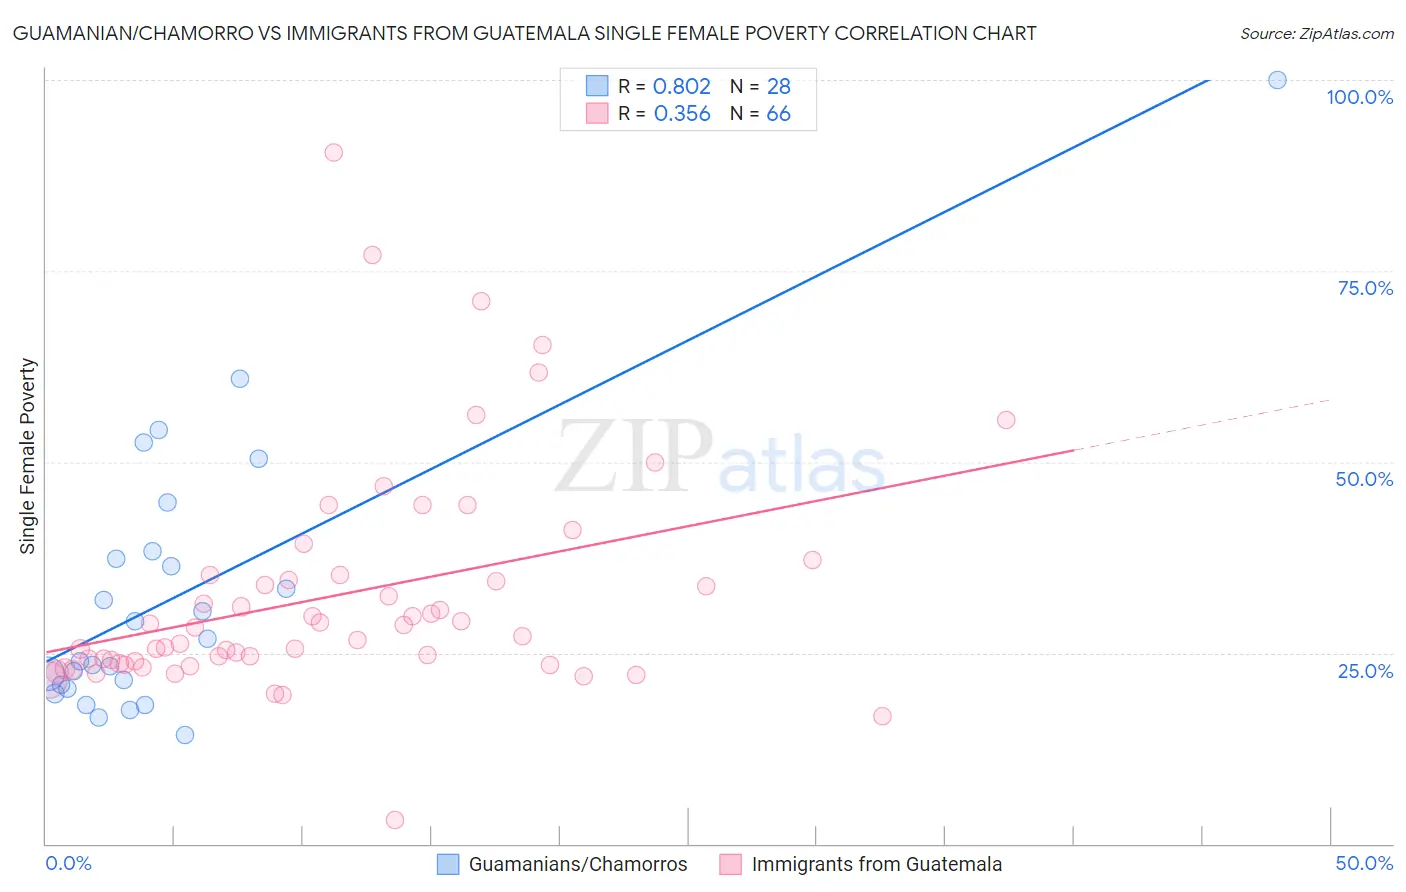
Guamanian/Chamorro vs Immigrants from Guatemala Single Female Poverty Correlation Chart
The statistical analysis conducted on geographies consisting of 220,498,532 people shows a very strong positive correlation between the proportion of Guamanians/Chamorros and poverty level among single females in the United States with a correlation coefficient (R) of 0.802 and weighted average of 21.6%. Similarly, the statistical analysis conducted on geographies consisting of 373,364,568 people shows a mild positive correlation between the proportion of Immigrants from Guatemala and poverty level among single females in the United States with a correlation coefficient (R) of 0.356 and weighted average of 24.1%, a difference of 11.6%.
Single Female Poverty Correlation Summary
| Measurement | Guamanian/Chamorro | Immigrants from Guatemala |
| Minimum | 14.3% | 3.0% |
| Maximum | 100.0% | 90.5% |
| Range | 85.7% | 87.4% |
| Mean | 32.5% | 32.5% |
| Median | 25.4% | 27.7% |
| Interquartile 25% (IQ1) | 20.5% | 23.6% |
| Interquartile 75% (IQ3) | 37.8% | 35.1% |
| Interquartile Range (IQR) | 17.3% | 11.5% |
| Standard Deviation (Sample) | 18.3% | 15.0% |
| Standard Deviation (Population) | 18.0% | 14.9% |
Similar Demographics by Single Female Poverty
Demographics Similar to Guamanians/Chamorros by Single Female Poverty
In terms of single female poverty, the demographic groups most similar to Guamanians/Chamorros are Jamaican (21.6%, a difference of 0.030%), Icelander (21.6%, a difference of 0.040%), Immigrants from Nicaragua (21.6%, a difference of 0.060%), Immigrants from Panama (21.6%, a difference of 0.080%), and Immigrants from Eastern Africa (21.6%, a difference of 0.17%).
| Demographics | Rating | Rank | Single Female Poverty |
| Belgians | 16.1 /100 | #206 | Poor 21.5% |
| Ghanaians | 15.7 /100 | #207 | Poor 21.6% |
| Haitians | 15.4 /100 | #208 | Poor 21.6% |
| Immigrants | Eastern Africa | 15.1 /100 | #209 | Poor 21.6% |
| Immigrants | Panama | 14.4 /100 | #210 | Poor 21.6% |
| Icelanders | 14.0 /100 | #211 | Poor 21.6% |
| Jamaicans | 14.0 /100 | #212 | Poor 21.6% |
| Guamanians/Chamorros | 13.7 /100 | #213 | Poor 21.6% |
| Immigrants | Nicaragua | 13.3 /100 | #214 | Poor 21.6% |
| Ecuadorians | 12.3 /100 | #215 | Poor 21.6% |
| Immigrants | Barbados | 12.2 /100 | #216 | Poor 21.7% |
| Immigrants | St. Vincent and the Grenadines | 11.7 /100 | #217 | Poor 21.7% |
| Nepalese | 9.7 /100 | #218 | Tragic 21.7% |
| Panamanians | 9.4 /100 | #219 | Tragic 21.7% |
| Germans | 8.3 /100 | #220 | Tragic 21.8% |
Demographics Similar to Immigrants from Guatemala by Single Female Poverty
In terms of single female poverty, the demographic groups most similar to Immigrants from Guatemala are Cree (24.1%, a difference of 0.040%), Bangladeshi (24.2%, a difference of 0.19%), Spanish American (24.2%, a difference of 0.21%), U.S. Virgin Islander (24.2%, a difference of 0.26%), and Indonesian (24.3%, a difference of 0.60%).
| Demographics | Rating | Rank | Single Female Poverty |
| Immigrants | Nonimmigrants | 0.0 /100 | #278 | Tragic 23.6% |
| Alaskan Athabascans | 0.0 /100 | #279 | Tragic 23.6% |
| Immigrants | Latin America | 0.0 /100 | #280 | Tragic 23.7% |
| Immigrants | Zaire | 0.0 /100 | #281 | Tragic 23.8% |
| Guatemalans | 0.0 /100 | #282 | Tragic 23.8% |
| German Russians | 0.0 /100 | #283 | Tragic 23.9% |
| Immigrants | Dominica | 0.0 /100 | #284 | Tragic 23.9% |
| Immigrants | Guatemala | 0.0 /100 | #285 | Tragic 24.1% |
| Cree | 0.0 /100 | #286 | Tragic 24.1% |
| Bangladeshis | 0.0 /100 | #287 | Tragic 24.2% |
| Spanish Americans | 0.0 /100 | #288 | Tragic 24.2% |
| U.S. Virgin Islanders | 0.0 /100 | #289 | Tragic 24.2% |
| Indonesians | 0.0 /100 | #290 | Tragic 24.3% |
| Osage | 0.0 /100 | #291 | Tragic 24.4% |
| Alsatians | 0.0 /100 | #292 | Tragic 24.5% |