Zip Codes with the Highest Percentage of Families with Income Above $100,000 in New Hampshire
RELATED REPORTS & OPTIONS
Family Income | $100k+
New Hampshire
Compare Zip Codes
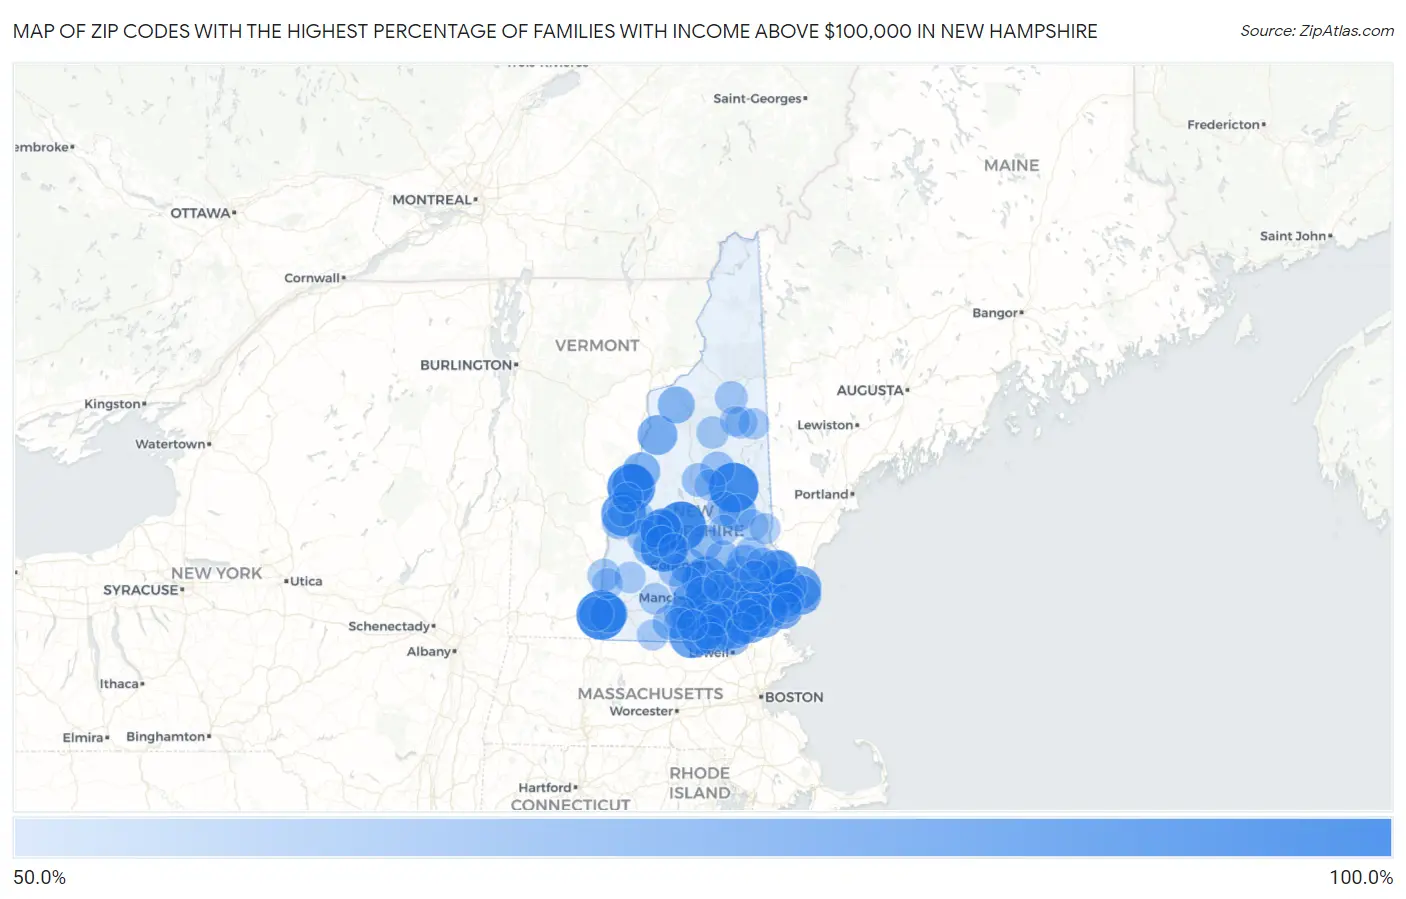
Map of Zip Codes with the Highest Percentage of Families with Income Above $100,000 in New Hampshire
50.0%
100.0%
Zip Codes with the Highest Percentage of Families with Income Above $100,000 in New Hampshire
| Zip Code | Families with Income > $100k | vs State | vs National | |
| 1. | 03443 | 100.0% | 57.1%(+42.9)#1 | 46.1%(+53.9)#35 |
| 2. | 03850 | 100.0% | 57.1%(+42.9)#2 | 46.1%(+53.9)#101 |
| 3. | 03231 | 100.0% | 57.1%(+42.9)#3 | 46.1%(+53.9)#124 |
| 4. | 03750 | 96.0% | 57.1%(+38.9)#4 | 46.1%(+49.9)#283 |
| 5. | 03273 | 92.5% | 57.1%(+35.4)#5 | 46.1%(+46.4)#319 |
| 6. | 03770 | 89.7% | 57.1%(+32.6)#6 | 46.1%(+43.6)#370 |
| 7. | 03033 | 86.9% | 57.1%(+29.8)#7 | 46.1%(+40.8)#478 |
| 8. | 03233 | 86.1% | 57.1%(+29.0)#8 | 46.1%(+40.0)#526 |
| 9. | 03854 | 84.6% | 57.1%(+27.5)#9 | 46.1%(+38.5)#620 |
| 10. | 03304 | 84.3% | 57.1%(+27.2)#10 | 46.1%(+38.2)#643 |
| 11. | 03856 | 83.8% | 57.1%(+26.7)#11 | 46.1%(+37.7)#686 |
| 12. | 03087 | 82.3% | 57.1%(+25.2)#12 | 46.1%(+36.2)#788 |
| 13. | 03031 | 81.9% | 57.1%(+24.8)#13 | 46.1%(+35.8)#816 |
| 14. | 03755 | 81.8% | 57.1%(+24.7)#14 | 46.1%(+35.7)#826 |
| 15. | 03811 | 81.3% | 57.1%(+24.2)#15 | 46.1%(+35.2)#888 |
| 16. | 03858 | 80.2% | 57.1%(+23.1)#16 | 46.1%(+34.1)#1,009 |
| 17. | 03844 | 80.2% | 57.1%(+23.1)#17 | 46.1%(+34.1)#1,013 |
| 18. | 03049 | 79.7% | 57.1%(+22.6)#18 | 46.1%(+33.6)#1,059 |
| 19. | 03823 | 79.6% | 57.1%(+22.5)#19 | 46.1%(+33.5)#1,072 |
| 20. | 03110 | 78.5% | 57.1%(+21.4)#20 | 46.1%(+32.4)#1,202 |
| 21. | 03032 | 78.4% | 57.1%(+21.3)#21 | 46.1%(+32.3)#1,222 |
| 22. | 03780 | 78.4% | 57.1%(+21.3)#22 | 46.1%(+32.3)#1,226 |
| 23. | 03034 | 78.3% | 57.1%(+21.2)#23 | 46.1%(+32.2)#1,231 |
| 24. | 03870 | 78.1% | 57.1%(+21.0)#24 | 46.1%(+32.0)#1,252 |
| 25. | 03036 | 77.8% | 57.1%(+20.7)#25 | 46.1%(+31.7)#1,290 |
| 26. | 03046 | 75.9% | 57.1%(+18.8)#26 | 46.1%(+29.8)#1,583 |
| 27. | 03885 | 75.4% | 57.1%(+18.3)#27 | 46.1%(+29.3)#1,644 |
| 28. | 03768 | 74.2% | 57.1%(+17.1)#28 | 46.1%(+28.1)#1,848 |
| 29. | 03462 | 74.0% | 57.1%(+16.9)#29 | 46.1%(+27.9)#1,887 |
| 30. | 03840 | 73.8% | 57.1%(+16.7)#30 | 46.1%(+27.7)#1,916 |
| 31. | 03810 | 73.4% | 57.1%(+16.3)#31 | 46.1%(+27.3)#1,970 |
| 32. | 03586 | 72.5% | 57.1%(+15.4)#32 | 46.1%(+26.4)#2,143 |
| 33. | 03057 | 71.9% | 57.1%(+14.8)#33 | 46.1%(+25.8)#2,248 |
| 34. | 03051 | 71.1% | 57.1%(+14.0)#34 | 46.1%(+25.0)#2,382 |
| 35. | 03833 | 70.9% | 57.1%(+13.8)#35 | 46.1%(+24.8)#2,426 |
| 36. | 03824 | 70.5% | 57.1%(+13.4)#36 | 46.1%(+24.4)#2,511 |
| 37. | 03255 | 70.4% | 57.1%(+13.3)#37 | 46.1%(+24.3)#2,528 |
| 38. | 03229 | 69.9% | 57.1%(+12.8)#38 | 46.1%(+23.8)#2,628 |
| 39. | 03287 | 69.8% | 57.1%(+12.7)#39 | 46.1%(+23.7)#2,655 |
| 40. | 03861 | 69.7% | 57.1%(+12.6)#40 | 46.1%(+23.6)#2,677 |
| 41. | 03261 | 68.8% | 57.1%(+11.7)#41 | 46.1%(+22.7)#2,863 |
| 42. | 03053 | 68.7% | 57.1%(+11.6)#42 | 46.1%(+22.6)#2,881 |
| 43. | 03076 | 68.6% | 57.1%(+11.5)#43 | 46.1%(+22.5)#2,899 |
| 44. | 03224 | 68.3% | 57.1%(+11.2)#44 | 46.1%(+22.2)#2,960 |
| 45. | 03070 | 68.2% | 57.1%(+11.1)#45 | 46.1%(+22.1)#2,982 |
| 46. | 03037 | 68.1% | 57.1%(+11.0)#46 | 46.1%(+22.0)#3,001 |
| 47. | 03466 | 67.4% | 57.1%(+10.3)#47 | 46.1%(+21.3)#3,175 |
| 48. | 03801 | 67.2% | 57.1%(+10.1)#48 | 46.1%(+21.1)#3,199 |
| 49. | 03084 | 67.0% | 57.1%(+9.90)#49 | 46.1%(+20.9)#3,250 |
| 50. | 03054 | 66.6% | 57.1%(+9.50)#50 | 46.1%(+20.5)#3,337 |
| 51. | 03249 | 66.6% | 57.1%(+9.50)#51 | 46.1%(+20.5)#3,348 |
| 52. | 03281 | 66.5% | 57.1%(+9.40)#52 | 46.1%(+20.4)#3,370 |
| 53. | 03227 | 66.5% | 57.1%(+9.40)#53 | 46.1%(+20.4)#3,377 |
| 54. | 03045 | 66.4% | 57.1%(+9.30)#54 | 46.1%(+20.3)#3,386 |
| 55. | 03258 | 66.3% | 57.1%(+9.20)#55 | 46.1%(+20.2)#3,426 |
| 56. | 03820 | 66.2% | 57.1%(+9.10)#56 | 46.1%(+20.1)#3,436 |
| 57. | 03245 | 65.7% | 57.1%(+8.60)#57 | 46.1%(+19.6)#3,561 |
| 58. | 03063 | 65.4% | 57.1%(+8.30)#58 | 46.1%(+19.3)#3,633 |
| 59. | 03848 | 65.2% | 57.1%(+8.10)#59 | 46.1%(+19.1)#3,702 |
| 60. | 03862 | 64.9% | 57.1%(+7.80)#60 | 46.1%(+18.8)#3,774 |
| 61. | 03753 | 64.9% | 57.1%(+7.80)#61 | 46.1%(+18.8)#3,775 |
| 62. | 03827 | 64.8% | 57.1%(+7.70)#62 | 46.1%(+18.7)#3,804 |
| 63. | 03782 | 64.8% | 57.1%(+7.70)#63 | 46.1%(+18.7)#3,805 |
| 64. | 03745 | 64.8% | 57.1%(+7.70)#64 | 46.1%(+18.7)#3,808 |
| 65. | 03826 | 64.7% | 57.1%(+7.60)#65 | 46.1%(+18.6)#3,834 |
| 66. | 03242 | 64.1% | 57.1%(+7.00)#66 | 46.1%(+18.0)#3,985 |
| 67. | 03044 | 64.1% | 57.1%(+7.00)#67 | 46.1%(+18.0)#3,986 |
| 68. | 03884 | 64.0% | 57.1%(+6.90)#68 | 46.1%(+17.9)#4,009 |
| 69. | 03082 | 63.4% | 57.1%(+6.30)#69 | 46.1%(+17.3)#4,178 |
| 70. | 03052 | 63.2% | 57.1%(+6.10)#70 | 46.1%(+17.1)#4,231 |
| 71. | 03257 | 63.0% | 57.1%(+5.90)#71 | 46.1%(+16.9)#4,285 |
| 72. | 03593 | 63.0% | 57.1%(+5.90)#72 | 46.1%(+16.9)#4,292 |
| 73. | 03609 | 62.8% | 57.1%(+5.70)#73 | 46.1%(+16.7)#4,345 |
| 74. | 03819 | 62.7% | 57.1%(+5.60)#74 | 46.1%(+16.6)#4,365 |
| 75. | 03825 | 62.6% | 57.1%(+5.50)#75 | 46.1%(+16.5)#4,388 |
| 76. | 03086 | 62.6% | 57.1%(+5.50)#76 | 46.1%(+16.5)#4,393 |
| 77. | 03215 | 62.4% | 57.1%(+5.30)#77 | 46.1%(+16.3)#4,457 |
| 78. | 03865 | 62.3% | 57.1%(+5.20)#78 | 46.1%(+16.2)#4,476 |
| 79. | 03079 | 61.6% | 57.1%(+4.50)#79 | 46.1%(+15.5)#4,666 |
| 80. | 03838 | 61.6% | 57.1%(+4.50)#80 | 46.1%(+15.5)#4,684 |
| 81. | 03290 | 61.4% | 57.1%(+4.30)#81 | 46.1%(+15.3)#4,727 |
| 82. | 03062 | 60.9% | 57.1%(+3.80)#82 | 46.1%(+14.8)#4,877 |
| 83. | 03841 | 60.9% | 57.1%(+3.80)#83 | 46.1%(+14.8)#4,889 |
| 84. | 03226 | 60.7% | 57.1%(+3.60)#84 | 46.1%(+14.6)#4,957 |
| 85. | 03855 | 60.6% | 57.1%(+3.50)#85 | 46.1%(+14.5)#4,977 |
| 86. | 03456 | 60.4% | 57.1%(+3.30)#86 | 46.1%(+14.3)#5,038 |
| 87. | 03449 | 60.3% | 57.1%(+3.20)#87 | 46.1%(+14.2)#5,057 |
| 88. | 03055 | 60.0% | 57.1%(+2.90)#88 | 46.1%(+13.9)#5,119 |
| 89. | 03608 | 59.9% | 57.1%(+2.80)#89 | 46.1%(+13.8)#5,175 |
| 90. | 03461 | 59.8% | 57.1%(+2.70)#90 | 46.1%(+13.7)#5,204 |
| 91. | 03845 | 59.8% | 57.1%(+2.70)#91 | 46.1%(+13.7)#5,209 |
| 92. | 03260 | 59.7% | 57.1%(+2.60)#92 | 46.1%(+13.6)#5,238 |
| 93. | 03106 | 59.6% | 57.1%(+2.50)#93 | 46.1%(+13.5)#5,256 |
| 94. | 03851 | 59.5% | 57.1%(+2.40)#94 | 46.1%(+13.4)#5,303 |
| 95. | 03278 | 59.5% | 57.1%(+2.40)#95 | 46.1%(+13.4)#5,306 |
| 96. | 03237 | 58.8% | 57.1%(+1.70)#96 | 46.1%(+12.7)#5,524 |
| 97. | 03842 | 58.6% | 57.1%(+1.50)#97 | 46.1%(+12.5)#5,584 |
| 98. | 03812 | 58.5% | 57.1%(+1.40)#98 | 46.1%(+12.4)#5,626 |
| 99. | 03781 | 58.3% | 57.1%(+1.20)#99 | 46.1%(+12.2)#5,680 |
| 100. | 03766 | 57.9% | 57.1%(+0.800)#100 | 46.1%(+11.8)#5,803 |
Common Questions
What are the Top 10 Zip Codes with the Highest Percentage of Families with Income Above $100,000 in New Hampshire?
Top 10 Zip Codes with the Highest Percentage of Families with Income Above $100,000 in New Hampshire are:
What zip code has the Highest Percentage of Families with Income Above $100,000 in New Hampshire?
03443 has the Highest Percentage of Families with Income Above $100,000 in New Hampshire with 100.0%.
What is the Percentage of Families with Income Above $100,000 in the State of New Hampshire?
Percentage of Families with Income Above $100,000 in New Hampshire is 57.1%.
What is the Percentage of Families with Income Above $100,000 in the United States?
Percentage of Families with Income Above $100,000 in the United States is 46.1%.