Washington County, NC Map & Demographics
Washington County Map
Washington County Overview
$26,209
PER CAPITA INCOME
$58,947
AVG FAMILY INCOME
$38,927
AVG HOUSEHOLD INCOME
46.9%
WAGE / INCOME GAP [ % ]
53.1¢/ $1
WAGE / INCOME GAP [ $ ]
0.51
INEQUALITY / GINI INDEX
11,051
TOTAL POPULATION
5,659
MALE POPULATION
5,392
FEMALE POPULATION
104.95
MALES / 100 FEMALES
95.28
FEMALES / 100 MALES
48.0
MEDIAN AGE
3.0
AVG FAMILY SIZE
2.2
AVG HOUSEHOLD SIZE
4,494
LABOR FORCE [ PEOPLE ]
49.3%
PERCENT IN LABOR FORCE
12.7%
UNEMPLOYMENT RATE
Washington County Area Codes
Income in Washington County
Income Overview in Washington County
Per Capita Income in Washington County is $26,209, while median incomes of families and households are $58,947 and $38,927 respectively.
| Characteristic | Number | Measure |
| Per Capita Income | 11,051 | $26,209 |
| Median Family Income | 2,798 | $58,947 |
| Mean Family Income | 2,798 | $74,619 |
| Median Household Income | 4,897 | $38,927 |
| Mean Household Income | 4,897 | $55,923 |
| Income Deficit | 2,798 | $0 |
| Wage / Income Gap (%) | 11,051 | 46.87% |
| Wage / Income Gap ($) | 11,051 | 53.13¢ per $1 |
| Gini / Inequality Index | 11,051 | 0.51 |
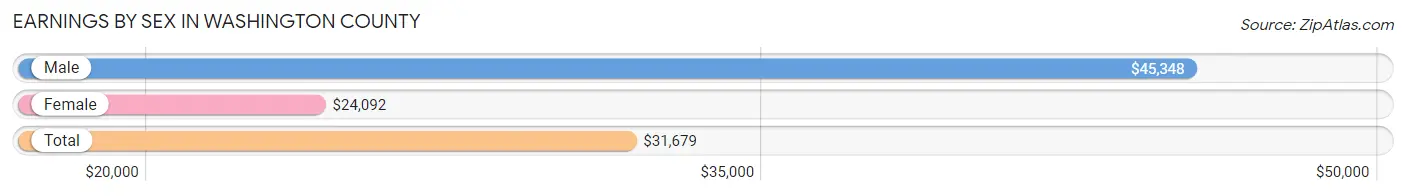
Earnings by Sex in Washington County
Average Earnings in Washington County are $31,679, $45,348 for men and $24,092 for women, a difference of 46.9%.
| Sex | Number | Average Earnings |
| Male | 2,029 (46.7%) | $45,348 |
| Female | 2,315 (53.3%) | $24,092 |
| Total | 4,344 (100.0%) | $31,679 |
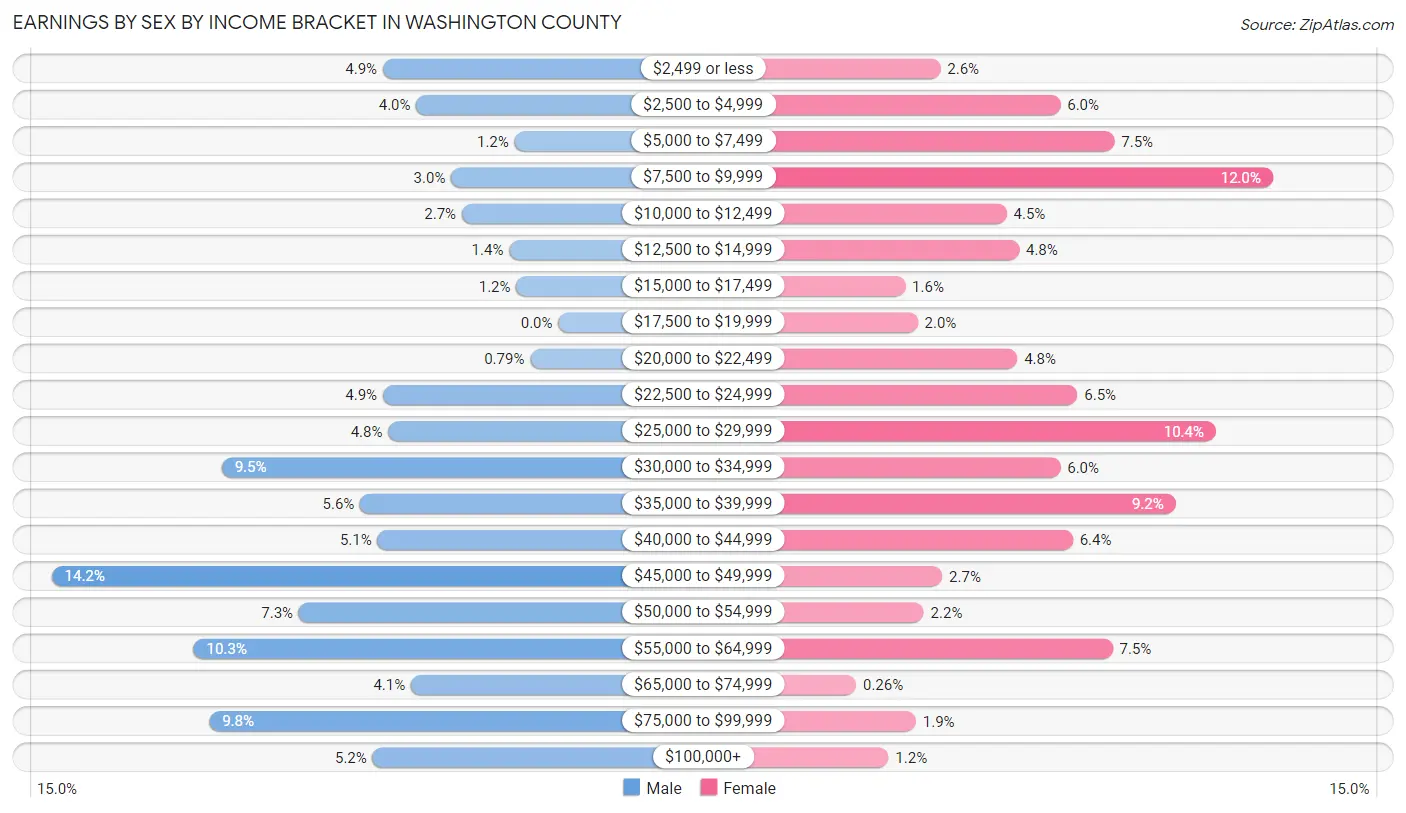
Earnings by Sex by Income Bracket in Washington County
The most common earnings brackets in Washington County are $45,000 to $49,999 for men (289 | 14.2%) and $7,500 to $9,999 for women (277 | 12.0%).
| Income | Male | Female |
| $2,499 or less | 100 (4.9%) | 61 (2.6%) |
| $2,500 to $4,999 | 81 (4.0%) | 139 (6.0%) |
| $5,000 to $7,499 | 25 (1.2%) | 174 (7.5%) |
| $7,500 to $9,999 | 61 (3.0%) | 277 (12.0%) |
| $10,000 to $12,499 | 55 (2.7%) | 104 (4.5%) |
| $12,500 to $14,999 | 28 (1.4%) | 112 (4.8%) |
| $15,000 to $17,499 | 24 (1.2%) | 38 (1.6%) |
| $17,500 to $19,999 | 0 (0.0%) | 46 (2.0%) |
| $20,000 to $22,499 | 16 (0.8%) | 111 (4.8%) |
| $22,500 to $24,999 | 100 (4.9%) | 150 (6.5%) |
| $25,000 to $29,999 | 97 (4.8%) | 240 (10.4%) |
| $30,000 to $34,999 | 192 (9.5%) | 139 (6.0%) |
| $35,000 to $39,999 | 113 (5.6%) | 214 (9.2%) |
| $40,000 to $44,999 | 103 (5.1%) | 147 (6.4%) |
| $45,000 to $49,999 | 289 (14.2%) | 62 (2.7%) |
| $50,000 to $54,999 | 148 (7.3%) | 50 (2.2%) |
| $55,000 to $64,999 | 208 (10.2%) | 173 (7.5%) |
| $65,000 to $74,999 | 84 (4.1%) | 6 (0.3%) |
| $75,000 to $99,999 | 199 (9.8%) | 45 (1.9%) |
| $100,000+ | 106 (5.2%) | 27 (1.2%) |
| Total | 2,029 (100.0%) | 2,315 (100.0%) |
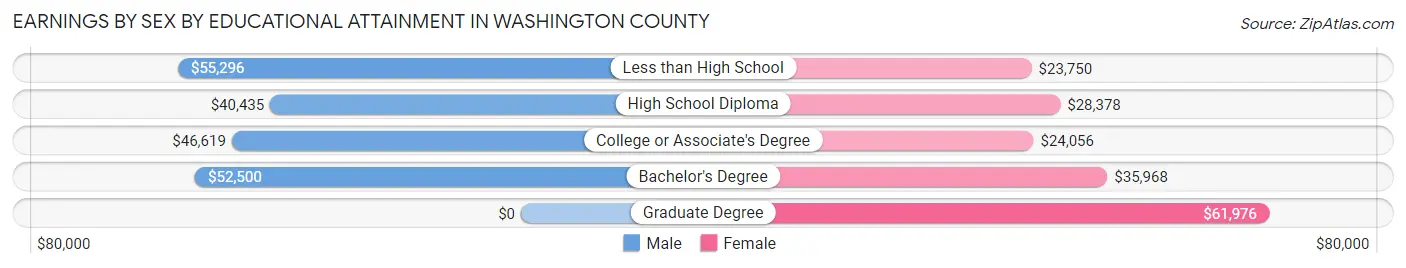
Earnings by Sex by Educational Attainment in Washington County
Average earnings in Washington County are $46,884 for men and $26,763 for women, a difference of 42.9%. Men with an educational attainment of less than high school enjoy the highest average annual earnings of $55,296, while those with high school diploma education earn the least with $40,435. Women with an educational attainment of graduate degree earn the most with the average annual earnings of $61,976, while those with less than high school education have the smallest earnings of $23,750.
| Educational Attainment | Male Income | Female Income |
| Less than High School | $55,296 | $23,750 |
| High School Diploma | $40,435 | $28,378 |
| College or Associate's Degree | $46,619 | $24,056 |
| Bachelor's Degree | $52,500 | $35,968 |
| Graduate Degree | - | - |
| Total | $46,884 | $26,763 |
Family Income in Washington County
Family Income Brackets in Washington County
According to the Washington County family income data, there are 602 families falling into the $75,000 to $99,999 income range, which is the most common income bracket and makes up 21.5% of all families. Conversely, the $10,000 to $14,999 income bracket is the least frequent group with only 39 families (1.4%) belonging to this category.
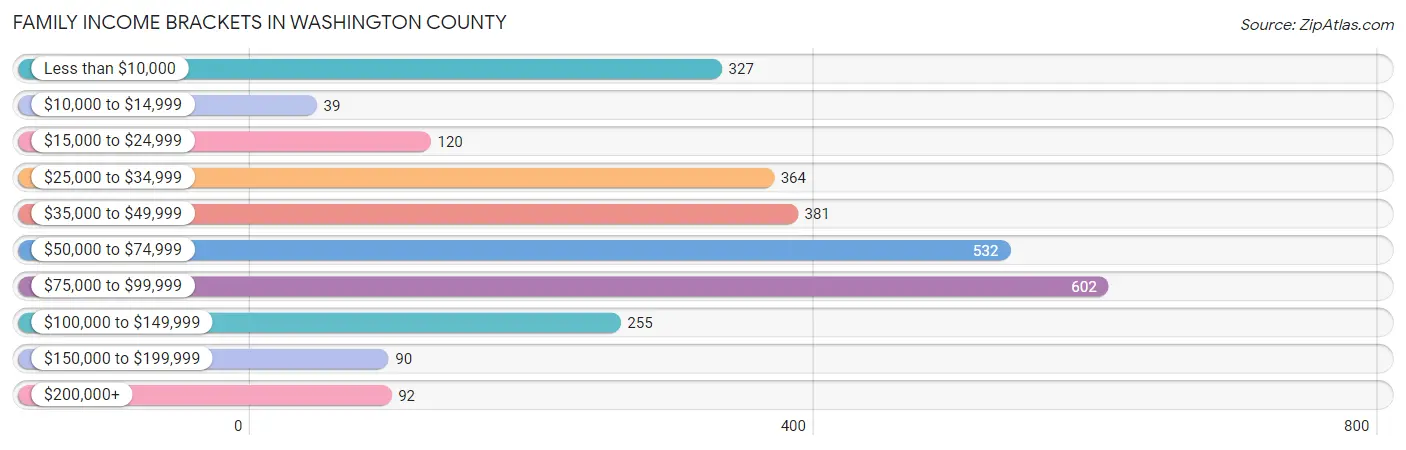
| Income Bracket | # Families | % Families |
| Less than $10,000 | 327 | 11.7% |
| $10,000 to $14,999 | 39 | 1.4% |
| $15,000 to $24,999 | 120 | 4.3% |
| $25,000 to $34,999 | 364 | 13.0% |
| $35,000 to $49,999 | 381 | 13.6% |
| $50,000 to $74,999 | 532 | 19.0% |
| $75,000 to $99,999 | 602 | 21.5% |
| $100,000 to $149,999 | 255 | 9.1% |
| $150,000 to $199,999 | 90 | 3.2% |
| $200,000+ | 92 | 3.3% |
Family Income by Famaliy Size in Washington County
4-person families (371 | 13.3%) account for the highest median family income in Washington County with $84,375 per family, while 3-person families (646 | 23.1%) have the highest median income of $24,524 per family member.
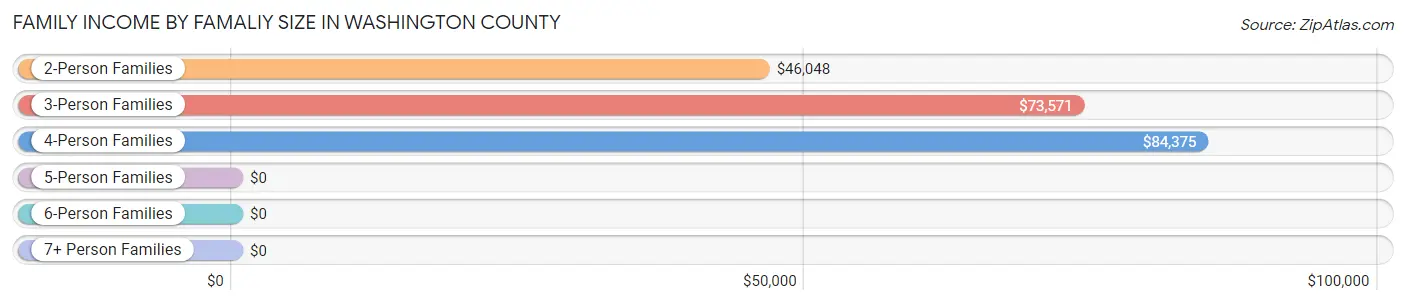
| Income Bracket | # Families | Median Income |
| 2-Person Families | 1,588 (56.8%) | $46,048 |
| 3-Person Families | 646 (23.1%) | $73,571 |
| 4-Person Families | 371 (13.3%) | $84,375 |
| 5-Person Families | 186 (6.7%) | $0 |
| 6-Person Families | 7 (0.3%) | $0 |
| 7+ Person Families | 0 (0.0%) | $0 |
| Total | 2,798 (100.0%) | $58,947 |
Family Income by Number of Earners in Washington County
The median family income in Washington County is $58,947, with families comprising 3+ earners (183) having the highest median family income of $92,679, while families with no earners (765) have the lowest median family income of $33,496, accounting for 6.5% and 27.3% of families, respectively.
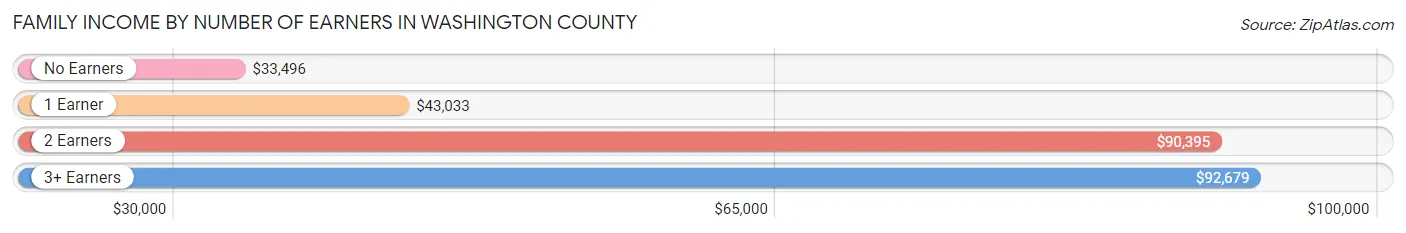
| Number of Earners | # Families | Median Income |
| No Earners | 765 (27.3%) | $33,496 |
| 1 Earner | 1,120 (40.0%) | $43,033 |
| 2 Earners | 730 (26.1%) | $90,395 |
| 3+ Earners | 183 (6.5%) | $92,679 |
| Total | 2,798 (100.0%) | $58,947 |
Household Income in Washington County
Household Income Brackets in Washington County
With 793 households falling in the category, the $50,000 to $74,999 income range is the most frequent in Washington County, accounting for 16.2% of all households. In contrast, only 88 households (1.8%) fall into the $150,000 to $199,999 income bracket, making it the least populous group.
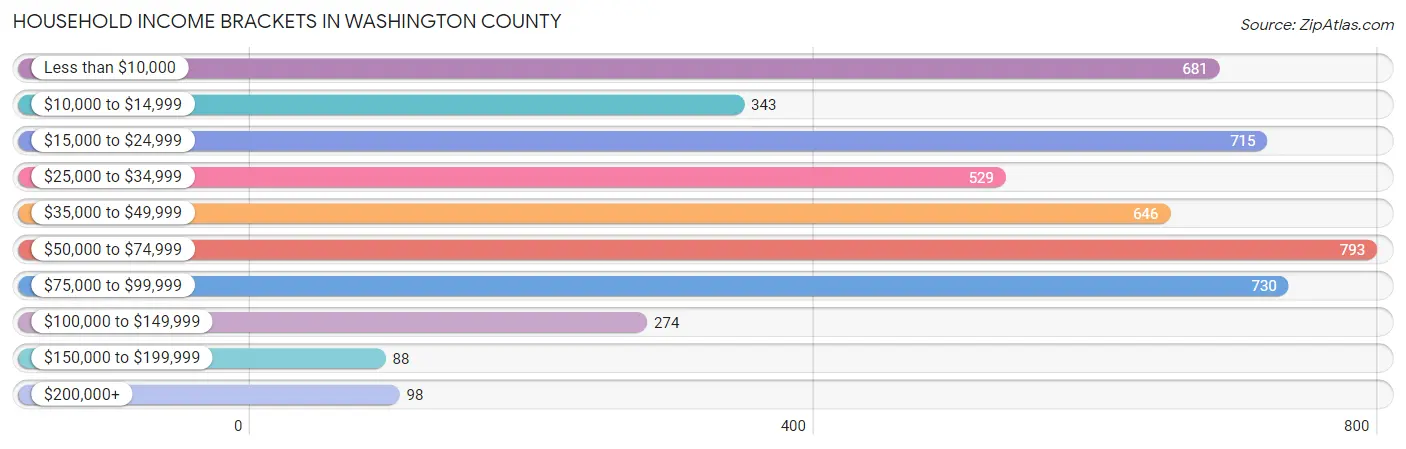
| Income Bracket | # Households | % Households |
| Less than $10,000 | 681 | 13.9% |
| $10,000 to $14,999 | 343 | 7.0% |
| $15,000 to $24,999 | 715 | 14.6% |
| $25,000 to $34,999 | 529 | 10.8% |
| $35,000 to $49,999 | 646 | 13.2% |
| $50,000 to $74,999 | 793 | 16.2% |
| $75,000 to $99,999 | 730 | 14.9% |
| $100,000 to $149,999 | 274 | 5.6% |
| $150,000 to $199,999 | 88 | 1.8% |
| $200,000+ | 98 | 2.0% |
Household Income by Householder Age in Washington County
The median household income in Washington County is $38,927, with the highest median household income of $52,948 found in the 45 to 64 years age bracket for the primary householder. A total of 1,797 households (36.7%) fall into this category. Meanwhile, the 15 to 24 years age bracket for the primary householder has the lowest median household income of $0, with 21 households (0.4%) in this group.
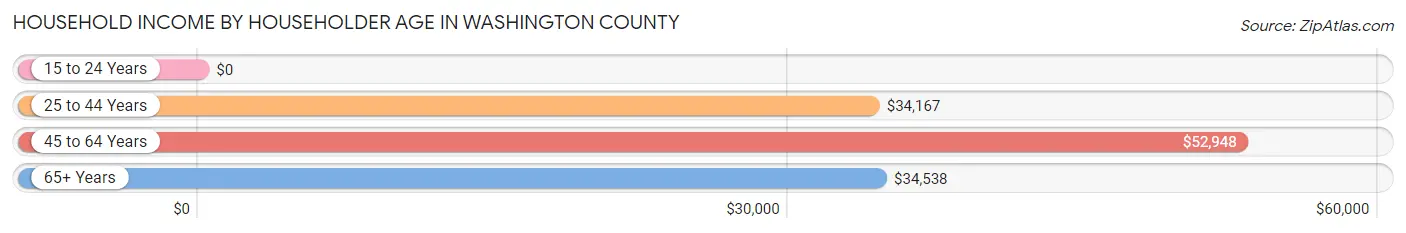
| Income Bracket | # Households | Median Income |
| 15 to 24 Years | 21 (0.4%) | $0 |
| 25 to 44 Years | 1,100 (22.5%) | $34,167 |
| 45 to 64 Years | 1,797 (36.7%) | $52,948 |
| 65+ Years | 1,979 (40.4%) | $34,538 |
| Total | 4,897 (100.0%) | $38,927 |
Poverty in Washington County
Income Below Poverty by Sex and Age in Washington County
With 25.5% poverty level for males and 17.5% for females among the residents of Washington County, 18 to 24 year old males and 5 year old females are the most vulnerable to poverty, with 265 males (55.0%) and 22 females (100.0%) in their respective age groups living below the poverty level.
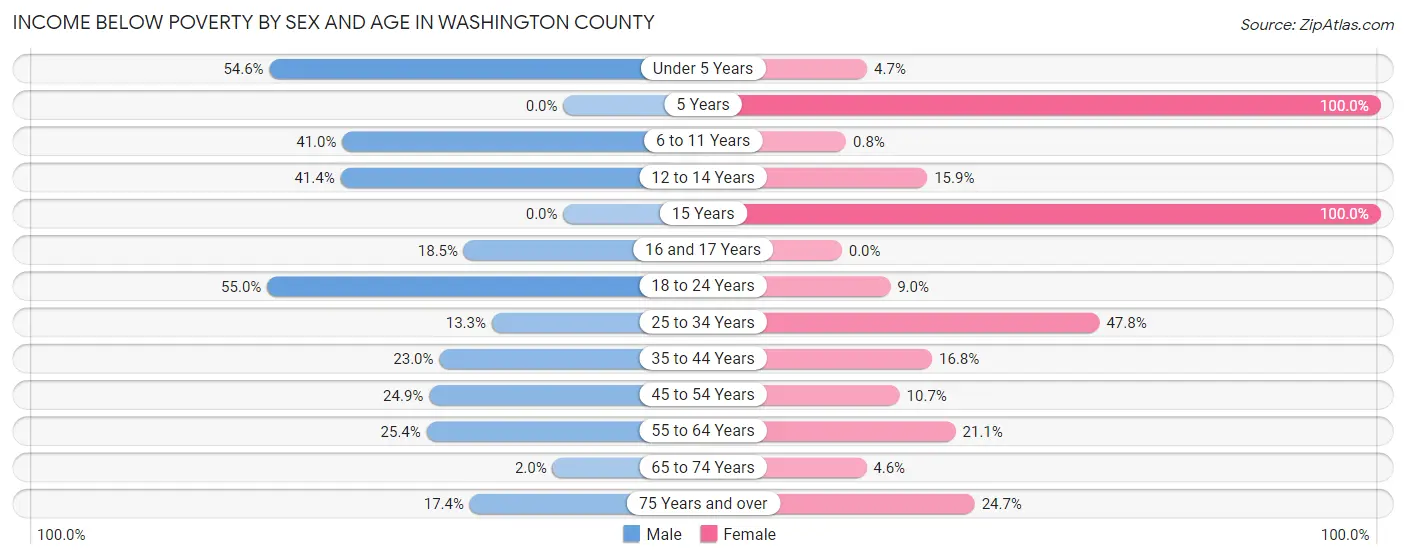
| Age Bracket | Male | Female |
| Under 5 Years | 120 (54.5%) | 4 (4.7%) |
| 5 Years | 0 (0.0%) | 22 (100.0%) |
| 6 to 11 Years | 215 (41.0%) | 2 (0.8%) |
| 12 to 14 Years | 187 (41.4%) | 23 (15.9%) |
| 15 Years | 0 (0.0%) | 3 (100.0%) |
| 16 and 17 Years | 29 (18.5%) | 0 (0.0%) |
| 18 to 24 Years | 265 (55.0%) | 37 (9.0%) |
| 25 to 34 Years | 51 (13.3%) | 275 (47.8%) |
| 35 to 44 Years | 131 (23.0%) | 91 (16.8%) |
| 45 to 54 Years | 136 (24.9%) | 75 (10.7%) |
| 55 to 64 Years | 201 (25.4%) | 195 (21.1%) |
| 65 to 74 Years | 17 (2.0%) | 39 (4.6%) |
| 75 Years and over | 70 (17.4%) | 166 (24.7%) |
| Total | 1,422 (25.5%) | 932 (17.5%) |
Income Above Poverty by Sex and Age in Washington County
According to the poverty statistics in Washington County, males aged 5 years and females aged 16 and 17 years are the age groups that are most secure financially, with 100.0% of males and 100.0% of females in these age groups living above the poverty line.
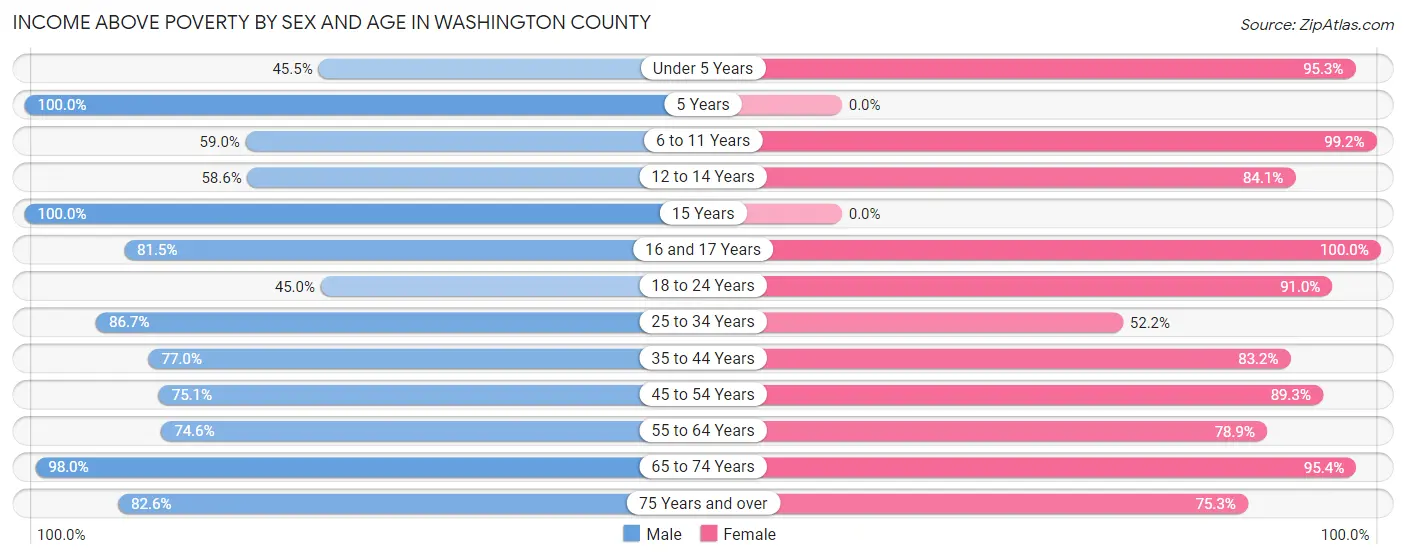
| Age Bracket | Male | Female |
| Under 5 Years | 100 (45.5%) | 81 (95.3%) |
| 5 Years | 69 (100.0%) | 0 (0.0%) |
| 6 to 11 Years | 309 (59.0%) | 248 (99.2%) |
| 12 to 14 Years | 265 (58.6%) | 122 (84.1%) |
| 15 Years | 125 (100.0%) | 0 (0.0%) |
| 16 and 17 Years | 128 (81.5%) | 135 (100.0%) |
| 18 to 24 Years | 217 (45.0%) | 375 (91.0%) |
| 25 to 34 Years | 333 (86.7%) | 300 (52.2%) |
| 35 to 44 Years | 438 (77.0%) | 452 (83.2%) |
| 45 to 54 Years | 410 (75.1%) | 623 (89.3%) |
| 55 to 64 Years | 591 (74.6%) | 728 (78.9%) |
| 65 to 74 Years | 832 (98.0%) | 817 (95.4%) |
| 75 Years and over | 333 (82.6%) | 507 (75.3%) |
| Total | 4,150 (74.5%) | 4,388 (82.5%) |
Income Below Poverty Among Married-Couple Families in Washington County
The poverty statistics for married-couple families in Washington County show that 4.3% or 76 of the total 1,765 families live below the poverty line. Families with 3 or 4 children have the highest poverty rate of 13.0%, comprising of 7 families. On the other hand, families with 1 or 2 children have the lowest poverty rate of 0.0%, which includes 0 families.
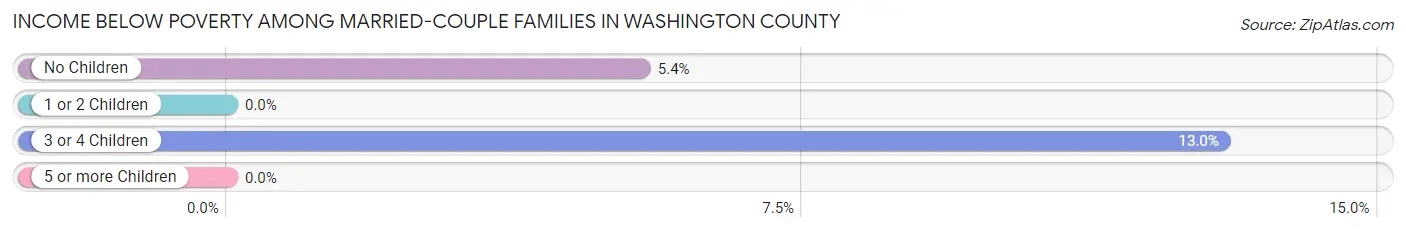
| Children | Above Poverty | Below Poverty |
| No Children | 1,212 (94.6%) | 69 (5.4%) |
| 1 or 2 Children | 430 (100.0%) | 0 (0.0%) |
| 3 or 4 Children | 47 (87.0%) | 7 (13.0%) |
| 5 or more Children | 0 (0.0%) | 0 (0.0%) |
| Total | 1,689 (95.7%) | 76 (4.3%) |
Income Below Poverty Among Single-Parent Households in Washington County
According to the poverty data in Washington County, 42.2% or 35 single-father households and 40.6% or 386 single-mother households are living below the poverty line. Among single-father households, those with no children have the highest poverty rate, with 35 households (52.2%) experiencing poverty. Likewise, among single-mother households, those with 3 or 4 children have the highest poverty rate, with 2 households (100.0%) falling below the poverty line.
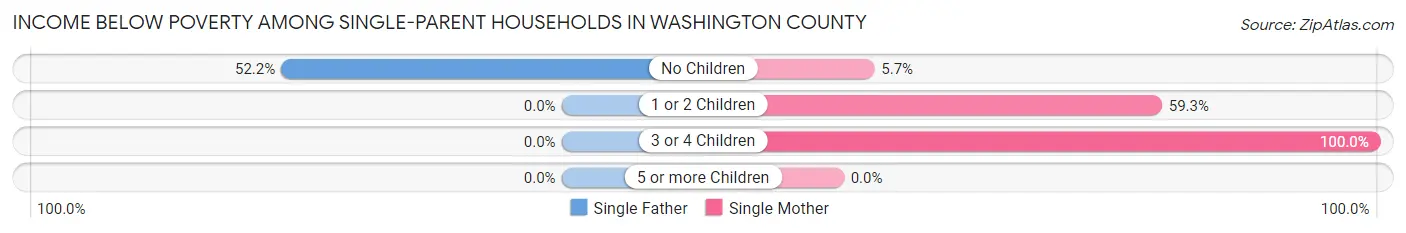
| Children | Single Father | Single Mother |
| No Children | 35 (52.2%) | 19 (5.7%) |
| 1 or 2 Children | 0 (0.0%) | 365 (59.3%) |
| 3 or 4 Children | 0 (0.0%) | 2 (100.0%) |
| 5 or more Children | 0 (0.0%) | 0 (0.0%) |
| Total | 35 (42.2%) | 386 (40.6%) |
Income Below Poverty Among Married-Couple vs Single-Parent Households in Washington County
The poverty data for Washington County shows that 76 of the married-couple family households (4.3%) and 421 of the single-parent households (40.8%) are living below the poverty level. Within the married-couple family households, those with 3 or 4 children have the highest poverty rate, with 7 households (13.0%) falling below the poverty line. Among the single-parent households, those with 3 or 4 children have the highest poverty rate, with 2 household (100.0%) living below poverty.
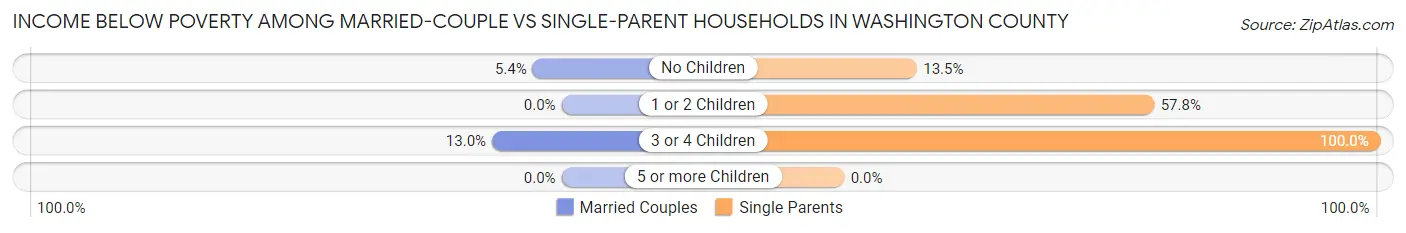
| Children | Married-Couple Families | Single-Parent Households |
| No Children | 69 (5.4%) | 54 (13.5%) |
| 1 or 2 Children | 0 (0.0%) | 365 (57.8%) |
| 3 or 4 Children | 7 (13.0%) | 2 (100.0%) |
| 5 or more Children | 0 (0.0%) | 0 (0.0%) |
| Total | 76 (4.3%) | 421 (40.8%) |
Race in Washington County
The most populous races in Washington County are Black / African American (5,335 | 48.3%), White / Caucasian (5,060 | 45.8%), and Hispanic or Latino (684 | 6.2%).
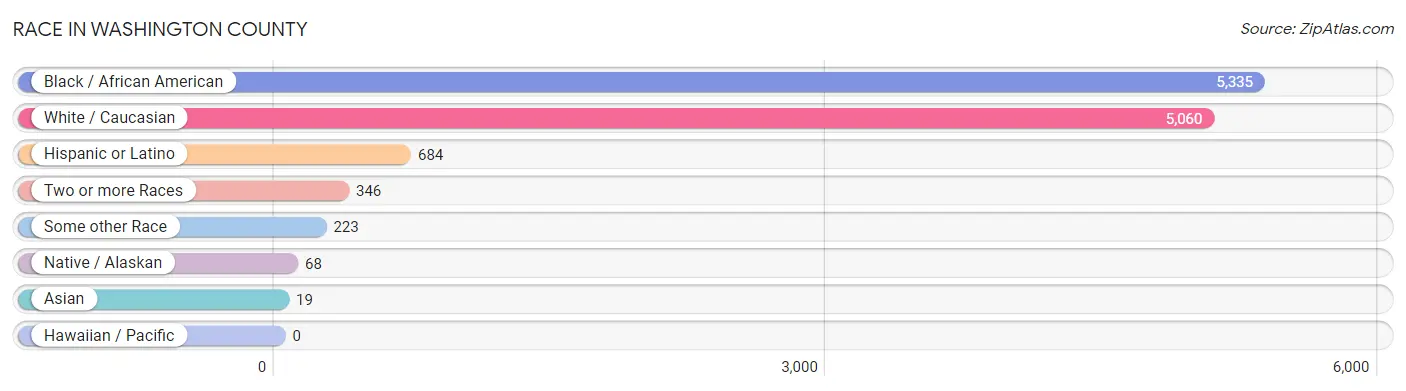
| Race | # Population | % Population |
| Asian | 19 | 0.2% |
| Black / African American | 5,335 | 48.3% |
| Hawaiian / Pacific | 0 | 0.0% |
| Hispanic or Latino | 684 | 6.2% |
| Native / Alaskan | 68 | 0.6% |
| White / Caucasian | 5,060 | 45.8% |
| Two or more Races | 346 | 3.1% |
| Some other Race | 223 | 2.0% |
| Total | 11,051 | 100.0% |
Ancestry in Washington County
The most populous ancestries reported in Washington County are American (1,830 | 16.6%), English (846 | 7.7%), Mexican (487 | 4.4%), German (196 | 1.8%), and Irish (190 | 1.7%), together accounting for 32.1% of all Washington County residents.
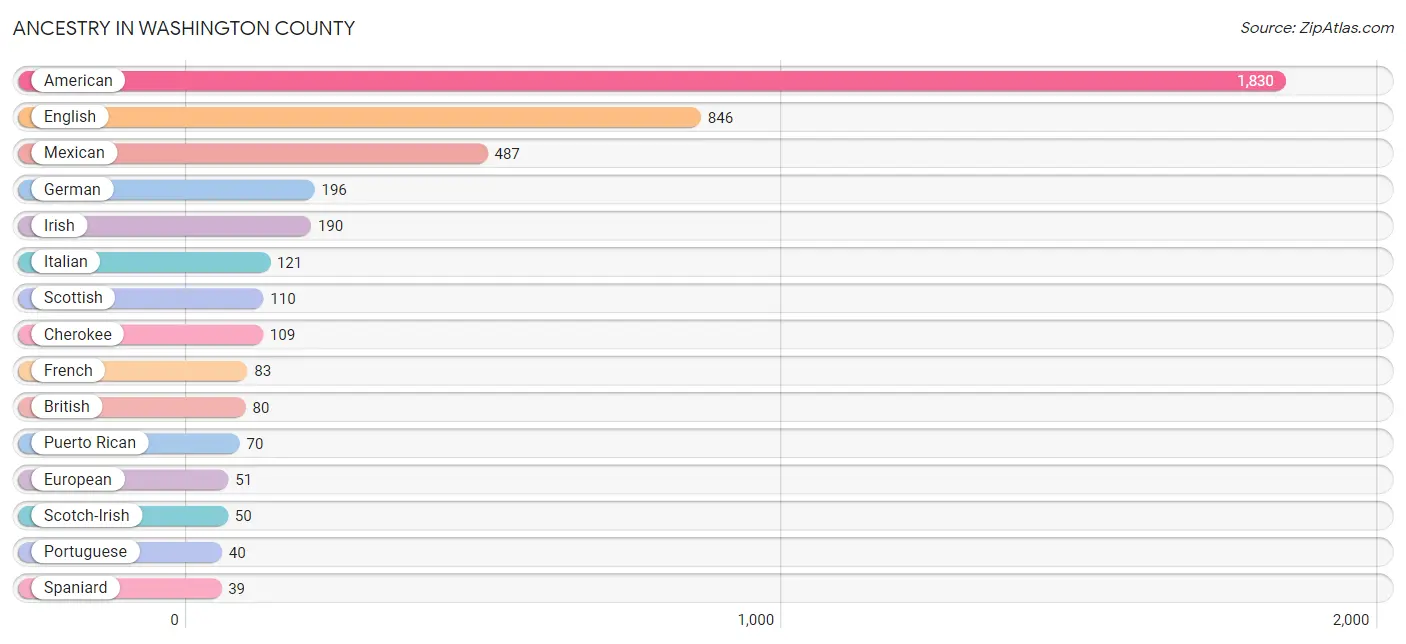
| Ancestry | # Population | % Population |
| American | 1,830 | 16.6% |
| Arab | 4 | 0.0% |
| Belgian | 2 | 0.0% |
| Blackfeet | 38 | 0.3% |
| British | 80 | 0.7% |
| Burmese | 10 | 0.1% |
| Central American | 21 | 0.2% |
| Cherokee | 109 | 1.0% |
| Colombian | 17 | 0.2% |
| Cuban | 27 | 0.2% |
| Dominican | 4 | 0.0% |
| Dutch | 19 | 0.2% |
| Eastern European | 9 | 0.1% |
| English | 846 | 7.7% |
| European | 51 | 0.5% |
| French | 83 | 0.7% |
| French Canadian | 9 | 0.1% |
| German | 196 | 1.8% |
| Guatemalan | 6 | 0.1% |
| Honduran | 15 | 0.1% |
| Indian (Asian) | 19 | 0.2% |
| Irish | 190 | 1.7% |
| Italian | 121 | 1.1% |
| Korean | 17 | 0.2% |
| Mexican | 487 | 4.4% |
| Norwegian | 20 | 0.2% |
| Osage | 7 | 0.1% |
| Peruvian | 19 | 0.2% |
| Polish | 19 | 0.2% |
| Portuguese | 40 | 0.4% |
| Puerto Rican | 70 | 0.6% |
| Romanian | 9 | 0.1% |
| Scotch-Irish | 50 | 0.4% |
| Scottish | 110 | 1.0% |
| Slovak | 8 | 0.1% |
| South American | 36 | 0.3% |
| Spaniard | 39 | 0.4% |
| Spanish American Indian | 19 | 0.2% |
| Subsaharan African | 33 | 0.3% |
| Swedish | 26 | 0.2% |
| Syrian | 4 | 0.0% |
| Welsh | 39 | 0.4% | View All 42 Rows |
Immigrants in Washington County
The most numerous immigrant groups reported in Washington County came from Latin America (137 | 1.2%), Central America (118 | 1.1%), Mexico (97 | 0.9%), Peru (19 | 0.2%), and South America (19 | 0.2%), together accounting for 3.5% of all Washington County residents.
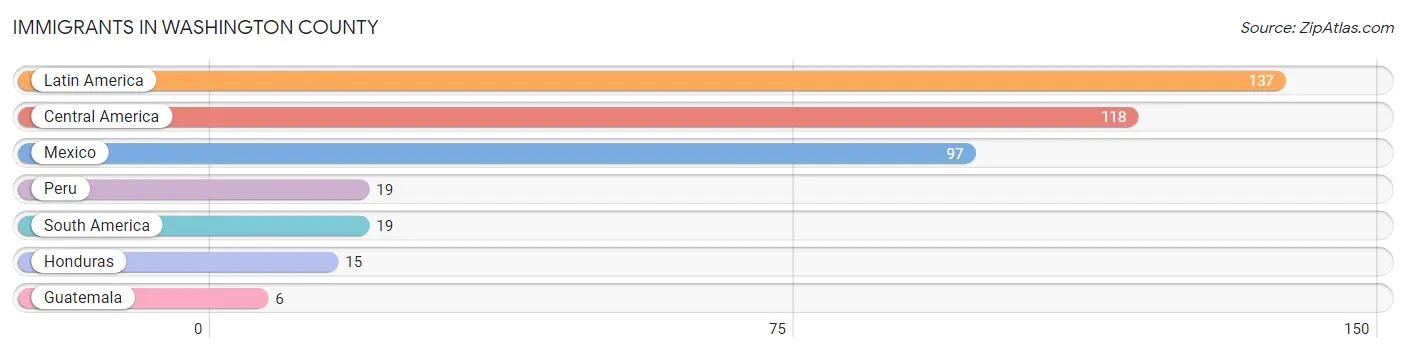
| Immigration Origin | # Population | % Population |
| Central America | 118 | 1.1% |
| Guatemala | 6 | 0.1% |
| Honduras | 15 | 0.1% |
| Latin America | 137 | 1.2% |
| Mexico | 97 | 0.9% |
| Peru | 19 | 0.2% |
| South America | 19 | 0.2% | View All 7 Rows |
Sex and Age in Washington County
Sex and Age in Washington County
The most populous age groups in Washington County are 10 to 14 Years (584 | 10.3%) for men and 60 to 64 Years (587 | 10.9%) for women.
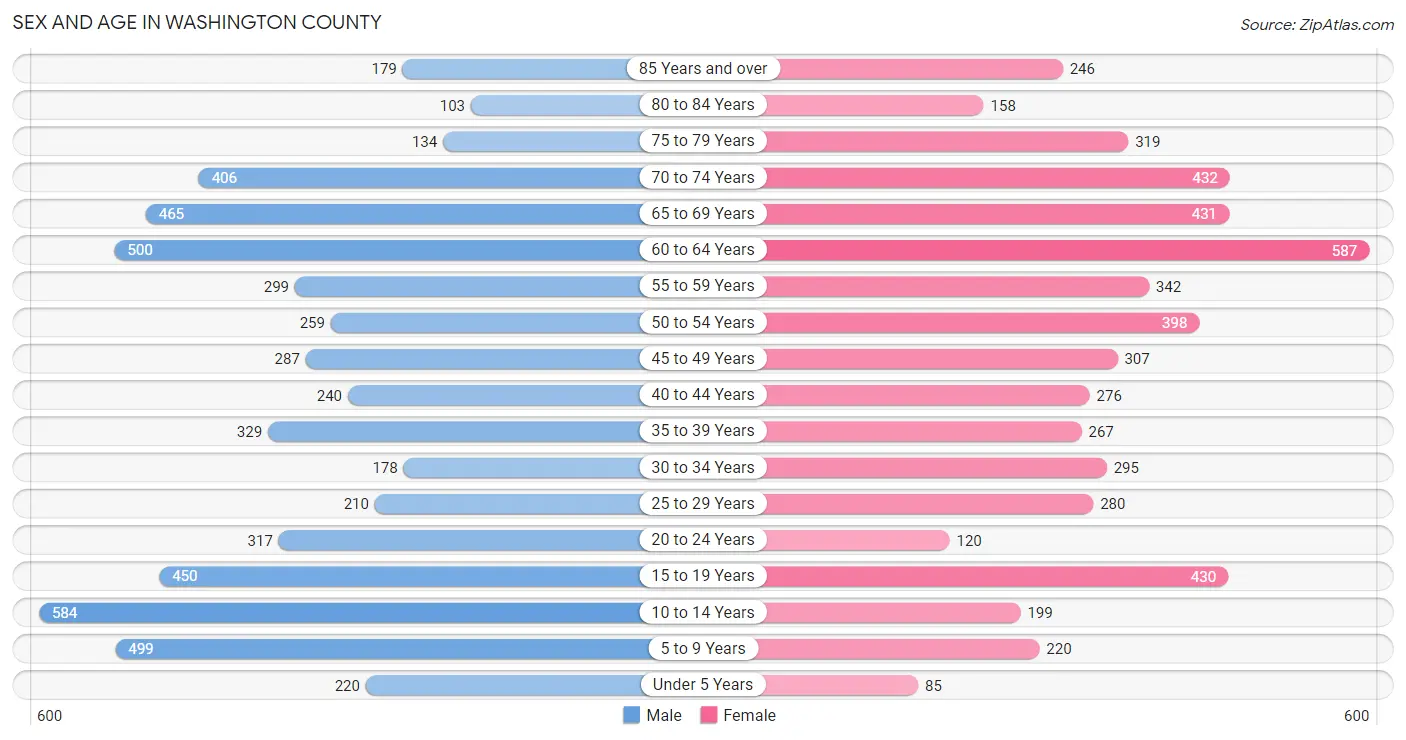
| Age Bracket | Male | Female |
| Under 5 Years | 220 (3.9%) | 85 (1.6%) |
| 5 to 9 Years | 499 (8.8%) | 220 (4.1%) |
| 10 to 14 Years | 584 (10.3%) | 199 (3.7%) |
| 15 to 19 Years | 450 (8.0%) | 430 (8.0%) |
| 20 to 24 Years | 317 (5.6%) | 120 (2.2%) |
| 25 to 29 Years | 210 (3.7%) | 280 (5.2%) |
| 30 to 34 Years | 178 (3.2%) | 295 (5.5%) |
| 35 to 39 Years | 329 (5.8%) | 267 (5.0%) |
| 40 to 44 Years | 240 (4.2%) | 276 (5.1%) |
| 45 to 49 Years | 287 (5.1%) | 307 (5.7%) |
| 50 to 54 Years | 259 (4.6%) | 398 (7.4%) |
| 55 to 59 Years | 299 (5.3%) | 342 (6.3%) |
| 60 to 64 Years | 500 (8.8%) | 587 (10.9%) |
| 65 to 69 Years | 465 (8.2%) | 431 (8.0%) |
| 70 to 74 Years | 406 (7.2%) | 432 (8.0%) |
| 75 to 79 Years | 134 (2.4%) | 319 (5.9%) |
| 80 to 84 Years | 103 (1.8%) | 158 (2.9%) |
| 85 Years and over | 179 (3.2%) | 246 (4.6%) |
| Total | 5,659 (100.0%) | 5,392 (100.0%) |
Families and Households in Washington County
Median Family Size in Washington County
The median family size in Washington County is 3.04 persons per family, with single female/mother families (950 | 34.0%) accounting for the largest median family size of 3.34 persons per family. On the other hand, single male/father families (83 | 3.0%) represent the smallest median family size with 1.73 persons per family.
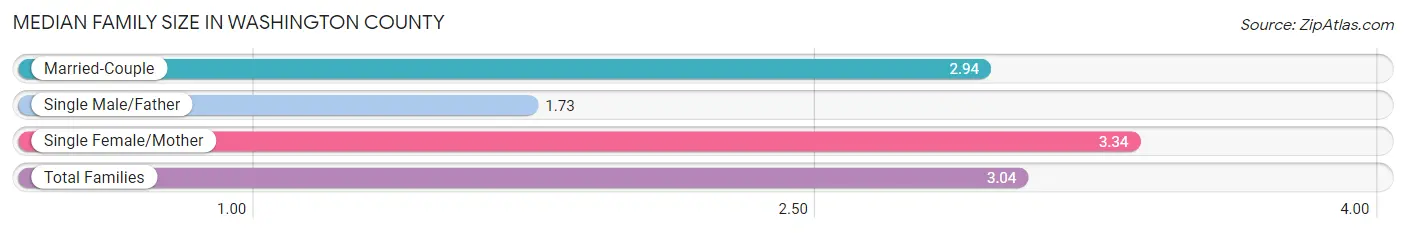
| Family Type | # Families | Family Size |
| Married-Couple | 1,765 (63.1%) | 2.94 |
| Single Male/Father | 83 (3.0%) | 1.73 |
| Single Female/Mother | 950 (34.0%) | 3.34 |
| Total Families | 2,798 (100.0%) | 3.04 |
Median Household Size in Washington County
The median household size in Washington County is 2.23 persons per household, with single female/mother households (950 | 19.4%) accounting for the largest median household size of 3.44 persons per household. non-family households (2,099 | 42.9%) represent the smallest median household size with 1.08 persons per household.
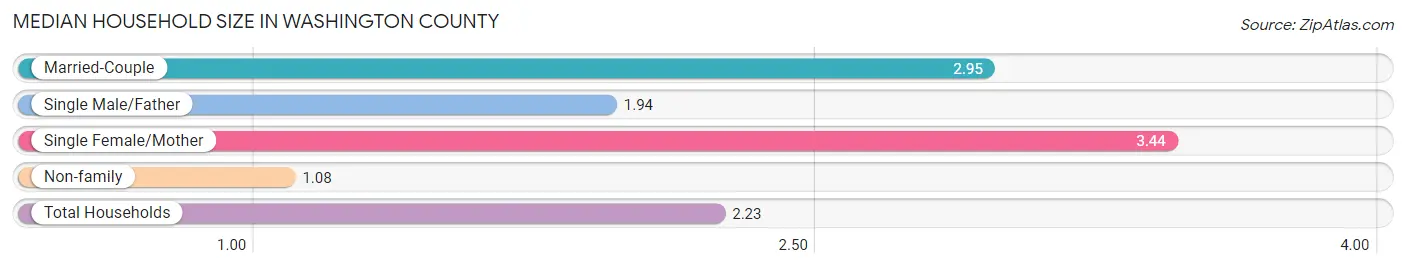
| Household Type | # Households | Household Size |
| Married-Couple | 1,765 (36.0%) | 2.95 |
| Single Male/Father | 83 (1.7%) | 1.94 |
| Single Female/Mother | 950 (19.4%) | 3.44 |
| Non-family | 2,099 (42.9%) | 1.08 |
| Total Households | 4,897 (100.0%) | 2.23 |
Household Size by Marriage Status in Washington County
Out of a total of 4,897 households in Washington County, 2,798 (57.1%) are family households, while 2,099 (42.9%) are nonfamily households. The most numerous type of family households are 2-person households, comprising 1,546, and the most common type of nonfamily households are 1-person households, comprising 1,933.
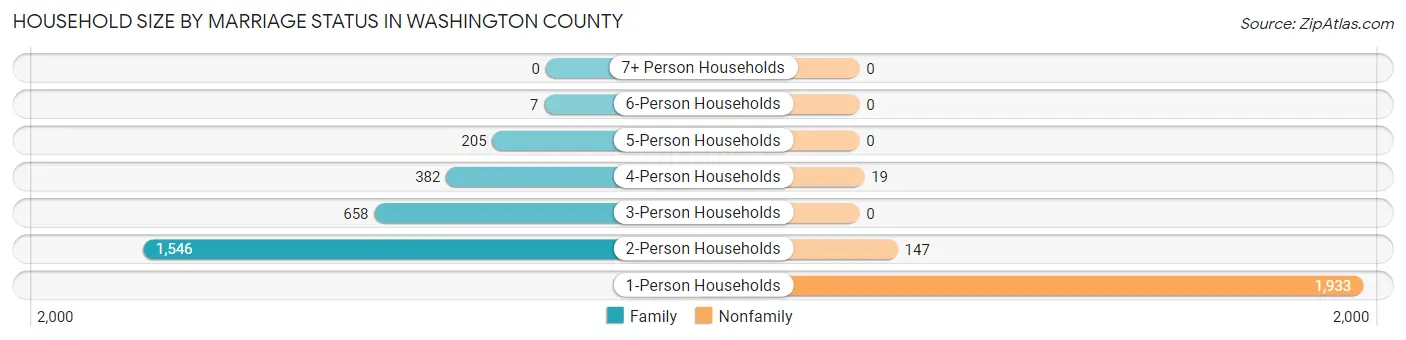
| Household Size | Family Households | Nonfamily Households |
| 1-Person Households | - | 1,933 (39.5%) |
| 2-Person Households | 1,546 (31.6%) | 147 (3.0%) |
| 3-Person Households | 658 (13.4%) | 0 (0.0%) |
| 4-Person Households | 382 (7.8%) | 19 (0.4%) |
| 5-Person Households | 205 (4.2%) | 0 (0.0%) |
| 6-Person Households | 7 (0.1%) | 0 (0.0%) |
| 7+ Person Households | 0 (0.0%) | 0 (0.0%) |
| Total | 2,798 (57.1%) | 2,099 (42.9%) |
Female Fertility in Washington County
Fertility by Age in Washington County
Average fertility rate in Washington County is 73.0 births per 1,000 women. Women in the age bracket of 20 to 34 years have the highest fertility rate with 213.0 births per 1,000 women. Women in the age bracket of 20 to 34 years acount for 96.7% of all women with births.
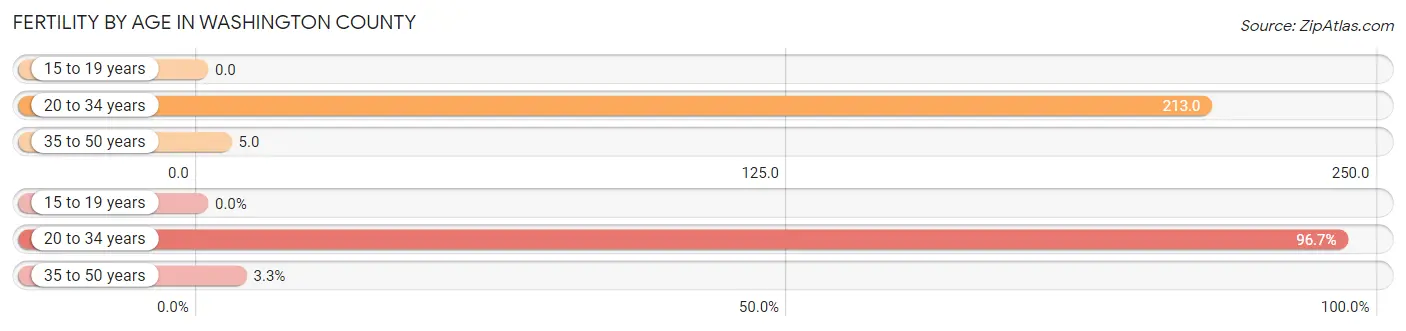
| Age Bracket | Women with Births | Births / 1,000 Women |
| 15 to 19 years | 0 (0.0%) | 0.0 |
| 20 to 34 years | 148 (96.7%) | 213.0 |
| 35 to 50 years | 5 (3.3%) | 5.0 |
| Total | 153 (100.0%) | 73.0 |
Fertility by Age by Marriage Status in Washington County
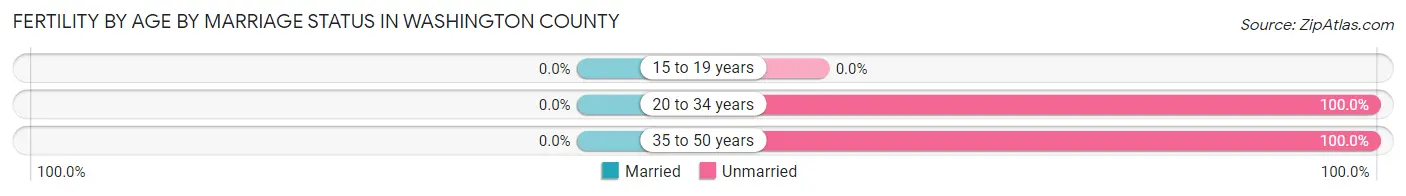
| Age Bracket | Married | Unmarried |
| 15 to 19 years | 0 (0.0%) | 0 (0.0%) |
| 20 to 34 years | 0 (0.0%) | 148 (100.0%) |
| 35 to 50 years | 0 (0.0%) | 5 (100.0%) |
| Total | 0 (0.0%) | 153 (100.0%) |
Fertility by Education in Washington County
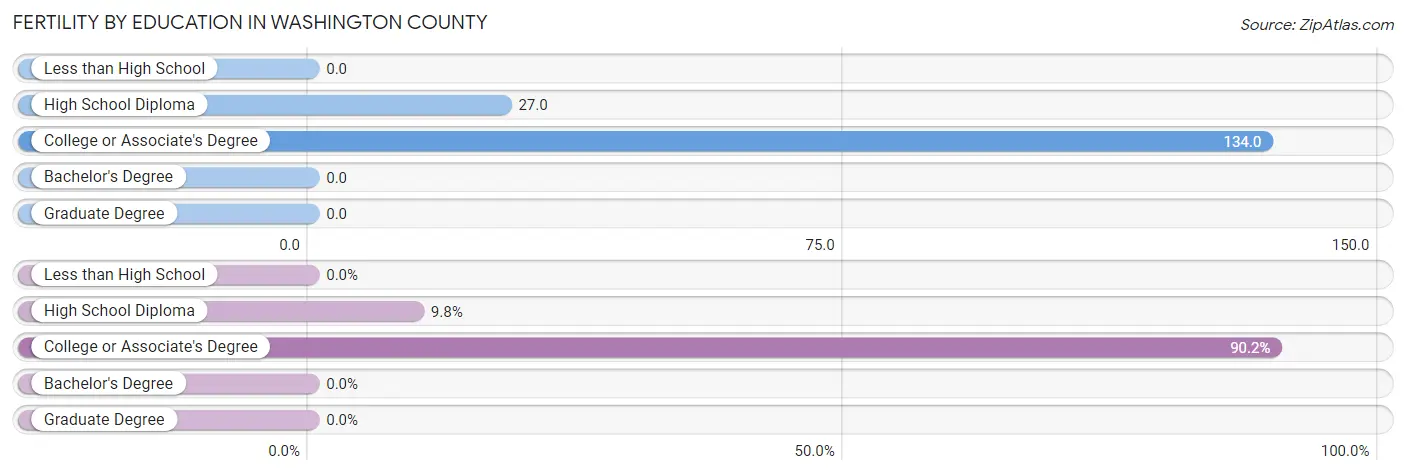
| Educational Attainment | Women with Births | Births / 1,000 Women |
| Less than High School | 0 (0.0%) | 0.0 |
| High School Diploma | 15 (9.8%) | 27.0 |
| College or Associate's Degree | 138 (90.2%) | 134.0 |
| Bachelor's Degree | 0 (0.0%) | 0.0 |
| Graduate Degree | 0 (0.0%) | 0.0 |
| Total | 153 (100.0%) | 73.0 |
Fertility by Education by Marriage Status in Washington County
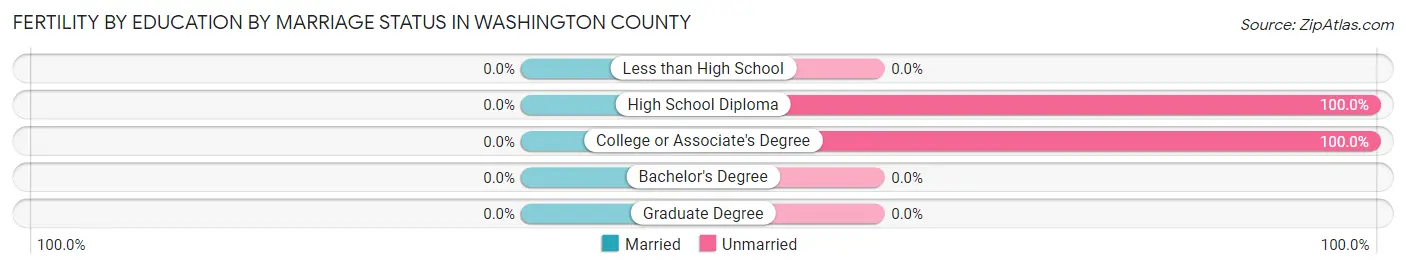
| Educational Attainment | Married | Unmarried |
| Less than High School | 0 (0.0%) | 0 (0.0%) |
| High School Diploma | 0 (0.0%) | 15 (100.0%) |
| College or Associate's Degree | 0 (0.0%) | 138 (100.0%) |
| Bachelor's Degree | 0 (0.0%) | 0 (0.0%) |
| Graduate Degree | 0 (0.0%) | 0 (0.0%) |
| Total | 0 (0.0%) | 153 (100.0%) |
Employment Characteristics in Washington County
Employment by Class of Employer in Washington County
Among the 3,906 employed individuals in Washington County, private company employees (2,323 | 59.5%), local government employees (375 | 9.6%), and state government employees (352 | 9.0%) make up the most common classes of employment.
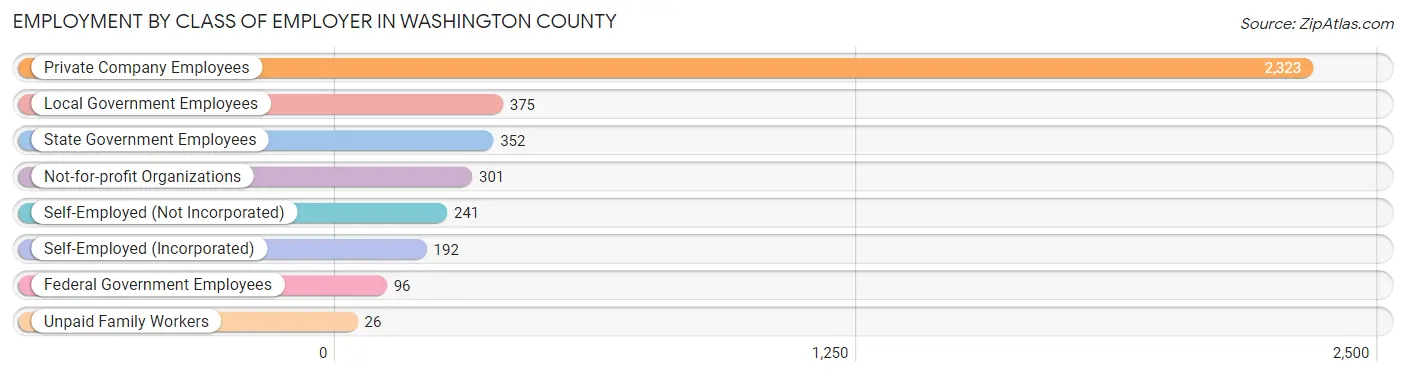
| Employer Class | # Employees | % Employees |
| Private Company Employees | 2,323 | 59.5% |
| Self-Employed (Incorporated) | 192 | 4.9% |
| Self-Employed (Not Incorporated) | 241 | 6.2% |
| Not-for-profit Organizations | 301 | 7.7% |
| Local Government Employees | 375 | 9.6% |
| State Government Employees | 352 | 9.0% |
| Federal Government Employees | 96 | 2.5% |
| Unpaid Family Workers | 26 | 0.7% |
| Total | 3,906 | 100.0% |
Employment Status by Age in Washington County
According to the labor force statistics for Washington County, out of the total population over 16 years of age (9,115), 49.3% or 4,494 individuals are in the labor force, with 12.7% or 571 of them unemployed. The age group with the highest labor force participation rate is 25 to 29 years, with 98.0% or 480 individuals in the labor force. Within the labor force, the 25 to 29 years age range has the highest percentage of unemployed individuals, with 48.5% or 233 of them being unemployed.
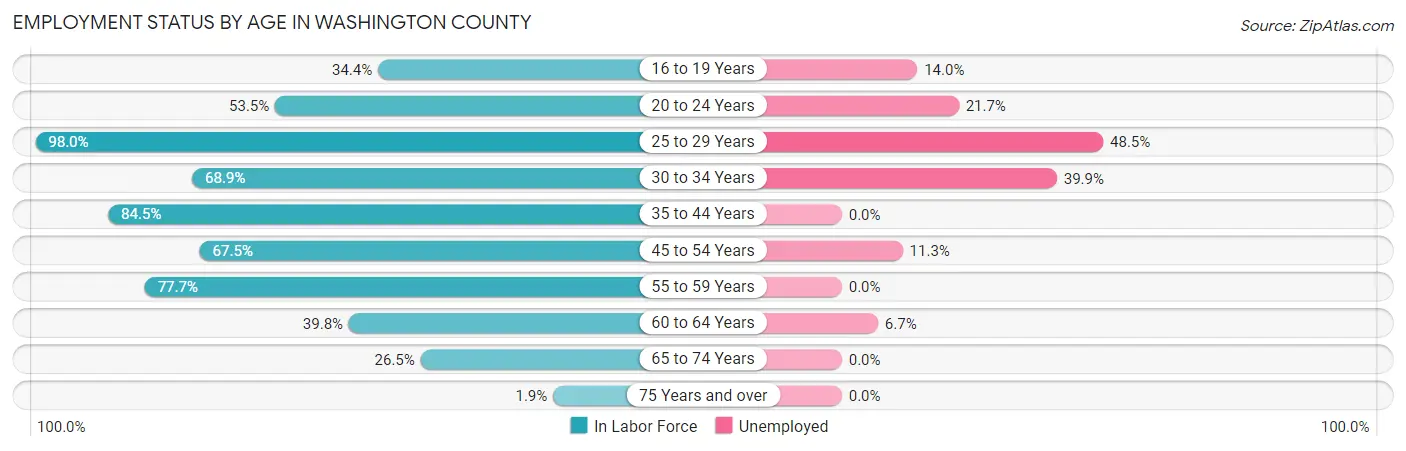
| Age Bracket | In Labor Force | Unemployed |
| 16 to 19 Years | 258 (34.4%) | 36 (14.0%) |
| 20 to 24 Years | 234 (53.5%) | 51 (21.7%) |
| 25 to 29 Years | 480 (98.0%) | 233 (48.5%) |
| 30 to 34 Years | 326 (68.9%) | 130 (39.9%) |
| 35 to 44 Years | 940 (84.5%) | 0 (0.0%) |
| 45 to 54 Years | 844 (67.5%) | 95 (11.3%) |
| 55 to 59 Years | 498 (77.7%) | 0 (0.0%) |
| 60 to 64 Years | 433 (39.8%) | 29 (6.7%) |
| 65 to 74 Years | 460 (26.5%) | 0 (0.0%) |
| 75 Years and over | 22 (1.9%) | 0 (0.0%) |
| Total | 4,494 (49.3%) | 571 (12.7%) |
Employment Status by Educational Attainment in Washington County
According to labor force statistics for Washington County, 69.7% of individuals (3,523) out of the total population between 25 and 64 years of age (5,054) are in the labor force, with 13.8% or 486 of them being unemployed. The group with the highest labor force participation rate are those with the educational attainment of college / associate degree, with 77.7% or 1,758 individuals in the labor force. Within the labor force, individuals with high school diploma education have the highest percentage of unemployment, with 25.5% or 280 of them being unemployed.
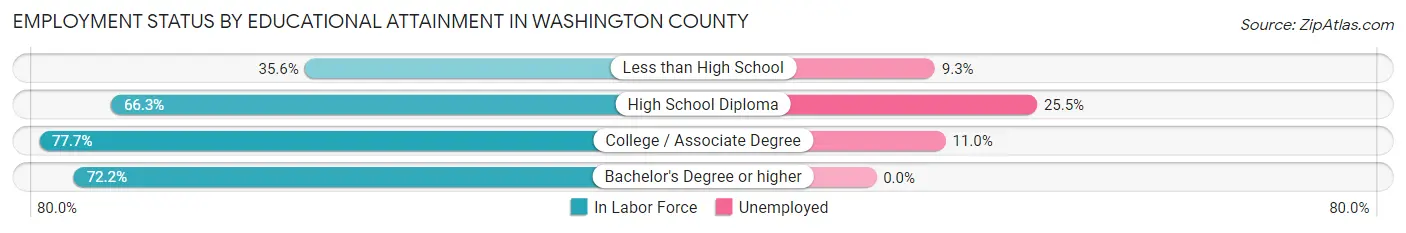
| Educational Attainment | In Labor Force | Unemployed |
| Less than High School | 150 (35.6%) | 39 (9.3%) |
| High School Diploma | 1,099 (66.3%) | 423 (25.5%) |
| College / Associate Degree | 1,758 (77.7%) | 249 (11.0%) |
| Bachelor's Degree or higher | 515 (72.2%) | 0 (0.0%) |
| Total | 3,523 (69.7%) | 697 (13.8%) |
Employment Occupations by Sex in Washington County
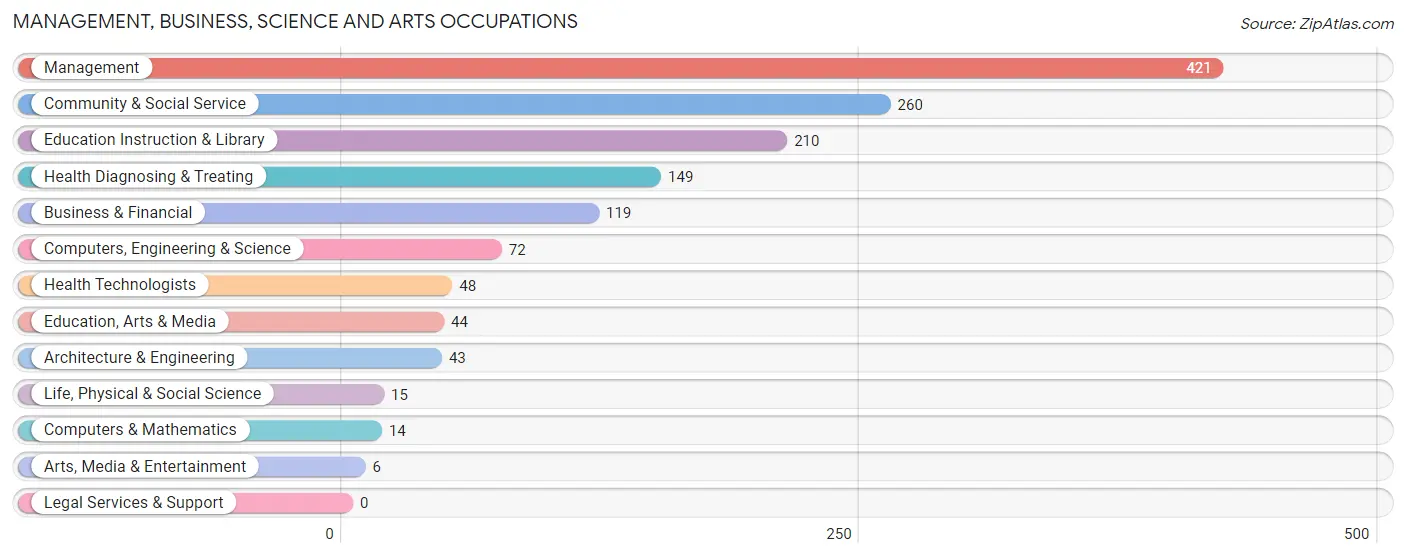
Management, Business, Science and Arts Occupations
The most common Management, Business, Science and Arts occupations in Washington County are Management (421 | 10.8%), Community & Social Service (260 | 6.7%), Education Instruction & Library (210 | 5.4%), Health Diagnosing & Treating (149 | 3.8%), and Business & Financial (119 | 3.1%).
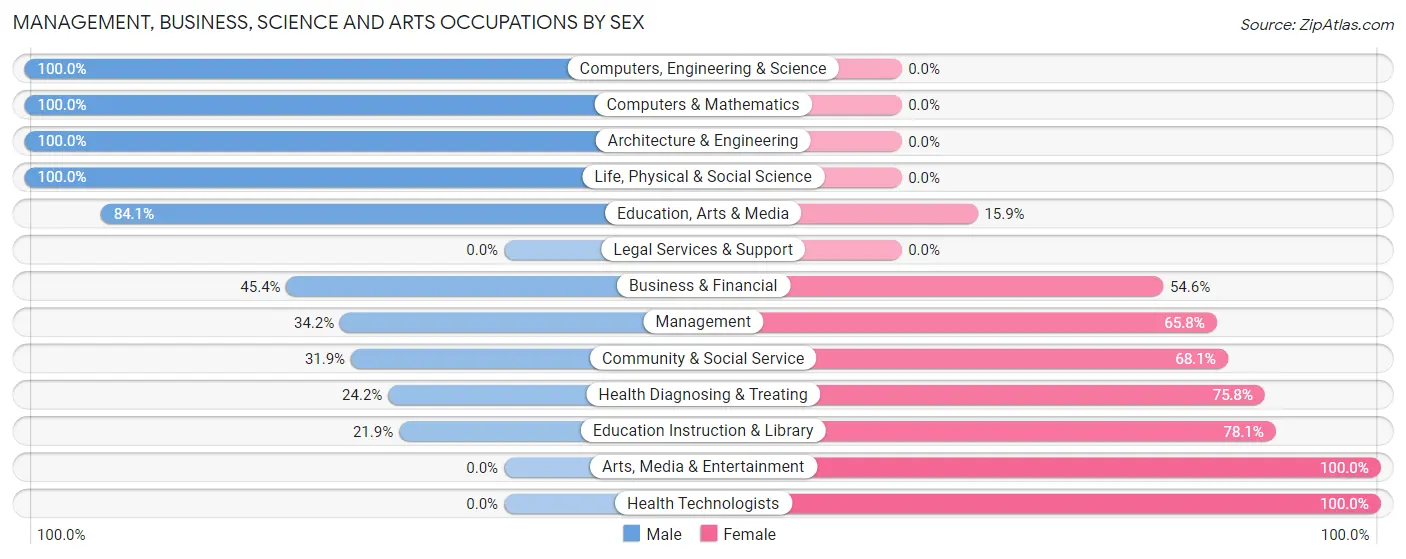
Management, Business, Science and Arts Occupations by Sex
Within the Management, Business, Science and Arts occupations in Washington County, the most male-oriented occupations are Computers, Engineering & Science (100.0%), Computers & Mathematics (100.0%), and Architecture & Engineering (100.0%), while the most female-oriented occupations are Arts, Media & Entertainment (100.0%), Health Technologists (100.0%), and Education Instruction & Library (78.1%).
| Occupation | Male | Female |
| Management | 144 (34.2%) | 277 (65.8%) |
| Business & Financial | 54 (45.4%) | 65 (54.6%) |
| Computers, Engineering & Science | 72 (100.0%) | 0 (0.0%) |
| Computers & Mathematics | 14 (100.0%) | 0 (0.0%) |
| Architecture & Engineering | 43 (100.0%) | 0 (0.0%) |
| Life, Physical & Social Science | 15 (100.0%) | 0 (0.0%) |
| Community & Social Service | 83 (31.9%) | 177 (68.1%) |
| Education, Arts & Media | 37 (84.1%) | 7 (15.9%) |
| Legal Services & Support | 0 (0.0%) | 0 (0.0%) |
| Education Instruction & Library | 46 (21.9%) | 164 (78.1%) |
| Arts, Media & Entertainment | 0 (0.0%) | 6 (100.0%) |
| Health Diagnosing & Treating | 36 (24.2%) | 113 (75.8%) |
| Health Technologists | 0 (0.0%) | 48 (100.0%) |
| Total (Category) | 389 (38.1%) | 632 (61.9%) |
| Total (Overall) | 1,814 (46.6%) | 2,079 (53.4%) |
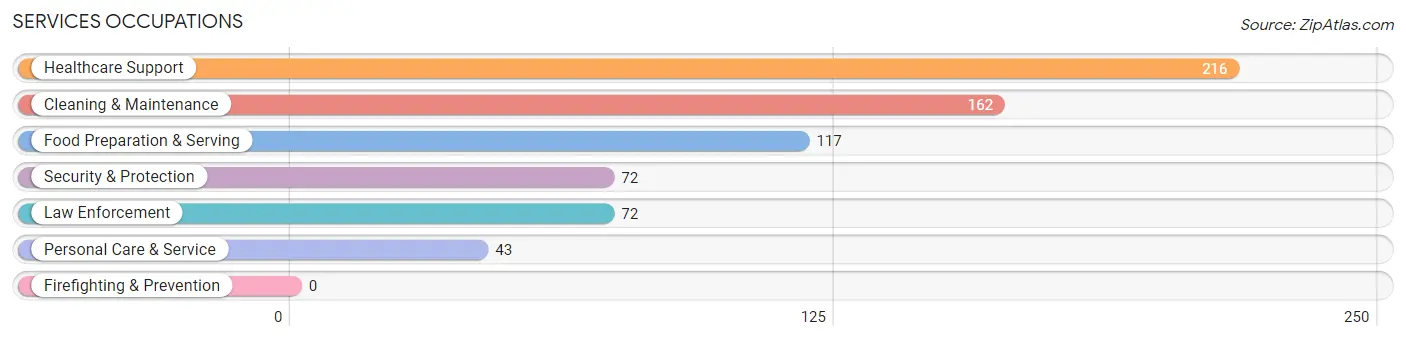
Services Occupations
The most common Services occupations in Washington County are Healthcare Support (216 | 5.6%), Cleaning & Maintenance (162 | 4.2%), Food Preparation & Serving (117 | 3.0%), Security & Protection (72 | 1.8%), and Law Enforcement (72 | 1.8%).
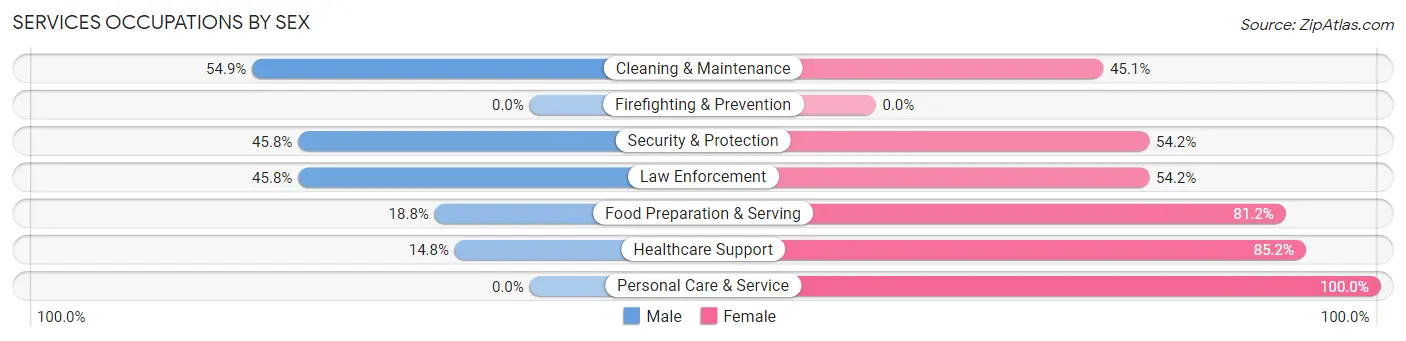
Services Occupations by Sex
Within the Services occupations in Washington County, the most male-oriented occupations are Cleaning & Maintenance (54.9%), Security & Protection (45.8%), and Law Enforcement (45.8%), while the most female-oriented occupations are Personal Care & Service (100.0%), Healthcare Support (85.2%), and Food Preparation & Serving (81.2%).
| Occupation | Male | Female |
| Healthcare Support | 32 (14.8%) | 184 (85.2%) |
| Security & Protection | 33 (45.8%) | 39 (54.2%) |
| Firefighting & Prevention | 0 (0.0%) | 0 (0.0%) |
| Law Enforcement | 33 (45.8%) | 39 (54.2%) |
| Food Preparation & Serving | 22 (18.8%) | 95 (81.2%) |
| Cleaning & Maintenance | 89 (54.9%) | 73 (45.1%) |
| Personal Care & Service | 0 (0.0%) | 43 (100.0%) |
| Total (Category) | 176 (28.8%) | 434 (71.2%) |
| Total (Overall) | 1,814 (46.6%) | 2,079 (53.4%) |
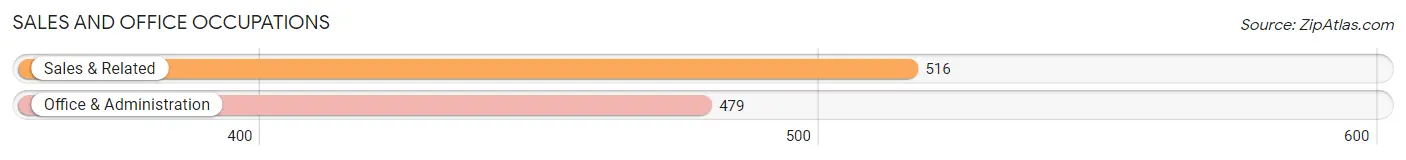
Sales and Office Occupations
The most common Sales and Office occupations in Washington County are Sales & Related (516 | 13.3%), and Office & Administration (479 | 12.3%).
Sales and Office Occupations by Sex
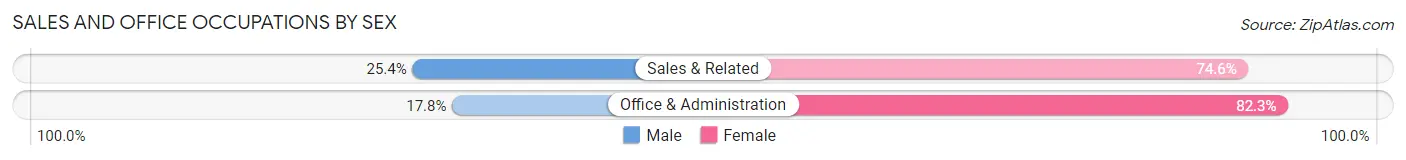
| Occupation | Male | Female |
| Sales & Related | 131 (25.4%) | 385 (74.6%) |
| Office & Administration | 85 (17.7%) | 394 (82.3%) |
| Total (Category) | 216 (21.7%) | 779 (78.3%) |
| Total (Overall) | 1,814 (46.6%) | 2,079 (53.4%) |
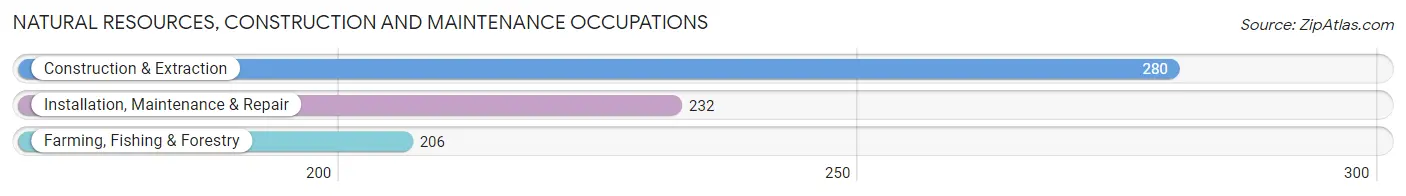
Natural Resources, Construction and Maintenance Occupations
The most common Natural Resources, Construction and Maintenance occupations in Washington County are Construction & Extraction (280 | 7.2%), Installation, Maintenance & Repair (232 | 6.0%), and Farming, Fishing & Forestry (206 | 5.3%).
Natural Resources, Construction and Maintenance Occupations by Sex
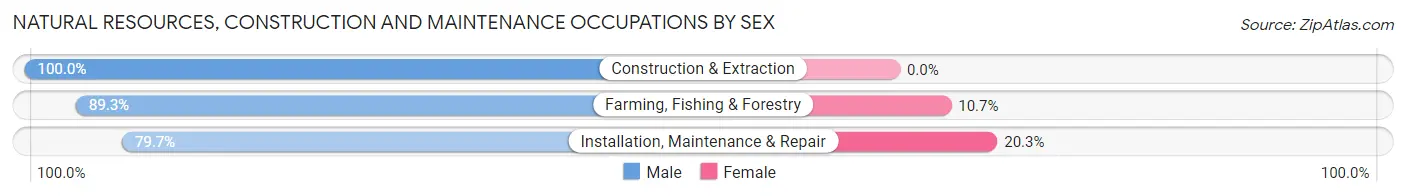
| Occupation | Male | Female |
| Farming, Fishing & Forestry | 184 (89.3%) | 22 (10.7%) |
| Construction & Extraction | 280 (100.0%) | 0 (0.0%) |
| Installation, Maintenance & Repair | 185 (79.7%) | 47 (20.3%) |
| Total (Category) | 649 (90.4%) | 69 (9.6%) |
| Total (Overall) | 1,814 (46.6%) | 2,079 (53.4%) |
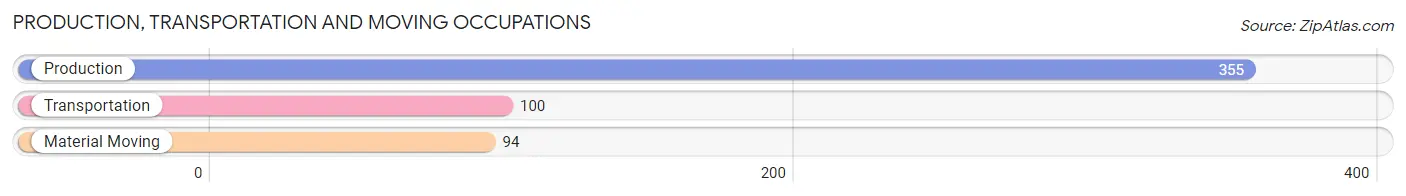
Production, Transportation and Moving Occupations
The most common Production, Transportation and Moving occupations in Washington County are Production (355 | 9.1%), Transportation (100 | 2.6%), and Material Moving (94 | 2.4%).
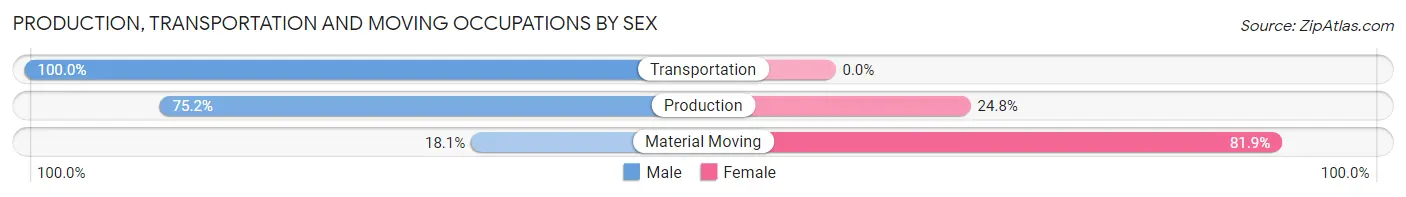
Production, Transportation and Moving Occupations by Sex
| Occupation | Male | Female |
| Production | 267 (75.2%) | 88 (24.8%) |
| Transportation | 100 (100.0%) | 0 (0.0%) |
| Material Moving | 17 (18.1%) | 77 (81.9%) |
| Total (Category) | 384 (70.0%) | 165 (30.0%) |
| Total (Overall) | 1,814 (46.6%) | 2,079 (53.4%) |
Employment Industries by Sex in Washington County
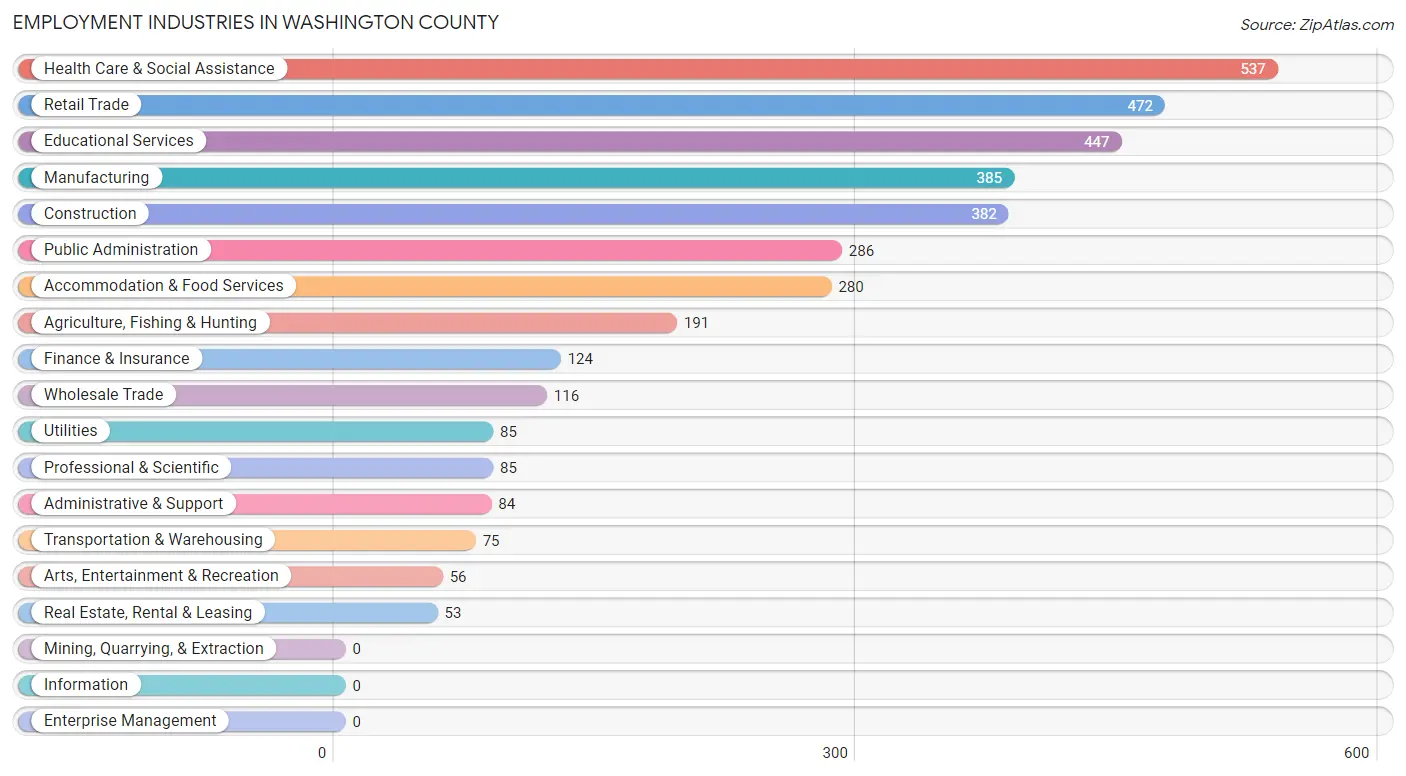
Employment Industries in Washington County
The major employment industries in Washington County include Health Care & Social Assistance (537 | 13.8%), Retail Trade (472 | 12.1%), Educational Services (447 | 11.5%), Manufacturing (385 | 9.9%), and Construction (382 | 9.8%).
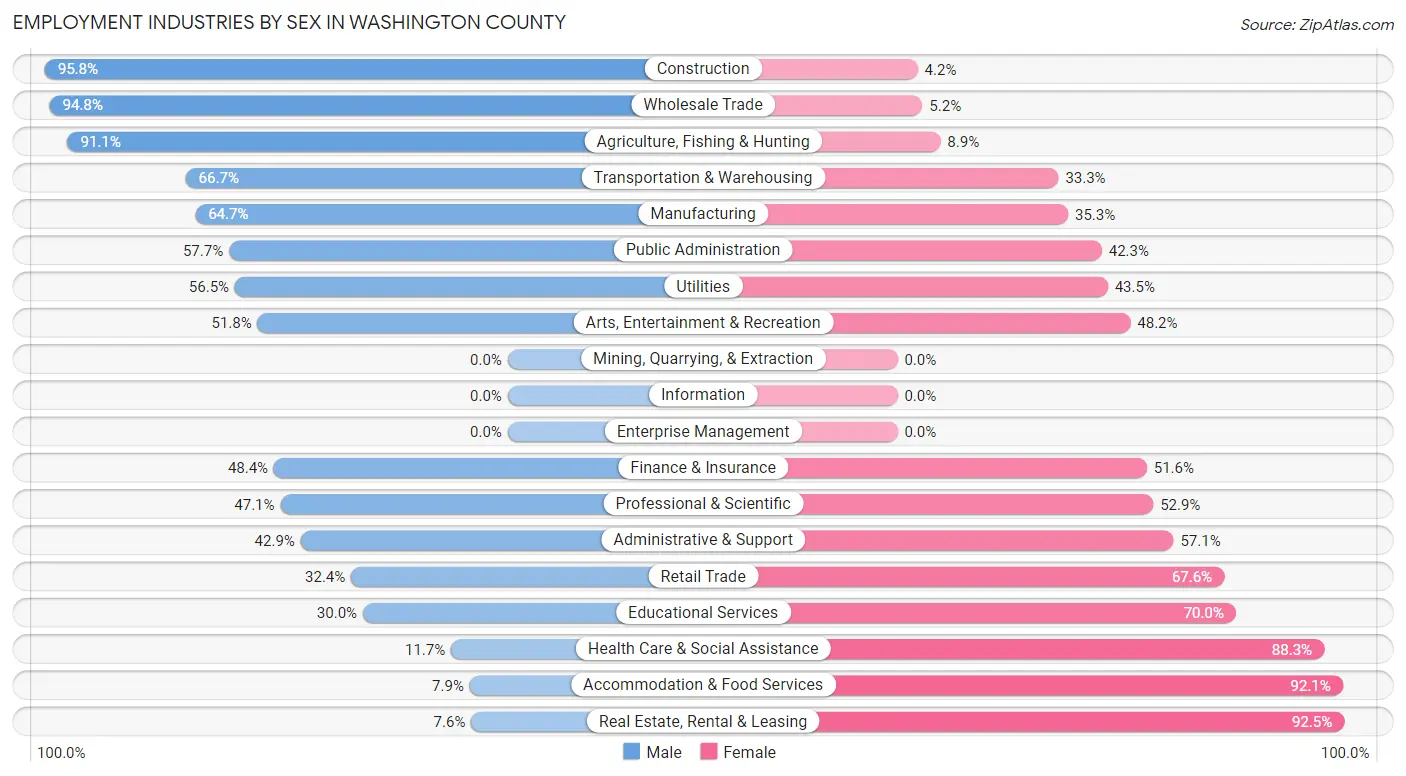
Employment Industries by Sex in Washington County
The Washington County industries that see more men than women are Construction (95.8%), Wholesale Trade (94.8%), and Agriculture, Fishing & Hunting (91.1%), whereas the industries that tend to have a higher number of women are Real Estate, Rental & Leasing (92.4%), Accommodation & Food Services (92.1%), and Health Care & Social Assistance (88.3%).
| Industry | Male | Female |
| Agriculture, Fishing & Hunting | 174 (91.1%) | 17 (8.9%) |
| Mining, Quarrying, & Extraction | 0 (0.0%) | 0 (0.0%) |
| Construction | 366 (95.8%) | 16 (4.2%) |
| Manufacturing | 249 (64.7%) | 136 (35.3%) |
| Wholesale Trade | 110 (94.8%) | 6 (5.2%) |
| Retail Trade | 153 (32.4%) | 319 (67.6%) |
| Transportation & Warehousing | 50 (66.7%) | 25 (33.3%) |
| Utilities | 48 (56.5%) | 37 (43.5%) |
| Information | 0 (0.0%) | 0 (0.0%) |
| Finance & Insurance | 60 (48.4%) | 64 (51.6%) |
| Real Estate, Rental & Leasing | 4 (7.5%) | 49 (92.4%) |
| Professional & Scientific | 40 (47.1%) | 45 (52.9%) |
| Enterprise Management | 0 (0.0%) | 0 (0.0%) |
| Administrative & Support | 36 (42.9%) | 48 (57.1%) |
| Educational Services | 134 (30.0%) | 313 (70.0%) |
| Health Care & Social Assistance | 63 (11.7%) | 474 (88.3%) |
| Arts, Entertainment & Recreation | 29 (51.8%) | 27 (48.2%) |
| Accommodation & Food Services | 22 (7.9%) | 258 (92.1%) |
| Public Administration | 165 (57.7%) | 121 (42.3%) |
| Total | 1,814 (46.6%) | 2,079 (53.4%) |
Education in Washington County
School Enrollment in Washington County
The most common levels of schooling among the 2,412 students in Washington County are middle school (751 | 31.1%), elementary school (612 | 25.4%), and high school (496 | 20.6%).
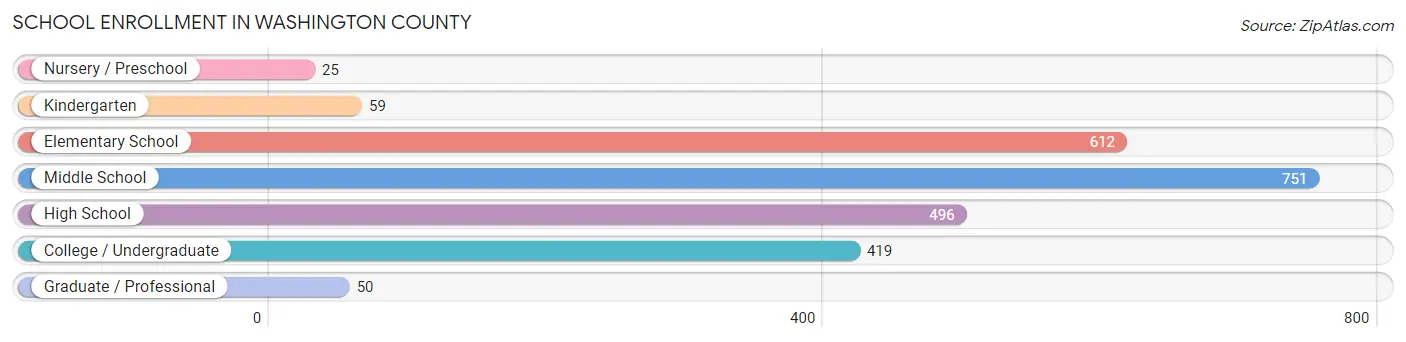
| School Level | # Students | % Students |
| Nursery / Preschool | 25 | 1.0% |
| Kindergarten | 59 | 2.5% |
| Elementary School | 612 | 25.4% |
| Middle School | 751 | 31.1% |
| High School | 496 | 20.6% |
| College / Undergraduate | 419 | 17.4% |
| Graduate / Professional | 50 | 2.1% |
| Total | 2,412 | 100.0% |
School Enrollment by Age by Funding Source in Washington County
Out of a total of 2,412 students who are enrolled in schools in Washington County, 164 (6.8%) attend a private institution, while the remaining 2,248 (93.2%) are enrolled in public schools. The age group of 3 to 4 year olds has the highest likelihood of being enrolled in private schools, with 6 (100.0% in the age bracket) enrolled. Conversely, the age group of 18 to 19 year olds has the lowest likelihood of being enrolled in a private school, with 179 (100.0% in the age bracket) attending a public institution.
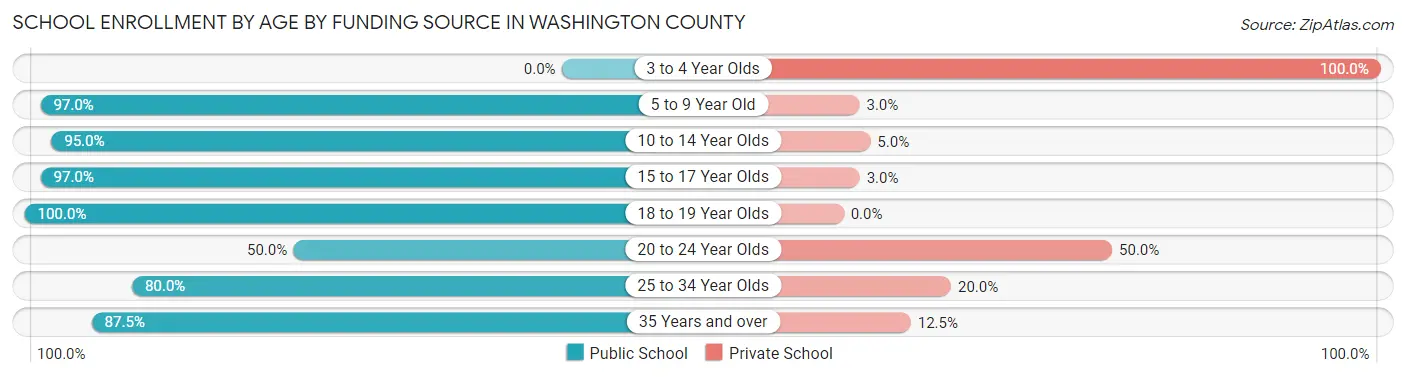
| Age Bracket | Public School | Private School |
| 3 to 4 Year Olds | 0 (0.0%) | 6 (100.0%) |
| 5 to 9 Year Old | 655 (97.0%) | 20 (3.0%) |
| 10 to 14 Year Olds | 744 (95.0%) | 39 (5.0%) |
| 15 to 17 Year Olds | 389 (97.0%) | 12 (3.0%) |
| 18 to 19 Year Olds | 179 (100.0%) | 0 (0.0%) |
| 20 to 24 Year Olds | 41 (50.0%) | 41 (50.0%) |
| 25 to 34 Year Olds | 120 (80.0%) | 30 (20.0%) |
| 35 Years and over | 119 (87.5%) | 17 (12.5%) |
| Total | 2,248 (93.2%) | 164 (6.8%) |
Educational Attainment by Field of Study in Washington County
Education (284 | 24.5%), social sciences (164 | 14.2%), science & technology (147 | 12.7%), business (136 | 11.7%), and bio, nature & agricultural (113 | 9.8%) are the most common fields of study among 1,157 individuals in Washington County who have obtained a bachelor's degree or higher.
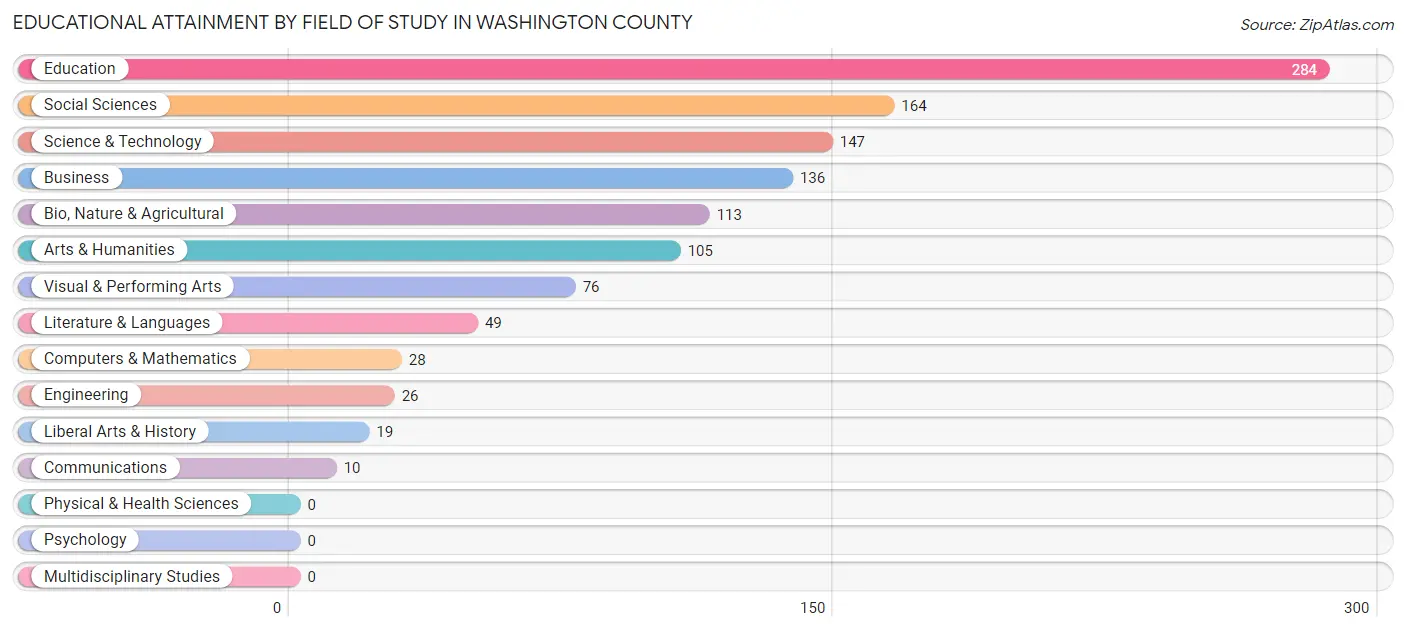
| Field of Study | # Graduates | % Graduates |
| Computers & Mathematics | 28 | 2.4% |
| Bio, Nature & Agricultural | 113 | 9.8% |
| Physical & Health Sciences | 0 | 0.0% |
| Psychology | 0 | 0.0% |
| Social Sciences | 164 | 14.2% |
| Engineering | 26 | 2.2% |
| Multidisciplinary Studies | 0 | 0.0% |
| Science & Technology | 147 | 12.7% |
| Business | 136 | 11.7% |
| Education | 284 | 24.5% |
| Literature & Languages | 49 | 4.2% |
| Liberal Arts & History | 19 | 1.6% |
| Visual & Performing Arts | 76 | 6.6% |
| Communications | 10 | 0.9% |
| Arts & Humanities | 105 | 9.1% |
| Total | 1,157 | 100.0% |
Transportation & Commute in Washington County
Vehicle Availability by Sex in Washington County
The most prevalent vehicle ownership categories in Washington County are males with 2 vehicles (507, accounting for 27.4%) and females with 2 vehicles (859, making up 24.7%).
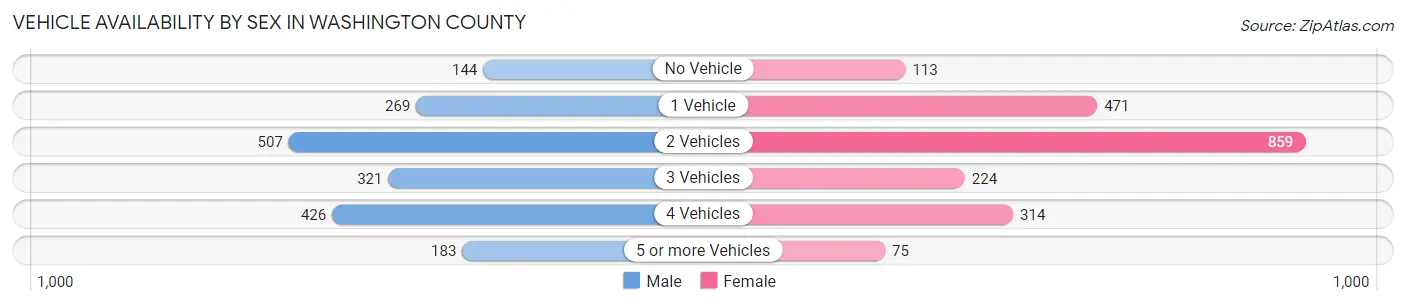
| Vehicles Available | Male | Female |
| No Vehicle | 144 (7.8%) | 113 (5.5%) |
| 1 Vehicle | 269 (14.5%) | 471 (22.9%) |
| 2 Vehicles | 507 (27.4%) | 859 (41.8%) |
| 3 Vehicles | 321 (17.3%) | 224 (10.9%) |
| 4 Vehicles | 426 (23.0%) | 314 (15.3%) |
| 5 or more Vehicles | 183 (9.9%) | 75 (3.6%) |
| Total | 1,850 (100.0%) | 2,056 (100.0%) |
Commute Time in Washington County
The most frequently occuring commute durations in Washington County are 10 to 14 minutes (684 commuters, 18.5%), 5 to 9 minutes (587 commuters, 15.9%), and 15 to 19 minutes (465 commuters, 12.6%).
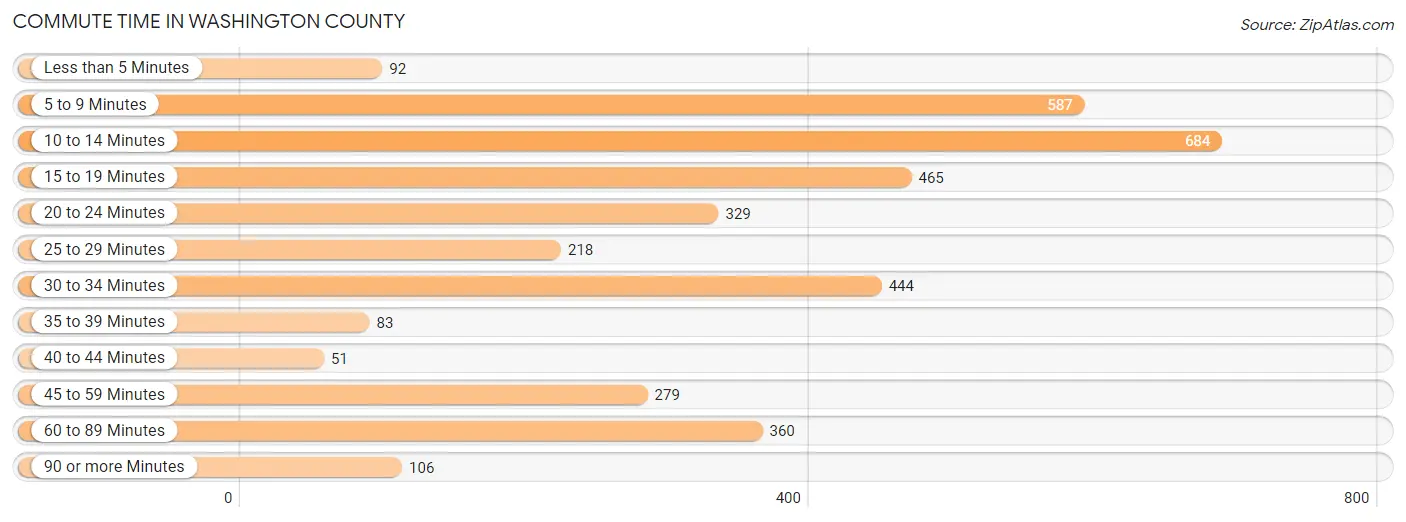
| Commute Time | # Commuters | % Commuters |
| Less than 5 Minutes | 92 | 2.5% |
| 5 to 9 Minutes | 587 | 15.9% |
| 10 to 14 Minutes | 684 | 18.5% |
| 15 to 19 Minutes | 465 | 12.6% |
| 20 to 24 Minutes | 329 | 8.9% |
| 25 to 29 Minutes | 218 | 5.9% |
| 30 to 34 Minutes | 444 | 12.0% |
| 35 to 39 Minutes | 83 | 2.2% |
| 40 to 44 Minutes | 51 | 1.4% |
| 45 to 59 Minutes | 279 | 7.5% |
| 60 to 89 Minutes | 360 | 9.7% |
| 90 or more Minutes | 106 | 2.9% |
Commute Time by Sex in Washington County
The most common commute times in Washington County are 60 to 89 minutes (270 commuters, 15.9%) for males and 10 to 14 minutes (441 commuters, 22.1%) for females.
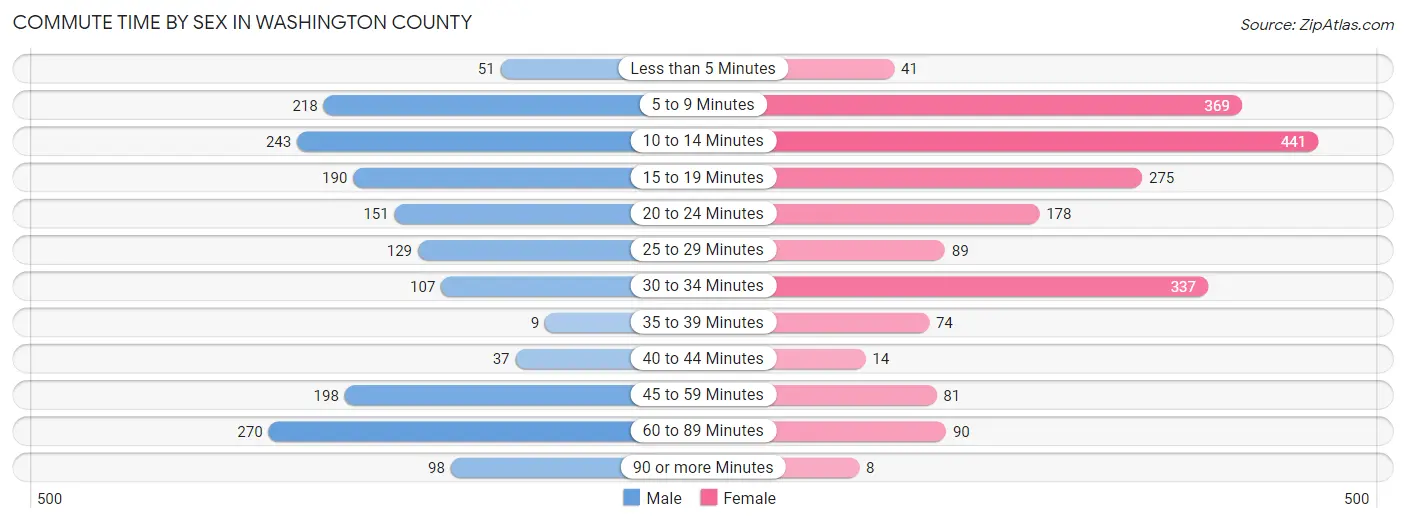
| Commute Time | Male | Female |
| Less than 5 Minutes | 51 (3.0%) | 41 (2.1%) |
| 5 to 9 Minutes | 218 (12.8%) | 369 (18.5%) |
| 10 to 14 Minutes | 243 (14.3%) | 441 (22.1%) |
| 15 to 19 Minutes | 190 (11.2%) | 275 (13.8%) |
| 20 to 24 Minutes | 151 (8.9%) | 178 (8.9%) |
| 25 to 29 Minutes | 129 (7.6%) | 89 (4.5%) |
| 30 to 34 Minutes | 107 (6.3%) | 337 (16.9%) |
| 35 to 39 Minutes | 9 (0.5%) | 74 (3.7%) |
| 40 to 44 Minutes | 37 (2.2%) | 14 (0.7%) |
| 45 to 59 Minutes | 198 (11.6%) | 81 (4.1%) |
| 60 to 89 Minutes | 270 (15.9%) | 90 (4.5%) |
| 90 or more Minutes | 98 (5.8%) | 8 (0.4%) |
Time of Departure to Work by Sex in Washington County
The most frequent times of departure to work in Washington County are 6:00 AM to 6:29 AM (243, 14.3%) for males and 7:00 AM to 7:29 AM (281, 14.1%) for females.
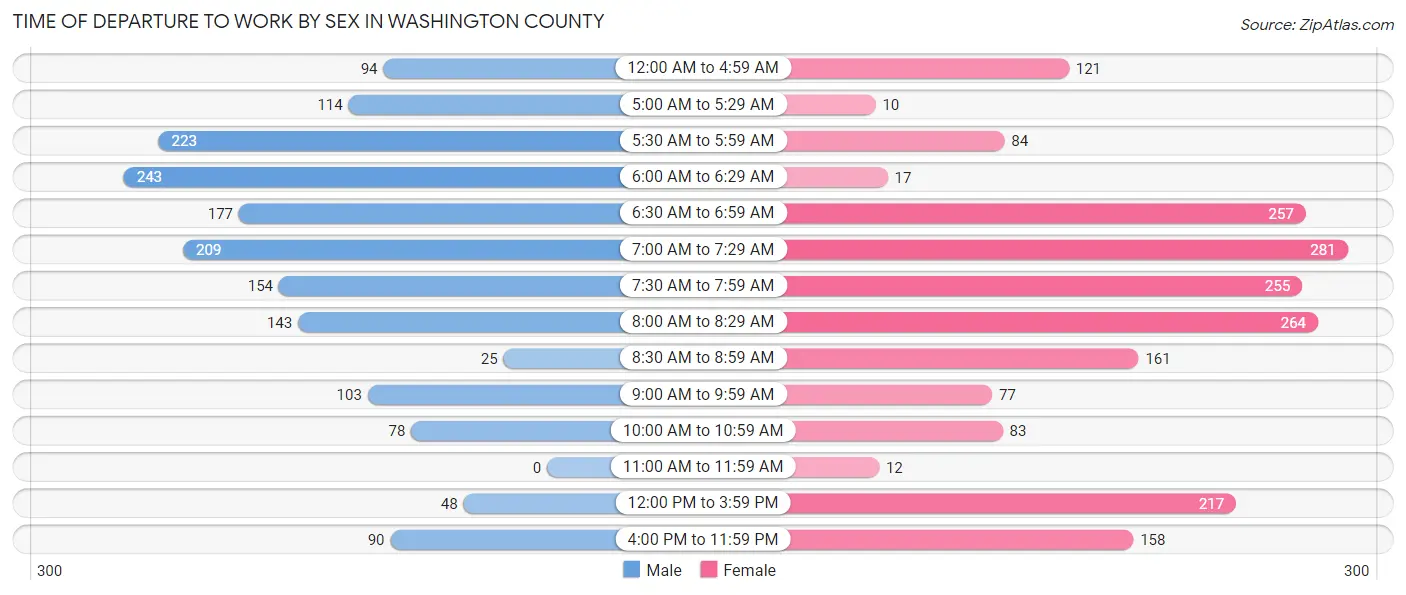
| Time of Departure | Male | Female |
| 12:00 AM to 4:59 AM | 94 (5.5%) | 121 (6.1%) |
| 5:00 AM to 5:29 AM | 114 (6.7%) | 10 (0.5%) |
| 5:30 AM to 5:59 AM | 223 (13.1%) | 84 (4.2%) |
| 6:00 AM to 6:29 AM | 243 (14.3%) | 17 (0.9%) |
| 6:30 AM to 6:59 AM | 177 (10.4%) | 257 (12.9%) |
| 7:00 AM to 7:29 AM | 209 (12.3%) | 281 (14.1%) |
| 7:30 AM to 7:59 AM | 154 (9.0%) | 255 (12.8%) |
| 8:00 AM to 8:29 AM | 143 (8.4%) | 264 (13.2%) |
| 8:30 AM to 8:59 AM | 25 (1.5%) | 161 (8.1%) |
| 9:00 AM to 9:59 AM | 103 (6.1%) | 77 (3.9%) |
| 10:00 AM to 10:59 AM | 78 (4.6%) | 83 (4.2%) |
| 11:00 AM to 11:59 AM | 0 (0.0%) | 12 (0.6%) |
| 12:00 PM to 3:59 PM | 48 (2.8%) | 217 (10.9%) |
| 4:00 PM to 11:59 PM | 90 (5.3%) | 158 (7.9%) |
| Total | 1,701 (100.0%) | 1,997 (100.0%) |
Housing Occupancy in Washington County
Occupancy by Ownership in Washington County
Of the total 4,897 dwellings in Washington County, owner-occupied units account for 3,360 (68.6%), while renter-occupied units make up 1,537 (31.4%).
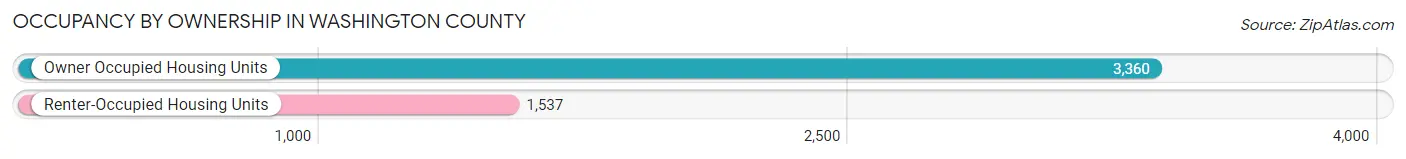
| Occupancy | # Housing Units | % Housing Units |
| Owner Occupied Housing Units | 3,360 | 68.6% |
| Renter-Occupied Housing Units | 1,537 | 31.4% |
| Total Occupied Housing Units | 4,897 | 100.0% |
Occupancy by Household Size in Washington County
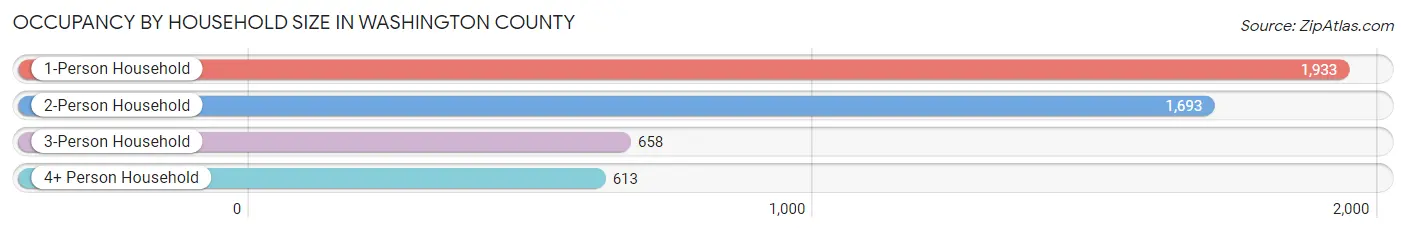
| Household Size | # Housing Units | % Housing Units |
| 1-Person Household | 1,933 | 39.5% |
| 2-Person Household | 1,693 | 34.6% |
| 3-Person Household | 658 | 13.4% |
| 4+ Person Household | 613 | 12.5% |
| Total Housing Units | 4,897 | 100.0% |
Occupancy by Ownership by Household Size in Washington County
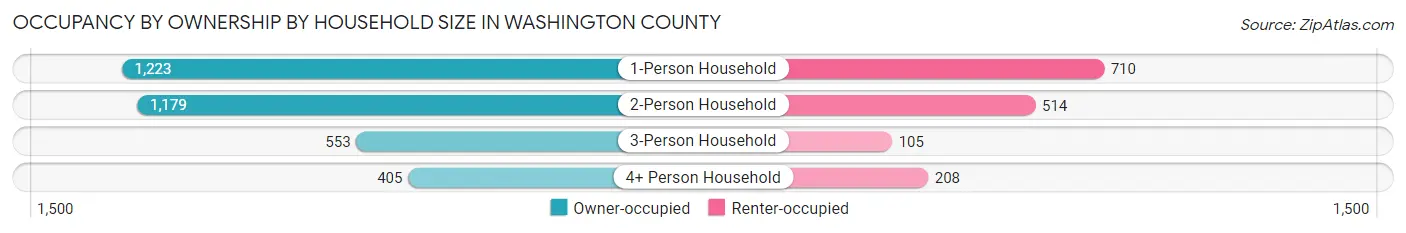
| Household Size | Owner-occupied | Renter-occupied |
| 1-Person Household | 1,223 (63.3%) | 710 (36.7%) |
| 2-Person Household | 1,179 (69.6%) | 514 (30.4%) |
| 3-Person Household | 553 (84.0%) | 105 (16.0%) |
| 4+ Person Household | 405 (66.1%) | 208 (33.9%) |
| Total Housing Units | 3,360 (68.6%) | 1,537 (31.4%) |
Occupancy by Educational Attainment in Washington County
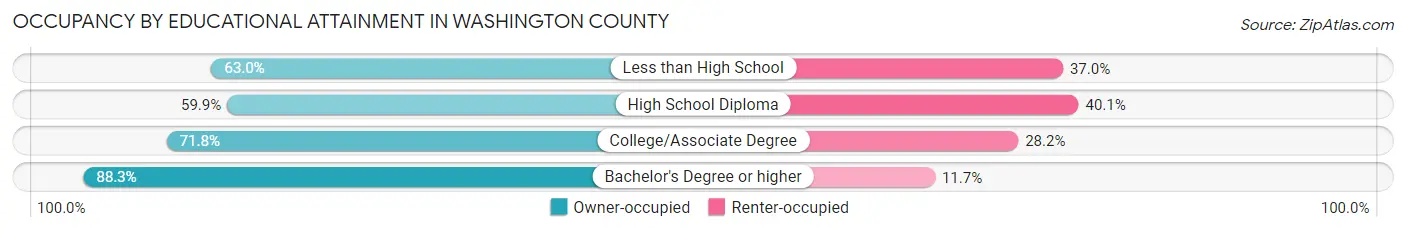
| Household Size | Owner-occupied | Renter-occupied |
| Less than High School | 425 (63.0%) | 250 (37.0%) |
| High School Diploma | 992 (59.9%) | 665 (40.1%) |
| College/Associate Degree | 1,405 (71.8%) | 551 (28.2%) |
| Bachelor's Degree or higher | 538 (88.3%) | 71 (11.7%) |
Occupancy by Age of Householder in Washington County
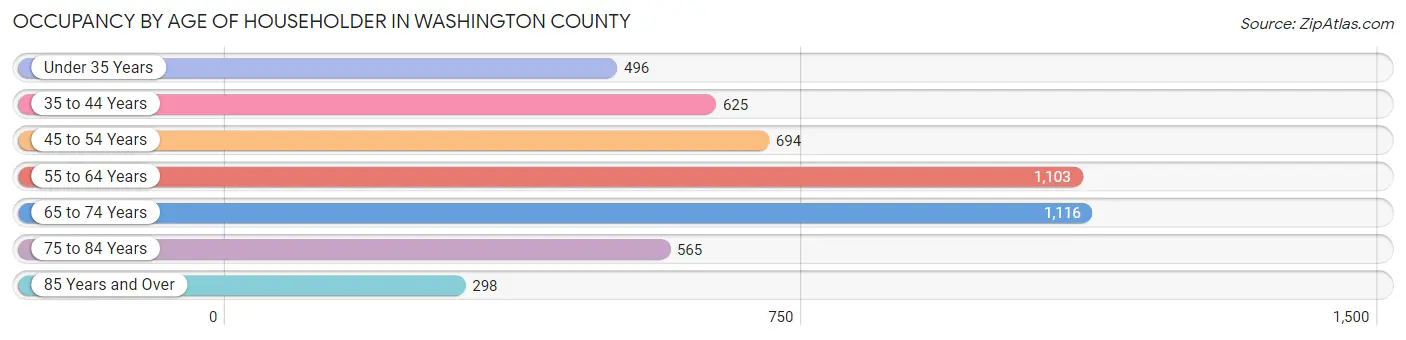
| Age Bracket | # Households | % Households |
| Under 35 Years | 496 | 10.1% |
| 35 to 44 Years | 625 | 12.8% |
| 45 to 54 Years | 694 | 14.2% |
| 55 to 64 Years | 1,103 | 22.5% |
| 65 to 74 Years | 1,116 | 22.8% |
| 75 to 84 Years | 565 | 11.5% |
| 85 Years and Over | 298 | 6.1% |
| Total | 4,897 | 100.0% |
Housing Finances in Washington County
Median Income by Occupancy in Washington County
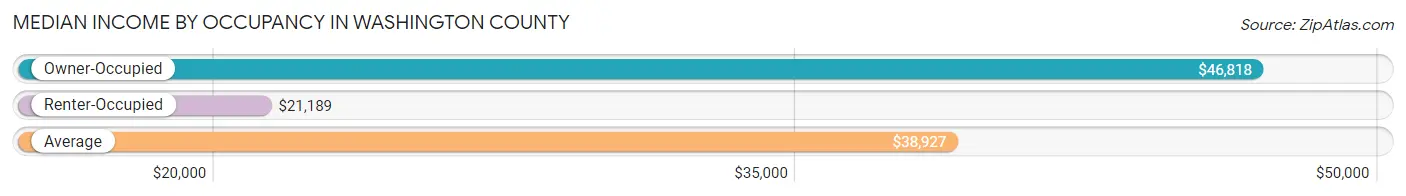
| Occupancy Type | # Households | Median Income |
| Owner-Occupied | 3,360 (68.6%) | $46,818 |
| Renter-Occupied | 1,537 (31.4%) | $21,189 |
| Average | 4,897 (100.0%) | $38,927 |
Occupancy by Householder Income Bracket in Washington County
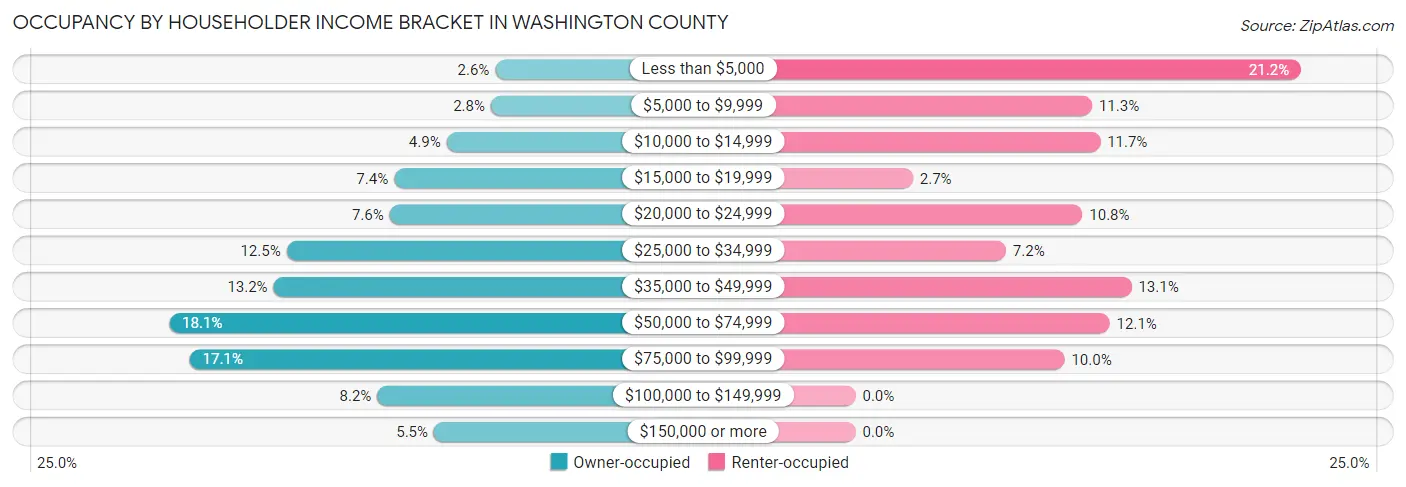
| Income Bracket | Owner-occupied | Renter-occupied |
| Less than $5,000 | 87 (2.6%) | 326 (21.2%) |
| $5,000 to $9,999 | 94 (2.8%) | 173 (11.3%) |
| $10,000 to $14,999 | 165 (4.9%) | 179 (11.7%) |
| $15,000 to $19,999 | 249 (7.4%) | 42 (2.7%) |
| $20,000 to $24,999 | 256 (7.6%) | 166 (10.8%) |
| $25,000 to $34,999 | 421 (12.5%) | 110 (7.2%) |
| $35,000 to $49,999 | 442 (13.2%) | 202 (13.1%) |
| $50,000 to $74,999 | 609 (18.1%) | 186 (12.1%) |
| $75,000 to $99,999 | 576 (17.1%) | 153 (10.0%) |
| $100,000 to $149,999 | 276 (8.2%) | 0 (0.0%) |
| $150,000 or more | 185 (5.5%) | 0 (0.0%) |
| Total | 3,360 (100.0%) | 1,537 (100.0%) |
Monthly Housing Cost Tiers in Washington County
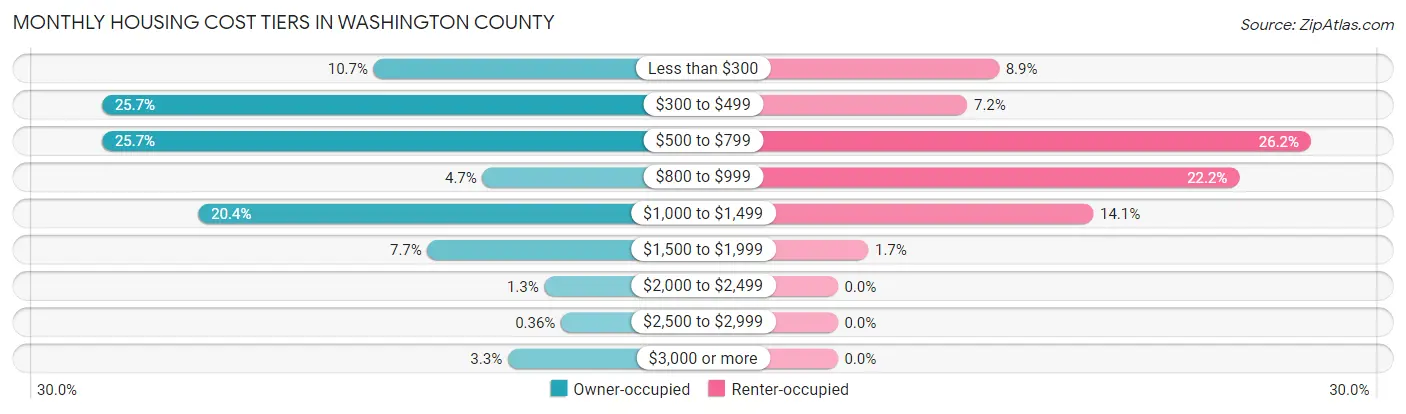
| Monthly Cost | Owner-occupied | Renter-occupied |
| Less than $300 | 360 (10.7%) | 137 (8.9%) |
| $300 to $499 | 865 (25.7%) | 110 (7.2%) |
| $500 to $799 | 865 (25.7%) | 402 (26.2%) |
| $800 to $999 | 158 (4.7%) | 341 (22.2%) |
| $1,000 to $1,499 | 686 (20.4%) | 217 (14.1%) |
| $1,500 to $1,999 | 260 (7.7%) | 26 (1.7%) |
| $2,000 to $2,499 | 43 (1.3%) | 0 (0.0%) |
| $2,500 to $2,999 | 12 (0.4%) | 0 (0.0%) |
| $3,000 or more | 111 (3.3%) | 0 (0.0%) |
| Total | 3,360 (100.0%) | 1,537 (100.0%) |
Physical Housing Characteristics in Washington County
Housing Structures in Washington County
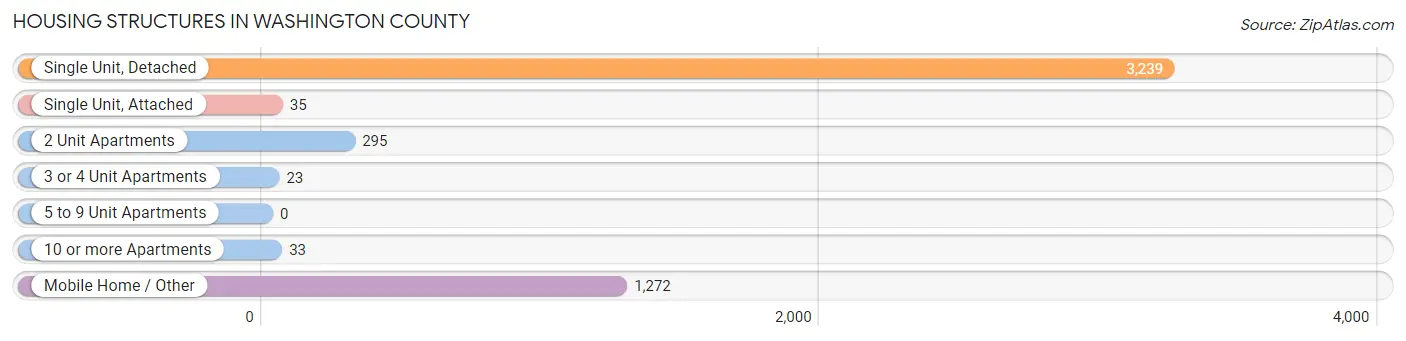
| Structure Type | # Housing Units | % Housing Units |
| Single Unit, Detached | 3,239 | 66.1% |
| Single Unit, Attached | 35 | 0.7% |
| 2 Unit Apartments | 295 | 6.0% |
| 3 or 4 Unit Apartments | 23 | 0.5% |
| 5 to 9 Unit Apartments | 0 | 0.0% |
| 10 or more Apartments | 33 | 0.7% |
| Mobile Home / Other | 1,272 | 26.0% |
| Total | 4,897 | 100.0% |
Housing Structures by Occupancy in Washington County
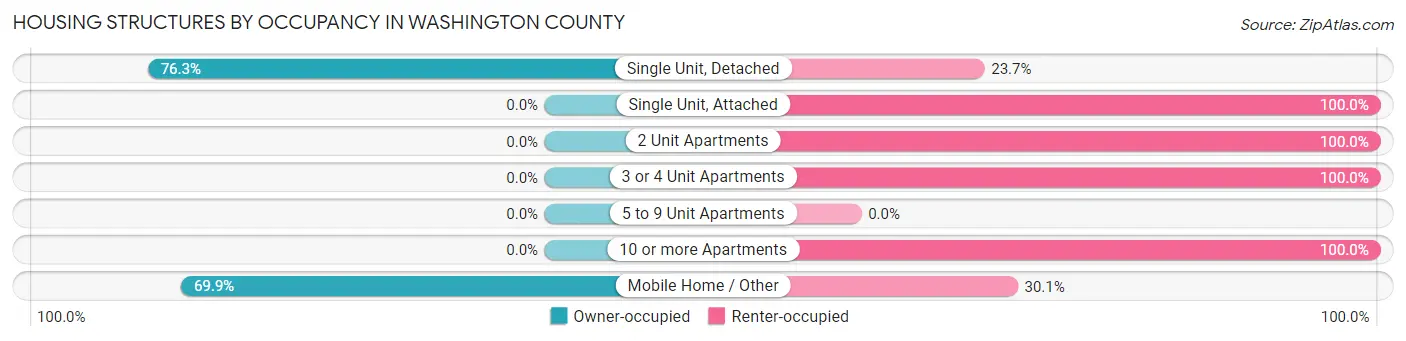
| Structure Type | Owner-occupied | Renter-occupied |
| Single Unit, Detached | 2,471 (76.3%) | 768 (23.7%) |
| Single Unit, Attached | 0 (0.0%) | 35 (100.0%) |
| 2 Unit Apartments | 0 (0.0%) | 295 (100.0%) |
| 3 or 4 Unit Apartments | 0 (0.0%) | 23 (100.0%) |
| 5 to 9 Unit Apartments | 0 (0.0%) | 0 (0.0%) |
| 10 or more Apartments | 0 (0.0%) | 33 (100.0%) |
| Mobile Home / Other | 889 (69.9%) | 383 (30.1%) |
| Total | 3,360 (68.6%) | 1,537 (31.4%) |
Housing Structures by Number of Rooms in Washington County
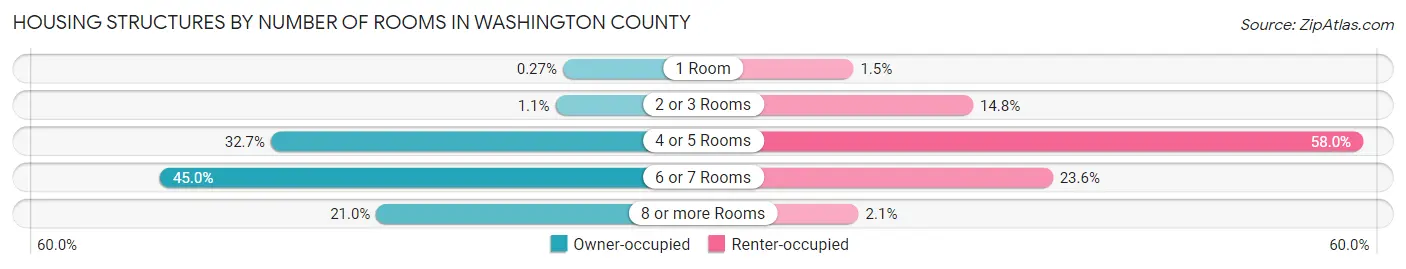
| Number of Rooms | Owner-occupied | Renter-occupied |
| 1 Room | 9 (0.3%) | 23 (1.5%) |
| 2 or 3 Rooms | 37 (1.1%) | 227 (14.8%) |
| 4 or 5 Rooms | 1,098 (32.7%) | 892 (58.0%) |
| 6 or 7 Rooms | 1,511 (45.0%) | 363 (23.6%) |
| 8 or more Rooms | 705 (21.0%) | 32 (2.1%) |
| Total | 3,360 (100.0%) | 1,537 (100.0%) |
Housing Structure by Heating Type in Washington County
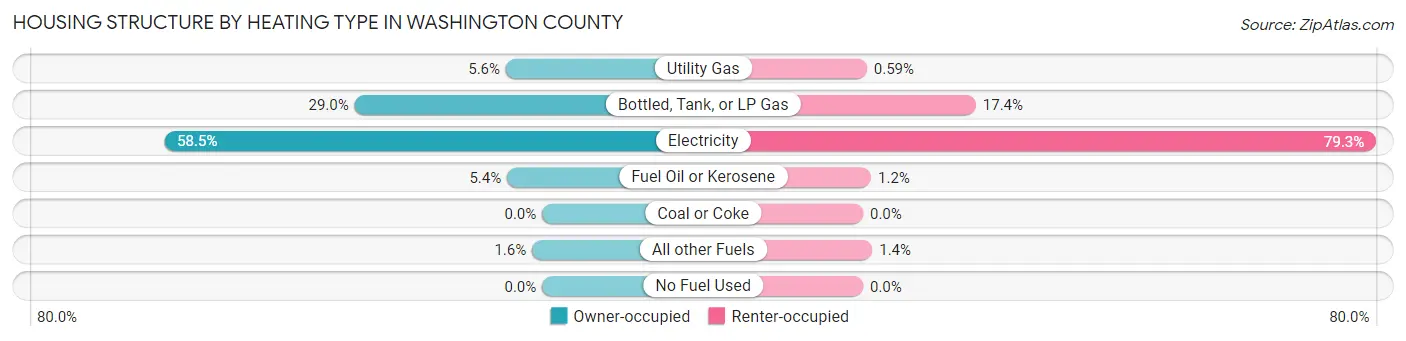
| Heating Type | Owner-occupied | Renter-occupied |
| Utility Gas | 188 (5.6%) | 9 (0.6%) |
| Bottled, Tank, or LP Gas | 974 (29.0%) | 268 (17.4%) |
| Electricity | 1,964 (58.5%) | 1,219 (79.3%) |
| Fuel Oil or Kerosene | 182 (5.4%) | 19 (1.2%) |
| Coal or Coke | 0 (0.0%) | 0 (0.0%) |
| All other Fuels | 52 (1.5%) | 22 (1.4%) |
| No Fuel Used | 0 (0.0%) | 0 (0.0%) |
| Total | 3,360 (100.0%) | 1,537 (100.0%) |
Household Vehicle Usage in Washington County
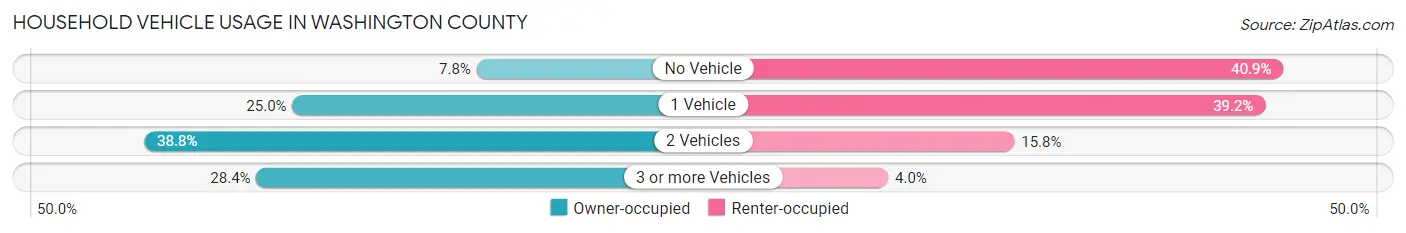
| Vehicles per Household | Owner-occupied | Renter-occupied |
| No Vehicle | 262 (7.8%) | 629 (40.9%) |
| 1 Vehicle | 840 (25.0%) | 603 (39.2%) |
| 2 Vehicles | 1,305 (38.8%) | 243 (15.8%) |
| 3 or more Vehicles | 953 (28.4%) | 62 (4.0%) |
| Total | 3,360 (100.0%) | 1,537 (100.0%) |
Real Estate & Mortgages in Washington County
Real Estate and Mortgage Overview in Washington County
| Characteristic | Without Mortgage | With Mortgage |
| Housing Units | 1,966 | 1,394 |
| Median Property Value | $83,900 | $123,200 |
| Median Household Income | $40,616 | $77 |
| Monthly Housing Costs | $448 | $111 |
| Real Estate Taxes | $895 | $8 |
Property Value by Mortgage Status in Washington County
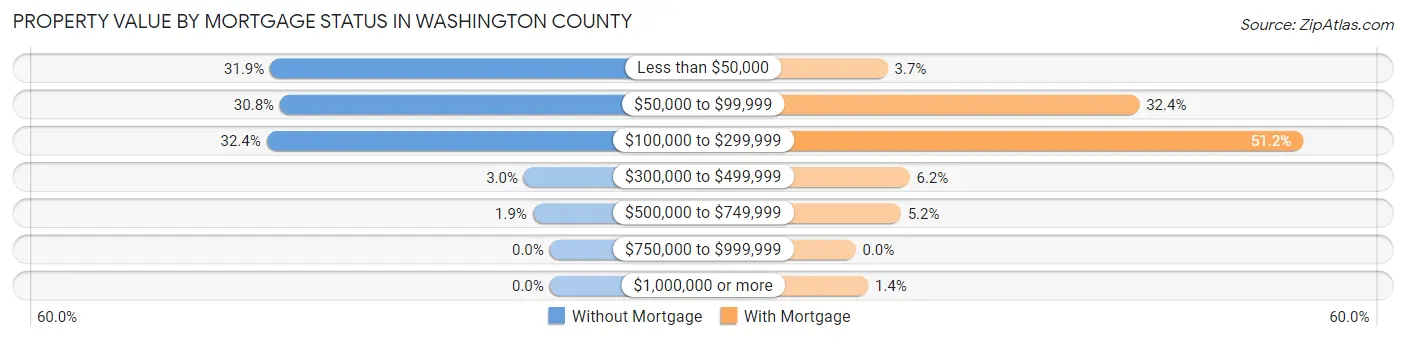
| Property Value | Without Mortgage | With Mortgage |
| Less than $50,000 | 628 (31.9%) | 51 (3.7%) |
| $50,000 to $99,999 | 606 (30.8%) | 452 (32.4%) |
| $100,000 to $299,999 | 636 (32.4%) | 713 (51.1%) |
| $300,000 to $499,999 | 58 (2.9%) | 86 (6.2%) |
| $500,000 to $749,999 | 38 (1.9%) | 72 (5.2%) |
| $750,000 to $999,999 | 0 (0.0%) | 0 (0.0%) |
| $1,000,000 or more | 0 (0.0%) | 20 (1.4%) |
| Total | 1,966 (100.0%) | 1,394 (100.0%) |
Household Income by Mortgage Status in Washington County
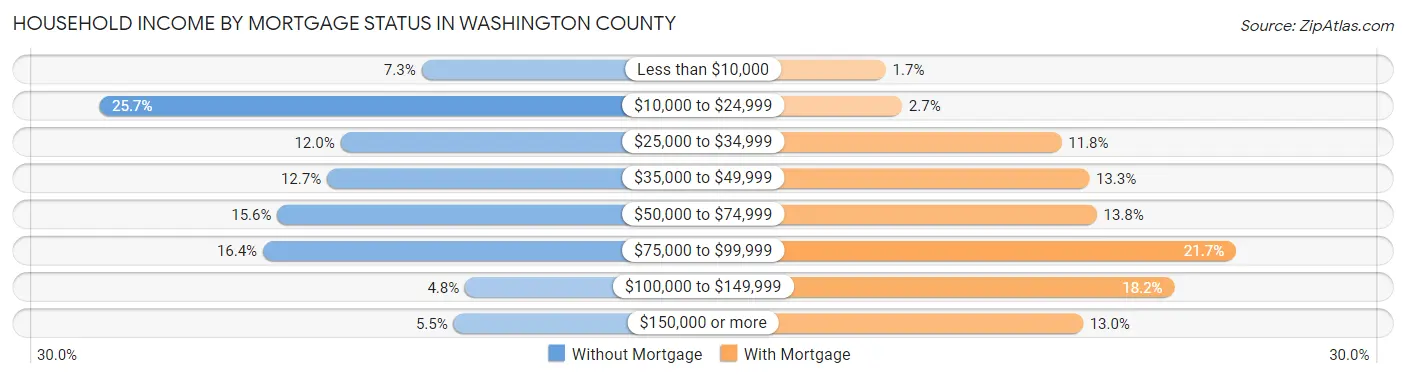
| Household Income | Without Mortgage | With Mortgage |
| Less than $10,000 | 144 (7.3%) | 24 (1.7%) |
| $10,000 to $24,999 | 506 (25.7%) | 37 (2.6%) |
| $25,000 to $34,999 | 235 (11.9%) | 164 (11.8%) |
| $35,000 to $49,999 | 250 (12.7%) | 186 (13.3%) |
| $50,000 to $74,999 | 306 (15.6%) | 192 (13.8%) |
| $75,000 to $99,999 | 322 (16.4%) | 303 (21.7%) |
| $100,000 to $149,999 | 95 (4.8%) | 254 (18.2%) |
| $150,000 or more | 108 (5.5%) | 181 (13.0%) |
| Total | 1,966 (100.0%) | 1,394 (100.0%) |
Property Value to Household Income Ratio in Washington County
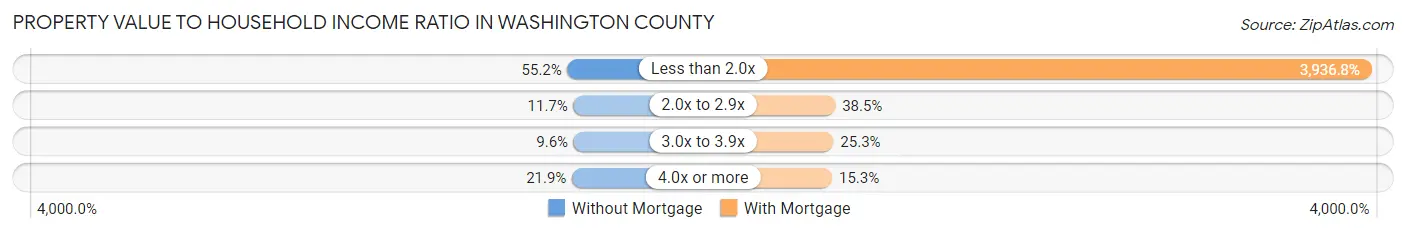
| Value-to-Income Ratio | Without Mortgage | With Mortgage |
| Less than 2.0x | 1,086 (55.2%) | 54,879 (3,936.8%) |
| 2.0x to 2.9x | 230 (11.7%) | 536 (38.5%) |
| 3.0x to 3.9x | 188 (9.6%) | 352 (25.3%) |
| 4.0x or more | 431 (21.9%) | 213 (15.3%) |
| Total | 1,966 (100.0%) | 1,394 (100.0%) |
Real Estate Taxes by Mortgage Status in Washington County
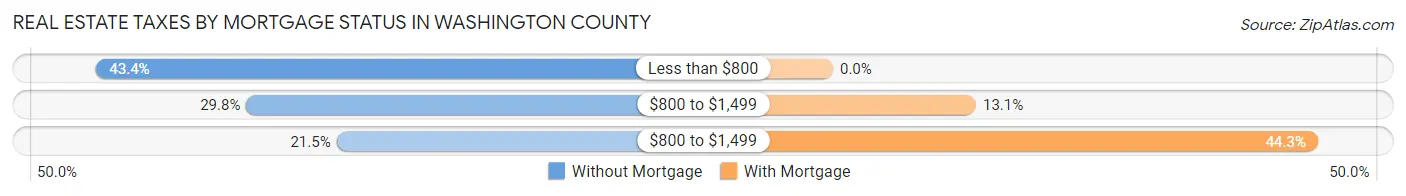
| Property Taxes | Without Mortgage | With Mortgage |
| Less than $800 | 854 (43.4%) | 0 (0.0%) |
| $800 to $1,499 | 585 (29.8%) | 182 (13.1%) |
| $800 to $1,499 | 423 (21.5%) | 617 (44.3%) |
| Total | 1,966 (100.0%) | 1,394 (100.0%) |
Health & Disability in Washington County
Health Insurance Coverage by Age in Washington County
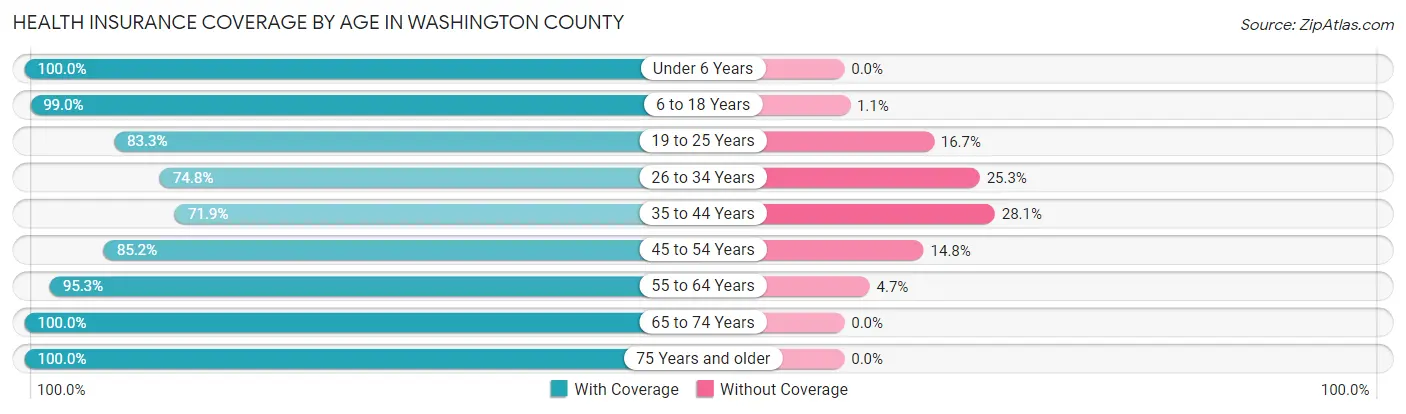
| Age Bracket | With Coverage | Without Coverage |
| Under 6 Years | 396 (100.0%) | 0 (0.0%) |
| 6 to 18 Years | 1,982 (99.0%) | 21 (1.1%) |
| 19 to 25 Years | 624 (83.3%) | 125 (16.7%) |
| 26 to 34 Years | 666 (74.8%) | 225 (25.3%) |
| 35 to 44 Years | 800 (71.9%) | 312 (28.1%) |
| 45 to 54 Years | 1,060 (85.2%) | 184 (14.8%) |
| 55 to 64 Years | 1,634 (95.3%) | 81 (4.7%) |
| 65 to 74 Years | 1,705 (100.0%) | 0 (0.0%) |
| 75 Years and older | 1,076 (100.0%) | 0 (0.0%) |
| Total | 9,943 (91.3%) | 948 (8.7%) |
Health Insurance Coverage by Citizenship Status in Washington County
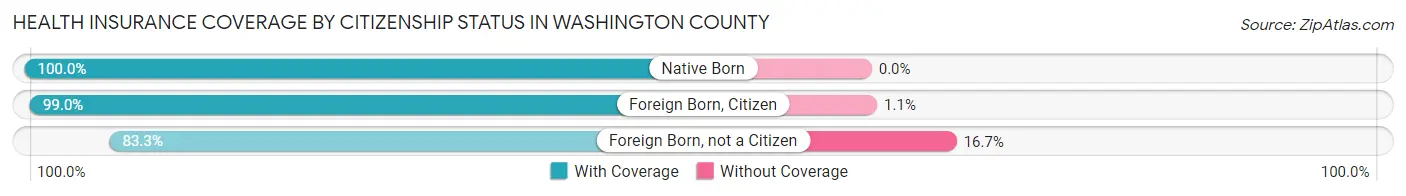
| Citizenship Status | With Coverage | Without Coverage |
| Native Born | 396 (100.0%) | 0 (0.0%) |
| Foreign Born, Citizen | 1,982 (99.0%) | 21 (1.1%) |
| Foreign Born, not a Citizen | 624 (83.3%) | 125 (16.7%) |
Health Insurance Coverage by Household Income in Washington County
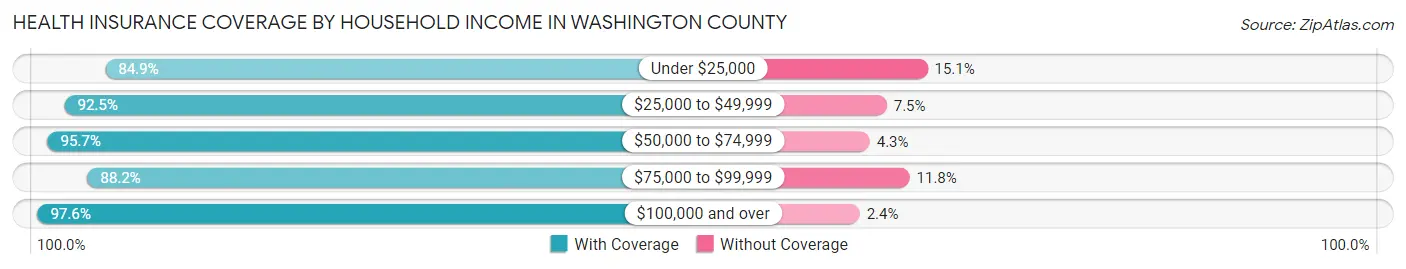
| Household Income | With Coverage | Without Coverage |
| Under $25,000 | 2,030 (84.9%) | 362 (15.1%) |
| $25,000 to $49,999 | 2,765 (92.5%) | 224 (7.5%) |
| $50,000 to $74,999 | 1,752 (95.7%) | 79 (4.3%) |
| $75,000 to $99,999 | 1,837 (88.2%) | 245 (11.8%) |
| $100,000 and over | 1,534 (97.6%) | 38 (2.4%) |
Public vs Private Health Insurance Coverage by Age in Washington County
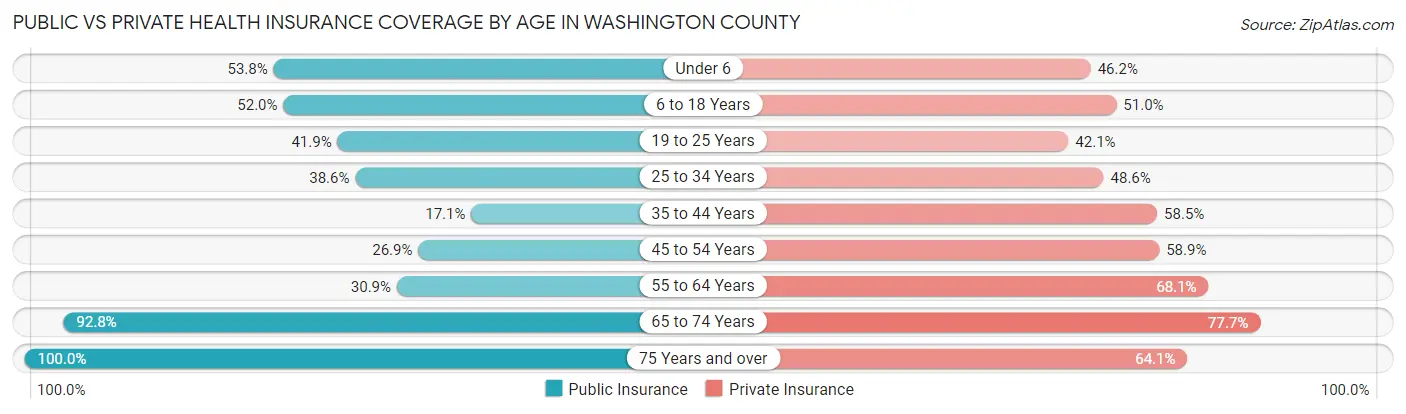
| Age Bracket | Public Insurance | Private Insurance |
| Under 6 | 213 (53.8%) | 183 (46.2%) |
| 6 to 18 Years | 1,041 (52.0%) | 1,021 (51.0%) |
| 19 to 25 Years | 314 (41.9%) | 315 (42.1%) |
| 25 to 34 Years | 344 (38.6%) | 433 (48.6%) |
| 35 to 44 Years | 190 (17.1%) | 651 (58.5%) |
| 45 to 54 Years | 335 (26.9%) | 733 (58.9%) |
| 55 to 64 Years | 530 (30.9%) | 1,167 (68.0%) |
| 65 to 74 Years | 1,582 (92.8%) | 1,324 (77.6%) |
| 75 Years and over | 1,076 (100.0%) | 690 (64.1%) |
| Total | 5,625 (51.6%) | 6,517 (59.8%) |
Disability Status by Sex by Age in Washington County
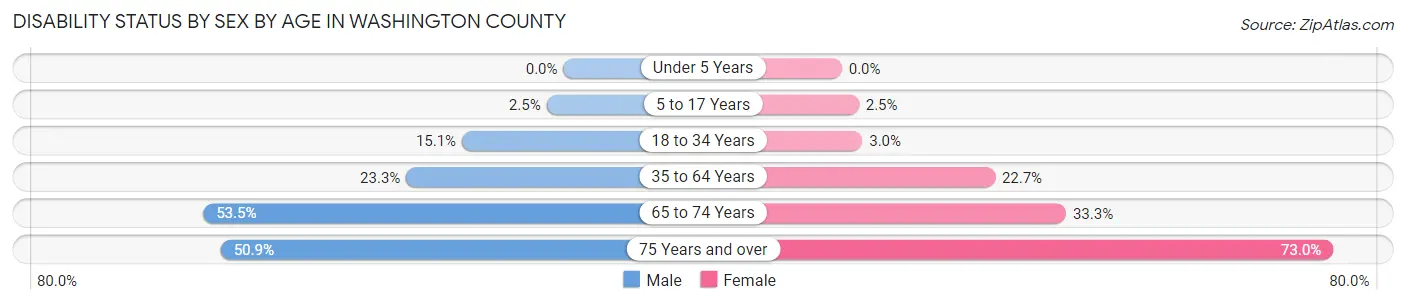
| Age Bracket | Male | Female |
| Under 5 Years | 0 (0.0%) | 0 (0.0%) |
| 5 to 17 Years | 34 (2.5%) | 14 (2.5%) |
| 18 to 34 Years | 125 (15.1%) | 30 (3.0%) |
| 35 to 64 Years | 445 (23.3%) | 492 (22.7%) |
| 65 to 74 Years | 454 (53.5%) | 285 (33.3%) |
| 75 Years and over | 205 (50.9%) | 491 (73.0%) |
Disability Class by Sex by Age in Washington County
Disability Class: Hearing Difficulty
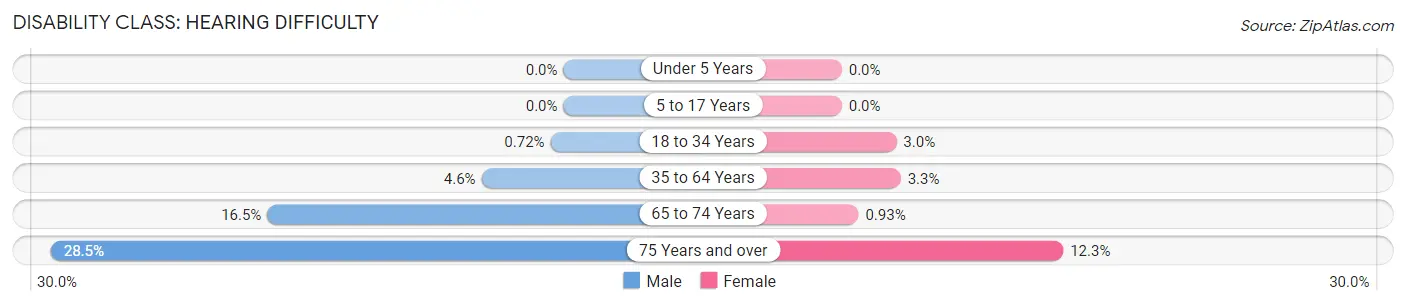
| Age Bracket | Male | Female |
| Under 5 Years | 0 (0.0%) | 0 (0.0%) |
| 5 to 17 Years | 0 (0.0%) | 0 (0.0%) |
| 18 to 34 Years | 6 (0.7%) | 30 (3.0%) |
| 35 to 64 Years | 87 (4.6%) | 71 (3.3%) |
| 65 to 74 Years | 140 (16.5%) | 8 (0.9%) |
| 75 Years and over | 115 (28.5%) | 83 (12.3%) |
Disability Class: Vision Difficulty
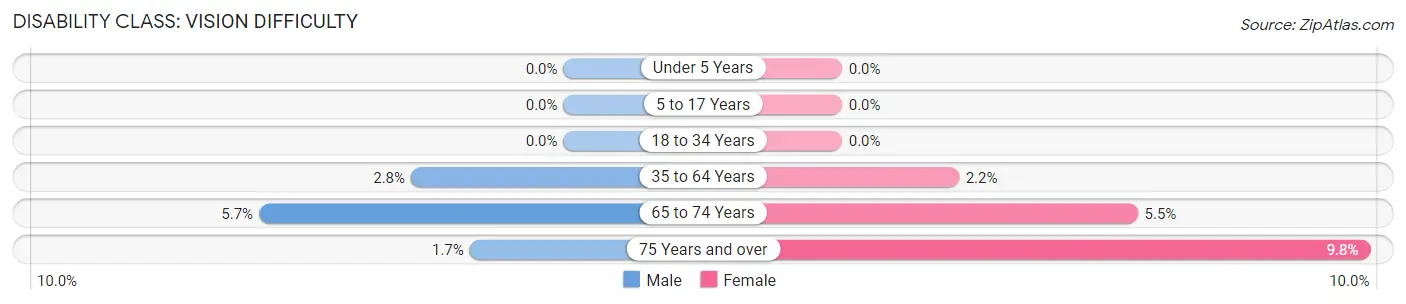
| Age Bracket | Male | Female |
| Under 5 Years | 0 (0.0%) | 0 (0.0%) |
| 5 to 17 Years | 0 (0.0%) | 0 (0.0%) |
| 18 to 34 Years | 0 (0.0%) | 0 (0.0%) |
| 35 to 64 Years | 54 (2.8%) | 47 (2.2%) |
| 65 to 74 Years | 48 (5.7%) | 47 (5.5%) |
| 75 Years and over | 7 (1.7%) | 66 (9.8%) |
Disability Class: Cognitive Difficulty
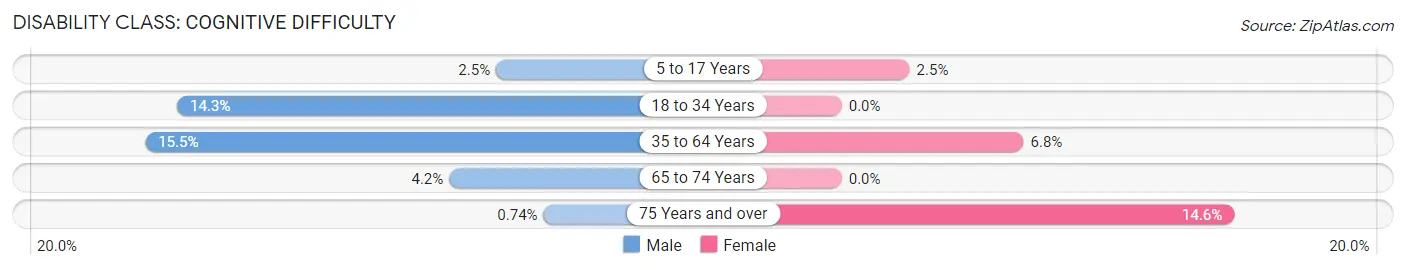
| Age Bracket | Male | Female |
| 5 to 17 Years | 34 (2.5%) | 14 (2.5%) |
| 18 to 34 Years | 119 (14.3%) | 0 (0.0%) |
| 35 to 64 Years | 296 (15.5%) | 146 (6.8%) |
| 65 to 74 Years | 36 (4.2%) | 0 (0.0%) |
| 75 Years and over | 3 (0.7%) | 98 (14.6%) |
Disability Class: Ambulatory Difficulty
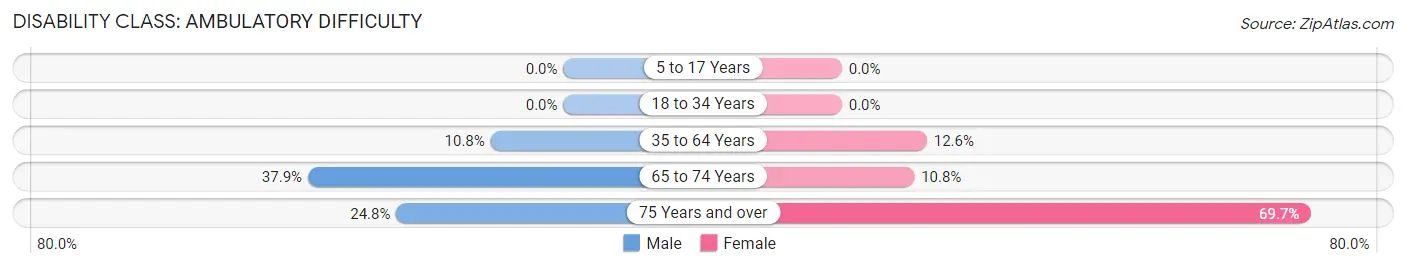
| Age Bracket | Male | Female |
| 5 to 17 Years | 0 (0.0%) | 0 (0.0%) |
| 18 to 34 Years | 0 (0.0%) | 0 (0.0%) |
| 35 to 64 Years | 206 (10.8%) | 273 (12.6%) |
| 65 to 74 Years | 322 (37.9%) | 92 (10.7%) |
| 75 Years and over | 100 (24.8%) | 469 (69.7%) |
Disability Class: Self-Care Difficulty
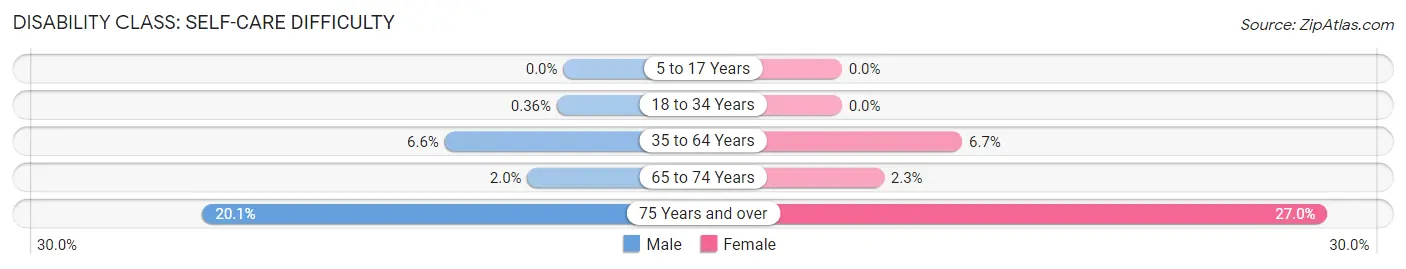
| Age Bracket | Male | Female |
| 5 to 17 Years | 0 (0.0%) | 0 (0.0%) |
| 18 to 34 Years | 3 (0.4%) | 0 (0.0%) |
| 35 to 64 Years | 126 (6.6%) | 145 (6.7%) |
| 65 to 74 Years | 17 (2.0%) | 20 (2.3%) |
| 75 Years and over | 81 (20.1%) | 182 (27.0%) |
Technology Access in Washington County
Computing Device Access in Washington County
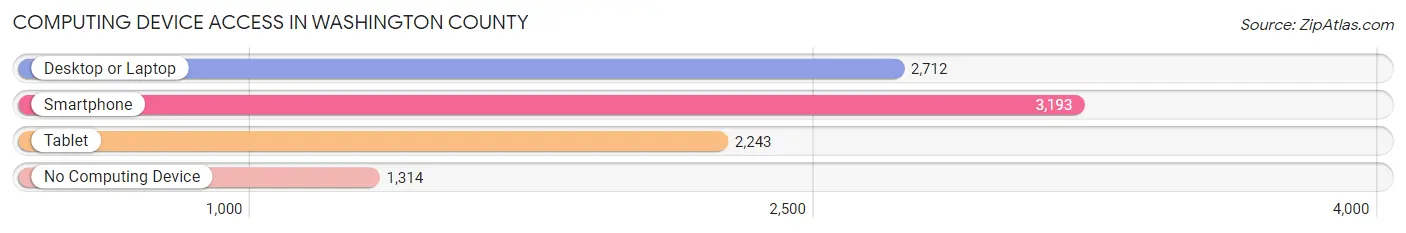
| Device Type | # Households | % Households |
| Desktop or Laptop | 2,712 | 55.4% |
| Smartphone | 3,193 | 65.2% |
| Tablet | 2,243 | 45.8% |
| No Computing Device | 1,314 | 26.8% |
| Total | 4,897 | 100.0% |
Internet Access in Washington County
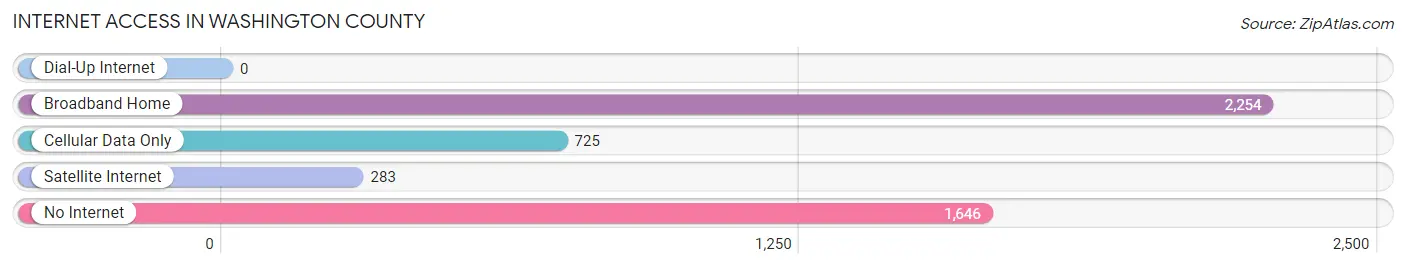
| Internet Type | # Households | % Households |
| Dial-Up Internet | 0 | 0.0% |
| Broadband Home | 2,254 | 46.0% |
| Cellular Data Only | 725 | 14.8% |
| Satellite Internet | 283 | 5.8% |
| No Internet | 1,646 | 33.6% |
| Total | 4,897 | 100.0% |
Washington County Summary
Introduction
Washington County is located in the northeastern corner of North Carolina, and is bordered by the Albemarle Sound to the north, the Pamlico River to the east, and the Tar River to the south. The county is part of the Inner Banks region of North Carolina, and is home to a variety of natural resources, including forests, wetlands, and rivers. The county is also home to a number of historic sites, including the Washington County Courthouse, the Washington County Museum, and the Washington County Historical Society.
History
Washington County was established in 1799, and was named after George Washington, the first President of the United States. The county was originally part of Tyrrell County, and was created to provide a more convenient location for the county seat. The county seat was moved to Plymouth in 1802, and the county was divided into two townships, Washington and Plymouth.
The county was home to a number of prominent figures in North Carolina history, including William Gaston, a signer of the United States Constitution, and William Gaston, Jr., a United States Senator. The county was also home to a number of prominent African-American leaders, including John Chavis, a minister and educator, and William Gaston, Jr., a lawyer and politician.
Geography
Washington County is located in the northeastern corner of North Carolina, and is bordered by the Albemarle Sound to the north, the Pamlico River to the east, and the Tar River to the south. The county is part of the Inner Banks region of North Carolina, and is home to a variety of natural resources, including forests, wetlands, and rivers. The county is also home to a number of historic sites, including the Washington County Courthouse, the Washington County Museum, and the Washington County Historical Society.
The county is divided into two townships, Washington and Plymouth. The county is home to a number of small towns, including Plymouth, Creswell, and Roper. The county is also home to a number of unincorporated communities, including Belhaven, Chocowinity, and Pantego.
Economy
Washington County is home to a variety of industries, including agriculture, forestry, and tourism. The county is home to a number of agricultural operations, including poultry farms, hog farms, and vegetable farms. The county is also home to a number of timber operations, including sawmills and pulp mills.
The county is home to a number of tourist attractions, including the Washington County Museum, the Washington County Historical Society, and the Washington County Courthouse. The county is also home to a number of outdoor recreation areas, including the Pocosin Lakes National Wildlife Refuge, the Mattamuskeet National Wildlife Refuge, and the Alligator River National Wildlife Refuge.
Demographics
As of the 2010 census, Washington County had a population of 13,228. The population was spread out with a median age of 43.7 years. The racial makeup of the county was 79.2% White, 16.2% African American, 0.5% Native American, 0.7% Asian, 0.1% Pacific Islander, 1.7% from other races, and 1.7% from two or more races.
Conclusion
Washington County is a rural county located in the northeastern corner of North Carolina. The county is home to a variety of natural resources, including forests, wetlands, and rivers. The county is also home to a number of historic sites, including the Washington County Courthouse, the Washington County Museum, and the Washington County Historical Society. The county is home to a variety of industries, including agriculture, forestry, and tourism. The county is also home to a number of tourist attractions, including the Washington County Museum, the Washington County Historical Society, and the Washington County Courthouse. As of the 2010 census, Washington County had a population of 13,228.
Common Questions
What is Per Capita Income in Washington County?
Per Capita income in Washington County is $26,209.
What is the Median Family Income in Washington County?
Median Family Income in Washington County is $58,947.
What is the Median Household income in Washington County?
Median Household Income in Washington County is $38,927.
What is Income or Wage Gap in Washington County?
Income or Wage Gap in Washington County is 46.9%.
Women in Washington County earn 53.1 cents for every dollar earned by a man.
What is Inequality or Gini Index in Washington County?
Inequality or Gini Index in Washington County is 0.51.
What is the Total Population of Washington County?
Total Population of Washington County is 11,051.
What is the Total Male Population of Washington County?
Total Male Population of Washington County is 5,659.
What is the Total Female Population of Washington County?
Total Female Population of Washington County is 5,392.
What is the Ratio of Males per 100 Females in Washington County?
There are 104.95 Males per 100 Females in Washington County.
What is the Ratio of Females per 100 Males in Washington County?
There are 95.28 Females per 100 Males in Washington County.
What is the Median Population Age in Washington County?
Median Population Age in Washington County is 48.0 Years.
What is the Average Family Size in Washington County
Average Family Size in Washington County is 3.0 People.
What is the Average Household Size in Washington County
Average Household Size in Washington County is 2.2 People.
How Large is the Labor Force in Washington County?
There are 4,494 People in the Labor Forcein in Washington County.
What is the Percentage of People in the Labor Force in Washington County?
49.3% of People are in the Labor Force in Washington County.
What is the Unemployment Rate in Washington County?
Unemployment Rate in Washington County is 12.7%.