Transylvania County, NC Map & Demographics
Transylvania County Overview
$36,660
PER CAPITA INCOME
$77,573
AVG FAMILY INCOME
$62,056
AVG HOUSEHOLD INCOME
21.5%
WAGE / INCOME GAP [ % ]
78.5¢/ $1
WAGE / INCOME GAP [ $ ]
$9,852
FAMILY INCOME DEFICIT
0.45
INEQUALITY / GINI INDEX
33,131
TOTAL POPULATION
16,013
MALE POPULATION
17,118
FEMALE POPULATION
93.54
MALES / 100 FEMALES
106.90
FEMALES / 100 MALES
52.4
MEDIAN AGE
2.7
AVG FAMILY SIZE
2.2
AVG HOUSEHOLD SIZE
14,774
LABOR FORCE [ PEOPLE ]
51.8%
PERCENT IN LABOR FORCE
4.0%
UNEMPLOYMENT RATE
Transylvania County Area Codes
Income in Transylvania County
Income Overview in Transylvania County
Per Capita Income in Transylvania County is $36,660, while median incomes of families and households are $77,573 and $62,056 respectively.
| Characteristic | Number | Measure |
| Per Capita Income | 33,131 | $36,660 |
| Median Family Income | 9,385 | $77,573 |
| Mean Family Income | 9,385 | $96,906 |
| Median Household Income | 14,353 | $62,056 |
| Mean Household Income | 14,353 | $81,444 |
| Income Deficit | 9,385 | $9,852 |
| Wage / Income Gap (%) | 33,131 | 21.46% |
| Wage / Income Gap ($) | 33,131 | 78.54¢ per $1 |
| Gini / Inequality Index | 33,131 | 0.45 |
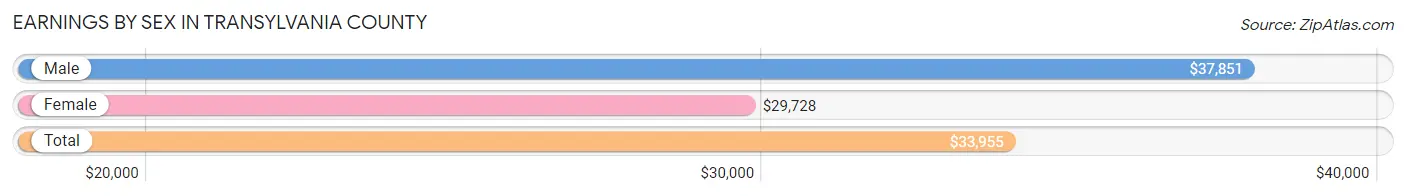
Earnings by Sex in Transylvania County
Average Earnings in Transylvania County are $33,955, $37,851 for men and $29,728 for women, a difference of 21.5%.
| Sex | Number | Average Earnings |
| Male | 8,367 (51.7%) | $37,851 |
| Female | 7,810 (48.3%) | $29,728 |
| Total | 16,177 (100.0%) | $33,955 |
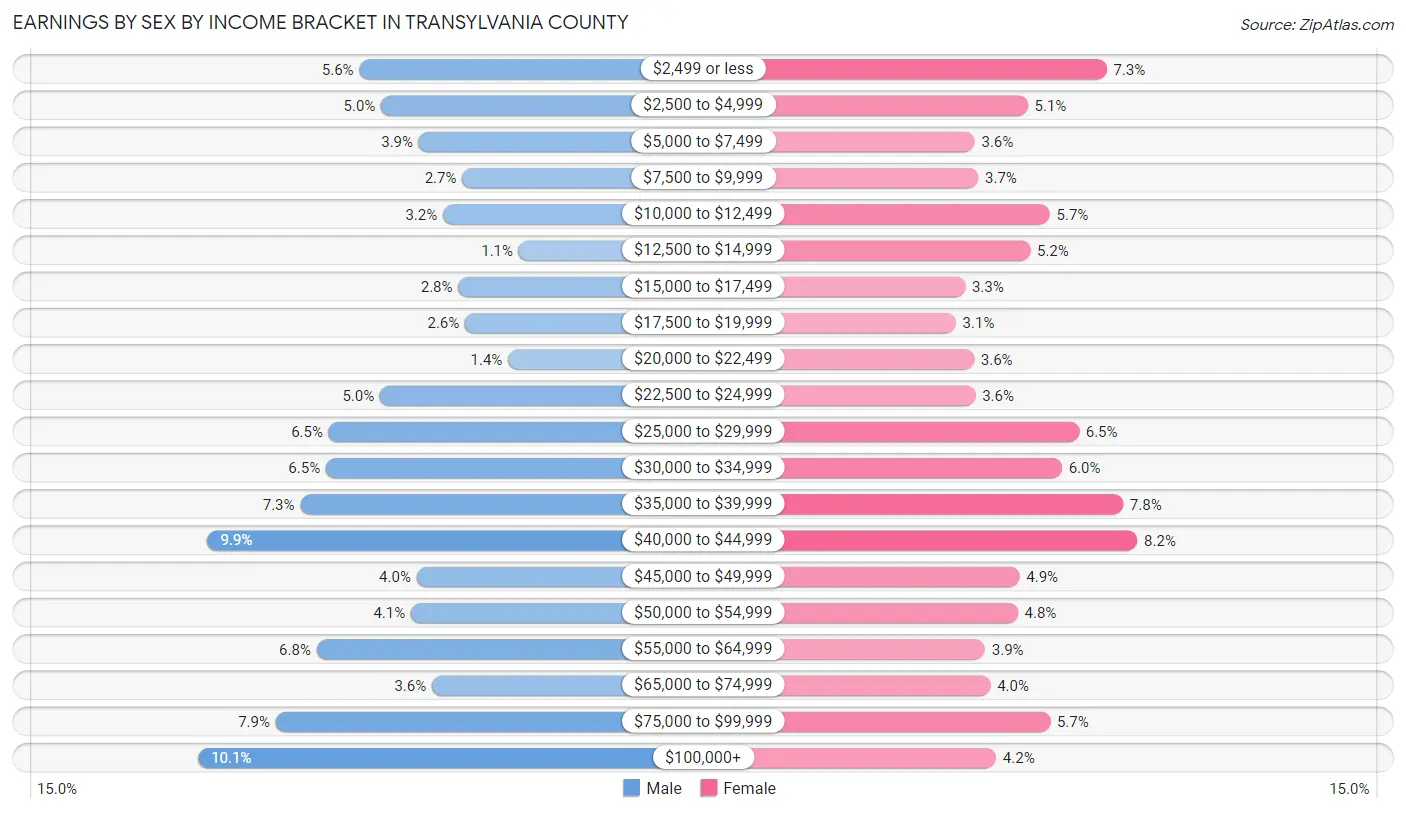
Earnings by Sex by Income Bracket in Transylvania County
The most common earnings brackets in Transylvania County are $100,000+ for men (847 | 10.1%) and $40,000 to $44,999 for women (637 | 8.2%).
| Income | Male | Female |
| $2,499 or less | 468 (5.6%) | 570 (7.3%) |
| $2,500 to $4,999 | 417 (5.0%) | 397 (5.1%) |
| $5,000 to $7,499 | 328 (3.9%) | 280 (3.6%) |
| $7,500 to $9,999 | 226 (2.7%) | 288 (3.7%) |
| $10,000 to $12,499 | 271 (3.2%) | 445 (5.7%) |
| $12,500 to $14,999 | 93 (1.1%) | 402 (5.1%) |
| $15,000 to $17,499 | 235 (2.8%) | 259 (3.3%) |
| $17,500 to $19,999 | 219 (2.6%) | 239 (3.1%) |
| $20,000 to $22,499 | 118 (1.4%) | 279 (3.6%) |
| $22,500 to $24,999 | 419 (5.0%) | 282 (3.6%) |
| $25,000 to $29,999 | 540 (6.5%) | 509 (6.5%) |
| $30,000 to $34,999 | 546 (6.5%) | 472 (6.0%) |
| $35,000 to $39,999 | 607 (7.2%) | 606 (7.8%) |
| $40,000 to $44,999 | 825 (9.9%) | 637 (8.2%) |
| $45,000 to $49,999 | 333 (4.0%) | 379 (4.9%) |
| $50,000 to $54,999 | 346 (4.1%) | 375 (4.8%) |
| $55,000 to $64,999 | 568 (6.8%) | 303 (3.9%) |
| $65,000 to $74,999 | 297 (3.5%) | 315 (4.0%) |
| $75,000 to $99,999 | 664 (7.9%) | 446 (5.7%) |
| $100,000+ | 847 (10.1%) | 327 (4.2%) |
| Total | 8,367 (100.0%) | 7,810 (100.0%) |
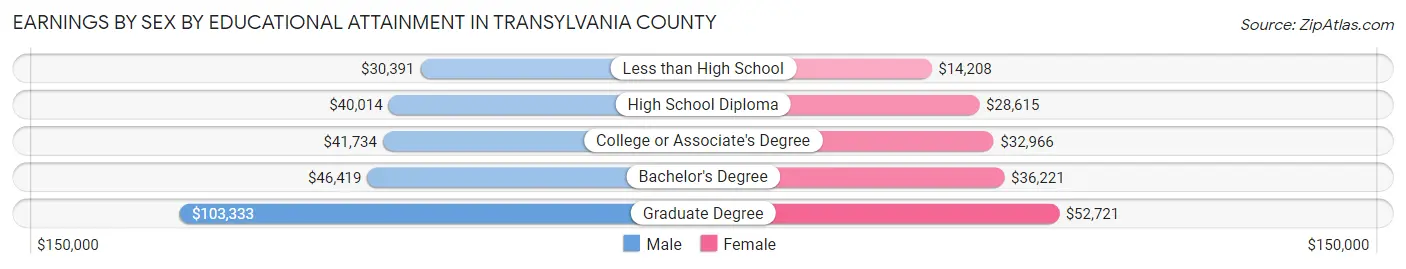
Earnings by Sex by Educational Attainment in Transylvania County
Average earnings in Transylvania County are $41,708 for men and $33,750 for women, a difference of 19.1%. Men with an educational attainment of graduate degree enjoy the highest average annual earnings of $103,333, while those with less than high school education earn the least with $30,391. Women with an educational attainment of graduate degree earn the most with the average annual earnings of $52,721, while those with less than high school education have the smallest earnings of $14,208.
| Educational Attainment | Male Income | Female Income |
| Less than High School | $30,391 | $14,208 |
| High School Diploma | $40,014 | $28,615 |
| College or Associate's Degree | $41,734 | $32,966 |
| Bachelor's Degree | $46,419 | $36,221 |
| Graduate Degree | $103,333 | $52,721 |
| Total | $41,708 | $33,750 |
Family Income in Transylvania County
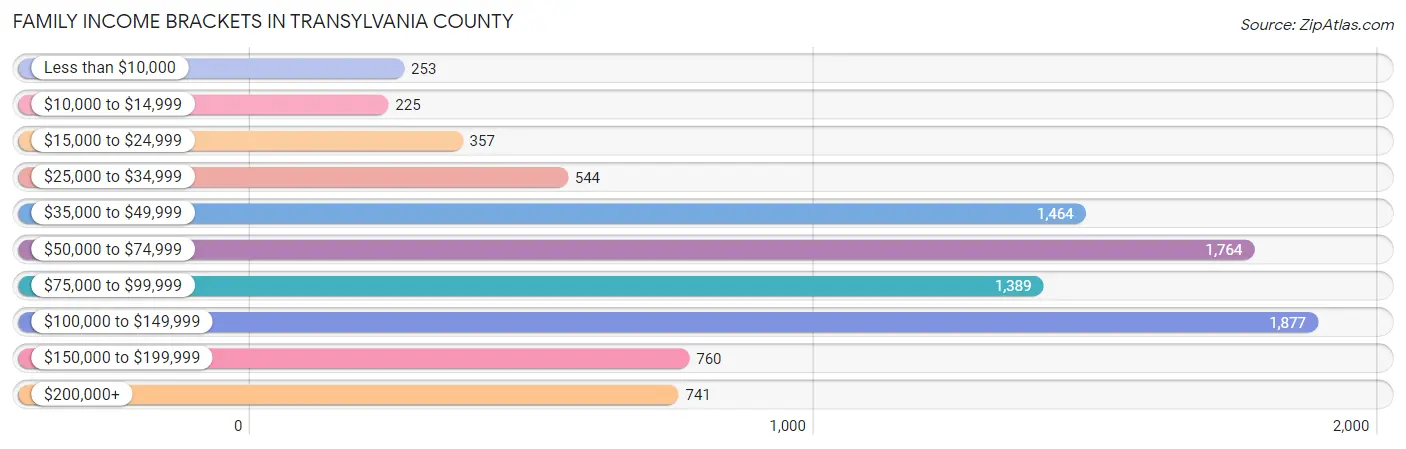
Family Income Brackets in Transylvania County
According to the Transylvania County family income data, there are 1,877 families falling into the $100,000 to $149,999 income range, which is the most common income bracket and makes up 20.0% of all families. Conversely, the $10,000 to $14,999 income bracket is the least frequent group with only 225 families (2.4%) belonging to this category.
| Income Bracket | # Families | % Families |
| Less than $10,000 | 253 | 2.7% |
| $10,000 to $14,999 | 225 | 2.4% |
| $15,000 to $24,999 | 357 | 3.8% |
| $25,000 to $34,999 | 544 | 5.8% |
| $35,000 to $49,999 | 1,464 | 15.6% |
| $50,000 to $74,999 | 1,764 | 18.8% |
| $75,000 to $99,999 | 1,389 | 14.8% |
| $100,000 to $149,999 | 1,877 | 20.0% |
| $150,000 to $199,999 | 760 | 8.1% |
| $200,000+ | 741 | 7.9% |
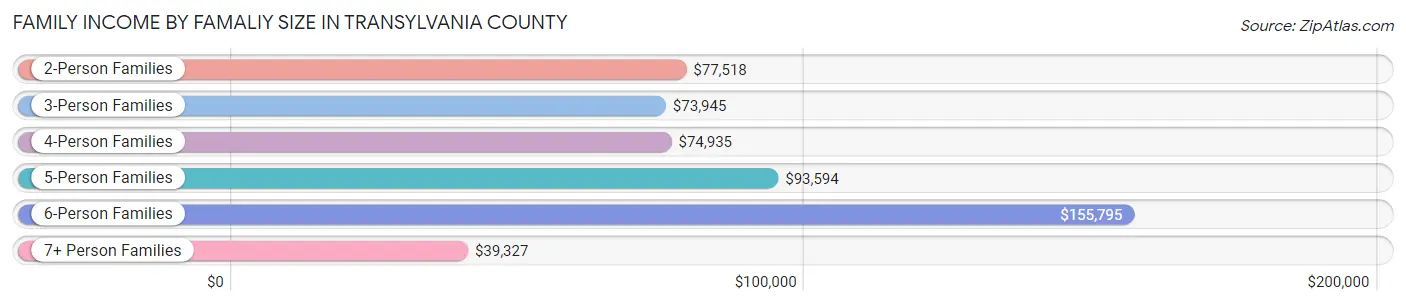
Family Income by Famaliy Size in Transylvania County
6-person families (92 | 1.0%) account for the highest median family income in Transylvania County with $155,795 per family, while 2-person families (6,090 | 64.9%) have the highest median income of $38,759 per family member.
| Income Bracket | # Families | Median Income |
| 2-Person Families | 6,090 (64.9%) | $77,518 |
| 3-Person Families | 1,759 (18.7%) | $73,945 |
| 4-Person Families | 991 (10.6%) | $74,935 |
| 5-Person Families | 393 (4.2%) | $93,594 |
| 6-Person Families | 92 (1.0%) | $155,795 |
| 7+ Person Families | 60 (0.6%) | $39,327 |
| Total | 9,385 (100.0%) | $77,573 |
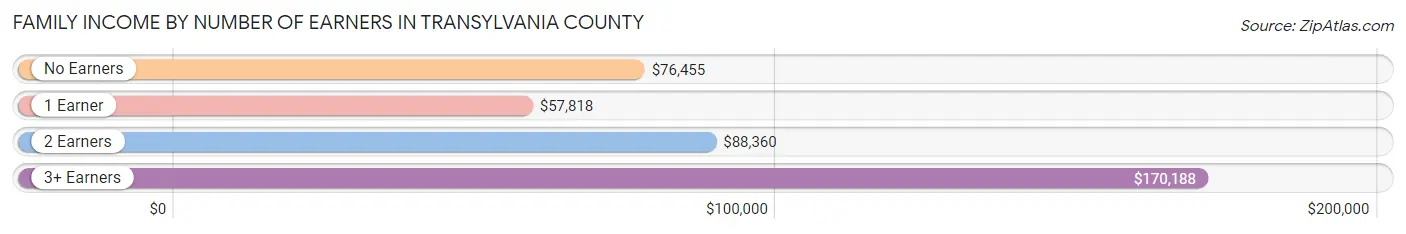
Family Income by Number of Earners in Transylvania County
The median family income in Transylvania County is $77,573, with families comprising 3+ earners (521) having the highest median family income of $170,188, while families with 1 earner (2,814) have the lowest median family income of $57,818, accounting for 5.6% and 30.0% of families, respectively.
| Number of Earners | # Families | Median Income |
| No Earners | 2,590 (27.6%) | $76,455 |
| 1 Earner | 2,814 (30.0%) | $57,818 |
| 2 Earners | 3,460 (36.9%) | $88,360 |
| 3+ Earners | 521 (5.6%) | $170,188 |
| Total | 9,385 (100.0%) | $77,573 |
Household Income in Transylvania County
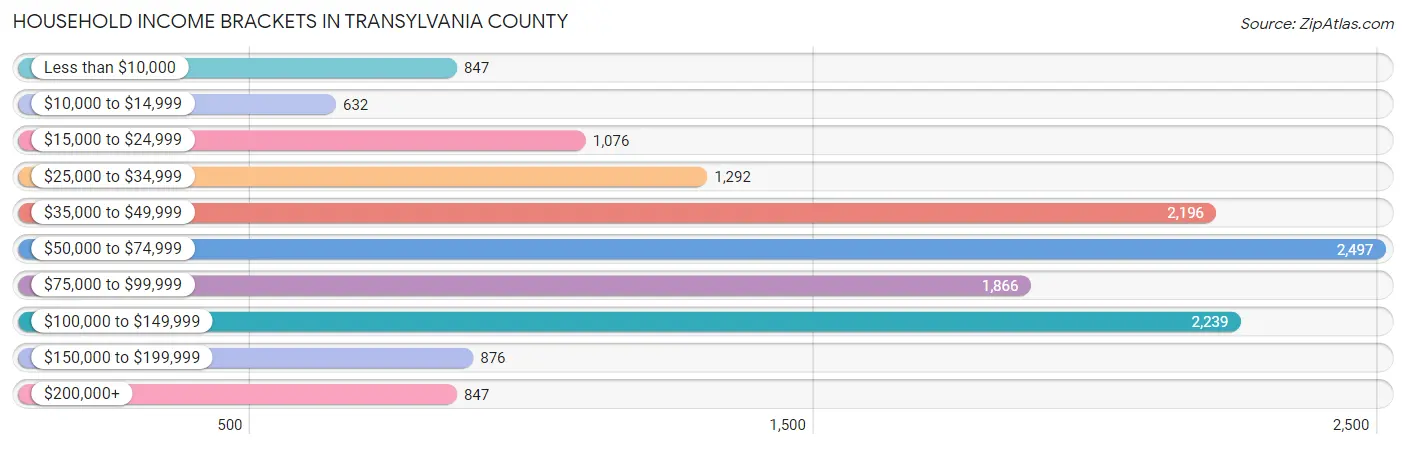
Household Income Brackets in Transylvania County
With 2,497 households falling in the category, the $50,000 to $74,999 income range is the most frequent in Transylvania County, accounting for 17.4% of all households. In contrast, only 632 households (4.4%) fall into the $10,000 to $14,999 income bracket, making it the least populous group.
| Income Bracket | # Households | % Households |
| Less than $10,000 | 847 | 5.9% |
| $10,000 to $14,999 | 632 | 4.4% |
| $15,000 to $24,999 | 1,076 | 7.5% |
| $25,000 to $34,999 | 1,292 | 9.0% |
| $35,000 to $49,999 | 2,196 | 15.3% |
| $50,000 to $74,999 | 2,497 | 17.4% |
| $75,000 to $99,999 | 1,866 | 13.0% |
| $100,000 to $149,999 | 2,239 | 15.6% |
| $150,000 to $199,999 | 876 | 6.1% |
| $200,000+ | 847 | 5.9% |
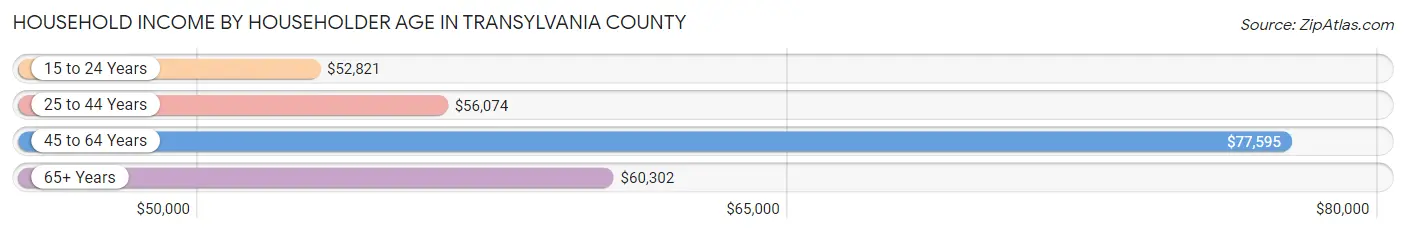
Household Income by Householder Age in Transylvania County
The median household income in Transylvania County is $62,056, with the highest median household income of $77,595 found in the 45 to 64 years age bracket for the primary householder. A total of 4,152 households (28.9%) fall into this category. Meanwhile, the 15 to 24 years age bracket for the primary householder has the lowest median household income of $52,821, with 386 households (2.7%) in this group.
| Income Bracket | # Households | Median Income |
| 15 to 24 Years | 386 (2.7%) | $52,821 |
| 25 to 44 Years | 3,417 (23.8%) | $56,074 |
| 45 to 64 Years | 4,152 (28.9%) | $77,595 |
| 65+ Years | 6,398 (44.6%) | $60,302 |
| Total | 14,353 (100.0%) | $62,056 |
Poverty in Transylvania County
Income Below Poverty by Sex and Age in Transylvania County
With 12.6% poverty level for males and 14.1% for females among the residents of Transylvania County, 16 and 17 year old males and 18 to 24 year old females are the most vulnerable to poverty, with 70 males (34.6%) and 279 females (34.6%) in their respective age groups living below the poverty level.
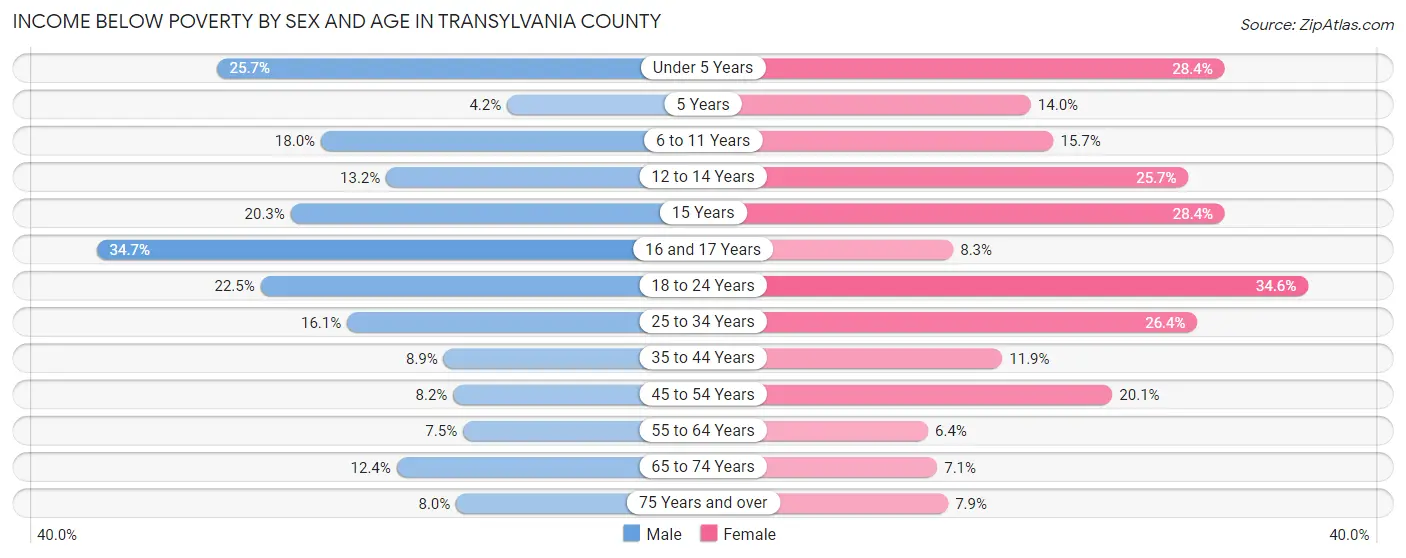
| Age Bracket | Male | Female |
| Under 5 Years | 173 (25.7%) | 175 (28.4%) |
| 5 Years | 11 (4.2%) | 16 (14.0%) |
| 6 to 11 Years | 153 (18.0%) | 150 (15.7%) |
| 12 to 14 Years | 40 (13.2%) | 97 (25.7%) |
| 15 Years | 65 (20.3%) | 31 (28.4%) |
| 16 and 17 Years | 70 (34.6%) | 25 (8.3%) |
| 18 to 24 Years | 257 (22.5%) | 279 (34.6%) |
| 25 to 34 Years | 251 (16.1%) | 436 (26.4%) |
| 35 to 44 Years | 139 (8.9%) | 202 (11.9%) |
| 45 to 54 Years | 139 (8.2%) | 358 (20.1%) |
| 55 to 64 Years | 171 (7.4%) | 183 (6.4%) |
| 65 to 74 Years | 317 (12.4%) | 208 (7.1%) |
| 75 Years and over | 163 (8.0%) | 196 (7.9%) |
| Total | 1,949 (12.6%) | 2,356 (14.1%) |
Income Above Poverty by Sex and Age in Transylvania County
According to the poverty statistics in Transylvania County, males aged 5 years and females aged 55 to 64 years are the age groups that are most secure financially, with 95.8% of males and 93.6% of females in these age groups living above the poverty line.
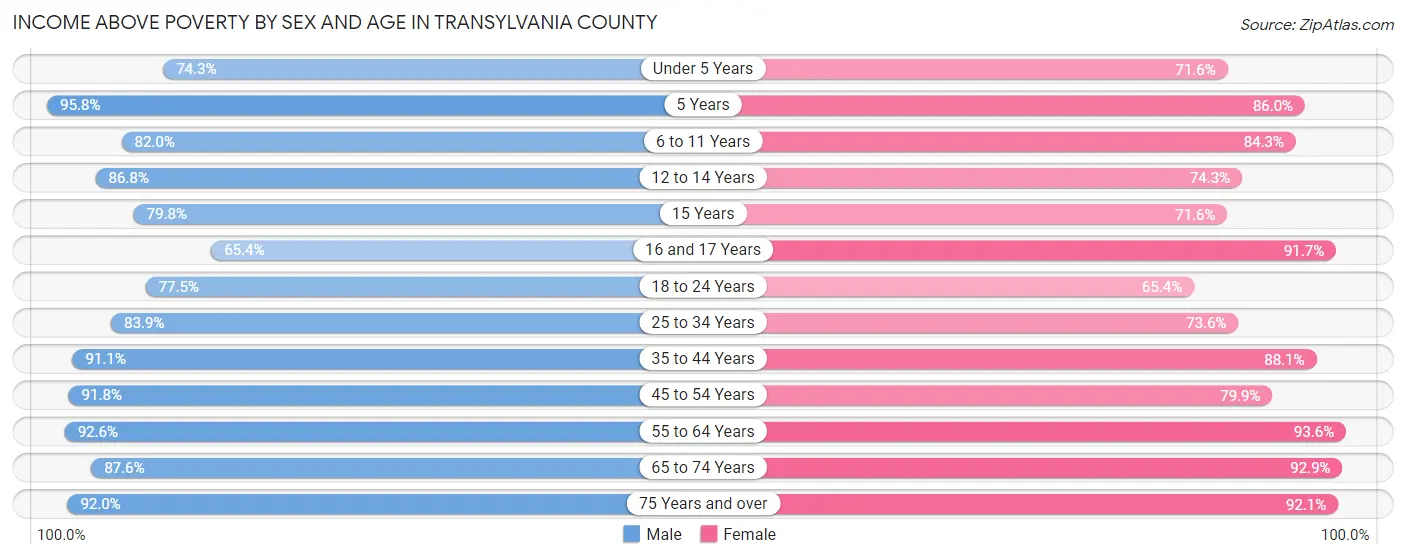
| Age Bracket | Male | Female |
| Under 5 Years | 499 (74.3%) | 441 (71.6%) |
| 5 Years | 252 (95.8%) | 98 (86.0%) |
| 6 to 11 Years | 697 (82.0%) | 804 (84.3%) |
| 12 to 14 Years | 264 (86.8%) | 280 (74.3%) |
| 15 Years | 256 (79.7%) | 78 (71.6%) |
| 16 and 17 Years | 132 (65.3%) | 277 (91.7%) |
| 18 to 24 Years | 886 (77.5%) | 527 (65.4%) |
| 25 to 34 Years | 1,312 (83.9%) | 1,216 (73.6%) |
| 35 to 44 Years | 1,425 (91.1%) | 1,493 (88.1%) |
| 45 to 54 Years | 1,560 (91.8%) | 1,424 (79.9%) |
| 55 to 64 Years | 2,125 (92.5%) | 2,673 (93.6%) |
| 65 to 74 Years | 2,243 (87.6%) | 2,726 (92.9%) |
| 75 Years and over | 1,886 (92.0%) | 2,284 (92.1%) |
| Total | 13,537 (87.4%) | 14,321 (85.9%) |
Income Below Poverty Among Married-Couple Families in Transylvania County
The poverty statistics for married-couple families in Transylvania County show that 4.8% or 356 of the total 7,423 families live below the poverty line. Families with 5 or more children have the highest poverty rate of 100.0%, comprising of 43 families. On the other hand, families with 1 or 2 children have the lowest poverty rate of 1.3%, which includes 17 families.
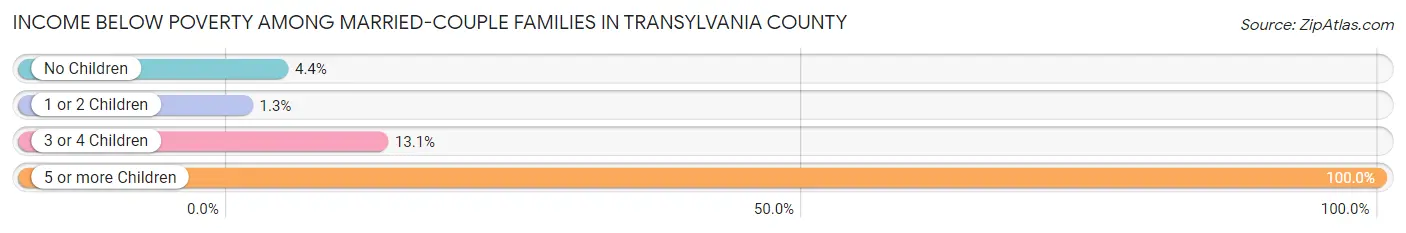
| Children | Above Poverty | Below Poverty |
| No Children | 5,408 (95.7%) | 246 (4.3%) |
| 1 or 2 Children | 1,326 (98.7%) | 17 (1.3%) |
| 3 or 4 Children | 333 (87.0%) | 50 (13.1%) |
| 5 or more Children | 0 (0.0%) | 43 (100.0%) |
| Total | 7,067 (95.2%) | 356 (4.8%) |
Income Below Poverty Among Single-Parent Households in Transylvania County
According to the poverty data in Transylvania County, 13.9% or 70 single-father households and 21.8% or 319 single-mother households are living below the poverty line. Among single-father households, those with 5 or more children have the highest poverty rate, with 10 households (66.7%) experiencing poverty. Likewise, among single-mother households, those with 3 or 4 children have the highest poverty rate, with 44 households (42.3%) falling below the poverty line.
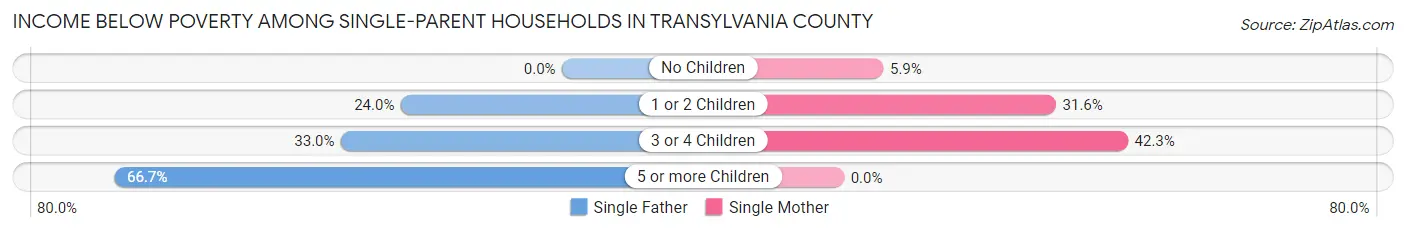
| Children | Single Father | Single Mother |
| No Children | 0 (0.0%) | 35 (5.9%) |
| 1 or 2 Children | 31 (24.0%) | 240 (31.6%) |
| 3 or 4 Children | 29 (33.0%) | 44 (42.3%) |
| 5 or more Children | 10 (66.7%) | 0 (0.0%) |
| Total | 70 (13.9%) | 319 (21.8%) |
Income Below Poverty Among Married-Couple vs Single-Parent Households in Transylvania County
The poverty data for Transylvania County shows that 356 of the married-couple family households (4.8%) and 389 of the single-parent households (19.8%) are living below the poverty level. Within the married-couple family households, those with 5 or more children have the highest poverty rate, with 43 households (100.0%) falling below the poverty line. Among the single-parent households, those with 5 or more children have the highest poverty rate, with 10 household (66.7%) living below poverty.
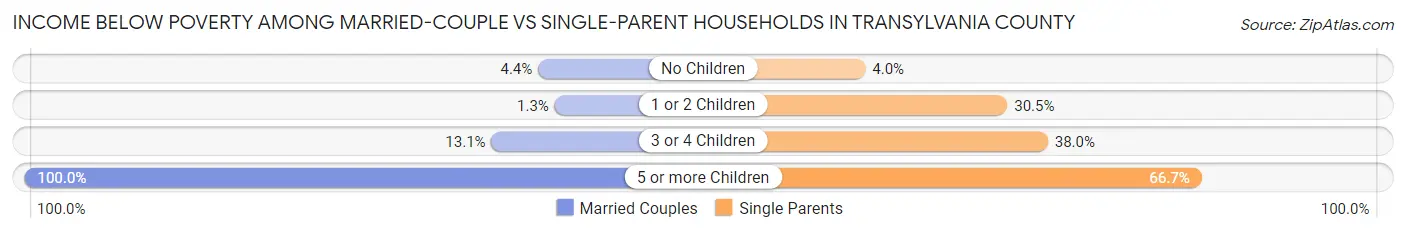
| Children | Married-Couple Families | Single-Parent Households |
| No Children | 246 (4.3%) | 35 (4.0%) |
| 1 or 2 Children | 17 (1.3%) | 271 (30.5%) |
| 3 or 4 Children | 50 (13.1%) | 73 (38.0%) |
| 5 or more Children | 43 (100.0%) | 10 (66.7%) |
| Total | 356 (4.8%) | 389 (19.8%) |
Race in Transylvania County
The most populous races in Transylvania County are White / Caucasian (29,993 | 90.5%), Black / African American (1,476 | 4.5%), and Two or more Races (1,230 | 3.7%).
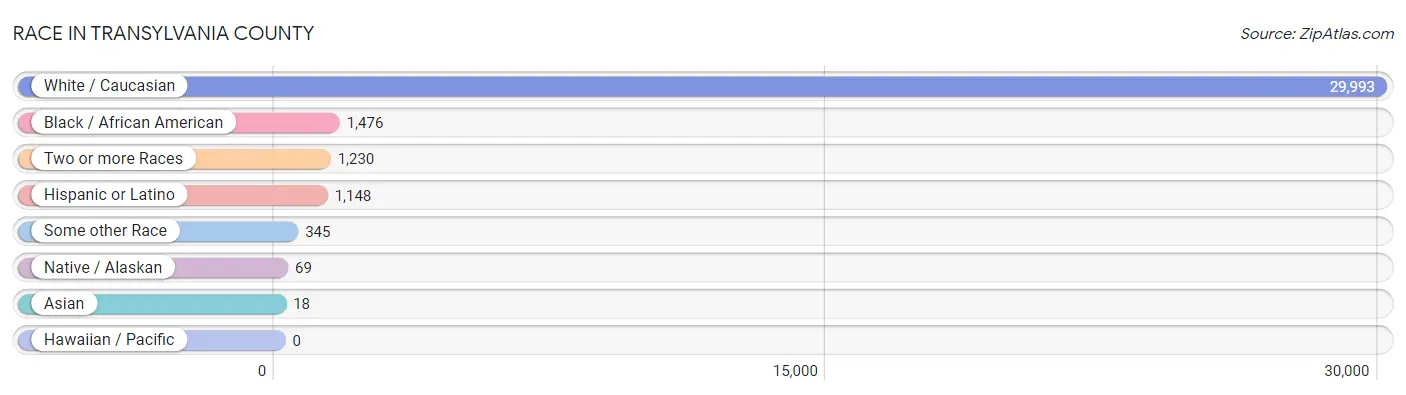
| Race | # Population | % Population |
| Asian | 18 | 0.1% |
| Black / African American | 1,476 | 4.5% |
| Hawaiian / Pacific | 0 | 0.0% |
| Hispanic or Latino | 1,148 | 3.5% |
| Native / Alaskan | 69 | 0.2% |
| White / Caucasian | 29,993 | 90.5% |
| Two or more Races | 1,230 | 3.7% |
| Some other Race | 345 | 1.0% |
| Total | 33,131 | 100.0% |
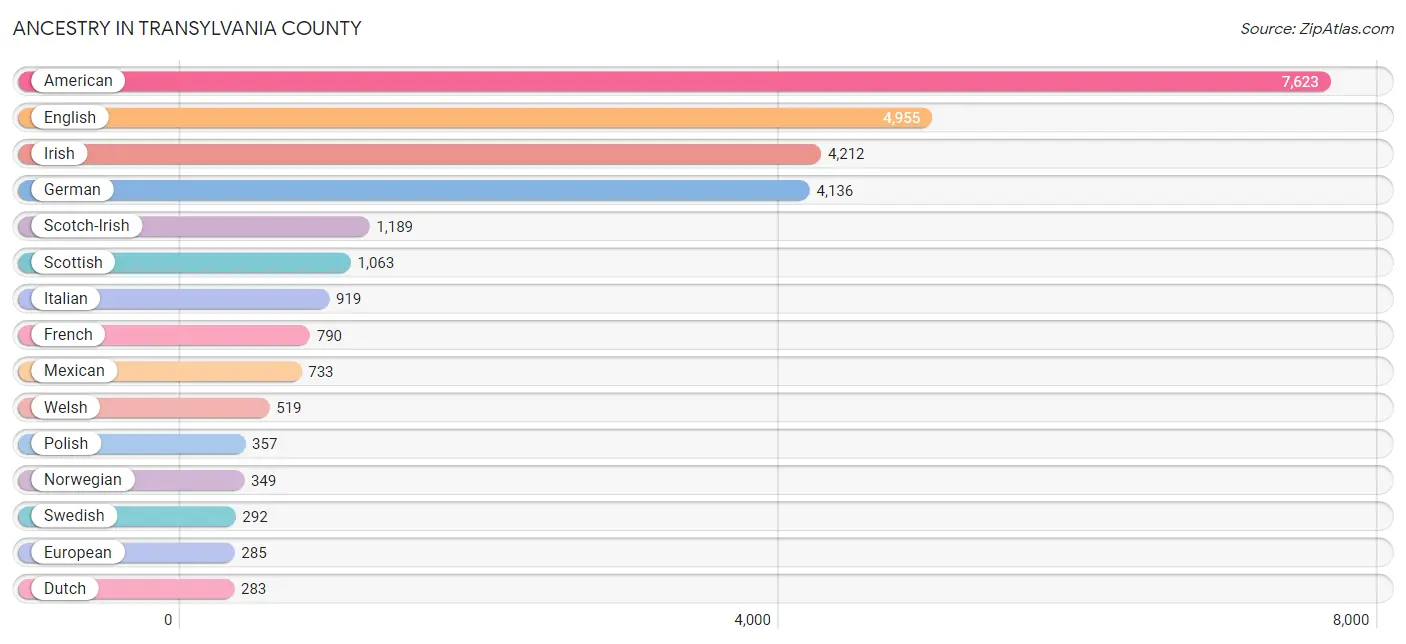
Ancestry in Transylvania County
The most populous ancestries reported in Transylvania County are American (7,623 | 23.0%), English (4,955 | 15.0%), Irish (4,212 | 12.7%), German (4,136 | 12.5%), and Scotch-Irish (1,189 | 3.6%), together accounting for 66.8% of all Transylvania County residents.
| Ancestry | # Population | % Population |
| African | 23 | 0.1% |
| American | 7,623 | 23.0% |
| Apache | 4 | 0.0% |
| Arab | 14 | 0.0% |
| Armenian | 14 | 0.0% |
| Austrian | 92 | 0.3% |
| Barbadian | 1 | 0.0% |
| Bermudan | 10 | 0.0% |
| Bhutanese | 36 | 0.1% |
| Blackfeet | 34 | 0.1% |
| Brazilian | 8 | 0.0% |
| British | 255 | 0.8% |
| Burmese | 6 | 0.0% |
| Canadian | 36 | 0.1% |
| Central American | 97 | 0.3% |
| Central American Indian | 7 | 0.0% |
| Cherokee | 238 | 0.7% |
| Chippewa | 24 | 0.1% |
| Colombian | 15 | 0.1% |
| Croatian | 40 | 0.1% |
| Cuban | 122 | 0.4% |
| Czech | 22 | 0.1% |
| Czechoslovakian | 19 | 0.1% |
| Danish | 71 | 0.2% |
| Dominican | 7 | 0.0% |
| Dutch | 283 | 0.9% |
| Eastern European | 44 | 0.1% |
| English | 4,955 | 15.0% |
| European | 285 | 0.9% |
| Finnish | 58 | 0.2% |
| French | 790 | 2.4% |
| French Canadian | 152 | 0.5% |
| German | 4,136 | 12.5% |
| Ghanaian | 4 | 0.0% |
| Greek | 44 | 0.1% |
| Guatemalan | 7 | 0.0% |
| Haitian | 91 | 0.3% |
| Honduran | 90 | 0.3% |
| Hungarian | 23 | 0.1% |
| Indian (Asian) | 64 | 0.2% |
| Irish | 4,212 | 12.7% |
| Iroquois | 1 | 0.0% |
| Italian | 919 | 2.8% |
| Lebanese | 10 | 0.0% |
| Lithuanian | 16 | 0.1% |
| Lumbee | 29 | 0.1% |
| Luxembourger | 38 | 0.1% |
| Mexican | 733 | 2.2% |
| Moroccan | 4 | 0.0% |
| Navajo | 32 | 0.1% |
| Northern European | 158 | 0.5% |
| Norwegian | 349 | 1.1% |
| Pennsylvania German | 19 | 0.1% |
| Polish | 357 | 1.1% |
| Portuguese | 50 | 0.2% |
| Puerto Rican | 71 | 0.2% |
| Russian | 48 | 0.1% |
| Scandinavian | 51 | 0.2% |
| Scotch-Irish | 1,189 | 3.6% |
| Scottish | 1,063 | 3.2% |
| Sioux | 7 | 0.0% |
| Slovak | 15 | 0.1% |
| South African | 30 | 0.1% |
| South American | 15 | 0.1% |
| Spaniard | 84 | 0.3% |
| Spanish | 18 | 0.1% |
| Subsaharan African | 76 | 0.2% |
| Swedish | 292 | 0.9% |
| Swiss | 98 | 0.3% |
| Ukrainian | 40 | 0.1% |
| Welsh | 519 | 1.6% |
| West Indian | 46 | 0.1% | View All 72 Rows |
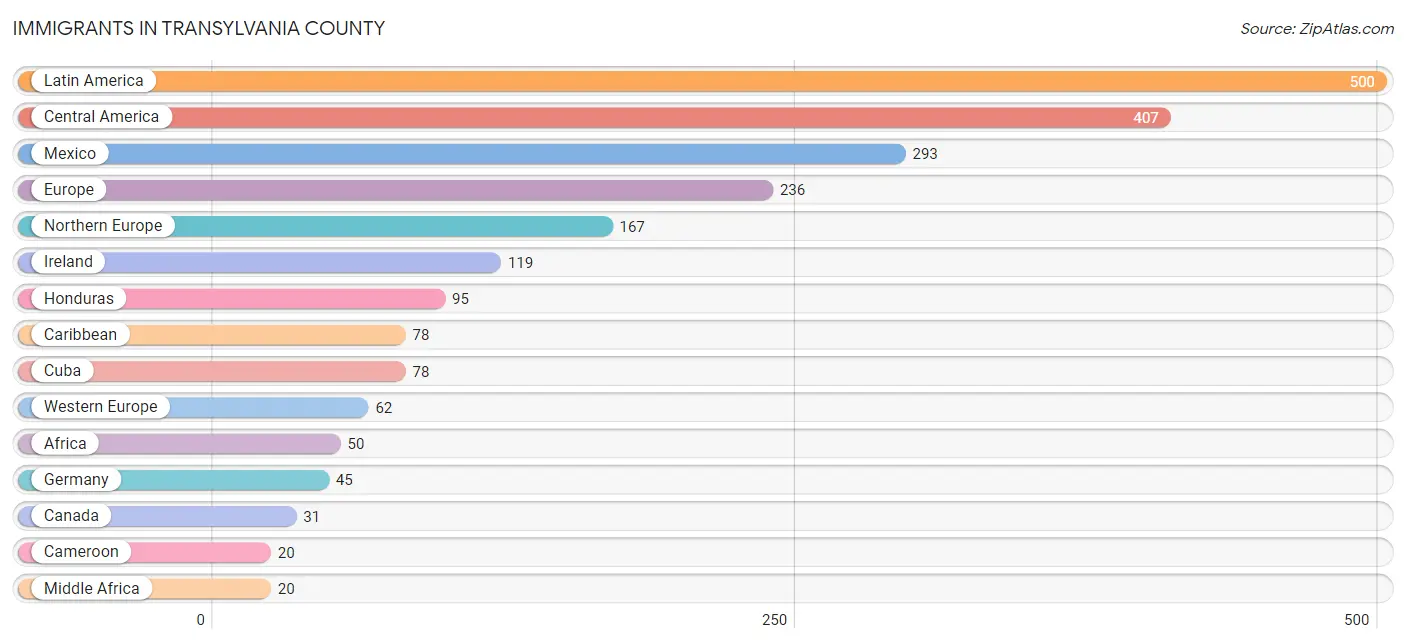
Immigrants in Transylvania County
The most numerous immigrant groups reported in Transylvania County came from Latin America (500 | 1.5%), Central America (407 | 1.2%), Mexico (293 | 0.9%), Europe (236 | 0.7%), and Northern Europe (167 | 0.5%), together accounting for 4.8% of all Transylvania County residents.
| Immigration Origin | # Population | % Population |
| Africa | 50 | 0.2% |
| Armenia | 14 | 0.0% |
| Asia | 18 | 0.1% |
| Austria | 13 | 0.0% |
| Belgium | 4 | 0.0% |
| Cameroon | 20 | 0.1% |
| Canada | 31 | 0.1% |
| Caribbean | 78 | 0.2% |
| Central America | 407 | 1.2% |
| Colombia | 15 | 0.1% |
| Croatia | 7 | 0.0% |
| Cuba | 78 | 0.2% |
| Eastern Africa | 12 | 0.0% |
| Eastern Europe | 7 | 0.0% |
| Europe | 236 | 0.7% |
| Germany | 45 | 0.1% |
| Guatemala | 19 | 0.1% |
| Honduras | 95 | 0.3% |
| Ireland | 119 | 0.4% |
| Latin America | 500 | 1.5% |
| Lebanon | 4 | 0.0% |
| Mexico | 293 | 0.9% |
| Middle Africa | 20 | 0.1% |
| Northern Europe | 167 | 0.5% |
| South Africa | 18 | 0.1% |
| South America | 15 | 0.1% |
| Western Asia | 18 | 0.1% |
| Western Europe | 62 | 0.2% |
| Zimbabwe | 12 | 0.0% | View All 29 Rows |
Sex and Age in Transylvania County
Sex and Age in Transylvania County
The most populous age groups in Transylvania County are 65 to 69 Years (1,384 | 8.6%) for men and 60 to 64 Years (1,529 | 8.9%) for women.
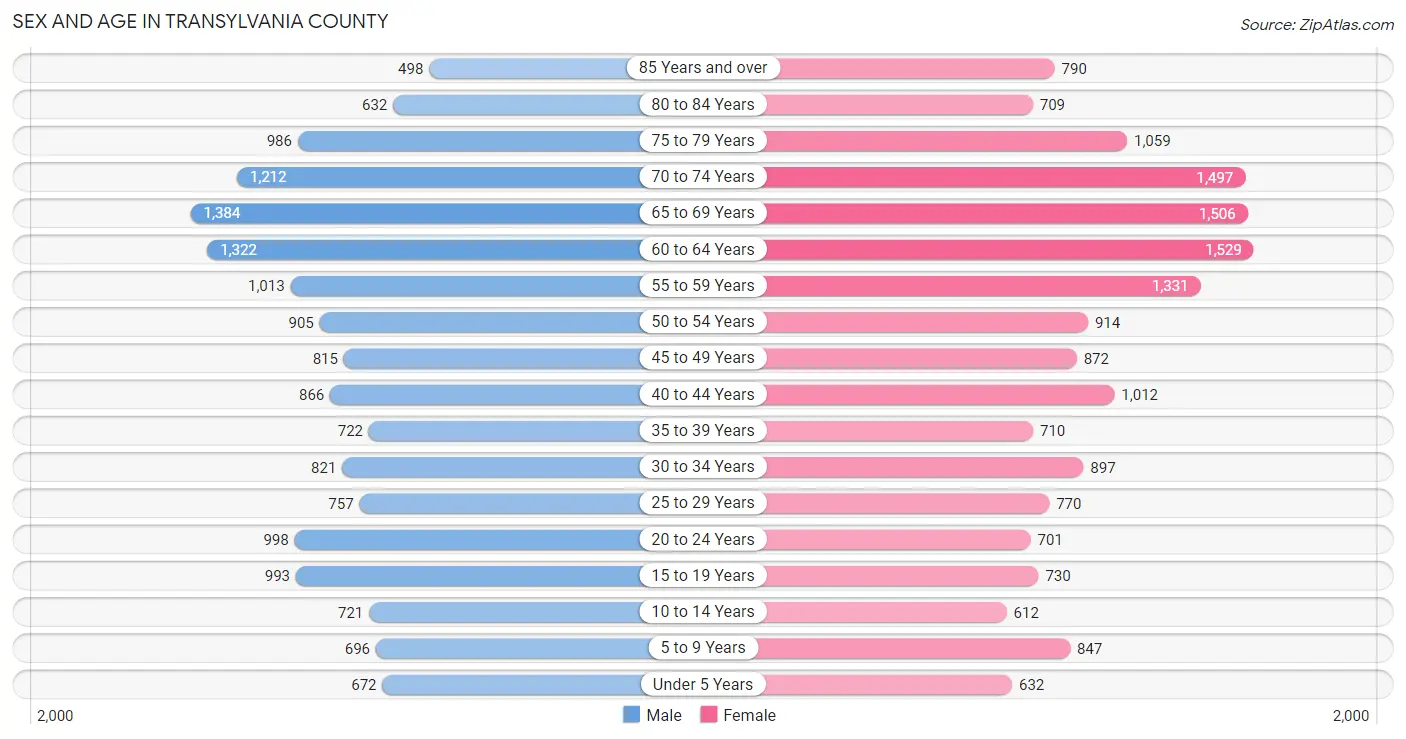
| Age Bracket | Male | Female |
| Under 5 Years | 672 (4.2%) | 632 (3.7%) |
| 5 to 9 Years | 696 (4.3%) | 847 (5.0%) |
| 10 to 14 Years | 721 (4.5%) | 612 (3.6%) |
| 15 to 19 Years | 993 (6.2%) | 730 (4.3%) |
| 20 to 24 Years | 998 (6.2%) | 701 (4.1%) |
| 25 to 29 Years | 757 (4.7%) | 770 (4.5%) |
| 30 to 34 Years | 821 (5.1%) | 897 (5.2%) |
| 35 to 39 Years | 722 (4.5%) | 710 (4.2%) |
| 40 to 44 Years | 866 (5.4%) | 1,012 (5.9%) |
| 45 to 49 Years | 815 (5.1%) | 872 (5.1%) |
| 50 to 54 Years | 905 (5.7%) | 914 (5.3%) |
| 55 to 59 Years | 1,013 (6.3%) | 1,331 (7.8%) |
| 60 to 64 Years | 1,322 (8.3%) | 1,529 (8.9%) |
| 65 to 69 Years | 1,384 (8.6%) | 1,506 (8.8%) |
| 70 to 74 Years | 1,212 (7.6%) | 1,497 (8.7%) |
| 75 to 79 Years | 986 (6.2%) | 1,059 (6.2%) |
| 80 to 84 Years | 632 (4.0%) | 709 (4.1%) |
| 85 Years and over | 498 (3.1%) | 790 (4.6%) |
| Total | 16,013 (100.0%) | 17,118 (100.0%) |
Families and Households in Transylvania County
Median Family Size in Transylvania County
The median family size in Transylvania County is 2.70 persons per family, with single male/father families (502 | 5.3%) accounting for the largest median family size of 3.85 persons per family. On the other hand, married-couple families (7,423 | 79.1%) represent the smallest median family size with 2.61 persons per family.
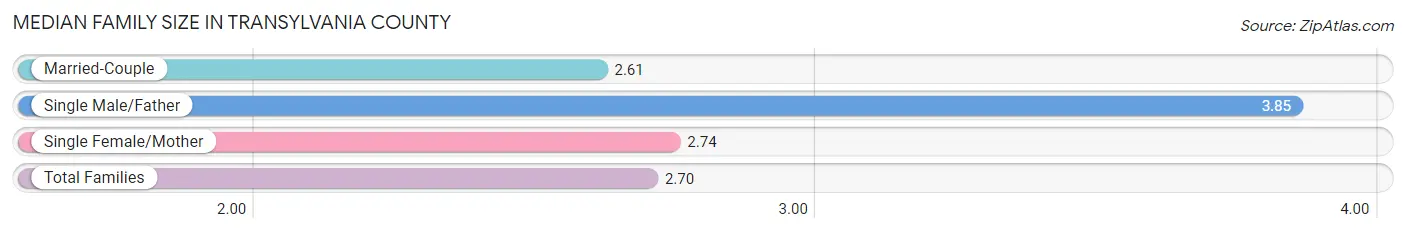
| Family Type | # Families | Family Size |
| Married-Couple | 7,423 (79.1%) | 2.61 |
| Single Male/Father | 502 (5.3%) | 3.85 |
| Single Female/Mother | 1,460 (15.6%) | 2.74 |
| Total Families | 9,385 (100.0%) | 2.70 |
Median Household Size in Transylvania County
The median household size in Transylvania County is 2.22 persons per household, with single male/father households (502 | 3.5%) accounting for the largest median household size of 4.13 persons per household. non-family households (4,968 | 34.6%) represent the smallest median household size with 1.26 persons per household.
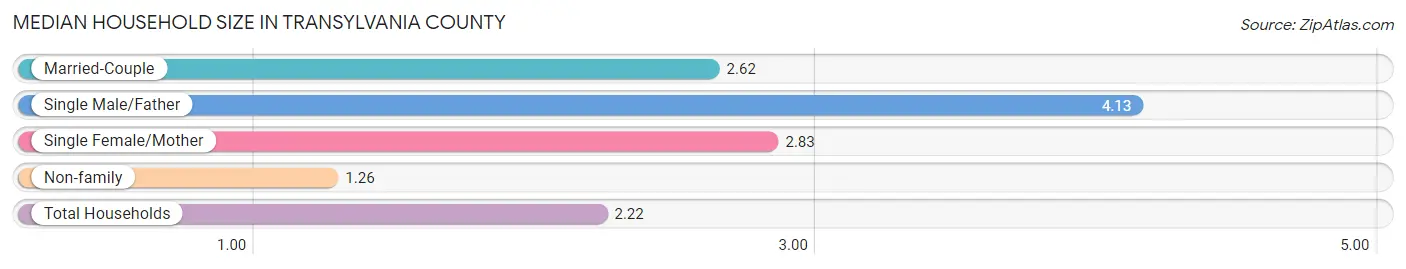
| Household Type | # Households | Household Size |
| Married-Couple | 7,423 (51.7%) | 2.62 |
| Single Male/Father | 502 (3.5%) | 4.13 |
| Single Female/Mother | 1,460 (10.2%) | 2.83 |
| Non-family | 4,968 (34.6%) | 1.26 |
| Total Households | 14,353 (100.0%) | 2.22 |
Household Size by Marriage Status in Transylvania County
Out of a total of 14,353 households in Transylvania County, 9,385 (65.4%) are family households, while 4,968 (34.6%) are nonfamily households. The most numerous type of family households are 2-person households, comprising 5,950, and the most common type of nonfamily households are 1-person households, comprising 4,014.
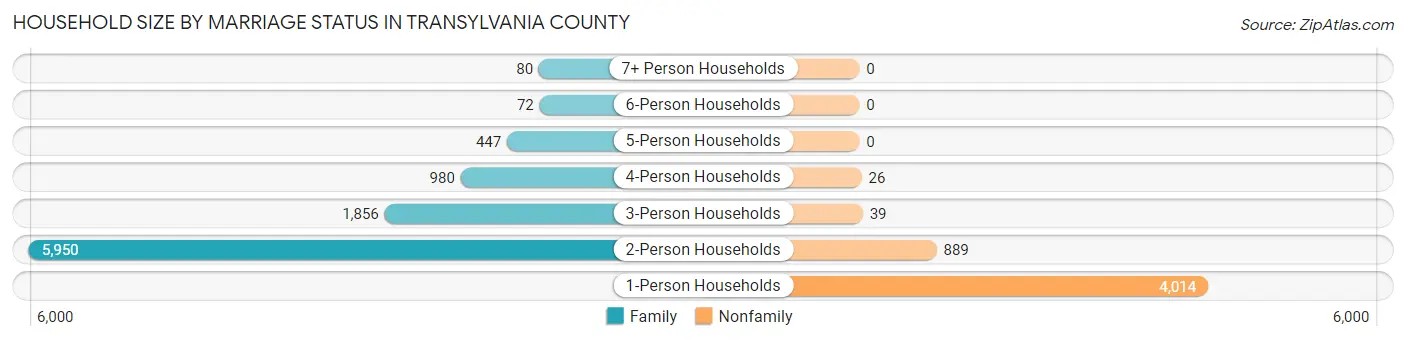
| Household Size | Family Households | Nonfamily Households |
| 1-Person Households | - | 4,014 (28.0%) |
| 2-Person Households | 5,950 (41.4%) | 889 (6.2%) |
| 3-Person Households | 1,856 (12.9%) | 39 (0.3%) |
| 4-Person Households | 980 (6.8%) | 26 (0.2%) |
| 5-Person Households | 447 (3.1%) | 0 (0.0%) |
| 6-Person Households | 72 (0.5%) | 0 (0.0%) |
| 7+ Person Households | 80 (0.6%) | 0 (0.0%) |
| Total | 9,385 (65.4%) | 4,968 (34.6%) |
Female Fertility in Transylvania County
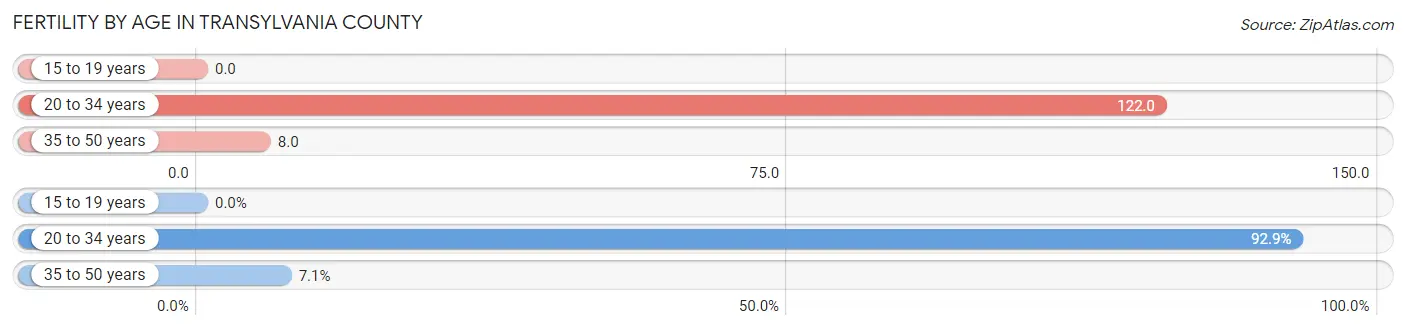
Fertility by Age in Transylvania County
Average fertility rate in Transylvania County is 53.0 births per 1,000 women. Women in the age bracket of 20 to 34 years have the highest fertility rate with 122.0 births per 1,000 women. Women in the age bracket of 20 to 34 years acount for 92.9% of all women with births.
| Age Bracket | Women with Births | Births / 1,000 Women |
| 15 to 19 years | 0 (0.0%) | 0.0 |
| 20 to 34 years | 288 (92.9%) | 122.0 |
| 35 to 50 years | 22 (7.1%) | 8.0 |
| Total | 310 (100.0%) | 53.0 |
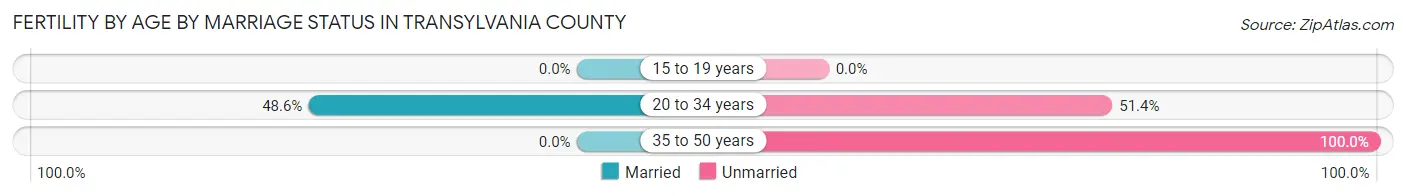
Fertility by Age by Marriage Status in Transylvania County
45.2% of women with births (310) in Transylvania County are married. The highest percentage of unmarried women with births falls into 35 to 50 years age bracket with 100.0% of them unmarried at the time of birth, while the lowest percentage of unmarried women with births belong to 20 to 34 years age bracket with 51.4% of them unmarried.
| Age Bracket | Married | Unmarried |
| 15 to 19 years | 0 (0.0%) | 0 (0.0%) |
| 20 to 34 years | 140 (48.6%) | 148 (51.4%) |
| 35 to 50 years | 0 (0.0%) | 22 (100.0%) |
| Total | 140 (45.2%) | 170 (54.8%) |
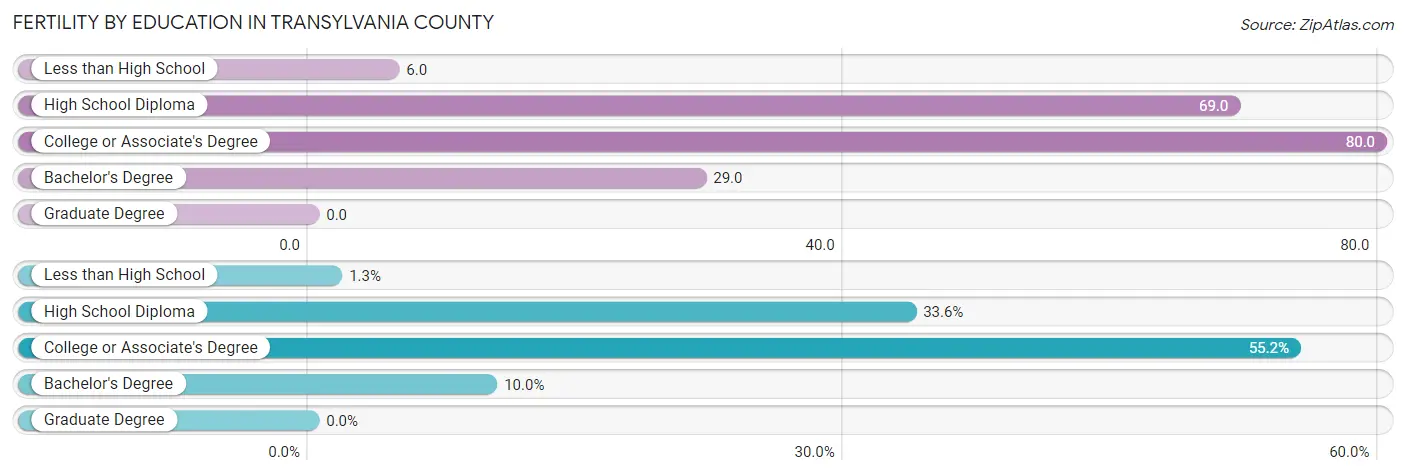
Fertility by Education in Transylvania County
| Educational Attainment | Women with Births | Births / 1,000 Women |
| Less than High School | 4 (1.3%) | 6.0 |
| High School Diploma | 104 (33.6%) | 69.0 |
| College or Associate's Degree | 171 (55.2%) | 80.0 |
| Bachelor's Degree | 31 (10.0%) | 29.0 |
| Graduate Degree | 0 (0.0%) | 0.0 |
| Total | 310 (100.0%) | 53.0 |
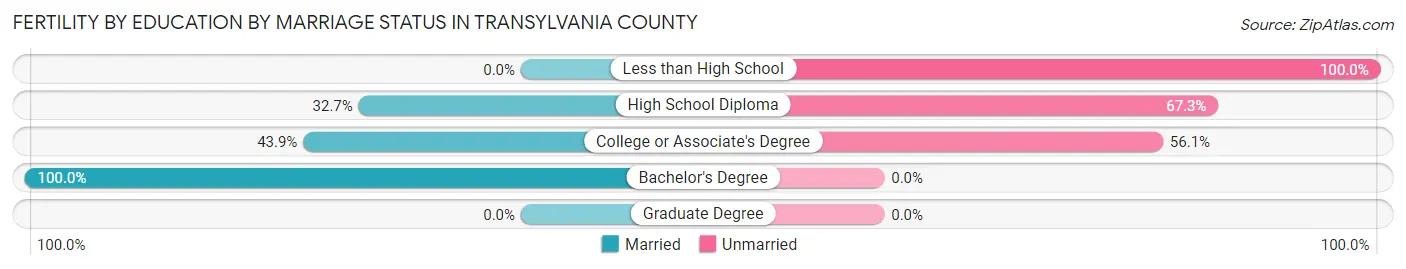
Fertility by Education by Marriage Status in Transylvania County
54.8% of women with births in Transylvania County are unmarried. Women with the educational attainment of bachelor's degree are most likely to be married with 100.0% of them married at childbirth, while women with the educational attainment of less than high school are least likely to be married with 100.0% of them unmarried at childbirth.
| Educational Attainment | Married | Unmarried |
| Less than High School | 0 (0.0%) | 4 (100.0%) |
| High School Diploma | 34 (32.7%) | 70 (67.3%) |
| College or Associate's Degree | 75 (43.9%) | 96 (56.1%) |
| Bachelor's Degree | 31 (100.0%) | 0 (0.0%) |
| Graduate Degree | 0 (0.0%) | 0 (0.0%) |
| Total | 140 (45.2%) | 170 (54.8%) |
Employment Characteristics in Transylvania County
Employment by Class of Employer in Transylvania County
Among the 13,645 employed individuals in Transylvania County, private company employees (8,445 | 61.9%), self-employed (not incorporated) (1,435 | 10.5%), and not-for-profit organizations (1,366 | 10.0%) make up the most common classes of employment.
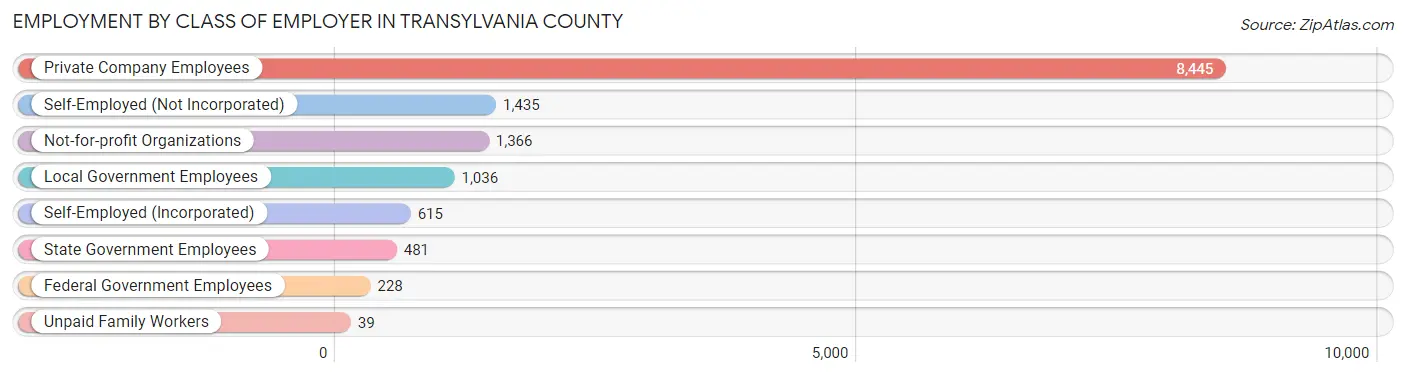
| Employer Class | # Employees | % Employees |
| Private Company Employees | 8,445 | 61.9% |
| Self-Employed (Incorporated) | 615 | 4.5% |
| Self-Employed (Not Incorporated) | 1,435 | 10.5% |
| Not-for-profit Organizations | 1,366 | 10.0% |
| Local Government Employees | 1,036 | 7.6% |
| State Government Employees | 481 | 3.5% |
| Federal Government Employees | 228 | 1.7% |
| Unpaid Family Workers | 39 | 0.3% |
| Total | 13,645 | 100.0% |
Employment Status by Age in Transylvania County
According to the labor force statistics for Transylvania County, out of the total population over 16 years of age (28,521), 51.8% or 14,774 individuals are in the labor force, with 4.0% or 591 of them unemployed. The age group with the highest labor force participation rate is 25 to 29 years, with 87.2% or 1,332 individuals in the labor force. Within the labor force, the 16 to 19 years age range has the highest percentage of unemployed individuals, with 13.6% or 61 of them being unemployed.
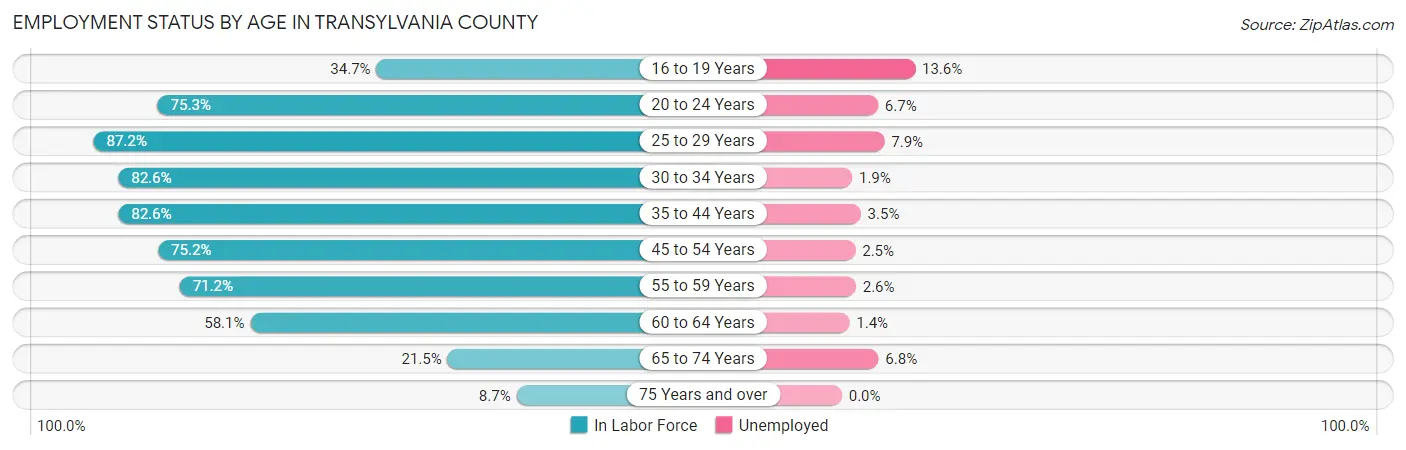
| Age Bracket | In Labor Force | Unemployed |
| 16 to 19 Years | 449 (34.7%) | 61 (13.6%) |
| 20 to 24 Years | 1,279 (75.3%) | 86 (6.7%) |
| 25 to 29 Years | 1,332 (87.2%) | 105 (7.9%) |
| 30 to 34 Years | 1,419 (82.6%) | 27 (1.9%) |
| 35 to 44 Years | 2,734 (82.6%) | 96 (3.5%) |
| 45 to 54 Years | 2,637 (75.2%) | 66 (2.5%) |
| 55 to 59 Years | 1,669 (71.2%) | 43 (2.6%) |
| 60 to 64 Years | 1,656 (58.1%) | 23 (1.4%) |
| 65 to 74 Years | 1,204 (21.5%) | 82 (6.8%) |
| 75 Years and over | 407 (8.7%) | 0 (0.0%) |
| Total | 14,774 (51.8%) | 591 (4.0%) |
Employment Status by Educational Attainment in Transylvania County
According to labor force statistics for Transylvania County, 75.1% of individuals (11,457) out of the total population between 25 and 64 years of age (15,256) are in the labor force, with 3.1% or 355 of them being unemployed. The group with the highest labor force participation rate are those with the educational attainment of bachelor's degree or higher, with 80.2% or 3,905 individuals in the labor force. Within the labor force, individuals with less than high school education have the highest percentage of unemployment, with 6.8% or 31 of them being unemployed.
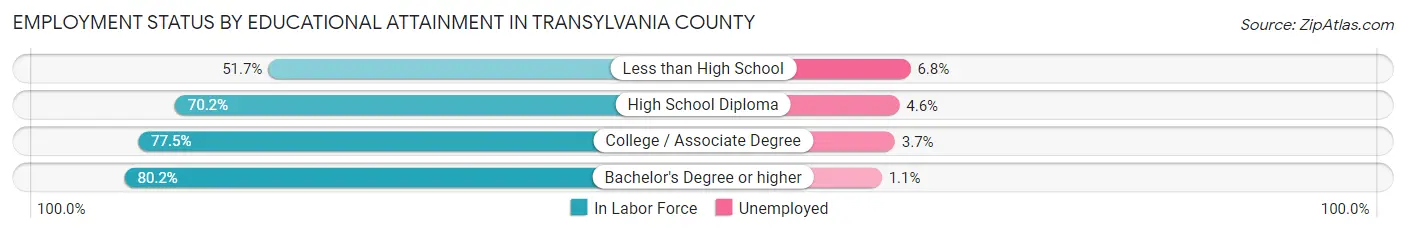
| Educational Attainment | In Labor Force | Unemployed |
| Less than High School | 453 (51.7%) | 60 (6.8%) |
| High School Diploma | 2,650 (70.2%) | 174 (4.6%) |
| College / Associate Degree | 4,445 (77.5%) | 212 (3.7%) |
| Bachelor's Degree or higher | 3,905 (80.2%) | 54 (1.1%) |
| Total | 11,457 (75.1%) | 473 (3.1%) |
Employment Occupations by Sex in Transylvania County
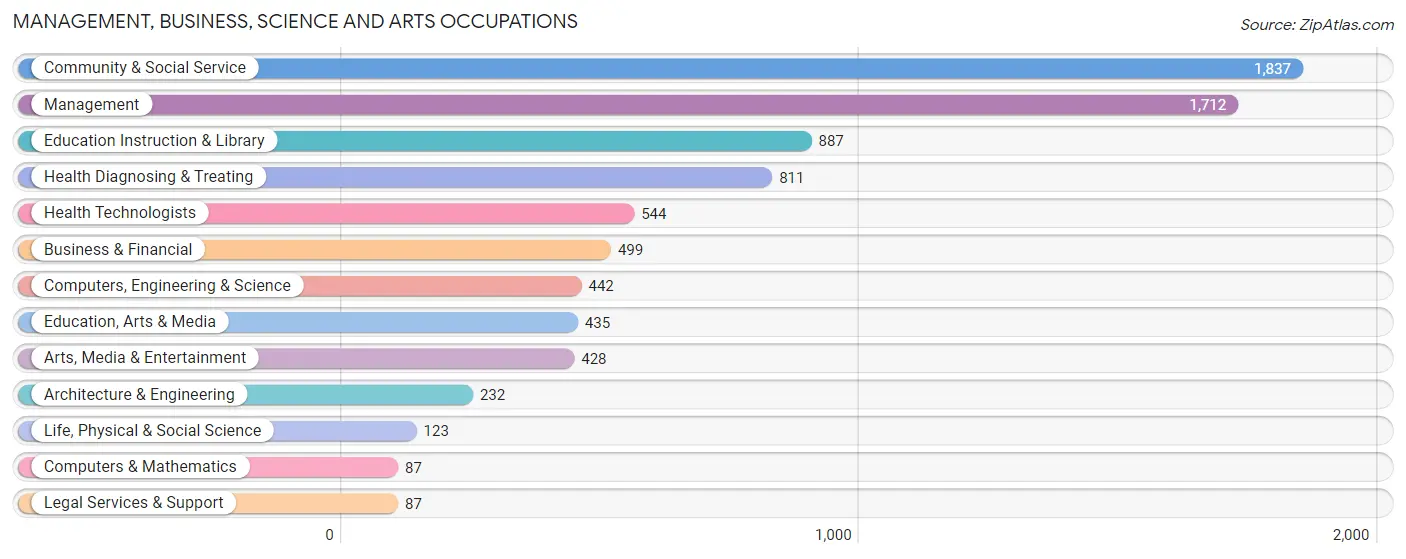
Management, Business, Science and Arts Occupations
The most common Management, Business, Science and Arts occupations in Transylvania County are Community & Social Service (1,837 | 12.9%), Management (1,712 | 12.1%), Education Instruction & Library (887 | 6.2%), Health Diagnosing & Treating (811 | 5.7%), and Health Technologists (544 | 3.8%).
Management, Business, Science and Arts Occupations by Sex
Within the Management, Business, Science and Arts occupations in Transylvania County, the most male-oriented occupations are Architecture & Engineering (91.4%), Computers, Engineering & Science (68.1%), and Management (65.2%), while the most female-oriented occupations are Education Instruction & Library (79.6%), Legal Services & Support (75.9%), and Community & Social Service (70.6%).
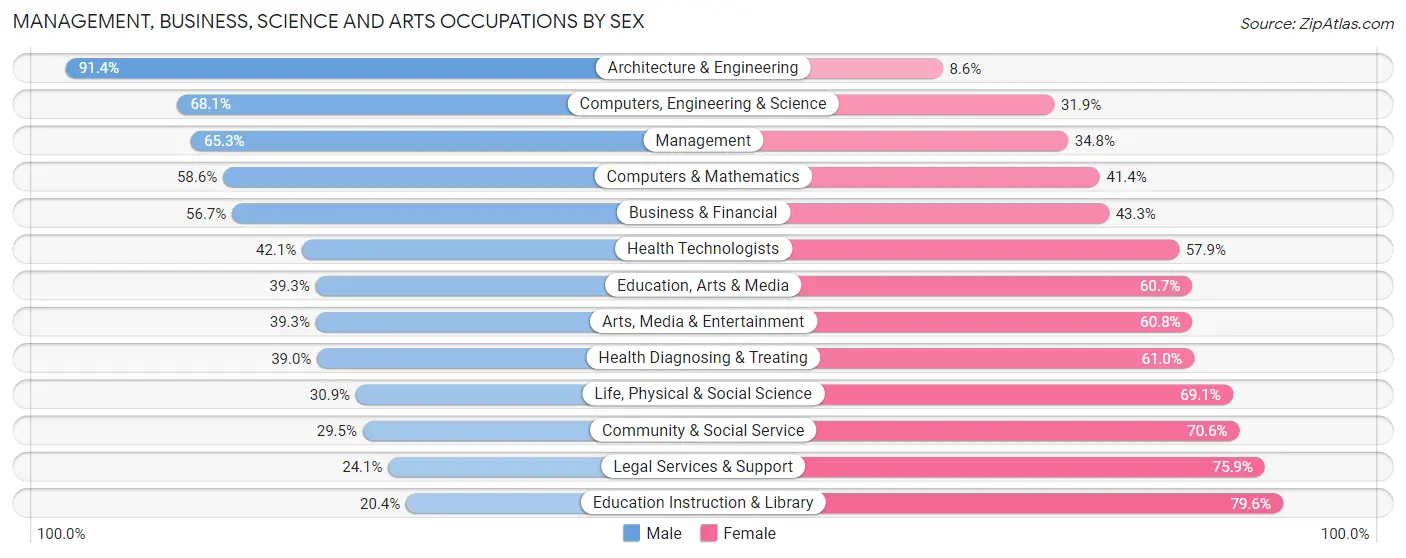
| Occupation | Male | Female |
| Management | 1,117 (65.2%) | 595 (34.7%) |
| Business & Financial | 283 (56.7%) | 216 (43.3%) |
| Computers, Engineering & Science | 301 (68.1%) | 141 (31.9%) |
| Computers & Mathematics | 51 (58.6%) | 36 (41.4%) |
| Architecture & Engineering | 212 (91.4%) | 20 (8.6%) |
| Life, Physical & Social Science | 38 (30.9%) | 85 (69.1%) |
| Community & Social Service | 541 (29.4%) | 1,296 (70.6%) |
| Education, Arts & Media | 171 (39.3%) | 264 (60.7%) |
| Legal Services & Support | 21 (24.1%) | 66 (75.9%) |
| Education Instruction & Library | 181 (20.4%) | 706 (79.6%) |
| Arts, Media & Entertainment | 168 (39.3%) | 260 (60.8%) |
| Health Diagnosing & Treating | 316 (39.0%) | 495 (61.0%) |
| Health Technologists | 229 (42.1%) | 315 (57.9%) |
| Total (Category) | 2,558 (48.3%) | 2,743 (51.7%) |
| Total (Overall) | 7,487 (52.7%) | 6,709 (47.3%) |
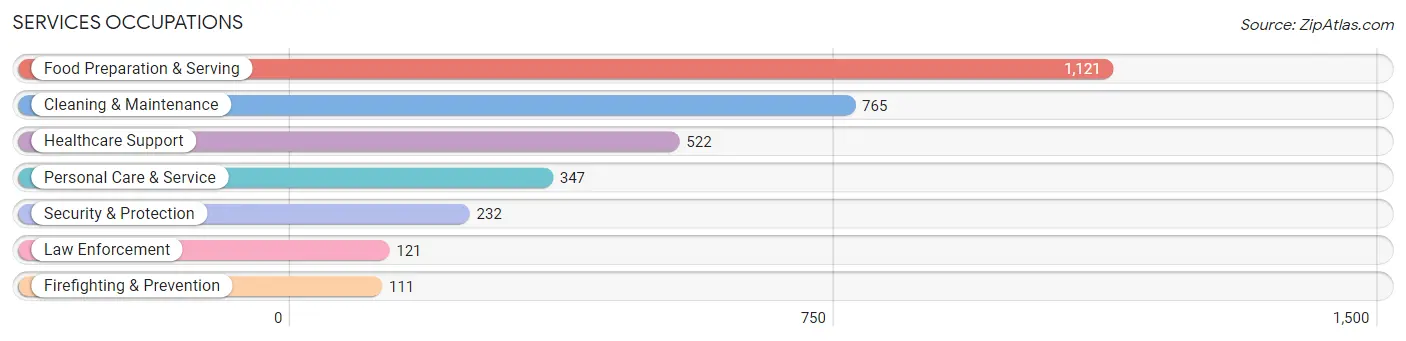
Services Occupations
The most common Services occupations in Transylvania County are Food Preparation & Serving (1,121 | 7.9%), Cleaning & Maintenance (765 | 5.4%), Healthcare Support (522 | 3.7%), Personal Care & Service (347 | 2.4%), and Security & Protection (232 | 1.6%).
Services Occupations by Sex
Within the Services occupations in Transylvania County, the most male-oriented occupations are Law Enforcement (72.7%), Cleaning & Maintenance (65.5%), and Security & Protection (63.4%), while the most female-oriented occupations are Personal Care & Service (80.7%), Healthcare Support (76.8%), and Food Preparation & Serving (58.3%).
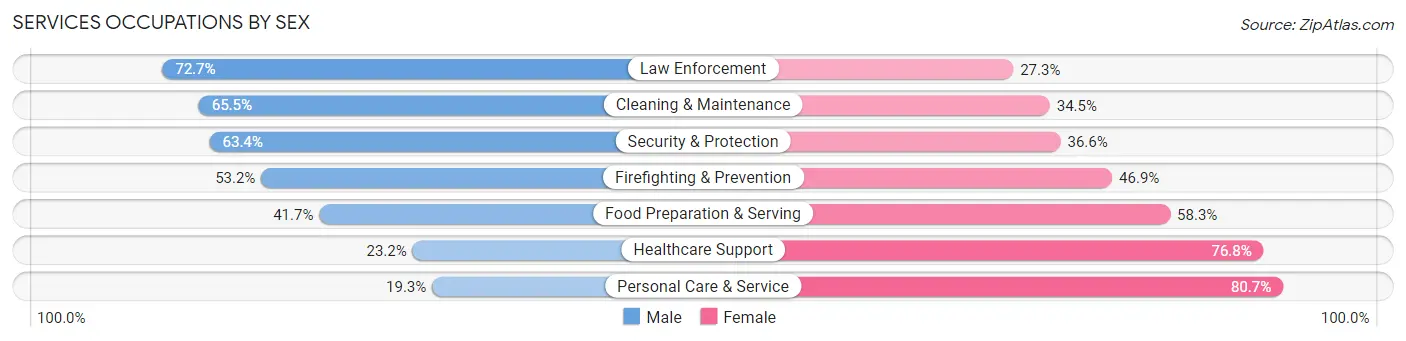
| Occupation | Male | Female |
| Healthcare Support | 121 (23.2%) | 401 (76.8%) |
| Security & Protection | 147 (63.4%) | 85 (36.6%) |
| Firefighting & Prevention | 59 (53.1%) | 52 (46.9%) |
| Law Enforcement | 88 (72.7%) | 33 (27.3%) |
| Food Preparation & Serving | 467 (41.7%) | 654 (58.3%) |
| Cleaning & Maintenance | 501 (65.5%) | 264 (34.5%) |
| Personal Care & Service | 67 (19.3%) | 280 (80.7%) |
| Total (Category) | 1,303 (43.6%) | 1,684 (56.4%) |
| Total (Overall) | 7,487 (52.7%) | 6,709 (47.3%) |
Sales and Office Occupations
The most common Sales and Office occupations in Transylvania County are Office & Administration (1,700 | 12.0%), and Sales & Related (1,331 | 9.4%).

Sales and Office Occupations by Sex
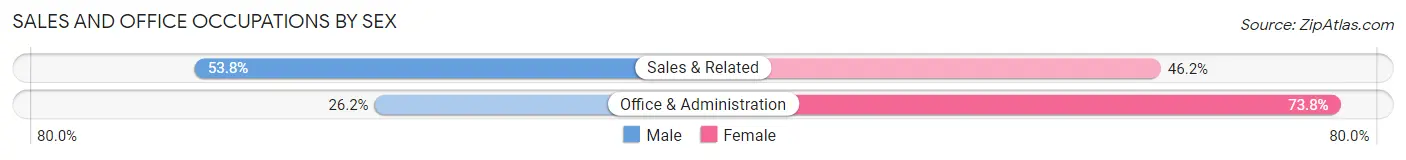
| Occupation | Male | Female |
| Sales & Related | 716 (53.8%) | 615 (46.2%) |
| Office & Administration | 445 (26.2%) | 1,255 (73.8%) |
| Total (Category) | 1,161 (38.3%) | 1,870 (61.7%) |
| Total (Overall) | 7,487 (52.7%) | 6,709 (47.3%) |
Natural Resources, Construction and Maintenance Occupations
The most common Natural Resources, Construction and Maintenance occupations in Transylvania County are Construction & Extraction (869 | 6.1%), Installation, Maintenance & Repair (496 | 3.5%), and Farming, Fishing & Forestry (153 | 1.1%).

Natural Resources, Construction and Maintenance Occupations by Sex

| Occupation | Male | Female |
| Farming, Fishing & Forestry | 120 (78.4%) | 33 (21.6%) |
| Construction & Extraction | 869 (100.0%) | 0 (0.0%) |
| Installation, Maintenance & Repair | 434 (87.5%) | 62 (12.5%) |
| Total (Category) | 1,423 (93.7%) | 95 (6.3%) |
| Total (Overall) | 7,487 (52.7%) | 6,709 (47.3%) |
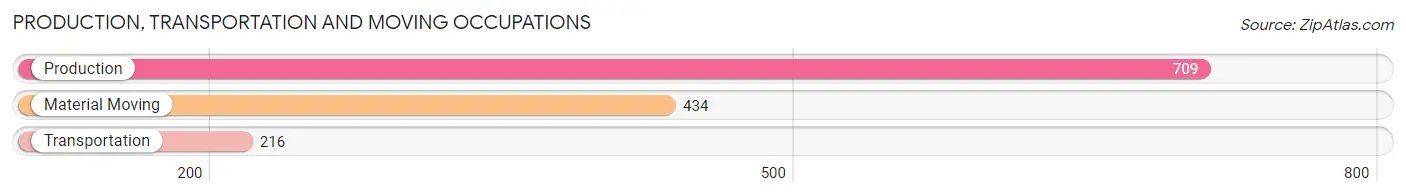
Production, Transportation and Moving Occupations
The most common Production, Transportation and Moving occupations in Transylvania County are Production (709 | 5.0%), Material Moving (434 | 3.1%), and Transportation (216 | 1.5%).
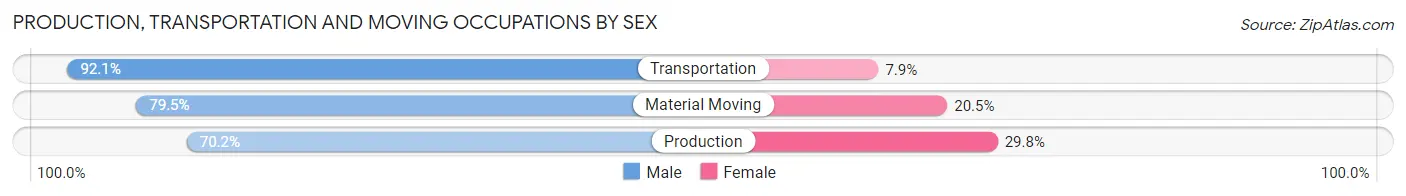
Production, Transportation and Moving Occupations by Sex
| Occupation | Male | Female |
| Production | 498 (70.2%) | 211 (29.8%) |
| Transportation | 199 (92.1%) | 17 (7.9%) |
| Material Moving | 345 (79.5%) | 89 (20.5%) |
| Total (Category) | 1,042 (76.7%) | 317 (23.3%) |
| Total (Overall) | 7,487 (52.7%) | 6,709 (47.3%) |
Employment Industries by Sex in Transylvania County
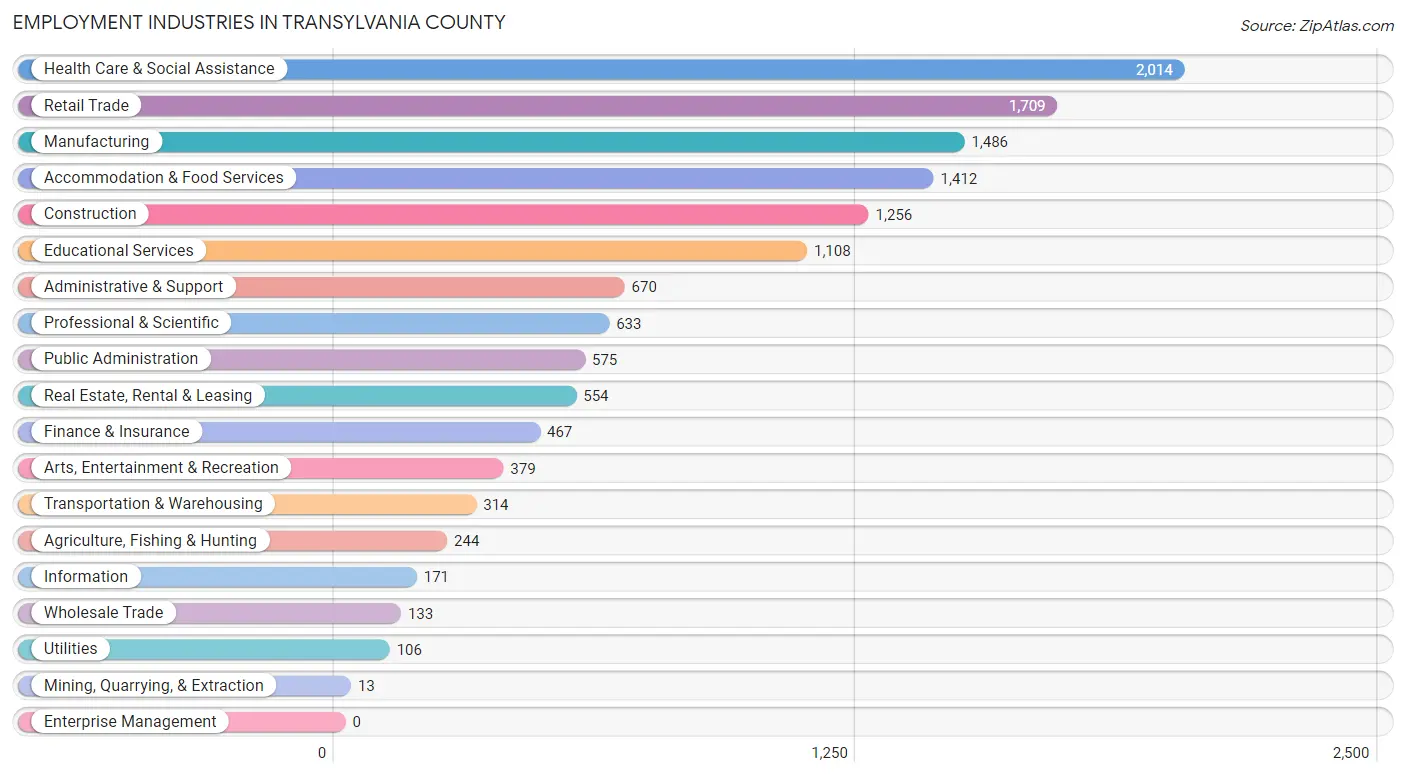
Employment Industries in Transylvania County
The major employment industries in Transylvania County include Health Care & Social Assistance (2,014 | 14.2%), Retail Trade (1,709 | 12.0%), Manufacturing (1,486 | 10.5%), Accommodation & Food Services (1,412 | 10.0%), and Construction (1,256 | 8.8%).
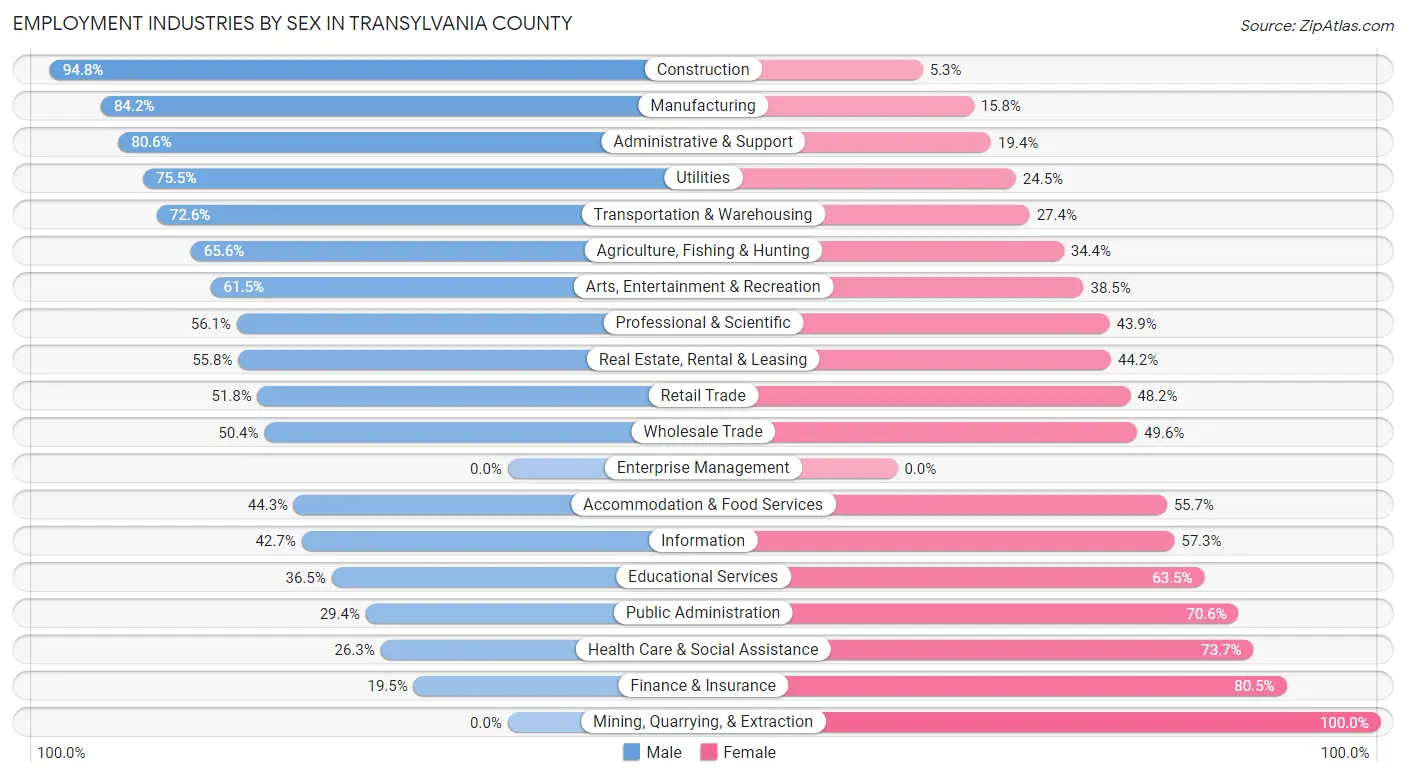
Employment Industries by Sex in Transylvania County
The Transylvania County industries that see more men than women are Construction (94.8%), Manufacturing (84.2%), and Administrative & Support (80.6%), whereas the industries that tend to have a higher number of women are Mining, Quarrying, & Extraction (100.0%), Finance & Insurance (80.5%), and Health Care & Social Assistance (73.7%).
| Industry | Male | Female |
| Agriculture, Fishing & Hunting | 160 (65.6%) | 84 (34.4%) |
| Mining, Quarrying, & Extraction | 0 (0.0%) | 13 (100.0%) |
| Construction | 1,190 (94.8%) | 66 (5.2%) |
| Manufacturing | 1,251 (84.2%) | 235 (15.8%) |
| Wholesale Trade | 67 (50.4%) | 66 (49.6%) |
| Retail Trade | 885 (51.8%) | 824 (48.2%) |
| Transportation & Warehousing | 228 (72.6%) | 86 (27.4%) |
| Utilities | 80 (75.5%) | 26 (24.5%) |
| Information | 73 (42.7%) | 98 (57.3%) |
| Finance & Insurance | 91 (19.5%) | 376 (80.5%) |
| Real Estate, Rental & Leasing | 309 (55.8%) | 245 (44.2%) |
| Professional & Scientific | 355 (56.1%) | 278 (43.9%) |
| Enterprise Management | 0 (0.0%) | 0 (0.0%) |
| Administrative & Support | 540 (80.6%) | 130 (19.4%) |
| Educational Services | 404 (36.5%) | 704 (63.5%) |
| Health Care & Social Assistance | 530 (26.3%) | 1,484 (73.7%) |
| Arts, Entertainment & Recreation | 233 (61.5%) | 146 (38.5%) |
| Accommodation & Food Services | 625 (44.3%) | 787 (55.7%) |
| Public Administration | 169 (29.4%) | 406 (70.6%) |
| Total | 7,487 (52.7%) | 6,709 (47.3%) |
Education in Transylvania County
School Enrollment in Transylvania County
The most common levels of schooling among the 5,724 students in Transylvania County are college / undergraduate (1,388 | 24.2%), elementary school (1,189 | 20.8%), and high school (1,148 | 20.1%).
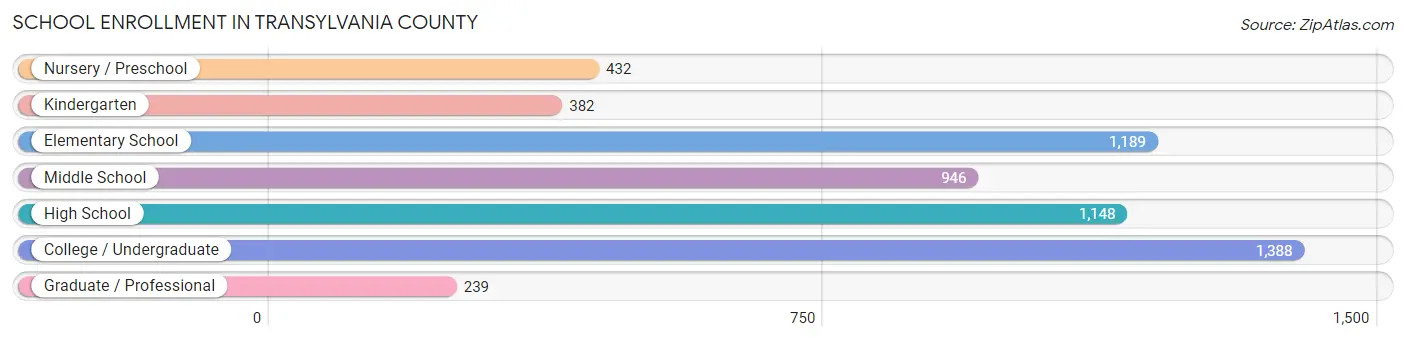
| School Level | # Students | % Students |
| Nursery / Preschool | 432 | 7.5% |
| Kindergarten | 382 | 6.7% |
| Elementary School | 1,189 | 20.8% |
| Middle School | 946 | 16.5% |
| High School | 1,148 | 20.1% |
| College / Undergraduate | 1,388 | 24.2% |
| Graduate / Professional | 239 | 4.2% |
| Total | 5,724 | 100.0% |
School Enrollment by Age by Funding Source in Transylvania County
Out of a total of 5,724 students who are enrolled in schools in Transylvania County, 1,317 (23.0%) attend a private institution, while the remaining 4,407 (77.0%) are enrolled in public schools. The age group of 3 to 4 year olds has the highest likelihood of being enrolled in private schools, with 202 (52.6% in the age bracket) enrolled. Conversely, the age group of 15 to 17 year olds has the lowest likelihood of being enrolled in a private school, with 847 (96.4% in the age bracket) attending a public institution.
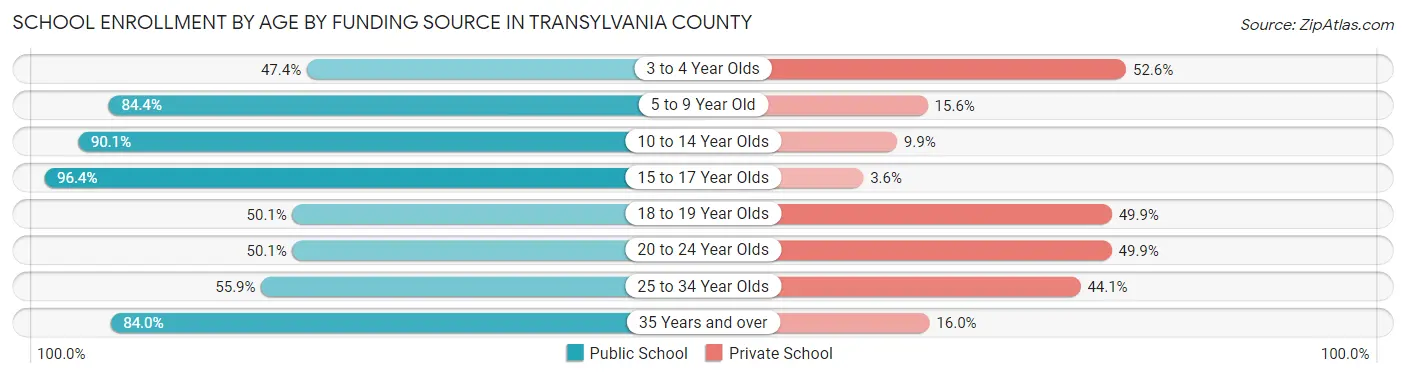
| Age Bracket | Public School | Private School |
| 3 to 4 Year Olds | 182 (47.4%) | 202 (52.6%) |
| 5 to 9 Year Old | 1,208 (84.4%) | 224 (15.6%) |
| 10 to 14 Year Olds | 1,117 (90.1%) | 123 (9.9%) |
| 15 to 17 Year Olds | 847 (96.4%) | 32 (3.6%) |
| 18 to 19 Year Olds | 310 (50.1%) | 309 (49.9%) |
| 20 to 24 Year Olds | 272 (50.1%) | 271 (49.9%) |
| 25 to 34 Year Olds | 109 (55.9%) | 86 (44.1%) |
| 35 Years and over | 363 (84.0%) | 69 (16.0%) |
| Total | 4,407 (77.0%) | 1,317 (23.0%) |
Educational Attainment by Field of Study in Transylvania County
Business (1,694 | 16.8%), education (1,449 | 14.3%), science & technology (930 | 9.2%), visual & performing arts (797 | 7.9%), and arts & humanities (764 | 7.6%) are the most common fields of study among 10,101 individuals in Transylvania County who have obtained a bachelor's degree or higher.
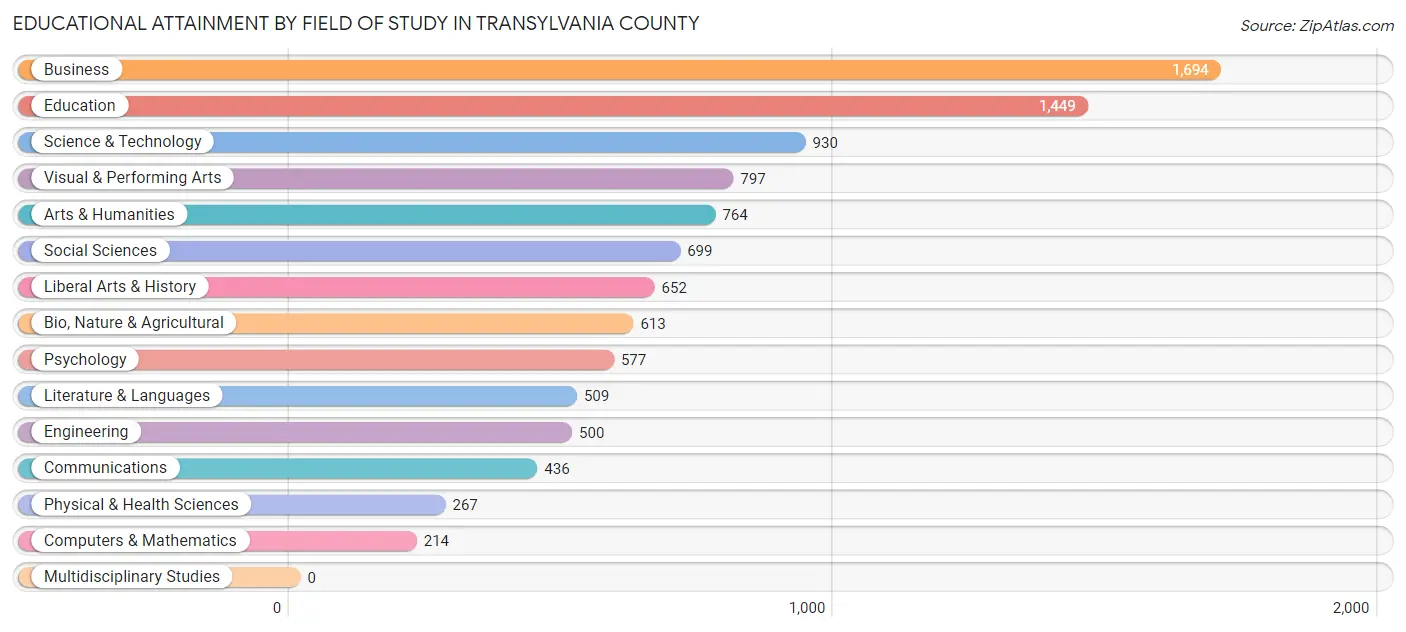
| Field of Study | # Graduates | % Graduates |
| Computers & Mathematics | 214 | 2.1% |
| Bio, Nature & Agricultural | 613 | 6.1% |
| Physical & Health Sciences | 267 | 2.6% |
| Psychology | 577 | 5.7% |
| Social Sciences | 699 | 6.9% |
| Engineering | 500 | 5.0% |
| Multidisciplinary Studies | 0 | 0.0% |
| Science & Technology | 930 | 9.2% |
| Business | 1,694 | 16.8% |
| Education | 1,449 | 14.3% |
| Literature & Languages | 509 | 5.0% |
| Liberal Arts & History | 652 | 6.5% |
| Visual & Performing Arts | 797 | 7.9% |
| Communications | 436 | 4.3% |
| Arts & Humanities | 764 | 7.6% |
| Total | 10,101 | 100.0% |
Transportation & Commute in Transylvania County
Vehicle Availability by Sex in Transylvania County
The most prevalent vehicle ownership categories in Transylvania County are males with 2 vehicles (3,042, accounting for 43.6%) and females with 2 vehicles (2,848, making up 47.8%).
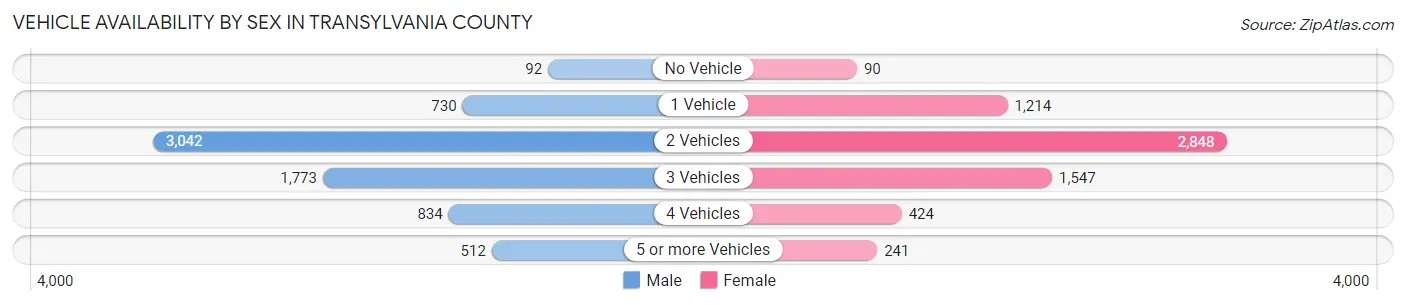
| Vehicles Available | Male | Female |
| No Vehicle | 92 (1.3%) | 90 (1.4%) |
| 1 Vehicle | 730 (10.4%) | 1,214 (19.1%) |
| 2 Vehicles | 3,042 (43.6%) | 2,848 (44.8%) |
| 3 Vehicles | 1,773 (25.4%) | 1,547 (24.3%) |
| 4 Vehicles | 834 (11.9%) | 424 (6.7%) |
| 5 or more Vehicles | 512 (7.3%) | 241 (3.8%) |
| Total | 6,983 (100.0%) | 6,364 (100.0%) |
Commute Time in Transylvania County
The most frequently occuring commute durations in Transylvania County are 10 to 14 minutes (2,266 commuters, 18.5%), 15 to 19 minutes (1,994 commuters, 16.3%), and 30 to 34 minutes (1,724 commuters, 14.1%).
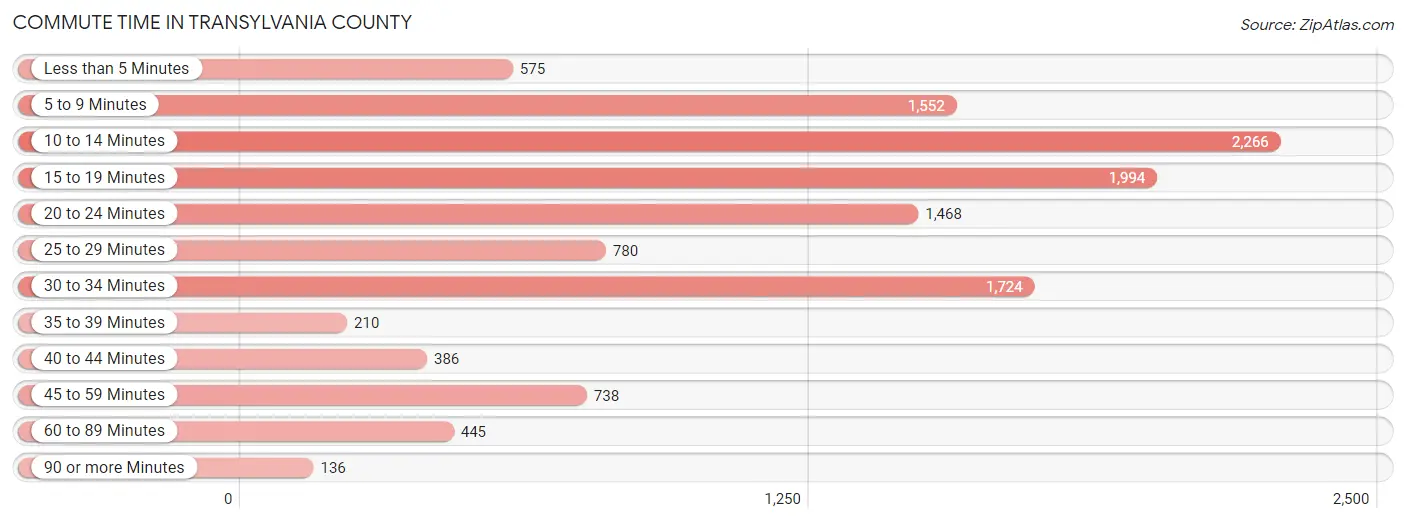
| Commute Time | # Commuters | % Commuters |
| Less than 5 Minutes | 575 | 4.7% |
| 5 to 9 Minutes | 1,552 | 12.6% |
| 10 to 14 Minutes | 2,266 | 18.5% |
| 15 to 19 Minutes | 1,994 | 16.3% |
| 20 to 24 Minutes | 1,468 | 12.0% |
| 25 to 29 Minutes | 780 | 6.4% |
| 30 to 34 Minutes | 1,724 | 14.1% |
| 35 to 39 Minutes | 210 | 1.7% |
| 40 to 44 Minutes | 386 | 3.1% |
| 45 to 59 Minutes | 738 | 6.0% |
| 60 to 89 Minutes | 445 | 3.6% |
| 90 or more Minutes | 136 | 1.1% |
Commute Time by Sex in Transylvania County
The most common commute times in Transylvania County are 10 to 14 minutes (1,190 commuters, 18.3%) for males and 10 to 14 minutes (1,076 commuters, 18.6%) for females.
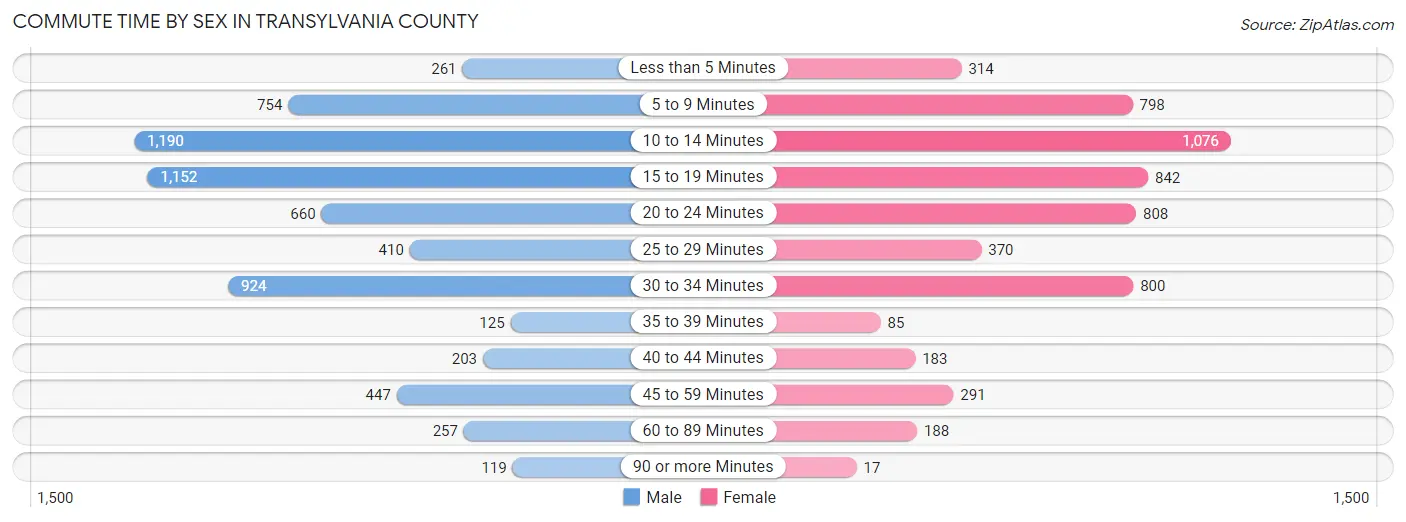
| Commute Time | Male | Female |
| Less than 5 Minutes | 261 (4.0%) | 314 (5.4%) |
| 5 to 9 Minutes | 754 (11.6%) | 798 (13.8%) |
| 10 to 14 Minutes | 1,190 (18.3%) | 1,076 (18.6%) |
| 15 to 19 Minutes | 1,152 (17.7%) | 842 (14.6%) |
| 20 to 24 Minutes | 660 (10.2%) | 808 (14.0%) |
| 25 to 29 Minutes | 410 (6.3%) | 370 (6.4%) |
| 30 to 34 Minutes | 924 (14.2%) | 800 (13.9%) |
| 35 to 39 Minutes | 125 (1.9%) | 85 (1.5%) |
| 40 to 44 Minutes | 203 (3.1%) | 183 (3.2%) |
| 45 to 59 Minutes | 447 (6.9%) | 291 (5.0%) |
| 60 to 89 Minutes | 257 (4.0%) | 188 (3.3%) |
| 90 or more Minutes | 119 (1.8%) | 17 (0.3%) |
Time of Departure to Work by Sex in Transylvania County
The most frequent times of departure to work in Transylvania County are 7:00 AM to 7:29 AM (1,261, 19.4%) for males and 7:30 AM to 7:59 AM (1,121, 19.4%) for females.
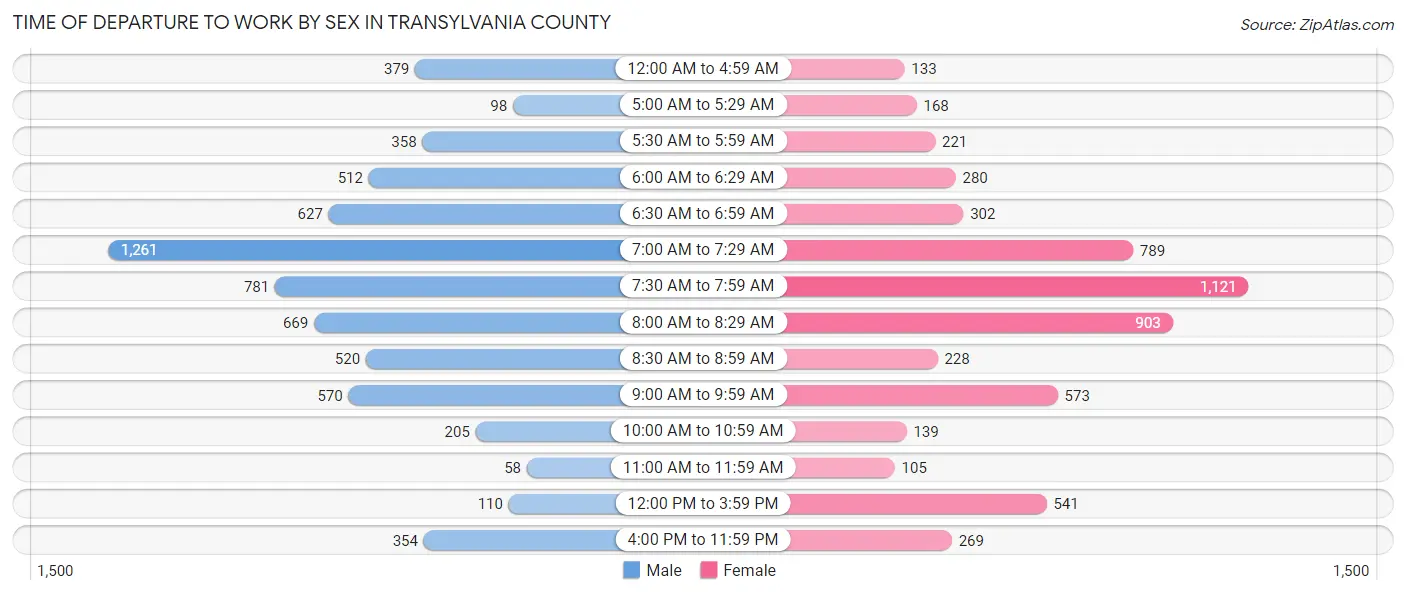
| Time of Departure | Male | Female |
| 12:00 AM to 4:59 AM | 379 (5.8%) | 133 (2.3%) |
| 5:00 AM to 5:29 AM | 98 (1.5%) | 168 (2.9%) |
| 5:30 AM to 5:59 AM | 358 (5.5%) | 221 (3.8%) |
| 6:00 AM to 6:29 AM | 512 (7.9%) | 280 (4.9%) |
| 6:30 AM to 6:59 AM | 627 (9.6%) | 302 (5.2%) |
| 7:00 AM to 7:29 AM | 1,261 (19.4%) | 789 (13.7%) |
| 7:30 AM to 7:59 AM | 781 (12.0%) | 1,121 (19.4%) |
| 8:00 AM to 8:29 AM | 669 (10.3%) | 903 (15.6%) |
| 8:30 AM to 8:59 AM | 520 (8.0%) | 228 (4.0%) |
| 9:00 AM to 9:59 AM | 570 (8.8%) | 573 (9.9%) |
| 10:00 AM to 10:59 AM | 205 (3.2%) | 139 (2.4%) |
| 11:00 AM to 11:59 AM | 58 (0.9%) | 105 (1.8%) |
| 12:00 PM to 3:59 PM | 110 (1.7%) | 541 (9.4%) |
| 4:00 PM to 11:59 PM | 354 (5.4%) | 269 (4.7%) |
| Total | 6,502 (100.0%) | 5,772 (100.0%) |
Housing Occupancy in Transylvania County
Occupancy by Ownership in Transylvania County
Of the total 14,353 dwellings in Transylvania County, owner-occupied units account for 10,927 (76.1%), while renter-occupied units make up 3,426 (23.9%).
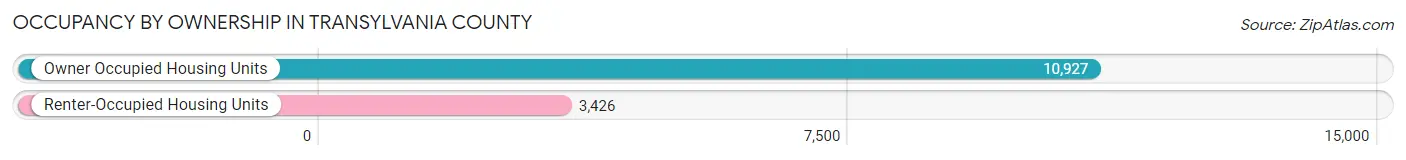
| Occupancy | # Housing Units | % Housing Units |
| Owner Occupied Housing Units | 10,927 | 76.1% |
| Renter-Occupied Housing Units | 3,426 | 23.9% |
| Total Occupied Housing Units | 14,353 | 100.0% |
Occupancy by Household Size in Transylvania County
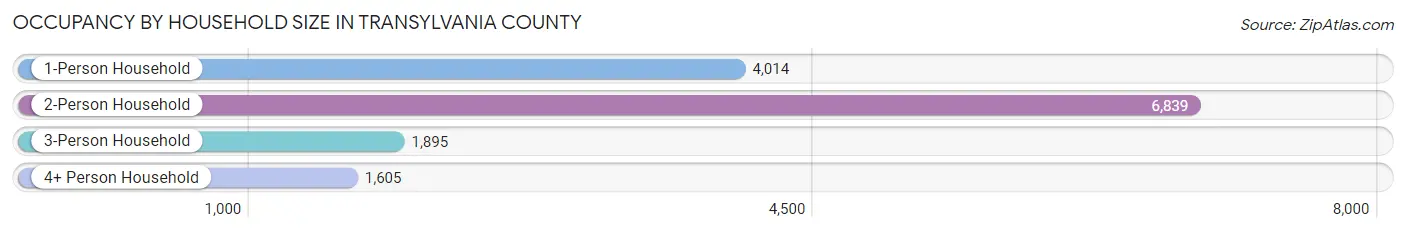
| Household Size | # Housing Units | % Housing Units |
| 1-Person Household | 4,014 | 28.0% |
| 2-Person Household | 6,839 | 47.6% |
| 3-Person Household | 1,895 | 13.2% |
| 4+ Person Household | 1,605 | 11.2% |
| Total Housing Units | 14,353 | 100.0% |
Occupancy by Ownership by Household Size in Transylvania County
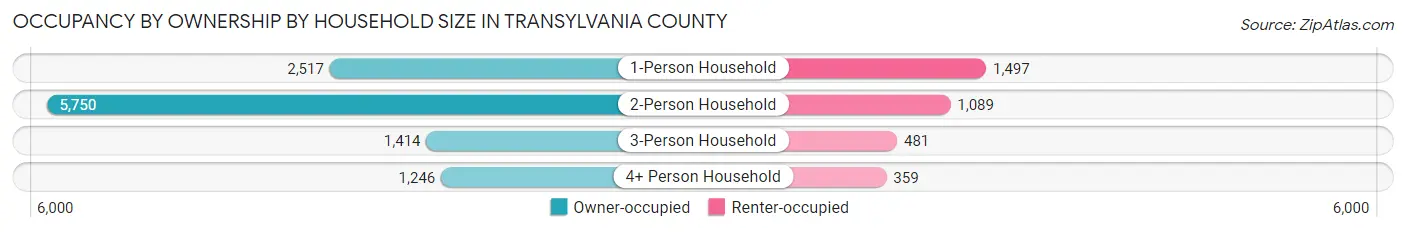
| Household Size | Owner-occupied | Renter-occupied |
| 1-Person Household | 2,517 (62.7%) | 1,497 (37.3%) |
| 2-Person Household | 5,750 (84.1%) | 1,089 (15.9%) |
| 3-Person Household | 1,414 (74.6%) | 481 (25.4%) |
| 4+ Person Household | 1,246 (77.6%) | 359 (22.4%) |
| Total Housing Units | 10,927 (76.1%) | 3,426 (23.9%) |
Occupancy by Educational Attainment in Transylvania County
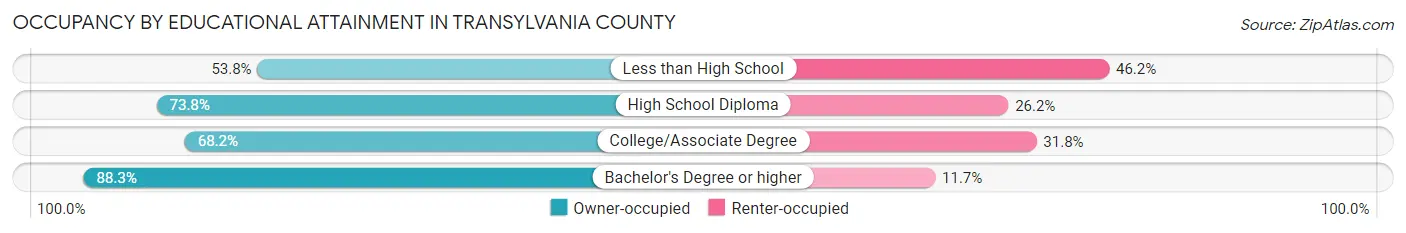
| Household Size | Owner-occupied | Renter-occupied |
| Less than High School | 436 (53.8%) | 374 (46.2%) |
| High School Diploma | 2,478 (73.8%) | 879 (26.2%) |
| College/Associate Degree | 3,340 (68.2%) | 1,555 (31.8%) |
| Bachelor's Degree or higher | 4,673 (88.3%) | 618 (11.7%) |
Occupancy by Age of Householder in Transylvania County
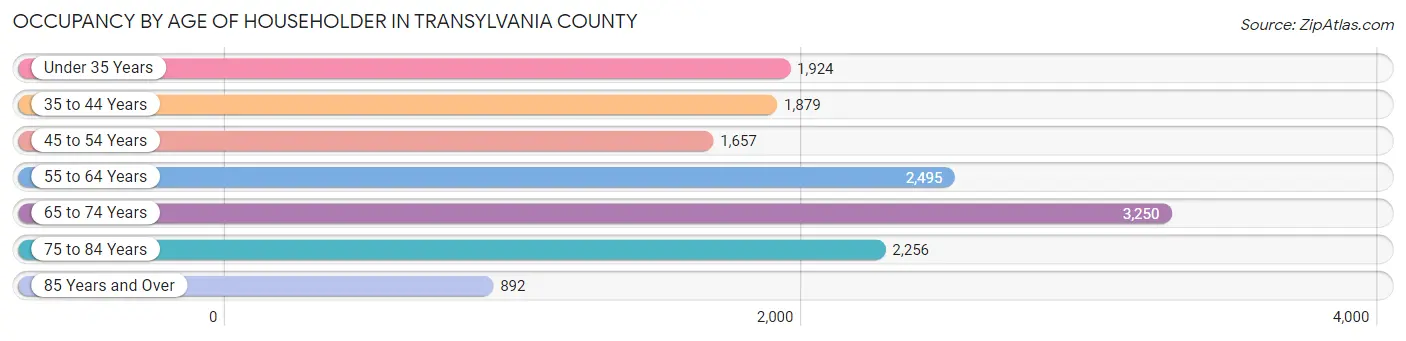
| Age Bracket | # Households | % Households |
| Under 35 Years | 1,924 | 13.4% |
| 35 to 44 Years | 1,879 | 13.1% |
| 45 to 54 Years | 1,657 | 11.5% |
| 55 to 64 Years | 2,495 | 17.4% |
| 65 to 74 Years | 3,250 | 22.6% |
| 75 to 84 Years | 2,256 | 15.7% |
| 85 Years and Over | 892 | 6.2% |
| Total | 14,353 | 100.0% |
Housing Finances in Transylvania County
Median Income by Occupancy in Transylvania County
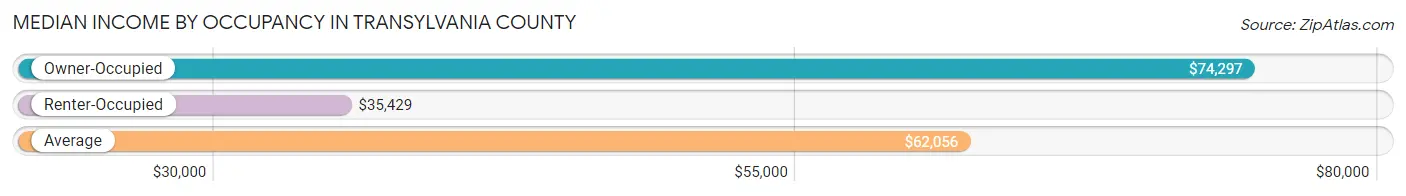
| Occupancy Type | # Households | Median Income |
| Owner-Occupied | 10,927 (76.1%) | $74,297 |
| Renter-Occupied | 3,426 (23.9%) | $35,429 |
| Average | 14,353 (100.0%) | $62,056 |
Occupancy by Householder Income Bracket in Transylvania County
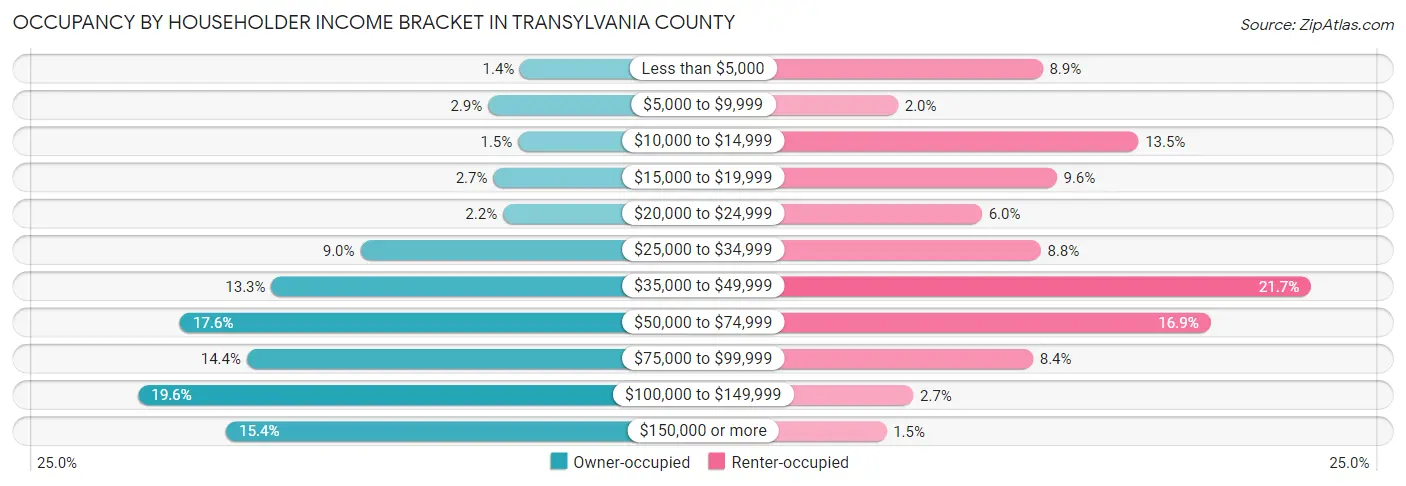
| Income Bracket | Owner-occupied | Renter-occupied |
| Less than $5,000 | 153 (1.4%) | 305 (8.9%) |
| $5,000 to $9,999 | 320 (2.9%) | 69 (2.0%) |
| $10,000 to $14,999 | 164 (1.5%) | 461 (13.5%) |
| $15,000 to $19,999 | 293 (2.7%) | 328 (9.6%) |
| $20,000 to $24,999 | 243 (2.2%) | 206 (6.0%) |
| $25,000 to $34,999 | 985 (9.0%) | 302 (8.8%) |
| $35,000 to $49,999 | 1,448 (13.3%) | 743 (21.7%) |
| $50,000 to $74,999 | 1,923 (17.6%) | 579 (16.9%) |
| $75,000 to $99,999 | 1,576 (14.4%) | 289 (8.4%) |
| $100,000 to $149,999 | 2,139 (19.6%) | 94 (2.7%) |
| $150,000 or more | 1,683 (15.4%) | 50 (1.5%) |
| Total | 10,927 (100.0%) | 3,426 (100.0%) |
Monthly Housing Cost Tiers in Transylvania County
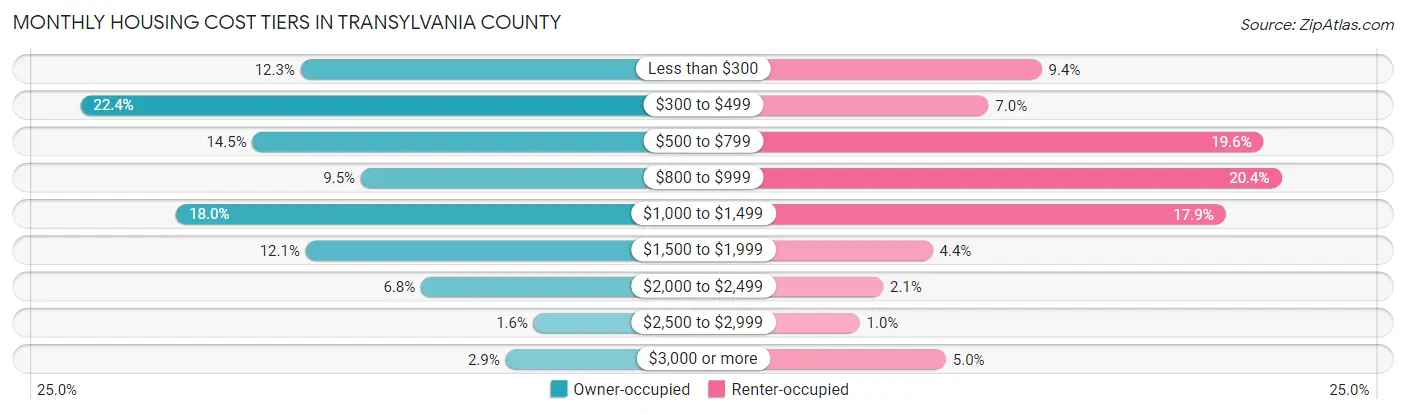
| Monthly Cost | Owner-occupied | Renter-occupied |
| Less than $300 | 1,343 (12.3%) | 322 (9.4%) |
| $300 to $499 | 2,451 (22.4%) | 238 (7.0%) |
| $500 to $799 | 1,585 (14.5%) | 672 (19.6%) |
| $800 to $999 | 1,040 (9.5%) | 700 (20.4%) |
| $1,000 to $1,499 | 1,969 (18.0%) | 612 (17.9%) |
| $1,500 to $1,999 | 1,318 (12.1%) | 150 (4.4%) |
| $2,000 to $2,499 | 738 (6.8%) | 72 (2.1%) |
| $2,500 to $2,999 | 171 (1.6%) | 35 (1.0%) |
| $3,000 or more | 312 (2.9%) | 171 (5.0%) |
| Total | 10,927 (100.0%) | 3,426 (100.0%) |
Physical Housing Characteristics in Transylvania County
Housing Structures in Transylvania County
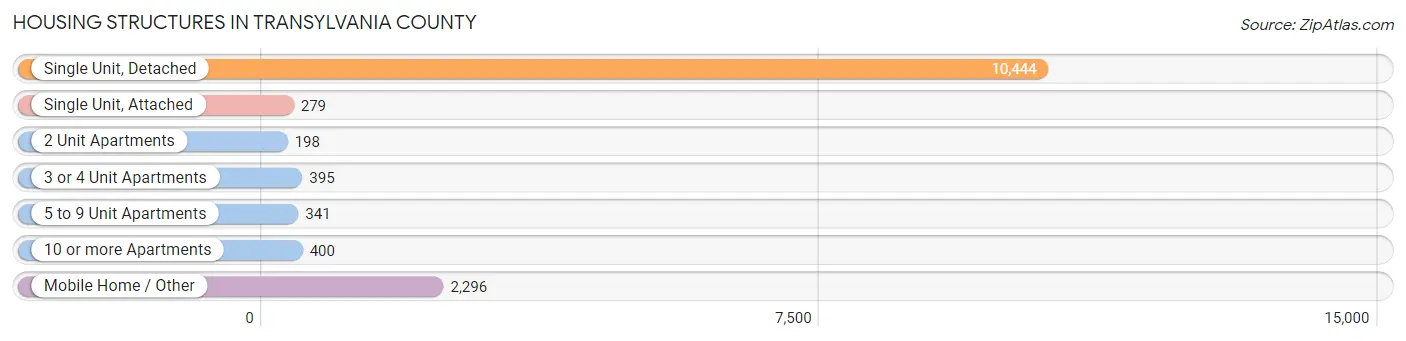
| Structure Type | # Housing Units | % Housing Units |
| Single Unit, Detached | 10,444 | 72.8% |
| Single Unit, Attached | 279 | 1.9% |
| 2 Unit Apartments | 198 | 1.4% |
| 3 or 4 Unit Apartments | 395 | 2.8% |
| 5 to 9 Unit Apartments | 341 | 2.4% |
| 10 or more Apartments | 400 | 2.8% |
| Mobile Home / Other | 2,296 | 16.0% |
| Total | 14,353 | 100.0% |
Housing Structures by Occupancy in Transylvania County
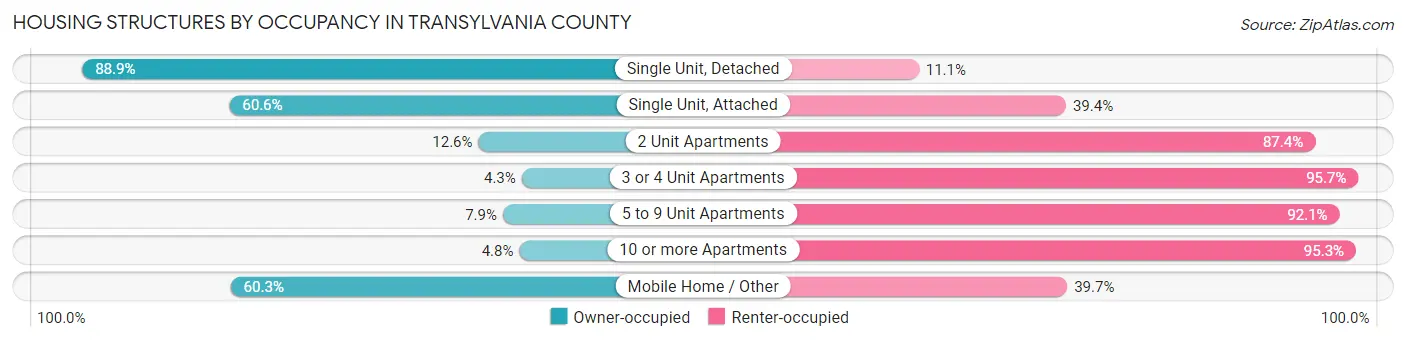
| Structure Type | Owner-occupied | Renter-occupied |
| Single Unit, Detached | 9,285 (88.9%) | 1,159 (11.1%) |
| Single Unit, Attached | 169 (60.6%) | 110 (39.4%) |
| 2 Unit Apartments | 25 (12.6%) | 173 (87.4%) |
| 3 or 4 Unit Apartments | 17 (4.3%) | 378 (95.7%) |
| 5 to 9 Unit Apartments | 27 (7.9%) | 314 (92.1%) |
| 10 or more Apartments | 19 (4.8%) | 381 (95.3%) |
| Mobile Home / Other | 1,385 (60.3%) | 911 (39.7%) |
| Total | 10,927 (76.1%) | 3,426 (23.9%) |
Housing Structures by Number of Rooms in Transylvania County
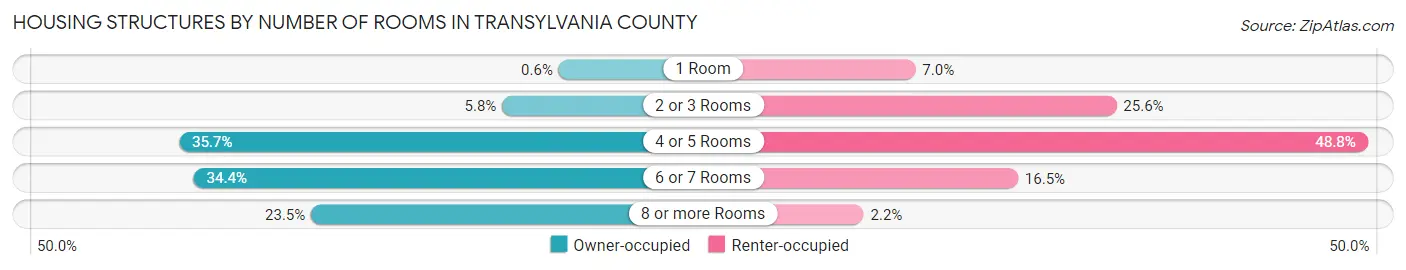
| Number of Rooms | Owner-occupied | Renter-occupied |
| 1 Room | 66 (0.6%) | 239 (7.0%) |
| 2 or 3 Rooms | 637 (5.8%) | 876 (25.6%) |
| 4 or 5 Rooms | 3,902 (35.7%) | 1,672 (48.8%) |
| 6 or 7 Rooms | 3,754 (34.4%) | 564 (16.5%) |
| 8 or more Rooms | 2,568 (23.5%) | 75 (2.2%) |
| Total | 10,927 (100.0%) | 3,426 (100.0%) |
Housing Structure by Heating Type in Transylvania County
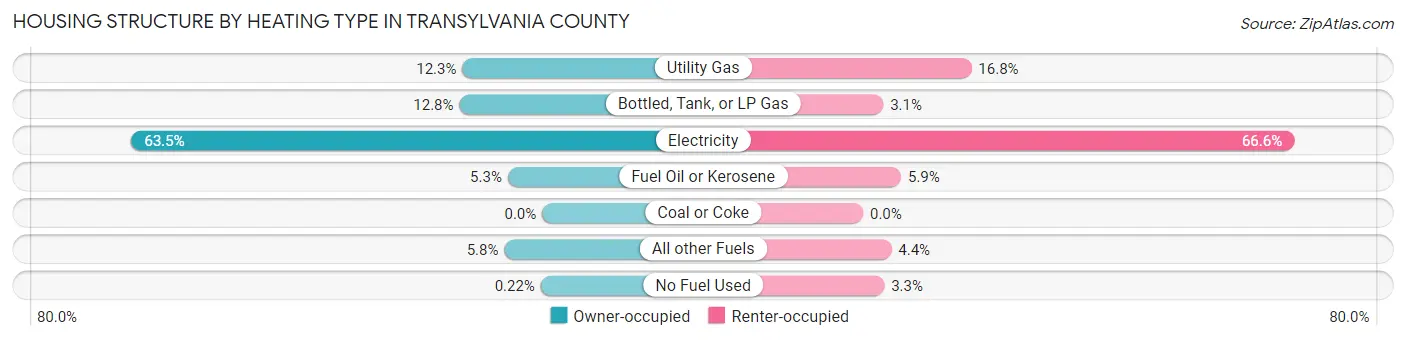
| Heating Type | Owner-occupied | Renter-occupied |
| Utility Gas | 1,348 (12.3%) | 574 (16.8%) |
| Bottled, Tank, or LP Gas | 1,398 (12.8%) | 107 (3.1%) |
| Electricity | 6,939 (63.5%) | 2,282 (66.6%) |
| Fuel Oil or Kerosene | 580 (5.3%) | 201 (5.9%) |
| Coal or Coke | 0 (0.0%) | 0 (0.0%) |
| All other Fuels | 638 (5.8%) | 150 (4.4%) |
| No Fuel Used | 24 (0.2%) | 112 (3.3%) |
| Total | 10,927 (100.0%) | 3,426 (100.0%) |
Household Vehicle Usage in Transylvania County
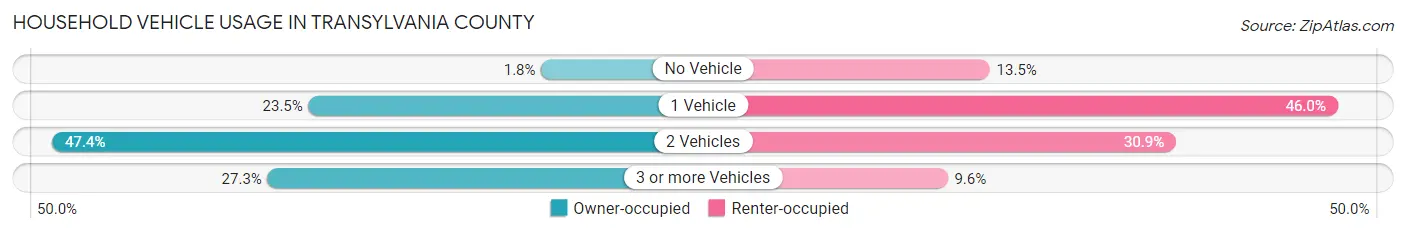
| Vehicles per Household | Owner-occupied | Renter-occupied |
| No Vehicle | 192 (1.8%) | 463 (13.5%) |
| 1 Vehicle | 2,567 (23.5%) | 1,576 (46.0%) |
| 2 Vehicles | 5,184 (47.4%) | 1,059 (30.9%) |
| 3 or more Vehicles | 2,984 (27.3%) | 328 (9.6%) |
| Total | 10,927 (100.0%) | 3,426 (100.0%) |
Real Estate & Mortgages in Transylvania County
Real Estate and Mortgage Overview in Transylvania County
| Characteristic | Without Mortgage | With Mortgage |
| Housing Units | 5,655 | 5,272 |
| Median Property Value | $300,800 | $297,400 |
| Median Household Income | $59,339 | $1,052 |
| Monthly Housing Costs | $422 | $306 |
| Real Estate Taxes | $1,373 | $99 |
Property Value by Mortgage Status in Transylvania County
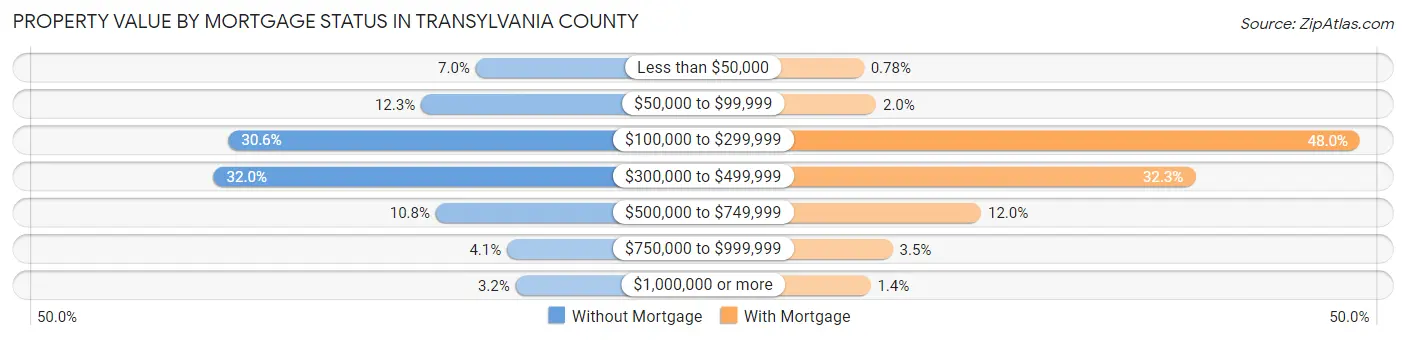
| Property Value | Without Mortgage | With Mortgage |
| Less than $50,000 | 398 (7.0%) | 41 (0.8%) |
| $50,000 to $99,999 | 693 (12.2%) | 103 (1.9%) |
| $100,000 to $299,999 | 1,730 (30.6%) | 2,532 (48.0%) |
| $300,000 to $499,999 | 1,809 (32.0%) | 1,705 (32.3%) |
| $500,000 to $749,999 | 613 (10.8%) | 630 (11.9%) |
| $750,000 to $999,999 | 229 (4.1%) | 186 (3.5%) |
| $1,000,000 or more | 183 (3.2%) | 75 (1.4%) |
| Total | 5,655 (100.0%) | 5,272 (100.0%) |
Household Income by Mortgage Status in Transylvania County
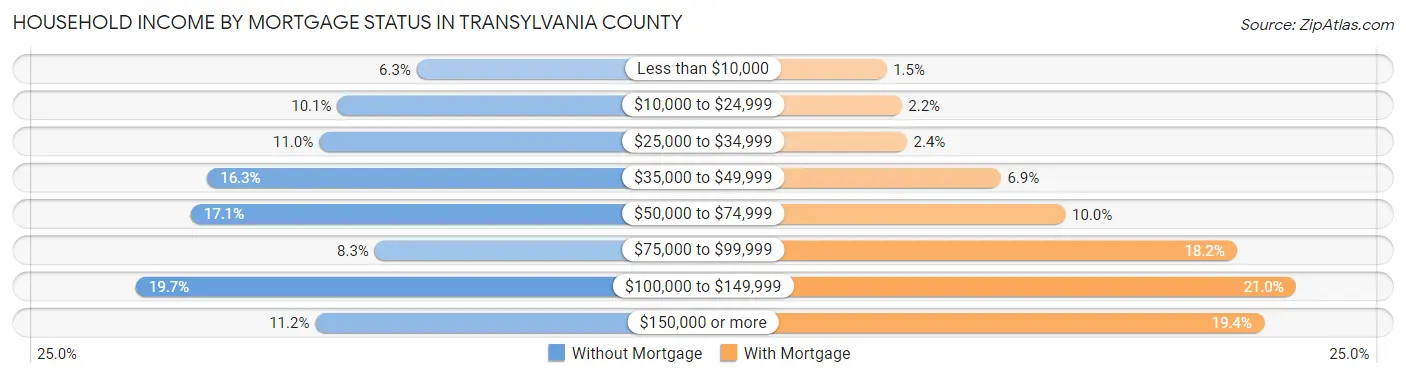
| Household Income | Without Mortgage | With Mortgage |
| Less than $10,000 | 358 (6.3%) | 77 (1.5%) |
| $10,000 to $24,999 | 572 (10.1%) | 115 (2.2%) |
| $25,000 to $34,999 | 621 (11.0%) | 128 (2.4%) |
| $35,000 to $49,999 | 922 (16.3%) | 364 (6.9%) |
| $50,000 to $74,999 | 966 (17.1%) | 526 (10.0%) |
| $75,000 to $99,999 | 471 (8.3%) | 957 (18.1%) |
| $100,000 to $149,999 | 1,114 (19.7%) | 1,105 (21.0%) |
| $150,000 or more | 631 (11.2%) | 1,025 (19.4%) |
| Total | 5,655 (100.0%) | 5,272 (100.0%) |
Property Value to Household Income Ratio in Transylvania County
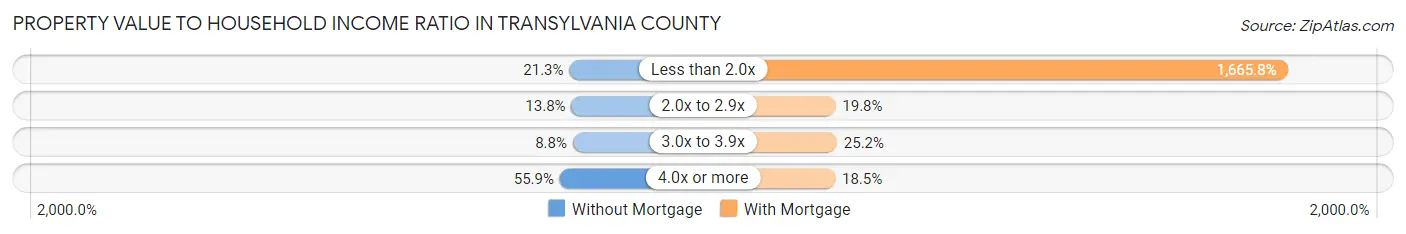
| Value-to-Income Ratio | Without Mortgage | With Mortgage |
| Less than 2.0x | 1,207 (21.3%) | 87,823 (1,665.8%) |
| 2.0x to 2.9x | 779 (13.8%) | 1,046 (19.8%) |
| 3.0x to 3.9x | 495 (8.7%) | 1,329 (25.2%) |
| 4.0x or more | 3,163 (55.9%) | 975 (18.5%) |
| Total | 5,655 (100.0%) | 5,272 (100.0%) |
Real Estate Taxes by Mortgage Status in Transylvania County
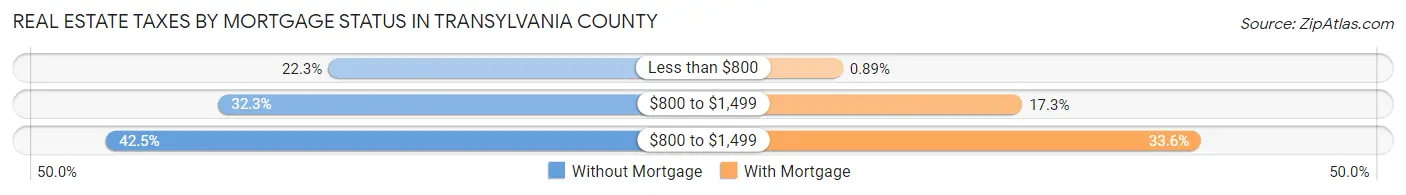
| Property Taxes | Without Mortgage | With Mortgage |
| Less than $800 | 1,260 (22.3%) | 47 (0.9%) |
| $800 to $1,499 | 1,827 (32.3%) | 911 (17.3%) |
| $800 to $1,499 | 2,405 (42.5%) | 1,772 (33.6%) |
| Total | 5,655 (100.0%) | 5,272 (100.0%) |
Health & Disability in Transylvania County
Health Insurance Coverage by Age in Transylvania County
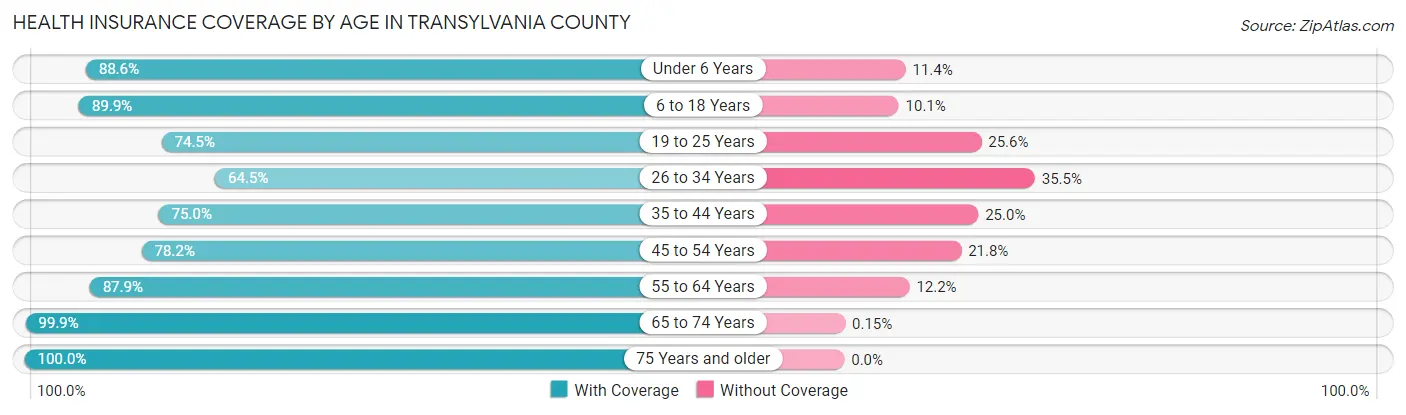
| Age Bracket | With Coverage | Without Coverage |
| Under 6 Years | 1,489 (88.6%) | 192 (11.4%) |
| 6 to 18 Years | 3,301 (89.9%) | 372 (10.1%) |
| 19 to 25 Years | 1,938 (74.5%) | 665 (25.6%) |
| 26 to 34 Years | 1,820 (64.5%) | 1,003 (35.5%) |
| 35 to 44 Years | 2,445 (75.0%) | 814 (25.0%) |
| 45 to 54 Years | 2,722 (78.2%) | 759 (21.8%) |
| 55 to 64 Years | 4,526 (87.8%) | 626 (12.1%) |
| 65 to 74 Years | 5,486 (99.9%) | 8 (0.2%) |
| 75 Years and older | 4,529 (100.0%) | 0 (0.0%) |
| Total | 28,256 (86.4%) | 4,439 (13.6%) |
Health Insurance Coverage by Citizenship Status in Transylvania County
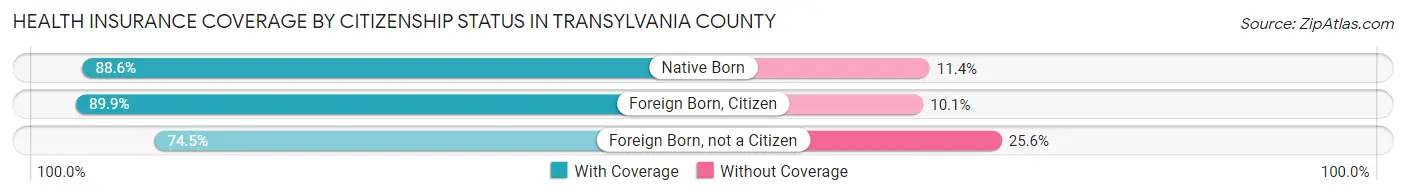
| Citizenship Status | With Coverage | Without Coverage |
| Native Born | 1,489 (88.6%) | 192 (11.4%) |
| Foreign Born, Citizen | 3,301 (89.9%) | 372 (10.1%) |
| Foreign Born, not a Citizen | 1,938 (74.5%) | 665 (25.6%) |
Health Insurance Coverage by Household Income in Transylvania County
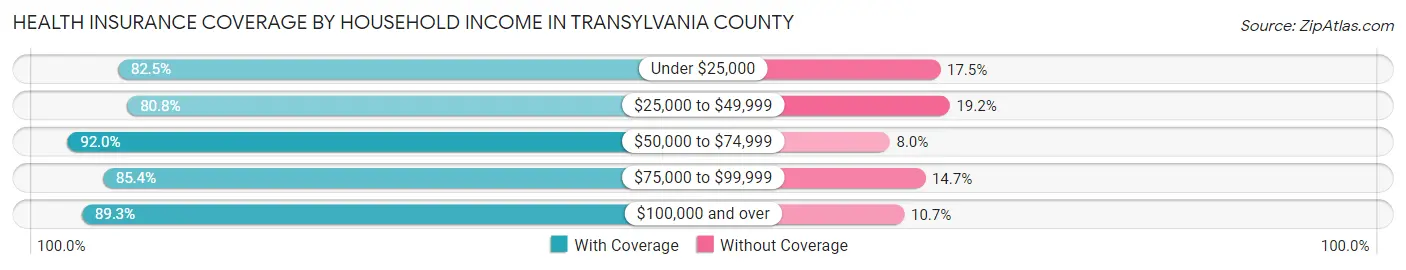
| Household Income | With Coverage | Without Coverage |
| Under $25,000 | 3,325 (82.5%) | 704 (17.5%) |
| $25,000 to $49,999 | 5,766 (80.8%) | 1,374 (19.2%) |
| $50,000 to $74,999 | 5,490 (92.0%) | 478 (8.0%) |
| $75,000 to $99,999 | 4,001 (85.4%) | 687 (14.6%) |
| $100,000 and over | 9,023 (89.3%) | 1,084 (10.7%) |
Public vs Private Health Insurance Coverage by Age in Transylvania County
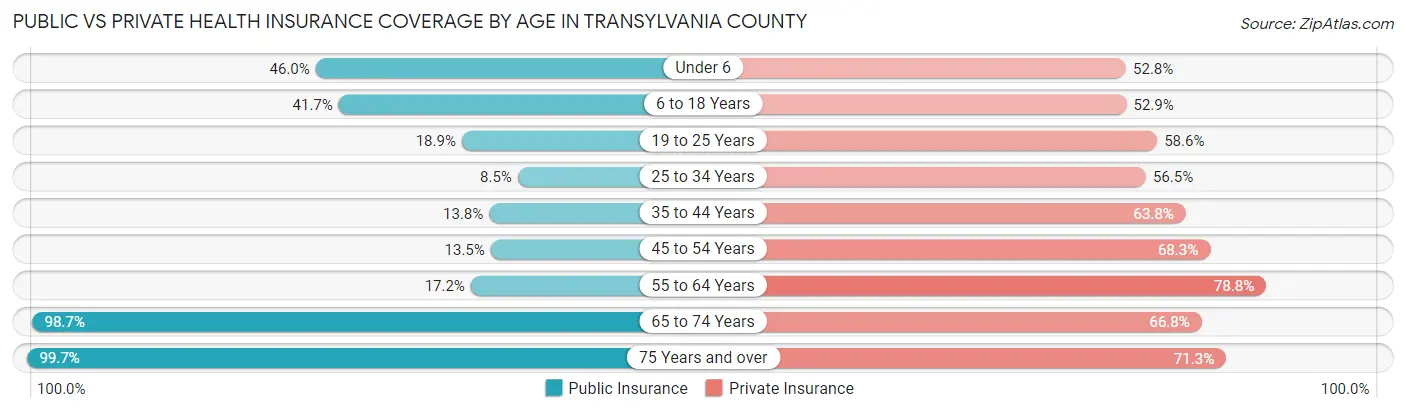
| Age Bracket | Public Insurance | Private Insurance |
| Under 6 | 773 (46.0%) | 887 (52.8%) |
| 6 to 18 Years | 1,532 (41.7%) | 1,941 (52.8%) |
| 19 to 25 Years | 491 (18.9%) | 1,524 (58.6%) |
| 25 to 34 Years | 239 (8.5%) | 1,594 (56.5%) |
| 35 to 44 Years | 449 (13.8%) | 2,080 (63.8%) |
| 45 to 54 Years | 470 (13.5%) | 2,379 (68.3%) |
| 55 to 64 Years | 886 (17.2%) | 4,057 (78.7%) |
| 65 to 74 Years | 5,423 (98.7%) | 3,668 (66.8%) |
| 75 Years and over | 4,513 (99.7%) | 3,230 (71.3%) |
| Total | 14,776 (45.2%) | 21,360 (65.3%) |
Disability Status by Sex by Age in Transylvania County
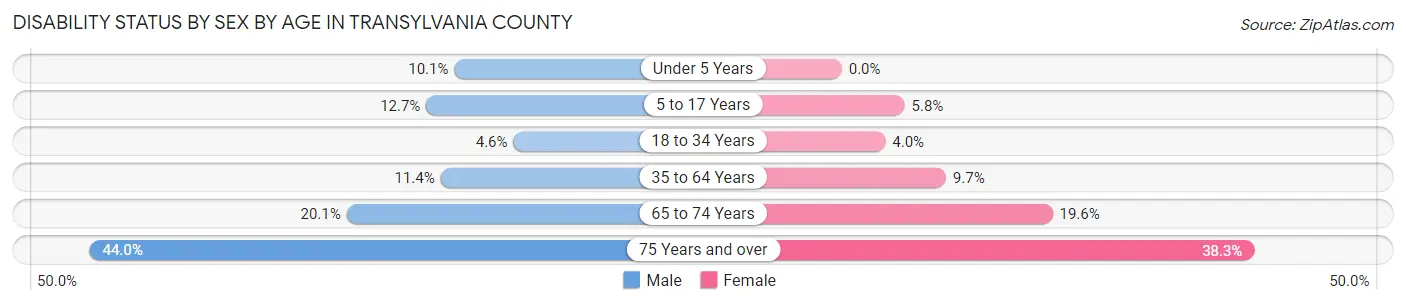
| Age Bracket | Male | Female |
| Under 5 Years | 68 (10.1%) | 0 (0.0%) |
| 5 to 17 Years | 247 (12.7%) | 109 (5.8%) |
| 18 to 34 Years | 139 (4.6%) | 108 (4.0%) |
| 35 to 64 Years | 634 (11.4%) | 612 (9.7%) |
| 65 to 74 Years | 515 (20.1%) | 574 (19.6%) |
| 75 Years and over | 901 (44.0%) | 949 (38.3%) |
Disability Class by Sex by Age in Transylvania County
Disability Class: Hearing Difficulty
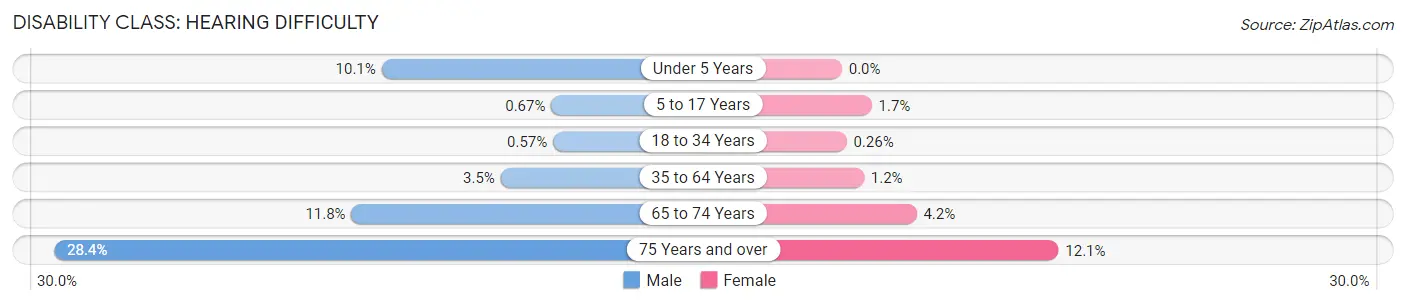
| Age Bracket | Male | Female |
| Under 5 Years | 68 (10.1%) | 0 (0.0%) |
| 5 to 17 Years | 13 (0.7%) | 31 (1.7%) |
| 18 to 34 Years | 17 (0.6%) | 7 (0.3%) |
| 35 to 64 Years | 194 (3.5%) | 78 (1.2%) |
| 65 to 74 Years | 302 (11.8%) | 122 (4.2%) |
| 75 Years and over | 581 (28.4%) | 299 (12.1%) |
Disability Class: Vision Difficulty
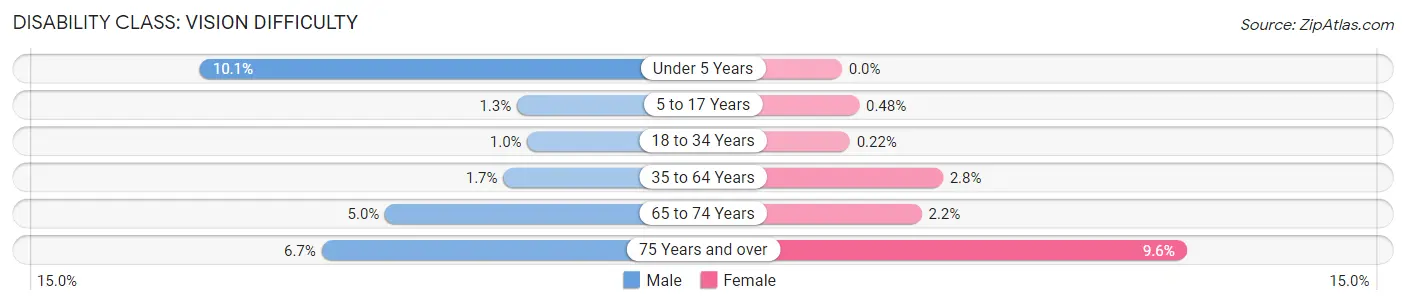
| Age Bracket | Male | Female |
| Under 5 Years | 68 (10.1%) | 0 (0.0%) |
| 5 to 17 Years | 25 (1.3%) | 9 (0.5%) |
| 18 to 34 Years | 30 (1.0%) | 6 (0.2%) |
| 35 to 64 Years | 93 (1.7%) | 178 (2.8%) |
| 65 to 74 Years | 127 (5.0%) | 65 (2.2%) |
| 75 Years and over | 138 (6.7%) | 238 (9.6%) |
Disability Class: Cognitive Difficulty
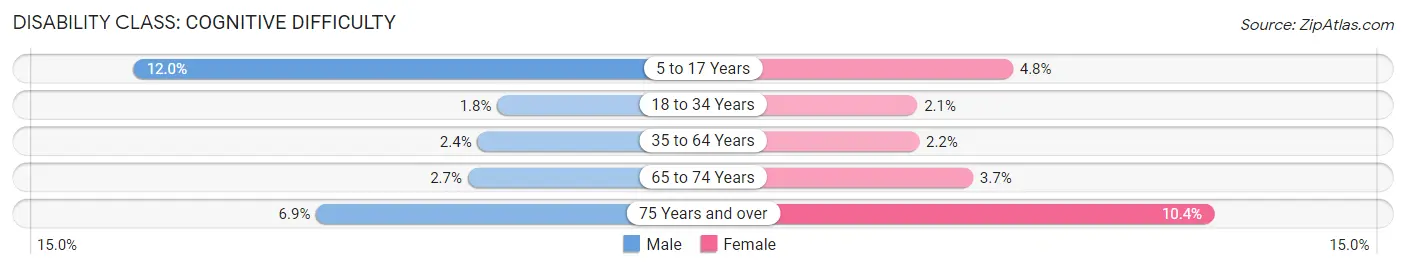
| Age Bracket | Male | Female |
| 5 to 17 Years | 232 (12.0%) | 89 (4.8%) |
| 18 to 34 Years | 55 (1.8%) | 56 (2.1%) |
| 35 to 64 Years | 133 (2.4%) | 136 (2.1%) |
| 65 to 74 Years | 68 (2.7%) | 107 (3.6%) |
| 75 Years and over | 141 (6.9%) | 257 (10.4%) |
Disability Class: Ambulatory Difficulty
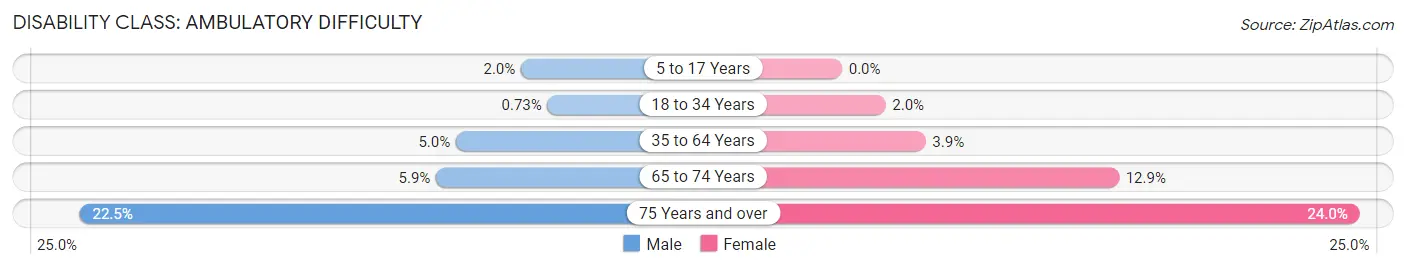
| Age Bracket | Male | Female |
| 5 to 17 Years | 38 (2.0%) | 0 (0.0%) |
| 18 to 34 Years | 22 (0.7%) | 54 (2.0%) |
| 35 to 64 Years | 277 (5.0%) | 246 (3.9%) |
| 65 to 74 Years | 151 (5.9%) | 377 (12.9%) |
| 75 Years and over | 460 (22.5%) | 596 (24.0%) |
Disability Class: Self-Care Difficulty
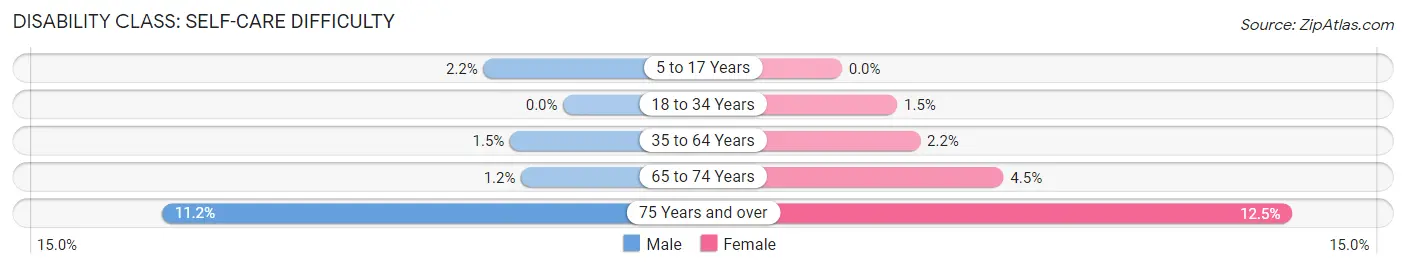
| Age Bracket | Male | Female |
| 5 to 17 Years | 43 (2.2%) | 0 (0.0%) |
| 18 to 34 Years | 0 (0.0%) | 41 (1.5%) |
| 35 to 64 Years | 82 (1.5%) | 138 (2.2%) |
| 65 to 74 Years | 30 (1.2%) | 132 (4.5%) |
| 75 Years and over | 229 (11.2%) | 311 (12.5%) |
Technology Access in Transylvania County
Computing Device Access in Transylvania County
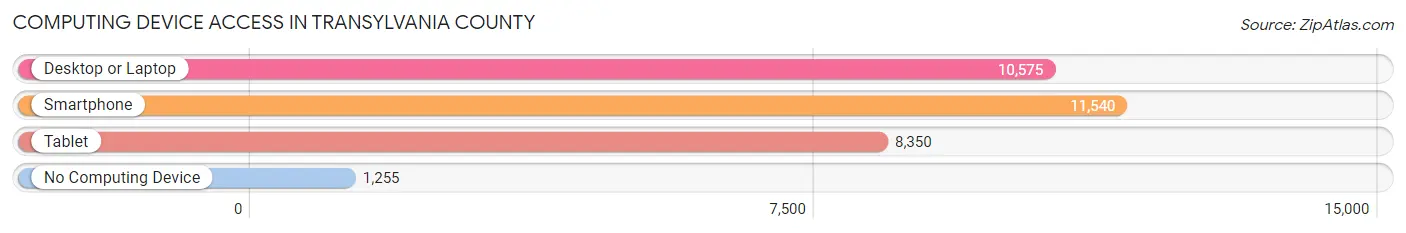
| Device Type | # Households | % Households |
| Desktop or Laptop | 10,575 | 73.7% |
| Smartphone | 11,540 | 80.4% |
| Tablet | 8,350 | 58.2% |
| No Computing Device | 1,255 | 8.7% |
| Total | 14,353 | 100.0% |
Internet Access in Transylvania County
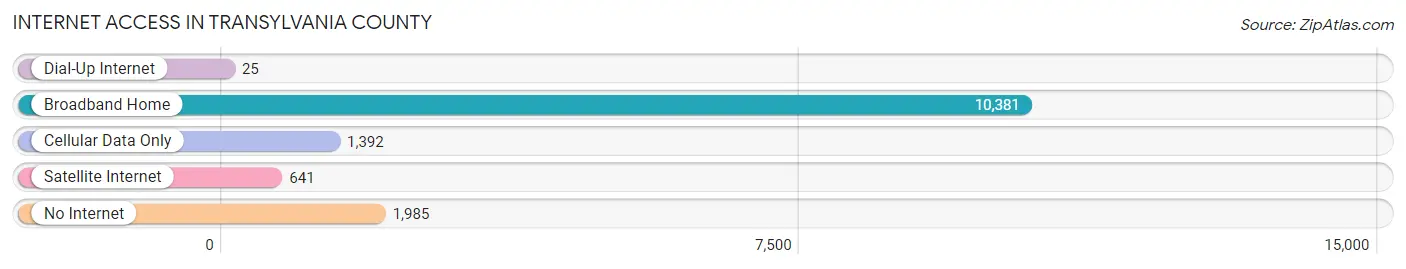
| Internet Type | # Households | % Households |
| Dial-Up Internet | 25 | 0.2% |
| Broadband Home | 10,381 | 72.3% |
| Cellular Data Only | 1,392 | 9.7% |
| Satellite Internet | 641 | 4.5% |
| No Internet | 1,985 | 13.8% |
| Total | 14,353 | 100.0% |
Transylvania County Summary
Transylvania County, North Carolina is located in the western part of the state, in the Blue Ridge Mountains. It is bordered by Henderson County to the north, Jackson County to the east, and South Carolina to the south. The county seat is Brevard, and the county is home to the Pisgah National Forest, the DuPont State Recreational Forest, and the Gorges State Park.
History
Transylvania County was formed in 1861 from parts of Henderson and Jackson counties. It was named for the Transylvania Company, a land company that had purchased much of the land in the area in the late 1700s. The county was home to the Cherokee Indians prior to the arrival of European settlers. The first settlers arrived in the late 1700s, and the county was officially established in 1868.
The county was largely agricultural in the 19th century, with the main crops being corn, wheat, and tobacco. The county also had a thriving timber industry, and the railroad was built through the county in the late 1800s. The county was also home to several resorts, including the Connestee Falls Resort, which opened in the early 1900s.
Geography
Transylvania County is located in the Blue Ridge Mountains of western North Carolina. It is bordered by Henderson County to the north, Jackson County to the east, and South Carolina to the south. The county covers an area of 437 square miles, and is home to the Pisgah National Forest, the DuPont State Recreational Forest, and the Gorges State Park. The county is also home to the French Broad River, which runs through the county.
The county is divided into two distinct regions: the Blue Ridge Mountains in the west, and the Piedmont Plateau in the east. The highest point in the county is the summit of Rich Mountain, which has an elevation of 4,941 feet. The county also has several lakes, including Lake Toxaway, Lake Jocassee, and Lake Summit.
Economy
Transylvania County has a diverse economy, with the largest employers being the healthcare, retail, and manufacturing industries. The county is home to several large employers, including the Brevard Music Center, the Connestee Falls Resort, and the DuPont State Recreational Forest. The county is also home to several small businesses, including restaurants, shops, and galleries.
The county is also home to several tourist attractions, including the Pisgah National Forest, the DuPont State Recreational Forest, and the Gorges State Park. The county is also home to several wineries, breweries, and distilleries.
Demographics
As of the 2010 census, Transylvania County had a population of 33,090. The population was spread out, with 24.3% under the age of 18, 8.2% from 18 to 24, 28.2% from 25 to 44, 24.7% from 45 to 64, and 14.6% who were 65 years of age or older. The median age was 38.4 years.
The median income for a household in the county was $41,945, and the median income for a family was $50,945. The per capita income for the county was $22,945. About 11.2% of families and 15.2% of the population were below the poverty line, including 22.2% of those under age 18 and 8.2% of those age 65 or over.
Common Questions
What is Per Capita Income in Transylvania County?
Per Capita income in Transylvania County is $36,660.
What is the Median Family Income in Transylvania County?
Median Family Income in Transylvania County is $77,573.
What is the Median Household income in Transylvania County?
Median Household Income in Transylvania County is $62,056.
What is Income or Wage Gap in Transylvania County?
Income or Wage Gap in Transylvania County is 21.5%.
Women in Transylvania County earn 78.5 cents for every dollar earned by a man.
What is Family Income Deficit in Transylvania County?
Family Income Deficit in Transylvania County is $9,852.
Families that are below poverty line in Transylvania County earn $9,852 less on average than the poverty threshold level.
What is Inequality or Gini Index in Transylvania County?
Inequality or Gini Index in Transylvania County is 0.45.
What is the Total Population of Transylvania County?
Total Population of Transylvania County is 33,131.
What is the Total Male Population of Transylvania County?
Total Male Population of Transylvania County is 16,013.
What is the Total Female Population of Transylvania County?
Total Female Population of Transylvania County is 17,118.
What is the Ratio of Males per 100 Females in Transylvania County?
There are 93.54 Males per 100 Females in Transylvania County.
What is the Ratio of Females per 100 Males in Transylvania County?
There are 106.90 Females per 100 Males in Transylvania County.
What is the Median Population Age in Transylvania County?
Median Population Age in Transylvania County is 52.4 Years.
What is the Average Family Size in Transylvania County
Average Family Size in Transylvania County is 2.7 People.
What is the Average Household Size in Transylvania County
Average Household Size in Transylvania County is 2.2 People.
How Large is the Labor Force in Transylvania County?
There are 14,774 People in the Labor Forcein in Transylvania County.
What is the Percentage of People in the Labor Force in Transylvania County?
51.8% of People are in the Labor Force in Transylvania County.
What is the Unemployment Rate in Transylvania County?
Unemployment Rate in Transylvania County is 4.0%.