Swain County, NC Map & Demographics
Swain County Map
Swain County Overview
$28,624
PER CAPITA INCOME
$72,516
AVG FAMILY INCOME
$52,818
AVG HOUSEHOLD INCOME
17.9%
WAGE / INCOME GAP [ % ]
82.1¢/ $1
WAGE / INCOME GAP [ $ ]
$13,168
FAMILY INCOME DEFICIT
0.45
INEQUALITY / GINI INDEX
14,130
TOTAL POPULATION
6,913
MALE POPULATION
7,217
FEMALE POPULATION
95.79
MALES / 100 FEMALES
104.40
FEMALES / 100 MALES
41.6
MEDIAN AGE
3.0
AVG FAMILY SIZE
2.4
AVG HOUSEHOLD SIZE
6,223
LABOR FORCE [ PEOPLE ]
55.2%
PERCENT IN LABOR FORCE
7.5%
UNEMPLOYMENT RATE
Swain County Area Codes
Income in Swain County
Income Overview in Swain County
Per Capita Income in Swain County is $28,624, while median incomes of families and households are $72,516 and $52,818 respectively.
| Characteristic | Number | Measure |
| Per Capita Income | 14,130 | $28,624 |
| Median Family Income | 3,815 | $72,516 |
| Mean Family Income | 3,815 | $83,976 |
| Median Household Income | 5,684 | $52,818 |
| Mean Household Income | 5,684 | $71,082 |
| Income Deficit | 3,815 | $13,168 |
| Wage / Income Gap (%) | 14,130 | 17.93% |
| Wage / Income Gap ($) | 14,130 | 82.07¢ per $1 |
| Gini / Inequality Index | 14,130 | 0.45 |
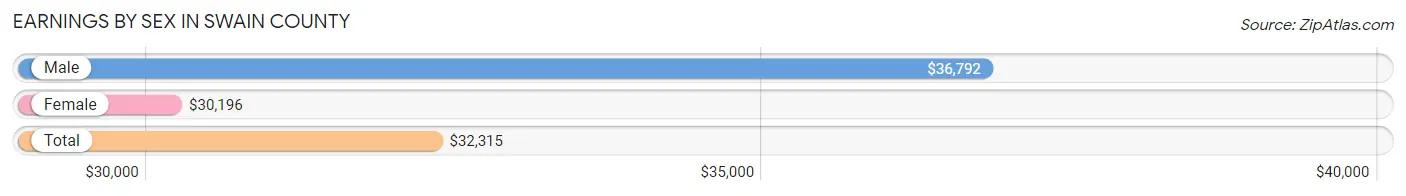
Earnings by Sex in Swain County
Average Earnings in Swain County are $32,315, $36,792 for men and $30,196 for women, a difference of 17.9%.
| Sex | Number | Average Earnings |
| Male | 3,321 (50.1%) | $36,792 |
| Female | 3,307 (49.9%) | $30,196 |
| Total | 6,628 (100.0%) | $32,315 |
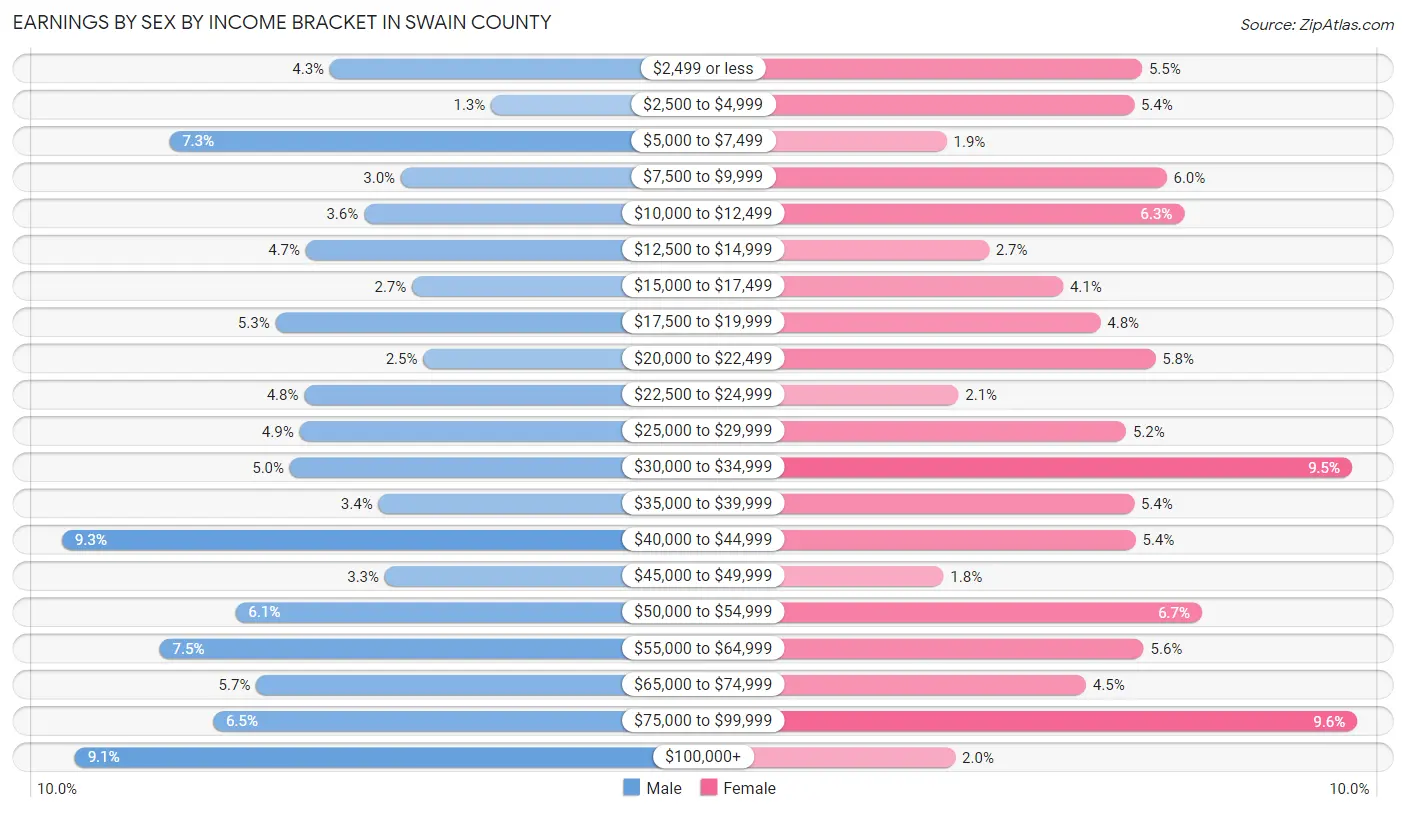
Earnings by Sex by Income Bracket in Swain County
The most common earnings brackets in Swain County are $40,000 to $44,999 for men (309 | 9.3%) and $75,000 to $99,999 for women (316 | 9.6%).
| Income | Male | Female |
| $2,499 or less | 142 (4.3%) | 183 (5.5%) |
| $2,500 to $4,999 | 42 (1.3%) | 178 (5.4%) |
| $5,000 to $7,499 | 242 (7.3%) | 62 (1.9%) |
| $7,500 to $9,999 | 98 (2.9%) | 198 (6.0%) |
| $10,000 to $12,499 | 121 (3.6%) | 209 (6.3%) |
| $12,500 to $14,999 | 157 (4.7%) | 88 (2.7%) |
| $15,000 to $17,499 | 91 (2.7%) | 134 (4.1%) |
| $17,500 to $19,999 | 176 (5.3%) | 157 (4.8%) |
| $20,000 to $22,499 | 84 (2.5%) | 191 (5.8%) |
| $22,500 to $24,999 | 158 (4.8%) | 69 (2.1%) |
| $25,000 to $29,999 | 161 (4.9%) | 173 (5.2%) |
| $30,000 to $34,999 | 167 (5.0%) | 313 (9.5%) |
| $35,000 to $39,999 | 112 (3.4%) | 178 (5.4%) |
| $40,000 to $44,999 | 309 (9.3%) | 179 (5.4%) |
| $45,000 to $49,999 | 108 (3.3%) | 60 (1.8%) |
| $50,000 to $54,999 | 201 (6.0%) | 220 (6.7%) |
| $55,000 to $64,999 | 248 (7.5%) | 184 (5.6%) |
| $65,000 to $74,999 | 188 (5.7%) | 148 (4.5%) |
| $75,000 to $99,999 | 215 (6.5%) | 316 (9.6%) |
| $100,000+ | 301 (9.1%) | 67 (2.0%) |
| Total | 3,321 (100.0%) | 3,307 (100.0%) |
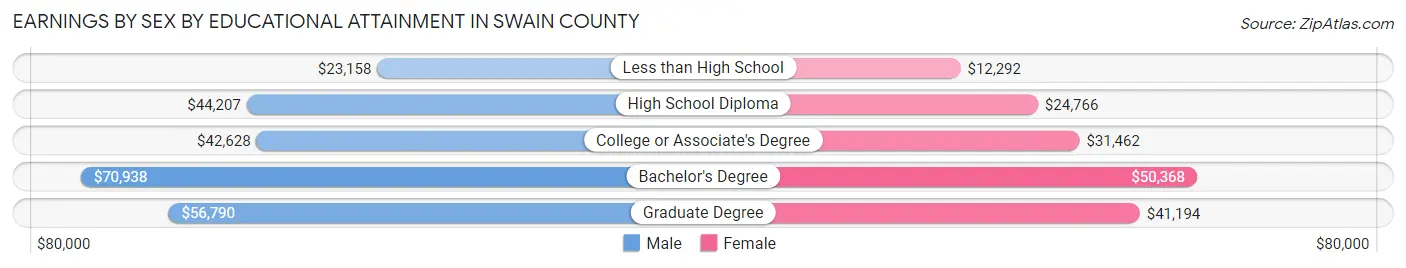
Earnings by Sex by Educational Attainment in Swain County
Average earnings in Swain County are $42,769 for men and $33,096 for women, a difference of 22.6%. Men with an educational attainment of bachelor's degree enjoy the highest average annual earnings of $70,938, while those with less than high school education earn the least with $23,158. Women with an educational attainment of bachelor's degree earn the most with the average annual earnings of $50,368, while those with less than high school education have the smallest earnings of $12,292.
| Educational Attainment | Male Income | Female Income |
| Less than High School | $23,158 | $12,292 |
| High School Diploma | $44,207 | $24,766 |
| College or Associate's Degree | $42,628 | $31,462 |
| Bachelor's Degree | $70,938 | $50,368 |
| Graduate Degree | $56,790 | $41,194 |
| Total | $42,769 | $33,096 |
Family Income in Swain County
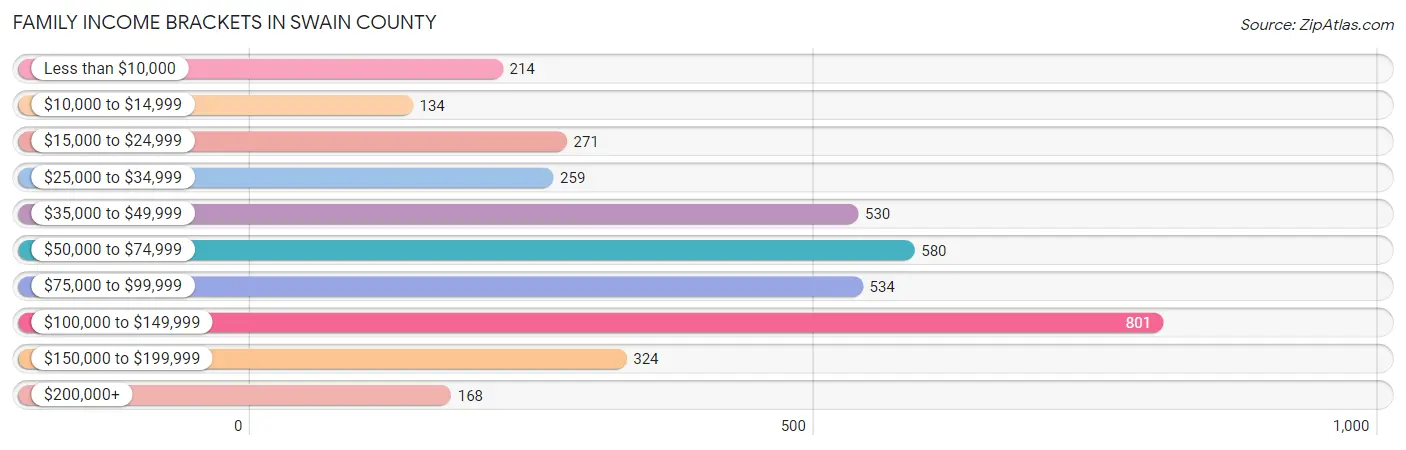
Family Income Brackets in Swain County
According to the Swain County family income data, there are 801 families falling into the $100,000 to $149,999 income range, which is the most common income bracket and makes up 21.0% of all families. Conversely, the $10,000 to $14,999 income bracket is the least frequent group with only 134 families (3.5%) belonging to this category.
| Income Bracket | # Families | % Families |
| Less than $10,000 | 214 | 5.6% |
| $10,000 to $14,999 | 134 | 3.5% |
| $15,000 to $24,999 | 271 | 7.1% |
| $25,000 to $34,999 | 259 | 6.8% |
| $35,000 to $49,999 | 530 | 13.9% |
| $50,000 to $74,999 | 580 | 15.2% |
| $75,000 to $99,999 | 534 | 14.0% |
| $100,000 to $149,999 | 801 | 21.0% |
| $150,000 to $199,999 | 324 | 8.5% |
| $200,000+ | 168 | 4.4% |
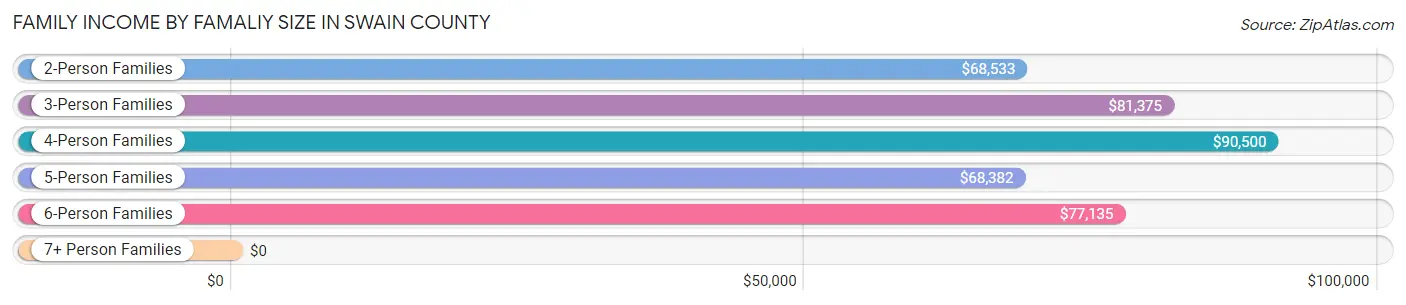
Family Income by Famaliy Size in Swain County
4-person families (546 | 14.3%) account for the highest median family income in Swain County with $90,500 per family, while 2-person families (2,015 | 52.8%) have the highest median income of $34,266 per family member.
| Income Bracket | # Families | Median Income |
| 2-Person Families | 2,015 (52.8%) | $68,533 |
| 3-Person Families | 739 (19.4%) | $81,375 |
| 4-Person Families | 546 (14.3%) | $90,500 |
| 5-Person Families | 222 (5.8%) | $68,382 |
| 6-Person Families | 194 (5.1%) | $77,135 |
| 7+ Person Families | 99 (2.6%) | $0 |
| Total | 3,815 (100.0%) | $72,516 |
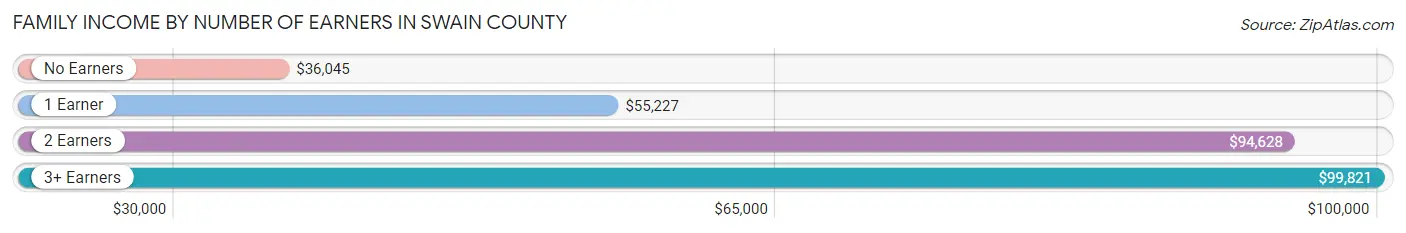
Family Income by Number of Earners in Swain County
The median family income in Swain County is $72,516, with families comprising 3+ earners (287) having the highest median family income of $99,821, while families with no earners (884) have the lowest median family income of $36,045, accounting for 7.5% and 23.2% of families, respectively.
| Number of Earners | # Families | Median Income |
| No Earners | 884 (23.2%) | $36,045 |
| 1 Earner | 1,270 (33.3%) | $55,227 |
| 2 Earners | 1,374 (36.0%) | $94,628 |
| 3+ Earners | 287 (7.5%) | $99,821 |
| Total | 3,815 (100.0%) | $72,516 |
Household Income in Swain County
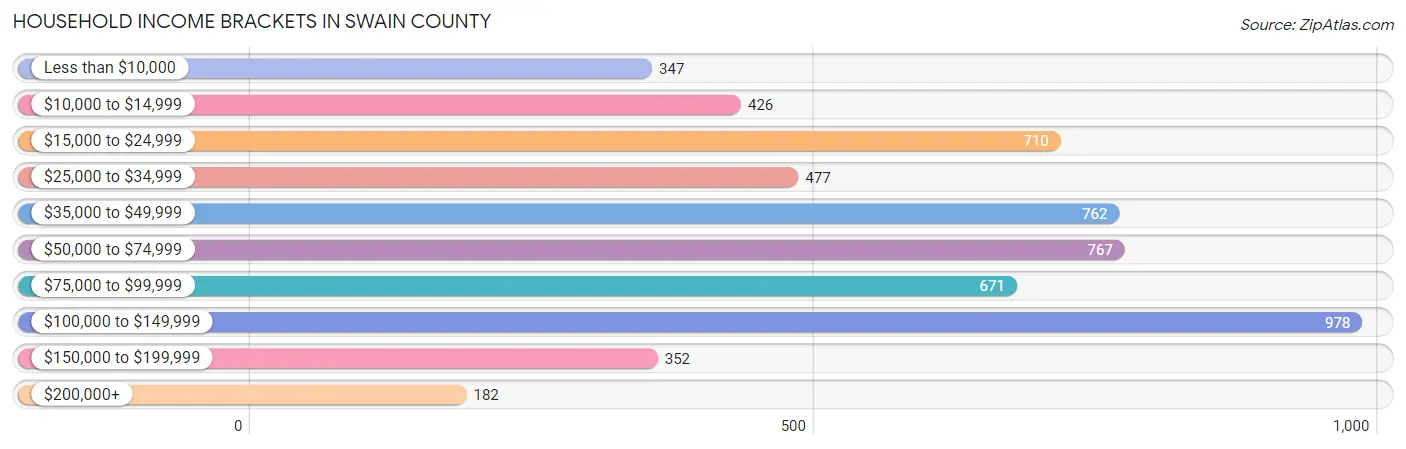
Household Income Brackets in Swain County
With 978 households falling in the category, the $100,000 to $149,999 income range is the most frequent in Swain County, accounting for 17.2% of all households. In contrast, only 182 households (3.2%) fall into the $200,000+ income bracket, making it the least populous group.
| Income Bracket | # Households | % Households |
| Less than $10,000 | 347 | 6.1% |
| $10,000 to $14,999 | 426 | 7.5% |
| $15,000 to $24,999 | 710 | 12.5% |
| $25,000 to $34,999 | 477 | 8.4% |
| $35,000 to $49,999 | 762 | 13.4% |
| $50,000 to $74,999 | 767 | 13.5% |
| $75,000 to $99,999 | 671 | 11.8% |
| $100,000 to $149,999 | 978 | 17.2% |
| $150,000 to $199,999 | 352 | 6.2% |
| $200,000+ | 182 | 3.2% |
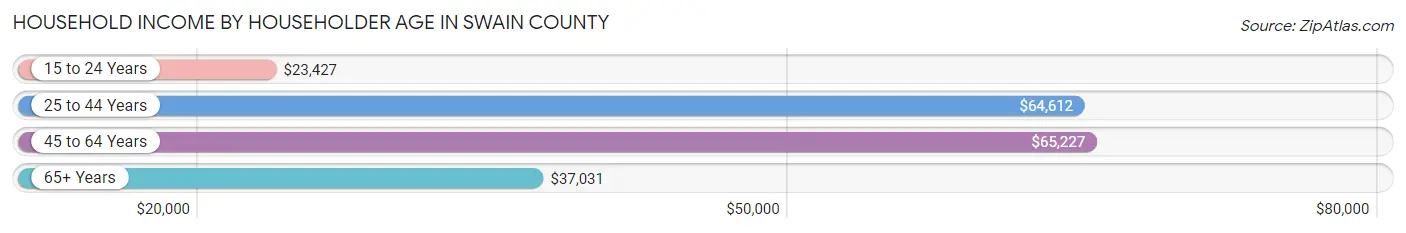
Household Income by Householder Age in Swain County
The median household income in Swain County is $52,818, with the highest median household income of $65,227 found in the 45 to 64 years age bracket for the primary householder. A total of 2,016 households (35.5%) fall into this category. Meanwhile, the 15 to 24 years age bracket for the primary householder has the lowest median household income of $23,427, with 217 households (3.8%) in this group.
| Income Bracket | # Households | Median Income |
| 15 to 24 Years | 217 (3.8%) | $23,427 |
| 25 to 44 Years | 1,677 (29.5%) | $64,612 |
| 45 to 64 Years | 2,016 (35.5%) | $65,227 |
| 65+ Years | 1,774 (31.2%) | $37,031 |
| Total | 5,684 (100.0%) | $52,818 |
Poverty in Swain County
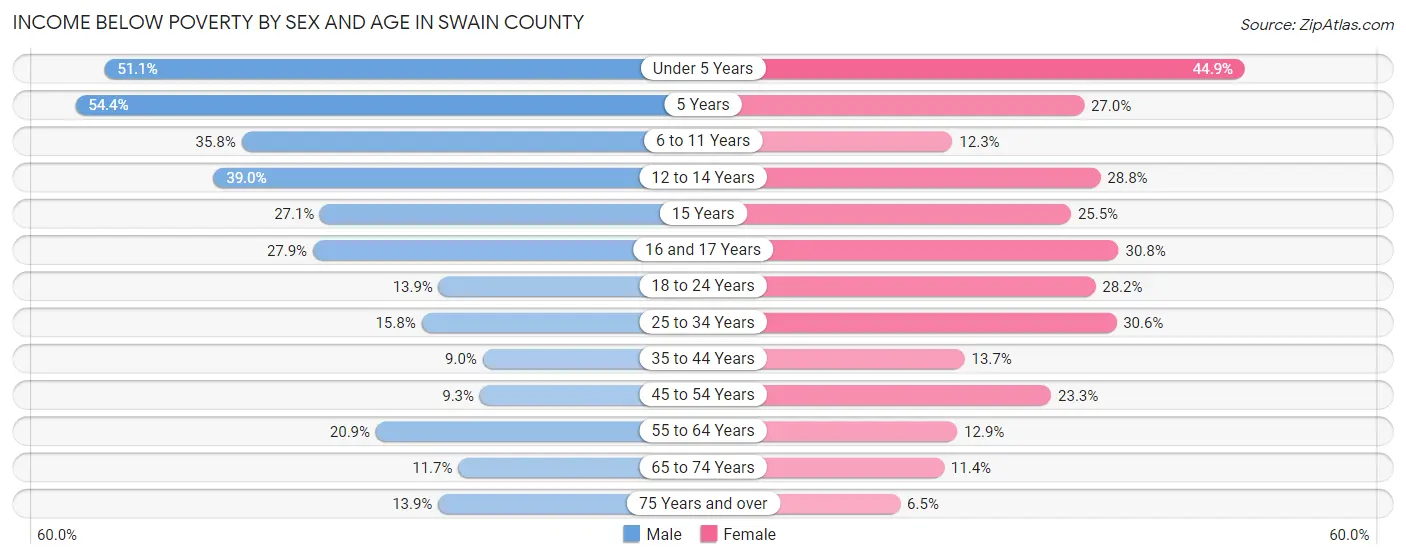
Income Below Poverty by Sex and Age in Swain County
With 20.0% poverty level for males and 19.6% for females among the residents of Swain County, 5 year old males and under 5 year old females are the most vulnerable to poverty, with 50 males (54.3%) and 123 females (44.9%) in their respective age groups living below the poverty level.
| Age Bracket | Male | Female |
| Under 5 Years | 206 (51.1%) | 123 (44.9%) |
| 5 Years | 50 (54.3%) | 24 (27.0%) |
| 6 to 11 Years | 239 (35.8%) | 68 (12.3%) |
| 12 to 14 Years | 99 (39.0%) | 72 (28.8%) |
| 15 Years | 26 (27.1%) | 37 (25.5%) |
| 16 and 17 Years | 53 (27.9%) | 45 (30.8%) |
| 18 to 24 Years | 92 (13.9%) | 164 (28.2%) |
| 25 to 34 Years | 106 (15.8%) | 272 (30.6%) |
| 35 to 44 Years | 74 (9.0%) | 127 (13.7%) |
| 45 to 54 Years | 82 (9.3%) | 197 (23.3%) |
| 55 to 64 Years | 189 (20.9%) | 123 (12.9%) |
| 65 to 74 Years | 79 (11.7%) | 94 (11.4%) |
| 75 Years and over | 69 (13.9%) | 37 (6.5%) |
| Total | 1,364 (20.0%) | 1,383 (19.6%) |
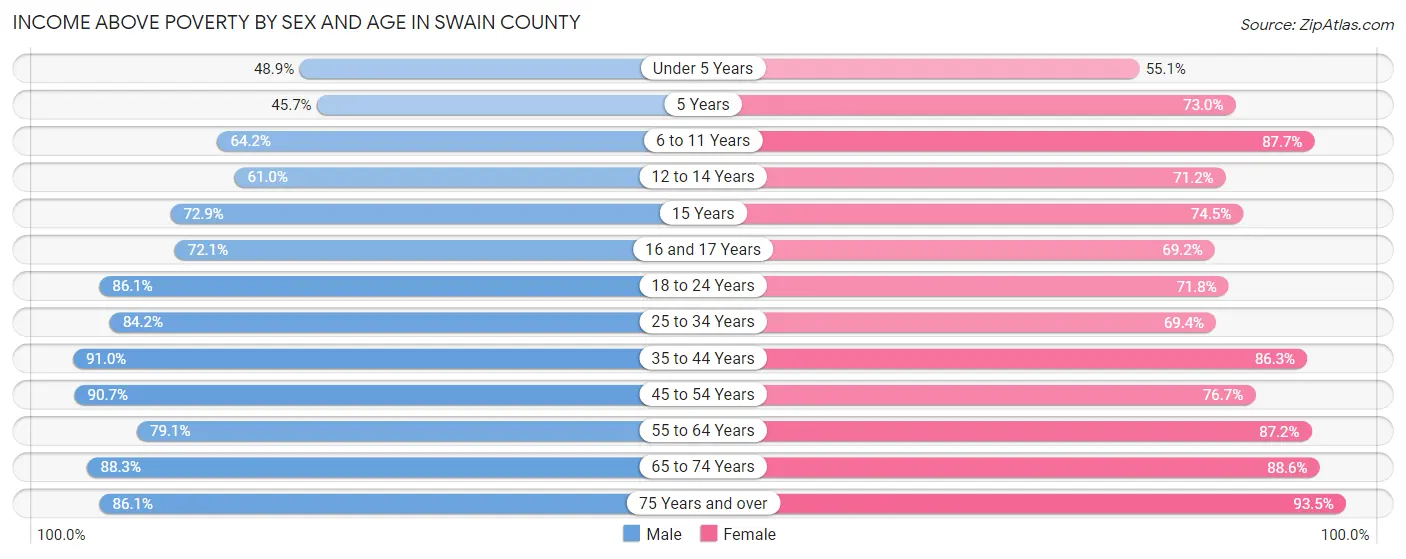
Income Above Poverty by Sex and Age in Swain County
According to the poverty statistics in Swain County, males aged 35 to 44 years and females aged 75 years and over are the age groups that are most secure financially, with 91.0% of males and 93.5% of females in these age groups living above the poverty line.
| Age Bracket | Male | Female |
| Under 5 Years | 197 (48.9%) | 151 (55.1%) |
| 5 Years | 42 (45.7%) | 65 (73.0%) |
| 6 to 11 Years | 428 (64.2%) | 484 (87.7%) |
| 12 to 14 Years | 155 (61.0%) | 178 (71.2%) |
| 15 Years | 70 (72.9%) | 108 (74.5%) |
| 16 and 17 Years | 137 (72.1%) | 101 (69.2%) |
| 18 to 24 Years | 571 (86.1%) | 417 (71.8%) |
| 25 to 34 Years | 565 (84.2%) | 618 (69.4%) |
| 35 to 44 Years | 750 (91.0%) | 802 (86.3%) |
| 45 to 54 Years | 800 (90.7%) | 648 (76.7%) |
| 55 to 64 Years | 716 (79.1%) | 834 (87.2%) |
| 65 to 74 Years | 596 (88.3%) | 733 (88.6%) |
| 75 Years and over | 426 (86.1%) | 532 (93.5%) |
| Total | 5,453 (80.0%) | 5,671 (80.4%) |
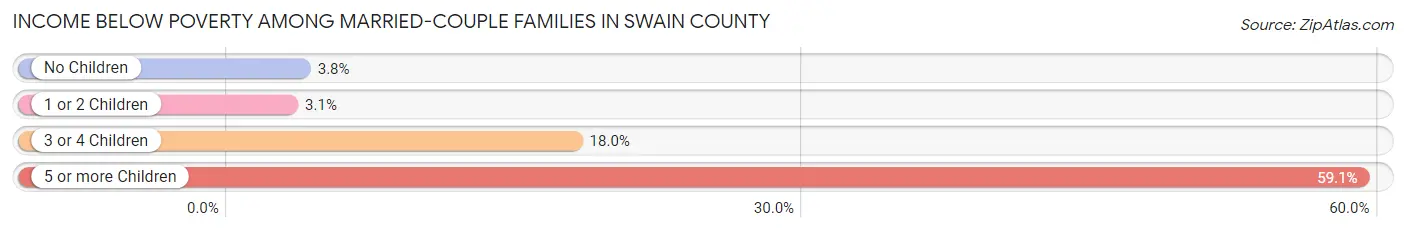
Income Below Poverty Among Married-Couple Families in Swain County
The poverty statistics for married-couple families in Swain County show that 5.6% or 148 of the total 2,631 families live below the poverty line. Families with 5 or more children have the highest poverty rate of 59.1%, comprising of 26 families. On the other hand, families with 1 or 2 children have the lowest poverty rate of 3.1%, which includes 22 families.
| Children | Above Poverty | Below Poverty |
| No Children | 1,622 (96.2%) | 64 (3.8%) |
| 1 or 2 Children | 679 (96.9%) | 22 (3.1%) |
| 3 or 4 Children | 164 (82.0%) | 36 (18.0%) |
| 5 or more Children | 18 (40.9%) | 26 (59.1%) |
| Total | 2,483 (94.4%) | 148 (5.6%) |
Income Below Poverty Among Single-Parent Households in Swain County
According to the poverty data in Swain County, 31.8% or 124 single-father households and 35.0% or 278 single-mother households are living below the poverty line. Among single-father households, those with 5 or more children have the highest poverty rate, with 12 households (100.0%) experiencing poverty. Likewise, among single-mother households, those with 3 or 4 children have the highest poverty rate, with 44 households (100.0%) falling below the poverty line.
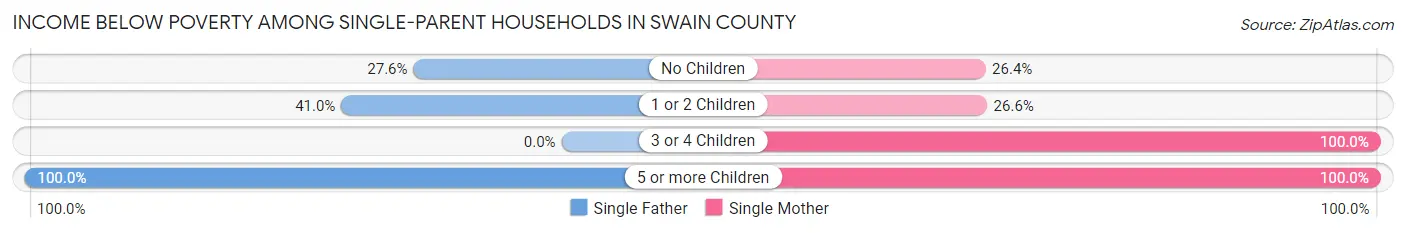
| Children | Single Father | Single Mother |
| No Children | 48 (27.6%) | 88 (26.4%) |
| 1 or 2 Children | 64 (41.0%) | 98 (26.6%) |
| 3 or 4 Children | 0 (0.0%) | 44 (100.0%) |
| 5 or more Children | 12 (100.0%) | 48 (100.0%) |
| Total | 124 (31.8%) | 278 (35.0%) |
Income Below Poverty Among Married-Couple vs Single-Parent Households in Swain County
The poverty data for Swain County shows that 148 of the married-couple family households (5.6%) and 402 of the single-parent households (34.0%) are living below the poverty level. Within the married-couple family households, those with 5 or more children have the highest poverty rate, with 26 households (59.1%) falling below the poverty line. Among the single-parent households, those with 5 or more children have the highest poverty rate, with 60 household (100.0%) living below poverty.
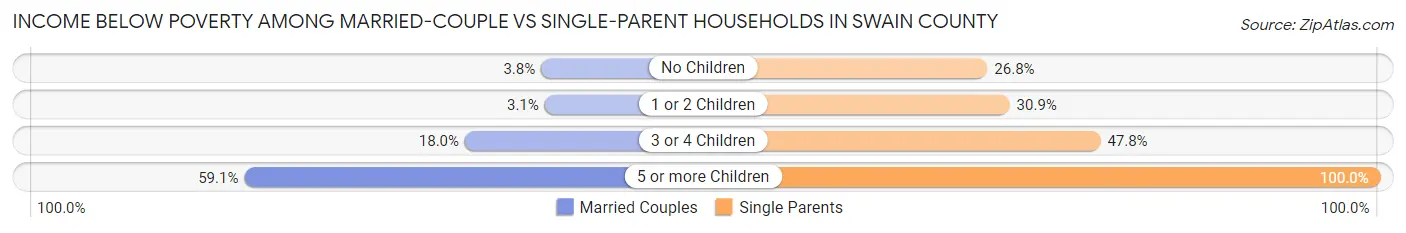
| Children | Married-Couple Families | Single-Parent Households |
| No Children | 64 (3.8%) | 136 (26.8%) |
| 1 or 2 Children | 22 (3.1%) | 162 (30.9%) |
| 3 or 4 Children | 36 (18.0%) | 44 (47.8%) |
| 5 or more Children | 26 (59.1%) | 60 (100.0%) |
| Total | 148 (5.6%) | 402 (34.0%) |
Race in Swain County
The most populous races in Swain County are White / Caucasian (8,786 | 62.2%), Native / Alaskan (4,106 | 29.1%), and Hispanic or Latino (973 | 6.9%).
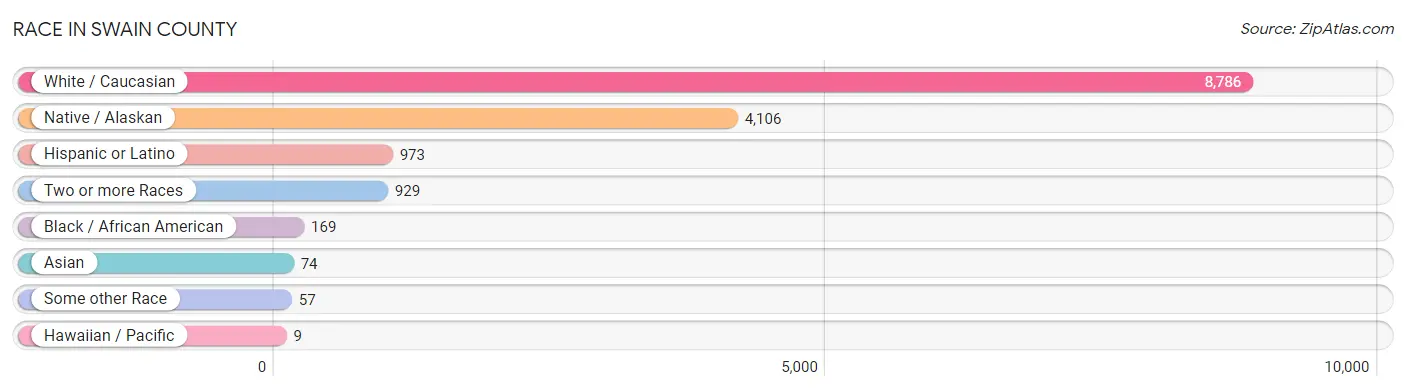
| Race | # Population | % Population |
| Asian | 74 | 0.5% |
| Black / African American | 169 | 1.2% |
| Hawaiian / Pacific | 9 | 0.1% |
| Hispanic or Latino | 973 | 6.9% |
| Native / Alaskan | 4,106 | 29.1% |
| White / Caucasian | 8,786 | 62.2% |
| Two or more Races | 929 | 6.6% |
| Some other Race | 57 | 0.4% |
| Total | 14,130 | 100.0% |
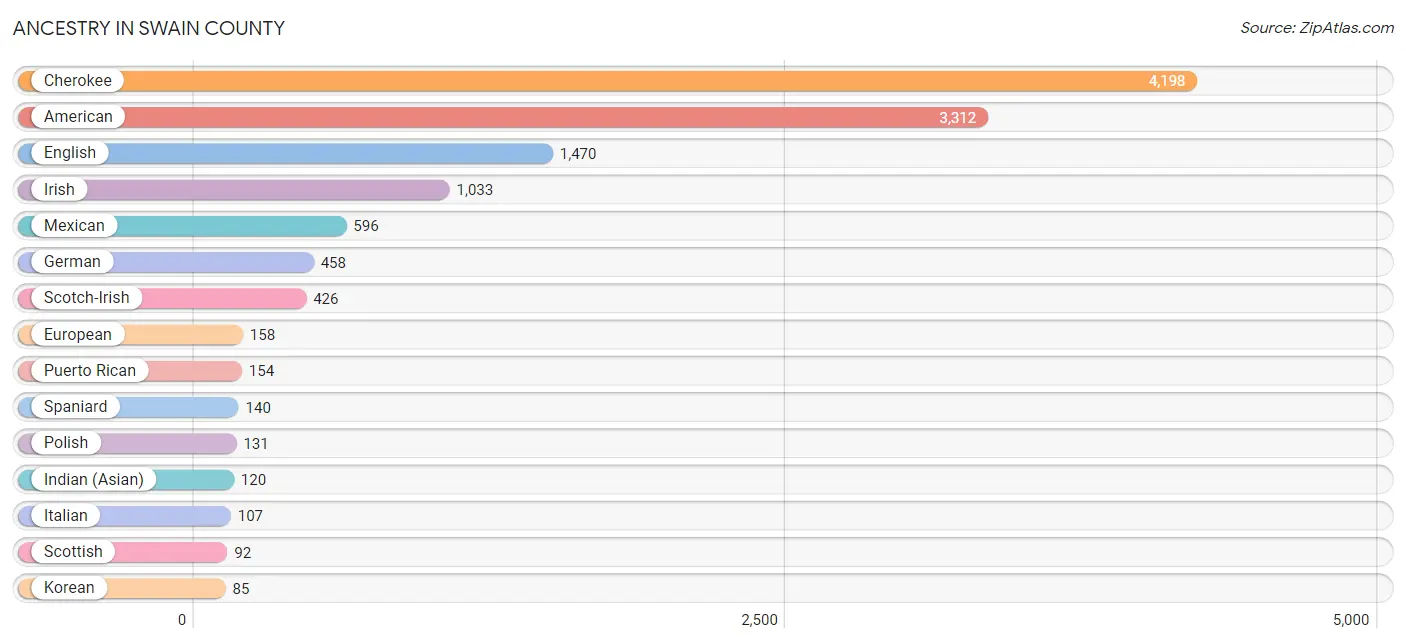
Ancestry in Swain County
The most populous ancestries reported in Swain County are Cherokee (4,198 | 29.7%), American (3,312 | 23.4%), English (1,470 | 10.4%), Irish (1,033 | 7.3%), and Mexican (596 | 4.2%), together accounting for 75.1% of all Swain County residents.
| Ancestry | # Population | % Population |
| African | 16 | 0.1% |
| American | 3,312 | 23.4% |
| Apache | 68 | 0.5% |
| Belgian | 8 | 0.1% |
| Blackfeet | 34 | 0.2% |
| British | 33 | 0.2% |
| Burmese | 15 | 0.1% |
| Canadian | 18 | 0.1% |
| Cherokee | 4,198 | 29.7% |
| Chippewa | 13 | 0.1% |
| Choctaw | 23 | 0.2% |
| Czech | 19 | 0.1% |
| Danish | 8 | 0.1% |
| Delaware | 6 | 0.0% |
| Dutch | 75 | 0.5% |
| Eastern European | 16 | 0.1% |
| English | 1,470 | 10.4% |
| Estonian | 3 | 0.0% |
| European | 158 | 1.1% |
| French | 78 | 0.5% |
| French Canadian | 9 | 0.1% |
| German | 458 | 3.2% |
| Greek | 21 | 0.2% |
| Guamanian / Chamorro | 9 | 0.1% |
| Hungarian | 12 | 0.1% |
| Indian (Asian) | 120 | 0.9% |
| Irish | 1,033 | 7.3% |
| Iroquois | 9 | 0.1% |
| Italian | 107 | 0.8% |
| Korean | 85 | 0.6% |
| Laotian | 24 | 0.2% |
| Lithuanian | 8 | 0.1% |
| Lumbee | 41 | 0.3% |
| Mexican | 596 | 4.2% |
| Norwegian | 12 | 0.1% |
| Peruvian | 83 | 0.6% |
| Polish | 131 | 0.9% |
| Puerto Rican | 154 | 1.1% |
| Russian | 28 | 0.2% |
| Scandinavian | 58 | 0.4% |
| Scotch-Irish | 426 | 3.0% |
| Scottish | 92 | 0.6% |
| Slovak | 5 | 0.0% |
| South African | 3 | 0.0% |
| South American | 83 | 0.6% |
| Spaniard | 140 | 1.0% |
| Sri Lankan | 85 | 0.6% |
| Subsaharan African | 19 | 0.1% |
| Swedish | 53 | 0.4% |
| Swiss | 63 | 0.4% |
| Ukrainian | 37 | 0.3% |
| Welsh | 73 | 0.5% |
| West Indian | 15 | 0.1% | View All 53 Rows |
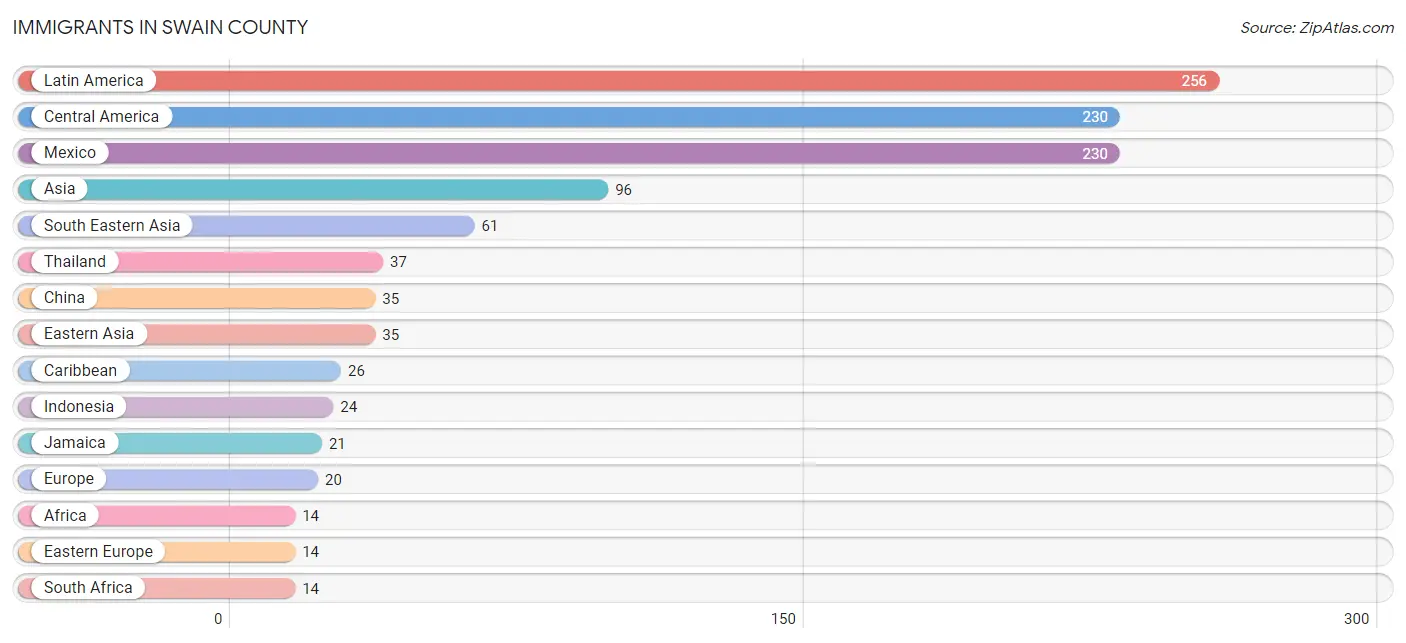
Immigrants in Swain County
The most numerous immigrant groups reported in Swain County came from Latin America (256 | 1.8%), Central America (230 | 1.6%), Mexico (230 | 1.6%), Asia (96 | 0.7%), and South Eastern Asia (61 | 0.4%), together accounting for 6.2% of all Swain County residents.
| Immigration Origin | # Population | % Population |
| Africa | 14 | 0.1% |
| Asia | 96 | 0.7% |
| Canada | 5 | 0.0% |
| Caribbean | 26 | 0.2% |
| Central America | 230 | 1.6% |
| China | 35 | 0.3% |
| Eastern Asia | 35 | 0.3% |
| Eastern Europe | 14 | 0.1% |
| England | 4 | 0.0% |
| Europe | 20 | 0.1% |
| Indonesia | 24 | 0.2% |
| Ireland | 2 | 0.0% |
| Jamaica | 21 | 0.2% |
| Latin America | 256 | 1.8% |
| Mexico | 230 | 1.6% |
| Northern Europe | 6 | 0.0% |
| South Africa | 14 | 0.1% |
| South Eastern Asia | 61 | 0.4% |
| Thailand | 37 | 0.3% |
| Trinidad and Tobago | 5 | 0.0% |
| Ukraine | 14 | 0.1% | View All 21 Rows |
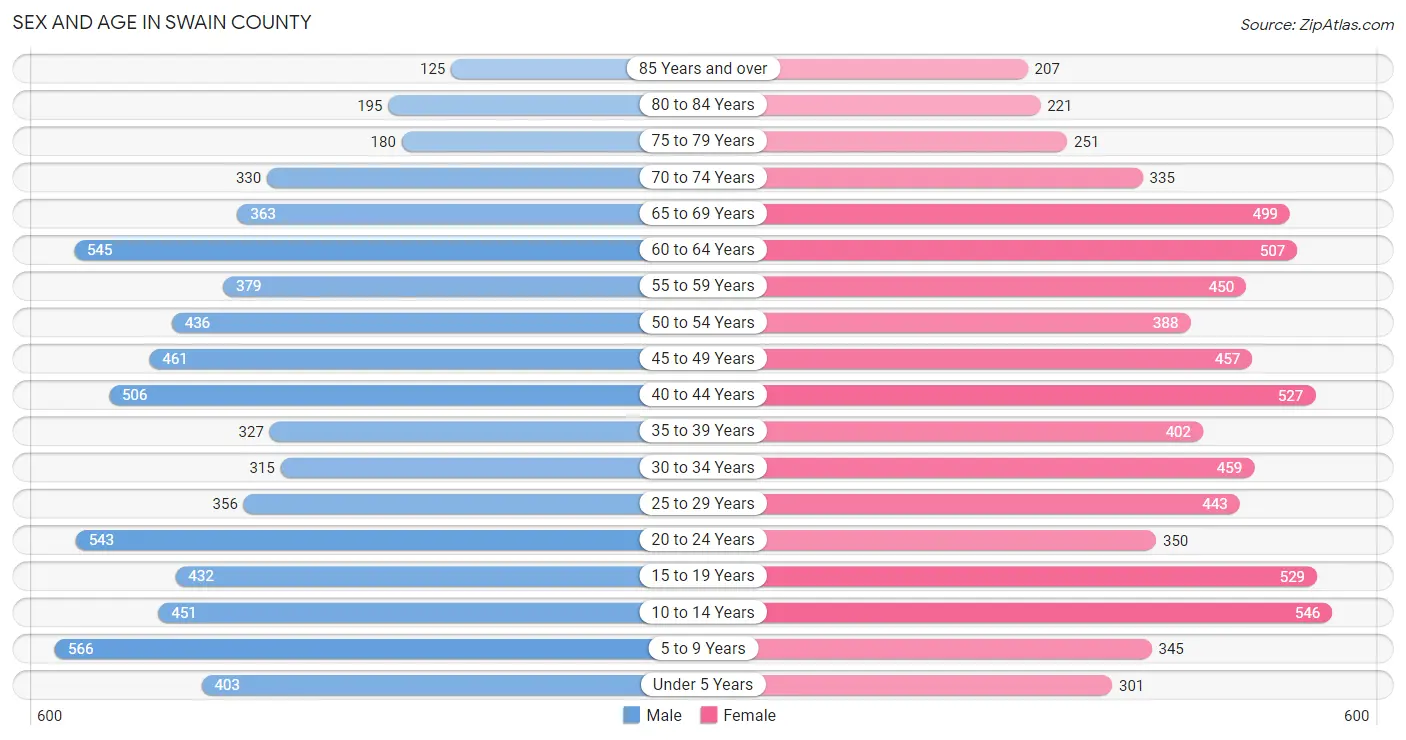
Sex and Age in Swain County
Sex and Age in Swain County
The most populous age groups in Swain County are 5 to 9 Years (566 | 8.2%) for men and 10 to 14 Years (546 | 7.6%) for women.
| Age Bracket | Male | Female |
| Under 5 Years | 403 (5.8%) | 301 (4.2%) |
| 5 to 9 Years | 566 (8.2%) | 345 (4.8%) |
| 10 to 14 Years | 451 (6.5%) | 546 (7.6%) |
| 15 to 19 Years | 432 (6.2%) | 529 (7.3%) |
| 20 to 24 Years | 543 (7.9%) | 350 (4.9%) |
| 25 to 29 Years | 356 (5.1%) | 443 (6.1%) |
| 30 to 34 Years | 315 (4.6%) | 459 (6.4%) |
| 35 to 39 Years | 327 (4.7%) | 402 (5.6%) |
| 40 to 44 Years | 506 (7.3%) | 527 (7.3%) |
| 45 to 49 Years | 461 (6.7%) | 457 (6.3%) |
| 50 to 54 Years | 436 (6.3%) | 388 (5.4%) |
| 55 to 59 Years | 379 (5.5%) | 450 (6.2%) |
| 60 to 64 Years | 545 (7.9%) | 507 (7.0%) |
| 65 to 69 Years | 363 (5.2%) | 499 (6.9%) |
| 70 to 74 Years | 330 (4.8%) | 335 (4.6%) |
| 75 to 79 Years | 180 (2.6%) | 251 (3.5%) |
| 80 to 84 Years | 195 (2.8%) | 221 (3.1%) |
| 85 Years and over | 125 (1.8%) | 207 (2.9%) |
| Total | 6,913 (100.0%) | 7,217 (100.0%) |
Families and Households in Swain County
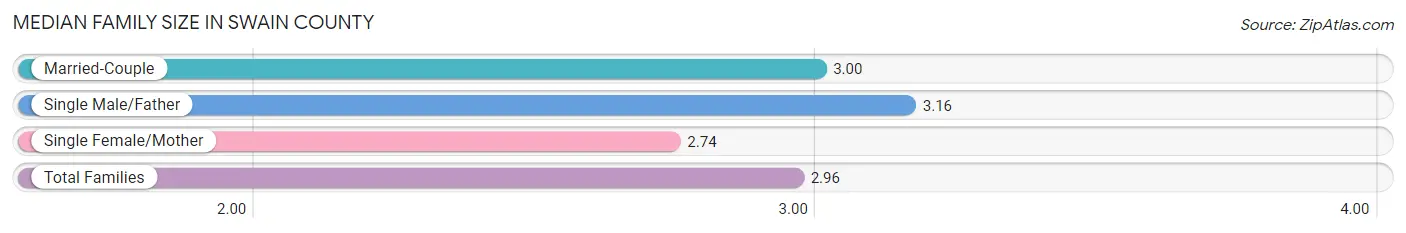
Median Family Size in Swain County
The median family size in Swain County is 2.96 persons per family, with single male/father families (390 | 10.2%) accounting for the largest median family size of 3.16 persons per family. On the other hand, single female/mother families (794 | 20.8%) represent the smallest median family size with 2.74 persons per family.
| Family Type | # Families | Family Size |
| Married-Couple | 2,631 (69.0%) | 3.00 |
| Single Male/Father | 390 (10.2%) | 3.16 |
| Single Female/Mother | 794 (20.8%) | 2.74 |
| Total Families | 3,815 (100.0%) | 2.96 |
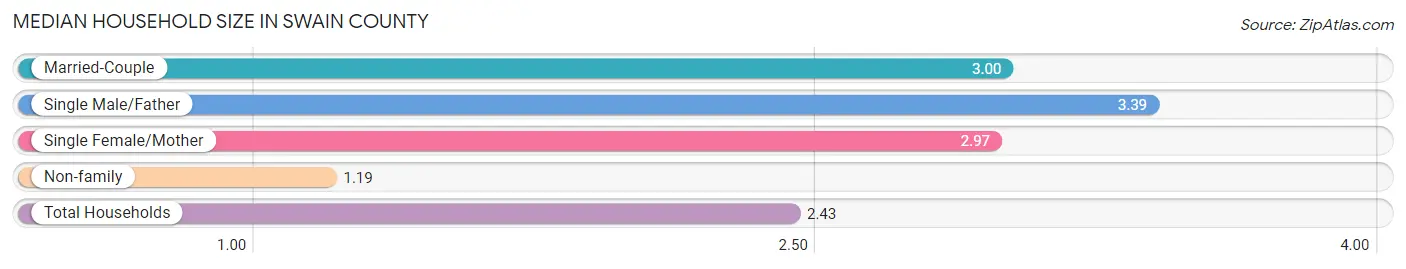
Median Household Size in Swain County
The median household size in Swain County is 2.43 persons per household, with single male/father households (390 | 6.9%) accounting for the largest median household size of 3.39 persons per household. non-family households (1,869 | 32.9%) represent the smallest median household size with 1.19 persons per household.
| Household Type | # Households | Household Size |
| Married-Couple | 2,631 (46.3%) | 3.00 |
| Single Male/Father | 390 (6.9%) | 3.39 |
| Single Female/Mother | 794 (14.0%) | 2.97 |
| Non-family | 1,869 (32.9%) | 1.19 |
| Total Households | 5,684 (100.0%) | 2.43 |
Household Size by Marriage Status in Swain County
Out of a total of 5,684 households in Swain County, 3,815 (67.1%) are family households, while 1,869 (32.9%) are nonfamily households. The most numerous type of family households are 2-person households, comprising 1,959, and the most common type of nonfamily households are 1-person households, comprising 1,576.
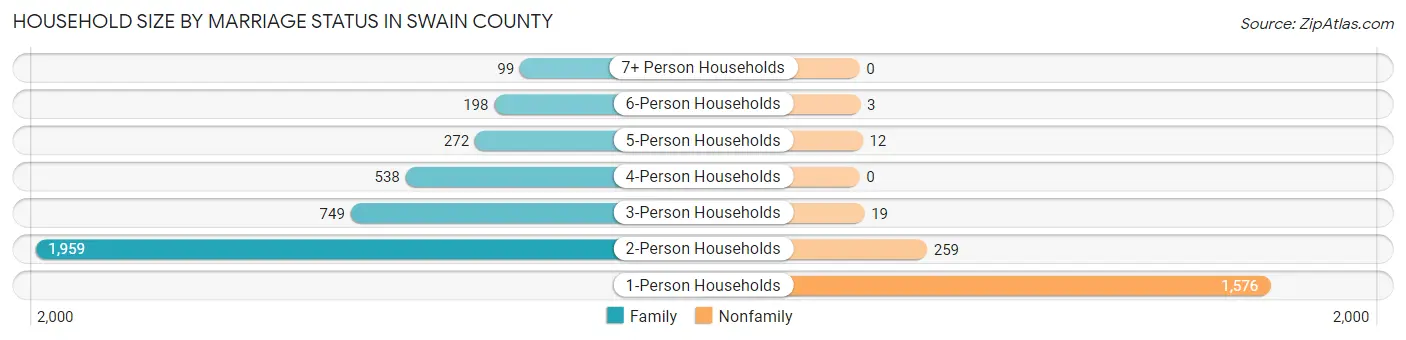
| Household Size | Family Households | Nonfamily Households |
| 1-Person Households | - | 1,576 (27.7%) |
| 2-Person Households | 1,959 (34.5%) | 259 (4.6%) |
| 3-Person Households | 749 (13.2%) | 19 (0.3%) |
| 4-Person Households | 538 (9.5%) | 0 (0.0%) |
| 5-Person Households | 272 (4.8%) | 12 (0.2%) |
| 6-Person Households | 198 (3.5%) | 3 (0.1%) |
| 7+ Person Households | 99 (1.7%) | 0 (0.0%) |
| Total | 3,815 (67.1%) | 1,869 (32.9%) |
Female Fertility in Swain County
Fertility by Age in Swain County
Average fertility rate in Swain County is 58.0 births per 1,000 women. Women in the age bracket of 20 to 34 years have the highest fertility rate with 116.0 births per 1,000 women. Women in the age bracket of 20 to 34 years acount for 75.9% of all women with births.
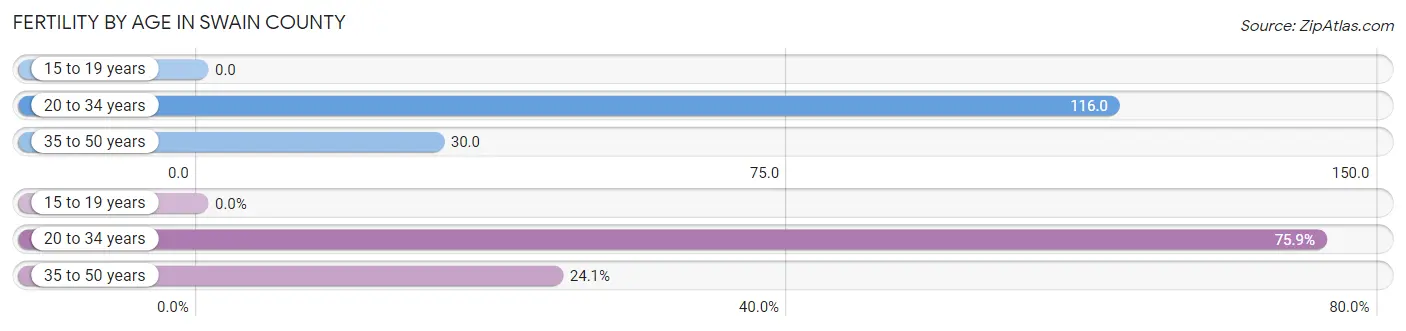
| Age Bracket | Women with Births | Births / 1,000 Women |
| 15 to 19 years | 0 (0.0%) | 0.0 |
| 20 to 34 years | 145 (75.9%) | 116.0 |
| 35 to 50 years | 46 (24.1%) | 30.0 |
| Total | 191 (100.0%) | 58.0 |
Fertility by Age by Marriage Status in Swain County
45.5% of women with births (191) in Swain County are married. The highest percentage of unmarried women with births falls into 20 to 34 years age bracket with 60.7% of them unmarried at the time of birth, while the lowest percentage of unmarried women with births belong to 35 to 50 years age bracket with 34.8% of them unmarried.
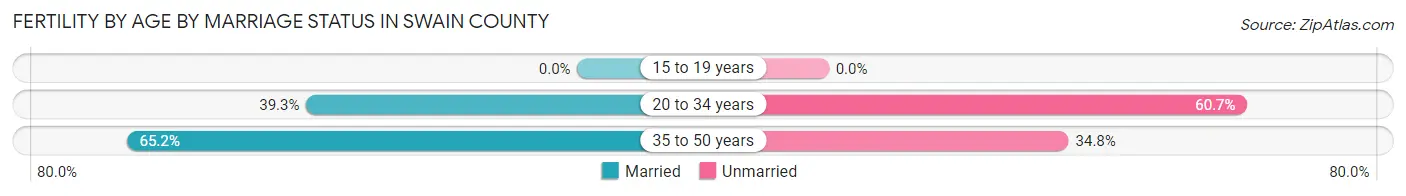
| Age Bracket | Married | Unmarried |
| 15 to 19 years | 0 (0.0%) | 0 (0.0%) |
| 20 to 34 years | 57 (39.3%) | 88 (60.7%) |
| 35 to 50 years | 30 (65.2%) | 16 (34.8%) |
| Total | 87 (45.6%) | 104 (54.4%) |
Fertility by Education in Swain County
Average fertility rate in Swain County is 58.0 births per 1,000 women. Women with the education attainment of graduate degree have the highest fertility rate of 187.0 births per 1,000 women, while women with the education attainment of college or associate's degree have the lowest fertility at 12.0 births per 1,000 women. Women with the education attainment of high school diploma represent 69.1% of all women with births.
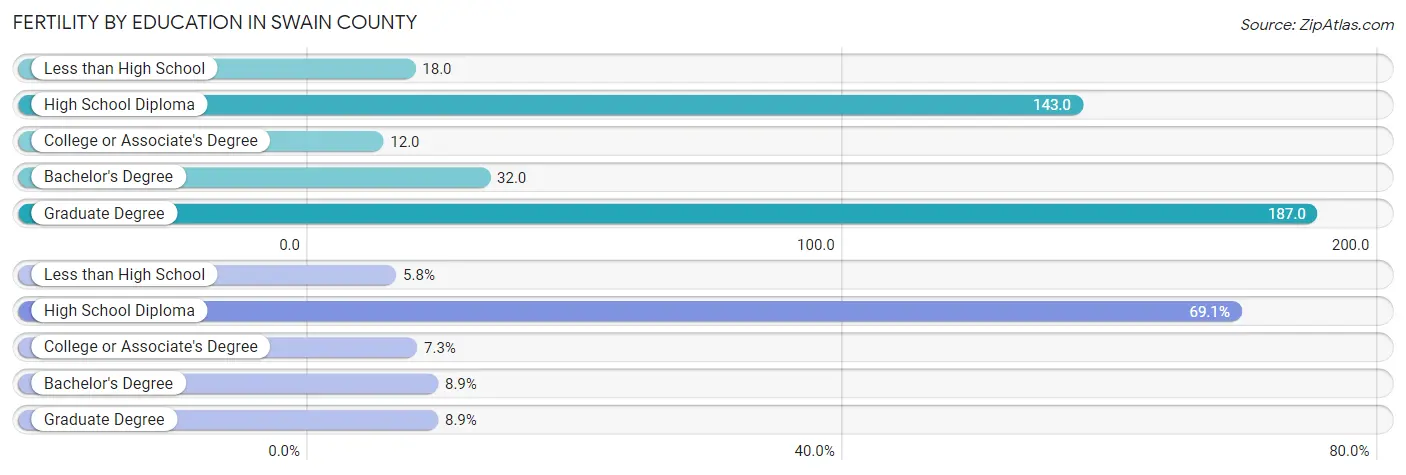
| Educational Attainment | Women with Births | Births / 1,000 Women |
| Less than High School | 11 (5.8%) | 18.0 |
| High School Diploma | 132 (69.1%) | 143.0 |
| College or Associate's Degree | 14 (7.3%) | 12.0 |
| Bachelor's Degree | 17 (8.9%) | 32.0 |
| Graduate Degree | 17 (8.9%) | 187.0 |
| Total | 191 (100.0%) | 58.0 |
Fertility by Education by Marriage Status in Swain County
54.4% of women with births in Swain County are unmarried. Women with the educational attainment of college or associate's degree are most likely to be married with 100.0% of them married at childbirth, while women with the educational attainment of less than high school are least likely to be married with 100.0% of them unmarried at childbirth.
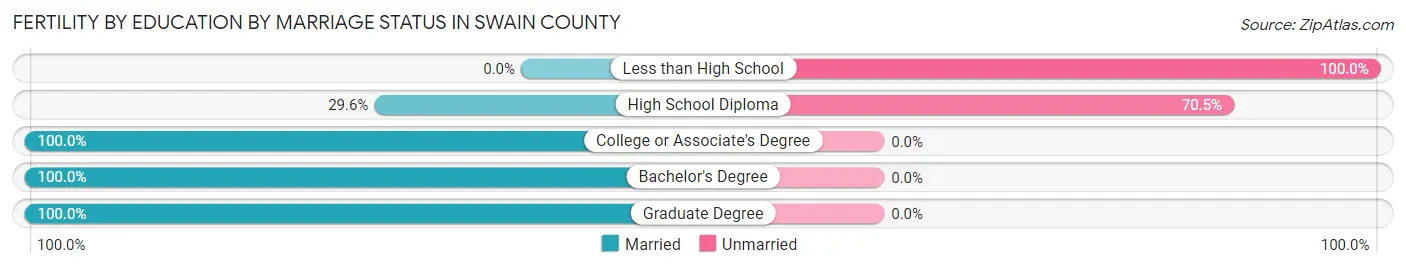
| Educational Attainment | Married | Unmarried |
| Less than High School | 0 (0.0%) | 11 (100.0%) |
| High School Diploma | 39 (29.5%) | 93 (70.5%) |
| College or Associate's Degree | 14 (100.0%) | 0 (0.0%) |
| Bachelor's Degree | 17 (100.0%) | 0 (0.0%) |
| Graduate Degree | 17 (100.0%) | 0 (0.0%) |
| Total | 87 (45.6%) | 104 (54.4%) |
Employment Characteristics in Swain County
Employment by Class of Employer in Swain County
Among the 5,620 employed individuals in Swain County, private company employees (3,233 | 57.5%), local government employees (930 | 16.6%), and federal government employees (404 | 7.2%) make up the most common classes of employment.
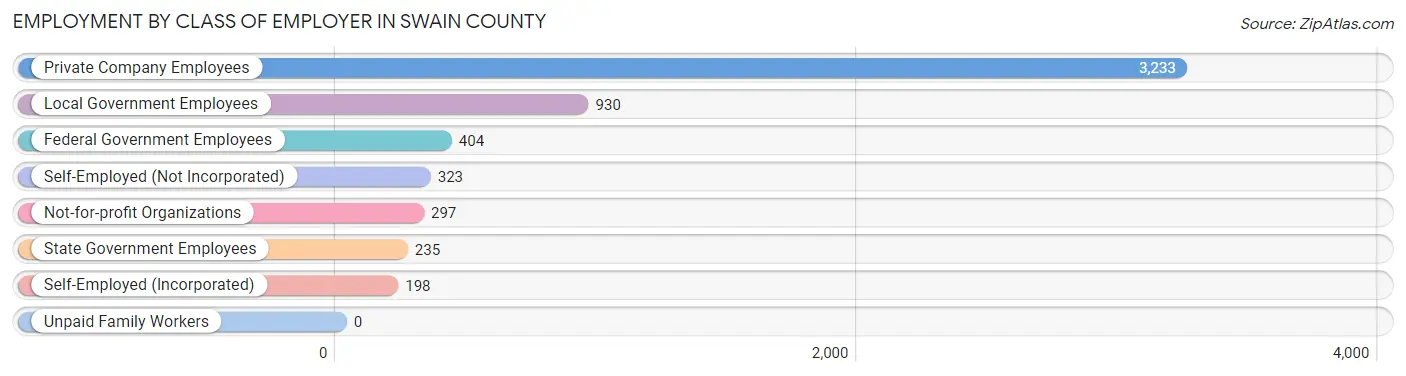
| Employer Class | # Employees | % Employees |
| Private Company Employees | 3,233 | 57.5% |
| Self-Employed (Incorporated) | 198 | 3.5% |
| Self-Employed (Not Incorporated) | 323 | 5.8% |
| Not-for-profit Organizations | 297 | 5.3% |
| Local Government Employees | 930 | 16.6% |
| State Government Employees | 235 | 4.2% |
| Federal Government Employees | 404 | 7.2% |
| Unpaid Family Workers | 0 | 0.0% |
| Total | 5,620 | 100.0% |
Employment Status by Age in Swain County
According to the labor force statistics for Swain County, out of the total population over 16 years of age (11,274), 55.2% or 6,223 individuals are in the labor force, with 7.5% or 467 of them unemployed. The age group with the highest labor force participation rate is 25 to 29 years, with 85.6% or 684 individuals in the labor force. Within the labor force, the 25 to 29 years age range has the highest percentage of unemployed individuals, with 23.1% or 158 of them being unemployed.
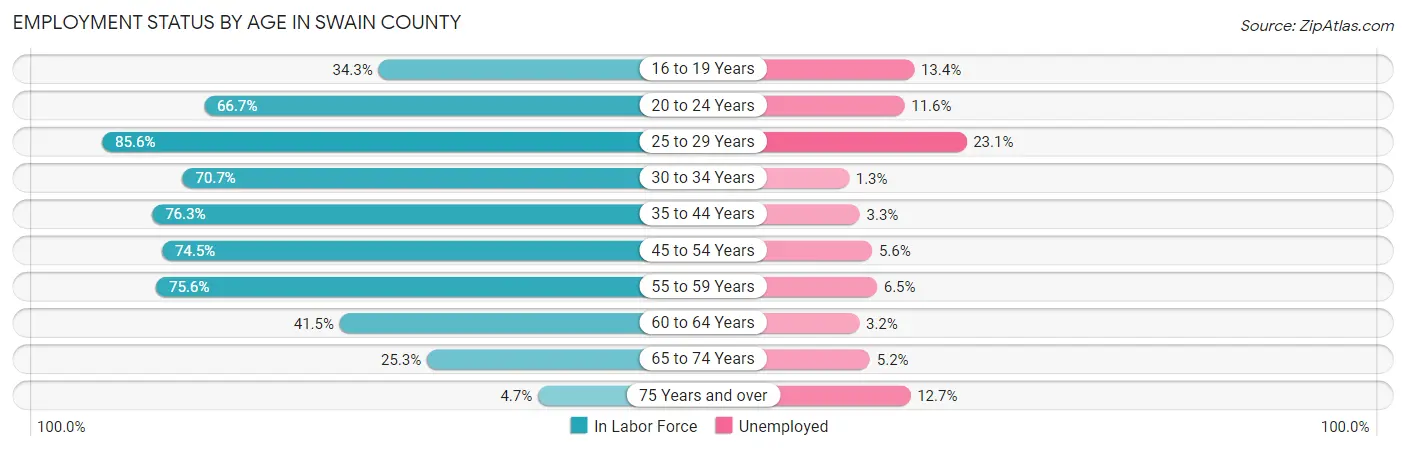
| Age Bracket | In Labor Force | Unemployed |
| 16 to 19 Years | 246 (34.3%) | 33 (13.4%) |
| 20 to 24 Years | 596 (66.7%) | 69 (11.6%) |
| 25 to 29 Years | 684 (85.6%) | 158 (23.1%) |
| 30 to 34 Years | 547 (70.7%) | 7 (1.3%) |
| 35 to 44 Years | 1,344 (76.3%) | 44 (3.3%) |
| 45 to 54 Years | 1,298 (74.5%) | 73 (5.6%) |
| 55 to 59 Years | 627 (75.6%) | 41 (6.5%) |
| 60 to 64 Years | 437 (41.5%) | 14 (3.2%) |
| 65 to 74 Years | 386 (25.3%) | 20 (5.2%) |
| 75 Years and over | 55 (4.7%) | 7 (12.7%) |
| Total | 6,223 (55.2%) | 467 (7.5%) |
Employment Status by Educational Attainment in Swain County
According to labor force statistics for Swain County, 71.0% of individuals (4,940) out of the total population between 25 and 64 years of age (6,958) are in the labor force, with 6.8% or 336 of them being unemployed. The group with the highest labor force participation rate are those with the educational attainment of bachelor's degree or higher, with 83.0% or 1,143 individuals in the labor force. Within the labor force, individuals with less than high school education have the highest percentage of unemployment, with 12.9% or 75 of them being unemployed.
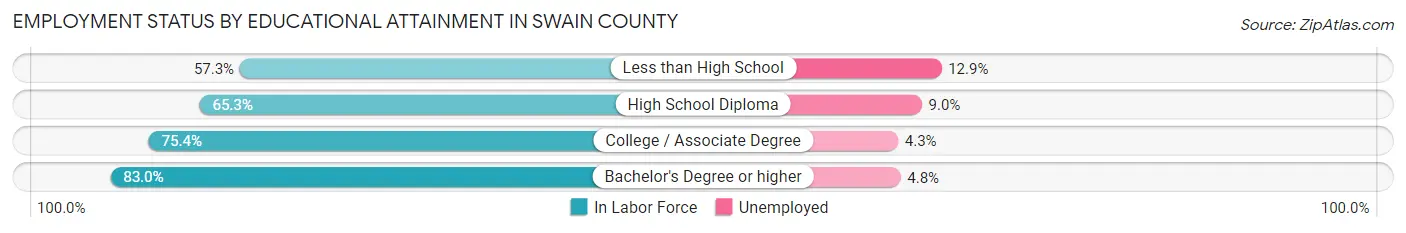
| Educational Attainment | In Labor Force | Unemployed |
| Less than High School | 581 (57.3%) | 131 (12.9%) |
| High School Diploma | 1,495 (65.3%) | 206 (9.0%) |
| College / Associate Degree | 1,718 (75.4%) | 98 (4.3%) |
| Bachelor's Degree or higher | 1,143 (83.0%) | 66 (4.8%) |
| Total | 4,940 (71.0%) | 473 (6.8%) |
Employment Occupations by Sex in Swain County
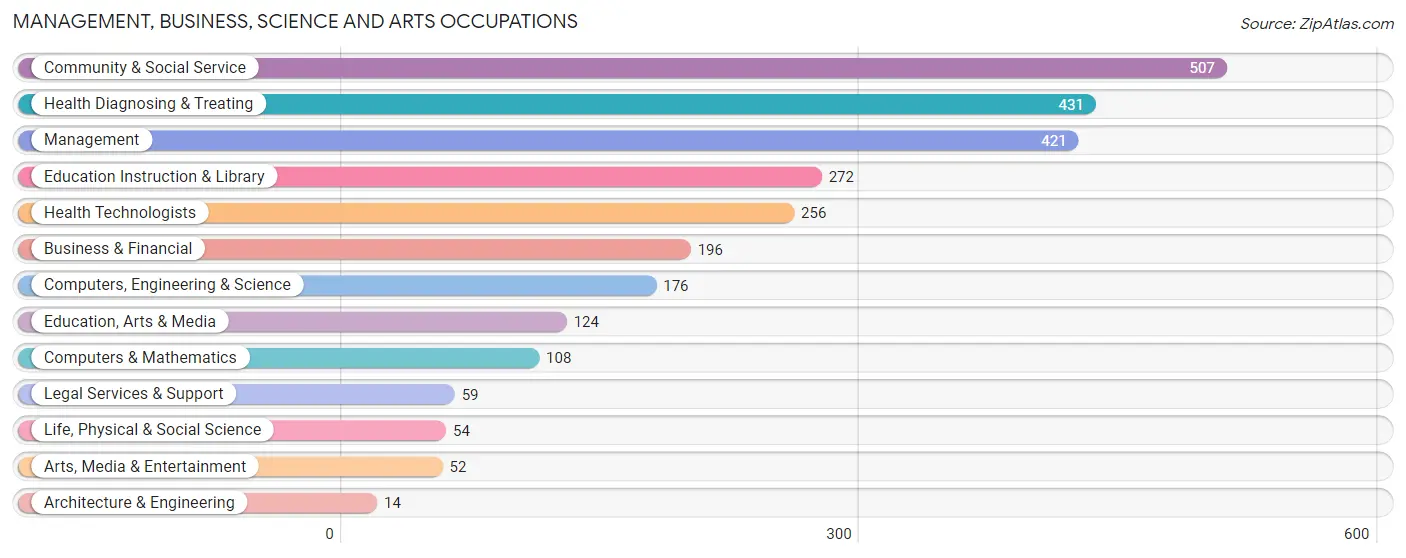
Management, Business, Science and Arts Occupations
The most common Management, Business, Science and Arts occupations in Swain County are Community & Social Service (507 | 8.8%), Health Diagnosing & Treating (431 | 7.5%), Management (421 | 7.3%), Education Instruction & Library (272 | 4.7%), and Health Technologists (256 | 4.4%).
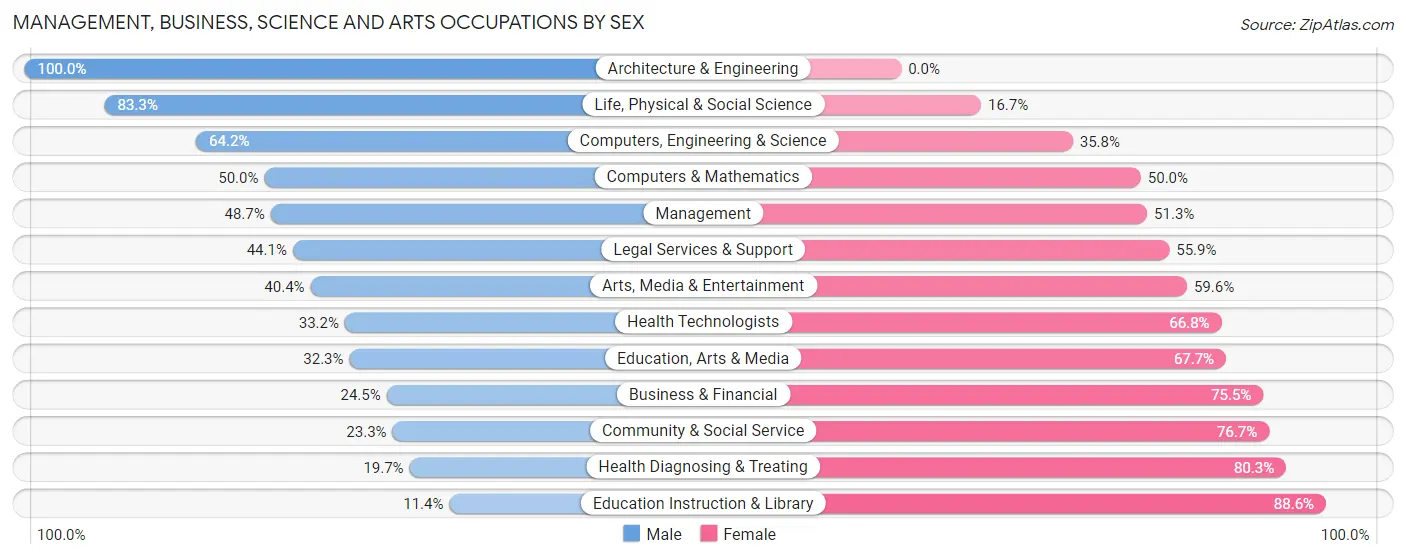
Management, Business, Science and Arts Occupations by Sex
Within the Management, Business, Science and Arts occupations in Swain County, the most male-oriented occupations are Architecture & Engineering (100.0%), Life, Physical & Social Science (83.3%), and Computers, Engineering & Science (64.2%), while the most female-oriented occupations are Education Instruction & Library (88.6%), Health Diagnosing & Treating (80.3%), and Community & Social Service (76.7%).
| Occupation | Male | Female |
| Management | 205 (48.7%) | 216 (51.3%) |
| Business & Financial | 48 (24.5%) | 148 (75.5%) |
| Computers, Engineering & Science | 113 (64.2%) | 63 (35.8%) |
| Computers & Mathematics | 54 (50.0%) | 54 (50.0%) |
| Architecture & Engineering | 14 (100.0%) | 0 (0.0%) |
| Life, Physical & Social Science | 45 (83.3%) | 9 (16.7%) |
| Community & Social Service | 118 (23.3%) | 389 (76.7%) |
| Education, Arts & Media | 40 (32.3%) | 84 (67.7%) |
| Legal Services & Support | 26 (44.1%) | 33 (55.9%) |
| Education Instruction & Library | 31 (11.4%) | 241 (88.6%) |
| Arts, Media & Entertainment | 21 (40.4%) | 31 (59.6%) |
| Health Diagnosing & Treating | 85 (19.7%) | 346 (80.3%) |
| Health Technologists | 85 (33.2%) | 171 (66.8%) |
| Total (Category) | 569 (32.9%) | 1,162 (67.1%) |
| Total (Overall) | 2,845 (49.4%) | 2,909 (50.6%) |
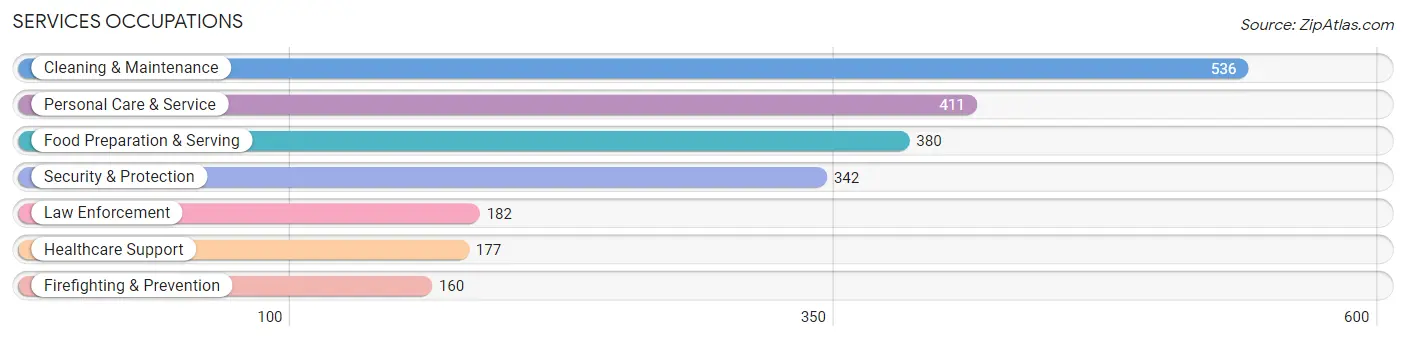
Services Occupations
The most common Services occupations in Swain County are Cleaning & Maintenance (536 | 9.3%), Personal Care & Service (411 | 7.1%), Food Preparation & Serving (380 | 6.6%), Security & Protection (342 | 5.9%), and Law Enforcement (182 | 3.2%).
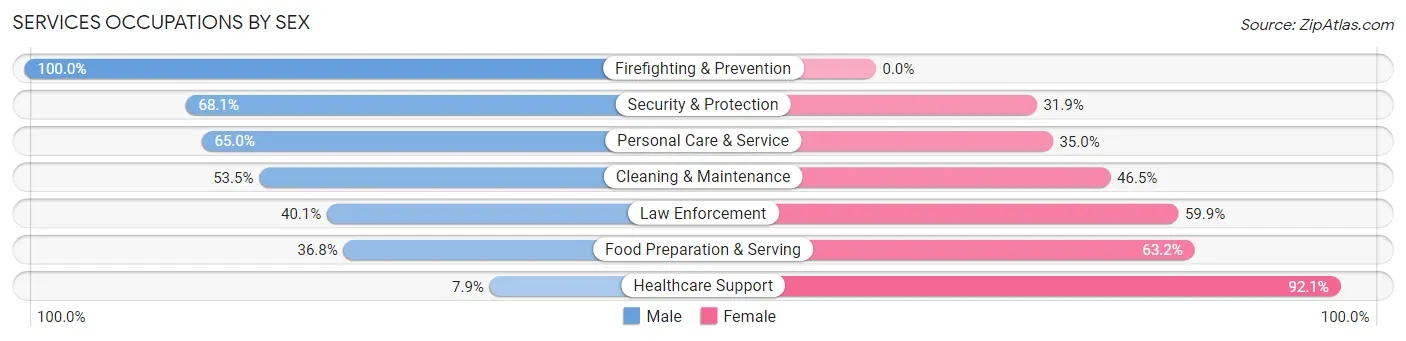
Services Occupations by Sex
Within the Services occupations in Swain County, the most male-oriented occupations are Firefighting & Prevention (100.0%), Security & Protection (68.1%), and Personal Care & Service (65.0%), while the most female-oriented occupations are Healthcare Support (92.1%), Food Preparation & Serving (63.2%), and Law Enforcement (59.9%).
| Occupation | Male | Female |
| Healthcare Support | 14 (7.9%) | 163 (92.1%) |
| Security & Protection | 233 (68.1%) | 109 (31.9%) |
| Firefighting & Prevention | 160 (100.0%) | 0 (0.0%) |
| Law Enforcement | 73 (40.1%) | 109 (59.9%) |
| Food Preparation & Serving | 140 (36.8%) | 240 (63.2%) |
| Cleaning & Maintenance | 287 (53.5%) | 249 (46.5%) |
| Personal Care & Service | 267 (65.0%) | 144 (35.0%) |
| Total (Category) | 941 (51.0%) | 905 (49.0%) |
| Total (Overall) | 2,845 (49.4%) | 2,909 (50.6%) |
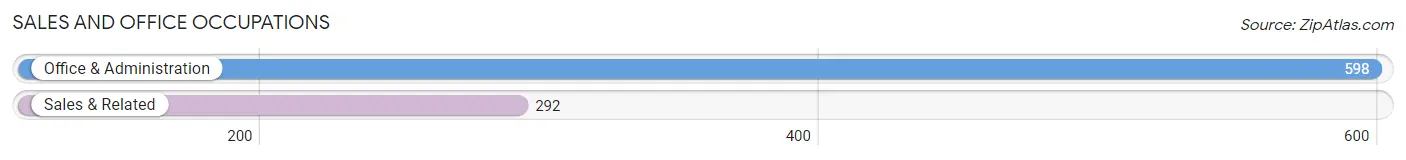
Sales and Office Occupations
The most common Sales and Office occupations in Swain County are Office & Administration (598 | 10.4%), and Sales & Related (292 | 5.1%).
Sales and Office Occupations by Sex
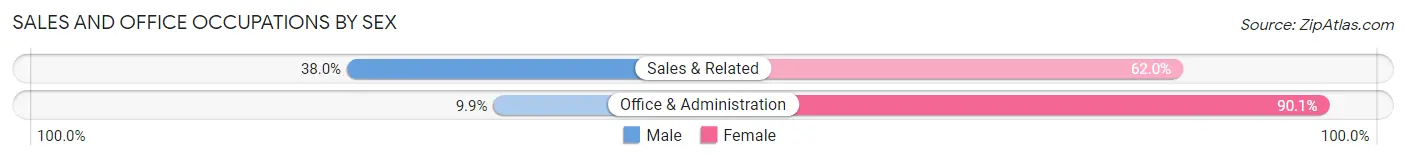
| Occupation | Male | Female |
| Sales & Related | 111 (38.0%) | 181 (62.0%) |
| Office & Administration | 59 (9.9%) | 539 (90.1%) |
| Total (Category) | 170 (19.1%) | 720 (80.9%) |
| Total (Overall) | 2,845 (49.4%) | 2,909 (50.6%) |
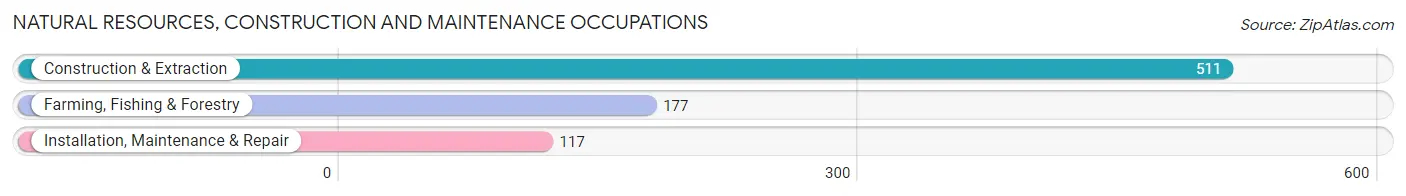
Natural Resources, Construction and Maintenance Occupations
The most common Natural Resources, Construction and Maintenance occupations in Swain County are Construction & Extraction (511 | 8.9%), Farming, Fishing & Forestry (177 | 3.1%), and Installation, Maintenance & Repair (117 | 2.0%).
Natural Resources, Construction and Maintenance Occupations by Sex
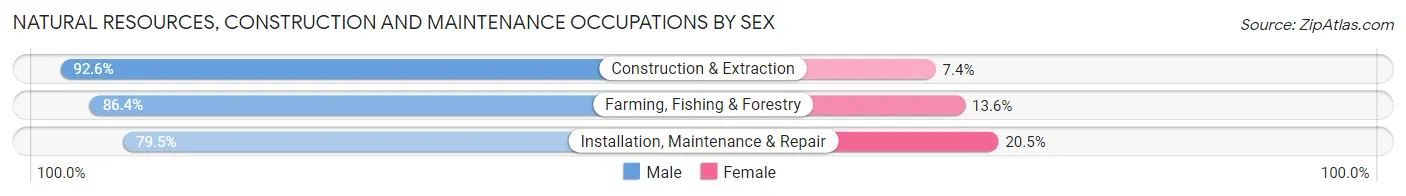
| Occupation | Male | Female |
| Farming, Fishing & Forestry | 153 (86.4%) | 24 (13.6%) |
| Construction & Extraction | 473 (92.6%) | 38 (7.4%) |
| Installation, Maintenance & Repair | 93 (79.5%) | 24 (20.5%) |
| Total (Category) | 719 (89.3%) | 86 (10.7%) |
| Total (Overall) | 2,845 (49.4%) | 2,909 (50.6%) |
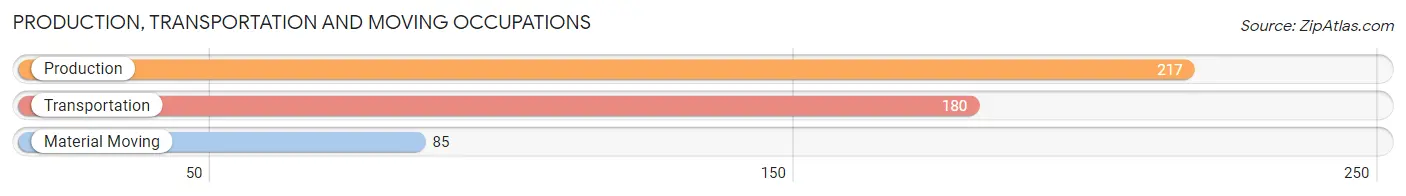
Production, Transportation and Moving Occupations
The most common Production, Transportation and Moving occupations in Swain County are Production (217 | 3.8%), Transportation (180 | 3.1%), and Material Moving (85 | 1.5%).
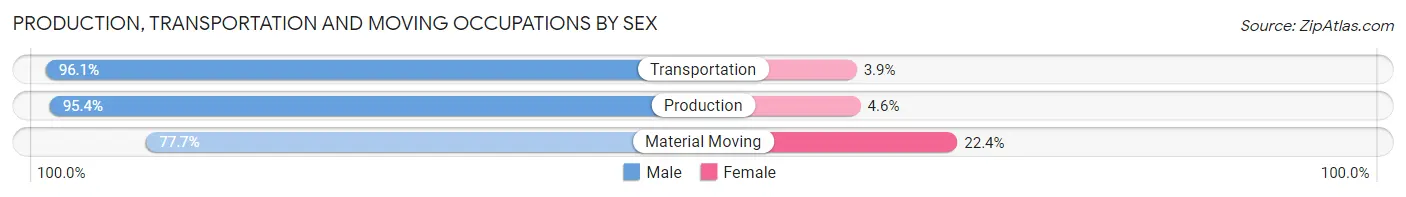
Production, Transportation and Moving Occupations by Sex
| Occupation | Male | Female |
| Production | 207 (95.4%) | 10 (4.6%) |
| Transportation | 173 (96.1%) | 7 (3.9%) |
| Material Moving | 66 (77.6%) | 19 (22.4%) |
| Total (Category) | 446 (92.5%) | 36 (7.5%) |
| Total (Overall) | 2,845 (49.4%) | 2,909 (50.6%) |
Employment Industries by Sex in Swain County
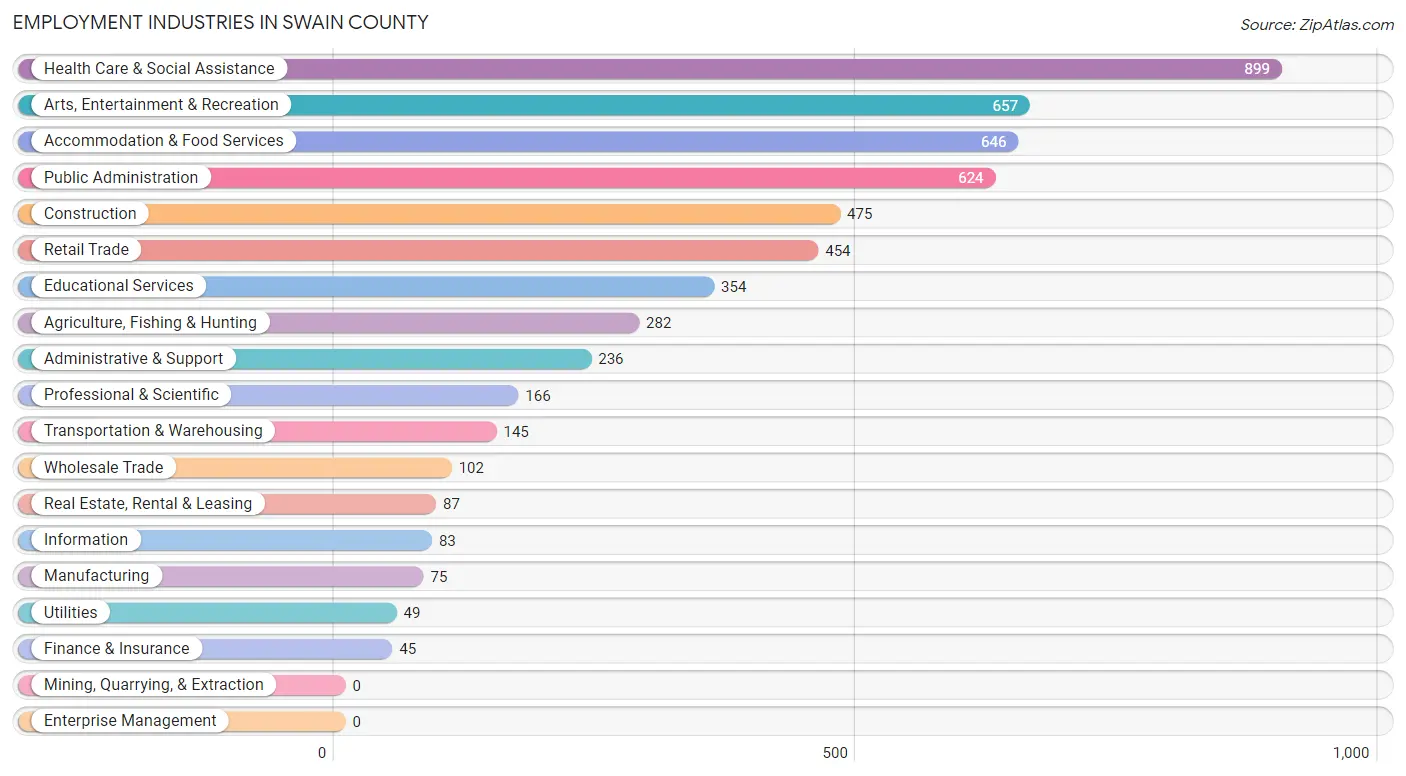
Employment Industries in Swain County
The major employment industries in Swain County include Health Care & Social Assistance (899 | 15.6%), Arts, Entertainment & Recreation (657 | 11.4%), Accommodation & Food Services (646 | 11.2%), Public Administration (624 | 10.8%), and Construction (475 | 8.3%).
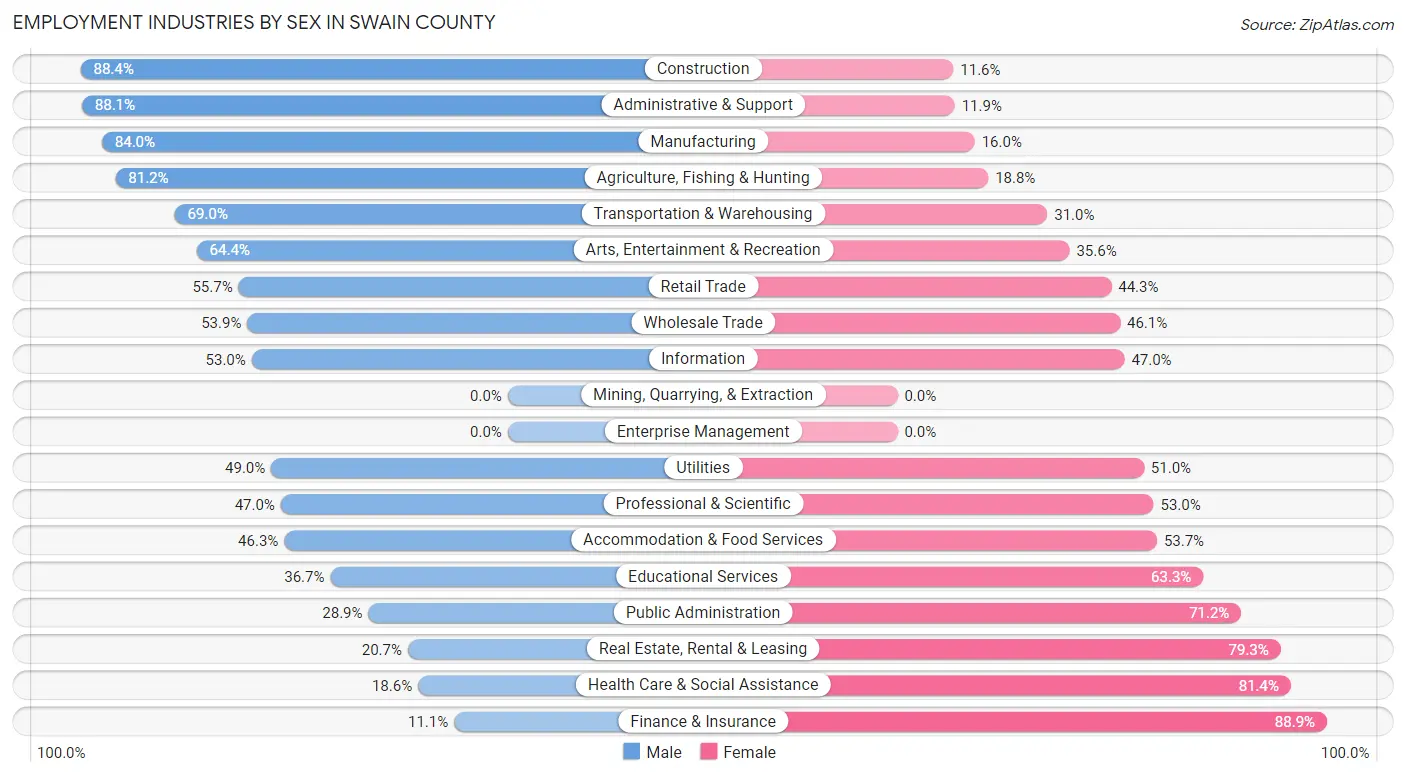
Employment Industries by Sex in Swain County
The Swain County industries that see more men than women are Construction (88.4%), Administrative & Support (88.1%), and Manufacturing (84.0%), whereas the industries that tend to have a higher number of women are Finance & Insurance (88.9%), Health Care & Social Assistance (81.4%), and Real Estate, Rental & Leasing (79.3%).
| Industry | Male | Female |
| Agriculture, Fishing & Hunting | 229 (81.2%) | 53 (18.8%) |
| Mining, Quarrying, & Extraction | 0 (0.0%) | 0 (0.0%) |
| Construction | 420 (88.4%) | 55 (11.6%) |
| Manufacturing | 63 (84.0%) | 12 (16.0%) |
| Wholesale Trade | 55 (53.9%) | 47 (46.1%) |
| Retail Trade | 253 (55.7%) | 201 (44.3%) |
| Transportation & Warehousing | 100 (69.0%) | 45 (31.0%) |
| Utilities | 24 (49.0%) | 25 (51.0%) |
| Information | 44 (53.0%) | 39 (47.0%) |
| Finance & Insurance | 5 (11.1%) | 40 (88.9%) |
| Real Estate, Rental & Leasing | 18 (20.7%) | 69 (79.3%) |
| Professional & Scientific | 78 (47.0%) | 88 (53.0%) |
| Enterprise Management | 0 (0.0%) | 0 (0.0%) |
| Administrative & Support | 208 (88.1%) | 28 (11.9%) |
| Educational Services | 130 (36.7%) | 224 (63.3%) |
| Health Care & Social Assistance | 167 (18.6%) | 732 (81.4%) |
| Arts, Entertainment & Recreation | 423 (64.4%) | 234 (35.6%) |
| Accommodation & Food Services | 299 (46.3%) | 347 (53.7%) |
| Public Administration | 180 (28.8%) | 444 (71.2%) |
| Total | 2,845 (49.4%) | 2,909 (50.6%) |
Education in Swain County
School Enrollment in Swain County
The most common levels of schooling among the 3,093 students in Swain County are middle school (810 | 26.2%), elementary school (808 | 26.1%), and high school (726 | 23.5%).
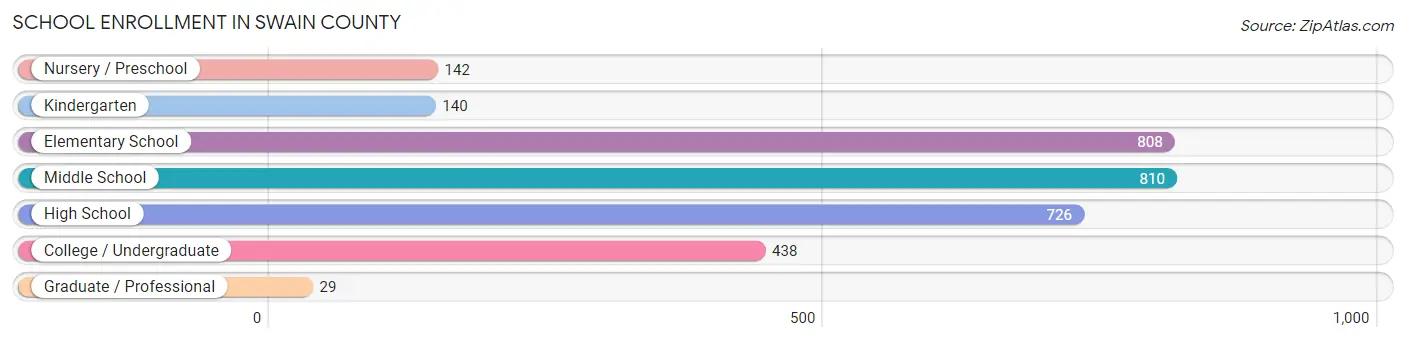
| School Level | # Students | % Students |
| Nursery / Preschool | 142 | 4.6% |
| Kindergarten | 140 | 4.5% |
| Elementary School | 808 | 26.1% |
| Middle School | 810 | 26.2% |
| High School | 726 | 23.5% |
| College / Undergraduate | 438 | 14.2% |
| Graduate / Professional | 29 | 0.9% |
| Total | 3,093 | 100.0% |
School Enrollment by Age by Funding Source in Swain County
Out of a total of 3,093 students who are enrolled in schools in Swain County, 223 (7.2%) attend a private institution, while the remaining 2,870 (92.8%) are enrolled in public schools. The age group of 35 years and over has the highest likelihood of being enrolled in private schools, with 36 (22.8% in the age bracket) enrolled. Conversely, the age group of 3 to 4 year olds has the lowest likelihood of being enrolled in a private school, with 111 (100.0% in the age bracket) attending a public institution.
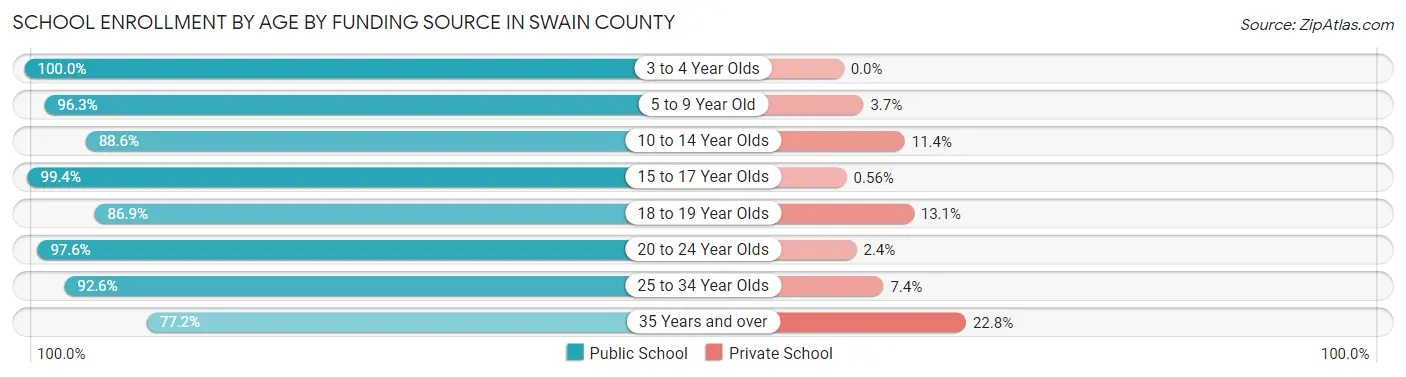
| Age Bracket | Public School | Private School |
| 3 to 4 Year Olds | 111 (100.0%) | 0 (0.0%) |
| 5 to 9 Year Old | 809 (96.3%) | 31 (3.7%) |
| 10 to 14 Year Olds | 879 (88.6%) | 113 (11.4%) |
| 15 to 17 Year Olds | 534 (99.4%) | 3 (0.6%) |
| 18 to 19 Year Olds | 193 (86.9%) | 29 (13.1%) |
| 20 to 24 Year Olds | 122 (97.6%) | 3 (2.4%) |
| 25 to 34 Year Olds | 100 (92.6%) | 8 (7.4%) |
| 35 Years and over | 122 (77.2%) | 36 (22.8%) |
| Total | 2,870 (92.8%) | 223 (7.2%) |
Educational Attainment by Field of Study in Swain County
Education (558 | 26.3%), business (330 | 15.5%), bio, nature & agricultural (202 | 9.5%), social sciences (167 | 7.9%), and science & technology (158 | 7.4%) are the most common fields of study among 2,126 individuals in Swain County who have obtained a bachelor's degree or higher.
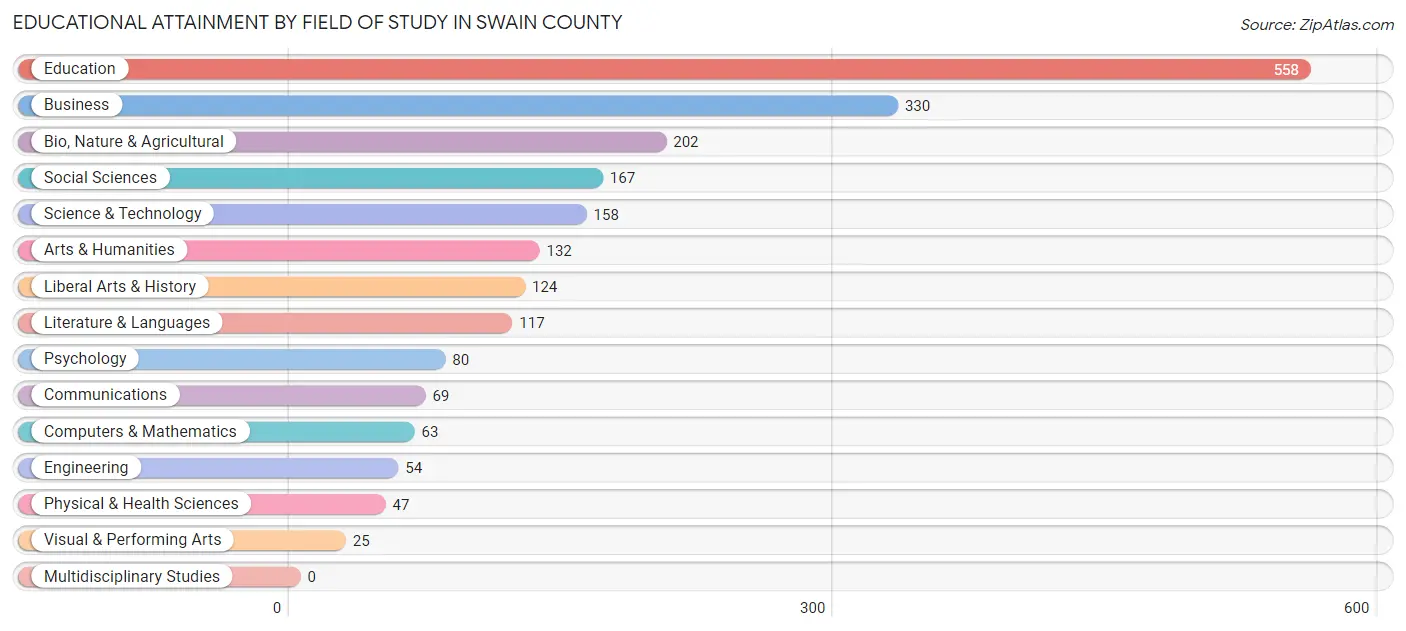
| Field of Study | # Graduates | % Graduates |
| Computers & Mathematics | 63 | 3.0% |
| Bio, Nature & Agricultural | 202 | 9.5% |
| Physical & Health Sciences | 47 | 2.2% |
| Psychology | 80 | 3.8% |
| Social Sciences | 167 | 7.9% |
| Engineering | 54 | 2.5% |
| Multidisciplinary Studies | 0 | 0.0% |
| Science & Technology | 158 | 7.4% |
| Business | 330 | 15.5% |
| Education | 558 | 26.3% |
| Literature & Languages | 117 | 5.5% |
| Liberal Arts & History | 124 | 5.8% |
| Visual & Performing Arts | 25 | 1.2% |
| Communications | 69 | 3.3% |
| Arts & Humanities | 132 | 6.2% |
| Total | 2,126 | 100.0% |
Transportation & Commute in Swain County
Vehicle Availability by Sex in Swain County
The most prevalent vehicle ownership categories in Swain County are males with 2 vehicles (909, accounting for 33.6%) and females with 2 vehicles (1,055, making up 31.8%).
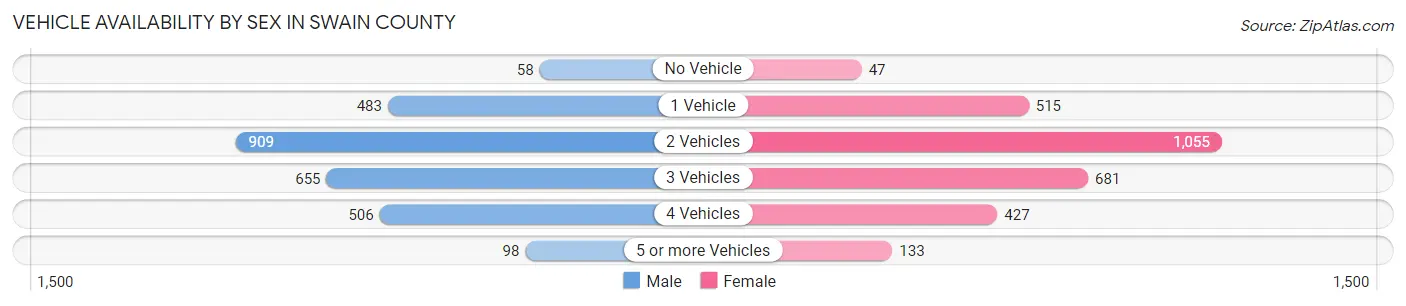
| Vehicles Available | Male | Female |
| No Vehicle | 58 (2.1%) | 47 (1.6%) |
| 1 Vehicle | 483 (17.8%) | 515 (18.0%) |
| 2 Vehicles | 909 (33.6%) | 1,055 (36.9%) |
| 3 Vehicles | 655 (24.2%) | 681 (23.8%) |
| 4 Vehicles | 506 (18.7%) | 427 (14.9%) |
| 5 or more Vehicles | 98 (3.6%) | 133 (4.6%) |
| Total | 2,709 (100.0%) | 2,858 (100.0%) |
Commute Time in Swain County
The most frequently occuring commute durations in Swain County are 20 to 24 minutes (1,008 commuters, 19.4%), 10 to 14 minutes (911 commuters, 17.5%), and 5 to 9 minutes (907 commuters, 17.4%).
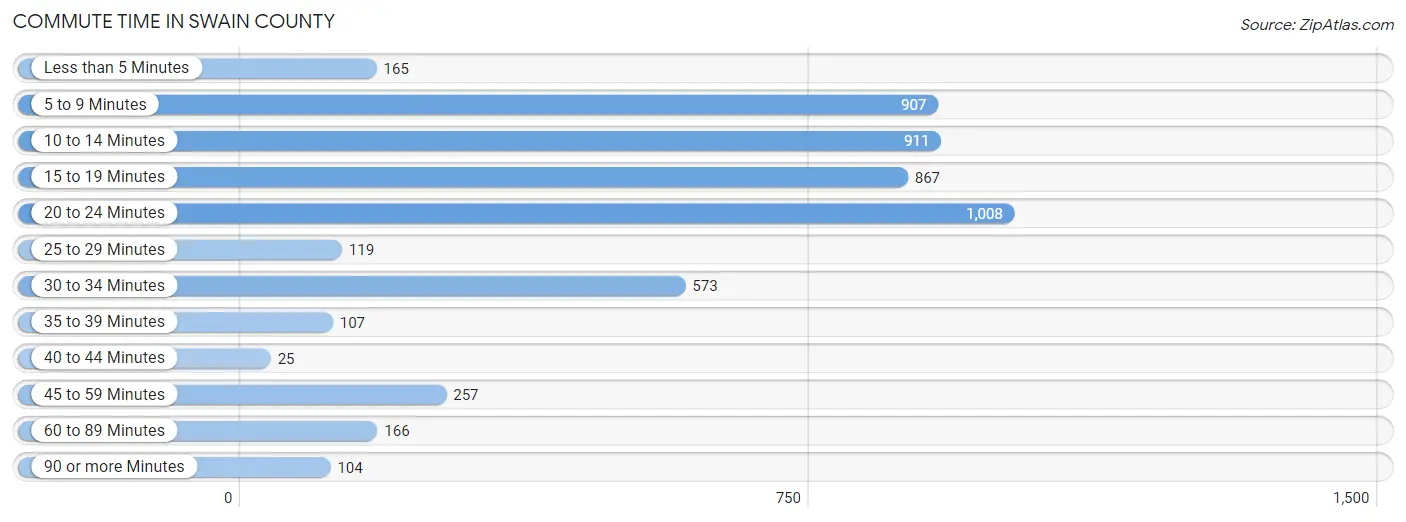
| Commute Time | # Commuters | % Commuters |
| Less than 5 Minutes | 165 | 3.2% |
| 5 to 9 Minutes | 907 | 17.4% |
| 10 to 14 Minutes | 911 | 17.5% |
| 15 to 19 Minutes | 867 | 16.6% |
| 20 to 24 Minutes | 1,008 | 19.4% |
| 25 to 29 Minutes | 119 | 2.3% |
| 30 to 34 Minutes | 573 | 11.0% |
| 35 to 39 Minutes | 107 | 2.1% |
| 40 to 44 Minutes | 25 | 0.5% |
| 45 to 59 Minutes | 257 | 4.9% |
| 60 to 89 Minutes | 166 | 3.2% |
| 90 or more Minutes | 104 | 2.0% |
Commute Time by Sex in Swain County
The most common commute times in Swain County are 20 to 24 minutes (462 commuters, 18.5%) for males and 20 to 24 minutes (546 commuters, 20.2%) for females.
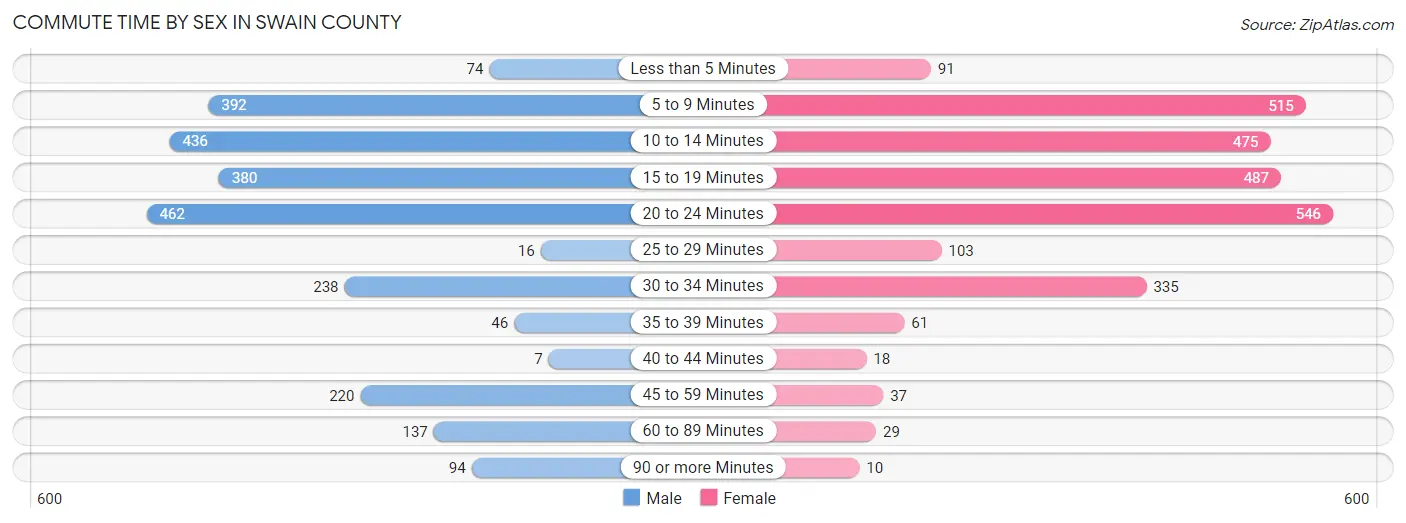
| Commute Time | Male | Female |
| Less than 5 Minutes | 74 (3.0%) | 91 (3.4%) |
| 5 to 9 Minutes | 392 (15.7%) | 515 (19.0%) |
| 10 to 14 Minutes | 436 (17.4%) | 475 (17.5%) |
| 15 to 19 Minutes | 380 (15.2%) | 487 (18.0%) |
| 20 to 24 Minutes | 462 (18.5%) | 546 (20.2%) |
| 25 to 29 Minutes | 16 (0.6%) | 103 (3.8%) |
| 30 to 34 Minutes | 238 (9.5%) | 335 (12.4%) |
| 35 to 39 Minutes | 46 (1.8%) | 61 (2.2%) |
| 40 to 44 Minutes | 7 (0.3%) | 18 (0.7%) |
| 45 to 59 Minutes | 220 (8.8%) | 37 (1.4%) |
| 60 to 89 Minutes | 137 (5.5%) | 29 (1.1%) |
| 90 or more Minutes | 94 (3.8%) | 10 (0.4%) |
Time of Departure to Work by Sex in Swain County
The most frequent times of departure to work in Swain County are 7:00 AM to 7:29 AM (392, 15.7%) for males and 7:00 AM to 7:29 AM (694, 25.6%) for females.
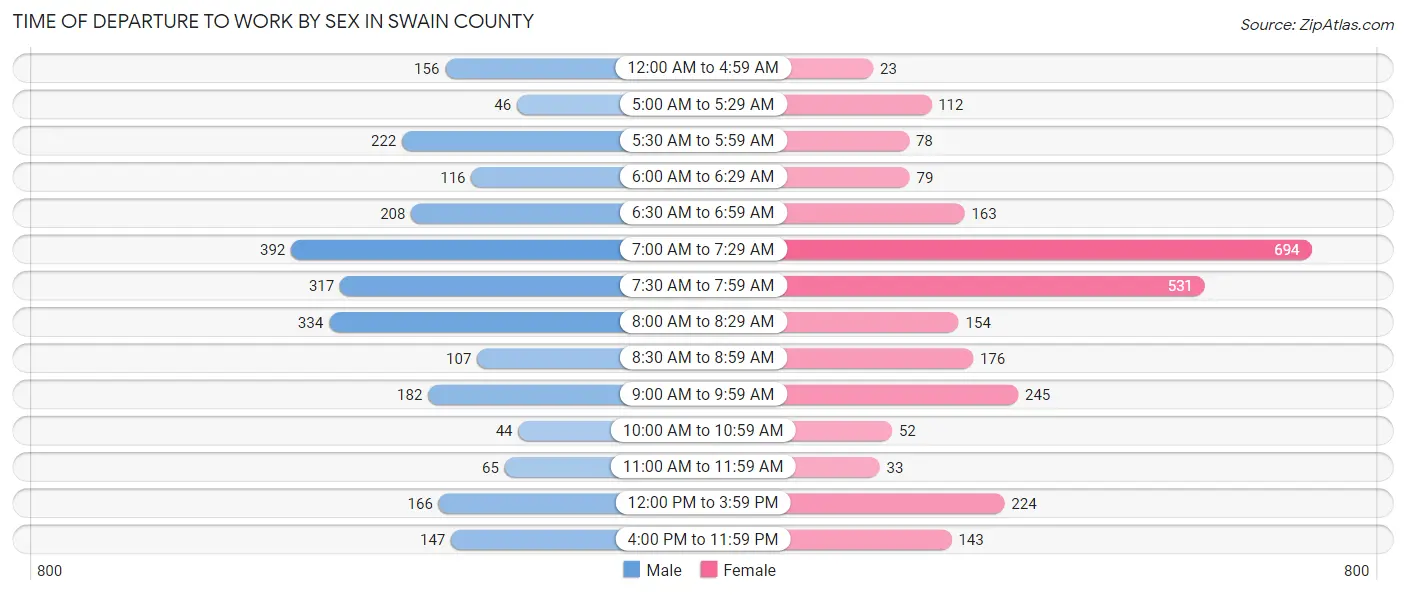
| Time of Departure | Male | Female |
| 12:00 AM to 4:59 AM | 156 (6.2%) | 23 (0.9%) |
| 5:00 AM to 5:29 AM | 46 (1.8%) | 112 (4.1%) |
| 5:30 AM to 5:59 AM | 222 (8.9%) | 78 (2.9%) |
| 6:00 AM to 6:29 AM | 116 (4.6%) | 79 (2.9%) |
| 6:30 AM to 6:59 AM | 208 (8.3%) | 163 (6.0%) |
| 7:00 AM to 7:29 AM | 392 (15.7%) | 694 (25.6%) |
| 7:30 AM to 7:59 AM | 317 (12.7%) | 531 (19.6%) |
| 8:00 AM to 8:29 AM | 334 (13.4%) | 154 (5.7%) |
| 8:30 AM to 8:59 AM | 107 (4.3%) | 176 (6.5%) |
| 9:00 AM to 9:59 AM | 182 (7.3%) | 245 (9.0%) |
| 10:00 AM to 10:59 AM | 44 (1.8%) | 52 (1.9%) |
| 11:00 AM to 11:59 AM | 65 (2.6%) | 33 (1.2%) |
| 12:00 PM to 3:59 PM | 166 (6.6%) | 224 (8.3%) |
| 4:00 PM to 11:59 PM | 147 (5.9%) | 143 (5.3%) |
| Total | 2,502 (100.0%) | 2,707 (100.0%) |
Housing Occupancy in Swain County
Occupancy by Ownership in Swain County
Of the total 5,684 dwellings in Swain County, owner-occupied units account for 4,135 (72.8%), while renter-occupied units make up 1,549 (27.3%).
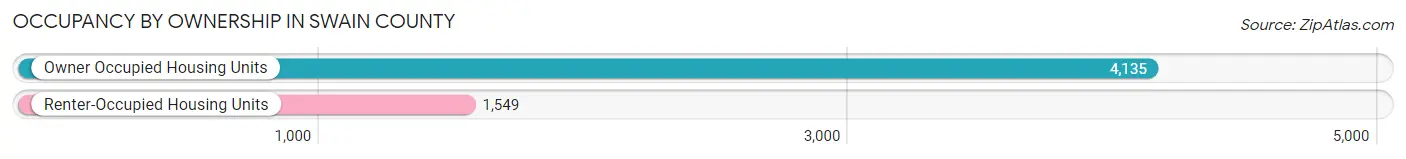
| Occupancy | # Housing Units | % Housing Units |
| Owner Occupied Housing Units | 4,135 | 72.8% |
| Renter-Occupied Housing Units | 1,549 | 27.3% |
| Total Occupied Housing Units | 5,684 | 100.0% |
Occupancy by Household Size in Swain County
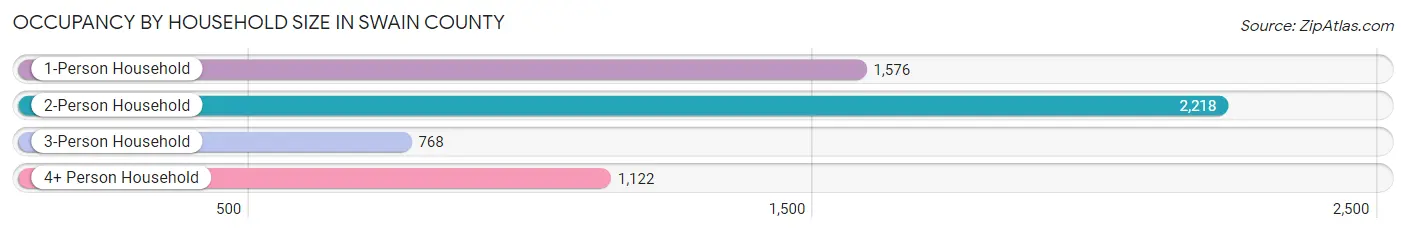
| Household Size | # Housing Units | % Housing Units |
| 1-Person Household | 1,576 | 27.7% |
| 2-Person Household | 2,218 | 39.0% |
| 3-Person Household | 768 | 13.5% |
| 4+ Person Household | 1,122 | 19.7% |
| Total Housing Units | 5,684 | 100.0% |
Occupancy by Ownership by Household Size in Swain County
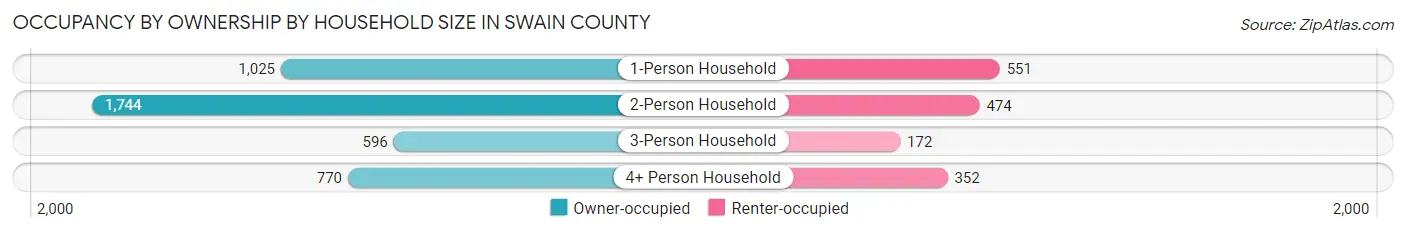
| Household Size | Owner-occupied | Renter-occupied |
| 1-Person Household | 1,025 (65.0%) | 551 (35.0%) |
| 2-Person Household | 1,744 (78.6%) | 474 (21.4%) |
| 3-Person Household | 596 (77.6%) | 172 (22.4%) |
| 4+ Person Household | 770 (68.6%) | 352 (31.4%) |
| Total Housing Units | 4,135 (72.8%) | 1,549 (27.3%) |
Occupancy by Educational Attainment in Swain County
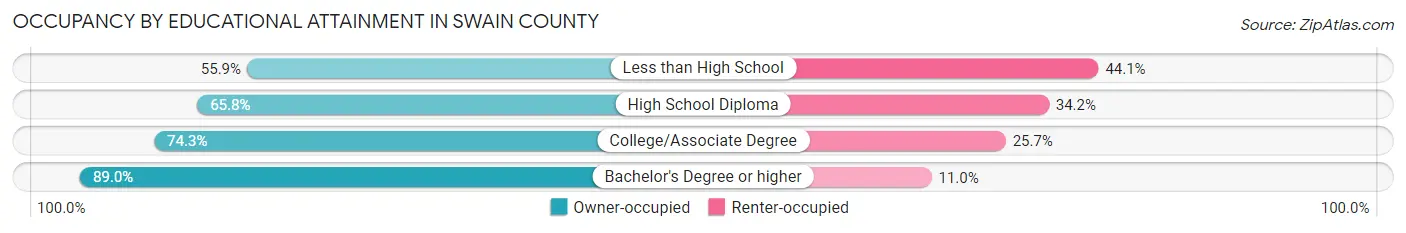
| Household Size | Owner-occupied | Renter-occupied |
| Less than High School | 382 (55.9%) | 301 (44.1%) |
| High School Diploma | 1,153 (65.8%) | 600 (34.2%) |
| College/Associate Degree | 1,473 (74.3%) | 509 (25.7%) |
| Bachelor's Degree or higher | 1,127 (89.0%) | 139 (11.0%) |
Occupancy by Age of Householder in Swain County
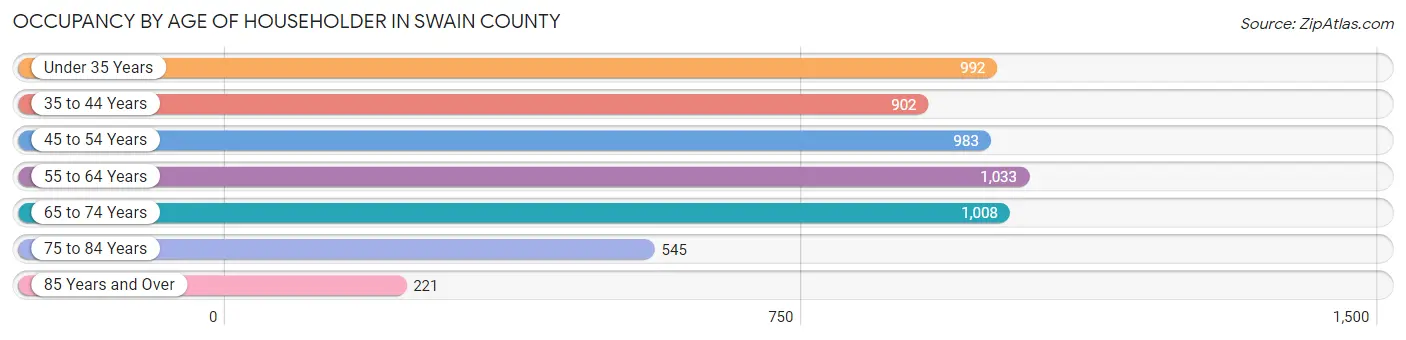
| Age Bracket | # Households | % Households |
| Under 35 Years | 992 | 17.4% |
| 35 to 44 Years | 902 | 15.9% |
| 45 to 54 Years | 983 | 17.3% |
| 55 to 64 Years | 1,033 | 18.2% |
| 65 to 74 Years | 1,008 | 17.7% |
| 75 to 84 Years | 545 | 9.6% |
| 85 Years and Over | 221 | 3.9% |
| Total | 5,684 | 100.0% |
Housing Finances in Swain County
Median Income by Occupancy in Swain County
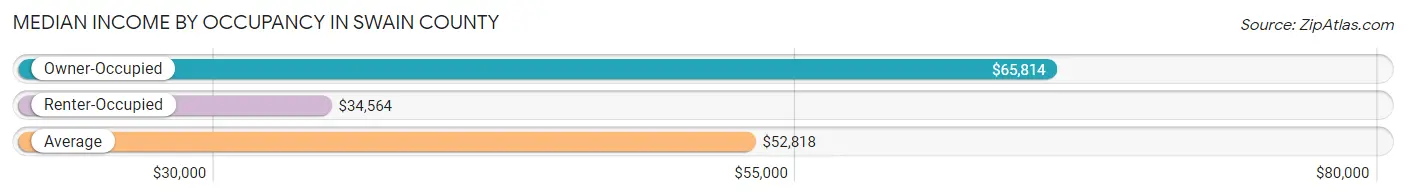
| Occupancy Type | # Households | Median Income |
| Owner-Occupied | 4,135 (72.8%) | $65,814 |
| Renter-Occupied | 1,549 (27.3%) | $34,564 |
| Average | 5,684 (100.0%) | $52,818 |
Occupancy by Householder Income Bracket in Swain County
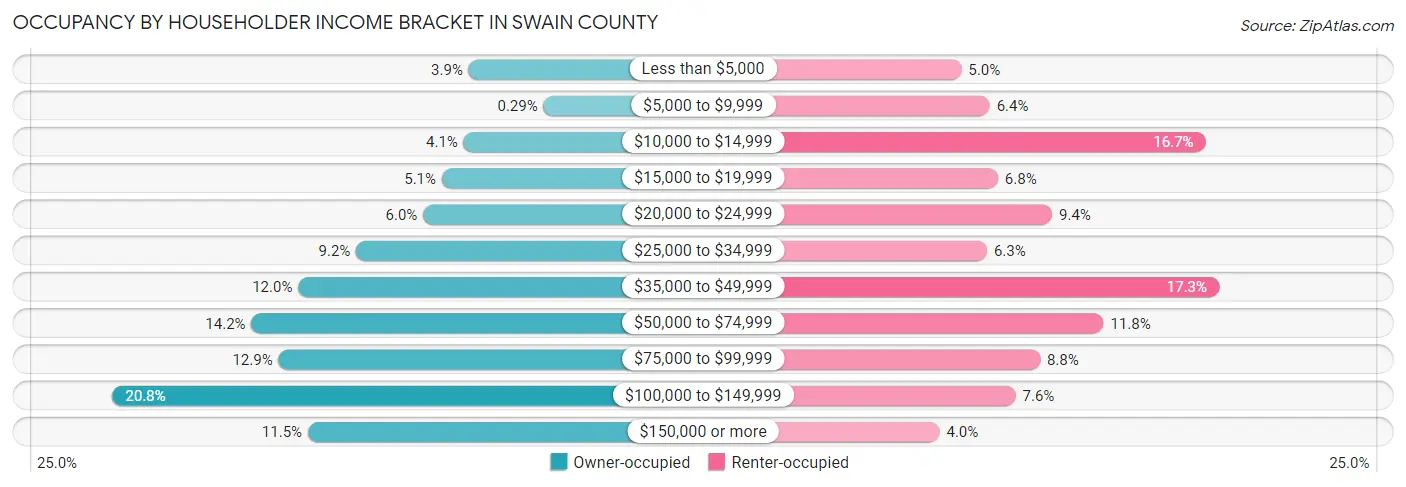
| Income Bracket | Owner-occupied | Renter-occupied |
| Less than $5,000 | 159 (3.8%) | 78 (5.0%) |
| $5,000 to $9,999 | 12 (0.3%) | 99 (6.4%) |
| $10,000 to $14,999 | 169 (4.1%) | 258 (16.7%) |
| $15,000 to $19,999 | 212 (5.1%) | 105 (6.8%) |
| $20,000 to $24,999 | 249 (6.0%) | 145 (9.4%) |
| $25,000 to $34,999 | 381 (9.2%) | 97 (6.3%) |
| $35,000 to $49,999 | 495 (12.0%) | 268 (17.3%) |
| $50,000 to $74,999 | 587 (14.2%) | 183 (11.8%) |
| $75,000 to $99,999 | 534 (12.9%) | 136 (8.8%) |
| $100,000 to $149,999 | 861 (20.8%) | 118 (7.6%) |
| $150,000 or more | 476 (11.5%) | 62 (4.0%) |
| Total | 4,135 (100.0%) | 1,549 (100.0%) |
Monthly Housing Cost Tiers in Swain County
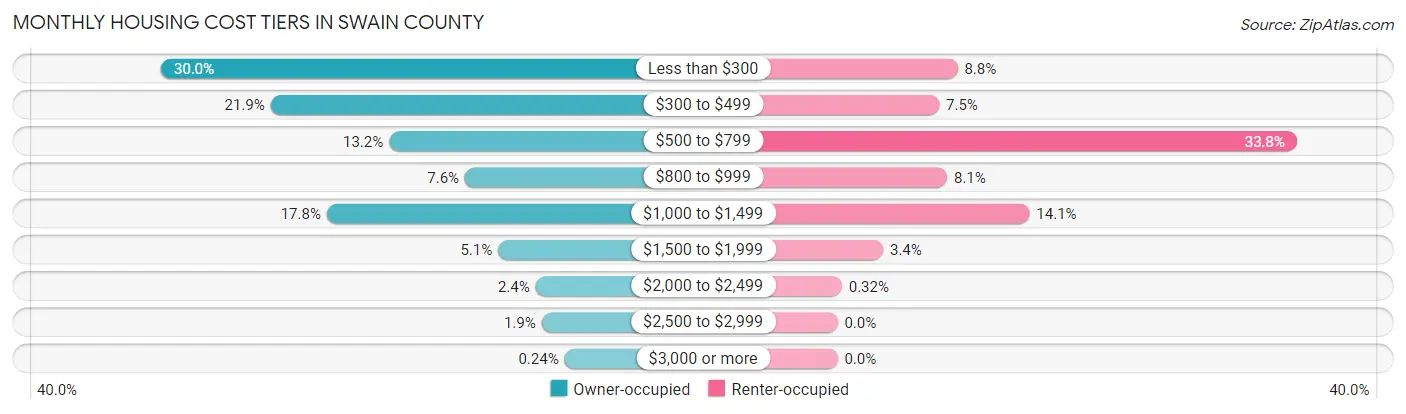
| Monthly Cost | Owner-occupied | Renter-occupied |
| Less than $300 | 1,239 (30.0%) | 137 (8.8%) |
| $300 to $499 | 905 (21.9%) | 116 (7.5%) |
| $500 to $799 | 544 (13.2%) | 524 (33.8%) |
| $800 to $999 | 313 (7.6%) | 125 (8.1%) |
| $1,000 to $1,499 | 734 (17.7%) | 219 (14.1%) |
| $1,500 to $1,999 | 212 (5.1%) | 52 (3.4%) |
| $2,000 to $2,499 | 98 (2.4%) | 5 (0.3%) |
| $2,500 to $2,999 | 80 (1.9%) | 0 (0.0%) |
| $3,000 or more | 10 (0.2%) | 0 (0.0%) |
| Total | 4,135 (100.0%) | 1,549 (100.0%) |
Physical Housing Characteristics in Swain County
Housing Structures in Swain County
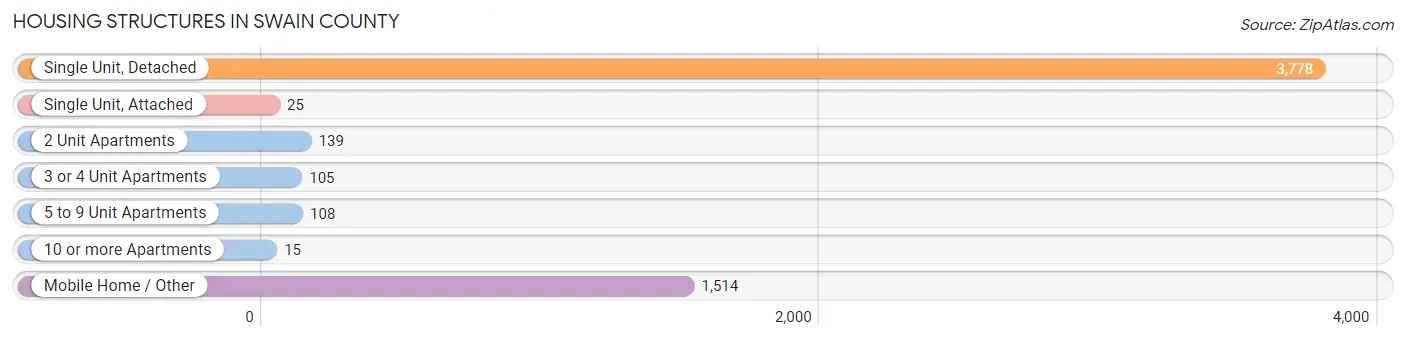
| Structure Type | # Housing Units | % Housing Units |
| Single Unit, Detached | 3,778 | 66.5% |
| Single Unit, Attached | 25 | 0.4% |
| 2 Unit Apartments | 139 | 2.5% |
| 3 or 4 Unit Apartments | 105 | 1.8% |
| 5 to 9 Unit Apartments | 108 | 1.9% |
| 10 or more Apartments | 15 | 0.3% |
| Mobile Home / Other | 1,514 | 26.6% |
| Total | 5,684 | 100.0% |
Housing Structures by Occupancy in Swain County
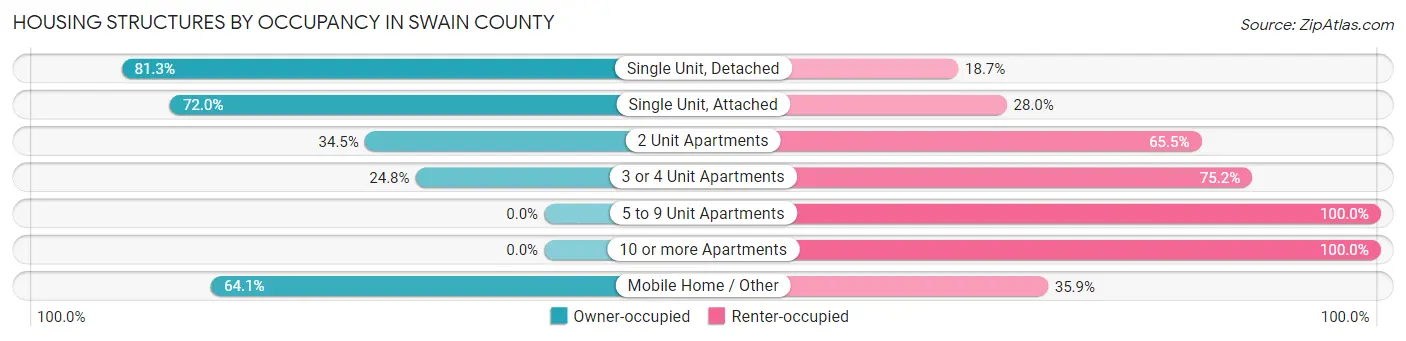
| Structure Type | Owner-occupied | Renter-occupied |
| Single Unit, Detached | 3,073 (81.3%) | 705 (18.7%) |
| Single Unit, Attached | 18 (72.0%) | 7 (28.0%) |
| 2 Unit Apartments | 48 (34.5%) | 91 (65.5%) |
| 3 or 4 Unit Apartments | 26 (24.8%) | 79 (75.2%) |
| 5 to 9 Unit Apartments | 0 (0.0%) | 108 (100.0%) |
| 10 or more Apartments | 0 (0.0%) | 15 (100.0%) |
| Mobile Home / Other | 970 (64.1%) | 544 (35.9%) |
| Total | 4,135 (72.8%) | 1,549 (27.3%) |
Housing Structures by Number of Rooms in Swain County
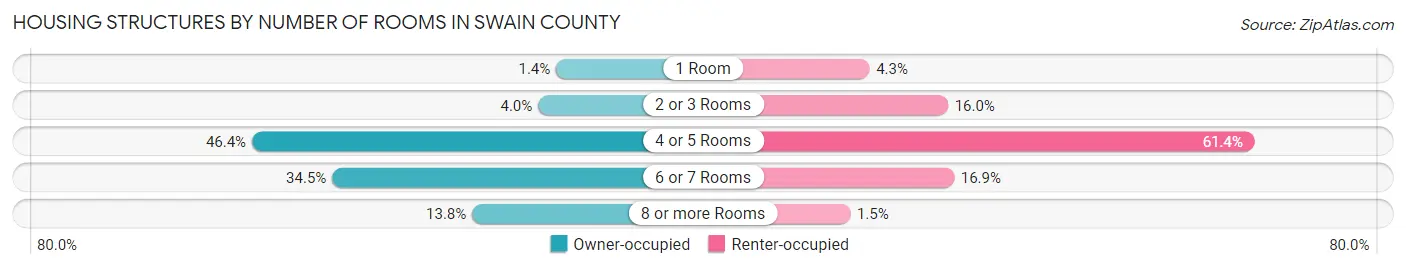
| Number of Rooms | Owner-occupied | Renter-occupied |
| 1 Room | 56 (1.3%) | 67 (4.3%) |
| 2 or 3 Rooms | 166 (4.0%) | 247 (16.0%) |
| 4 or 5 Rooms | 1,917 (46.4%) | 951 (61.4%) |
| 6 or 7 Rooms | 1,426 (34.5%) | 261 (16.9%) |
| 8 or more Rooms | 570 (13.8%) | 23 (1.5%) |
| Total | 4,135 (100.0%) | 1,549 (100.0%) |
Housing Structure by Heating Type in Swain County
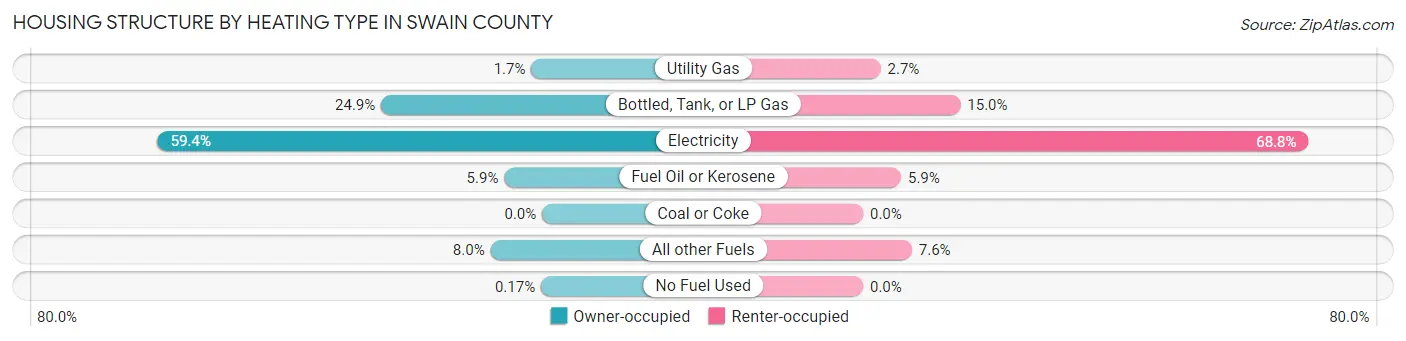
| Heating Type | Owner-occupied | Renter-occupied |
| Utility Gas | 69 (1.7%) | 42 (2.7%) |
| Bottled, Tank, or LP Gas | 1,029 (24.9%) | 233 (15.0%) |
| Electricity | 2,458 (59.4%) | 1,066 (68.8%) |
| Fuel Oil or Kerosene | 242 (5.9%) | 91 (5.9%) |
| Coal or Coke | 0 (0.0%) | 0 (0.0%) |
| All other Fuels | 330 (8.0%) | 117 (7.5%) |
| No Fuel Used | 7 (0.2%) | 0 (0.0%) |
| Total | 4,135 (100.0%) | 1,549 (100.0%) |
Household Vehicle Usage in Swain County
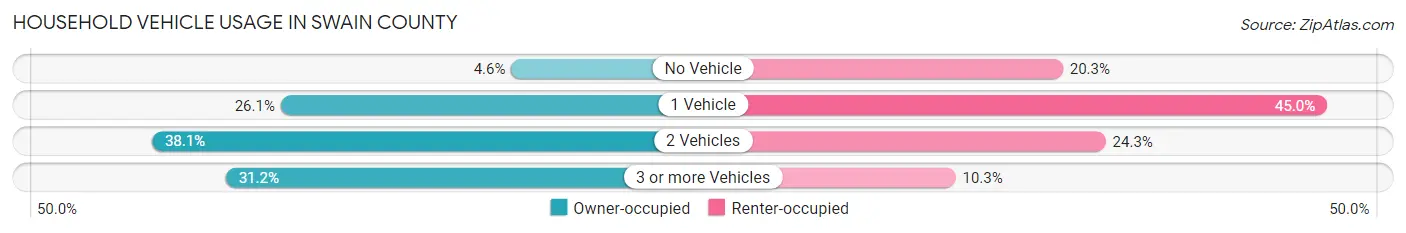
| Vehicles per Household | Owner-occupied | Renter-occupied |
| No Vehicle | 189 (4.6%) | 315 (20.3%) |
| 1 Vehicle | 1,079 (26.1%) | 697 (45.0%) |
| 2 Vehicles | 1,576 (38.1%) | 377 (24.3%) |
| 3 or more Vehicles | 1,291 (31.2%) | 160 (10.3%) |
| Total | 4,135 (100.0%) | 1,549 (100.0%) |
Real Estate & Mortgages in Swain County
Real Estate and Mortgage Overview in Swain County
| Characteristic | Without Mortgage | With Mortgage |
| Housing Units | 2,485 | 1,650 |
| Median Property Value | $153,700 | $222,800 |
| Median Household Income | $49,789 | $343 |
| Monthly Housing Costs | $303 | $10 |
| Real Estate Taxes | $833 | $249 |
Property Value by Mortgage Status in Swain County
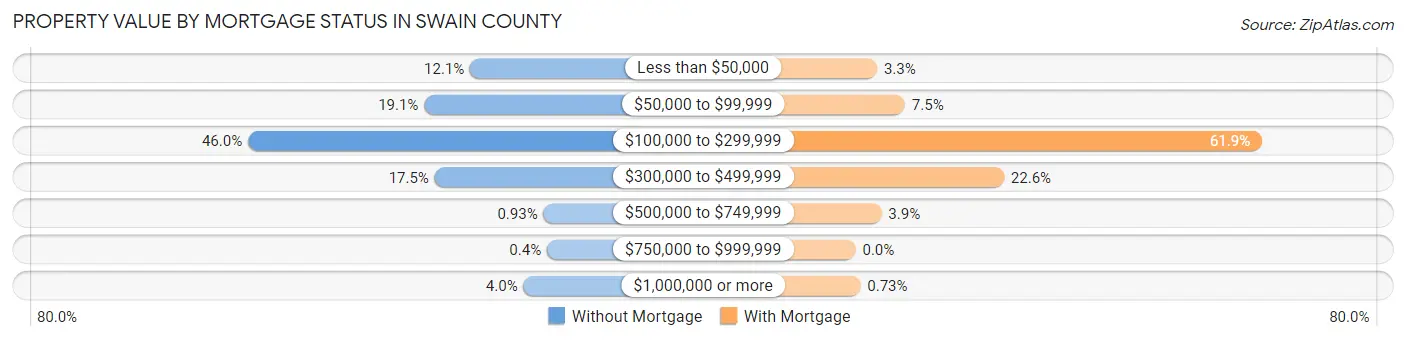
| Property Value | Without Mortgage | With Mortgage |
| Less than $50,000 | 301 (12.1%) | 54 (3.3%) |
| $50,000 to $99,999 | 475 (19.1%) | 124 (7.5%) |
| $100,000 to $299,999 | 1,142 (46.0%) | 1,022 (61.9%) |
| $300,000 to $499,999 | 435 (17.5%) | 373 (22.6%) |
| $500,000 to $749,999 | 23 (0.9%) | 65 (3.9%) |
| $750,000 to $999,999 | 10 (0.4%) | 0 (0.0%) |
| $1,000,000 or more | 99 (4.0%) | 12 (0.7%) |
| Total | 2,485 (100.0%) | 1,650 (100.0%) |
Household Income by Mortgage Status in Swain County
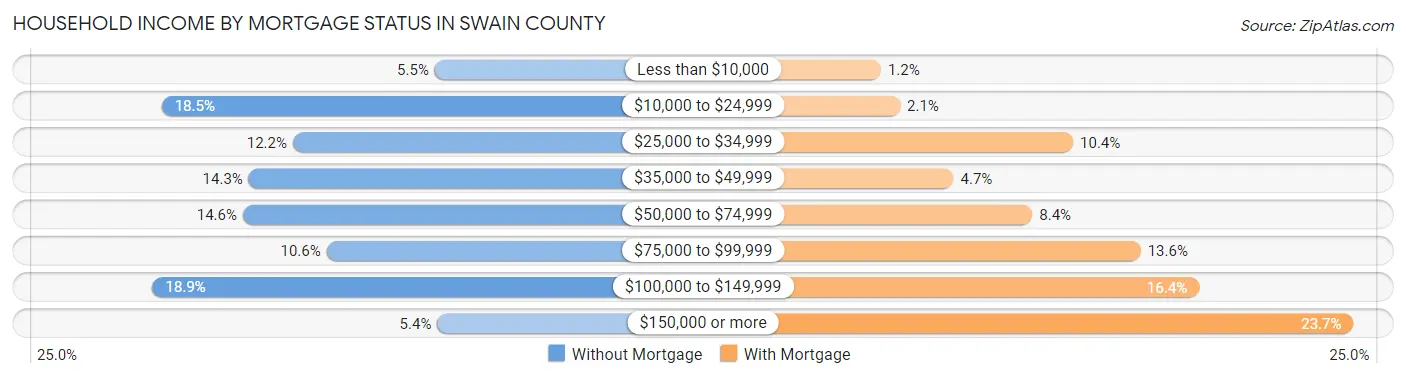
| Household Income | Without Mortgage | With Mortgage |
| Less than $10,000 | 136 (5.5%) | 20 (1.2%) |
| $10,000 to $24,999 | 459 (18.5%) | 35 (2.1%) |
| $25,000 to $34,999 | 304 (12.2%) | 171 (10.4%) |
| $35,000 to $49,999 | 356 (14.3%) | 77 (4.7%) |
| $50,000 to $74,999 | 363 (14.6%) | 139 (8.4%) |
| $75,000 to $99,999 | 264 (10.6%) | 224 (13.6%) |
| $100,000 to $149,999 | 470 (18.9%) | 270 (16.4%) |
| $150,000 or more | 133 (5.3%) | 391 (23.7%) |
| Total | 2,485 (100.0%) | 1,650 (100.0%) |
Property Value to Household Income Ratio in Swain County
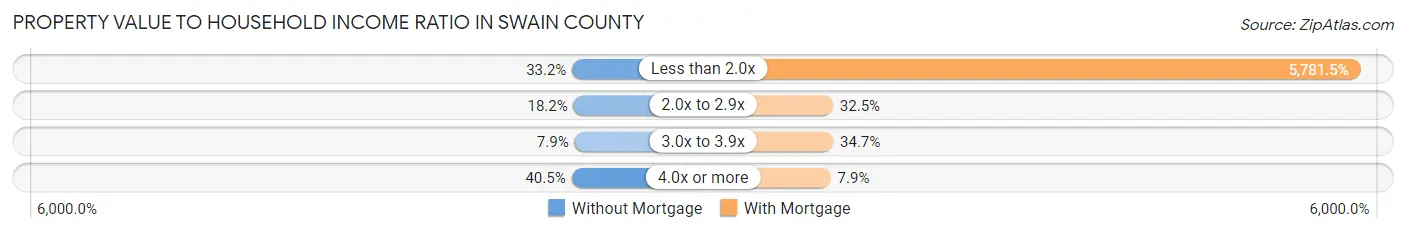
| Value-to-Income Ratio | Without Mortgage | With Mortgage |
| Less than 2.0x | 824 (33.2%) | 95,395 (5,781.5%) |
| 2.0x to 2.9x | 453 (18.2%) | 536 (32.5%) |
| 3.0x to 3.9x | 197 (7.9%) | 572 (34.7%) |
| 4.0x or more | 1,006 (40.5%) | 131 (7.9%) |
| Total | 2,485 (100.0%) | 1,650 (100.0%) |
Real Estate Taxes by Mortgage Status in Swain County
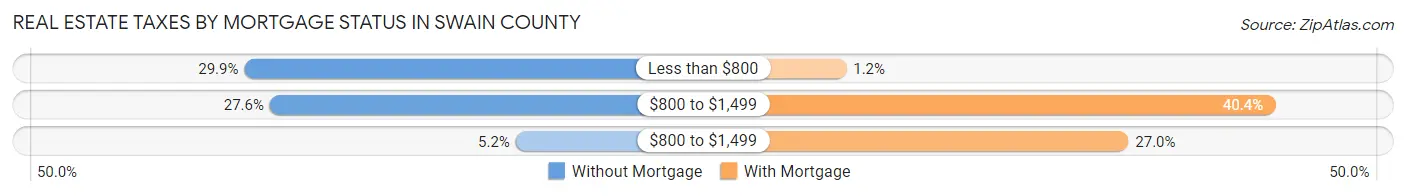
| Property Taxes | Without Mortgage | With Mortgage |
| Less than $800 | 744 (29.9%) | 20 (1.2%) |
| $800 to $1,499 | 686 (27.6%) | 666 (40.4%) |
| $800 to $1,499 | 128 (5.1%) | 445 (27.0%) |
| Total | 2,485 (100.0%) | 1,650 (100.0%) |
Health & Disability in Swain County
Health Insurance Coverage by Age in Swain County
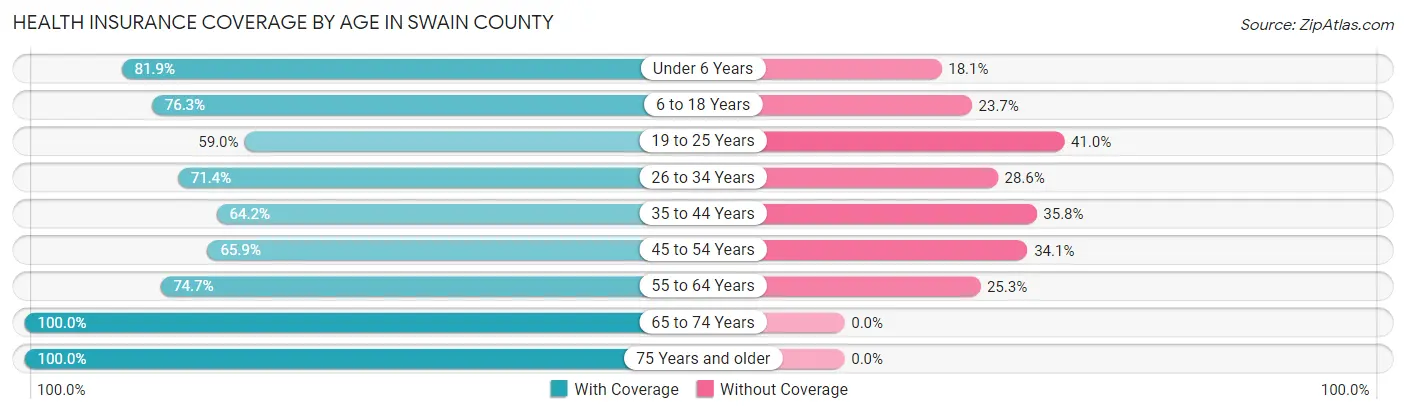
| Age Bracket | With Coverage | Without Coverage |
| Under 6 Years | 725 (81.9%) | 160 (18.1%) |
| 6 to 18 Years | 1,931 (76.3%) | 601 (23.7%) |
| 19 to 25 Years | 710 (59.0%) | 493 (41.0%) |
| 26 to 34 Years | 980 (71.4%) | 392 (28.6%) |
| 35 to 44 Years | 1,125 (64.2%) | 628 (35.8%) |
| 45 to 54 Years | 1,138 (65.9%) | 589 (34.1%) |
| 55 to 64 Years | 1,391 (74.7%) | 471 (25.3%) |
| 65 to 74 Years | 1,502 (100.0%) | 0 (0.0%) |
| 75 Years and older | 1,064 (100.0%) | 0 (0.0%) |
| Total | 10,566 (76.0%) | 3,334 (24.0%) |
Health Insurance Coverage by Citizenship Status in Swain County
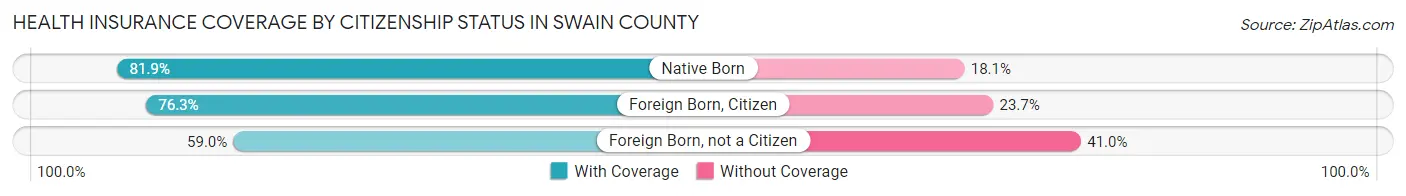
| Citizenship Status | With Coverage | Without Coverage |
| Native Born | 725 (81.9%) | 160 (18.1%) |
| Foreign Born, Citizen | 1,931 (76.3%) | 601 (23.7%) |
| Foreign Born, not a Citizen | 710 (59.0%) | 493 (41.0%) |
Health Insurance Coverage by Household Income in Swain County
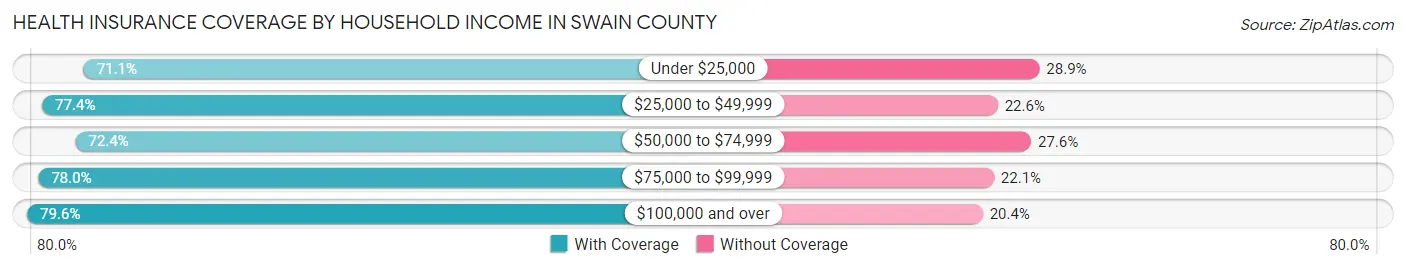
| Household Income | With Coverage | Without Coverage |
| Under $25,000 | 2,025 (71.1%) | 822 (28.9%) |
| $25,000 to $49,999 | 2,053 (77.4%) | 600 (22.6%) |
| $50,000 to $74,999 | 1,588 (72.4%) | 606 (27.6%) |
| $75,000 to $99,999 | 1,616 (77.9%) | 457 (22.1%) |
| $100,000 and over | 3,209 (79.6%) | 821 (20.4%) |
Public vs Private Health Insurance Coverage by Age in Swain County
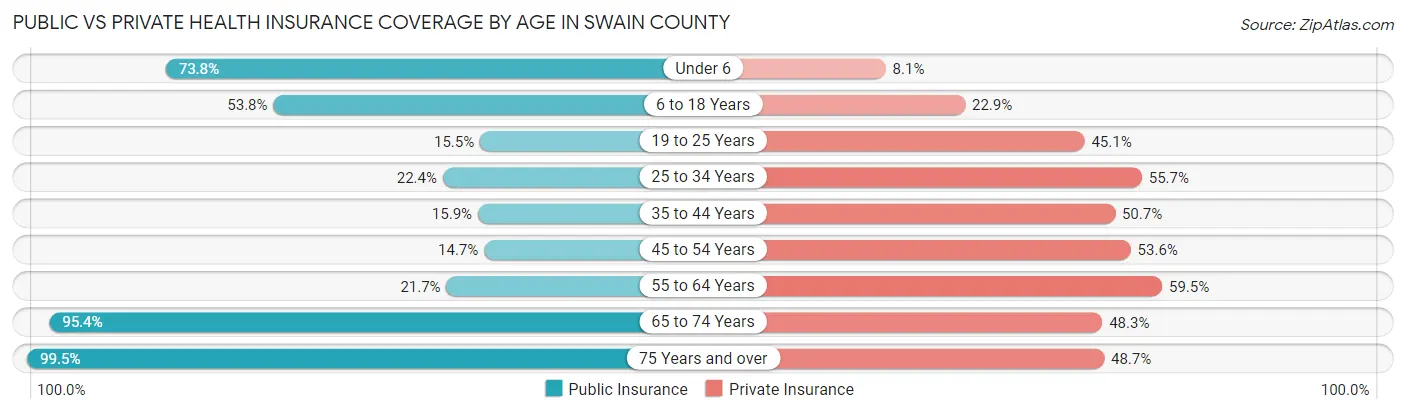
| Age Bracket | Public Insurance | Private Insurance |
| Under 6 | 653 (73.8%) | 72 (8.1%) |
| 6 to 18 Years | 1,363 (53.8%) | 579 (22.9%) |
| 19 to 25 Years | 186 (15.5%) | 542 (45.1%) |
| 25 to 34 Years | 307 (22.4%) | 764 (55.7%) |
| 35 to 44 Years | 278 (15.9%) | 889 (50.7%) |
| 45 to 54 Years | 254 (14.7%) | 926 (53.6%) |
| 55 to 64 Years | 404 (21.7%) | 1,107 (59.5%) |
| 65 to 74 Years | 1,433 (95.4%) | 726 (48.3%) |
| 75 Years and over | 1,059 (99.5%) | 518 (48.7%) |
| Total | 5,937 (42.7%) | 6,123 (44.1%) |
Disability Status by Sex by Age in Swain County
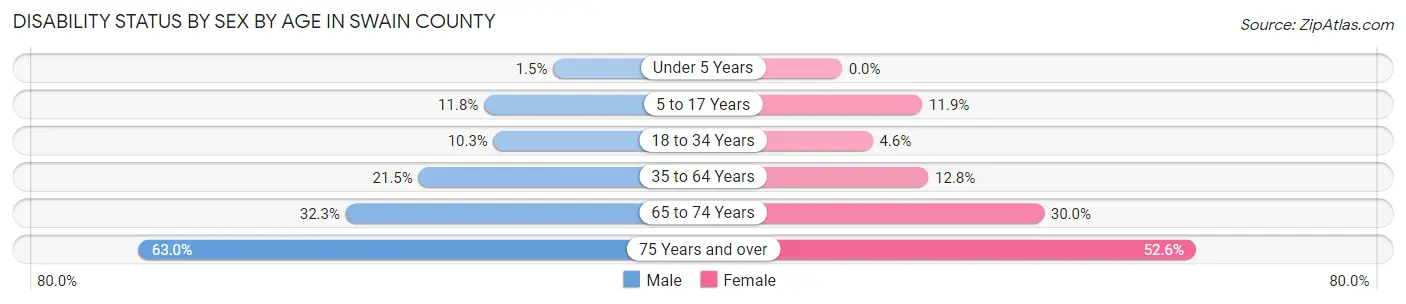
| Age Bracket | Male | Female |
| Under 5 Years | 6 (1.5%) | 0 (0.0%) |
| 5 to 17 Years | 153 (11.8%) | 141 (11.9%) |
| 18 to 34 Years | 138 (10.3%) | 67 (4.5%) |
| 35 to 64 Years | 561 (21.5%) | 350 (12.8%) |
| 65 to 74 Years | 218 (32.3%) | 248 (30.0%) |
| 75 Years and over | 312 (63.0%) | 299 (52.5%) |
Disability Class by Sex by Age in Swain County
Disability Class: Hearing Difficulty
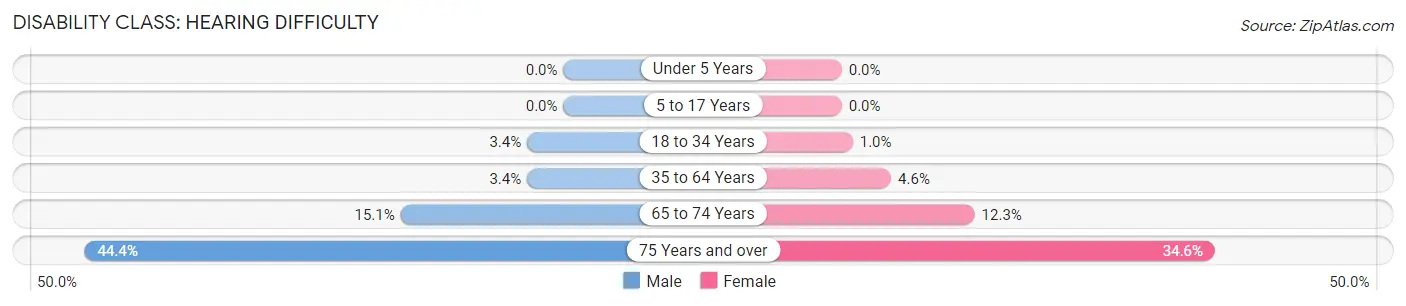
| Age Bracket | Male | Female |
| Under 5 Years | 0 (0.0%) | 0 (0.0%) |
| 5 to 17 Years | 0 (0.0%) | 0 (0.0%) |
| 18 to 34 Years | 45 (3.4%) | 15 (1.0%) |
| 35 to 64 Years | 88 (3.4%) | 125 (4.6%) |
| 65 to 74 Years | 102 (15.1%) | 102 (12.3%) |
| 75 Years and over | 220 (44.4%) | 197 (34.6%) |
Disability Class: Vision Difficulty
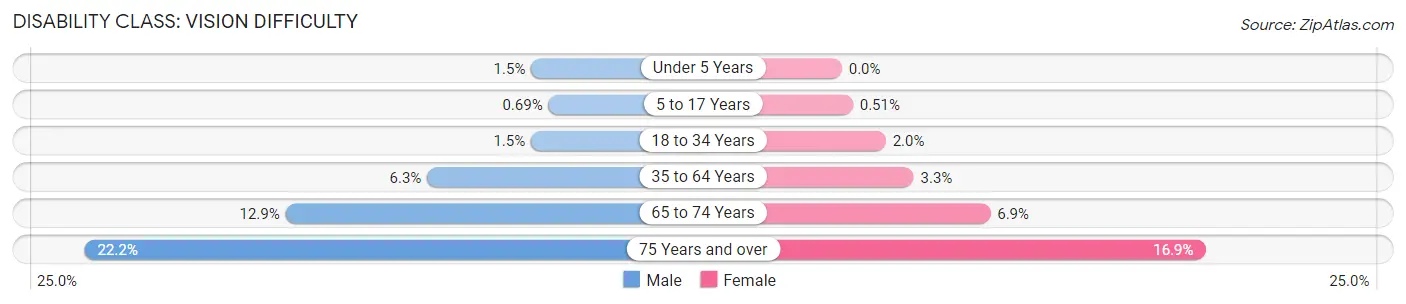
| Age Bracket | Male | Female |
| Under 5 Years | 6 (1.5%) | 0 (0.0%) |
| 5 to 17 Years | 9 (0.7%) | 6 (0.5%) |
| 18 to 34 Years | 20 (1.5%) | 30 (2.0%) |
| 35 to 64 Years | 165 (6.3%) | 91 (3.3%) |
| 65 to 74 Years | 87 (12.9%) | 57 (6.9%) |
| 75 Years and over | 110 (22.2%) | 96 (16.9%) |
Disability Class: Cognitive Difficulty
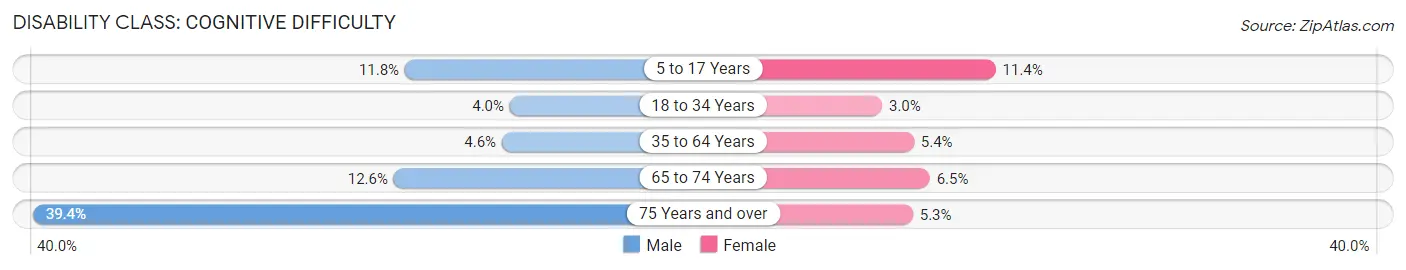
| Age Bracket | Male | Female |
| 5 to 17 Years | 153 (11.8%) | 135 (11.4%) |
| 18 to 34 Years | 53 (4.0%) | 44 (3.0%) |
| 35 to 64 Years | 119 (4.6%) | 146 (5.3%) |
| 65 to 74 Years | 85 (12.6%) | 54 (6.5%) |
| 75 Years and over | 195 (39.4%) | 30 (5.3%) |
Disability Class: Ambulatory Difficulty
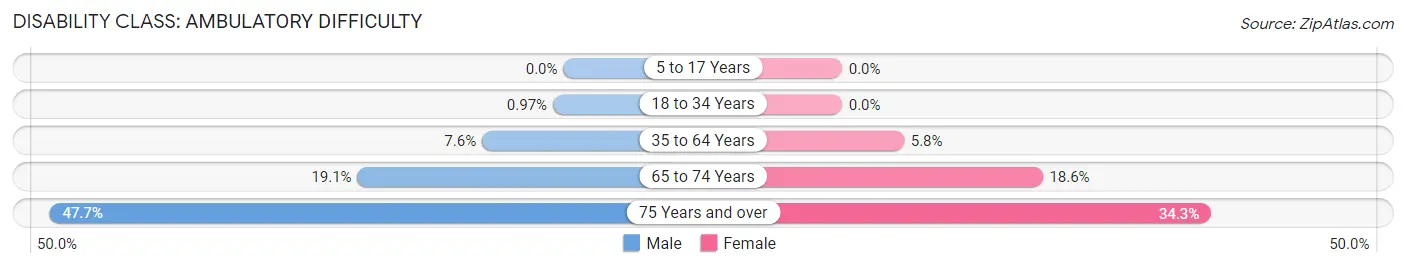
| Age Bracket | Male | Female |
| 5 to 17 Years | 0 (0.0%) | 0 (0.0%) |
| 18 to 34 Years | 13 (1.0%) | 0 (0.0%) |
| 35 to 64 Years | 197 (7.5%) | 157 (5.8%) |
| 65 to 74 Years | 129 (19.1%) | 154 (18.6%) |
| 75 Years and over | 236 (47.7%) | 195 (34.3%) |
Disability Class: Self-Care Difficulty
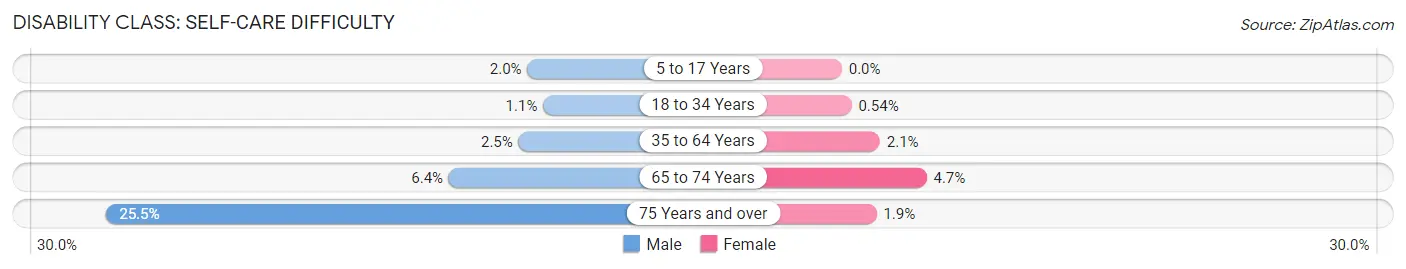
| Age Bracket | Male | Female |
| 5 to 17 Years | 26 (2.0%) | 0 (0.0%) |
| 18 to 34 Years | 15 (1.1%) | 8 (0.5%) |
| 35 to 64 Years | 65 (2.5%) | 58 (2.1%) |
| 65 to 74 Years | 43 (6.4%) | 39 (4.7%) |
| 75 Years and over | 126 (25.5%) | 11 (1.9%) |
Technology Access in Swain County
Computing Device Access in Swain County
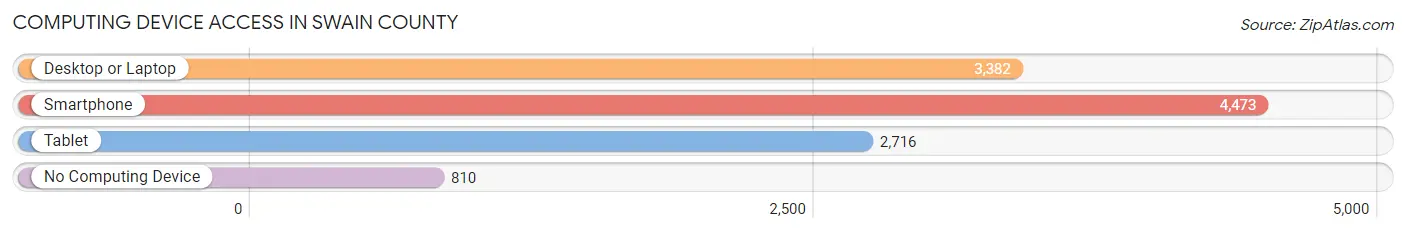
| Device Type | # Households | % Households |
| Desktop or Laptop | 3,382 | 59.5% |
| Smartphone | 4,473 | 78.7% |
| Tablet | 2,716 | 47.8% |
| No Computing Device | 810 | 14.2% |
| Total | 5,684 | 100.0% |
Internet Access in Swain County
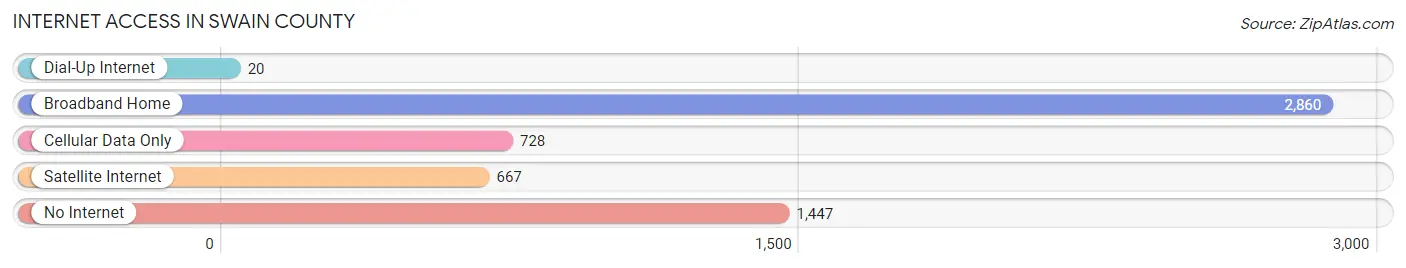
| Internet Type | # Households | % Households |
| Dial-Up Internet | 20 | 0.4% |
| Broadband Home | 2,860 | 50.3% |
| Cellular Data Only | 728 | 12.8% |
| Satellite Internet | 667 | 11.7% |
| No Internet | 1,447 | 25.5% |
| Total | 5,684 | 100.0% |
Swain County Summary
Swain County is located in the western part of North Carolina, in the Appalachian Mountains. It is bordered by Graham County to the north, Macon County to the east, Jackson County to the south, and Haywood County to the west. The county seat is Bryson City, and the county is home to the Great Smoky Mountains National Park.
History
Swain County was formed in 1871 from parts of Jackson and Macon counties. It was named for David L. Swain, the governor of North Carolina from 1832 to 1835. The county was originally inhabited by the Cherokee Indians, who were forcibly removed in the 1830s as part of the Indian Removal Act.
The county was largely rural until the Great Smoky Mountains National Park was established in 1934. The park brought an influx of tourists to the area, and the county’s population has grown steadily since then.
Geography
Swain County is located in the Appalachian Mountains of western North Carolina. It is bordered by Graham County to the north, Macon County to the east, Jackson County to the south, and Haywood County to the west. The county is home to the Great Smoky Mountains National Park, which covers more than half of the county’s total area.
The county is divided into two distinct regions: the Great Smoky Mountains to the east and the Nantahala National Forest to the west. The highest point in the county is Clingmans Dome, which has an elevation of 6,643 feet. The county also contains several rivers, including the Tuckasegee, Nantahala, and Oconaluftee.
Economy
Swain County’s economy is largely based on tourism. The Great Smoky Mountains National Park is the county’s largest employer, and it attracts millions of visitors each year. Other major employers in the county include the Nantahala Outdoor Center, the Great Smoky Mountains Railroad, and the Cherokee Indian Reservation.
The county also has a thriving agricultural sector, with crops such as corn, soybeans, and hay being grown in the area. Livestock production is also important, with beef cattle, dairy cows, and hogs being raised in the county.
Demographics
As of the 2010 census, Swain County had a population of 13,981. The population was spread out, with 48.3% male and 51.7% female. The median age was 41.7 years.
The racial makeup of the county was 92.2% White, 4.2% Native American, 0.7% Asian, 0.3% Black or African American, 0.1% Pacific Islander, 1.2% from other races, and 1.4% from two or more races. Hispanic or Latino of any race were 2.7% of the population.
The median household income was $35,945, and the median family income was $41,945. The per capita income was $19,945. About 17.2% of the population was below the poverty line.
Swain County is a rural county with a strong tourism industry. It is home to the Great Smoky Mountains National Park, which attracts millions of visitors each year. The county also has a thriving agricultural sector, with crops such as corn, soybeans, and hay being grown in the area. The population is largely white, with a small Native American population. The median household income is slightly below the national average, and the poverty rate is slightly higher than the national average.
Common Questions
What is Per Capita Income in Swain County?
Per Capita income in Swain County is $28,624.
What is the Median Family Income in Swain County?
Median Family Income in Swain County is $72,516.
What is the Median Household income in Swain County?
Median Household Income in Swain County is $52,818.
What is Income or Wage Gap in Swain County?
Income or Wage Gap in Swain County is 17.9%.
Women in Swain County earn 82.1 cents for every dollar earned by a man.
What is Family Income Deficit in Swain County?
Family Income Deficit in Swain County is $13,168.
Families that are below poverty line in Swain County earn $13,168 less on average than the poverty threshold level.
What is Inequality or Gini Index in Swain County?
Inequality or Gini Index in Swain County is 0.45.
What is the Total Population of Swain County?
Total Population of Swain County is 14,130.
What is the Total Male Population of Swain County?
Total Male Population of Swain County is 6,913.
What is the Total Female Population of Swain County?
Total Female Population of Swain County is 7,217.
What is the Ratio of Males per 100 Females in Swain County?
There are 95.79 Males per 100 Females in Swain County.
What is the Ratio of Females per 100 Males in Swain County?
There are 104.40 Females per 100 Males in Swain County.
What is the Median Population Age in Swain County?
Median Population Age in Swain County is 41.6 Years.
What is the Average Family Size in Swain County
Average Family Size in Swain County is 3.0 People.
What is the Average Household Size in Swain County
Average Household Size in Swain County is 2.4 People.
How Large is the Labor Force in Swain County?
There are 6,223 People in the Labor Forcein in Swain County.
What is the Percentage of People in the Labor Force in Swain County?
55.2% of People are in the Labor Force in Swain County.
What is the Unemployment Rate in Swain County?
Unemployment Rate in Swain County is 7.5%.