Stanly County, NC Map & Demographics
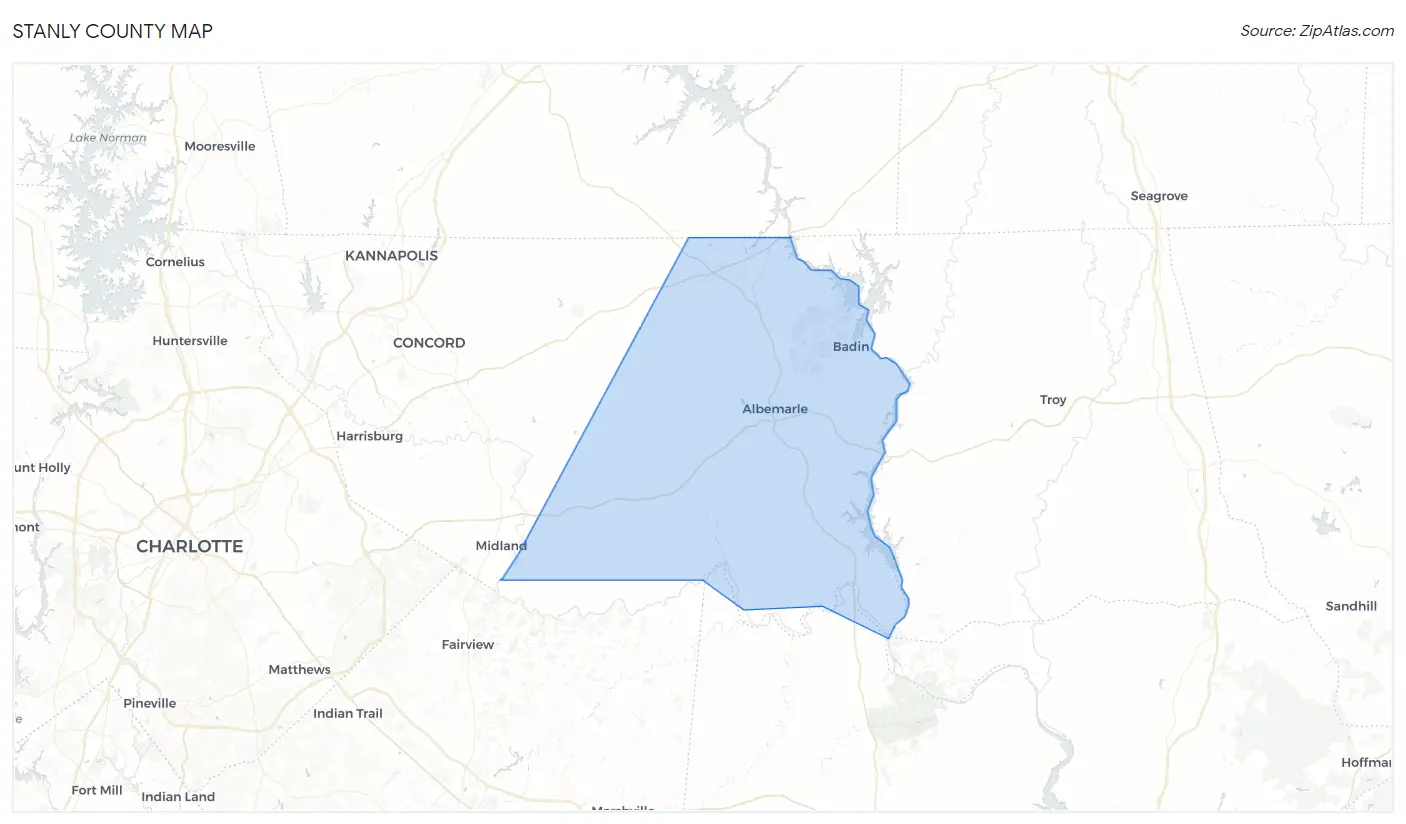
Stanly County Map
Stanly County Overview
$30,857
PER CAPITA INCOME
$78,623
AVG FAMILY INCOME
$60,634
AVG HOUSEHOLD INCOME
26.4%
WAGE / INCOME GAP [ % ]
73.6¢/ $1
WAGE / INCOME GAP [ $ ]
$11,359
FAMILY INCOME DEFICIT
0.45
INEQUALITY / GINI INDEX
62,723
TOTAL POPULATION
31,635
MALE POPULATION
31,088
FEMALE POPULATION
101.76
MALES / 100 FEMALES
98.27
FEMALES / 100 MALES
41.4
MEDIAN AGE
3.1
AVG FAMILY SIZE
2.5
AVG HOUSEHOLD SIZE
30,090
LABOR FORCE [ PEOPLE ]
59.3%
PERCENT IN LABOR FORCE
4.3%
UNEMPLOYMENT RATE
Income in Stanly County
Income Overview in Stanly County
Per Capita Income in Stanly County is $30,857, while median incomes of families and households are $78,623 and $60,634 respectively.
| Characteristic | Number | Measure |
| Per Capita Income | 62,723 | $30,857 |
| Median Family Income | 16,144 | $78,623 |
| Mean Family Income | 16,144 | $97,370 |
| Median Household Income | 23,773 | $60,634 |
| Mean Household Income | 23,773 | $80,127 |
| Income Deficit | 16,144 | $11,359 |
| Wage / Income Gap (%) | 62,723 | 26.42% |
| Wage / Income Gap ($) | 62,723 | 73.58¢ per $1 |
| Gini / Inequality Index | 62,723 | 0.45 |
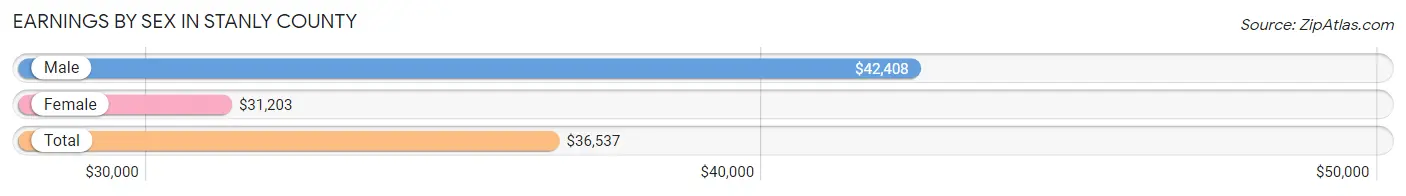
Earnings by Sex in Stanly County
Average Earnings in Stanly County are $36,537, $42,408 for men and $31,203 for women, a difference of 26.4%.
| Sex | Number | Average Earnings |
| Male | 17,710 (55.3%) | $42,408 |
| Female | 14,310 (44.7%) | $31,203 |
| Total | 32,020 (100.0%) | $36,537 |
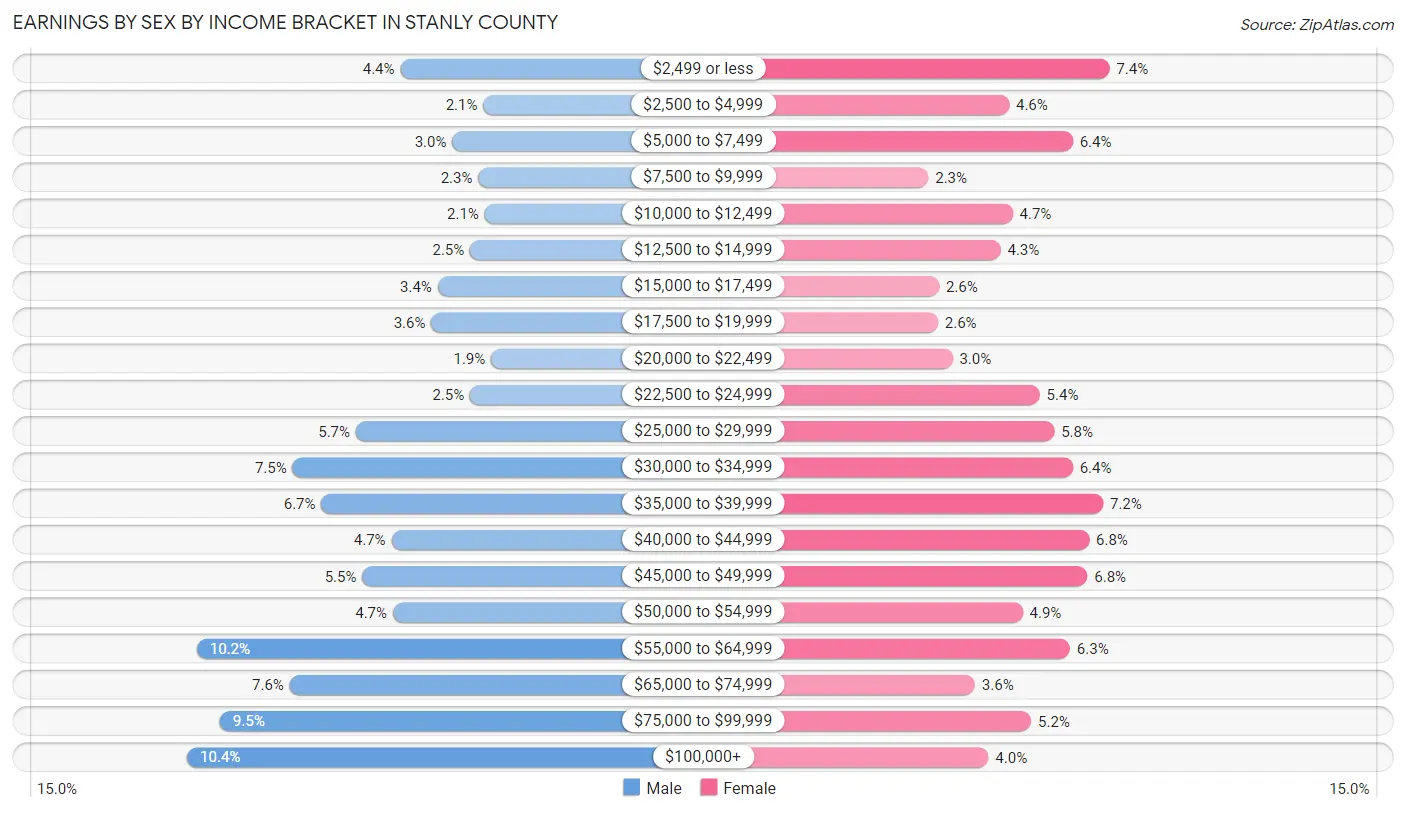
Earnings by Sex by Income Bracket in Stanly County
The most common earnings brackets in Stanly County are $100,000+ for men (1,847 | 10.4%) and $2,499 or less for women (1,056 | 7.4%).
| Income | Male | Female |
| $2,499 or less | 787 (4.4%) | 1,056 (7.4%) |
| $2,500 to $4,999 | 374 (2.1%) | 652 (4.6%) |
| $5,000 to $7,499 | 528 (3.0%) | 909 (6.4%) |
| $7,500 to $9,999 | 399 (2.2%) | 327 (2.3%) |
| $10,000 to $12,499 | 367 (2.1%) | 667 (4.7%) |
| $12,500 to $14,999 | 439 (2.5%) | 618 (4.3%) |
| $15,000 to $17,499 | 601 (3.4%) | 370 (2.6%) |
| $17,500 to $19,999 | 632 (3.6%) | 367 (2.6%) |
| $20,000 to $22,499 | 334 (1.9%) | 425 (3.0%) |
| $22,500 to $24,999 | 440 (2.5%) | 776 (5.4%) |
| $25,000 to $29,999 | 1,007 (5.7%) | 834 (5.8%) |
| $30,000 to $34,999 | 1,323 (7.5%) | 908 (6.4%) |
| $35,000 to $39,999 | 1,180 (6.7%) | 1,030 (7.2%) |
| $40,000 to $44,999 | 831 (4.7%) | 974 (6.8%) |
| $45,000 to $49,999 | 976 (5.5%) | 967 (6.8%) |
| $50,000 to $54,999 | 823 (4.6%) | 707 (4.9%) |
| $55,000 to $64,999 | 1,800 (10.2%) | 897 (6.3%) |
| $65,000 to $74,999 | 1,337 (7.5%) | 515 (3.6%) |
| $75,000 to $99,999 | 1,685 (9.5%) | 741 (5.2%) |
| $100,000+ | 1,847 (10.4%) | 570 (4.0%) |
| Total | 17,710 (100.0%) | 14,310 (100.0%) |
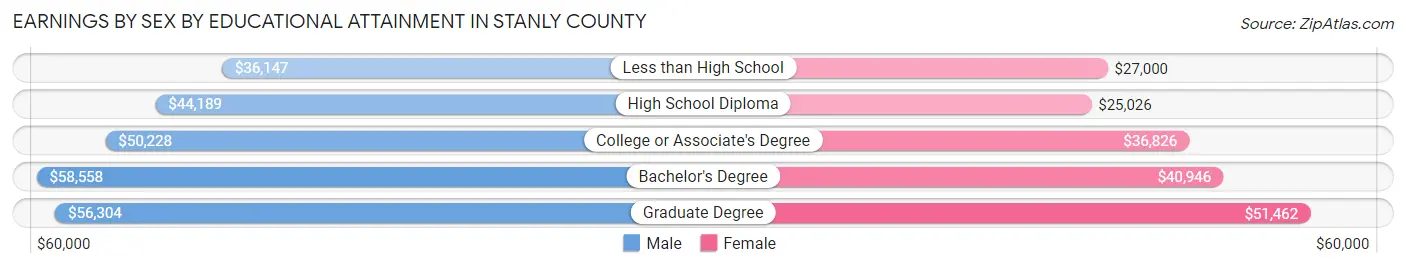
Earnings by Sex by Educational Attainment in Stanly County
Average earnings in Stanly County are $48,397 for men and $35,307 for women, a difference of 27.1%. Men with an educational attainment of bachelor's degree enjoy the highest average annual earnings of $58,558, while those with less than high school education earn the least with $36,147. Women with an educational attainment of graduate degree earn the most with the average annual earnings of $51,462, while those with high school diploma education have the smallest earnings of $25,026.
| Educational Attainment | Male Income | Female Income |
| Less than High School | $36,147 | $27,000 |
| High School Diploma | $44,189 | $25,026 |
| College or Associate's Degree | $50,228 | $36,826 |
| Bachelor's Degree | $58,558 | $40,946 |
| Graduate Degree | $56,304 | $51,462 |
| Total | $48,397 | $35,307 |
Family Income in Stanly County
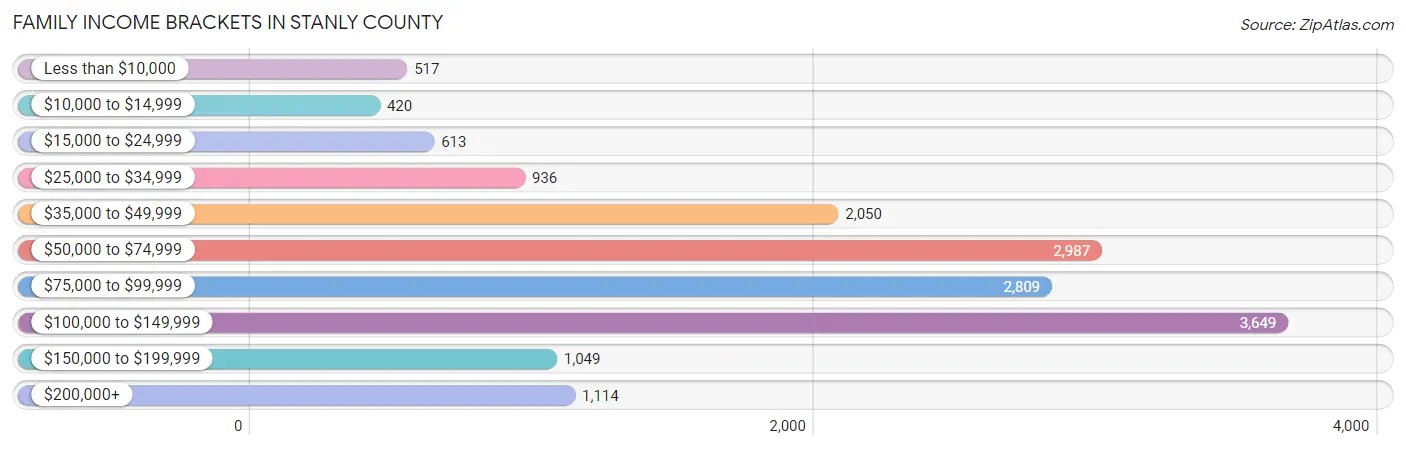
Family Income Brackets in Stanly County
According to the Stanly County family income data, there are 3,649 families falling into the $100,000 to $149,999 income range, which is the most common income bracket and makes up 22.6% of all families. Conversely, the $10,000 to $14,999 income bracket is the least frequent group with only 420 families (2.6%) belonging to this category.
| Income Bracket | # Families | % Families |
| Less than $10,000 | 517 | 3.2% |
| $10,000 to $14,999 | 420 | 2.6% |
| $15,000 to $24,999 | 613 | 3.8% |
| $25,000 to $34,999 | 936 | 5.8% |
| $35,000 to $49,999 | 2,050 | 12.7% |
| $50,000 to $74,999 | 2,987 | 18.5% |
| $75,000 to $99,999 | 2,809 | 17.4% |
| $100,000 to $149,999 | 3,649 | 22.6% |
| $150,000 to $199,999 | 1,049 | 6.5% |
| $200,000+ | 1,114 | 6.9% |
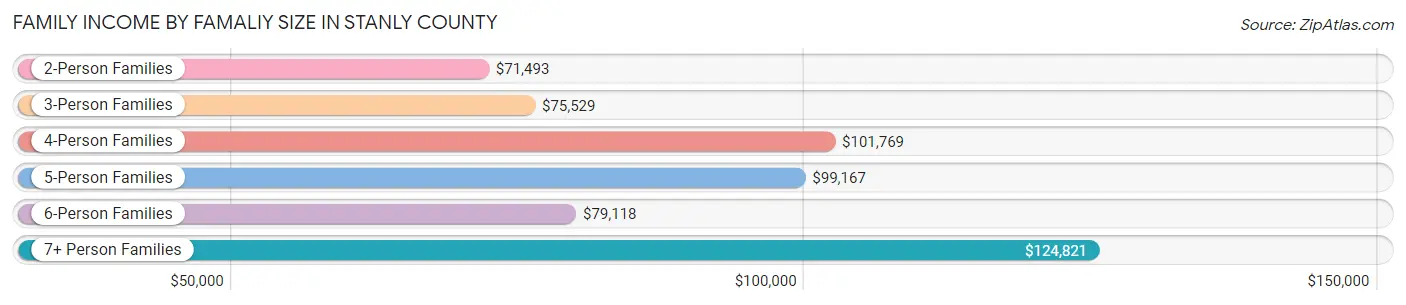
Family Income by Famaliy Size in Stanly County
7+ person families (297 | 1.8%) account for the highest median family income in Stanly County with $124,821 per family, while 2-person families (7,978 | 49.4%) have the highest median income of $35,746 per family member.
| Income Bracket | # Families | Median Income |
| 2-Person Families | 7,978 (49.4%) | $71,493 |
| 3-Person Families | 3,544 (22.0%) | $75,529 |
| 4-Person Families | 2,837 (17.6%) | $101,769 |
| 5-Person Families | 910 (5.6%) | $99,167 |
| 6-Person Families | 578 (3.6%) | $79,118 |
| 7+ Person Families | 297 (1.8%) | $124,821 |
| Total | 16,144 (100.0%) | $78,623 |
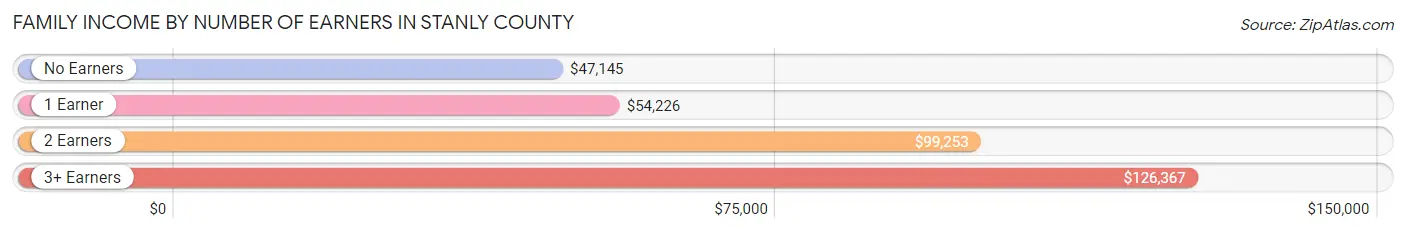
Family Income by Number of Earners in Stanly County
The median family income in Stanly County is $78,623, with families comprising 3+ earners (1,954) having the highest median family income of $126,367, while families with no earners (2,561) have the lowest median family income of $47,145, accounting for 12.1% and 15.9% of families, respectively.
| Number of Earners | # Families | Median Income |
| No Earners | 2,561 (15.9%) | $47,145 |
| 1 Earner | 5,169 (32.0%) | $54,226 |
| 2 Earners | 6,460 (40.0%) | $99,253 |
| 3+ Earners | 1,954 (12.1%) | $126,367 |
| Total | 16,144 (100.0%) | $78,623 |
Household Income in Stanly County
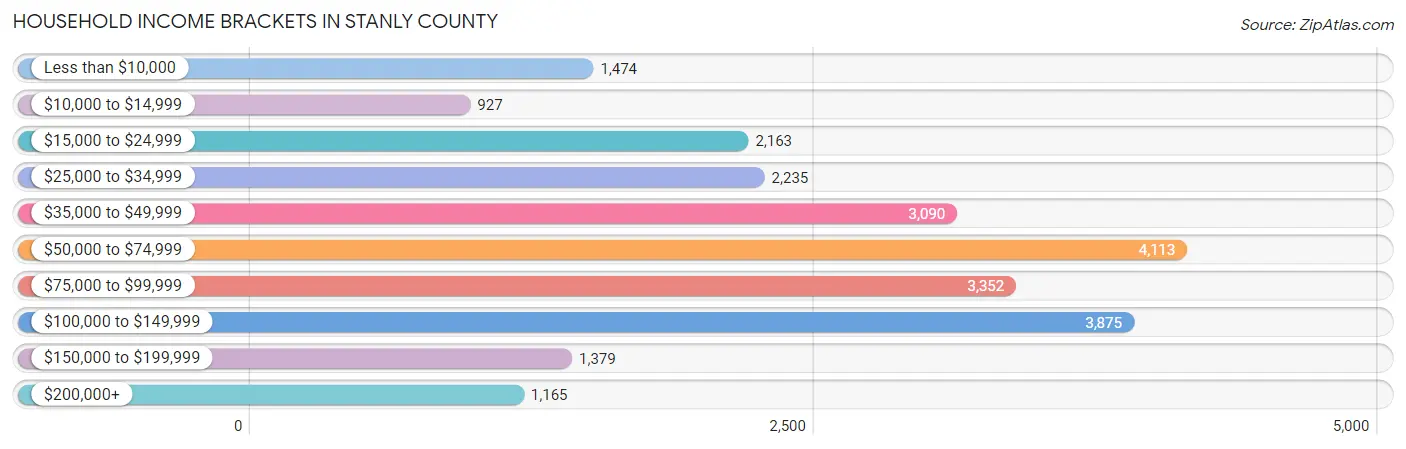
Household Income Brackets in Stanly County
With 4,113 households falling in the category, the $50,000 to $74,999 income range is the most frequent in Stanly County, accounting for 17.3% of all households. In contrast, only 927 households (3.9%) fall into the $10,000 to $14,999 income bracket, making it the least populous group.
| Income Bracket | # Households | % Households |
| Less than $10,000 | 1,474 | 6.2% |
| $10,000 to $14,999 | 927 | 3.9% |
| $15,000 to $24,999 | 2,163 | 9.1% |
| $25,000 to $34,999 | 2,235 | 9.4% |
| $35,000 to $49,999 | 3,090 | 13.0% |
| $50,000 to $74,999 | 4,113 | 17.3% |
| $75,000 to $99,999 | 3,352 | 14.1% |
| $100,000 to $149,999 | 3,875 | 16.3% |
| $150,000 to $199,999 | 1,379 | 5.8% |
| $200,000+ | 1,165 | 4.9% |
Household Income by Householder Age in Stanly County
The median household income in Stanly County is $60,634, with the highest median household income of $78,134 found in the 45 to 64 years age bracket for the primary householder. A total of 8,805 households (37.0%) fall into this category. Meanwhile, the 15 to 24 years age bracket for the primary householder has the lowest median household income of $35,120, with 737 households (3.1%) in this group.
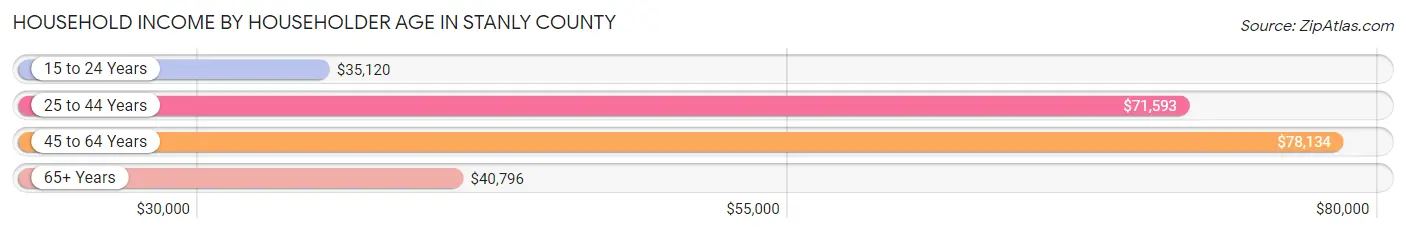
| Income Bracket | # Households | Median Income |
| 15 to 24 Years | 737 (3.1%) | $35,120 |
| 25 to 44 Years | 6,846 (28.8%) | $71,593 |
| 45 to 64 Years | 8,805 (37.0%) | $78,134 |
| 65+ Years | 7,385 (31.1%) | $40,796 |
| Total | 23,773 (100.0%) | $60,634 |
Poverty in Stanly County
Income Below Poverty by Sex and Age in Stanly County
With 11.7% poverty level for males and 15.8% for females among the residents of Stanly County, 5 year old males and 5 year old females are the most vulnerable to poverty, with 386 males (54.3%) and 112 females (32.9%) in their respective age groups living below the poverty level.
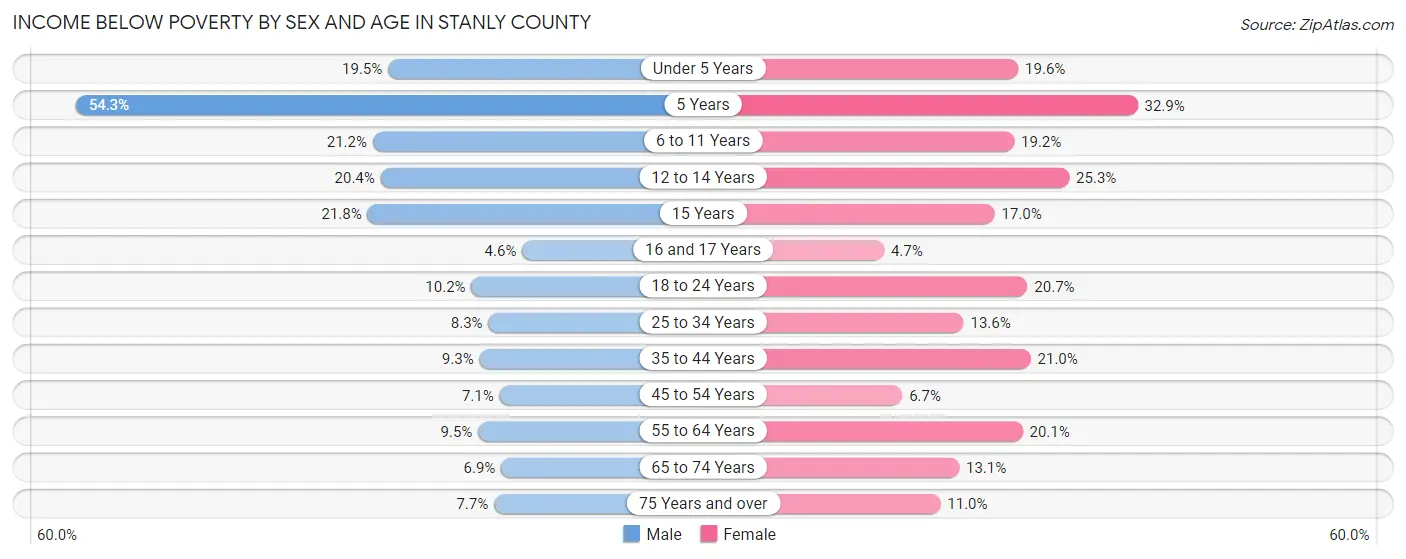
| Age Bracket | Male | Female |
| Under 5 Years | 335 (19.5%) | 345 (19.6%) |
| 5 Years | 386 (54.3%) | 112 (32.9%) |
| 6 to 11 Years | 492 (21.2%) | 403 (19.2%) |
| 12 to 14 Years | 209 (20.3%) | 255 (25.3%) |
| 15 Years | 130 (21.8%) | 49 (17.0%) |
| 16 and 17 Years | 25 (4.6%) | 45 (4.7%) |
| 18 to 24 Years | 250 (10.2%) | 462 (20.7%) |
| 25 to 34 Years | 342 (8.3%) | 510 (13.6%) |
| 35 to 44 Years | 322 (9.3%) | 752 (21.0%) |
| 45 to 54 Years | 291 (7.1%) | 267 (6.7%) |
| 55 to 64 Years | 396 (9.5%) | 870 (20.1%) |
| 65 to 74 Years | 221 (6.9%) | 471 (13.1%) |
| 75 Years and over | 149 (7.7%) | 280 (11.0%) |
| Total | 3,548 (11.7%) | 4,821 (15.8%) |
Income Above Poverty by Sex and Age in Stanly County
According to the poverty statistics in Stanly County, males aged 16 and 17 years and females aged 16 and 17 years are the age groups that are most secure financially, with 95.4% of males and 95.3% of females in these age groups living above the poverty line.
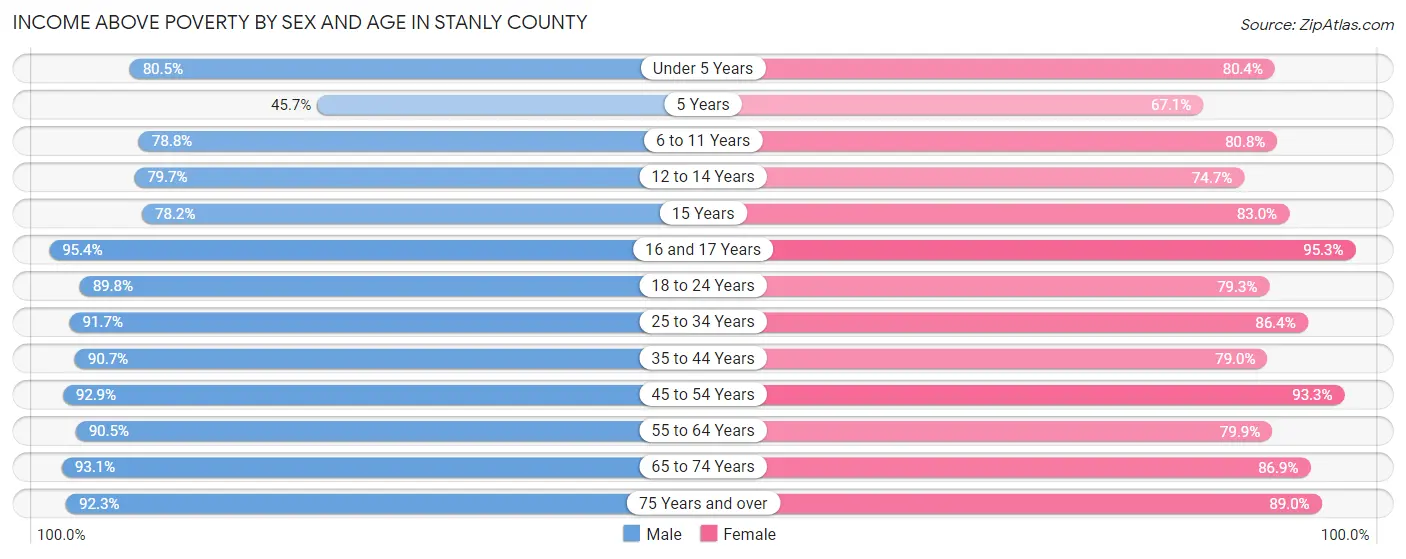
| Age Bracket | Male | Female |
| Under 5 Years | 1,381 (80.5%) | 1,412 (80.4%) |
| 5 Years | 325 (45.7%) | 228 (67.1%) |
| 6 to 11 Years | 1,827 (78.8%) | 1,697 (80.8%) |
| 12 to 14 Years | 818 (79.6%) | 752 (74.7%) |
| 15 Years | 466 (78.2%) | 239 (83.0%) |
| 16 and 17 Years | 521 (95.4%) | 913 (95.3%) |
| 18 to 24 Years | 2,192 (89.8%) | 1,773 (79.3%) |
| 25 to 34 Years | 3,758 (91.7%) | 3,250 (86.4%) |
| 35 to 44 Years | 3,124 (90.7%) | 2,823 (79.0%) |
| 45 to 54 Years | 3,803 (92.9%) | 3,703 (93.3%) |
| 55 to 64 Years | 3,776 (90.5%) | 3,451 (79.9%) |
| 65 to 74 Years | 2,972 (93.1%) | 3,135 (86.9%) |
| 75 Years and over | 1,780 (92.3%) | 2,270 (89.0%) |
| Total | 26,743 (88.3%) | 25,646 (84.2%) |
Income Below Poverty Among Married-Couple Families in Stanly County
The poverty statistics for married-couple families in Stanly County show that 3.6% or 429 of the total 12,018 families live below the poverty line. Families with 5 or more children have the highest poverty rate of 44.4%, comprising of 59 families. On the other hand, families with no children have the lowest poverty rate of 2.5%, which includes 191 families.
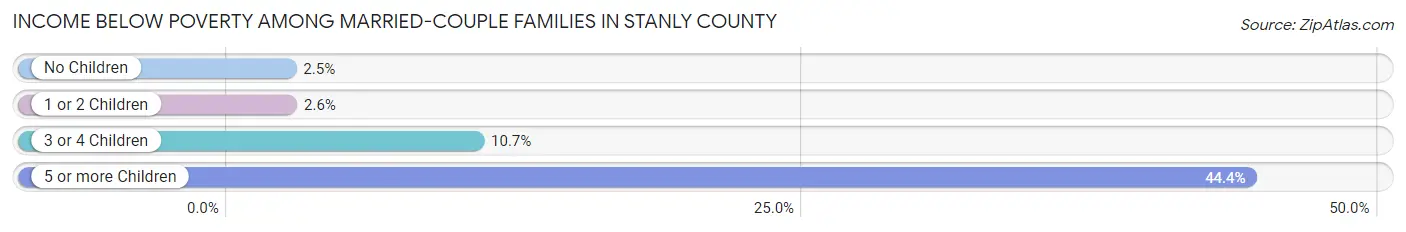
| Children | Above Poverty | Below Poverty |
| No Children | 7,337 (97.5%) | 191 (2.5%) |
| 1 or 2 Children | 3,444 (97.4%) | 91 (2.6%) |
| 3 or 4 Children | 734 (89.3%) | 88 (10.7%) |
| 5 or more Children | 74 (55.6%) | 59 (44.4%) |
| Total | 11,589 (96.4%) | 429 (3.6%) |
Income Below Poverty Among Single-Parent Households in Stanly County
According to the poverty data in Stanly County, 7.8% or 116 single-father households and 35.4% or 933 single-mother households are living below the poverty line. Among single-father households, those with 5 or more children have the highest poverty rate, with 1 households (100.0%) experiencing poverty. Likewise, among single-mother households, those with 3 or 4 children have the highest poverty rate, with 182 households (74.0%) falling below the poverty line.
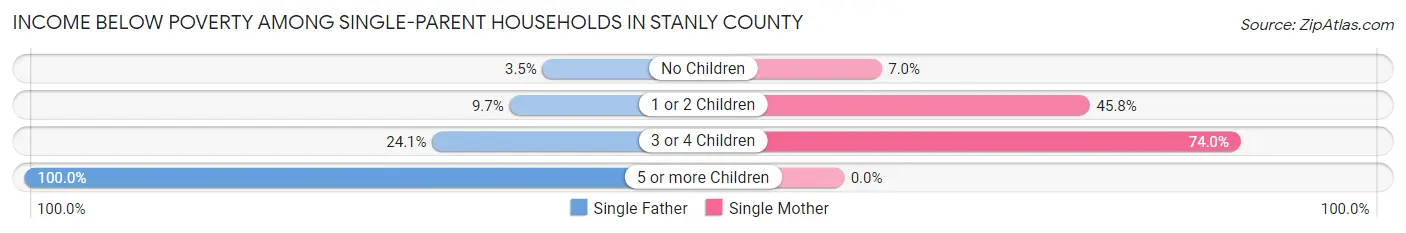
| Children | Single Father | Single Mother |
| No Children | 23 (3.5%) | 62 (7.0%) |
| 1 or 2 Children | 73 (9.7%) | 689 (45.8%) |
| 3 or 4 Children | 19 (24.0%) | 182 (74.0%) |
| 5 or more Children | 1 (100.0%) | 0 (0.0%) |
| Total | 116 (7.8%) | 933 (35.4%) |
Income Below Poverty Among Married-Couple vs Single-Parent Households in Stanly County
The poverty data for Stanly County shows that 429 of the married-couple family households (3.6%) and 1,049 of the single-parent households (25.4%) are living below the poverty level. Within the married-couple family households, those with 5 or more children have the highest poverty rate, with 59 households (44.4%) falling below the poverty line. Among the single-parent households, those with 5 or more children have the highest poverty rate, with 1 household (100.0%) living below poverty.
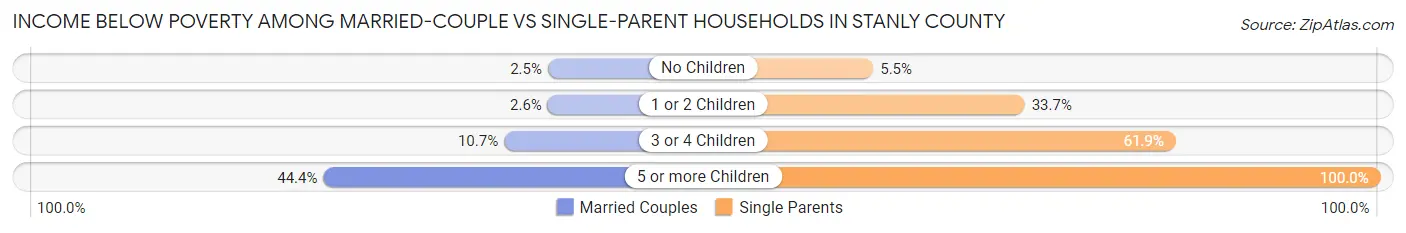
| Children | Married-Couple Families | Single-Parent Households |
| No Children | 191 (2.5%) | 85 (5.5%) |
| 1 or 2 Children | 91 (2.6%) | 762 (33.7%) |
| 3 or 4 Children | 88 (10.7%) | 201 (61.9%) |
| 5 or more Children | 59 (44.4%) | 1 (100.0%) |
| Total | 429 (3.6%) | 1,049 (25.4%) |
Race in Stanly County
The most populous races in Stanly County are White / Caucasian (51,085 | 81.5%), Black / African American (7,093 | 11.3%), and Hispanic or Latino (2,995 | 4.8%).
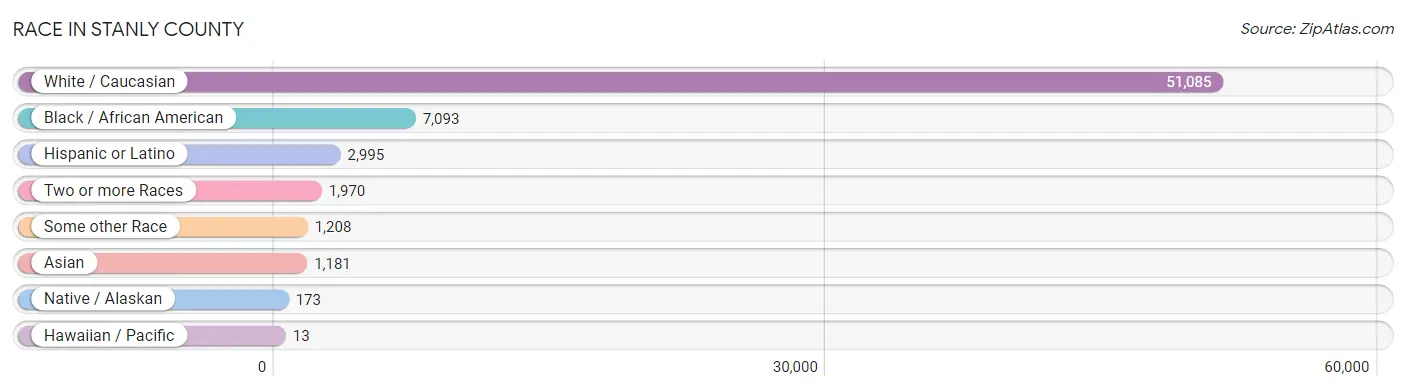
| Race | # Population | % Population |
| Asian | 1,181 | 1.9% |
| Black / African American | 7,093 | 11.3% |
| Hawaiian / Pacific | 13 | 0.0% |
| Hispanic or Latino | 2,995 | 4.8% |
| Native / Alaskan | 173 | 0.3% |
| White / Caucasian | 51,085 | 81.5% |
| Two or more Races | 1,970 | 3.1% |
| Some other Race | 1,208 | 1.9% |
| Total | 62,723 | 100.0% |
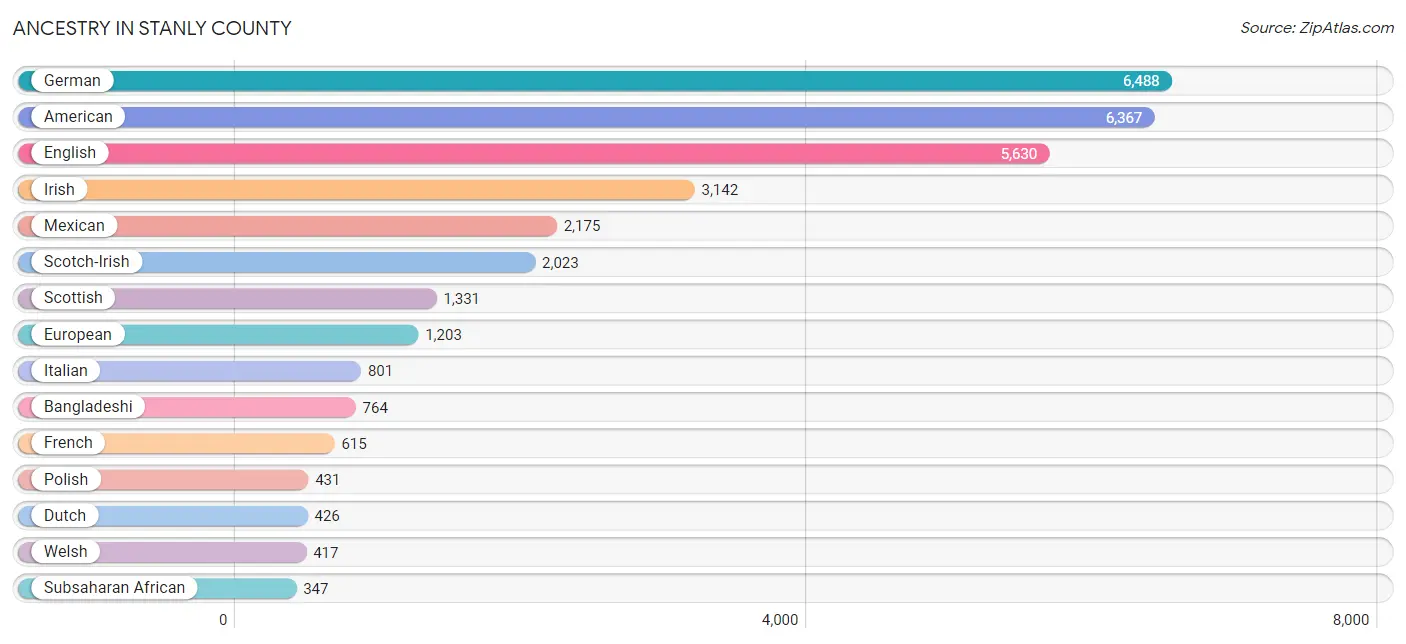
Ancestry in Stanly County
The most populous ancestries reported in Stanly County are German (6,488 | 10.3%), American (6,367 | 10.2%), English (5,630 | 9.0%), Irish (3,142 | 5.0%), and Mexican (2,175 | 3.5%), together accounting for 38.0% of all Stanly County residents.
| Ancestry | # Population | % Population |
| African | 173 | 0.3% |
| Alaskan Athabascan | 2 | 0.0% |
| American | 6,367 | 10.2% |
| Apache | 4 | 0.0% |
| Arab | 37 | 0.1% |
| Argentinean | 68 | 0.1% |
| Austrian | 6 | 0.0% |
| Bangladeshi | 764 | 1.2% |
| Blackfeet | 13 | 0.0% |
| Brazilian | 3 | 0.0% |
| British | 245 | 0.4% |
| Burmese | 30 | 0.1% |
| Canadian | 6 | 0.0% |
| Celtic | 8 | 0.0% |
| Central American | 107 | 0.2% |
| Central American Indian | 15 | 0.0% |
| Cherokee | 238 | 0.4% |
| Chilean | 9 | 0.0% |
| Chippewa | 5 | 0.0% |
| Choctaw | 2 | 0.0% |
| Colombian | 14 | 0.0% |
| Costa Rican | 5 | 0.0% |
| Creek | 4 | 0.0% |
| Croatian | 6 | 0.0% |
| Cuban | 202 | 0.3% |
| Czech | 110 | 0.2% |
| Czechoslovakian | 29 | 0.1% |
| Danish | 16 | 0.0% |
| Dutch | 426 | 0.7% |
| Eastern European | 73 | 0.1% |
| Ecuadorian | 10 | 0.0% |
| English | 5,630 | 9.0% |
| Ethiopian | 159 | 0.3% |
| European | 1,203 | 1.9% |
| Finnish | 24 | 0.0% |
| French | 615 | 1.0% |
| French Canadian | 170 | 0.3% |
| German | 6,488 | 10.3% |
| Greek | 102 | 0.2% |
| Guamanian / Chamorro | 13 | 0.0% |
| Guatemalan | 37 | 0.1% |
| Haitian | 103 | 0.2% |
| Honduran | 26 | 0.0% |
| Hungarian | 82 | 0.1% |
| Indian (Asian) | 5 | 0.0% |
| Irish | 3,142 | 5.0% |
| Iroquois | 5 | 0.0% |
| Israeli | 4 | 0.0% |
| Italian | 801 | 1.3% |
| Jamaican | 16 | 0.0% |
| Jordanian | 1 | 0.0% |
| Korean | 301 | 0.5% |
| Lithuanian | 37 | 0.1% |
| Lumbee | 15 | 0.0% |
| Malaysian | 60 | 0.1% |
| Mexican | 2,175 | 3.5% |
| Moroccan | 31 | 0.1% |
| Nigerian | 15 | 0.0% |
| Northern European | 59 | 0.1% |
| Norwegian | 116 | 0.2% |
| Pakistani | 8 | 0.0% |
| Panamanian | 10 | 0.0% |
| Pennsylvania German | 2 | 0.0% |
| Peruvian | 21 | 0.0% |
| Polish | 431 | 0.7% |
| Portuguese | 53 | 0.1% |
| Puerto Rican | 249 | 0.4% |
| Romanian | 22 | 0.0% |
| Russian | 70 | 0.1% |
| Salvadoran | 29 | 0.1% |
| Scandinavian | 71 | 0.1% |
| Scotch-Irish | 2,023 | 3.2% |
| Scottish | 1,331 | 2.1% |
| Slavic | 15 | 0.0% |
| Slovak | 22 | 0.0% |
| Slovene | 6 | 0.0% |
| South American | 122 | 0.2% |
| Spaniard | 42 | 0.1% |
| Spanish | 17 | 0.0% |
| Sri Lankan | 158 | 0.3% |
| Subsaharan African | 347 | 0.5% |
| Swedish | 137 | 0.2% |
| Swiss | 57 | 0.1% |
| Thai | 26 | 0.0% |
| Turkish | 10 | 0.0% |
| Ukrainian | 300 | 0.5% |
| Welsh | 417 | 0.7% | View All 87 Rows |
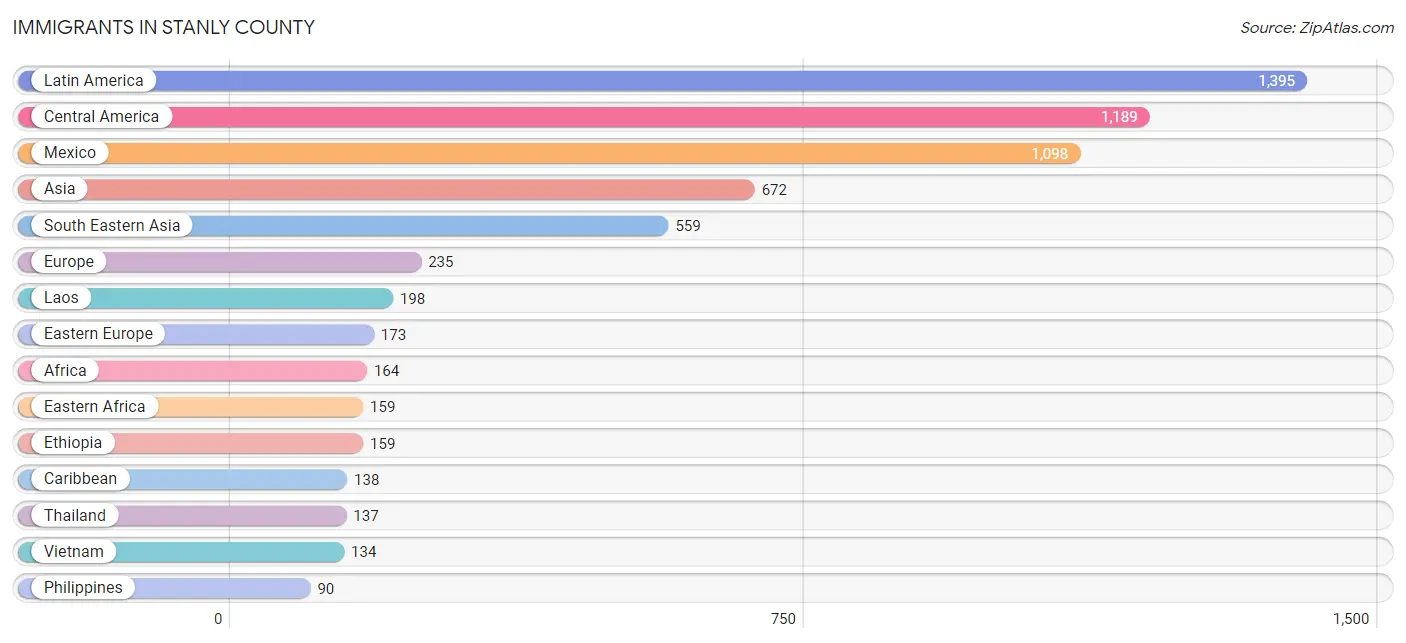
Immigrants in Stanly County
The most numerous immigrant groups reported in Stanly County came from Latin America (1,395 | 2.2%), Central America (1,189 | 1.9%), Mexico (1,098 | 1.8%), Asia (672 | 1.1%), and South Eastern Asia (559 | 0.9%), together accounting for 7.8% of all Stanly County residents.
| Immigration Origin | # Population | % Population |
| Africa | 164 | 0.3% |
| Argentina | 33 | 0.1% |
| Asia | 672 | 1.1% |
| Brazil | 22 | 0.0% |
| Canada | 29 | 0.1% |
| Caribbean | 138 | 0.2% |
| Central America | 1,189 | 1.9% |
| Chile | 9 | 0.0% |
| Colombia | 4 | 0.0% |
| Cuba | 78 | 0.1% |
| Dominican Republic | 44 | 0.1% |
| Eastern Africa | 159 | 0.3% |
| Eastern Asia | 30 | 0.1% |
| Eastern Europe | 173 | 0.3% |
| El Salvador | 13 | 0.0% |
| England | 34 | 0.1% |
| Ethiopia | 159 | 0.3% |
| Europe | 235 | 0.4% |
| Germany | 8 | 0.0% |
| Greece | 5 | 0.0% |
| Guatemala | 37 | 0.1% |
| Haiti | 16 | 0.0% |
| Honduras | 41 | 0.1% |
| India | 75 | 0.1% |
| Ireland | 15 | 0.0% |
| Jordan | 5 | 0.0% |
| Korea | 30 | 0.1% |
| Laos | 198 | 0.3% |
| Latin America | 1,395 | 2.2% |
| Mexico | 1,098 | 1.8% |
| Northern Europe | 49 | 0.1% |
| Philippines | 90 | 0.1% |
| Poland | 32 | 0.1% |
| Romania | 36 | 0.1% |
| Russia | 5 | 0.0% |
| South America | 68 | 0.1% |
| South Central Asia | 75 | 0.1% |
| South Eastern Asia | 559 | 0.9% |
| Southern Europe | 5 | 0.0% |
| Thailand | 137 | 0.2% |
| Turkey | 3 | 0.0% |
| Ukraine | 6 | 0.0% |
| Vietnam | 134 | 0.2% |
| Western Asia | 8 | 0.0% |
| Western Europe | 8 | 0.0% | View All 45 Rows |
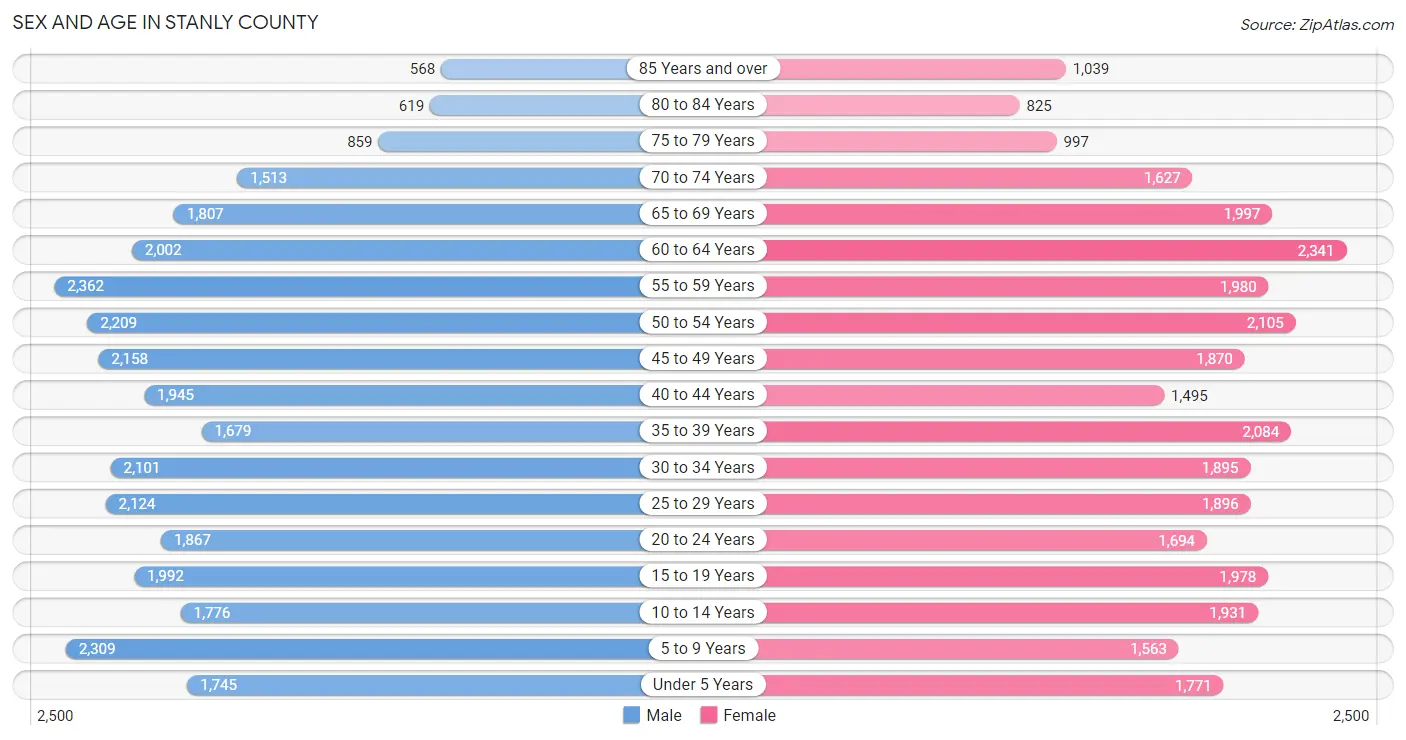
Sex and Age in Stanly County
Sex and Age in Stanly County
The most populous age groups in Stanly County are 55 to 59 Years (2,362 | 7.5%) for men and 60 to 64 Years (2,341 | 7.5%) for women.
| Age Bracket | Male | Female |
| Under 5 Years | 1,745 (5.5%) | 1,771 (5.7%) |
| 5 to 9 Years | 2,309 (7.3%) | 1,563 (5.0%) |
| 10 to 14 Years | 1,776 (5.6%) | 1,931 (6.2%) |
| 15 to 19 Years | 1,992 (6.3%) | 1,978 (6.4%) |
| 20 to 24 Years | 1,867 (5.9%) | 1,694 (5.4%) |
| 25 to 29 Years | 2,124 (6.7%) | 1,896 (6.1%) |
| 30 to 34 Years | 2,101 (6.6%) | 1,895 (6.1%) |
| 35 to 39 Years | 1,679 (5.3%) | 2,084 (6.7%) |
| 40 to 44 Years | 1,945 (6.1%) | 1,495 (4.8%) |
| 45 to 49 Years | 2,158 (6.8%) | 1,870 (6.0%) |
| 50 to 54 Years | 2,209 (7.0%) | 2,105 (6.8%) |
| 55 to 59 Years | 2,362 (7.5%) | 1,980 (6.4%) |
| 60 to 64 Years | 2,002 (6.3%) | 2,341 (7.5%) |
| 65 to 69 Years | 1,807 (5.7%) | 1,997 (6.4%) |
| 70 to 74 Years | 1,513 (4.8%) | 1,627 (5.2%) |
| 75 to 79 Years | 859 (2.7%) | 997 (3.2%) |
| 80 to 84 Years | 619 (2.0%) | 825 (2.6%) |
| 85 Years and over | 568 (1.8%) | 1,039 (3.3%) |
| Total | 31,635 (100.0%) | 31,088 (100.0%) |
Families and Households in Stanly County
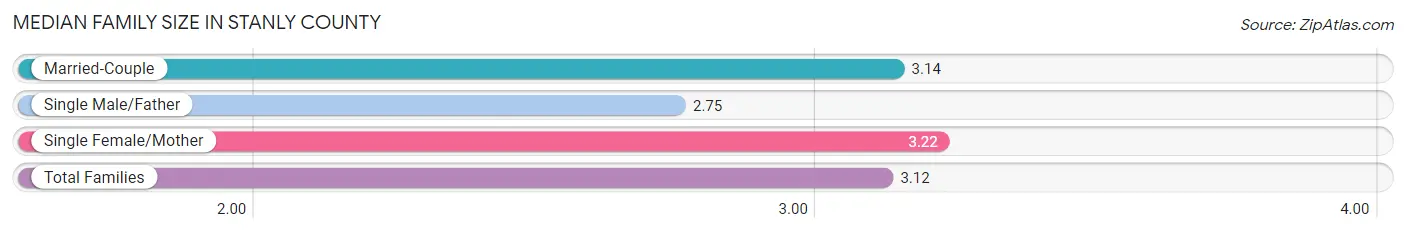
Median Family Size in Stanly County
The median family size in Stanly County is 3.12 persons per family, with single female/mother families (2,635 | 16.3%) accounting for the largest median family size of 3.22 persons per family. On the other hand, single male/father families (1,491 | 9.2%) represent the smallest median family size with 2.75 persons per family.
| Family Type | # Families | Family Size |
| Married-Couple | 12,018 (74.4%) | 3.14 |
| Single Male/Father | 1,491 (9.2%) | 2.75 |
| Single Female/Mother | 2,635 (16.3%) | 3.22 |
| Total Families | 16,144 (100.0%) | 3.12 |
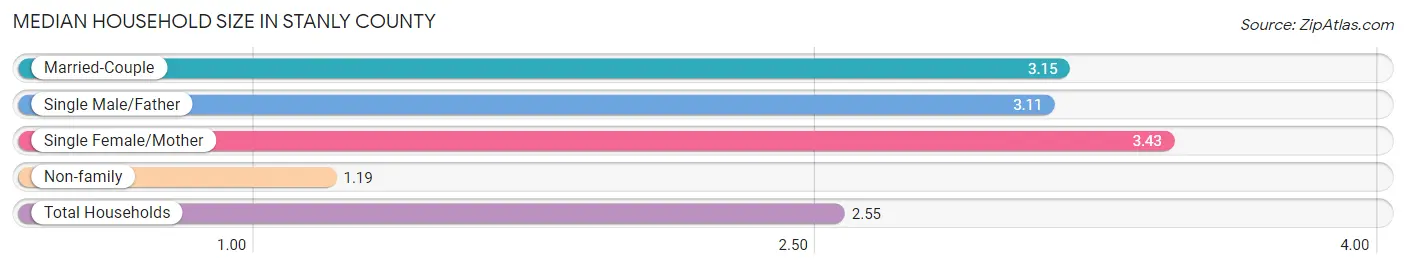
Median Household Size in Stanly County
The median household size in Stanly County is 2.55 persons per household, with single female/mother households (2,635 | 11.1%) accounting for the largest median household size of 3.43 persons per household. non-family households (7,629 | 32.1%) represent the smallest median household size with 1.19 persons per household.
| Household Type | # Households | Household Size |
| Married-Couple | 12,018 (50.5%) | 3.15 |
| Single Male/Father | 1,491 (6.3%) | 3.11 |
| Single Female/Mother | 2,635 (11.1%) | 3.43 |
| Non-family | 7,629 (32.1%) | 1.19 |
| Total Households | 23,773 (100.0%) | 2.55 |
Household Size by Marriage Status in Stanly County
Out of a total of 23,773 households in Stanly County, 16,144 (67.9%) are family households, while 7,629 (32.1%) are nonfamily households. The most numerous type of family households are 2-person households, comprising 7,546, and the most common type of nonfamily households are 1-person households, comprising 6,494.
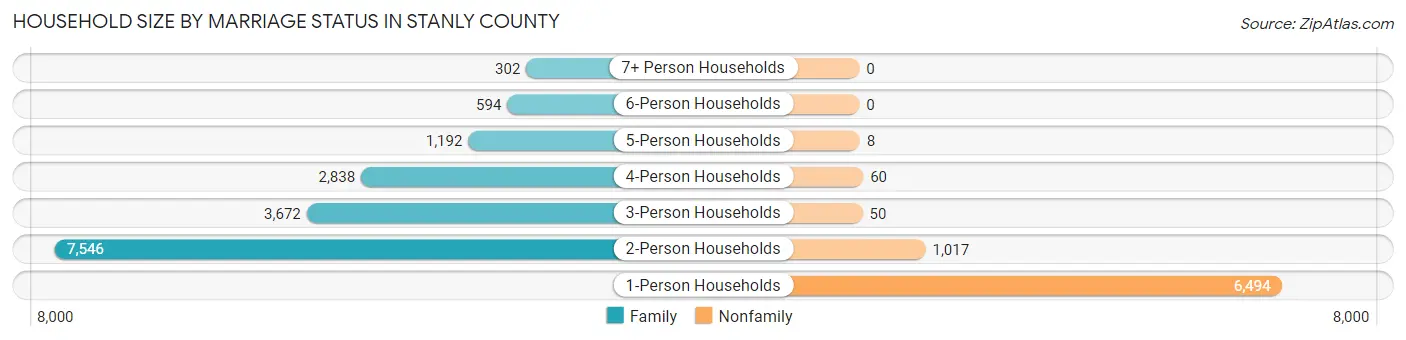
| Household Size | Family Households | Nonfamily Households |
| 1-Person Households | - | 6,494 (27.3%) |
| 2-Person Households | 7,546 (31.7%) | 1,017 (4.3%) |
| 3-Person Households | 3,672 (15.4%) | 50 (0.2%) |
| 4-Person Households | 2,838 (11.9%) | 60 (0.3%) |
| 5-Person Households | 1,192 (5.0%) | 8 (0.0%) |
| 6-Person Households | 594 (2.5%) | 0 (0.0%) |
| 7+ Person Households | 302 (1.3%) | 0 (0.0%) |
| Total | 16,144 (67.9%) | 7,629 (32.1%) |
Female Fertility in Stanly County
Fertility by Age in Stanly County
Average fertility rate in Stanly County is 55.0 births per 1,000 women. Women in the age bracket of 20 to 34 years have the highest fertility rate with 79.0 births per 1,000 women. Women in the age bracket of 20 to 34 years acount for 59.9% of all women with births.
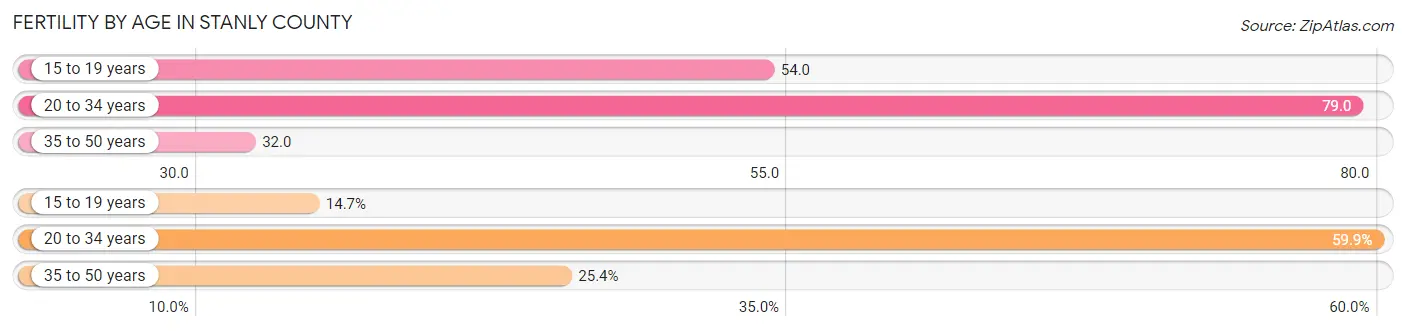
| Age Bracket | Women with Births | Births / 1,000 Women |
| 15 to 19 years | 107 (14.7%) | 54.0 |
| 20 to 34 years | 436 (59.9%) | 79.0 |
| 35 to 50 years | 185 (25.4%) | 32.0 |
| Total | 728 (100.0%) | 55.0 |
Fertility by Age by Marriage Status in Stanly County
59.3% of women with births (728) in Stanly County are married. The highest percentage of unmarried women with births falls into 15 to 19 years age bracket with 100.0% of them unmarried at the time of birth, while the lowest percentage of unmarried women with births belong to 35 to 50 years age bracket with 8.7% of them unmarried.
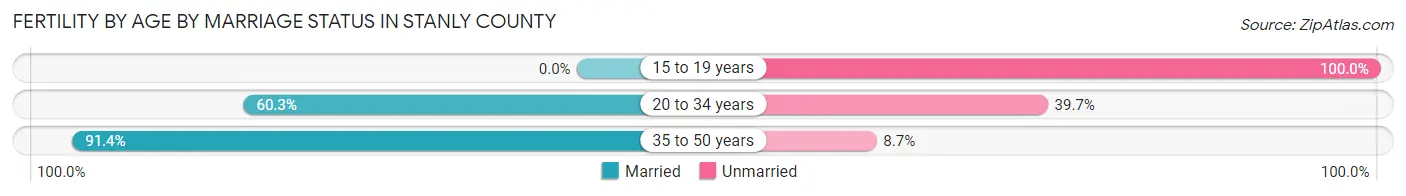
| Age Bracket | Married | Unmarried |
| 15 to 19 years | 0 (0.0%) | 107 (100.0%) |
| 20 to 34 years | 263 (60.3%) | 173 (39.7%) |
| 35 to 50 years | 169 (91.3%) | 16 (8.6%) |
| Total | 432 (59.3%) | 296 (40.7%) |
Fertility by Education in Stanly County
Average fertility rate in Stanly County is 55.0 births per 1,000 women. Women with the education attainment of bachelor's degree have the highest fertility rate of 89.0 births per 1,000 women, while women with the education attainment of graduate degree have the lowest fertility at 9.0 births per 1,000 women. Women with the education attainment of college or associate's degree represent 29.8% of all women with births.
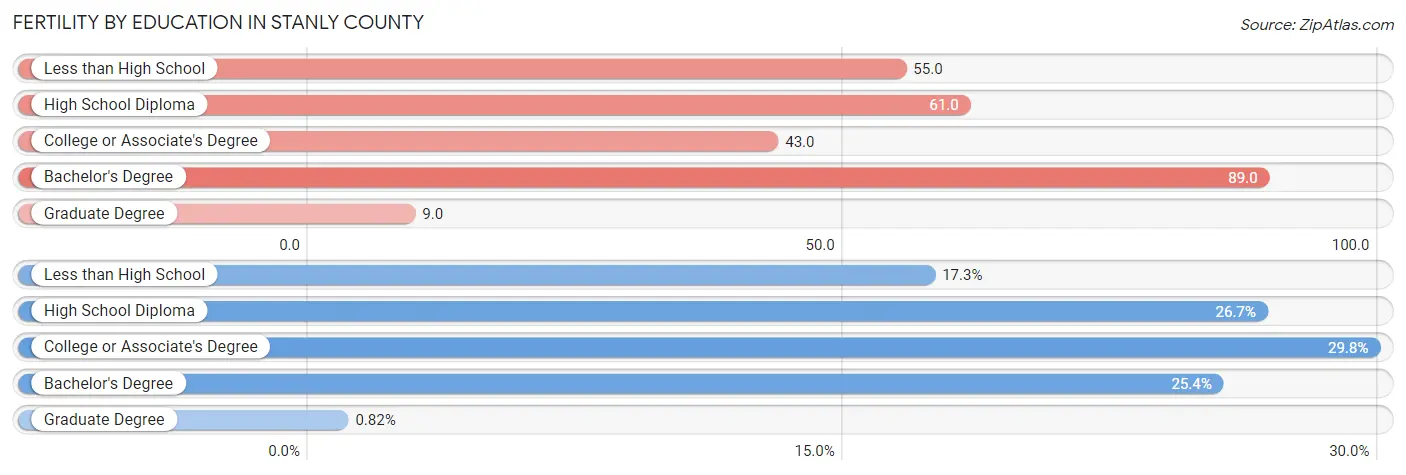
| Educational Attainment | Women with Births | Births / 1,000 Women |
| Less than High School | 126 (17.3%) | 55.0 |
| High School Diploma | 194 (26.7%) | 61.0 |
| College or Associate's Degree | 217 (29.8%) | 43.0 |
| Bachelor's Degree | 185 (25.4%) | 89.0 |
| Graduate Degree | 6 (0.8%) | 9.0 |
| Total | 728 (100.0%) | 55.0 |
Fertility by Education by Marriage Status in Stanly County
40.7% of women with births in Stanly County are unmarried. Women with the educational attainment of graduate degree are most likely to be married with 100.0% of them married at childbirth, while women with the educational attainment of less than high school are least likely to be married with 100.0% of them unmarried at childbirth.
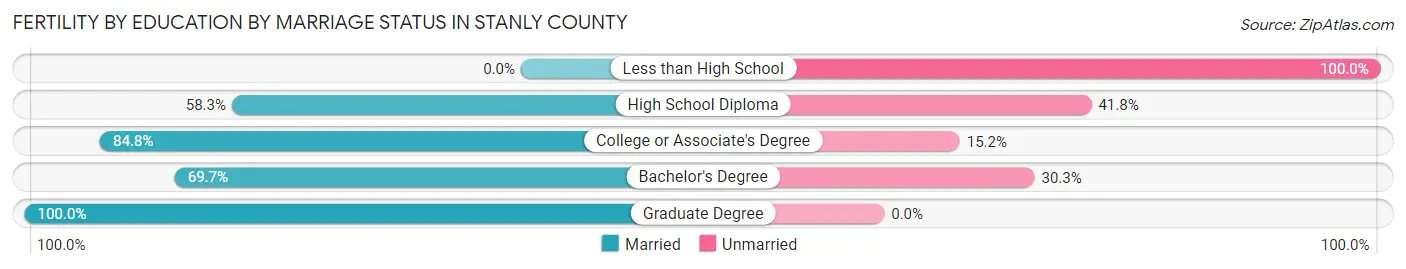
| Educational Attainment | Married | Unmarried |
| Less than High School | 0 (0.0%) | 126 (100.0%) |
| High School Diploma | 113 (58.3%) | 81 (41.7%) |
| College or Associate's Degree | 184 (84.8%) | 33 (15.2%) |
| Bachelor's Degree | 129 (69.7%) | 56 (30.3%) |
| Graduate Degree | 6 (100.0%) | 0 (0.0%) |
| Total | 432 (59.3%) | 296 (40.7%) |
Employment Characteristics in Stanly County
Employment by Class of Employer in Stanly County
Among the 28,124 employed individuals in Stanly County, private company employees (19,571 | 69.6%), not-for-profit organizations (1,992 | 7.1%), and local government employees (1,944 | 6.9%) make up the most common classes of employment.
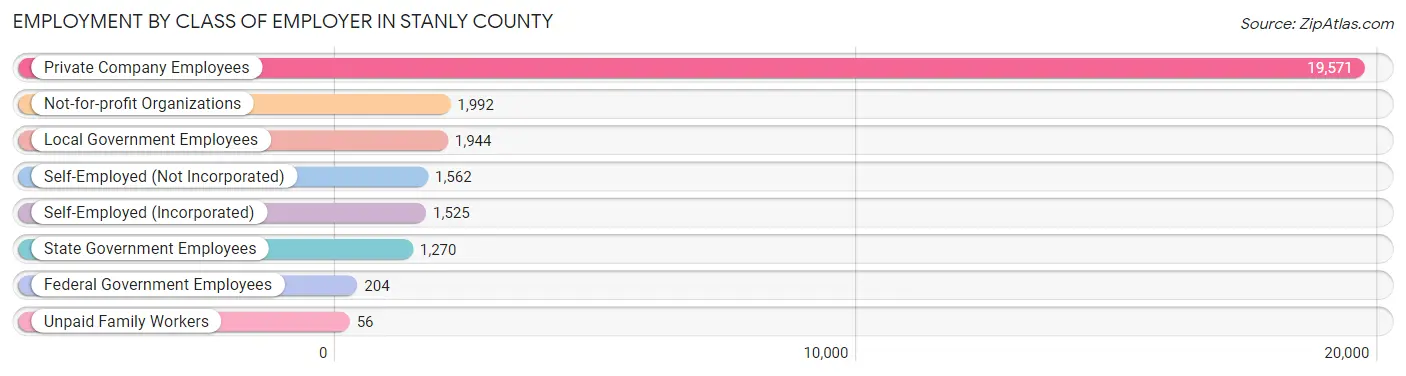
| Employer Class | # Employees | % Employees |
| Private Company Employees | 19,571 | 69.6% |
| Self-Employed (Incorporated) | 1,525 | 5.4% |
| Self-Employed (Not Incorporated) | 1,562 | 5.6% |
| Not-for-profit Organizations | 1,992 | 7.1% |
| Local Government Employees | 1,944 | 6.9% |
| State Government Employees | 1,270 | 4.5% |
| Federal Government Employees | 204 | 0.7% |
| Unpaid Family Workers | 56 | 0.2% |
| Total | 28,124 | 100.0% |
Employment Status by Age in Stanly County
According to the labor force statistics for Stanly County, out of the total population over 16 years of age (50,742), 59.3% or 30,090 individuals are in the labor force, with 4.3% or 1,294 of them unemployed. The age group with the highest labor force participation rate is 25 to 29 years, with 84.2% or 3,385 individuals in the labor force. Within the labor force, the 16 to 19 years age range has the highest percentage of unemployed individuals, with 7.5% or 116 of them being unemployed.
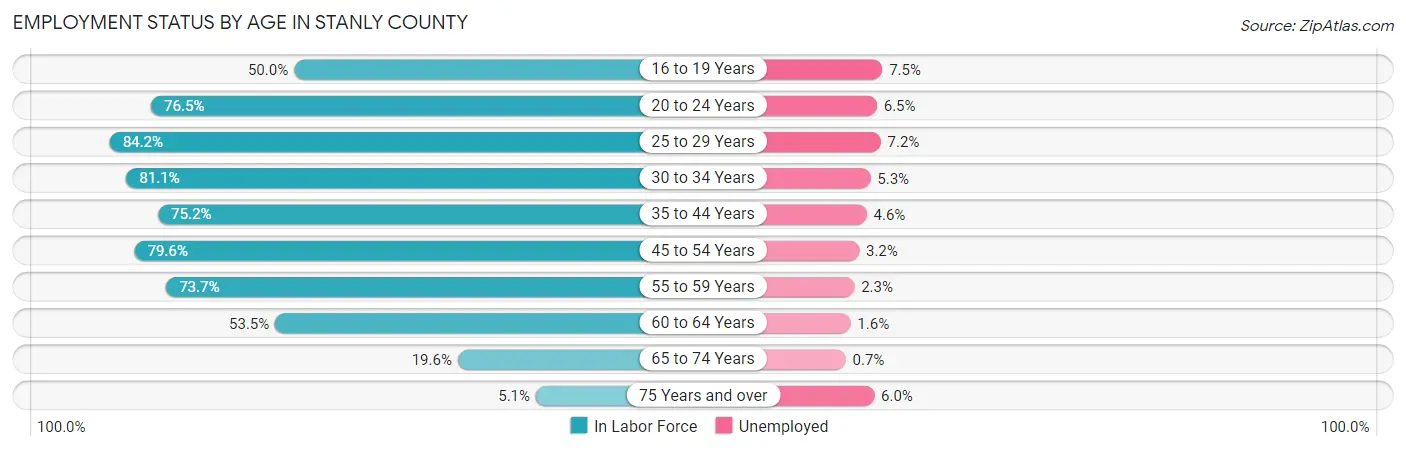
| Age Bracket | In Labor Force | Unemployed |
| 16 to 19 Years | 1,542 (50.0%) | 116 (7.5%) |
| 20 to 24 Years | 2,724 (76.5%) | 177 (6.5%) |
| 25 to 29 Years | 3,385 (84.2%) | 244 (7.2%) |
| 30 to 34 Years | 3,241 (81.1%) | 172 (5.3%) |
| 35 to 44 Years | 5,417 (75.2%) | 249 (4.6%) |
| 45 to 54 Years | 6,640 (79.6%) | 212 (3.2%) |
| 55 to 59 Years | 3,200 (73.7%) | 74 (2.3%) |
| 60 to 64 Years | 2,324 (53.5%) | 37 (1.6%) |
| 65 to 74 Years | 1,361 (19.6%) | 10 (0.7%) |
| 75 Years and over | 250 (5.1%) | 15 (6.0%) |
| Total | 30,090 (59.3%) | 1,294 (4.3%) |
Employment Status by Educational Attainment in Stanly County
According to labor force statistics for Stanly County, 75.0% of individuals (24,184) out of the total population between 25 and 64 years of age (32,246) are in the labor force, with 4.1% or 992 of them being unemployed. The group with the highest labor force participation rate are those with the educational attainment of bachelor's degree or higher, with 84.4% or 5,289 individuals in the labor force. Within the labor force, individuals with high school diploma education have the highest percentage of unemployment, with 5.9% or 435 of them being unemployed.
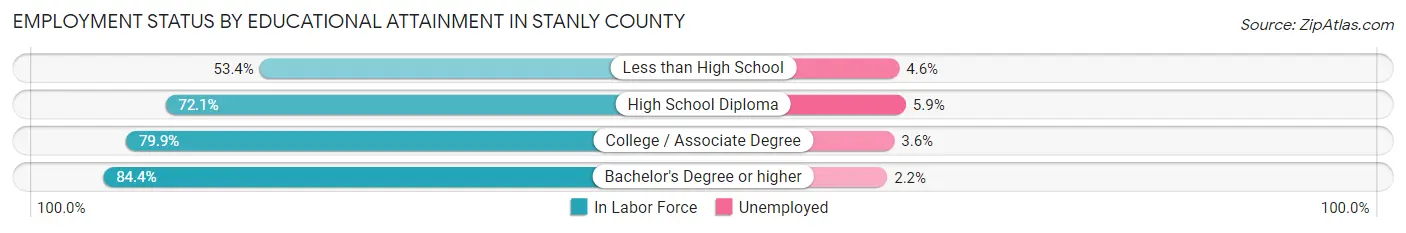
| Educational Attainment | In Labor Force | Unemployed |
| Less than High School | 2,130 (53.4%) | 183 (4.6%) |
| High School Diploma | 7,372 (72.1%) | 603 (5.9%) |
| College / Associate Degree | 9,403 (79.9%) | 424 (3.6%) |
| Bachelor's Degree or higher | 5,289 (84.4%) | 138 (2.2%) |
| Total | 24,184 (75.0%) | 1,322 (4.1%) |
Employment Occupations by Sex in Stanly County
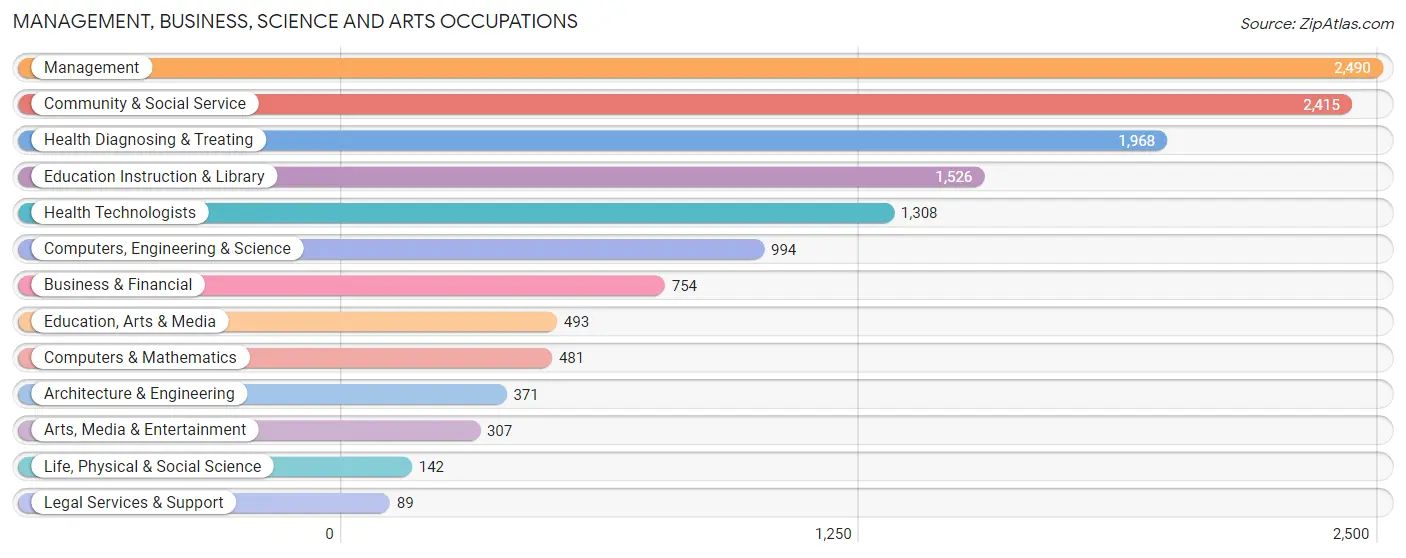
Management, Business, Science and Arts Occupations
The most common Management, Business, Science and Arts occupations in Stanly County are Management (2,490 | 8.7%), Community & Social Service (2,415 | 8.4%), Health Diagnosing & Treating (1,968 | 6.9%), Education Instruction & Library (1,526 | 5.3%), and Health Technologists (1,308 | 4.5%).
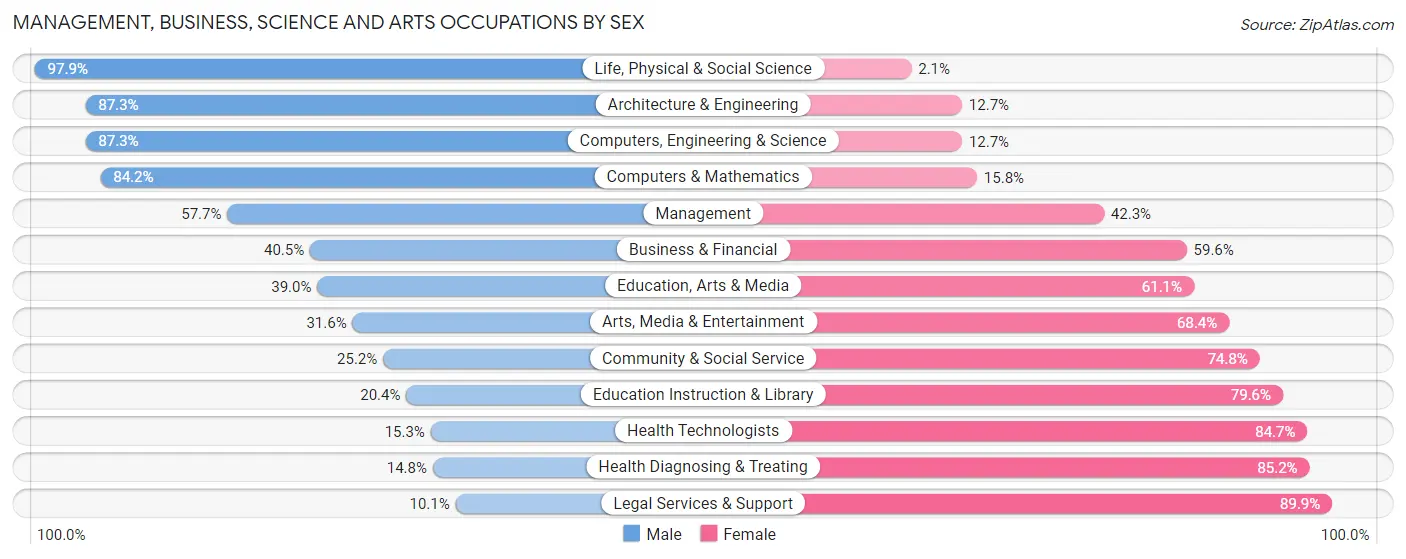
Management, Business, Science and Arts Occupations by Sex
Within the Management, Business, Science and Arts occupations in Stanly County, the most male-oriented occupations are Life, Physical & Social Science (97.9%), Architecture & Engineering (87.3%), and Computers, Engineering & Science (87.3%), while the most female-oriented occupations are Legal Services & Support (89.9%), Health Diagnosing & Treating (85.2%), and Health Technologists (84.7%).
| Occupation | Male | Female |
| Management | 1,437 (57.7%) | 1,053 (42.3%) |
| Business & Financial | 305 (40.5%) | 449 (59.6%) |
| Computers, Engineering & Science | 868 (87.3%) | 126 (12.7%) |
| Computers & Mathematics | 405 (84.2%) | 76 (15.8%) |
| Architecture & Engineering | 324 (87.3%) | 47 (12.7%) |
| Life, Physical & Social Science | 139 (97.9%) | 3 (2.1%) |
| Community & Social Service | 609 (25.2%) | 1,806 (74.8%) |
| Education, Arts & Media | 192 (39.0%) | 301 (61.1%) |
| Legal Services & Support | 9 (10.1%) | 80 (89.9%) |
| Education Instruction & Library | 311 (20.4%) | 1,215 (79.6%) |
| Arts, Media & Entertainment | 97 (31.6%) | 210 (68.4%) |
| Health Diagnosing & Treating | 292 (14.8%) | 1,676 (85.2%) |
| Health Technologists | 200 (15.3%) | 1,108 (84.7%) |
| Total (Category) | 3,511 (40.7%) | 5,110 (59.3%) |
| Total (Overall) | 15,691 (54.6%) | 13,048 (45.4%) |
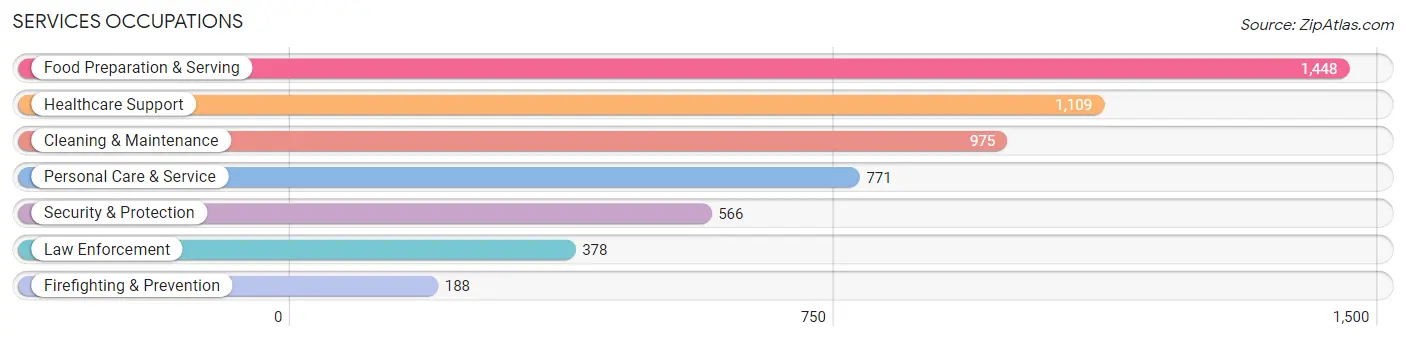
Services Occupations
The most common Services occupations in Stanly County are Food Preparation & Serving (1,448 | 5.0%), Healthcare Support (1,109 | 3.9%), Cleaning & Maintenance (975 | 3.4%), Personal Care & Service (771 | 2.7%), and Security & Protection (566 | 2.0%).
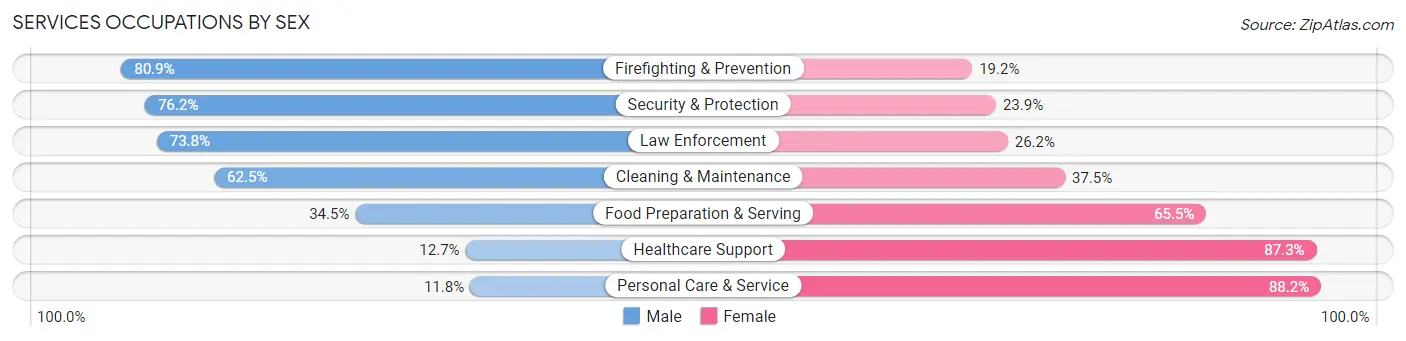
Services Occupations by Sex
Within the Services occupations in Stanly County, the most male-oriented occupations are Firefighting & Prevention (80.8%), Security & Protection (76.1%), and Law Enforcement (73.8%), while the most female-oriented occupations are Personal Care & Service (88.2%), Healthcare Support (87.3%), and Food Preparation & Serving (65.5%).
| Occupation | Male | Female |
| Healthcare Support | 141 (12.7%) | 968 (87.3%) |
| Security & Protection | 431 (76.1%) | 135 (23.8%) |
| Firefighting & Prevention | 152 (80.8%) | 36 (19.2%) |
| Law Enforcement | 279 (73.8%) | 99 (26.2%) |
| Food Preparation & Serving | 500 (34.5%) | 948 (65.5%) |
| Cleaning & Maintenance | 609 (62.5%) | 366 (37.5%) |
| Personal Care & Service | 91 (11.8%) | 680 (88.2%) |
| Total (Category) | 1,772 (36.4%) | 3,097 (63.6%) |
| Total (Overall) | 15,691 (54.6%) | 13,048 (45.4%) |
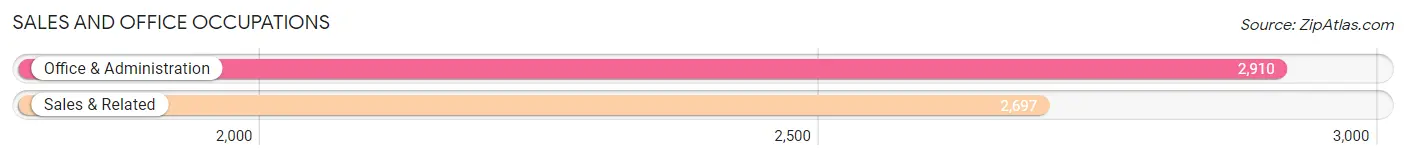
Sales and Office Occupations
The most common Sales and Office occupations in Stanly County are Office & Administration (2,910 | 10.1%), and Sales & Related (2,697 | 9.4%).
Sales and Office Occupations by Sex
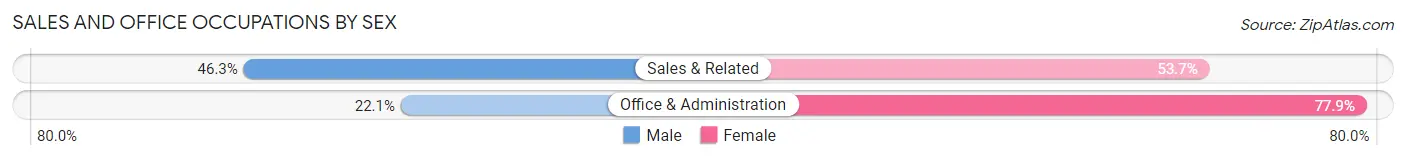
| Occupation | Male | Female |
| Sales & Related | 1,249 (46.3%) | 1,448 (53.7%) |
| Office & Administration | 644 (22.1%) | 2,266 (77.9%) |
| Total (Category) | 1,893 (33.8%) | 3,714 (66.2%) |
| Total (Overall) | 15,691 (54.6%) | 13,048 (45.4%) |
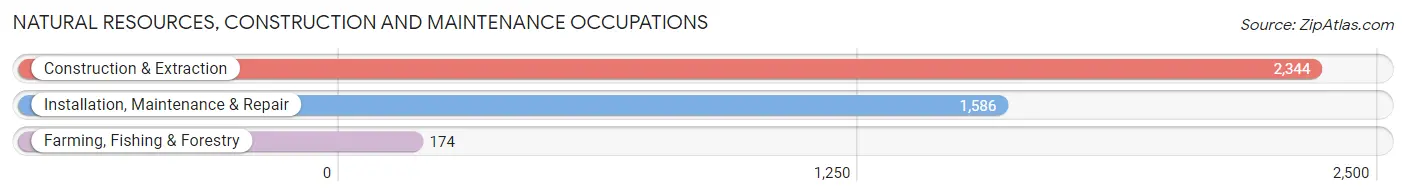
Natural Resources, Construction and Maintenance Occupations
The most common Natural Resources, Construction and Maintenance occupations in Stanly County are Construction & Extraction (2,344 | 8.2%), Installation, Maintenance & Repair (1,586 | 5.5%), and Farming, Fishing & Forestry (174 | 0.6%).
Natural Resources, Construction and Maintenance Occupations by Sex
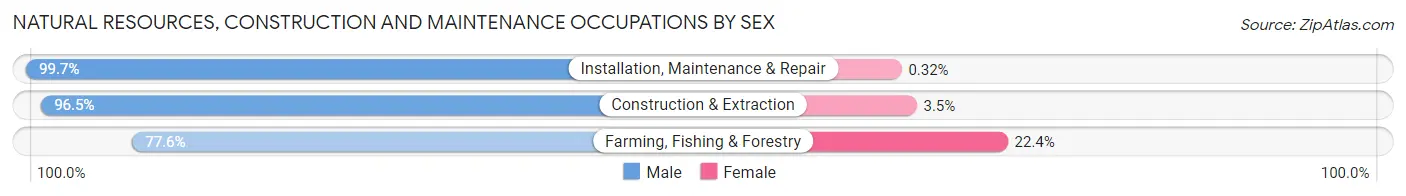
| Occupation | Male | Female |
| Farming, Fishing & Forestry | 135 (77.6%) | 39 (22.4%) |
| Construction & Extraction | 2,263 (96.5%) | 81 (3.5%) |
| Installation, Maintenance & Repair | 1,581 (99.7%) | 5 (0.3%) |
| Total (Category) | 3,979 (97.0%) | 125 (3.0%) |
| Total (Overall) | 15,691 (54.6%) | 13,048 (45.4%) |
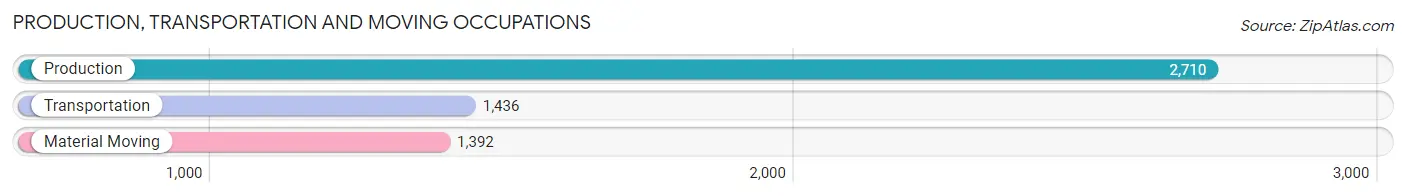
Production, Transportation and Moving Occupations
The most common Production, Transportation and Moving occupations in Stanly County are Production (2,710 | 9.4%), Transportation (1,436 | 5.0%), and Material Moving (1,392 | 4.8%).
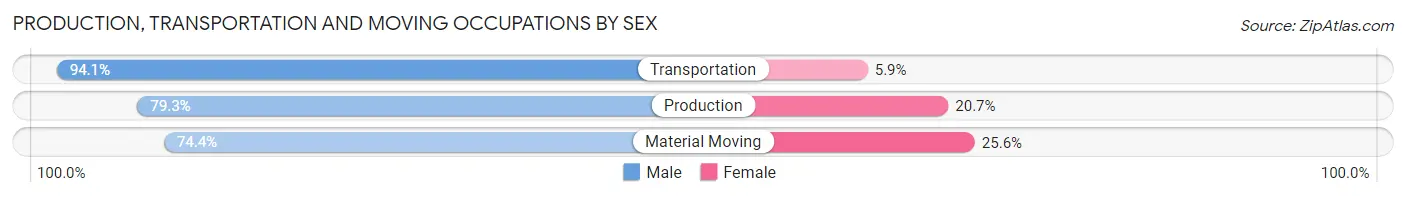
Production, Transportation and Moving Occupations by Sex
| Occupation | Male | Female |
| Production | 2,149 (79.3%) | 561 (20.7%) |
| Transportation | 1,351 (94.1%) | 85 (5.9%) |
| Material Moving | 1,036 (74.4%) | 356 (25.6%) |
| Total (Category) | 4,536 (81.9%) | 1,002 (18.1%) |
| Total (Overall) | 15,691 (54.6%) | 13,048 (45.4%) |
Employment Industries by Sex in Stanly County
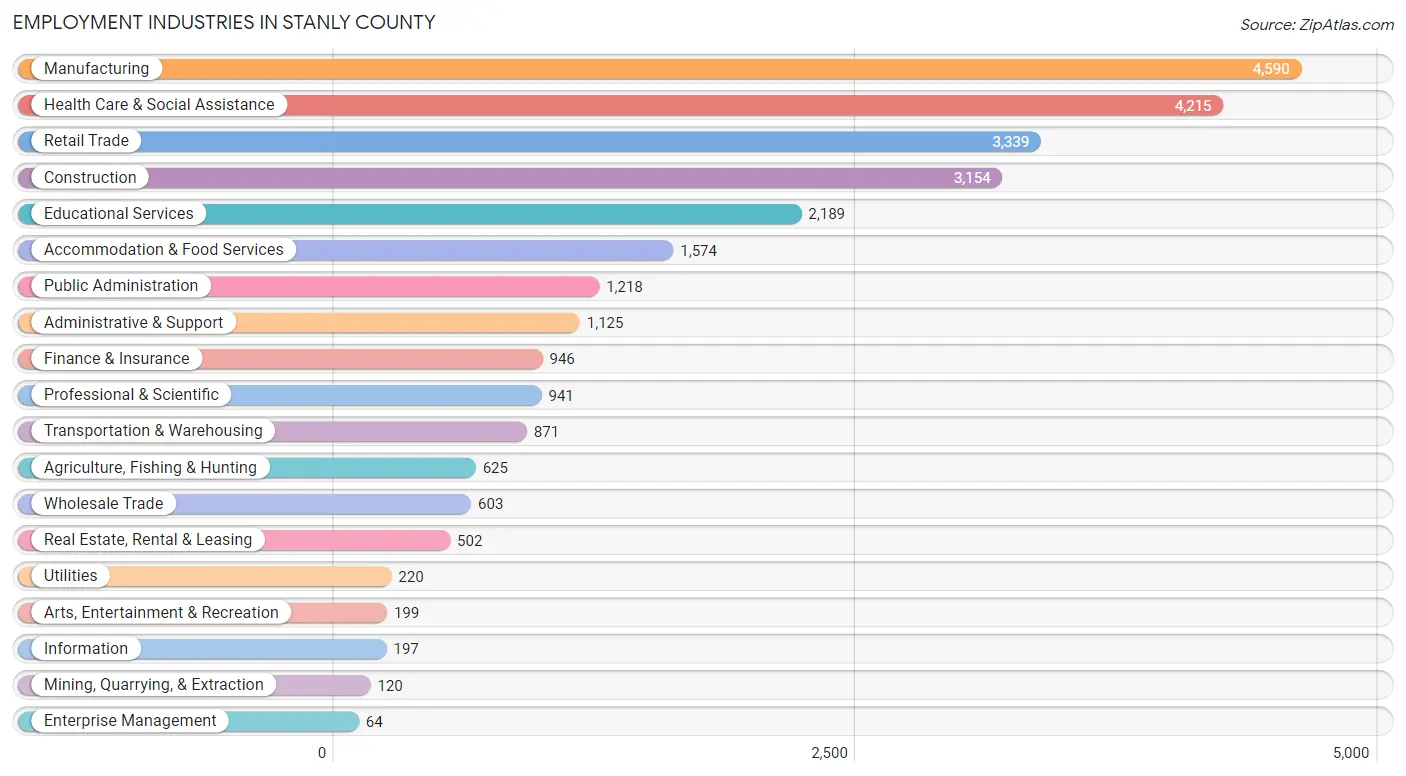
Employment Industries in Stanly County
The major employment industries in Stanly County include Manufacturing (4,590 | 16.0%), Health Care & Social Assistance (4,215 | 14.7%), Retail Trade (3,339 | 11.6%), Construction (3,154 | 11.0%), and Educational Services (2,189 | 7.6%).
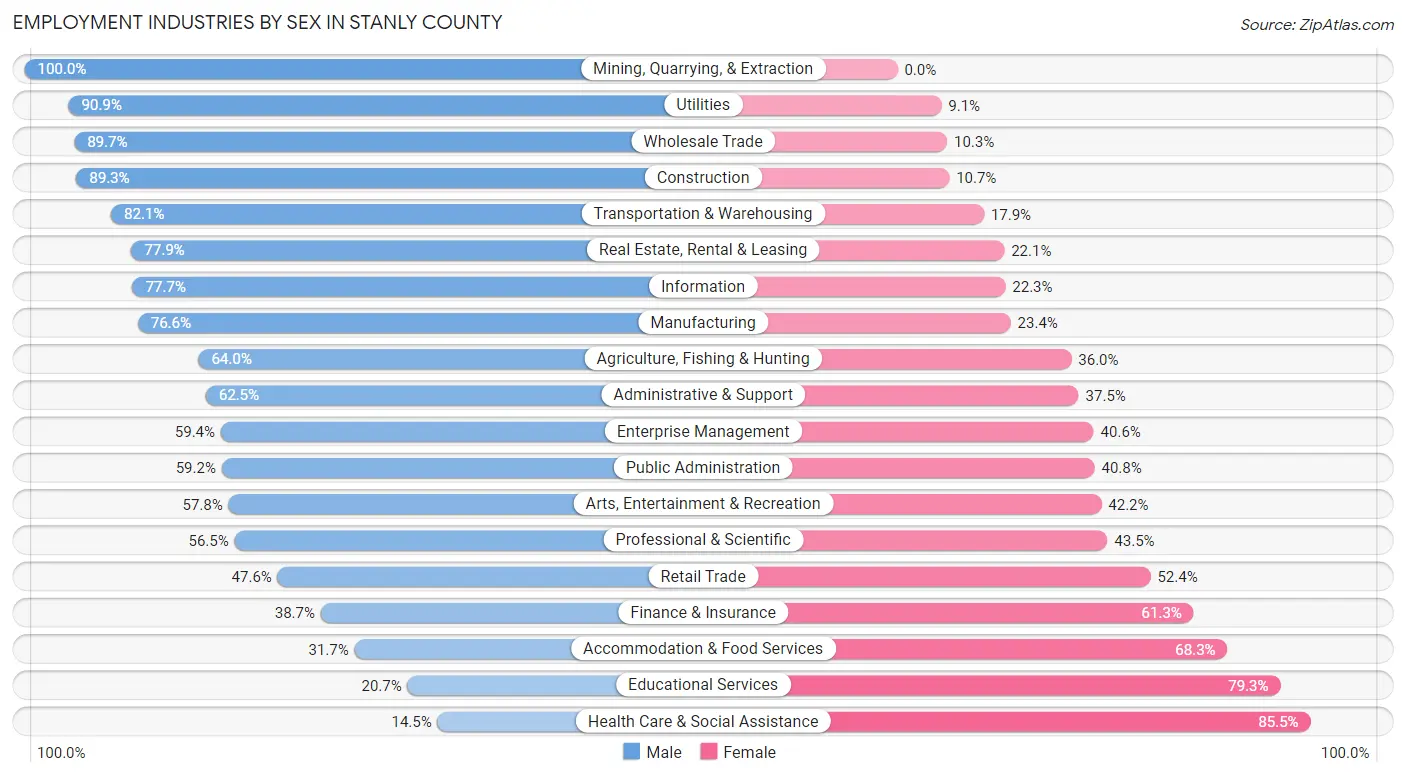
Employment Industries by Sex in Stanly County
The Stanly County industries that see more men than women are Mining, Quarrying, & Extraction (100.0%), Utilities (90.9%), and Wholesale Trade (89.7%), whereas the industries that tend to have a higher number of women are Health Care & Social Assistance (85.5%), Educational Services (79.3%), and Accommodation & Food Services (68.3%).
| Industry | Male | Female |
| Agriculture, Fishing & Hunting | 400 (64.0%) | 225 (36.0%) |
| Mining, Quarrying, & Extraction | 120 (100.0%) | 0 (0.0%) |
| Construction | 2,816 (89.3%) | 338 (10.7%) |
| Manufacturing | 3,514 (76.6%) | 1,076 (23.4%) |
| Wholesale Trade | 541 (89.7%) | 62 (10.3%) |
| Retail Trade | 1,590 (47.6%) | 1,749 (52.4%) |
| Transportation & Warehousing | 715 (82.1%) | 156 (17.9%) |
| Utilities | 200 (90.9%) | 20 (9.1%) |
| Information | 153 (77.7%) | 44 (22.3%) |
| Finance & Insurance | 366 (38.7%) | 580 (61.3%) |
| Real Estate, Rental & Leasing | 391 (77.9%) | 111 (22.1%) |
| Professional & Scientific | 532 (56.5%) | 409 (43.5%) |
| Enterprise Management | 38 (59.4%) | 26 (40.6%) |
| Administrative & Support | 703 (62.5%) | 422 (37.5%) |
| Educational Services | 454 (20.7%) | 1,735 (79.3%) |
| Health Care & Social Assistance | 612 (14.5%) | 3,603 (85.5%) |
| Arts, Entertainment & Recreation | 115 (57.8%) | 84 (42.2%) |
| Accommodation & Food Services | 499 (31.7%) | 1,075 (68.3%) |
| Public Administration | 721 (59.2%) | 497 (40.8%) |
| Total | 15,691 (54.6%) | 13,048 (45.4%) |
Education in Stanly County
School Enrollment in Stanly County
The most common levels of schooling among the 13,421 students in Stanly County are elementary school (3,026 | 22.6%), high school (2,902 | 21.6%), and middle school (2,794 | 20.8%).
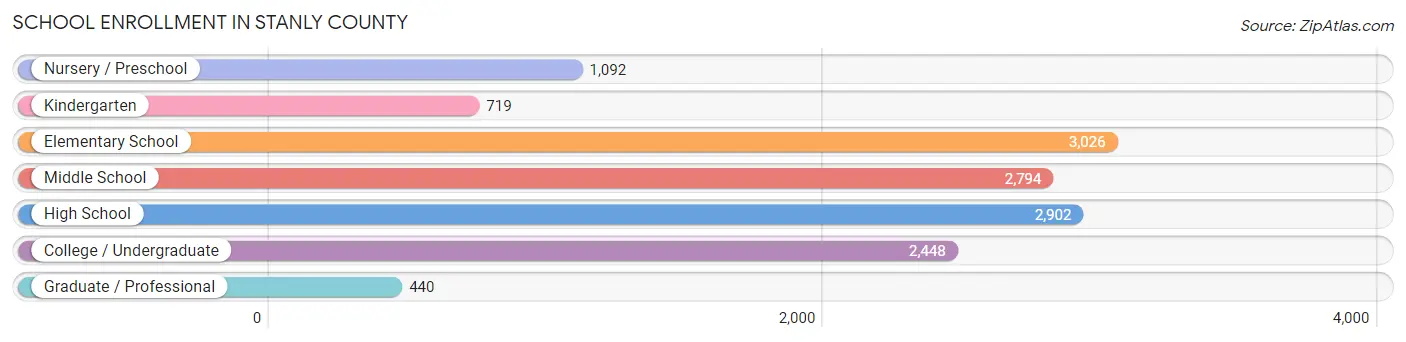
| School Level | # Students | % Students |
| Nursery / Preschool | 1,092 | 8.1% |
| Kindergarten | 719 | 5.4% |
| Elementary School | 3,026 | 22.6% |
| Middle School | 2,794 | 20.8% |
| High School | 2,902 | 21.6% |
| College / Undergraduate | 2,448 | 18.2% |
| Graduate / Professional | 440 | 3.3% |
| Total | 13,421 | 100.0% |
School Enrollment by Age by Funding Source in Stanly County
Out of a total of 13,421 students who are enrolled in schools in Stanly County, 2,738 (20.4%) attend a private institution, while the remaining 10,683 (79.6%) are enrolled in public schools. The age group of 3 to 4 year olds has the highest likelihood of being enrolled in private schools, with 375 (60.4% in the age bracket) enrolled. Conversely, the age group of 15 to 17 year olds has the lowest likelihood of being enrolled in a private school, with 1,979 (89.4% in the age bracket) attending a public institution.
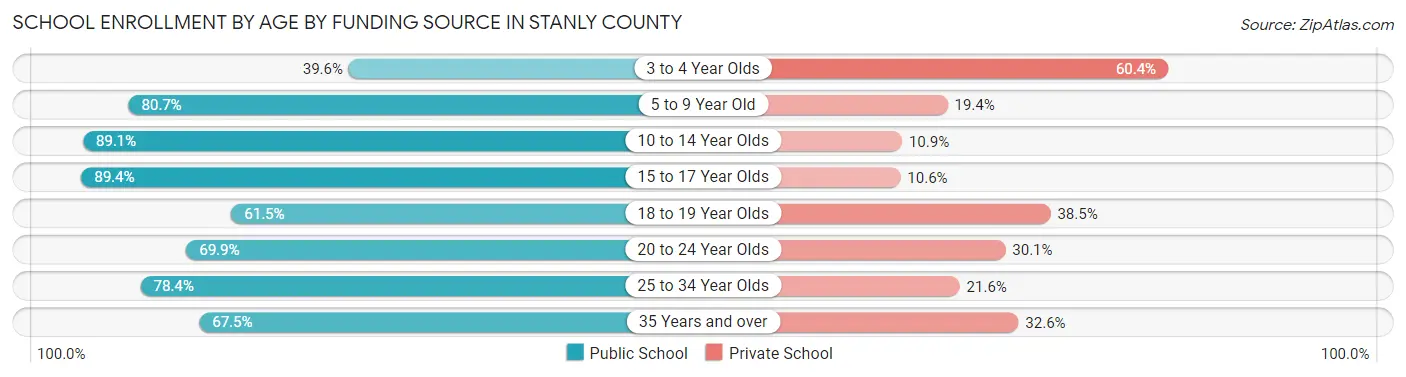
| Age Bracket | Public School | Private School |
| 3 to 4 Year Olds | 246 (39.6%) | 375 (60.4%) |
| 5 to 9 Year Old | 2,922 (80.6%) | 701 (19.4%) |
| 10 to 14 Year Olds | 3,257 (89.1%) | 397 (10.9%) |
| 15 to 17 Year Olds | 1,979 (89.4%) | 234 (10.6%) |
| 18 to 19 Year Olds | 498 (61.5%) | 312 (38.5%) |
| 20 to 24 Year Olds | 782 (69.9%) | 337 (30.1%) |
| 25 to 34 Year Olds | 519 (78.4%) | 143 (21.6%) |
| 35 Years and over | 485 (67.4%) | 234 (32.6%) |
| Total | 10,683 (79.6%) | 2,738 (20.4%) |
Educational Attainment by Field of Study in Stanly County
Education (1,766 | 20.1%), business (1,599 | 18.2%), science & technology (958 | 10.9%), arts & humanities (861 | 9.8%), and bio, nature & agricultural (588 | 6.7%) are the most common fields of study among 8,790 individuals in Stanly County who have obtained a bachelor's degree or higher.
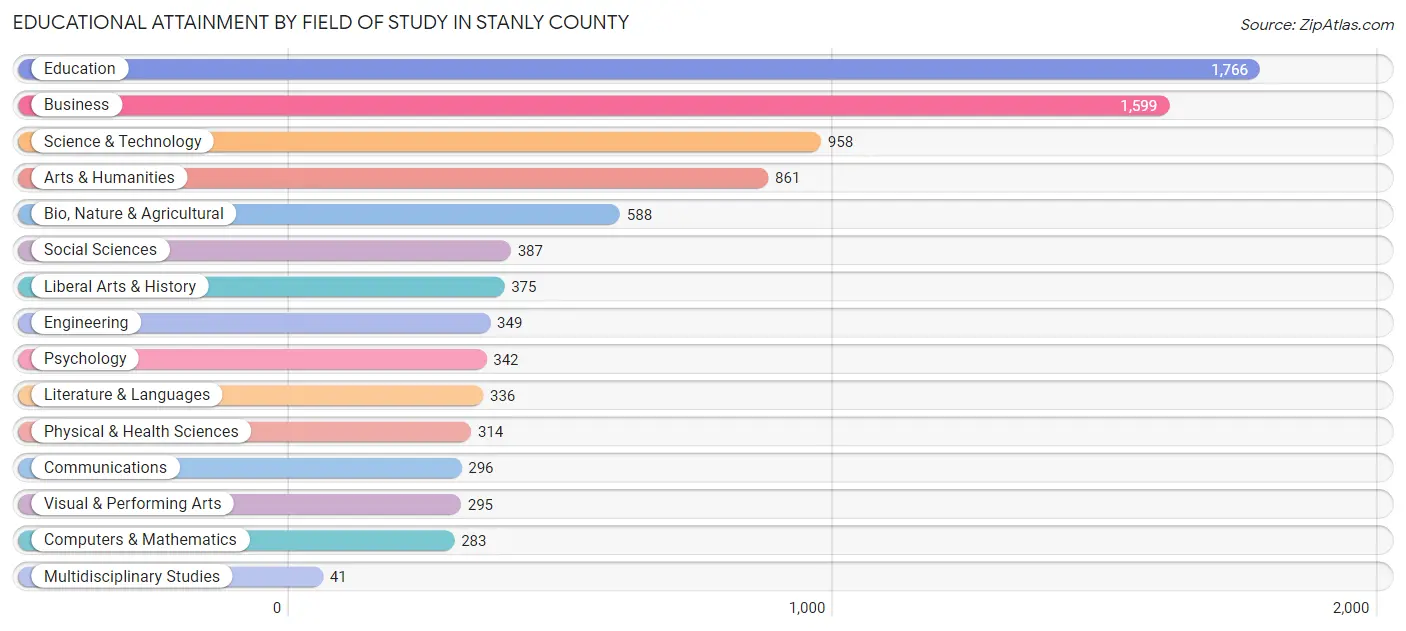
| Field of Study | # Graduates | % Graduates |
| Computers & Mathematics | 283 | 3.2% |
| Bio, Nature & Agricultural | 588 | 6.7% |
| Physical & Health Sciences | 314 | 3.6% |
| Psychology | 342 | 3.9% |
| Social Sciences | 387 | 4.4% |
| Engineering | 349 | 4.0% |
| Multidisciplinary Studies | 41 | 0.5% |
| Science & Technology | 958 | 10.9% |
| Business | 1,599 | 18.2% |
| Education | 1,766 | 20.1% |
| Literature & Languages | 336 | 3.8% |
| Liberal Arts & History | 375 | 4.3% |
| Visual & Performing Arts | 295 | 3.4% |
| Communications | 296 | 3.4% |
| Arts & Humanities | 861 | 9.8% |
| Total | 8,790 | 100.0% |
Transportation & Commute in Stanly County
Vehicle Availability by Sex in Stanly County
The most prevalent vehicle ownership categories in Stanly County are males with 2 vehicles (4,979, accounting for 32.4%) and females with 2 vehicles (3,967, making up 39.6%).
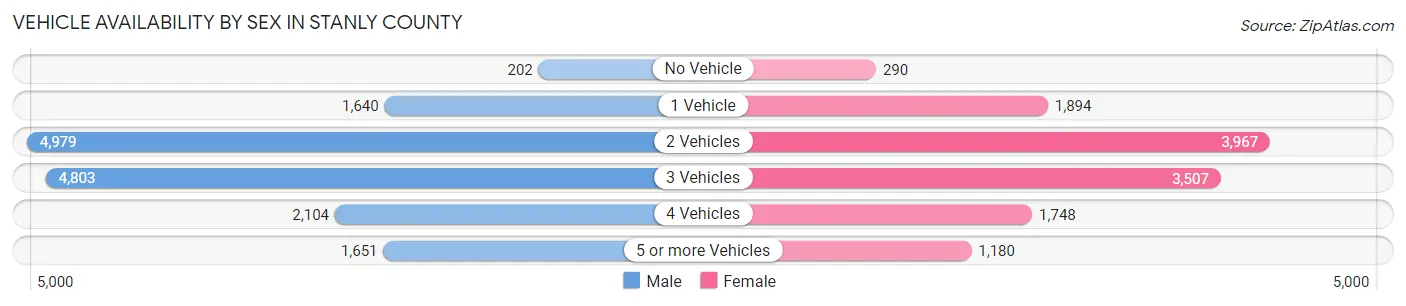
| Vehicles Available | Male | Female |
| No Vehicle | 202 (1.3%) | 290 (2.3%) |
| 1 Vehicle | 1,640 (10.7%) | 1,894 (15.0%) |
| 2 Vehicles | 4,979 (32.4%) | 3,967 (31.5%) |
| 3 Vehicles | 4,803 (31.2%) | 3,507 (27.9%) |
| 4 Vehicles | 2,104 (13.7%) | 1,748 (13.9%) |
| 5 or more Vehicles | 1,651 (10.7%) | 1,180 (9.4%) |
| Total | 15,379 (100.0%) | 12,586 (100.0%) |
Commute Time in Stanly County
The most frequently occuring commute durations in Stanly County are 10 to 14 minutes (3,935 commuters, 14.9%), 5 to 9 minutes (3,281 commuters, 12.5%), and 20 to 24 minutes (3,049 commuters, 11.6%).
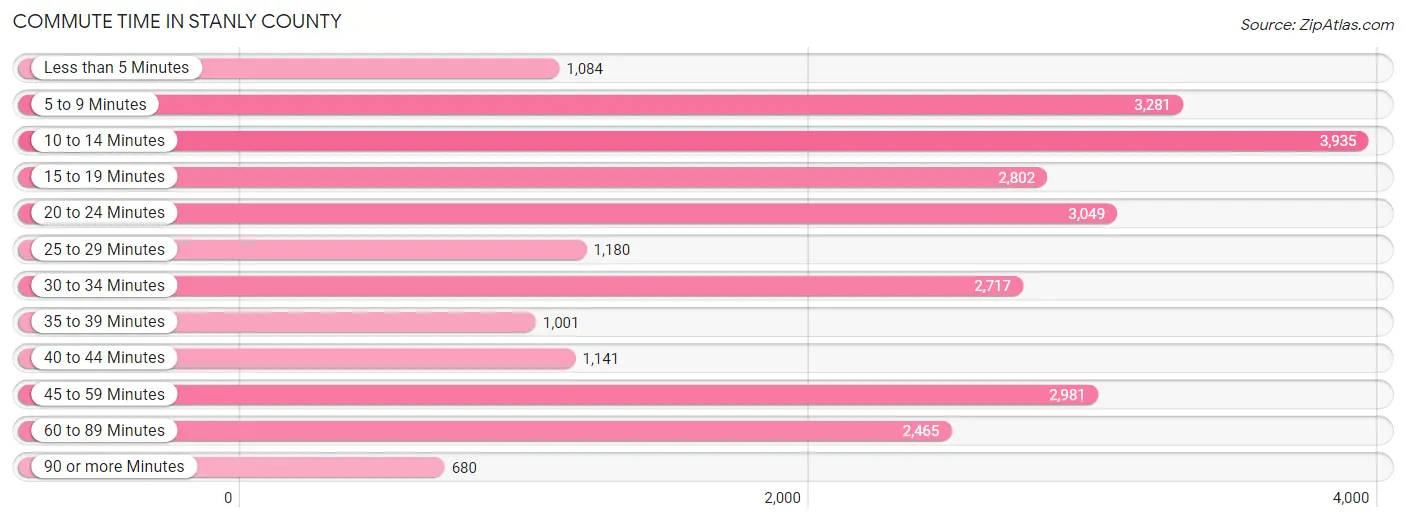
| Commute Time | # Commuters | % Commuters |
| Less than 5 Minutes | 1,084 | 4.1% |
| 5 to 9 Minutes | 3,281 | 12.5% |
| 10 to 14 Minutes | 3,935 | 14.9% |
| 15 to 19 Minutes | 2,802 | 10.6% |
| 20 to 24 Minutes | 3,049 | 11.6% |
| 25 to 29 Minutes | 1,180 | 4.5% |
| 30 to 34 Minutes | 2,717 | 10.3% |
| 35 to 39 Minutes | 1,001 | 3.8% |
| 40 to 44 Minutes | 1,141 | 4.3% |
| 45 to 59 Minutes | 2,981 | 11.3% |
| 60 to 89 Minutes | 2,465 | 9.4% |
| 90 or more Minutes | 680 | 2.6% |
Commute Time by Sex in Stanly County
The most common commute times in Stanly County are 10 to 14 minutes (1,943 commuters, 13.3%) for males and 10 to 14 minutes (1,992 commuters, 17.1%) for females.
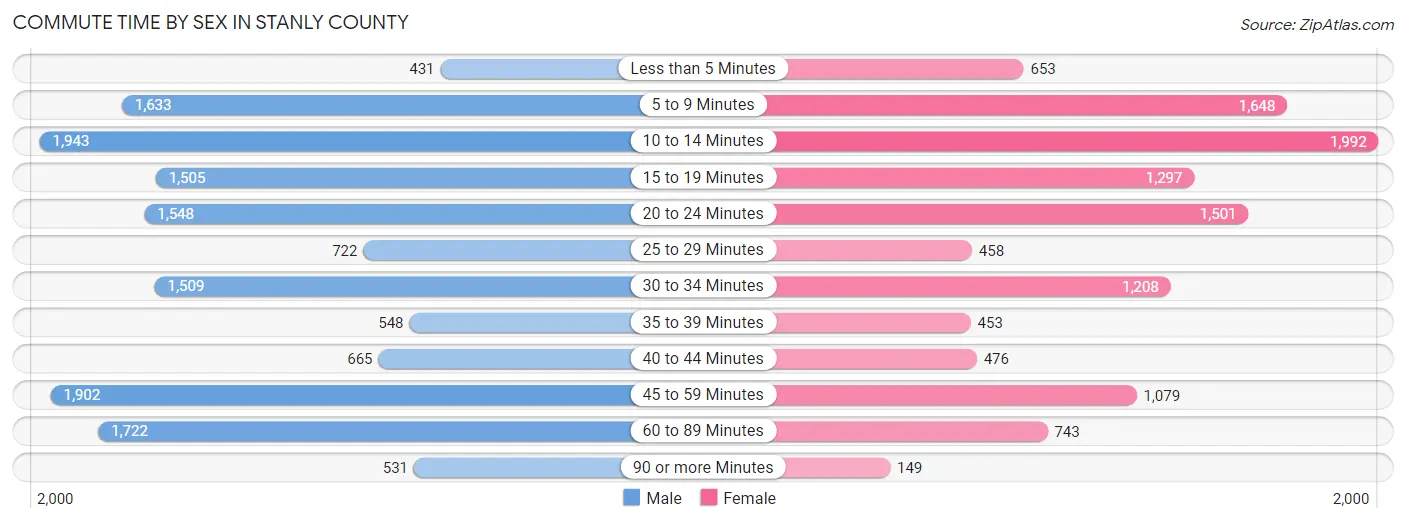
| Commute Time | Male | Female |
| Less than 5 Minutes | 431 (2.9%) | 653 (5.6%) |
| 5 to 9 Minutes | 1,633 (11.1%) | 1,648 (14.1%) |
| 10 to 14 Minutes | 1,943 (13.3%) | 1,992 (17.1%) |
| 15 to 19 Minutes | 1,505 (10.3%) | 1,297 (11.1%) |
| 20 to 24 Minutes | 1,548 (10.6%) | 1,501 (12.9%) |
| 25 to 29 Minutes | 722 (4.9%) | 458 (3.9%) |
| 30 to 34 Minutes | 1,509 (10.3%) | 1,208 (10.4%) |
| 35 to 39 Minutes | 548 (3.7%) | 453 (3.9%) |
| 40 to 44 Minutes | 665 (4.5%) | 476 (4.1%) |
| 45 to 59 Minutes | 1,902 (13.0%) | 1,079 (9.3%) |
| 60 to 89 Minutes | 1,722 (11.7%) | 743 (6.4%) |
| 90 or more Minutes | 531 (3.6%) | 149 (1.3%) |
Time of Departure to Work by Sex in Stanly County
The most frequent times of departure to work in Stanly County are 7:00 AM to 7:29 AM (2,334, 15.9%) for males and 7:30 AM to 7:59 AM (2,069, 17.7%) for females.
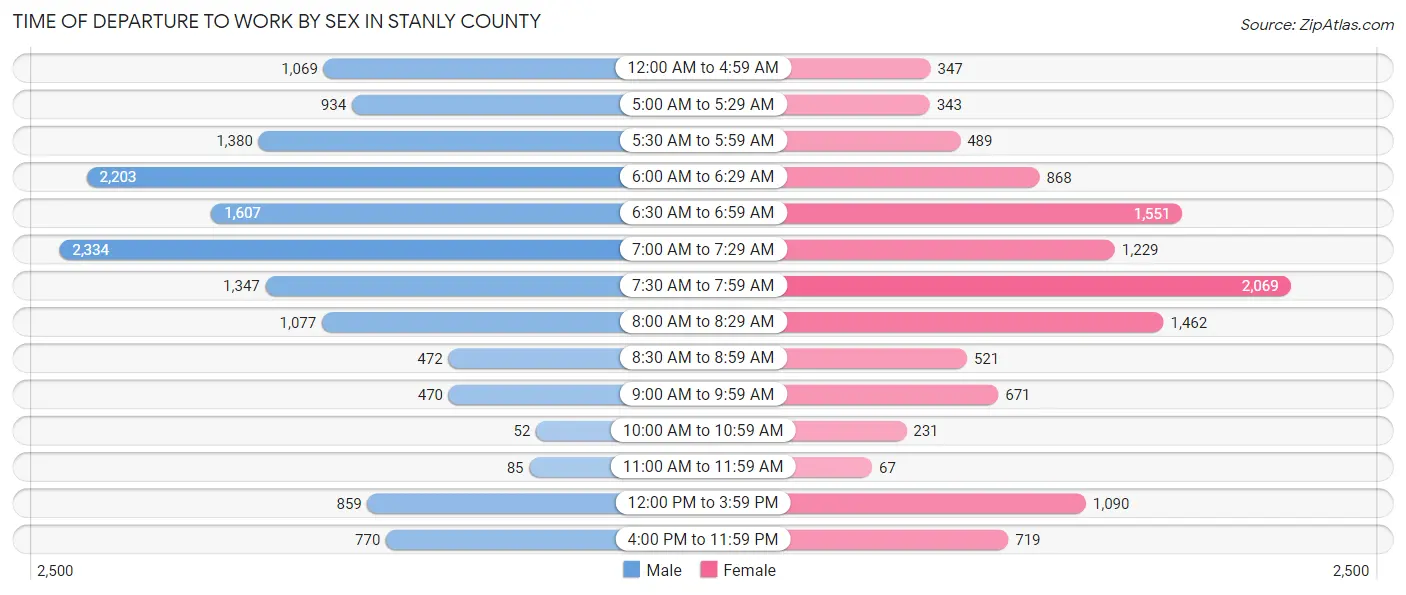
| Time of Departure | Male | Female |
| 12:00 AM to 4:59 AM | 1,069 (7.3%) | 347 (3.0%) |
| 5:00 AM to 5:29 AM | 934 (6.4%) | 343 (2.9%) |
| 5:30 AM to 5:59 AM | 1,380 (9.4%) | 489 (4.2%) |
| 6:00 AM to 6:29 AM | 2,203 (15.0%) | 868 (7.4%) |
| 6:30 AM to 6:59 AM | 1,607 (11.0%) | 1,551 (13.3%) |
| 7:00 AM to 7:29 AM | 2,334 (15.9%) | 1,229 (10.5%) |
| 7:30 AM to 7:59 AM | 1,347 (9.2%) | 2,069 (17.7%) |
| 8:00 AM to 8:29 AM | 1,077 (7.3%) | 1,462 (12.5%) |
| 8:30 AM to 8:59 AM | 472 (3.2%) | 521 (4.5%) |
| 9:00 AM to 9:59 AM | 470 (3.2%) | 671 (5.8%) |
| 10:00 AM to 10:59 AM | 52 (0.4%) | 231 (2.0%) |
| 11:00 AM to 11:59 AM | 85 (0.6%) | 67 (0.6%) |
| 12:00 PM to 3:59 PM | 859 (5.9%) | 1,090 (9.3%) |
| 4:00 PM to 11:59 PM | 770 (5.2%) | 719 (6.2%) |
| Total | 14,659 (100.0%) | 11,657 (100.0%) |
Housing Occupancy in Stanly County
Occupancy by Ownership in Stanly County
Of the total 23,773 dwellings in Stanly County, owner-occupied units account for 17,797 (74.9%), while renter-occupied units make up 5,976 (25.1%).
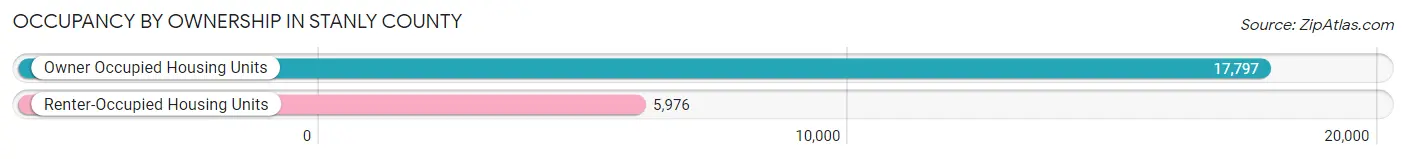
| Occupancy | # Housing Units | % Housing Units |
| Owner Occupied Housing Units | 17,797 | 74.9% |
| Renter-Occupied Housing Units | 5,976 | 25.1% |
| Total Occupied Housing Units | 23,773 | 100.0% |
Occupancy by Household Size in Stanly County
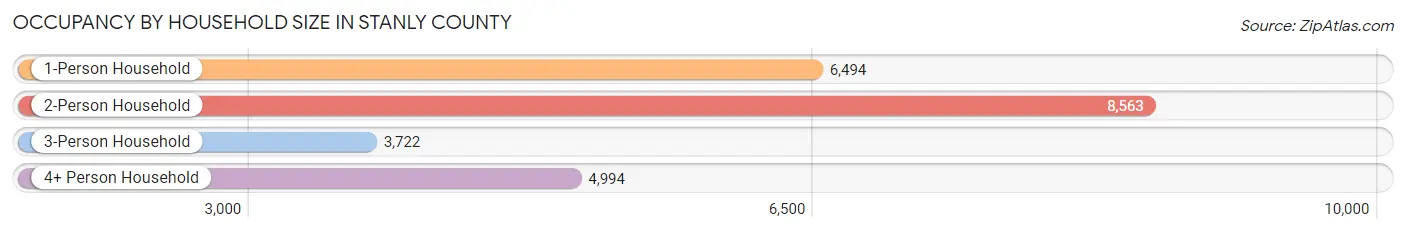
| Household Size | # Housing Units | % Housing Units |
| 1-Person Household | 6,494 | 27.3% |
| 2-Person Household | 8,563 | 36.0% |
| 3-Person Household | 3,722 | 15.7% |
| 4+ Person Household | 4,994 | 21.0% |
| Total Housing Units | 23,773 | 100.0% |
Occupancy by Ownership by Household Size in Stanly County
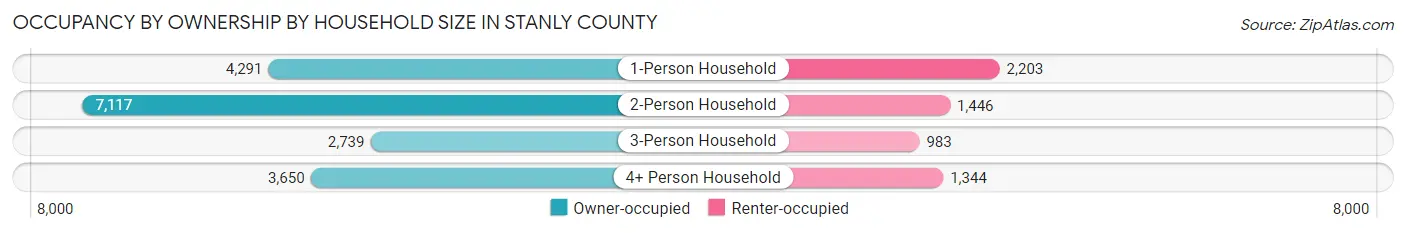
| Household Size | Owner-occupied | Renter-occupied |
| 1-Person Household | 4,291 (66.1%) | 2,203 (33.9%) |
| 2-Person Household | 7,117 (83.1%) | 1,446 (16.9%) |
| 3-Person Household | 2,739 (73.6%) | 983 (26.4%) |
| 4+ Person Household | 3,650 (73.1%) | 1,344 (26.9%) |
| Total Housing Units | 17,797 (74.9%) | 5,976 (25.1%) |
Occupancy by Educational Attainment in Stanly County
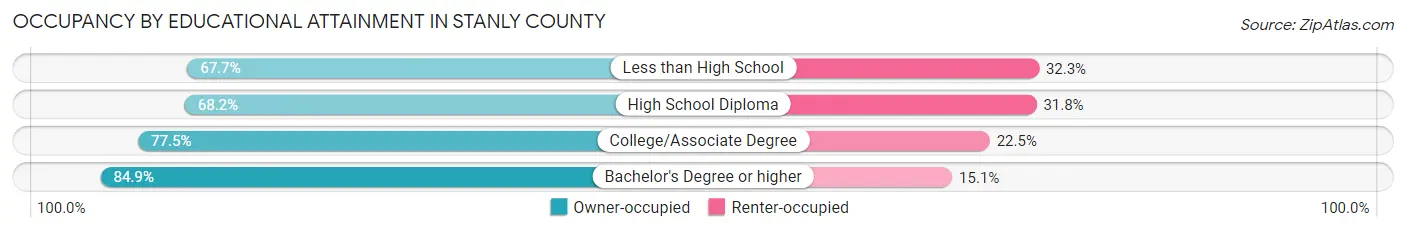
| Household Size | Owner-occupied | Renter-occupied |
| Less than High School | 1,916 (67.7%) | 913 (32.3%) |
| High School Diploma | 5,159 (68.2%) | 2,403 (31.8%) |
| College/Associate Degree | 6,688 (77.5%) | 1,944 (22.5%) |
| Bachelor's Degree or higher | 4,034 (84.9%) | 716 (15.1%) |
Occupancy by Age of Householder in Stanly County
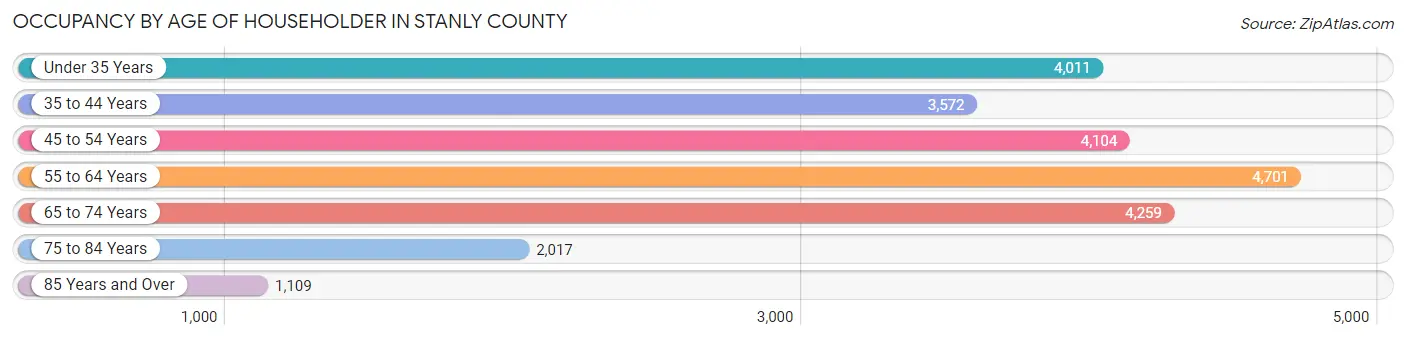
| Age Bracket | # Households | % Households |
| Under 35 Years | 4,011 | 16.9% |
| 35 to 44 Years | 3,572 | 15.0% |
| 45 to 54 Years | 4,104 | 17.3% |
| 55 to 64 Years | 4,701 | 19.8% |
| 65 to 74 Years | 4,259 | 17.9% |
| 75 to 84 Years | 2,017 | 8.5% |
| 85 Years and Over | 1,109 | 4.7% |
| Total | 23,773 | 100.0% |
Housing Finances in Stanly County
Median Income by Occupancy in Stanly County
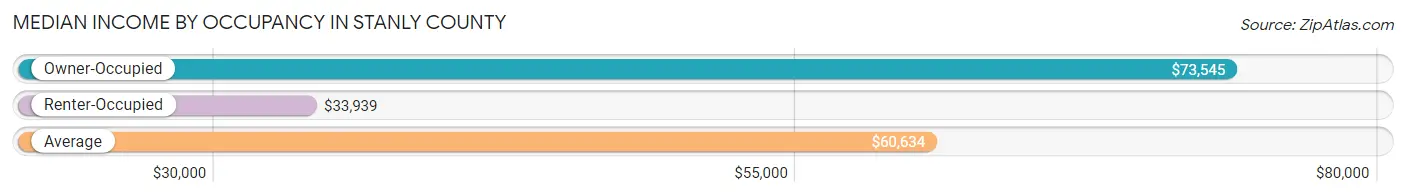
| Occupancy Type | # Households | Median Income |
| Owner-Occupied | 17,797 (74.9%) | $73,545 |
| Renter-Occupied | 5,976 (25.1%) | $33,939 |
| Average | 23,773 (100.0%) | $60,634 |
Occupancy by Householder Income Bracket in Stanly County
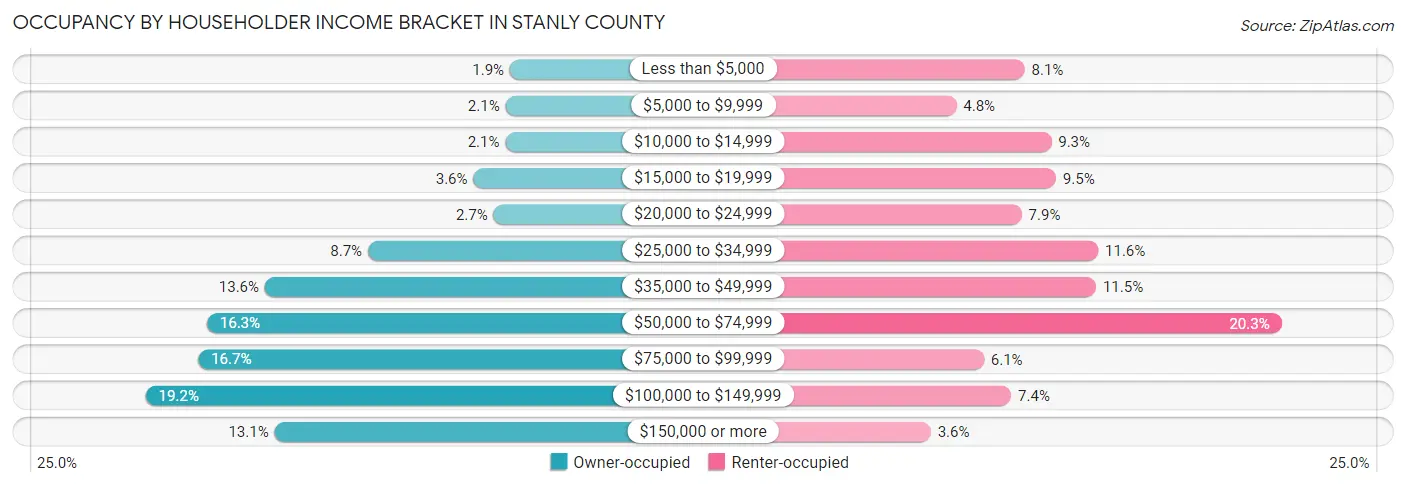
| Income Bracket | Owner-occupied | Renter-occupied |
| Less than $5,000 | 336 (1.9%) | 481 (8.1%) |
| $5,000 to $9,999 | 374 (2.1%) | 287 (4.8%) |
| $10,000 to $14,999 | 375 (2.1%) | 557 (9.3%) |
| $15,000 to $19,999 | 646 (3.6%) | 570 (9.5%) |
| $20,000 to $24,999 | 476 (2.7%) | 473 (7.9%) |
| $25,000 to $34,999 | 1,539 (8.6%) | 690 (11.6%) |
| $35,000 to $49,999 | 2,414 (13.6%) | 684 (11.5%) |
| $50,000 to $74,999 | 2,905 (16.3%) | 1,212 (20.3%) |
| $75,000 to $99,999 | 2,977 (16.7%) | 365 (6.1%) |
| $100,000 to $149,999 | 3,424 (19.2%) | 443 (7.4%) |
| $150,000 or more | 2,331 (13.1%) | 214 (3.6%) |
| Total | 17,797 (100.0%) | 5,976 (100.0%) |
Monthly Housing Cost Tiers in Stanly County
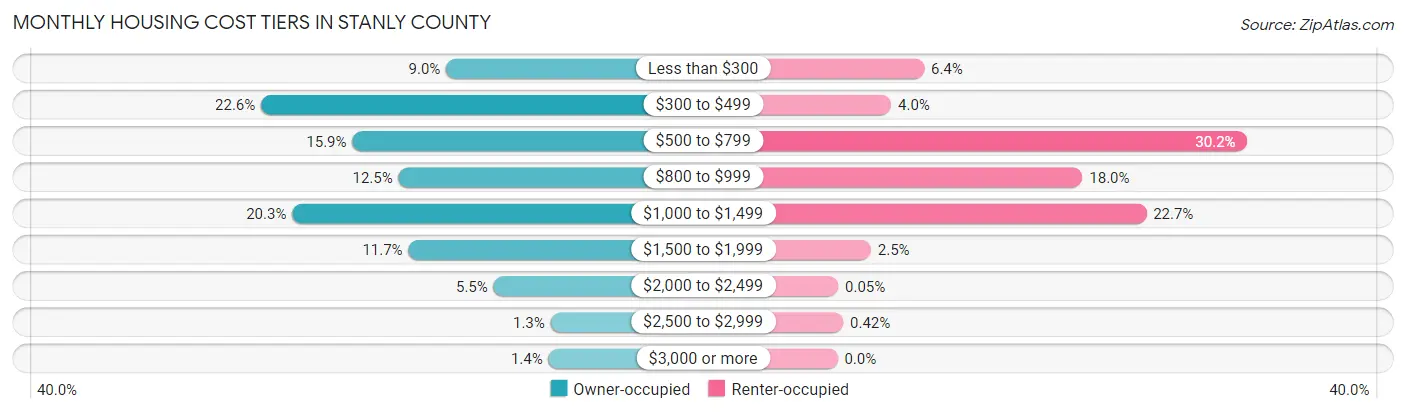
| Monthly Cost | Owner-occupied | Renter-occupied |
| Less than $300 | 1,592 (8.9%) | 381 (6.4%) |
| $300 to $499 | 4,019 (22.6%) | 236 (4.0%) |
| $500 to $799 | 2,822 (15.9%) | 1,804 (30.2%) |
| $800 to $999 | 2,218 (12.5%) | 1,078 (18.0%) |
| $1,000 to $1,499 | 3,611 (20.3%) | 1,359 (22.7%) |
| $1,500 to $1,999 | 2,087 (11.7%) | 147 (2.5%) |
| $2,000 to $2,499 | 972 (5.5%) | 3 (0.1%) |
| $2,500 to $2,999 | 225 (1.3%) | 25 (0.4%) |
| $3,000 or more | 251 (1.4%) | 0 (0.0%) |
| Total | 17,797 (100.0%) | 5,976 (100.0%) |
Physical Housing Characteristics in Stanly County
Housing Structures in Stanly County
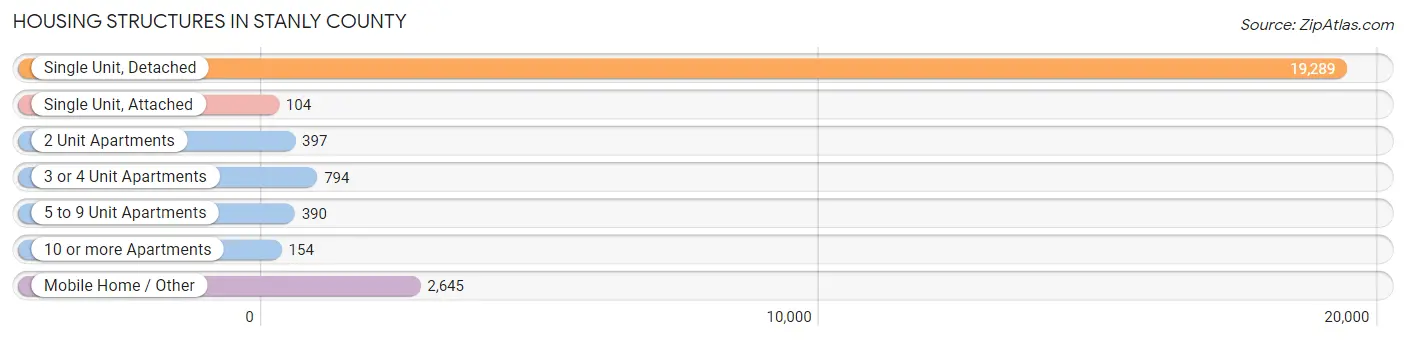
| Structure Type | # Housing Units | % Housing Units |
| Single Unit, Detached | 19,289 | 81.1% |
| Single Unit, Attached | 104 | 0.4% |
| 2 Unit Apartments | 397 | 1.7% |
| 3 or 4 Unit Apartments | 794 | 3.3% |
| 5 to 9 Unit Apartments | 390 | 1.6% |
| 10 or more Apartments | 154 | 0.6% |
| Mobile Home / Other | 2,645 | 11.1% |
| Total | 23,773 | 100.0% |
Housing Structures by Occupancy in Stanly County
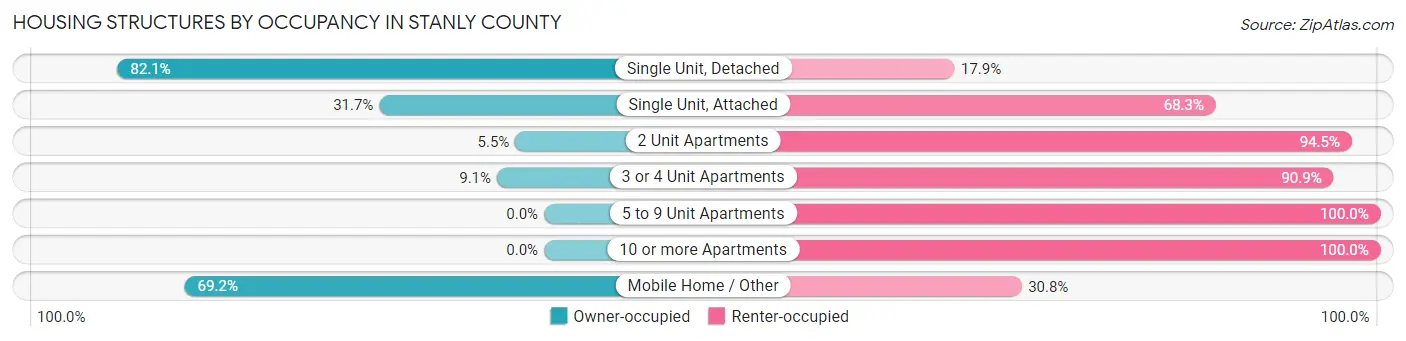
| Structure Type | Owner-occupied | Renter-occupied |
| Single Unit, Detached | 15,840 (82.1%) | 3,449 (17.9%) |
| Single Unit, Attached | 33 (31.7%) | 71 (68.3%) |
| 2 Unit Apartments | 22 (5.5%) | 375 (94.5%) |
| 3 or 4 Unit Apartments | 72 (9.1%) | 722 (90.9%) |
| 5 to 9 Unit Apartments | 0 (0.0%) | 390 (100.0%) |
| 10 or more Apartments | 0 (0.0%) | 154 (100.0%) |
| Mobile Home / Other | 1,830 (69.2%) | 815 (30.8%) |
| Total | 17,797 (74.9%) | 5,976 (25.1%) |
Housing Structures by Number of Rooms in Stanly County
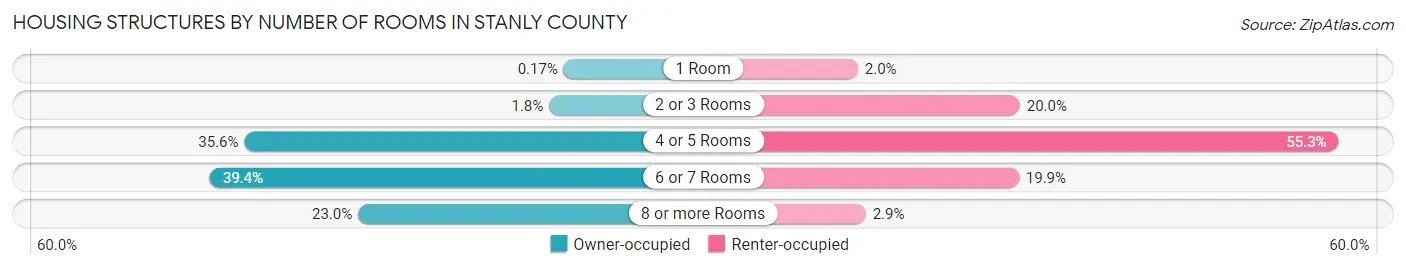
| Number of Rooms | Owner-occupied | Renter-occupied |
| 1 Room | 31 (0.2%) | 119 (2.0%) |
| 2 or 3 Rooms | 318 (1.8%) | 1,193 (20.0%) |
| 4 or 5 Rooms | 6,337 (35.6%) | 3,306 (55.3%) |
| 6 or 7 Rooms | 7,019 (39.4%) | 1,187 (19.9%) |
| 8 or more Rooms | 4,092 (23.0%) | 171 (2.9%) |
| Total | 17,797 (100.0%) | 5,976 (100.0%) |
Housing Structure by Heating Type in Stanly County
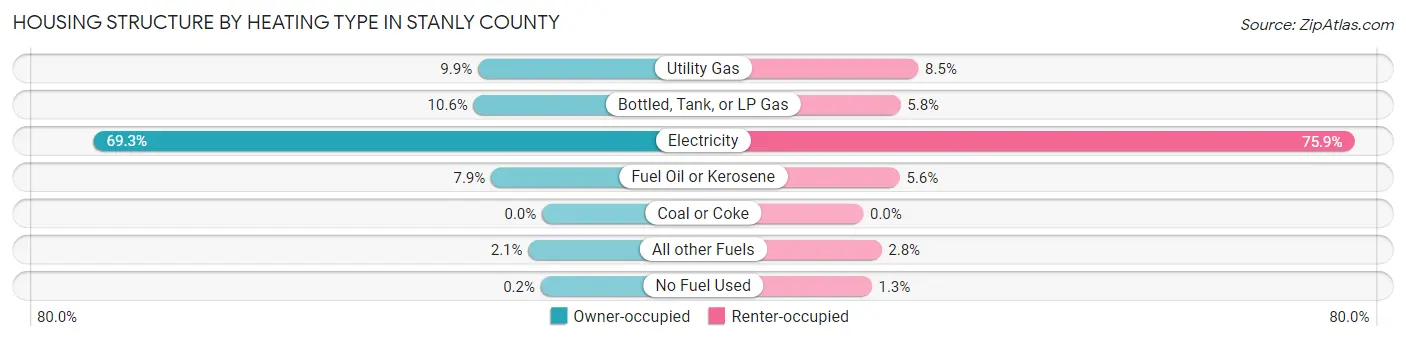
| Heating Type | Owner-occupied | Renter-occupied |
| Utility Gas | 1,763 (9.9%) | 509 (8.5%) |
| Bottled, Tank, or LP Gas | 1,883 (10.6%) | 345 (5.8%) |
| Electricity | 12,336 (69.3%) | 4,538 (75.9%) |
| Fuel Oil or Kerosene | 1,403 (7.9%) | 337 (5.6%) |
| Coal or Coke | 0 (0.0%) | 0 (0.0%) |
| All other Fuels | 377 (2.1%) | 169 (2.8%) |
| No Fuel Used | 35 (0.2%) | 78 (1.3%) |
| Total | 17,797 (100.0%) | 5,976 (100.0%) |
Household Vehicle Usage in Stanly County
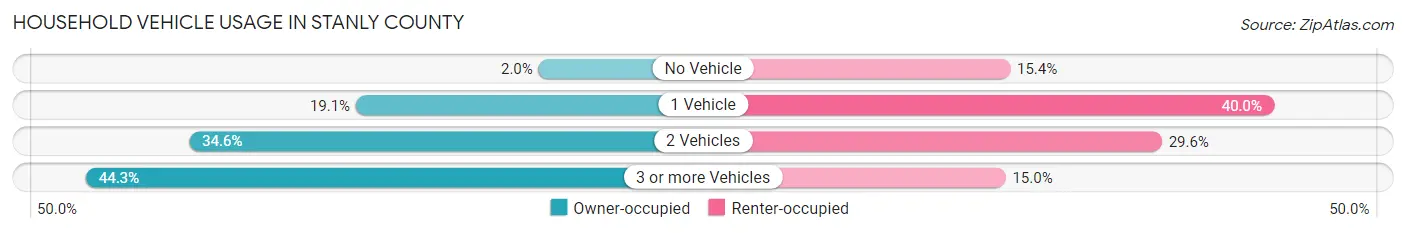
| Vehicles per Household | Owner-occupied | Renter-occupied |
| No Vehicle | 359 (2.0%) | 921 (15.4%) |
| 1 Vehicle | 3,393 (19.1%) | 2,392 (40.0%) |
| 2 Vehicles | 6,165 (34.6%) | 1,767 (29.6%) |
| 3 or more Vehicles | 7,880 (44.3%) | 896 (15.0%) |
| Total | 17,797 (100.0%) | 5,976 (100.0%) |
Real Estate & Mortgages in Stanly County
Real Estate and Mortgage Overview in Stanly County
| Characteristic | Without Mortgage | With Mortgage |
| Housing Units | 7,691 | 10,106 |
| Median Property Value | $161,200 | $218,100 |
| Median Household Income | $49,801 | $1,778 |
| Monthly Housing Costs | $412 | $242 |
| Real Estate Taxes | $1,141 | $170 |
Property Value by Mortgage Status in Stanly County
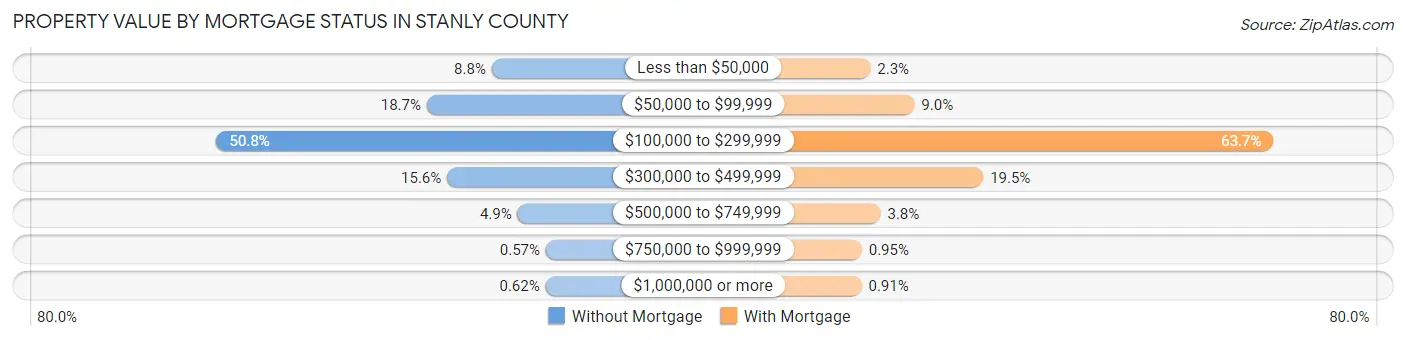
| Property Value | Without Mortgage | With Mortgage |
| Less than $50,000 | 678 (8.8%) | 228 (2.3%) |
| $50,000 to $99,999 | 1,440 (18.7%) | 907 (9.0%) |
| $100,000 to $299,999 | 3,905 (50.8%) | 6,432 (63.6%) |
| $300,000 to $499,999 | 1,201 (15.6%) | 1,966 (19.5%) |
| $500,000 to $749,999 | 375 (4.9%) | 385 (3.8%) |
| $750,000 to $999,999 | 44 (0.6%) | 96 (0.9%) |
| $1,000,000 or more | 48 (0.6%) | 92 (0.9%) |
| Total | 7,691 (100.0%) | 10,106 (100.0%) |
Household Income by Mortgage Status in Stanly County
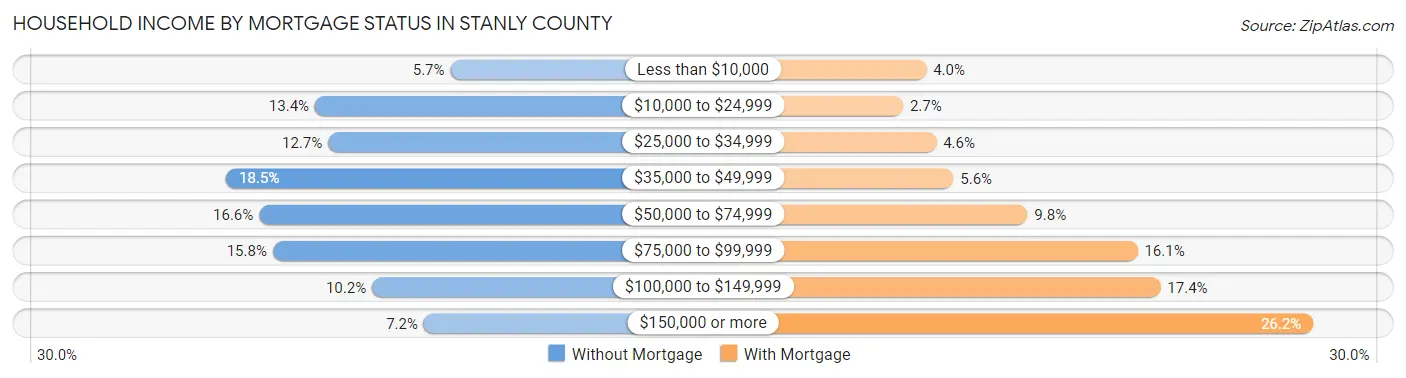
| Household Income | Without Mortgage | With Mortgage |
| Less than $10,000 | 436 (5.7%) | 408 (4.0%) |
| $10,000 to $24,999 | 1,031 (13.4%) | 274 (2.7%) |
| $25,000 to $34,999 | 974 (12.7%) | 466 (4.6%) |
| $35,000 to $49,999 | 1,422 (18.5%) | 565 (5.6%) |
| $50,000 to $74,999 | 1,277 (16.6%) | 992 (9.8%) |
| $75,000 to $99,999 | 1,217 (15.8%) | 1,628 (16.1%) |
| $100,000 to $149,999 | 781 (10.2%) | 1,760 (17.4%) |
| $150,000 or more | 553 (7.2%) | 2,643 (26.2%) |
| Total | 7,691 (100.0%) | 10,106 (100.0%) |
Property Value to Household Income Ratio in Stanly County
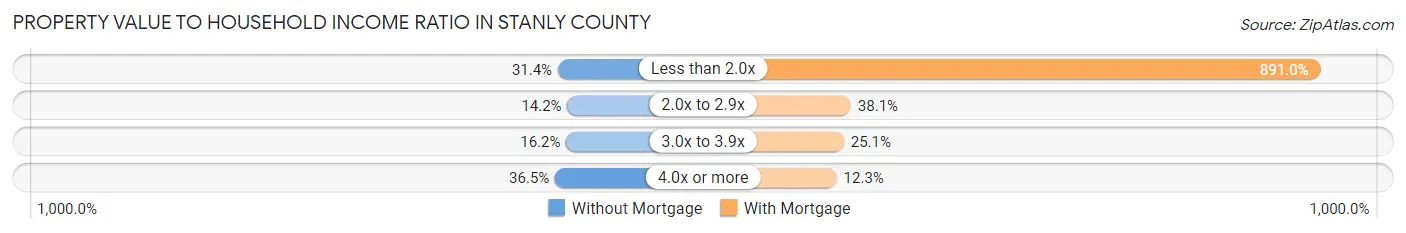
| Value-to-Income Ratio | Without Mortgage | With Mortgage |
| Less than 2.0x | 2,413 (31.4%) | 90,041 (891.0%) |
| 2.0x to 2.9x | 1,088 (14.1%) | 3,847 (38.1%) |
| 3.0x to 3.9x | 1,244 (16.2%) | 2,540 (25.1%) |
| 4.0x or more | 2,804 (36.5%) | 1,239 (12.3%) |
| Total | 7,691 (100.0%) | 10,106 (100.0%) |
Real Estate Taxes by Mortgage Status in Stanly County
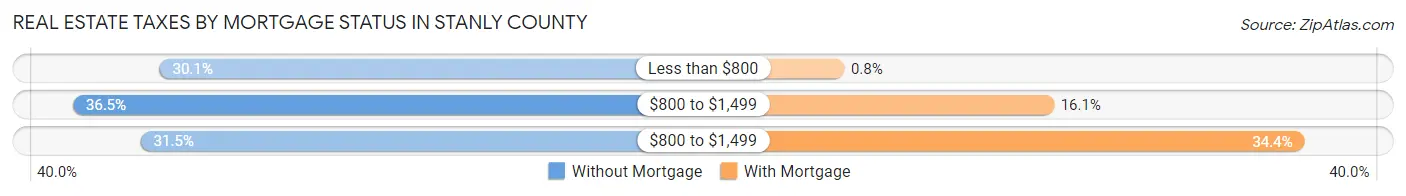
| Property Taxes | Without Mortgage | With Mortgage |
| Less than $800 | 2,318 (30.1%) | 81 (0.8%) |
| $800 to $1,499 | 2,805 (36.5%) | 1,629 (16.1%) |
| $800 to $1,499 | 2,424 (31.5%) | 3,481 (34.4%) |
| Total | 7,691 (100.0%) | 10,106 (100.0%) |
Health & Disability in Stanly County
Health Insurance Coverage by Age in Stanly County
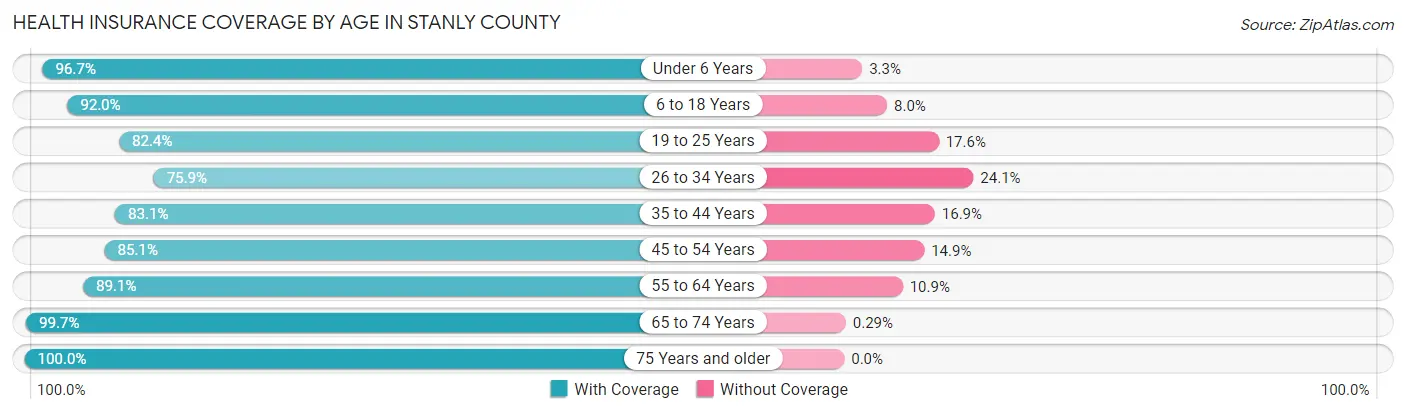
| Age Bracket | With Coverage | Without Coverage |
| Under 6 Years | 4,429 (96.7%) | 153 (3.3%) |
| 6 to 18 Years | 8,690 (92.0%) | 754 (8.0%) |
| 19 to 25 Years | 4,422 (82.4%) | 945 (17.6%) |
| 26 to 34 Years | 5,341 (75.9%) | 1,694 (24.1%) |
| 35 to 44 Years | 5,828 (83.1%) | 1,184 (16.9%) |
| 45 to 54 Years | 6,854 (85.1%) | 1,201 (14.9%) |
| 55 to 64 Years | 7,567 (89.1%) | 926 (10.9%) |
| 65 to 74 Years | 6,779 (99.7%) | 20 (0.3%) |
| 75 Years and older | 4,479 (100.0%) | 0 (0.0%) |
| Total | 54,389 (88.8%) | 6,877 (11.2%) |
Health Insurance Coverage by Citizenship Status in Stanly County
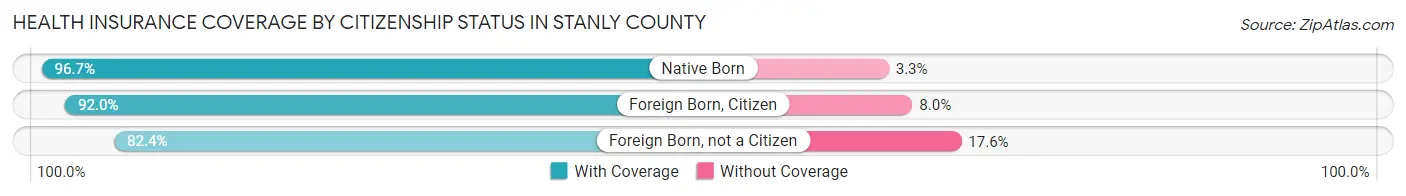
| Citizenship Status | With Coverage | Without Coverage |
| Native Born | 4,429 (96.7%) | 153 (3.3%) |
| Foreign Born, Citizen | 8,690 (92.0%) | 754 (8.0%) |
| Foreign Born, not a Citizen | 4,422 (82.4%) | 945 (17.6%) |
Health Insurance Coverage by Household Income in Stanly County
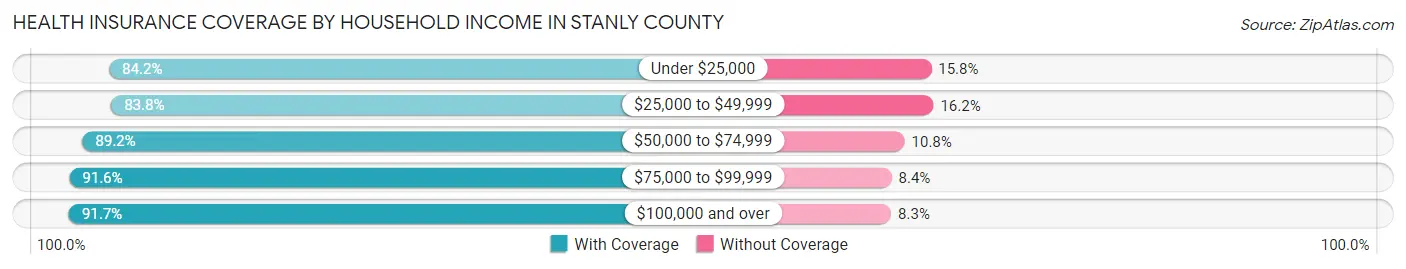
| Household Income | With Coverage | Without Coverage |
| Under $25,000 | 6,737 (84.2%) | 1,267 (15.8%) |
| $25,000 to $49,999 | 9,689 (83.8%) | 1,878 (16.2%) |
| $50,000 to $74,999 | 9,416 (89.2%) | 1,144 (10.8%) |
| $75,000 to $99,999 | 8,178 (91.6%) | 749 (8.4%) |
| $100,000 and over | 19,727 (91.7%) | 1,789 (8.3%) |
Public vs Private Health Insurance Coverage by Age in Stanly County
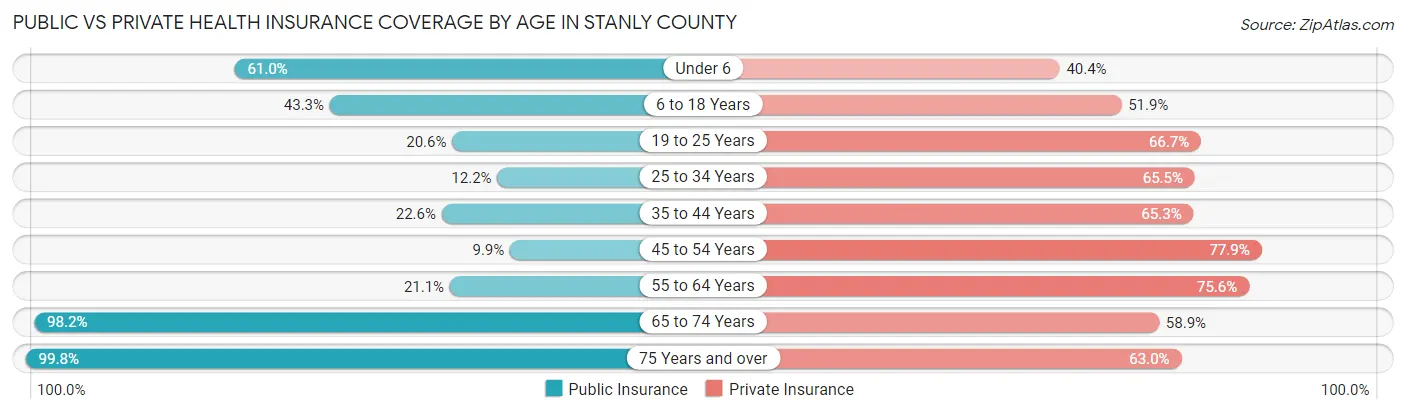
| Age Bracket | Public Insurance | Private Insurance |
| Under 6 | 2,797 (61.0%) | 1,851 (40.4%) |
| 6 to 18 Years | 4,093 (43.3%) | 4,898 (51.9%) |
| 19 to 25 Years | 1,106 (20.6%) | 3,579 (66.7%) |
| 25 to 34 Years | 861 (12.2%) | 4,609 (65.5%) |
| 35 to 44 Years | 1,582 (22.6%) | 4,577 (65.3%) |
| 45 to 54 Years | 796 (9.9%) | 6,276 (77.9%) |
| 55 to 64 Years | 1,788 (21.0%) | 6,420 (75.6%) |
| 65 to 74 Years | 6,678 (98.2%) | 4,002 (58.9%) |
| 75 Years and over | 4,470 (99.8%) | 2,823 (63.0%) |
| Total | 24,171 (39.5%) | 39,035 (63.7%) |
Disability Status by Sex by Age in Stanly County
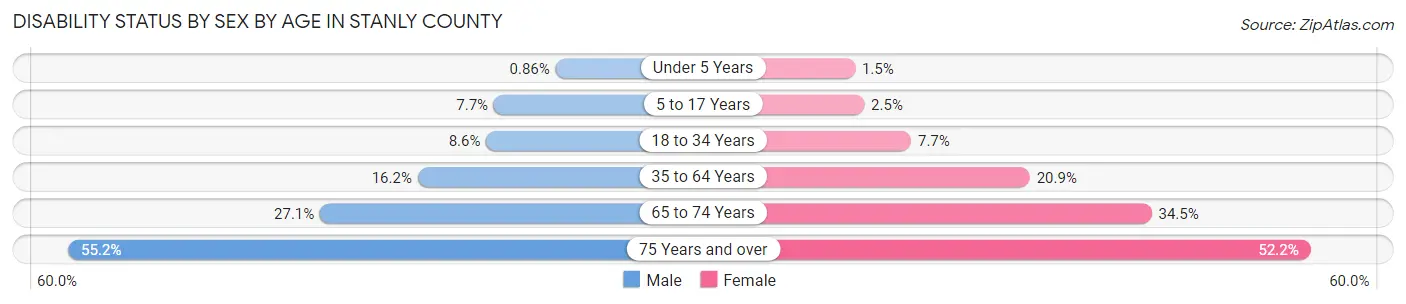
| Age Bracket | Male | Female |
| Under 5 Years | 15 (0.9%) | 26 (1.5%) |
| 5 to 17 Years | 404 (7.7%) | 118 (2.5%) |
| 18 to 34 Years | 580 (8.6%) | 477 (7.7%) |
| 35 to 64 Years | 1,897 (16.2%) | 2,484 (20.9%) |
| 65 to 74 Years | 865 (27.1%) | 1,244 (34.5%) |
| 75 Years and over | 1,064 (55.2%) | 1,331 (52.2%) |
Disability Class by Sex by Age in Stanly County
Disability Class: Hearing Difficulty
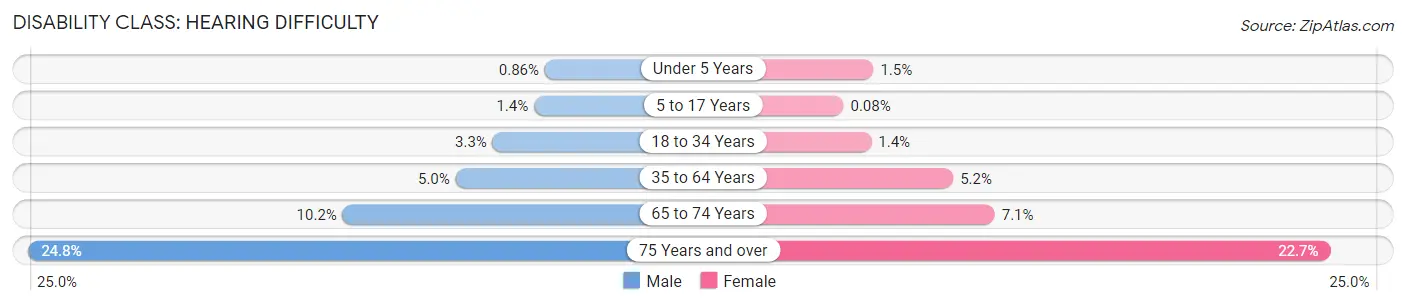
| Age Bracket | Male | Female |
| Under 5 Years | 15 (0.9%) | 26 (1.5%) |
| 5 to 17 Years | 71 (1.4%) | 4 (0.1%) |
| 18 to 34 Years | 222 (3.3%) | 85 (1.4%) |
| 35 to 64 Years | 585 (5.0%) | 613 (5.2%) |
| 65 to 74 Years | 327 (10.2%) | 256 (7.1%) |
| 75 Years and over | 479 (24.8%) | 578 (22.7%) |
Disability Class: Vision Difficulty
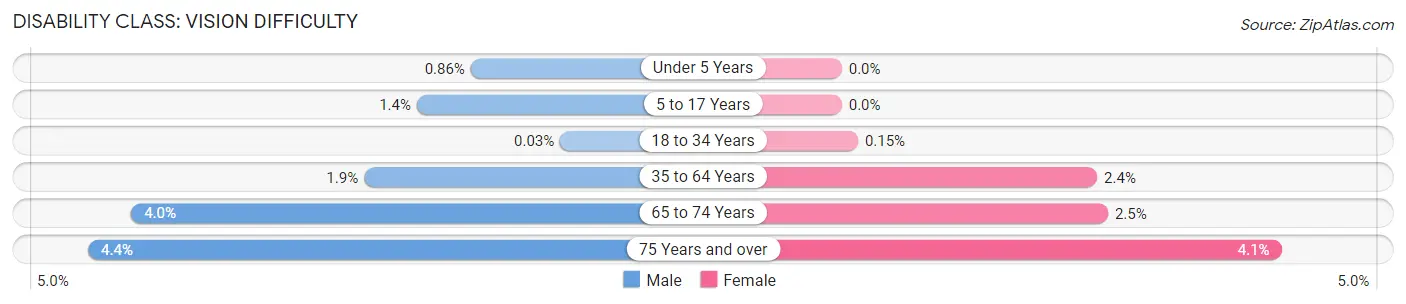
| Age Bracket | Male | Female |
| Under 5 Years | 15 (0.9%) | 0 (0.0%) |
| 5 to 17 Years | 71 (1.4%) | 0 (0.0%) |
| 18 to 34 Years | 2 (0.0%) | 9 (0.2%) |
| 35 to 64 Years | 216 (1.8%) | 281 (2.4%) |
| 65 to 74 Years | 128 (4.0%) | 89 (2.5%) |
| 75 Years and over | 85 (4.4%) | 104 (4.1%) |
Disability Class: Cognitive Difficulty
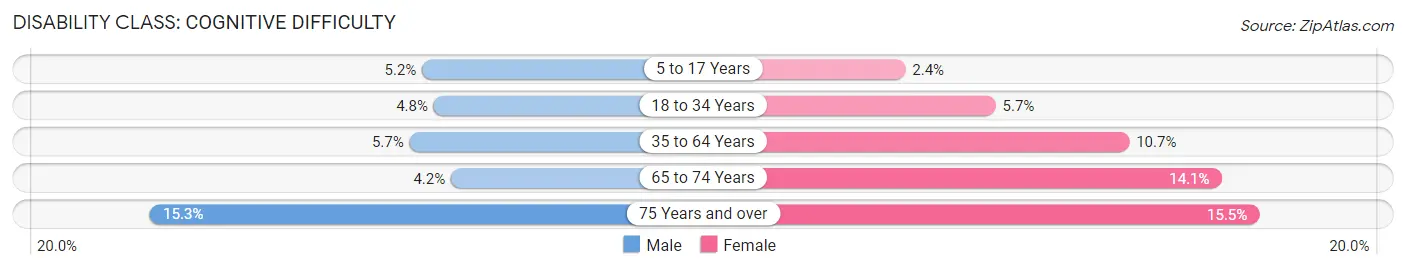
| Age Bracket | Male | Female |
| 5 to 17 Years | 274 (5.2%) | 112 (2.4%) |
| 18 to 34 Years | 325 (4.8%) | 353 (5.7%) |
| 35 to 64 Years | 668 (5.7%) | 1,266 (10.7%) |
| 65 to 74 Years | 133 (4.2%) | 508 (14.1%) |
| 75 Years and over | 296 (15.3%) | 395 (15.5%) |
Disability Class: Ambulatory Difficulty
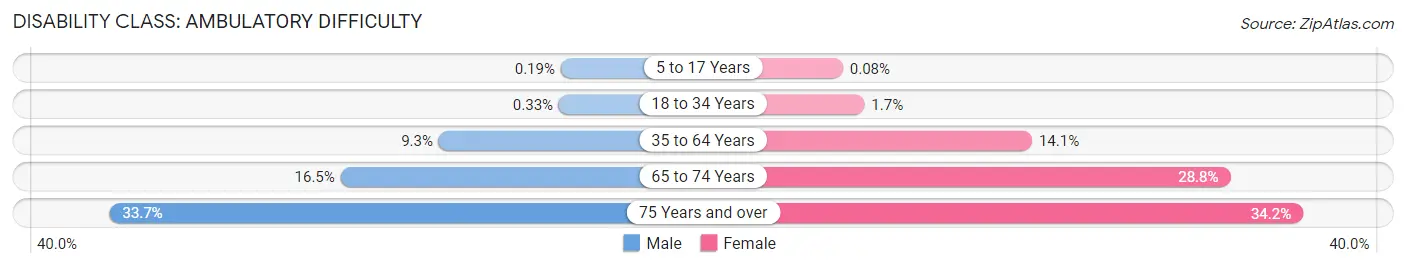
| Age Bracket | Male | Female |
| 5 to 17 Years | 10 (0.2%) | 4 (0.1%) |
| 18 to 34 Years | 22 (0.3%) | 104 (1.7%) |
| 35 to 64 Years | 1,082 (9.2%) | 1,676 (14.1%) |
| 65 to 74 Years | 528 (16.5%) | 1,040 (28.8%) |
| 75 Years and over | 650 (33.7%) | 873 (34.2%) |
Disability Class: Self-Care Difficulty
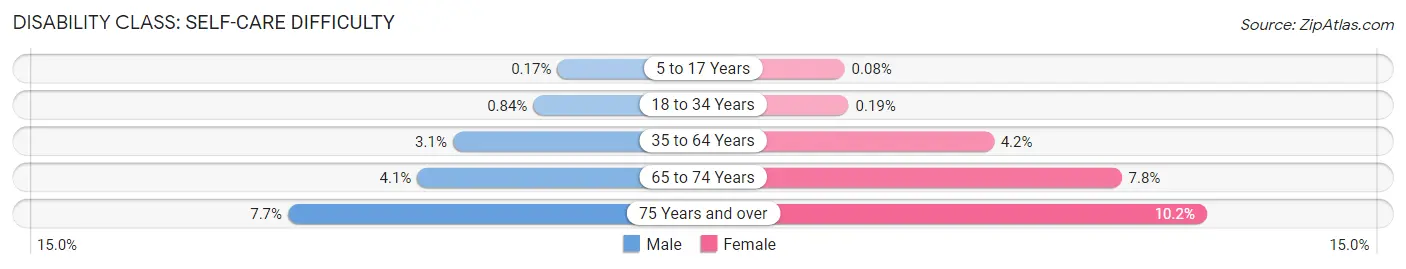
| Age Bracket | Male | Female |
| 5 to 17 Years | 9 (0.2%) | 4 (0.1%) |
| 18 to 34 Years | 57 (0.8%) | 12 (0.2%) |
| 35 to 64 Years | 360 (3.1%) | 502 (4.2%) |
| 65 to 74 Years | 130 (4.1%) | 281 (7.8%) |
| 75 Years and over | 148 (7.7%) | 259 (10.2%) |
Technology Access in Stanly County
Computing Device Access in Stanly County
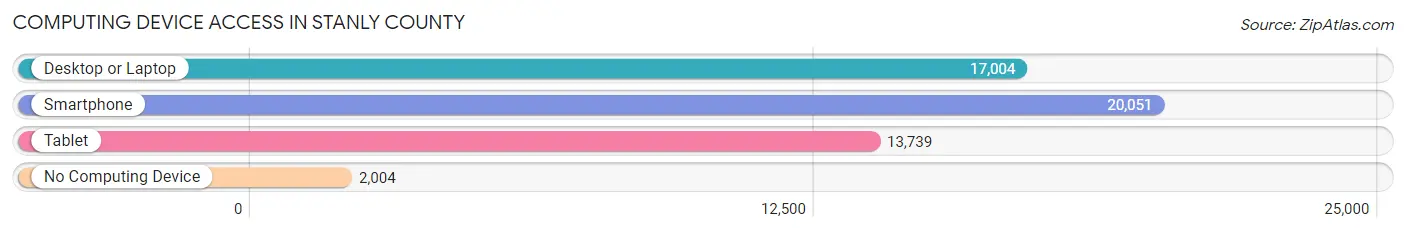
| Device Type | # Households | % Households |
| Desktop or Laptop | 17,004 | 71.5% |
| Smartphone | 20,051 | 84.3% |
| Tablet | 13,739 | 57.8% |
| No Computing Device | 2,004 | 8.4% |
| Total | 23,773 | 100.0% |
Internet Access in Stanly County
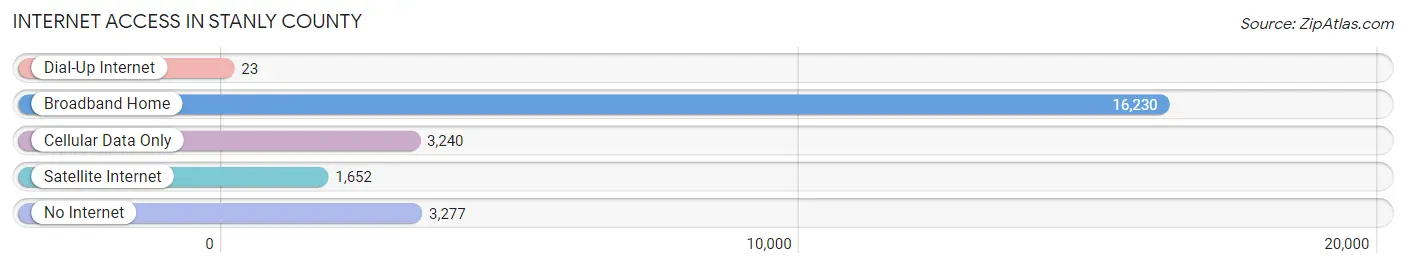
| Internet Type | # Households | % Households |
| Dial-Up Internet | 23 | 0.1% |
| Broadband Home | 16,230 | 68.3% |
| Cellular Data Only | 3,240 | 13.6% |
| Satellite Internet | 1,652 | 7.0% |
| No Internet | 3,277 | 13.8% |
| Total | 23,773 | 100.0% |
Stanly County Summary
Stanly County is located in the central part of North Carolina, and is part of the Charlotte metropolitan area. It is bordered by Cabarrus County to the north, Montgomery County to the east, Anson County to the south, and Union County to the west. The county seat is Albemarle, and the county is named for John Stanly, a member of the North Carolina House of Commons.
History
The area that is now Stanly County was originally inhabited by the Catawba and Cheraw Native American tribes. The first European settlers arrived in the area in the late 1700s, and the county was officially established in 1841. The county was named for John Stanly, a member of the North Carolina House of Commons.
During the Civil War, Stanly County was a major site of Confederate activity. The Battle of Reed's Bridge was fought in the county in 1865, and the county was the site of several skirmishes. After the war, the county experienced a period of economic growth, as the railroad and other industries began to develop in the area.
Geography
Stanly County is located in the central part of North Carolina, and is part of the Charlotte metropolitan area. It is bordered by Cabarrus County to the north, Montgomery County to the east, Anson County to the south, and Union County to the west. The county has a total area of 441 square miles, of which 437 square miles is land and 4.2 square miles is water.
The county is located in the Piedmont region of North Carolina, and is characterized by rolling hills and wooded areas. The Uwharrie Mountains are located in the western part of the county, and the Yadkin River runs through the eastern part of the county.
Economy
The economy of Stanly County is largely based on agriculture and manufacturing. The county is home to several large agricultural operations, including poultry farms, hog farms, and dairy farms. The county is also home to several manufacturing companies, including a furniture manufacturer, a textile manufacturer, and a plastics manufacturer.
The county is also home to several large retail stores, including Walmart, Lowe's, and Target. The county is also home to several large employers, including Stanly Community College, Stanly Regional Medical Center, and Albemarle Corporation.
Demographics
As of the 2010 census, Stanly County had a population of 60,585. The racial makeup of the county was 79.2% White, 15.7% African American, 0.5% Native American, 1.2% Asian, 0.1% Pacific Islander, 1.7% from other races, and 1.7% from two or more races. Hispanic or Latino of any race were 4.2% of the population.
The median household income in Stanly County was $41,945, and the median family income was $50,945. The per capita income was $20,945. About 14.2% of the population was below the poverty line.
Stanly County is served by the Stanly County Schools system, which consists of 14 elementary schools, five middle schools, and four high schools. The county is also home to Stanly Community College, a two-year public college.
Common Questions
What is Per Capita Income in Stanly County?
Per Capita income in Stanly County is $30,857.
What is the Median Family Income in Stanly County?
Median Family Income in Stanly County is $78,623.
What is the Median Household income in Stanly County?
Median Household Income in Stanly County is $60,634.
What is Income or Wage Gap in Stanly County?
Income or Wage Gap in Stanly County is 26.4%.
Women in Stanly County earn 73.6 cents for every dollar earned by a man.
What is Family Income Deficit in Stanly County?
Family Income Deficit in Stanly County is $11,359.
Families that are below poverty line in Stanly County earn $11,359 less on average than the poverty threshold level.
What is Inequality or Gini Index in Stanly County?
Inequality or Gini Index in Stanly County is 0.45.
What is the Total Population of Stanly County?
Total Population of Stanly County is 62,723.
What is the Total Male Population of Stanly County?
Total Male Population of Stanly County is 31,635.
What is the Total Female Population of Stanly County?
Total Female Population of Stanly County is 31,088.
What is the Ratio of Males per 100 Females in Stanly County?
There are 101.76 Males per 100 Females in Stanly County.
What is the Ratio of Females per 100 Males in Stanly County?
There are 98.27 Females per 100 Males in Stanly County.
What is the Median Population Age in Stanly County?
Median Population Age in Stanly County is 41.4 Years.
What is the Average Family Size in Stanly County
Average Family Size in Stanly County is 3.1 People.
What is the Average Household Size in Stanly County
Average Household Size in Stanly County is 2.5 People.
How Large is the Labor Force in Stanly County?
There are 30,090 People in the Labor Forcein in Stanly County.
What is the Percentage of People in the Labor Force in Stanly County?
59.3% of People are in the Labor Force in Stanly County.
What is the Unemployment Rate in Stanly County?
Unemployment Rate in Stanly County is 4.3%.