Rutherford County, NC Map & Demographics
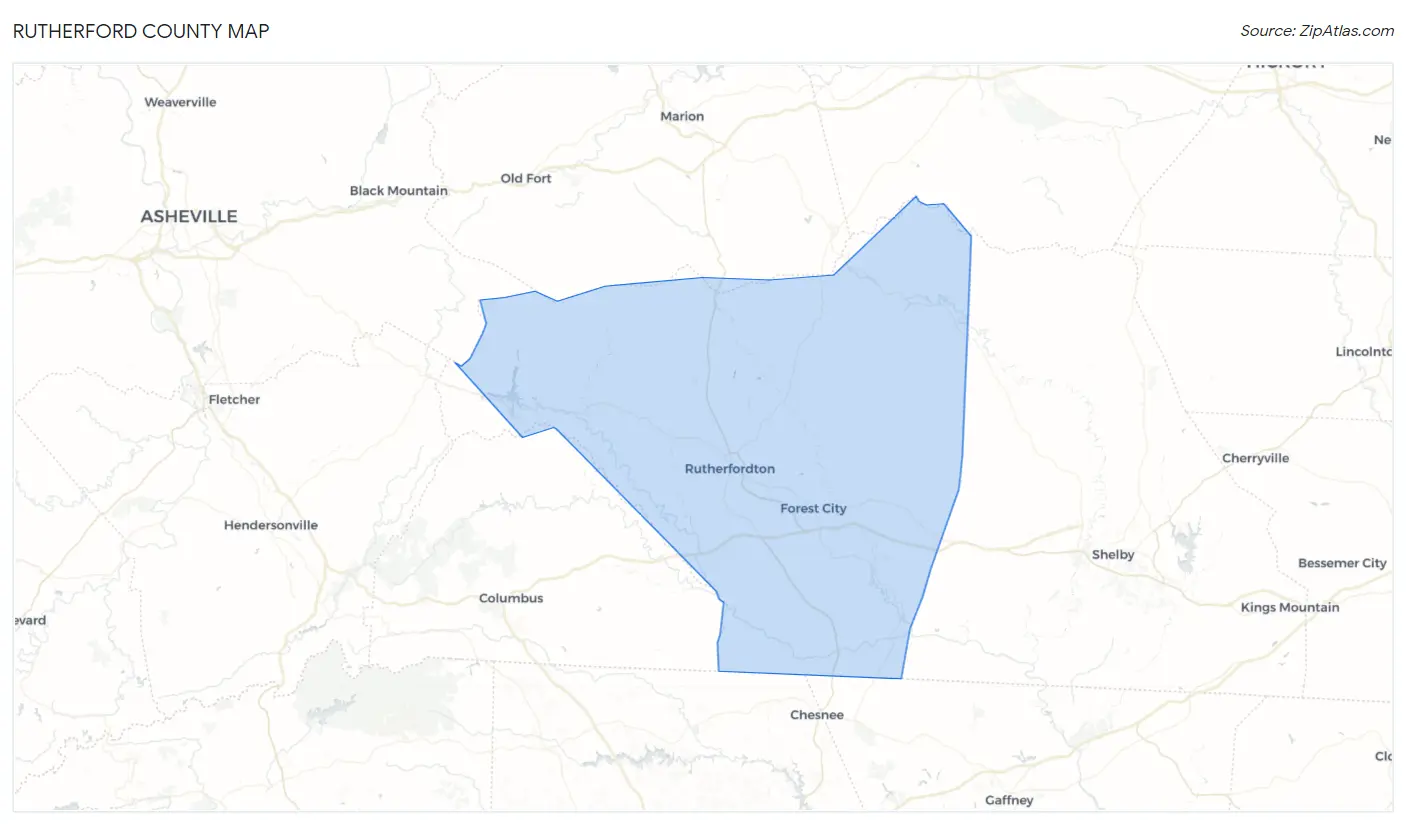
Rutherford County Map
Rutherford County Overview
$28,873
PER CAPITA INCOME
$62,564
AVG FAMILY INCOME
$50,512
AVG HOUSEHOLD INCOME
34.1%
WAGE / INCOME GAP [ % ]
65.9¢/ $1
WAGE / INCOME GAP [ $ ]
$8,683
FAMILY INCOME DEFICIT
0.47
INEQUALITY / GINI INDEX
64,680
TOTAL POPULATION
31,503
MALE POPULATION
33,177
FEMALE POPULATION
94.95
MALES / 100 FEMALES
105.31
FEMALES / 100 MALES
44.9
MEDIAN AGE
3.0
AVG FAMILY SIZE
2.4
AVG HOUSEHOLD SIZE
28,408
LABOR FORCE [ PEOPLE ]
53.3%
PERCENT IN LABOR FORCE
6.0%
UNEMPLOYMENT RATE
Income in Rutherford County
Income Overview in Rutherford County
Per Capita Income in Rutherford County is $28,873, while median incomes of families and households are $62,564 and $50,512 respectively.
| Characteristic | Number | Measure |
| Per Capita Income | 64,680 | $28,873 |
| Median Family Income | 17,069 | $62,564 |
| Mean Family Income | 17,069 | $83,034 |
| Median Household Income | 26,273 | $50,512 |
| Mean Household Income | 26,273 | $69,897 |
| Income Deficit | 17,069 | $8,683 |
| Wage / Income Gap (%) | 64,680 | 34.14% |
| Wage / Income Gap ($) | 64,680 | 65.86¢ per $1 |
| Gini / Inequality Index | 64,680 | 0.47 |
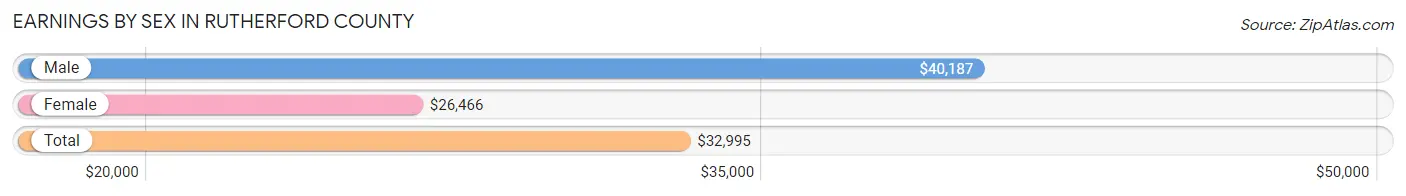
Earnings by Sex in Rutherford County
Average Earnings in Rutherford County are $32,995, $40,187 for men and $26,466 for women, a difference of 34.1%.
| Sex | Number | Average Earnings |
| Male | 15,206 (51.8%) | $40,187 |
| Female | 14,156 (48.2%) | $26,466 |
| Total | 29,362 (100.0%) | $32,995 |
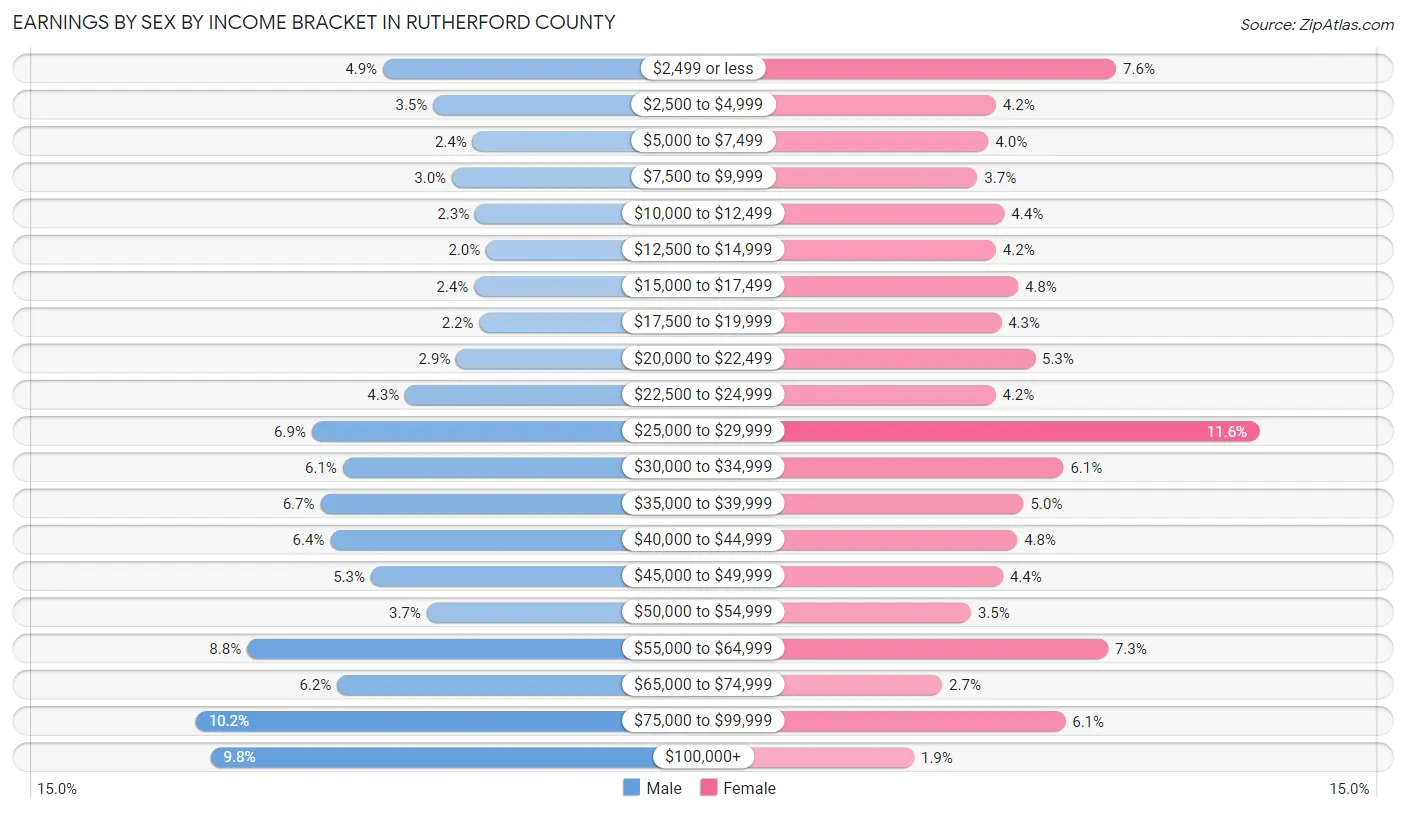
Earnings by Sex by Income Bracket in Rutherford County
The most common earnings brackets in Rutherford County are $75,000 to $99,999 for men (1,549 | 10.2%) and $25,000 to $29,999 for women (1,639 | 11.6%).
| Income | Male | Female |
| $2,499 or less | 750 (4.9%) | 1,072 (7.6%) |
| $2,500 to $4,999 | 536 (3.5%) | 593 (4.2%) |
| $5,000 to $7,499 | 366 (2.4%) | 563 (4.0%) |
| $7,500 to $9,999 | 455 (3.0%) | 519 (3.7%) |
| $10,000 to $12,499 | 356 (2.3%) | 627 (4.4%) |
| $12,500 to $14,999 | 309 (2.0%) | 593 (4.2%) |
| $15,000 to $17,499 | 361 (2.4%) | 681 (4.8%) |
| $17,500 to $19,999 | 337 (2.2%) | 614 (4.3%) |
| $20,000 to $22,499 | 437 (2.9%) | 749 (5.3%) |
| $22,500 to $24,999 | 655 (4.3%) | 592 (4.2%) |
| $25,000 to $29,999 | 1,054 (6.9%) | 1,639 (11.6%) |
| $30,000 to $34,999 | 922 (6.1%) | 862 (6.1%) |
| $35,000 to $39,999 | 1,018 (6.7%) | 704 (5.0%) |
| $40,000 to $44,999 | 974 (6.4%) | 678 (4.8%) |
| $45,000 to $49,999 | 802 (5.3%) | 621 (4.4%) |
| $50,000 to $54,999 | 562 (3.7%) | 494 (3.5%) |
| $55,000 to $64,999 | 1,331 (8.7%) | 1,039 (7.3%) |
| $65,000 to $74,999 | 946 (6.2%) | 380 (2.7%) |
| $75,000 to $99,999 | 1,549 (10.2%) | 869 (6.1%) |
| $100,000+ | 1,486 (9.8%) | 267 (1.9%) |
| Total | 15,206 (100.0%) | 14,156 (100.0%) |
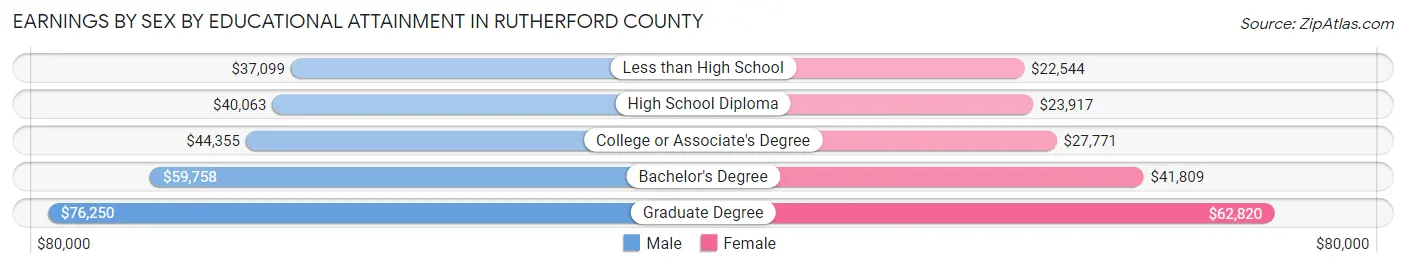
Earnings by Sex by Educational Attainment in Rutherford County
Average earnings in Rutherford County are $44,511 for men and $28,935 for women, a difference of 35.0%. Men with an educational attainment of graduate degree enjoy the highest average annual earnings of $76,250, while those with less than high school education earn the least with $37,099. Women with an educational attainment of graduate degree earn the most with the average annual earnings of $62,820, while those with less than high school education have the smallest earnings of $22,544.
| Educational Attainment | Male Income | Female Income |
| Less than High School | $37,099 | $22,544 |
| High School Diploma | $40,063 | $23,917 |
| College or Associate's Degree | $44,355 | $27,771 |
| Bachelor's Degree | $59,758 | $41,809 |
| Graduate Degree | $76,250 | $62,820 |
| Total | $44,511 | $28,935 |
Family Income in Rutherford County
Family Income Brackets in Rutherford County
According to the Rutherford County family income data, there are 3,192 families falling into the $50,000 to $74,999 income range, which is the most common income bracket and makes up 18.7% of all families. Conversely, the $10,000 to $14,999 income bracket is the least frequent group with only 324 families (1.9%) belonging to this category.
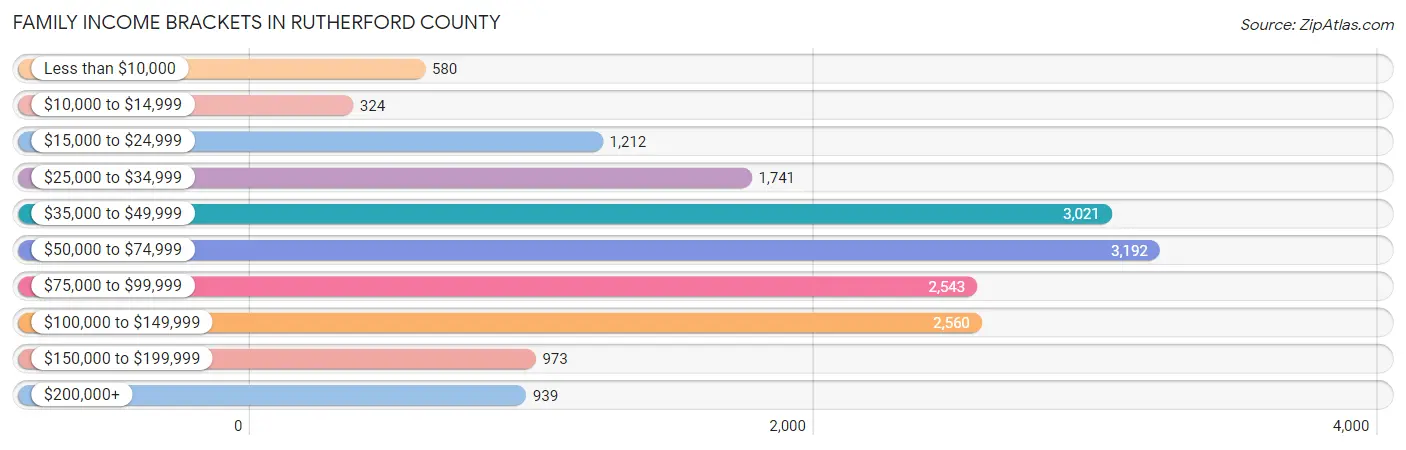
| Income Bracket | # Families | % Families |
| Less than $10,000 | 580 | 3.4% |
| $10,000 to $14,999 | 324 | 1.9% |
| $15,000 to $24,999 | 1,212 | 7.1% |
| $25,000 to $34,999 | 1,741 | 10.2% |
| $35,000 to $49,999 | 3,021 | 17.7% |
| $50,000 to $74,999 | 3,192 | 18.7% |
| $75,000 to $99,999 | 2,543 | 14.9% |
| $100,000 to $149,999 | 2,560 | 15.0% |
| $150,000 to $199,999 | 973 | 5.7% |
| $200,000+ | 939 | 5.5% |
Family Income by Famaliy Size in Rutherford County
5-person families (1,032 | 6.0%) account for the highest median family income in Rutherford County with $87,847 per family, while 2-person families (8,949 | 52.4%) have the highest median income of $27,686 per family member.
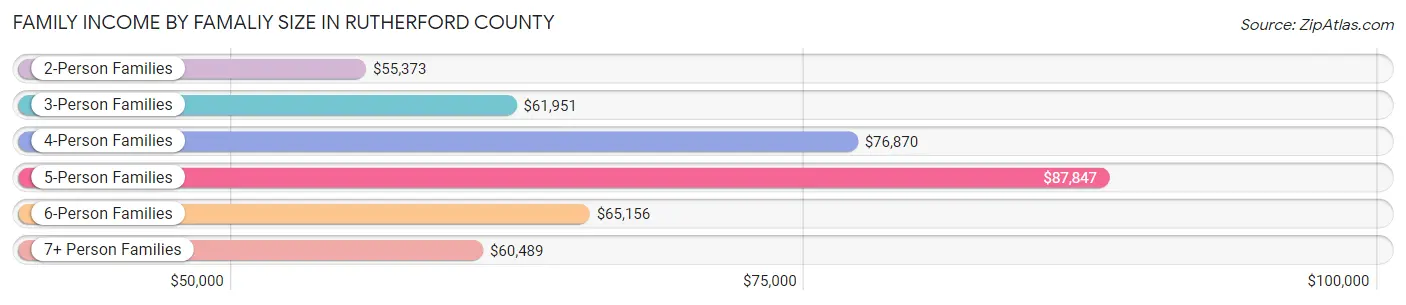
| Income Bracket | # Families | Median Income |
| 2-Person Families | 8,949 (52.4%) | $55,373 |
| 3-Person Families | 3,796 (22.2%) | $61,951 |
| 4-Person Families | 2,558 (15.0%) | $76,870 |
| 5-Person Families | 1,032 (6.0%) | $87,847 |
| 6-Person Families | 459 (2.7%) | $65,156 |
| 7+ Person Families | 275 (1.6%) | $60,489 |
| Total | 17,069 (100.0%) | $62,564 |
Family Income by Number of Earners in Rutherford County
The median family income in Rutherford County is $62,564, with families comprising 3+ earners (1,803) having the highest median family income of $130,069, while families with no earners (3,660) have the lowest median family income of $37,943, accounting for 10.6% and 21.4% of families, respectively.
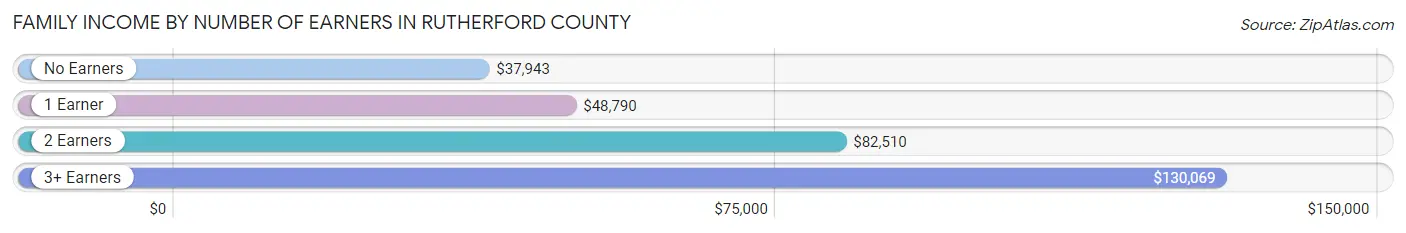
| Number of Earners | # Families | Median Income |
| No Earners | 3,660 (21.4%) | $37,943 |
| 1 Earner | 6,049 (35.4%) | $48,790 |
| 2 Earners | 5,557 (32.6%) | $82,510 |
| 3+ Earners | 1,803 (10.6%) | $130,069 |
| Total | 17,069 (100.0%) | $62,564 |
Household Income in Rutherford County
Household Income Brackets in Rutherford County
With 4,992 households falling in the category, the $50,000 to $74,999 income range is the most frequent in Rutherford County, accounting for 19.0% of all households. In contrast, only 1,077 households (4.1%) fall into the $150,000 to $199,999 income bracket, making it the least populous group.
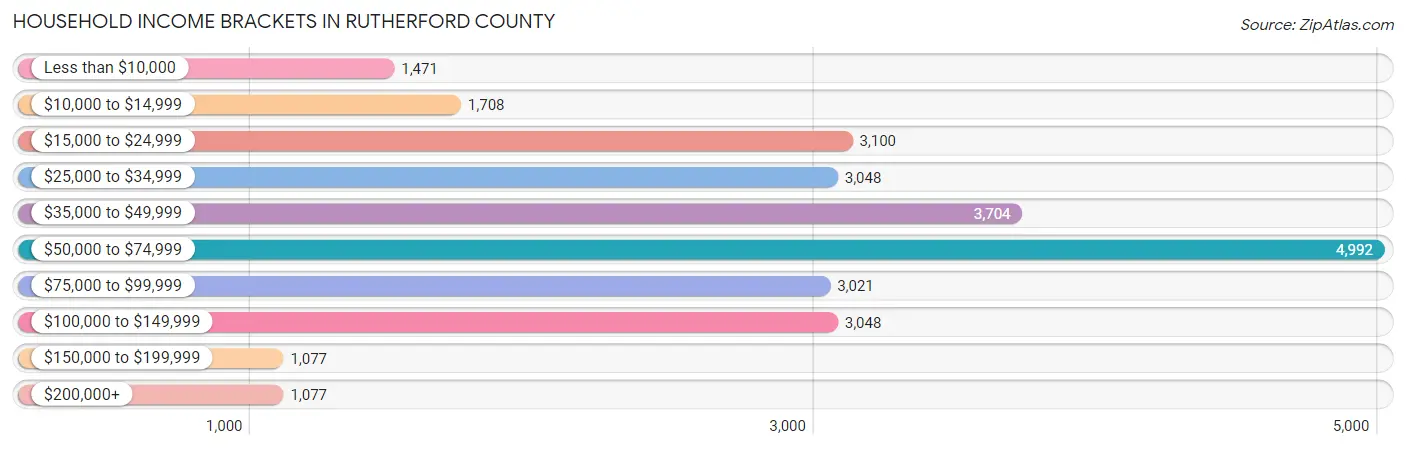
| Income Bracket | # Households | % Households |
| Less than $10,000 | 1,471 | 5.6% |
| $10,000 to $14,999 | 1,708 | 6.5% |
| $15,000 to $24,999 | 3,100 | 11.8% |
| $25,000 to $34,999 | 3,048 | 11.6% |
| $35,000 to $49,999 | 3,704 | 14.1% |
| $50,000 to $74,999 | 4,992 | 19.0% |
| $75,000 to $99,999 | 3,021 | 11.5% |
| $100,000 to $149,999 | 3,048 | 11.6% |
| $150,000 to $199,999 | 1,077 | 4.1% |
| $200,000+ | 1,077 | 4.1% |
Household Income by Householder Age in Rutherford County
The median household income in Rutherford County is $50,512, with the highest median household income of $58,777 found in the 25 to 44 years age bracket for the primary householder. A total of 6,805 households (25.9%) fall into this category. Meanwhile, the 65+ years age bracket for the primary householder has the lowest median household income of $40,606, with 9,186 households (35.0%) in this group.
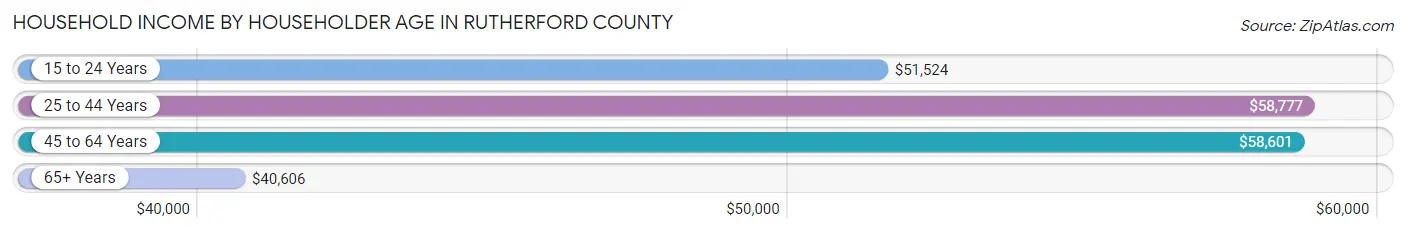
| Income Bracket | # Households | Median Income |
| 15 to 24 Years | 446 (1.7%) | $51,524 |
| 25 to 44 Years | 6,805 (25.9%) | $58,777 |
| 45 to 64 Years | 9,836 (37.4%) | $58,601 |
| 65+ Years | 9,186 (35.0%) | $40,606 |
| Total | 26,273 (100.0%) | $50,512 |
Poverty in Rutherford County
Income Below Poverty by Sex and Age in Rutherford County
With 15.9% poverty level for males and 20.7% for females among the residents of Rutherford County, under 5 year old males and 15 year old females are the most vulnerable to poverty, with 448 males (27.9%) and 151 females (36.6%) in their respective age groups living below the poverty level.
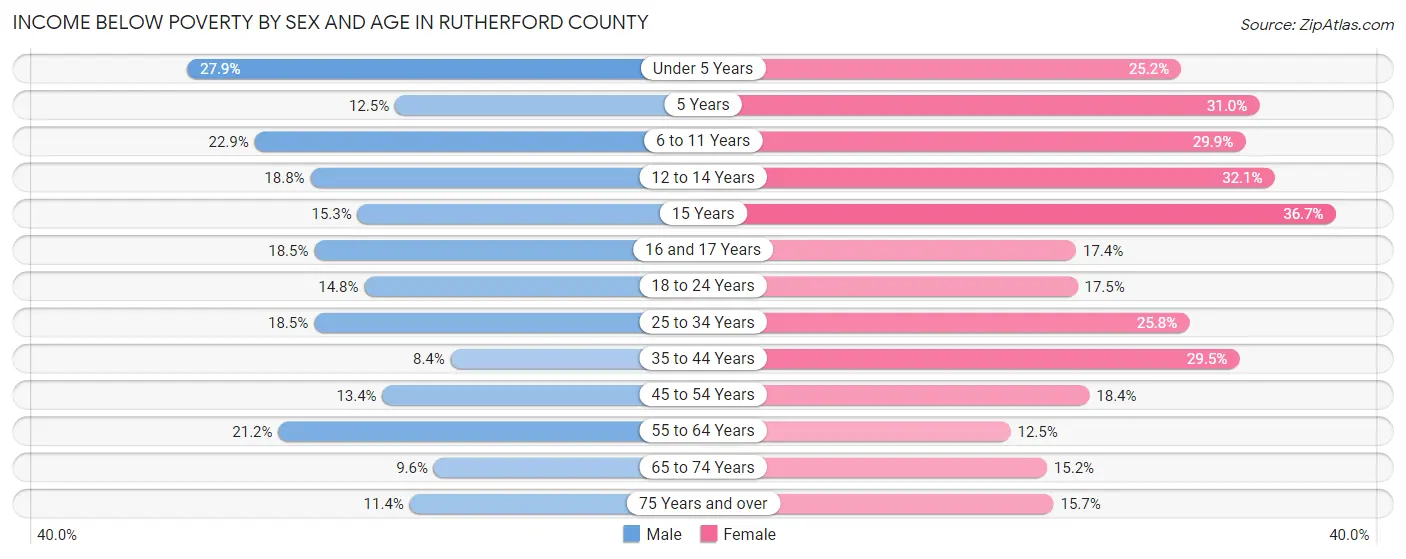
| Age Bracket | Male | Female |
| Under 5 Years | 448 (27.9%) | 391 (25.2%) |
| 5 Years | 33 (12.5%) | 136 (31.0%) |
| 6 to 11 Years | 523 (22.9%) | 706 (29.9%) |
| 12 to 14 Years | 210 (18.8%) | 244 (32.1%) |
| 15 Years | 57 (15.3%) | 151 (36.6%) |
| 16 and 17 Years | 167 (18.5%) | 137 (17.4%) |
| 18 to 24 Years | 379 (14.8%) | 392 (17.5%) |
| 25 to 34 Years | 624 (18.5%) | 977 (25.8%) |
| 35 to 44 Years | 283 (8.4%) | 1,085 (29.5%) |
| 45 to 54 Years | 556 (13.4%) | 789 (18.4%) |
| 55 to 64 Years | 967 (21.2%) | 621 (12.5%) |
| 65 to 74 Years | 377 (9.6%) | 662 (15.2%) |
| 75 Years and over | 256 (11.4%) | 484 (15.7%) |
| Total | 4,880 (15.9%) | 6,775 (20.7%) |
Income Above Poverty by Sex and Age in Rutherford County
According to the poverty statistics in Rutherford County, males aged 35 to 44 years and females aged 55 to 64 years are the age groups that are most secure financially, with 91.6% of males and 87.5% of females in these age groups living above the poverty line.
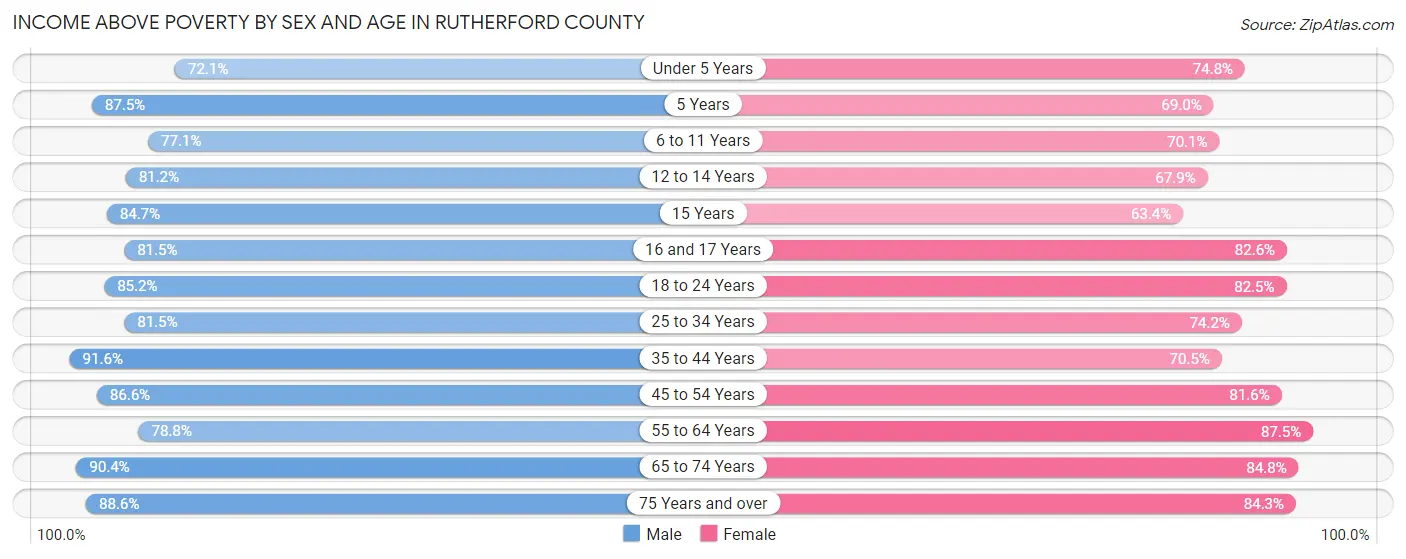
| Age Bracket | Male | Female |
| Under 5 Years | 1,156 (72.1%) | 1,162 (74.8%) |
| 5 Years | 231 (87.5%) | 303 (69.0%) |
| 6 to 11 Years | 1,758 (77.1%) | 1,652 (70.1%) |
| 12 to 14 Years | 908 (81.2%) | 516 (67.9%) |
| 15 Years | 316 (84.7%) | 261 (63.3%) |
| 16 and 17 Years | 736 (81.5%) | 651 (82.6%) |
| 18 to 24 Years | 2,185 (85.2%) | 1,848 (82.5%) |
| 25 to 34 Years | 2,747 (81.5%) | 2,813 (74.2%) |
| 35 to 44 Years | 3,099 (91.6%) | 2,593 (70.5%) |
| 45 to 54 Years | 3,585 (86.6%) | 3,504 (81.6%) |
| 55 to 64 Years | 3,602 (78.8%) | 4,334 (87.5%) |
| 65 to 74 Years | 3,543 (90.4%) | 3,684 (84.8%) |
| 75 Years and over | 1,987 (88.6%) | 2,594 (84.3%) |
| Total | 25,853 (84.1%) | 25,915 (79.3%) |
Income Below Poverty Among Married-Couple Families in Rutherford County
The poverty statistics for married-couple families in Rutherford County show that 6.3% or 763 of the total 12,176 families live below the poverty line. Families with 5 or more children have the highest poverty rate of 38.9%, comprising of 28 families. On the other hand, families with no children have the lowest poverty rate of 4.3%, which includes 359 families.
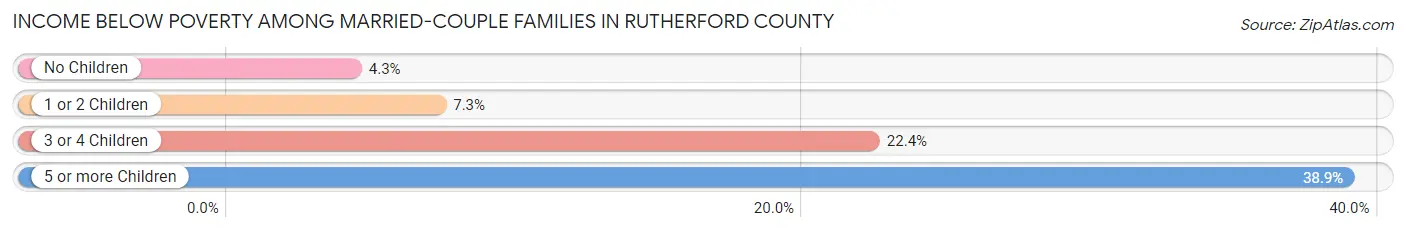
| Children | Above Poverty | Below Poverty |
| No Children | 7,977 (95.7%) | 359 (4.3%) |
| 1 or 2 Children | 2,864 (92.7%) | 224 (7.2%) |
| 3 or 4 Children | 528 (77.6%) | 152 (22.4%) |
| 5 or more Children | 44 (61.1%) | 28 (38.9%) |
| Total | 11,413 (93.7%) | 763 (6.3%) |
Income Below Poverty Among Single-Parent Households in Rutherford County
According to the poverty data in Rutherford County, 14.4% or 256 single-father households and 37.7% or 1,174 single-mother households are living below the poverty line. Among single-father households, those with 5 or more children have the highest poverty rate, with 16 households (66.7%) experiencing poverty. Likewise, among single-mother households, those with 5 or more children have the highest poverty rate, with 131 households (100.0%) falling below the poverty line.
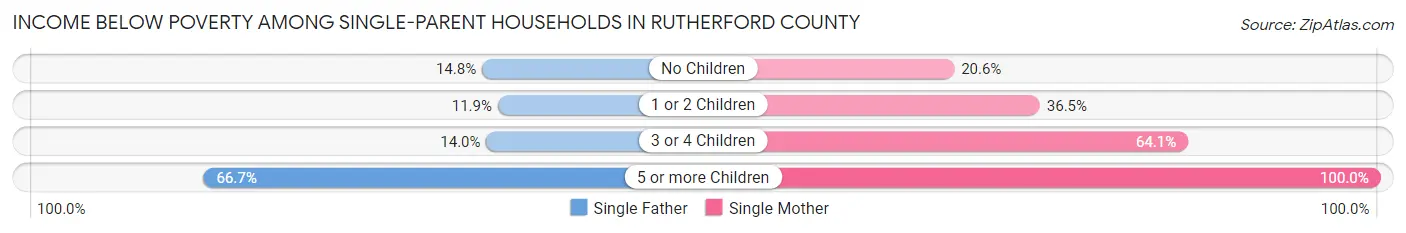
| Children | Single Father | Single Mother |
| No Children | 129 (14.8%) | 211 (20.6%) |
| 1 or 2 Children | 70 (11.9%) | 562 (36.5%) |
| 3 or 4 Children | 41 (14.0%) | 270 (64.1%) |
| 5 or more Children | 16 (66.7%) | 131 (100.0%) |
| Total | 256 (14.4%) | 1,174 (37.7%) |
Income Below Poverty Among Married-Couple vs Single-Parent Households in Rutherford County
The poverty data for Rutherford County shows that 763 of the married-couple family households (6.3%) and 1,430 of the single-parent households (29.2%) are living below the poverty level. Within the married-couple family households, those with 5 or more children have the highest poverty rate, with 28 households (38.9%) falling below the poverty line. Among the single-parent households, those with 5 or more children have the highest poverty rate, with 147 household (94.8%) living below poverty.
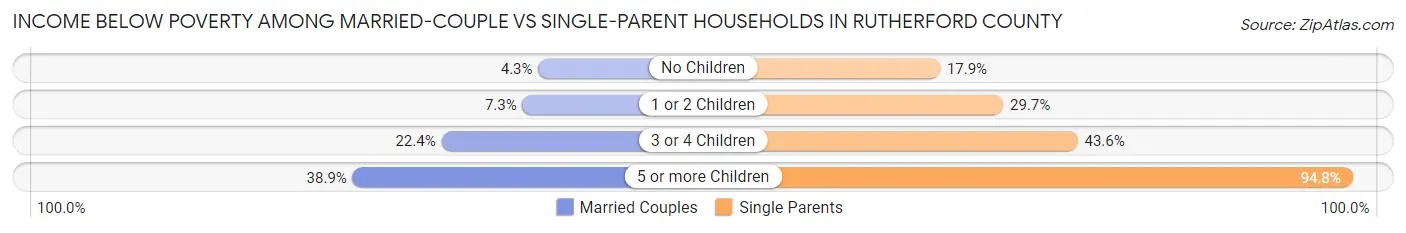
| Children | Married-Couple Families | Single-Parent Households |
| No Children | 359 (4.3%) | 340 (17.9%) |
| 1 or 2 Children | 224 (7.2%) | 632 (29.7%) |
| 3 or 4 Children | 152 (22.4%) | 311 (43.6%) |
| 5 or more Children | 28 (38.9%) | 147 (94.8%) |
| Total | 763 (6.3%) | 1,430 (29.2%) |
Race in Rutherford County
The most populous races in Rutherford County are White / Caucasian (54,235 | 83.9%), Black / African American (5,585 | 8.6%), and Hispanic or Latino (3,250 | 5.0%).
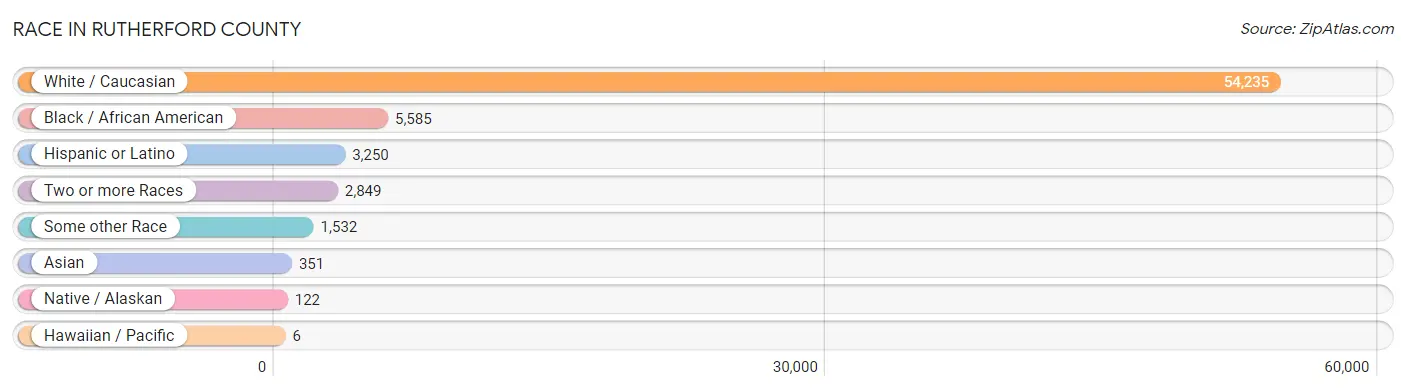
| Race | # Population | % Population |
| Asian | 351 | 0.5% |
| Black / African American | 5,585 | 8.6% |
| Hawaiian / Pacific | 6 | 0.0% |
| Hispanic or Latino | 3,250 | 5.0% |
| Native / Alaskan | 122 | 0.2% |
| White / Caucasian | 54,235 | 83.9% |
| Two or more Races | 2,849 | 4.4% |
| Some other Race | 1,532 | 2.4% |
| Total | 64,680 | 100.0% |
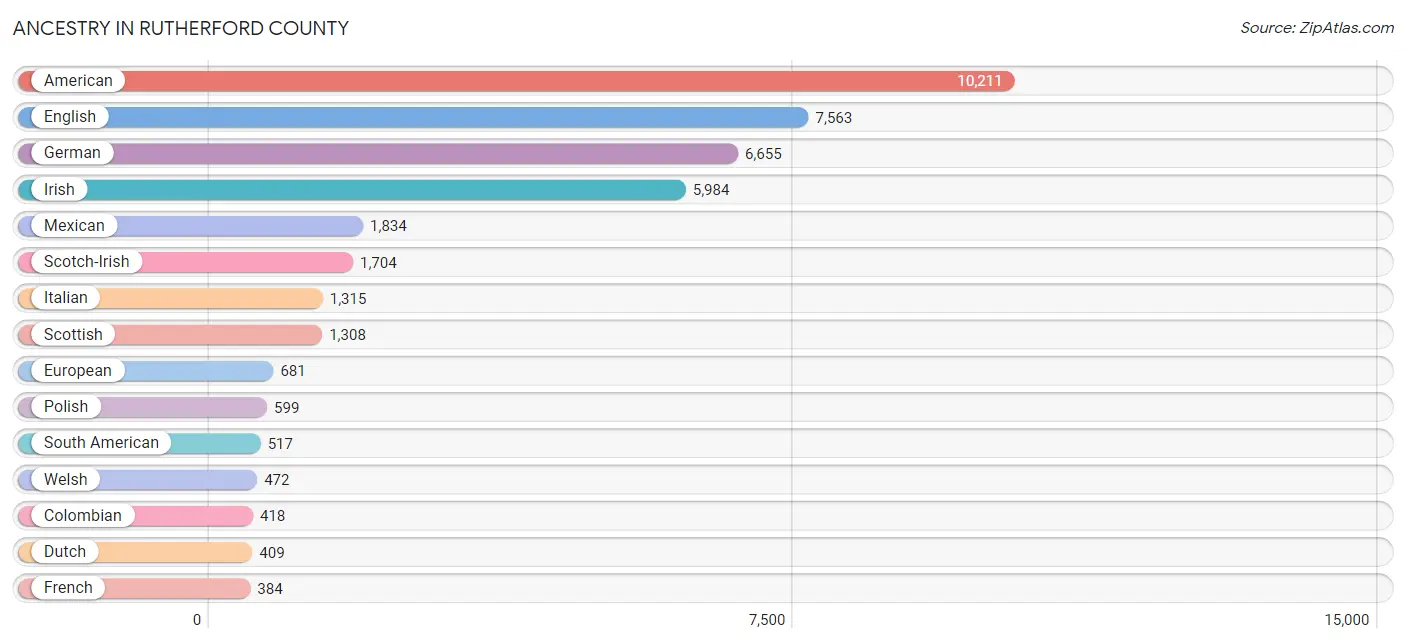
Ancestry in Rutherford County
The most populous ancestries reported in Rutherford County are American (10,211 | 15.8%), English (7,563 | 11.7%), German (6,655 | 10.3%), Irish (5,984 | 9.2%), and Mexican (1,834 | 2.8%), together accounting for 49.9% of all Rutherford County residents.
| Ancestry | # Population | % Population |
| African | 66 | 0.1% |
| American | 10,211 | 15.8% |
| Arab | 10 | 0.0% |
| Armenian | 42 | 0.1% |
| Australian | 108 | 0.2% |
| Austrian | 3 | 0.0% |
| Bangladeshi | 31 | 0.1% |
| Belgian | 42 | 0.1% |
| Bhutanese | 77 | 0.1% |
| Blackfeet | 95 | 0.2% |
| Bolivian | 70 | 0.1% |
| Brazilian | 47 | 0.1% |
| British | 318 | 0.5% |
| British West Indian | 9 | 0.0% |
| Burmese | 51 | 0.1% |
| Cambodian | 6 | 0.0% |
| Canadian | 144 | 0.2% |
| Celtic | 20 | 0.0% |
| Central American | 288 | 0.4% |
| Central American Indian | 10 | 0.0% |
| Cherokee | 290 | 0.4% |
| Colombian | 418 | 0.6% |
| Creek | 28 | 0.0% |
| Croatian | 6 | 0.0% |
| Cuban | 245 | 0.4% |
| Czech | 136 | 0.2% |
| Czechoslovakian | 12 | 0.0% |
| Danish | 125 | 0.2% |
| Dutch | 409 | 0.6% |
| Eastern European | 45 | 0.1% |
| Ecuadorian | 8 | 0.0% |
| English | 7,563 | 11.7% |
| Estonian | 7 | 0.0% |
| European | 681 | 1.1% |
| Finnish | 26 | 0.0% |
| French | 384 | 0.6% |
| French Canadian | 133 | 0.2% |
| German | 6,655 | 10.3% |
| Greek | 33 | 0.1% |
| Guatemalan | 7 | 0.0% |
| Haitian | 2 | 0.0% |
| Hungarian | 71 | 0.1% |
| Icelander | 4 | 0.0% |
| Irish | 5,984 | 9.2% |
| Iroquois | 42 | 0.1% |
| Italian | 1,315 | 2.0% |
| Korean | 112 | 0.2% |
| Lebanese | 2 | 0.0% |
| Lithuanian | 12 | 0.0% |
| Lumbee | 32 | 0.1% |
| Mexican | 1,834 | 2.8% |
| Mexican American Indian | 19 | 0.0% |
| Native Hawaiian | 26 | 0.0% |
| Navajo | 2 | 0.0% |
| Nicaraguan | 46 | 0.1% |
| Northern European | 75 | 0.1% |
| Norwegian | 140 | 0.2% |
| Pakistani | 8 | 0.0% |
| Palestinian | 5 | 0.0% |
| Panamanian | 5 | 0.0% |
| Pennsylvania German | 60 | 0.1% |
| Polish | 599 | 0.9% |
| Portuguese | 43 | 0.1% |
| Puerto Rican | 177 | 0.3% |
| Romanian | 7 | 0.0% |
| Russian | 161 | 0.3% |
| Salvadoran | 230 | 0.4% |
| Samoan | 11 | 0.0% |
| Scandinavian | 109 | 0.2% |
| Scotch-Irish | 1,704 | 2.6% |
| Scottish | 1,308 | 2.0% |
| Serbian | 39 | 0.1% |
| Slovak | 66 | 0.1% |
| Slovene | 3 | 0.0% |
| South American | 517 | 0.8% |
| Spaniard | 43 | 0.1% |
| Spanish | 46 | 0.1% |
| Sri Lankan | 133 | 0.2% |
| Subsaharan African | 71 | 0.1% |
| Swedish | 191 | 0.3% |
| Swiss | 8 | 0.0% |
| Thai | 44 | 0.1% |
| Tongan | 8 | 0.0% |
| Trinidadian and Tobagonian | 10 | 0.0% |
| Ukrainian | 46 | 0.1% |
| Venezuelan | 21 | 0.0% |
| Vietnamese | 60 | 0.1% |
| Welsh | 472 | 0.7% |
| Yugoslavian | 6 | 0.0% | View All 89 Rows |
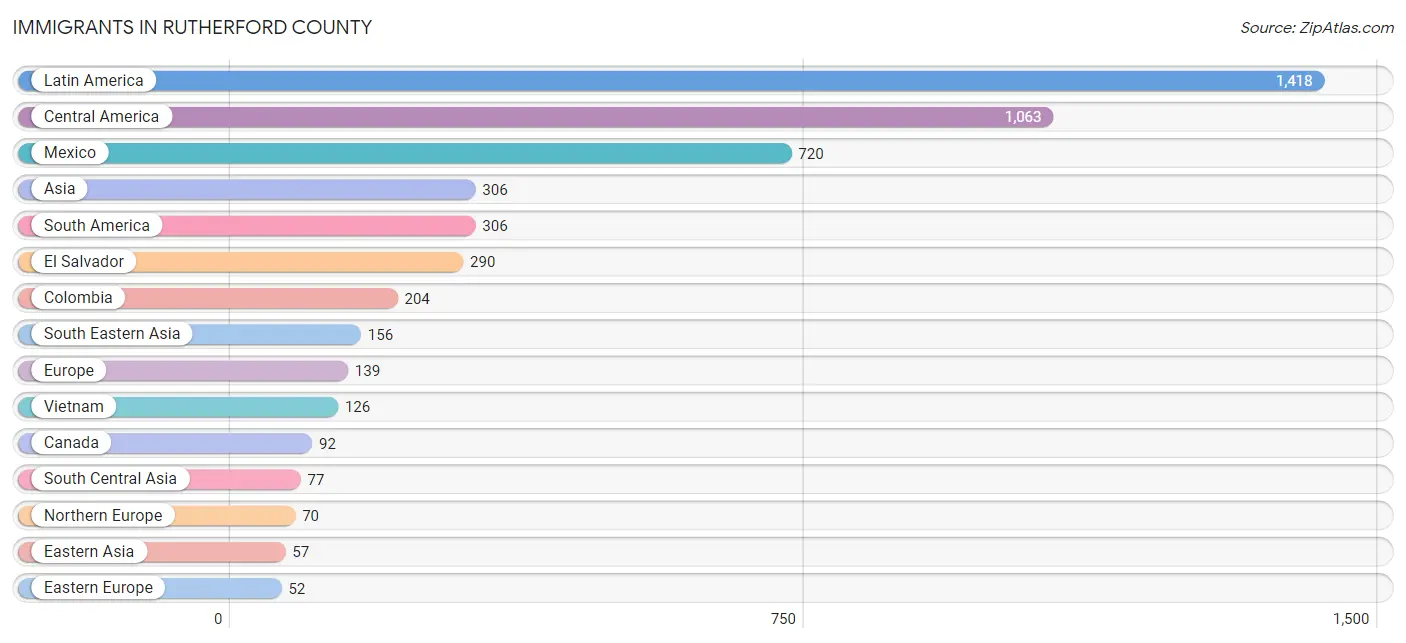
Immigrants in Rutherford County
The most numerous immigrant groups reported in Rutherford County came from Latin America (1,418 | 2.2%), Central America (1,063 | 1.6%), Mexico (720 | 1.1%), Asia (306 | 0.5%), and South America (306 | 0.5%), together accounting for 5.9% of all Rutherford County residents.
| Immigration Origin | # Population | % Population |
| Africa | 14 | 0.0% |
| Asia | 306 | 0.5% |
| Austria | 3 | 0.0% |
| Bangladesh | 28 | 0.0% |
| Brazil | 48 | 0.1% |
| Canada | 92 | 0.1% |
| Caribbean | 49 | 0.1% |
| Central America | 1,063 | 1.6% |
| Colombia | 204 | 0.3% |
| Cuba | 30 | 0.1% |
| Czechoslovakia | 2 | 0.0% |
| Denmark | 1 | 0.0% |
| Eastern Asia | 57 | 0.1% |
| Eastern Europe | 52 | 0.1% |
| Ecuador | 8 | 0.0% |
| El Salvador | 290 | 0.4% |
| England | 22 | 0.0% |
| Europe | 139 | 0.2% |
| France | 1 | 0.0% |
| Germany | 11 | 0.0% |
| Greece | 2 | 0.0% |
| Guatemala | 7 | 0.0% |
| India | 44 | 0.1% |
| Japan | 25 | 0.0% |
| Korea | 32 | 0.1% |
| Latin America | 1,418 | 2.2% |
| Mexico | 720 | 1.1% |
| Nicaragua | 46 | 0.1% |
| Northern Europe | 70 | 0.1% |
| Philippines | 30 | 0.1% |
| Russia | 8 | 0.0% |
| Scotland | 3 | 0.0% |
| Serbia | 33 | 0.1% |
| South Africa | 14 | 0.0% |
| South America | 306 | 0.5% |
| South Central Asia | 77 | 0.1% |
| South Eastern Asia | 156 | 0.2% |
| Southern Europe | 2 | 0.0% |
| Trinidad and Tobago | 10 | 0.0% |
| Ukraine | 1 | 0.0% |
| Uzbekistan | 5 | 0.0% |
| Venezuela | 14 | 0.0% |
| Vietnam | 126 | 0.2% |
| Western Asia | 14 | 0.0% |
| Western Europe | 15 | 0.0% | View All 45 Rows |
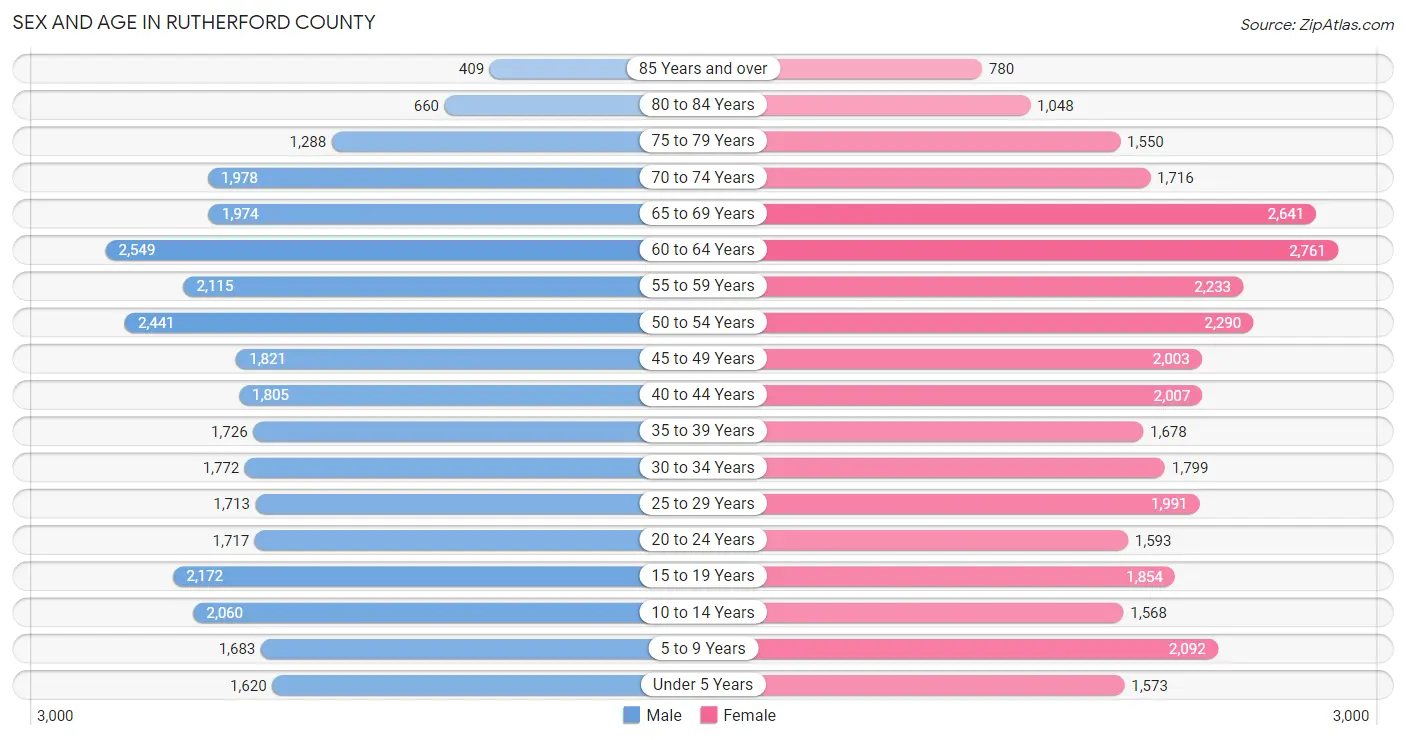
Sex and Age in Rutherford County
Sex and Age in Rutherford County
The most populous age groups in Rutherford County are 60 to 64 Years (2,549 | 8.1%) for men and 60 to 64 Years (2,761 | 8.3%) for women.
| Age Bracket | Male | Female |
| Under 5 Years | 1,620 (5.1%) | 1,573 (4.7%) |
| 5 to 9 Years | 1,683 (5.3%) | 2,092 (6.3%) |
| 10 to 14 Years | 2,060 (6.5%) | 1,568 (4.7%) |
| 15 to 19 Years | 2,172 (6.9%) | 1,854 (5.6%) |
| 20 to 24 Years | 1,717 (5.4%) | 1,593 (4.8%) |
| 25 to 29 Years | 1,713 (5.4%) | 1,991 (6.0%) |
| 30 to 34 Years | 1,772 (5.6%) | 1,799 (5.4%) |
| 35 to 39 Years | 1,726 (5.5%) | 1,678 (5.1%) |
| 40 to 44 Years | 1,805 (5.7%) | 2,007 (6.0%) |
| 45 to 49 Years | 1,821 (5.8%) | 2,003 (6.0%) |
| 50 to 54 Years | 2,441 (7.7%) | 2,290 (6.9%) |
| 55 to 59 Years | 2,115 (6.7%) | 2,233 (6.7%) |
| 60 to 64 Years | 2,549 (8.1%) | 2,761 (8.3%) |
| 65 to 69 Years | 1,974 (6.3%) | 2,641 (8.0%) |
| 70 to 74 Years | 1,978 (6.3%) | 1,716 (5.2%) |
| 75 to 79 Years | 1,288 (4.1%) | 1,550 (4.7%) |
| 80 to 84 Years | 660 (2.1%) | 1,048 (3.2%) |
| 85 Years and over | 409 (1.3%) | 780 (2.4%) |
| Total | 31,503 (100.0%) | 33,177 (100.0%) |
Families and Households in Rutherford County
Median Family Size in Rutherford County
The median family size in Rutherford County is 2.98 persons per family, with single female/mother families (3,115 | 18.2%) accounting for the largest median family size of 3.07 persons per family. On the other hand, single male/father families (1,778 | 10.4%) represent the smallest median family size with 2.94 persons per family.

| Family Type | # Families | Family Size |
| Married-Couple | 12,176 (71.3%) | 2.96 |
| Single Male/Father | 1,778 (10.4%) | 2.94 |
| Single Female/Mother | 3,115 (18.2%) | 3.07 |
| Total Families | 17,069 (100.0%) | 2.98 |
Median Household Size in Rutherford County
The median household size in Rutherford County is 2.41 persons per household, with single male/father households (1,778 | 6.8%) accounting for the largest median household size of 3.32 persons per household. non-family households (9,204 | 35.0%) represent the smallest median household size with 1.19 persons per household.

| Household Type | # Households | Household Size |
| Married-Couple | 12,176 (46.3%) | 2.98 |
| Single Male/Father | 1,778 (6.8%) | 3.32 |
| Single Female/Mother | 3,115 (11.9%) | 3.29 |
| Non-family | 9,204 (35.0%) | 1.19 |
| Total Households | 26,273 (100.0%) | 2.41 |
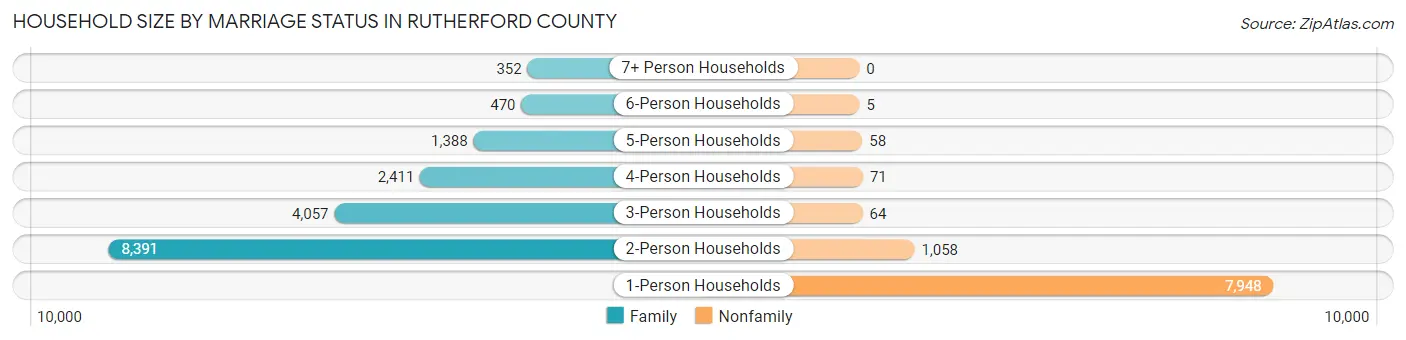
Household Size by Marriage Status in Rutherford County
Out of a total of 26,273 households in Rutherford County, 17,069 (65.0%) are family households, while 9,204 (35.0%) are nonfamily households. The most numerous type of family households are 2-person households, comprising 8,391, and the most common type of nonfamily households are 1-person households, comprising 7,948.
| Household Size | Family Households | Nonfamily Households |
| 1-Person Households | - | 7,948 (30.2%) |
| 2-Person Households | 8,391 (31.9%) | 1,058 (4.0%) |
| 3-Person Households | 4,057 (15.4%) | 64 (0.2%) |
| 4-Person Households | 2,411 (9.2%) | 71 (0.3%) |
| 5-Person Households | 1,388 (5.3%) | 58 (0.2%) |
| 6-Person Households | 470 (1.8%) | 5 (0.0%) |
| 7+ Person Households | 352 (1.3%) | 0 (0.0%) |
| Total | 17,069 (65.0%) | 9,204 (35.0%) |
Female Fertility in Rutherford County
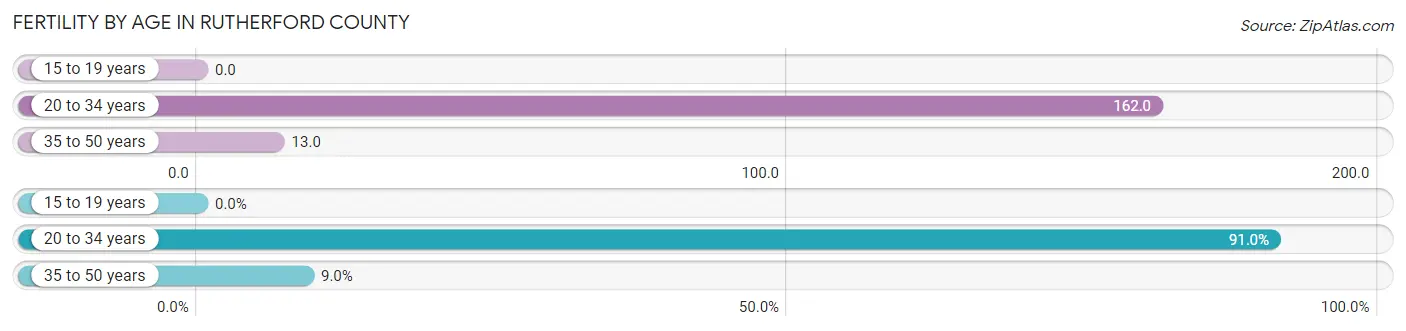
Fertility by Age in Rutherford County
Average fertility rate in Rutherford County is 70.0 births per 1,000 women. Women in the age bracket of 20 to 34 years have the highest fertility rate with 162.0 births per 1,000 women. Women in the age bracket of 20 to 34 years acount for 91.0% of all women with births.
| Age Bracket | Women with Births | Births / 1,000 Women |
| 15 to 19 years | 0 (0.0%) | 0.0 |
| 20 to 34 years | 871 (91.0%) | 162.0 |
| 35 to 50 years | 86 (9.0%) | 13.0 |
| Total | 957 (100.0%) | 70.0 |
Fertility by Age by Marriage Status in Rutherford County
43.5% of women with births (957) in Rutherford County are married. The highest percentage of unmarried women with births falls into 20 to 34 years age bracket with 59.4% of them unmarried at the time of birth, while the lowest percentage of unmarried women with births belong to 35 to 50 years age bracket with 27.9% of them unmarried.
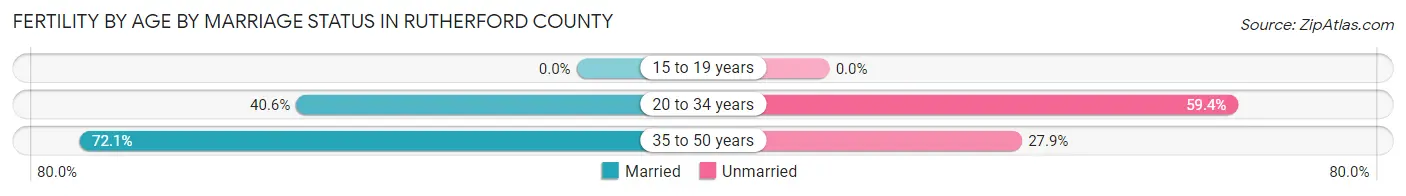
| Age Bracket | Married | Unmarried |
| 15 to 19 years | 0 (0.0%) | 0 (0.0%) |
| 20 to 34 years | 354 (40.6%) | 517 (59.4%) |
| 35 to 50 years | 62 (72.1%) | 24 (27.9%) |
| Total | 416 (43.5%) | 541 (56.5%) |
Fertility by Education in Rutherford County
Average fertility rate in Rutherford County is 70.0 births per 1,000 women. Women with the education attainment of graduate degree have the highest fertility rate of 99.0 births per 1,000 women, while women with the education attainment of less than high school have the lowest fertility at 24.0 births per 1,000 women. Women with the education attainment of college or associate's degree represent 41.9% of all women with births.
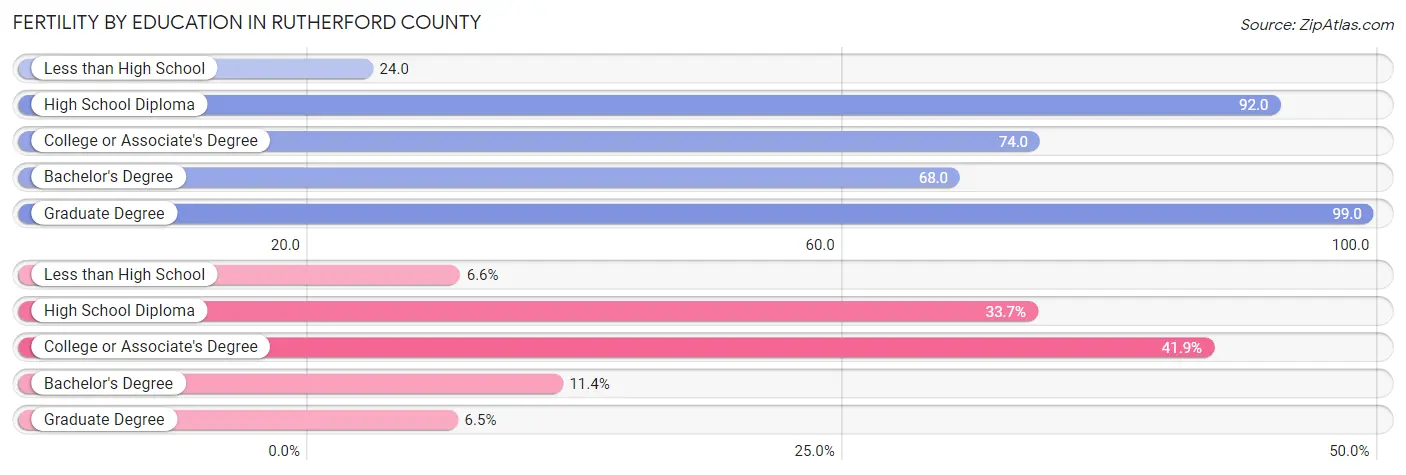
| Educational Attainment | Women with Births | Births / 1,000 Women |
| Less than High School | 63 (6.6%) | 24.0 |
| High School Diploma | 322 (33.7%) | 92.0 |
| College or Associate's Degree | 401 (41.9%) | 74.0 |
| Bachelor's Degree | 109 (11.4%) | 68.0 |
| Graduate Degree | 62 (6.5%) | 99.0 |
| Total | 957 (100.0%) | 70.0 |
Fertility by Education by Marriage Status in Rutherford County
56.5% of women with births in Rutherford County are unmarried. Women with the educational attainment of graduate degree are most likely to be married with 100.0% of them married at childbirth, while women with the educational attainment of less than high school are least likely to be married with 69.8% of them unmarried at childbirth.
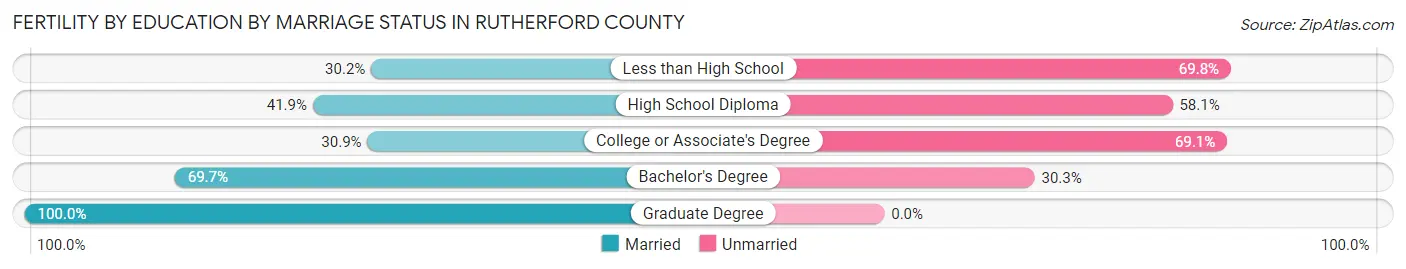
| Educational Attainment | Married | Unmarried |
| Less than High School | 19 (30.2%) | 44 (69.8%) |
| High School Diploma | 135 (41.9%) | 187 (58.1%) |
| College or Associate's Degree | 124 (30.9%) | 277 (69.1%) |
| Bachelor's Degree | 76 (69.7%) | 33 (30.3%) |
| Graduate Degree | 62 (100.0%) | 0 (0.0%) |
| Total | 416 (43.5%) | 541 (56.5%) |
Employment Characteristics in Rutherford County
Employment by Class of Employer in Rutherford County
Among the 26,021 employed individuals in Rutherford County, private company employees (18,395 | 70.7%), local government employees (1,637 | 6.3%), and self-employed (not incorporated) (1,605 | 6.2%) make up the most common classes of employment.
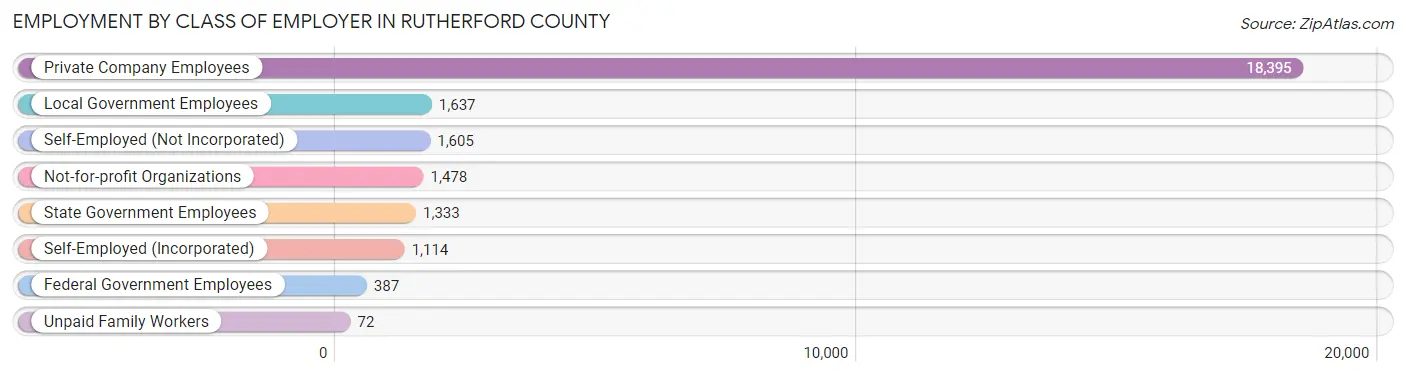
| Employer Class | # Employees | % Employees |
| Private Company Employees | 18,395 | 70.7% |
| Self-Employed (Incorporated) | 1,114 | 4.3% |
| Self-Employed (Not Incorporated) | 1,605 | 6.2% |
| Not-for-profit Organizations | 1,478 | 5.7% |
| Local Government Employees | 1,637 | 6.3% |
| State Government Employees | 1,333 | 5.1% |
| Federal Government Employees | 387 | 1.5% |
| Unpaid Family Workers | 72 | 0.3% |
| Total | 26,021 | 100.0% |
Employment Status by Age in Rutherford County
According to the labor force statistics for Rutherford County, out of the total population over 16 years of age (53,299), 53.3% or 28,408 individuals are in the labor force, with 6.0% or 1,704 of them unemployed. The age group with the highest labor force participation rate is 25 to 29 years, with 78.1% or 2,893 individuals in the labor force. Within the labor force, the 16 to 19 years age range has the highest percentage of unemployed individuals, with 25.4% or 466 of them being unemployed.
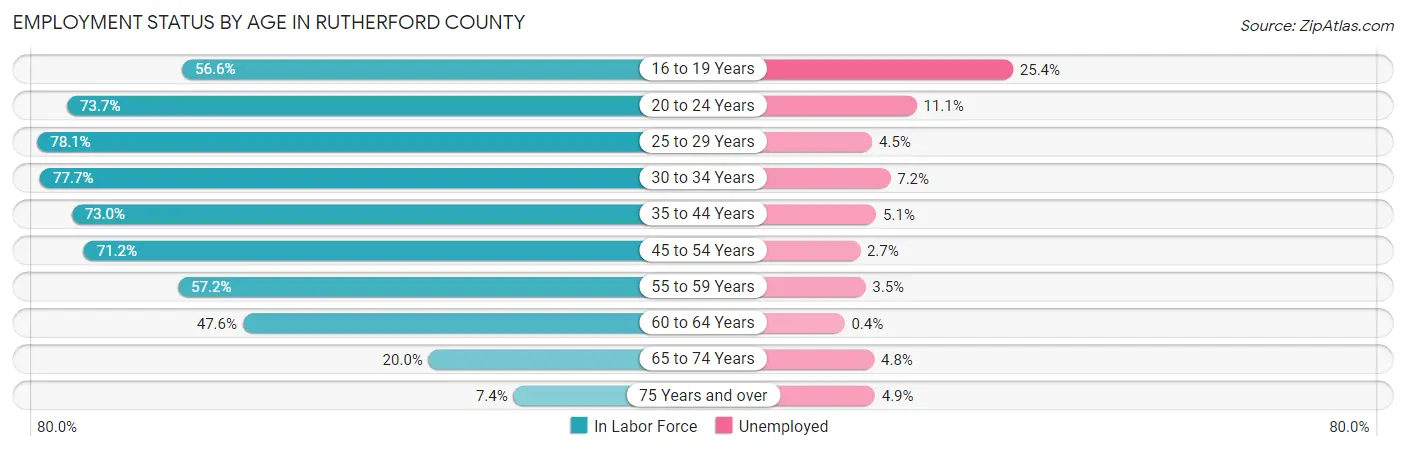
| Age Bracket | In Labor Force | Unemployed |
| 16 to 19 Years | 1,834 (56.6%) | 466 (25.4%) |
| 20 to 24 Years | 2,439 (73.7%) | 271 (11.1%) |
| 25 to 29 Years | 2,893 (78.1%) | 130 (4.5%) |
| 30 to 34 Years | 2,775 (77.7%) | 200 (7.2%) |
| 35 to 44 Years | 5,268 (73.0%) | 269 (5.1%) |
| 45 to 54 Years | 6,091 (71.2%) | 164 (2.7%) |
| 55 to 59 Years | 2,487 (57.2%) | 87 (3.5%) |
| 60 to 64 Years | 2,528 (47.6%) | 10 (0.4%) |
| 65 to 74 Years | 1,662 (20.0%) | 80 (4.8%) |
| 75 Years and over | 424 (7.4%) | 21 (4.9%) |
| Total | 28,408 (53.3%) | 1,704 (6.0%) |
Employment Status by Educational Attainment in Rutherford County
According to labor force statistics for Rutherford County, 67.4% of individuals (22,042) out of the total population between 25 and 64 years of age (32,704) are in the labor force, with 3.9% or 860 of them being unemployed. The group with the highest labor force participation rate are those with the educational attainment of college / associate degree, with 77.7% or 9,507 individuals in the labor force. Within the labor force, individuals with high school diploma education have the highest percentage of unemployment, with 7.9% or 434 of them being unemployed.
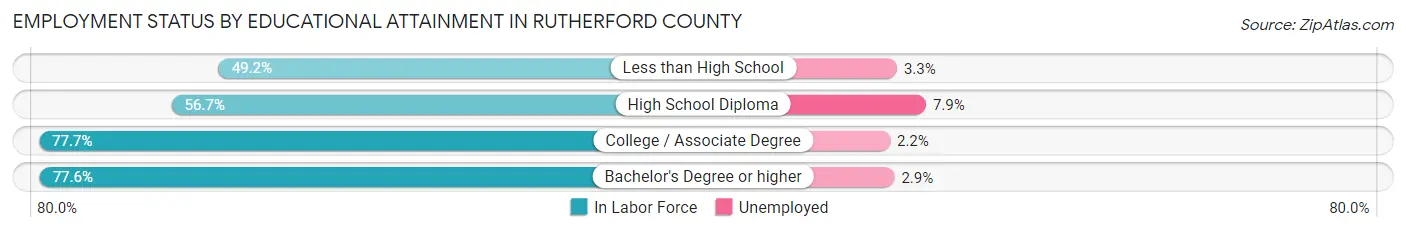
| Educational Attainment | In Labor Force | Unemployed |
| Less than High School | 2,272 (49.2%) | 152 (3.3%) |
| High School Diploma | 5,500 (56.7%) | 766 (7.9%) |
| College / Associate Degree | 9,507 (77.7%) | 269 (2.2%) |
| Bachelor's Degree or higher | 4,772 (77.6%) | 178 (2.9%) |
| Total | 22,042 (67.4%) | 1,275 (3.9%) |
Employment Occupations by Sex in Rutherford County
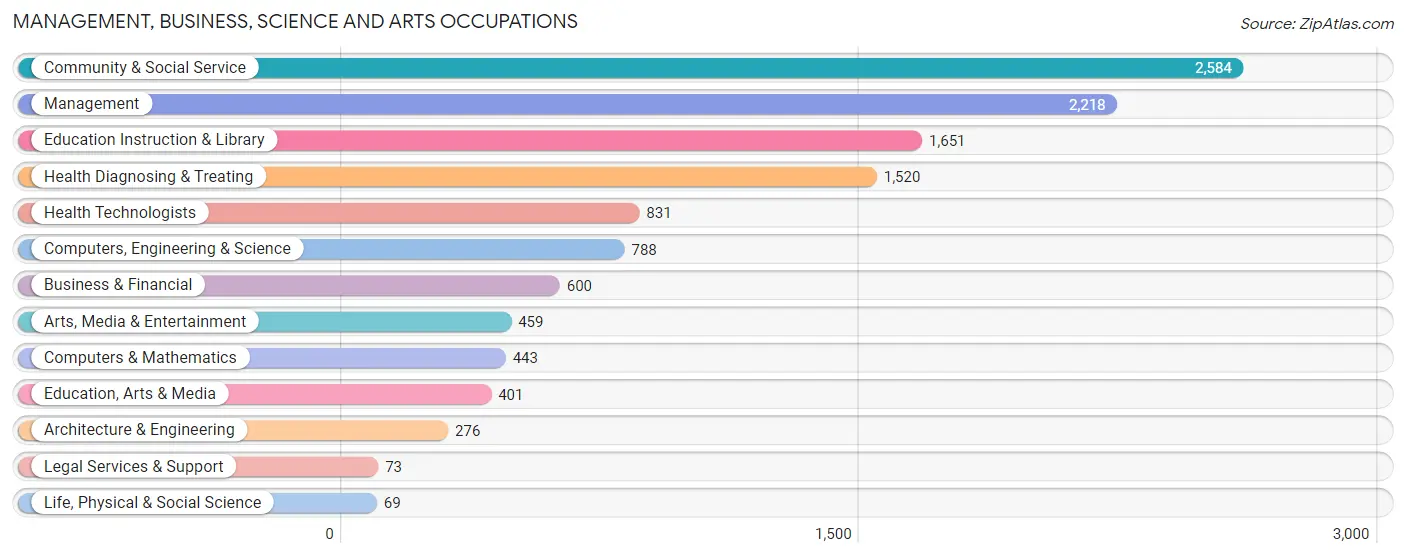
Management, Business, Science and Arts Occupations
The most common Management, Business, Science and Arts occupations in Rutherford County are Community & Social Service (2,584 | 9.7%), Management (2,218 | 8.3%), Education Instruction & Library (1,651 | 6.2%), Health Diagnosing & Treating (1,520 | 5.7%), and Health Technologists (831 | 3.1%).
Management, Business, Science and Arts Occupations by Sex
Within the Management, Business, Science and Arts occupations in Rutherford County, the most male-oriented occupations are Architecture & Engineering (88.0%), Computers, Engineering & Science (74.4%), and Life, Physical & Social Science (72.5%), while the most female-oriented occupations are Health Diagnosing & Treating (81.5%), Health Technologists (80.6%), and Education Instruction & Library (78.7%).
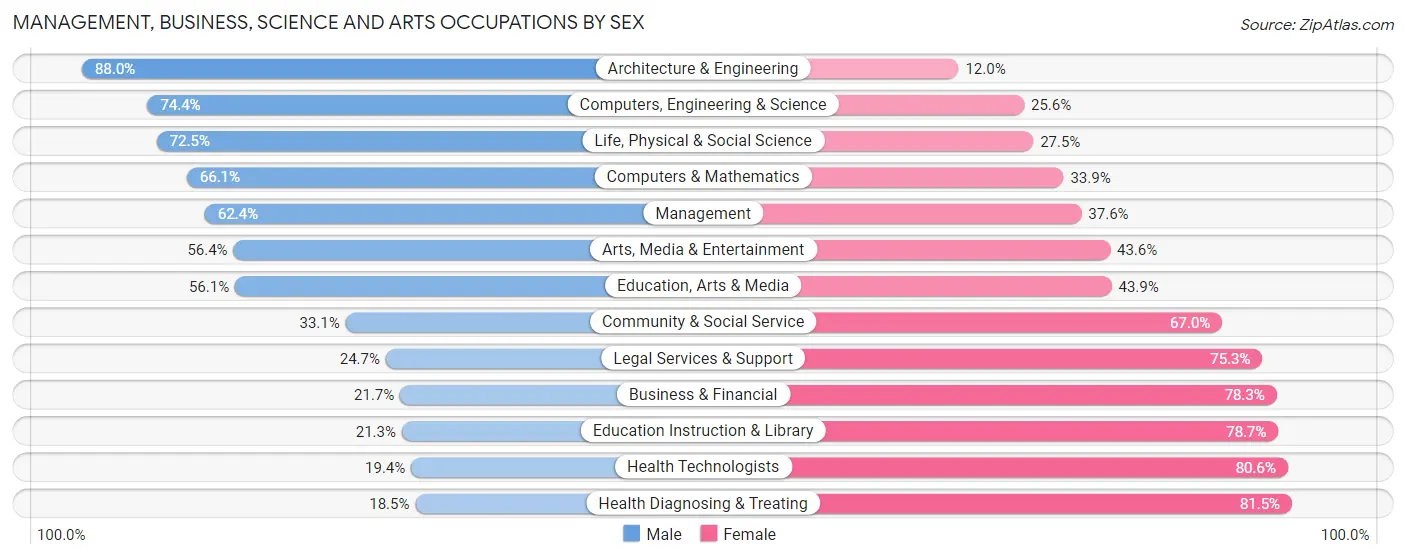
| Occupation | Male | Female |
| Management | 1,384 (62.4%) | 834 (37.6%) |
| Business & Financial | 130 (21.7%) | 470 (78.3%) |
| Computers, Engineering & Science | 586 (74.4%) | 202 (25.6%) |
| Computers & Mathematics | 293 (66.1%) | 150 (33.9%) |
| Architecture & Engineering | 243 (88.0%) | 33 (12.0%) |
| Life, Physical & Social Science | 50 (72.5%) | 19 (27.5%) |
| Community & Social Service | 854 (33.1%) | 1,730 (66.9%) |
| Education, Arts & Media | 225 (56.1%) | 176 (43.9%) |
| Legal Services & Support | 18 (24.7%) | 55 (75.3%) |
| Education Instruction & Library | 352 (21.3%) | 1,299 (78.7%) |
| Arts, Media & Entertainment | 259 (56.4%) | 200 (43.6%) |
| Health Diagnosing & Treating | 281 (18.5%) | 1,239 (81.5%) |
| Health Technologists | 161 (19.4%) | 670 (80.6%) |
| Total (Category) | 3,235 (42.0%) | 4,475 (58.0%) |
| Total (Overall) | 14,084 (52.7%) | 12,624 (47.3%) |
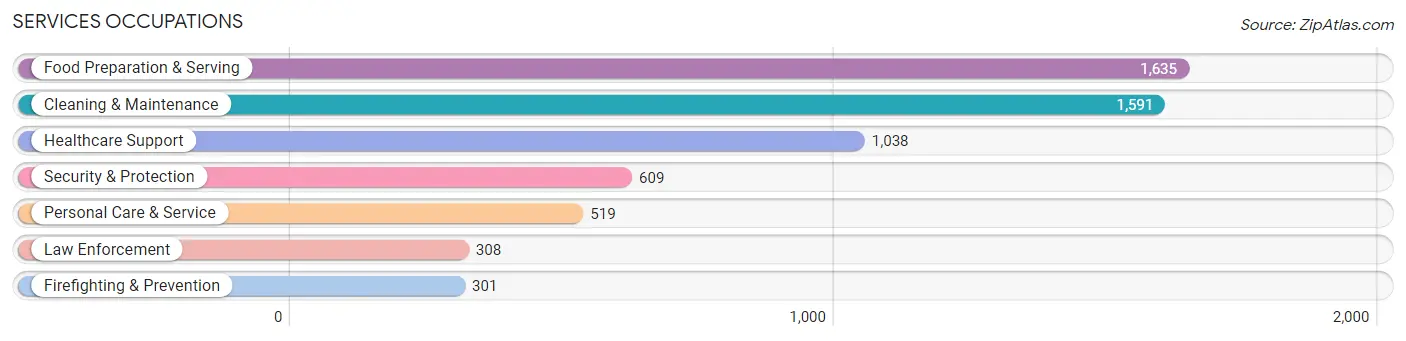
Services Occupations
The most common Services occupations in Rutherford County are Food Preparation & Serving (1,635 | 6.1%), Cleaning & Maintenance (1,591 | 6.0%), Healthcare Support (1,038 | 3.9%), Security & Protection (609 | 2.3%), and Personal Care & Service (519 | 1.9%).
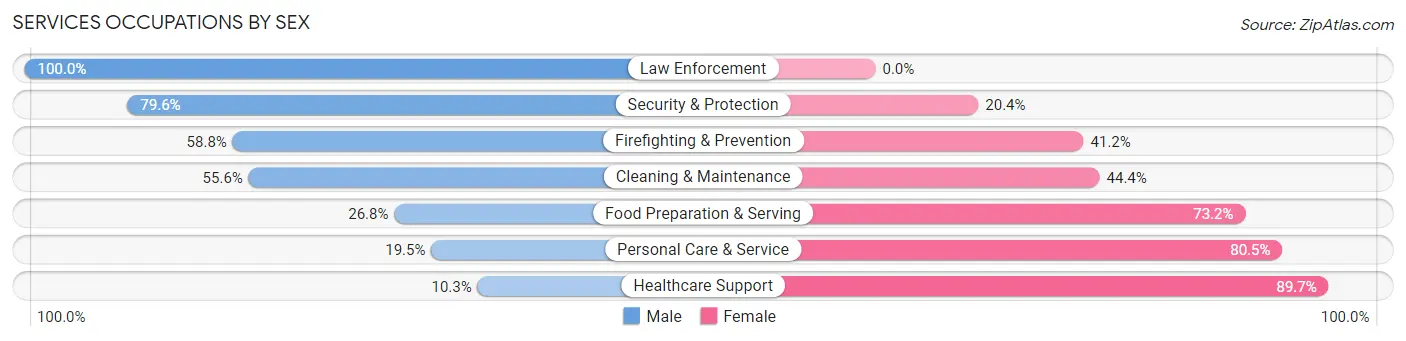
Services Occupations by Sex
Within the Services occupations in Rutherford County, the most male-oriented occupations are Law Enforcement (100.0%), Security & Protection (79.6%), and Firefighting & Prevention (58.8%), while the most female-oriented occupations are Healthcare Support (89.7%), Personal Care & Service (80.5%), and Food Preparation & Serving (73.2%).
| Occupation | Male | Female |
| Healthcare Support | 107 (10.3%) | 931 (89.7%) |
| Security & Protection | 485 (79.6%) | 124 (20.4%) |
| Firefighting & Prevention | 177 (58.8%) | 124 (41.2%) |
| Law Enforcement | 308 (100.0%) | 0 (0.0%) |
| Food Preparation & Serving | 438 (26.8%) | 1,197 (73.2%) |
| Cleaning & Maintenance | 885 (55.6%) | 706 (44.4%) |
| Personal Care & Service | 101 (19.5%) | 418 (80.5%) |
| Total (Category) | 2,016 (37.4%) | 3,376 (62.6%) |
| Total (Overall) | 14,084 (52.7%) | 12,624 (47.3%) |
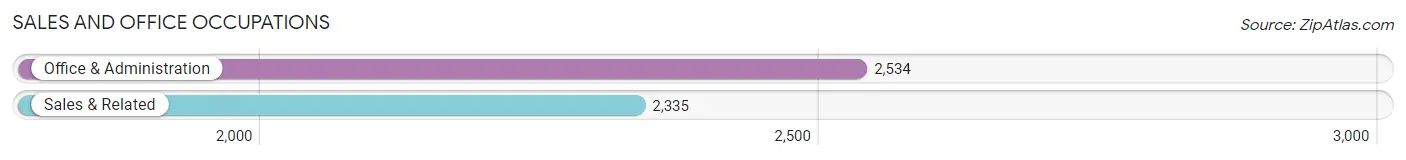
Sales and Office Occupations
The most common Sales and Office occupations in Rutherford County are Office & Administration (2,534 | 9.5%), and Sales & Related (2,335 | 8.7%).
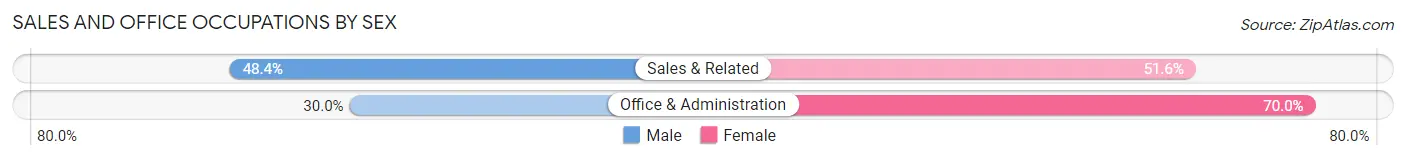
Sales and Office Occupations by Sex
| Occupation | Male | Female |
| Sales & Related | 1,131 (48.4%) | 1,204 (51.6%) |
| Office & Administration | 761 (30.0%) | 1,773 (70.0%) |
| Total (Category) | 1,892 (38.9%) | 2,977 (61.1%) |
| Total (Overall) | 14,084 (52.7%) | 12,624 (47.3%) |
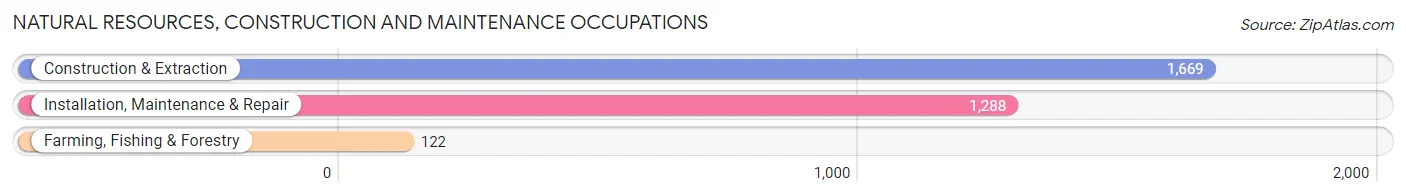
Natural Resources, Construction and Maintenance Occupations
The most common Natural Resources, Construction and Maintenance occupations in Rutherford County are Construction & Extraction (1,669 | 6.2%), Installation, Maintenance & Repair (1,288 | 4.8%), and Farming, Fishing & Forestry (122 | 0.5%).
Natural Resources, Construction and Maintenance Occupations by Sex
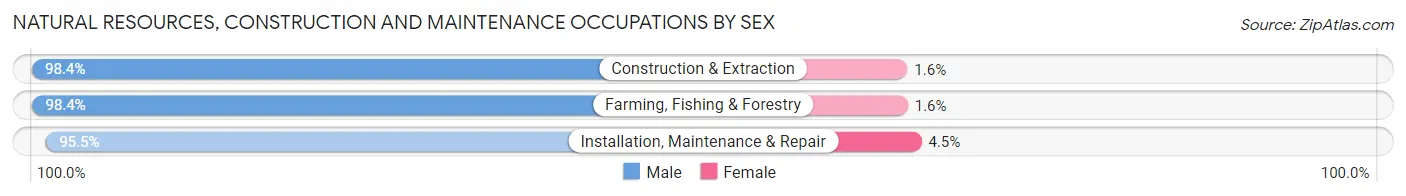
| Occupation | Male | Female |
| Farming, Fishing & Forestry | 120 (98.4%) | 2 (1.6%) |
| Construction & Extraction | 1,643 (98.4%) | 26 (1.6%) |
| Installation, Maintenance & Repair | 1,230 (95.5%) | 58 (4.5%) |
| Total (Category) | 2,993 (97.2%) | 86 (2.8%) |
| Total (Overall) | 14,084 (52.7%) | 12,624 (47.3%) |
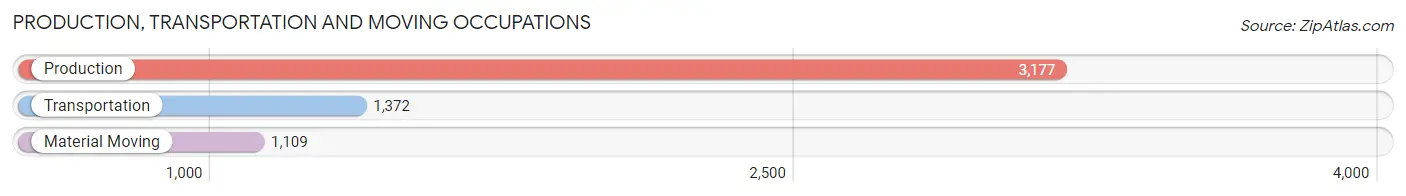
Production, Transportation and Moving Occupations
The most common Production, Transportation and Moving occupations in Rutherford County are Production (3,177 | 11.9%), Transportation (1,372 | 5.1%), and Material Moving (1,109 | 4.2%).
Production, Transportation and Moving Occupations by Sex
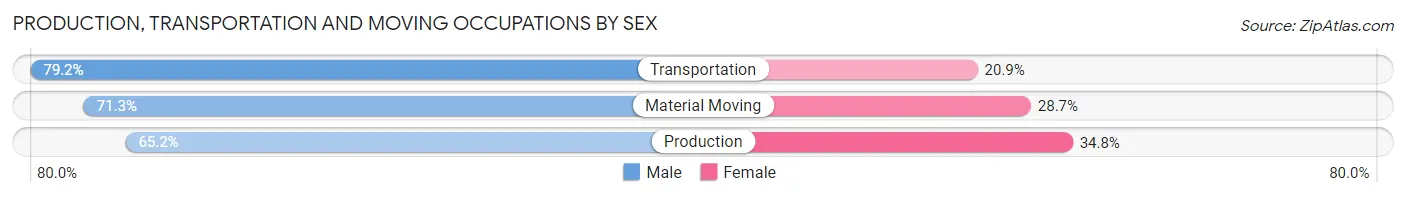
| Occupation | Male | Female |
| Production | 2,071 (65.2%) | 1,106 (34.8%) |
| Transportation | 1,086 (79.1%) | 286 (20.8%) |
| Material Moving | 791 (71.3%) | 318 (28.7%) |
| Total (Category) | 3,948 (69.8%) | 1,710 (30.2%) |
| Total (Overall) | 14,084 (52.7%) | 12,624 (47.3%) |
Employment Industries by Sex in Rutherford County
Employment Industries in Rutherford County
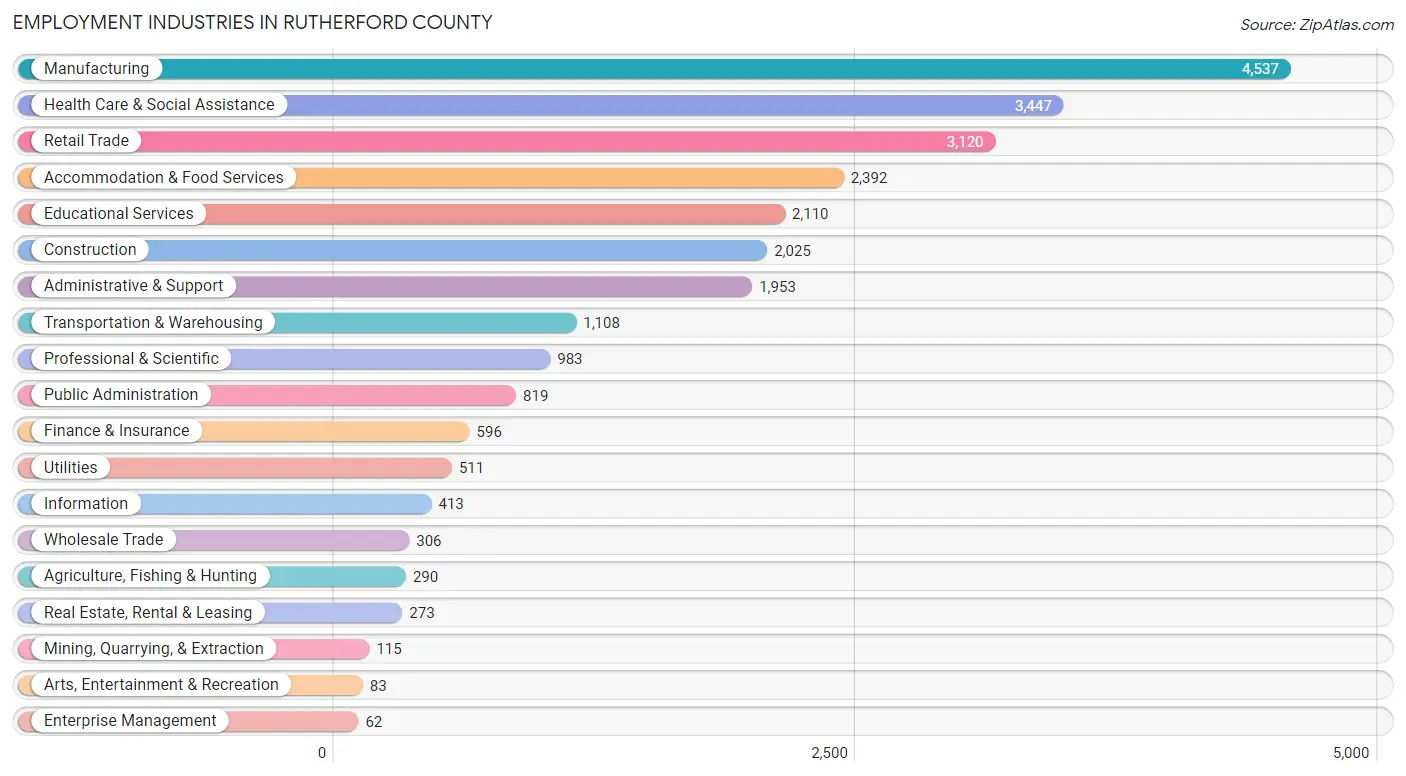
The major employment industries in Rutherford County include Manufacturing (4,537 | 17.0%), Health Care & Social Assistance (3,447 | 12.9%), Retail Trade (3,120 | 11.7%), Accommodation & Food Services (2,392 | 9.0%), and Educational Services (2,110 | 7.9%).
Employment Industries by Sex in Rutherford County
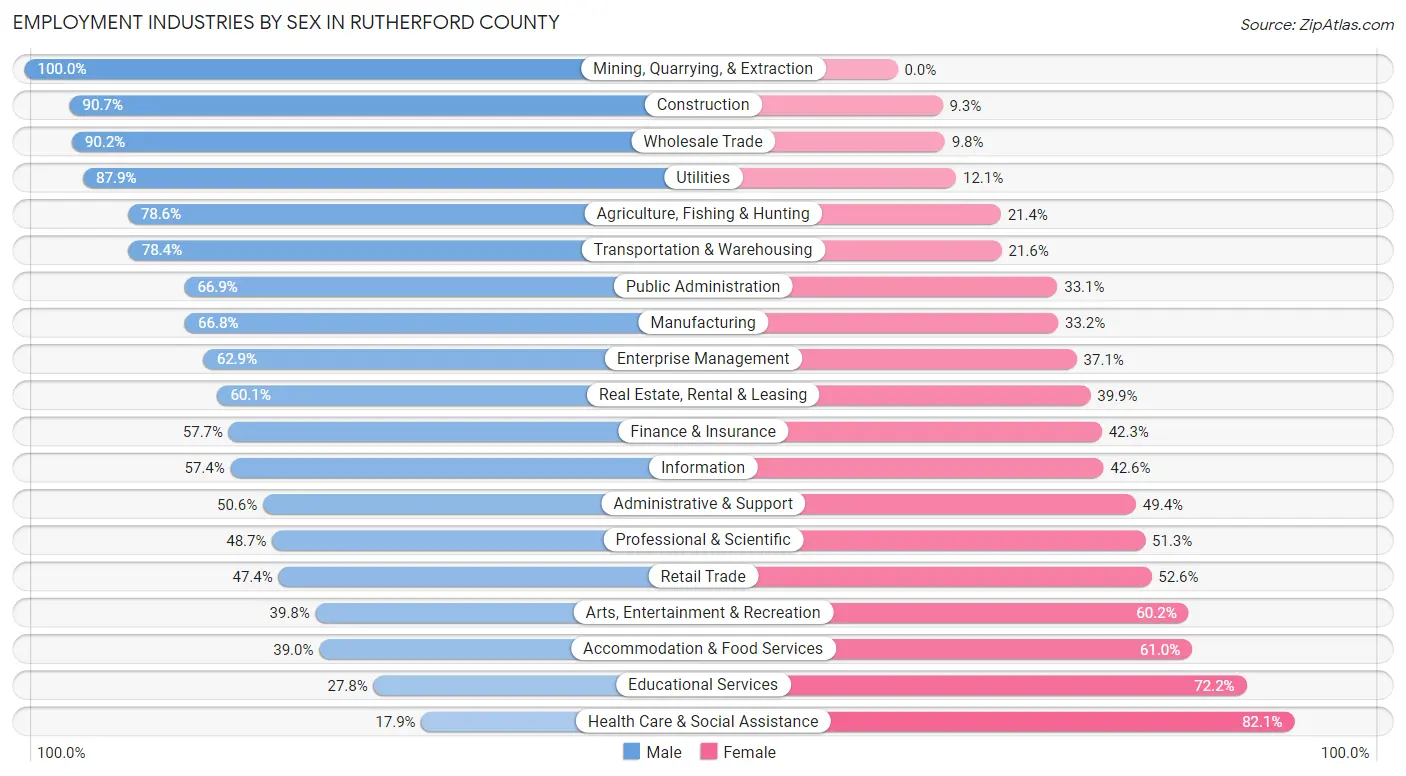
The Rutherford County industries that see more men than women are Mining, Quarrying, & Extraction (100.0%), Construction (90.7%), and Wholesale Trade (90.2%), whereas the industries that tend to have a higher number of women are Health Care & Social Assistance (82.1%), Educational Services (72.2%), and Accommodation & Food Services (61.0%).
| Industry | Male | Female |
| Agriculture, Fishing & Hunting | 228 (78.6%) | 62 (21.4%) |
| Mining, Quarrying, & Extraction | 115 (100.0%) | 0 (0.0%) |
| Construction | 1,836 (90.7%) | 189 (9.3%) |
| Manufacturing | 3,029 (66.8%) | 1,508 (33.2%) |
| Wholesale Trade | 276 (90.2%) | 30 (9.8%) |
| Retail Trade | 1,480 (47.4%) | 1,640 (52.6%) |
| Transportation & Warehousing | 869 (78.4%) | 239 (21.6%) |
| Utilities | 449 (87.9%) | 62 (12.1%) |
| Information | 237 (57.4%) | 176 (42.6%) |
| Finance & Insurance | 344 (57.7%) | 252 (42.3%) |
| Real Estate, Rental & Leasing | 164 (60.1%) | 109 (39.9%) |
| Professional & Scientific | 479 (48.7%) | 504 (51.3%) |
| Enterprise Management | 39 (62.9%) | 23 (37.1%) |
| Administrative & Support | 989 (50.6%) | 964 (49.4%) |
| Educational Services | 586 (27.8%) | 1,524 (72.2%) |
| Health Care & Social Assistance | 616 (17.9%) | 2,831 (82.1%) |
| Arts, Entertainment & Recreation | 33 (39.8%) | 50 (60.2%) |
| Accommodation & Food Services | 933 (39.0%) | 1,459 (61.0%) |
| Public Administration | 548 (66.9%) | 271 (33.1%) |
| Total | 14,084 (52.7%) | 12,624 (47.3%) |
Education in Rutherford County
School Enrollment in Rutherford County
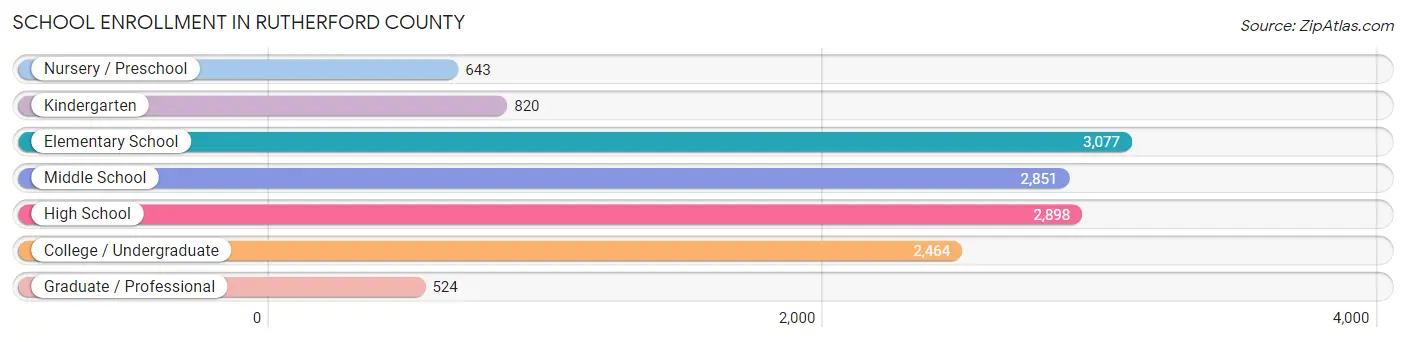
The most common levels of schooling among the 13,277 students in Rutherford County are elementary school (3,077 | 23.2%), high school (2,898 | 21.8%), and middle school (2,851 | 21.5%).
| School Level | # Students | % Students |
| Nursery / Preschool | 643 | 4.8% |
| Kindergarten | 820 | 6.2% |
| Elementary School | 3,077 | 23.2% |
| Middle School | 2,851 | 21.5% |
| High School | 2,898 | 21.8% |
| College / Undergraduate | 2,464 | 18.6% |
| Graduate / Professional | 524 | 4.0% |
| Total | 13,277 | 100.0% |
School Enrollment by Age by Funding Source in Rutherford County
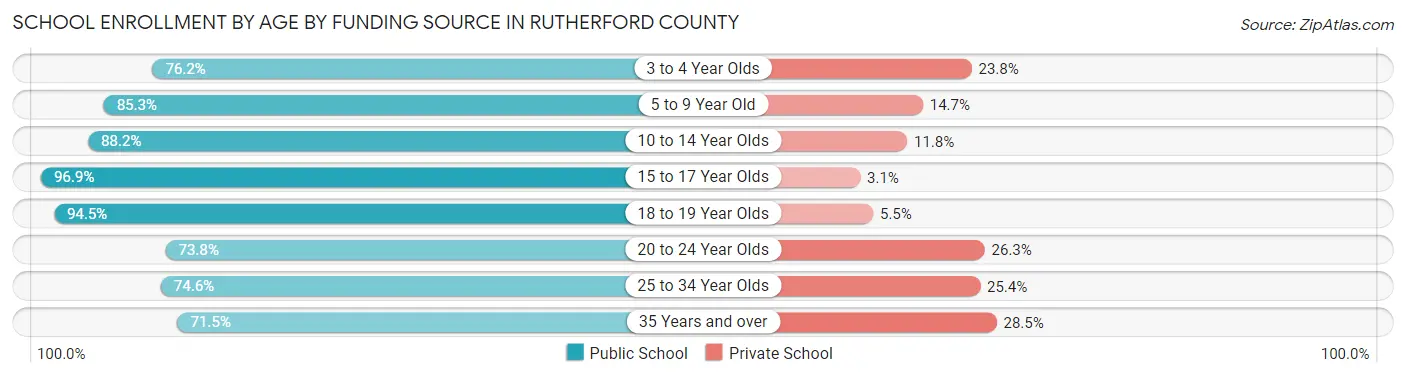
Out of a total of 13,277 students who are enrolled in schools in Rutherford County, 1,885 (14.2%) attend a private institution, while the remaining 11,392 (85.8%) are enrolled in public schools. The age group of 35 years and over has the highest likelihood of being enrolled in private schools, with 268 (28.5% in the age bracket) enrolled. Conversely, the age group of 15 to 17 year olds has the lowest likelihood of being enrolled in a private school, with 2,280 (96.9% in the age bracket) attending a public institution.
| Age Bracket | Public School | Private School |
| 3 to 4 Year Olds | 291 (76.2%) | 91 (23.8%) |
| 5 to 9 Year Old | 3,025 (85.3%) | 523 (14.7%) |
| 10 to 14 Year Olds | 3,128 (88.2%) | 419 (11.8%) |
| 15 to 17 Year Olds | 2,280 (96.9%) | 72 (3.1%) |
| 18 to 19 Year Olds | 640 (94.5%) | 37 (5.5%) |
| 20 to 24 Year Olds | 708 (73.8%) | 252 (26.3%) |
| 25 to 34 Year Olds | 649 (74.6%) | 221 (25.4%) |
| 35 Years and over | 673 (71.5%) | 268 (28.5%) |
| Total | 11,392 (85.8%) | 1,885 (14.2%) |
Educational Attainment by Field of Study in Rutherford County
Business (1,881 | 19.0%), education (1,871 | 18.9%), science & technology (1,012 | 10.2%), arts & humanities (813 | 8.2%), and social sciences (651 | 6.6%) are the most common fields of study among 9,899 individuals in Rutherford County who have obtained a bachelor's degree or higher.
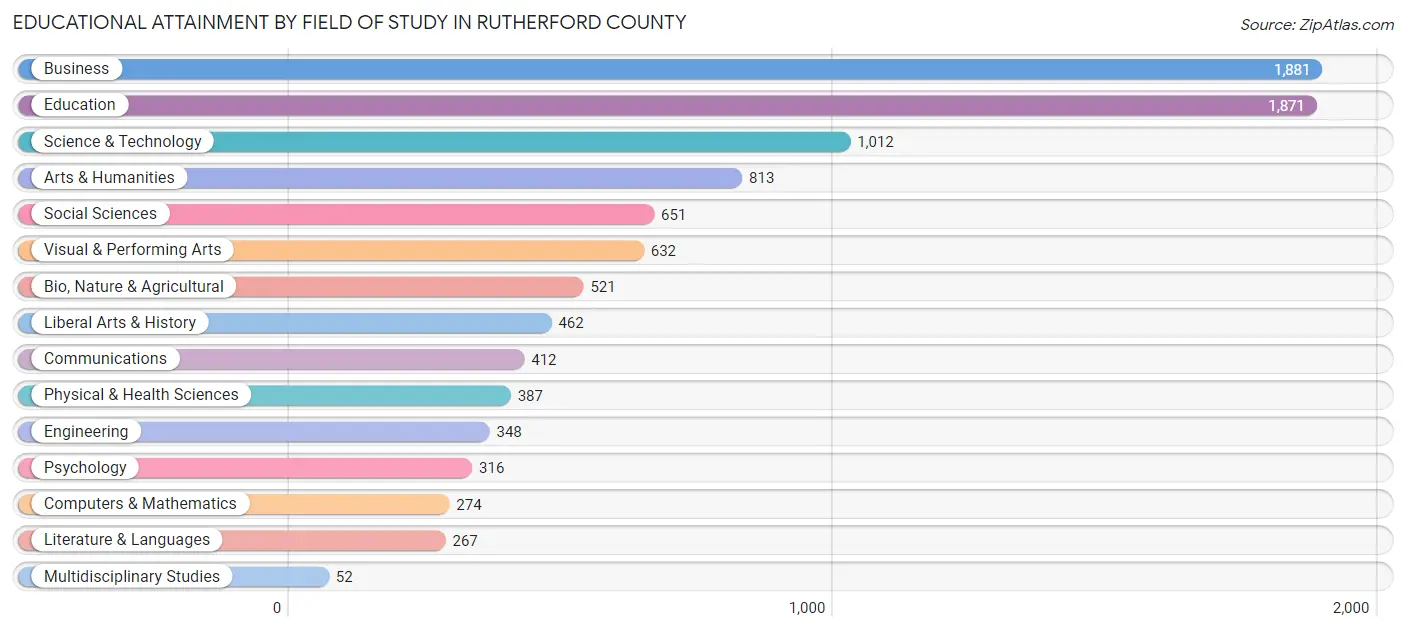
| Field of Study | # Graduates | % Graduates |
| Computers & Mathematics | 274 | 2.8% |
| Bio, Nature & Agricultural | 521 | 5.3% |
| Physical & Health Sciences | 387 | 3.9% |
| Psychology | 316 | 3.2% |
| Social Sciences | 651 | 6.6% |
| Engineering | 348 | 3.5% |
| Multidisciplinary Studies | 52 | 0.5% |
| Science & Technology | 1,012 | 10.2% |
| Business | 1,881 | 19.0% |
| Education | 1,871 | 18.9% |
| Literature & Languages | 267 | 2.7% |
| Liberal Arts & History | 462 | 4.7% |
| Visual & Performing Arts | 632 | 6.4% |
| Communications | 412 | 4.2% |
| Arts & Humanities | 813 | 8.2% |
| Total | 9,899 | 100.0% |
Transportation & Commute in Rutherford County
Vehicle Availability by Sex in Rutherford County
The most prevalent vehicle ownership categories in Rutherford County are males with 2 vehicles (5,046, accounting for 36.3%) and females with 2 vehicles (4,421, making up 41.8%).
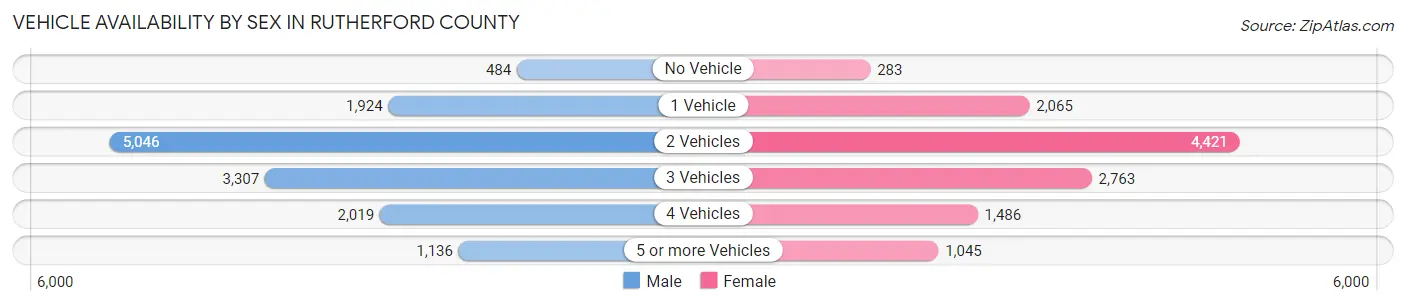
| Vehicles Available | Male | Female |
| No Vehicle | 484 (3.5%) | 283 (2.4%) |
| 1 Vehicle | 1,924 (13.8%) | 2,065 (17.1%) |
| 2 Vehicles | 5,046 (36.3%) | 4,421 (36.6%) |
| 3 Vehicles | 3,307 (23.8%) | 2,763 (22.9%) |
| 4 Vehicles | 2,019 (14.5%) | 1,486 (12.3%) |
| 5 or more Vehicles | 1,136 (8.2%) | 1,045 (8.7%) |
| Total | 13,916 (100.0%) | 12,063 (100.0%) |
Commute Time in Rutherford County
The most frequently occuring commute durations in Rutherford County are 15 to 19 minutes (4,626 commuters, 18.8%), 10 to 14 minutes (3,378 commuters, 13.8%), and 20 to 24 minutes (3,329 commuters, 13.6%).
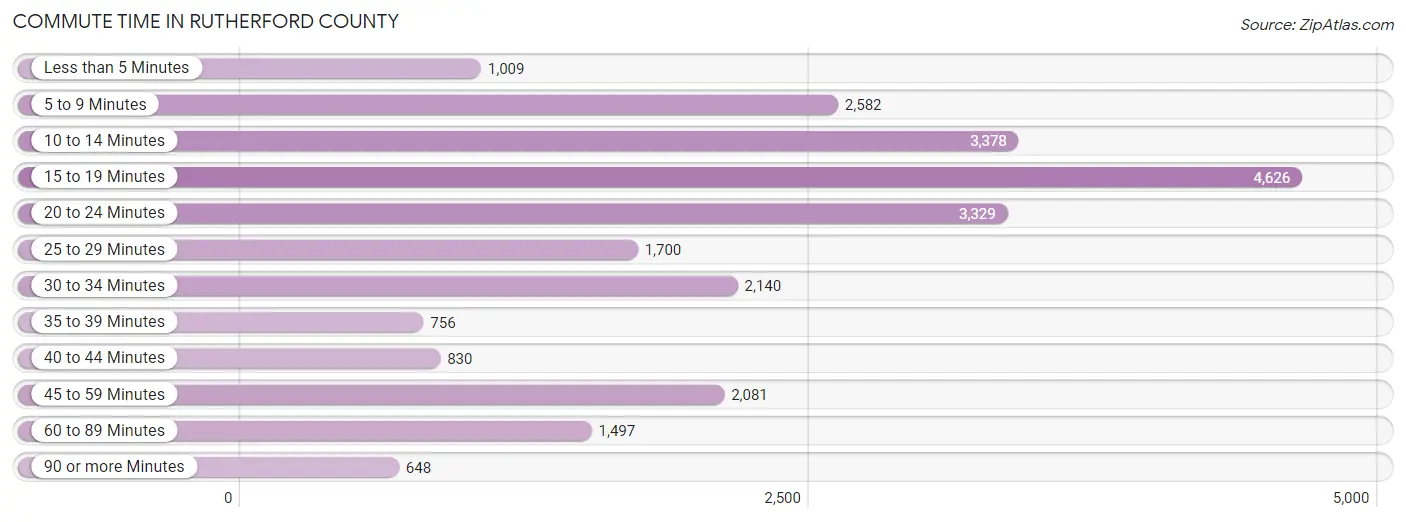
| Commute Time | # Commuters | % Commuters |
| Less than 5 Minutes | 1,009 | 4.1% |
| 5 to 9 Minutes | 2,582 | 10.5% |
| 10 to 14 Minutes | 3,378 | 13.8% |
| 15 to 19 Minutes | 4,626 | 18.8% |
| 20 to 24 Minutes | 3,329 | 13.6% |
| 25 to 29 Minutes | 1,700 | 6.9% |
| 30 to 34 Minutes | 2,140 | 8.7% |
| 35 to 39 Minutes | 756 | 3.1% |
| 40 to 44 Minutes | 830 | 3.4% |
| 45 to 59 Minutes | 2,081 | 8.5% |
| 60 to 89 Minutes | 1,497 | 6.1% |
| 90 or more Minutes | 648 | 2.6% |
Commute Time by Sex in Rutherford County
The most common commute times in Rutherford County are 15 to 19 minutes (2,128 commuters, 16.1%) for males and 15 to 19 minutes (2,498 commuters, 22.0%) for females.
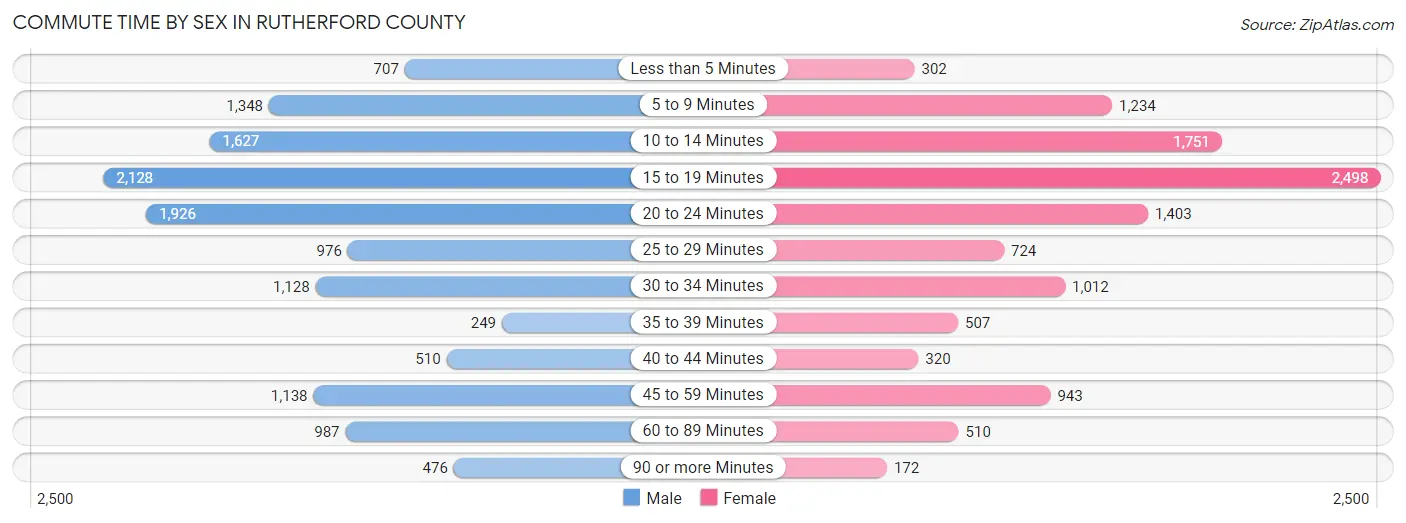
| Commute Time | Male | Female |
| Less than 5 Minutes | 707 (5.4%) | 302 (2.6%) |
| 5 to 9 Minutes | 1,348 (10.2%) | 1,234 (10.8%) |
| 10 to 14 Minutes | 1,627 (12.3%) | 1,751 (15.4%) |
| 15 to 19 Minutes | 2,128 (16.1%) | 2,498 (22.0%) |
| 20 to 24 Minutes | 1,926 (14.6%) | 1,403 (12.3%) |
| 25 to 29 Minutes | 976 (7.4%) | 724 (6.4%) |
| 30 to 34 Minutes | 1,128 (8.6%) | 1,012 (8.9%) |
| 35 to 39 Minutes | 249 (1.9%) | 507 (4.5%) |
| 40 to 44 Minutes | 510 (3.9%) | 320 (2.8%) |
| 45 to 59 Minutes | 1,138 (8.6%) | 943 (8.3%) |
| 60 to 89 Minutes | 987 (7.5%) | 510 (4.5%) |
| 90 or more Minutes | 476 (3.6%) | 172 (1.5%) |
Time of Departure to Work by Sex in Rutherford County
The most frequent times of departure to work in Rutherford County are 7:00 AM to 7:29 AM (2,101, 15.9%) for males and 7:00 AM to 7:29 AM (1,736, 15.3%) for females.
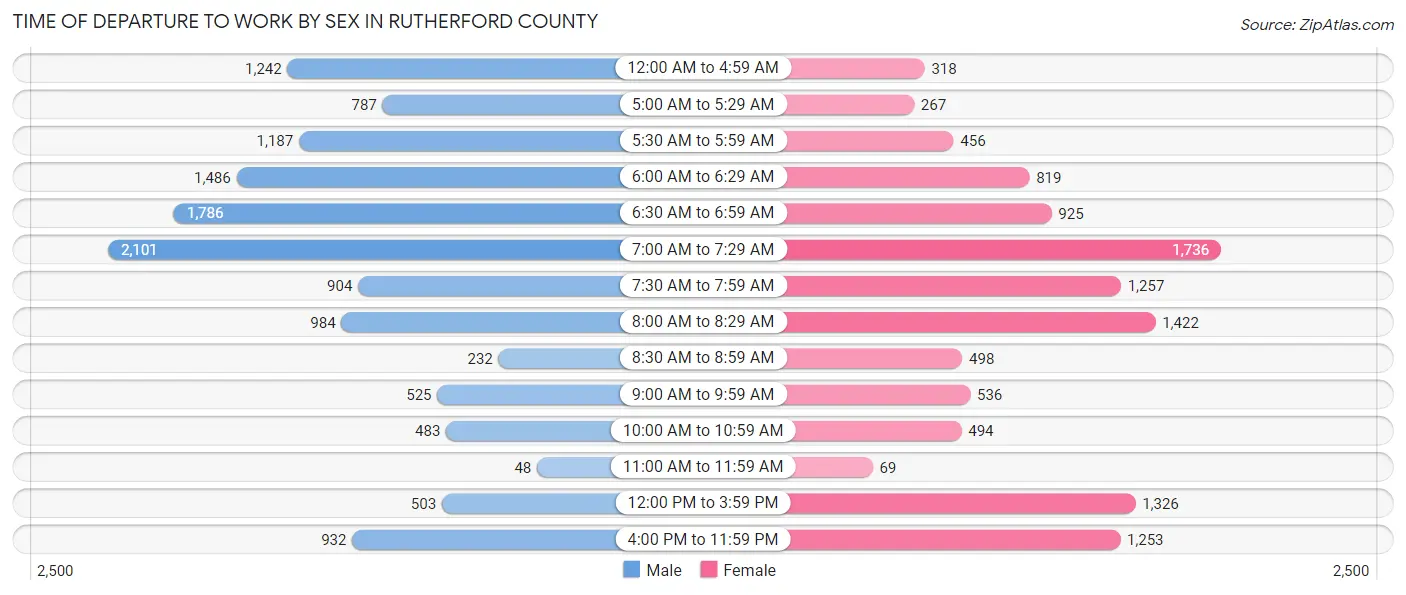
| Time of Departure | Male | Female |
| 12:00 AM to 4:59 AM | 1,242 (9.4%) | 318 (2.8%) |
| 5:00 AM to 5:29 AM | 787 (6.0%) | 267 (2.4%) |
| 5:30 AM to 5:59 AM | 1,187 (9.0%) | 456 (4.0%) |
| 6:00 AM to 6:29 AM | 1,486 (11.3%) | 819 (7.2%) |
| 6:30 AM to 6:59 AM | 1,786 (13.5%) | 925 (8.1%) |
| 7:00 AM to 7:29 AM | 2,101 (15.9%) | 1,736 (15.3%) |
| 7:30 AM to 7:59 AM | 904 (6.9%) | 1,257 (11.1%) |
| 8:00 AM to 8:29 AM | 984 (7.4%) | 1,422 (12.5%) |
| 8:30 AM to 8:59 AM | 232 (1.8%) | 498 (4.4%) |
| 9:00 AM to 9:59 AM | 525 (4.0%) | 536 (4.7%) |
| 10:00 AM to 10:59 AM | 483 (3.7%) | 494 (4.3%) |
| 11:00 AM to 11:59 AM | 48 (0.4%) | 69 (0.6%) |
| 12:00 PM to 3:59 PM | 503 (3.8%) | 1,326 (11.7%) |
| 4:00 PM to 11:59 PM | 932 (7.1%) | 1,253 (11.0%) |
| Total | 13,200 (100.0%) | 11,376 (100.0%) |
Housing Occupancy in Rutherford County
Occupancy by Ownership in Rutherford County
Of the total 26,273 dwellings in Rutherford County, owner-occupied units account for 19,271 (73.4%), while renter-occupied units make up 7,002 (26.7%).
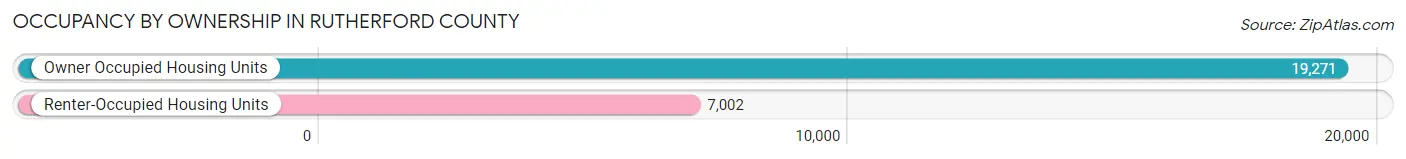
| Occupancy | # Housing Units | % Housing Units |
| Owner Occupied Housing Units | 19,271 | 73.4% |
| Renter-Occupied Housing Units | 7,002 | 26.7% |
| Total Occupied Housing Units | 26,273 | 100.0% |
Occupancy by Household Size in Rutherford County
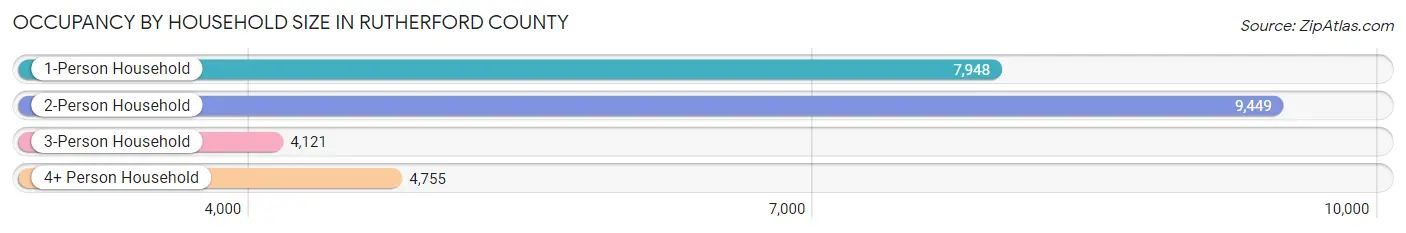
| Household Size | # Housing Units | % Housing Units |
| 1-Person Household | 7,948 | 30.2% |
| 2-Person Household | 9,449 | 36.0% |
| 3-Person Household | 4,121 | 15.7% |
| 4+ Person Household | 4,755 | 18.1% |
| Total Housing Units | 26,273 | 100.0% |
Occupancy by Ownership by Household Size in Rutherford County
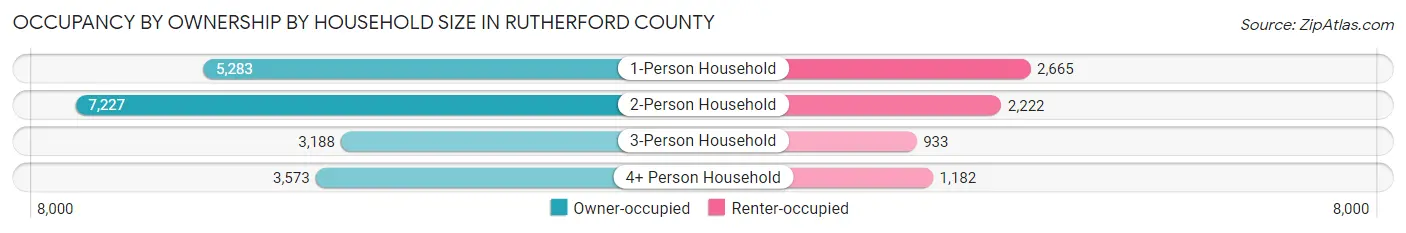
| Household Size | Owner-occupied | Renter-occupied |
| 1-Person Household | 5,283 (66.5%) | 2,665 (33.5%) |
| 2-Person Household | 7,227 (76.5%) | 2,222 (23.5%) |
| 3-Person Household | 3,188 (77.4%) | 933 (22.6%) |
| 4+ Person Household | 3,573 (75.1%) | 1,182 (24.9%) |
| Total Housing Units | 19,271 (73.4%) | 7,002 (26.7%) |
Occupancy by Educational Attainment in Rutherford County
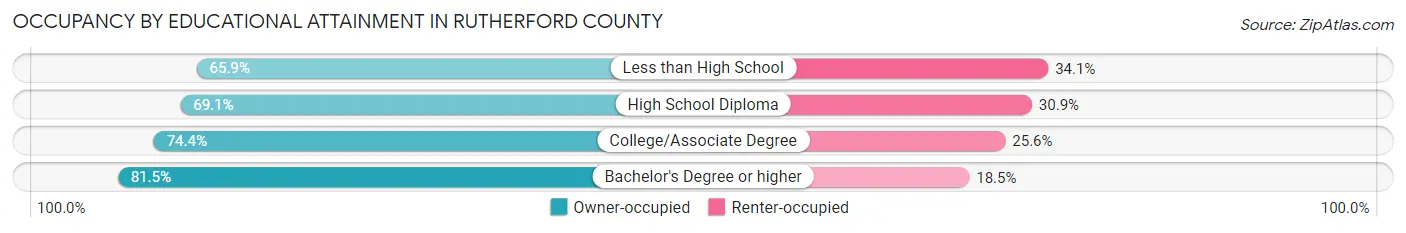
| Household Size | Owner-occupied | Renter-occupied |
| Less than High School | 2,096 (65.9%) | 1,085 (34.1%) |
| High School Diploma | 5,100 (69.1%) | 2,278 (30.9%) |
| College/Associate Degree | 7,673 (74.4%) | 2,642 (25.6%) |
| Bachelor's Degree or higher | 4,402 (81.5%) | 997 (18.5%) |
Occupancy by Age of Householder in Rutherford County
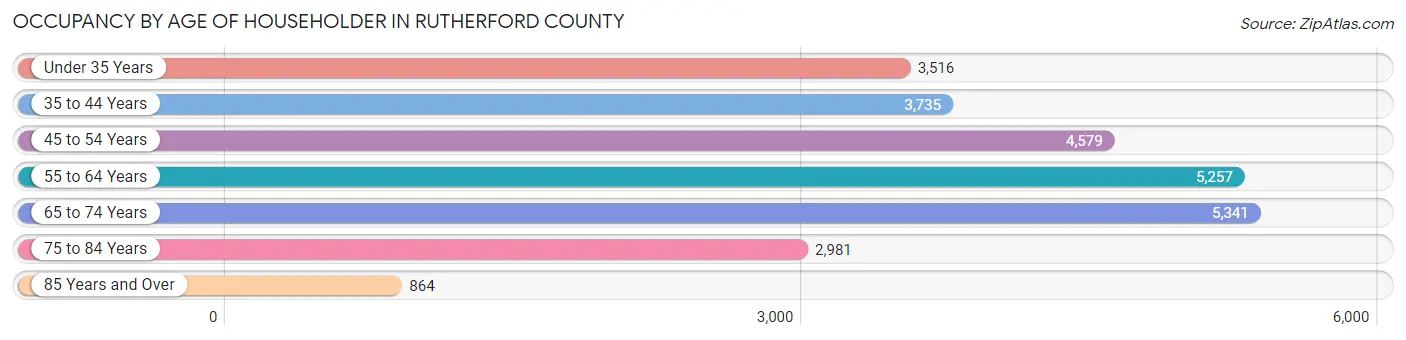
| Age Bracket | # Households | % Households |
| Under 35 Years | 3,516 | 13.4% |
| 35 to 44 Years | 3,735 | 14.2% |
| 45 to 54 Years | 4,579 | 17.4% |
| 55 to 64 Years | 5,257 | 20.0% |
| 65 to 74 Years | 5,341 | 20.3% |
| 75 to 84 Years | 2,981 | 11.4% |
| 85 Years and Over | 864 | 3.3% |
| Total | 26,273 | 100.0% |
Housing Finances in Rutherford County
Median Income by Occupancy in Rutherford County
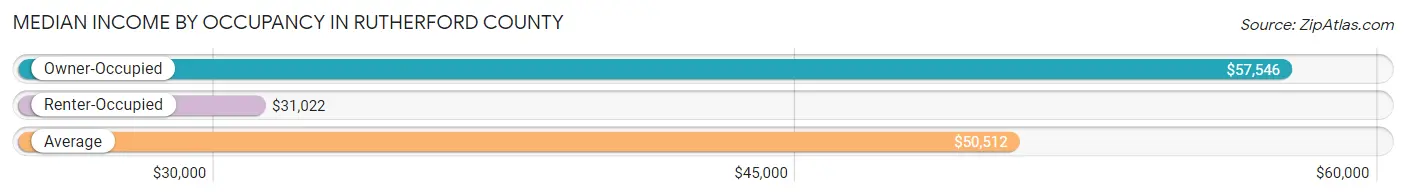
| Occupancy Type | # Households | Median Income |
| Owner-Occupied | 19,271 (73.4%) | $57,546 |
| Renter-Occupied | 7,002 (26.7%) | $31,022 |
| Average | 26,273 (100.0%) | $50,512 |
Occupancy by Householder Income Bracket in Rutherford County
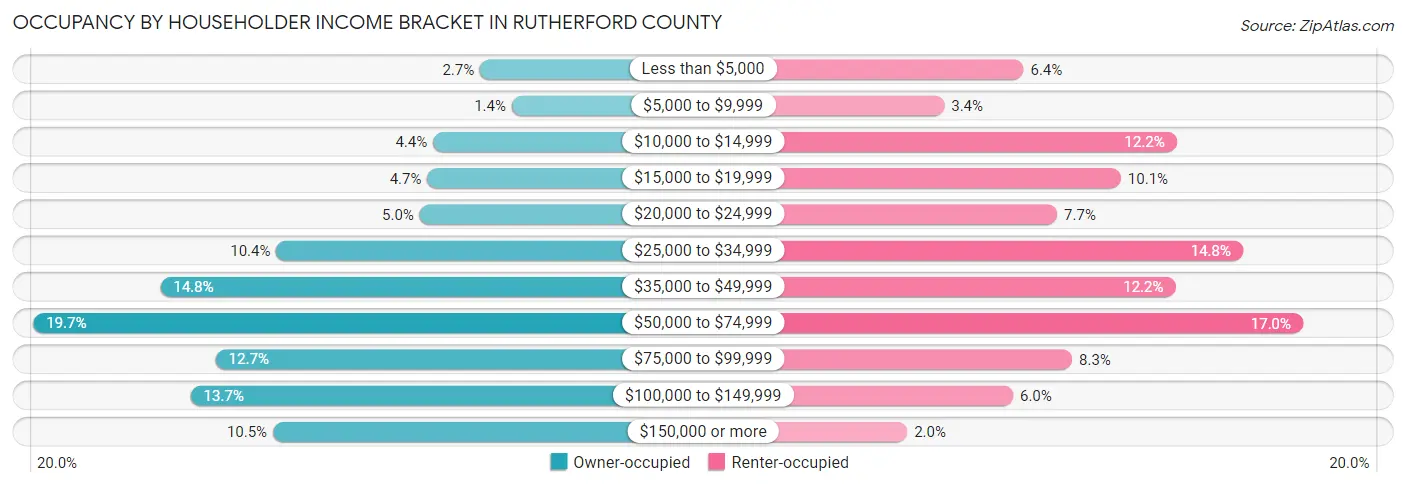
| Income Bracket | Owner-occupied | Renter-occupied |
| Less than $5,000 | 510 (2.6%) | 448 (6.4%) |
| $5,000 to $9,999 | 278 (1.4%) | 237 (3.4%) |
| $10,000 to $14,999 | 856 (4.4%) | 856 (12.2%) |
| $15,000 to $19,999 | 898 (4.7%) | 708 (10.1%) |
| $20,000 to $24,999 | 954 (5.0%) | 538 (7.7%) |
| $25,000 to $34,999 | 2,007 (10.4%) | 1,033 (14.7%) |
| $35,000 to $49,999 | 2,857 (14.8%) | 853 (12.2%) |
| $50,000 to $74,999 | 3,790 (19.7%) | 1,193 (17.0%) |
| $75,000 to $99,999 | 2,452 (12.7%) | 578 (8.3%) |
| $100,000 to $149,999 | 2,637 (13.7%) | 420 (6.0%) |
| $150,000 or more | 2,032 (10.5%) | 138 (2.0%) |
| Total | 19,271 (100.0%) | 7,002 (100.0%) |
Monthly Housing Cost Tiers in Rutherford County
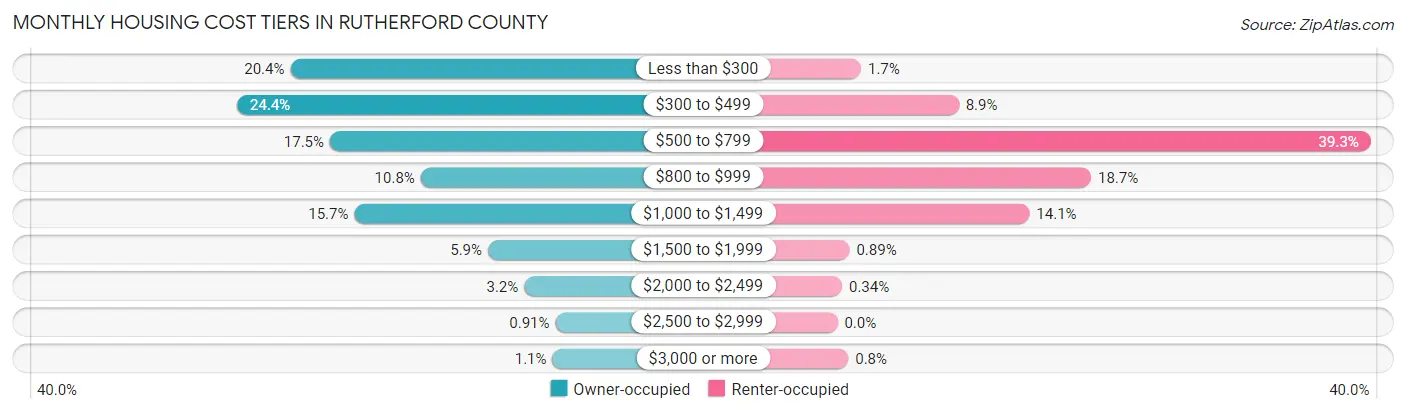
| Monthly Cost | Owner-occupied | Renter-occupied |
| Less than $300 | 3,938 (20.4%) | 122 (1.7%) |
| $300 to $499 | 4,694 (24.4%) | 625 (8.9%) |
| $500 to $799 | 3,377 (17.5%) | 2,750 (39.3%) |
| $800 to $999 | 2,087 (10.8%) | 1,308 (18.7%) |
| $1,000 to $1,499 | 3,030 (15.7%) | 990 (14.1%) |
| $1,500 to $1,999 | 1,133 (5.9%) | 62 (0.9%) |
| $2,000 to $2,499 | 619 (3.2%) | 24 (0.3%) |
| $2,500 to $2,999 | 176 (0.9%) | 0 (0.0%) |
| $3,000 or more | 217 (1.1%) | 56 (0.8%) |
| Total | 19,271 (100.0%) | 7,002 (100.0%) |
Physical Housing Characteristics in Rutherford County
Housing Structures in Rutherford County
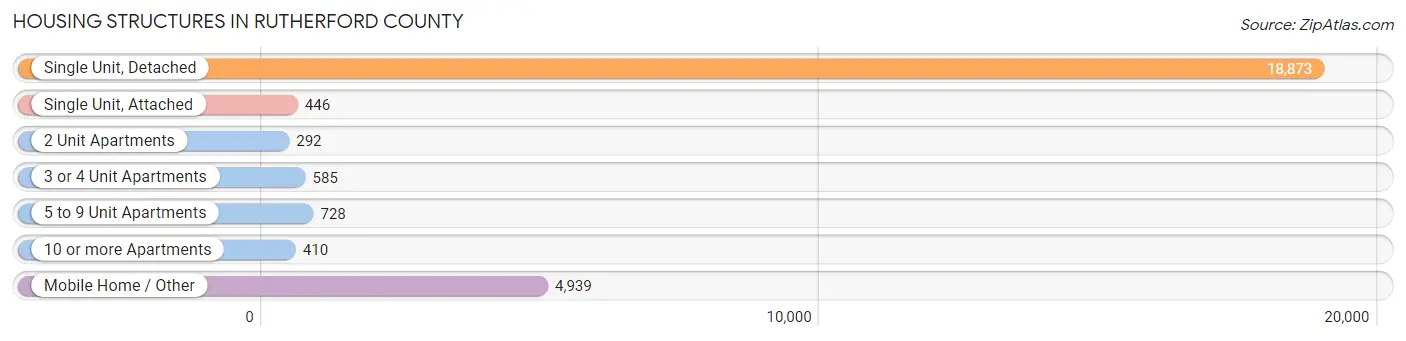
| Structure Type | # Housing Units | % Housing Units |
| Single Unit, Detached | 18,873 | 71.8% |
| Single Unit, Attached | 446 | 1.7% |
| 2 Unit Apartments | 292 | 1.1% |
| 3 or 4 Unit Apartments | 585 | 2.2% |
| 5 to 9 Unit Apartments | 728 | 2.8% |
| 10 or more Apartments | 410 | 1.6% |
| Mobile Home / Other | 4,939 | 18.8% |
| Total | 26,273 | 100.0% |
Housing Structures by Occupancy in Rutherford County
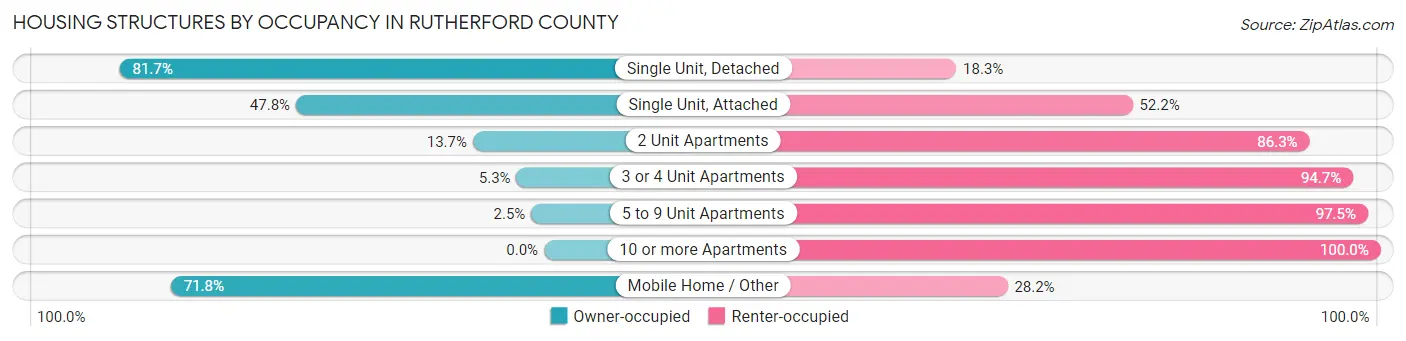
| Structure Type | Owner-occupied | Renter-occupied |
| Single Unit, Detached | 15,421 (81.7%) | 3,452 (18.3%) |
| Single Unit, Attached | 213 (47.8%) | 233 (52.2%) |
| 2 Unit Apartments | 40 (13.7%) | 252 (86.3%) |
| 3 or 4 Unit Apartments | 31 (5.3%) | 554 (94.7%) |
| 5 to 9 Unit Apartments | 18 (2.5%) | 710 (97.5%) |
| 10 or more Apartments | 0 (0.0%) | 410 (100.0%) |
| Mobile Home / Other | 3,548 (71.8%) | 1,391 (28.2%) |
| Total | 19,271 (73.4%) | 7,002 (26.7%) |
Housing Structures by Number of Rooms in Rutherford County
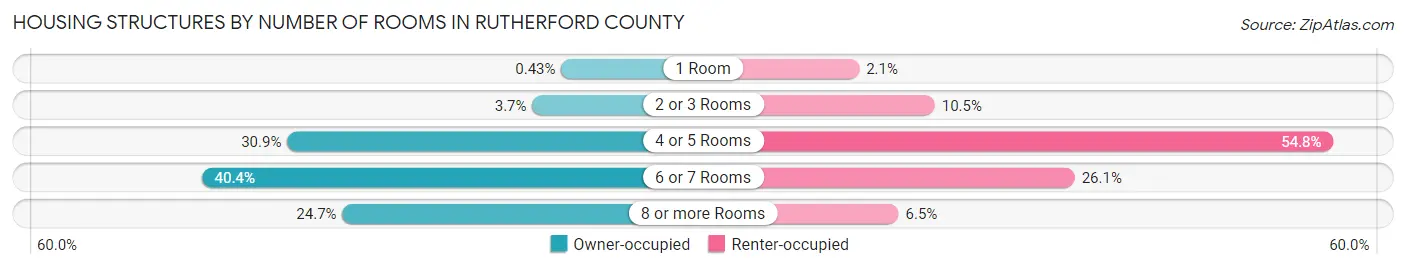
| Number of Rooms | Owner-occupied | Renter-occupied |
| 1 Room | 82 (0.4%) | 150 (2.1%) |
| 2 or 3 Rooms | 703 (3.6%) | 737 (10.5%) |
| 4 or 5 Rooms | 5,946 (30.8%) | 3,834 (54.8%) |
| 6 or 7 Rooms | 7,775 (40.4%) | 1,825 (26.1%) |
| 8 or more Rooms | 4,765 (24.7%) | 456 (6.5%) |
| Total | 19,271 (100.0%) | 7,002 (100.0%) |
Housing Structure by Heating Type in Rutherford County
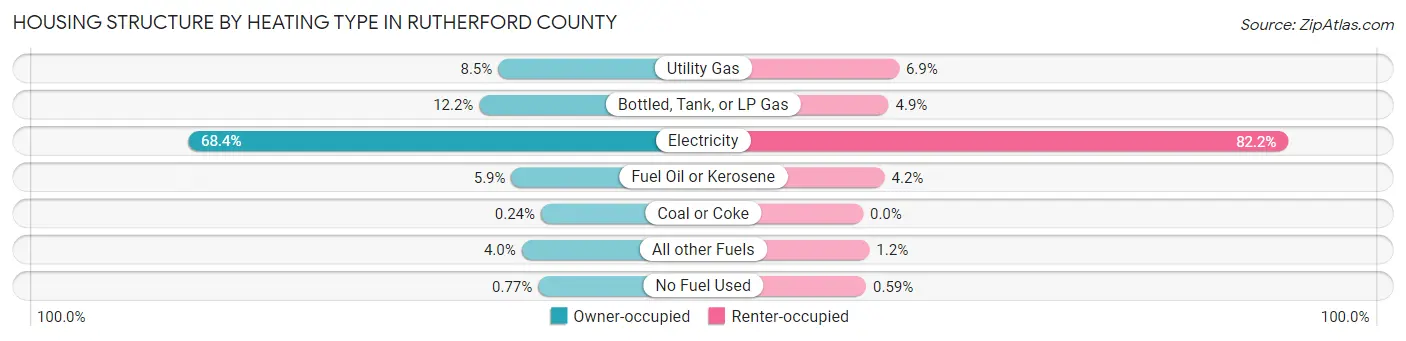
| Heating Type | Owner-occupied | Renter-occupied |
| Utility Gas | 1,638 (8.5%) | 486 (6.9%) |
| Bottled, Tank, or LP Gas | 2,344 (12.2%) | 346 (4.9%) |
| Electricity | 13,183 (68.4%) | 5,752 (82.2%) |
| Fuel Oil or Kerosene | 1,145 (5.9%) | 291 (4.2%) |
| Coal or Coke | 47 (0.2%) | 0 (0.0%) |
| All other Fuels | 766 (4.0%) | 86 (1.2%) |
| No Fuel Used | 148 (0.8%) | 41 (0.6%) |
| Total | 19,271 (100.0%) | 7,002 (100.0%) |
Household Vehicle Usage in Rutherford County
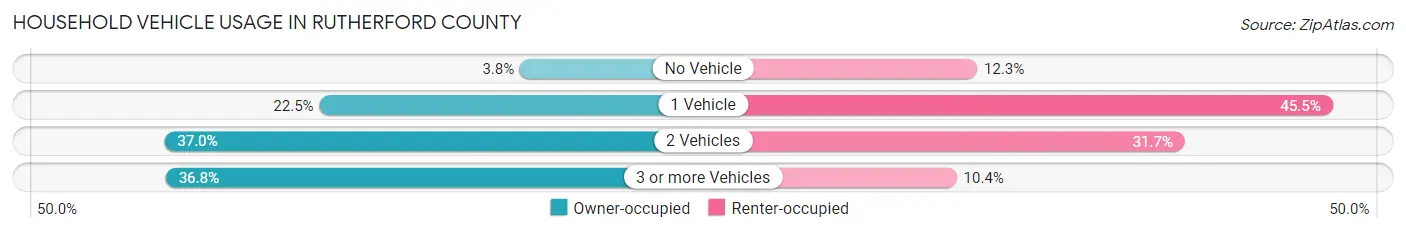
| Vehicles per Household | Owner-occupied | Renter-occupied |
| No Vehicle | 723 (3.7%) | 864 (12.3%) |
| 1 Vehicle | 4,333 (22.5%) | 3,187 (45.5%) |
| 2 Vehicles | 7,120 (36.9%) | 2,221 (31.7%) |
| 3 or more Vehicles | 7,095 (36.8%) | 730 (10.4%) |
| Total | 19,271 (100.0%) | 7,002 (100.0%) |
Real Estate & Mortgages in Rutherford County
Real Estate and Mortgage Overview in Rutherford County
| Characteristic | Without Mortgage | With Mortgage |
| Housing Units | 10,501 | 8,770 |
| Median Property Value | $137,400 | $176,600 |
| Median Household Income | $44,797 | $1,386 |
| Monthly Housing Costs | $342 | $214 |
| Real Estate Taxes | $860 | $216 |
Property Value by Mortgage Status in Rutherford County
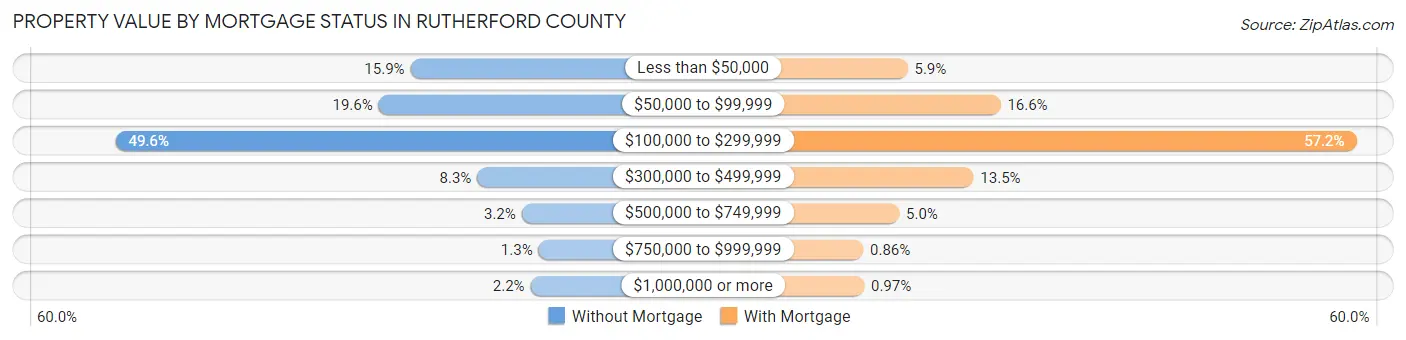
| Property Value | Without Mortgage | With Mortgage |
| Less than $50,000 | 1,671 (15.9%) | 521 (5.9%) |
| $50,000 to $99,999 | 2,053 (19.6%) | 1,452 (16.6%) |
| $100,000 to $299,999 | 5,209 (49.6%) | 5,019 (57.2%) |
| $300,000 to $499,999 | 869 (8.3%) | 1,181 (13.5%) |
| $500,000 to $749,999 | 336 (3.2%) | 437 (5.0%) |
| $750,000 to $999,999 | 133 (1.3%) | 75 (0.9%) |
| $1,000,000 or more | 230 (2.2%) | 85 (1.0%) |
| Total | 10,501 (100.0%) | 8,770 (100.0%) |
Household Income by Mortgage Status in Rutherford County
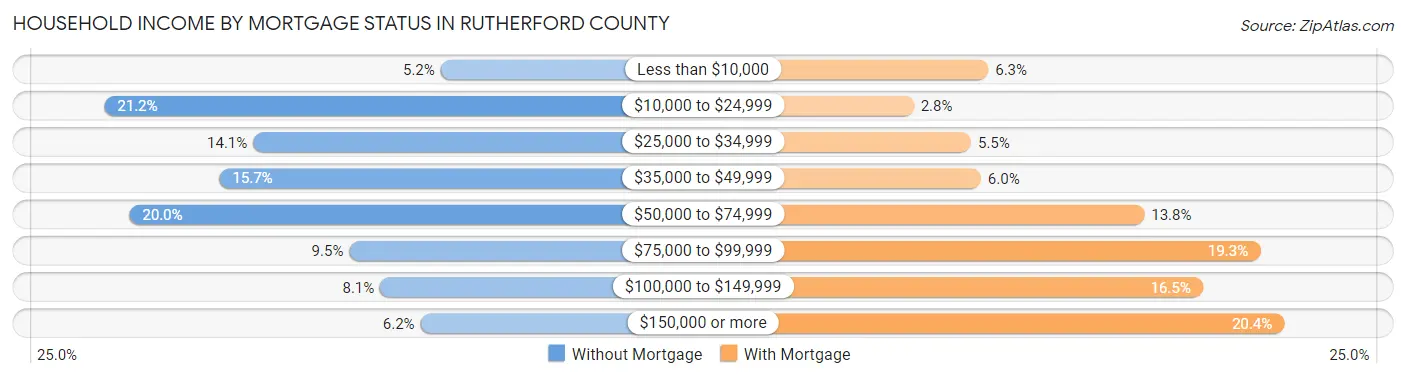
| Household Income | Without Mortgage | With Mortgage |
| Less than $10,000 | 545 (5.2%) | 554 (6.3%) |
| $10,000 to $24,999 | 2,226 (21.2%) | 243 (2.8%) |
| $25,000 to $34,999 | 1,483 (14.1%) | 482 (5.5%) |
| $35,000 to $49,999 | 1,651 (15.7%) | 524 (6.0%) |
| $50,000 to $74,999 | 2,101 (20.0%) | 1,206 (13.8%) |
| $75,000 to $99,999 | 1,002 (9.5%) | 1,689 (19.3%) |
| $100,000 to $149,999 | 847 (8.1%) | 1,450 (16.5%) |
| $150,000 or more | 646 (6.1%) | 1,790 (20.4%) |
| Total | 10,501 (100.0%) | 8,770 (100.0%) |
Property Value to Household Income Ratio in Rutherford County
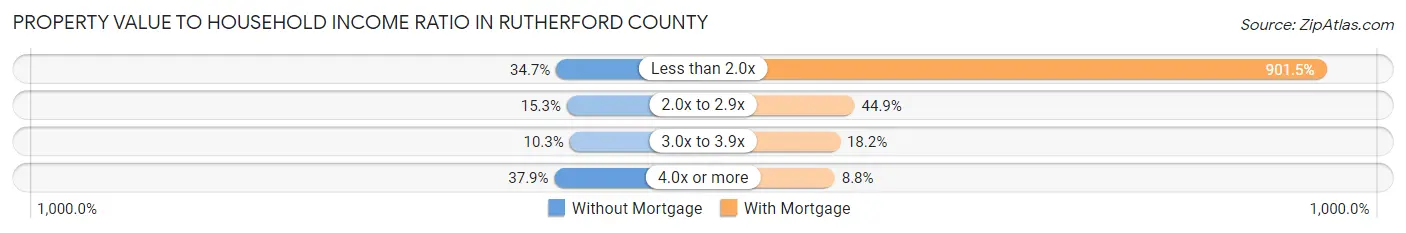
| Value-to-Income Ratio | Without Mortgage | With Mortgage |
| Less than 2.0x | 3,647 (34.7%) | 79,057 (901.4%) |
| 2.0x to 2.9x | 1,604 (15.3%) | 3,935 (44.9%) |
| 3.0x to 3.9x | 1,077 (10.3%) | 1,600 (18.2%) |
| 4.0x or more | 3,984 (37.9%) | 772 (8.8%) |
| Total | 10,501 (100.0%) | 8,770 (100.0%) |
Real Estate Taxes by Mortgage Status in Rutherford County
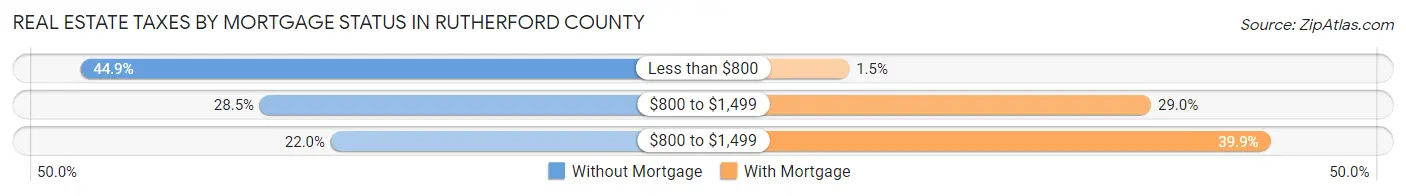
| Property Taxes | Without Mortgage | With Mortgage |
| Less than $800 | 4,716 (44.9%) | 130 (1.5%) |
| $800 to $1,499 | 2,994 (28.5%) | 2,547 (29.0%) |
| $800 to $1,499 | 2,313 (22.0%) | 3,503 (39.9%) |
| Total | 10,501 (100.0%) | 8,770 (100.0%) |
Health & Disability in Rutherford County
Health Insurance Coverage by Age in Rutherford County
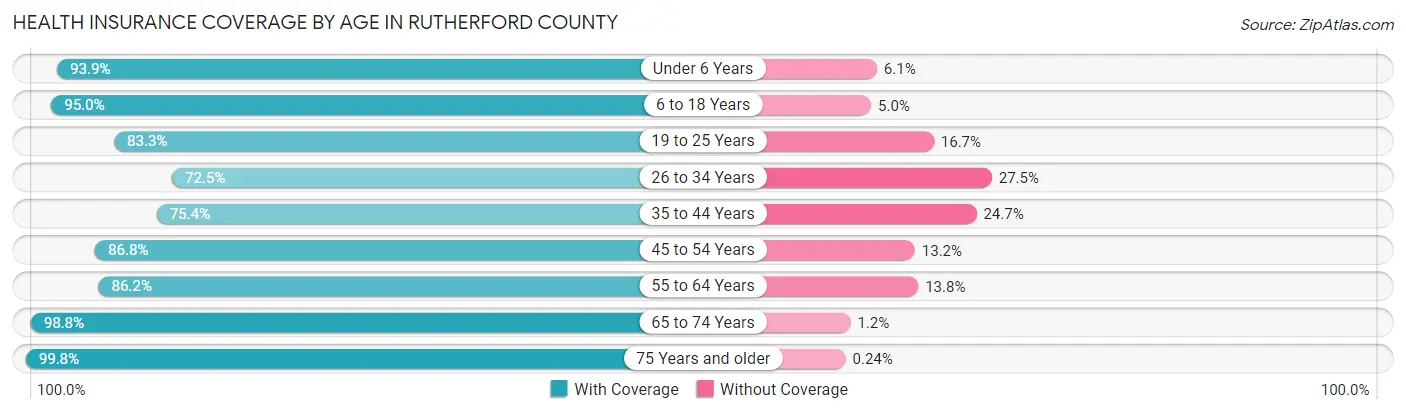
| Age Bracket | With Coverage | Without Coverage |
| Under 6 Years | 3,659 (93.9%) | 237 (6.1%) |
| 6 to 18 Years | 9,468 (95.0%) | 497 (5.0%) |
| 19 to 25 Years | 3,902 (83.3%) | 782 (16.7%) |
| 26 to 34 Years | 4,703 (72.5%) | 1,785 (27.5%) |
| 35 to 44 Years | 5,320 (75.3%) | 1,740 (24.6%) |
| 45 to 54 Years | 7,324 (86.8%) | 1,110 (13.2%) |
| 55 to 64 Years | 8,211 (86.2%) | 1,313 (13.8%) |
| 65 to 74 Years | 8,170 (98.8%) | 96 (1.2%) |
| 75 Years and older | 5,308 (99.8%) | 13 (0.2%) |
| Total | 56,065 (88.1%) | 7,573 (11.9%) |
Health Insurance Coverage by Citizenship Status in Rutherford County
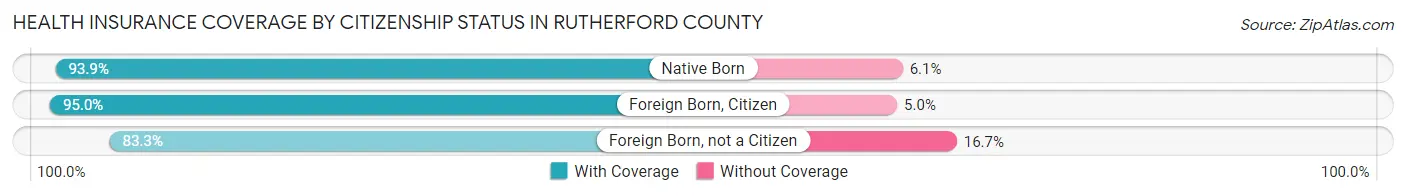
| Citizenship Status | With Coverage | Without Coverage |
| Native Born | 3,659 (93.9%) | 237 (6.1%) |
| Foreign Born, Citizen | 9,468 (95.0%) | 497 (5.0%) |
| Foreign Born, not a Citizen | 3,902 (83.3%) | 782 (16.7%) |
Health Insurance Coverage by Household Income in Rutherford County
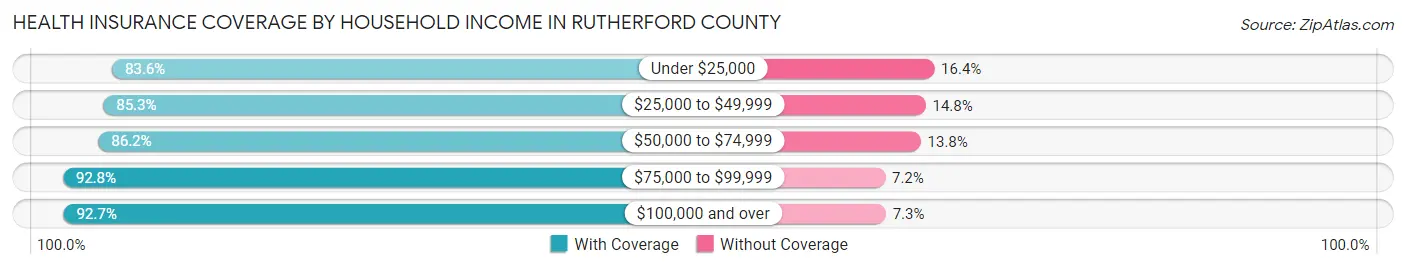
| Household Income | With Coverage | Without Coverage |
| Under $25,000 | 8,789 (83.6%) | 1,720 (16.4%) |
| $25,000 to $49,999 | 13,075 (85.3%) | 2,262 (14.7%) |
| $50,000 to $74,999 | 10,729 (86.2%) | 1,722 (13.8%) |
| $75,000 to $99,999 | 8,040 (92.8%) | 620 (7.2%) |
| $100,000 and over | 15,243 (92.7%) | 1,198 (7.3%) |
Public vs Private Health Insurance Coverage by Age in Rutherford County
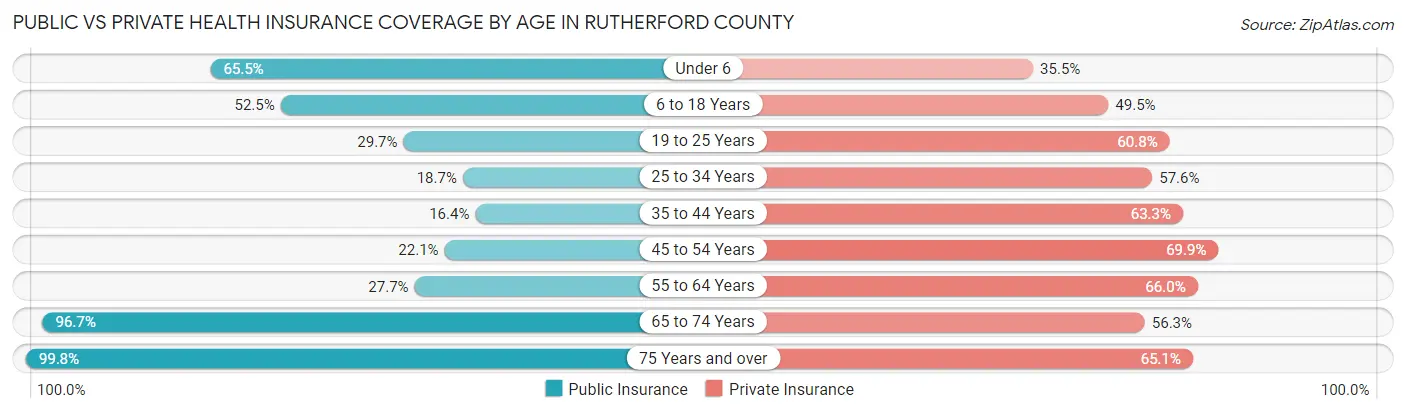
| Age Bracket | Public Insurance | Private Insurance |
| Under 6 | 2,552 (65.5%) | 1,384 (35.5%) |
| 6 to 18 Years | 5,231 (52.5%) | 4,932 (49.5%) |
| 19 to 25 Years | 1,391 (29.7%) | 2,849 (60.8%) |
| 25 to 34 Years | 1,212 (18.7%) | 3,740 (57.6%) |
| 35 to 44 Years | 1,155 (16.4%) | 4,468 (63.3%) |
| 45 to 54 Years | 1,862 (22.1%) | 5,893 (69.9%) |
| 55 to 64 Years | 2,633 (27.7%) | 6,287 (66.0%) |
| 65 to 74 Years | 7,991 (96.7%) | 4,650 (56.2%) |
| 75 Years and over | 5,308 (99.8%) | 3,466 (65.1%) |
| Total | 29,335 (46.1%) | 37,669 (59.2%) |
Disability Status by Sex by Age in Rutherford County
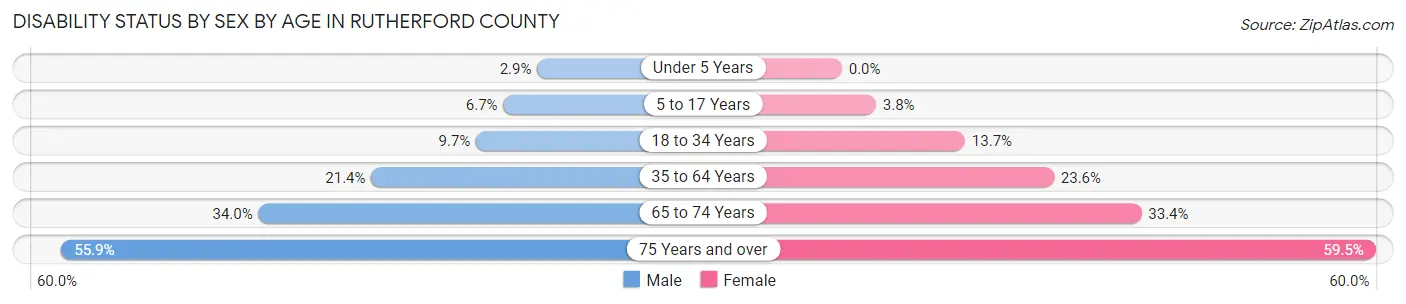
| Age Bracket | Male | Female |
| Under 5 Years | 47 (2.9%) | 0 (0.0%) |
| 5 to 17 Years | 335 (6.7%) | 184 (3.8%) |
| 18 to 34 Years | 576 (9.7%) | 827 (13.7%) |
| 35 to 64 Years | 2,585 (21.4%) | 3,053 (23.6%) |
| 65 to 74 Years | 1,331 (34.0%) | 1,450 (33.4%) |
| 75 Years and over | 1,254 (55.9%) | 1,830 (59.5%) |
Disability Class by Sex by Age in Rutherford County
Disability Class: Hearing Difficulty
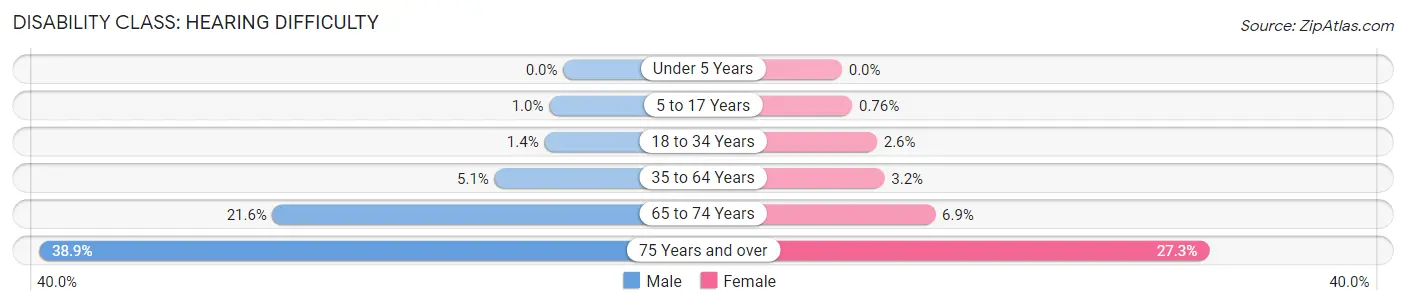
| Age Bracket | Male | Female |
| Under 5 Years | 0 (0.0%) | 0 (0.0%) |
| 5 to 17 Years | 52 (1.0%) | 37 (0.8%) |
| 18 to 34 Years | 83 (1.4%) | 157 (2.6%) |
| 35 to 64 Years | 617 (5.1%) | 409 (3.2%) |
| 65 to 74 Years | 846 (21.6%) | 301 (6.9%) |
| 75 Years and over | 873 (38.9%) | 839 (27.3%) |
Disability Class: Vision Difficulty
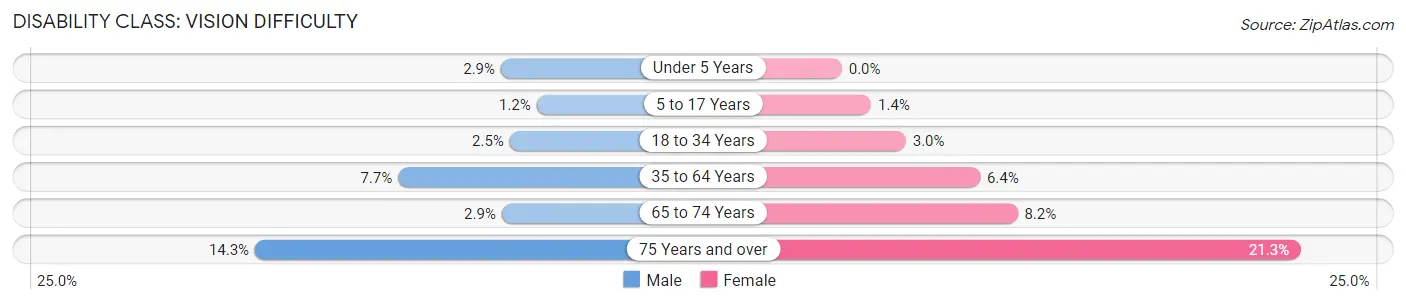
| Age Bracket | Male | Female |
| Under 5 Years | 47 (2.9%) | 0 (0.0%) |
| 5 to 17 Years | 62 (1.2%) | 66 (1.4%) |
| 18 to 34 Years | 148 (2.5%) | 179 (3.0%) |
| 35 to 64 Years | 928 (7.7%) | 828 (6.4%) |
| 65 to 74 Years | 112 (2.9%) | 354 (8.2%) |
| 75 Years and over | 321 (14.3%) | 656 (21.3%) |
Disability Class: Cognitive Difficulty
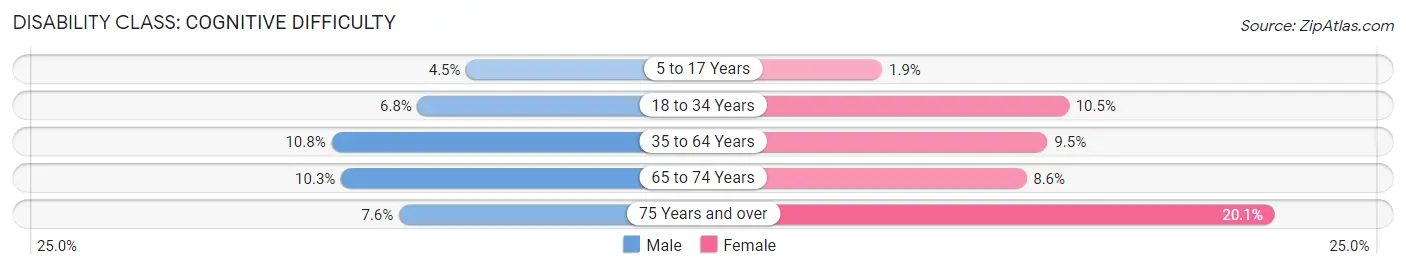
| Age Bracket | Male | Female |
| 5 to 17 Years | 226 (4.5%) | 91 (1.9%) |
| 18 to 34 Years | 401 (6.8%) | 635 (10.5%) |
| 35 to 64 Years | 1,301 (10.8%) | 1,233 (9.5%) |
| 65 to 74 Years | 404 (10.3%) | 372 (8.6%) |
| 75 Years and over | 171 (7.6%) | 618 (20.1%) |
Disability Class: Ambulatory Difficulty
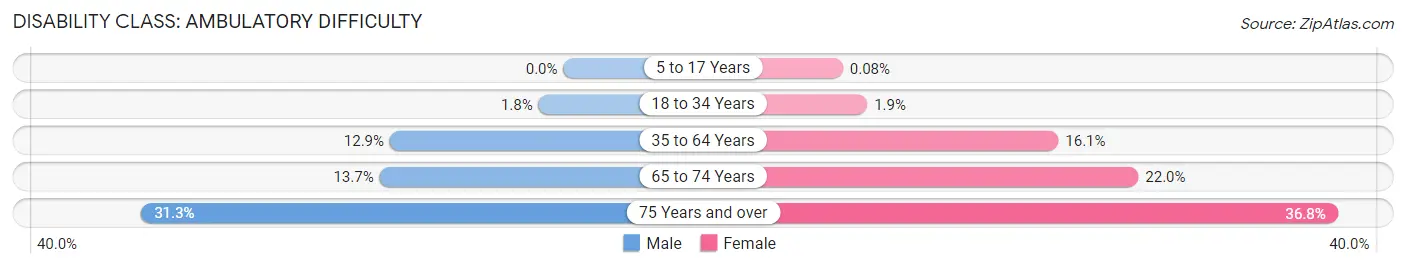
| Age Bracket | Male | Female |
| 5 to 17 Years | 0 (0.0%) | 4 (0.1%) |
| 18 to 34 Years | 109 (1.8%) | 114 (1.9%) |
| 35 to 64 Years | 1,557 (12.9%) | 2,079 (16.1%) |
| 65 to 74 Years | 535 (13.7%) | 957 (22.0%) |
| 75 Years and over | 703 (31.3%) | 1,133 (36.8%) |
Disability Class: Self-Care Difficulty
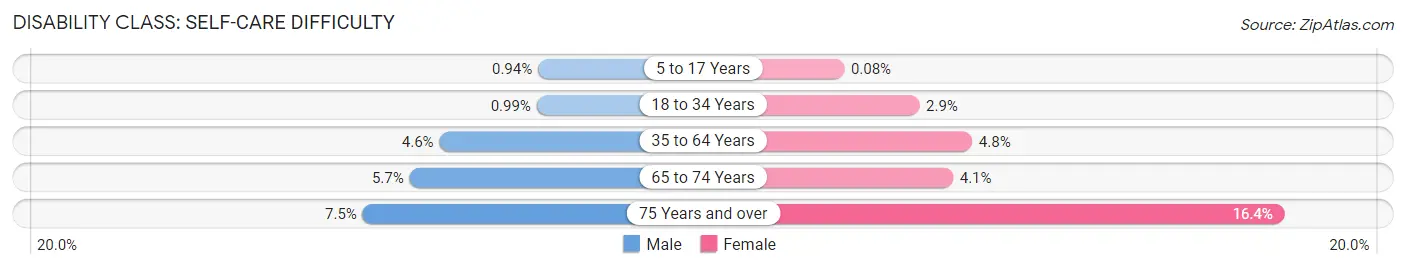
| Age Bracket | Male | Female |
| 5 to 17 Years | 47 (0.9%) | 4 (0.1%) |
| 18 to 34 Years | 59 (1.0%) | 173 (2.9%) |
| 35 to 64 Years | 556 (4.6%) | 624 (4.8%) |
| 65 to 74 Years | 224 (5.7%) | 179 (4.1%) |
| 75 Years and over | 167 (7.4%) | 506 (16.4%) |
Technology Access in Rutherford County
Computing Device Access in Rutherford County
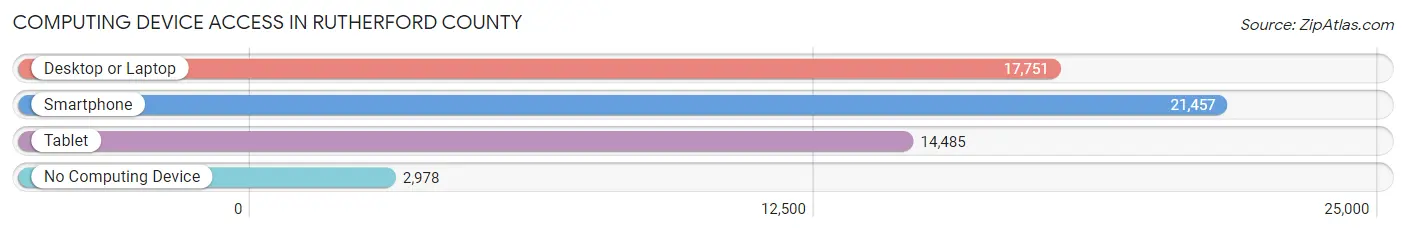
| Device Type | # Households | % Households |
| Desktop or Laptop | 17,751 | 67.6% |
| Smartphone | 21,457 | 81.7% |
| Tablet | 14,485 | 55.1% |
| No Computing Device | 2,978 | 11.3% |
| Total | 26,273 | 100.0% |
Internet Access in Rutherford County
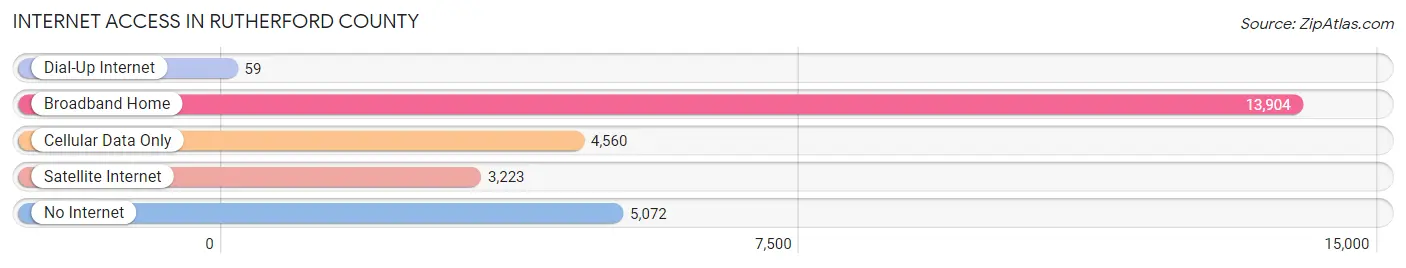
| Internet Type | # Households | % Households |
| Dial-Up Internet | 59 | 0.2% |
| Broadband Home | 13,904 | 52.9% |
| Cellular Data Only | 4,560 | 17.4% |
| Satellite Internet | 3,223 | 12.3% |
| No Internet | 5,072 | 19.3% |
| Total | 26,273 | 100.0% |
Rutherford County Summary
Rutherford County is located in the foothills of western North Carolina, and is part of the larger Appalachian region. It is bordered by Cleveland County to the north, Polk County to the east, McDowell County to the south, and Burke and Cleveland Counties to the west. The county seat is Rutherfordton, and the county is home to a population of approximately 66,000 people.
History
Rutherford County was formed in 1779 from parts of Tryon and Lincoln Counties. It was named for General Griffith Rutherford, a Revolutionary War hero who served in the Battle of Kings Mountain. The county was originally part of the Cherokee Nation, and the first European settlers arrived in the late 1700s. The county was largely agricultural, with cotton, tobacco, and corn being the main crops. The county was also home to several gold mines, which were a major source of income for the area.
In the late 1800s, the county began to industrialize, with the construction of several textile mills. The county also became a major producer of furniture, and the town of Forest City became known as the “Furniture Capital of the World.” The county also became a major producer of apples, and the town of Spindale became known as the “Apple Capital of the World.”
Geography
Rutherford County is located in the foothills of the Blue Ridge Mountains. The county is mostly mountainous, with elevations ranging from 1,000 to 4,000 feet. The county is home to several rivers, including the Broad, Catawba, and Pacolet. The county is also home to several lakes, including Lake Lure and Lake Adger.
The county is home to several state parks, including Chimney Rock State Park, Lake Lure Beach and Water Park, and South Mountains State Park. The county is also home to several national forests, including the Nantahala National Forest and the Pisgah National Forest.
Economy
Rutherford County’s economy is largely based on agriculture, manufacturing, and tourism. The county is home to several large employers, including Isothermal Community College, Rutherford Regional Medical Center, and the Rutherford County Schools. The county is also home to several large manufacturing companies, including AvaCare Medical, Bemis Manufacturing, and Drexel Heritage Furniture.
The county is also home to several tourist attractions, including Chimney Rock State Park, Lake Lure Beach and Water Park, and the Biltmore Estate. The county is also home to several wineries, including the Biltmore Winery and the Raffaldini Vineyards.
Demographics
As of the 2010 census, the population of Rutherford County was 66,000. The racial makeup of the county was 87.3% White, 8.3% African American, 0.7% Native American, 0.7% Asian, 0.1% Pacific Islander, and 2.9% from other races. The median household income was $41,000, and the median family income was $48,000. The per capita income was $20,000.
Rutherford County is home to several religious denominations, including Baptist, Methodist, Presbyterian, and Catholic. The county is also home to several colleges and universities, including Isothermal Community College, Gardner-Webb University, and Montreat College.
Common Questions
What is Per Capita Income in Rutherford County?
Per Capita income in Rutherford County is $28,873.
What is the Median Family Income in Rutherford County?
Median Family Income in Rutherford County is $62,564.
What is the Median Household income in Rutherford County?
Median Household Income in Rutherford County is $50,512.
What is Income or Wage Gap in Rutherford County?
Income or Wage Gap in Rutherford County is 34.1%.
Women in Rutherford County earn 65.9 cents for every dollar earned by a man.
What is Family Income Deficit in Rutherford County?
Family Income Deficit in Rutherford County is $8,683.
Families that are below poverty line in Rutherford County earn $8,683 less on average than the poverty threshold level.
What is Inequality or Gini Index in Rutherford County?
Inequality or Gini Index in Rutherford County is 0.47.
What is the Total Population of Rutherford County?
Total Population of Rutherford County is 64,680.
What is the Total Male Population of Rutherford County?
Total Male Population of Rutherford County is 31,503.
What is the Total Female Population of Rutherford County?
Total Female Population of Rutherford County is 33,177.
What is the Ratio of Males per 100 Females in Rutherford County?
There are 94.95 Males per 100 Females in Rutherford County.
What is the Ratio of Females per 100 Males in Rutherford County?
There are 105.31 Females per 100 Males in Rutherford County.
What is the Median Population Age in Rutherford County?
Median Population Age in Rutherford County is 44.9 Years.
What is the Average Family Size in Rutherford County
Average Family Size in Rutherford County is 3.0 People.
What is the Average Household Size in Rutherford County
Average Household Size in Rutherford County is 2.4 People.
How Large is the Labor Force in Rutherford County?
There are 28,408 People in the Labor Forcein in Rutherford County.
What is the Percentage of People in the Labor Force in Rutherford County?
53.3% of People are in the Labor Force in Rutherford County.
What is the Unemployment Rate in Rutherford County?
Unemployment Rate in Rutherford County is 6.0%.