Rockingham County, NC Map & Demographics
Rockingham County Map
Rockingham County Overview
$29,239
PER CAPITA INCOME
$63,904
AVG FAMILY INCOME
$50,737
AVG HOUSEHOLD INCOME
27.2%
WAGE / INCOME GAP [ % ]
72.8¢/ $1
WAGE / INCOME GAP [ $ ]
$10,195
FAMILY INCOME DEFICIT
0.46
INEQUALITY / GINI INDEX
91,209
TOTAL POPULATION
44,392
MALE POPULATION
46,817
FEMALE POPULATION
94.82
MALES / 100 FEMALES
105.46
FEMALES / 100 MALES
45.1
MEDIAN AGE
2.9
AVG FAMILY SIZE
2.3
AVG HOUSEHOLD SIZE
42,225
LABOR FORCE [ PEOPLE ]
56.0%
PERCENT IN LABOR FORCE
6.5%
UNEMPLOYMENT RATE
Rockingham County Area Codes
Income in Rockingham County
Income Overview in Rockingham County
Per Capita Income in Rockingham County is $29,239, while median incomes of families and households are $63,904 and $50,737 respectively.
| Characteristic | Number | Measure |
| Per Capita Income | 91,209 | $29,239 |
| Median Family Income | 25,232 | $63,904 |
| Mean Family Income | 25,232 | $81,993 |
| Median Household Income | 38,710 | $50,737 |
| Mean Household Income | 38,710 | $68,574 |
| Income Deficit | 25,232 | $10,195 |
| Wage / Income Gap (%) | 91,209 | 27.24% |
| Wage / Income Gap ($) | 91,209 | 72.76¢ per $1 |
| Gini / Inequality Index | 91,209 | 0.46 |
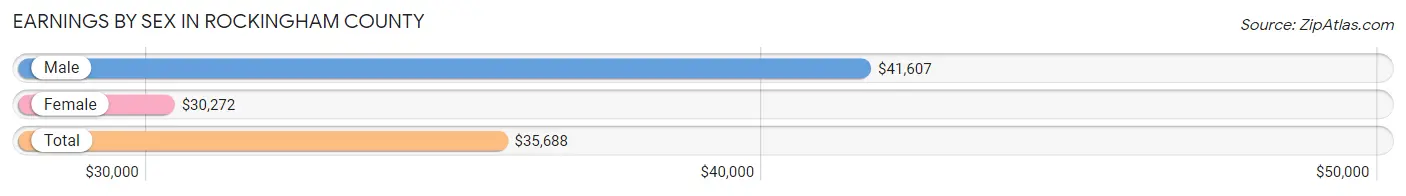
Earnings by Sex in Rockingham County
Average Earnings in Rockingham County are $35,688, $41,607 for men and $30,272 for women, a difference of 27.2%.
| Sex | Number | Average Earnings |
| Male | 22,769 (52.4%) | $41,607 |
| Female | 20,655 (47.6%) | $30,272 |
| Total | 43,424 (100.0%) | $35,688 |
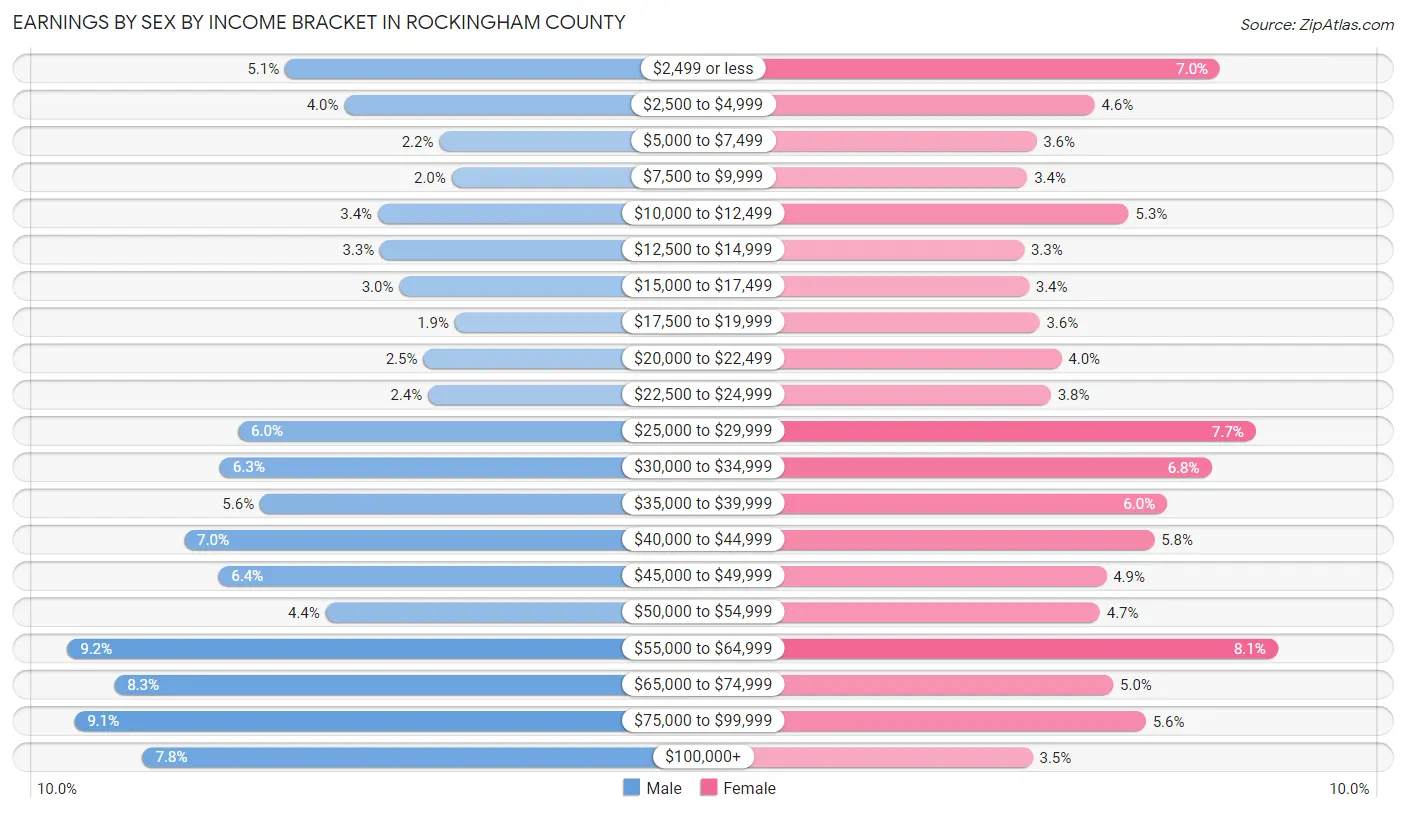
Earnings by Sex by Income Bracket in Rockingham County
The most common earnings brackets in Rockingham County are $55,000 to $64,999 for men (2,094 | 9.2%) and $55,000 to $64,999 for women (1,667 | 8.1%).
| Income | Male | Female |
| $2,499 or less | 1,166 (5.1%) | 1,443 (7.0%) |
| $2,500 to $4,999 | 912 (4.0%) | 958 (4.6%) |
| $5,000 to $7,499 | 507 (2.2%) | 734 (3.5%) |
| $7,500 to $9,999 | 455 (2.0%) | 698 (3.4%) |
| $10,000 to $12,499 | 769 (3.4%) | 1,091 (5.3%) |
| $12,500 to $14,999 | 760 (3.3%) | 686 (3.3%) |
| $15,000 to $17,499 | 678 (3.0%) | 704 (3.4%) |
| $17,500 to $19,999 | 441 (1.9%) | 745 (3.6%) |
| $20,000 to $22,499 | 576 (2.5%) | 831 (4.0%) |
| $22,500 to $24,999 | 556 (2.4%) | 789 (3.8%) |
| $25,000 to $29,999 | 1,367 (6.0%) | 1,583 (7.7%) |
| $30,000 to $34,999 | 1,444 (6.3%) | 1,410 (6.8%) |
| $35,000 to $39,999 | 1,272 (5.6%) | 1,239 (6.0%) |
| $40,000 to $44,999 | 1,596 (7.0%) | 1,190 (5.8%) |
| $45,000 to $49,999 | 1,451 (6.4%) | 1,003 (4.9%) |
| $50,000 to $54,999 | 993 (4.4%) | 980 (4.7%) |
| $55,000 to $64,999 | 2,094 (9.2%) | 1,667 (8.1%) |
| $65,000 to $74,999 | 1,894 (8.3%) | 1,030 (5.0%) |
| $75,000 to $99,999 | 2,065 (9.1%) | 1,156 (5.6%) |
| $100,000+ | 1,773 (7.8%) | 718 (3.5%) |
| Total | 22,769 (100.0%) | 20,655 (100.0%) |
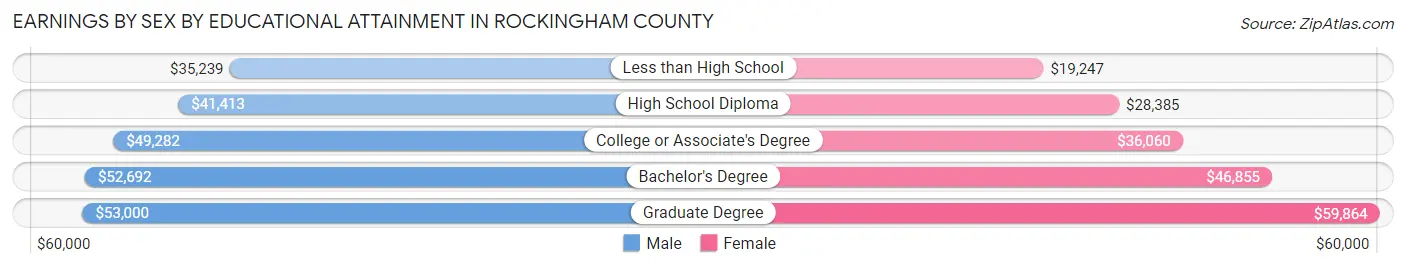
Earnings by Sex by Educational Attainment in Rockingham County
Average earnings in Rockingham County are $45,079 for men and $34,313 for women, a difference of 23.9%. Men with an educational attainment of graduate degree enjoy the highest average annual earnings of $53,000, while those with less than high school education earn the least with $35,239. Women with an educational attainment of graduate degree earn the most with the average annual earnings of $59,864, while those with less than high school education have the smallest earnings of $19,247.
| Educational Attainment | Male Income | Female Income |
| Less than High School | $35,239 | $19,247 |
| High School Diploma | $41,413 | $28,385 |
| College or Associate's Degree | $49,282 | $36,060 |
| Bachelor's Degree | $52,692 | $46,855 |
| Graduate Degree | $53,000 | $59,864 |
| Total | $45,079 | $34,313 |
Family Income in Rockingham County
Family Income Brackets in Rockingham County
According to the Rockingham County family income data, there are 4,819 families falling into the $50,000 to $74,999 income range, which is the most common income bracket and makes up 19.1% of all families. Conversely, the $10,000 to $14,999 income bracket is the least frequent group with only 706 families (2.8%) belonging to this category.
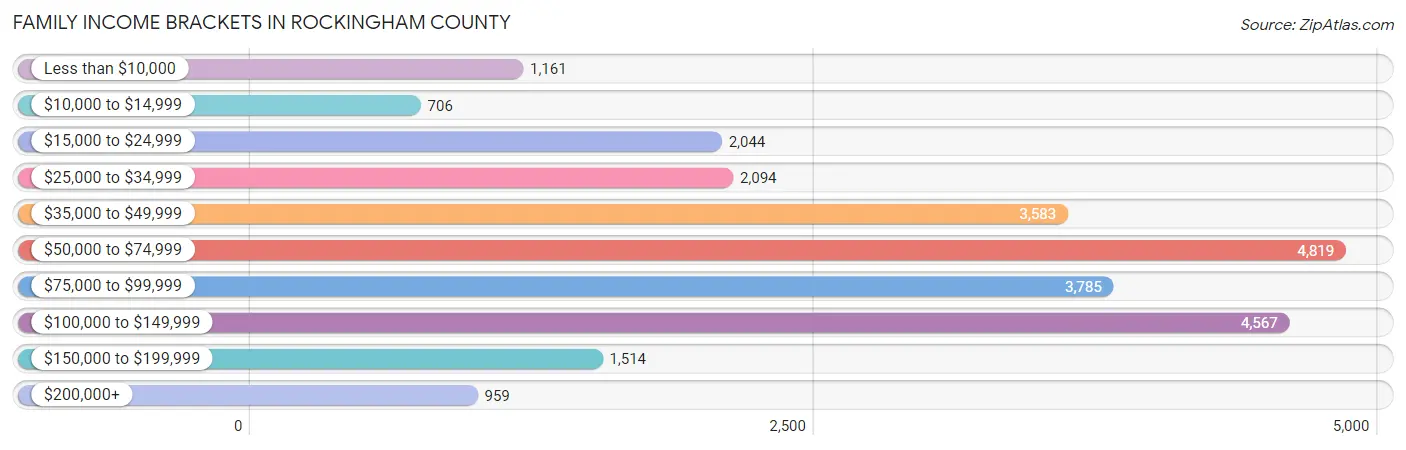
| Income Bracket | # Families | % Families |
| Less than $10,000 | 1,161 | 4.6% |
| $10,000 to $14,999 | 706 | 2.8% |
| $15,000 to $24,999 | 2,044 | 8.1% |
| $25,000 to $34,999 | 2,094 | 8.3% |
| $35,000 to $49,999 | 3,583 | 14.2% |
| $50,000 to $74,999 | 4,819 | 19.1% |
| $75,000 to $99,999 | 3,785 | 15.0% |
| $100,000 to $149,999 | 4,567 | 18.1% |
| $150,000 to $199,999 | 1,514 | 6.0% |
| $200,000+ | 959 | 3.8% |
Family Income by Famaliy Size in Rockingham County
5-person families (1,149 | 4.5%) account for the highest median family income in Rockingham County with $77,303 per family, while 2-person families (13,163 | 52.2%) have the highest median income of $29,688 per family member.
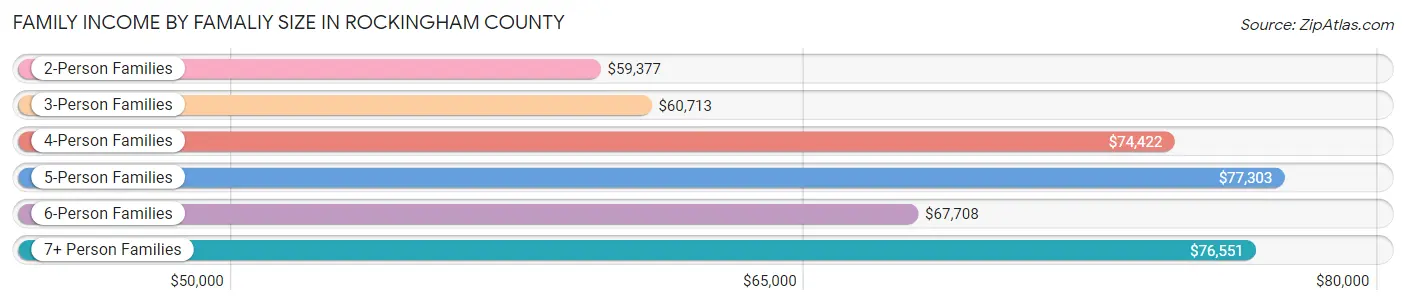
| Income Bracket | # Families | Median Income |
| 2-Person Families | 13,163 (52.2%) | $59,377 |
| 3-Person Families | 5,923 (23.5%) | $60,713 |
| 4-Person Families | 4,023 (15.9%) | $74,422 |
| 5-Person Families | 1,149 (4.5%) | $77,303 |
| 6-Person Families | 713 (2.8%) | $67,708 |
| 7+ Person Families | 261 (1.0%) | $76,551 |
| Total | 25,232 (100.0%) | $63,904 |
Family Income by Number of Earners in Rockingham County
The median family income in Rockingham County is $63,904, with families comprising 3+ earners (2,132) having the highest median family income of $116,759, while families with no earners (5,138) have the lowest median family income of $37,096, accounting for 8.5% and 20.4% of families, respectively.
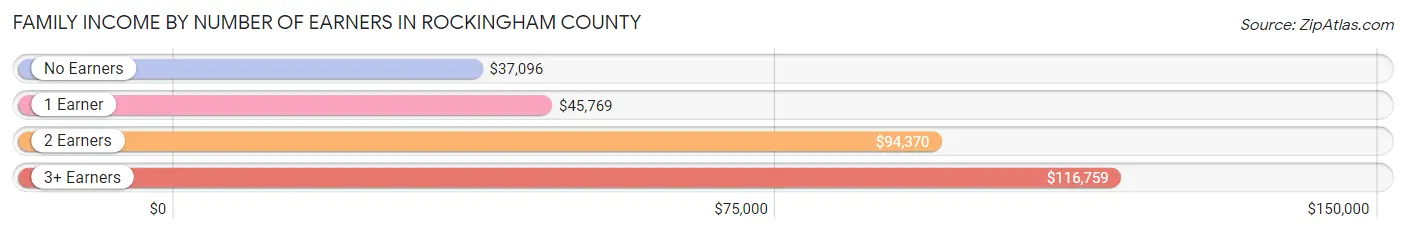
| Number of Earners | # Families | Median Income |
| No Earners | 5,138 (20.4%) | $37,096 |
| 1 Earner | 8,451 (33.5%) | $45,769 |
| 2 Earners | 9,511 (37.7%) | $94,370 |
| 3+ Earners | 2,132 (8.5%) | $116,759 |
| Total | 25,232 (100.0%) | $63,904 |
Household Income in Rockingham County
Household Income Brackets in Rockingham County
With 6,697 households falling in the category, the $50,000 to $74,999 income range is the most frequent in Rockingham County, accounting for 17.3% of all households. In contrast, only 1,045 households (2.7%) fall into the $200,000+ income bracket, making it the least populous group.
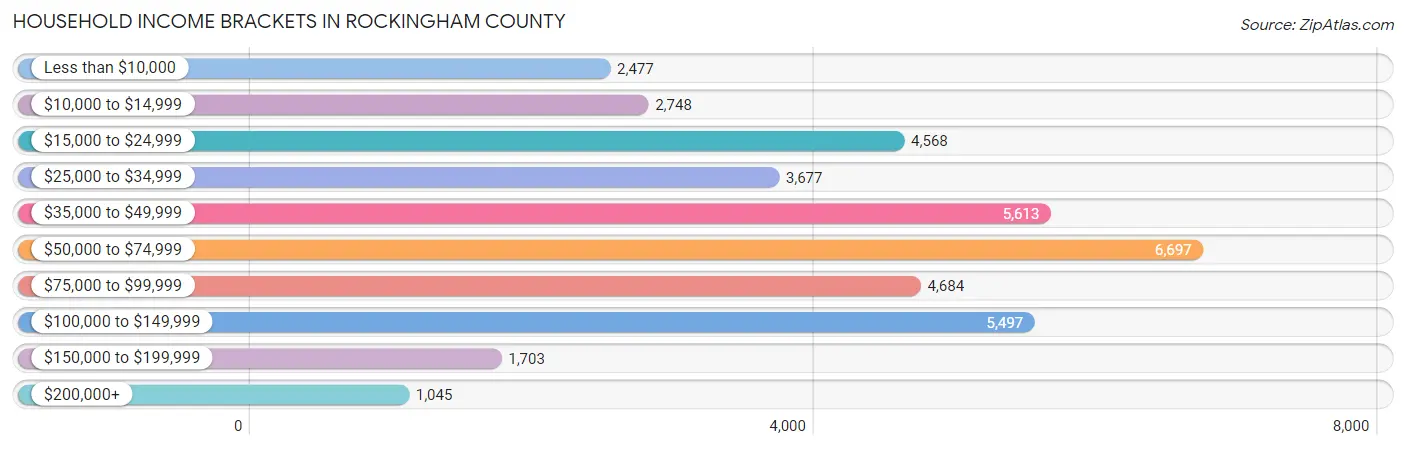
| Income Bracket | # Households | % Households |
| Less than $10,000 | 2,477 | 6.4% |
| $10,000 to $14,999 | 2,748 | 7.1% |
| $15,000 to $24,999 | 4,568 | 11.8% |
| $25,000 to $34,999 | 3,677 | 9.5% |
| $35,000 to $49,999 | 5,613 | 14.5% |
| $50,000 to $74,999 | 6,697 | 17.3% |
| $75,000 to $99,999 | 4,684 | 12.1% |
| $100,000 to $149,999 | 5,497 | 14.2% |
| $150,000 to $199,999 | 1,703 | 4.4% |
| $200,000+ | 1,045 | 2.7% |
Household Income by Householder Age in Rockingham County
The median household income in Rockingham County is $50,737, with the highest median household income of $61,793 found in the 25 to 44 years age bracket for the primary householder. A total of 9,432 households (24.4%) fall into this category. Meanwhile, the 65+ years age bracket for the primary householder has the lowest median household income of $38,693, with 12,539 households (32.4%) in this group.
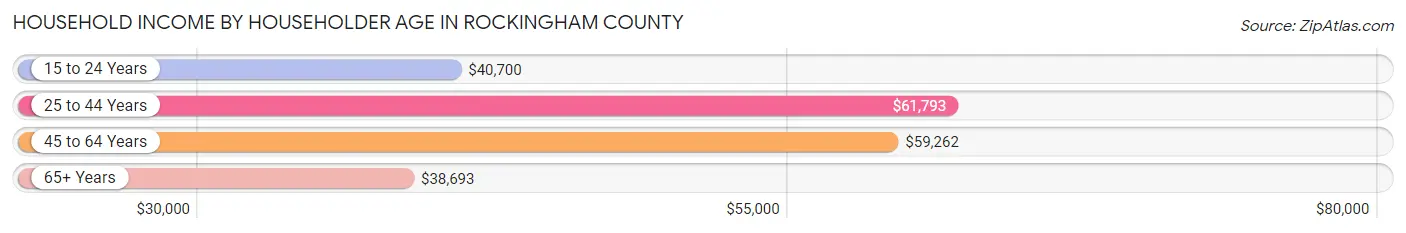
| Income Bracket | # Households | Median Income |
| 15 to 24 Years | 1,235 (3.2%) | $40,700 |
| 25 to 44 Years | 9,432 (24.4%) | $61,793 |
| 45 to 64 Years | 15,504 (40.1%) | $59,262 |
| 65+ Years | 12,539 (32.4%) | $38,693 |
| Total | 38,710 (100.0%) | $50,737 |
Poverty in Rockingham County
Income Below Poverty by Sex and Age in Rockingham County
With 16.4% poverty level for males and 21.1% for females among the residents of Rockingham County, 5 year old males and under 5 year old females are the most vulnerable to poverty, with 174 males (43.3%) and 772 females (40.6%) in their respective age groups living below the poverty level.
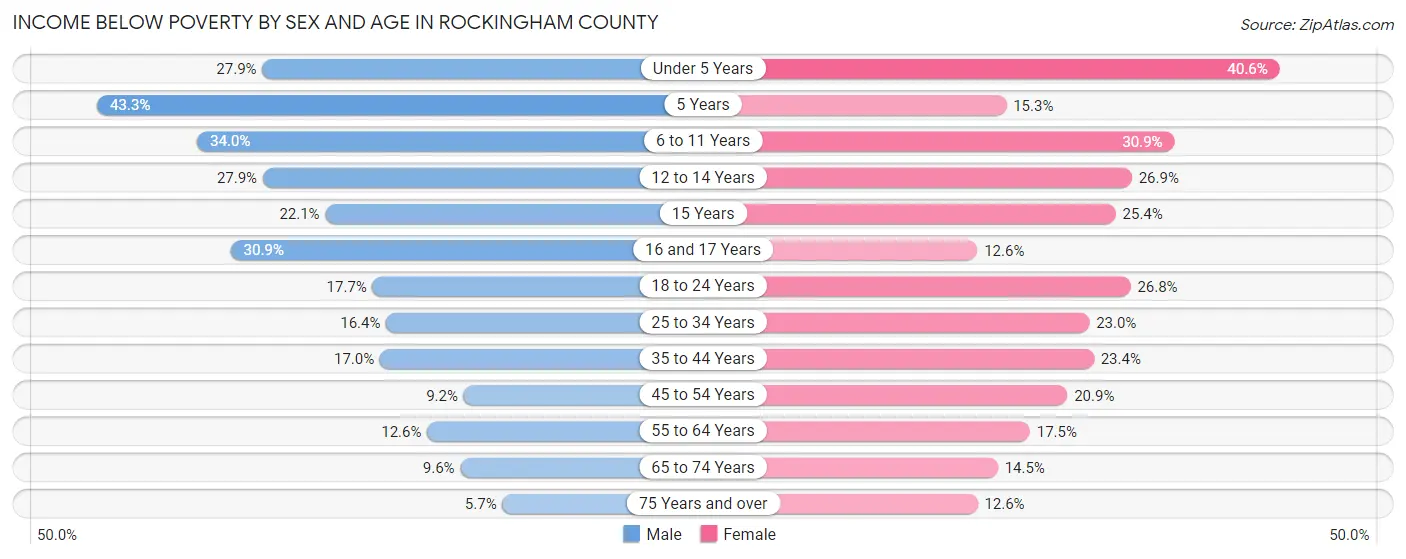
| Age Bracket | Male | Female |
| Under 5 Years | 619 (27.9%) | 772 (40.6%) |
| 5 Years | 174 (43.3%) | 47 (15.3%) |
| 6 to 11 Years | 1,005 (34.0%) | 884 (30.9%) |
| 12 to 14 Years | 472 (27.9%) | 472 (26.9%) |
| 15 Years | 106 (22.1%) | 92 (25.4%) |
| 16 and 17 Years | 390 (30.9%) | 155 (12.6%) |
| 18 to 24 Years | 626 (17.7%) | 879 (26.8%) |
| 25 to 34 Years | 820 (16.4%) | 1,230 (23.0%) |
| 35 to 44 Years | 823 (17.0%) | 1,158 (23.4%) |
| 45 to 54 Years | 553 (9.2%) | 1,324 (20.9%) |
| 55 to 64 Years | 845 (12.6%) | 1,305 (17.4%) |
| 65 to 74 Years | 496 (9.6%) | 837 (14.5%) |
| 75 Years and over | 175 (5.7%) | 547 (12.6%) |
| Total | 7,104 (16.4%) | 9,702 (21.1%) |
Income Above Poverty by Sex and Age in Rockingham County
According to the poverty statistics in Rockingham County, males aged 75 years and over and females aged 16 and 17 years are the age groups that are most secure financially, with 94.4% of males and 87.4% of females in these age groups living above the poverty line.
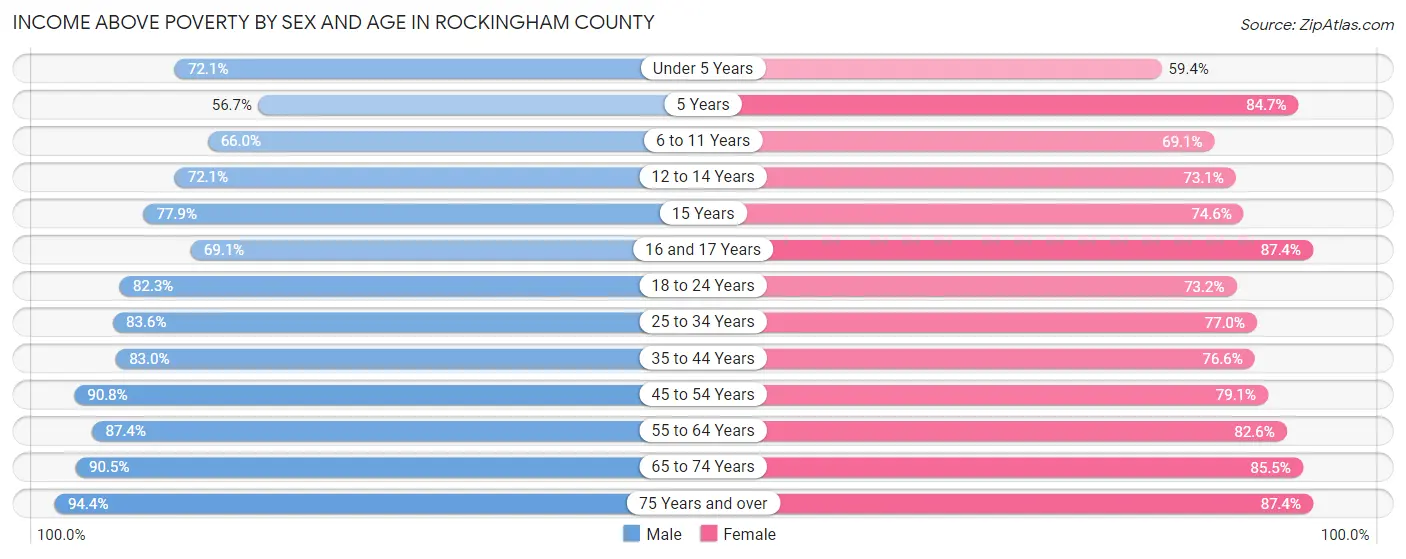
| Age Bracket | Male | Female |
| Under 5 Years | 1,597 (72.1%) | 1,128 (59.4%) |
| 5 Years | 228 (56.7%) | 261 (84.7%) |
| 6 to 11 Years | 1,952 (66.0%) | 1,980 (69.1%) |
| 12 to 14 Years | 1,221 (72.1%) | 1,282 (73.1%) |
| 15 Years | 374 (77.9%) | 270 (74.6%) |
| 16 and 17 Years | 873 (69.1%) | 1,078 (87.4%) |
| 18 to 24 Years | 2,910 (82.3%) | 2,402 (73.2%) |
| 25 to 34 Years | 4,172 (83.6%) | 4,126 (77.0%) |
| 35 to 44 Years | 4,016 (83.0%) | 3,794 (76.6%) |
| 45 to 54 Years | 5,432 (90.8%) | 5,005 (79.1%) |
| 55 to 64 Years | 5,846 (87.4%) | 6,173 (82.6%) |
| 65 to 74 Years | 4,700 (90.4%) | 4,949 (85.5%) |
| 75 Years and over | 2,923 (94.4%) | 3,796 (87.4%) |
| Total | 36,244 (83.6%) | 36,244 (78.9%) |
Income Below Poverty Among Married-Couple Families in Rockingham County
The poverty statistics for married-couple families in Rockingham County show that 6.9% or 1,231 of the total 17,962 families live below the poverty line. Families with 5 or more children have the highest poverty rate of 41.1%, comprising of 65 families. On the other hand, families with no children have the lowest poverty rate of 4.7%, which includes 541 families.
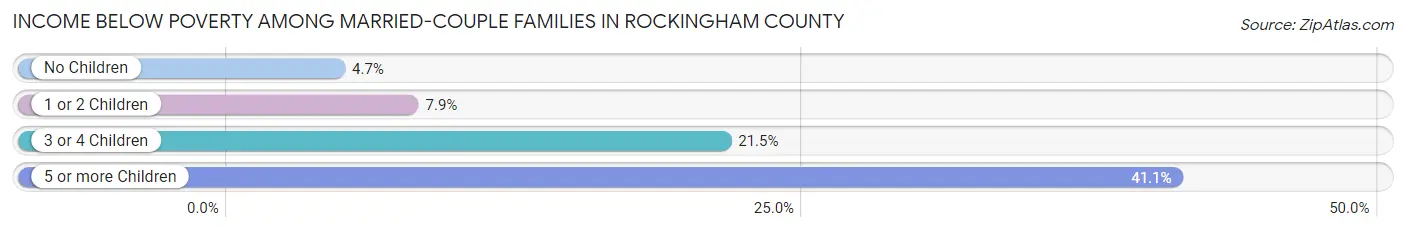
| Children | Above Poverty | Below Poverty |
| No Children | 11,075 (95.3%) | 541 (4.7%) |
| 1 or 2 Children | 4,762 (92.1%) | 406 (7.9%) |
| 3 or 4 Children | 801 (78.5%) | 219 (21.5%) |
| 5 or more Children | 93 (58.9%) | 65 (41.1%) |
| Total | 16,731 (93.1%) | 1,231 (6.9%) |
Income Below Poverty Among Single-Parent Households in Rockingham County
According to the poverty data in Rockingham County, 20.0% or 388 single-father households and 40.2% or 2,139 single-mother households are living below the poverty line. Among single-father households, those with 5 or more children have the highest poverty rate, with 14 households (100.0%) experiencing poverty. Likewise, among single-mother households, those with 5 or more children have the highest poverty rate, with 57 households (100.0%) falling below the poverty line.
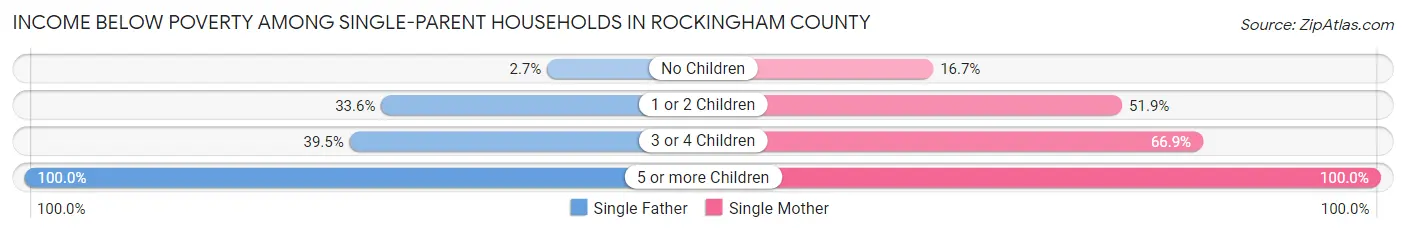
| Children | Single Father | Single Mother |
| No Children | 24 (2.7%) | 347 (16.7%) |
| 1 or 2 Children | 335 (33.6%) | 1,375 (51.9%) |
| 3 or 4 Children | 15 (39.5%) | 360 (66.9%) |
| 5 or more Children | 14 (100.0%) | 57 (100.0%) |
| Total | 388 (20.0%) | 2,139 (40.2%) |
Income Below Poverty Among Married-Couple vs Single-Parent Households in Rockingham County
The poverty data for Rockingham County shows that 1,231 of the married-couple family households (6.9%) and 2,527 of the single-parent households (34.8%) are living below the poverty level. Within the married-couple family households, those with 5 or more children have the highest poverty rate, with 65 households (41.1%) falling below the poverty line. Among the single-parent households, those with 5 or more children have the highest poverty rate, with 71 household (100.0%) living below poverty.
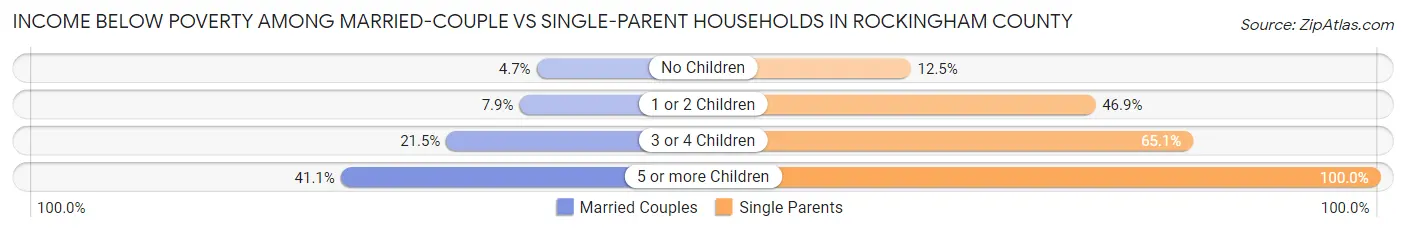
| Children | Married-Couple Families | Single-Parent Households |
| No Children | 541 (4.7%) | 371 (12.5%) |
| 1 or 2 Children | 406 (7.9%) | 1,710 (46.9%) |
| 3 or 4 Children | 219 (21.5%) | 375 (65.1%) |
| 5 or more Children | 65 (41.1%) | 71 (100.0%) |
| Total | 1,231 (6.9%) | 2,527 (34.8%) |
Race in Rockingham County
The most populous races in Rockingham County are White / Caucasian (66,592 | 73.0%), Black / African American (16,080 | 17.6%), and Hispanic or Latino (5,910 | 6.5%).
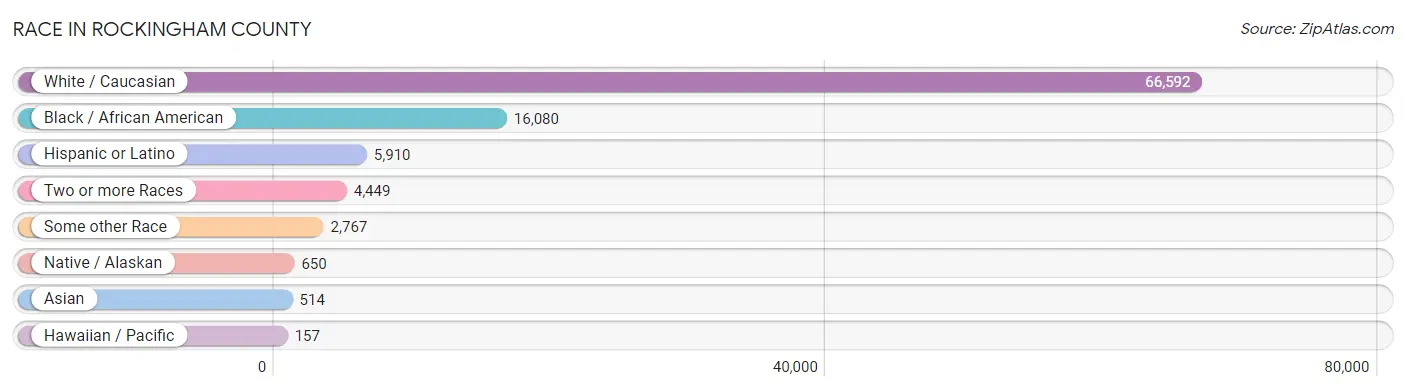
| Race | # Population | % Population |
| Asian | 514 | 0.6% |
| Black / African American | 16,080 | 17.6% |
| Hawaiian / Pacific | 157 | 0.2% |
| Hispanic or Latino | 5,910 | 6.5% |
| Native / Alaskan | 650 | 0.7% |
| White / Caucasian | 66,592 | 73.0% |
| Two or more Races | 4,449 | 4.9% |
| Some other Race | 2,767 | 3.0% |
| Total | 91,209 | 100.0% |
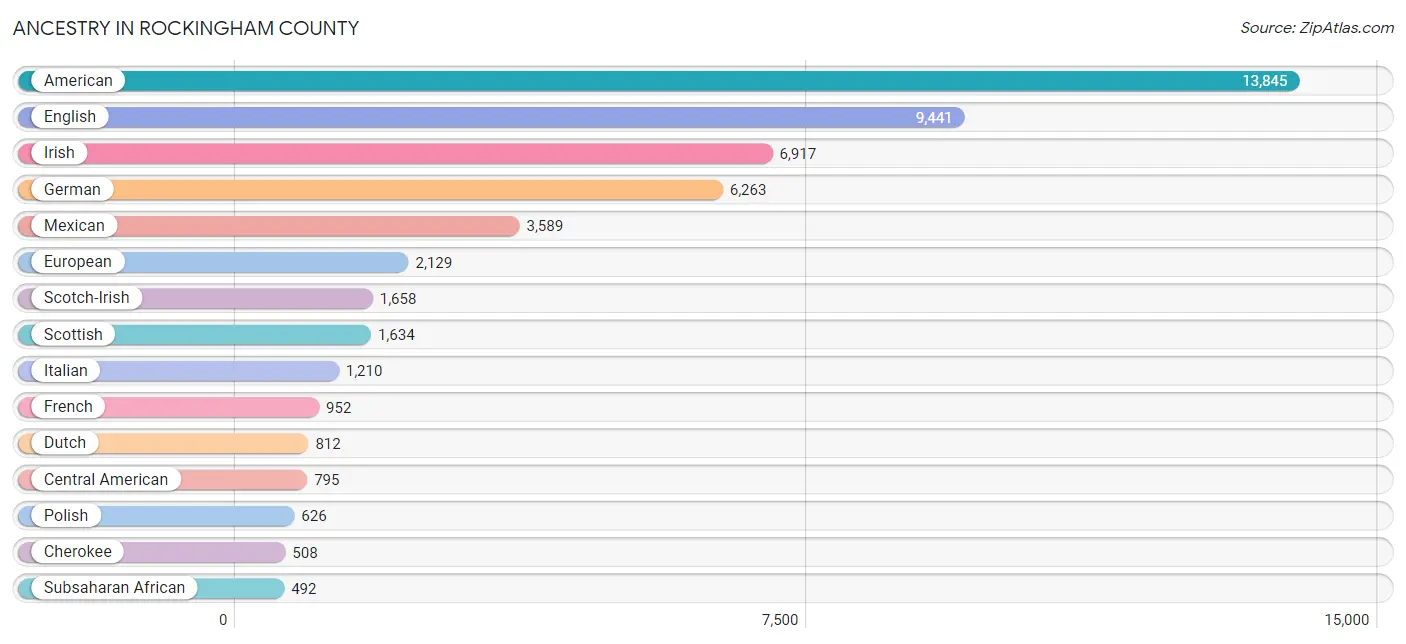
Ancestry in Rockingham County
The most populous ancestries reported in Rockingham County are American (13,845 | 15.2%), English (9,441 | 10.3%), Irish (6,917 | 7.6%), German (6,263 | 6.9%), and Mexican (3,589 | 3.9%), together accounting for 43.9% of all Rockingham County residents.
| Ancestry | # Population | % Population |
| African | 401 | 0.4% |
| Albanian | 15 | 0.0% |
| American | 13,845 | 15.2% |
| Apache | 2 | 0.0% |
| Arab | 161 | 0.2% |
| Argentinean | 4 | 0.0% |
| Armenian | 7 | 0.0% |
| Belgian | 13 | 0.0% |
| Blackfeet | 13 | 0.0% |
| British | 490 | 0.5% |
| British West Indian | 22 | 0.0% |
| Burmese | 240 | 0.3% |
| Canadian | 21 | 0.0% |
| Celtic | 7 | 0.0% |
| Central American | 795 | 0.9% |
| Cherokee | 508 | 0.6% |
| Colombian | 37 | 0.0% |
| Costa Rican | 4 | 0.0% |
| Cuban | 240 | 0.3% |
| Czech | 102 | 0.1% |
| Czechoslovakian | 24 | 0.0% |
| Danish | 69 | 0.1% |
| Dominican | 39 | 0.0% |
| Dutch | 812 | 0.9% |
| Eastern European | 18 | 0.0% |
| English | 9,441 | 10.3% |
| Ethiopian | 10 | 0.0% |
| European | 2,129 | 2.3% |
| Finnish | 63 | 0.1% |
| French | 952 | 1.0% |
| French Canadian | 250 | 0.3% |
| German | 6,263 | 6.9% |
| Greek | 39 | 0.0% |
| Guamanian / Chamorro | 4 | 0.0% |
| Guatemalan | 226 | 0.3% |
| Haitian | 20 | 0.0% |
| Honduran | 189 | 0.2% |
| Hungarian | 325 | 0.4% |
| Indian (Asian) | 147 | 0.2% |
| Iranian | 77 | 0.1% |
| Irish | 6,917 | 7.6% |
| Iroquois | 14 | 0.0% |
| Italian | 1,210 | 1.3% |
| Jamaican | 57 | 0.1% |
| Korean | 319 | 0.4% |
| Latvian | 9 | 0.0% |
| Lebanese | 37 | 0.0% |
| Lithuanian | 84 | 0.1% |
| Lumbee | 60 | 0.1% |
| Malaysian | 20 | 0.0% |
| Mexican | 3,589 | 3.9% |
| Mexican American Indian | 328 | 0.4% |
| Moroccan | 47 | 0.1% |
| Native Hawaiian | 179 | 0.2% |
| Navajo | 32 | 0.0% |
| Nicaraguan | 8 | 0.0% |
| Nigerian | 49 | 0.1% |
| Northern European | 13 | 0.0% |
| Norwegian | 404 | 0.4% |
| Pakistani | 20 | 0.0% |
| Pennsylvania German | 32 | 0.0% |
| Polish | 626 | 0.7% |
| Portuguese | 53 | 0.1% |
| Puerto Rican | 374 | 0.4% |
| Romanian | 34 | 0.0% |
| Russian | 145 | 0.2% |
| Salvadoran | 368 | 0.4% |
| Samoan | 19 | 0.0% |
| Scandinavian | 136 | 0.2% |
| Scotch-Irish | 1,658 | 1.8% |
| Scottish | 1,634 | 1.8% |
| Sierra Leonean | 21 | 0.0% |
| Slavic | 15 | 0.0% |
| Slovak | 46 | 0.1% |
| South American | 257 | 0.3% |
| Spaniard | 486 | 0.5% |
| Spanish American | 27 | 0.0% |
| Sri Lankan | 89 | 0.1% |
| Subsaharan African | 492 | 0.5% |
| Swedish | 325 | 0.4% |
| Swiss | 19 | 0.0% |
| Syrian | 46 | 0.1% |
| Ukrainian | 40 | 0.0% |
| Uruguayan | 20 | 0.0% |
| Venezuelan | 196 | 0.2% |
| Welsh | 320 | 0.4% |
| Yuman | 25 | 0.0% | View All 87 Rows |
Immigrants in Rockingham County
The most numerous immigrant groups reported in Rockingham County came from Latin America (2,737 | 3.0%), Central America (2,448 | 2.7%), Mexico (2,090 | 2.3%), Asia (598 | 0.7%), and South Eastern Asia (451 | 0.5%), together accounting for 9.1% of all Rockingham County residents.
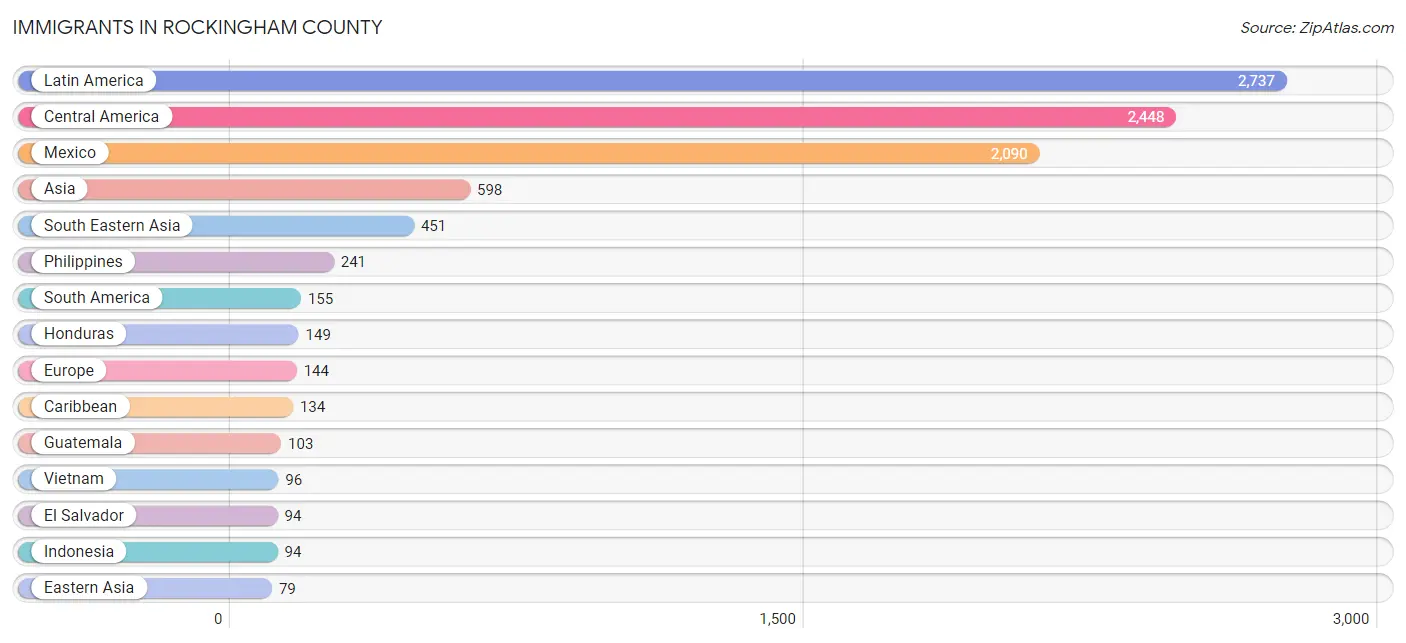
| Immigration Origin | # Population | % Population |
| Africa | 70 | 0.1% |
| Asia | 598 | 0.7% |
| Brazil | 9 | 0.0% |
| Canada | 13 | 0.0% |
| Caribbean | 134 | 0.2% |
| Central America | 2,448 | 2.7% |
| China | 75 | 0.1% |
| Colombia | 14 | 0.0% |
| Costa Rica | 4 | 0.0% |
| Cuba | 39 | 0.0% |
| Dominican Republic | 35 | 0.0% |
| Eastern Africa | 1 | 0.0% |
| Eastern Asia | 79 | 0.1% |
| Eastern Europe | 8 | 0.0% |
| El Salvador | 94 | 0.1% |
| England | 47 | 0.1% |
| Europe | 144 | 0.2% |
| Germany | 20 | 0.0% |
| Guatemala | 103 | 0.1% |
| Guyana | 47 | 0.1% |
| Honduras | 149 | 0.2% |
| Hong Kong | 75 | 0.1% |
| Indonesia | 94 | 0.1% |
| Iran | 52 | 0.1% |
| Italy | 15 | 0.0% |
| Jamaica | 60 | 0.1% |
| Japan | 4 | 0.0% |
| Laos | 20 | 0.0% |
| Latin America | 2,737 | 3.0% |
| Lebanon | 16 | 0.0% |
| Mexico | 2,090 | 2.3% |
| Netherlands | 27 | 0.0% |
| Nicaragua | 8 | 0.0% |
| Nigeria | 17 | 0.0% |
| Northern Africa | 31 | 0.0% |
| Northern Europe | 59 | 0.1% |
| Norway | 6 | 0.0% |
| Philippines | 241 | 0.3% |
| Russia | 8 | 0.0% |
| Sierra Leone | 21 | 0.0% |
| South America | 155 | 0.2% |
| South Central Asia | 52 | 0.1% |
| South Eastern Asia | 451 | 0.5% |
| Southern Europe | 15 | 0.0% |
| Uruguay | 20 | 0.0% |
| Venezuela | 65 | 0.1% |
| Vietnam | 96 | 0.1% |
| Western Africa | 38 | 0.0% |
| Western Asia | 16 | 0.0% |
| Western Europe | 47 | 0.1% | View All 50 Rows |
Sex and Age in Rockingham County
Sex and Age in Rockingham County
The most populous age groups in Rockingham County are 60 to 64 Years (3,498 | 7.9%) for men and 55 to 59 Years (3,826 | 8.2%) for women.
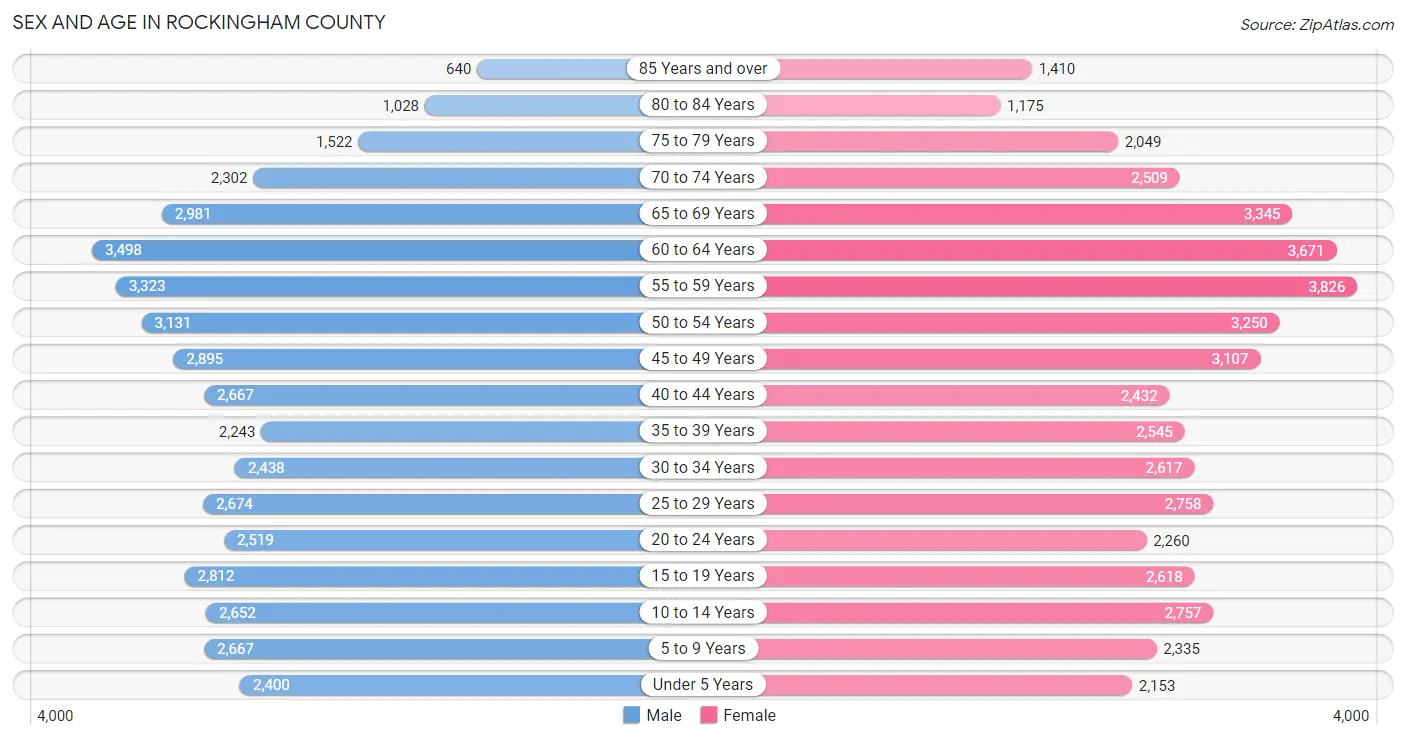
| Age Bracket | Male | Female |
| Under 5 Years | 2,400 (5.4%) | 2,153 (4.6%) |
| 5 to 9 Years | 2,667 (6.0%) | 2,335 (5.0%) |
| 10 to 14 Years | 2,652 (6.0%) | 2,757 (5.9%) |
| 15 to 19 Years | 2,812 (6.3%) | 2,618 (5.6%) |
| 20 to 24 Years | 2,519 (5.7%) | 2,260 (4.8%) |
| 25 to 29 Years | 2,674 (6.0%) | 2,758 (5.9%) |
| 30 to 34 Years | 2,438 (5.5%) | 2,617 (5.6%) |
| 35 to 39 Years | 2,243 (5.1%) | 2,545 (5.4%) |
| 40 to 44 Years | 2,667 (6.0%) | 2,432 (5.2%) |
| 45 to 49 Years | 2,895 (6.5%) | 3,107 (6.6%) |
| 50 to 54 Years | 3,131 (7.0%) | 3,250 (6.9%) |
| 55 to 59 Years | 3,323 (7.5%) | 3,826 (8.2%) |
| 60 to 64 Years | 3,498 (7.9%) | 3,671 (7.8%) |
| 65 to 69 Years | 2,981 (6.7%) | 3,345 (7.1%) |
| 70 to 74 Years | 2,302 (5.2%) | 2,509 (5.4%) |
| 75 to 79 Years | 1,522 (3.4%) | 2,049 (4.4%) |
| 80 to 84 Years | 1,028 (2.3%) | 1,175 (2.5%) |
| 85 Years and over | 640 (1.4%) | 1,410 (3.0%) |
| Total | 44,392 (100.0%) | 46,817 (100.0%) |
Families and Households in Rockingham County
Median Family Size in Rockingham County
The median family size in Rockingham County is 2.86 persons per family, with married-couple families (17,962 | 71.2%) accounting for the largest median family size of 2.9 persons per family. On the other hand, single male/father families (1,944 | 7.7%) represent the smallest median family size with 2.39 persons per family.
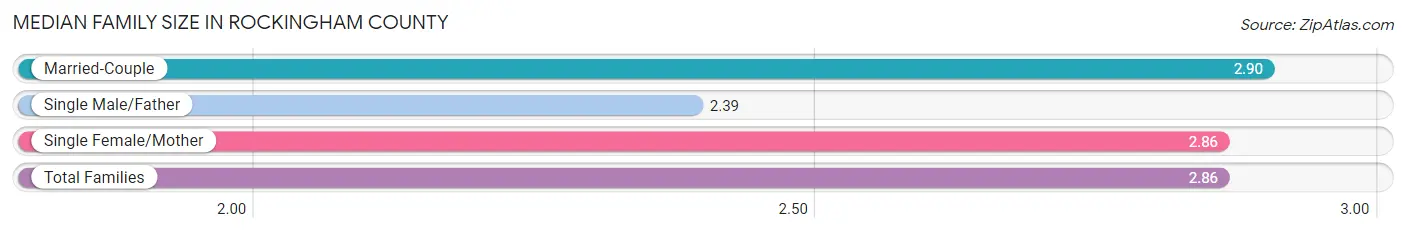
| Family Type | # Families | Family Size |
| Married-Couple | 17,962 (71.2%) | 2.90 |
| Single Male/Father | 1,944 (7.7%) | 2.39 |
| Single Female/Mother | 5,326 (21.1%) | 2.86 |
| Total Families | 25,232 (100.0%) | 2.86 |
Median Household Size in Rockingham County
The median household size in Rockingham County is 2.32 persons per household, with single female/mother households (5,326 | 13.8%) accounting for the largest median household size of 3.05 persons per household. non-family households (13,478 | 34.8%) represent the smallest median household size with 1.18 persons per household.
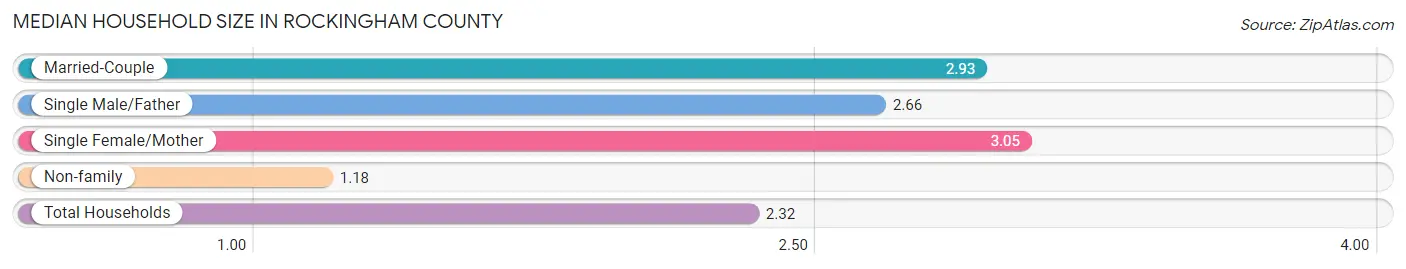
| Household Type | # Households | Household Size |
| Married-Couple | 17,962 (46.4%) | 2.93 |
| Single Male/Father | 1,944 (5.0%) | 2.66 |
| Single Female/Mother | 5,326 (13.8%) | 3.05 |
| Non-family | 13,478 (34.8%) | 1.18 |
| Total Households | 38,710 (100.0%) | 2.32 |
Household Size by Marriage Status in Rockingham County
Out of a total of 38,710 households in Rockingham County, 25,232 (65.2%) are family households, while 13,478 (34.8%) are nonfamily households. The most numerous type of family households are 2-person households, comprising 12,360, and the most common type of nonfamily households are 1-person households, comprising 11,918.
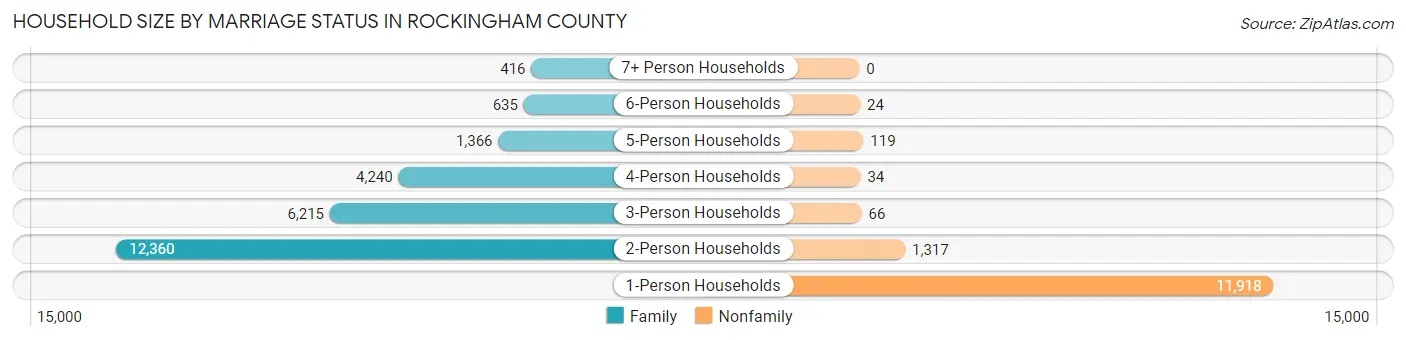
| Household Size | Family Households | Nonfamily Households |
| 1-Person Households | - | 11,918 (30.8%) |
| 2-Person Households | 12,360 (31.9%) | 1,317 (3.4%) |
| 3-Person Households | 6,215 (16.1%) | 66 (0.2%) |
| 4-Person Households | 4,240 (11.0%) | 34 (0.1%) |
| 5-Person Households | 1,366 (3.5%) | 119 (0.3%) |
| 6-Person Households | 635 (1.6%) | 24 (0.1%) |
| 7+ Person Households | 416 (1.1%) | 0 (0.0%) |
| Total | 25,232 (65.2%) | 13,478 (34.8%) |
Female Fertility in Rockingham County
Fertility by Age in Rockingham County
Average fertility rate in Rockingham County is 55.0 births per 1,000 women. Women in the age bracket of 20 to 34 years have the highest fertility rate with 119.0 births per 1,000 women. Women in the age bracket of 20 to 34 years acount for 85.3% of all women with births.
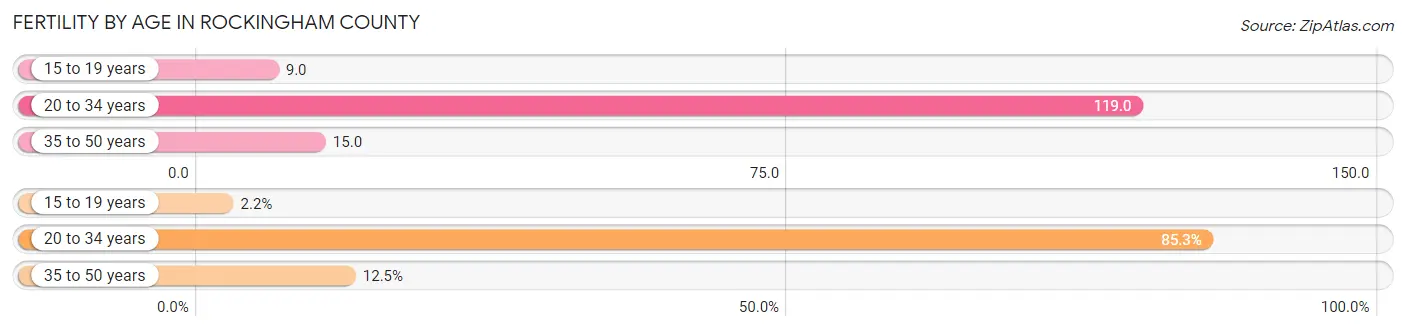
| Age Bracket | Women with Births | Births / 1,000 Women |
| 15 to 19 years | 23 (2.2%) | 9.0 |
| 20 to 34 years | 905 (85.3%) | 119.0 |
| 35 to 50 years | 133 (12.5%) | 15.0 |
| Total | 1,061 (100.0%) | 55.0 |
Fertility by Age by Marriage Status in Rockingham County
73.4% of women with births (1,061) in Rockingham County are married. The highest percentage of unmarried women with births falls into 15 to 19 years age bracket with 100.0% of them unmarried at the time of birth, while the lowest percentage of unmarried women with births belong to 35 to 50 years age bracket with 1.5% of them unmarried.
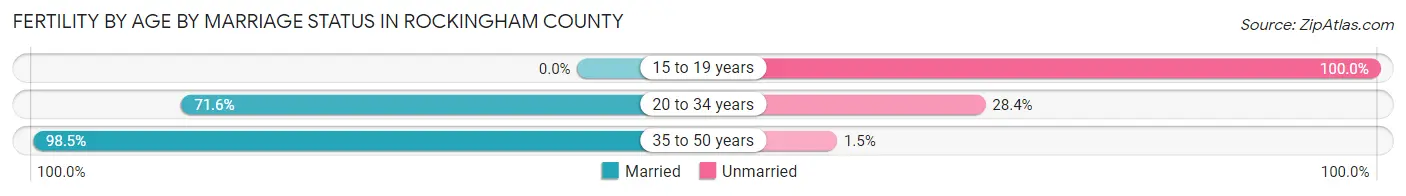
| Age Bracket | Married | Unmarried |
| 15 to 19 years | 0 (0.0%) | 23 (100.0%) |
| 20 to 34 years | 648 (71.6%) | 257 (28.4%) |
| 35 to 50 years | 131 (98.5%) | 2 (1.5%) |
| Total | 779 (73.4%) | 282 (26.6%) |
Fertility by Education in Rockingham County
Average fertility rate in Rockingham County is 55.0 births per 1,000 women. Women with the education attainment of bachelor's degree have the highest fertility rate of 96.0 births per 1,000 women, while women with the education attainment of less than high school have the lowest fertility at 14.0 births per 1,000 women. Women with the education attainment of college or associate's degree represent 45.8% of all women with births.
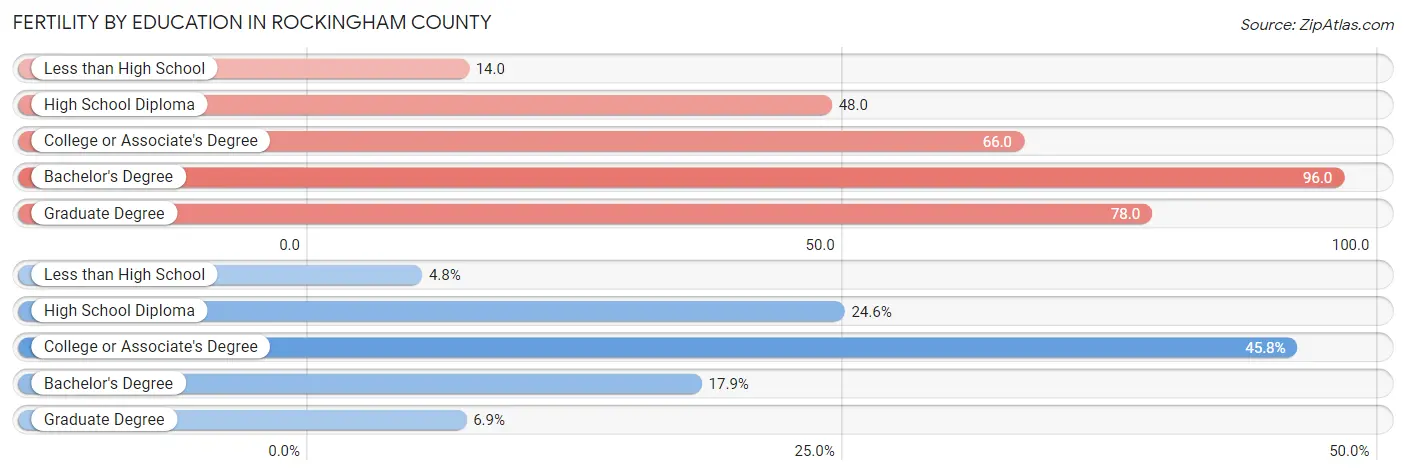
| Educational Attainment | Women with Births | Births / 1,000 Women |
| Less than High School | 51 (4.8%) | 14.0 |
| High School Diploma | 261 (24.6%) | 48.0 |
| College or Associate's Degree | 486 (45.8%) | 66.0 |
| Bachelor's Degree | 190 (17.9%) | 96.0 |
| Graduate Degree | 73 (6.9%) | 78.0 |
| Total | 1,061 (100.0%) | 55.0 |
Fertility by Education by Marriage Status in Rockingham County
26.6% of women with births in Rockingham County are unmarried. Women with the educational attainment of graduate degree are most likely to be married with 100.0% of them married at childbirth, while women with the educational attainment of less than high school are least likely to be married with 54.9% of them unmarried at childbirth.
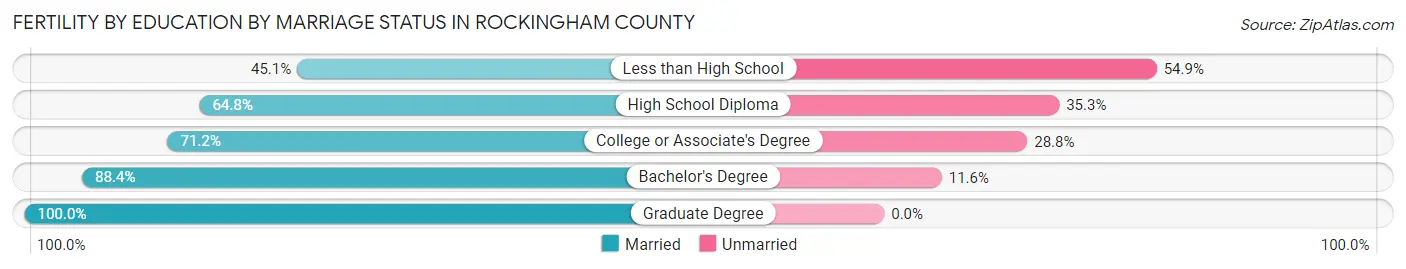
| Educational Attainment | Married | Unmarried |
| Less than High School | 23 (45.1%) | 28 (54.9%) |
| High School Diploma | 169 (64.7%) | 92 (35.2%) |
| College or Associate's Degree | 346 (71.2%) | 140 (28.8%) |
| Bachelor's Degree | 168 (88.4%) | 22 (11.6%) |
| Graduate Degree | 73 (100.0%) | 0 (0.0%) |
| Total | 779 (73.4%) | 282 (26.6%) |
Employment Characteristics in Rockingham County
Employment by Class of Employer in Rockingham County
Among the 38,800 employed individuals in Rockingham County, private company employees (28,044 | 72.3%), local government employees (2,464 | 6.4%), and not-for-profit organizations (2,326 | 6.0%) make up the most common classes of employment.
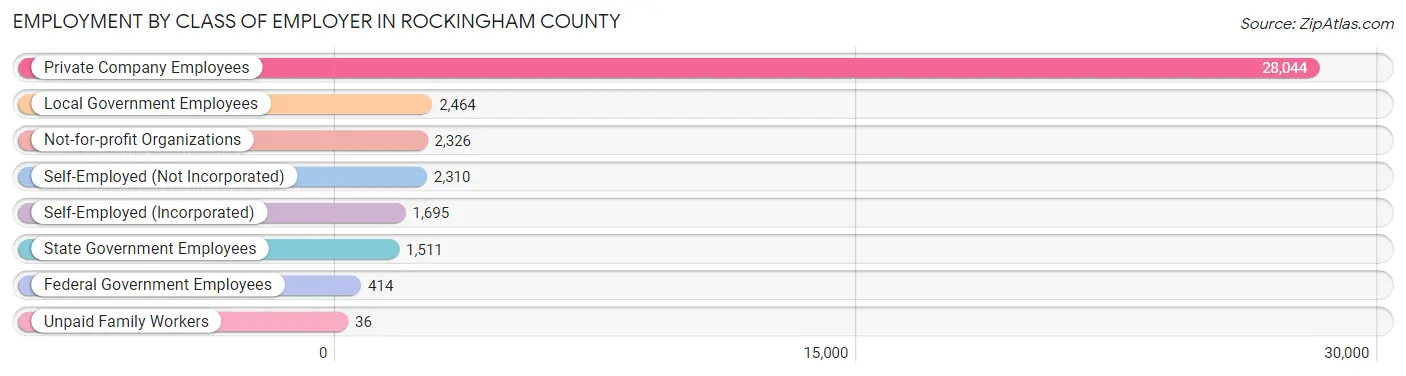
| Employer Class | # Employees | % Employees |
| Private Company Employees | 28,044 | 72.3% |
| Self-Employed (Incorporated) | 1,695 | 4.4% |
| Self-Employed (Not Incorporated) | 2,310 | 5.9% |
| Not-for-profit Organizations | 2,326 | 6.0% |
| Local Government Employees | 2,464 | 6.4% |
| State Government Employees | 1,511 | 3.9% |
| Federal Government Employees | 414 | 1.1% |
| Unpaid Family Workers | 36 | 0.1% |
| Total | 38,800 | 100.0% |
Employment Status by Age in Rockingham County
According to the labor force statistics for Rockingham County, out of the total population over 16 years of age (75,402), 56.0% or 42,225 individuals are in the labor force, with 6.5% or 2,745 of them unemployed. The age group with the highest labor force participation rate is 30 to 34 years, with 79.8% or 4,034 individuals in the labor force. Within the labor force, the 16 to 19 years age range has the highest percentage of unemployed individuals, with 18.6% or 283 of them being unemployed.
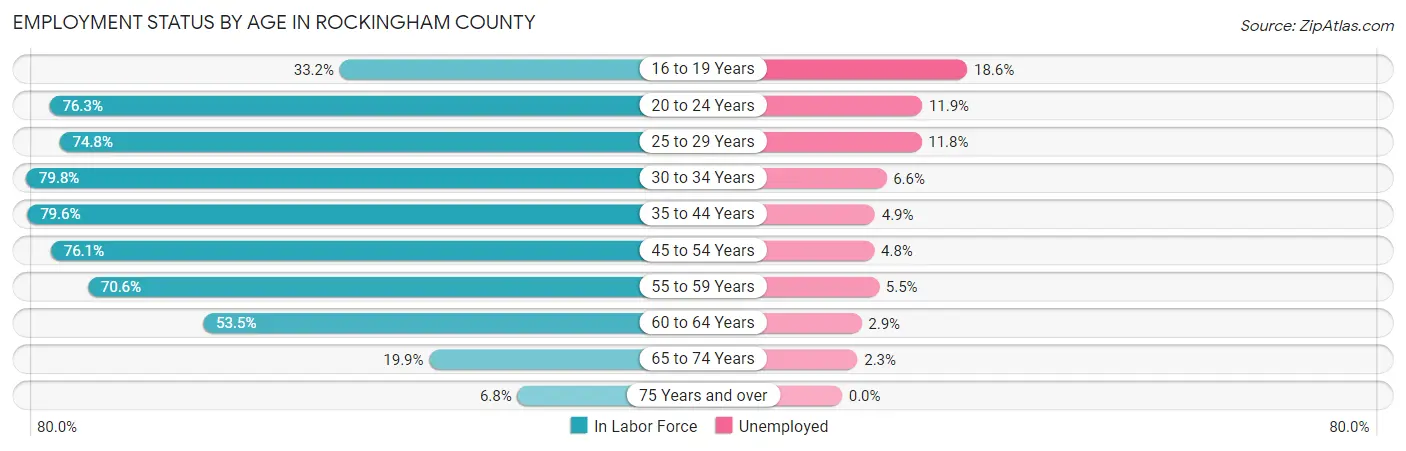
| Age Bracket | In Labor Force | Unemployed |
| 16 to 19 Years | 1,523 (33.2%) | 283 (18.6%) |
| 20 to 24 Years | 3,646 (76.3%) | 434 (11.9%) |
| 25 to 29 Years | 4,063 (74.8%) | 479 (11.8%) |
| 30 to 34 Years | 4,034 (79.8%) | 266 (6.6%) |
| 35 to 44 Years | 7,870 (79.6%) | 386 (4.9%) |
| 45 to 54 Years | 9,423 (76.1%) | 452 (4.8%) |
| 55 to 59 Years | 5,047 (70.6%) | 278 (5.5%) |
| 60 to 64 Years | 3,835 (53.5%) | 111 (2.9%) |
| 65 to 74 Years | 2,216 (19.9%) | 51 (2.3%) |
| 75 Years and over | 532 (6.8%) | 0 (0.0%) |
| Total | 42,225 (56.0%) | 2,745 (6.5%) |
Employment Status by Educational Attainment in Rockingham County
According to labor force statistics for Rockingham County, 72.8% of individuals (34,271) out of the total population between 25 and 64 years of age (47,075) are in the labor force, with 5.7% or 1,953 of them being unemployed. The group with the highest labor force participation rate are those with the educational attainment of bachelor's degree or higher, with 86.0% or 6,387 individuals in the labor force. Within the labor force, individuals with less than high school education have the highest percentage of unemployment, with 8.0% or 301 of them being unemployed.
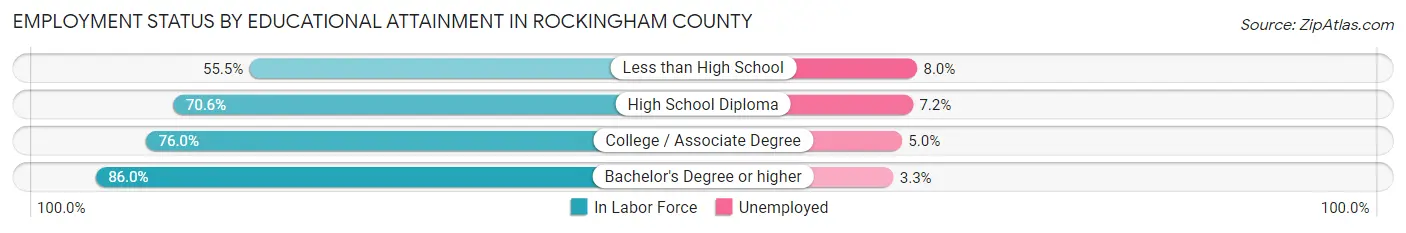
| Educational Attainment | In Labor Force | Unemployed |
| Less than High School | 3,761 (55.5%) | 542 (8.0%) |
| High School Diploma | 11,240 (70.6%) | 1,146 (7.2%) |
| College / Associate Degree | 12,884 (76.0%) | 848 (5.0%) |
| Bachelor's Degree or higher | 6,387 (86.0%) | 245 (3.3%) |
| Total | 34,271 (72.8%) | 2,683 (5.7%) |
Employment Occupations by Sex in Rockingham County
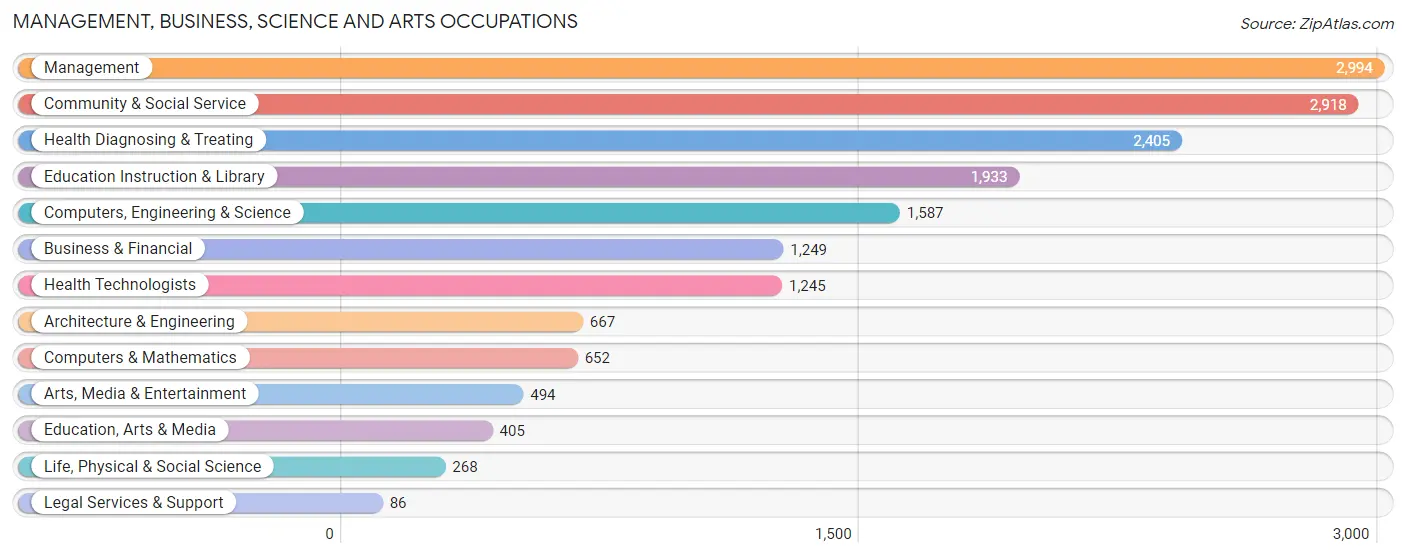
Management, Business, Science and Arts Occupations
The most common Management, Business, Science and Arts occupations in Rockingham County are Management (2,994 | 7.6%), Community & Social Service (2,918 | 7.4%), Health Diagnosing & Treating (2,405 | 6.1%), Education Instruction & Library (1,933 | 4.9%), and Computers, Engineering & Science (1,587 | 4.0%).
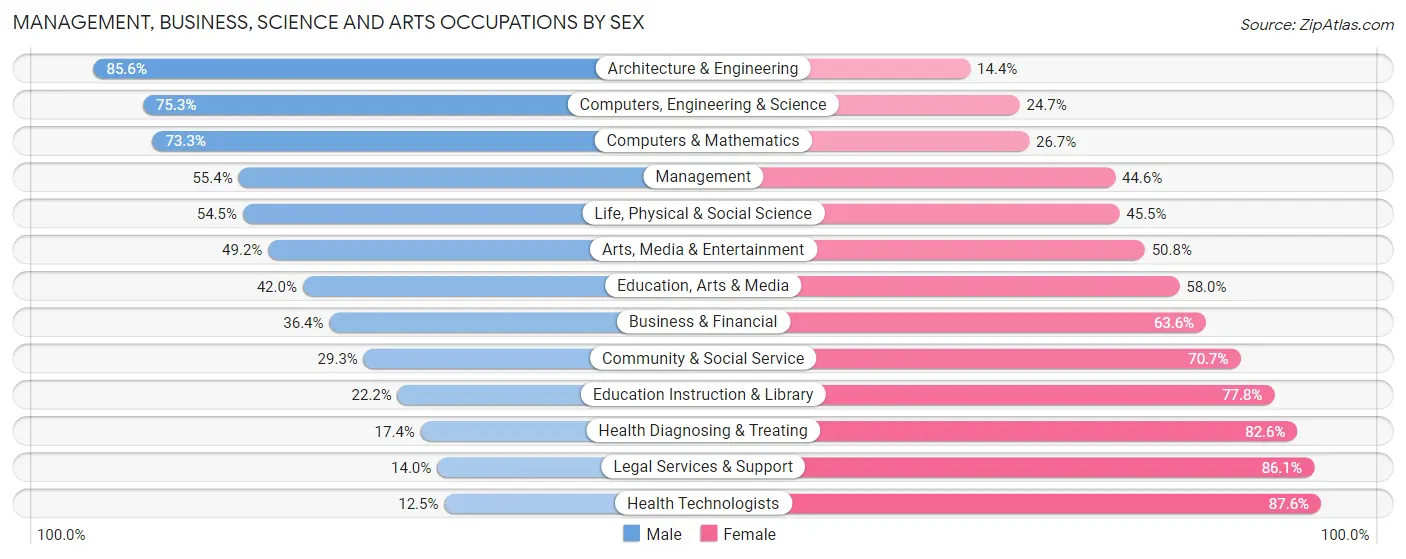
Management, Business, Science and Arts Occupations by Sex
Within the Management, Business, Science and Arts occupations in Rockingham County, the most male-oriented occupations are Architecture & Engineering (85.6%), Computers, Engineering & Science (75.3%), and Computers & Mathematics (73.3%), while the most female-oriented occupations are Health Technologists (87.5%), Legal Services & Support (86.1%), and Health Diagnosing & Treating (82.6%).
| Occupation | Male | Female |
| Management | 1,658 (55.4%) | 1,336 (44.6%) |
| Business & Financial | 455 (36.4%) | 794 (63.6%) |
| Computers, Engineering & Science | 1,195 (75.3%) | 392 (24.7%) |
| Computers & Mathematics | 478 (73.3%) | 174 (26.7%) |
| Architecture & Engineering | 571 (85.6%) | 96 (14.4%) |
| Life, Physical & Social Science | 146 (54.5%) | 122 (45.5%) |
| Community & Social Service | 854 (29.3%) | 2,064 (70.7%) |
| Education, Arts & Media | 170 (42.0%) | 235 (58.0%) |
| Legal Services & Support | 12 (14.0%) | 74 (86.1%) |
| Education Instruction & Library | 429 (22.2%) | 1,504 (77.8%) |
| Arts, Media & Entertainment | 243 (49.2%) | 251 (50.8%) |
| Health Diagnosing & Treating | 418 (17.4%) | 1,987 (82.6%) |
| Health Technologists | 155 (12.4%) | 1,090 (87.5%) |
| Total (Category) | 4,580 (41.1%) | 6,573 (58.9%) |
| Total (Overall) | 20,508 (52.0%) | 18,910 (48.0%) |
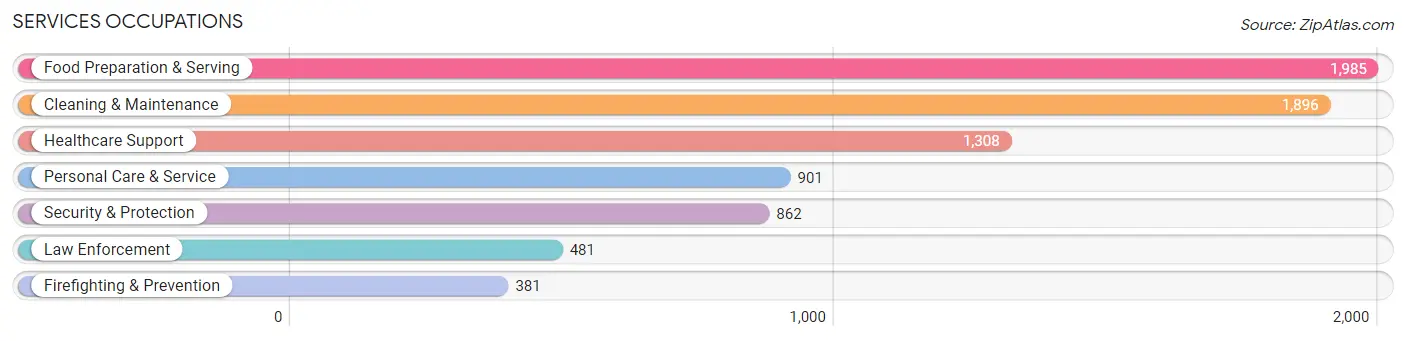
Services Occupations
The most common Services occupations in Rockingham County are Food Preparation & Serving (1,985 | 5.0%), Cleaning & Maintenance (1,896 | 4.8%), Healthcare Support (1,308 | 3.3%), Personal Care & Service (901 | 2.3%), and Security & Protection (862 | 2.2%).
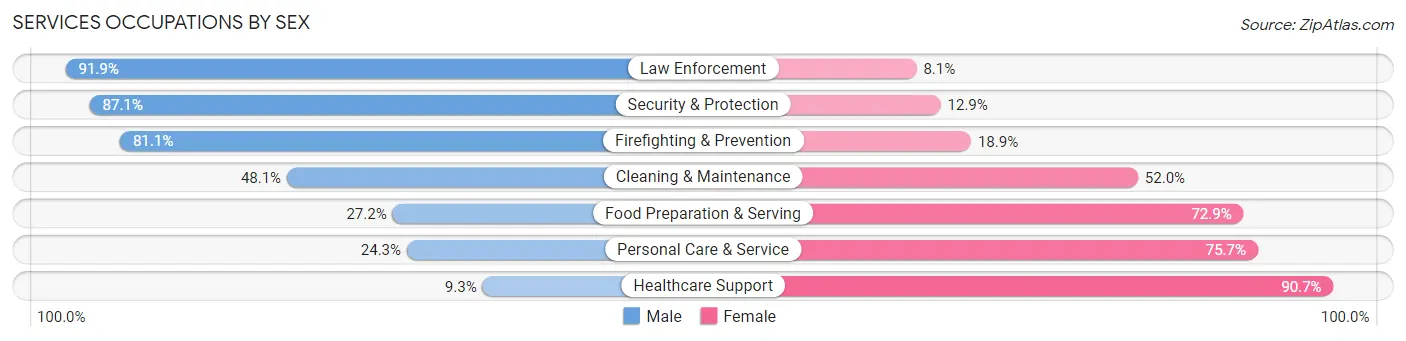
Services Occupations by Sex
Within the Services occupations in Rockingham County, the most male-oriented occupations are Law Enforcement (91.9%), Security & Protection (87.1%), and Firefighting & Prevention (81.1%), while the most female-oriented occupations are Healthcare Support (90.7%), Personal Care & Service (75.7%), and Food Preparation & Serving (72.9%).
| Occupation | Male | Female |
| Healthcare Support | 122 (9.3%) | 1,186 (90.7%) |
| Security & Protection | 751 (87.1%) | 111 (12.9%) |
| Firefighting & Prevention | 309 (81.1%) | 72 (18.9%) |
| Law Enforcement | 442 (91.9%) | 39 (8.1%) |
| Food Preparation & Serving | 539 (27.2%) | 1,446 (72.9%) |
| Cleaning & Maintenance | 911 (48.0%) | 985 (51.9%) |
| Personal Care & Service | 219 (24.3%) | 682 (75.7%) |
| Total (Category) | 2,542 (36.6%) | 4,410 (63.4%) |
| Total (Overall) | 20,508 (52.0%) | 18,910 (48.0%) |
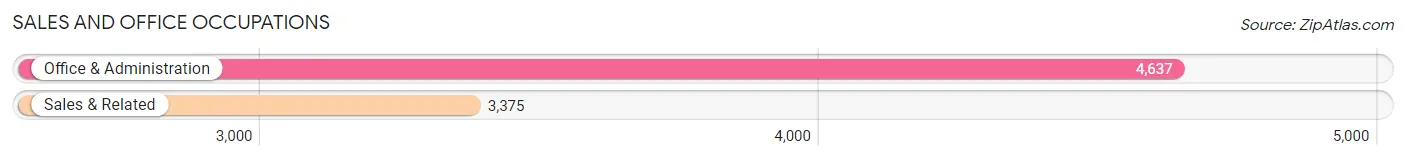
Sales and Office Occupations
The most common Sales and Office occupations in Rockingham County are Office & Administration (4,637 | 11.8%), and Sales & Related (3,375 | 8.6%).
Sales and Office Occupations by Sex
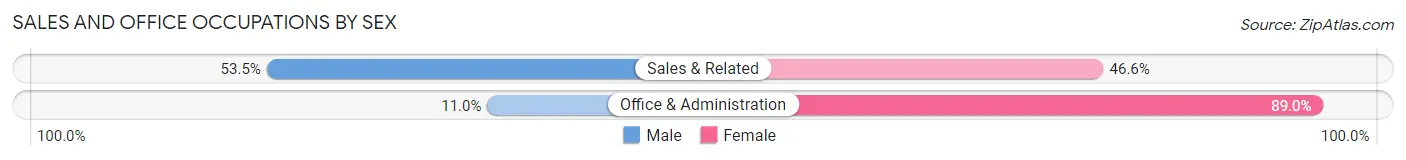
| Occupation | Male | Female |
| Sales & Related | 1,804 (53.4%) | 1,571 (46.6%) |
| Office & Administration | 511 (11.0%) | 4,126 (89.0%) |
| Total (Category) | 2,315 (28.9%) | 5,697 (71.1%) |
| Total (Overall) | 20,508 (52.0%) | 18,910 (48.0%) |
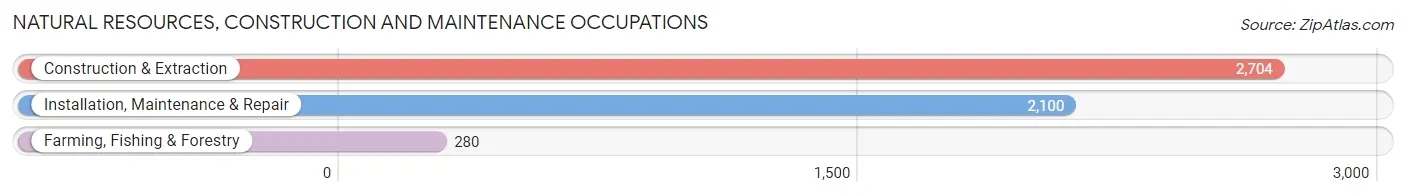
Natural Resources, Construction and Maintenance Occupations
The most common Natural Resources, Construction and Maintenance occupations in Rockingham County are Construction & Extraction (2,704 | 6.9%), Installation, Maintenance & Repair (2,100 | 5.3%), and Farming, Fishing & Forestry (280 | 0.7%).
Natural Resources, Construction and Maintenance Occupations by Sex
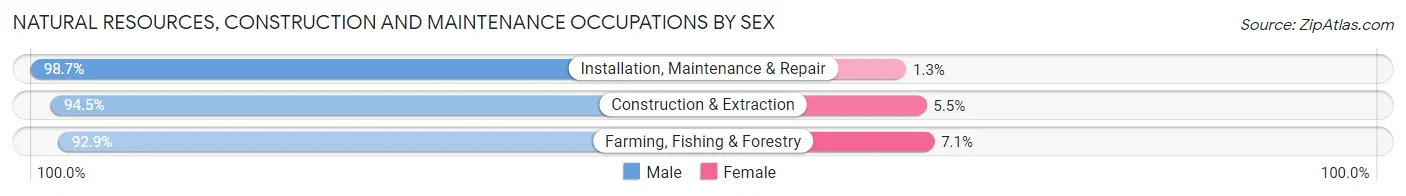
| Occupation | Male | Female |
| Farming, Fishing & Forestry | 260 (92.9%) | 20 (7.1%) |
| Construction & Extraction | 2,555 (94.5%) | 149 (5.5%) |
| Installation, Maintenance & Repair | 2,073 (98.7%) | 27 (1.3%) |
| Total (Category) | 4,888 (96.1%) | 196 (3.9%) |
| Total (Overall) | 20,508 (52.0%) | 18,910 (48.0%) |
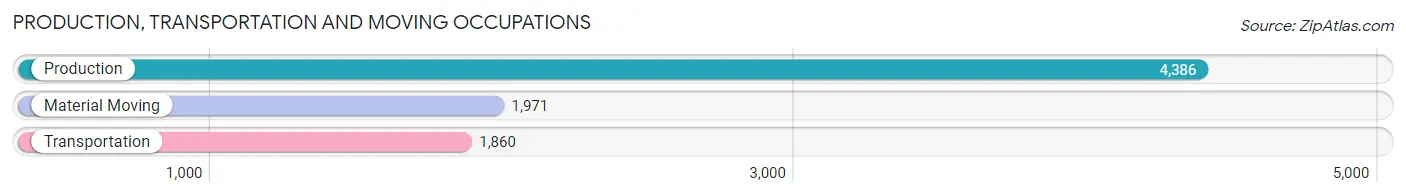
Production, Transportation and Moving Occupations
The most common Production, Transportation and Moving occupations in Rockingham County are Production (4,386 | 11.1%), Material Moving (1,971 | 5.0%), and Transportation (1,860 | 4.7%).
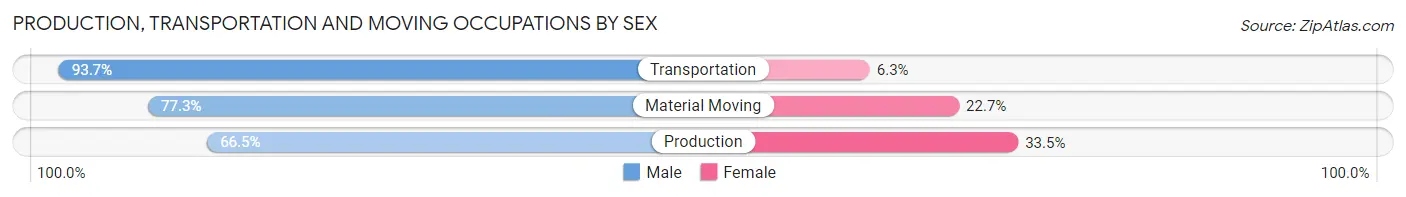
Production, Transportation and Moving Occupations by Sex
| Occupation | Male | Female |
| Production | 2,916 (66.5%) | 1,470 (33.5%) |
| Transportation | 1,743 (93.7%) | 117 (6.3%) |
| Material Moving | 1,524 (77.3%) | 447 (22.7%) |
| Total (Category) | 6,183 (75.2%) | 2,034 (24.7%) |
| Total (Overall) | 20,508 (52.0%) | 18,910 (48.0%) |
Employment Industries by Sex in Rockingham County
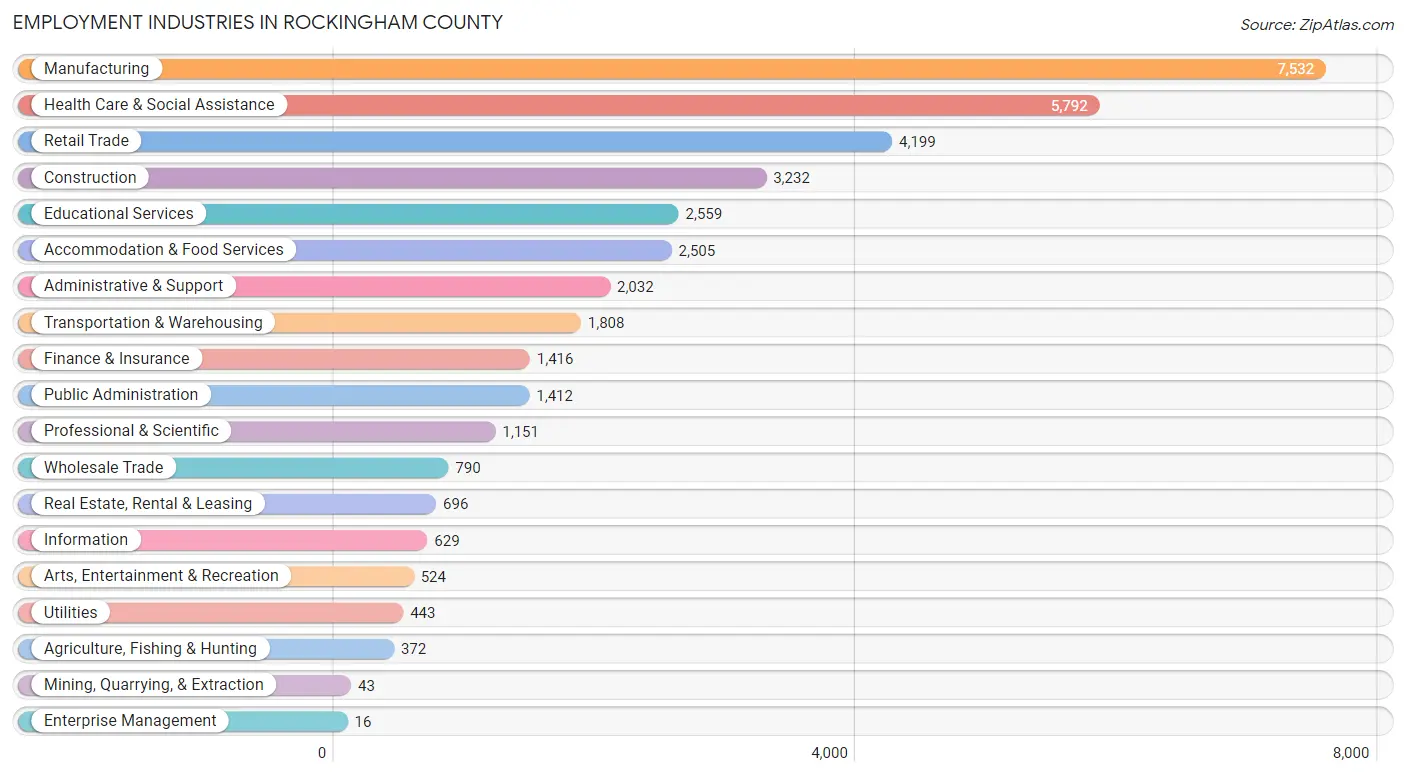
Employment Industries in Rockingham County
The major employment industries in Rockingham County include Manufacturing (7,532 | 19.1%), Health Care & Social Assistance (5,792 | 14.7%), Retail Trade (4,199 | 10.6%), Construction (3,232 | 8.2%), and Educational Services (2,559 | 6.5%).
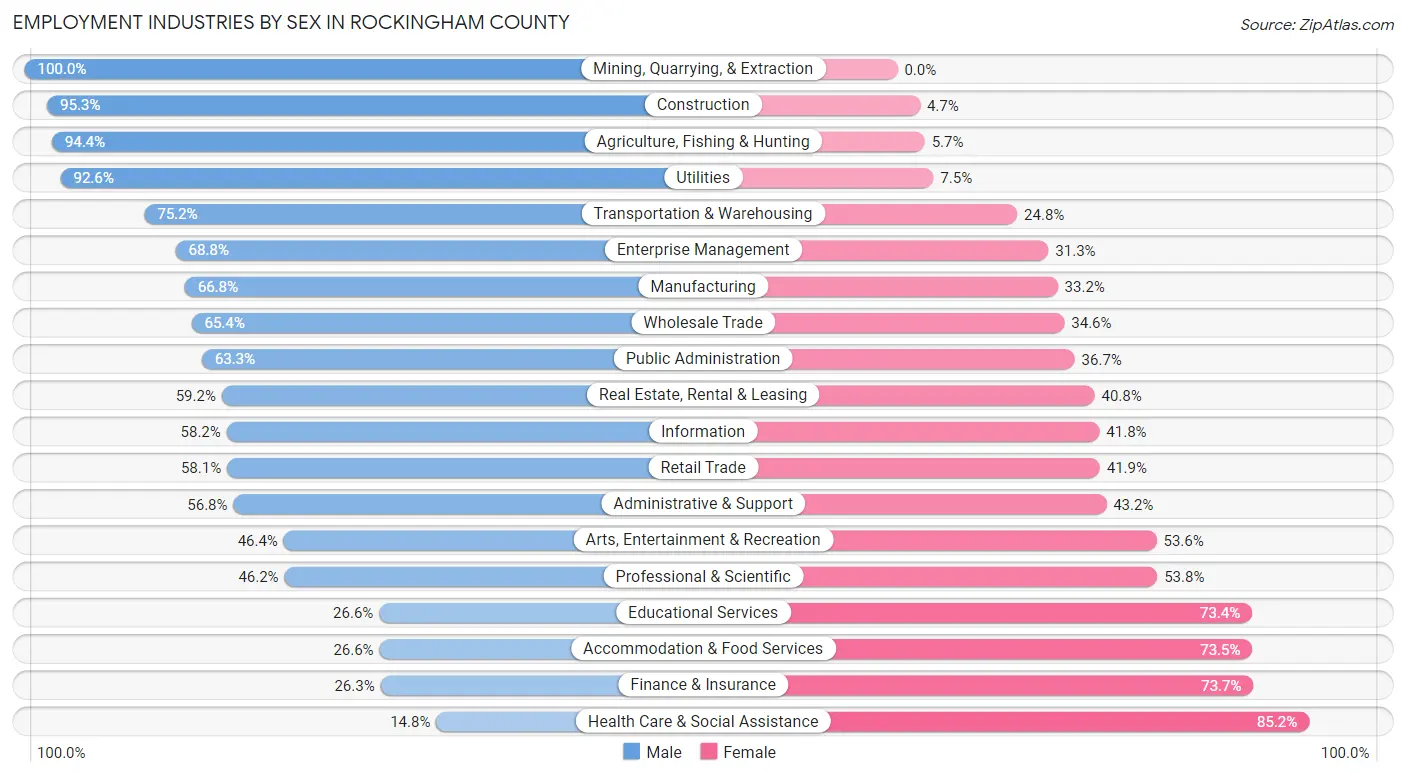
Employment Industries by Sex in Rockingham County
The Rockingham County industries that see more men than women are Mining, Quarrying, & Extraction (100.0%), Construction (95.3%), and Agriculture, Fishing & Hunting (94.4%), whereas the industries that tend to have a higher number of women are Health Care & Social Assistance (85.2%), Finance & Insurance (73.7%), and Accommodation & Food Services (73.5%).
| Industry | Male | Female |
| Agriculture, Fishing & Hunting | 351 (94.4%) | 21 (5.7%) |
| Mining, Quarrying, & Extraction | 43 (100.0%) | 0 (0.0%) |
| Construction | 3,081 (95.3%) | 151 (4.7%) |
| Manufacturing | 5,034 (66.8%) | 2,498 (33.2%) |
| Wholesale Trade | 517 (65.4%) | 273 (34.6%) |
| Retail Trade | 2,440 (58.1%) | 1,759 (41.9%) |
| Transportation & Warehousing | 1,360 (75.2%) | 448 (24.8%) |
| Utilities | 410 (92.5%) | 33 (7.4%) |
| Information | 366 (58.2%) | 263 (41.8%) |
| Finance & Insurance | 373 (26.3%) | 1,043 (73.7%) |
| Real Estate, Rental & Leasing | 412 (59.2%) | 284 (40.8%) |
| Professional & Scientific | 532 (46.2%) | 619 (53.8%) |
| Enterprise Management | 11 (68.8%) | 5 (31.2%) |
| Administrative & Support | 1,154 (56.8%) | 878 (43.2%) |
| Educational Services | 681 (26.6%) | 1,878 (73.4%) |
| Health Care & Social Assistance | 857 (14.8%) | 4,935 (85.2%) |
| Arts, Entertainment & Recreation | 243 (46.4%) | 281 (53.6%) |
| Accommodation & Food Services | 665 (26.6%) | 1,840 (73.5%) |
| Public Administration | 894 (63.3%) | 518 (36.7%) |
| Total | 20,508 (52.0%) | 18,910 (48.0%) |
Education in Rockingham County
School Enrollment in Rockingham County
The most common levels of schooling among the 18,613 students in Rockingham County are high school (4,692 | 25.2%), middle school (4,489 | 24.1%), and elementary school (3,910 | 21.0%).
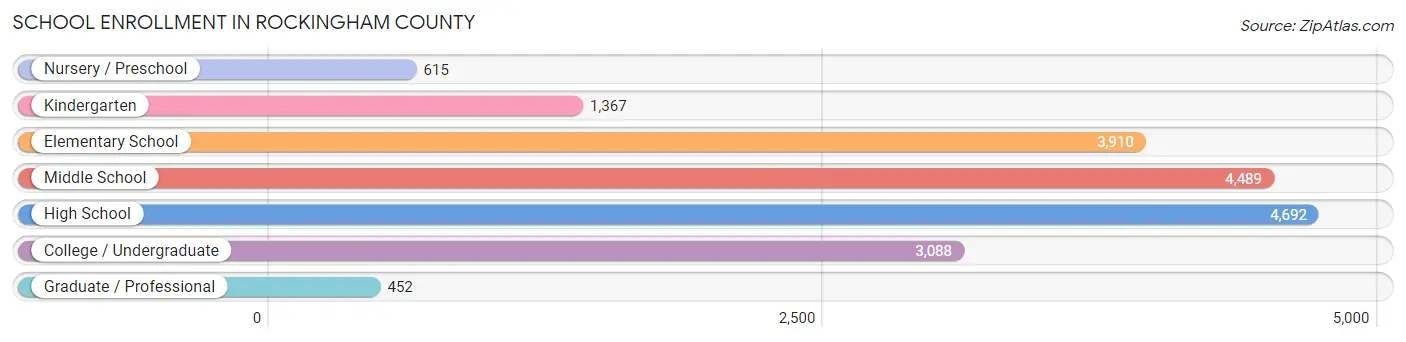
| School Level | # Students | % Students |
| Nursery / Preschool | 615 | 3.3% |
| Kindergarten | 1,367 | 7.3% |
| Elementary School | 3,910 | 21.0% |
| Middle School | 4,489 | 24.1% |
| High School | 4,692 | 25.2% |
| College / Undergraduate | 3,088 | 16.6% |
| Graduate / Professional | 452 | 2.4% |
| Total | 18,613 | 100.0% |
School Enrollment by Age by Funding Source in Rockingham County
Out of a total of 18,613 students who are enrolled in schools in Rockingham County, 2,122 (11.4%) attend a private institution, while the remaining 16,491 (88.6%) are enrolled in public schools. The age group of 3 to 4 year olds has the highest likelihood of being enrolled in private schools, with 136 (22.4% in the age bracket) enrolled. Conversely, the age group of 18 to 19 year olds has the lowest likelihood of being enrolled in a private school, with 1,256 (93.8% in the age bracket) attending a public institution.
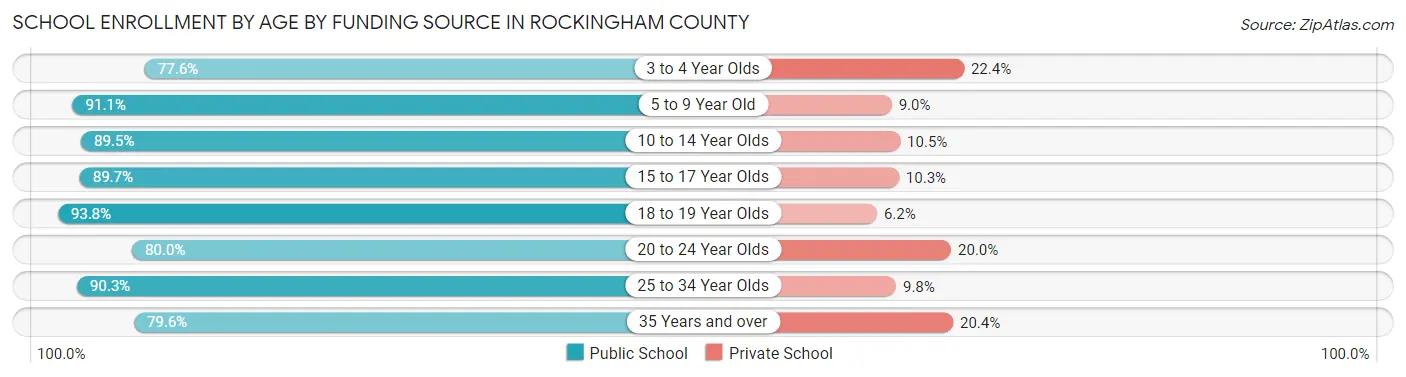
| Age Bracket | Public School | Private School |
| 3 to 4 Year Olds | 471 (77.6%) | 136 (22.4%) |
| 5 to 9 Year Old | 4,386 (91.0%) | 431 (8.9%) |
| 10 to 14 Year Olds | 4,780 (89.5%) | 562 (10.5%) |
| 15 to 17 Year Olds | 2,885 (89.7%) | 331 (10.3%) |
| 18 to 19 Year Olds | 1,256 (93.8%) | 83 (6.2%) |
| 20 to 24 Year Olds | 1,183 (80.0%) | 296 (20.0%) |
| 25 to 34 Year Olds | 759 (90.2%) | 82 (9.8%) |
| 35 Years and over | 774 (79.6%) | 198 (20.4%) |
| Total | 16,491 (88.6%) | 2,122 (11.4%) |
Educational Attainment by Field of Study in Rockingham County
Education (1,804 | 16.2%), business (1,692 | 15.2%), science & technology (1,311 | 11.8%), arts & humanities (1,003 | 9.0%), and liberal arts & history (808 | 7.2%) are the most common fields of study among 11,141 individuals in Rockingham County who have obtained a bachelor's degree or higher.
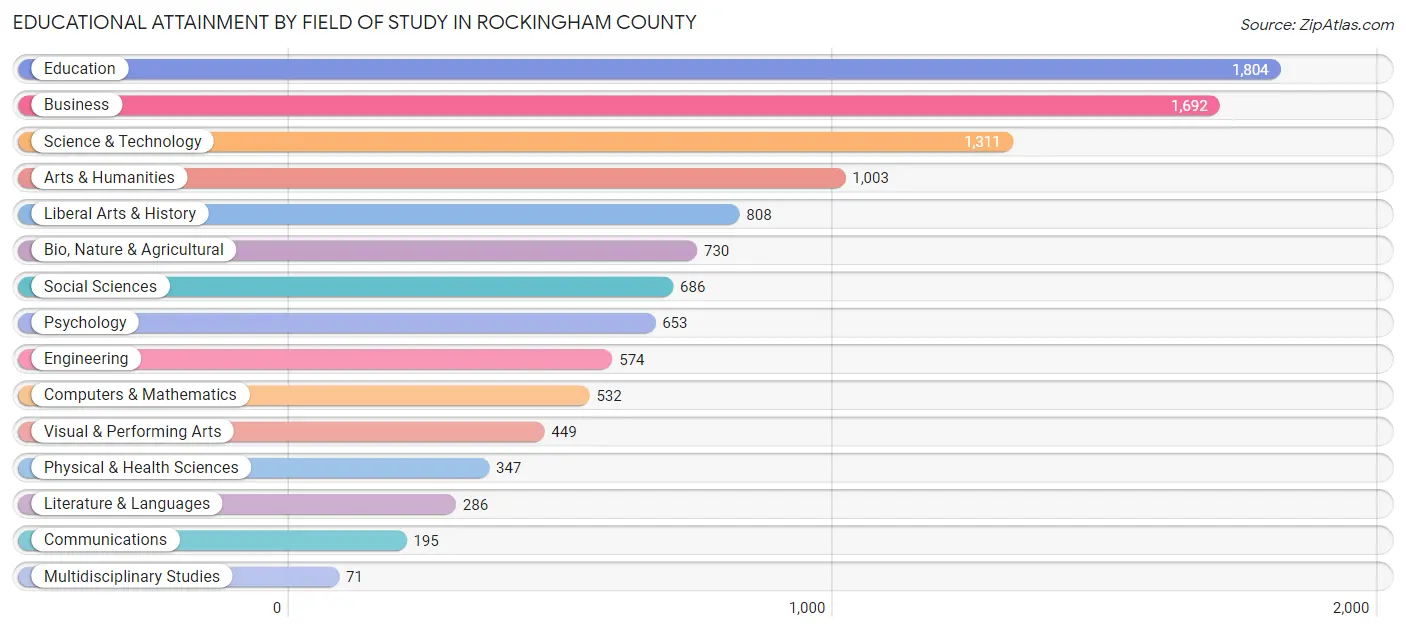
| Field of Study | # Graduates | % Graduates |
| Computers & Mathematics | 532 | 4.8% |
| Bio, Nature & Agricultural | 730 | 6.6% |
| Physical & Health Sciences | 347 | 3.1% |
| Psychology | 653 | 5.9% |
| Social Sciences | 686 | 6.2% |
| Engineering | 574 | 5.1% |
| Multidisciplinary Studies | 71 | 0.6% |
| Science & Technology | 1,311 | 11.8% |
| Business | 1,692 | 15.2% |
| Education | 1,804 | 16.2% |
| Literature & Languages | 286 | 2.6% |
| Liberal Arts & History | 808 | 7.2% |
| Visual & Performing Arts | 449 | 4.0% |
| Communications | 195 | 1.8% |
| Arts & Humanities | 1,003 | 9.0% |
| Total | 11,141 | 100.0% |
Transportation & Commute in Rockingham County
Vehicle Availability by Sex in Rockingham County
The most prevalent vehicle ownership categories in Rockingham County are males with 2 vehicles (7,110, accounting for 35.2%) and females with 2 vehicles (5,845, making up 38.4%).
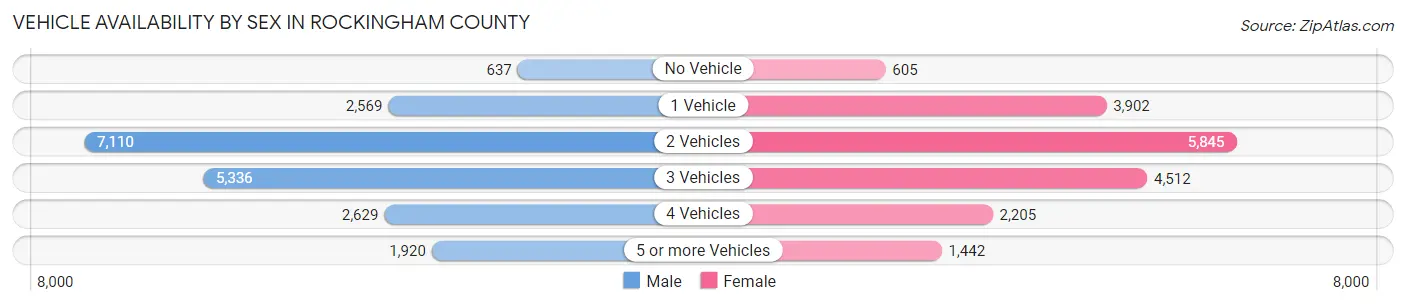
| Vehicles Available | Male | Female |
| No Vehicle | 637 (3.2%) | 605 (3.3%) |
| 1 Vehicle | 2,569 (12.7%) | 3,902 (21.1%) |
| 2 Vehicles | 7,110 (35.2%) | 5,845 (31.6%) |
| 3 Vehicles | 5,336 (26.4%) | 4,512 (24.4%) |
| 4 Vehicles | 2,629 (13.0%) | 2,205 (11.9%) |
| 5 or more Vehicles | 1,920 (9.5%) | 1,442 (7.8%) |
| Total | 20,201 (100.0%) | 18,511 (100.0%) |
Commute Time in Rockingham County
The most frequently occuring commute durations in Rockingham County are 30 to 34 minutes (5,139 commuters, 13.9%), 10 to 14 minutes (4,755 commuters, 12.8%), and 15 to 19 minutes (4,470 commuters, 12.1%).
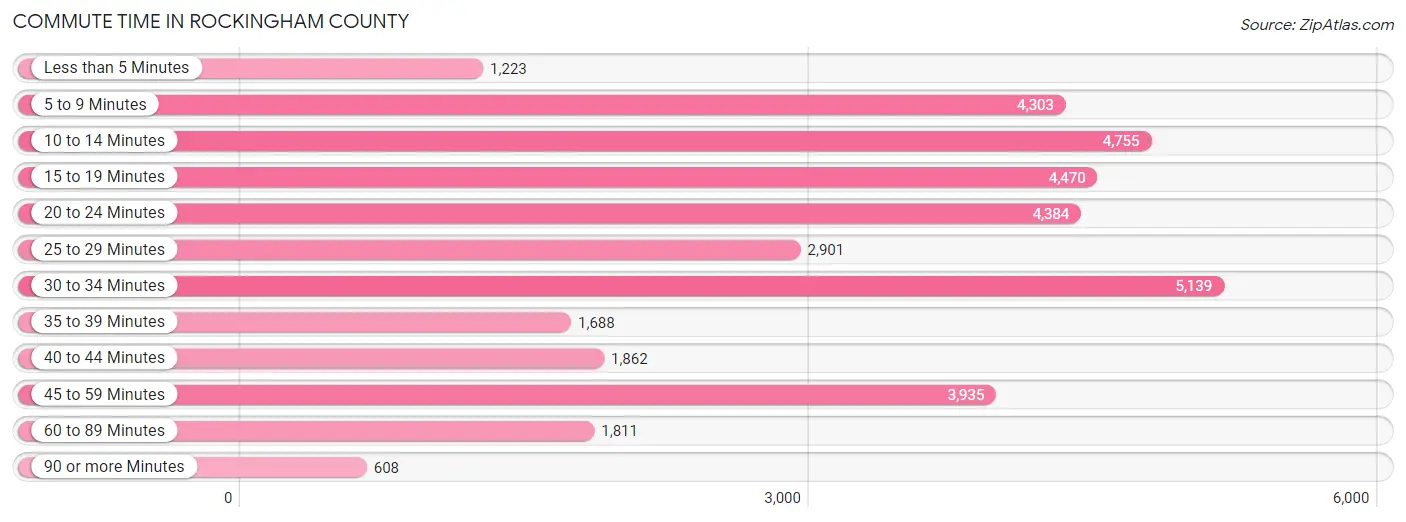
| Commute Time | # Commuters | % Commuters |
| Less than 5 Minutes | 1,223 | 3.3% |
| 5 to 9 Minutes | 4,303 | 11.6% |
| 10 to 14 Minutes | 4,755 | 12.8% |
| 15 to 19 Minutes | 4,470 | 12.1% |
| 20 to 24 Minutes | 4,384 | 11.8% |
| 25 to 29 Minutes | 2,901 | 7.8% |
| 30 to 34 Minutes | 5,139 | 13.9% |
| 35 to 39 Minutes | 1,688 | 4.5% |
| 40 to 44 Minutes | 1,862 | 5.0% |
| 45 to 59 Minutes | 3,935 | 10.6% |
| 60 to 89 Minutes | 1,811 | 4.9% |
| 90 or more Minutes | 608 | 1.6% |
Commute Time by Sex in Rockingham County
The most common commute times in Rockingham County are 15 to 19 minutes (2,843 commuters, 14.5%) for males and 10 to 14 minutes (2,591 commuters, 14.8%) for females.
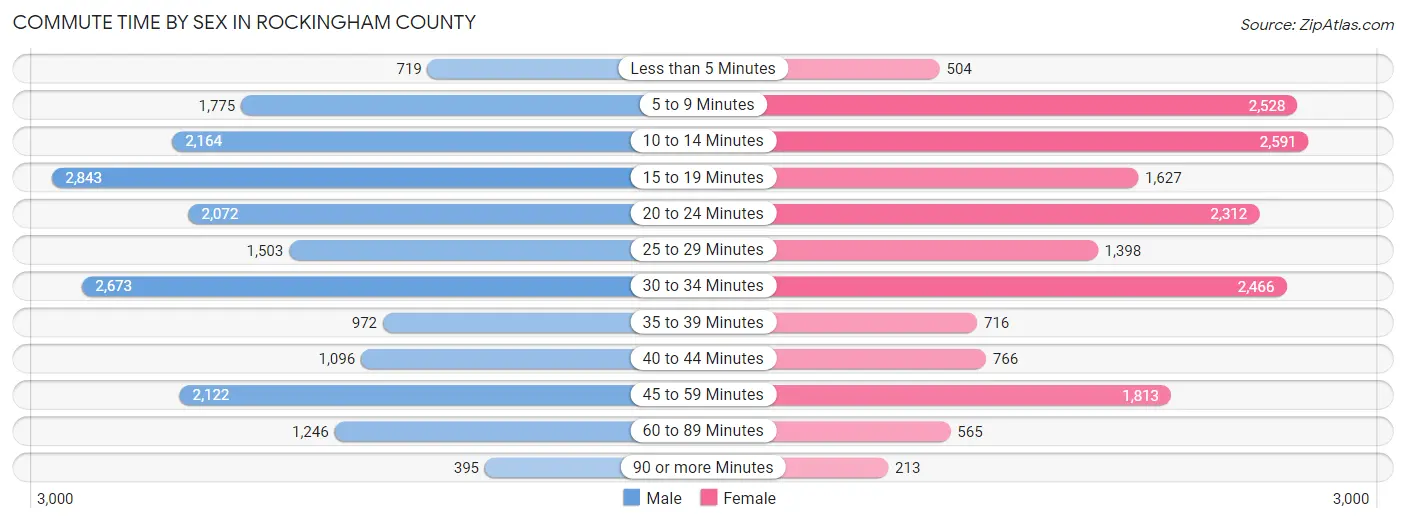
| Commute Time | Male | Female |
| Less than 5 Minutes | 719 (3.7%) | 504 (2.9%) |
| 5 to 9 Minutes | 1,775 (9.1%) | 2,528 (14.4%) |
| 10 to 14 Minutes | 2,164 (11.1%) | 2,591 (14.8%) |
| 15 to 19 Minutes | 2,843 (14.5%) | 1,627 (9.3%) |
| 20 to 24 Minutes | 2,072 (10.6%) | 2,312 (13.2%) |
| 25 to 29 Minutes | 1,503 (7.7%) | 1,398 (8.0%) |
| 30 to 34 Minutes | 2,673 (13.7%) | 2,466 (14.1%) |
| 35 to 39 Minutes | 972 (5.0%) | 716 (4.1%) |
| 40 to 44 Minutes | 1,096 (5.6%) | 766 (4.4%) |
| 45 to 59 Minutes | 2,122 (10.8%) | 1,813 (10.4%) |
| 60 to 89 Minutes | 1,246 (6.4%) | 565 (3.2%) |
| 90 or more Minutes | 395 (2.0%) | 213 (1.2%) |
Time of Departure to Work by Sex in Rockingham County
The most frequent times of departure to work in Rockingham County are 6:30 AM to 6:59 AM (2,724, 13.9%) for males and 7:00 AM to 7:29 AM (3,128, 17.9%) for females.
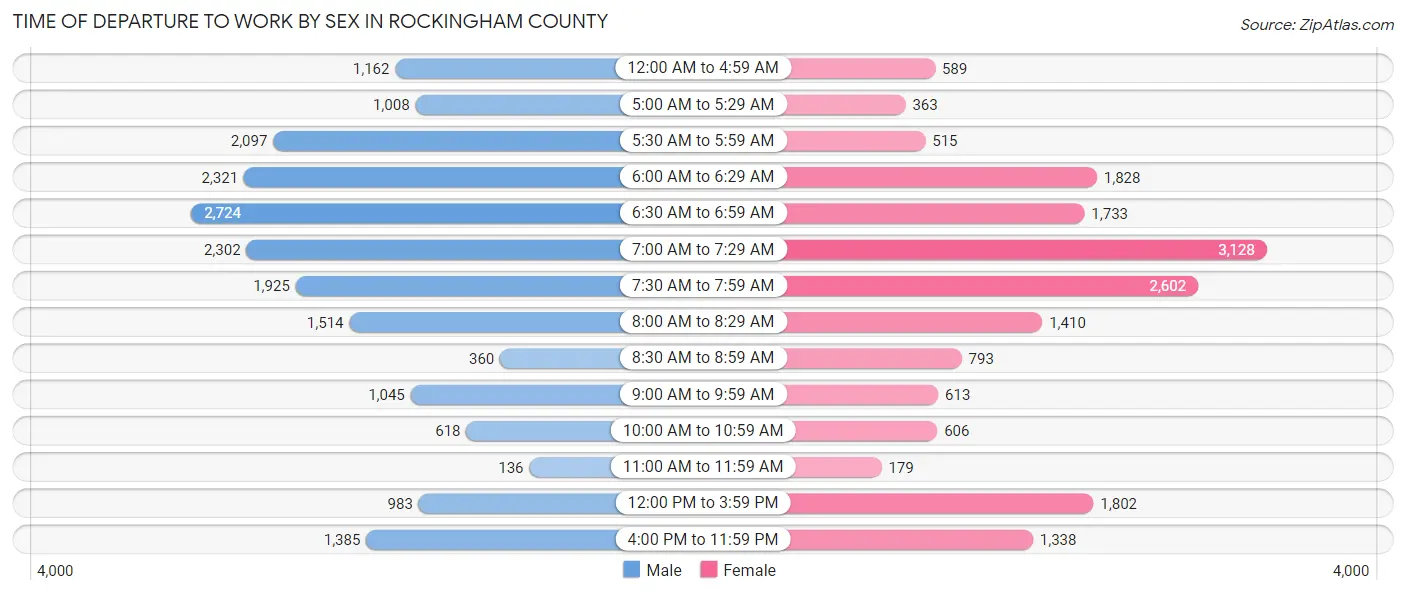
| Time of Departure | Male | Female |
| 12:00 AM to 4:59 AM | 1,162 (5.9%) | 589 (3.4%) |
| 5:00 AM to 5:29 AM | 1,008 (5.1%) | 363 (2.1%) |
| 5:30 AM to 5:59 AM | 2,097 (10.7%) | 515 (2.9%) |
| 6:00 AM to 6:29 AM | 2,321 (11.8%) | 1,828 (10.4%) |
| 6:30 AM to 6:59 AM | 2,724 (13.9%) | 1,733 (9.9%) |
| 7:00 AM to 7:29 AM | 2,302 (11.8%) | 3,128 (17.9%) |
| 7:30 AM to 7:59 AM | 1,925 (9.8%) | 2,602 (14.9%) |
| 8:00 AM to 8:29 AM | 1,514 (7.7%) | 1,410 (8.1%) |
| 8:30 AM to 8:59 AM | 360 (1.8%) | 793 (4.5%) |
| 9:00 AM to 9:59 AM | 1,045 (5.3%) | 613 (3.5%) |
| 10:00 AM to 10:59 AM | 618 (3.2%) | 606 (3.5%) |
| 11:00 AM to 11:59 AM | 136 (0.7%) | 179 (1.0%) |
| 12:00 PM to 3:59 PM | 983 (5.0%) | 1,802 (10.3%) |
| 4:00 PM to 11:59 PM | 1,385 (7.1%) | 1,338 (7.6%) |
| Total | 19,580 (100.0%) | 17,499 (100.0%) |
Housing Occupancy in Rockingham County
Occupancy by Ownership in Rockingham County
Of the total 38,710 dwellings in Rockingham County, owner-occupied units account for 27,615 (71.3%), while renter-occupied units make up 11,095 (28.7%).
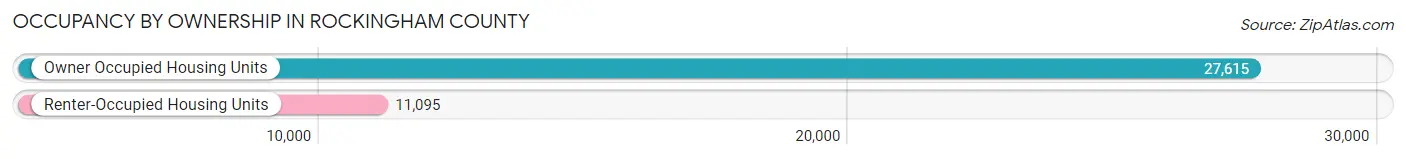
| Occupancy | # Housing Units | % Housing Units |
| Owner Occupied Housing Units | 27,615 | 71.3% |
| Renter-Occupied Housing Units | 11,095 | 28.7% |
| Total Occupied Housing Units | 38,710 | 100.0% |
Occupancy by Household Size in Rockingham County
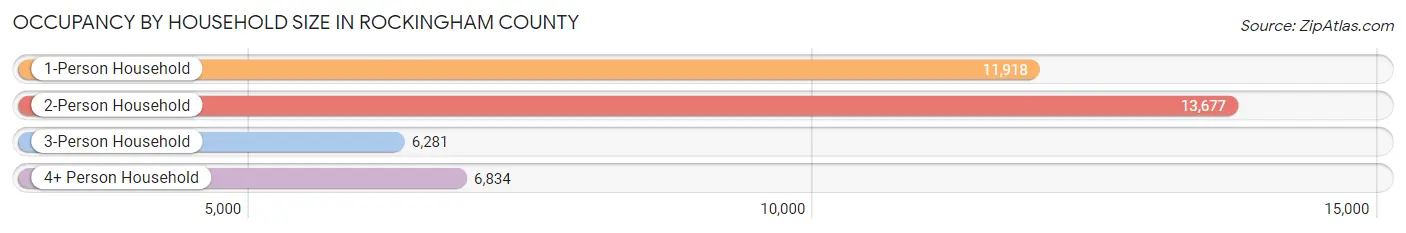
| Household Size | # Housing Units | % Housing Units |
| 1-Person Household | 11,918 | 30.8% |
| 2-Person Household | 13,677 | 35.3% |
| 3-Person Household | 6,281 | 16.2% |
| 4+ Person Household | 6,834 | 17.6% |
| Total Housing Units | 38,710 | 100.0% |
Occupancy by Ownership by Household Size in Rockingham County
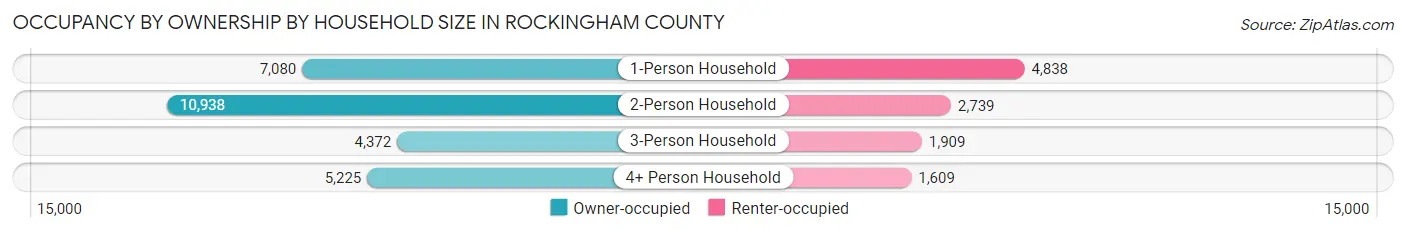
| Household Size | Owner-occupied | Renter-occupied |
| 1-Person Household | 7,080 (59.4%) | 4,838 (40.6%) |
| 2-Person Household | 10,938 (80.0%) | 2,739 (20.0%) |
| 3-Person Household | 4,372 (69.6%) | 1,909 (30.4%) |
| 4+ Person Household | 5,225 (76.5%) | 1,609 (23.5%) |
| Total Housing Units | 27,615 (71.3%) | 11,095 (28.7%) |
Occupancy by Educational Attainment in Rockingham County
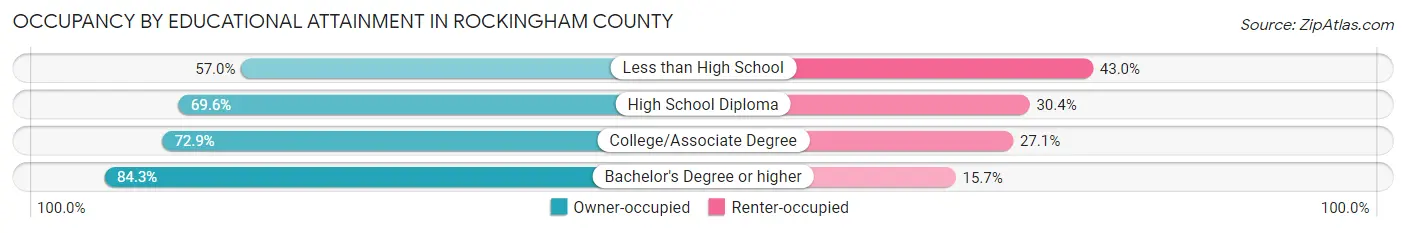
| Household Size | Owner-occupied | Renter-occupied |
| Less than High School | 3,107 (57.0%) | 2,340 (43.0%) |
| High School Diploma | 9,110 (69.6%) | 3,980 (30.4%) |
| College/Associate Degree | 10,222 (72.9%) | 3,808 (27.1%) |
| Bachelor's Degree or higher | 5,176 (84.3%) | 967 (15.7%) |
Occupancy by Age of Householder in Rockingham County
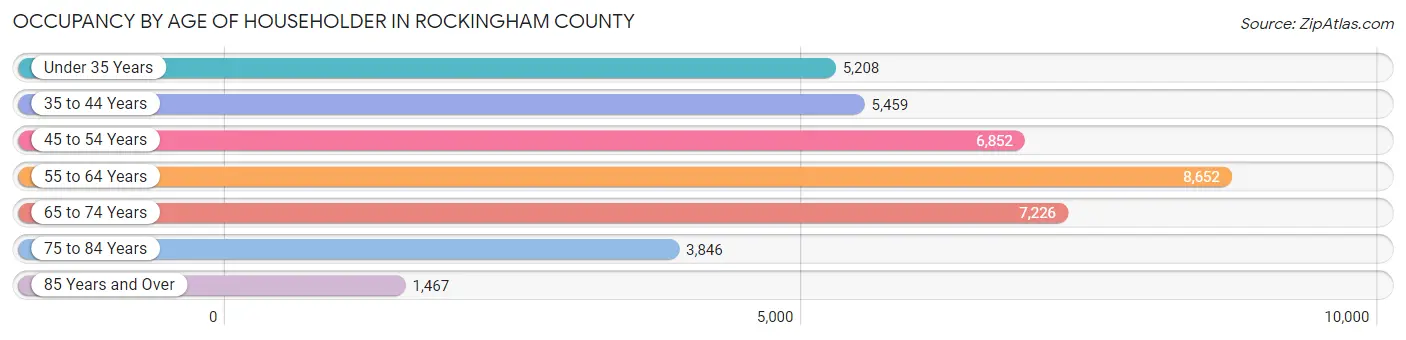
| Age Bracket | # Households | % Households |
| Under 35 Years | 5,208 | 13.5% |
| 35 to 44 Years | 5,459 | 14.1% |
| 45 to 54 Years | 6,852 | 17.7% |
| 55 to 64 Years | 8,652 | 22.4% |
| 65 to 74 Years | 7,226 | 18.7% |
| 75 to 84 Years | 3,846 | 9.9% |
| 85 Years and Over | 1,467 | 3.8% |
| Total | 38,710 | 100.0% |
Housing Finances in Rockingham County
Median Income by Occupancy in Rockingham County
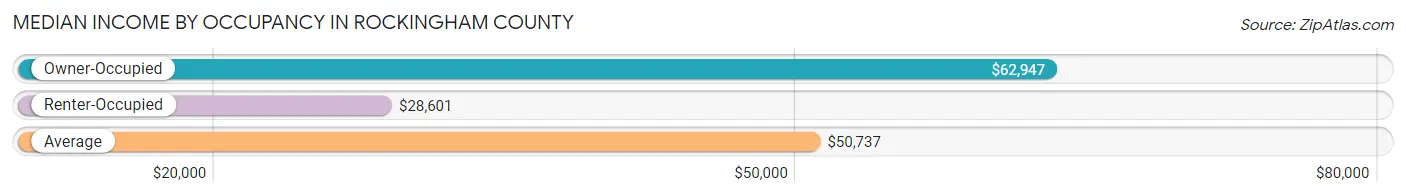
| Occupancy Type | # Households | Median Income |
| Owner-Occupied | 27,615 (71.3%) | $62,947 |
| Renter-Occupied | 11,095 (28.7%) | $28,601 |
| Average | 38,710 (100.0%) | $50,737 |
Occupancy by Householder Income Bracket in Rockingham County
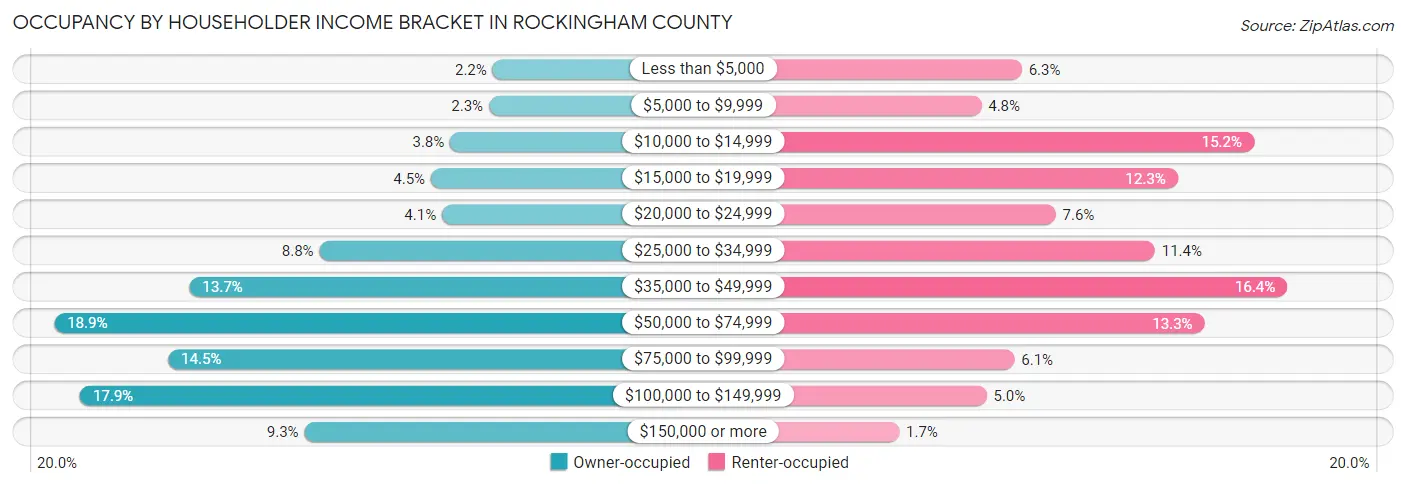
| Income Bracket | Owner-occupied | Renter-occupied |
| Less than $5,000 | 600 (2.2%) | 702 (6.3%) |
| $5,000 to $9,999 | 639 (2.3%) | 532 (4.8%) |
| $10,000 to $14,999 | 1,047 (3.8%) | 1,683 (15.2%) |
| $15,000 to $19,999 | 1,248 (4.5%) | 1,361 (12.3%) |
| $20,000 to $24,999 | 1,131 (4.1%) | 845 (7.6%) |
| $25,000 to $34,999 | 2,421 (8.8%) | 1,265 (11.4%) |
| $35,000 to $49,999 | 3,789 (13.7%) | 1,824 (16.4%) |
| $50,000 to $74,999 | 5,210 (18.9%) | 1,474 (13.3%) |
| $75,000 to $99,999 | 4,013 (14.5%) | 671 (6.0%) |
| $100,000 to $149,999 | 4,939 (17.9%) | 554 (5.0%) |
| $150,000 or more | 2,578 (9.3%) | 184 (1.7%) |
| Total | 27,615 (100.0%) | 11,095 (100.0%) |
Monthly Housing Cost Tiers in Rockingham County
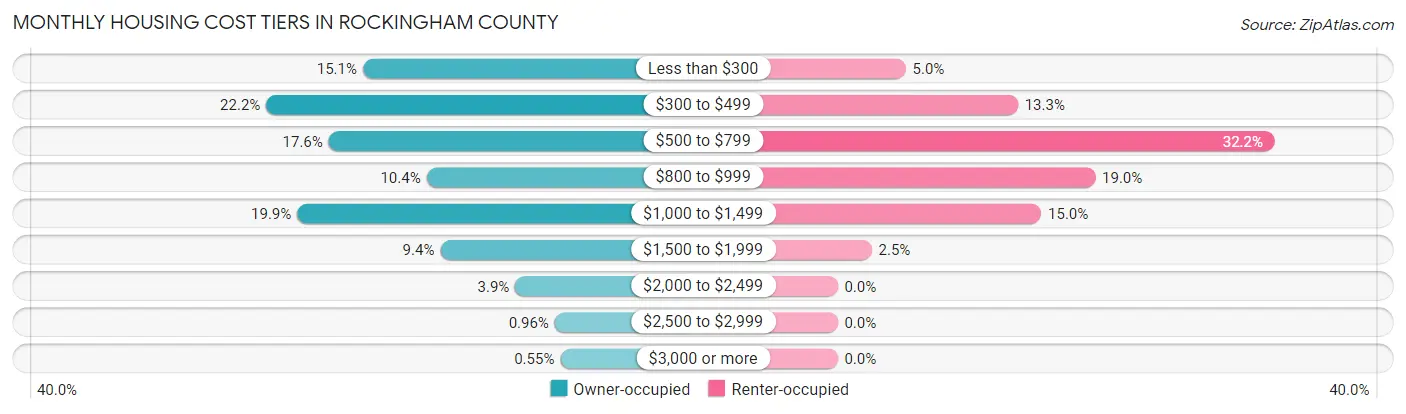
| Monthly Cost | Owner-occupied | Renter-occupied |
| Less than $300 | 4,166 (15.1%) | 557 (5.0%) |
| $300 to $499 | 6,133 (22.2%) | 1,473 (13.3%) |
| $500 to $799 | 4,863 (17.6%) | 3,574 (32.2%) |
| $800 to $999 | 2,873 (10.4%) | 2,106 (19.0%) |
| $1,000 to $1,499 | 5,503 (19.9%) | 1,664 (15.0%) |
| $1,500 to $1,999 | 2,592 (9.4%) | 280 (2.5%) |
| $2,000 to $2,499 | 1,068 (3.9%) | 0 (0.0%) |
| $2,500 to $2,999 | 264 (1.0%) | 0 (0.0%) |
| $3,000 or more | 153 (0.5%) | 0 (0.0%) |
| Total | 27,615 (100.0%) | 11,095 (100.0%) |
Physical Housing Characteristics in Rockingham County
Housing Structures in Rockingham County
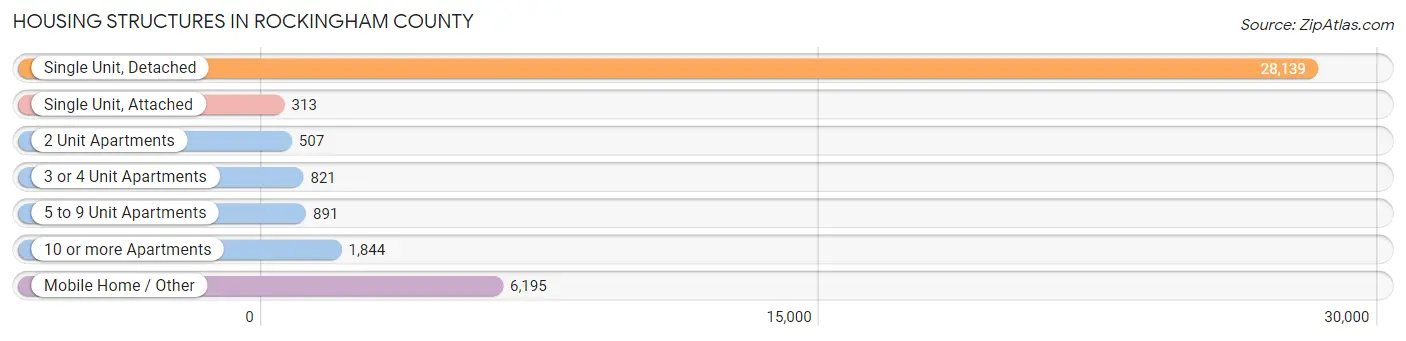
| Structure Type | # Housing Units | % Housing Units |
| Single Unit, Detached | 28,139 | 72.7% |
| Single Unit, Attached | 313 | 0.8% |
| 2 Unit Apartments | 507 | 1.3% |
| 3 or 4 Unit Apartments | 821 | 2.1% |
| 5 to 9 Unit Apartments | 891 | 2.3% |
| 10 or more Apartments | 1,844 | 4.8% |
| Mobile Home / Other | 6,195 | 16.0% |
| Total | 38,710 | 100.0% |
Housing Structures by Occupancy in Rockingham County
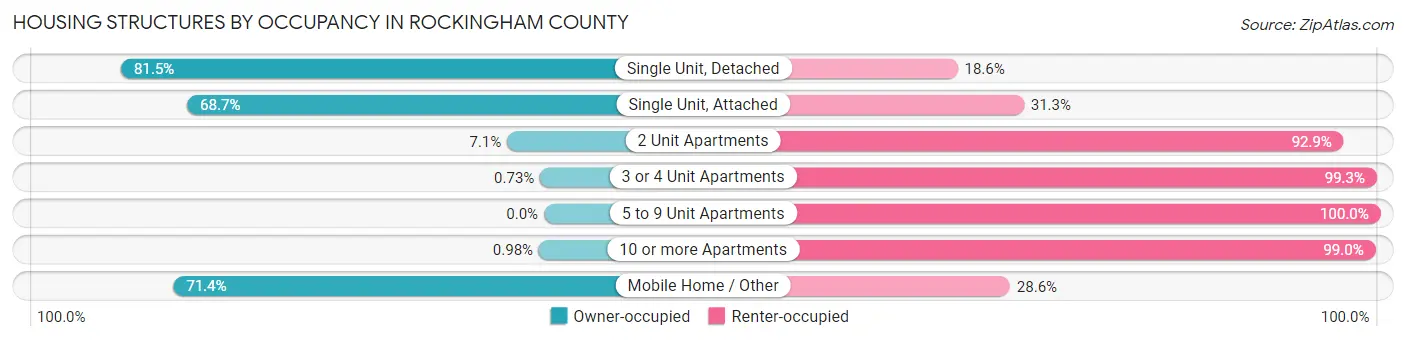
| Structure Type | Owner-occupied | Renter-occupied |
| Single Unit, Detached | 22,919 (81.5%) | 5,220 (18.5%) |
| Single Unit, Attached | 215 (68.7%) | 98 (31.3%) |
| 2 Unit Apartments | 36 (7.1%) | 471 (92.9%) |
| 3 or 4 Unit Apartments | 6 (0.7%) | 815 (99.3%) |
| 5 to 9 Unit Apartments | 0 (0.0%) | 891 (100.0%) |
| 10 or more Apartments | 18 (1.0%) | 1,826 (99.0%) |
| Mobile Home / Other | 4,421 (71.4%) | 1,774 (28.6%) |
| Total | 27,615 (71.3%) | 11,095 (28.7%) |
Housing Structures by Number of Rooms in Rockingham County
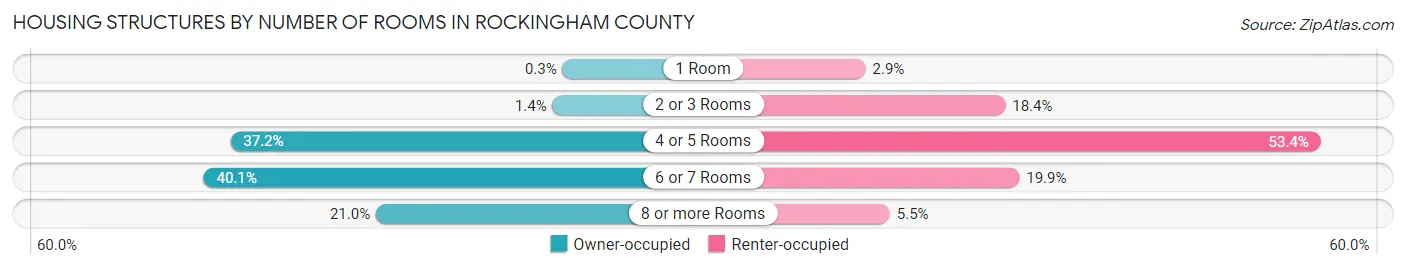
| Number of Rooms | Owner-occupied | Renter-occupied |
| 1 Room | 83 (0.3%) | 316 (2.9%) |
| 2 or 3 Rooms | 388 (1.4%) | 2,036 (18.3%) |
| 4 or 5 Rooms | 10,261 (37.2%) | 5,919 (53.3%) |
| 6 or 7 Rooms | 11,083 (40.1%) | 2,209 (19.9%) |
| 8 or more Rooms | 5,800 (21.0%) | 615 (5.5%) |
| Total | 27,615 (100.0%) | 11,095 (100.0%) |
Housing Structure by Heating Type in Rockingham County
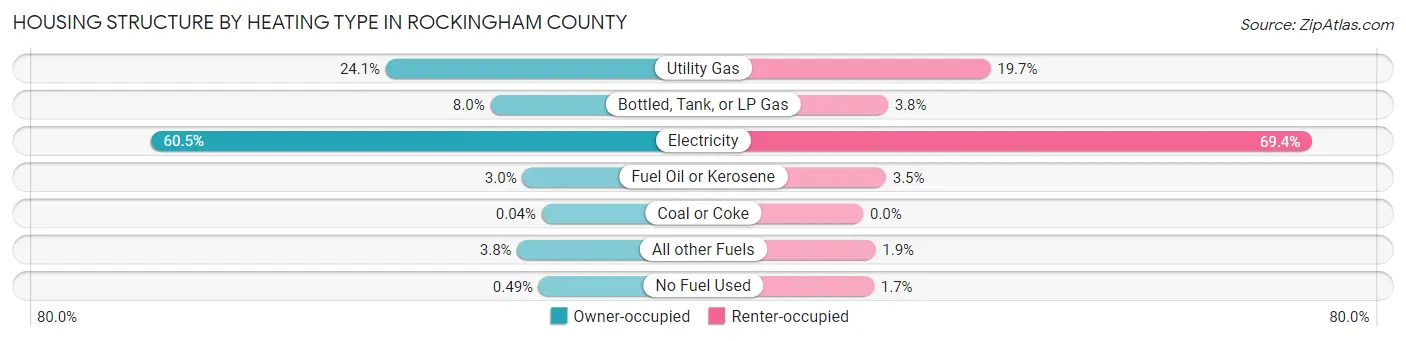
| Heating Type | Owner-occupied | Renter-occupied |
| Utility Gas | 6,665 (24.1%) | 2,182 (19.7%) |
| Bottled, Tank, or LP Gas | 2,205 (8.0%) | 424 (3.8%) |
| Electricity | 16,711 (60.5%) | 7,702 (69.4%) |
| Fuel Oil or Kerosene | 837 (3.0%) | 391 (3.5%) |
| Coal or Coke | 10 (0.0%) | 0 (0.0%) |
| All other Fuels | 1,052 (3.8%) | 211 (1.9%) |
| No Fuel Used | 135 (0.5%) | 185 (1.7%) |
| Total | 27,615 (100.0%) | 11,095 (100.0%) |
Household Vehicle Usage in Rockingham County
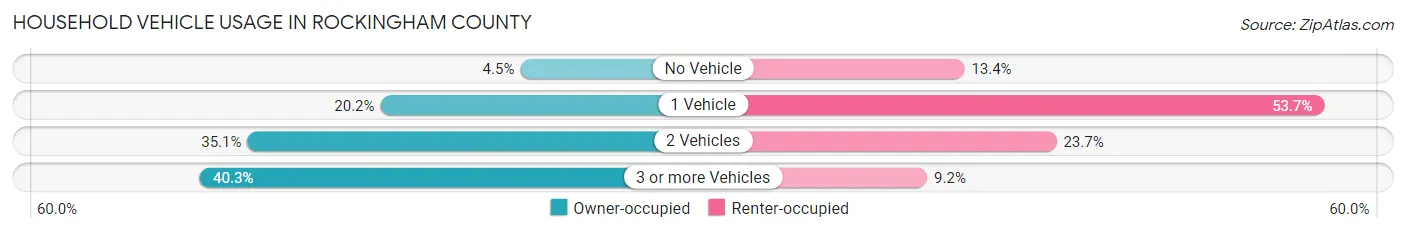
| Vehicles per Household | Owner-occupied | Renter-occupied |
| No Vehicle | 1,236 (4.5%) | 1,486 (13.4%) |
| 1 Vehicle | 5,564 (20.2%) | 5,957 (53.7%) |
| 2 Vehicles | 9,679 (35.0%) | 2,630 (23.7%) |
| 3 or more Vehicles | 11,136 (40.3%) | 1,022 (9.2%) |
| Total | 27,615 (100.0%) | 11,095 (100.0%) |
Real Estate & Mortgages in Rockingham County
Real Estate and Mortgage Overview in Rockingham County
| Characteristic | Without Mortgage | With Mortgage |
| Housing Units | 13,004 | 14,611 |
| Median Property Value | $118,700 | $161,500 |
| Median Household Income | $50,486 | $1,752 |
| Monthly Housing Costs | $372 | $101 |
| Real Estate Taxes | $1,008 | $424 |
Property Value by Mortgage Status in Rockingham County
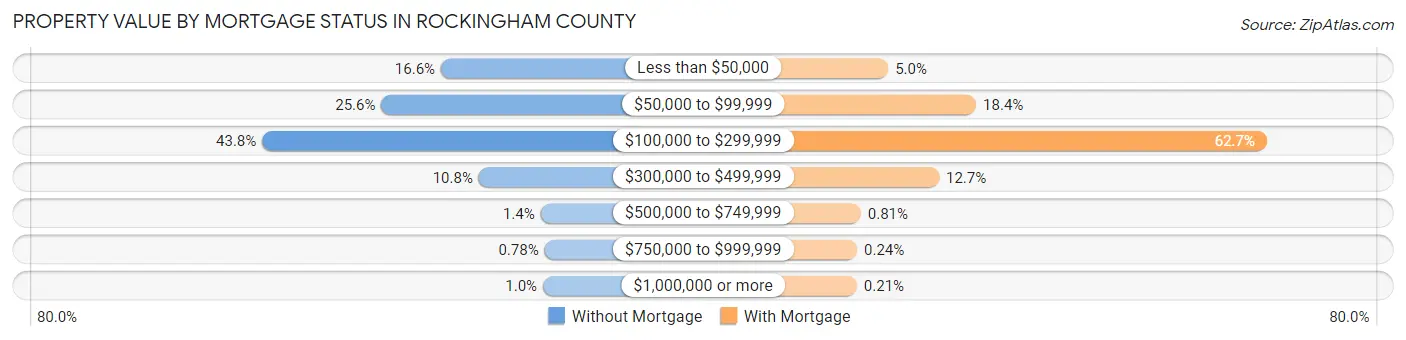
| Property Value | Without Mortgage | With Mortgage |
| Less than $50,000 | 2,154 (16.6%) | 728 (5.0%) |
| $50,000 to $99,999 | 3,334 (25.6%) | 2,686 (18.4%) |
| $100,000 to $299,999 | 5,697 (43.8%) | 9,155 (62.7%) |
| $300,000 to $499,999 | 1,405 (10.8%) | 1,858 (12.7%) |
| $500,000 to $749,999 | 179 (1.4%) | 119 (0.8%) |
| $750,000 to $999,999 | 102 (0.8%) | 35 (0.2%) |
| $1,000,000 or more | 133 (1.0%) | 30 (0.2%) |
| Total | 13,004 (100.0%) | 14,611 (100.0%) |
Household Income by Mortgage Status in Rockingham County
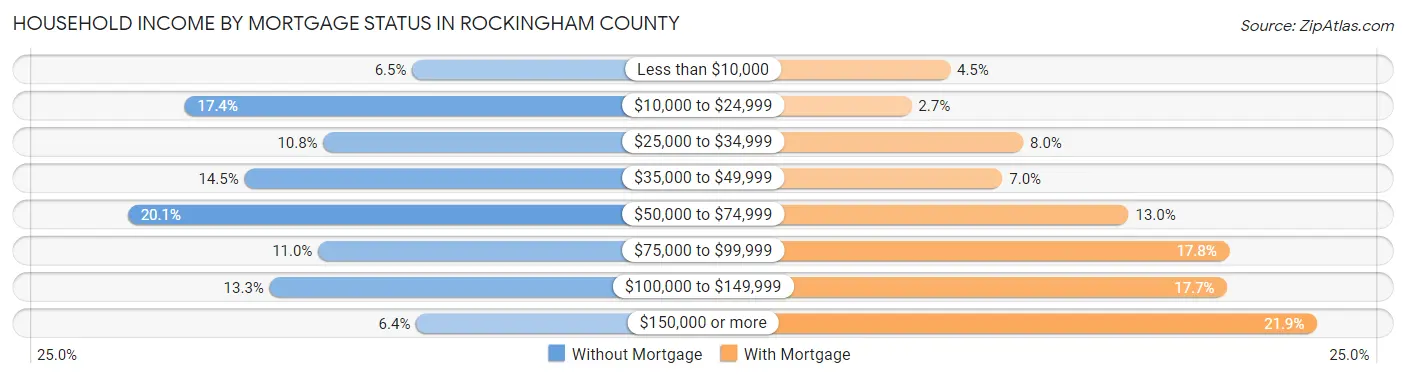
| Household Income | Without Mortgage | With Mortgage |
| Less than $10,000 | 850 (6.5%) | 658 (4.5%) |
| $10,000 to $24,999 | 2,260 (17.4%) | 389 (2.7%) |
| $25,000 to $34,999 | 1,400 (10.8%) | 1,166 (8.0%) |
| $35,000 to $49,999 | 1,889 (14.5%) | 1,021 (7.0%) |
| $50,000 to $74,999 | 2,613 (20.1%) | 1,900 (13.0%) |
| $75,000 to $99,999 | 1,433 (11.0%) | 2,597 (17.8%) |
| $100,000 to $149,999 | 1,733 (13.3%) | 2,580 (17.7%) |
| $150,000 or more | 826 (6.4%) | 3,206 (21.9%) |
| Total | 13,004 (100.0%) | 14,611 (100.0%) |
Property Value to Household Income Ratio in Rockingham County
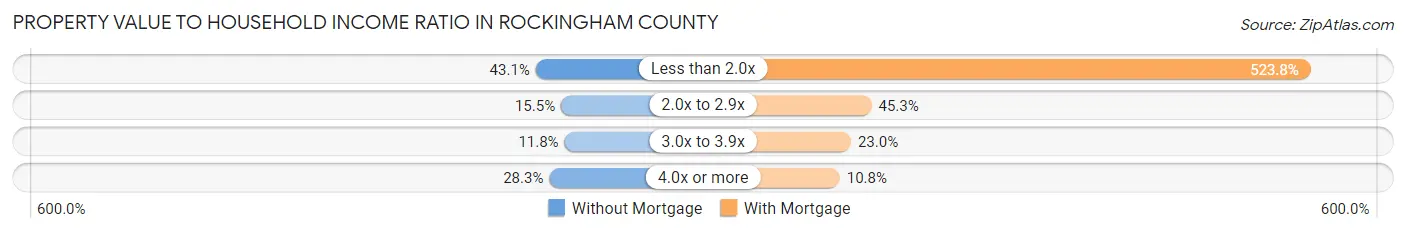
| Value-to-Income Ratio | Without Mortgage | With Mortgage |
| Less than 2.0x | 5,605 (43.1%) | 76,538 (523.8%) |
| 2.0x to 2.9x | 2,017 (15.5%) | 6,625 (45.3%) |
| 3.0x to 3.9x | 1,529 (11.8%) | 3,356 (23.0%) |
| 4.0x or more | 3,684 (28.3%) | 1,575 (10.8%) |
| Total | 13,004 (100.0%) | 14,611 (100.0%) |
Real Estate Taxes by Mortgage Status in Rockingham County
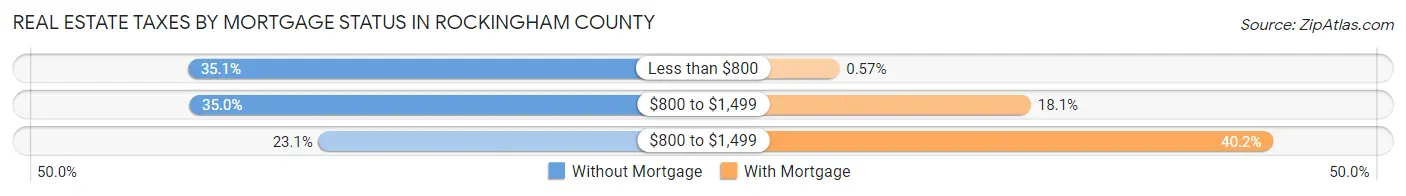
| Property Taxes | Without Mortgage | With Mortgage |
| Less than $800 | 4,565 (35.1%) | 84 (0.6%) |
| $800 to $1,499 | 4,549 (35.0%) | 2,640 (18.1%) |
| $800 to $1,499 | 3,009 (23.1%) | 5,875 (40.2%) |
| Total | 13,004 (100.0%) | 14,611 (100.0%) |
Health & Disability in Rockingham County
Health Insurance Coverage by Age in Rockingham County
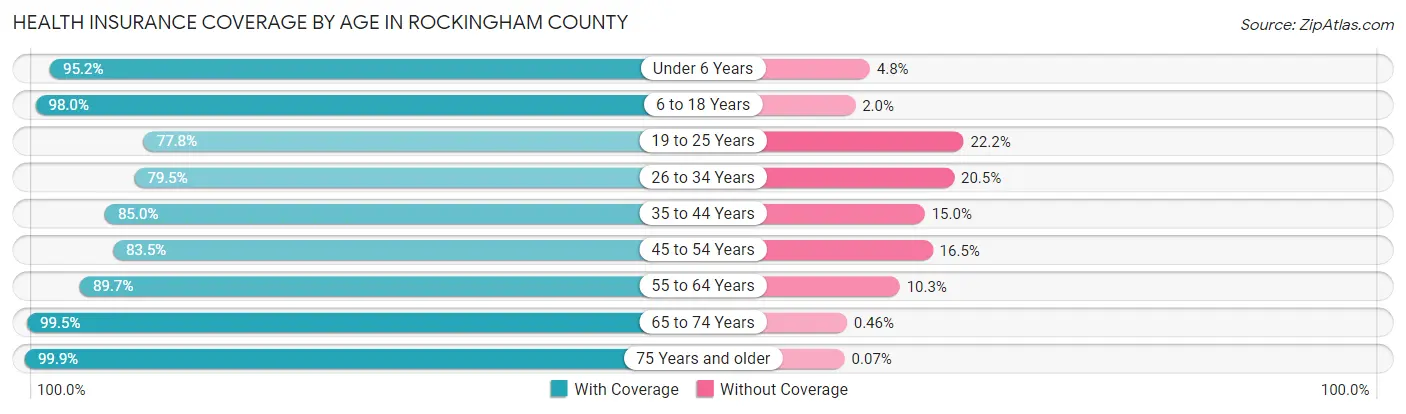
| Age Bracket | With Coverage | Without Coverage |
| Under 6 Years | 5,024 (95.2%) | 251 (4.8%) |
| 6 to 18 Years | 13,755 (98.0%) | 286 (2.0%) |
| 19 to 25 Years | 5,459 (77.8%) | 1,560 (22.2%) |
| 26 to 34 Years | 7,246 (79.5%) | 1,865 (20.5%) |
| 35 to 44 Years | 8,305 (85.0%) | 1,466 (15.0%) |
| 45 to 54 Years | 10,285 (83.5%) | 2,029 (16.5%) |
| 55 to 64 Years | 12,706 (89.7%) | 1,463 (10.3%) |
| 65 to 74 Years | 10,931 (99.5%) | 51 (0.5%) |
| 75 Years and older | 7,436 (99.9%) | 5 (0.1%) |
| Total | 81,147 (90.0%) | 8,976 (10.0%) |
Health Insurance Coverage by Citizenship Status in Rockingham County
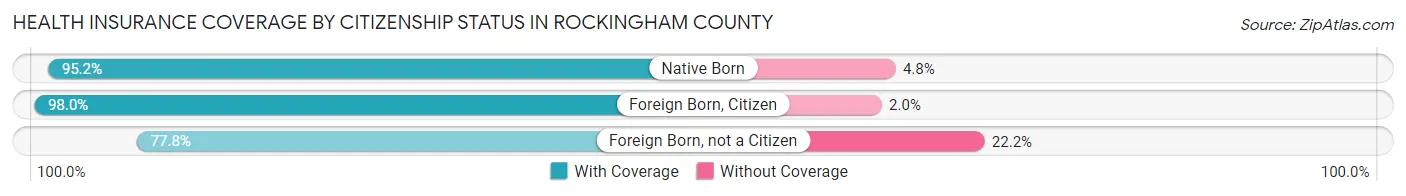
| Citizenship Status | With Coverage | Without Coverage |
| Native Born | 5,024 (95.2%) | 251 (4.8%) |
| Foreign Born, Citizen | 13,755 (98.0%) | 286 (2.0%) |
| Foreign Born, not a Citizen | 5,459 (77.8%) | 1,560 (22.2%) |
Health Insurance Coverage by Household Income in Rockingham County
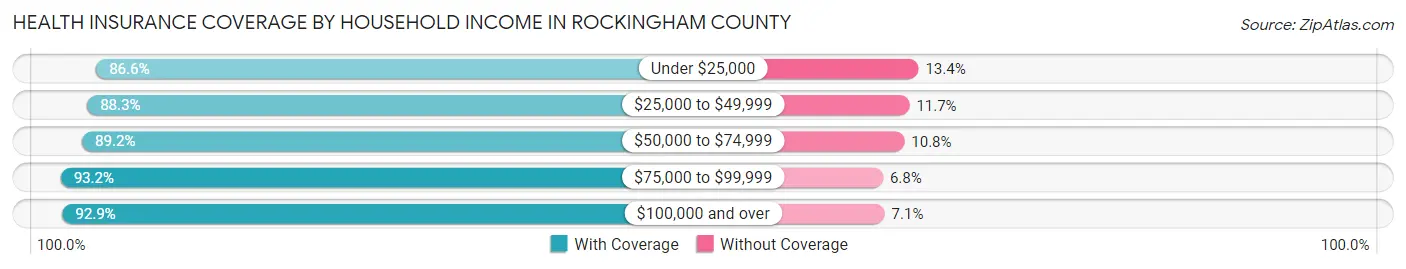
| Household Income | With Coverage | Without Coverage |
| Under $25,000 | 14,727 (86.6%) | 2,284 (13.4%) |
| $25,000 to $49,999 | 17,509 (88.3%) | 2,328 (11.7%) |
| $50,000 to $74,999 | 13,961 (89.2%) | 1,689 (10.8%) |
| $75,000 to $99,999 | 11,669 (93.2%) | 847 (6.8%) |
| $100,000 and over | 23,013 (92.9%) | 1,757 (7.1%) |
Public vs Private Health Insurance Coverage by Age in Rockingham County
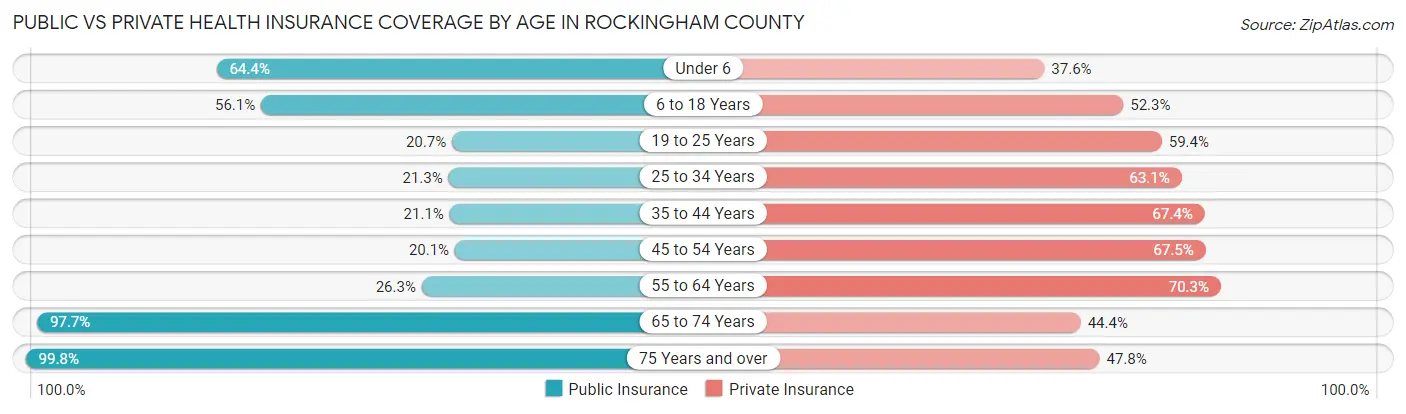
| Age Bracket | Public Insurance | Private Insurance |
| Under 6 | 3,396 (64.4%) | 1,984 (37.6%) |
| 6 to 18 Years | 7,878 (56.1%) | 7,336 (52.2%) |
| 19 to 25 Years | 1,451 (20.7%) | 4,169 (59.4%) |
| 25 to 34 Years | 1,942 (21.3%) | 5,745 (63.1%) |
| 35 to 44 Years | 2,062 (21.1%) | 6,581 (67.3%) |
| 45 to 54 Years | 2,477 (20.1%) | 8,315 (67.5%) |
| 55 to 64 Years | 3,725 (26.3%) | 9,967 (70.3%) |
| 65 to 74 Years | 10,729 (97.7%) | 4,871 (44.4%) |
| 75 Years and over | 7,427 (99.8%) | 3,560 (47.8%) |
| Total | 41,087 (45.6%) | 52,528 (58.3%) |
Disability Status by Sex by Age in Rockingham County
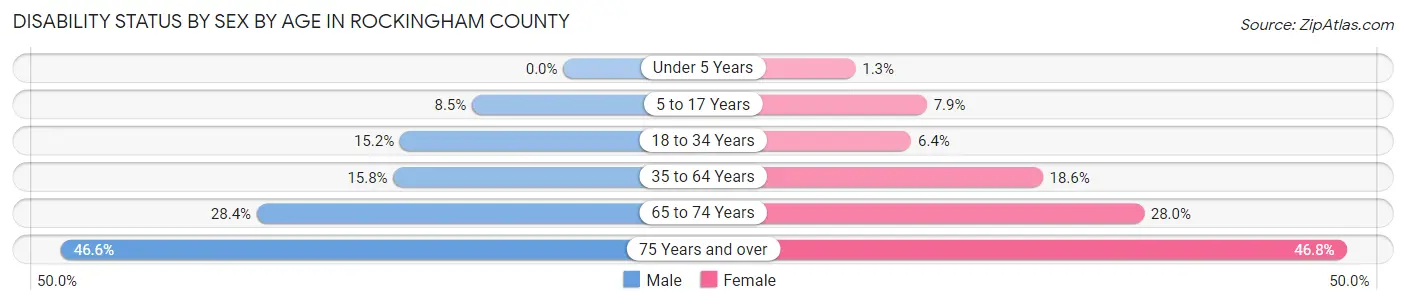
| Age Bracket | Male | Female |
| Under 5 Years | 0 (0.0%) | 27 (1.3%) |
| 5 to 17 Years | 598 (8.5%) | 527 (7.9%) |
| 18 to 34 Years | 1,290 (15.2%) | 555 (6.4%) |
| 35 to 64 Years | 2,759 (15.8%) | 3,495 (18.6%) |
| 65 to 74 Years | 1,478 (28.4%) | 1,622 (28.0%) |
| 75 Years and over | 1,445 (46.6%) | 2,034 (46.8%) |
Disability Class by Sex by Age in Rockingham County
Disability Class: Hearing Difficulty
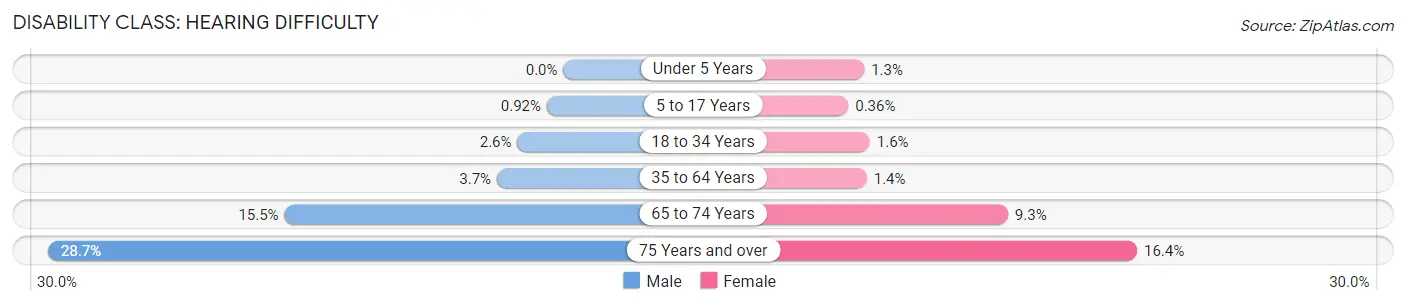
| Age Bracket | Male | Female |
| Under 5 Years | 0 (0.0%) | 27 (1.3%) |
| 5 to 17 Years | 65 (0.9%) | 24 (0.4%) |
| 18 to 34 Years | 218 (2.6%) | 135 (1.6%) |
| 35 to 64 Years | 647 (3.7%) | 261 (1.4%) |
| 65 to 74 Years | 807 (15.5%) | 535 (9.2%) |
| 75 Years and over | 889 (28.7%) | 714 (16.4%) |
Disability Class: Vision Difficulty
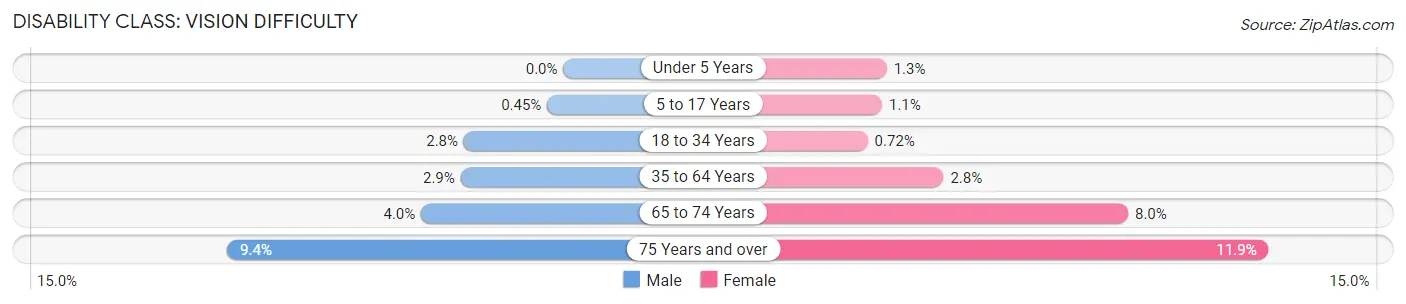
| Age Bracket | Male | Female |
| Under 5 Years | 0 (0.0%) | 27 (1.3%) |
| 5 to 17 Years | 32 (0.4%) | 75 (1.1%) |
| 18 to 34 Years | 236 (2.8%) | 62 (0.7%) |
| 35 to 64 Years | 500 (2.9%) | 531 (2.8%) |
| 65 to 74 Years | 206 (4.0%) | 461 (8.0%) |
| 75 Years and over | 290 (9.4%) | 516 (11.9%) |
Disability Class: Cognitive Difficulty
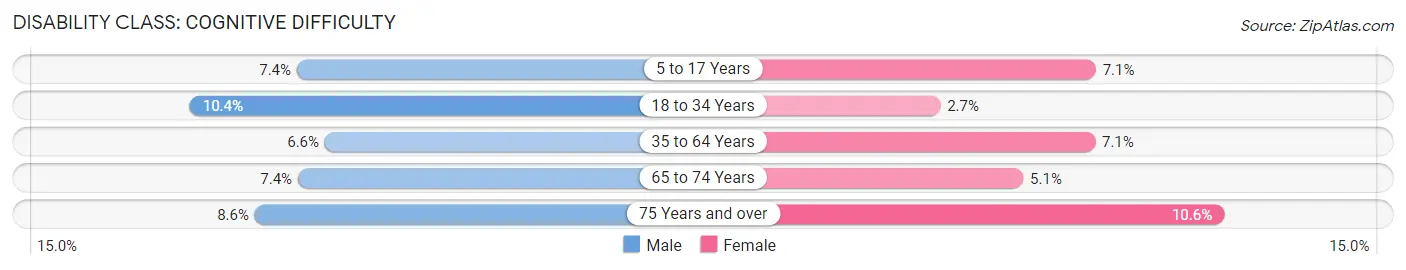
| Age Bracket | Male | Female |
| 5 to 17 Years | 524 (7.4%) | 473 (7.1%) |
| 18 to 34 Years | 885 (10.4%) | 237 (2.7%) |
| 35 to 64 Years | 1,162 (6.6%) | 1,323 (7.0%) |
| 65 to 74 Years | 384 (7.4%) | 292 (5.1%) |
| 75 Years and over | 266 (8.6%) | 462 (10.6%) |
Disability Class: Ambulatory Difficulty
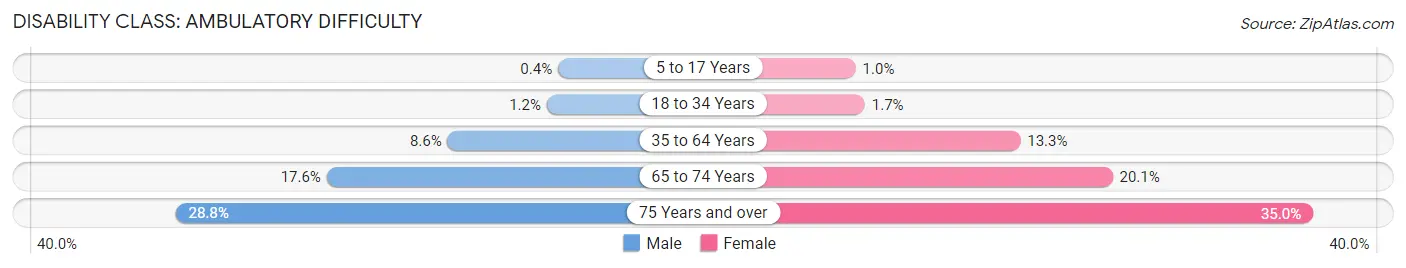
| Age Bracket | Male | Female |
| 5 to 17 Years | 28 (0.4%) | 69 (1.0%) |
| 18 to 34 Years | 105 (1.2%) | 148 (1.7%) |
| 35 to 64 Years | 1,505 (8.6%) | 2,485 (13.3%) |
| 65 to 74 Years | 913 (17.6%) | 1,163 (20.1%) |
| 75 Years and over | 892 (28.8%) | 1,519 (35.0%) |
Disability Class: Self-Care Difficulty
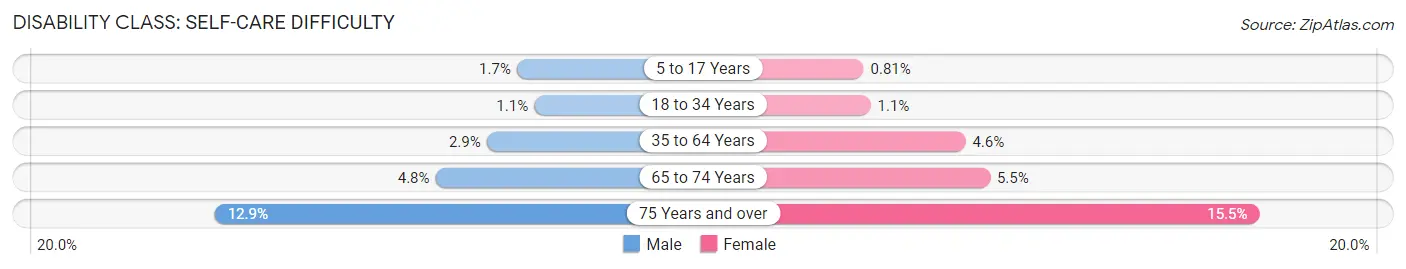
| Age Bracket | Male | Female |
| 5 to 17 Years | 122 (1.7%) | 54 (0.8%) |
| 18 to 34 Years | 93 (1.1%) | 92 (1.1%) |
| 35 to 64 Years | 499 (2.9%) | 861 (4.6%) |
| 65 to 74 Years | 247 (4.8%) | 318 (5.5%) |
| 75 Years and over | 401 (12.9%) | 673 (15.5%) |
Technology Access in Rockingham County
Computing Device Access in Rockingham County
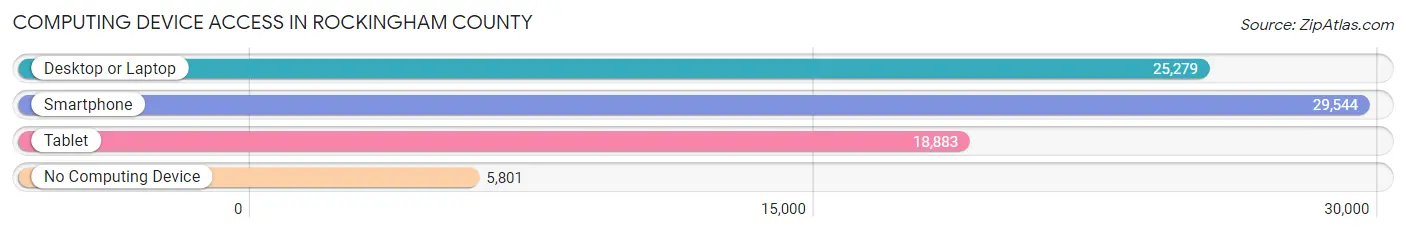
| Device Type | # Households | % Households |
| Desktop or Laptop | 25,279 | 65.3% |
| Smartphone | 29,544 | 76.3% |
| Tablet | 18,883 | 48.8% |
| No Computing Device | 5,801 | 15.0% |
| Total | 38,710 | 100.0% |
Internet Access in Rockingham County
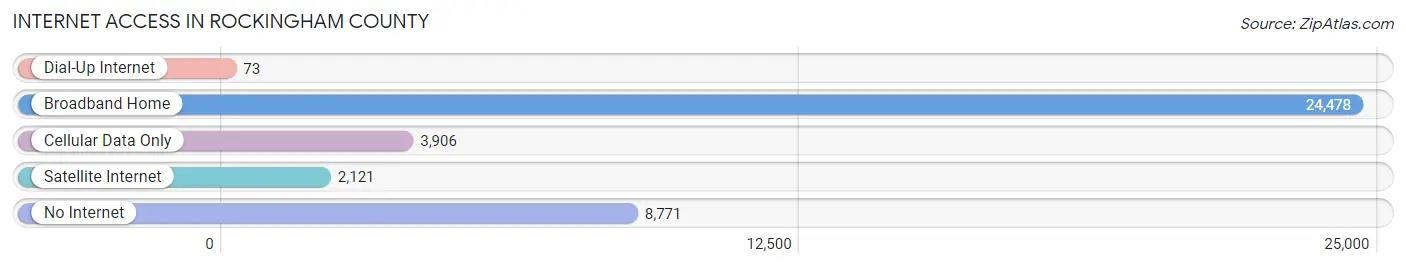
| Internet Type | # Households | % Households |
| Dial-Up Internet | 73 | 0.2% |
| Broadband Home | 24,478 | 63.2% |
| Cellular Data Only | 3,906 | 10.1% |
| Satellite Internet | 2,121 | 5.5% |
| No Internet | 8,771 | 22.7% |
| Total | 38,710 | 100.0% |
Rockingham County Summary
Rockingham County is located in the Piedmont region of North Carolina, and is part of the Greensboro-Winston-Salem-High Point Metropolitan Statistical Area. The county was formed in 1785 from Guilford County and named for Charles Watson-Wentworth, 2nd Marquess of Rockingham, a British Prime Minister. As of the 2010 census, the population was 93,643.
Geography
Rockingham County is located in the Piedmont region of North Carolina, and is part of the Greensboro-Winston-Salem-High Point Metropolitan Statistical Area. The county is bordered by Guilford County to the north, Alamance County to the east, Caswell County to the south, and Stokes County to the west. The county covers an area of 545 square miles, with the majority of the land being rural. The county is home to the Uwharrie National Forest, which covers over 50,000 acres of land.
The county is divided into two distinct regions: the northern and southern parts. The northern part of the county is mostly rolling hills and is home to the Uwharrie National Forest. The southern part of the county is mostly flat and is home to the cities of Eden and Reidsville.
Climate
Rockingham County has a humid subtropical climate, with hot, humid summers and mild winters. The average annual temperature is around 61°F, with the average high in July being around 89°F and the average low in January being around 33°F. The average annual precipitation is around 44 inches, with the majority of the precipitation occurring in the summer months.
Demographics
As of the 2010 census, the population of Rockingham County was 93,643. The population is made up of 48.3% White, 43.2% African American, 4.2% Hispanic or Latino, 2.2% Asian, and 0.7% Native American. The median household income is $41,945, and the median age is 40.
Economy
Rockingham County is home to a diverse economy, with the majority of the population employed in manufacturing, retail, and healthcare. The county is home to several large employers, including Honda Aircraft Company, Unifi Manufacturing, and Cone Health. The county is also home to several smaller businesses, including farms, wineries, and craft breweries.
The county is home to several educational institutions, including Rockingham Community College, the University of North Carolina at Greensboro, and Elon University. The county is also home to several parks and recreational areas, including the Uwharrie National Forest, the Mayo River State Park, and the Haw River State Park.
Conclusion
Rockingham County is a diverse and vibrant county located in the Piedmont region of North Carolina. The county is home to a diverse economy, with the majority of the population employed in manufacturing, retail, and healthcare. The county is also home to several educational institutions, parks, and recreational areas. The county has a humid subtropical climate, with hot, humid summers and mild winters. As of the 2010 census, the population of Rockingham County was 93,643, with the majority of the population being White, African American, Hispanic or Latino, Asian, and Native American.
Common Questions
What is Per Capita Income in Rockingham County?
Per Capita income in Rockingham County is $29,239.
What is the Median Family Income in Rockingham County?
Median Family Income in Rockingham County is $63,904.
What is the Median Household income in Rockingham County?
Median Household Income in Rockingham County is $50,737.
What is Income or Wage Gap in Rockingham County?
Income or Wage Gap in Rockingham County is 27.2%.
Women in Rockingham County earn 72.8 cents for every dollar earned by a man.
What is Family Income Deficit in Rockingham County?
Family Income Deficit in Rockingham County is $10,195.
Families that are below poverty line in Rockingham County earn $10,195 less on average than the poverty threshold level.
What is Inequality or Gini Index in Rockingham County?
Inequality or Gini Index in Rockingham County is 0.46.
What is the Total Population of Rockingham County?
Total Population of Rockingham County is 91,209.
What is the Total Male Population of Rockingham County?
Total Male Population of Rockingham County is 44,392.
What is the Total Female Population of Rockingham County?
Total Female Population of Rockingham County is 46,817.
What is the Ratio of Males per 100 Females in Rockingham County?
There are 94.82 Males per 100 Females in Rockingham County.
What is the Ratio of Females per 100 Males in Rockingham County?
There are 105.46 Females per 100 Males in Rockingham County.
What is the Median Population Age in Rockingham County?
Median Population Age in Rockingham County is 45.1 Years.
What is the Average Family Size in Rockingham County
Average Family Size in Rockingham County is 2.9 People.
What is the Average Household Size in Rockingham County
Average Household Size in Rockingham County is 2.3 People.
How Large is the Labor Force in Rockingham County?
There are 42,225 People in the Labor Forcein in Rockingham County.
What is the Percentage of People in the Labor Force in Rockingham County?
56.0% of People are in the Labor Force in Rockingham County.
What is the Unemployment Rate in Rockingham County?
Unemployment Rate in Rockingham County is 6.5%.