Person County, NC Map & Demographics
Person County Map
Person County Overview
$33,456
PER CAPITA INCOME
$73,891
AVG FAMILY INCOME
$60,688
AVG HOUSEHOLD INCOME
26.2%
WAGE / INCOME GAP [ % ]
73.8¢/ $1
WAGE / INCOME GAP [ $ ]
$11,222
FAMILY INCOME DEFICIT
0.45
INEQUALITY / GINI INDEX
39,131
TOTAL POPULATION
18,879
MALE POPULATION
20,252
FEMALE POPULATION
93.22
MALES / 100 FEMALES
107.27
FEMALES / 100 MALES
43.7
MEDIAN AGE
2.9
AVG FAMILY SIZE
2.4
AVG HOUSEHOLD SIZE
19,479
LABOR FORCE [ PEOPLE ]
60.6%
PERCENT IN LABOR FORCE
3.7%
UNEMPLOYMENT RATE
Income in Person County
Income Overview in Person County
Per Capita Income in Person County is $33,456, while median incomes of families and households are $73,891 and $60,688 respectively.
| Characteristic | Number | Measure |
| Per Capita Income | 39,131 | $33,456 |
| Median Family Income | 10,782 | $73,891 |
| Mean Family Income | 10,782 | $89,918 |
| Median Household Income | 16,139 | $60,688 |
| Mean Household Income | 16,139 | $77,763 |
| Income Deficit | 10,782 | $11,222 |
| Wage / Income Gap (%) | 39,131 | 26.19% |
| Wage / Income Gap ($) | 39,131 | 73.81¢ per $1 |
| Gini / Inequality Index | 39,131 | 0.45 |
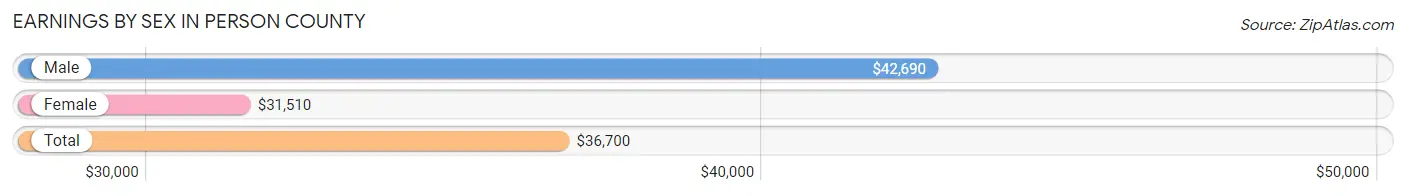
Earnings by Sex in Person County
Average Earnings in Person County are $36,700, $42,690 for men and $31,510 for women, a difference of 26.2%.
| Sex | Number | Average Earnings |
| Male | 10,388 (51.1%) | $42,690 |
| Female | 9,940 (48.9%) | $31,510 |
| Total | 20,328 (100.0%) | $36,700 |
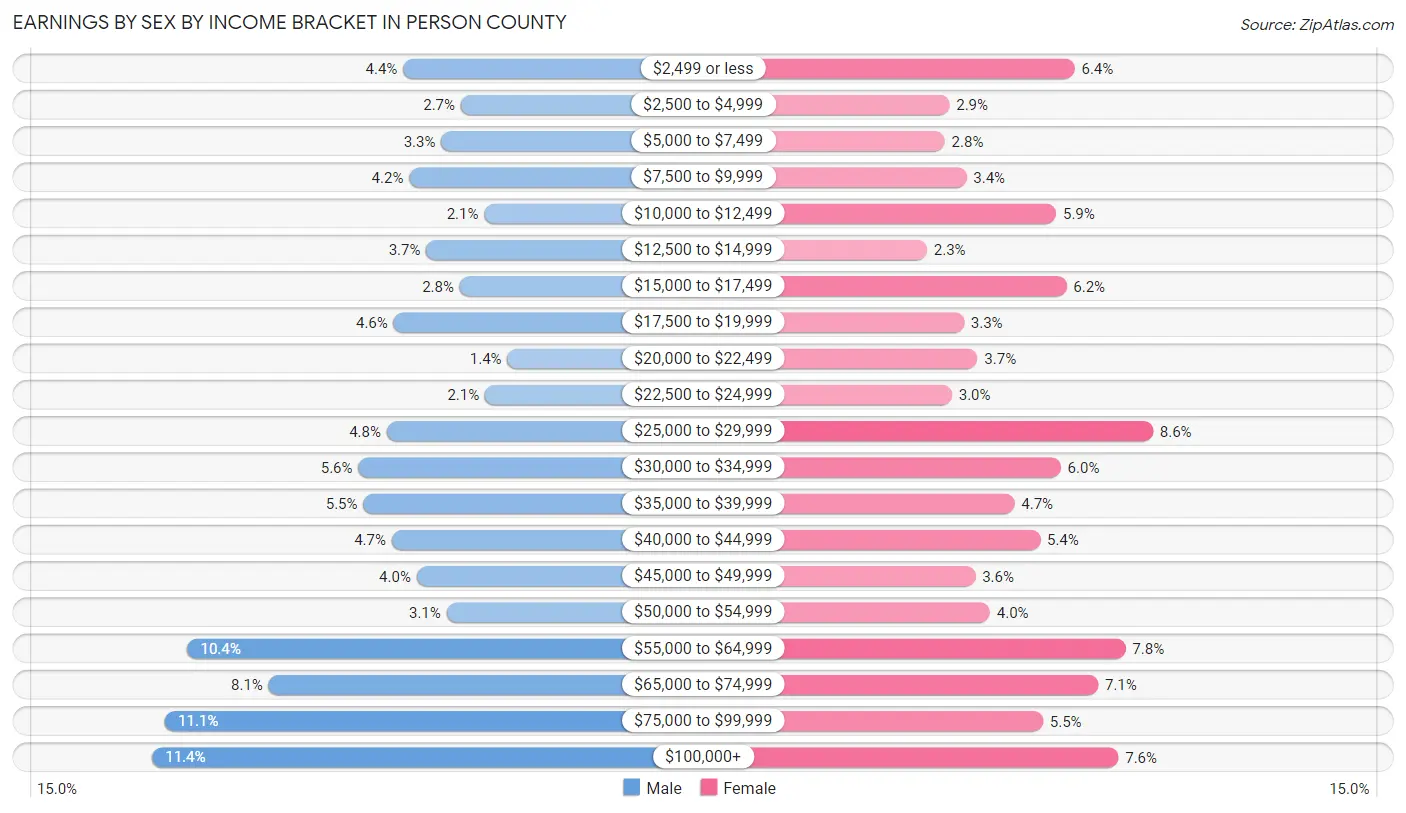
Earnings by Sex by Income Bracket in Person County
The most common earnings brackets in Person County are $100,000+ for men (1,185 | 11.4%) and $25,000 to $29,999 for women (855 | 8.6%).
| Income | Male | Female |
| $2,499 or less | 453 (4.4%) | 636 (6.4%) |
| $2,500 to $4,999 | 285 (2.7%) | 286 (2.9%) |
| $5,000 to $7,499 | 342 (3.3%) | 273 (2.8%) |
| $7,500 to $9,999 | 435 (4.2%) | 334 (3.4%) |
| $10,000 to $12,499 | 216 (2.1%) | 584 (5.9%) |
| $12,500 to $14,999 | 385 (3.7%) | 224 (2.2%) |
| $15,000 to $17,499 | 288 (2.8%) | 613 (6.2%) |
| $17,500 to $19,999 | 481 (4.6%) | 327 (3.3%) |
| $20,000 to $22,499 | 149 (1.4%) | 365 (3.7%) |
| $22,500 to $24,999 | 214 (2.1%) | 293 (2.9%) |
| $25,000 to $29,999 | 501 (4.8%) | 855 (8.6%) |
| $30,000 to $34,999 | 584 (5.6%) | 597 (6.0%) |
| $35,000 to $39,999 | 569 (5.5%) | 468 (4.7%) |
| $40,000 to $44,999 | 486 (4.7%) | 540 (5.4%) |
| $45,000 to $49,999 | 413 (4.0%) | 359 (3.6%) |
| $50,000 to $54,999 | 326 (3.1%) | 400 (4.0%) |
| $55,000 to $64,999 | 1,082 (10.4%) | 778 (7.8%) |
| $65,000 to $74,999 | 846 (8.1%) | 702 (7.1%) |
| $75,000 to $99,999 | 1,148 (11.1%) | 548 (5.5%) |
| $100,000+ | 1,185 (11.4%) | 758 (7.6%) |
| Total | 10,388 (100.0%) | 9,940 (100.0%) |
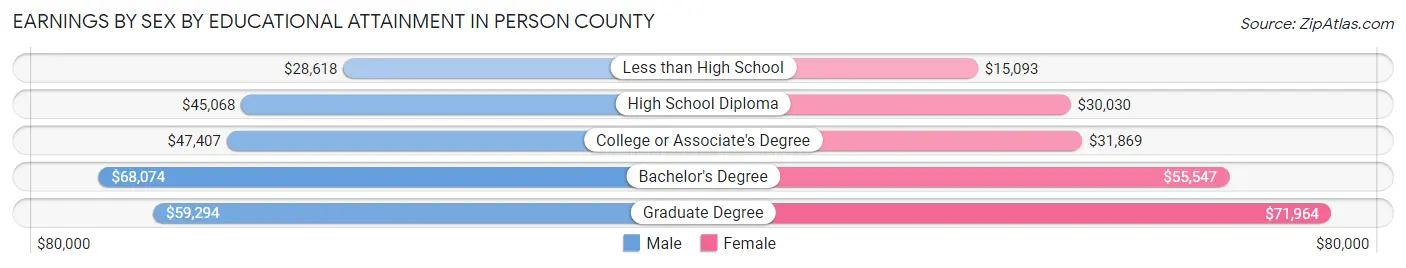
Earnings by Sex by Educational Attainment in Person County
Average earnings in Person County are $47,895 for men and $36,378 for women, a difference of 24.0%. Men with an educational attainment of bachelor's degree enjoy the highest average annual earnings of $68,074, while those with less than high school education earn the least with $28,618. Women with an educational attainment of graduate degree earn the most with the average annual earnings of $71,964, while those with less than high school education have the smallest earnings of $15,093.
| Educational Attainment | Male Income | Female Income |
| Less than High School | $28,618 | $15,093 |
| High School Diploma | $45,068 | $30,030 |
| College or Associate's Degree | $47,407 | $31,869 |
| Bachelor's Degree | $68,074 | $55,547 |
| Graduate Degree | $59,294 | $71,964 |
| Total | $47,895 | $36,378 |
Family Income in Person County
Family Income Brackets in Person County
According to the Person County family income data, there are 2,318 families falling into the $100,000 to $149,999 income range, which is the most common income bracket and makes up 21.5% of all families. Conversely, the $10,000 to $14,999 income bracket is the least frequent group with only 388 families (3.6%) belonging to this category.
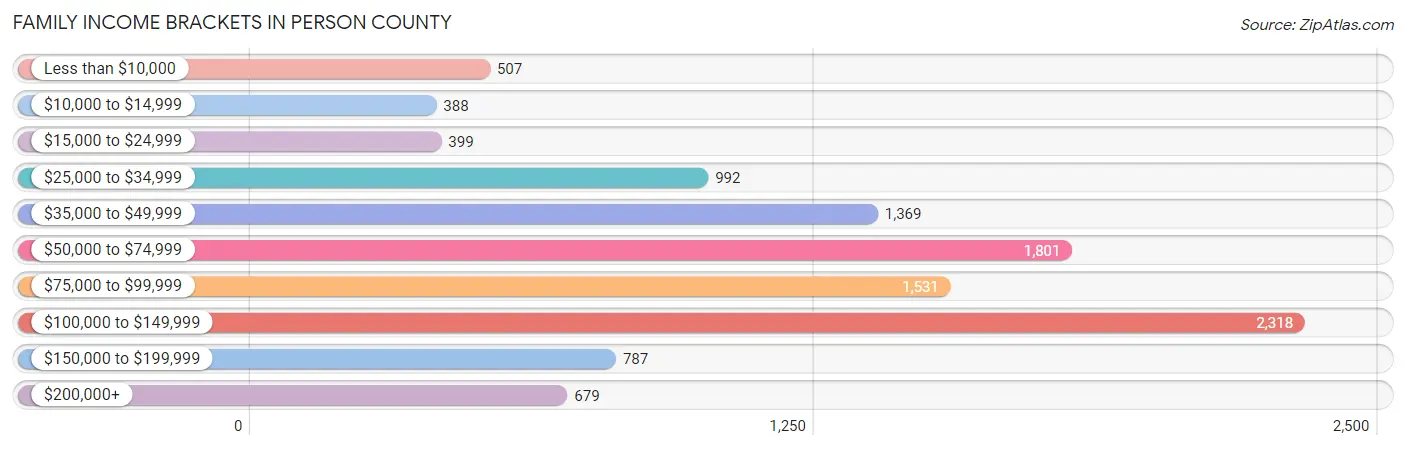
| Income Bracket | # Families | % Families |
| Less than $10,000 | 507 | 4.7% |
| $10,000 to $14,999 | 388 | 3.6% |
| $15,000 to $24,999 | 399 | 3.7% |
| $25,000 to $34,999 | 992 | 9.2% |
| $35,000 to $49,999 | 1,369 | 12.7% |
| $50,000 to $74,999 | 1,801 | 16.7% |
| $75,000 to $99,999 | 1,531 | 14.2% |
| $100,000 to $149,999 | 2,318 | 21.5% |
| $150,000 to $199,999 | 787 | 7.3% |
| $200,000+ | 679 | 6.3% |
Family Income by Famaliy Size in Person County
4-person families (1,371 | 12.7%) account for the highest median family income in Person County with $103,347 per family, while 2-person families (5,558 | 51.5%) have the highest median income of $31,030 per family member.
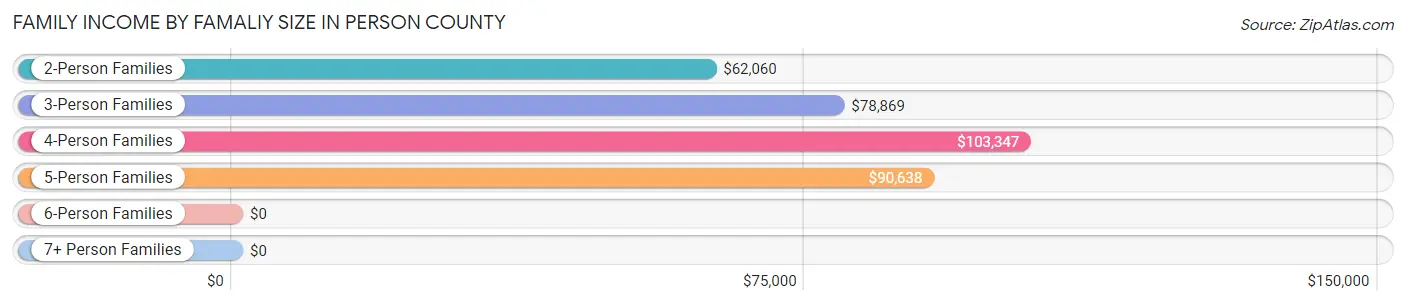
| Income Bracket | # Families | Median Income |
| 2-Person Families | 5,558 (51.5%) | $62,060 |
| 3-Person Families | 3,009 (27.9%) | $78,869 |
| 4-Person Families | 1,371 (12.7%) | $103,347 |
| 5-Person Families | 651 (6.0%) | $90,638 |
| 6-Person Families | 154 (1.4%) | $0 |
| 7+ Person Families | 39 (0.4%) | $0 |
| Total | 10,782 (100.0%) | $73,891 |
Family Income by Number of Earners in Person County
The median family income in Person County is $73,891, with families comprising 3+ earners (881) having the highest median family income of $119,427, while families with no earners (1,698) have the lowest median family income of $40,145, accounting for 8.2% and 15.8% of families, respectively.
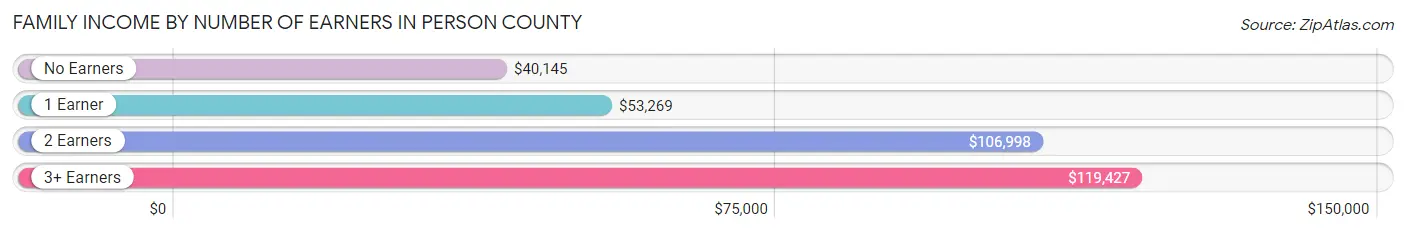
| Number of Earners | # Families | Median Income |
| No Earners | 1,698 (15.8%) | $40,145 |
| 1 Earner | 3,786 (35.1%) | $53,269 |
| 2 Earners | 4,417 (41.0%) | $106,998 |
| 3+ Earners | 881 (8.2%) | $119,427 |
| Total | 10,782 (100.0%) | $73,891 |
Household Income in Person County
Household Income Brackets in Person County
With 2,711 households falling in the category, the $100,000 to $149,999 income range is the most frequent in Person County, accounting for 16.8% of all households. In contrast, only 775 households (4.8%) fall into the $200,000+ income bracket, making it the least populous group.
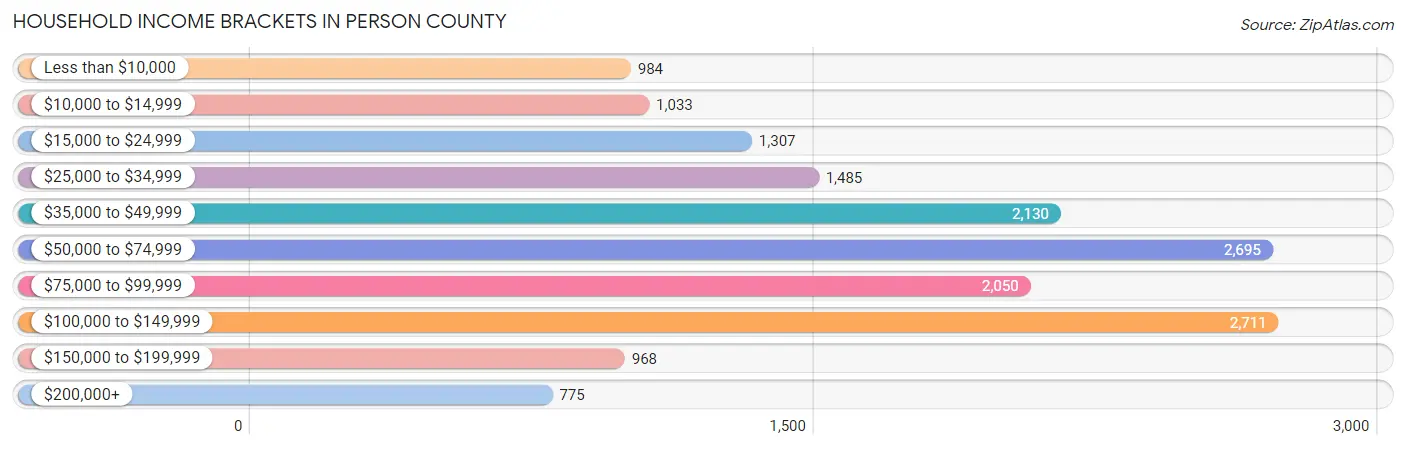
| Income Bracket | # Households | % Households |
| Less than $10,000 | 984 | 6.1% |
| $10,000 to $14,999 | 1,033 | 6.4% |
| $15,000 to $24,999 | 1,307 | 8.1% |
| $25,000 to $34,999 | 1,485 | 9.2% |
| $35,000 to $49,999 | 2,130 | 13.2% |
| $50,000 to $74,999 | 2,695 | 16.7% |
| $75,000 to $99,999 | 2,050 | 12.7% |
| $100,000 to $149,999 | 2,711 | 16.8% |
| $150,000 to $199,999 | 968 | 6.0% |
| $200,000+ | 775 | 4.8% |
Household Income by Householder Age in Person County
The median household income in Person County is $60,688, with the highest median household income of $74,929 found in the 25 to 44 years age bracket for the primary householder. A total of 3,936 households (24.4%) fall into this category. Meanwhile, the 15 to 24 years age bracket for the primary householder has the lowest median household income of $0, with 563 households (3.5%) in this group.
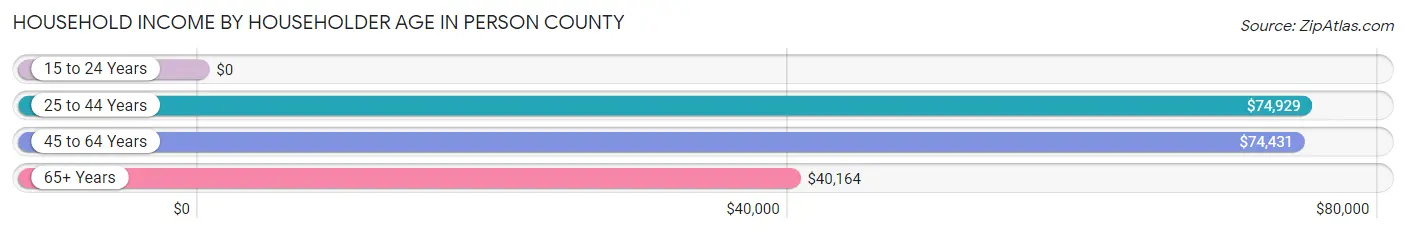
| Income Bracket | # Households | Median Income |
| 15 to 24 Years | 563 (3.5%) | $0 |
| 25 to 44 Years | 3,936 (24.4%) | $74,929 |
| 45 to 64 Years | 6,483 (40.2%) | $74,431 |
| 65+ Years | 5,157 (32.0%) | $40,164 |
| Total | 16,139 (100.0%) | $60,688 |
Poverty in Person County
Income Below Poverty by Sex and Age in Person County
With 14.5% poverty level for males and 19.7% for females among the residents of Person County, 6 to 11 year old males and under 5 year old females are the most vulnerable to poverty, with 456 males (39.9%) and 524 females (48.8%) in their respective age groups living below the poverty level.
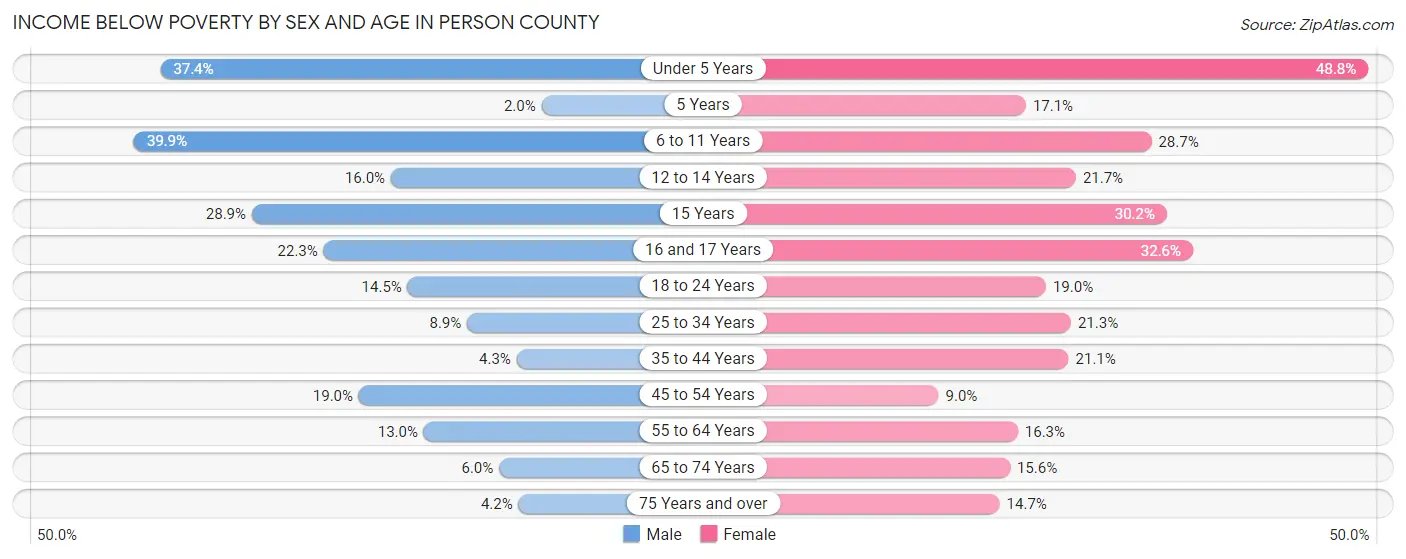
| Age Bracket | Male | Female |
| Under 5 Years | 380 (37.4%) | 524 (48.8%) |
| 5 Years | 4 (2.0%) | 20 (17.1%) |
| 6 to 11 Years | 456 (39.9%) | 317 (28.7%) |
| 12 to 14 Years | 143 (16.0%) | 208 (21.7%) |
| 15 Years | 85 (28.9%) | 38 (30.2%) |
| 16 and 17 Years | 87 (22.3%) | 216 (32.6%) |
| 18 to 24 Years | 237 (14.4%) | 279 (19.0%) |
| 25 to 34 Years | 194 (8.9%) | 495 (21.3%) |
| 35 to 44 Years | 93 (4.3%) | 454 (21.0%) |
| 45 to 54 Years | 470 (19.0%) | 229 (9.0%) |
| 55 to 64 Years | 385 (13.0%) | 506 (16.3%) |
| 65 to 74 Years | 128 (6.0%) | 400 (15.6%) |
| 75 Years and over | 50 (4.2%) | 267 (14.6%) |
| Total | 2,712 (14.5%) | 3,953 (19.7%) |
Income Above Poverty by Sex and Age in Person County
According to the poverty statistics in Person County, males aged 5 years and females aged 45 to 54 years are the age groups that are most secure financially, with 98.0% of males and 91.0% of females in these age groups living above the poverty line.
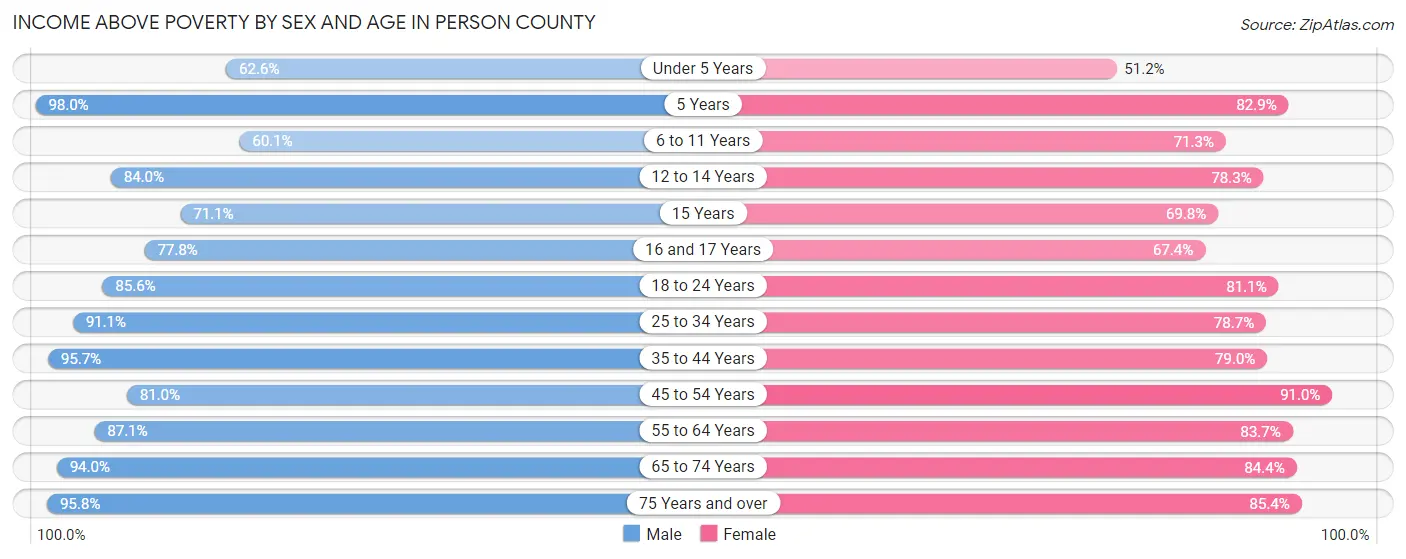
| Age Bracket | Male | Female |
| Under 5 Years | 636 (62.6%) | 549 (51.2%) |
| 5 Years | 194 (98.0%) | 97 (82.9%) |
| 6 to 11 Years | 688 (60.1%) | 786 (71.3%) |
| 12 to 14 Years | 751 (84.0%) | 749 (78.3%) |
| 15 Years | 209 (71.1%) | 88 (69.8%) |
| 16 and 17 Years | 304 (77.7%) | 447 (67.4%) |
| 18 to 24 Years | 1,403 (85.6%) | 1,193 (81.0%) |
| 25 to 34 Years | 1,978 (91.1%) | 1,832 (78.7%) |
| 35 to 44 Years | 2,057 (95.7%) | 1,703 (78.9%) |
| 45 to 54 Years | 2,006 (81.0%) | 2,322 (91.0%) |
| 55 to 64 Years | 2,588 (87.1%) | 2,590 (83.7%) |
| 65 to 74 Years | 2,019 (94.0%) | 2,163 (84.4%) |
| 75 Years and over | 1,153 (95.8%) | 1,556 (85.4%) |
| Total | 15,986 (85.5%) | 16,075 (80.3%) |
Income Below Poverty Among Married-Couple Families in Person County
The poverty statistics for married-couple families in Person County show that 4.5% or 348 of the total 7,772 families live below the poverty line. Families with 3 or 4 children have the highest poverty rate of 26.7%, comprising of 125 families. On the other hand, families with 1 or 2 children have the lowest poverty rate of 1.4%, which includes 30 families.
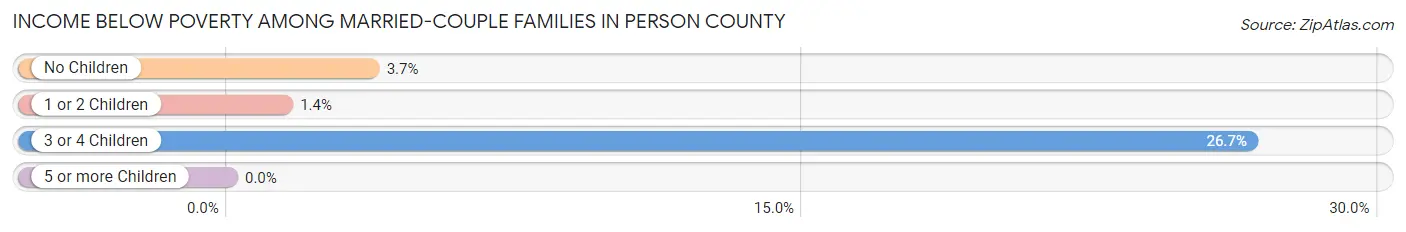
| Children | Above Poverty | Below Poverty |
| No Children | 5,022 (96.3%) | 193 (3.7%) |
| 1 or 2 Children | 2,058 (98.6%) | 30 (1.4%) |
| 3 or 4 Children | 344 (73.4%) | 125 (26.7%) |
| 5 or more Children | 0 (0.0%) | 0 (0.0%) |
| Total | 7,424 (95.5%) | 348 (4.5%) |
Income Below Poverty Among Single-Parent Households in Person County
According to the poverty data in Person County, 16.8% or 120 single-father households and 38.7% or 887 single-mother households are living below the poverty line. Among single-father households, those with 3 or 4 children have the highest poverty rate, with 43 households (97.7%) experiencing poverty. Likewise, among single-mother households, those with 3 or 4 children have the highest poverty rate, with 256 households (97.3%) falling below the poverty line.
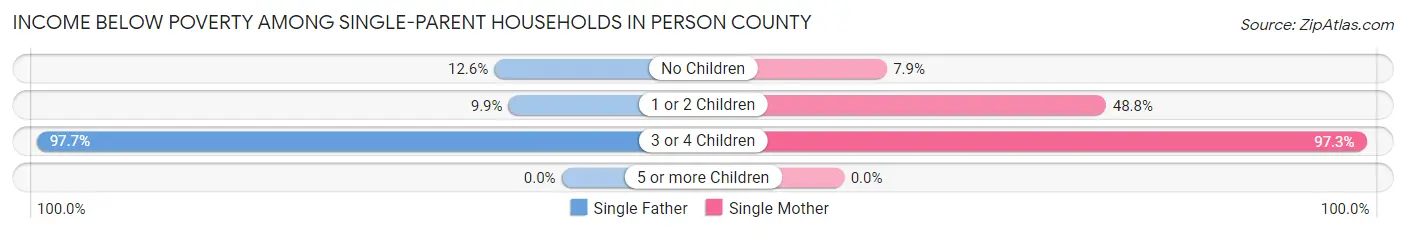
| Children | Single Father | Single Mother |
| No Children | 50 (12.6%) | 70 (7.9%) |
| 1 or 2 Children | 27 (9.9%) | 561 (48.8%) |
| 3 or 4 Children | 43 (97.7%) | 256 (97.3%) |
| 5 or more Children | 0 (0.0%) | 0 (0.0%) |
| Total | 120 (16.8%) | 887 (38.7%) |
Income Below Poverty Among Married-Couple vs Single-Parent Households in Person County
The poverty data for Person County shows that 348 of the married-couple family households (4.5%) and 1,007 of the single-parent households (33.5%) are living below the poverty level. Within the married-couple family households, those with 3 or 4 children have the highest poverty rate, with 125 households (26.7%) falling below the poverty line. Among the single-parent households, those with 3 or 4 children have the highest poverty rate, with 299 household (97.4%) living below poverty.
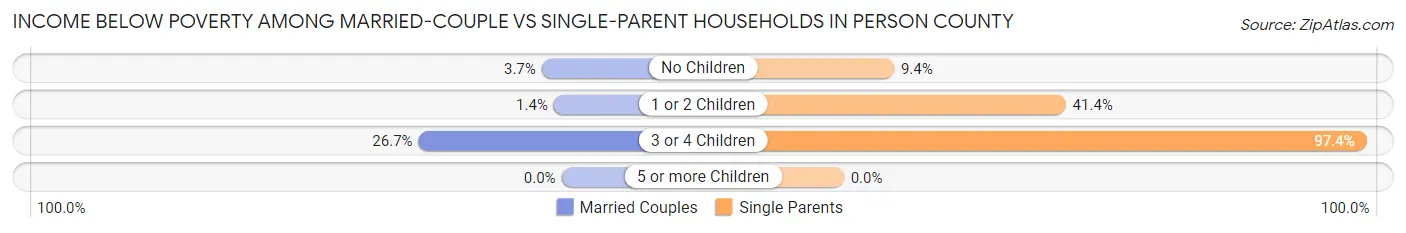
| Children | Married-Couple Families | Single-Parent Households |
| No Children | 193 (3.7%) | 120 (9.4%) |
| 1 or 2 Children | 30 (1.4%) | 588 (41.3%) |
| 3 or 4 Children | 125 (26.7%) | 299 (97.4%) |
| 5 or more Children | 0 (0.0%) | 0 (0.0%) |
| Total | 348 (4.5%) | 1,007 (33.5%) |
Race in Person County
The most populous races in Person County are White / Caucasian (26,043 | 66.5%), Black / African American (9,987 | 25.5%), and Two or more Races (2,325 | 5.9%).
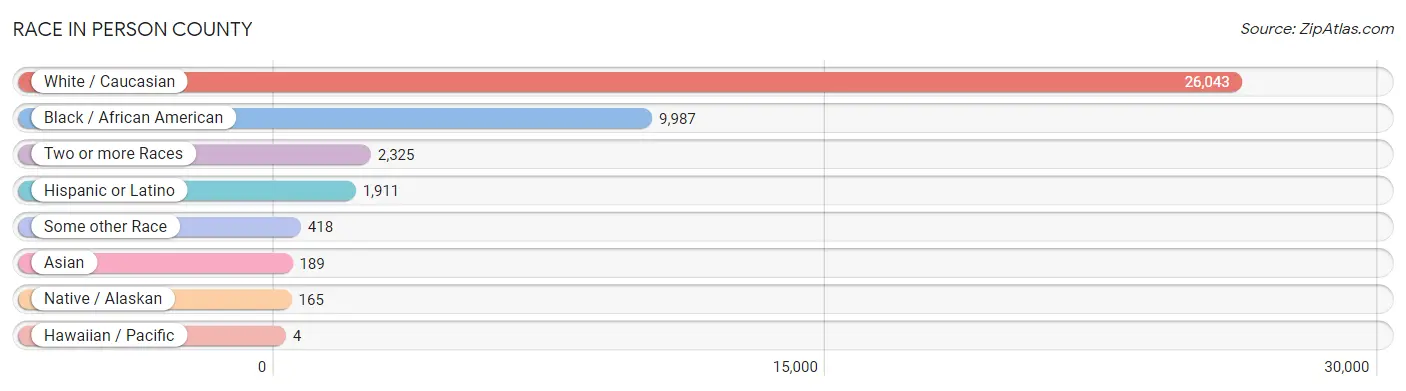
| Race | # Population | % Population |
| Asian | 189 | 0.5% |
| Black / African American | 9,987 | 25.5% |
| Hawaiian / Pacific | 4 | 0.0% |
| Hispanic or Latino | 1,911 | 4.9% |
| Native / Alaskan | 165 | 0.4% |
| White / Caucasian | 26,043 | 66.5% |
| Two or more Races | 2,325 | 5.9% |
| Some other Race | 418 | 1.1% |
| Total | 39,131 | 100.0% |
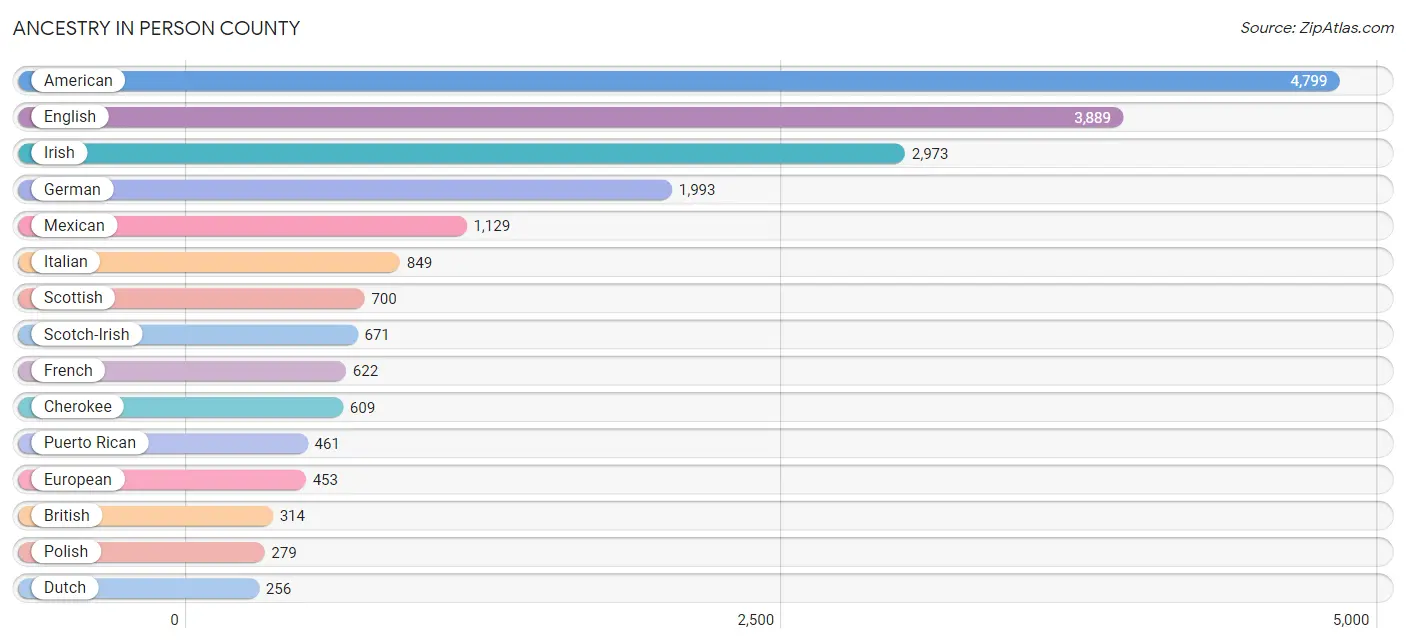
Ancestry in Person County
The most populous ancestries reported in Person County are American (4,799 | 12.3%), English (3,889 | 9.9%), Irish (2,973 | 7.6%), German (1,993 | 5.1%), and Mexican (1,129 | 2.9%), together accounting for 37.8% of all Person County residents.
| Ancestry | # Population | % Population |
| African | 95 | 0.2% |
| American | 4,799 | 12.3% |
| Arab | 50 | 0.1% |
| Barbadian | 79 | 0.2% |
| Bhutanese | 2 | 0.0% |
| Blackfeet | 2 | 0.0% |
| Brazilian | 44 | 0.1% |
| British | 314 | 0.8% |
| Burmese | 1 | 0.0% |
| Canadian | 26 | 0.1% |
| Celtic | 35 | 0.1% |
| Central American | 125 | 0.3% |
| Central American Indian | 6 | 0.0% |
| Cherokee | 609 | 1.6% |
| Chippewa | 23 | 0.1% |
| Choctaw | 66 | 0.2% |
| Colombian | 65 | 0.2% |
| Comanche | 1 | 0.0% |
| Costa Rican | 22 | 0.1% |
| Croatian | 43 | 0.1% |
| Czechoslovakian | 14 | 0.0% |
| Danish | 35 | 0.1% |
| Delaware | 1 | 0.0% |
| Dominican | 18 | 0.1% |
| Dutch | 256 | 0.6% |
| Eastern European | 71 | 0.2% |
| Ecuadorian | 93 | 0.2% |
| Egyptian | 33 | 0.1% |
| English | 3,889 | 9.9% |
| European | 453 | 1.2% |
| Finnish | 68 | 0.2% |
| French | 622 | 1.6% |
| French Canadian | 127 | 0.3% |
| German | 1,993 | 5.1% |
| Greek | 2 | 0.0% |
| Guatemalan | 5 | 0.0% |
| Haitian | 52 | 0.1% |
| Hmong | 13 | 0.0% |
| Honduran | 69 | 0.2% |
| Hungarian | 2 | 0.0% |
| Indian (Asian) | 15 | 0.0% |
| Irish | 2,973 | 7.6% |
| Italian | 849 | 2.2% |
| Jamaican | 2 | 0.0% |
| Kenyan | 20 | 0.1% |
| Korean | 68 | 0.2% |
| Lithuanian | 2 | 0.0% |
| Lumbee | 1 | 0.0% |
| Menominee | 8 | 0.0% |
| Mexican | 1,129 | 2.9% |
| Native Hawaiian | 2 | 0.0% |
| Northern European | 5 | 0.0% |
| Norwegian | 77 | 0.2% |
| Polish | 279 | 0.7% |
| Portuguese | 136 | 0.4% |
| Puerto Rican | 461 | 1.2% |
| Salvadoran | 29 | 0.1% |
| Scandinavian | 35 | 0.1% |
| Scotch-Irish | 671 | 1.7% |
| Scottish | 700 | 1.8% |
| Serbian | 5 | 0.0% |
| Sioux | 1 | 0.0% |
| Slovak | 16 | 0.0% |
| South American | 171 | 0.4% |
| South American Indian | 6 | 0.0% |
| Spaniard | 2 | 0.0% |
| Spanish | 5 | 0.0% |
| Subsaharan African | 117 | 0.3% |
| Sudanese | 2 | 0.0% |
| Swedish | 114 | 0.3% |
| Swiss | 47 | 0.1% |
| Thai | 115 | 0.3% |
| U.S. Virgin Islander | 14 | 0.0% |
| Ukrainian | 96 | 0.3% |
| Venezuelan | 13 | 0.0% |
| Welsh | 167 | 0.4% |
| West Indian | 14 | 0.0% | View All 77 Rows |
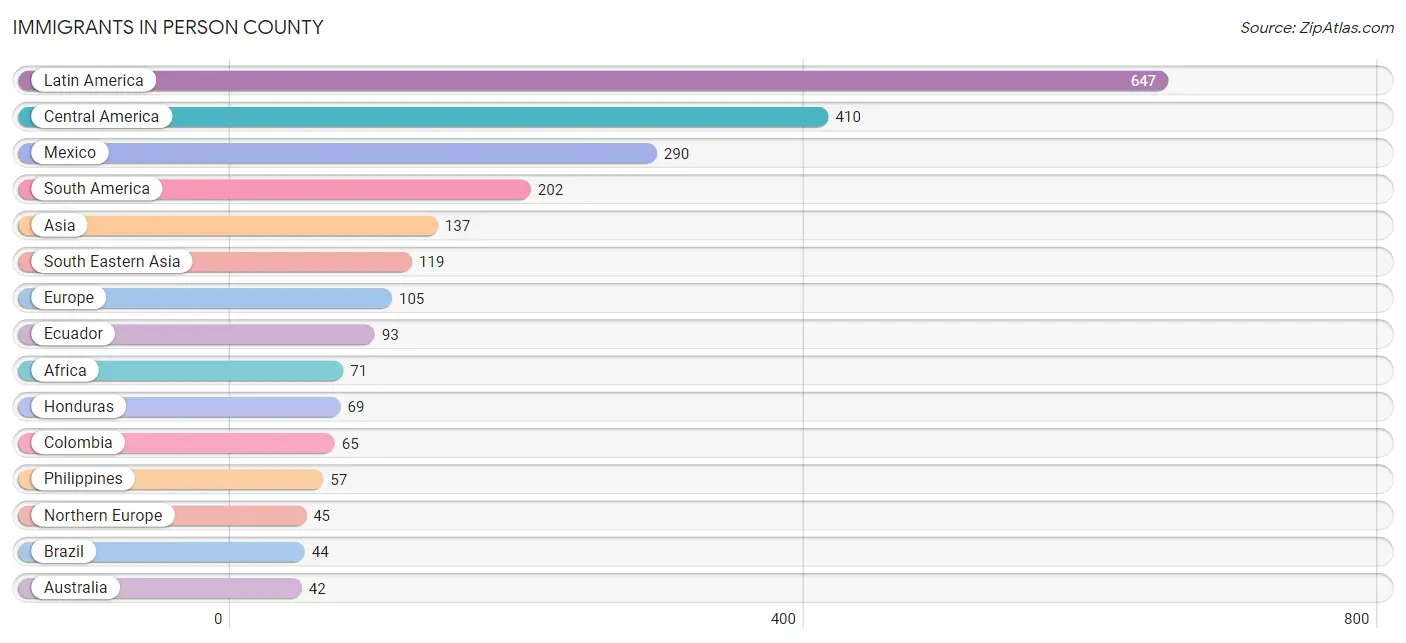
Immigrants in Person County
The most numerous immigrant groups reported in Person County came from Latin America (647 | 1.7%), Central America (410 | 1.1%), Mexico (290 | 0.7%), South America (202 | 0.5%), and Asia (137 | 0.4%), together accounting for 4.3% of all Person County residents.
| Immigration Origin | # Population | % Population |
| Africa | 71 | 0.2% |
| Asia | 137 | 0.4% |
| Australia | 42 | 0.1% |
| Brazil | 44 | 0.1% |
| Canada | 16 | 0.0% |
| Caribbean | 35 | 0.1% |
| Central America | 410 | 1.1% |
| China | 15 | 0.0% |
| Colombia | 65 | 0.2% |
| Costa Rica | 22 | 0.1% |
| Dominican Republic | 18 | 0.1% |
| Eastern Asia | 15 | 0.0% |
| Eastern Europe | 40 | 0.1% |
| Ecuador | 93 | 0.2% |
| Egypt | 33 | 0.1% |
| El Salvador | 29 | 0.1% |
| England | 27 | 0.1% |
| Europe | 105 | 0.3% |
| France | 17 | 0.0% |
| Germany | 3 | 0.0% |
| Haiti | 16 | 0.0% |
| Honduras | 69 | 0.2% |
| Jamaica | 1 | 0.0% |
| Laos | 42 | 0.1% |
| Latin America | 647 | 1.7% |
| Liberia | 38 | 0.1% |
| Mexico | 290 | 0.7% |
| Northern Africa | 33 | 0.1% |
| Northern Europe | 45 | 0.1% |
| Oceania | 42 | 0.1% |
| Pakistan | 3 | 0.0% |
| Philippines | 57 | 0.2% |
| Poland | 40 | 0.1% |
| Scotland | 18 | 0.1% |
| South America | 202 | 0.5% |
| South Central Asia | 3 | 0.0% |
| South Eastern Asia | 119 | 0.3% |
| Thailand | 20 | 0.1% |
| Western Africa | 38 | 0.1% |
| Western Europe | 20 | 0.1% | View All 40 Rows |
Sex and Age in Person County
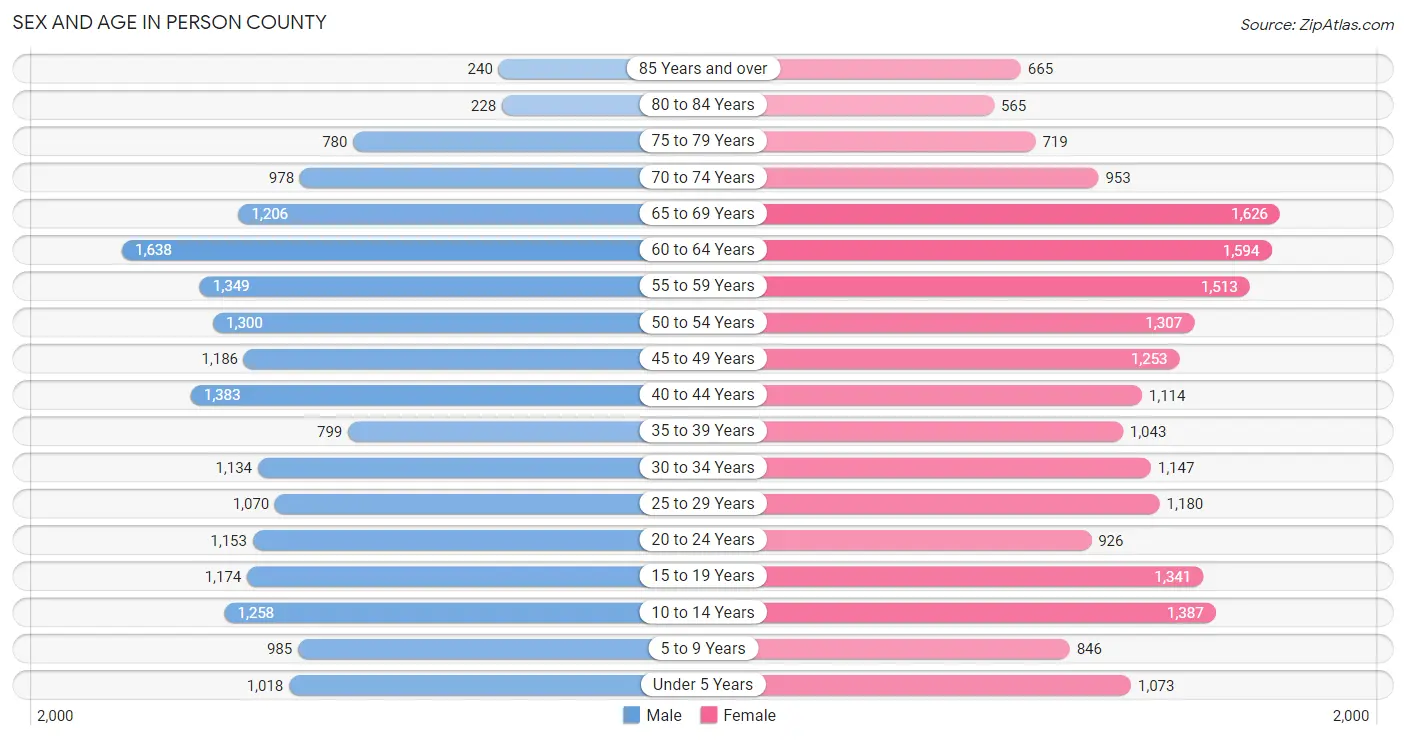
Sex and Age in Person County
The most populous age groups in Person County are 60 to 64 Years (1,638 | 8.7%) for men and 65 to 69 Years (1,626 | 8.0%) for women.
| Age Bracket | Male | Female |
| Under 5 Years | 1,018 (5.4%) | 1,073 (5.3%) |
| 5 to 9 Years | 985 (5.2%) | 846 (4.2%) |
| 10 to 14 Years | 1,258 (6.7%) | 1,387 (6.9%) |
| 15 to 19 Years | 1,174 (6.2%) | 1,341 (6.6%) |
| 20 to 24 Years | 1,153 (6.1%) | 926 (4.6%) |
| 25 to 29 Years | 1,070 (5.7%) | 1,180 (5.8%) |
| 30 to 34 Years | 1,134 (6.0%) | 1,147 (5.7%) |
| 35 to 39 Years | 799 (4.2%) | 1,043 (5.1%) |
| 40 to 44 Years | 1,383 (7.3%) | 1,114 (5.5%) |
| 45 to 49 Years | 1,186 (6.3%) | 1,253 (6.2%) |
| 50 to 54 Years | 1,300 (6.9%) | 1,307 (6.5%) |
| 55 to 59 Years | 1,349 (7.1%) | 1,513 (7.5%) |
| 60 to 64 Years | 1,638 (8.7%) | 1,594 (7.9%) |
| 65 to 69 Years | 1,206 (6.4%) | 1,626 (8.0%) |
| 70 to 74 Years | 978 (5.2%) | 953 (4.7%) |
| 75 to 79 Years | 780 (4.1%) | 719 (3.5%) |
| 80 to 84 Years | 228 (1.2%) | 565 (2.8%) |
| 85 Years and over | 240 (1.3%) | 665 (3.3%) |
| Total | 18,879 (100.0%) | 20,252 (100.0%) |
Families and Households in Person County
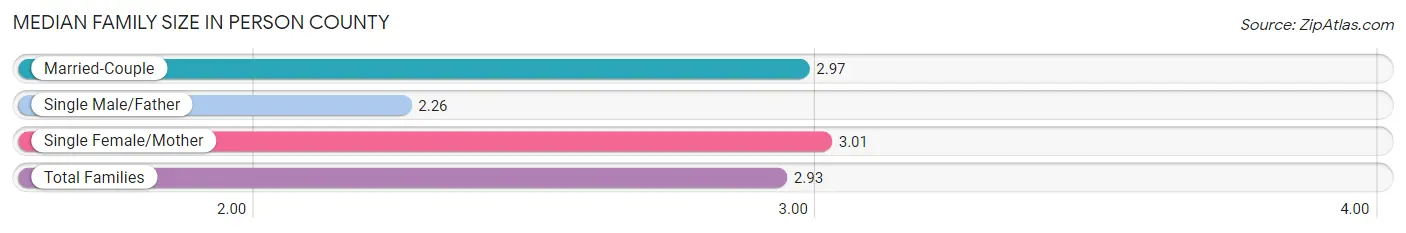
Median Family Size in Person County
The median family size in Person County is 2.93 persons per family, with single female/mother families (2,295 | 21.3%) accounting for the largest median family size of 3.01 persons per family. On the other hand, single male/father families (715 | 6.6%) represent the smallest median family size with 2.26 persons per family.
| Family Type | # Families | Family Size |
| Married-Couple | 7,772 (72.1%) | 2.97 |
| Single Male/Father | 715 (6.6%) | 2.26 |
| Single Female/Mother | 2,295 (21.3%) | 3.01 |
| Total Families | 10,782 (100.0%) | 2.93 |
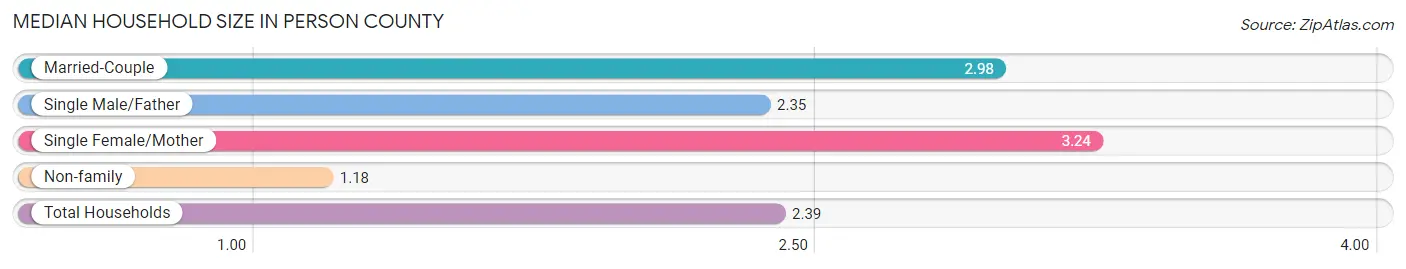
Median Household Size in Person County
The median household size in Person County is 2.39 persons per household, with single female/mother households (2,295 | 14.2%) accounting for the largest median household size of 3.24 persons per household. non-family households (5,357 | 33.2%) represent the smallest median household size with 1.18 persons per household.
| Household Type | # Households | Household Size |
| Married-Couple | 7,772 (48.2%) | 2.98 |
| Single Male/Father | 715 (4.4%) | 2.35 |
| Single Female/Mother | 2,295 (14.2%) | 3.24 |
| Non-family | 5,357 (33.2%) | 1.18 |
| Total Households | 16,139 (100.0%) | 2.39 |
Household Size by Marriage Status in Person County
Out of a total of 16,139 households in Person County, 10,782 (66.8%) are family households, while 5,357 (33.2%) are nonfamily households. The most numerous type of family households are 2-person households, comprising 5,198, and the most common type of nonfamily households are 1-person households, comprising 4,536.
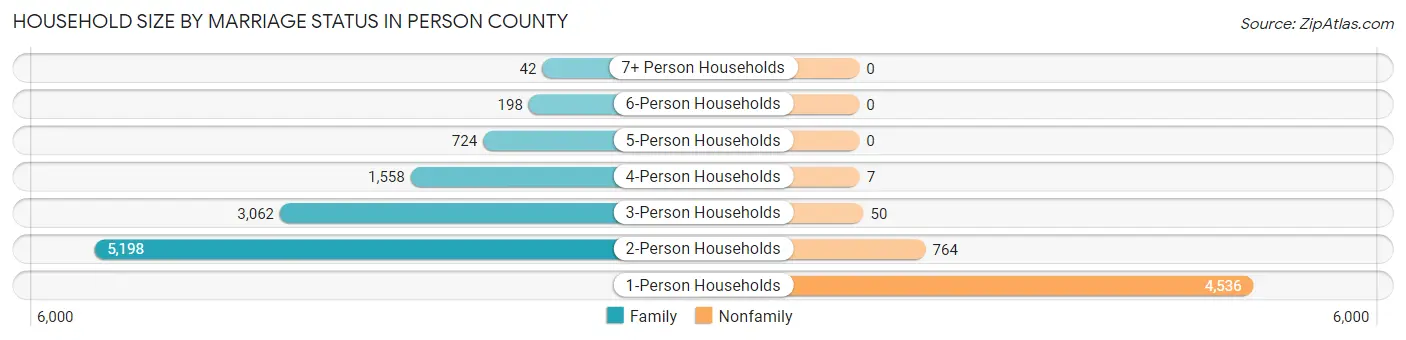
| Household Size | Family Households | Nonfamily Households |
| 1-Person Households | - | 4,536 (28.1%) |
| 2-Person Households | 5,198 (32.2%) | 764 (4.7%) |
| 3-Person Households | 3,062 (19.0%) | 50 (0.3%) |
| 4-Person Households | 1,558 (9.7%) | 7 (0.0%) |
| 5-Person Households | 724 (4.5%) | 0 (0.0%) |
| 6-Person Households | 198 (1.2%) | 0 (0.0%) |
| 7+ Person Households | 42 (0.3%) | 0 (0.0%) |
| Total | 10,782 (66.8%) | 5,357 (33.2%) |
Female Fertility in Person County
Fertility by Age in Person County
Average fertility rate in Person County is 56.0 births per 1,000 women. Women in the age bracket of 20 to 34 years have the highest fertility rate with 109.0 births per 1,000 women. Women in the age bracket of 20 to 34 years acount for 77.4% of all women with births.
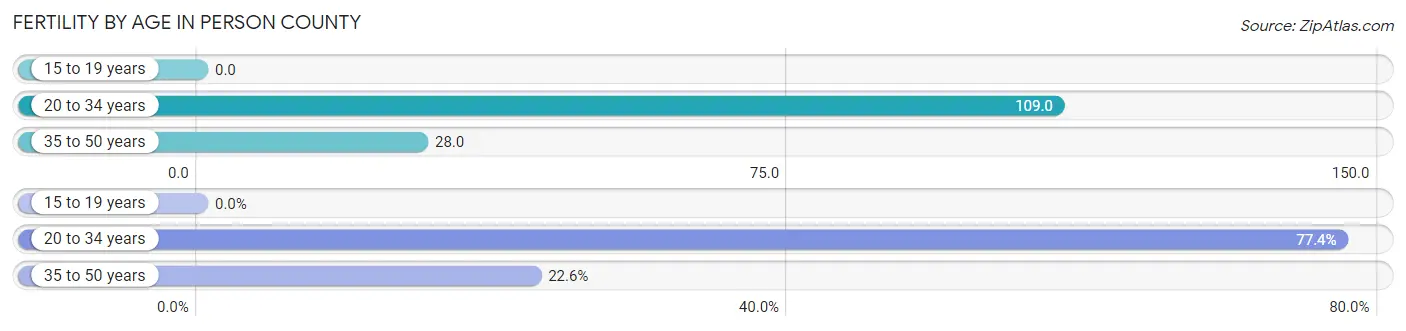
| Age Bracket | Women with Births | Births / 1,000 Women |
| 15 to 19 years | 0 (0.0%) | 0.0 |
| 20 to 34 years | 356 (77.4%) | 109.0 |
| 35 to 50 years | 104 (22.6%) | 28.0 |
| Total | 460 (100.0%) | 56.0 |
Fertility by Age by Marriage Status in Person County
68.7% of women with births (460) in Person County are married. The highest percentage of unmarried women with births falls into 20 to 34 years age bracket with 37.9% of them unmarried at the time of birth, while the lowest percentage of unmarried women with births belong to 35 to 50 years age bracket with 8.7% of them unmarried.
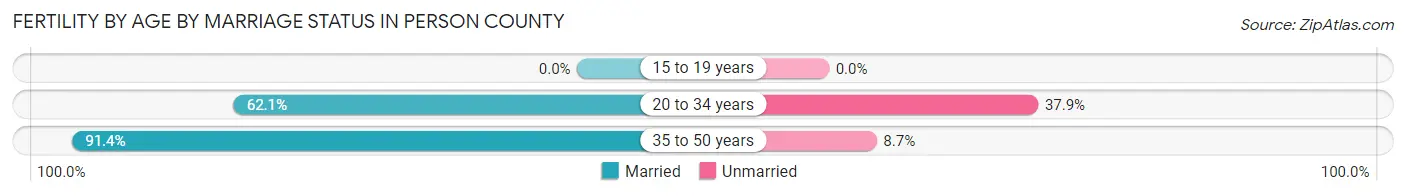
| Age Bracket | Married | Unmarried |
| 15 to 19 years | 0 (0.0%) | 0 (0.0%) |
| 20 to 34 years | 221 (62.1%) | 135 (37.9%) |
| 35 to 50 years | 95 (91.3%) | 9 (8.6%) |
| Total | 316 (68.7%) | 144 (31.3%) |
Fertility by Education in Person County
Average fertility rate in Person County is 56.0 births per 1,000 women. Women with the education attainment of high school diploma have the highest fertility rate of 83.0 births per 1,000 women, while women with the education attainment of less than high school have the lowest fertility at 2.0 births per 1,000 women. Women with the education attainment of college or associate's degree represent 47.0% of all women with births.
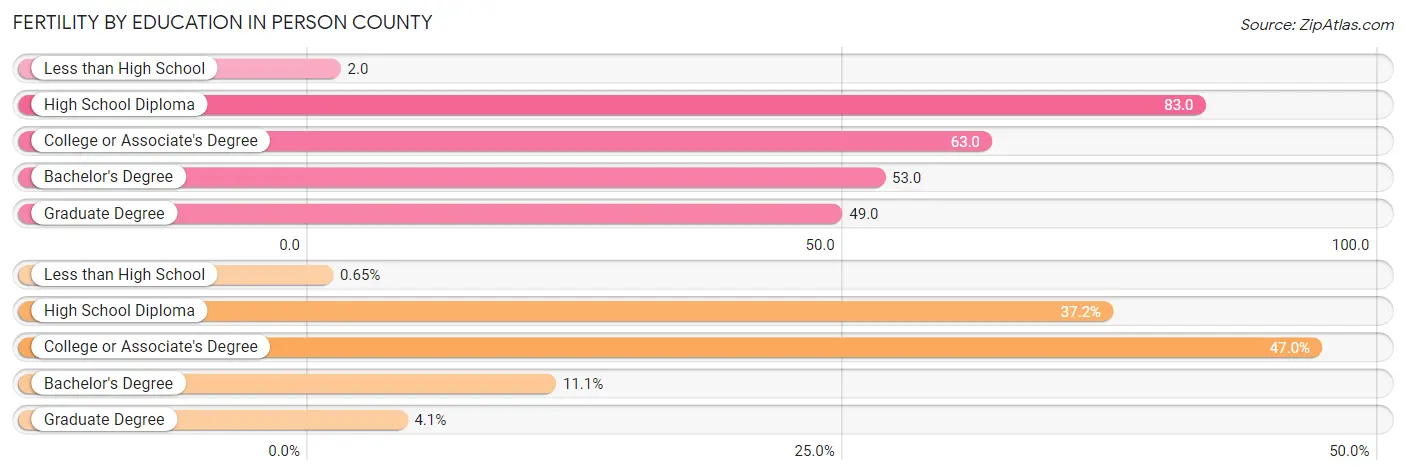
| Educational Attainment | Women with Births | Births / 1,000 Women |
| Less than High School | 3 (0.6%) | 2.0 |
| High School Diploma | 171 (37.2%) | 83.0 |
| College or Associate's Degree | 216 (47.0%) | 63.0 |
| Bachelor's Degree | 51 (11.1%) | 53.0 |
| Graduate Degree | 19 (4.1%) | 49.0 |
| Total | 460 (100.0%) | 56.0 |
Fertility by Education by Marriage Status in Person County
31.3% of women with births in Person County are unmarried. Women with the educational attainment of less than high school are most likely to be married with 100.0% of them married at childbirth, while women with the educational attainment of college or associate's degree are least likely to be married with 63.9% of them unmarried at childbirth.
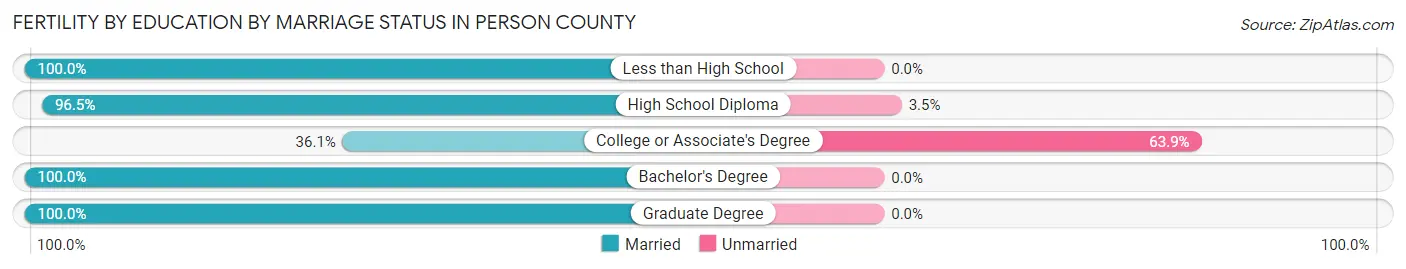
| Educational Attainment | Married | Unmarried |
| Less than High School | 3 (100.0%) | 0 (0.0%) |
| High School Diploma | 165 (96.5%) | 6 (3.5%) |
| College or Associate's Degree | 78 (36.1%) | 138 (63.9%) |
| Bachelor's Degree | 51 (100.0%) | 0 (0.0%) |
| Graduate Degree | 19 (100.0%) | 0 (0.0%) |
| Total | 316 (68.7%) | 144 (31.3%) |
Employment Characteristics in Person County
Employment by Class of Employer in Person County
Among the 18,393 employed individuals in Person County, private company employees (12,912 | 70.2%), local government employees (1,636 | 8.9%), and not-for-profit organizations (1,140 | 6.2%) make up the most common classes of employment.
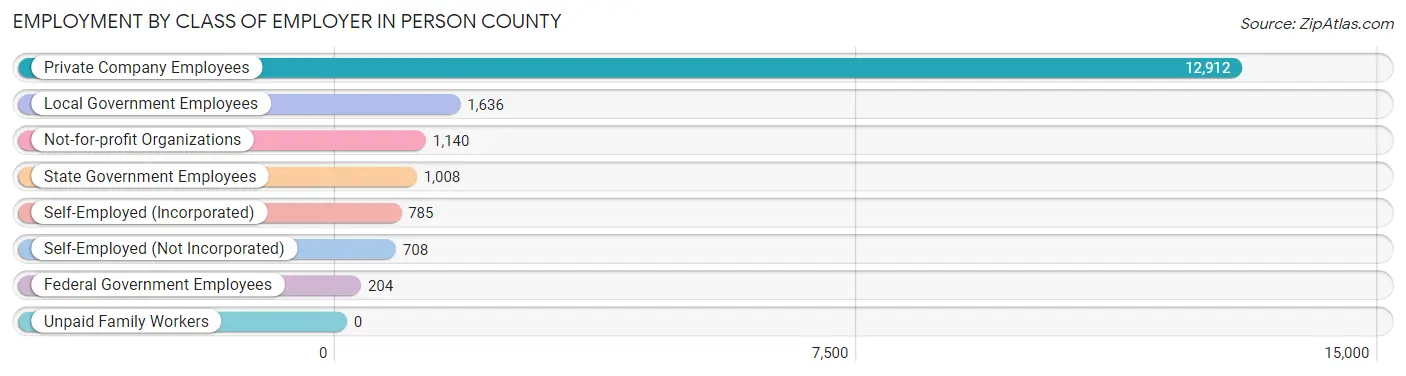
| Employer Class | # Employees | % Employees |
| Private Company Employees | 12,912 | 70.2% |
| Self-Employed (Incorporated) | 785 | 4.3% |
| Self-Employed (Not Incorporated) | 708 | 3.8% |
| Not-for-profit Organizations | 1,140 | 6.2% |
| Local Government Employees | 1,636 | 8.9% |
| State Government Employees | 1,008 | 5.5% |
| Federal Government Employees | 204 | 1.1% |
| Unpaid Family Workers | 0 | 0.0% |
| Total | 18,393 | 100.0% |
Employment Status by Age in Person County
According to the labor force statistics for Person County, out of the total population over 16 years of age (32,143), 60.6% or 19,479 individuals are in the labor force, with 3.7% or 721 of them unemployed. The age group with the highest labor force participation rate is 30 to 34 years, with 91.3% or 2,083 individuals in the labor force. Within the labor force, the 20 to 24 years age range has the highest percentage of unemployed individuals, with 8.5% or 149 of them being unemployed.
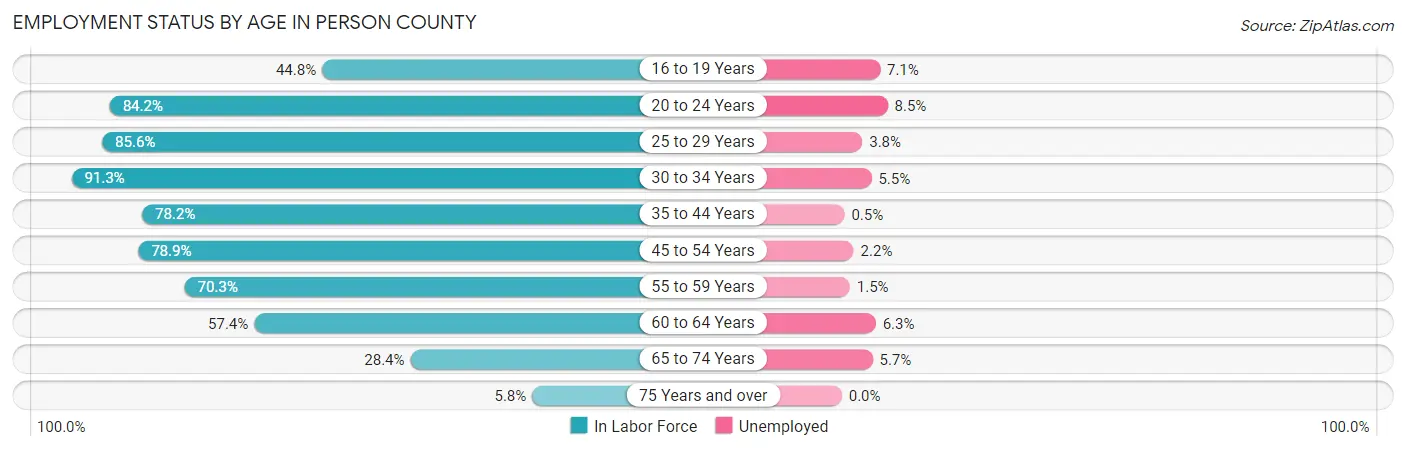
| Age Bracket | In Labor Force | Unemployed |
| 16 to 19 Years | 938 (44.8%) | 67 (7.1%) |
| 20 to 24 Years | 1,751 (84.2%) | 149 (8.5%) |
| 25 to 29 Years | 1,926 (85.6%) | 73 (3.8%) |
| 30 to 34 Years | 2,083 (91.3%) | 115 (5.5%) |
| 35 to 44 Years | 3,393 (78.2%) | 17 (0.5%) |
| 45 to 54 Years | 3,981 (78.9%) | 88 (2.2%) |
| 55 to 59 Years | 2,012 (70.3%) | 30 (1.5%) |
| 60 to 64 Years | 1,855 (57.4%) | 117 (6.3%) |
| 65 to 74 Years | 1,353 (28.4%) | 77 (5.7%) |
| 75 Years and over | 185 (5.8%) | 0 (0.0%) |
| Total | 19,479 (60.6%) | 721 (3.7%) |
Employment Status by Educational Attainment in Person County
According to labor force statistics for Person County, 76.2% of individuals (15,248) out of the total population between 25 and 64 years of age (20,010) are in the labor force, with 2.9% or 442 of them being unemployed. The group with the highest labor force participation rate are those with the educational attainment of bachelor's degree or higher, with 85.7% or 3,083 individuals in the labor force. Within the labor force, individuals with high school diploma education have the highest percentage of unemployment, with 4.1% or 211 of them being unemployed.
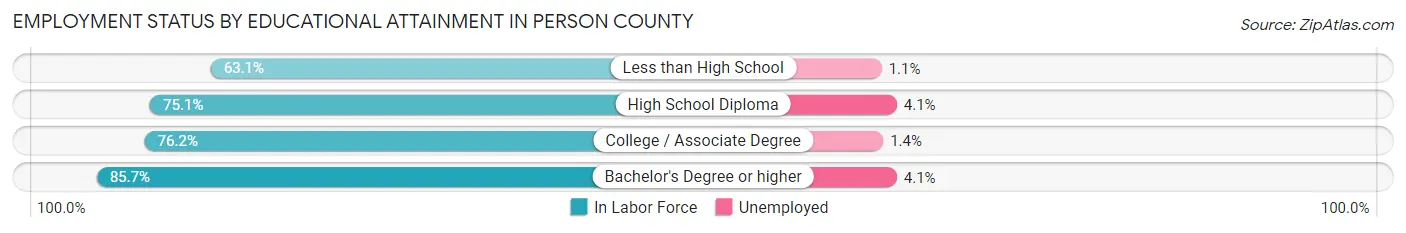
| Educational Attainment | In Labor Force | Unemployed |
| Less than High School | 1,265 (63.1%) | 22 (1.1%) |
| High School Diploma | 5,150 (75.1%) | 281 (4.1%) |
| College / Associate Degree | 5,753 (76.2%) | 106 (1.4%) |
| Bachelor's Degree or higher | 3,083 (85.7%) | 148 (4.1%) |
| Total | 15,248 (76.2%) | 580 (2.9%) |
Employment Occupations by Sex in Person County
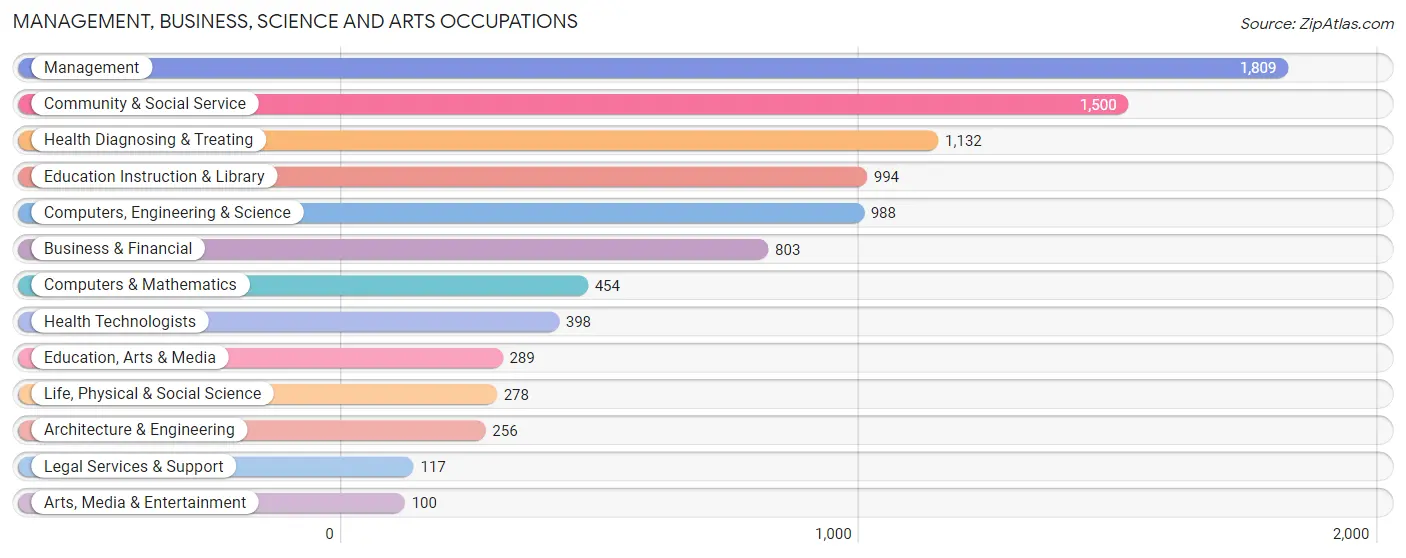
Management, Business, Science and Arts Occupations
The most common Management, Business, Science and Arts occupations in Person County are Management (1,809 | 9.7%), Community & Social Service (1,500 | 8.0%), Health Diagnosing & Treating (1,132 | 6.0%), Education Instruction & Library (994 | 5.3%), and Computers, Engineering & Science (988 | 5.3%).
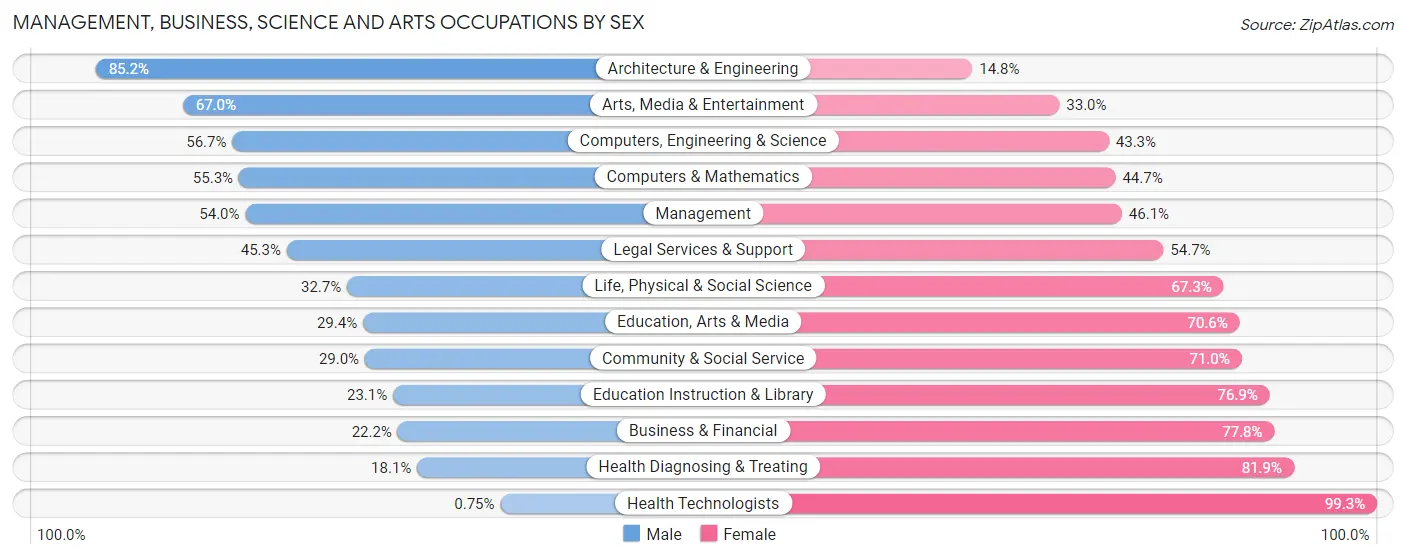
Management, Business, Science and Arts Occupations by Sex
Within the Management, Business, Science and Arts occupations in Person County, the most male-oriented occupations are Architecture & Engineering (85.2%), Arts, Media & Entertainment (67.0%), and Computers, Engineering & Science (56.7%), while the most female-oriented occupations are Health Technologists (99.3%), Health Diagnosing & Treating (81.9%), and Business & Financial (77.8%).
| Occupation | Male | Female |
| Management | 976 (53.9%) | 833 (46.1%) |
| Business & Financial | 178 (22.2%) | 625 (77.8%) |
| Computers, Engineering & Science | 560 (56.7%) | 428 (43.3%) |
| Computers & Mathematics | 251 (55.3%) | 203 (44.7%) |
| Architecture & Engineering | 218 (85.2%) | 38 (14.8%) |
| Life, Physical & Social Science | 91 (32.7%) | 187 (67.3%) |
| Community & Social Service | 435 (29.0%) | 1,065 (71.0%) |
| Education, Arts & Media | 85 (29.4%) | 204 (70.6%) |
| Legal Services & Support | 53 (45.3%) | 64 (54.7%) |
| Education Instruction & Library | 230 (23.1%) | 764 (76.9%) |
| Arts, Media & Entertainment | 67 (67.0%) | 33 (33.0%) |
| Health Diagnosing & Treating | 205 (18.1%) | 927 (81.9%) |
| Health Technologists | 3 (0.7%) | 395 (99.3%) |
| Total (Category) | 2,354 (37.8%) | 3,878 (62.2%) |
| Total (Overall) | 9,560 (51.0%) | 9,175 (49.0%) |
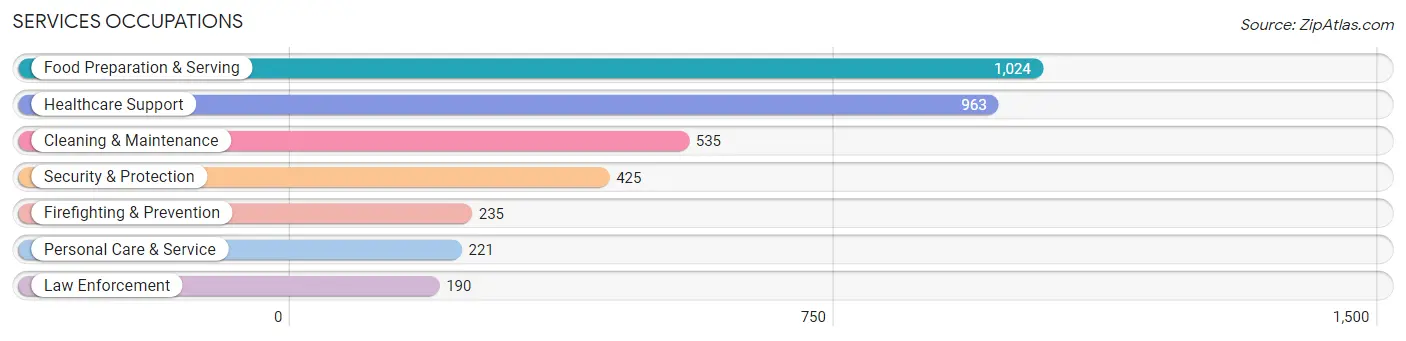
Services Occupations
The most common Services occupations in Person County are Food Preparation & Serving (1,024 | 5.5%), Healthcare Support (963 | 5.1%), Cleaning & Maintenance (535 | 2.9%), Security & Protection (425 | 2.3%), and Firefighting & Prevention (235 | 1.3%).
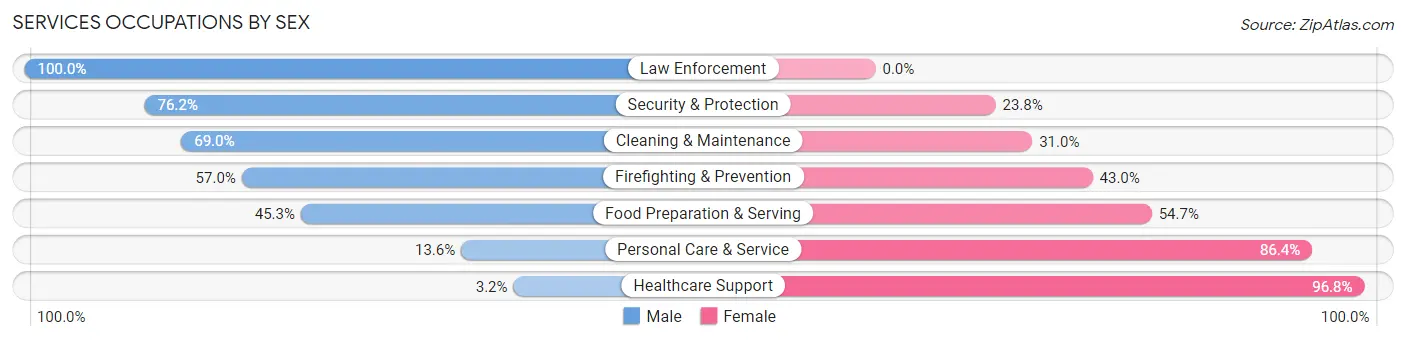
Services Occupations by Sex
Within the Services occupations in Person County, the most male-oriented occupations are Law Enforcement (100.0%), Security & Protection (76.2%), and Cleaning & Maintenance (69.0%), while the most female-oriented occupations are Healthcare Support (96.8%), Personal Care & Service (86.4%), and Food Preparation & Serving (54.7%).
| Occupation | Male | Female |
| Healthcare Support | 31 (3.2%) | 932 (96.8%) |
| Security & Protection | 324 (76.2%) | 101 (23.8%) |
| Firefighting & Prevention | 134 (57.0%) | 101 (43.0%) |
| Law Enforcement | 190 (100.0%) | 0 (0.0%) |
| Food Preparation & Serving | 464 (45.3%) | 560 (54.7%) |
| Cleaning & Maintenance | 369 (69.0%) | 166 (31.0%) |
| Personal Care & Service | 30 (13.6%) | 191 (86.4%) |
| Total (Category) | 1,218 (38.5%) | 1,950 (61.6%) |
| Total (Overall) | 9,560 (51.0%) | 9,175 (49.0%) |
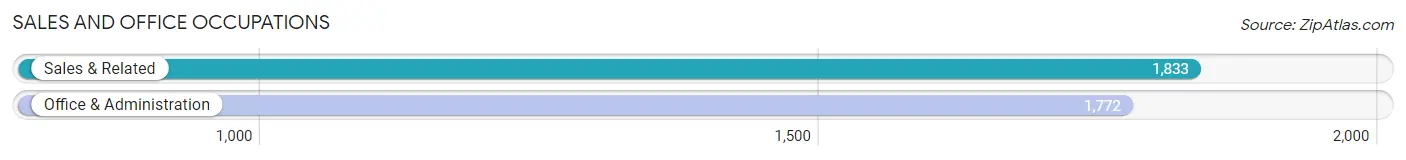
Sales and Office Occupations
The most common Sales and Office occupations in Person County are Sales & Related (1,833 | 9.8%), and Office & Administration (1,772 | 9.5%).
Sales and Office Occupations by Sex
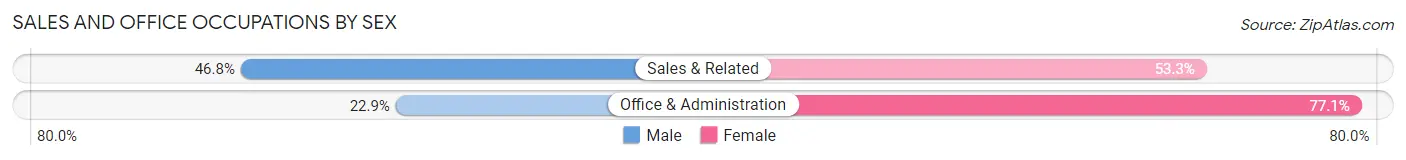
| Occupation | Male | Female |
| Sales & Related | 857 (46.8%) | 976 (53.2%) |
| Office & Administration | 406 (22.9%) | 1,366 (77.1%) |
| Total (Category) | 1,263 (35.0%) | 2,342 (65.0%) |
| Total (Overall) | 9,560 (51.0%) | 9,175 (49.0%) |
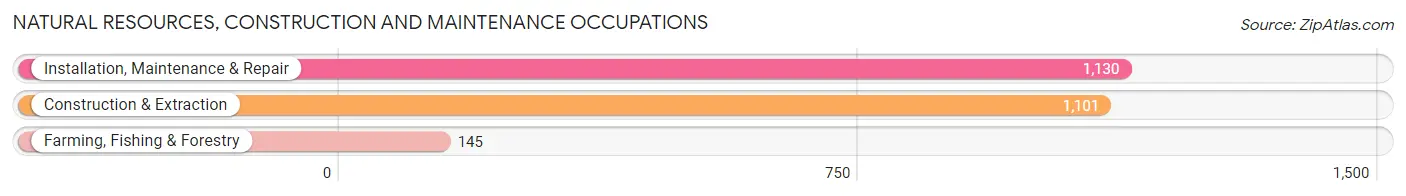
Natural Resources, Construction and Maintenance Occupations
The most common Natural Resources, Construction and Maintenance occupations in Person County are Installation, Maintenance & Repair (1,130 | 6.0%), Construction & Extraction (1,101 | 5.9%), and Farming, Fishing & Forestry (145 | 0.8%).
Natural Resources, Construction and Maintenance Occupations by Sex
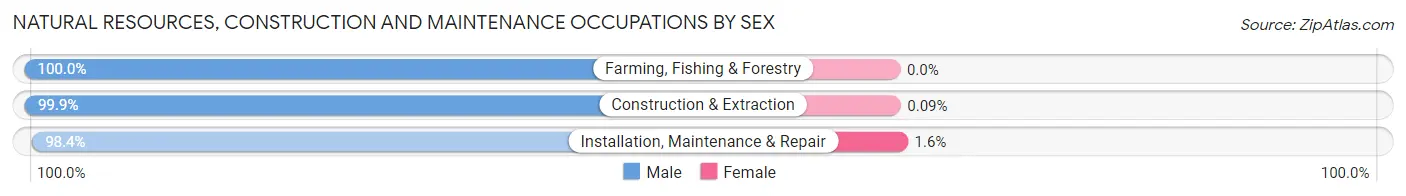
| Occupation | Male | Female |
| Farming, Fishing & Forestry | 145 (100.0%) | 0 (0.0%) |
| Construction & Extraction | 1,100 (99.9%) | 1 (0.1%) |
| Installation, Maintenance & Repair | 1,112 (98.4%) | 18 (1.6%) |
| Total (Category) | 2,357 (99.2%) | 19 (0.8%) |
| Total (Overall) | 9,560 (51.0%) | 9,175 (49.0%) |
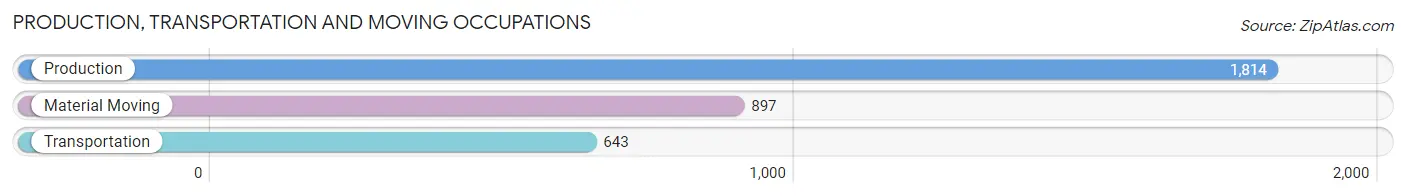
Production, Transportation and Moving Occupations
The most common Production, Transportation and Moving occupations in Person County are Production (1,814 | 9.7%), Material Moving (897 | 4.8%), and Transportation (643 | 3.4%).
Production, Transportation and Moving Occupations by Sex
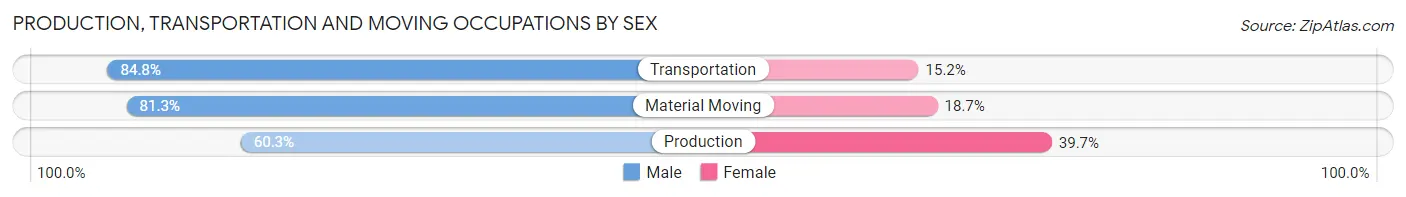
| Occupation | Male | Female |
| Production | 1,094 (60.3%) | 720 (39.7%) |
| Transportation | 545 (84.8%) | 98 (15.2%) |
| Material Moving | 729 (81.3%) | 168 (18.7%) |
| Total (Category) | 2,368 (70.6%) | 986 (29.4%) |
| Total (Overall) | 9,560 (51.0%) | 9,175 (49.0%) |
Employment Industries by Sex in Person County
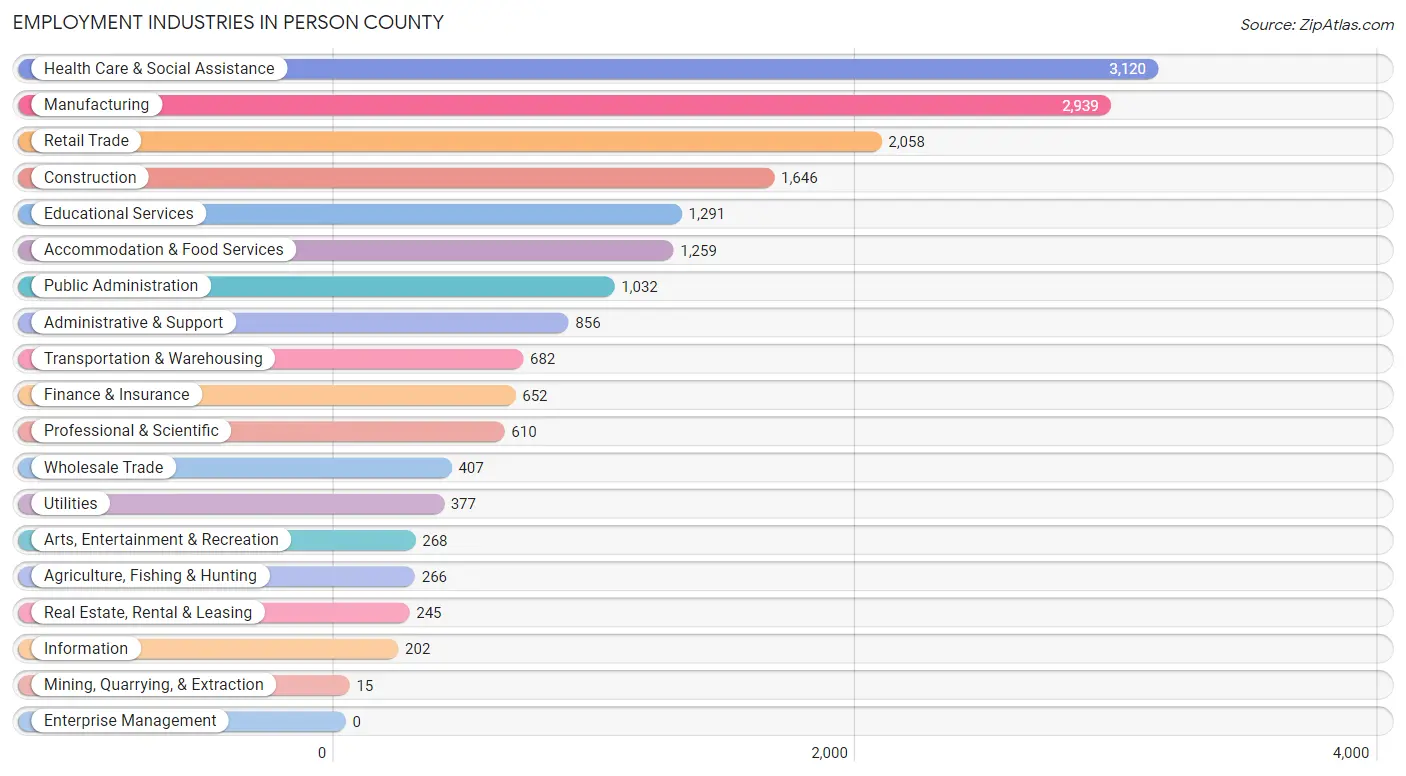
Employment Industries in Person County
The major employment industries in Person County include Health Care & Social Assistance (3,120 | 16.7%), Manufacturing (2,939 | 15.7%), Retail Trade (2,058 | 11.0%), Construction (1,646 | 8.8%), and Educational Services (1,291 | 6.9%).
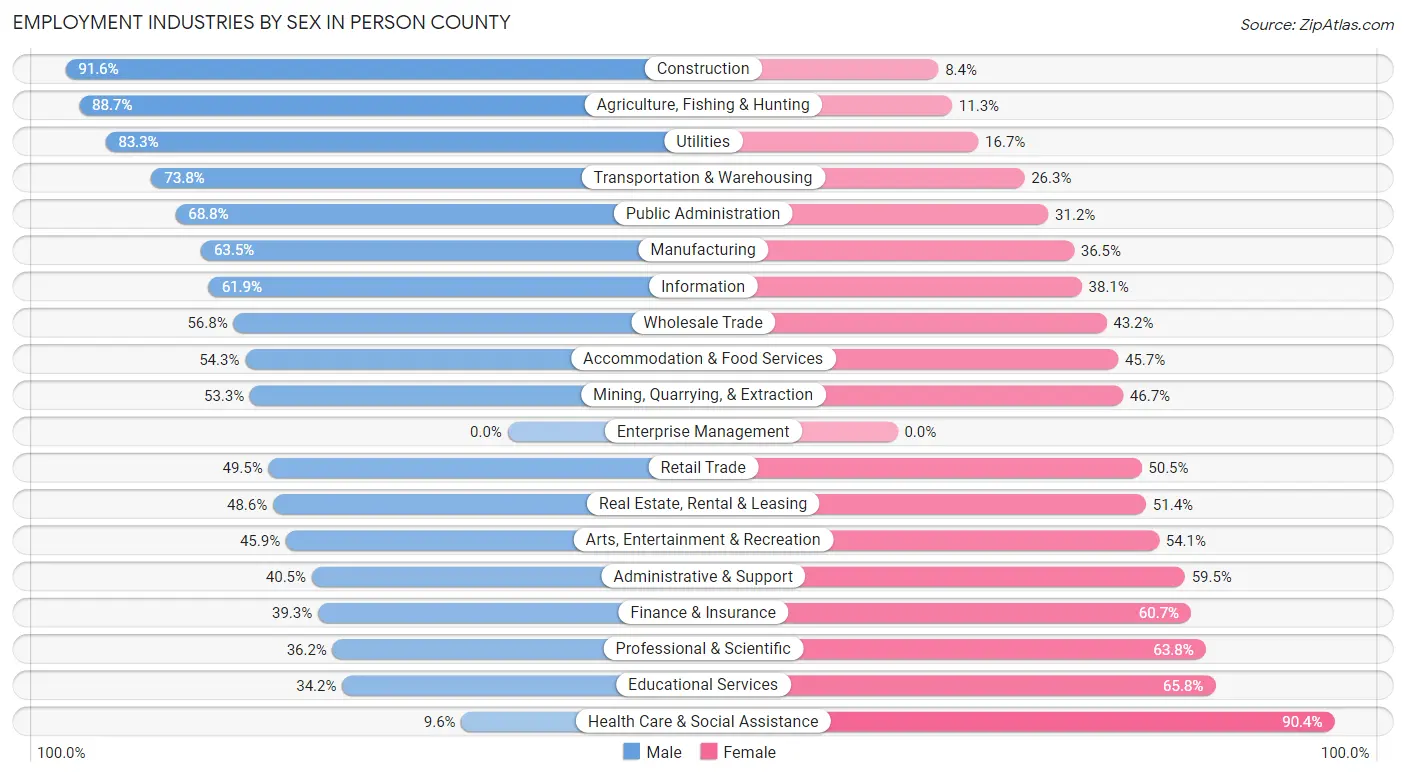
Employment Industries by Sex in Person County
The Person County industries that see more men than women are Construction (91.6%), Agriculture, Fishing & Hunting (88.7%), and Utilities (83.3%), whereas the industries that tend to have a higher number of women are Health Care & Social Assistance (90.4%), Educational Services (65.8%), and Professional & Scientific (63.8%).
| Industry | Male | Female |
| Agriculture, Fishing & Hunting | 236 (88.7%) | 30 (11.3%) |
| Mining, Quarrying, & Extraction | 8 (53.3%) | 7 (46.7%) |
| Construction | 1,507 (91.6%) | 139 (8.4%) |
| Manufacturing | 1,866 (63.5%) | 1,073 (36.5%) |
| Wholesale Trade | 231 (56.8%) | 176 (43.2%) |
| Retail Trade | 1,019 (49.5%) | 1,039 (50.5%) |
| Transportation & Warehousing | 503 (73.8%) | 179 (26.3%) |
| Utilities | 314 (83.3%) | 63 (16.7%) |
| Information | 125 (61.9%) | 77 (38.1%) |
| Finance & Insurance | 256 (39.3%) | 396 (60.7%) |
| Real Estate, Rental & Leasing | 119 (48.6%) | 126 (51.4%) |
| Professional & Scientific | 221 (36.2%) | 389 (63.8%) |
| Enterprise Management | 0 (0.0%) | 0 (0.0%) |
| Administrative & Support | 347 (40.5%) | 509 (59.5%) |
| Educational Services | 442 (34.2%) | 849 (65.8%) |
| Health Care & Social Assistance | 299 (9.6%) | 2,821 (90.4%) |
| Arts, Entertainment & Recreation | 123 (45.9%) | 145 (54.1%) |
| Accommodation & Food Services | 684 (54.3%) | 575 (45.7%) |
| Public Administration | 710 (68.8%) | 322 (31.2%) |
| Total | 9,560 (51.0%) | 9,175 (49.0%) |
Education in Person County
School Enrollment in Person County
The most common levels of schooling among the 8,611 students in Person County are middle school (2,140 | 24.8%), college / undergraduate (1,955 | 22.7%), and high school (1,881 | 21.8%).
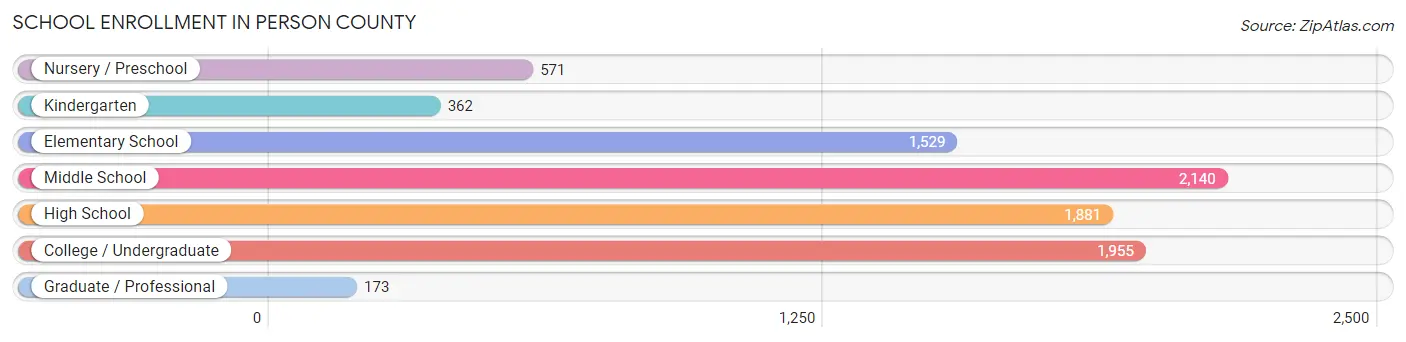
| School Level | # Students | % Students |
| Nursery / Preschool | 571 | 6.6% |
| Kindergarten | 362 | 4.2% |
| Elementary School | 1,529 | 17.8% |
| Middle School | 2,140 | 24.8% |
| High School | 1,881 | 21.8% |
| College / Undergraduate | 1,955 | 22.7% |
| Graduate / Professional | 173 | 2.0% |
| Total | 8,611 | 100.0% |
School Enrollment by Age by Funding Source in Person County
Out of a total of 8,611 students who are enrolled in schools in Person County, 1,094 (12.7%) attend a private institution, while the remaining 7,517 (87.3%) are enrolled in public schools. The age group of 3 to 4 year olds has the highest likelihood of being enrolled in private schools, with 227 (42.9% in the age bracket) enrolled. Conversely, the age group of 18 to 19 year olds has the lowest likelihood of being enrolled in a private school, with 837 (100.0% in the age bracket) attending a public institution.
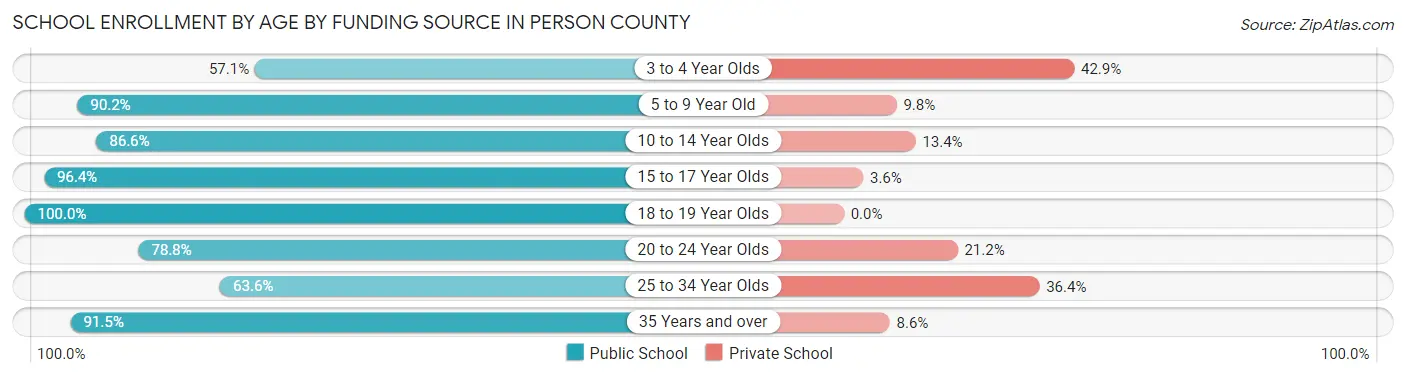
| Age Bracket | Public School | Private School |
| 3 to 4 Year Olds | 302 (57.1%) | 227 (42.9%) |
| 5 to 9 Year Old | 1,447 (90.2%) | 158 (9.8%) |
| 10 to 14 Year Olds | 2,249 (86.6%) | 347 (13.4%) |
| 15 to 17 Year Olds | 1,335 (96.4%) | 50 (3.6%) |
| 18 to 19 Year Olds | 837 (100.0%) | 0 (0.0%) |
| 20 to 24 Year Olds | 394 (78.8%) | 106 (21.2%) |
| 25 to 34 Year Olds | 246 (63.6%) | 141 (36.4%) |
| 35 Years and over | 706 (91.4%) | 66 (8.6%) |
| Total | 7,517 (87.3%) | 1,094 (12.7%) |
Educational Attainment by Field of Study in Person County
Business (1,167 | 22.8%), education (759 | 14.8%), science & technology (561 | 11.0%), bio, nature & agricultural (468 | 9.1%), and social sciences (415 | 8.1%) are the most common fields of study among 5,125 individuals in Person County who have obtained a bachelor's degree or higher.
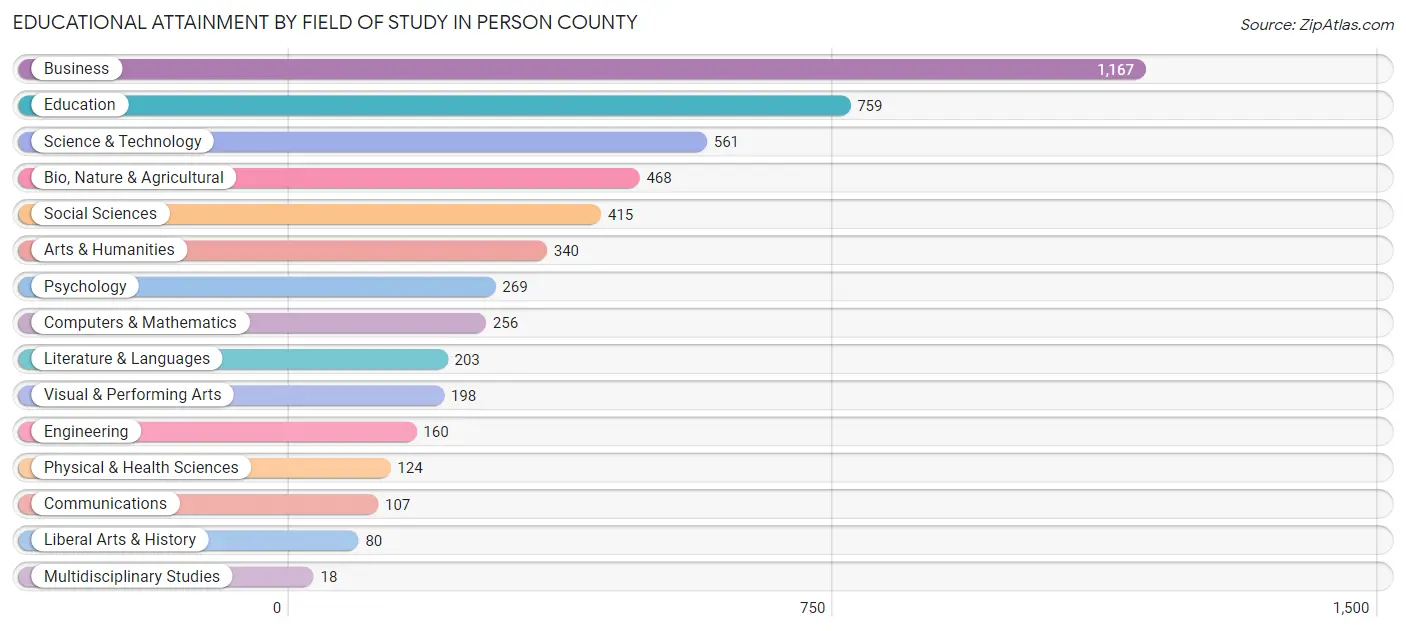
| Field of Study | # Graduates | % Graduates |
| Computers & Mathematics | 256 | 5.0% |
| Bio, Nature & Agricultural | 468 | 9.1% |
| Physical & Health Sciences | 124 | 2.4% |
| Psychology | 269 | 5.2% |
| Social Sciences | 415 | 8.1% |
| Engineering | 160 | 3.1% |
| Multidisciplinary Studies | 18 | 0.4% |
| Science & Technology | 561 | 11.0% |
| Business | 1,167 | 22.8% |
| Education | 759 | 14.8% |
| Literature & Languages | 203 | 4.0% |
| Liberal Arts & History | 80 | 1.6% |
| Visual & Performing Arts | 198 | 3.9% |
| Communications | 107 | 2.1% |
| Arts & Humanities | 340 | 6.6% |
| Total | 5,125 | 100.0% |
Transportation & Commute in Person County
Vehicle Availability by Sex in Person County
The most prevalent vehicle ownership categories in Person County are males with 2 vehicles (3,261, accounting for 34.8%) and females with 2 vehicles (2,646, making up 36.3%).
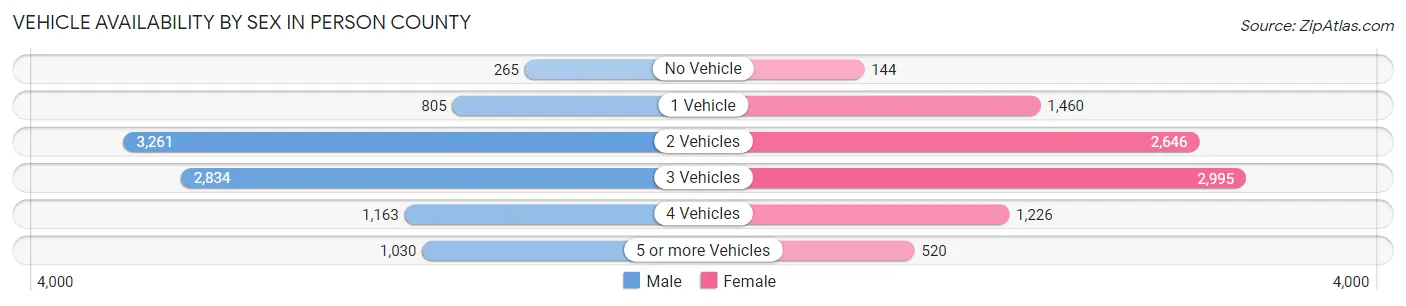
| Vehicles Available | Male | Female |
| No Vehicle | 265 (2.8%) | 144 (1.6%) |
| 1 Vehicle | 805 (8.6%) | 1,460 (16.2%) |
| 2 Vehicles | 3,261 (34.8%) | 2,646 (29.4%) |
| 3 Vehicles | 2,834 (30.3%) | 2,995 (33.3%) |
| 4 Vehicles | 1,163 (12.4%) | 1,226 (13.6%) |
| 5 or more Vehicles | 1,030 (11.0%) | 520 (5.8%) |
| Total | 9,358 (100.0%) | 8,991 (100.0%) |
Commute Time in Person County
The most frequently occuring commute durations in Person County are 45 to 59 minutes (2,353 commuters, 14.1%), 15 to 19 minutes (2,132 commuters, 12.8%), and 10 to 14 minutes (2,010 commuters, 12.0%).
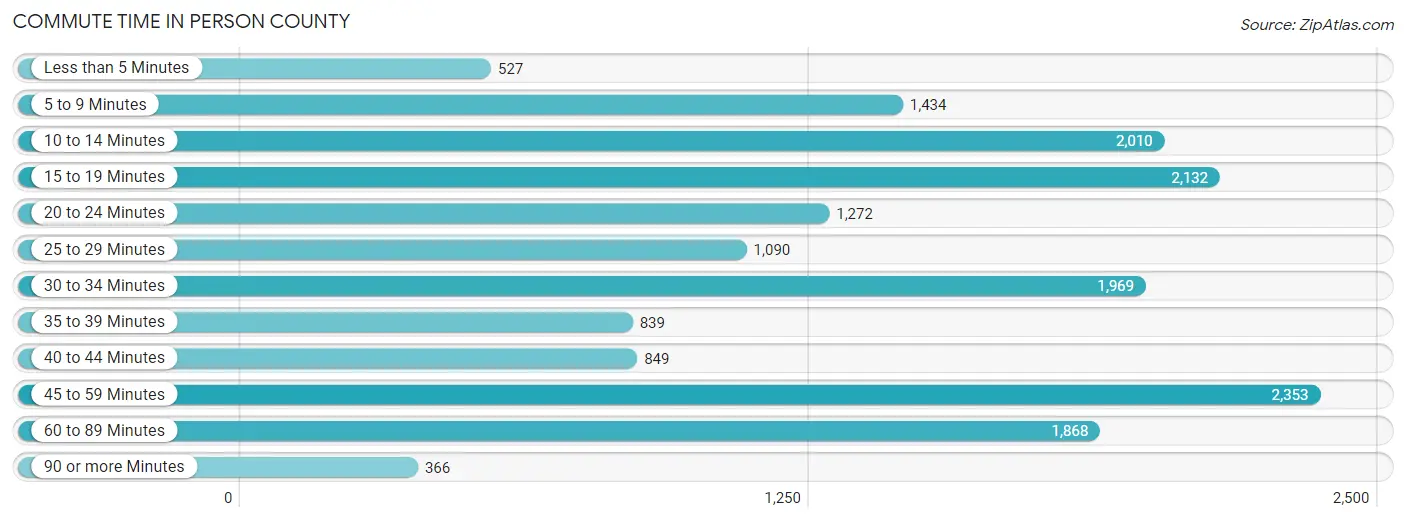
| Commute Time | # Commuters | % Commuters |
| Less than 5 Minutes | 527 | 3.2% |
| 5 to 9 Minutes | 1,434 | 8.6% |
| 10 to 14 Minutes | 2,010 | 12.0% |
| 15 to 19 Minutes | 2,132 | 12.8% |
| 20 to 24 Minutes | 1,272 | 7.6% |
| 25 to 29 Minutes | 1,090 | 6.5% |
| 30 to 34 Minutes | 1,969 | 11.8% |
| 35 to 39 Minutes | 839 | 5.0% |
| 40 to 44 Minutes | 849 | 5.1% |
| 45 to 59 Minutes | 2,353 | 14.1% |
| 60 to 89 Minutes | 1,868 | 11.2% |
| 90 or more Minutes | 366 | 2.2% |
Commute Time by Sex in Person County
The most common commute times in Person County are 45 to 59 minutes (1,103 commuters, 12.5%) for males and 45 to 59 minutes (1,250 commuters, 15.9%) for females.
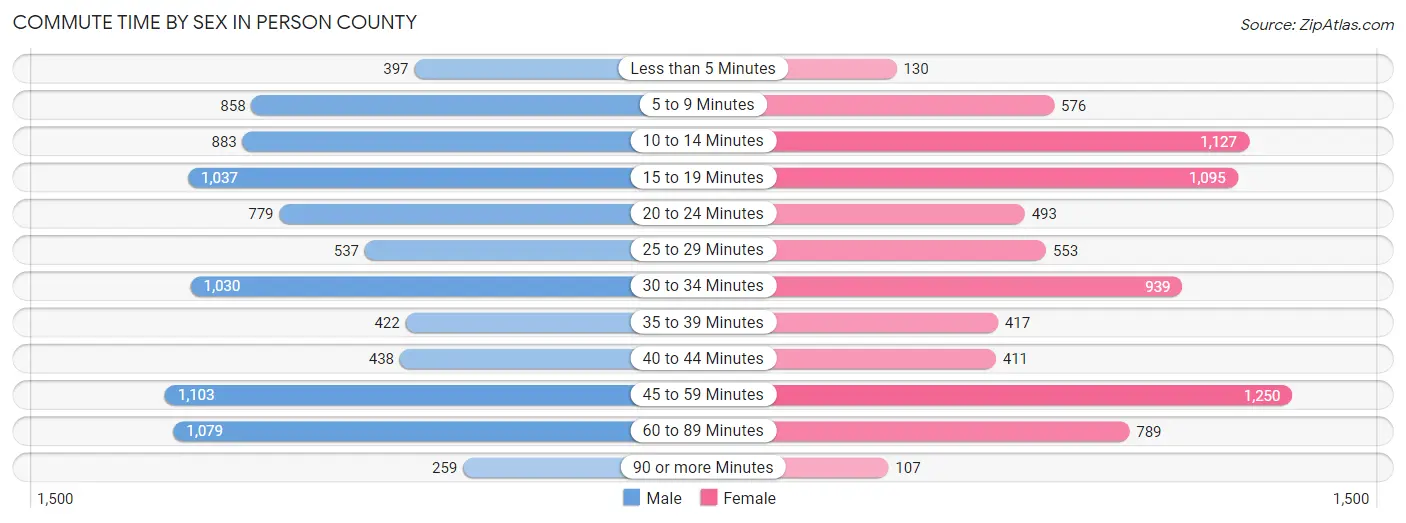
| Commute Time | Male | Female |
| Less than 5 Minutes | 397 (4.5%) | 130 (1.7%) |
| 5 to 9 Minutes | 858 (9.7%) | 576 (7.3%) |
| 10 to 14 Minutes | 883 (10.0%) | 1,127 (14.3%) |
| 15 to 19 Minutes | 1,037 (11.7%) | 1,095 (13.9%) |
| 20 to 24 Minutes | 779 (8.8%) | 493 (6.2%) |
| 25 to 29 Minutes | 537 (6.1%) | 553 (7.0%) |
| 30 to 34 Minutes | 1,030 (11.7%) | 939 (11.9%) |
| 35 to 39 Minutes | 422 (4.8%) | 417 (5.3%) |
| 40 to 44 Minutes | 438 (5.0%) | 411 (5.2%) |
| 45 to 59 Minutes | 1,103 (12.5%) | 1,250 (15.9%) |
| 60 to 89 Minutes | 1,079 (12.2%) | 789 (10.0%) |
| 90 or more Minutes | 259 (2.9%) | 107 (1.4%) |
Time of Departure to Work by Sex in Person County
The most frequent times of departure to work in Person County are 7:00 AM to 7:29 AM (1,324, 15.0%) for males and 7:00 AM to 7:29 AM (1,110, 14.1%) for females.
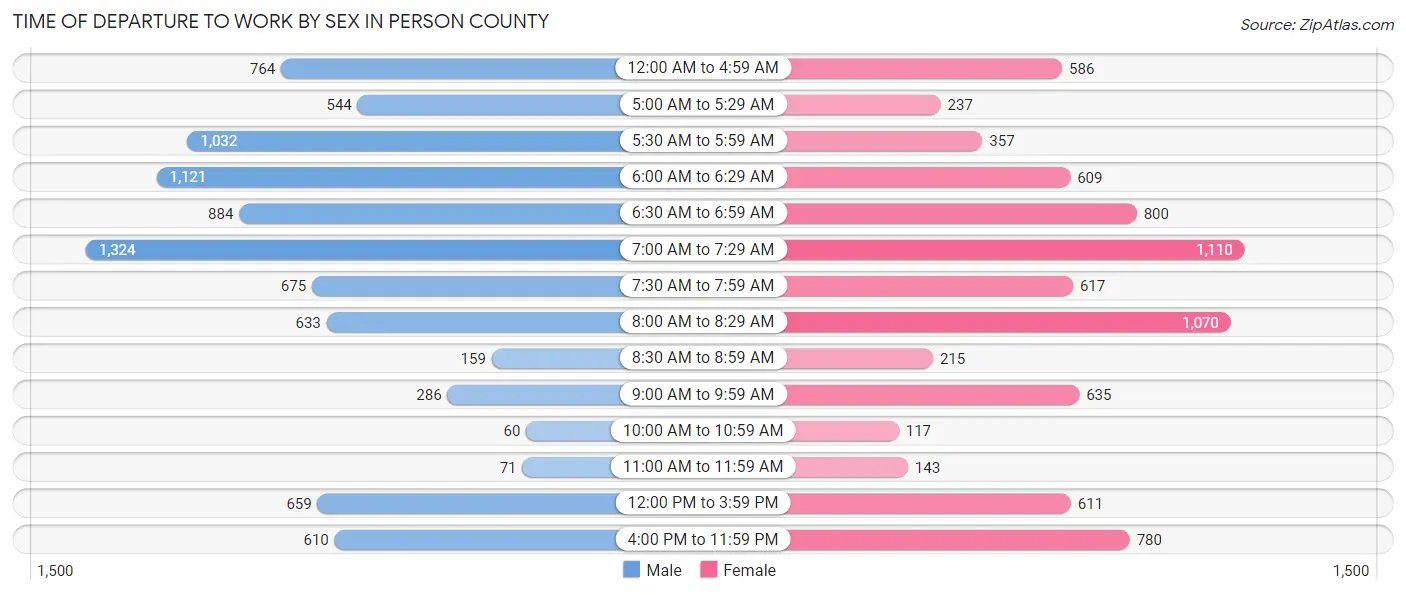
| Time of Departure | Male | Female |
| 12:00 AM to 4:59 AM | 764 (8.7%) | 586 (7.4%) |
| 5:00 AM to 5:29 AM | 544 (6.2%) | 237 (3.0%) |
| 5:30 AM to 5:59 AM | 1,032 (11.7%) | 357 (4.5%) |
| 6:00 AM to 6:29 AM | 1,121 (12.7%) | 609 (7.7%) |
| 6:30 AM to 6:59 AM | 884 (10.0%) | 800 (10.1%) |
| 7:00 AM to 7:29 AM | 1,324 (15.0%) | 1,110 (14.1%) |
| 7:30 AM to 7:59 AM | 675 (7.6%) | 617 (7.8%) |
| 8:00 AM to 8:29 AM | 633 (7.2%) | 1,070 (13.6%) |
| 8:30 AM to 8:59 AM | 159 (1.8%) | 215 (2.7%) |
| 9:00 AM to 9:59 AM | 286 (3.2%) | 635 (8.1%) |
| 10:00 AM to 10:59 AM | 60 (0.7%) | 117 (1.5%) |
| 11:00 AM to 11:59 AM | 71 (0.8%) | 143 (1.8%) |
| 12:00 PM to 3:59 PM | 659 (7.5%) | 611 (7.7%) |
| 4:00 PM to 11:59 PM | 610 (6.9%) | 780 (9.9%) |
| Total | 8,822 (100.0%) | 7,887 (100.0%) |
Housing Occupancy in Person County
Occupancy by Ownership in Person County
Of the total 16,139 dwellings in Person County, owner-occupied units account for 12,527 (77.6%), while renter-occupied units make up 3,612 (22.4%).
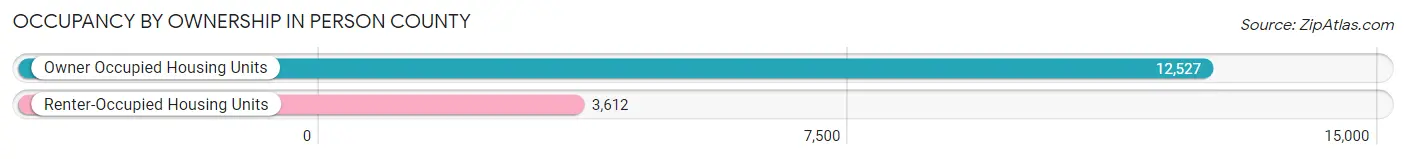
| Occupancy | # Housing Units | % Housing Units |
| Owner Occupied Housing Units | 12,527 | 77.6% |
| Renter-Occupied Housing Units | 3,612 | 22.4% |
| Total Occupied Housing Units | 16,139 | 100.0% |
Occupancy by Household Size in Person County
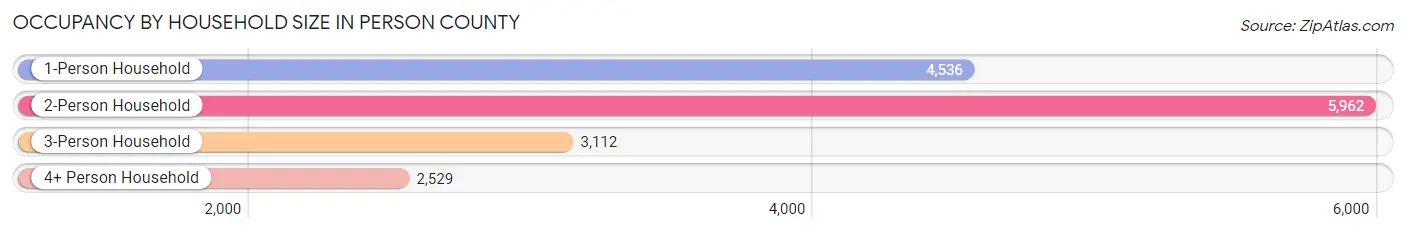
| Household Size | # Housing Units | % Housing Units |
| 1-Person Household | 4,536 | 28.1% |
| 2-Person Household | 5,962 | 36.9% |
| 3-Person Household | 3,112 | 19.3% |
| 4+ Person Household | 2,529 | 15.7% |
| Total Housing Units | 16,139 | 100.0% |
Occupancy by Ownership by Household Size in Person County
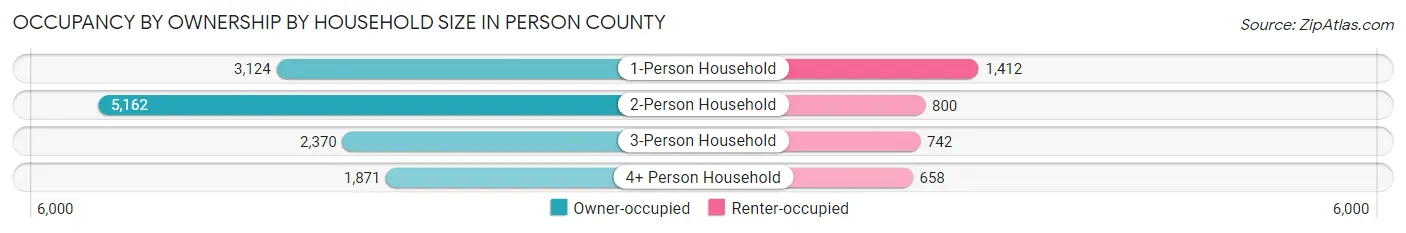
| Household Size | Owner-occupied | Renter-occupied |
| 1-Person Household | 3,124 (68.9%) | 1,412 (31.1%) |
| 2-Person Household | 5,162 (86.6%) | 800 (13.4%) |
| 3-Person Household | 2,370 (76.2%) | 742 (23.8%) |
| 4+ Person Household | 1,871 (74.0%) | 658 (26.0%) |
| Total Housing Units | 12,527 (77.6%) | 3,612 (22.4%) |
Occupancy by Educational Attainment in Person County
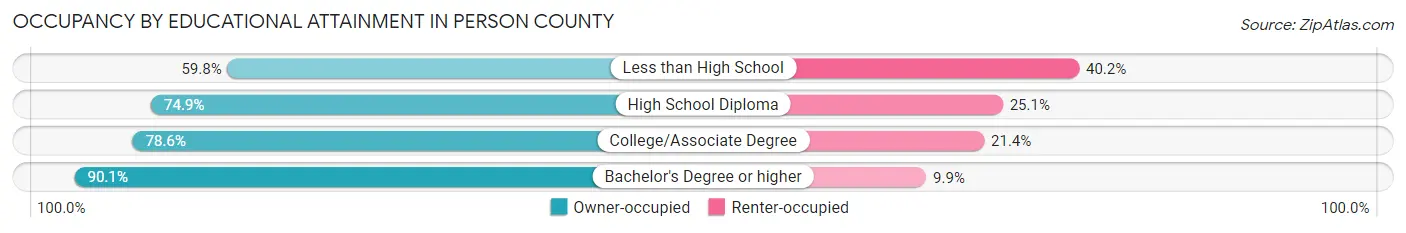
| Household Size | Owner-occupied | Renter-occupied |
| Less than High School | 924 (59.8%) | 622 (40.2%) |
| High School Diploma | 4,141 (74.9%) | 1,387 (25.1%) |
| College/Associate Degree | 4,818 (78.6%) | 1,312 (21.4%) |
| Bachelor's Degree or higher | 2,644 (90.1%) | 291 (9.9%) |
Occupancy by Age of Householder in Person County
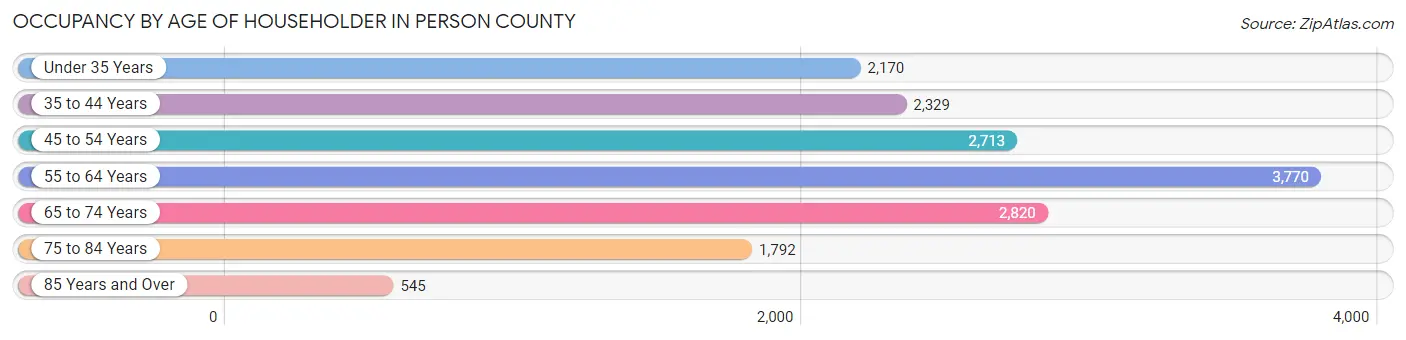
| Age Bracket | # Households | % Households |
| Under 35 Years | 2,170 | 13.5% |
| 35 to 44 Years | 2,329 | 14.4% |
| 45 to 54 Years | 2,713 | 16.8% |
| 55 to 64 Years | 3,770 | 23.4% |
| 65 to 74 Years | 2,820 | 17.5% |
| 75 to 84 Years | 1,792 | 11.1% |
| 85 Years and Over | 545 | 3.4% |
| Total | 16,139 | 100.0% |
Housing Finances in Person County
Median Income by Occupancy in Person County
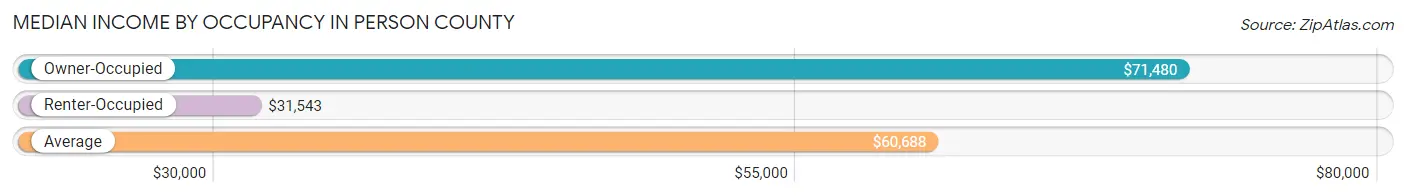
| Occupancy Type | # Households | Median Income |
| Owner-Occupied | 12,527 (77.6%) | $71,480 |
| Renter-Occupied | 3,612 (22.4%) | $31,543 |
| Average | 16,139 (100.0%) | $60,688 |
Occupancy by Householder Income Bracket in Person County
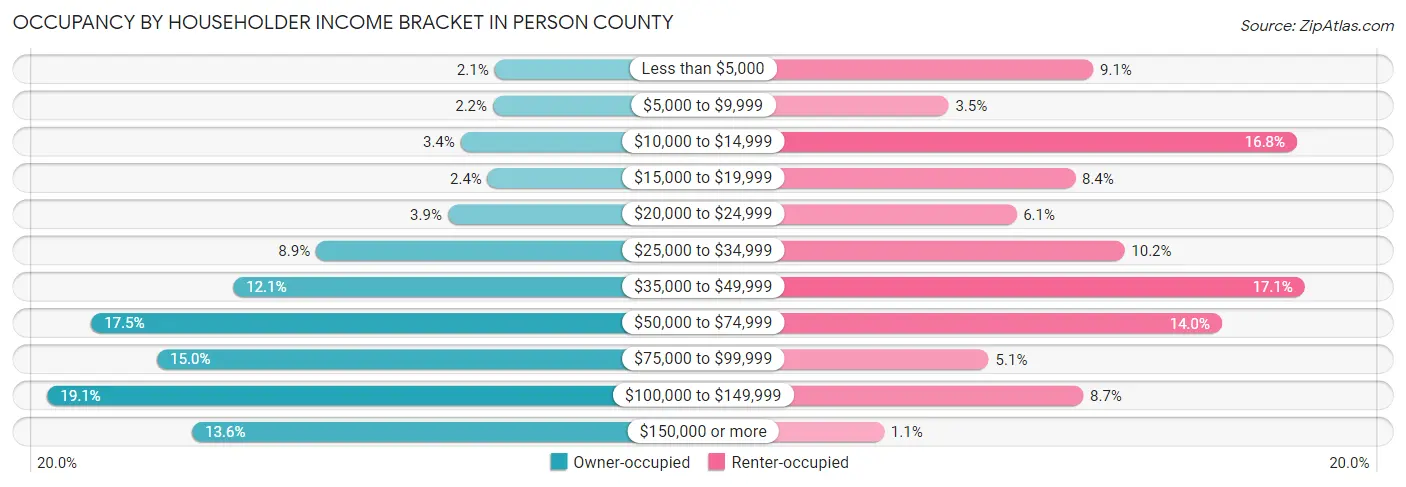
| Income Bracket | Owner-occupied | Renter-occupied |
| Less than $5,000 | 263 (2.1%) | 327 (9.0%) |
| $5,000 to $9,999 | 270 (2.2%) | 128 (3.5%) |
| $10,000 to $14,999 | 425 (3.4%) | 607 (16.8%) |
| $15,000 to $19,999 | 296 (2.4%) | 302 (8.4%) |
| $20,000 to $24,999 | 486 (3.9%) | 221 (6.1%) |
| $25,000 to $34,999 | 1,115 (8.9%) | 370 (10.2%) |
| $35,000 to $49,999 | 1,510 (12.0%) | 618 (17.1%) |
| $50,000 to $74,999 | 2,187 (17.5%) | 504 (14.0%) |
| $75,000 to $99,999 | 1,873 (14.9%) | 183 (5.1%) |
| $100,000 to $149,999 | 2,396 (19.1%) | 313 (8.7%) |
| $150,000 or more | 1,706 (13.6%) | 39 (1.1%) |
| Total | 12,527 (100.0%) | 3,612 (100.0%) |
Monthly Housing Cost Tiers in Person County
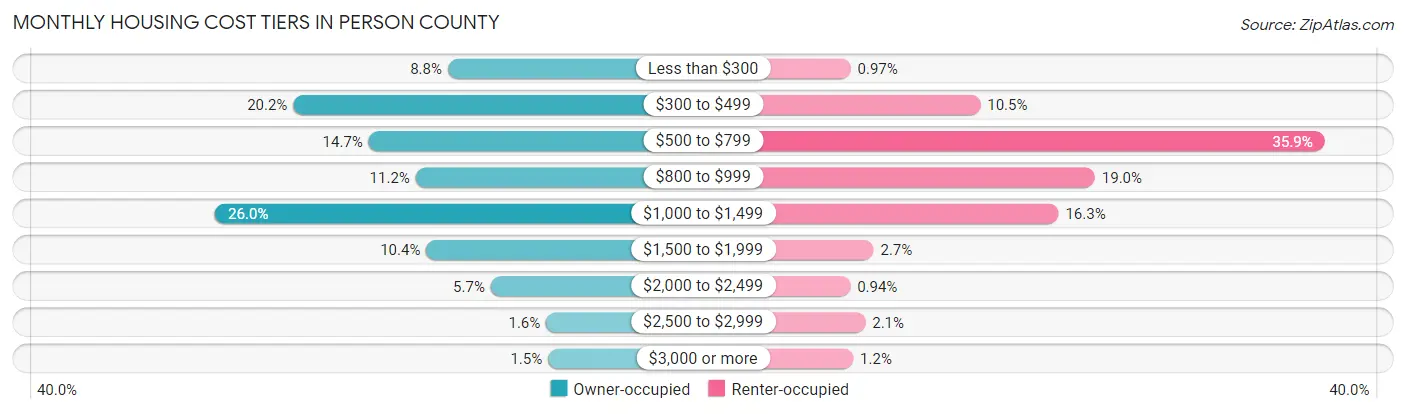
| Monthly Cost | Owner-occupied | Renter-occupied |
| Less than $300 | 1,106 (8.8%) | 35 (1.0%) |
| $300 to $499 | 2,533 (20.2%) | 380 (10.5%) |
| $500 to $799 | 1,836 (14.7%) | 1,296 (35.9%) |
| $800 to $999 | 1,403 (11.2%) | 685 (19.0%) |
| $1,000 to $1,499 | 3,253 (26.0%) | 588 (16.3%) |
| $1,500 to $1,999 | 1,305 (10.4%) | 96 (2.7%) |
| $2,000 to $2,499 | 710 (5.7%) | 34 (0.9%) |
| $2,500 to $2,999 | 199 (1.6%) | 74 (2.1%) |
| $3,000 or more | 182 (1.5%) | 42 (1.2%) |
| Total | 12,527 (100.0%) | 3,612 (100.0%) |
Physical Housing Characteristics in Person County
Housing Structures in Person County
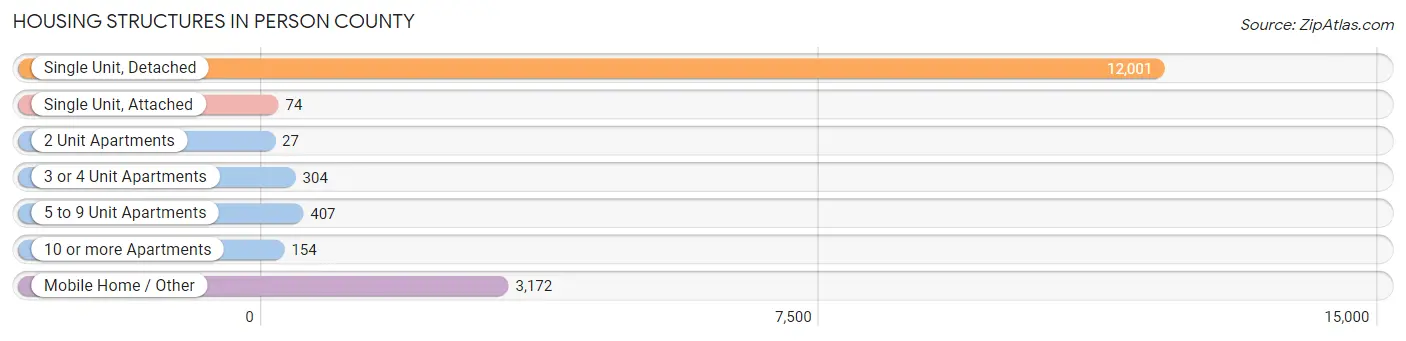
| Structure Type | # Housing Units | % Housing Units |
| Single Unit, Detached | 12,001 | 74.4% |
| Single Unit, Attached | 74 | 0.5% |
| 2 Unit Apartments | 27 | 0.2% |
| 3 or 4 Unit Apartments | 304 | 1.9% |
| 5 to 9 Unit Apartments | 407 | 2.5% |
| 10 or more Apartments | 154 | 0.9% |
| Mobile Home / Other | 3,172 | 19.7% |
| Total | 16,139 | 100.0% |
Housing Structures by Occupancy in Person County
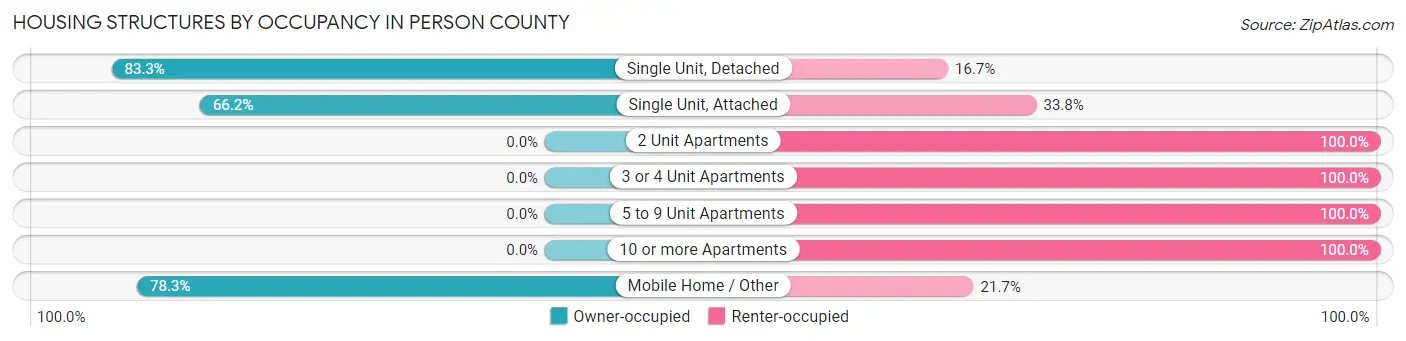
| Structure Type | Owner-occupied | Renter-occupied |
| Single Unit, Detached | 9,993 (83.3%) | 2,008 (16.7%) |
| Single Unit, Attached | 49 (66.2%) | 25 (33.8%) |
| 2 Unit Apartments | 0 (0.0%) | 27 (100.0%) |
| 3 or 4 Unit Apartments | 0 (0.0%) | 304 (100.0%) |
| 5 to 9 Unit Apartments | 0 (0.0%) | 407 (100.0%) |
| 10 or more Apartments | 0 (0.0%) | 154 (100.0%) |
| Mobile Home / Other | 2,485 (78.3%) | 687 (21.7%) |
| Total | 12,527 (77.6%) | 3,612 (22.4%) |
Housing Structures by Number of Rooms in Person County
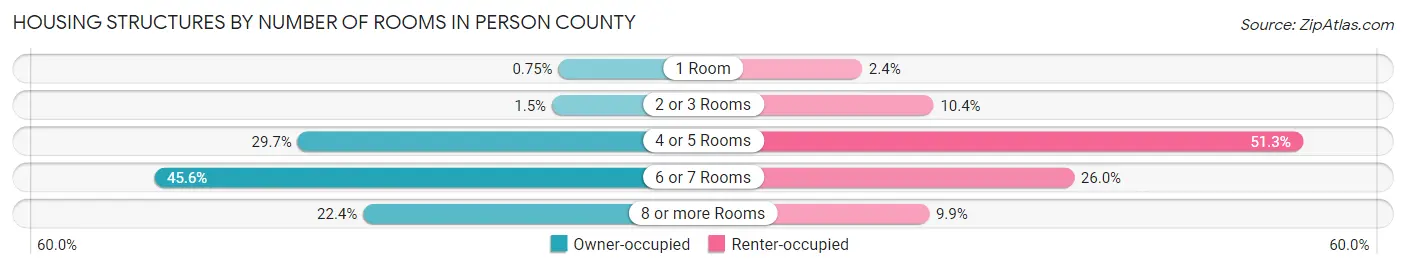
| Number of Rooms | Owner-occupied | Renter-occupied |
| 1 Room | 94 (0.7%) | 88 (2.4%) |
| 2 or 3 Rooms | 185 (1.5%) | 375 (10.4%) |
| 4 or 5 Rooms | 3,721 (29.7%) | 1,854 (51.3%) |
| 6 or 7 Rooms | 5,717 (45.6%) | 938 (26.0%) |
| 8 or more Rooms | 2,810 (22.4%) | 357 (9.9%) |
| Total | 12,527 (100.0%) | 3,612 (100.0%) |
Housing Structure by Heating Type in Person County

| Heating Type | Owner-occupied | Renter-occupied |
| Utility Gas | 1,931 (15.4%) | 1,341 (37.1%) |
| Bottled, Tank, or LP Gas | 2,333 (18.6%) | 181 (5.0%) |
| Electricity | 7,736 (61.8%) | 1,988 (55.0%) |
| Fuel Oil or Kerosene | 198 (1.6%) | 21 (0.6%) |
| Coal or Coke | 0 (0.0%) | 0 (0.0%) |
| All other Fuels | 314 (2.5%) | 29 (0.8%) |
| No Fuel Used | 15 (0.1%) | 52 (1.4%) |
| Total | 12,527 (100.0%) | 3,612 (100.0%) |
Household Vehicle Usage in Person County
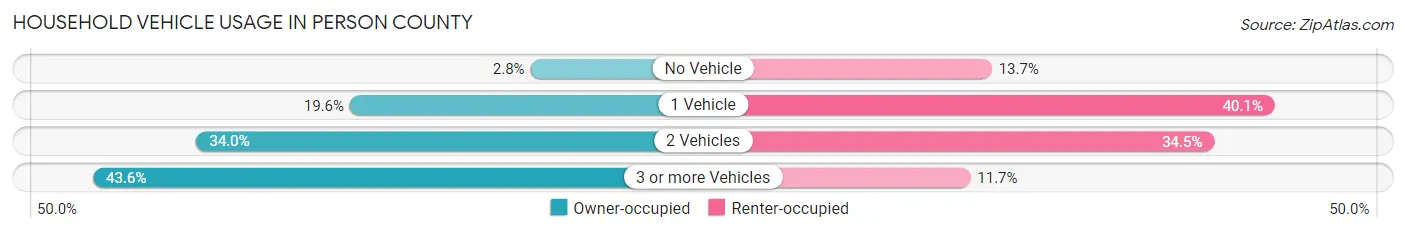
| Vehicles per Household | Owner-occupied | Renter-occupied |
| No Vehicle | 348 (2.8%) | 495 (13.7%) |
| 1 Vehicle | 2,460 (19.6%) | 1,449 (40.1%) |
| 2 Vehicles | 4,256 (34.0%) | 1,245 (34.5%) |
| 3 or more Vehicles | 5,463 (43.6%) | 423 (11.7%) |
| Total | 12,527 (100.0%) | 3,612 (100.0%) |
Real Estate & Mortgages in Person County
Real Estate and Mortgage Overview in Person County
| Characteristic | Without Mortgage | With Mortgage |
| Housing Units | 5,013 | 7,514 |
| Median Property Value | $131,000 | $190,500 |
| Median Household Income | $50,080 | $1,217 |
| Monthly Housing Costs | $418 | $163 |
| Real Estate Taxes | $1,056 | $102 |
Property Value by Mortgage Status in Person County
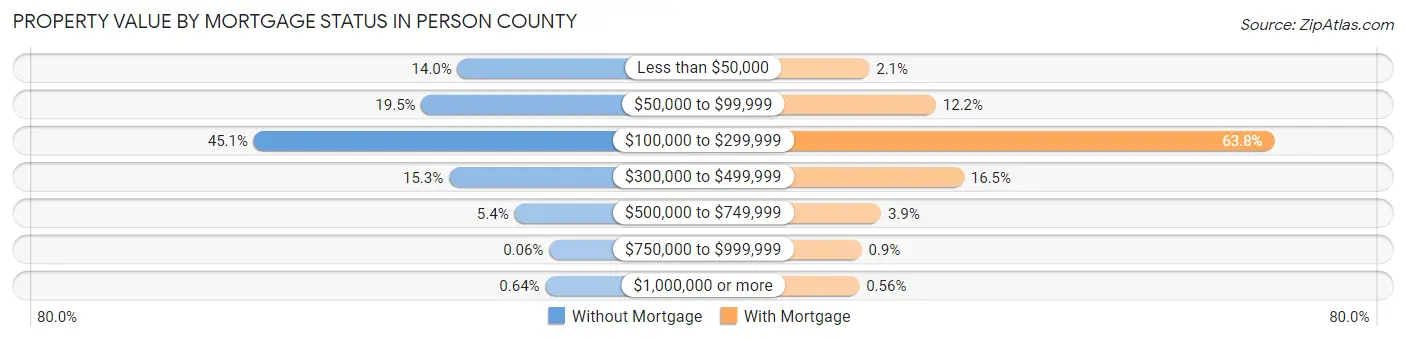
| Property Value | Without Mortgage | With Mortgage |
| Less than $50,000 | 703 (14.0%) | 157 (2.1%) |
| $50,000 to $99,999 | 979 (19.5%) | 920 (12.2%) |
| $100,000 to $299,999 | 2,260 (45.1%) | 4,796 (63.8%) |
| $300,000 to $499,999 | 768 (15.3%) | 1,240 (16.5%) |
| $500,000 to $749,999 | 268 (5.3%) | 291 (3.9%) |
| $750,000 to $999,999 | 3 (0.1%) | 68 (0.9%) |
| $1,000,000 or more | 32 (0.6%) | 42 (0.6%) |
| Total | 5,013 (100.0%) | 7,514 (100.0%) |
Household Income by Mortgage Status in Person County

| Household Income | Without Mortgage | With Mortgage |
| Less than $10,000 | 210 (4.2%) | 208 (2.8%) |
| $10,000 to $24,999 | 906 (18.1%) | 323 (4.3%) |
| $25,000 to $34,999 | 461 (9.2%) | 301 (4.0%) |
| $35,000 to $49,999 | 928 (18.5%) | 654 (8.7%) |
| $50,000 to $74,999 | 852 (17.0%) | 582 (7.7%) |
| $75,000 to $99,999 | 596 (11.9%) | 1,335 (17.8%) |
| $100,000 to $149,999 | 571 (11.4%) | 1,277 (17.0%) |
| $150,000 or more | 489 (9.8%) | 1,825 (24.3%) |
| Total | 5,013 (100.0%) | 7,514 (100.0%) |
Property Value to Household Income Ratio in Person County
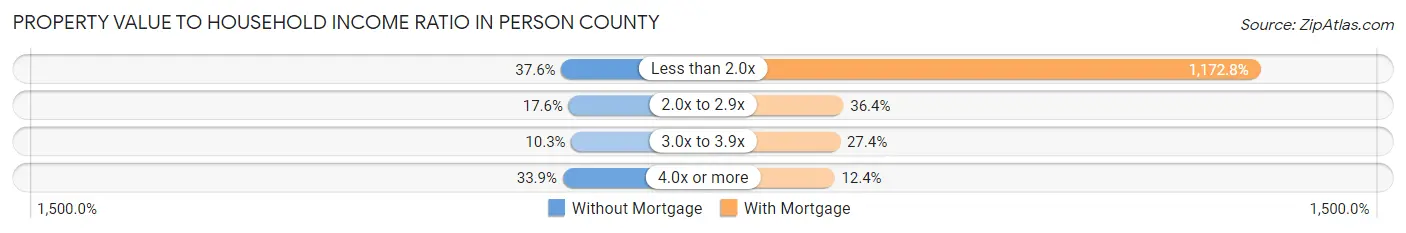
| Value-to-Income Ratio | Without Mortgage | With Mortgage |
| Less than 2.0x | 1,886 (37.6%) | 88,125 (1,172.8%) |
| 2.0x to 2.9x | 882 (17.6%) | 2,738 (36.4%) |
| 3.0x to 3.9x | 518 (10.3%) | 2,062 (27.4%) |
| 4.0x or more | 1,699 (33.9%) | 928 (12.3%) |
| Total | 5,013 (100.0%) | 7,514 (100.0%) |
Real Estate Taxes by Mortgage Status in Person County
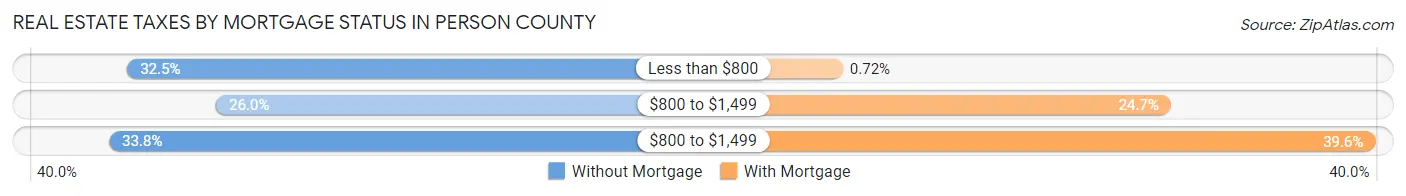
| Property Taxes | Without Mortgage | With Mortgage |
| Less than $800 | 1,629 (32.5%) | 54 (0.7%) |
| $800 to $1,499 | 1,304 (26.0%) | 1,854 (24.7%) |
| $800 to $1,499 | 1,696 (33.8%) | 2,976 (39.6%) |
| Total | 5,013 (100.0%) | 7,514 (100.0%) |
Health & Disability in Person County
Health Insurance Coverage by Age in Person County
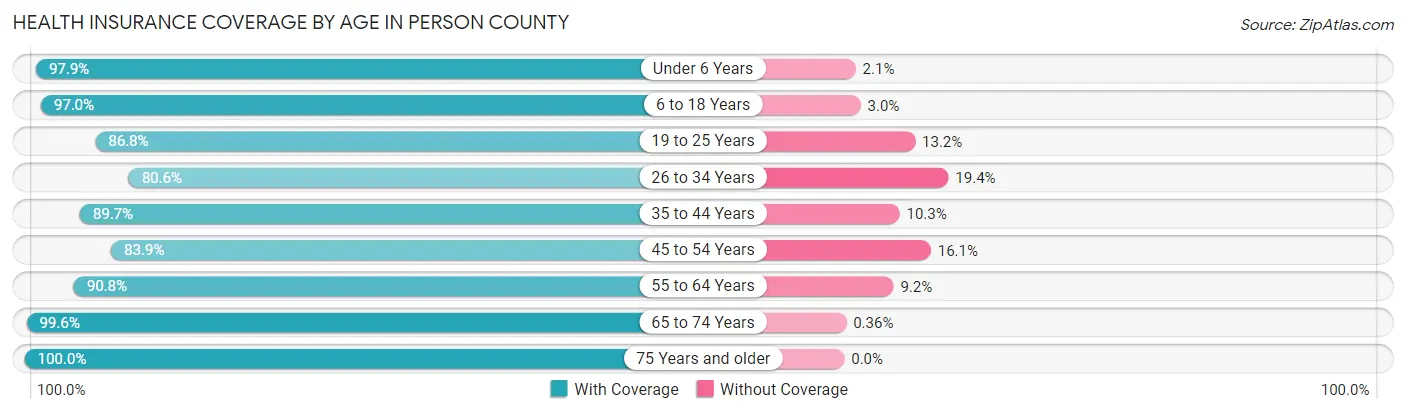
| Age Bracket | With Coverage | Without Coverage |
| Under 6 Years | 2,355 (97.9%) | 51 (2.1%) |
| 6 to 18 Years | 5,873 (97.0%) | 184 (3.0%) |
| 19 to 25 Years | 2,643 (86.8%) | 402 (13.2%) |
| 26 to 34 Years | 3,328 (80.6%) | 802 (19.4%) |
| 35 to 44 Years | 3,863 (89.7%) | 444 (10.3%) |
| 45 to 54 Years | 4,216 (83.9%) | 811 (16.1%) |
| 55 to 64 Years | 5,512 (90.8%) | 557 (9.2%) |
| 65 to 74 Years | 4,693 (99.6%) | 17 (0.4%) |
| 75 Years and older | 3,026 (100.0%) | 0 (0.0%) |
| Total | 35,509 (91.6%) | 3,268 (8.4%) |
Health Insurance Coverage by Citizenship Status in Person County
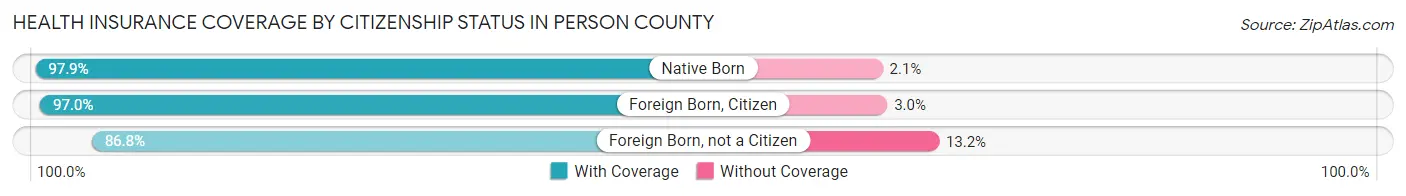
| Citizenship Status | With Coverage | Without Coverage |
| Native Born | 2,355 (97.9%) | 51 (2.1%) |
| Foreign Born, Citizen | 5,873 (97.0%) | 184 (3.0%) |
| Foreign Born, not a Citizen | 2,643 (86.8%) | 402 (13.2%) |
Health Insurance Coverage by Household Income in Person County
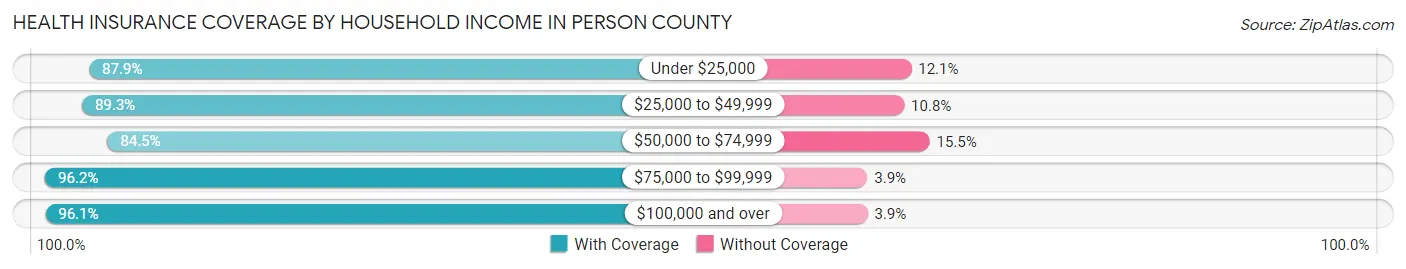
| Household Income | With Coverage | Without Coverage |
| Under $25,000 | 4,817 (87.9%) | 662 (12.1%) |
| $25,000 to $49,999 | 7,193 (89.2%) | 866 (10.7%) |
| $50,000 to $74,999 | 5,511 (84.5%) | 1,012 (15.5%) |
| $75,000 to $99,999 | 5,320 (96.2%) | 213 (3.8%) |
| $100,000 and over | 12,532 (96.1%) | 506 (3.9%) |
Public vs Private Health Insurance Coverage by Age in Person County
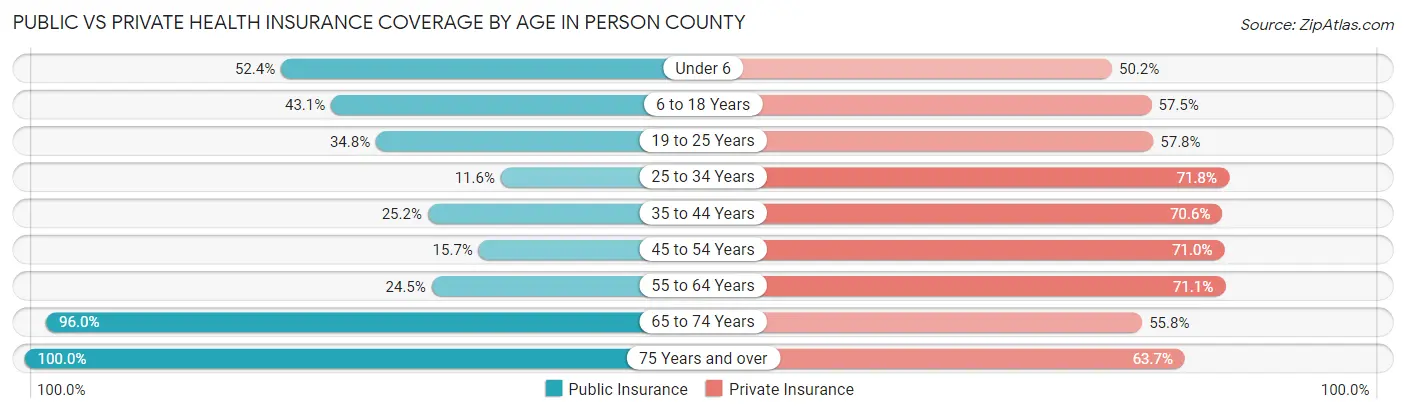
| Age Bracket | Public Insurance | Private Insurance |
| Under 6 | 1,261 (52.4%) | 1,207 (50.2%) |
| 6 to 18 Years | 2,612 (43.1%) | 3,482 (57.5%) |
| 19 to 25 Years | 1,059 (34.8%) | 1,761 (57.8%) |
| 25 to 34 Years | 480 (11.6%) | 2,966 (71.8%) |
| 35 to 44 Years | 1,084 (25.2%) | 3,041 (70.6%) |
| 45 to 54 Years | 790 (15.7%) | 3,568 (71.0%) |
| 55 to 64 Years | 1,484 (24.4%) | 4,317 (71.1%) |
| 65 to 74 Years | 4,521 (96.0%) | 2,627 (55.8%) |
| 75 Years and over | 3,026 (100.0%) | 1,926 (63.6%) |
| Total | 16,317 (42.1%) | 24,895 (64.2%) |
Disability Status by Sex by Age in Person County
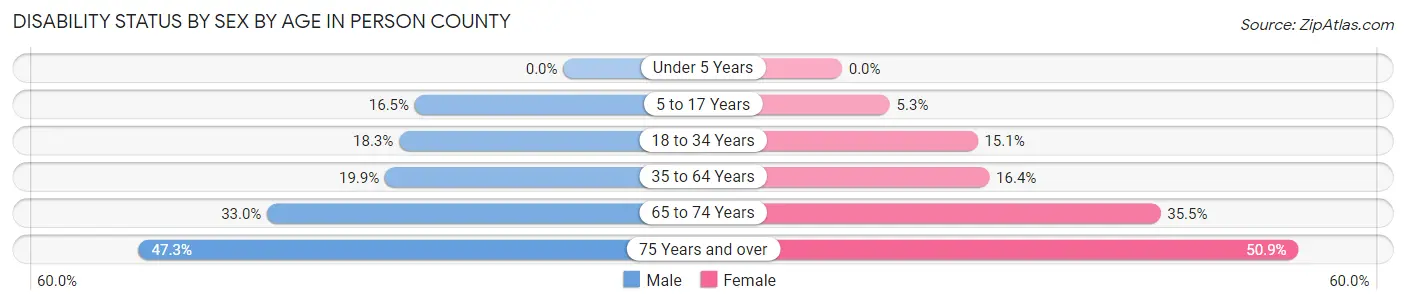
| Age Bracket | Male | Female |
| Under 5 Years | 0 (0.0%) | 0 (0.0%) |
| 5 to 17 Years | 484 (16.5%) | 161 (5.3%) |
| 18 to 34 Years | 695 (18.3%) | 574 (15.1%) |
| 35 to 64 Years | 1,509 (19.9%) | 1,281 (16.4%) |
| 65 to 74 Years | 708 (33.0%) | 909 (35.5%) |
| 75 Years and over | 569 (47.3%) | 927 (50.8%) |
Disability Class by Sex by Age in Person County
Disability Class: Hearing Difficulty
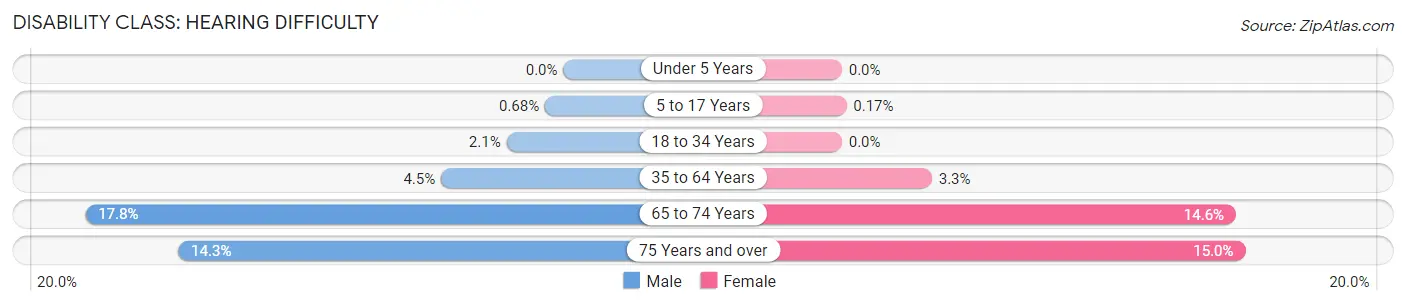
| Age Bracket | Male | Female |
| Under 5 Years | 0 (0.0%) | 0 (0.0%) |
| 5 to 17 Years | 20 (0.7%) | 5 (0.2%) |
| 18 to 34 Years | 80 (2.1%) | 0 (0.0%) |
| 35 to 64 Years | 345 (4.5%) | 261 (3.3%) |
| 65 to 74 Years | 381 (17.7%) | 375 (14.6%) |
| 75 Years and over | 172 (14.3%) | 273 (15.0%) |
Disability Class: Vision Difficulty
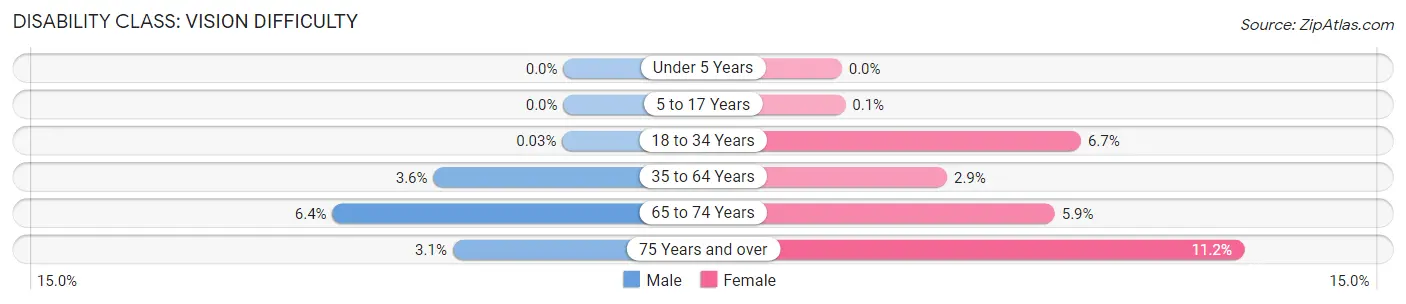
| Age Bracket | Male | Female |
| Under 5 Years | 0 (0.0%) | 0 (0.0%) |
| 5 to 17 Years | 0 (0.0%) | 3 (0.1%) |
| 18 to 34 Years | 1 (0.0%) | 253 (6.7%) |
| 35 to 64 Years | 275 (3.6%) | 229 (2.9%) |
| 65 to 74 Years | 138 (6.4%) | 152 (5.9%) |
| 75 Years and over | 37 (3.1%) | 204 (11.2%) |
Disability Class: Cognitive Difficulty
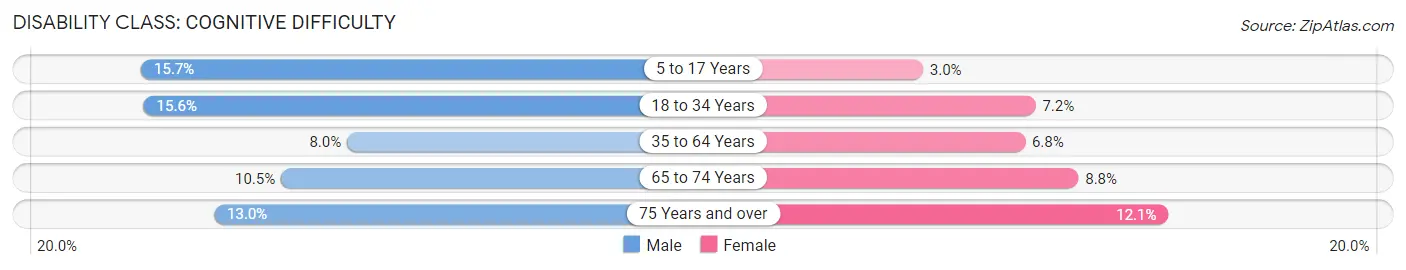
| Age Bracket | Male | Female |
| 5 to 17 Years | 459 (15.7%) | 91 (3.0%) |
| 18 to 34 Years | 592 (15.6%) | 273 (7.2%) |
| 35 to 64 Years | 610 (8.0%) | 531 (6.8%) |
| 65 to 74 Years | 225 (10.5%) | 225 (8.8%) |
| 75 Years and over | 156 (13.0%) | 221 (12.1%) |
Disability Class: Ambulatory Difficulty
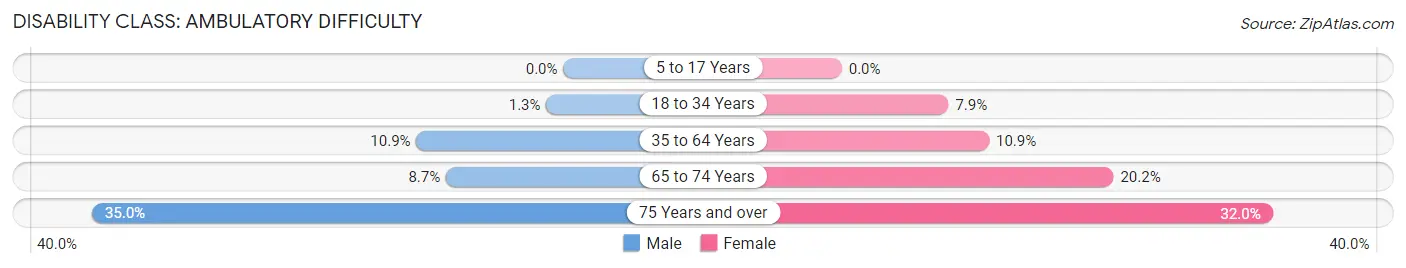
| Age Bracket | Male | Female |
| 5 to 17 Years | 0 (0.0%) | 0 (0.0%) |
| 18 to 34 Years | 48 (1.3%) | 301 (7.9%) |
| 35 to 64 Years | 829 (10.9%) | 853 (10.9%) |
| 65 to 74 Years | 187 (8.7%) | 517 (20.2%) |
| 75 Years and over | 421 (35.0%) | 583 (32.0%) |
Disability Class: Self-Care Difficulty
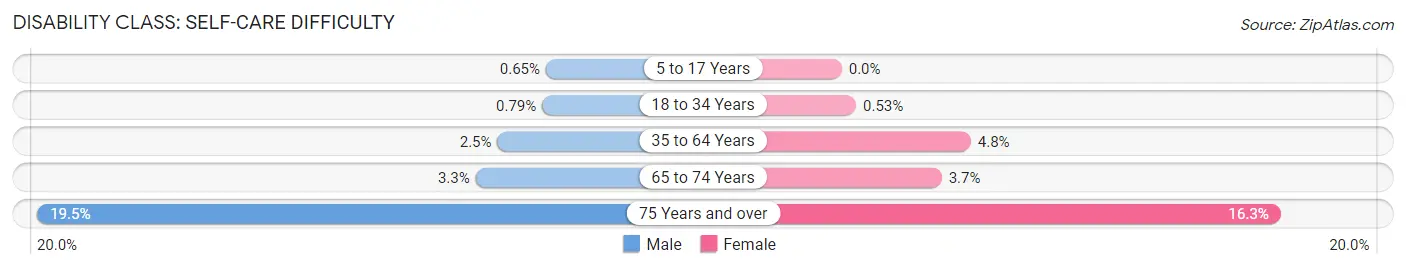
| Age Bracket | Male | Female |
| 5 to 17 Years | 19 (0.6%) | 0 (0.0%) |
| 18 to 34 Years | 30 (0.8%) | 20 (0.5%) |
| 35 to 64 Years | 186 (2.5%) | 374 (4.8%) |
| 65 to 74 Years | 70 (3.3%) | 95 (3.7%) |
| 75 Years and over | 235 (19.5%) | 297 (16.3%) |
Technology Access in Person County
Computing Device Access in Person County
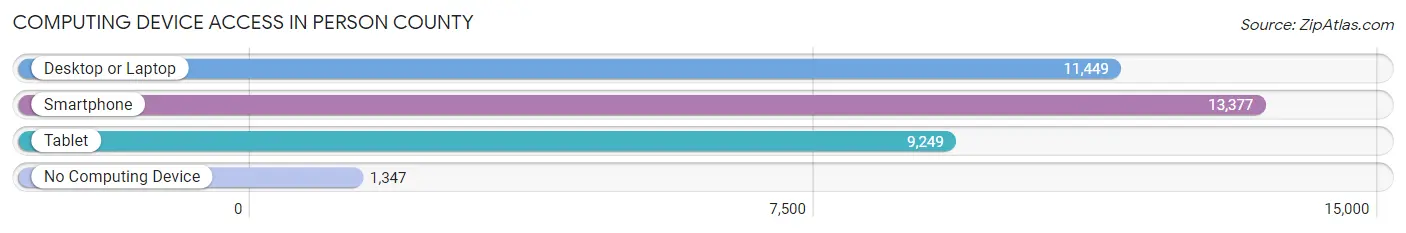
| Device Type | # Households | % Households |
| Desktop or Laptop | 11,449 | 70.9% |
| Smartphone | 13,377 | 82.9% |
| Tablet | 9,249 | 57.3% |
| No Computing Device | 1,347 | 8.4% |
| Total | 16,139 | 100.0% |
Internet Access in Person County
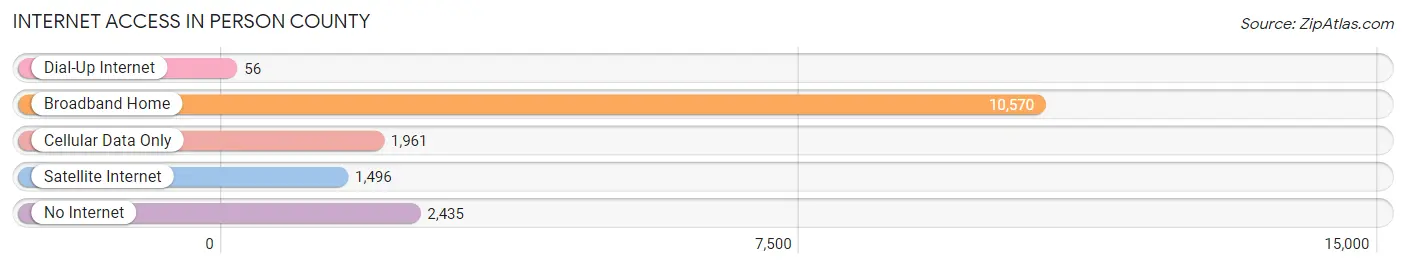
| Internet Type | # Households | % Households |
| Dial-Up Internet | 56 | 0.4% |
| Broadband Home | 10,570 | 65.5% |
| Cellular Data Only | 1,961 | 12.1% |
| Satellite Internet | 1,496 | 9.3% |
| No Internet | 2,435 | 15.1% |
| Total | 16,139 | 100.0% |
Person County Summary
Person County is located in the northern part of North Carolina, and is part of the Piedmont Triad region. It is bordered by Caswell County to the north, Granville County to the east, Durham County to the south, and Orange County to the west. The county seat is Roxboro, and the county has a population of 39,464 as of the 2010 census.
History
Person County was formed in 1791 from parts of Caswell and Orange Counties. It was named for General Thomas Person, a Revolutionary War hero and member of the North Carolina House of Commons. The county was originally part of the Granville District, and was later divided into two districts, Person and Caswell.
The county was home to several Native American tribes, including the Occaneechi, Eno, and Saponi. The first European settlers arrived in the area in the 1730s, and the county was officially established in 1791.
Person County was an agricultural area for much of its history, with tobacco, cotton, and corn being the main crops. The county also had several mills, including grist mills, saw mills, and cotton mills.
Geography
Person County is located in the northern part of North Carolina, and is part of the Piedmont Triad region. It is bordered by Caswell County to the north, Granville County to the east, Durham County to the south, and Orange County to the west. The county has a total area of 437 square miles, of which 434 square miles is land and 3 square miles is water.
The county is located in the Piedmont region of North Carolina, and is characterized by rolling hills and valleys. The county is drained by the Flat River, which flows through the center of the county. The county is also home to several lakes, including Hyco Lake, Mayo Lake, and Lake Rogers.
Economy
Person County's economy is largely based on agriculture, with tobacco, cotton, and corn being the main crops. The county also has several manufacturing plants, including a furniture plant, a textile plant, and a plastics plant.
The county is also home to several large employers, including Person County Schools, Person Memorial Hospital, and Person County Government. The county is also home to several small businesses, including restaurants, retail stores, and service providers.
Demographics
As of the 2010 census, Person County had a population of 39,464. The racial makeup of the county was 79.2% White, 16.2% African American, 0.5% Native American, 0.7% Asian, 0.1% Pacific Islander, 1.7% from other races, and 1.7% from two or more races. Hispanic or Latino of any race were 3.7% of the population.
The median income for a household in the county was $37,845, and the median income for a family was $45,945. The per capita income for the county was $19,845. About 15.2% of the population was below the poverty line.
Conclusion
Person County is a rural county located in the northern part of North Carolina. It is part of the Piedmont Triad region, and is bordered by Caswell, Granville, Durham, and Orange Counties. The county has a population of 39,464, and is largely agricultural, with tobacco, cotton, and corn being the main crops. The county also has several manufacturing plants, and is home to several large employers. The median income for a household in the county is $37,845, and the per capita income is $19,845.
Common Questions
What is Per Capita Income in Person County?
Per Capita income in Person County is $33,456.
What is the Median Family Income in Person County?
Median Family Income in Person County is $73,891.
What is the Median Household income in Person County?
Median Household Income in Person County is $60,688.
What is Income or Wage Gap in Person County?
Income or Wage Gap in Person County is 26.2%.
Women in Person County earn 73.8 cents for every dollar earned by a man.
What is Family Income Deficit in Person County?
Family Income Deficit in Person County is $11,222.
Families that are below poverty line in Person County earn $11,222 less on average than the poverty threshold level.
What is Inequality or Gini Index in Person County?
Inequality or Gini Index in Person County is 0.45.
What is the Total Population of Person County?
Total Population of Person County is 39,131.
What is the Total Male Population of Person County?
Total Male Population of Person County is 18,879.
What is the Total Female Population of Person County?
Total Female Population of Person County is 20,252.
What is the Ratio of Males per 100 Females in Person County?
There are 93.22 Males per 100 Females in Person County.
What is the Ratio of Females per 100 Males in Person County?
There are 107.27 Females per 100 Males in Person County.
What is the Median Population Age in Person County?
Median Population Age in Person County is 43.7 Years.
What is the Average Family Size in Person County
Average Family Size in Person County is 2.9 People.
What is the Average Household Size in Person County
Average Household Size in Person County is 2.4 People.
How Large is the Labor Force in Person County?
There are 19,479 People in the Labor Forcein in Person County.
What is the Percentage of People in the Labor Force in Person County?
60.6% of People are in the Labor Force in Person County.
What is the Unemployment Rate in Person County?
Unemployment Rate in Person County is 3.7%.