Perquimans County, NC Map & Demographics
Perquimans County Map
Perquimans County Overview
$31,919
PER CAPITA INCOME
$76,291
AVG FAMILY INCOME
$59,401
AVG HOUSEHOLD INCOME
31.0%
WAGE / INCOME GAP [ % ]
69.0¢/ $1
WAGE / INCOME GAP [ $ ]
0.40
INEQUALITY / GINI INDEX
13,053
TOTAL POPULATION
6,233
MALE POPULATION
6,820
FEMALE POPULATION
91.39
MALES / 100 FEMALES
109.42
FEMALES / 100 MALES
49.8
MEDIAN AGE
2.8
AVG FAMILY SIZE
2.3
AVG HOUSEHOLD SIZE
5,395
LABOR FORCE [ PEOPLE ]
49.3%
PERCENT IN LABOR FORCE
5.0%
UNEMPLOYMENT RATE
Perquimans County Area Codes
Income in Perquimans County
Income Overview in Perquimans County
Per Capita Income in Perquimans County is $31,919, while median incomes of families and households are $76,291 and $59,401 respectively.
| Characteristic | Number | Measure |
| Per Capita Income | 13,053 | $31,919 |
| Median Family Income | 3,871 | $76,291 |
| Mean Family Income | 3,871 | $84,248 |
| Median Household Income | 5,568 | $59,401 |
| Mean Household Income | 5,568 | $73,754 |
| Income Deficit | 3,871 | $0 |
| Wage / Income Gap (%) | 13,053 | 31.00% |
| Wage / Income Gap ($) | 13,053 | 69.00¢ per $1 |
| Gini / Inequality Index | 13,053 | 0.40 |
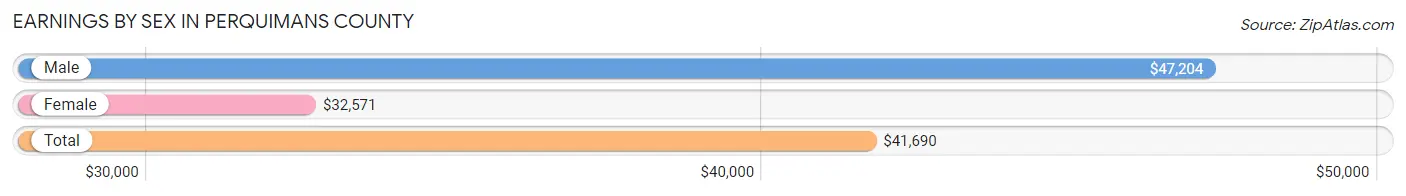
Earnings by Sex in Perquimans County
Average Earnings in Perquimans County are $41,690, $47,204 for men and $32,571 for women, a difference of 31.0%.
| Sex | Number | Average Earnings |
| Male | 3,126 (55.4%) | $47,204 |
| Female | 2,515 (44.6%) | $32,571 |
| Total | 5,641 (100.0%) | $41,690 |
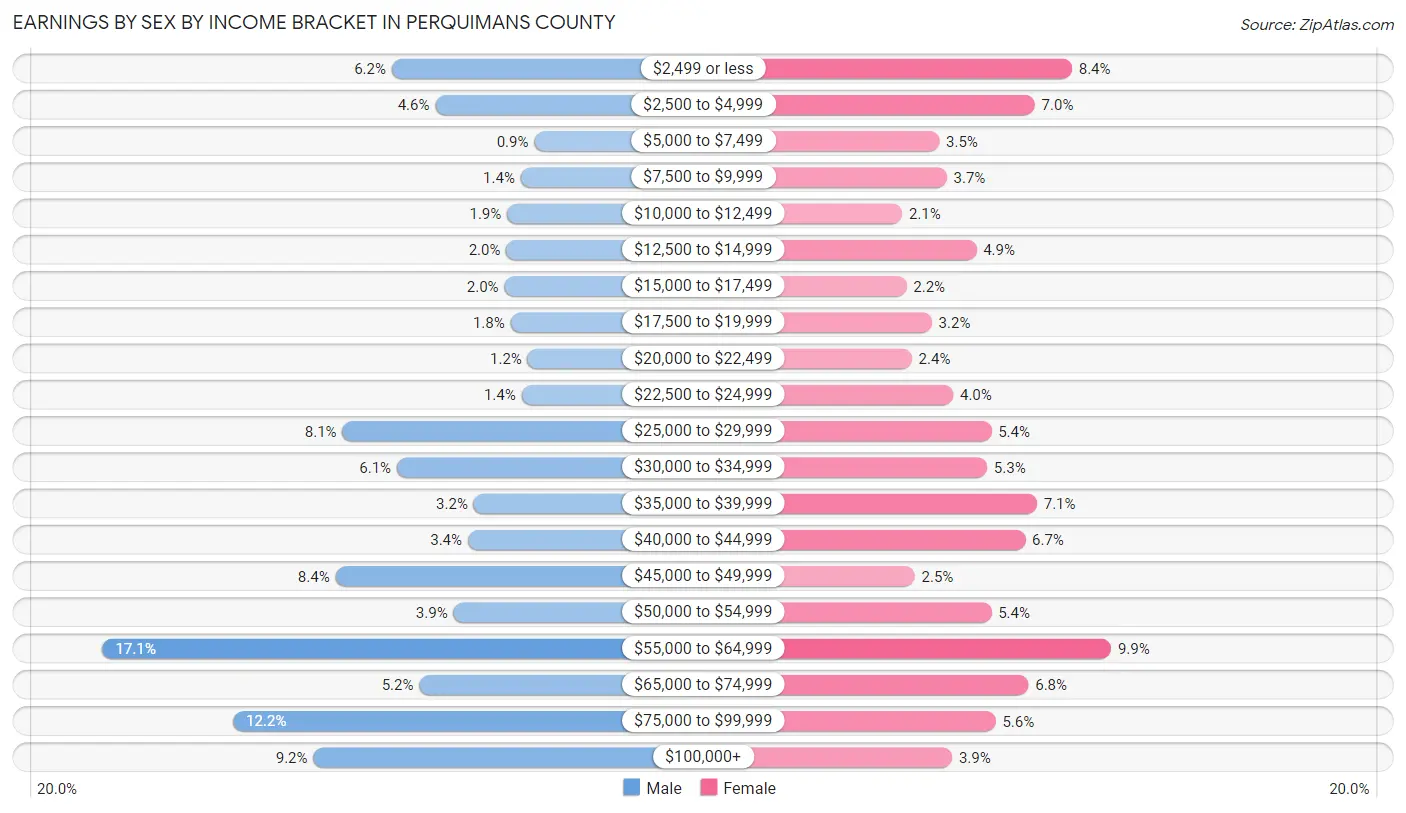
Earnings by Sex by Income Bracket in Perquimans County
The most common earnings brackets in Perquimans County are $55,000 to $64,999 for men (534 | 17.1%) and $55,000 to $64,999 for women (249 | 9.9%).
| Income | Male | Female |
| $2,499 or less | 195 (6.2%) | 212 (8.4%) |
| $2,500 to $4,999 | 144 (4.6%) | 177 (7.0%) |
| $5,000 to $7,499 | 28 (0.9%) | 87 (3.5%) |
| $7,500 to $9,999 | 44 (1.4%) | 94 (3.7%) |
| $10,000 to $12,499 | 60 (1.9%) | 52 (2.1%) |
| $12,500 to $14,999 | 61 (1.9%) | 122 (4.9%) |
| $15,000 to $17,499 | 63 (2.0%) | 56 (2.2%) |
| $17,500 to $19,999 | 56 (1.8%) | 80 (3.2%) |
| $20,000 to $22,499 | 36 (1.1%) | 61 (2.4%) |
| $22,500 to $24,999 | 43 (1.4%) | 100 (4.0%) |
| $25,000 to $29,999 | 253 (8.1%) | 136 (5.4%) |
| $30,000 to $34,999 | 189 (6.0%) | 132 (5.2%) |
| $35,000 to $39,999 | 99 (3.2%) | 179 (7.1%) |
| $40,000 to $44,999 | 106 (3.4%) | 168 (6.7%) |
| $45,000 to $49,999 | 261 (8.4%) | 64 (2.5%) |
| $50,000 to $54,999 | 123 (3.9%) | 136 (5.4%) |
| $55,000 to $64,999 | 534 (17.1%) | 249 (9.9%) |
| $65,000 to $74,999 | 163 (5.2%) | 171 (6.8%) |
| $75,000 to $99,999 | 381 (12.2%) | 140 (5.6%) |
| $100,000+ | 287 (9.2%) | 99 (3.9%) |
| Total | 3,126 (100.0%) | 2,515 (100.0%) |
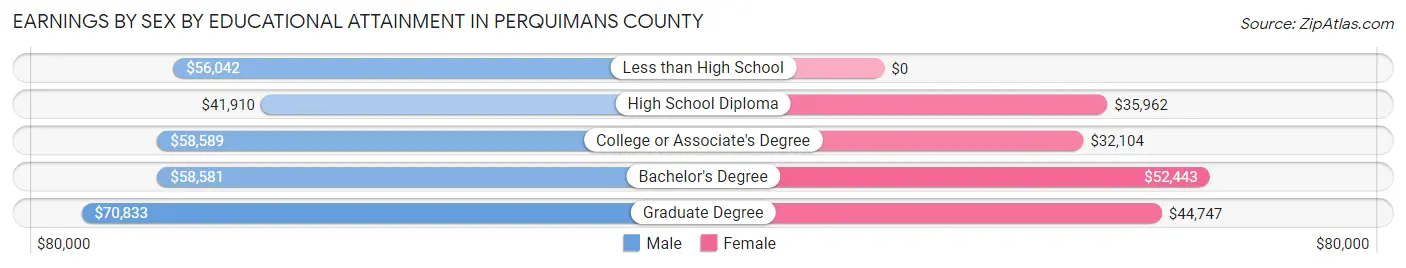
Earnings by Sex by Educational Attainment in Perquimans County
Average earnings in Perquimans County are $51,217 for men and $37,435 for women, a difference of 26.9%. Men with an educational attainment of graduate degree enjoy the highest average annual earnings of $70,833, while those with high school diploma education earn the least with $41,910. Women with an educational attainment of bachelor's degree earn the most with the average annual earnings of $52,443, while those with college or associate's degree education have the smallest earnings of $32,104.
| Educational Attainment | Male Income | Female Income |
| Less than High School | $56,042 | $0 |
| High School Diploma | $41,910 | $35,962 |
| College or Associate's Degree | $58,589 | $32,104 |
| Bachelor's Degree | $58,581 | $52,443 |
| Graduate Degree | $70,833 | $44,747 |
| Total | $51,217 | $37,435 |
Family Income in Perquimans County
Family Income Brackets in Perquimans County
According to the Perquimans County family income data, there are 883 families falling into the $100,000 to $149,999 income range, which is the most common income bracket and makes up 22.8% of all families. Conversely, the less than $10,000 income bracket is the least frequent group with only 112 families (2.9%) belonging to this category.
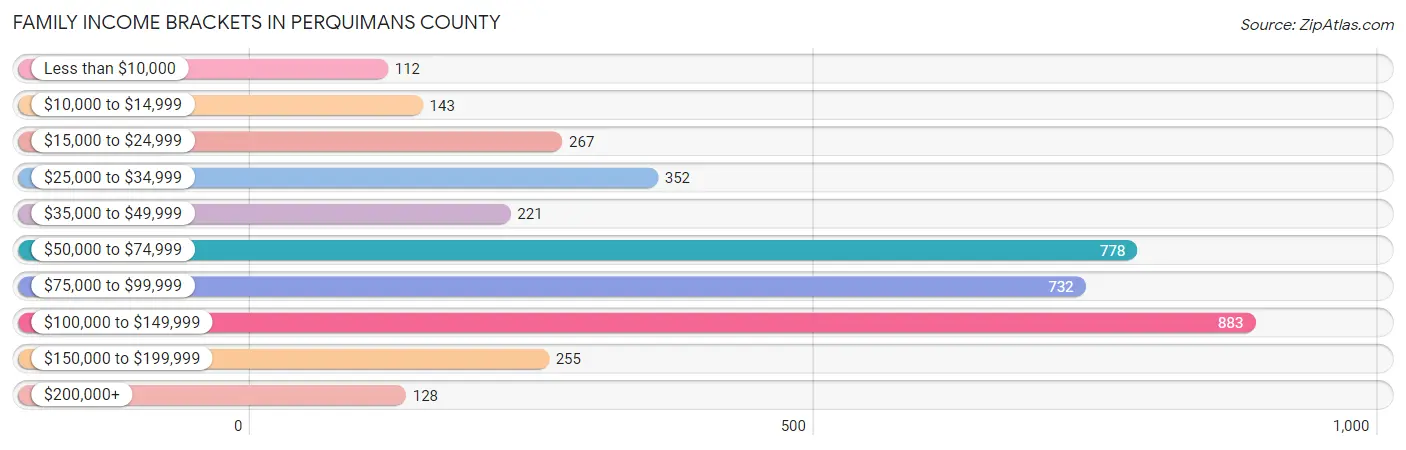
| Income Bracket | # Families | % Families |
| Less than $10,000 | 112 | 2.9% |
| $10,000 to $14,999 | 143 | 3.7% |
| $15,000 to $24,999 | 267 | 6.9% |
| $25,000 to $34,999 | 352 | 9.1% |
| $35,000 to $49,999 | 221 | 5.7% |
| $50,000 to $74,999 | 778 | 20.1% |
| $75,000 to $99,999 | 732 | 18.9% |
| $100,000 to $149,999 | 883 | 22.8% |
| $150,000 to $199,999 | 255 | 6.6% |
| $200,000+ | 128 | 3.3% |
Family Income by Famaliy Size in Perquimans County
6-person families (67 | 1.7%) account for the highest median family income in Perquimans County with $120,846 per family, while 2-person families (2,463 | 63.6%) have the highest median income of $34,610 per family member.
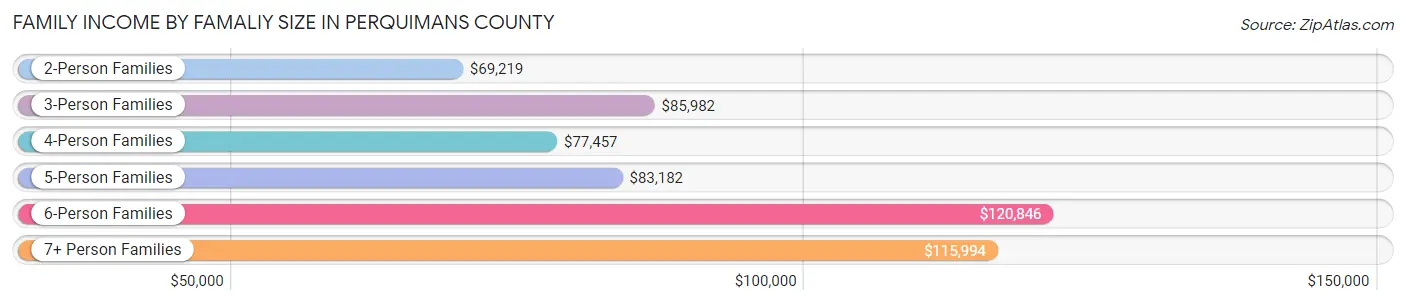
| Income Bracket | # Families | Median Income |
| 2-Person Families | 2,463 (63.6%) | $69,219 |
| 3-Person Families | 717 (18.5%) | $85,982 |
| 4-Person Families | 373 (9.6%) | $77,457 |
| 5-Person Families | 174 (4.5%) | $83,182 |
| 6-Person Families | 67 (1.7%) | $120,846 |
| 7+ Person Families | 77 (2.0%) | $115,994 |
| Total | 3,871 (100.0%) | $76,291 |
Family Income by Number of Earners in Perquimans County
The median family income in Perquimans County is $76,291, with families comprising 3+ earners (293) having the highest median family income of $113,472, while families with no earners (1,145) have the lowest median family income of $45,792, accounting for 7.6% and 29.6% of families, respectively.
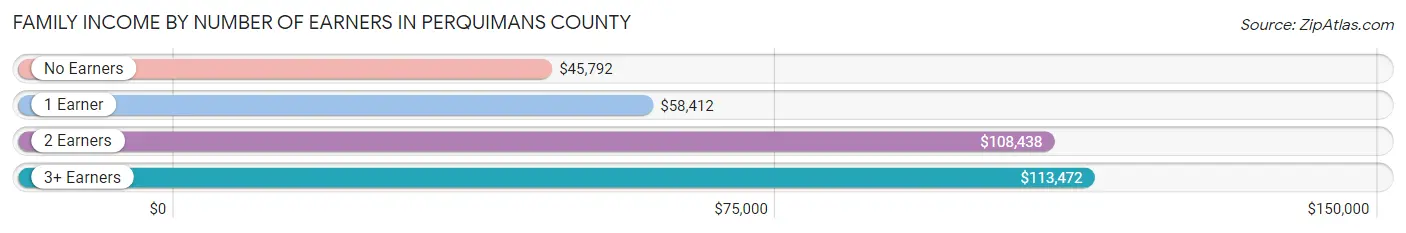
| Number of Earners | # Families | Median Income |
| No Earners | 1,145 (29.6%) | $45,792 |
| 1 Earner | 1,309 (33.8%) | $58,412 |
| 2 Earners | 1,124 (29.0%) | $108,438 |
| 3+ Earners | 293 (7.6%) | $113,472 |
| Total | 3,871 (100.0%) | $76,291 |
Household Income in Perquimans County
Household Income Brackets in Perquimans County
With 1,119 households falling in the category, the $100,000 to $149,999 income range is the most frequent in Perquimans County, accounting for 20.1% of all households. In contrast, only 134 households (2.4%) fall into the $200,000+ income bracket, making it the least populous group.
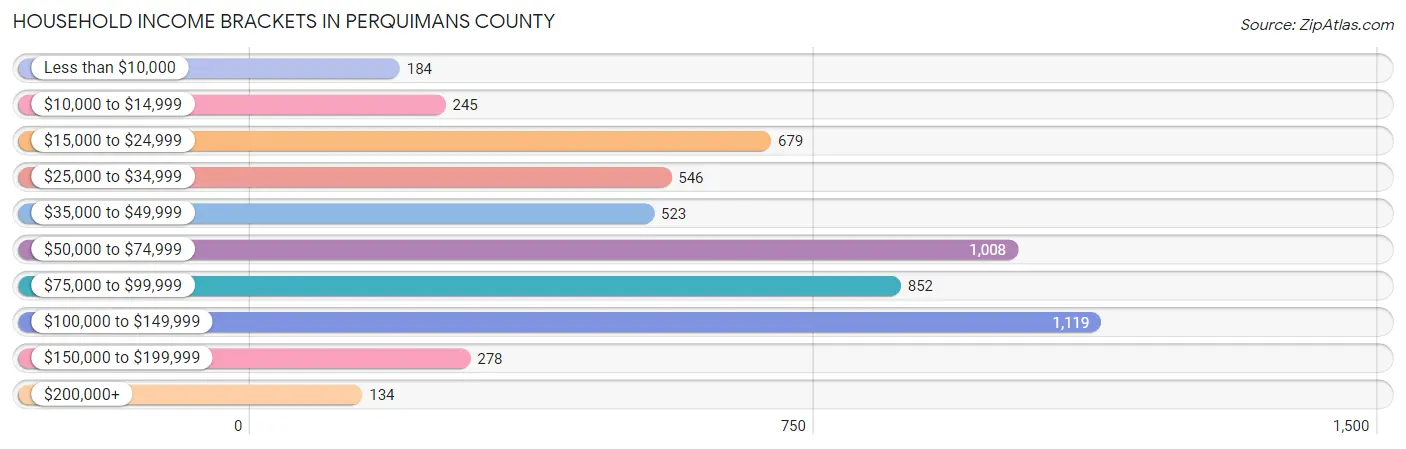
| Income Bracket | # Households | % Households |
| Less than $10,000 | 184 | 3.3% |
| $10,000 to $14,999 | 245 | 4.4% |
| $15,000 to $24,999 | 679 | 12.2% |
| $25,000 to $34,999 | 546 | 9.8% |
| $35,000 to $49,999 | 523 | 9.4% |
| $50,000 to $74,999 | 1,008 | 18.1% |
| $75,000 to $99,999 | 852 | 15.3% |
| $100,000 to $149,999 | 1,119 | 20.1% |
| $150,000 to $199,999 | 278 | 5.0% |
| $200,000+ | 134 | 2.4% |
Household Income by Householder Age in Perquimans County
The median household income in Perquimans County is $59,401, with the highest median household income of $77,500 found in the 45 to 64 years age bracket for the primary householder. A total of 1,956 households (35.1%) fall into this category. Meanwhile, the 15 to 24 years age bracket for the primary householder has the lowest median household income of $0, with 50 households (0.9%) in this group.
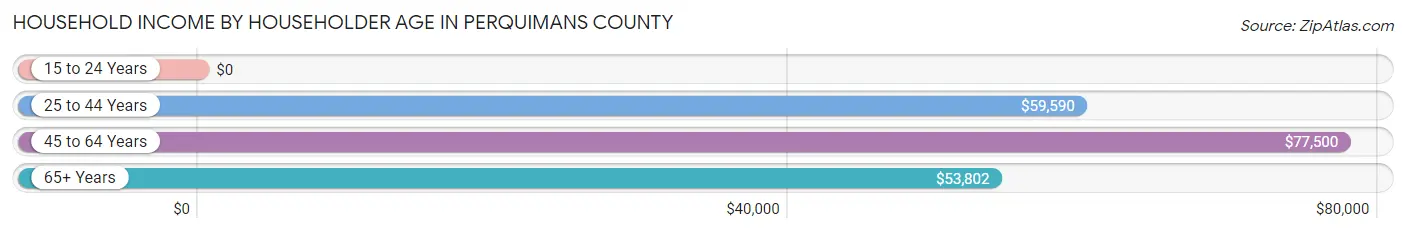
| Income Bracket | # Households | Median Income |
| 15 to 24 Years | 50 (0.9%) | $0 |
| 25 to 44 Years | 1,154 (20.7%) | $59,590 |
| 45 to 64 Years | 1,956 (35.1%) | $77,500 |
| 65+ Years | 2,408 (43.2%) | $53,802 |
| Total | 5,568 (100.0%) | $59,401 |
Poverty in Perquimans County
Income Below Poverty by Sex and Age in Perquimans County
With 10.9% poverty level for males and 15.5% for females among the residents of Perquimans County, 12 to 14 year old males and under 5 year old females are the most vulnerable to poverty, with 80 males (29.0%) and 102 females (32.2%) in their respective age groups living below the poverty level.
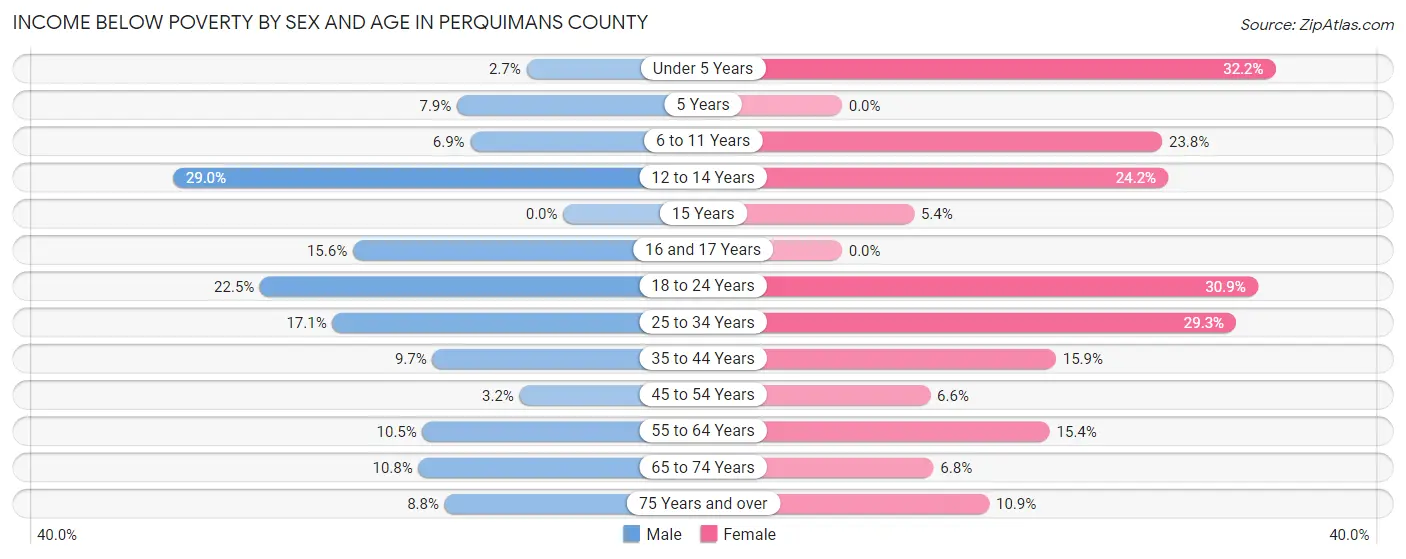
| Age Bracket | Male | Female |
| Under 5 Years | 5 (2.7%) | 102 (32.2%) |
| 5 Years | 6 (7.9%) | 0 (0.0%) |
| 6 to 11 Years | 28 (6.9%) | 107 (23.8%) |
| 12 to 14 Years | 80 (29.0%) | 46 (24.2%) |
| 15 Years | 0 (0.0%) | 3 (5.4%) |
| 16 and 17 Years | 10 (15.6%) | 0 (0.0%) |
| 18 to 24 Years | 106 (22.5%) | 100 (30.9%) |
| 25 to 34 Years | 60 (17.1%) | 206 (29.3%) |
| 35 to 44 Years | 77 (9.7%) | 99 (15.9%) |
| 45 to 54 Years | 26 (3.2%) | 51 (6.6%) |
| 55 to 64 Years | 106 (10.4%) | 168 (15.4%) |
| 65 to 74 Years | 111 (10.7%) | 73 (6.8%) |
| 75 Years and over | 58 (8.8%) | 96 (10.9%) |
| Total | 673 (10.9%) | 1,051 (15.5%) |
Income Above Poverty by Sex and Age in Perquimans County
According to the poverty statistics in Perquimans County, males aged 15 years and females aged 5 years are the age groups that are most secure financially, with 100.0% of males and 100.0% of females in these age groups living above the poverty line.
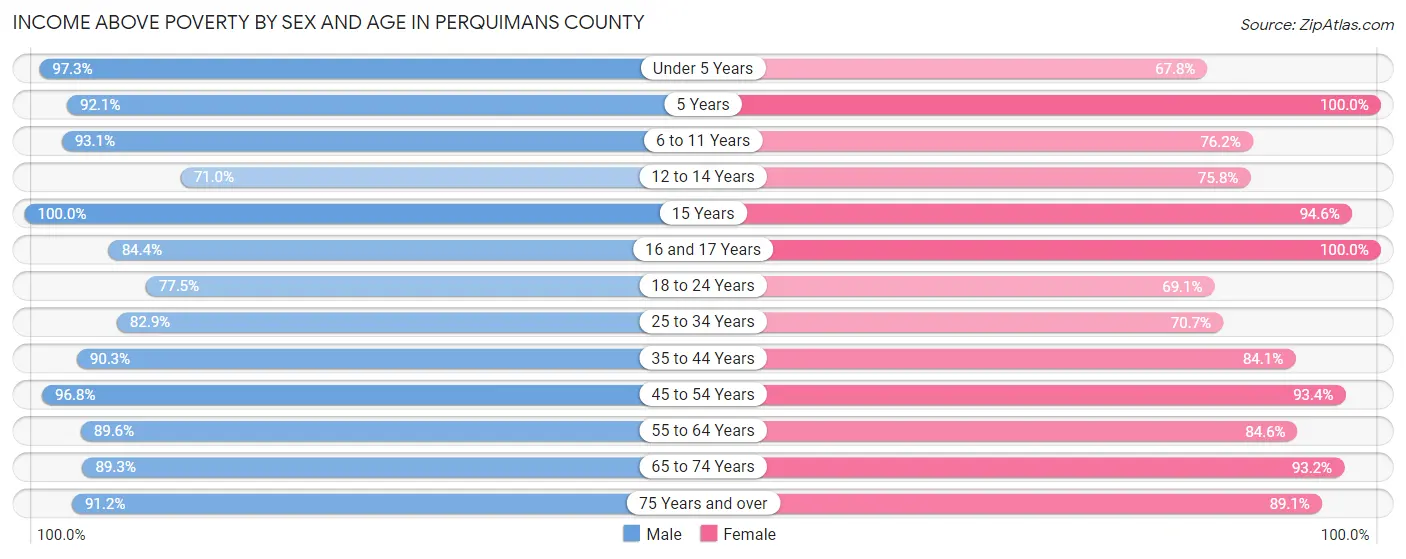
| Age Bracket | Male | Female |
| Under 5 Years | 178 (97.3%) | 215 (67.8%) |
| 5 Years | 70 (92.1%) | 33 (100.0%) |
| 6 to 11 Years | 378 (93.1%) | 343 (76.2%) |
| 12 to 14 Years | 196 (71.0%) | 144 (75.8%) |
| 15 Years | 51 (100.0%) | 53 (94.6%) |
| 16 and 17 Years | 54 (84.4%) | 253 (100.0%) |
| 18 to 24 Years | 365 (77.5%) | 224 (69.1%) |
| 25 to 34 Years | 290 (82.9%) | 498 (70.7%) |
| 35 to 44 Years | 716 (90.3%) | 524 (84.1%) |
| 45 to 54 Years | 776 (96.8%) | 727 (93.4%) |
| 55 to 64 Years | 908 (89.5%) | 921 (84.6%) |
| 65 to 74 Years | 922 (89.2%) | 1,001 (93.2%) |
| 75 Years and over | 601 (91.2%) | 782 (89.1%) |
| Total | 5,505 (89.1%) | 5,718 (84.5%) |
Income Below Poverty Among Married-Couple Families in Perquimans County
The poverty statistics for married-couple families in Perquimans County show that 6.8% or 197 of the total 2,908 families live below the poverty line. Families with 5 or more children have the highest poverty rate of 30.6%, comprising of 19 families. On the other hand, families with 3 or 4 children have the lowest poverty rate of 0.0%, which includes 0 families.
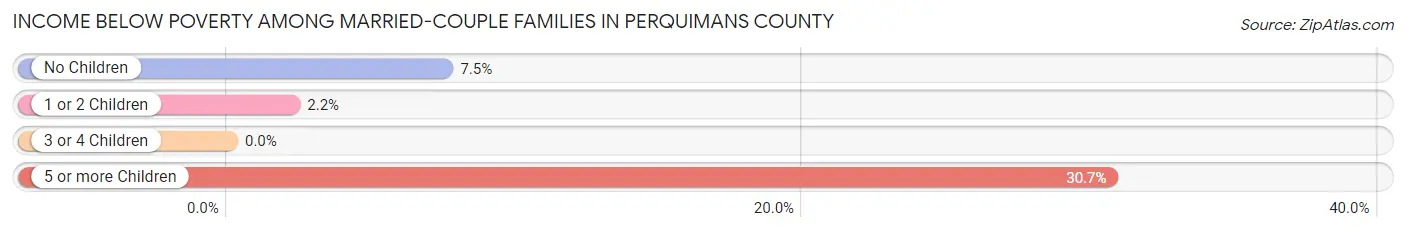
| Children | Above Poverty | Below Poverty |
| No Children | 2,060 (92.5%) | 167 (7.5%) |
| 1 or 2 Children | 496 (97.8%) | 11 (2.2%) |
| 3 or 4 Children | 112 (100.0%) | 0 (0.0%) |
| 5 or more Children | 43 (69.4%) | 19 (30.6%) |
| Total | 2,711 (93.2%) | 197 (6.8%) |
Income Below Poverty Among Single-Parent Households in Perquimans County
According to the poverty data in Perquimans County, 15.8% or 40 single-father households and 28.5% or 202 single-mother households are living below the poverty line. Among single-father households, those with 1 or 2 children have the highest poverty rate, with 40 households (43.5%) experiencing poverty. Likewise, among single-mother households, those with 1 or 2 children have the highest poverty rate, with 172 households (40.7%) falling below the poverty line.
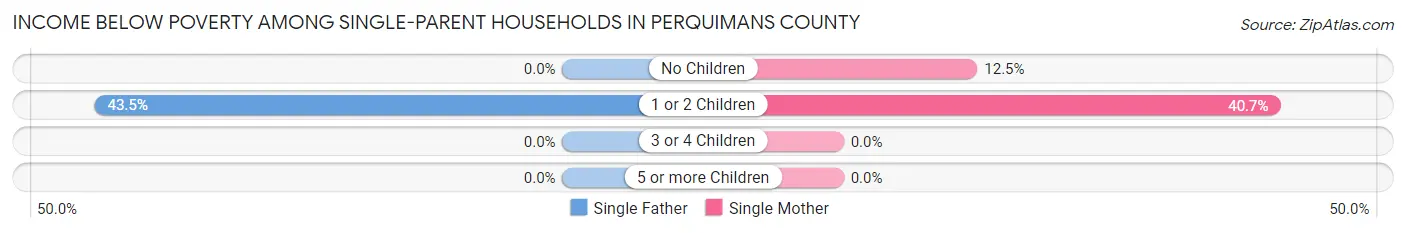
| Children | Single Father | Single Mother |
| No Children | 0 (0.0%) | 30 (12.4%) |
| 1 or 2 Children | 40 (43.5%) | 172 (40.7%) |
| 3 or 4 Children | 0 (0.0%) | 0 (0.0%) |
| 5 or more Children | 0 (0.0%) | 0 (0.0%) |
| Total | 40 (15.8%) | 202 (28.5%) |
Income Below Poverty Among Married-Couple vs Single-Parent Households in Perquimans County
The poverty data for Perquimans County shows that 197 of the married-couple family households (6.8%) and 242 of the single-parent households (25.1%) are living below the poverty level. Within the married-couple family households, those with 5 or more children have the highest poverty rate, with 19 households (30.6%) falling below the poverty line. Among the single-parent households, those with 1 or 2 children have the highest poverty rate, with 212 household (41.2%) living below poverty.
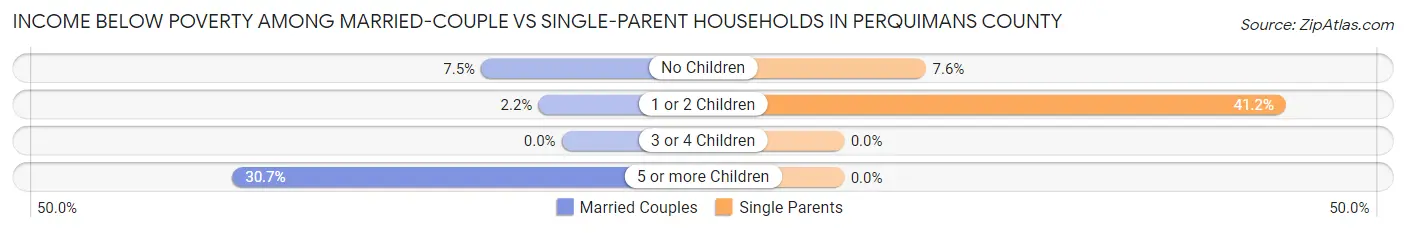
| Children | Married-Couple Families | Single-Parent Households |
| No Children | 167 (7.5%) | 30 (7.6%) |
| 1 or 2 Children | 11 (2.2%) | 212 (41.2%) |
| 3 or 4 Children | 0 (0.0%) | 0 (0.0%) |
| 5 or more Children | 19 (30.6%) | 0 (0.0%) |
| Total | 197 (6.8%) | 242 (25.1%) |
Race in Perquimans County
The most populous races in Perquimans County are White / Caucasian (9,371 | 71.8%), Black / African American (2,978 | 22.8%), and Two or more Races (426 | 3.3%).
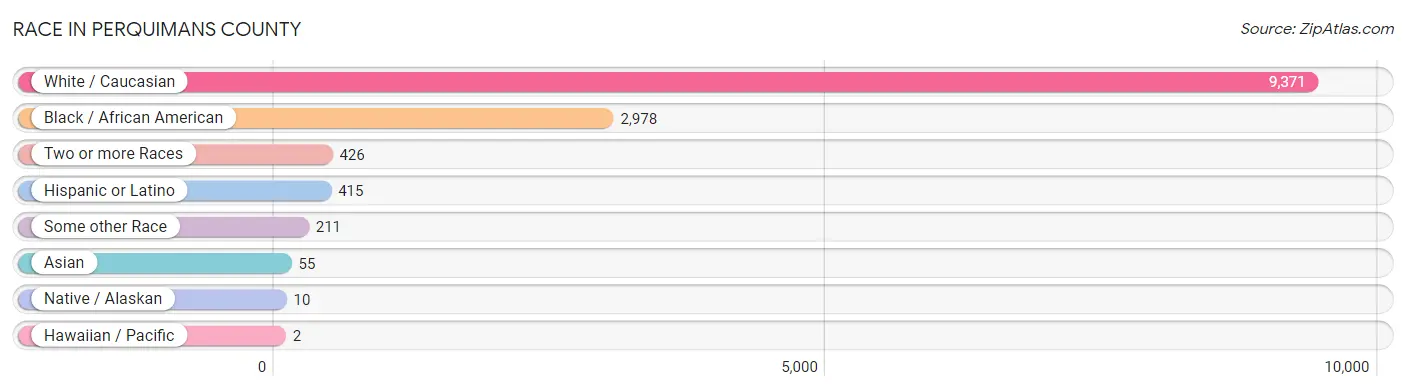
| Race | # Population | % Population |
| Asian | 55 | 0.4% |
| Black / African American | 2,978 | 22.8% |
| Hawaiian / Pacific | 2 | 0.0% |
| Hispanic or Latino | 415 | 3.2% |
| Native / Alaskan | 10 | 0.1% |
| White / Caucasian | 9,371 | 71.8% |
| Two or more Races | 426 | 3.3% |
| Some other Race | 211 | 1.6% |
| Total | 13,053 | 100.0% |
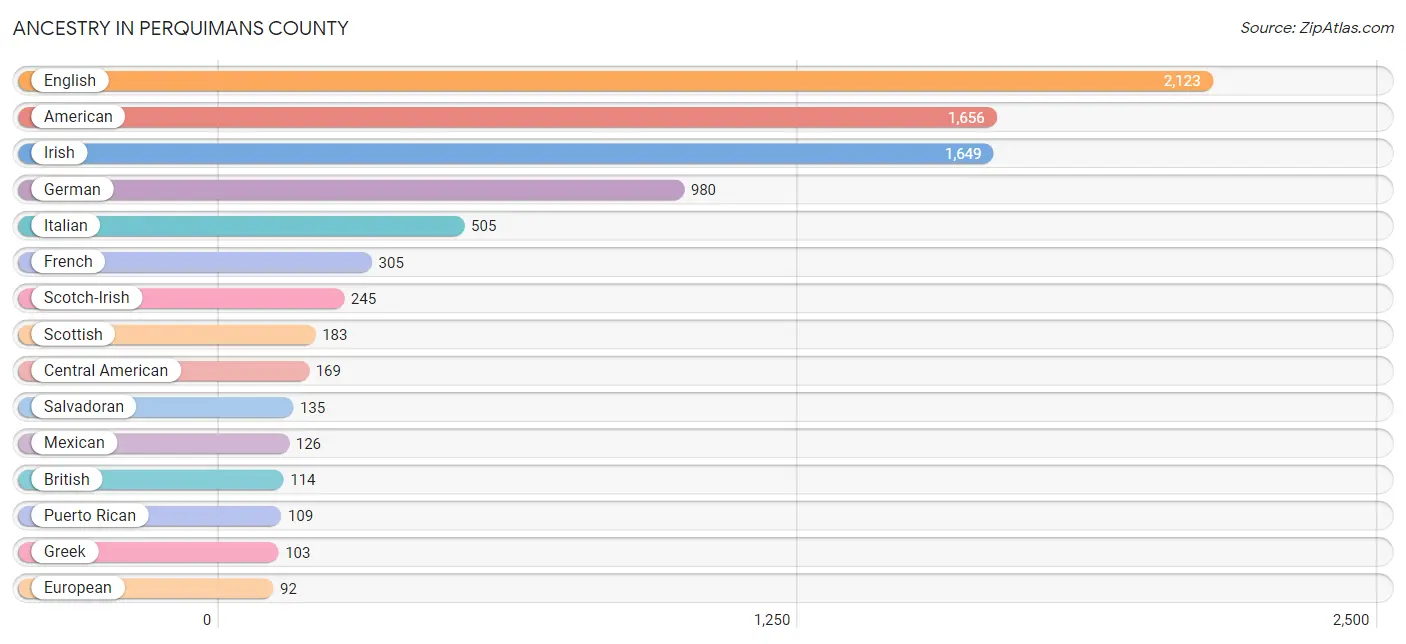
Ancestry in Perquimans County
The most populous ancestries reported in Perquimans County are English (2,123 | 16.3%), American (1,656 | 12.7%), Irish (1,649 | 12.6%), German (980 | 7.5%), and Italian (505 | 3.9%), together accounting for 53.0% of all Perquimans County residents.
| Ancestry | # Population | % Population |
| African | 28 | 0.2% |
| American | 1,656 | 12.7% |
| Austrian | 14 | 0.1% |
| Blackfeet | 2 | 0.0% |
| British | 114 | 0.9% |
| Burmese | 13 | 0.1% |
| Celtic | 8 | 0.1% |
| Central American | 169 | 1.3% |
| Cherokee | 41 | 0.3% |
| Cuban | 11 | 0.1% |
| Czech | 7 | 0.1% |
| Czechoslovakian | 8 | 0.1% |
| Danish | 14 | 0.1% |
| Dutch | 34 | 0.3% |
| English | 2,123 | 16.3% |
| European | 92 | 0.7% |
| Filipino | 28 | 0.2% |
| Finnish | 3 | 0.0% |
| French | 305 | 2.3% |
| French Canadian | 18 | 0.1% |
| German | 980 | 7.5% |
| Greek | 103 | 0.8% |
| Guamanian / Chamorro | 2 | 0.0% |
| Hungarian | 20 | 0.2% |
| Irish | 1,649 | 12.6% |
| Iroquois | 4 | 0.0% |
| Italian | 505 | 3.9% |
| Jamaican | 25 | 0.2% |
| Korean | 13 | 0.1% |
| Lithuanian | 7 | 0.1% |
| Mexican | 126 | 1.0% |
| Northern European | 25 | 0.2% |
| Norwegian | 19 | 0.2% |
| Panamanian | 34 | 0.3% |
| Polish | 76 | 0.6% |
| Puerto Rican | 109 | 0.8% |
| Russian | 32 | 0.3% |
| Salvadoran | 135 | 1.0% |
| Scandinavian | 8 | 0.1% |
| Scotch-Irish | 245 | 1.9% |
| Scottish | 183 | 1.4% |
| Slovak | 69 | 0.5% |
| Sri Lankan | 1 | 0.0% |
| Subsaharan African | 28 | 0.2% |
| Swedish | 7 | 0.1% |
| Welsh | 39 | 0.3% | View All 46 Rows |
Immigrants in Perquimans County
The most numerous immigrant groups reported in Perquimans County came from Latin America (136 | 1.0%), Central America (90 | 0.7%), Europe (81 | 0.6%), El Salvador (51 | 0.4%), and Asia (50 | 0.4%), together accounting for 3.1% of all Perquimans County residents.
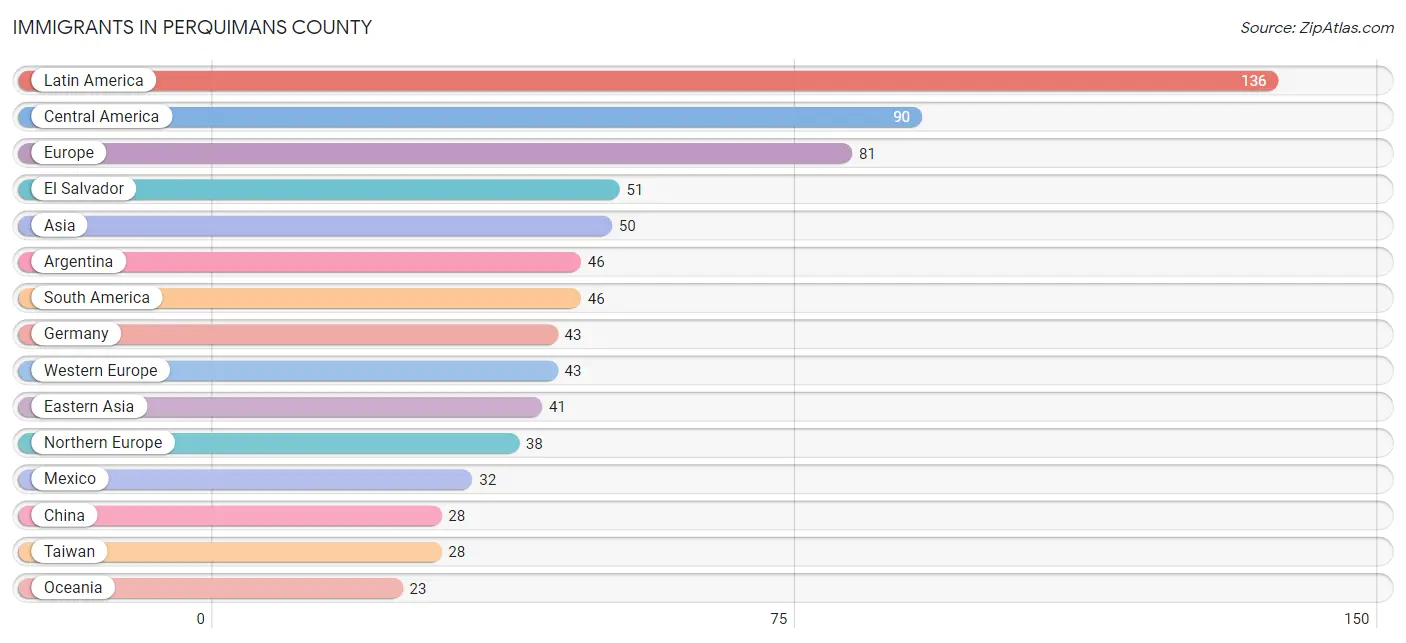
| Immigration Origin | # Population | % Population |
| Africa | 8 | 0.1% |
| Argentina | 46 | 0.4% |
| Asia | 50 | 0.4% |
| Central America | 90 | 0.7% |
| China | 28 | 0.2% |
| Eastern Africa | 8 | 0.1% |
| Eastern Asia | 41 | 0.3% |
| El Salvador | 51 | 0.4% |
| England | 11 | 0.1% |
| Europe | 81 | 0.6% |
| Germany | 43 | 0.3% |
| Japan | 8 | 0.1% |
| Jordan | 9 | 0.1% |
| Korea | 5 | 0.0% |
| Latin America | 136 | 1.0% |
| Mexico | 32 | 0.3% |
| Northern Europe | 38 | 0.3% |
| Oceania | 23 | 0.2% |
| Panama | 7 | 0.1% |
| Scotland | 5 | 0.0% |
| South America | 46 | 0.4% |
| Taiwan | 28 | 0.2% |
| Western Asia | 9 | 0.1% |
| Western Europe | 43 | 0.3% | View All 24 Rows |
Sex and Age in Perquimans County
Sex and Age in Perquimans County
The most populous age groups in Perquimans County are 60 to 64 Years (729 | 11.7%) for men and 65 to 69 Years (684 | 10.0%) for women.
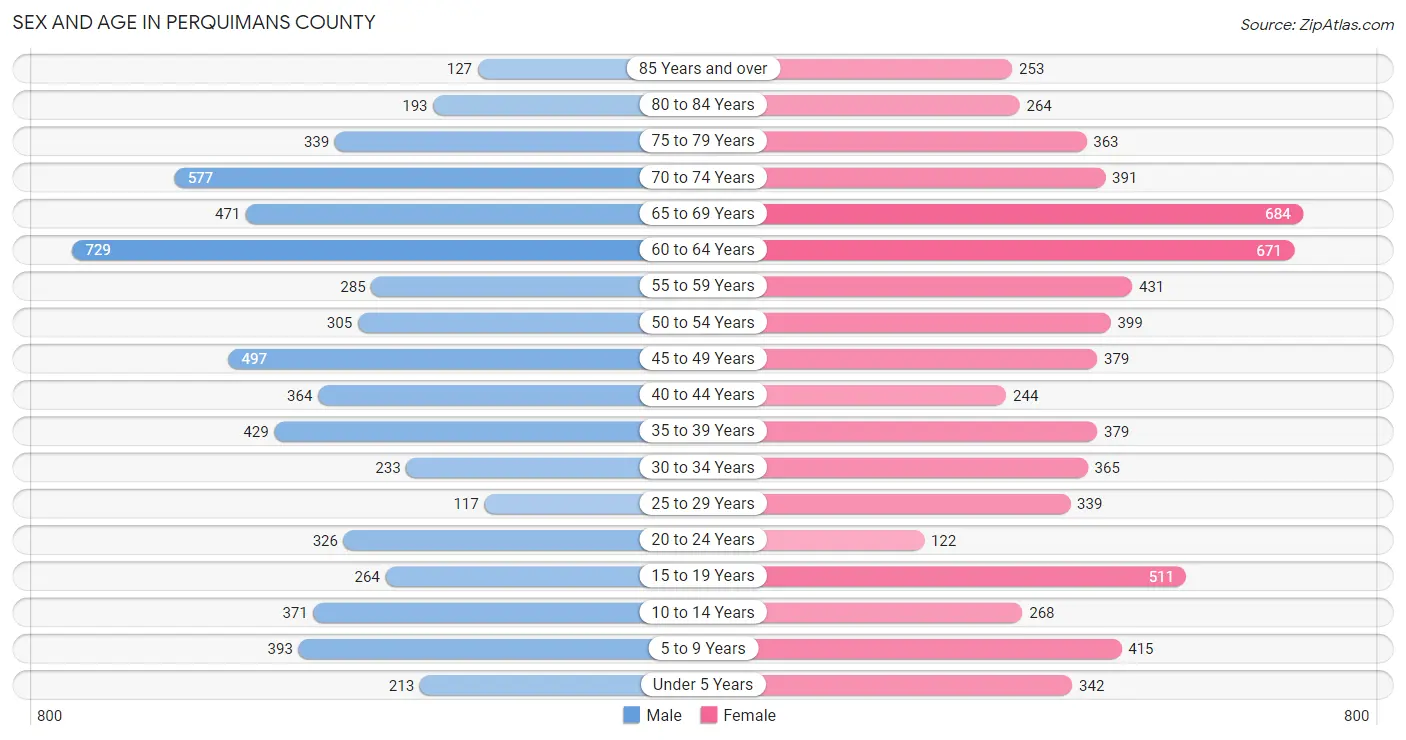
| Age Bracket | Male | Female |
| Under 5 Years | 213 (3.4%) | 342 (5.0%) |
| 5 to 9 Years | 393 (6.3%) | 415 (6.1%) |
| 10 to 14 Years | 371 (5.9%) | 268 (3.9%) |
| 15 to 19 Years | 264 (4.2%) | 511 (7.5%) |
| 20 to 24 Years | 326 (5.2%) | 122 (1.8%) |
| 25 to 29 Years | 117 (1.9%) | 339 (5.0%) |
| 30 to 34 Years | 233 (3.7%) | 365 (5.3%) |
| 35 to 39 Years | 429 (6.9%) | 379 (5.6%) |
| 40 to 44 Years | 364 (5.8%) | 244 (3.6%) |
| 45 to 49 Years | 497 (8.0%) | 379 (5.6%) |
| 50 to 54 Years | 305 (4.9%) | 399 (5.9%) |
| 55 to 59 Years | 285 (4.6%) | 431 (6.3%) |
| 60 to 64 Years | 729 (11.7%) | 671 (9.8%) |
| 65 to 69 Years | 471 (7.6%) | 684 (10.0%) |
| 70 to 74 Years | 577 (9.3%) | 391 (5.7%) |
| 75 to 79 Years | 339 (5.4%) | 363 (5.3%) |
| 80 to 84 Years | 193 (3.1%) | 264 (3.9%) |
| 85 Years and over | 127 (2.0%) | 253 (3.7%) |
| Total | 6,233 (100.0%) | 6,820 (100.0%) |
Families and Households in Perquimans County
Median Family Size in Perquimans County
The median family size in Perquimans County is 2.82 persons per family, with single female/mother families (709 | 18.3%) accounting for the largest median family size of 3.38 persons per family. On the other hand, single male/father families (254 | 6.6%) represent the smallest median family size with 2.60 persons per family.
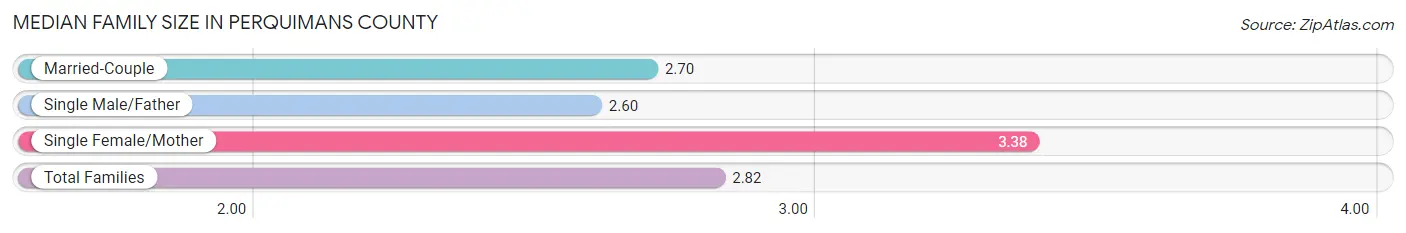
| Family Type | # Families | Family Size |
| Married-Couple | 2,908 (75.1%) | 2.70 |
| Single Male/Father | 254 (6.6%) | 2.60 |
| Single Female/Mother | 709 (18.3%) | 3.38 |
| Total Families | 3,871 (100.0%) | 2.82 |
Median Household Size in Perquimans County
The median household size in Perquimans County is 2.33 persons per household, with single female/mother households (709 | 12.7%) accounting for the largest median household size of 3.44 persons per household. non-family households (1,697 | 30.5%) represent the smallest median household size with 1.09 persons per household.
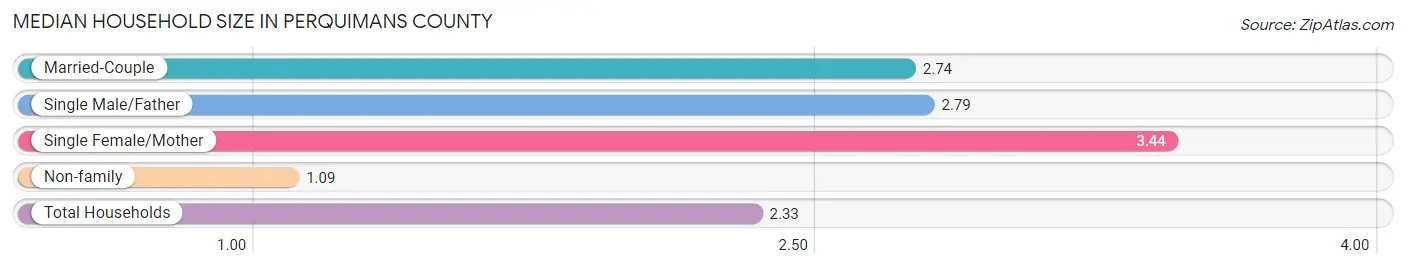
| Household Type | # Households | Household Size |
| Married-Couple | 2,908 (52.2%) | 2.74 |
| Single Male/Father | 254 (4.6%) | 2.79 |
| Single Female/Mother | 709 (12.7%) | 3.44 |
| Non-family | 1,697 (30.5%) | 1.09 |
| Total Households | 5,568 (100.0%) | 2.33 |
Household Size by Marriage Status in Perquimans County
Out of a total of 5,568 households in Perquimans County, 3,871 (69.5%) are family households, while 1,697 (30.5%) are nonfamily households. The most numerous type of family households are 2-person households, comprising 2,424, and the most common type of nonfamily households are 1-person households, comprising 1,567.
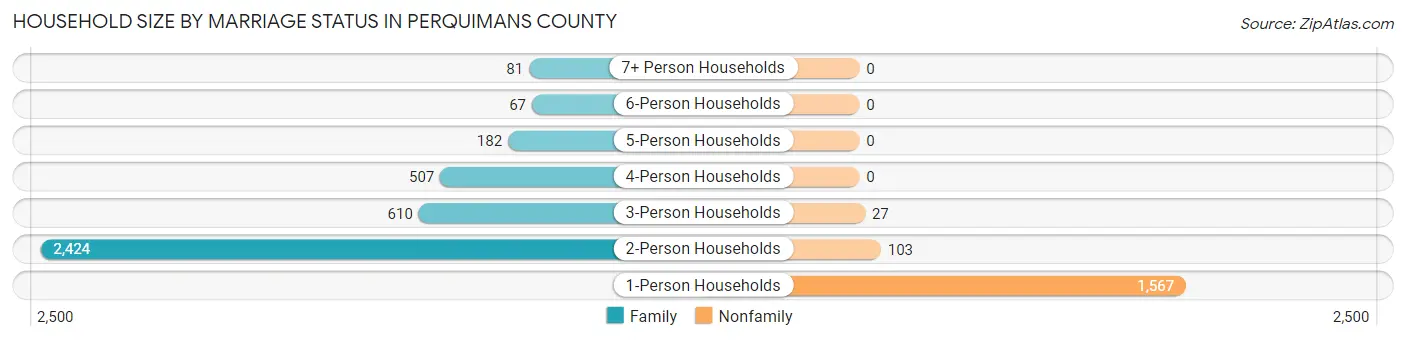
| Household Size | Family Households | Nonfamily Households |
| 1-Person Households | - | 1,567 (28.1%) |
| 2-Person Households | 2,424 (43.5%) | 103 (1.8%) |
| 3-Person Households | 610 (11.0%) | 27 (0.5%) |
| 4-Person Households | 507 (9.1%) | 0 (0.0%) |
| 5-Person Households | 182 (3.3%) | 0 (0.0%) |
| 6-Person Households | 67 (1.2%) | 0 (0.0%) |
| 7+ Person Households | 81 (1.5%) | 0 (0.0%) |
| Total | 3,871 (69.5%) | 1,697 (30.5%) |
Female Fertility in Perquimans County
Fertility by Age in Perquimans County
Average fertility rate in Perquimans County is 8.0 births per 1,000 women. Women in the age bracket of 35 to 50 years have the highest fertility rate with 13.0 births per 1,000 women. Women in the age bracket of 35 to 50 years acount for 70.0% of all women with births.
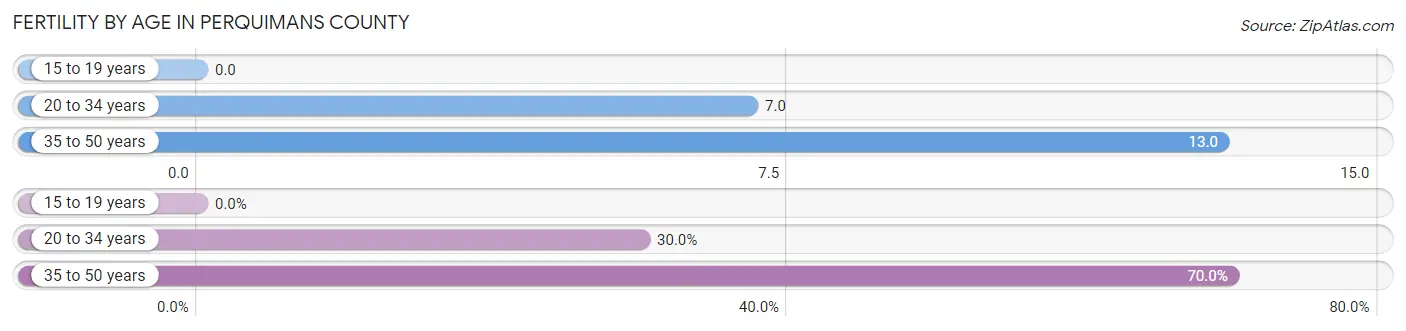
| Age Bracket | Women with Births | Births / 1,000 Women |
| 15 to 19 years | 0 (0.0%) | 0.0 |
| 20 to 34 years | 6 (30.0%) | 7.0 |
| 35 to 50 years | 14 (70.0%) | 13.0 |
| Total | 20 (100.0%) | 8.0 |
Fertility by Age by Marriage Status in Perquimans County
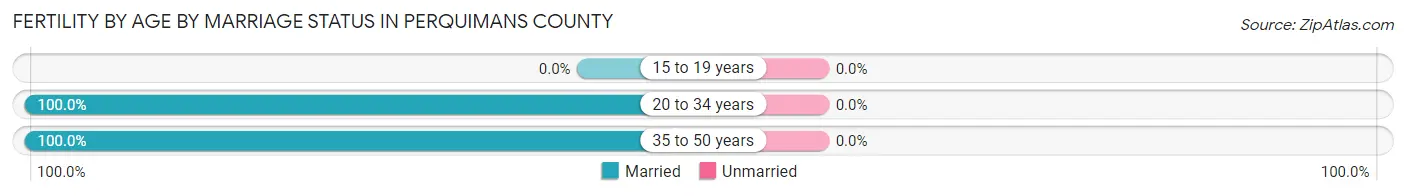
| Age Bracket | Married | Unmarried |
| 15 to 19 years | 0 (0.0%) | 0 (0.0%) |
| 20 to 34 years | 6 (100.0%) | 0 (0.0%) |
| 35 to 50 years | 14 (100.0%) | 0 (0.0%) |
| Total | 20 (100.0%) | 0 (0.0%) |
Fertility by Education in Perquimans County
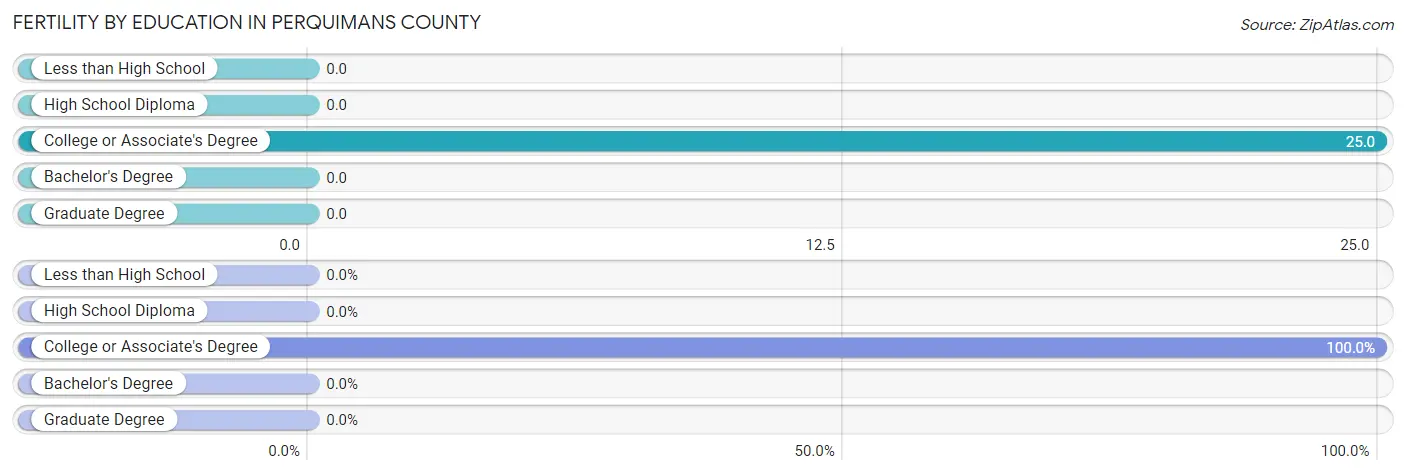
| Educational Attainment | Women with Births | Births / 1,000 Women |
| Less than High School | 0 (0.0%) | 0.0 |
| High School Diploma | 0 (0.0%) | 0.0 |
| College or Associate's Degree | 20 (100.0%) | 25.0 |
| Bachelor's Degree | 0 (0.0%) | 0.0 |
| Graduate Degree | 0 (0.0%) | 0.0 |
| Total | 20 (100.0%) | 8.0 |
Fertility by Education by Marriage Status in Perquimans County
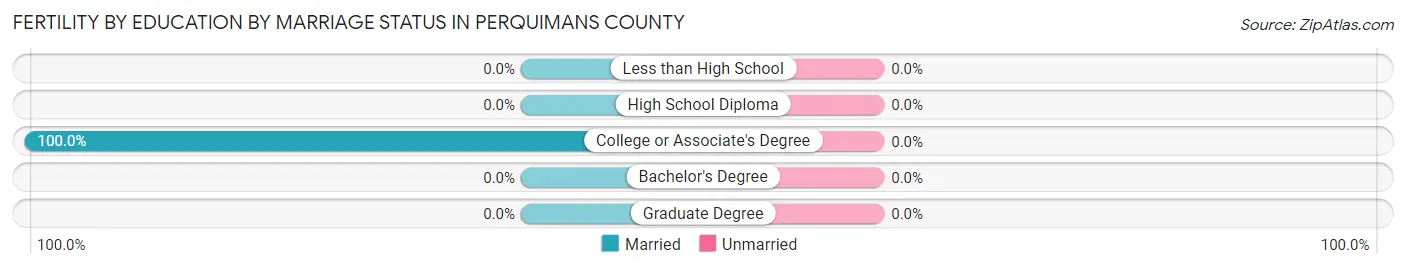
| Educational Attainment | Married | Unmarried |
| Less than High School | 0 (0.0%) | 0 (0.0%) |
| High School Diploma | 0 (0.0%) | 0 (0.0%) |
| College or Associate's Degree | 20 (100.0%) | 0 (0.0%) |
| Bachelor's Degree | 0 (0.0%) | 0 (0.0%) |
| Graduate Degree | 0 (0.0%) | 0 (0.0%) |
| Total | 20 (100.0%) | 0 (0.0%) |
Employment Characteristics in Perquimans County
Employment by Class of Employer in Perquimans County
Among the 5,011 employed individuals in Perquimans County, private company employees (2,809 | 56.1%), federal government employees (482 | 9.6%), and self-employed (incorporated) (412 | 8.2%) make up the most common classes of employment.
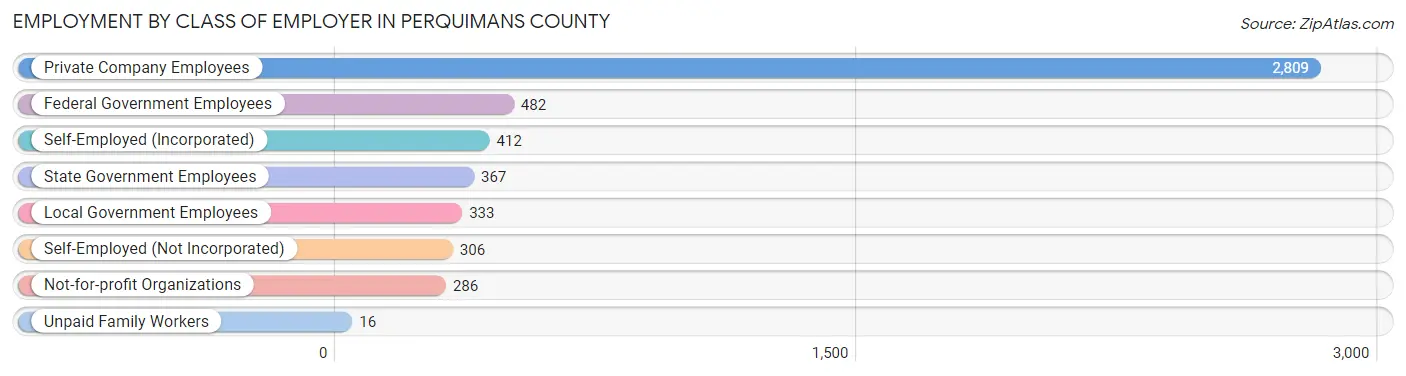
| Employer Class | # Employees | % Employees |
| Private Company Employees | 2,809 | 56.1% |
| Self-Employed (Incorporated) | 412 | 8.2% |
| Self-Employed (Not Incorporated) | 306 | 6.1% |
| Not-for-profit Organizations | 286 | 5.7% |
| Local Government Employees | 333 | 6.7% |
| State Government Employees | 367 | 7.3% |
| Federal Government Employees | 482 | 9.6% |
| Unpaid Family Workers | 16 | 0.3% |
| Total | 5,011 | 100.0% |
Employment Status by Age in Perquimans County
According to the labor force statistics for Perquimans County, out of the total population over 16 years of age (10,944), 49.3% or 5,395 individuals are in the labor force, with 5.0% or 270 of them unemployed. The age group with the highest labor force participation rate is 35 to 44 years, with 86.4% or 1,223 individuals in the labor force. Within the labor force, the 20 to 24 years age range has the highest percentage of unemployed individuals, with 27.0% or 77 of them being unemployed.
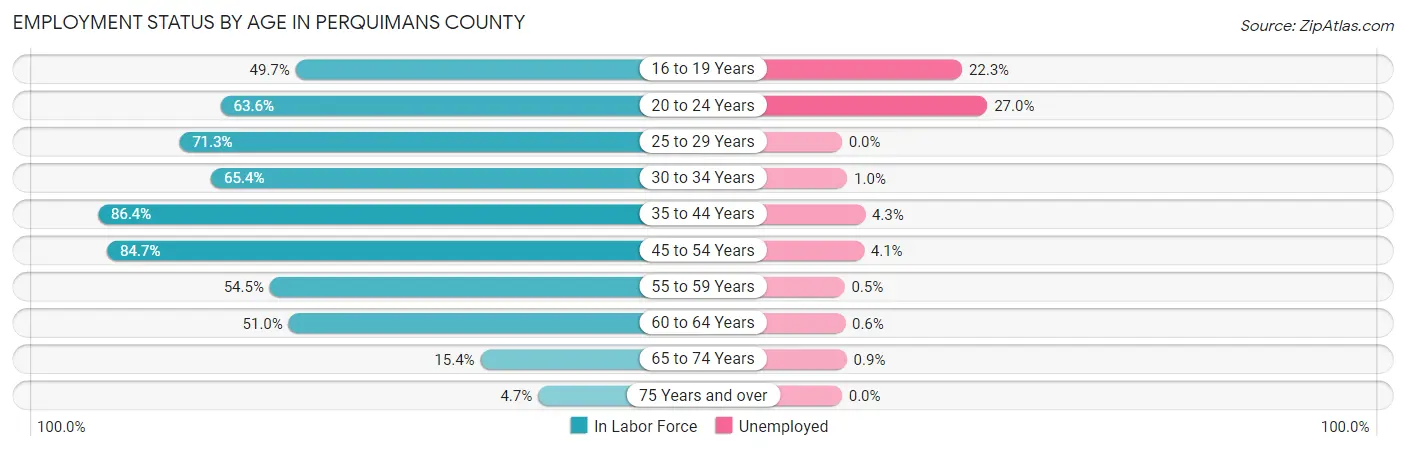
| Age Bracket | In Labor Force | Unemployed |
| 16 to 19 Years | 332 (49.7%) | 74 (22.3%) |
| 20 to 24 Years | 285 (63.6%) | 77 (27.0%) |
| 25 to 29 Years | 325 (71.3%) | 0 (0.0%) |
| 30 to 34 Years | 391 (65.4%) | 4 (1.0%) |
| 35 to 44 Years | 1,223 (86.4%) | 53 (4.3%) |
| 45 to 54 Years | 1,338 (84.7%) | 55 (4.1%) |
| 55 to 59 Years | 390 (54.5%) | 2 (0.5%) |
| 60 to 64 Years | 714 (51.0%) | 4 (0.6%) |
| 65 to 74 Years | 327 (15.4%) | 3 (0.9%) |
| 75 Years and over | 72 (4.7%) | 0 (0.0%) |
| Total | 5,395 (49.3%) | 270 (5.0%) |
Employment Status by Educational Attainment in Perquimans County
According to labor force statistics for Perquimans County, 71.1% of individuals (4,384) out of the total population between 25 and 64 years of age (6,166) are in the labor force, with 2.7% or 118 of them being unemployed. The group with the highest labor force participation rate are those with the educational attainment of college / associate degree, with 80.1% or 1,874 individuals in the labor force. Within the labor force, individuals with less than high school education have the highest percentage of unemployment, with 3.7% or 11 of them being unemployed.
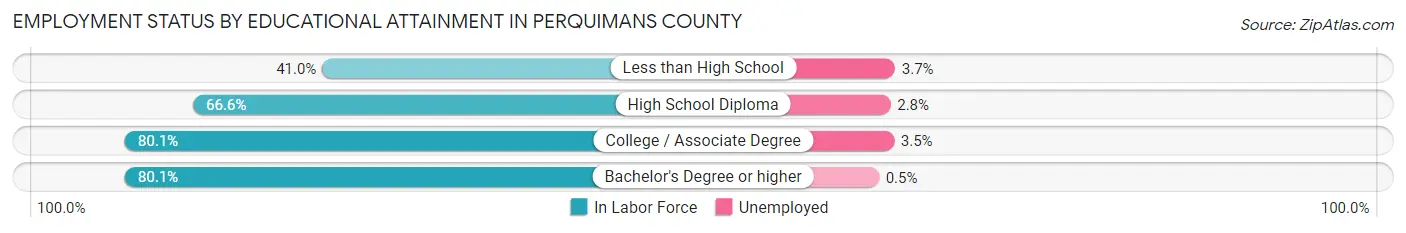
| Educational Attainment | In Labor Force | Unemployed |
| Less than High School | 301 (41.0%) | 27 (3.7%) |
| High School Diploma | 1,332 (66.6%) | 56 (2.8%) |
| College / Associate Degree | 1,874 (80.1%) | 82 (3.5%) |
| Bachelor's Degree or higher | 875 (80.1%) | 5 (0.5%) |
| Total | 4,384 (71.1%) | 166 (2.7%) |
Employment Occupations by Sex in Perquimans County
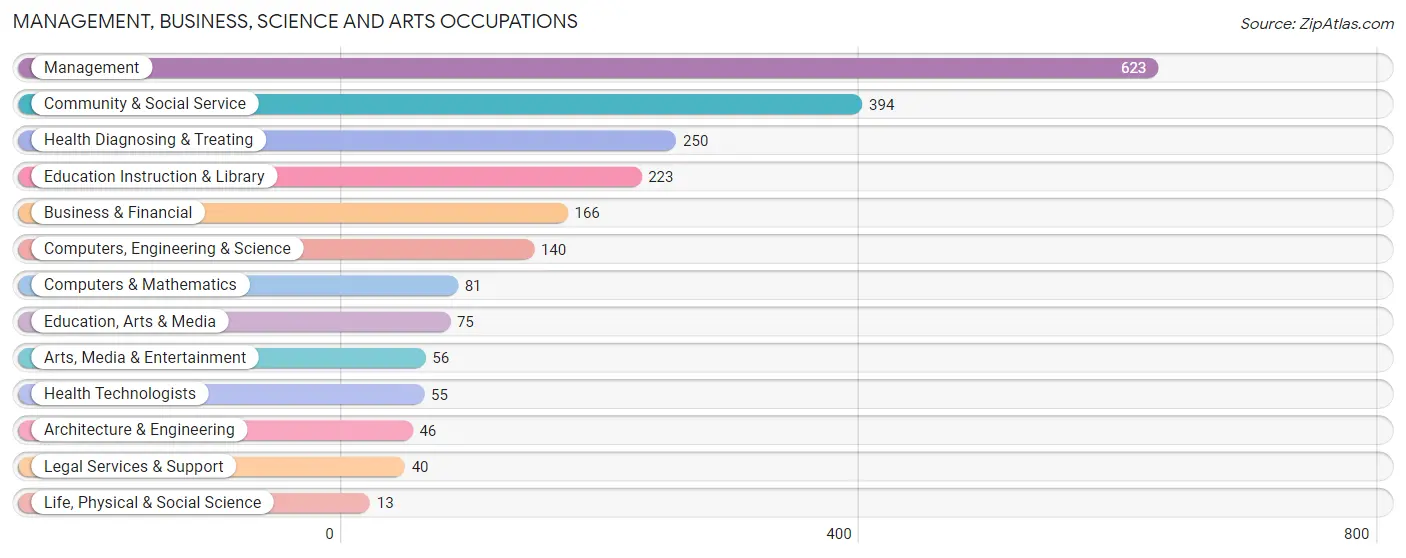
Management, Business, Science and Arts Occupations
The most common Management, Business, Science and Arts occupations in Perquimans County are Management (623 | 12.2%), Community & Social Service (394 | 7.7%), Health Diagnosing & Treating (250 | 4.9%), Education Instruction & Library (223 | 4.4%), and Business & Financial (166 | 3.2%).
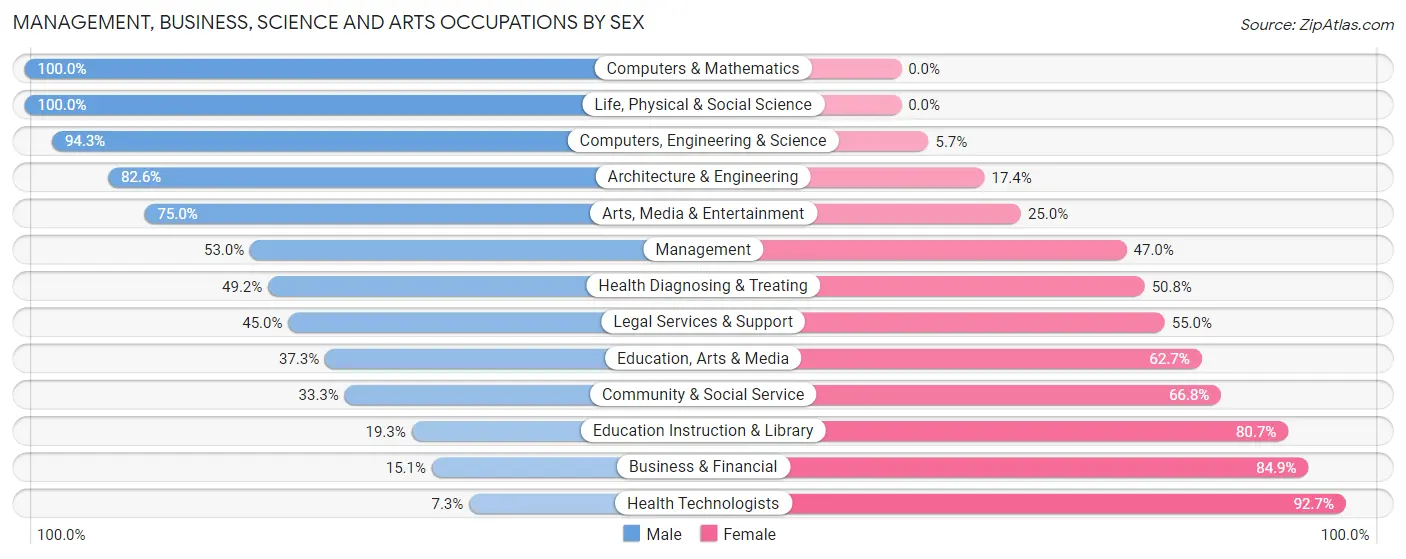
Management, Business, Science and Arts Occupations by Sex
Within the Management, Business, Science and Arts occupations in Perquimans County, the most male-oriented occupations are Computers & Mathematics (100.0%), Life, Physical & Social Science (100.0%), and Computers, Engineering & Science (94.3%), while the most female-oriented occupations are Health Technologists (92.7%), Business & Financial (84.9%), and Education Instruction & Library (80.7%).
| Occupation | Male | Female |
| Management | 330 (53.0%) | 293 (47.0%) |
| Business & Financial | 25 (15.1%) | 141 (84.9%) |
| Computers, Engineering & Science | 132 (94.3%) | 8 (5.7%) |
| Computers & Mathematics | 81 (100.0%) | 0 (0.0%) |
| Architecture & Engineering | 38 (82.6%) | 8 (17.4%) |
| Life, Physical & Social Science | 13 (100.0%) | 0 (0.0%) |
| Community & Social Service | 131 (33.3%) | 263 (66.7%) |
| Education, Arts & Media | 28 (37.3%) | 47 (62.7%) |
| Legal Services & Support | 18 (45.0%) | 22 (55.0%) |
| Education Instruction & Library | 43 (19.3%) | 180 (80.7%) |
| Arts, Media & Entertainment | 42 (75.0%) | 14 (25.0%) |
| Health Diagnosing & Treating | 123 (49.2%) | 127 (50.8%) |
| Health Technologists | 4 (7.3%) | 51 (92.7%) |
| Total (Category) | 741 (47.1%) | 832 (52.9%) |
| Total (Overall) | 2,859 (55.8%) | 2,261 (44.2%) |
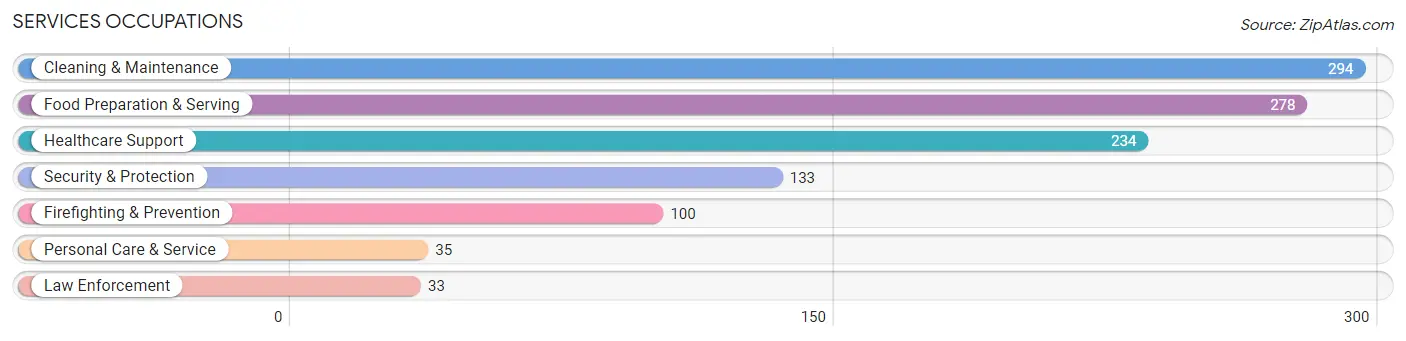
Services Occupations
The most common Services occupations in Perquimans County are Cleaning & Maintenance (294 | 5.7%), Food Preparation & Serving (278 | 5.4%), Healthcare Support (234 | 4.6%), Security & Protection (133 | 2.6%), and Firefighting & Prevention (100 | 1.9%).
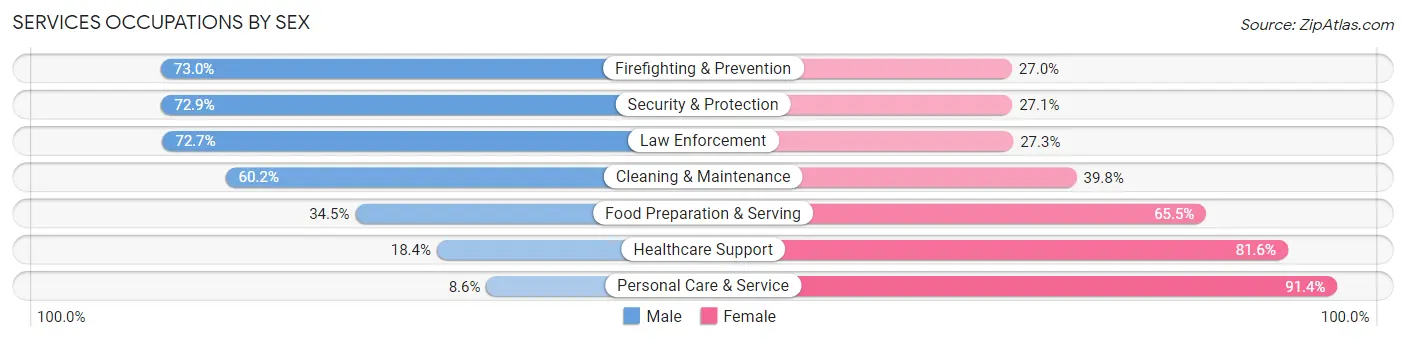
Services Occupations by Sex
Within the Services occupations in Perquimans County, the most male-oriented occupations are Firefighting & Prevention (73.0%), Security & Protection (72.9%), and Law Enforcement (72.7%), while the most female-oriented occupations are Personal Care & Service (91.4%), Healthcare Support (81.6%), and Food Preparation & Serving (65.5%).
| Occupation | Male | Female |
| Healthcare Support | 43 (18.4%) | 191 (81.6%) |
| Security & Protection | 97 (72.9%) | 36 (27.1%) |
| Firefighting & Prevention | 73 (73.0%) | 27 (27.0%) |
| Law Enforcement | 24 (72.7%) | 9 (27.3%) |
| Food Preparation & Serving | 96 (34.5%) | 182 (65.5%) |
| Cleaning & Maintenance | 177 (60.2%) | 117 (39.8%) |
| Personal Care & Service | 3 (8.6%) | 32 (91.4%) |
| Total (Category) | 416 (42.7%) | 558 (57.3%) |
| Total (Overall) | 2,859 (55.8%) | 2,261 (44.2%) |
Sales and Office Occupations
The most common Sales and Office occupations in Perquimans County are Sales & Related (546 | 10.7%), and Office & Administration (545 | 10.6%).
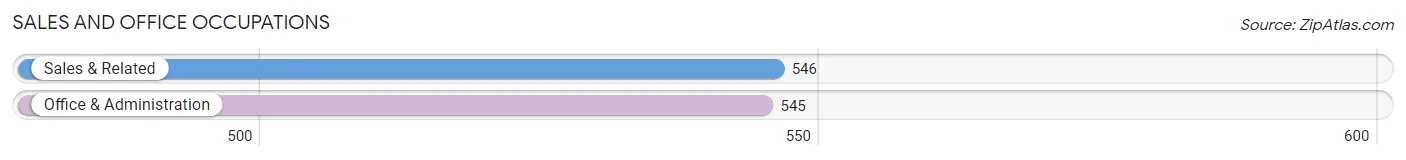
Sales and Office Occupations by Sex
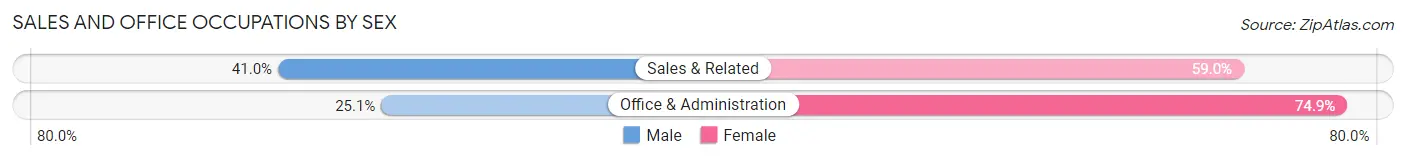
| Occupation | Male | Female |
| Sales & Related | 224 (41.0%) | 322 (59.0%) |
| Office & Administration | 137 (25.1%) | 408 (74.9%) |
| Total (Category) | 361 (33.1%) | 730 (66.9%) |
| Total (Overall) | 2,859 (55.8%) | 2,261 (44.2%) |
Natural Resources, Construction and Maintenance Occupations
The most common Natural Resources, Construction and Maintenance occupations in Perquimans County are Construction & Extraction (334 | 6.5%), Installation, Maintenance & Repair (271 | 5.3%), and Farming, Fishing & Forestry (102 | 2.0%).
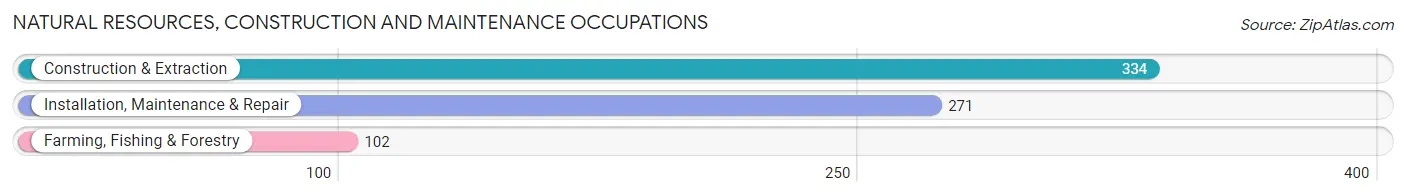
Natural Resources, Construction and Maintenance Occupations by Sex
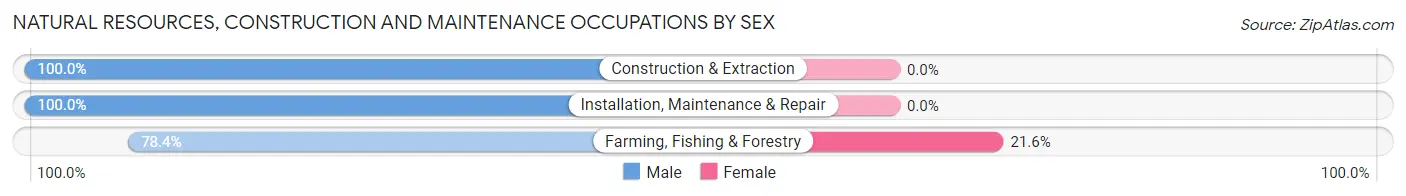
| Occupation | Male | Female |
| Farming, Fishing & Forestry | 80 (78.4%) | 22 (21.6%) |
| Construction & Extraction | 334 (100.0%) | 0 (0.0%) |
| Installation, Maintenance & Repair | 271 (100.0%) | 0 (0.0%) |
| Total (Category) | 685 (96.9%) | 22 (3.1%) |
| Total (Overall) | 2,859 (55.8%) | 2,261 (44.2%) |
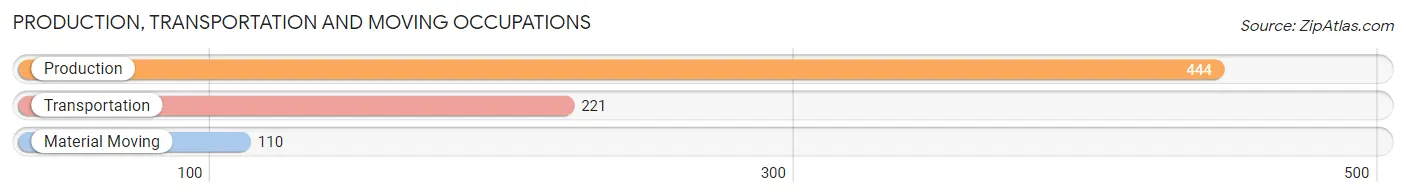
Production, Transportation and Moving Occupations
The most common Production, Transportation and Moving occupations in Perquimans County are Production (444 | 8.7%), Transportation (221 | 4.3%), and Material Moving (110 | 2.1%).
Production, Transportation and Moving Occupations by Sex
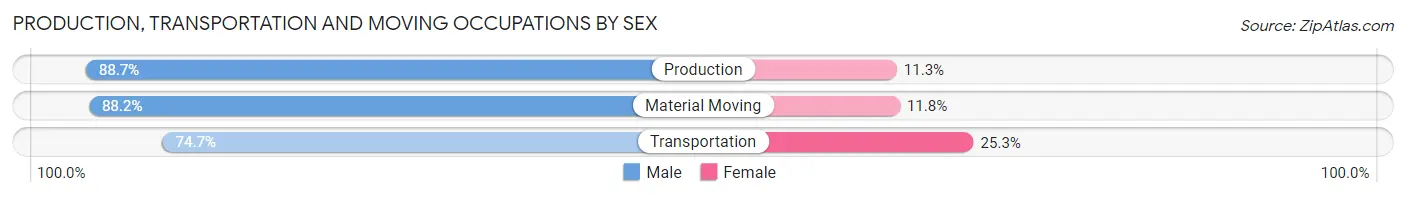
| Occupation | Male | Female |
| Production | 394 (88.7%) | 50 (11.3%) |
| Transportation | 165 (74.7%) | 56 (25.3%) |
| Material Moving | 97 (88.2%) | 13 (11.8%) |
| Total (Category) | 656 (84.7%) | 119 (15.3%) |
| Total (Overall) | 2,859 (55.8%) | 2,261 (44.2%) |
Employment Industries by Sex in Perquimans County
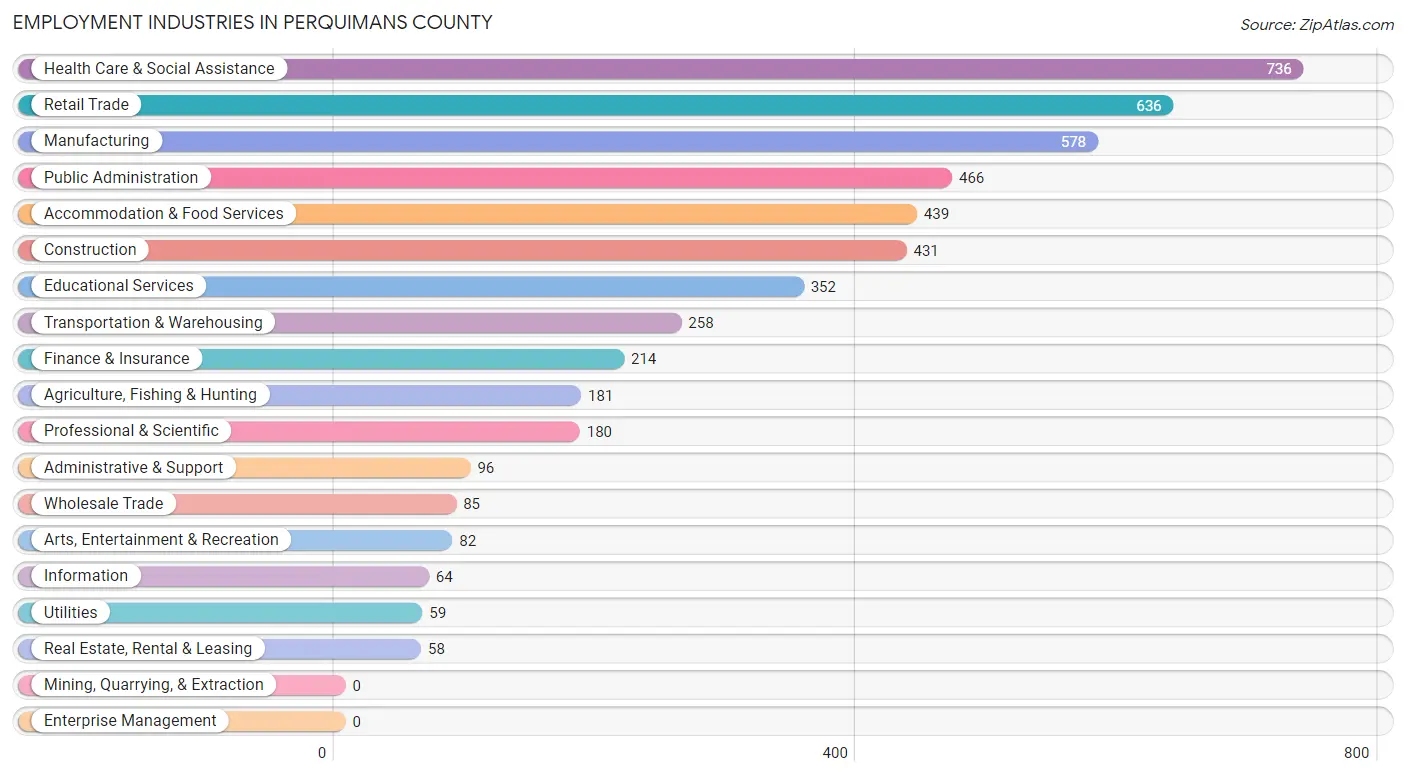
Employment Industries in Perquimans County
The major employment industries in Perquimans County include Health Care & Social Assistance (736 | 14.4%), Retail Trade (636 | 12.4%), Manufacturing (578 | 11.3%), Public Administration (466 | 9.1%), and Accommodation & Food Services (439 | 8.6%).
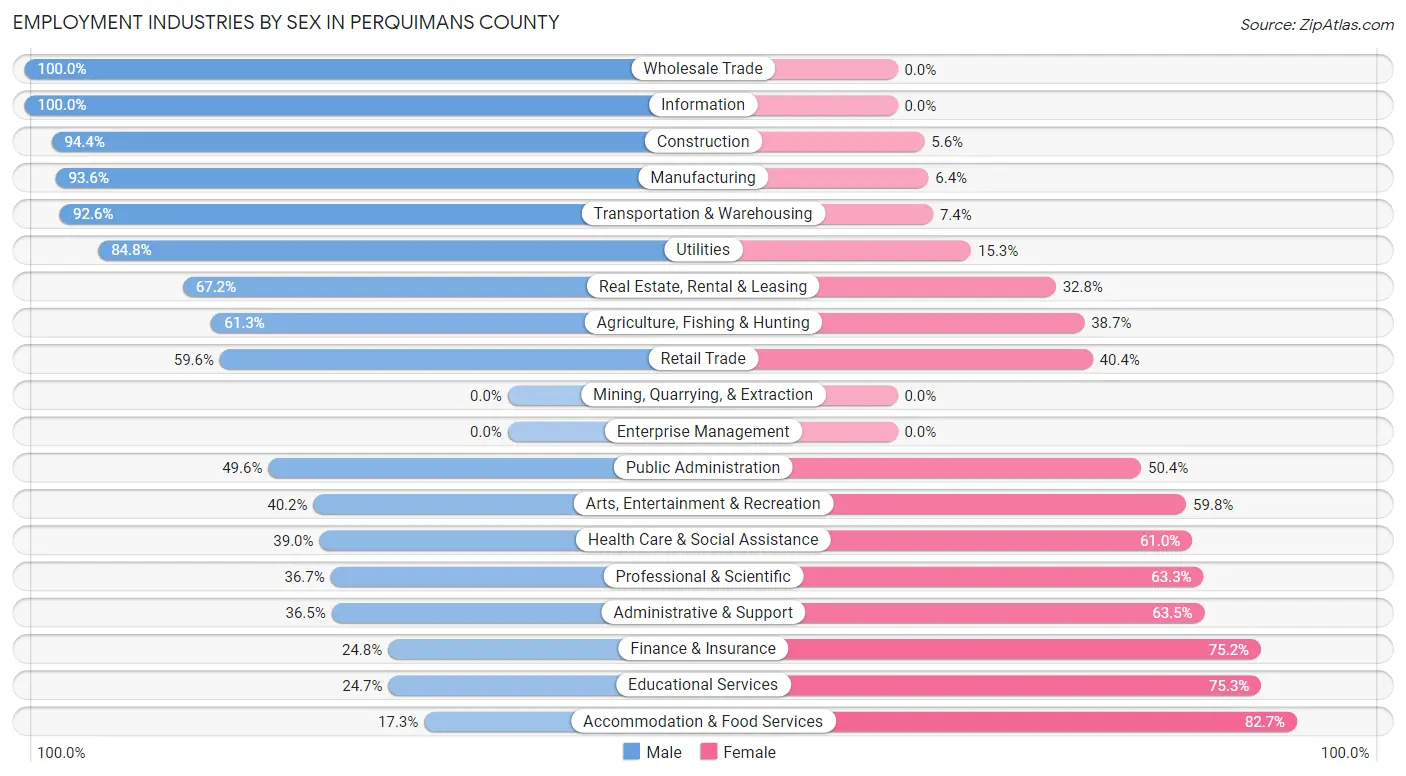
Employment Industries by Sex in Perquimans County
The Perquimans County industries that see more men than women are Wholesale Trade (100.0%), Information (100.0%), and Construction (94.4%), whereas the industries that tend to have a higher number of women are Accommodation & Food Services (82.7%), Educational Services (75.3%), and Finance & Insurance (75.2%).
| Industry | Male | Female |
| Agriculture, Fishing & Hunting | 111 (61.3%) | 70 (38.7%) |
| Mining, Quarrying, & Extraction | 0 (0.0%) | 0 (0.0%) |
| Construction | 407 (94.4%) | 24 (5.6%) |
| Manufacturing | 541 (93.6%) | 37 (6.4%) |
| Wholesale Trade | 85 (100.0%) | 0 (0.0%) |
| Retail Trade | 379 (59.6%) | 257 (40.4%) |
| Transportation & Warehousing | 239 (92.6%) | 19 (7.4%) |
| Utilities | 50 (84.8%) | 9 (15.2%) |
| Information | 64 (100.0%) | 0 (0.0%) |
| Finance & Insurance | 53 (24.8%) | 161 (75.2%) |
| Real Estate, Rental & Leasing | 39 (67.2%) | 19 (32.8%) |
| Professional & Scientific | 66 (36.7%) | 114 (63.3%) |
| Enterprise Management | 0 (0.0%) | 0 (0.0%) |
| Administrative & Support | 35 (36.5%) | 61 (63.5%) |
| Educational Services | 87 (24.7%) | 265 (75.3%) |
| Health Care & Social Assistance | 287 (39.0%) | 449 (61.0%) |
| Arts, Entertainment & Recreation | 33 (40.2%) | 49 (59.8%) |
| Accommodation & Food Services | 76 (17.3%) | 363 (82.7%) |
| Public Administration | 231 (49.6%) | 235 (50.4%) |
| Total | 2,859 (55.8%) | 2,261 (44.2%) |
Education in Perquimans County
School Enrollment in Perquimans County
The most common levels of schooling among the 2,418 students in Perquimans County are middle school (582 | 24.1%), high school (563 | 23.3%), and college / undergraduate (548 | 22.7%).
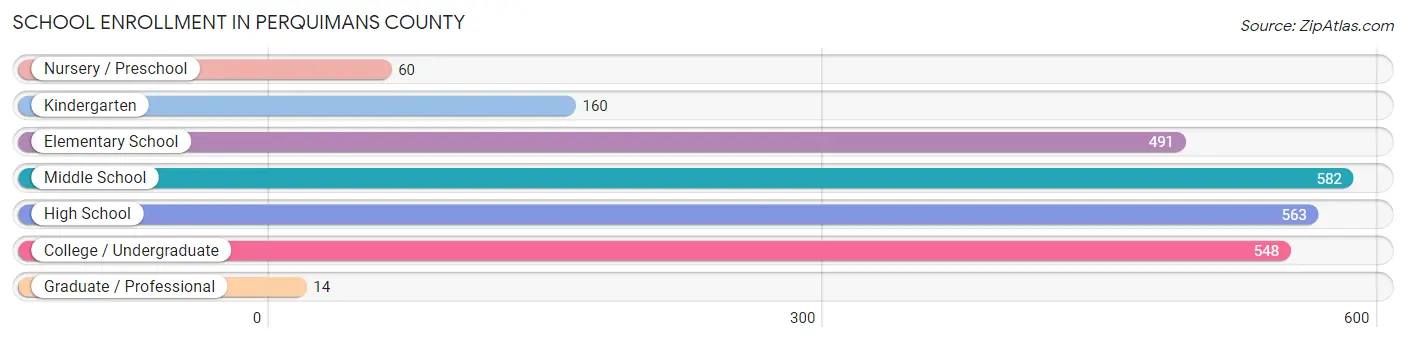
| School Level | # Students | % Students |
| Nursery / Preschool | 60 | 2.5% |
| Kindergarten | 160 | 6.6% |
| Elementary School | 491 | 20.3% |
| Middle School | 582 | 24.1% |
| High School | 563 | 23.3% |
| College / Undergraduate | 548 | 22.7% |
| Graduate / Professional | 14 | 0.6% |
| Total | 2,418 | 100.0% |
School Enrollment by Age by Funding Source in Perquimans County
Out of a total of 2,418 students who are enrolled in schools in Perquimans County, 295 (12.2%) attend a private institution, while the remaining 2,123 (87.8%) are enrolled in public schools. The age group of 3 to 4 year olds has the highest likelihood of being enrolled in private schools, with 51 (85.0% in the age bracket) enrolled. Conversely, the age group of 20 to 24 year olds has the lowest likelihood of being enrolled in a private school, with 80 (100.0% in the age bracket) attending a public institution.
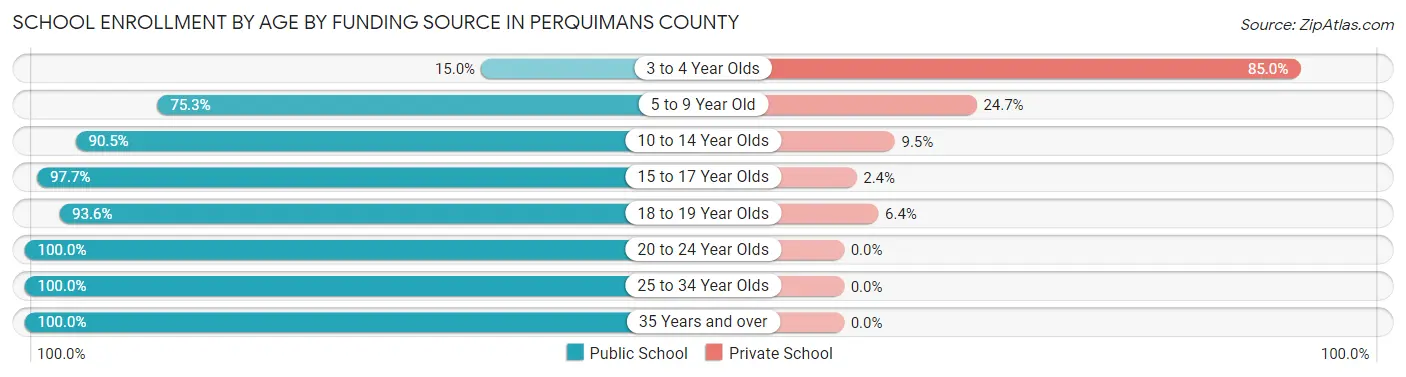
| Age Bracket | Public School | Private School |
| 3 to 4 Year Olds | 9 (15.0%) | 51 (85.0%) |
| 5 to 9 Year Old | 481 (75.3%) | 158 (24.7%) |
| 10 to 14 Year Olds | 573 (90.5%) | 60 (9.5%) |
| 15 to 17 Year Olds | 415 (97.7%) | 10 (2.4%) |
| 18 to 19 Year Olds | 248 (93.6%) | 17 (6.4%) |
| 20 to 24 Year Olds | 80 (100.0%) | 0 (0.0%) |
| 25 to 34 Year Olds | 141 (100.0%) | 0 (0.0%) |
| 35 Years and over | 175 (100.0%) | 0 (0.0%) |
| Total | 2,123 (87.8%) | 295 (12.2%) |
Educational Attainment by Field of Study in Perquimans County
Education (443 | 21.7%), business (365 | 17.9%), science & technology (217 | 10.6%), arts & humanities (190 | 9.3%), and bio, nature & agricultural (162 | 7.9%) are the most common fields of study among 2,041 individuals in Perquimans County who have obtained a bachelor's degree or higher.
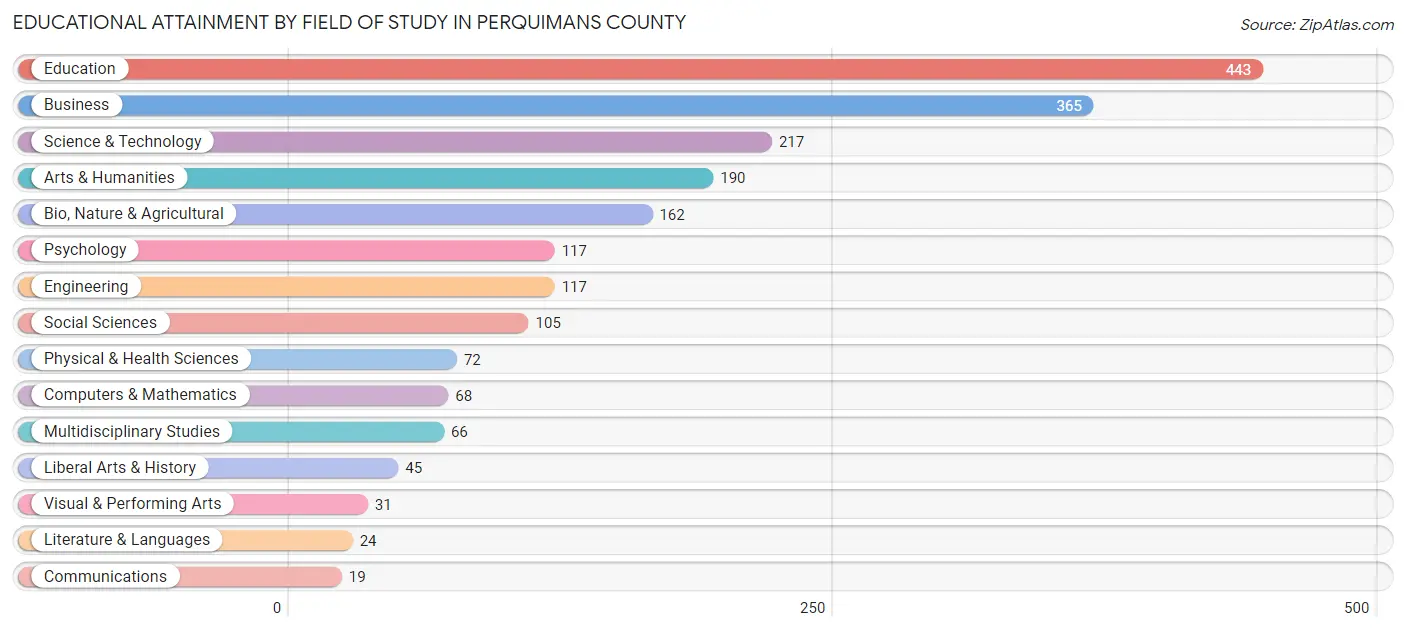
| Field of Study | # Graduates | % Graduates |
| Computers & Mathematics | 68 | 3.3% |
| Bio, Nature & Agricultural | 162 | 7.9% |
| Physical & Health Sciences | 72 | 3.5% |
| Psychology | 117 | 5.7% |
| Social Sciences | 105 | 5.1% |
| Engineering | 117 | 5.7% |
| Multidisciplinary Studies | 66 | 3.2% |
| Science & Technology | 217 | 10.6% |
| Business | 365 | 17.9% |
| Education | 443 | 21.7% |
| Literature & Languages | 24 | 1.2% |
| Liberal Arts & History | 45 | 2.2% |
| Visual & Performing Arts | 31 | 1.5% |
| Communications | 19 | 0.9% |
| Arts & Humanities | 190 | 9.3% |
| Total | 2,041 | 100.0% |
Transportation & Commute in Perquimans County
Vehicle Availability by Sex in Perquimans County
The most prevalent vehicle ownership categories in Perquimans County are males with 2 vehicles (1,155, accounting for 41.4%) and females with 2 vehicles (711, making up 52.0%).
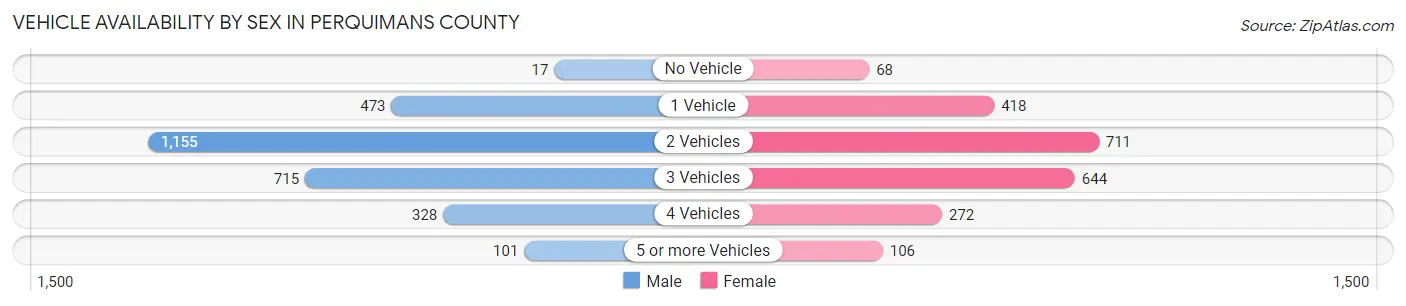
| Vehicles Available | Male | Female |
| No Vehicle | 17 (0.6%) | 68 (3.1%) |
| 1 Vehicle | 473 (17.0%) | 418 (18.8%) |
| 2 Vehicles | 1,155 (41.4%) | 711 (32.0%) |
| 3 Vehicles | 715 (25.6%) | 644 (29.0%) |
| 4 Vehicles | 328 (11.8%) | 272 (12.3%) |
| 5 or more Vehicles | 101 (3.6%) | 106 (4.8%) |
| Total | 2,789 (100.0%) | 2,219 (100.0%) |
Commute Time in Perquimans County
The most frequently occuring commute durations in Perquimans County are 15 to 19 minutes (803 commuters, 16.9%), 60 to 89 minutes (785 commuters, 16.5%), and 30 to 34 minutes (502 commuters, 10.5%).
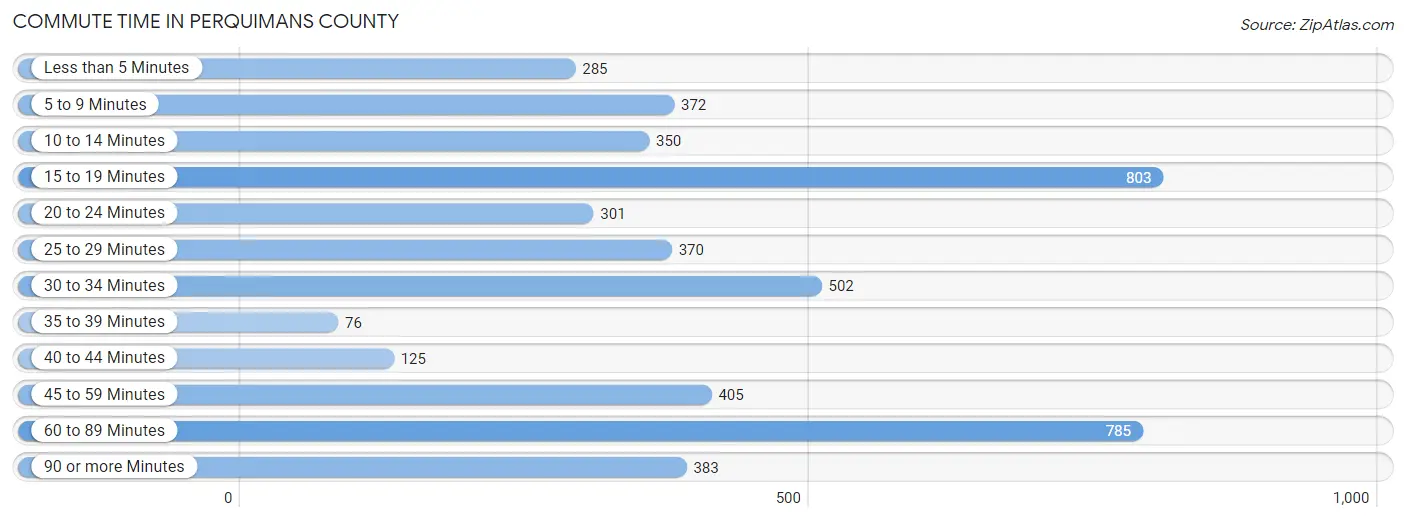
| Commute Time | # Commuters | % Commuters |
| Less than 5 Minutes | 285 | 6.0% |
| 5 to 9 Minutes | 372 | 7.8% |
| 10 to 14 Minutes | 350 | 7.4% |
| 15 to 19 Minutes | 803 | 16.9% |
| 20 to 24 Minutes | 301 | 6.3% |
| 25 to 29 Minutes | 370 | 7.8% |
| 30 to 34 Minutes | 502 | 10.5% |
| 35 to 39 Minutes | 76 | 1.6% |
| 40 to 44 Minutes | 125 | 2.6% |
| 45 to 59 Minutes | 405 | 8.5% |
| 60 to 89 Minutes | 785 | 16.5% |
| 90 or more Minutes | 383 | 8.1% |
Commute Time by Sex in Perquimans County
The most common commute times in Perquimans County are 60 to 89 minutes (482 commuters, 18.4%) for males and 15 to 19 minutes (394 commuters, 18.4%) for females.
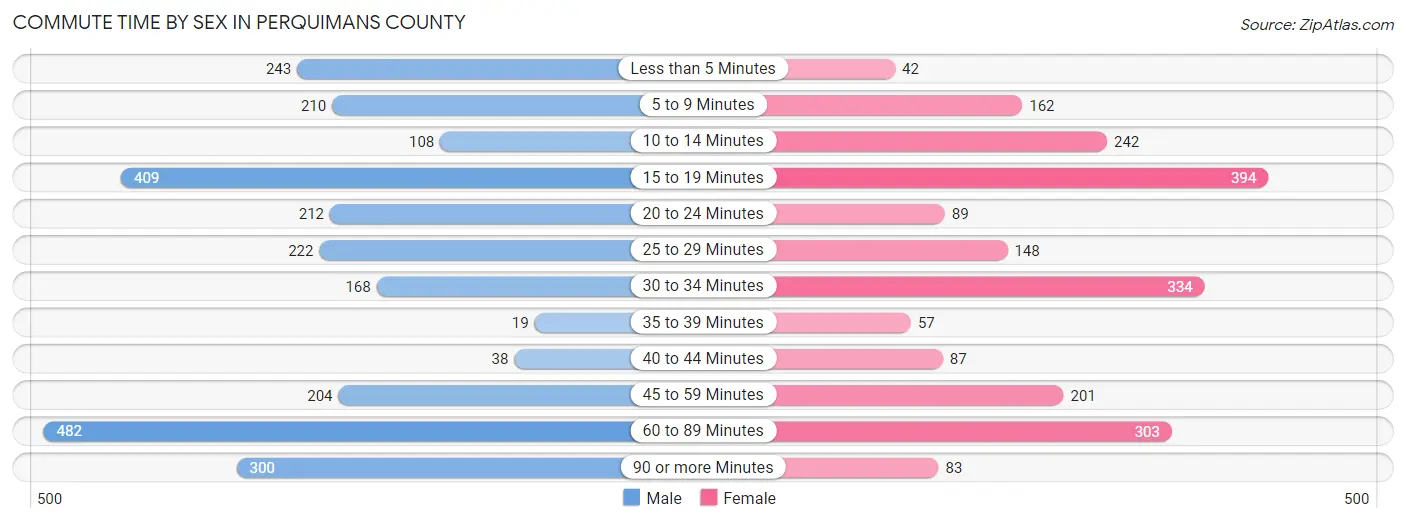
| Commute Time | Male | Female |
| Less than 5 Minutes | 243 (9.3%) | 42 (2.0%) |
| 5 to 9 Minutes | 210 (8.0%) | 162 (7.6%) |
| 10 to 14 Minutes | 108 (4.1%) | 242 (11.3%) |
| 15 to 19 Minutes | 409 (15.6%) | 394 (18.4%) |
| 20 to 24 Minutes | 212 (8.1%) | 89 (4.2%) |
| 25 to 29 Minutes | 222 (8.5%) | 148 (6.9%) |
| 30 to 34 Minutes | 168 (6.4%) | 334 (15.6%) |
| 35 to 39 Minutes | 19 (0.7%) | 57 (2.7%) |
| 40 to 44 Minutes | 38 (1.5%) | 87 (4.1%) |
| 45 to 59 Minutes | 204 (7.8%) | 201 (9.4%) |
| 60 to 89 Minutes | 482 (18.4%) | 303 (14.1%) |
| 90 or more Minutes | 300 (11.5%) | 83 (3.9%) |
Time of Departure to Work by Sex in Perquimans County
The most frequent times of departure to work in Perquimans County are 12:00 AM to 4:59 AM (438, 16.8%) for males and 7:30 AM to 7:59 AM (386, 18.0%) for females.
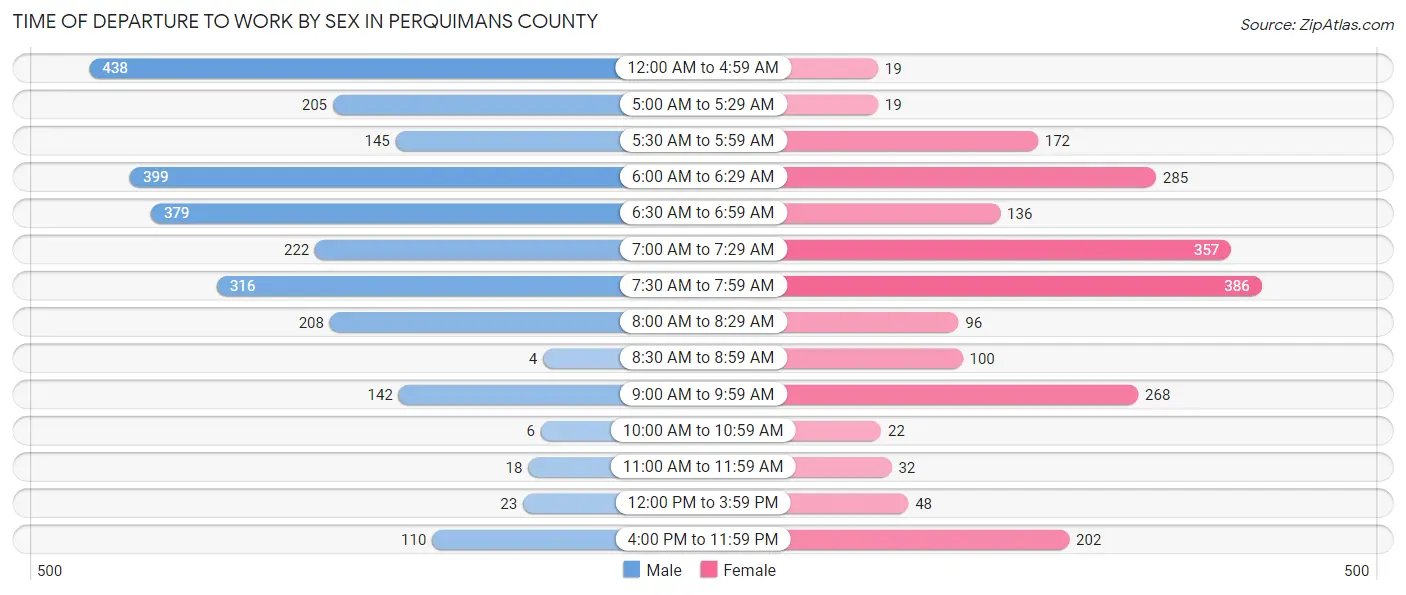
| Time of Departure | Male | Female |
| 12:00 AM to 4:59 AM | 438 (16.8%) | 19 (0.9%) |
| 5:00 AM to 5:29 AM | 205 (7.8%) | 19 (0.9%) |
| 5:30 AM to 5:59 AM | 145 (5.5%) | 172 (8.0%) |
| 6:00 AM to 6:29 AM | 399 (15.3%) | 285 (13.3%) |
| 6:30 AM to 6:59 AM | 379 (14.5%) | 136 (6.4%) |
| 7:00 AM to 7:29 AM | 222 (8.5%) | 357 (16.7%) |
| 7:30 AM to 7:59 AM | 316 (12.1%) | 386 (18.0%) |
| 8:00 AM to 8:29 AM | 208 (8.0%) | 96 (4.5%) |
| 8:30 AM to 8:59 AM | 4 (0.2%) | 100 (4.7%) |
| 9:00 AM to 9:59 AM | 142 (5.4%) | 268 (12.5%) |
| 10:00 AM to 10:59 AM | 6 (0.2%) | 22 (1.0%) |
| 11:00 AM to 11:59 AM | 18 (0.7%) | 32 (1.5%) |
| 12:00 PM to 3:59 PM | 23 (0.9%) | 48 (2.2%) |
| 4:00 PM to 11:59 PM | 110 (4.2%) | 202 (9.4%) |
| Total | 2,615 (100.0%) | 2,142 (100.0%) |
Housing Occupancy in Perquimans County
Occupancy by Ownership in Perquimans County
Of the total 5,568 dwellings in Perquimans County, owner-occupied units account for 4,265 (76.6%), while renter-occupied units make up 1,303 (23.4%).
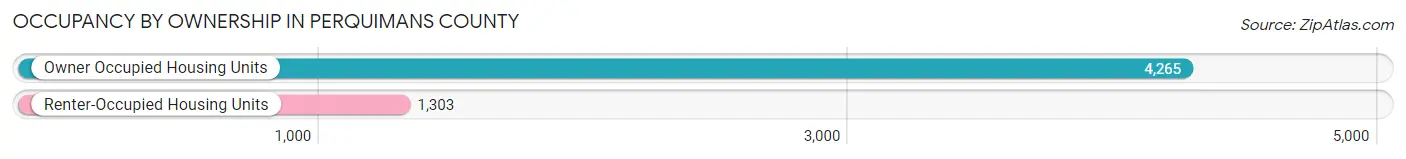
| Occupancy | # Housing Units | % Housing Units |
| Owner Occupied Housing Units | 4,265 | 76.6% |
| Renter-Occupied Housing Units | 1,303 | 23.4% |
| Total Occupied Housing Units | 5,568 | 100.0% |
Occupancy by Household Size in Perquimans County
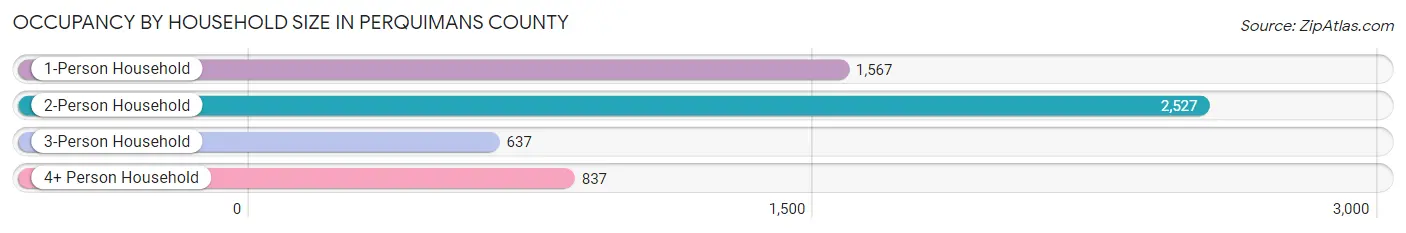
| Household Size | # Housing Units | % Housing Units |
| 1-Person Household | 1,567 | 28.1% |
| 2-Person Household | 2,527 | 45.4% |
| 3-Person Household | 637 | 11.4% |
| 4+ Person Household | 837 | 15.0% |
| Total Housing Units | 5,568 | 100.0% |
Occupancy by Ownership by Household Size in Perquimans County
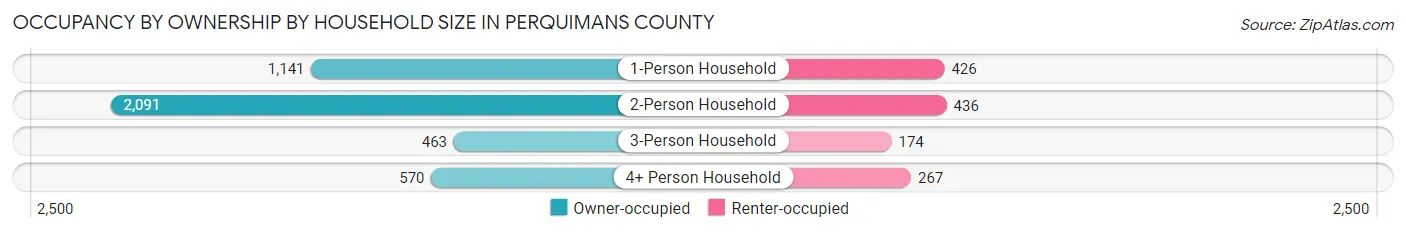
| Household Size | Owner-occupied | Renter-occupied |
| 1-Person Household | 1,141 (72.8%) | 426 (27.2%) |
| 2-Person Household | 2,091 (82.8%) | 436 (17.2%) |
| 3-Person Household | 463 (72.7%) | 174 (27.3%) |
| 4+ Person Household | 570 (68.1%) | 267 (31.9%) |
| Total Housing Units | 4,265 (76.6%) | 1,303 (23.4%) |
Occupancy by Educational Attainment in Perquimans County
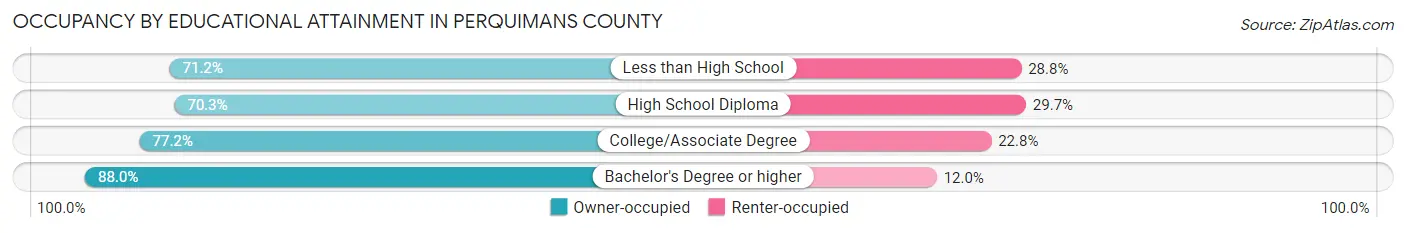
| Household Size | Owner-occupied | Renter-occupied |
| Less than High School | 498 (71.2%) | 201 (28.8%) |
| High School Diploma | 1,146 (70.3%) | 484 (29.7%) |
| College/Associate Degree | 1,638 (77.2%) | 484 (22.8%) |
| Bachelor's Degree or higher | 983 (88.0%) | 134 (12.0%) |
Occupancy by Age of Householder in Perquimans County
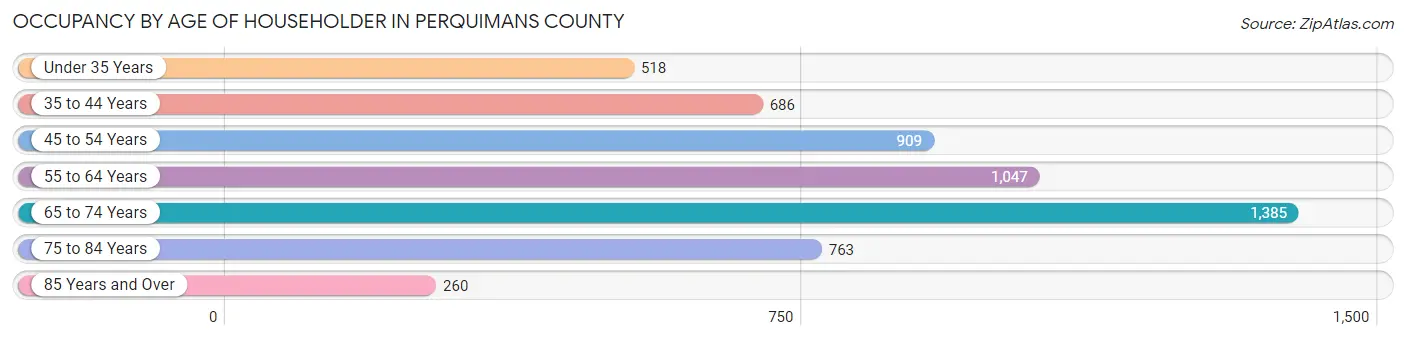
| Age Bracket | # Households | % Households |
| Under 35 Years | 518 | 9.3% |
| 35 to 44 Years | 686 | 12.3% |
| 45 to 54 Years | 909 | 16.3% |
| 55 to 64 Years | 1,047 | 18.8% |
| 65 to 74 Years | 1,385 | 24.9% |
| 75 to 84 Years | 763 | 13.7% |
| 85 Years and Over | 260 | 4.7% |
| Total | 5,568 | 100.0% |
Housing Finances in Perquimans County
Median Income by Occupancy in Perquimans County
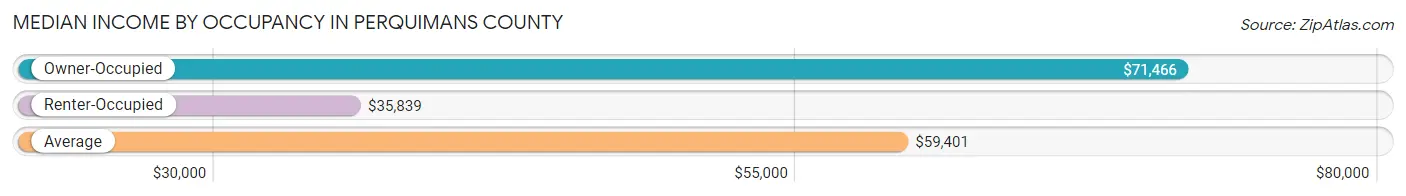
| Occupancy Type | # Households | Median Income |
| Owner-Occupied | 4,265 (76.6%) | $71,466 |
| Renter-Occupied | 1,303 (23.4%) | $35,839 |
| Average | 5,568 (100.0%) | $59,401 |
Occupancy by Householder Income Bracket in Perquimans County
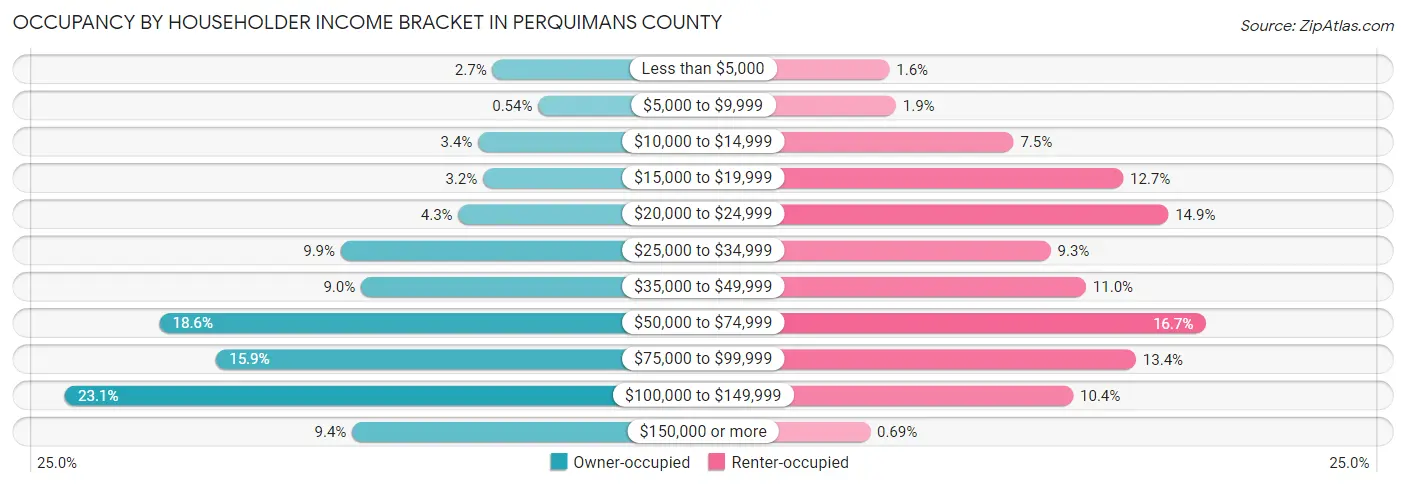
| Income Bracket | Owner-occupied | Renter-occupied |
| Less than $5,000 | 116 (2.7%) | 21 (1.6%) |
| $5,000 to $9,999 | 23 (0.5%) | 25 (1.9%) |
| $10,000 to $14,999 | 145 (3.4%) | 98 (7.5%) |
| $15,000 to $19,999 | 135 (3.2%) | 166 (12.7%) |
| $20,000 to $24,999 | 185 (4.3%) | 194 (14.9%) |
| $25,000 to $34,999 | 424 (9.9%) | 121 (9.3%) |
| $35,000 to $49,999 | 383 (9.0%) | 143 (11.0%) |
| $50,000 to $74,999 | 792 (18.6%) | 217 (16.7%) |
| $75,000 to $99,999 | 677 (15.9%) | 174 (13.4%) |
| $100,000 to $149,999 | 984 (23.1%) | 135 (10.4%) |
| $150,000 or more | 401 (9.4%) | 9 (0.7%) |
| Total | 4,265 (100.0%) | 1,303 (100.0%) |
Monthly Housing Cost Tiers in Perquimans County
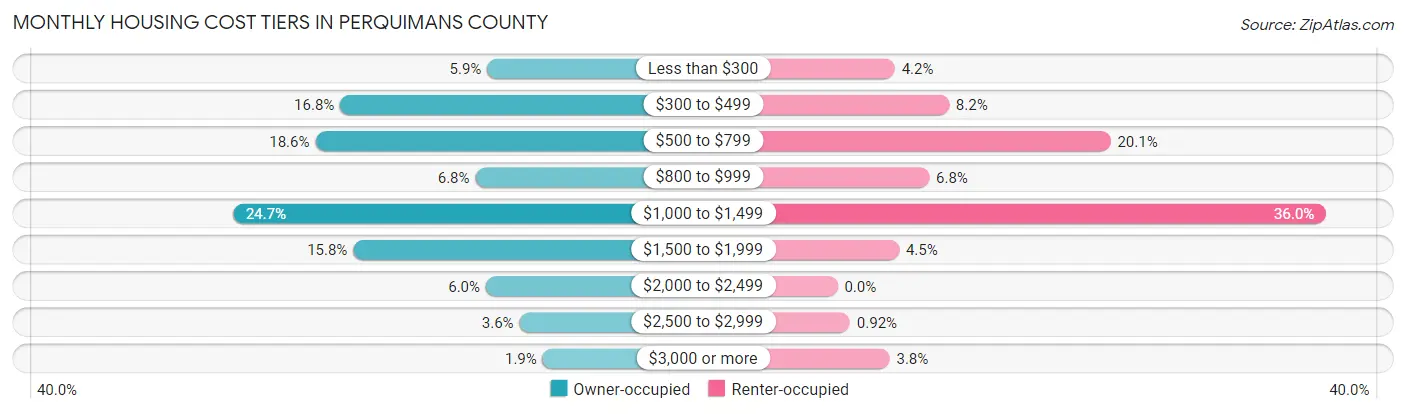
| Monthly Cost | Owner-occupied | Renter-occupied |
| Less than $300 | 253 (5.9%) | 55 (4.2%) |
| $300 to $499 | 715 (16.8%) | 107 (8.2%) |
| $500 to $799 | 793 (18.6%) | 262 (20.1%) |
| $800 to $999 | 290 (6.8%) | 88 (6.8%) |
| $1,000 to $1,499 | 1,052 (24.7%) | 469 (36.0%) |
| $1,500 to $1,999 | 674 (15.8%) | 59 (4.5%) |
| $2,000 to $2,499 | 257 (6.0%) | 0 (0.0%) |
| $2,500 to $2,999 | 152 (3.6%) | 12 (0.9%) |
| $3,000 or more | 79 (1.8%) | 50 (3.8%) |
| Total | 4,265 (100.0%) | 1,303 (100.0%) |
Physical Housing Characteristics in Perquimans County
Housing Structures in Perquimans County
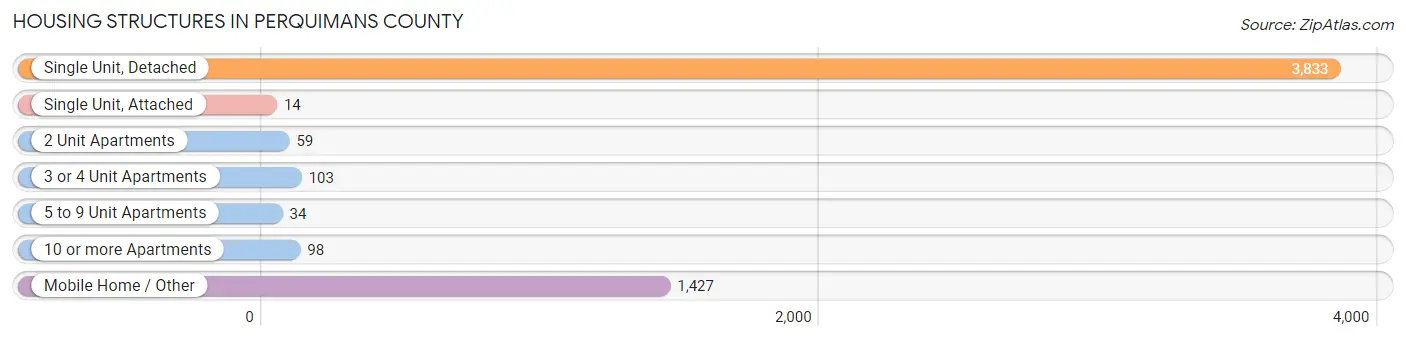
| Structure Type | # Housing Units | % Housing Units |
| Single Unit, Detached | 3,833 | 68.8% |
| Single Unit, Attached | 14 | 0.3% |
| 2 Unit Apartments | 59 | 1.1% |
| 3 or 4 Unit Apartments | 103 | 1.8% |
| 5 to 9 Unit Apartments | 34 | 0.6% |
| 10 or more Apartments | 98 | 1.8% |
| Mobile Home / Other | 1,427 | 25.6% |
| Total | 5,568 | 100.0% |
Housing Structures by Occupancy in Perquimans County
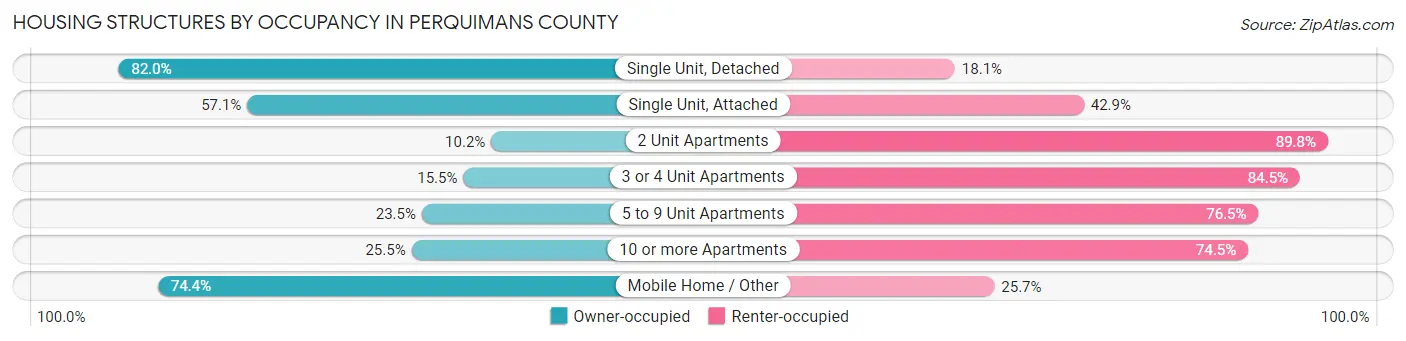
| Structure Type | Owner-occupied | Renter-occupied |
| Single Unit, Detached | 3,141 (82.0%) | 692 (18.0%) |
| Single Unit, Attached | 8 (57.1%) | 6 (42.9%) |
| 2 Unit Apartments | 6 (10.2%) | 53 (89.8%) |
| 3 or 4 Unit Apartments | 16 (15.5%) | 87 (84.5%) |
| 5 to 9 Unit Apartments | 8 (23.5%) | 26 (76.5%) |
| 10 or more Apartments | 25 (25.5%) | 73 (74.5%) |
| Mobile Home / Other | 1,061 (74.4%) | 366 (25.7%) |
| Total | 4,265 (76.6%) | 1,303 (23.4%) |
Housing Structures by Number of Rooms in Perquimans County
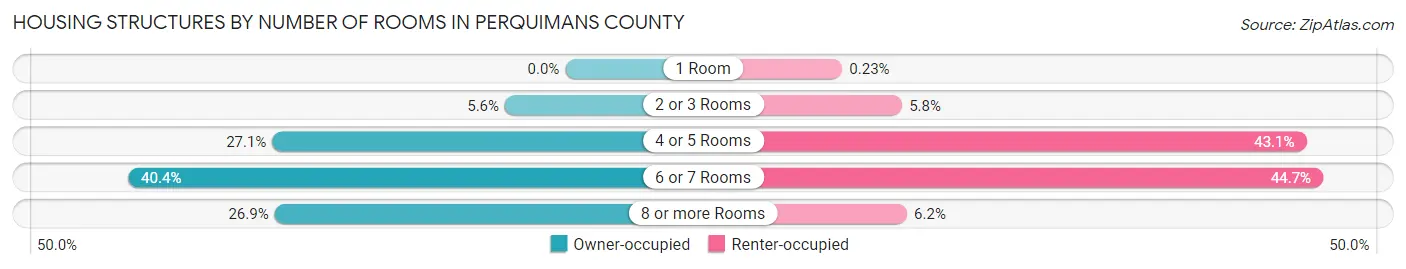
| Number of Rooms | Owner-occupied | Renter-occupied |
| 1 Room | 0 (0.0%) | 3 (0.2%) |
| 2 or 3 Rooms | 238 (5.6%) | 75 (5.8%) |
| 4 or 5 Rooms | 1,156 (27.1%) | 562 (43.1%) |
| 6 or 7 Rooms | 1,724 (40.4%) | 582 (44.7%) |
| 8 or more Rooms | 1,147 (26.9%) | 81 (6.2%) |
| Total | 4,265 (100.0%) | 1,303 (100.0%) |
Housing Structure by Heating Type in Perquimans County
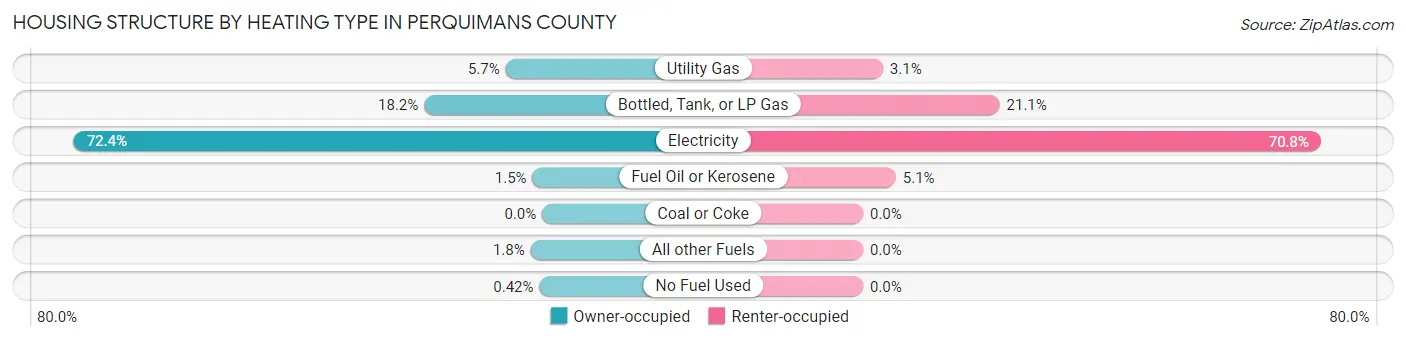
| Heating Type | Owner-occupied | Renter-occupied |
| Utility Gas | 241 (5.7%) | 40 (3.1%) |
| Bottled, Tank, or LP Gas | 778 (18.2%) | 275 (21.1%) |
| Electricity | 3,088 (72.4%) | 922 (70.8%) |
| Fuel Oil or Kerosene | 64 (1.5%) | 66 (5.1%) |
| Coal or Coke | 0 (0.0%) | 0 (0.0%) |
| All other Fuels | 76 (1.8%) | 0 (0.0%) |
| No Fuel Used | 18 (0.4%) | 0 (0.0%) |
| Total | 4,265 (100.0%) | 1,303 (100.0%) |
Household Vehicle Usage in Perquimans County
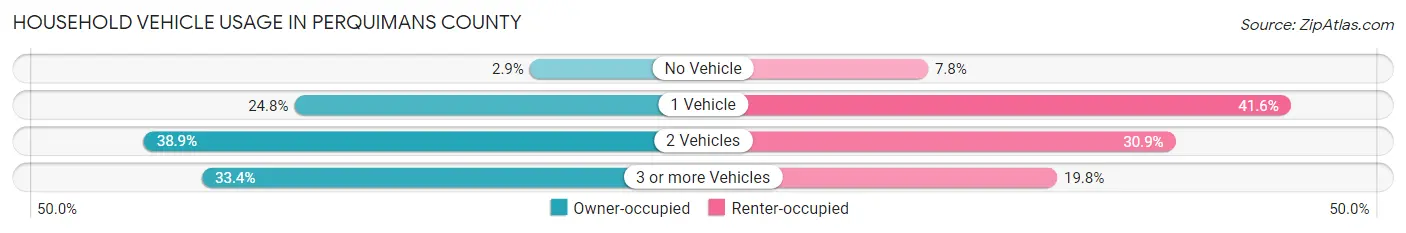
| Vehicles per Household | Owner-occupied | Renter-occupied |
| No Vehicle | 122 (2.9%) | 101 (7.7%) |
| 1 Vehicle | 1,059 (24.8%) | 542 (41.6%) |
| 2 Vehicles | 1,658 (38.9%) | 402 (30.8%) |
| 3 or more Vehicles | 1,426 (33.4%) | 258 (19.8%) |
| Total | 4,265 (100.0%) | 1,303 (100.0%) |
Real Estate & Mortgages in Perquimans County
Real Estate and Mortgage Overview in Perquimans County
| Characteristic | Without Mortgage | With Mortgage |
| Housing Units | 1,862 | 2,403 |
| Median Property Value | $181,000 | $222,400 |
| Median Household Income | $52,569 | $283 |
| Monthly Housing Costs | $489 | $79 |
| Real Estate Taxes | $977 | $37 |
Property Value by Mortgage Status in Perquimans County

| Property Value | Without Mortgage | With Mortgage |
| Less than $50,000 | 351 (18.9%) | 57 (2.4%) |
| $50,000 to $99,999 | 221 (11.9%) | 300 (12.5%) |
| $100,000 to $299,999 | 710 (38.1%) | 1,495 (62.2%) |
| $300,000 to $499,999 | 399 (21.4%) | 363 (15.1%) |
| $500,000 to $749,999 | 141 (7.6%) | 78 (3.3%) |
| $750,000 to $999,999 | 40 (2.1%) | 70 (2.9%) |
| $1,000,000 or more | 0 (0.0%) | 40 (1.7%) |
| Total | 1,862 (100.0%) | 2,403 (100.0%) |
Household Income by Mortgage Status in Perquimans County
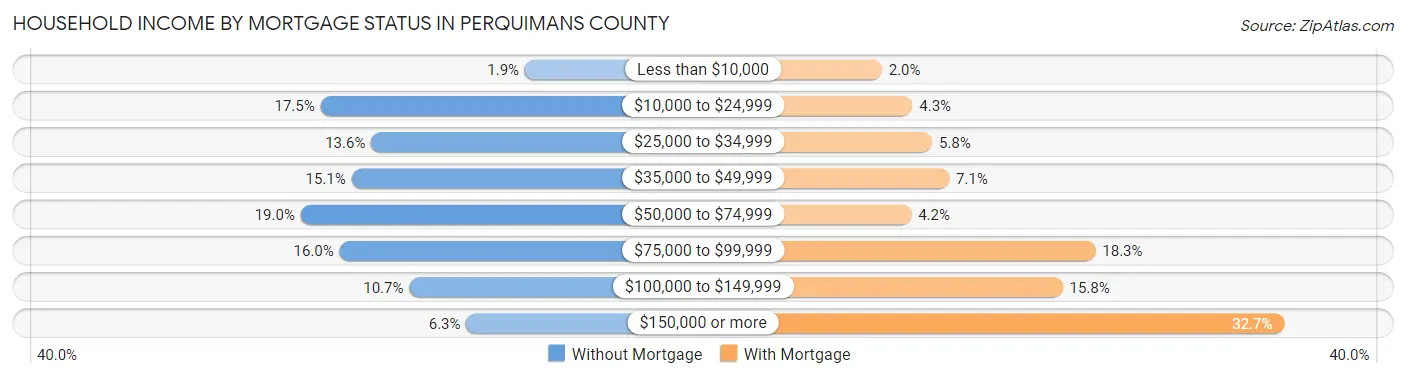
| Household Income | Without Mortgage | With Mortgage |
| Less than $10,000 | 35 (1.9%) | 48 (2.0%) |
| $10,000 to $24,999 | 325 (17.4%) | 104 (4.3%) |
| $25,000 to $34,999 | 253 (13.6%) | 140 (5.8%) |
| $35,000 to $49,999 | 281 (15.1%) | 171 (7.1%) |
| $50,000 to $74,999 | 353 (19.0%) | 102 (4.2%) |
| $75,000 to $99,999 | 298 (16.0%) | 439 (18.3%) |
| $100,000 to $149,999 | 199 (10.7%) | 379 (15.8%) |
| $150,000 or more | 118 (6.3%) | 785 (32.7%) |
| Total | 1,862 (100.0%) | 2,403 (100.0%) |
Property Value to Household Income Ratio in Perquimans County
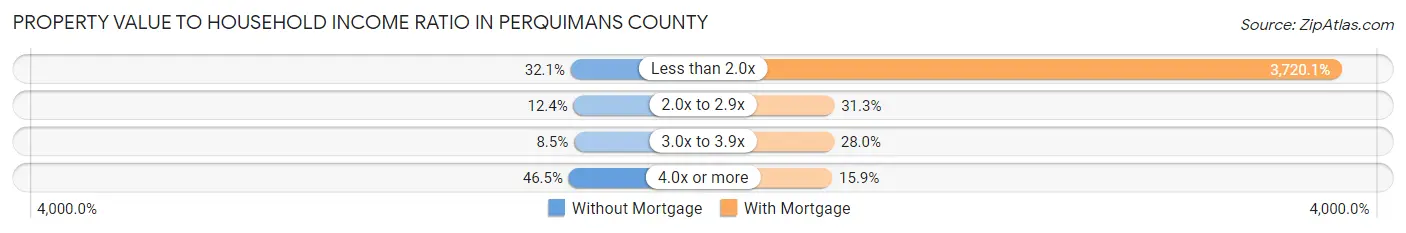
| Value-to-Income Ratio | Without Mortgage | With Mortgage |
| Less than 2.0x | 598 (32.1%) | 89,395 (3,720.1%) |
| 2.0x to 2.9x | 230 (12.3%) | 752 (31.3%) |
| 3.0x to 3.9x | 158 (8.5%) | 673 (28.0%) |
| 4.0x or more | 865 (46.5%) | 381 (15.9%) |
| Total | 1,862 (100.0%) | 2,403 (100.0%) |
Real Estate Taxes by Mortgage Status in Perquimans County
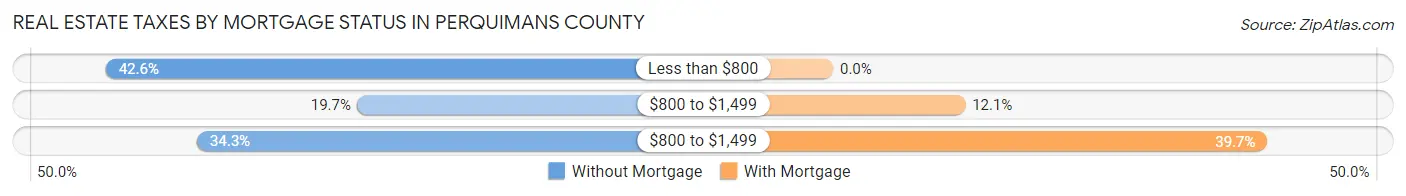
| Property Taxes | Without Mortgage | With Mortgage |
| Less than $800 | 793 (42.6%) | 0 (0.0%) |
| $800 to $1,499 | 366 (19.7%) | 290 (12.1%) |
| $800 to $1,499 | 638 (34.3%) | 953 (39.7%) |
| Total | 1,862 (100.0%) | 2,403 (100.0%) |
Health & Disability in Perquimans County
Health Insurance Coverage by Age in Perquimans County
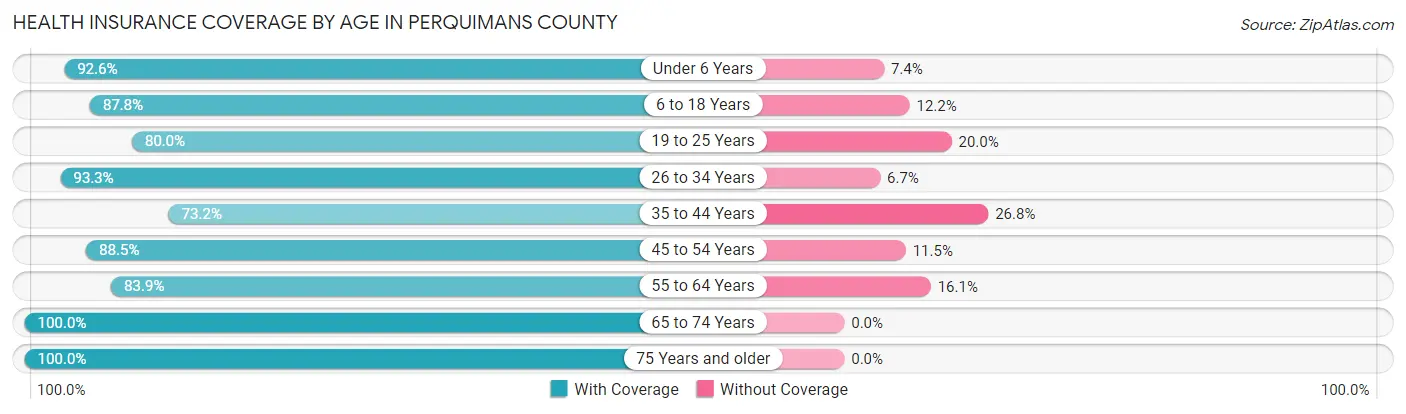
| Age Bracket | With Coverage | Without Coverage |
| Under 6 Years | 613 (92.6%) | 49 (7.4%) |
| 6 to 18 Years | 1,725 (87.8%) | 239 (12.2%) |
| 19 to 25 Years | 544 (80.0%) | 136 (20.0%) |
| 26 to 34 Years | 895 (93.3%) | 64 (6.7%) |
| 35 to 44 Years | 1,036 (73.2%) | 380 (26.8%) |
| 45 to 54 Years | 1,399 (88.5%) | 181 (11.5%) |
| 55 to 64 Years | 1,764 (83.9%) | 339 (16.1%) |
| 65 to 74 Years | 2,107 (100.0%) | 0 (0.0%) |
| 75 Years and older | 1,537 (100.0%) | 0 (0.0%) |
| Total | 11,620 (89.3%) | 1,388 (10.7%) |
Health Insurance Coverage by Citizenship Status in Perquimans County
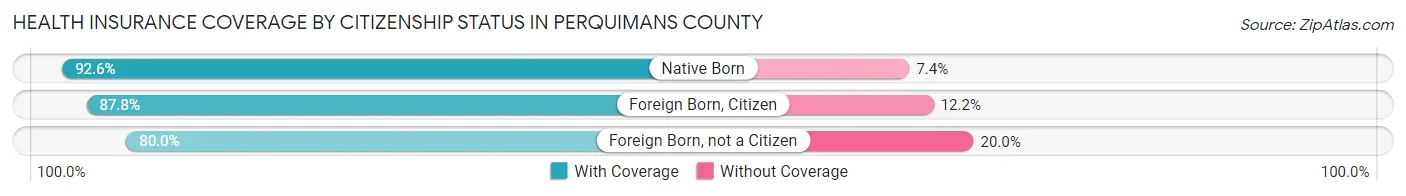
| Citizenship Status | With Coverage | Without Coverage |
| Native Born | 613 (92.6%) | 49 (7.4%) |
| Foreign Born, Citizen | 1,725 (87.8%) | 239 (12.2%) |
| Foreign Born, not a Citizen | 544 (80.0%) | 136 (20.0%) |
Health Insurance Coverage by Household Income in Perquimans County
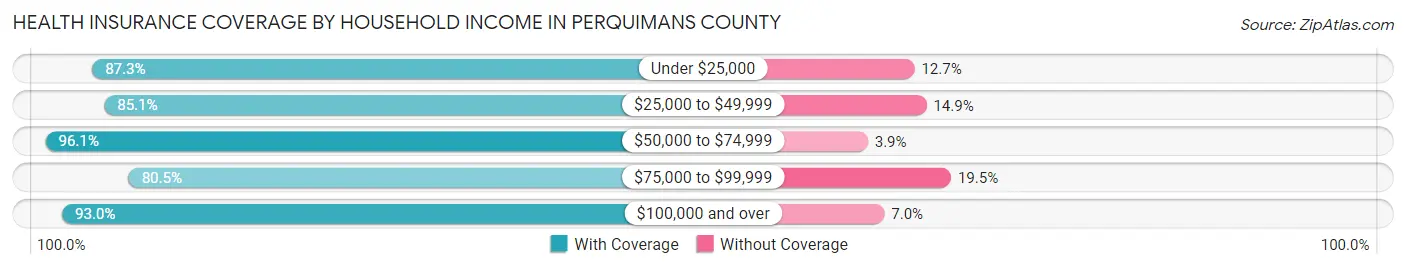
| Household Income | With Coverage | Without Coverage |
| Under $25,000 | 1,749 (87.3%) | 254 (12.7%) |
| $25,000 to $49,999 | 1,824 (85.1%) | 320 (14.9%) |
| $50,000 to $74,999 | 2,250 (96.1%) | 92 (3.9%) |
| $75,000 to $99,999 | 1,703 (80.5%) | 413 (19.5%) |
| $100,000 and over | 4,042 (93.0%) | 306 (7.0%) |
Public vs Private Health Insurance Coverage by Age in Perquimans County
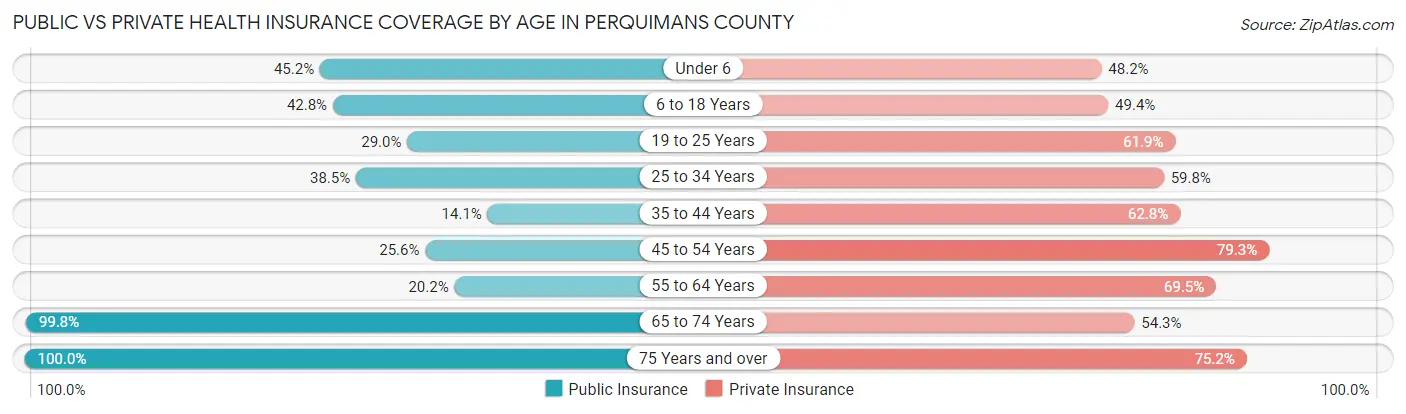
| Age Bracket | Public Insurance | Private Insurance |
| Under 6 | 299 (45.2%) | 319 (48.2%) |
| 6 to 18 Years | 840 (42.8%) | 971 (49.4%) |
| 19 to 25 Years | 197 (29.0%) | 421 (61.9%) |
| 25 to 34 Years | 369 (38.5%) | 573 (59.8%) |
| 35 to 44 Years | 199 (14.1%) | 889 (62.8%) |
| 45 to 54 Years | 405 (25.6%) | 1,253 (79.3%) |
| 55 to 64 Years | 425 (20.2%) | 1,461 (69.5%) |
| 65 to 74 Years | 2,102 (99.8%) | 1,144 (54.3%) |
| 75 Years and over | 1,537 (100.0%) | 1,155 (75.1%) |
| Total | 6,373 (49.0%) | 8,186 (62.9%) |
Disability Status by Sex by Age in Perquimans County
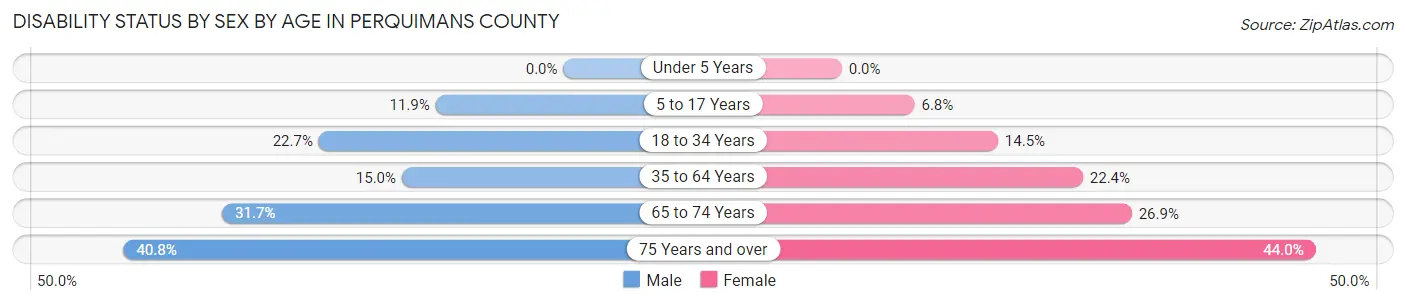
| Age Bracket | Male | Female |
| Under 5 Years | 0 (0.0%) | 0 (0.0%) |
| 5 to 17 Years | 104 (11.9%) | 67 (6.8%) |
| 18 to 34 Years | 185 (22.7%) | 149 (14.5%) |
| 35 to 64 Years | 391 (15.0%) | 557 (22.4%) |
| 65 to 74 Years | 327 (31.7%) | 289 (26.9%) |
| 75 Years and over | 269 (40.8%) | 386 (44.0%) |
Disability Class by Sex by Age in Perquimans County
Disability Class: Hearing Difficulty
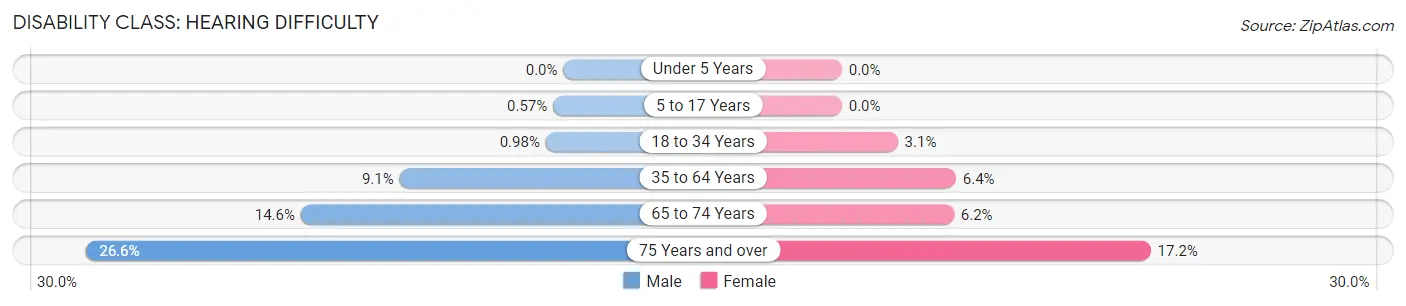
| Age Bracket | Male | Female |
| Under 5 Years | 0 (0.0%) | 0 (0.0%) |
| 5 to 17 Years | 5 (0.6%) | 0 (0.0%) |
| 18 to 34 Years | 8 (1.0%) | 32 (3.1%) |
| 35 to 64 Years | 238 (9.1%) | 158 (6.4%) |
| 65 to 74 Years | 151 (14.6%) | 67 (6.2%) |
| 75 Years and over | 175 (26.6%) | 151 (17.2%) |
Disability Class: Vision Difficulty
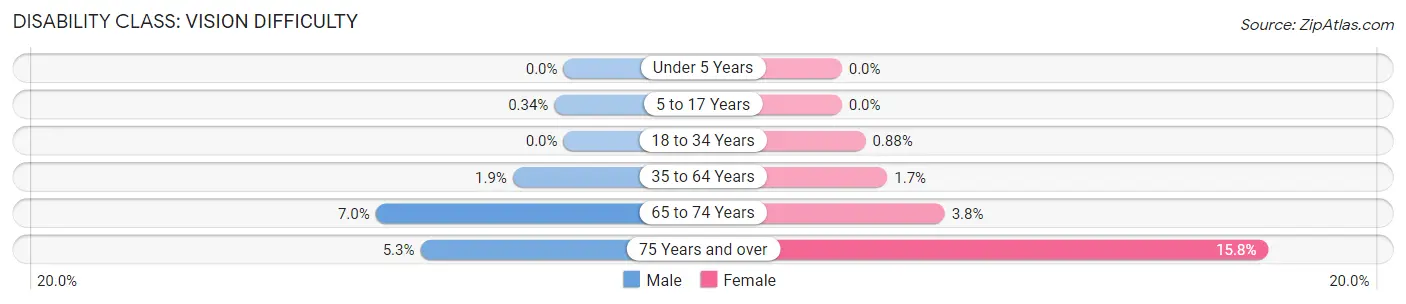
| Age Bracket | Male | Female |
| Under 5 Years | 0 (0.0%) | 0 (0.0%) |
| 5 to 17 Years | 3 (0.3%) | 0 (0.0%) |
| 18 to 34 Years | 0 (0.0%) | 9 (0.9%) |
| 35 to 64 Years | 49 (1.9%) | 42 (1.7%) |
| 65 to 74 Years | 72 (7.0%) | 41 (3.8%) |
| 75 Years and over | 35 (5.3%) | 139 (15.8%) |
Disability Class: Cognitive Difficulty
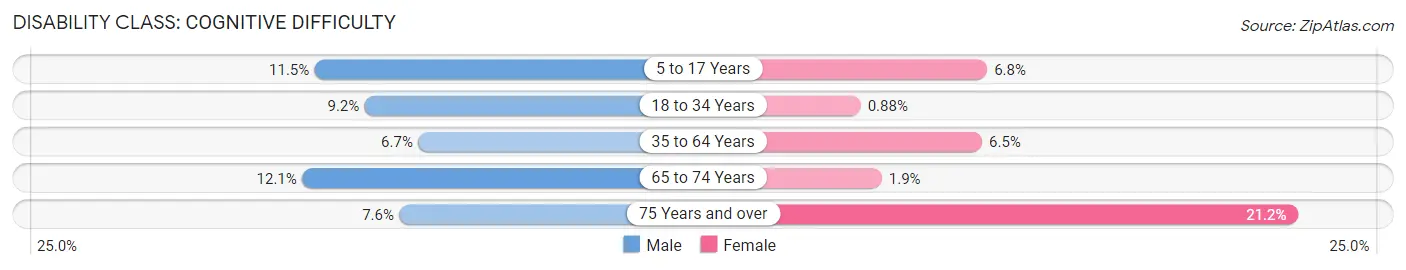
| Age Bracket | Male | Female |
| 5 to 17 Years | 101 (11.5%) | 67 (6.8%) |
| 18 to 34 Years | 75 (9.2%) | 9 (0.9%) |
| 35 to 64 Years | 175 (6.7%) | 162 (6.5%) |
| 65 to 74 Years | 125 (12.1%) | 20 (1.9%) |
| 75 Years and over | 50 (7.6%) | 186 (21.2%) |
Disability Class: Ambulatory Difficulty
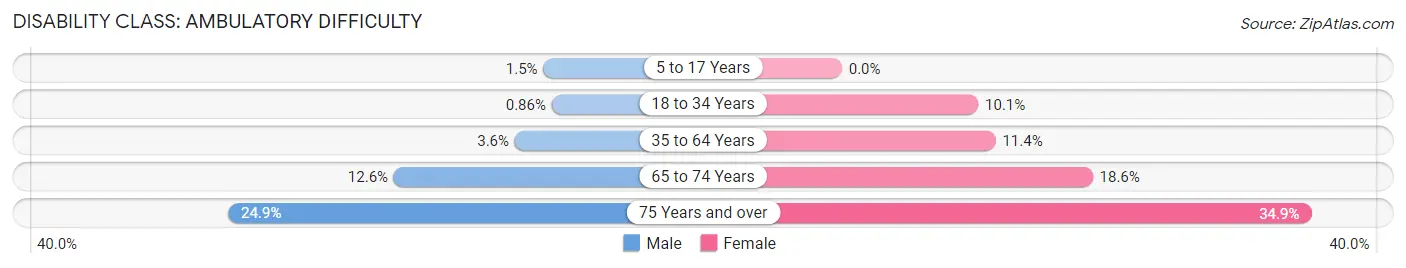
| Age Bracket | Male | Female |
| 5 to 17 Years | 13 (1.5%) | 0 (0.0%) |
| 18 to 34 Years | 7 (0.9%) | 104 (10.1%) |
| 35 to 64 Years | 94 (3.6%) | 284 (11.4%) |
| 65 to 74 Years | 130 (12.6%) | 200 (18.6%) |
| 75 Years and over | 164 (24.9%) | 306 (34.8%) |
Disability Class: Self-Care Difficulty
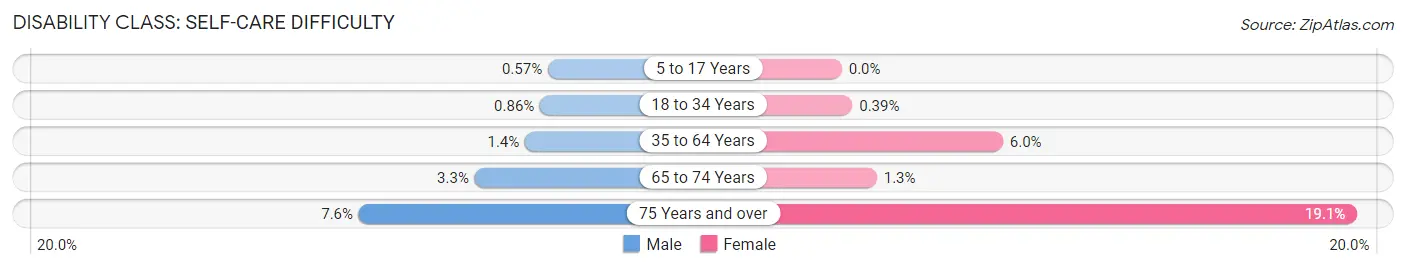
| Age Bracket | Male | Female |
| 5 to 17 Years | 5 (0.6%) | 0 (0.0%) |
| 18 to 34 Years | 7 (0.9%) | 4 (0.4%) |
| 35 to 64 Years | 37 (1.4%) | 149 (6.0%) |
| 65 to 74 Years | 34 (3.3%) | 14 (1.3%) |
| 75 Years and over | 50 (7.6%) | 168 (19.1%) |
Technology Access in Perquimans County
Computing Device Access in Perquimans County
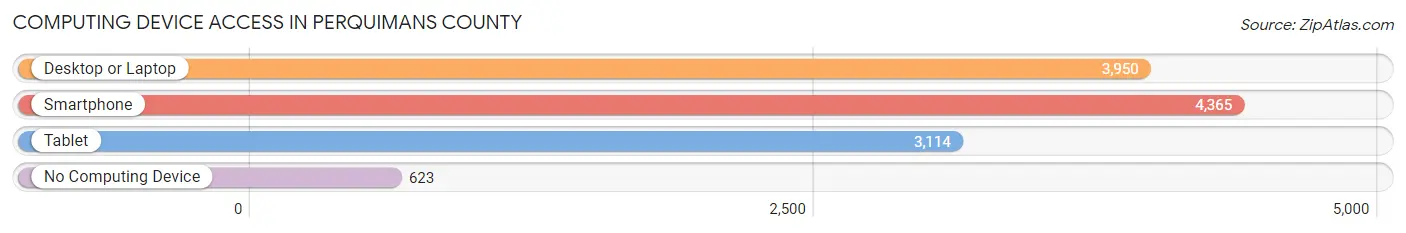
| Device Type | # Households | % Households |
| Desktop or Laptop | 3,950 | 70.9% |
| Smartphone | 4,365 | 78.4% |
| Tablet | 3,114 | 55.9% |
| No Computing Device | 623 | 11.2% |
| Total | 5,568 | 100.0% |
Internet Access in Perquimans County
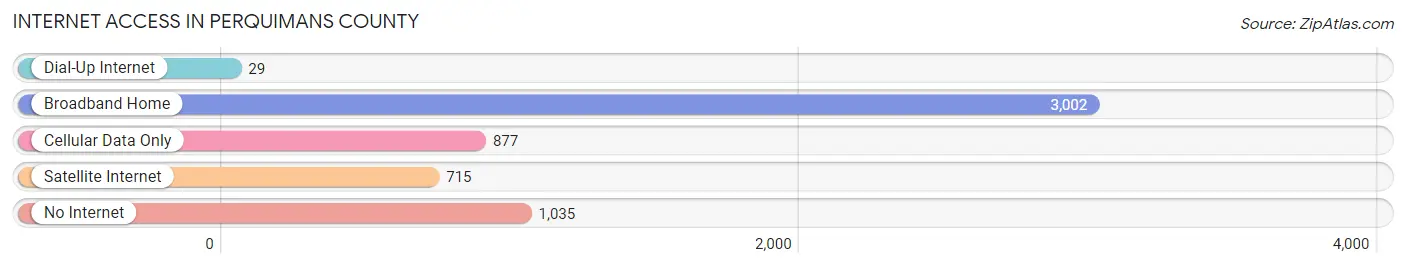
| Internet Type | # Households | % Households |
| Dial-Up Internet | 29 | 0.5% |
| Broadband Home | 3,002 | 53.9% |
| Cellular Data Only | 877 | 15.8% |
| Satellite Internet | 715 | 12.8% |
| No Internet | 1,035 | 18.6% |
| Total | 5,568 | 100.0% |
Perquimans County Summary
Perquimans County is located in the northeastern part of North Carolina, and is part of the Albemarle Sound region. It is bordered by Chowan County to the north, Pasquotank County to the east, and Gates County to the south. The county seat is Hertford, and the county is named after the Perquimans Indians, who were the original inhabitants of the area.
Geography
Perquimans County covers an area of approximately 250 square miles, and is mostly flat, with some rolling hills. The terrain is mostly sandy, with some areas of clay and loam. The county is drained by the Perquimans River, which flows through the center of the county. The county is also home to several small lakes, including Lake Phelps, Lake Mattamuskeet, and Lake Mattamuskeet National Wildlife Refuge.
The climate of Perquimans County is humid subtropical, with hot, humid summers and mild winters. The average annual temperature is around 70 degrees Fahrenheit, and the average annual precipitation is around 45 inches.
Demographics
As of the 2010 census, Perquimans County had a population of 13,453. The population is predominantly white (87.3%), with African Americans making up 8.3% of the population, and Hispanics making up 2.7%. The median household income is $41,945, and the median age is 41.
Economy
Perquimans County’s economy is largely based on agriculture, with the main crops being corn, soybeans, wheat, and cotton. The county is also home to several manufacturing companies, including a furniture factory, a boat manufacturing plant, and a paper mill. Tourism is also an important part of the economy, with visitors coming to the area to enjoy the county’s many outdoor activities, such as fishing, hunting, and boating.
History
Perquimans County was first settled by Europeans in the early 1700s, and was officially established in 1739. The county was named after the Perquimans Indians, who were the original inhabitants of the area. The county was an important center of trade and commerce in the colonial era, and was home to several prominent families, including the Harrells, the Byrds, and the Wards.
During the American Revolution, Perquimans County was the site of several battles, including the Battle of Great Bridge and the Battle of Elizabeth City. After the war, the county continued to grow and prosper, and by the mid-1800s, it was one of the most prosperous counties in the state.
In the 20th century, Perquimans County continued to grow and develop, and today it is a thriving rural community. The county is home to several historic sites, including the Perquimans County Courthouse, the Perquimans County Jail, and the Perquimans County Museum. The county is also home to several parks and recreational areas, including the Perquimans River Wildlife Refuge and the Perquimans County Park.
Common Questions
What is Per Capita Income in Perquimans County?
Per Capita income in Perquimans County is $31,919.
What is the Median Family Income in Perquimans County?
Median Family Income in Perquimans County is $76,291.
What is the Median Household income in Perquimans County?
Median Household Income in Perquimans County is $59,401.
What is Income or Wage Gap in Perquimans County?
Income or Wage Gap in Perquimans County is 31.0%.
Women in Perquimans County earn 69.0 cents for every dollar earned by a man.
What is Inequality or Gini Index in Perquimans County?
Inequality or Gini Index in Perquimans County is 0.40.
What is the Total Population of Perquimans County?
Total Population of Perquimans County is 13,053.
What is the Total Male Population of Perquimans County?
Total Male Population of Perquimans County is 6,233.
What is the Total Female Population of Perquimans County?
Total Female Population of Perquimans County is 6,820.
What is the Ratio of Males per 100 Females in Perquimans County?
There are 91.39 Males per 100 Females in Perquimans County.
What is the Ratio of Females per 100 Males in Perquimans County?
There are 109.42 Females per 100 Males in Perquimans County.
What is the Median Population Age in Perquimans County?
Median Population Age in Perquimans County is 49.8 Years.
What is the Average Family Size in Perquimans County
Average Family Size in Perquimans County is 2.8 People.
What is the Average Household Size in Perquimans County
Average Household Size in Perquimans County is 2.3 People.
How Large is the Labor Force in Perquimans County?
There are 5,395 People in the Labor Forcein in Perquimans County.
What is the Percentage of People in the Labor Force in Perquimans County?
49.3% of People are in the Labor Force in Perquimans County.
What is the Unemployment Rate in Perquimans County?
Unemployment Rate in Perquimans County is 5.0%.