Pasquotank County, NC Map & Demographics
Pasquotank County Map
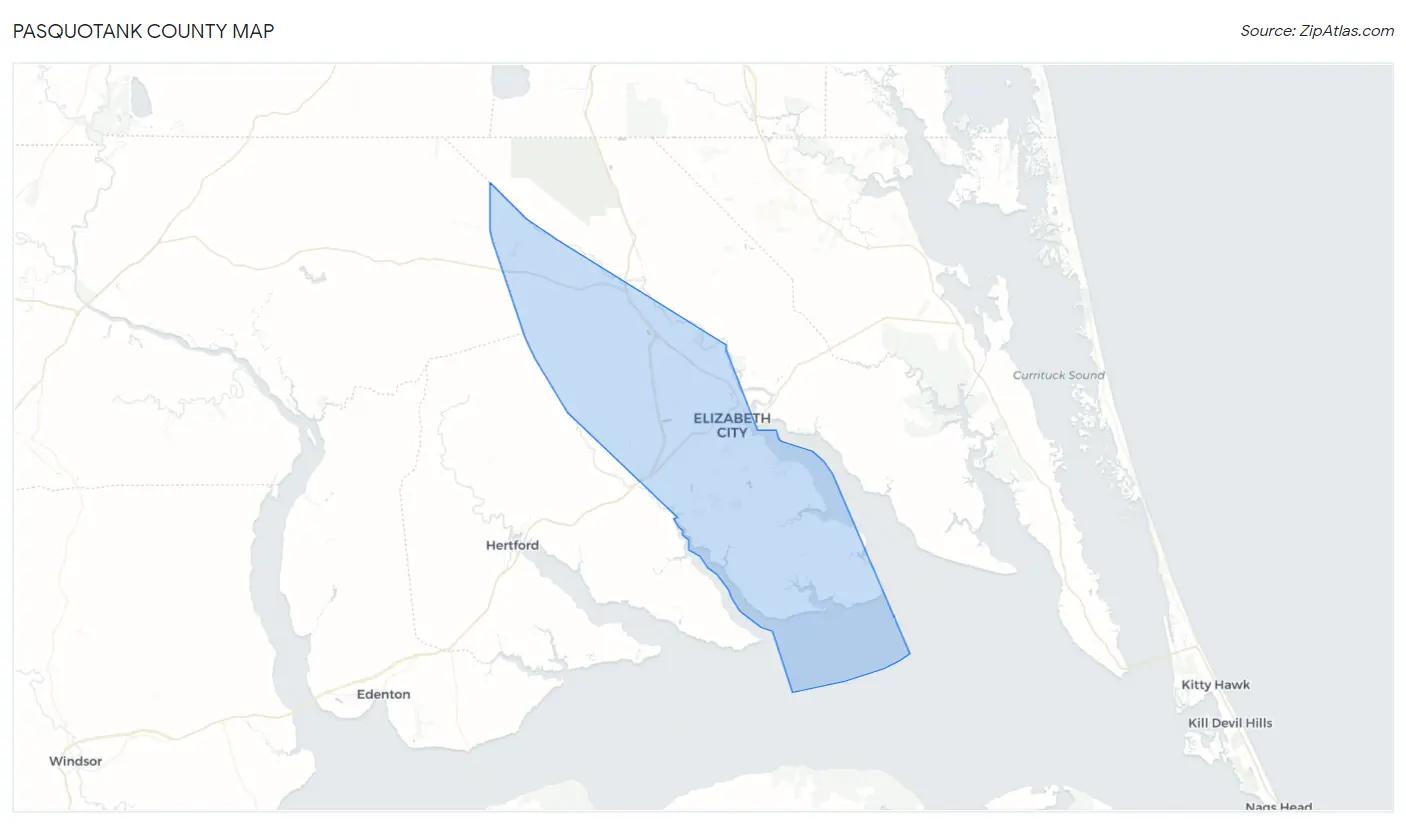
Pasquotank County Overview
$31,762
PER CAPITA INCOME
$77,228
AVG FAMILY INCOME
$61,411
AVG HOUSEHOLD INCOME
28.8%
WAGE / INCOME GAP [ % ]
71.2¢/ $1
WAGE / INCOME GAP [ $ ]
$8,476
FAMILY INCOME DEFICIT
0.44
INEQUALITY / GINI INDEX
40,454
TOTAL POPULATION
20,076
MALE POPULATION
20,378
FEMALE POPULATION
98.52
MALES / 100 FEMALES
101.50
FEMALES / 100 MALES
39.0
MEDIAN AGE
3.0
AVG FAMILY SIZE
2.5
AVG HOUSEHOLD SIZE
19,620
LABOR FORCE [ PEOPLE ]
60.3%
PERCENT IN LABOR FORCE
5.8%
UNEMPLOYMENT RATE
Pasquotank County Area Codes
Income in Pasquotank County
Income Overview in Pasquotank County
Per Capita Income in Pasquotank County is $31,762, while median incomes of families and households are $77,228 and $61,411 respectively.
| Characteristic | Number | Measure |
| Per Capita Income | 40,454 | $31,762 |
| Median Family Income | 10,361 | $77,228 |
| Mean Family Income | 10,361 | $94,885 |
| Median Household Income | 15,422 | $61,411 |
| Mean Household Income | 15,422 | $80,520 |
| Income Deficit | 10,361 | $8,476 |
| Wage / Income Gap (%) | 40,454 | 28.80% |
| Wage / Income Gap ($) | 40,454 | 71.20¢ per $1 |
| Gini / Inequality Index | 40,454 | 0.44 |
Earnings by Sex in Pasquotank County
Average Earnings in Pasquotank County are $38,756, $46,103 for men and $32,825 for women, a difference of 28.8%.
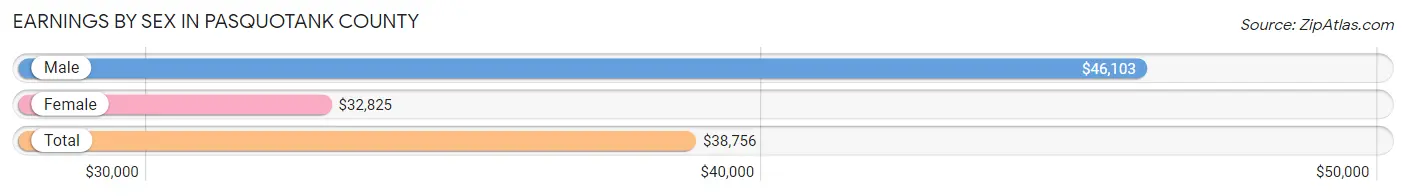
| Sex | Number | Average Earnings |
| Male | 10,491 (52.2%) | $46,103 |
| Female | 9,615 (47.8%) | $32,825 |
| Total | 20,106 (100.0%) | $38,756 |
Earnings by Sex by Income Bracket in Pasquotank County
The most common earnings brackets in Pasquotank County are $100,000+ for men (1,168 | 11.1%) and $25,000 to $29,999 for women (857 | 8.9%).
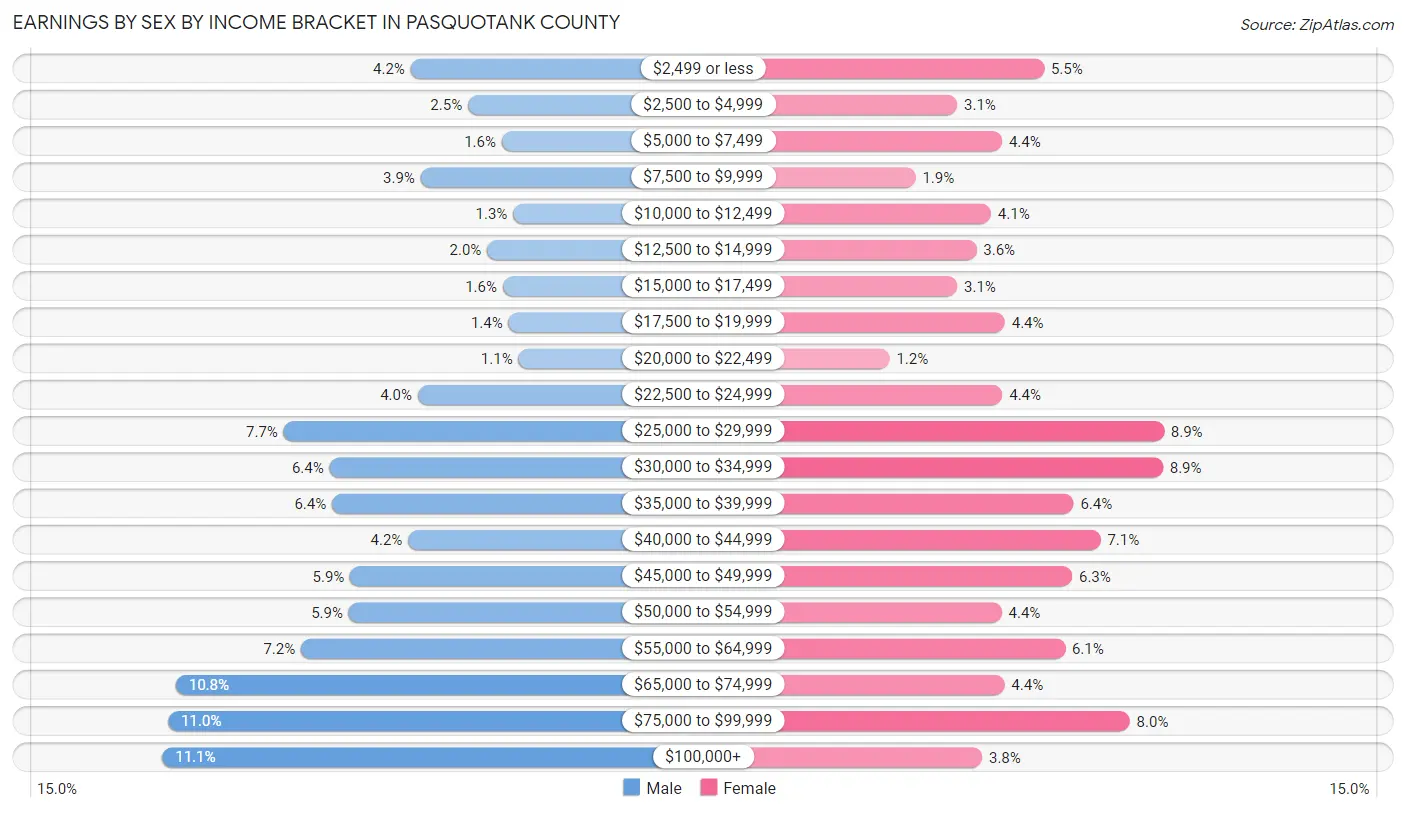
| Income | Male | Female |
| $2,499 or less | 435 (4.2%) | 533 (5.5%) |
| $2,500 to $4,999 | 266 (2.5%) | 298 (3.1%) |
| $5,000 to $7,499 | 167 (1.6%) | 419 (4.4%) |
| $7,500 to $9,999 | 406 (3.9%) | 186 (1.9%) |
| $10,000 to $12,499 | 133 (1.3%) | 389 (4.1%) |
| $12,500 to $14,999 | 210 (2.0%) | 350 (3.6%) |
| $15,000 to $17,499 | 164 (1.6%) | 298 (3.1%) |
| $17,500 to $19,999 | 147 (1.4%) | 427 (4.4%) |
| $20,000 to $22,499 | 117 (1.1%) | 115 (1.2%) |
| $22,500 to $24,999 | 414 (4.0%) | 420 (4.4%) |
| $25,000 to $29,999 | 810 (7.7%) | 857 (8.9%) |
| $30,000 to $34,999 | 675 (6.4%) | 854 (8.9%) |
| $35,000 to $39,999 | 667 (6.4%) | 612 (6.4%) |
| $40,000 to $44,999 | 443 (4.2%) | 686 (7.1%) |
| $45,000 to $49,999 | 614 (5.9%) | 609 (6.3%) |
| $50,000 to $54,999 | 618 (5.9%) | 418 (4.3%) |
| $55,000 to $64,999 | 758 (7.2%) | 589 (6.1%) |
| $65,000 to $74,999 | 1,128 (10.7%) | 426 (4.4%) |
| $75,000 to $99,999 | 1,151 (11.0%) | 764 (8.0%) |
| $100,000+ | 1,168 (11.1%) | 365 (3.8%) |
| Total | 10,491 (100.0%) | 9,615 (100.0%) |
Earnings by Sex by Educational Attainment in Pasquotank County
Average earnings in Pasquotank County are $50,900 for men and $35,824 for women, a difference of 29.6%. Men with an educational attainment of graduate degree enjoy the highest average annual earnings of $62,135, while those with less than high school education earn the least with $36,036. Women with an educational attainment of graduate degree earn the most with the average annual earnings of $52,781, while those with less than high school education have the smallest earnings of $28,082.
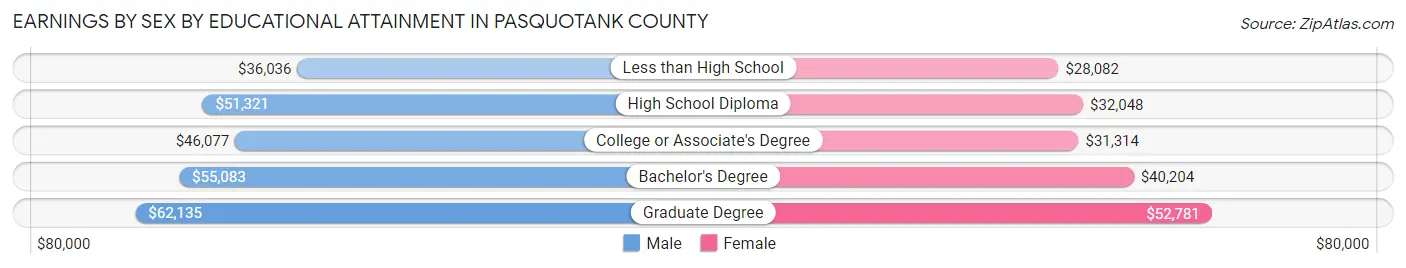
| Educational Attainment | Male Income | Female Income |
| Less than High School | $36,036 | $28,082 |
| High School Diploma | $51,321 | $32,048 |
| College or Associate's Degree | $46,077 | $31,314 |
| Bachelor's Degree | $55,083 | $40,204 |
| Graduate Degree | $62,135 | $52,781 |
| Total | $50,900 | $35,824 |
Family Income in Pasquotank County
Family Income Brackets in Pasquotank County
According to the Pasquotank County family income data, there are 2,010 families falling into the $100,000 to $149,999 income range, which is the most common income bracket and makes up 19.4% of all families. Conversely, the $10,000 to $14,999 income bracket is the least frequent group with only 218 families (2.1%) belonging to this category.
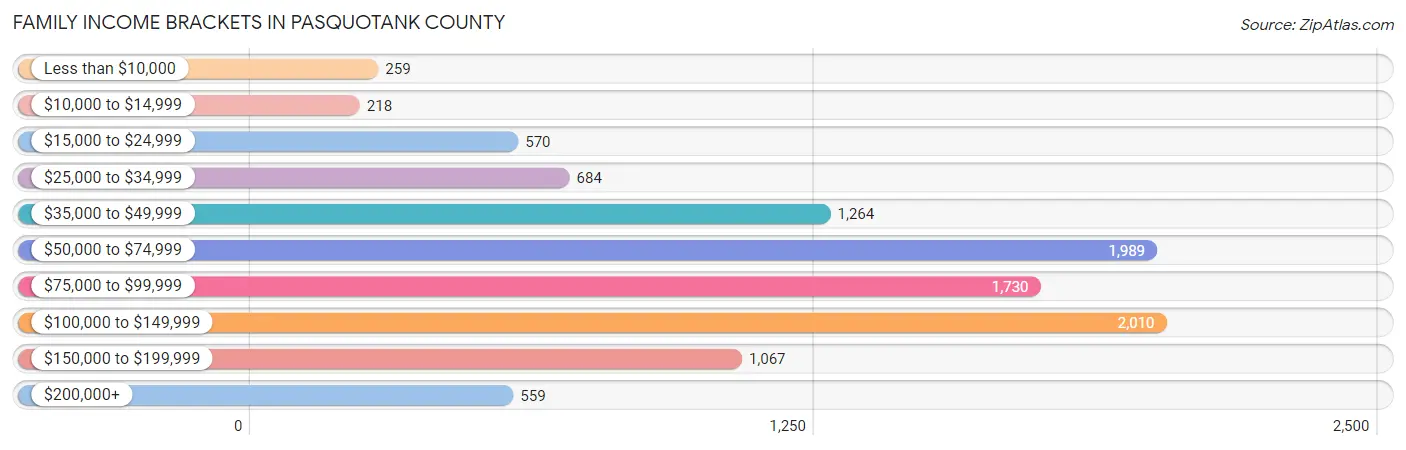
| Income Bracket | # Families | % Families |
| Less than $10,000 | 259 | 2.5% |
| $10,000 to $14,999 | 218 | 2.1% |
| $15,000 to $24,999 | 570 | 5.5% |
| $25,000 to $34,999 | 684 | 6.6% |
| $35,000 to $49,999 | 1,264 | 12.2% |
| $50,000 to $74,999 | 1,989 | 19.2% |
| $75,000 to $99,999 | 1,730 | 16.7% |
| $100,000 to $149,999 | 2,010 | 19.4% |
| $150,000 to $199,999 | 1,067 | 10.3% |
| $200,000+ | 559 | 5.4% |
Family Income by Famaliy Size in Pasquotank County
5-person families (862 | 8.3%) account for the highest median family income in Pasquotank County with $126,771 per family, while 2-person families (5,215 | 50.3%) have the highest median income of $40,799 per family member.
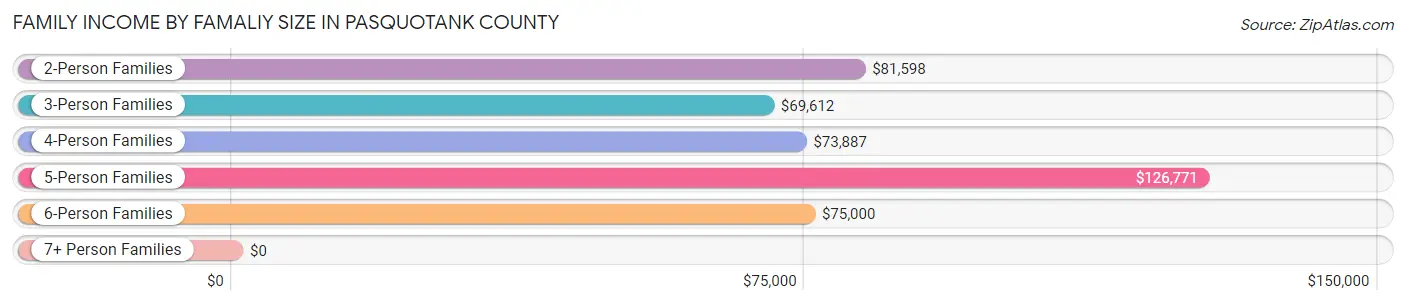
| Income Bracket | # Families | Median Income |
| 2-Person Families | 5,215 (50.3%) | $81,598 |
| 3-Person Families | 2,456 (23.7%) | $69,612 |
| 4-Person Families | 1,650 (15.9%) | $73,887 |
| 5-Person Families | 862 (8.3%) | $126,771 |
| 6-Person Families | 136 (1.3%) | $75,000 |
| 7+ Person Families | 42 (0.4%) | $0 |
| Total | 10,361 (100.0%) | $77,228 |
Family Income by Number of Earners in Pasquotank County
The median family income in Pasquotank County is $77,228, with families comprising 3+ earners (825) having the highest median family income of $146,054, while families with no earners (1,568) have the lowest median family income of $42,024, accounting for 8.0% and 15.1% of families, respectively.
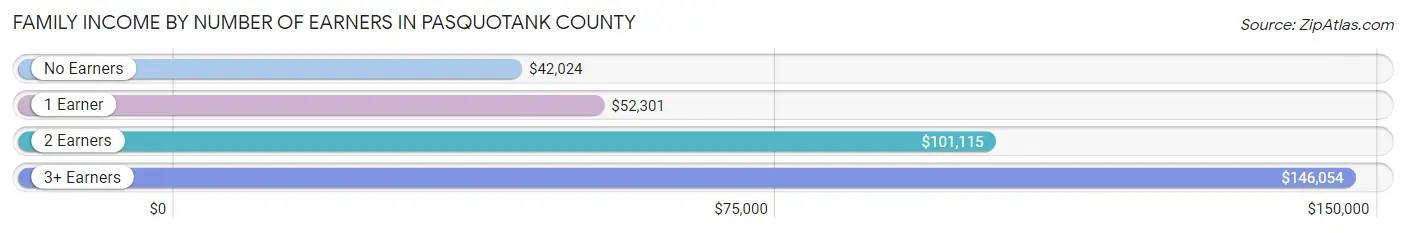
| Number of Earners | # Families | Median Income |
| No Earners | 1,568 (15.1%) | $42,024 |
| 1 Earner | 3,549 (34.3%) | $52,301 |
| 2 Earners | 4,419 (42.6%) | $101,115 |
| 3+ Earners | 825 (8.0%) | $146,054 |
| Total | 10,361 (100.0%) | $77,228 |
Household Income in Pasquotank County
Household Income Brackets in Pasquotank County
With 2,807 households falling in the category, the $50,000 to $74,999 income range is the most frequent in Pasquotank County, accounting for 18.2% of all households. In contrast, only 632 households (4.1%) fall into the less than $10,000 income bracket, making it the least populous group.
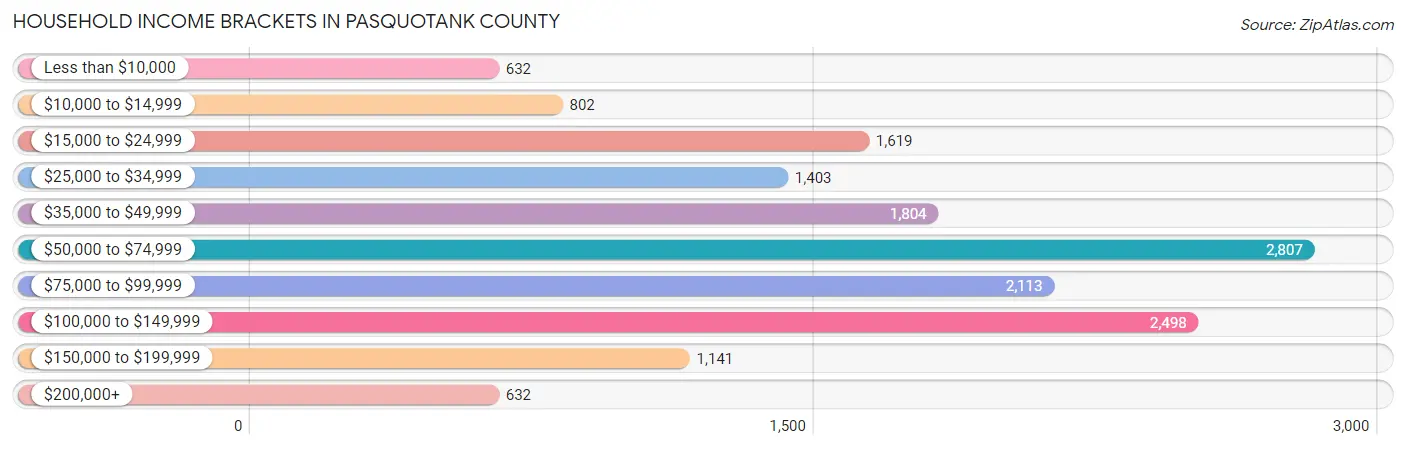
| Income Bracket | # Households | % Households |
| Less than $10,000 | 632 | 4.1% |
| $10,000 to $14,999 | 802 | 5.2% |
| $15,000 to $24,999 | 1,619 | 10.5% |
| $25,000 to $34,999 | 1,403 | 9.1% |
| $35,000 to $49,999 | 1,804 | 11.7% |
| $50,000 to $74,999 | 2,807 | 18.2% |
| $75,000 to $99,999 | 2,113 | 13.7% |
| $100,000 to $149,999 | 2,498 | 16.2% |
| $150,000 to $199,999 | 1,141 | 7.4% |
| $200,000+ | 632 | 4.1% |
Household Income by Householder Age in Pasquotank County
The median household income in Pasquotank County is $61,411, with the highest median household income of $72,197 found in the 45 to 64 years age bracket for the primary householder. A total of 5,346 households (34.7%) fall into this category. Meanwhile, the 15 to 24 years age bracket for the primary householder has the lowest median household income of $42,438, with 566 households (3.7%) in this group.
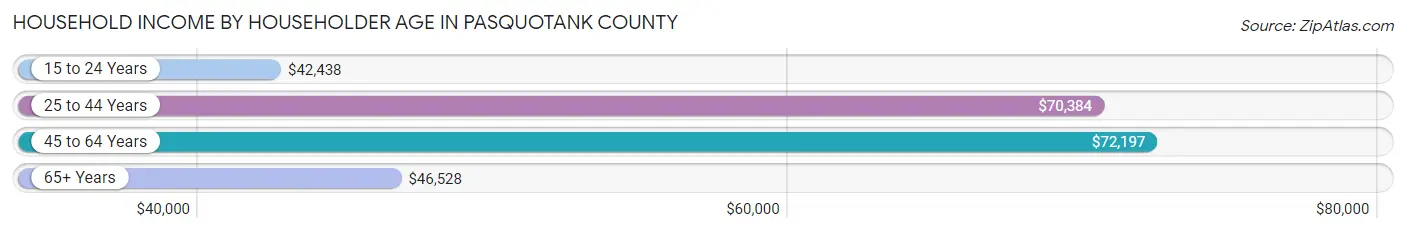
| Income Bracket | # Households | Median Income |
| 15 to 24 Years | 566 (3.7%) | $42,438 |
| 25 to 44 Years | 4,937 (32.0%) | $70,384 |
| 45 to 64 Years | 5,346 (34.7%) | $72,197 |
| 65+ Years | 4,573 (29.6%) | $46,528 |
| Total | 15,422 (100.0%) | $61,411 |
Poverty in Pasquotank County
Income Below Poverty by Sex and Age in Pasquotank County
With 10.8% poverty level for males and 12.4% for females among the residents of Pasquotank County, 16 and 17 year old males and 12 to 14 year old females are the most vulnerable to poverty, with 130 males (29.1%) and 217 females (36.2%) in their respective age groups living below the poverty level.
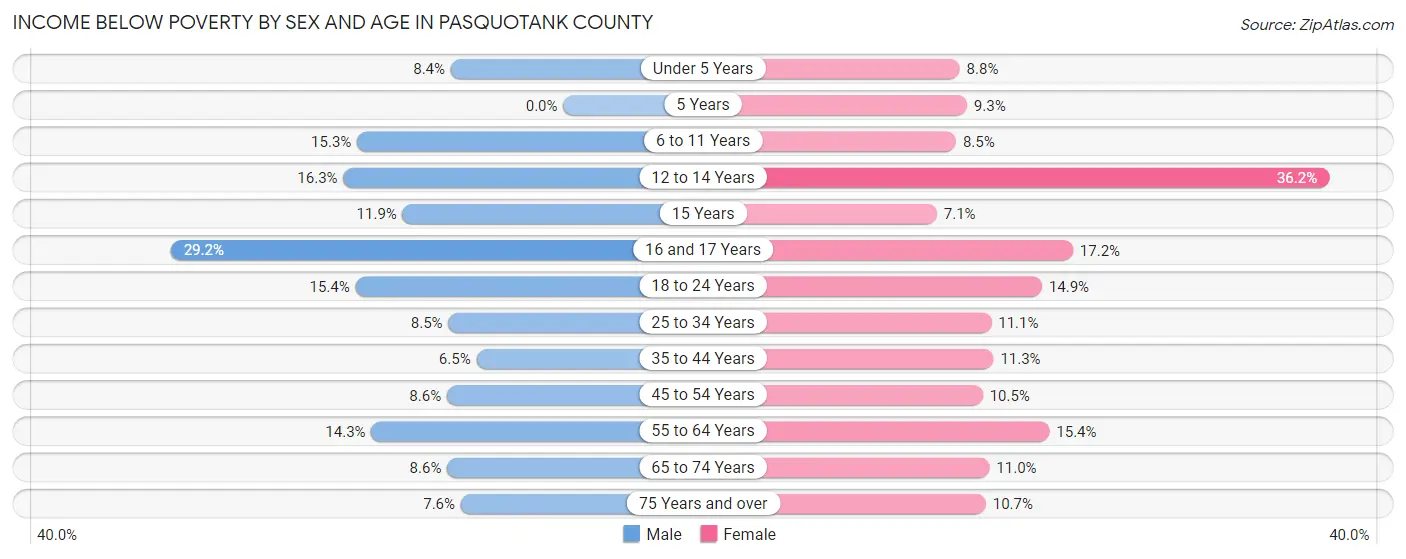
| Age Bracket | Male | Female |
| Under 5 Years | 111 (8.4%) | 89 (8.7%) |
| 5 Years | 0 (0.0%) | 17 (9.3%) |
| 6 to 11 Years | 205 (15.3%) | 117 (8.5%) |
| 12 to 14 Years | 136 (16.3%) | 217 (36.2%) |
| 15 Years | 34 (11.9%) | 19 (7.1%) |
| 16 and 17 Years | 130 (29.1%) | 64 (17.2%) |
| 18 to 24 Years | 190 (15.4%) | 181 (14.9%) |
| 25 to 34 Years | 229 (8.5%) | 315 (11.1%) |
| 35 to 44 Years | 162 (6.5%) | 276 (11.3%) |
| 45 to 54 Years | 191 (8.6%) | 218 (10.5%) |
| 55 to 64 Years | 359 (14.2%) | 440 (15.4%) |
| 65 to 74 Years | 160 (8.6%) | 249 (11.0%) |
| 75 Years and over | 82 (7.6%) | 179 (10.7%) |
| Total | 1,989 (10.8%) | 2,381 (12.4%) |
Income Above Poverty by Sex and Age in Pasquotank County
According to the poverty statistics in Pasquotank County, males aged 5 years and females aged 15 years are the age groups that are most secure financially, with 100.0% of males and 92.9% of females in these age groups living above the poverty line.
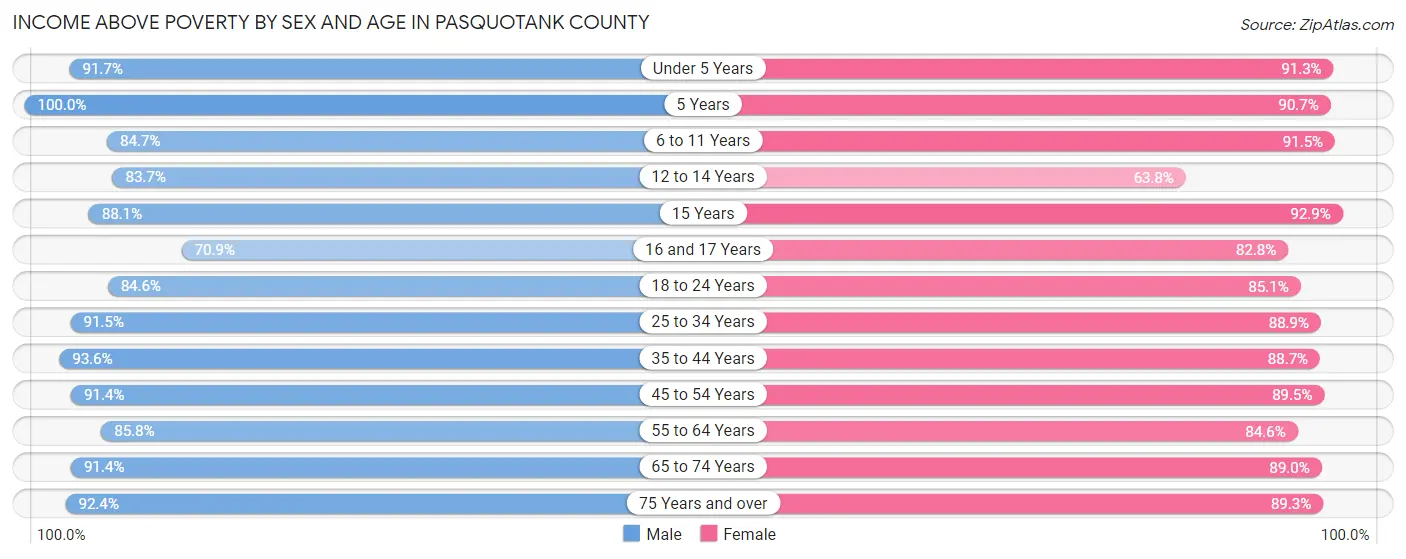
| Age Bracket | Male | Female |
| Under 5 Years | 1,219 (91.6%) | 928 (91.2%) |
| 5 Years | 153 (100.0%) | 166 (90.7%) |
| 6 to 11 Years | 1,134 (84.7%) | 1,262 (91.5%) |
| 12 to 14 Years | 697 (83.7%) | 383 (63.8%) |
| 15 Years | 251 (88.1%) | 250 (92.9%) |
| 16 and 17 Years | 316 (70.9%) | 309 (82.8%) |
| 18 to 24 Years | 1,041 (84.6%) | 1,037 (85.1%) |
| 25 to 34 Years | 2,456 (91.5%) | 2,523 (88.9%) |
| 35 to 44 Years | 2,349 (93.5%) | 2,175 (88.7%) |
| 45 to 54 Years | 2,020 (91.4%) | 1,867 (89.5%) |
| 55 to 64 Years | 2,160 (85.8%) | 2,415 (84.6%) |
| 65 to 74 Years | 1,696 (91.4%) | 2,022 (89.0%) |
| 75 Years and over | 995 (92.4%) | 1,496 (89.3%) |
| Total | 16,487 (89.2%) | 16,833 (87.6%) |
Income Below Poverty Among Married-Couple Families in Pasquotank County
The poverty statistics for married-couple families in Pasquotank County show that 4.4% or 334 of the total 7,565 families live below the poverty line. Families with 3 or 4 children have the highest poverty rate of 5.4%, comprising of 16 families. On the other hand, families with 1 or 2 children have the lowest poverty rate of 3.6%, which includes 92 families.
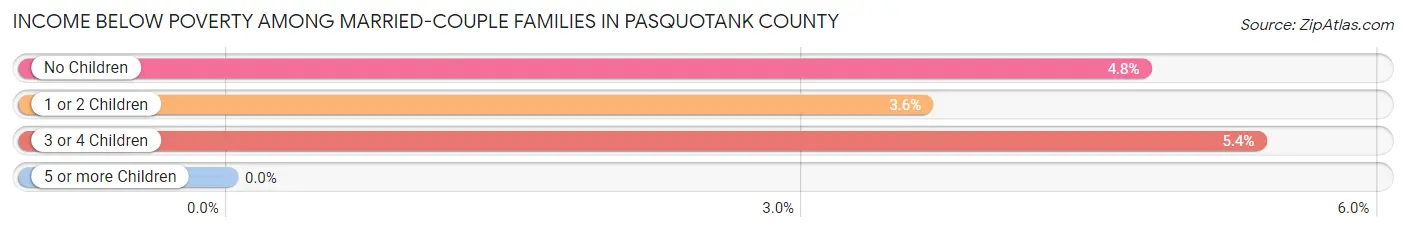
| Children | Above Poverty | Below Poverty |
| No Children | 4,507 (95.2%) | 226 (4.8%) |
| 1 or 2 Children | 2,442 (96.4%) | 92 (3.6%) |
| 3 or 4 Children | 282 (94.6%) | 16 (5.4%) |
| 5 or more Children | 0 (0.0%) | 0 (0.0%) |
| Total | 7,231 (95.6%) | 334 (4.4%) |
Income Below Poverty Among Single-Parent Households in Pasquotank County
According to the poverty data in Pasquotank County, 13.7% or 82 single-father households and 20.6% or 453 single-mother households are living below the poverty line. Among single-father households, those with 1 or 2 children have the highest poverty rate, with 61 households (21.4%) experiencing poverty. Likewise, among single-mother households, those with 3 or 4 children have the highest poverty rate, with 73 households (36.9%) falling below the poverty line.
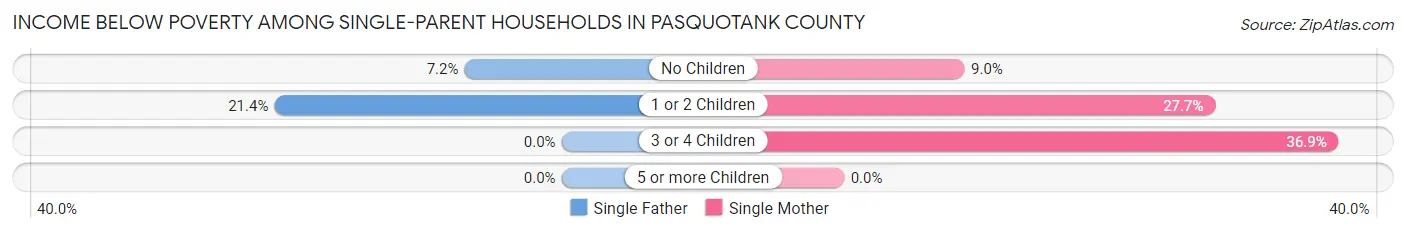
| Children | Single Father | Single Mother |
| No Children | 21 (7.2%) | 83 (9.0%) |
| 1 or 2 Children | 61 (21.4%) | 297 (27.7%) |
| 3 or 4 Children | 0 (0.0%) | 73 (36.9%) |
| 5 or more Children | 0 (0.0%) | 0 (0.0%) |
| Total | 82 (13.7%) | 453 (20.6%) |
Income Below Poverty Among Married-Couple vs Single-Parent Households in Pasquotank County
The poverty data for Pasquotank County shows that 334 of the married-couple family households (4.4%) and 535 of the single-parent households (19.1%) are living below the poverty level. Within the married-couple family households, those with 3 or 4 children have the highest poverty rate, with 16 households (5.4%) falling below the poverty line. Among the single-parent households, those with 3 or 4 children have the highest poverty rate, with 73 household (32.7%) living below poverty.
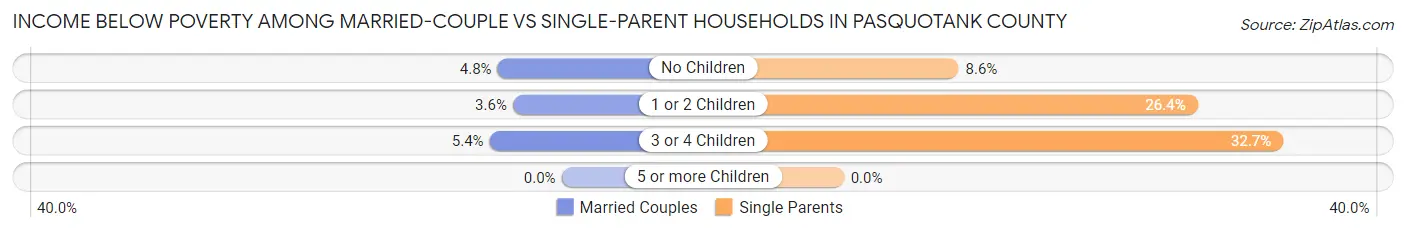
| Children | Married-Couple Families | Single-Parent Households |
| No Children | 226 (4.8%) | 104 (8.6%) |
| 1 or 2 Children | 92 (3.6%) | 358 (26.4%) |
| 3 or 4 Children | 16 (5.4%) | 73 (32.7%) |
| 5 or more Children | 0 (0.0%) | 0 (0.0%) |
| Total | 334 (4.4%) | 535 (19.1%) |
Race in Pasquotank County
The most populous races in Pasquotank County are White / Caucasian (22,871 | 56.5%), Black / African American (14,363 | 35.5%), and Hispanic or Latino (2,501 | 6.2%).
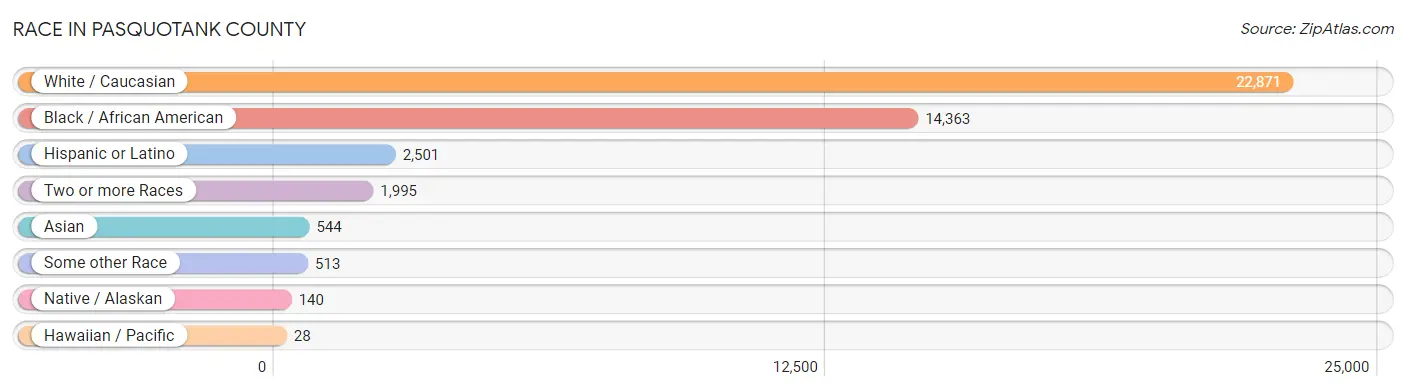
| Race | # Population | % Population |
| Asian | 544 | 1.3% |
| Black / African American | 14,363 | 35.5% |
| Hawaiian / Pacific | 28 | 0.1% |
| Hispanic or Latino | 2,501 | 6.2% |
| Native / Alaskan | 140 | 0.4% |
| White / Caucasian | 22,871 | 56.5% |
| Two or more Races | 1,995 | 4.9% |
| Some other Race | 513 | 1.3% |
| Total | 40,454 | 100.0% |
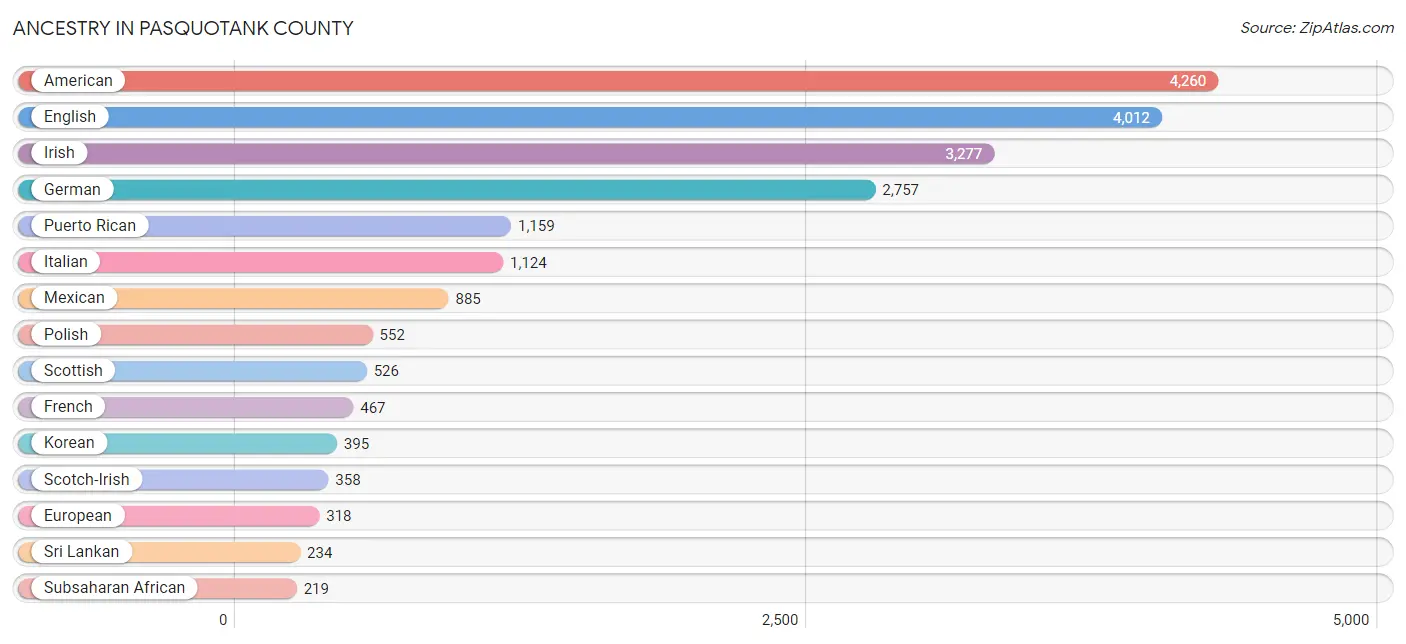
Ancestry in Pasquotank County
The most populous ancestries reported in Pasquotank County are American (4,260 | 10.5%), English (4,012 | 9.9%), Irish (3,277 | 8.1%), German (2,757 | 6.8%), and Puerto Rican (1,159 | 2.9%), together accounting for 38.2% of all Pasquotank County residents.
| Ancestry | # Population | % Population |
| African | 182 | 0.4% |
| American | 4,260 | 10.5% |
| Apache | 25 | 0.1% |
| Armenian | 7 | 0.0% |
| Austrian | 3 | 0.0% |
| Bhutanese | 7 | 0.0% |
| British | 138 | 0.3% |
| Canadian | 17 | 0.0% |
| Central American | 160 | 0.4% |
| Central American Indian | 4 | 0.0% |
| Cherokee | 61 | 0.2% |
| Colombian | 22 | 0.1% |
| Croatian | 11 | 0.0% |
| Cuban | 9 | 0.0% |
| Czech | 64 | 0.2% |
| Czechoslovakian | 18 | 0.0% |
| Danish | 79 | 0.2% |
| Dutch | 158 | 0.4% |
| Eastern European | 7 | 0.0% |
| English | 4,012 | 9.9% |
| European | 318 | 0.8% |
| Finnish | 122 | 0.3% |
| French | 467 | 1.1% |
| French Canadian | 22 | 0.1% |
| German | 2,757 | 6.8% |
| Greek | 69 | 0.2% |
| Haitian | 30 | 0.1% |
| Honduran | 156 | 0.4% |
| Hungarian | 149 | 0.4% |
| Indian (Asian) | 57 | 0.1% |
| Irish | 3,277 | 8.1% |
| Israeli | 7 | 0.0% |
| Italian | 1,124 | 2.8% |
| Jamaican | 43 | 0.1% |
| Korean | 395 | 1.0% |
| Lithuanian | 53 | 0.1% |
| Lumbee | 54 | 0.1% |
| Mexican | 885 | 2.2% |
| Mexican American Indian | 24 | 0.1% |
| Mongolian | 10 | 0.0% |
| Native Hawaiian | 26 | 0.1% |
| Nigerian | 37 | 0.1% |
| Northern European | 12 | 0.0% |
| Norwegian | 72 | 0.2% |
| Pennsylvania German | 11 | 0.0% |
| Peruvian | 10 | 0.0% |
| Polish | 552 | 1.4% |
| Portuguese | 48 | 0.1% |
| Puerto Rican | 1,159 | 2.9% |
| Romanian | 11 | 0.0% |
| Russian | 38 | 0.1% |
| Salvadoran | 4 | 0.0% |
| Samoan | 17 | 0.0% |
| Scandinavian | 118 | 0.3% |
| Scotch-Irish | 358 | 0.9% |
| Scottish | 526 | 1.3% |
| Serbian | 10 | 0.0% |
| South American | 202 | 0.5% |
| Spaniard | 16 | 0.0% |
| Spanish | 17 | 0.0% |
| Sri Lankan | 234 | 0.6% |
| Subsaharan African | 219 | 0.5% |
| Swedish | 202 | 0.5% |
| Swiss | 6 | 0.0% |
| Thai | 33 | 0.1% |
| Tlingit-Haida | 170 | 0.4% |
| Trinidadian and Tobagonian | 13 | 0.0% |
| Turkish | 9 | 0.0% |
| U.S. Virgin Islander | 13 | 0.0% |
| Ukrainian | 13 | 0.0% |
| Venezuelan | 170 | 0.4% |
| Welsh | 201 | 0.5% | View All 72 Rows |
Immigrants in Pasquotank County
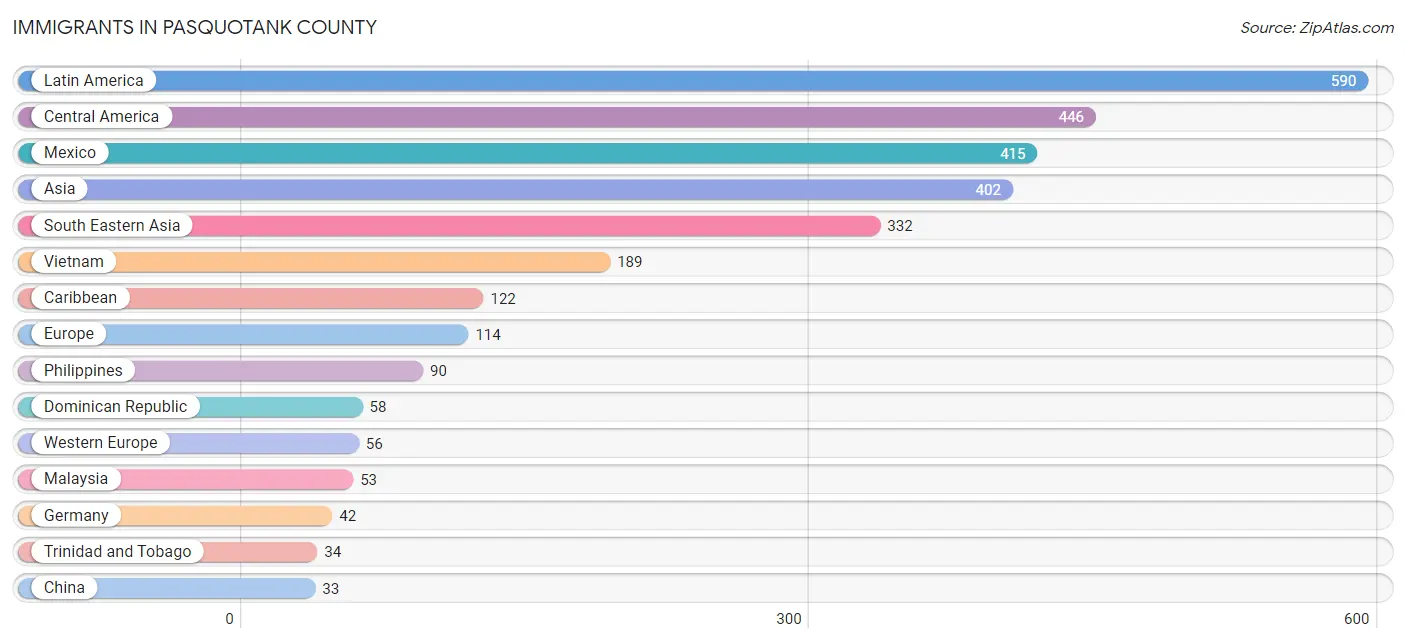
The most numerous immigrant groups reported in Pasquotank County came from Latin America (590 | 1.5%), Central America (446 | 1.1%), Mexico (415 | 1.0%), Asia (402 | 1.0%), and South Eastern Asia (332 | 0.8%), together accounting for 5.4% of all Pasquotank County residents.
| Immigration Origin | # Population | % Population |
| Africa | 29 | 0.1% |
| Asia | 402 | 1.0% |
| Bahamas | 22 | 0.1% |
| Canada | 2 | 0.0% |
| Caribbean | 122 | 0.3% |
| Central America | 446 | 1.1% |
| China | 33 | 0.1% |
| Colombia | 22 | 0.1% |
| Czechoslovakia | 4 | 0.0% |
| Dominican Republic | 58 | 0.1% |
| Eastern Asia | 33 | 0.1% |
| Eastern Europe | 28 | 0.1% |
| El Salvador | 4 | 0.0% |
| England | 8 | 0.0% |
| Europe | 114 | 0.3% |
| Germany | 42 | 0.1% |
| Honduras | 27 | 0.1% |
| India | 20 | 0.1% |
| Iran | 10 | 0.0% |
| Israel | 7 | 0.0% |
| Jamaica | 8 | 0.0% |
| Latin America | 590 | 1.5% |
| Malaysia | 53 | 0.1% |
| Mexico | 415 | 1.0% |
| Netherlands | 14 | 0.0% |
| Nigeria | 29 | 0.1% |
| Northern Europe | 30 | 0.1% |
| Oceania | 17 | 0.0% |
| Philippines | 90 | 0.2% |
| Romania | 11 | 0.0% |
| South America | 22 | 0.1% |
| South Central Asia | 30 | 0.1% |
| South Eastern Asia | 332 | 0.8% |
| Taiwan | 22 | 0.1% |
| Trinidad and Tobago | 34 | 0.1% |
| Ukraine | 13 | 0.0% |
| Vietnam | 189 | 0.5% |
| Western Africa | 29 | 0.1% |
| Western Asia | 7 | 0.0% |
| Western Europe | 56 | 0.1% | View All 40 Rows |
Sex and Age in Pasquotank County
Sex and Age in Pasquotank County
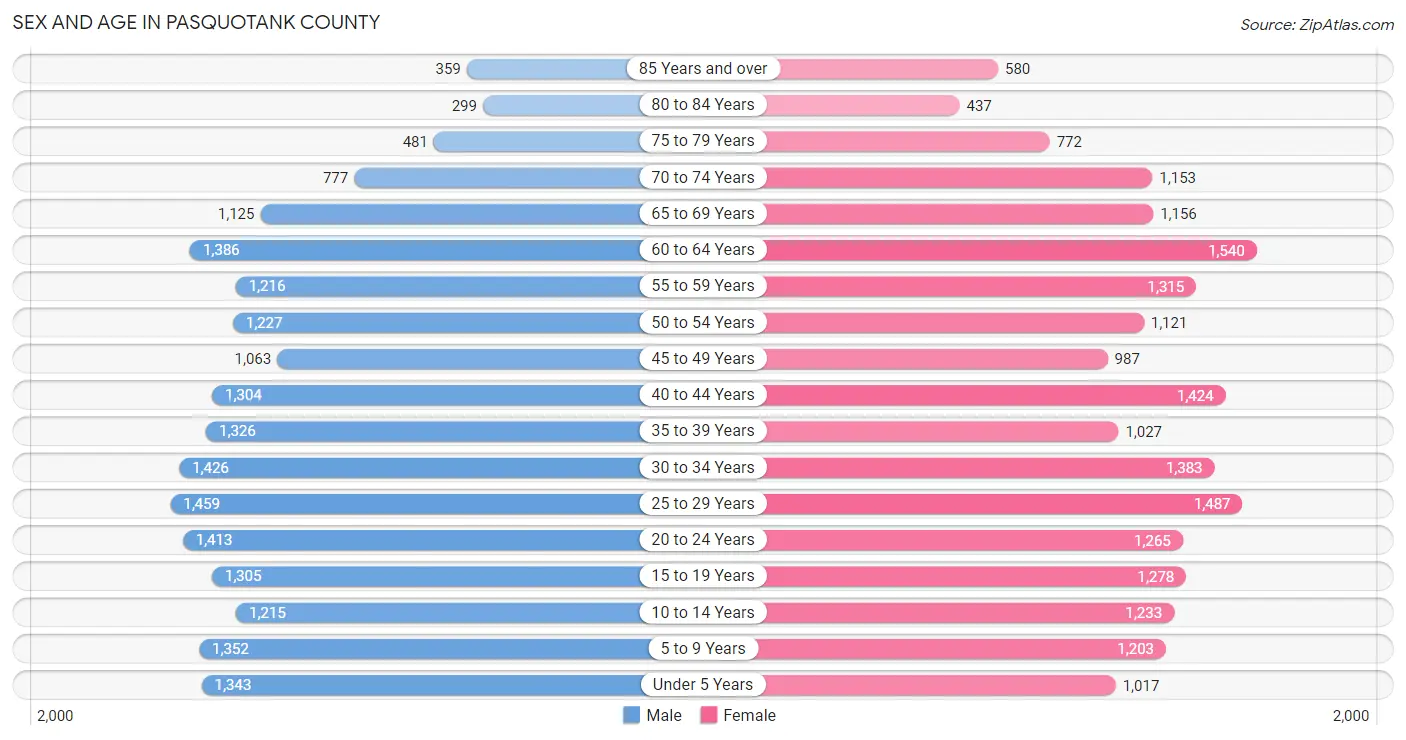
The most populous age groups in Pasquotank County are 25 to 29 Years (1,459 | 7.3%) for men and 60 to 64 Years (1,540 | 7.6%) for women.
| Age Bracket | Male | Female |
| Under 5 Years | 1,343 (6.7%) | 1,017 (5.0%) |
| 5 to 9 Years | 1,352 (6.7%) | 1,203 (5.9%) |
| 10 to 14 Years | 1,215 (6.0%) | 1,233 (6.0%) |
| 15 to 19 Years | 1,305 (6.5%) | 1,278 (6.3%) |
| 20 to 24 Years | 1,413 (7.0%) | 1,265 (6.2%) |
| 25 to 29 Years | 1,459 (7.3%) | 1,487 (7.3%) |
| 30 to 34 Years | 1,426 (7.1%) | 1,383 (6.8%) |
| 35 to 39 Years | 1,326 (6.6%) | 1,027 (5.0%) |
| 40 to 44 Years | 1,304 (6.5%) | 1,424 (7.0%) |
| 45 to 49 Years | 1,063 (5.3%) | 987 (4.8%) |
| 50 to 54 Years | 1,227 (6.1%) | 1,121 (5.5%) |
| 55 to 59 Years | 1,216 (6.1%) | 1,315 (6.5%) |
| 60 to 64 Years | 1,386 (6.9%) | 1,540 (7.6%) |
| 65 to 69 Years | 1,125 (5.6%) | 1,156 (5.7%) |
| 70 to 74 Years | 777 (3.9%) | 1,153 (5.7%) |
| 75 to 79 Years | 481 (2.4%) | 772 (3.8%) |
| 80 to 84 Years | 299 (1.5%) | 437 (2.1%) |
| 85 Years and over | 359 (1.8%) | 580 (2.9%) |
| Total | 20,076 (100.0%) | 20,378 (100.0%) |
Families and Households in Pasquotank County
Median Family Size in Pasquotank County
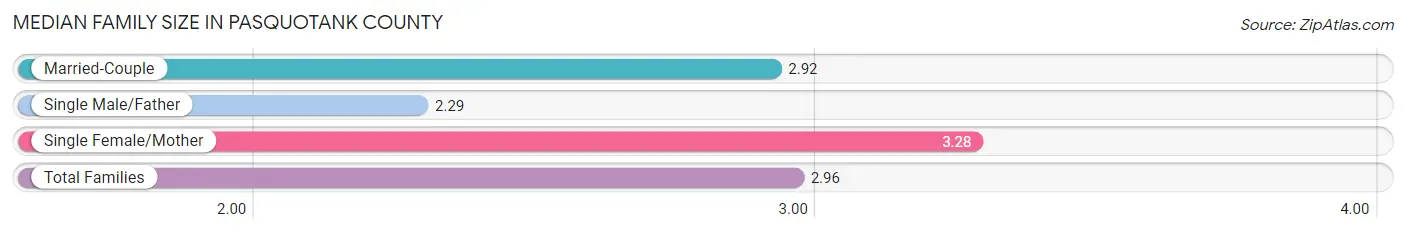
The median family size in Pasquotank County is 2.96 persons per family, with single female/mother families (2,196 | 21.2%) accounting for the largest median family size of 3.28 persons per family. On the other hand, single male/father families (600 | 5.8%) represent the smallest median family size with 2.29 persons per family.
| Family Type | # Families | Family Size |
| Married-Couple | 7,565 (73.0%) | 2.92 |
| Single Male/Father | 600 (5.8%) | 2.29 |
| Single Female/Mother | 2,196 (21.2%) | 3.28 |
| Total Families | 10,361 (100.0%) | 2.96 |
Median Household Size in Pasquotank County
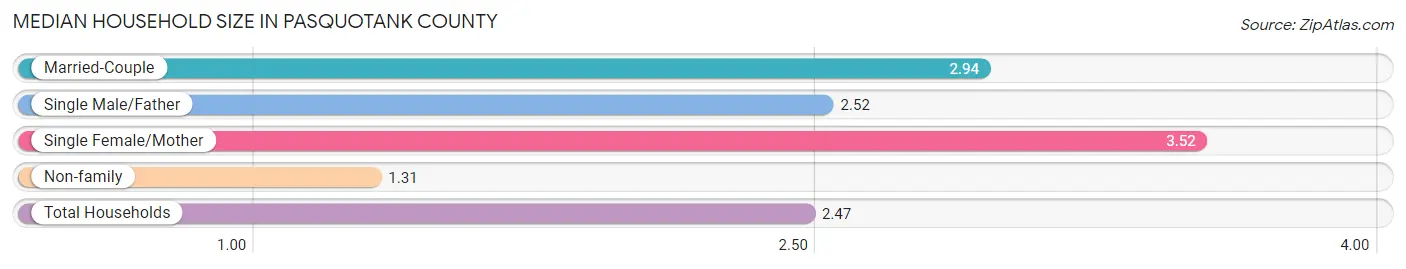
The median household size in Pasquotank County is 2.47 persons per household, with single female/mother households (2,196 | 14.2%) accounting for the largest median household size of 3.52 persons per household. non-family households (5,061 | 32.8%) represent the smallest median household size with 1.31 persons per household.
| Household Type | # Households | Household Size |
| Married-Couple | 7,565 (49.0%) | 2.94 |
| Single Male/Father | 600 (3.9%) | 2.52 |
| Single Female/Mother | 2,196 (14.2%) | 3.52 |
| Non-family | 5,061 (32.8%) | 1.31 |
| Total Households | 15,422 (100.0%) | 2.47 |
Household Size by Marriage Status in Pasquotank County
Out of a total of 15,422 households in Pasquotank County, 10,361 (67.2%) are family households, while 5,061 (32.8%) are nonfamily households. The most numerous type of family households are 2-person households, comprising 4,847, and the most common type of nonfamily households are 1-person households, comprising 4,294.
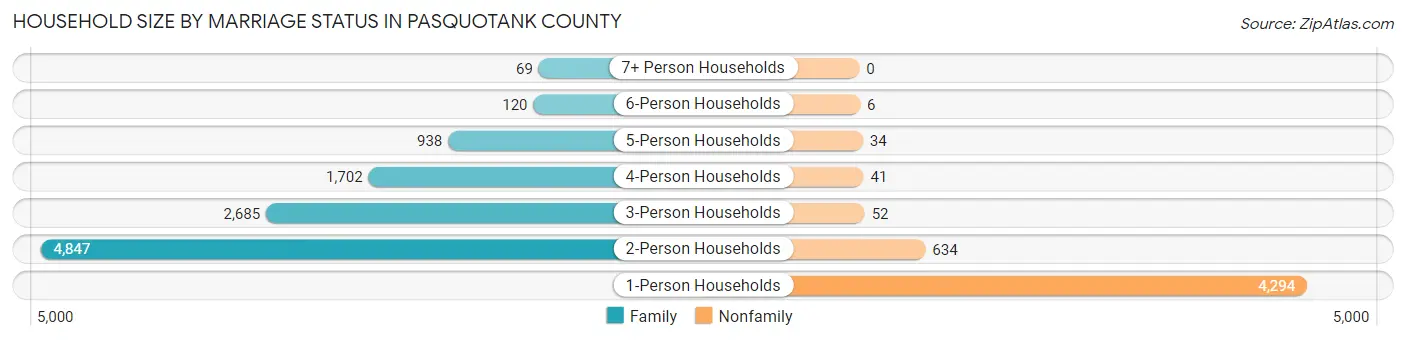
| Household Size | Family Households | Nonfamily Households |
| 1-Person Households | - | 4,294 (27.8%) |
| 2-Person Households | 4,847 (31.4%) | 634 (4.1%) |
| 3-Person Households | 2,685 (17.4%) | 52 (0.3%) |
| 4-Person Households | 1,702 (11.0%) | 41 (0.3%) |
| 5-Person Households | 938 (6.1%) | 34 (0.2%) |
| 6-Person Households | 120 (0.8%) | 6 (0.0%) |
| 7+ Person Households | 69 (0.4%) | 0 (0.0%) |
| Total | 10,361 (67.2%) | 5,061 (32.8%) |
Female Fertility in Pasquotank County
Fertility by Age in Pasquotank County
Average fertility rate in Pasquotank County is 67.0 births per 1,000 women. Women in the age bracket of 20 to 34 years have the highest fertility rate with 101.0 births per 1,000 women. Women in the age bracket of 20 to 34 years acount for 68.5% of all women with births.
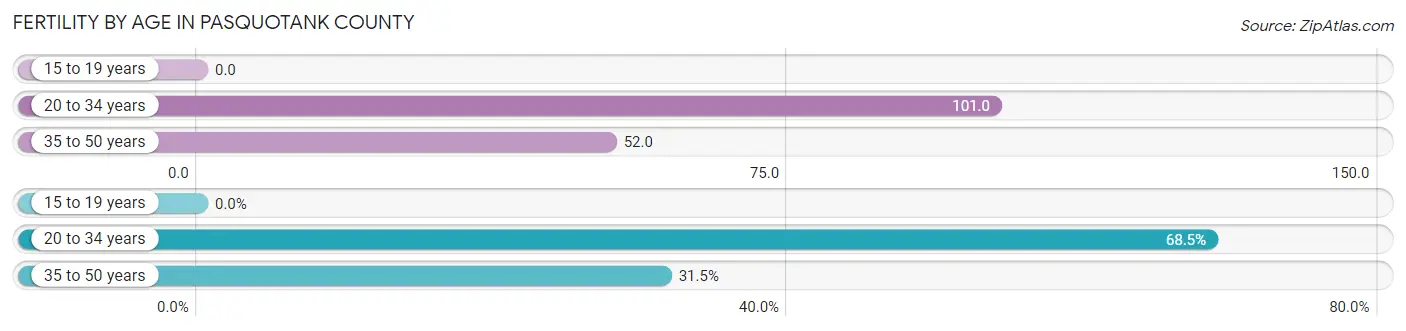
| Age Bracket | Women with Births | Births / 1,000 Women |
| 15 to 19 years | 0 (0.0%) | 0.0 |
| 20 to 34 years | 416 (68.5%) | 101.0 |
| 35 to 50 years | 191 (31.5%) | 52.0 |
| Total | 607 (100.0%) | 67.0 |
Fertility by Age by Marriage Status in Pasquotank County
58.3% of women with births (607) in Pasquotank County are married. The highest percentage of unmarried women with births falls into 35 to 50 years age bracket with 43.5% of them unmarried at the time of birth, while the lowest percentage of unmarried women with births belong to 20 to 34 years age bracket with 40.9% of them unmarried.
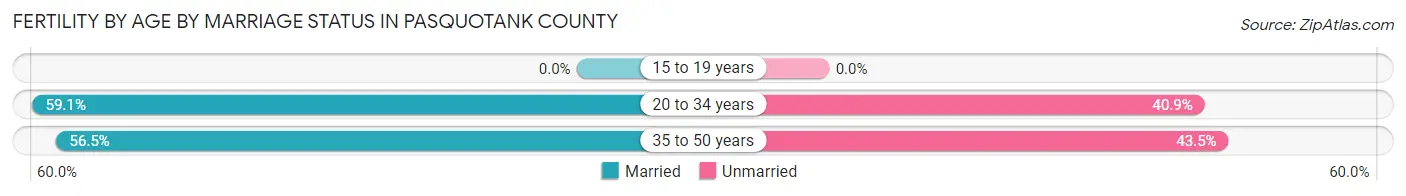
| Age Bracket | Married | Unmarried |
| 15 to 19 years | 0 (0.0%) | 0 (0.0%) |
| 20 to 34 years | 246 (59.1%) | 170 (40.9%) |
| 35 to 50 years | 108 (56.5%) | 83 (43.5%) |
| Total | 354 (58.3%) | 253 (41.7%) |
Fertility by Education in Pasquotank County
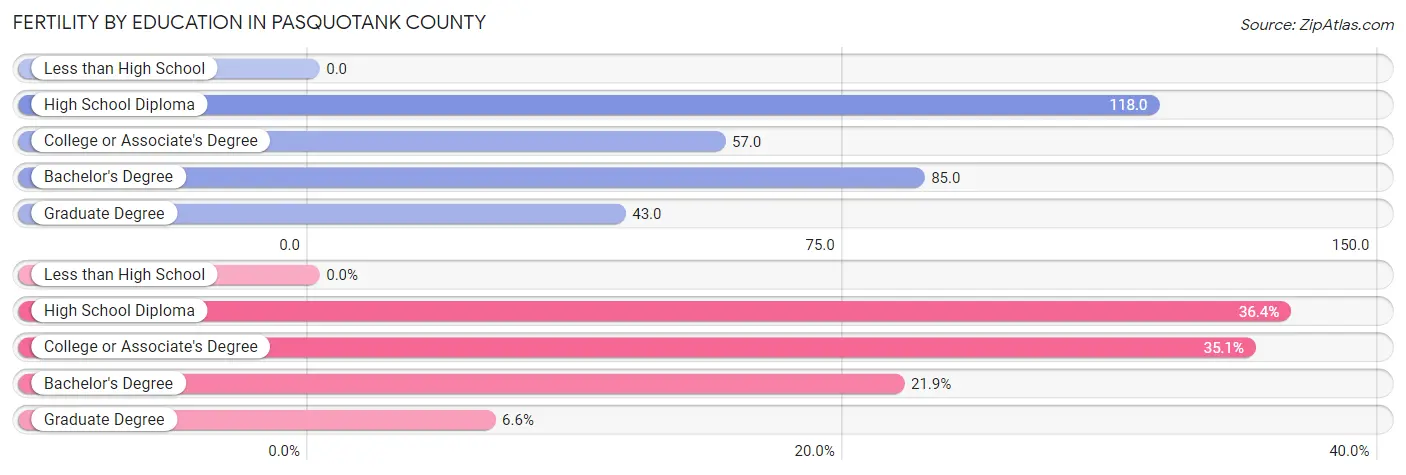
| Educational Attainment | Women with Births | Births / 1,000 Women |
| Less than High School | 0 (0.0%) | 0.0 |
| High School Diploma | 221 (36.4%) | 118.0 |
| College or Associate's Degree | 213 (35.1%) | 57.0 |
| Bachelor's Degree | 133 (21.9%) | 85.0 |
| Graduate Degree | 40 (6.6%) | 43.0 |
| Total | 607 (100.0%) | 67.0 |
Fertility by Education by Marriage Status in Pasquotank County
41.7% of women with births in Pasquotank County are unmarried. Women with the educational attainment of graduate degree are most likely to be married with 100.0% of them married at childbirth, while women with the educational attainment of college or associate's degree are least likely to be married with 57.3% of them unmarried at childbirth.
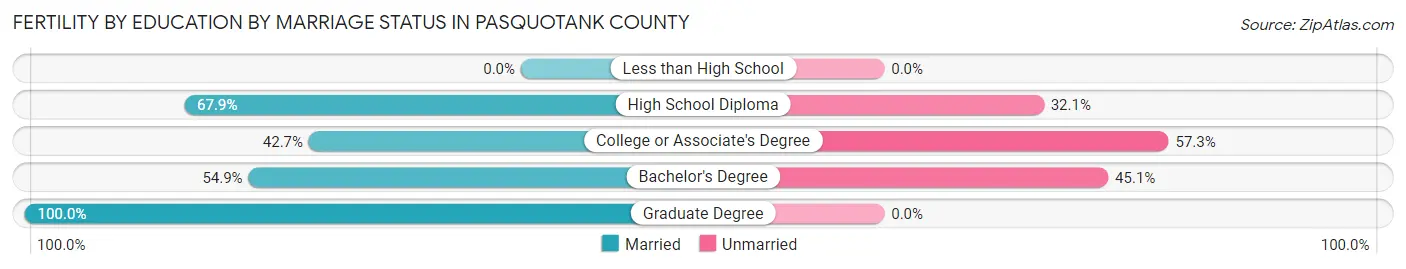
| Educational Attainment | Married | Unmarried |
| Less than High School | 0 (0.0%) | 0 (0.0%) |
| High School Diploma | 150 (67.9%) | 71 (32.1%) |
| College or Associate's Degree | 91 (42.7%) | 122 (57.3%) |
| Bachelor's Degree | 73 (54.9%) | 60 (45.1%) |
| Graduate Degree | 40 (100.0%) | 0 (0.0%) |
| Total | 354 (58.3%) | 253 (41.7%) |
Employment Characteristics in Pasquotank County
Employment by Class of Employer in Pasquotank County
Among the 18,395 employed individuals in Pasquotank County, private company employees (10,595 | 57.6%), state government employees (1,770 | 9.6%), and federal government employees (1,653 | 9.0%) make up the most common classes of employment.
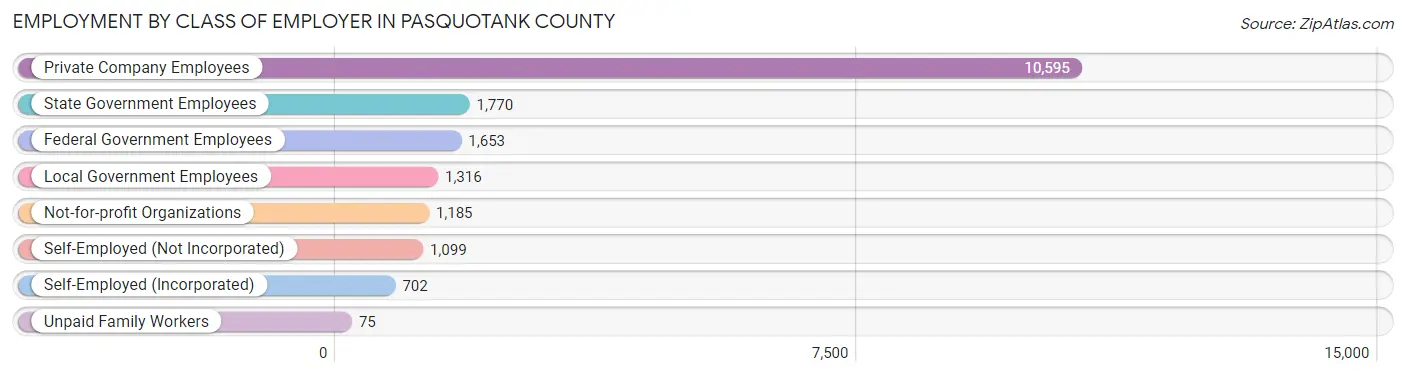
| Employer Class | # Employees | % Employees |
| Private Company Employees | 10,595 | 57.6% |
| Self-Employed (Incorporated) | 702 | 3.8% |
| Self-Employed (Not Incorporated) | 1,099 | 6.0% |
| Not-for-profit Organizations | 1,185 | 6.4% |
| Local Government Employees | 1,316 | 7.1% |
| State Government Employees | 1,770 | 9.6% |
| Federal Government Employees | 1,653 | 9.0% |
| Unpaid Family Workers | 75 | 0.4% |
| Total | 18,395 | 100.0% |
Employment Status by Age in Pasquotank County
According to the labor force statistics for Pasquotank County, out of the total population over 16 years of age (32,537), 60.3% or 19,620 individuals are in the labor force, with 5.8% or 1,138 of them unemployed. The age group with the highest labor force participation rate is 35 to 44 years, with 89.7% or 4,558 individuals in the labor force. Within the labor force, the 16 to 19 years age range has the highest percentage of unemployed individuals, with 27.8% or 158 of them being unemployed.
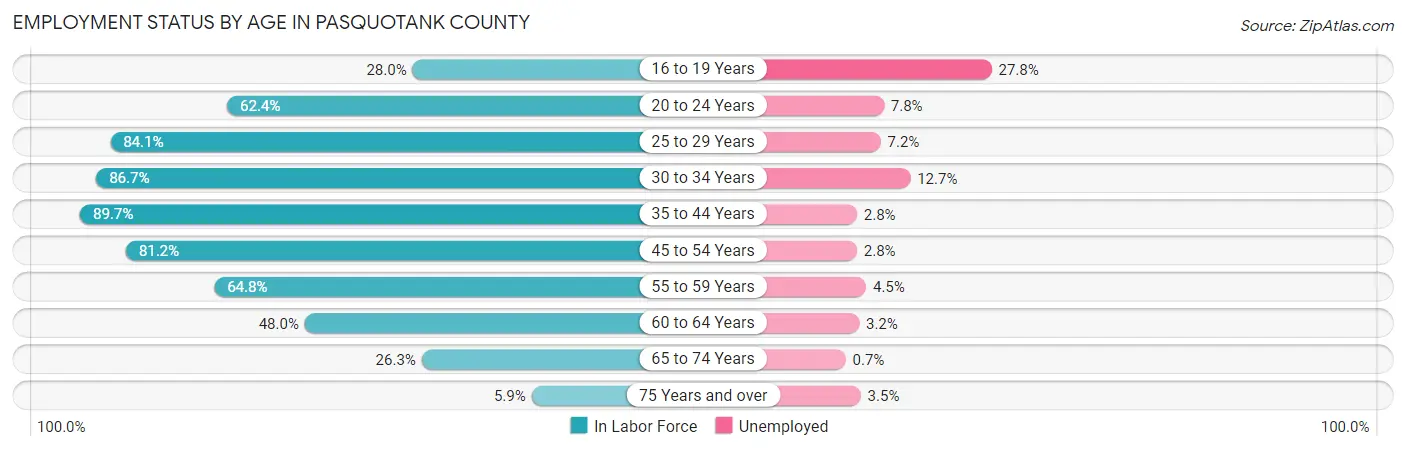
| Age Bracket | In Labor Force | Unemployed |
| 16 to 19 Years | 568 (28.0%) | 158 (27.8%) |
| 20 to 24 Years | 1,671 (62.4%) | 130 (7.8%) |
| 25 to 29 Years | 2,478 (84.1%) | 178 (7.2%) |
| 30 to 34 Years | 2,435 (86.7%) | 309 (12.7%) |
| 35 to 44 Years | 4,558 (89.7%) | 128 (2.8%) |
| 45 to 54 Years | 3,571 (81.2%) | 100 (2.8%) |
| 55 to 59 Years | 1,640 (64.8%) | 74 (4.5%) |
| 60 to 64 Years | 1,404 (48.0%) | 45 (3.2%) |
| 65 to 74 Years | 1,107 (26.3%) | 8 (0.7%) |
| 75 Years and over | 173 (5.9%) | 6 (3.5%) |
| Total | 19,620 (60.3%) | 1,138 (5.8%) |
Employment Status by Educational Attainment in Pasquotank County
According to labor force statistics for Pasquotank County, 77.8% of individuals (16,098) out of the total population between 25 and 64 years of age (20,691) are in the labor force, with 5.2% or 837 of them being unemployed. The group with the highest labor force participation rate are those with the educational attainment of bachelor's degree or higher, with 89.4% or 4,924 individuals in the labor force. Within the labor force, individuals with college / associate degree education have the highest percentage of unemployment, with 7.3% or 424 of them being unemployed.
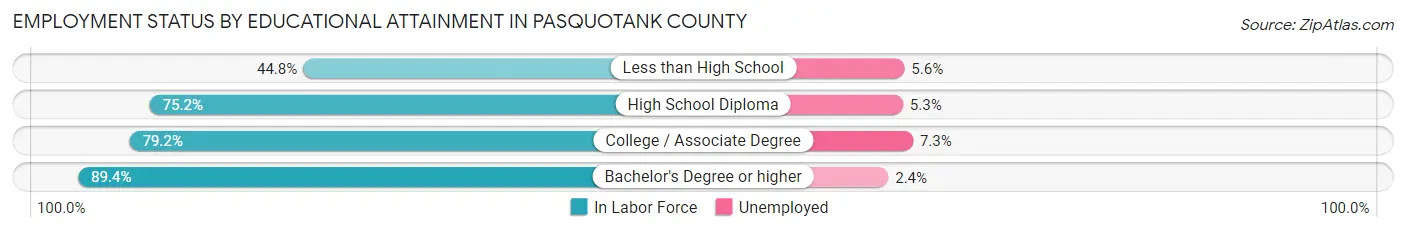
| Educational Attainment | In Labor Force | Unemployed |
| Less than High School | 795 (44.8%) | 99 (5.6%) |
| High School Diploma | 4,562 (75.2%) | 322 (5.3%) |
| College / Associate Degree | 5,815 (79.2%) | 536 (7.3%) |
| Bachelor's Degree or higher | 4,924 (89.4%) | 132 (2.4%) |
| Total | 16,098 (77.8%) | 1,076 (5.2%) |
Employment Occupations by Sex in Pasquotank County
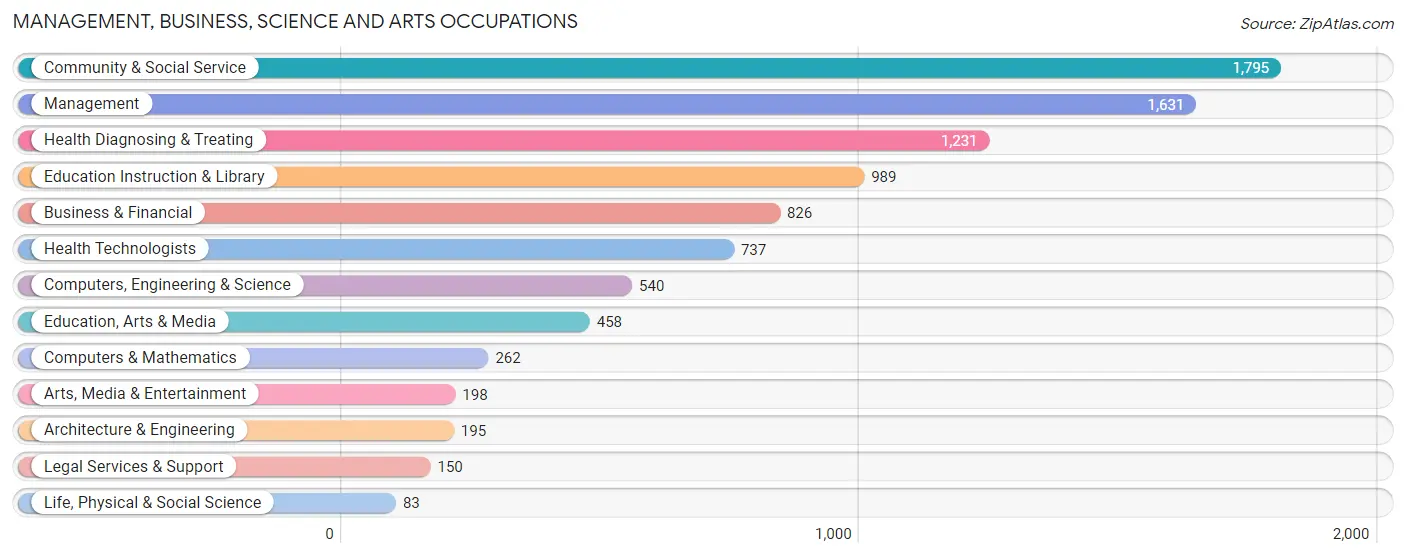
Management, Business, Science and Arts Occupations
The most common Management, Business, Science and Arts occupations in Pasquotank County are Community & Social Service (1,795 | 10.1%), Management (1,631 | 9.1%), Health Diagnosing & Treating (1,231 | 6.9%), Education Instruction & Library (989 | 5.6%), and Business & Financial (826 | 4.6%).
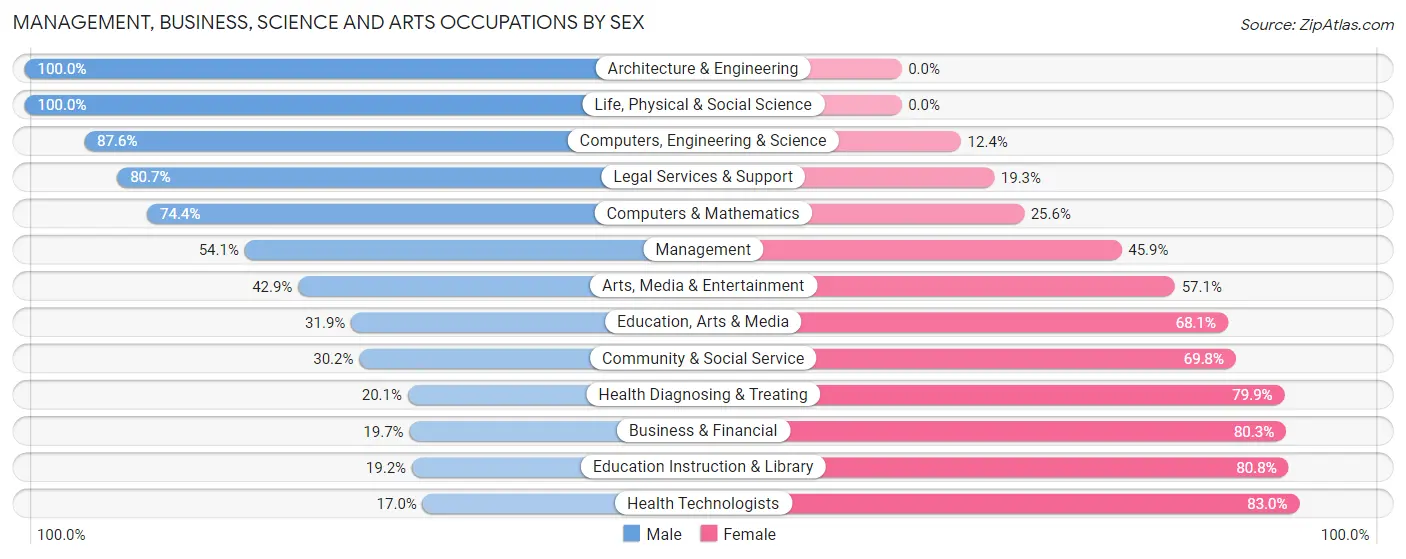
Management, Business, Science and Arts Occupations by Sex
Within the Management, Business, Science and Arts occupations in Pasquotank County, the most male-oriented occupations are Architecture & Engineering (100.0%), Life, Physical & Social Science (100.0%), and Computers, Engineering & Science (87.6%), while the most female-oriented occupations are Health Technologists (83.0%), Education Instruction & Library (80.8%), and Business & Financial (80.3%).
| Occupation | Male | Female |
| Management | 882 (54.1%) | 749 (45.9%) |
| Business & Financial | 163 (19.7%) | 663 (80.3%) |
| Computers, Engineering & Science | 473 (87.6%) | 67 (12.4%) |
| Computers & Mathematics | 195 (74.4%) | 67 (25.6%) |
| Architecture & Engineering | 195 (100.0%) | 0 (0.0%) |
| Life, Physical & Social Science | 83 (100.0%) | 0 (0.0%) |
| Community & Social Service | 542 (30.2%) | 1,253 (69.8%) |
| Education, Arts & Media | 146 (31.9%) | 312 (68.1%) |
| Legal Services & Support | 121 (80.7%) | 29 (19.3%) |
| Education Instruction & Library | 190 (19.2%) | 799 (80.8%) |
| Arts, Media & Entertainment | 85 (42.9%) | 113 (57.1%) |
| Health Diagnosing & Treating | 247 (20.1%) | 984 (79.9%) |
| Health Technologists | 125 (17.0%) | 612 (83.0%) |
| Total (Category) | 2,307 (38.3%) | 3,716 (61.7%) |
| Total (Overall) | 9,238 (51.8%) | 8,579 (48.1%) |
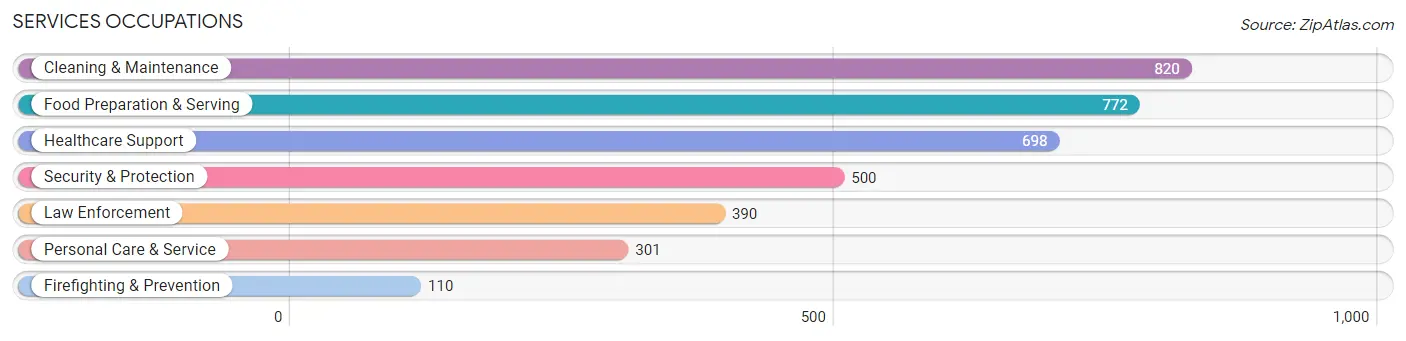
Services Occupations
The most common Services occupations in Pasquotank County are Cleaning & Maintenance (820 | 4.6%), Food Preparation & Serving (772 | 4.3%), Healthcare Support (698 | 3.9%), Security & Protection (500 | 2.8%), and Law Enforcement (390 | 2.2%).
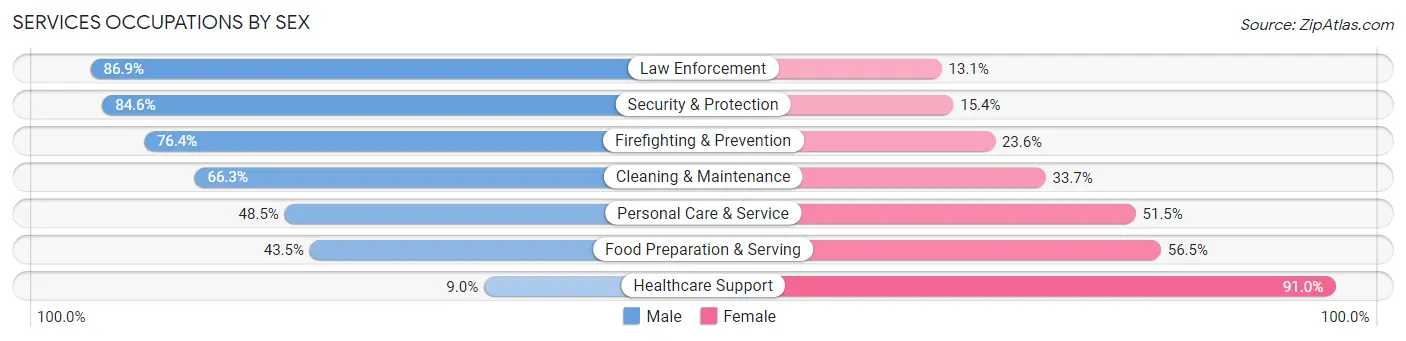
Services Occupations by Sex
Within the Services occupations in Pasquotank County, the most male-oriented occupations are Law Enforcement (86.9%), Security & Protection (84.6%), and Firefighting & Prevention (76.4%), while the most female-oriented occupations are Healthcare Support (91.0%), Food Preparation & Serving (56.5%), and Personal Care & Service (51.5%).
| Occupation | Male | Female |
| Healthcare Support | 63 (9.0%) | 635 (91.0%) |
| Security & Protection | 423 (84.6%) | 77 (15.4%) |
| Firefighting & Prevention | 84 (76.4%) | 26 (23.6%) |
| Law Enforcement | 339 (86.9%) | 51 (13.1%) |
| Food Preparation & Serving | 336 (43.5%) | 436 (56.5%) |
| Cleaning & Maintenance | 544 (66.3%) | 276 (33.7%) |
| Personal Care & Service | 146 (48.5%) | 155 (51.5%) |
| Total (Category) | 1,512 (48.9%) | 1,579 (51.1%) |
| Total (Overall) | 9,238 (51.8%) | 8,579 (48.1%) |
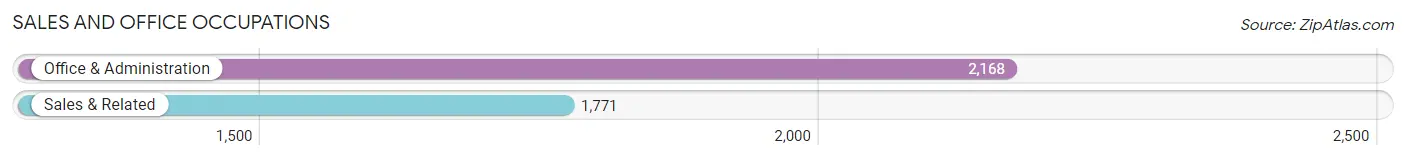
Sales and Office Occupations
The most common Sales and Office occupations in Pasquotank County are Office & Administration (2,168 | 12.2%), and Sales & Related (1,771 | 9.9%).
Sales and Office Occupations by Sex
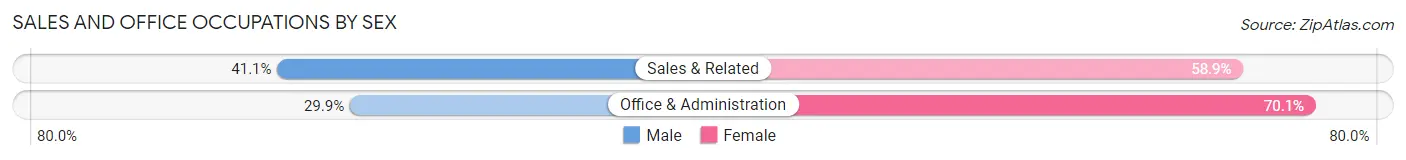
| Occupation | Male | Female |
| Sales & Related | 728 (41.1%) | 1,043 (58.9%) |
| Office & Administration | 649 (29.9%) | 1,519 (70.1%) |
| Total (Category) | 1,377 (35.0%) | 2,562 (65.0%) |
| Total (Overall) | 9,238 (51.8%) | 8,579 (48.1%) |
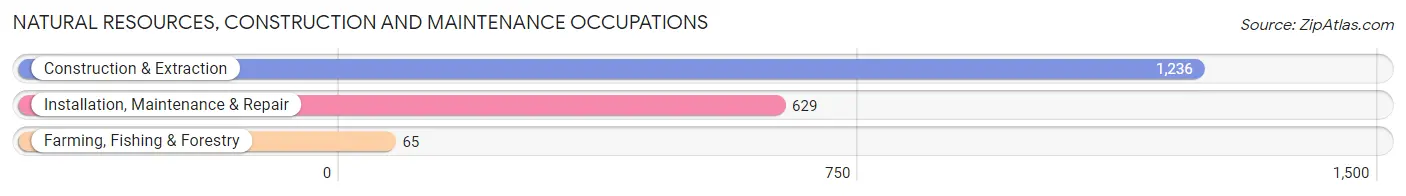
Natural Resources, Construction and Maintenance Occupations
The most common Natural Resources, Construction and Maintenance occupations in Pasquotank County are Construction & Extraction (1,236 | 6.9%), Installation, Maintenance & Repair (629 | 3.5%), and Farming, Fishing & Forestry (65 | 0.4%).
Natural Resources, Construction and Maintenance Occupations by Sex
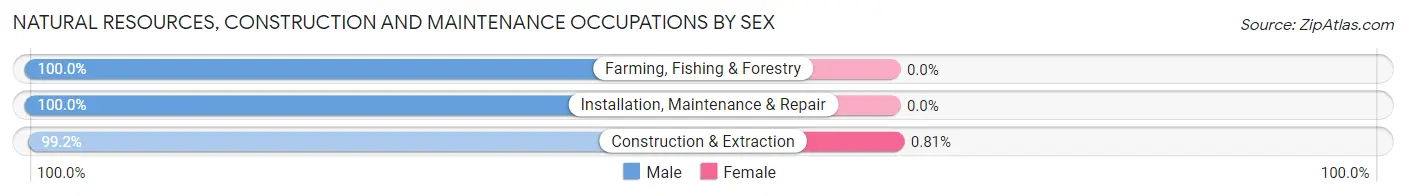
| Occupation | Male | Female |
| Farming, Fishing & Forestry | 65 (100.0%) | 0 (0.0%) |
| Construction & Extraction | 1,226 (99.2%) | 10 (0.8%) |
| Installation, Maintenance & Repair | 629 (100.0%) | 0 (0.0%) |
| Total (Category) | 1,920 (99.5%) | 10 (0.5%) |
| Total (Overall) | 9,238 (51.8%) | 8,579 (48.1%) |
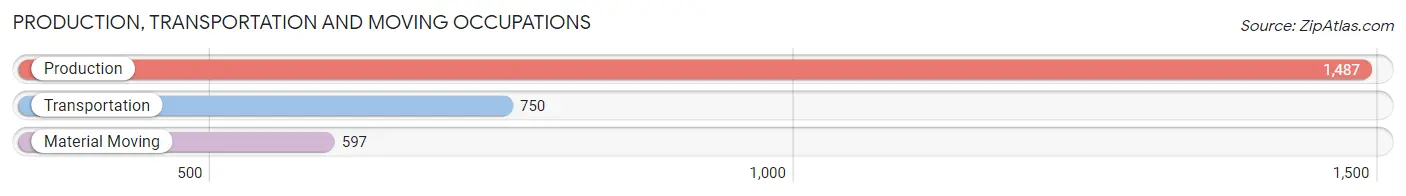
Production, Transportation and Moving Occupations
The most common Production, Transportation and Moving occupations in Pasquotank County are Production (1,487 | 8.4%), Transportation (750 | 4.2%), and Material Moving (597 | 3.4%).
Production, Transportation and Moving Occupations by Sex
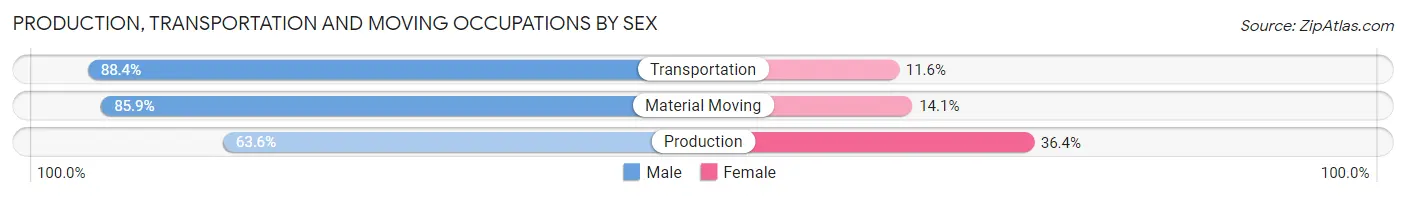
| Occupation | Male | Female |
| Production | 946 (63.6%) | 541 (36.4%) |
| Transportation | 663 (88.4%) | 87 (11.6%) |
| Material Moving | 513 (85.9%) | 84 (14.1%) |
| Total (Category) | 2,122 (74.9%) | 712 (25.1%) |
| Total (Overall) | 9,238 (51.8%) | 8,579 (48.1%) |
Employment Industries by Sex in Pasquotank County
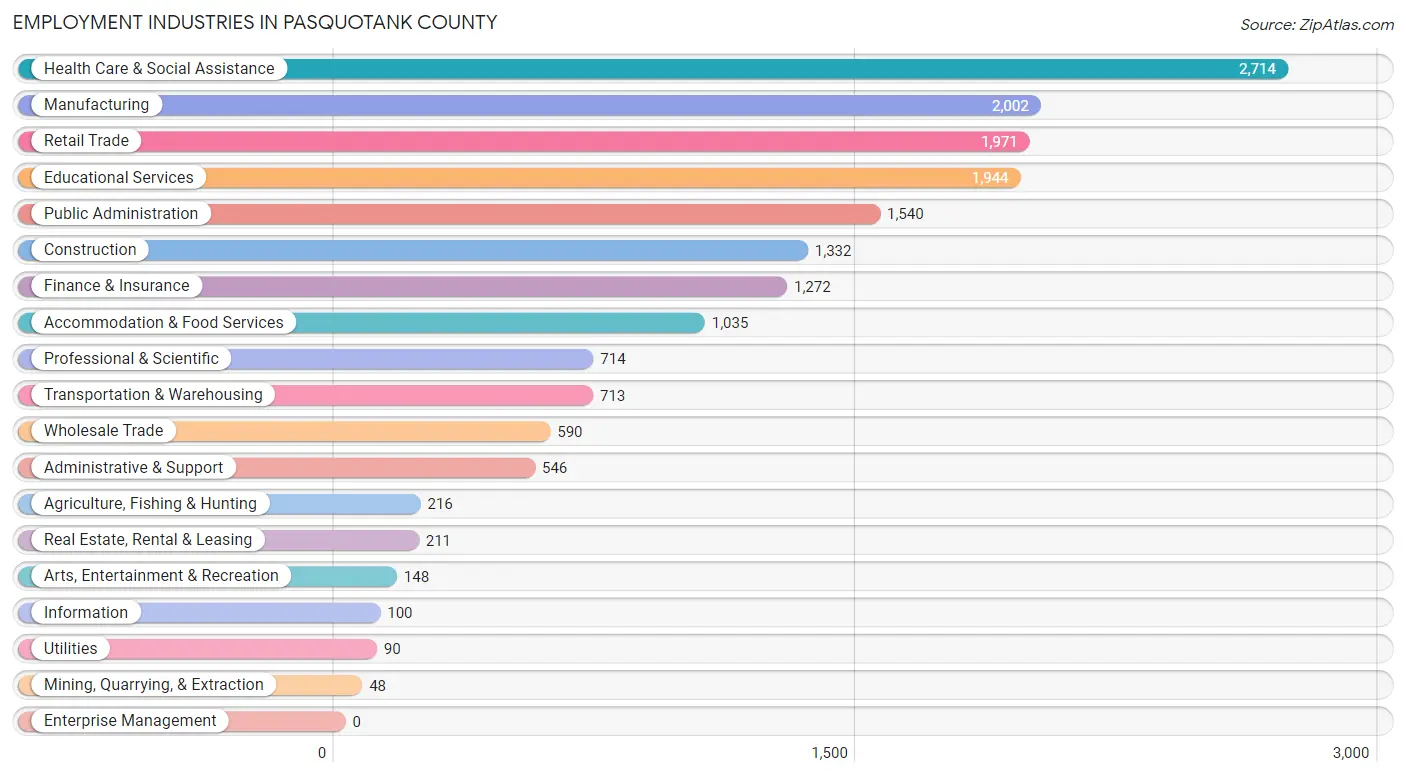
Employment Industries in Pasquotank County
The major employment industries in Pasquotank County include Health Care & Social Assistance (2,714 | 15.2%), Manufacturing (2,002 | 11.2%), Retail Trade (1,971 | 11.1%), Educational Services (1,944 | 10.9%), and Public Administration (1,540 | 8.6%).
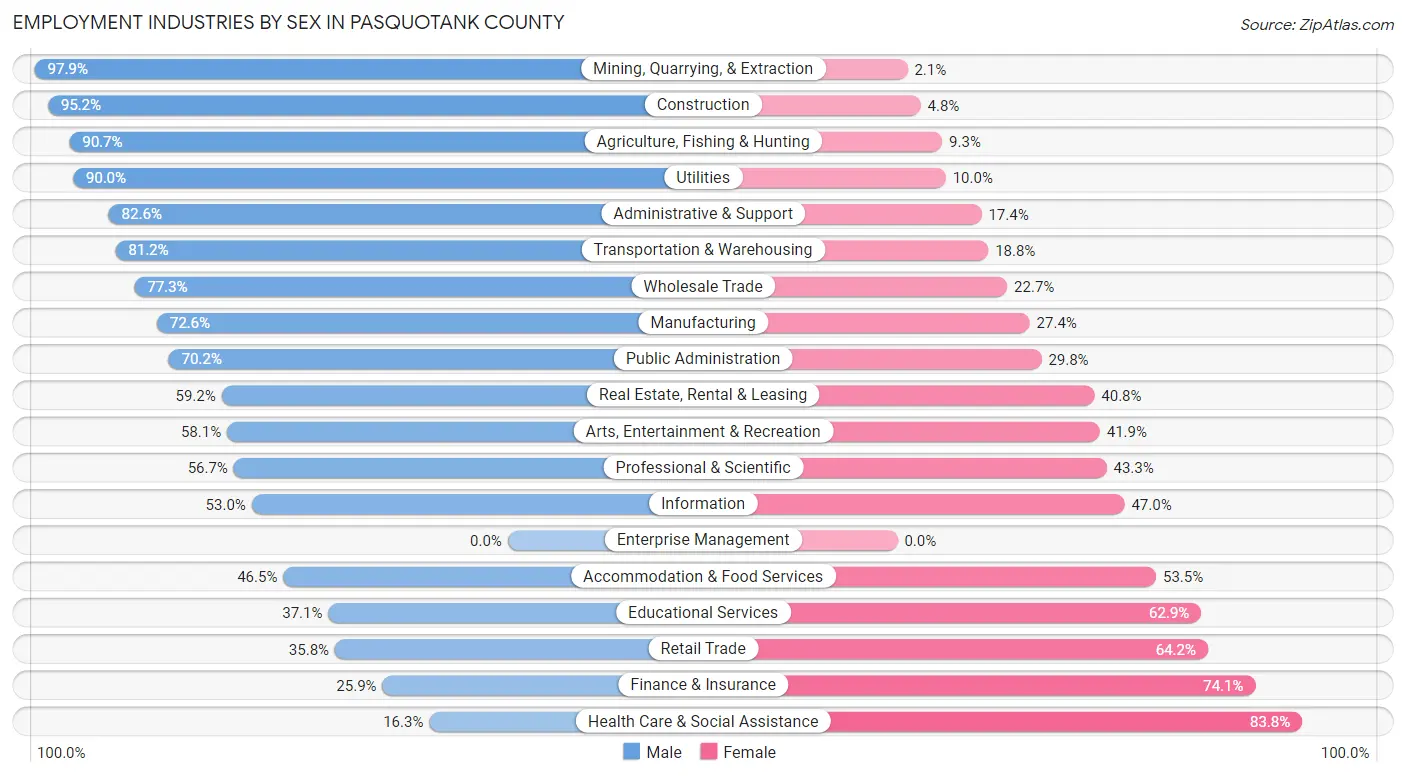
Employment Industries by Sex in Pasquotank County
The Pasquotank County industries that see more men than women are Mining, Quarrying, & Extraction (97.9%), Construction (95.2%), and Agriculture, Fishing & Hunting (90.7%), whereas the industries that tend to have a higher number of women are Health Care & Social Assistance (83.8%), Finance & Insurance (74.1%), and Retail Trade (64.2%).
| Industry | Male | Female |
| Agriculture, Fishing & Hunting | 196 (90.7%) | 20 (9.3%) |
| Mining, Quarrying, & Extraction | 47 (97.9%) | 1 (2.1%) |
| Construction | 1,268 (95.2%) | 64 (4.8%) |
| Manufacturing | 1,454 (72.6%) | 548 (27.4%) |
| Wholesale Trade | 456 (77.3%) | 134 (22.7%) |
| Retail Trade | 705 (35.8%) | 1,266 (64.2%) |
| Transportation & Warehousing | 579 (81.2%) | 134 (18.8%) |
| Utilities | 81 (90.0%) | 9 (10.0%) |
| Information | 53 (53.0%) | 47 (47.0%) |
| Finance & Insurance | 330 (25.9%) | 942 (74.1%) |
| Real Estate, Rental & Leasing | 125 (59.2%) | 86 (40.8%) |
| Professional & Scientific | 405 (56.7%) | 309 (43.3%) |
| Enterprise Management | 0 (0.0%) | 0 (0.0%) |
| Administrative & Support | 451 (82.6%) | 95 (17.4%) |
| Educational Services | 722 (37.1%) | 1,222 (62.9%) |
| Health Care & Social Assistance | 441 (16.3%) | 2,273 (83.8%) |
| Arts, Entertainment & Recreation | 86 (58.1%) | 62 (41.9%) |
| Accommodation & Food Services | 481 (46.5%) | 554 (53.5%) |
| Public Administration | 1,081 (70.2%) | 459 (29.8%) |
| Total | 9,238 (51.8%) | 8,579 (48.1%) |
Education in Pasquotank County
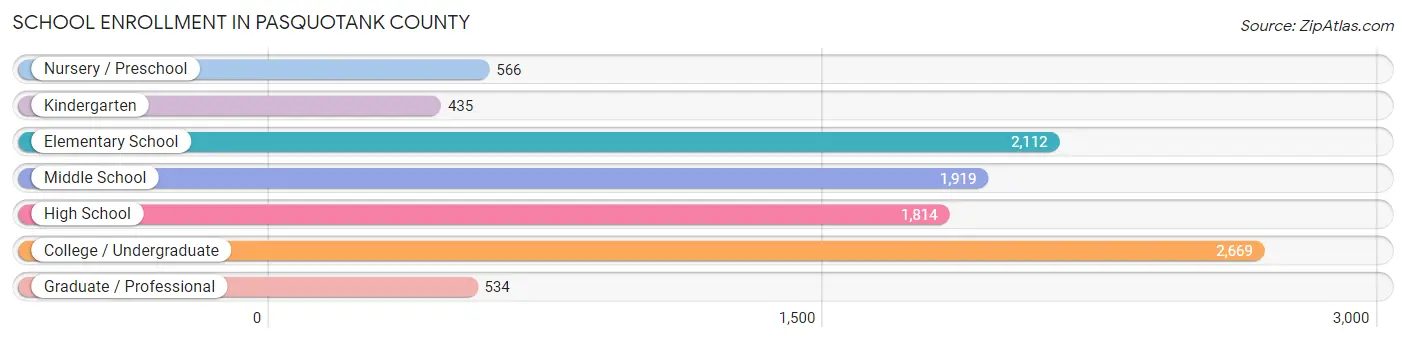
School Enrollment in Pasquotank County
The most common levels of schooling among the 10,049 students in Pasquotank County are college / undergraduate (2,669 | 26.6%), elementary school (2,112 | 21.0%), and middle school (1,919 | 19.1%).
| School Level | # Students | % Students |
| Nursery / Preschool | 566 | 5.6% |
| Kindergarten | 435 | 4.3% |
| Elementary School | 2,112 | 21.0% |
| Middle School | 1,919 | 19.1% |
| High School | 1,814 | 18.0% |
| College / Undergraduate | 2,669 | 26.6% |
| Graduate / Professional | 534 | 5.3% |
| Total | 10,049 | 100.0% |
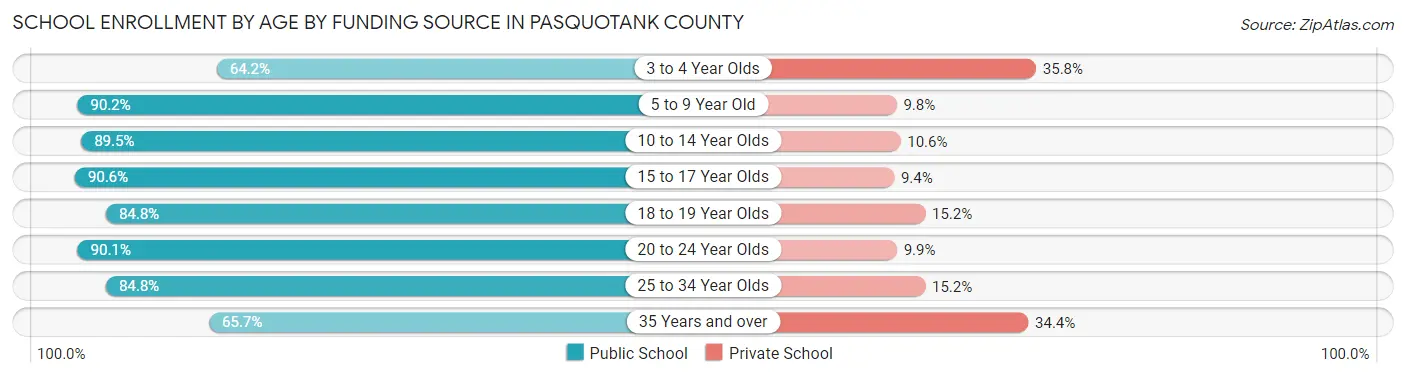
School Enrollment by Age by Funding Source in Pasquotank County
Out of a total of 10,049 students who are enrolled in schools in Pasquotank County, 1,326 (13.2%) attend a private institution, while the remaining 8,723 (86.8%) are enrolled in public schools. The age group of 3 to 4 year olds has the highest likelihood of being enrolled in private schools, with 189 (35.8% in the age bracket) enrolled. Conversely, the age group of 15 to 17 year olds has the lowest likelihood of being enrolled in a private school, with 1,228 (90.6% in the age bracket) attending a public institution.
| Age Bracket | Public School | Private School |
| 3 to 4 Year Olds | 339 (64.2%) | 189 (35.8%) |
| 5 to 9 Year Old | 2,109 (90.2%) | 230 (9.8%) |
| 10 to 14 Year Olds | 2,178 (89.4%) | 257 (10.5%) |
| 15 to 17 Year Olds | 1,228 (90.6%) | 127 (9.4%) |
| 18 to 19 Year Olds | 834 (84.8%) | 149 (15.2%) |
| 20 to 24 Year Olds | 1,158 (90.1%) | 127 (9.9%) |
| 25 to 34 Year Olds | 593 (84.8%) | 106 (15.2%) |
| 35 Years and over | 279 (65.6%) | 146 (34.4%) |
| Total | 8,723 (86.8%) | 1,326 (13.2%) |
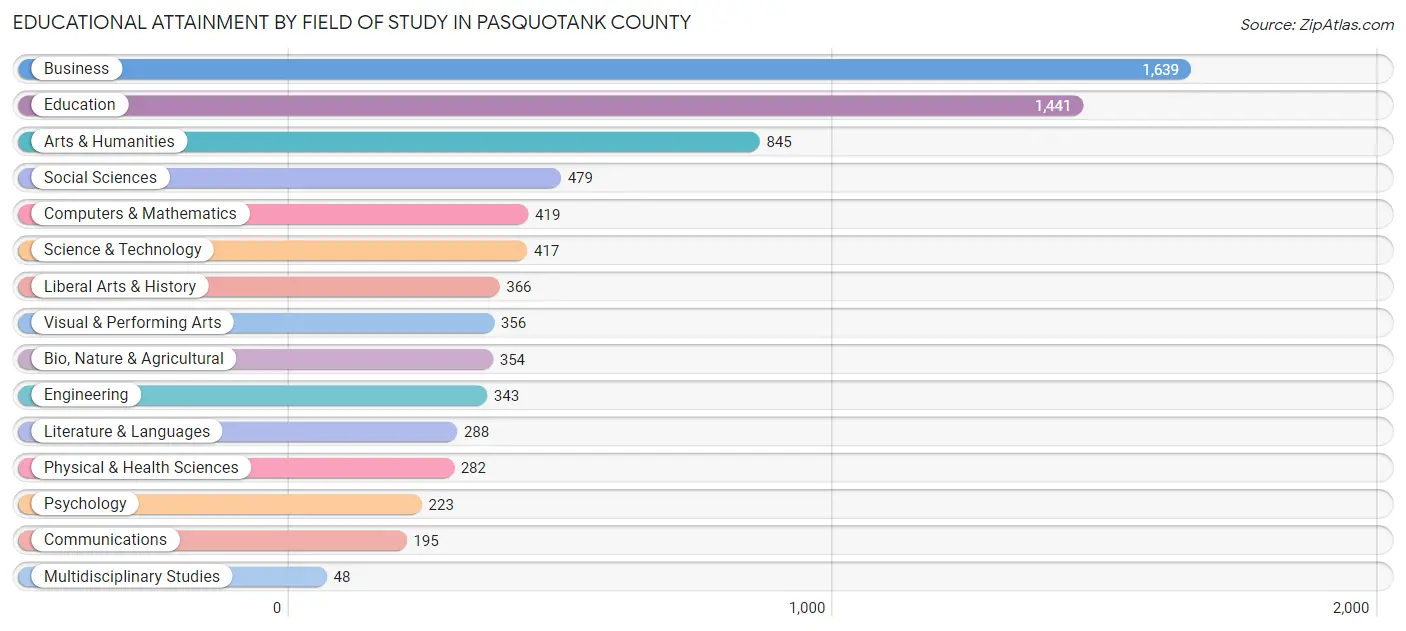
Educational Attainment by Field of Study in Pasquotank County
Business (1,639 | 21.3%), education (1,441 | 18.7%), arts & humanities (845 | 11.0%), social sciences (479 | 6.2%), and computers & mathematics (419 | 5.4%) are the most common fields of study among 7,695 individuals in Pasquotank County who have obtained a bachelor's degree or higher.
| Field of Study | # Graduates | % Graduates |
| Computers & Mathematics | 419 | 5.4% |
| Bio, Nature & Agricultural | 354 | 4.6% |
| Physical & Health Sciences | 282 | 3.7% |
| Psychology | 223 | 2.9% |
| Social Sciences | 479 | 6.2% |
| Engineering | 343 | 4.5% |
| Multidisciplinary Studies | 48 | 0.6% |
| Science & Technology | 417 | 5.4% |
| Business | 1,639 | 21.3% |
| Education | 1,441 | 18.7% |
| Literature & Languages | 288 | 3.7% |
| Liberal Arts & History | 366 | 4.8% |
| Visual & Performing Arts | 356 | 4.6% |
| Communications | 195 | 2.5% |
| Arts & Humanities | 845 | 11.0% |
| Total | 7,695 | 100.0% |
Transportation & Commute in Pasquotank County
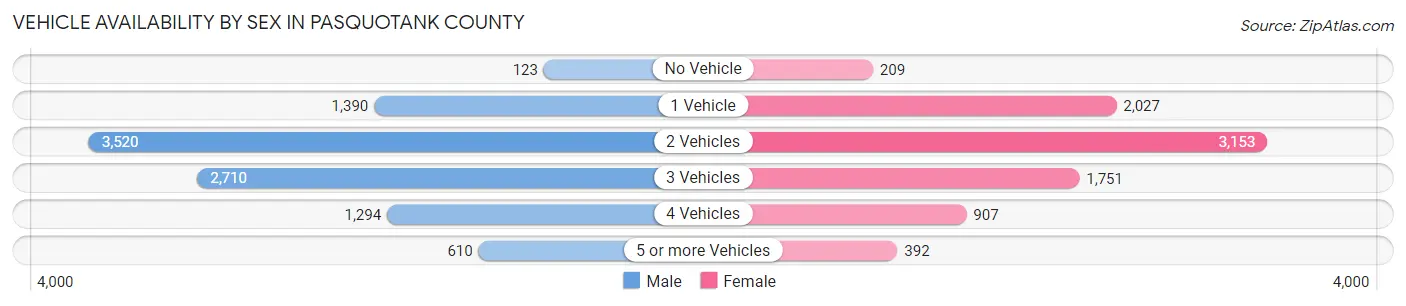
Vehicle Availability by Sex in Pasquotank County
The most prevalent vehicle ownership categories in Pasquotank County are males with 2 vehicles (3,520, accounting for 36.5%) and females with 2 vehicles (3,153, making up 41.7%).
| Vehicles Available | Male | Female |
| No Vehicle | 123 (1.3%) | 209 (2.5%) |
| 1 Vehicle | 1,390 (14.4%) | 2,027 (24.0%) |
| 2 Vehicles | 3,520 (36.5%) | 3,153 (37.4%) |
| 3 Vehicles | 2,710 (28.1%) | 1,751 (20.7%) |
| 4 Vehicles | 1,294 (13.4%) | 907 (10.7%) |
| 5 or more Vehicles | 610 (6.3%) | 392 (4.6%) |
| Total | 9,647 (100.0%) | 8,439 (100.0%) |
Commute Time in Pasquotank County
The most frequently occuring commute durations in Pasquotank County are 10 to 14 minutes (3,011 commuters, 17.6%), 5 to 9 minutes (2,654 commuters, 15.6%), and 15 to 19 minutes (2,553 commuters, 15.0%).
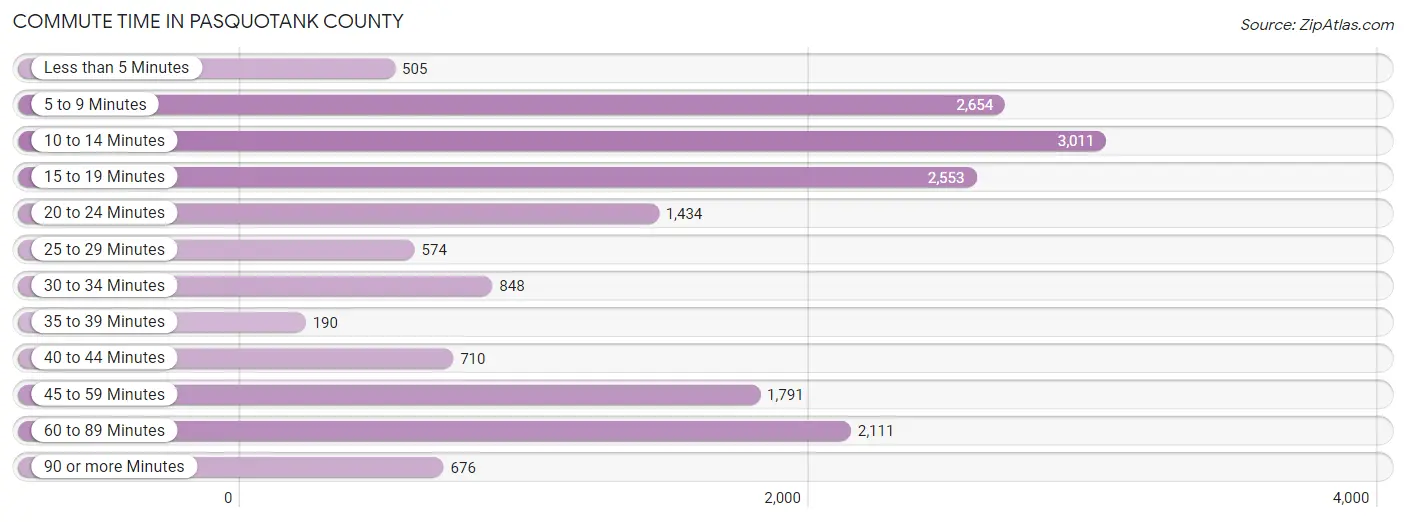
| Commute Time | # Commuters | % Commuters |
| Less than 5 Minutes | 505 | 3.0% |
| 5 to 9 Minutes | 2,654 | 15.6% |
| 10 to 14 Minutes | 3,011 | 17.6% |
| 15 to 19 Minutes | 2,553 | 15.0% |
| 20 to 24 Minutes | 1,434 | 8.4% |
| 25 to 29 Minutes | 574 | 3.4% |
| 30 to 34 Minutes | 848 | 5.0% |
| 35 to 39 Minutes | 190 | 1.1% |
| 40 to 44 Minutes | 710 | 4.2% |
| 45 to 59 Minutes | 1,791 | 10.5% |
| 60 to 89 Minutes | 2,111 | 12.4% |
| 90 or more Minutes | 676 | 4.0% |
Commute Time by Sex in Pasquotank County
The most common commute times in Pasquotank County are 60 to 89 minutes (1,618 commuters, 17.5%) for males and 10 to 14 minutes (1,797 commuters, 23.0%) for females.
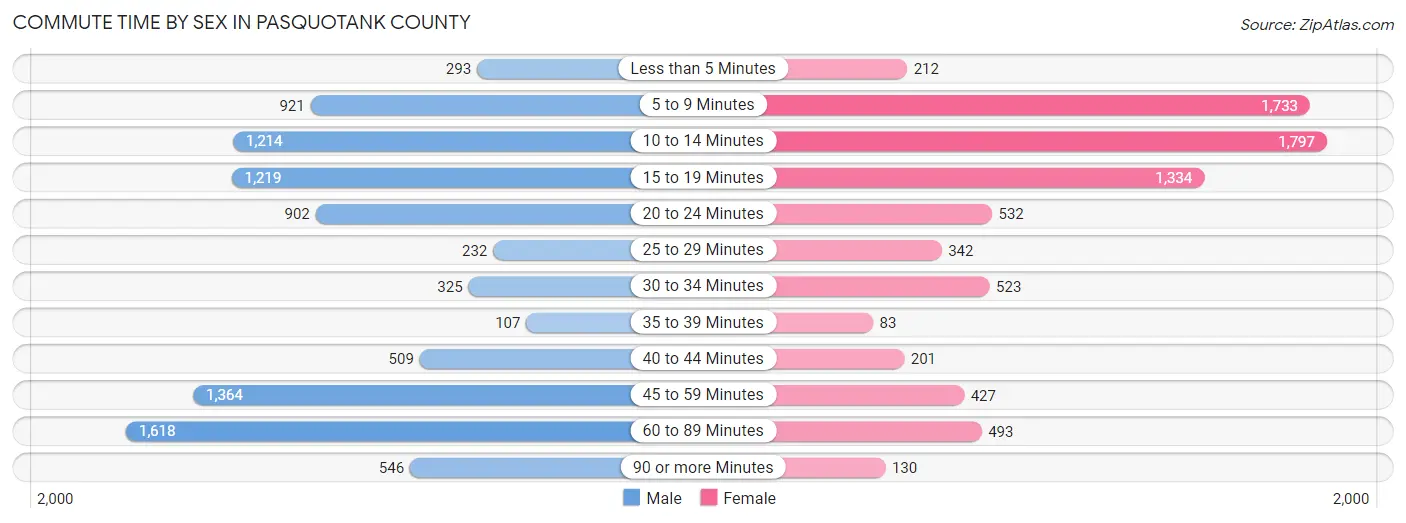
| Commute Time | Male | Female |
| Less than 5 Minutes | 293 (3.2%) | 212 (2.7%) |
| 5 to 9 Minutes | 921 (10.0%) | 1,733 (22.2%) |
| 10 to 14 Minutes | 1,214 (13.1%) | 1,797 (23.0%) |
| 15 to 19 Minutes | 1,219 (13.2%) | 1,334 (17.1%) |
| 20 to 24 Minutes | 902 (9.8%) | 532 (6.8%) |
| 25 to 29 Minutes | 232 (2.5%) | 342 (4.4%) |
| 30 to 34 Minutes | 325 (3.5%) | 523 (6.7%) |
| 35 to 39 Minutes | 107 (1.2%) | 83 (1.1%) |
| 40 to 44 Minutes | 509 (5.5%) | 201 (2.6%) |
| 45 to 59 Minutes | 1,364 (14.7%) | 427 (5.5%) |
| 60 to 89 Minutes | 1,618 (17.5%) | 493 (6.3%) |
| 90 or more Minutes | 546 (5.9%) | 130 (1.7%) |
Time of Departure to Work by Sex in Pasquotank County
The most frequent times of departure to work in Pasquotank County are 7:00 AM to 7:29 AM (1,332, 14.4%) for males and 7:30 AM to 7:59 AM (1,459, 18.7%) for females.
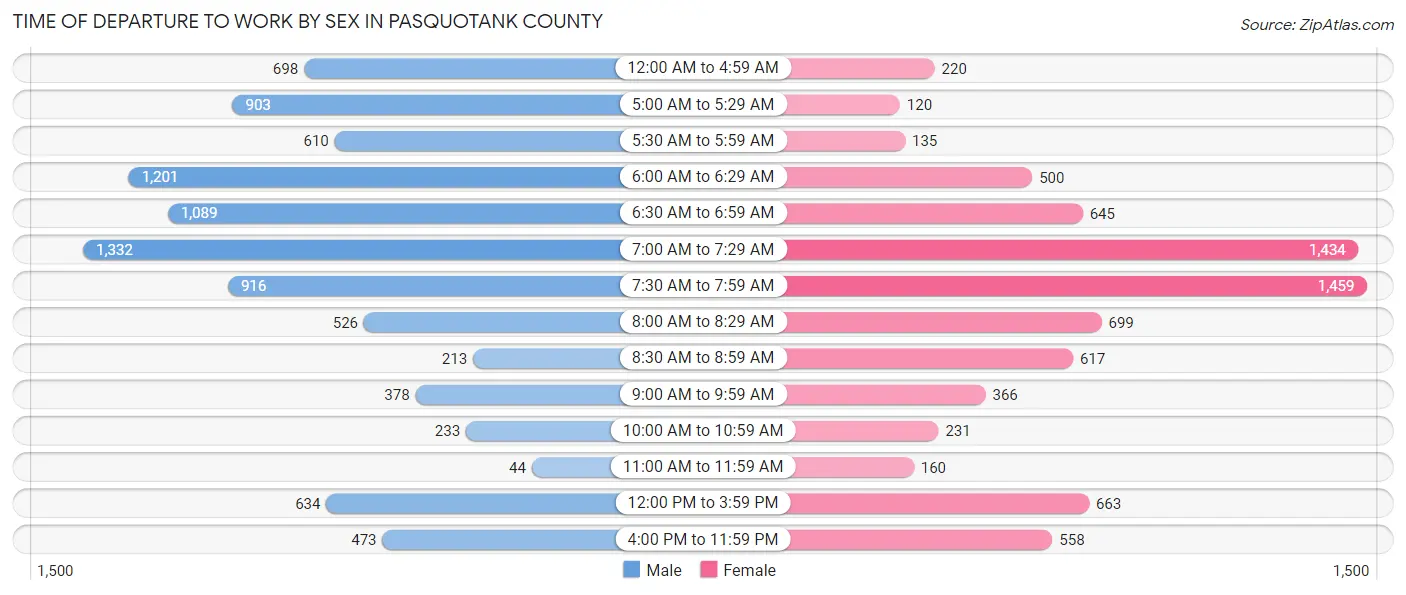
| Time of Departure | Male | Female |
| 12:00 AM to 4:59 AM | 698 (7.5%) | 220 (2.8%) |
| 5:00 AM to 5:29 AM | 903 (9.8%) | 120 (1.5%) |
| 5:30 AM to 5:59 AM | 610 (6.6%) | 135 (1.7%) |
| 6:00 AM to 6:29 AM | 1,201 (13.0%) | 500 (6.4%) |
| 6:30 AM to 6:59 AM | 1,089 (11.8%) | 645 (8.3%) |
| 7:00 AM to 7:29 AM | 1,332 (14.4%) | 1,434 (18.4%) |
| 7:30 AM to 7:59 AM | 916 (9.9%) | 1,459 (18.7%) |
| 8:00 AM to 8:29 AM | 526 (5.7%) | 699 (8.9%) |
| 8:30 AM to 8:59 AM | 213 (2.3%) | 617 (7.9%) |
| 9:00 AM to 9:59 AM | 378 (4.1%) | 366 (4.7%) |
| 10:00 AM to 10:59 AM | 233 (2.5%) | 231 (3.0%) |
| 11:00 AM to 11:59 AM | 44 (0.5%) | 160 (2.1%) |
| 12:00 PM to 3:59 PM | 634 (6.9%) | 663 (8.5%) |
| 4:00 PM to 11:59 PM | 473 (5.1%) | 558 (7.1%) |
| Total | 9,250 (100.0%) | 7,807 (100.0%) |
Housing Occupancy in Pasquotank County
Occupancy by Ownership in Pasquotank County
Of the total 15,422 dwellings in Pasquotank County, owner-occupied units account for 9,902 (64.2%), while renter-occupied units make up 5,520 (35.8%).
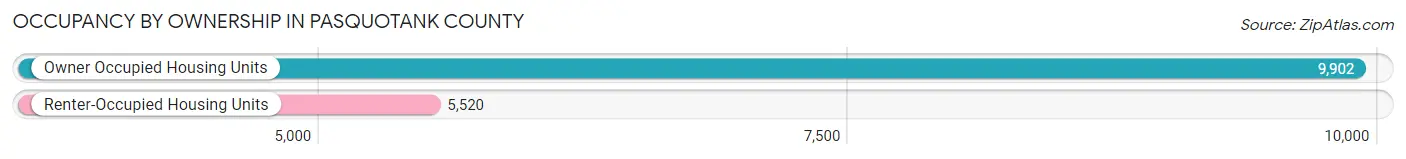
| Occupancy | # Housing Units | % Housing Units |
| Owner Occupied Housing Units | 9,902 | 64.2% |
| Renter-Occupied Housing Units | 5,520 | 35.8% |
| Total Occupied Housing Units | 15,422 | 100.0% |
Occupancy by Household Size in Pasquotank County
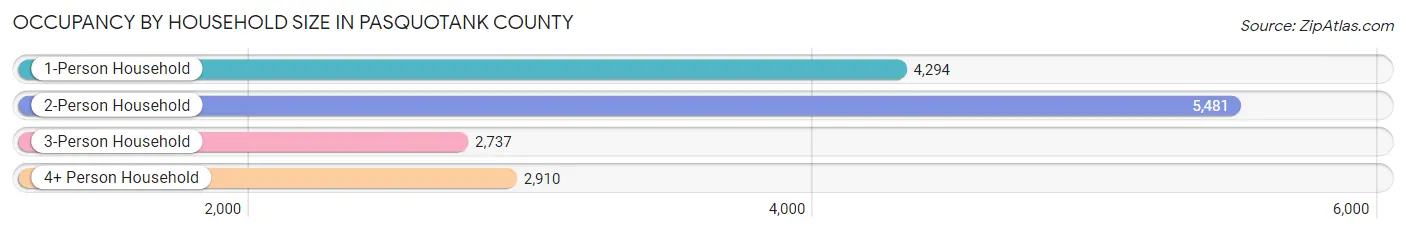
| Household Size | # Housing Units | % Housing Units |
| 1-Person Household | 4,294 | 27.8% |
| 2-Person Household | 5,481 | 35.5% |
| 3-Person Household | 2,737 | 17.7% |
| 4+ Person Household | 2,910 | 18.9% |
| Total Housing Units | 15,422 | 100.0% |
Occupancy by Ownership by Household Size in Pasquotank County
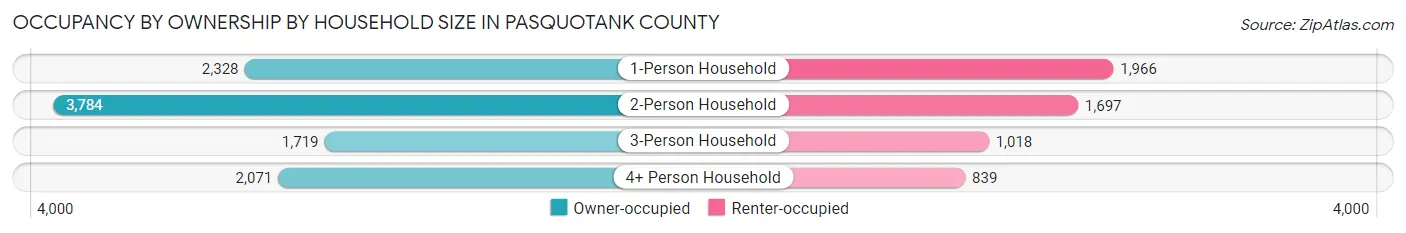
| Household Size | Owner-occupied | Renter-occupied |
| 1-Person Household | 2,328 (54.2%) | 1,966 (45.8%) |
| 2-Person Household | 3,784 (69.0%) | 1,697 (31.0%) |
| 3-Person Household | 1,719 (62.8%) | 1,018 (37.2%) |
| 4+ Person Household | 2,071 (71.2%) | 839 (28.8%) |
| Total Housing Units | 9,902 (64.2%) | 5,520 (35.8%) |
Occupancy by Educational Attainment in Pasquotank County
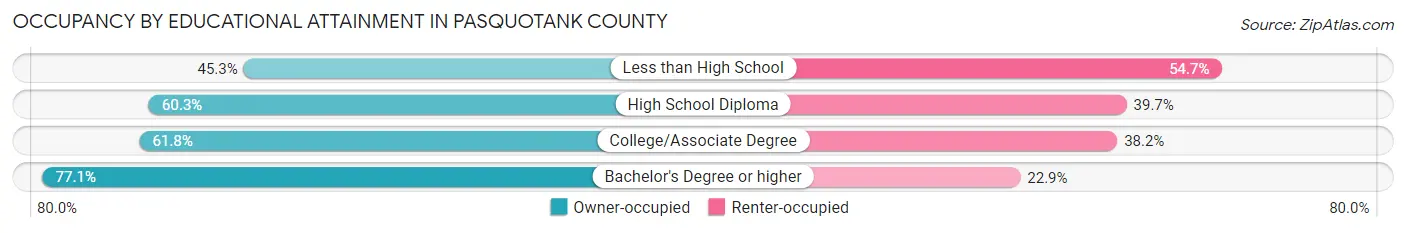
| Household Size | Owner-occupied | Renter-occupied |
| Less than High School | 541 (45.3%) | 654 (54.7%) |
| High School Diploma | 2,495 (60.3%) | 1,644 (39.7%) |
| College/Associate Degree | 3,679 (61.8%) | 2,277 (38.2%) |
| Bachelor's Degree or higher | 3,187 (77.1%) | 945 (22.9%) |
Occupancy by Age of Householder in Pasquotank County
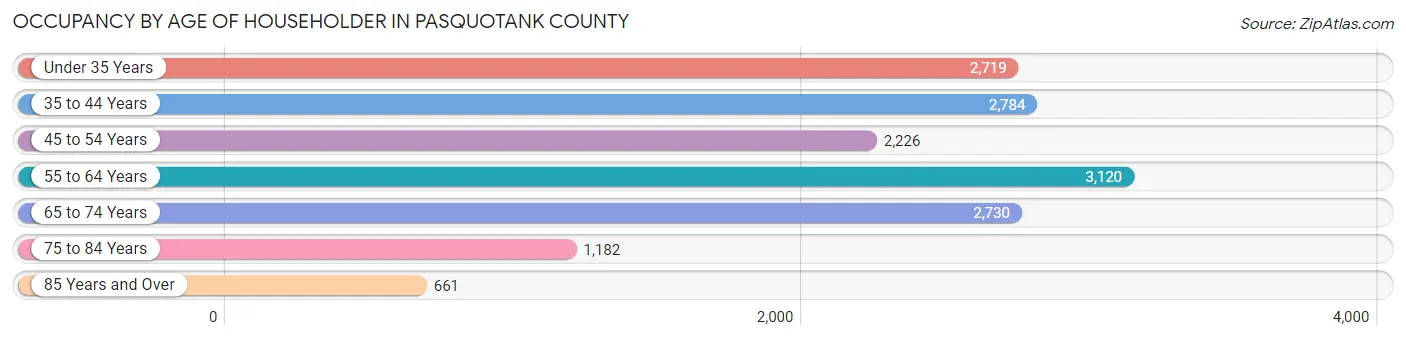
| Age Bracket | # Households | % Households |
| Under 35 Years | 2,719 | 17.6% |
| 35 to 44 Years | 2,784 | 18.0% |
| 45 to 54 Years | 2,226 | 14.4% |
| 55 to 64 Years | 3,120 | 20.2% |
| 65 to 74 Years | 2,730 | 17.7% |
| 75 to 84 Years | 1,182 | 7.7% |
| 85 Years and Over | 661 | 4.3% |
| Total | 15,422 | 100.0% |
Housing Finances in Pasquotank County
Median Income by Occupancy in Pasquotank County
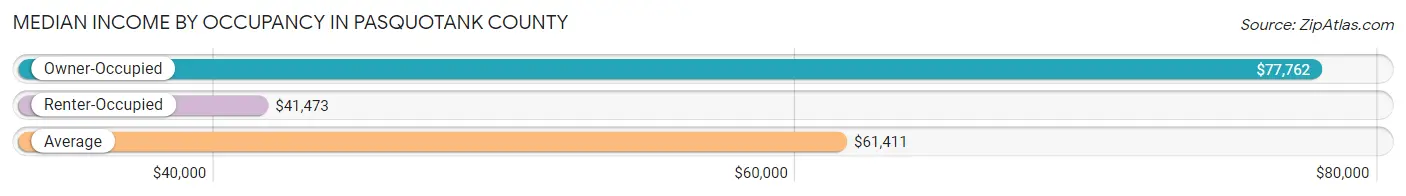
| Occupancy Type | # Households | Median Income |
| Owner-Occupied | 9,902 (64.2%) | $77,762 |
| Renter-Occupied | 5,520 (35.8%) | $41,473 |
| Average | 15,422 (100.0%) | $61,411 |
Occupancy by Householder Income Bracket in Pasquotank County
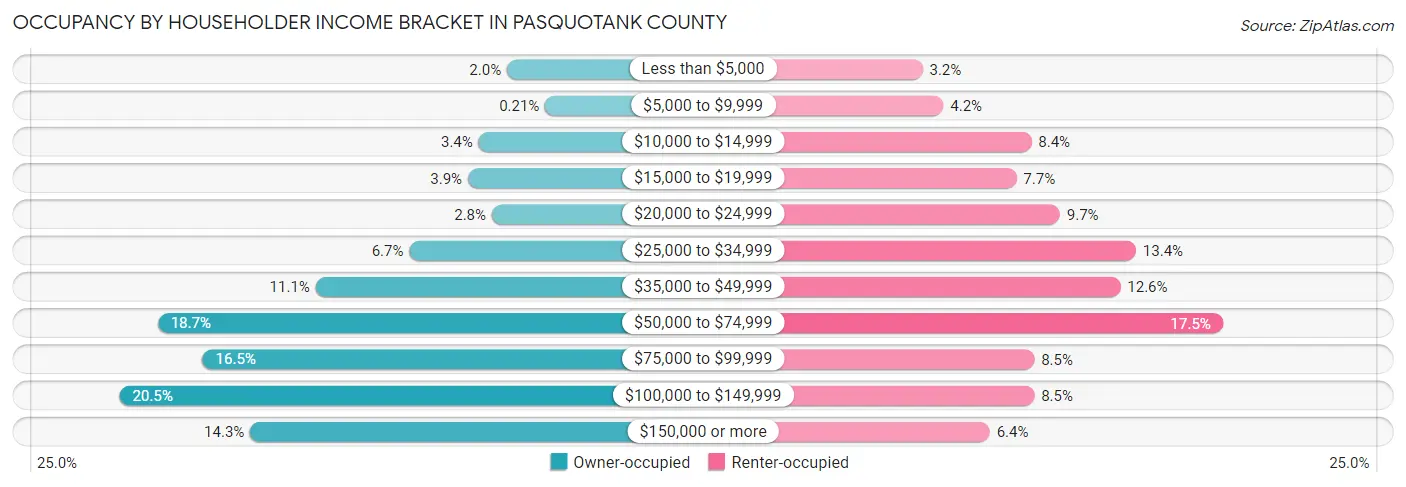
| Income Bracket | Owner-occupied | Renter-occupied |
| Less than $5,000 | 201 (2.0%) | 176 (3.2%) |
| $5,000 to $9,999 | 21 (0.2%) | 231 (4.2%) |
| $10,000 to $14,999 | 335 (3.4%) | 462 (8.4%) |
| $15,000 to $19,999 | 385 (3.9%) | 423 (7.7%) |
| $20,000 to $24,999 | 272 (2.8%) | 537 (9.7%) |
| $25,000 to $34,999 | 661 (6.7%) | 737 (13.4%) |
| $35,000 to $49,999 | 1,103 (11.1%) | 696 (12.6%) |
| $50,000 to $74,999 | 1,848 (18.7%) | 965 (17.5%) |
| $75,000 to $99,999 | 1,636 (16.5%) | 470 (8.5%) |
| $100,000 to $149,999 | 2,028 (20.5%) | 470 (8.5%) |
| $150,000 or more | 1,412 (14.3%) | 353 (6.4%) |
| Total | 9,902 (100.0%) | 5,520 (100.0%) |
Monthly Housing Cost Tiers in Pasquotank County
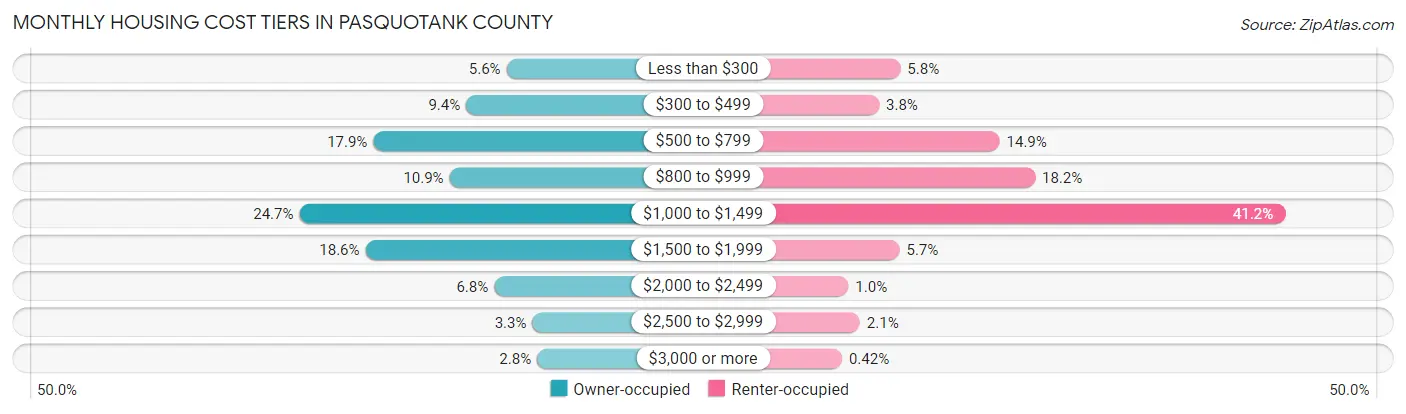
| Monthly Cost | Owner-occupied | Renter-occupied |
| Less than $300 | 558 (5.6%) | 320 (5.8%) |
| $300 to $499 | 927 (9.4%) | 212 (3.8%) |
| $500 to $799 | 1,773 (17.9%) | 824 (14.9%) |
| $800 to $999 | 1,078 (10.9%) | 1,004 (18.2%) |
| $1,000 to $1,499 | 2,447 (24.7%) | 2,275 (41.2%) |
| $1,500 to $1,999 | 1,845 (18.6%) | 316 (5.7%) |
| $2,000 to $2,499 | 671 (6.8%) | 56 (1.0%) |
| $2,500 to $2,999 | 323 (3.3%) | 114 (2.1%) |
| $3,000 or more | 280 (2.8%) | 23 (0.4%) |
| Total | 9,902 (100.0%) | 5,520 (100.0%) |
Physical Housing Characteristics in Pasquotank County
Housing Structures in Pasquotank County
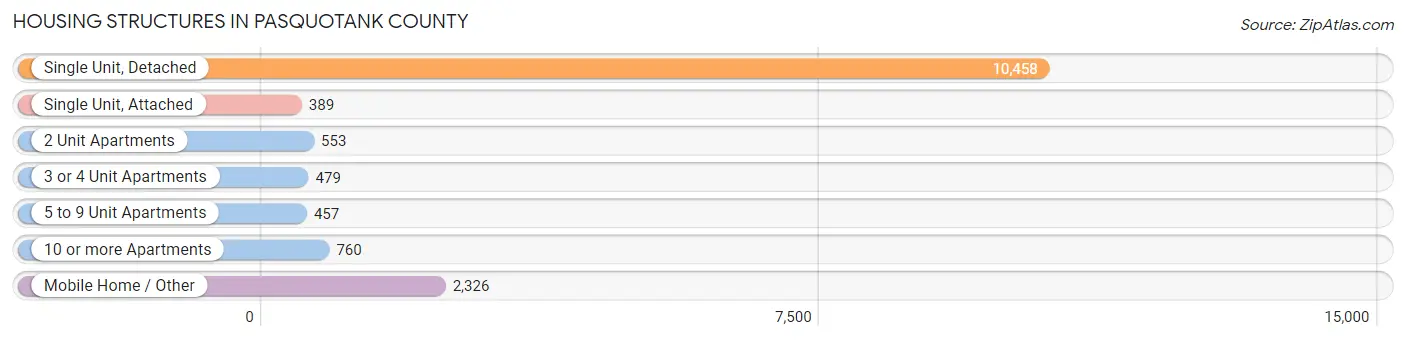
| Structure Type | # Housing Units | % Housing Units |
| Single Unit, Detached | 10,458 | 67.8% |
| Single Unit, Attached | 389 | 2.5% |
| 2 Unit Apartments | 553 | 3.6% |
| 3 or 4 Unit Apartments | 479 | 3.1% |
| 5 to 9 Unit Apartments | 457 | 3.0% |
| 10 or more Apartments | 760 | 4.9% |
| Mobile Home / Other | 2,326 | 15.1% |
| Total | 15,422 | 100.0% |
Housing Structures by Occupancy in Pasquotank County
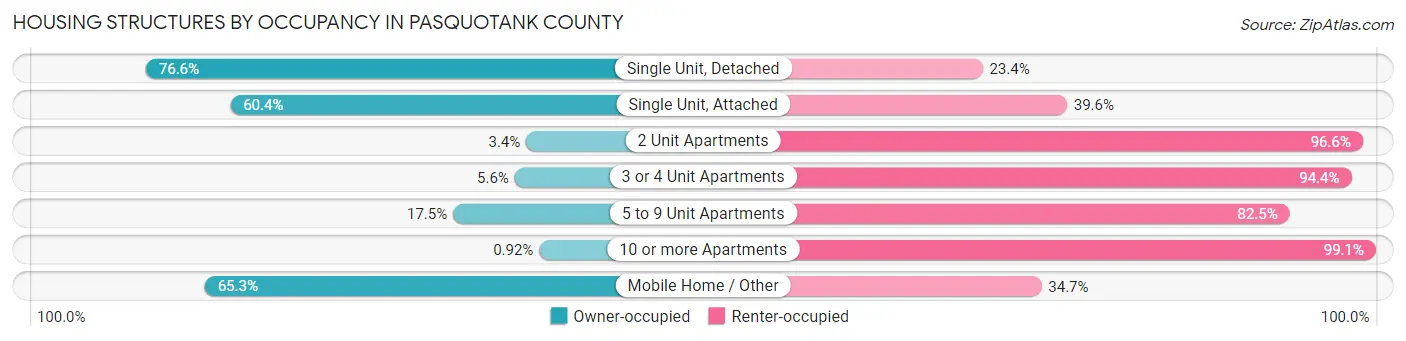
| Structure Type | Owner-occupied | Renter-occupied |
| Single Unit, Detached | 8,015 (76.6%) | 2,443 (23.4%) |
| Single Unit, Attached | 235 (60.4%) | 154 (39.6%) |
| 2 Unit Apartments | 19 (3.4%) | 534 (96.6%) |
| 3 or 4 Unit Apartments | 27 (5.6%) | 452 (94.4%) |
| 5 to 9 Unit Apartments | 80 (17.5%) | 377 (82.5%) |
| 10 or more Apartments | 7 (0.9%) | 753 (99.1%) |
| Mobile Home / Other | 1,519 (65.3%) | 807 (34.7%) |
| Total | 9,902 (64.2%) | 5,520 (35.8%) |
Housing Structures by Number of Rooms in Pasquotank County
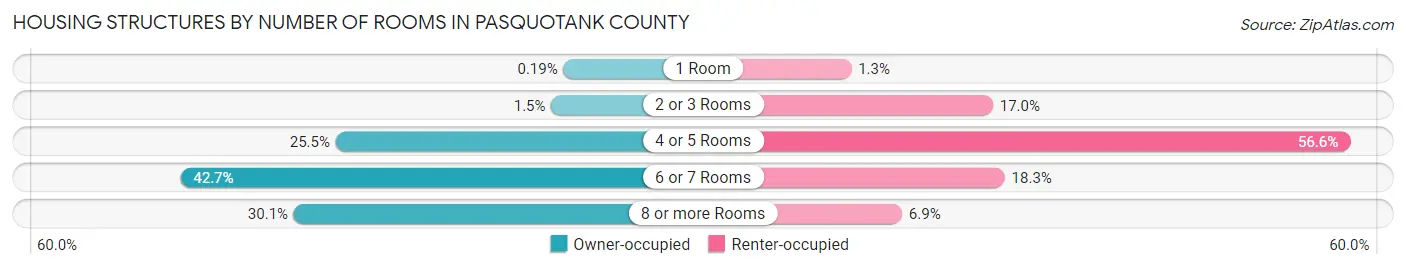
| Number of Rooms | Owner-occupied | Renter-occupied |
| 1 Room | 19 (0.2%) | 69 (1.3%) |
| 2 or 3 Rooms | 152 (1.5%) | 937 (17.0%) |
| 4 or 5 Rooms | 2,521 (25.5%) | 3,125 (56.6%) |
| 6 or 7 Rooms | 4,229 (42.7%) | 1,009 (18.3%) |
| 8 or more Rooms | 2,981 (30.1%) | 380 (6.9%) |
| Total | 9,902 (100.0%) | 5,520 (100.0%) |
Housing Structure by Heating Type in Pasquotank County
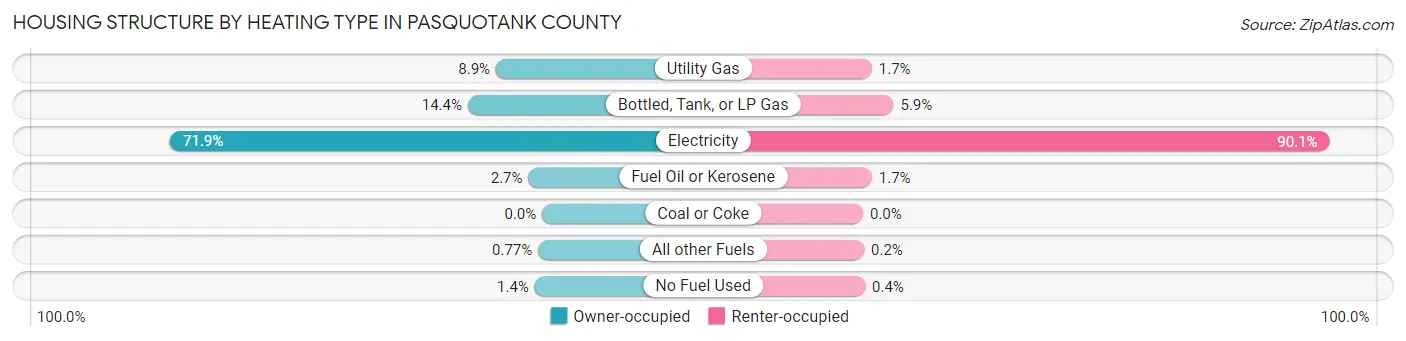
| Heating Type | Owner-occupied | Renter-occupied |
| Utility Gas | 883 (8.9%) | 94 (1.7%) |
| Bottled, Tank, or LP Gas | 1,421 (14.3%) | 325 (5.9%) |
| Electricity | 7,118 (71.9%) | 4,974 (90.1%) |
| Fuel Oil or Kerosene | 262 (2.6%) | 94 (1.7%) |
| Coal or Coke | 0 (0.0%) | 0 (0.0%) |
| All other Fuels | 76 (0.8%) | 11 (0.2%) |
| No Fuel Used | 142 (1.4%) | 22 (0.4%) |
| Total | 9,902 (100.0%) | 5,520 (100.0%) |
Household Vehicle Usage in Pasquotank County
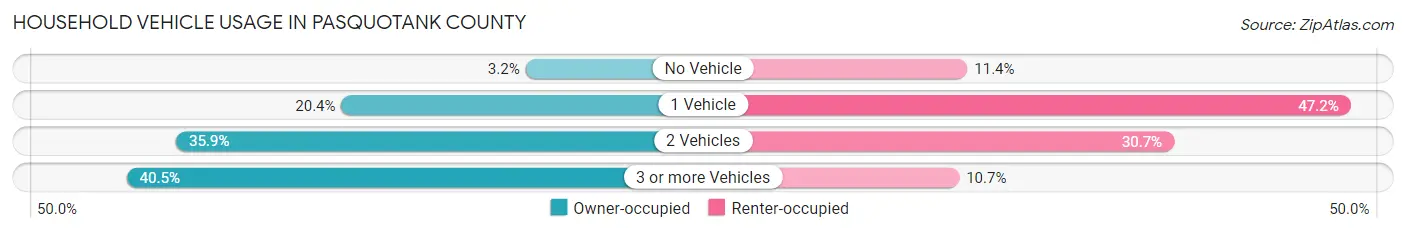
| Vehicles per Household | Owner-occupied | Renter-occupied |
| No Vehicle | 321 (3.2%) | 631 (11.4%) |
| 1 Vehicle | 2,023 (20.4%) | 2,605 (47.2%) |
| 2 Vehicles | 3,551 (35.9%) | 1,695 (30.7%) |
| 3 or more Vehicles | 4,007 (40.5%) | 589 (10.7%) |
| Total | 9,902 (100.0%) | 5,520 (100.0%) |
Real Estate & Mortgages in Pasquotank County
Real Estate and Mortgage Overview in Pasquotank County
| Characteristic | Without Mortgage | With Mortgage |
| Housing Units | 3,579 | 6,323 |
| Median Property Value | $184,000 | $206,900 |
| Median Household Income | $51,917 | $1,050 |
| Monthly Housing Costs | $548 | $280 |
| Real Estate Taxes | $1,364 | $206 |
Property Value by Mortgage Status in Pasquotank County
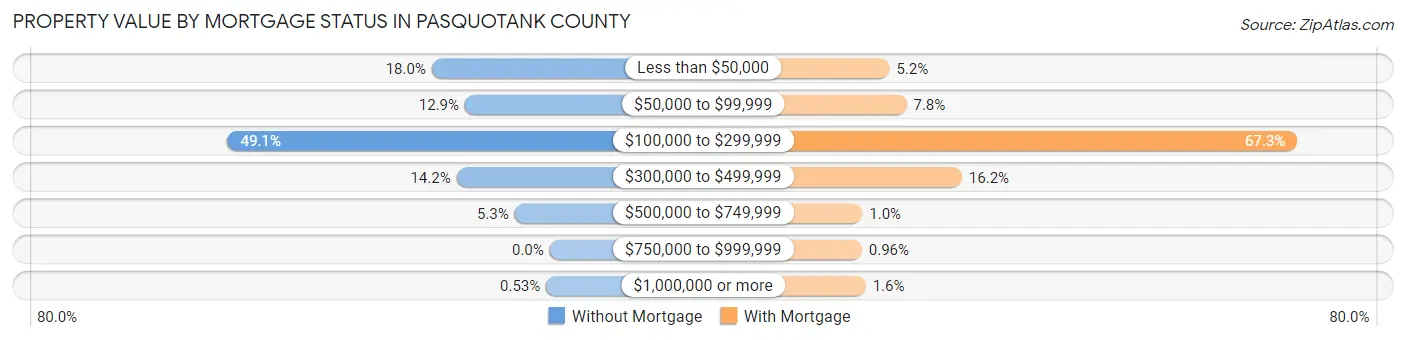
| Property Value | Without Mortgage | With Mortgage |
| Less than $50,000 | 643 (18.0%) | 327 (5.2%) |
| $50,000 to $99,999 | 462 (12.9%) | 491 (7.8%) |
| $100,000 to $299,999 | 1,756 (49.1%) | 4,255 (67.3%) |
| $300,000 to $499,999 | 508 (14.2%) | 1,025 (16.2%) |
| $500,000 to $749,999 | 191 (5.3%) | 66 (1.0%) |
| $750,000 to $999,999 | 0 (0.0%) | 61 (1.0%) |
| $1,000,000 or more | 19 (0.5%) | 98 (1.5%) |
| Total | 3,579 (100.0%) | 6,323 (100.0%) |
Household Income by Mortgage Status in Pasquotank County
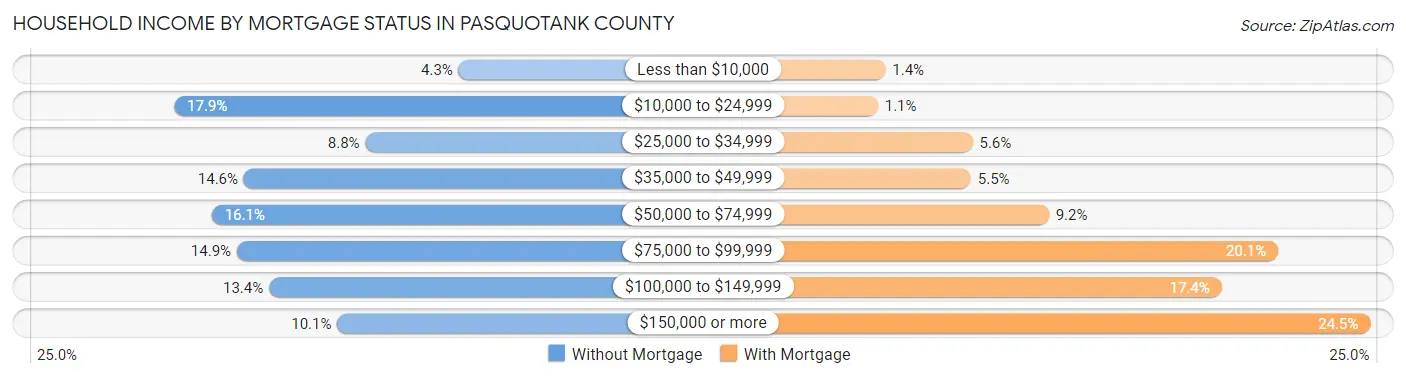
| Household Income | Without Mortgage | With Mortgage |
| Less than $10,000 | 155 (4.3%) | 90 (1.4%) |
| $10,000 to $24,999 | 640 (17.9%) | 67 (1.1%) |
| $25,000 to $34,999 | 314 (8.8%) | 352 (5.6%) |
| $35,000 to $49,999 | 521 (14.6%) | 347 (5.5%) |
| $50,000 to $74,999 | 576 (16.1%) | 582 (9.2%) |
| $75,000 to $99,999 | 533 (14.9%) | 1,272 (20.1%) |
| $100,000 to $149,999 | 478 (13.4%) | 1,103 (17.4%) |
| $150,000 or more | 362 (10.1%) | 1,550 (24.5%) |
| Total | 3,579 (100.0%) | 6,323 (100.0%) |
Property Value to Household Income Ratio in Pasquotank County
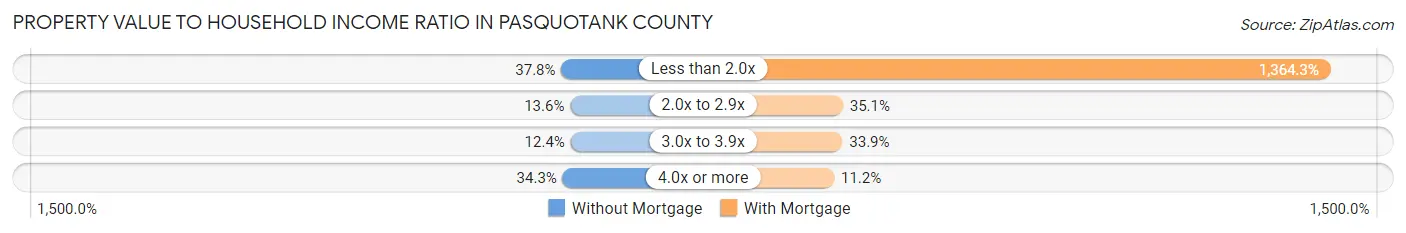
| Value-to-Income Ratio | Without Mortgage | With Mortgage |
| Less than 2.0x | 1,352 (37.8%) | 86,267 (1,364.3%) |
| 2.0x to 2.9x | 485 (13.6%) | 2,222 (35.1%) |
| 3.0x to 3.9x | 444 (12.4%) | 2,146 (33.9%) |
| 4.0x or more | 1,228 (34.3%) | 711 (11.2%) |
| Total | 3,579 (100.0%) | 6,323 (100.0%) |
Real Estate Taxes by Mortgage Status in Pasquotank County
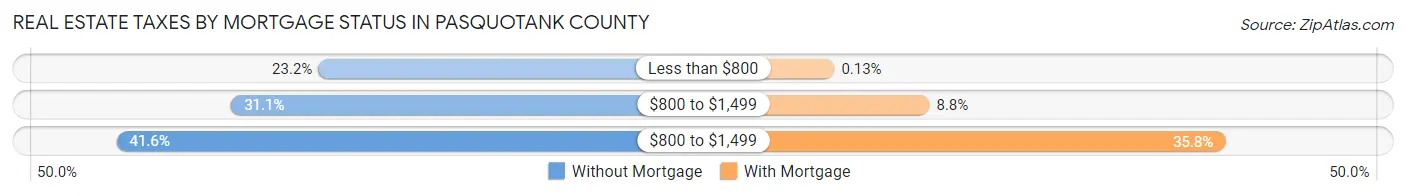
| Property Taxes | Without Mortgage | With Mortgage |
| Less than $800 | 830 (23.2%) | 8 (0.1%) |
| $800 to $1,499 | 1,114 (31.1%) | 557 (8.8%) |
| $800 to $1,499 | 1,489 (41.6%) | 2,264 (35.8%) |
| Total | 3,579 (100.0%) | 6,323 (100.0%) |
Health & Disability in Pasquotank County
Health Insurance Coverage by Age in Pasquotank County
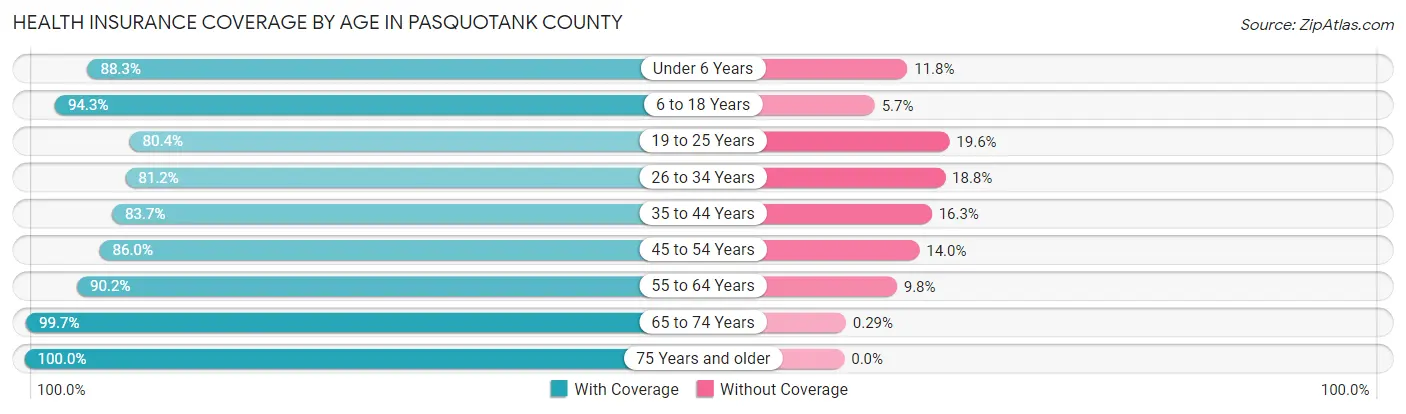
| Age Bracket | With Coverage | Without Coverage |
| Under 6 Years | 2,509 (88.2%) | 334 (11.7%) |
| 6 to 18 Years | 6,234 (94.3%) | 375 (5.7%) |
| 19 to 25 Years | 2,531 (80.4%) | 617 (19.6%) |
| 26 to 34 Years | 4,069 (81.2%) | 942 (18.8%) |
| 35 to 44 Years | 3,938 (83.7%) | 767 (16.3%) |
| 45 to 54 Years | 3,628 (86.0%) | 590 (14.0%) |
| 55 to 64 Years | 4,848 (90.2%) | 526 (9.8%) |
| 65 to 74 Years | 4,115 (99.7%) | 12 (0.3%) |
| 75 Years and older | 2,752 (100.0%) | 0 (0.0%) |
| Total | 34,624 (89.3%) | 4,163 (10.7%) |
Health Insurance Coverage by Citizenship Status in Pasquotank County
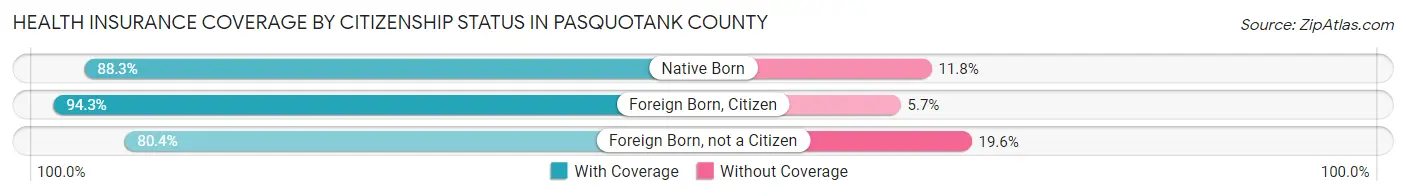
| Citizenship Status | With Coverage | Without Coverage |
| Native Born | 2,509 (88.2%) | 334 (11.7%) |
| Foreign Born, Citizen | 6,234 (94.3%) | 375 (5.7%) |
| Foreign Born, not a Citizen | 2,531 (80.4%) | 617 (19.6%) |
Health Insurance Coverage by Household Income in Pasquotank County
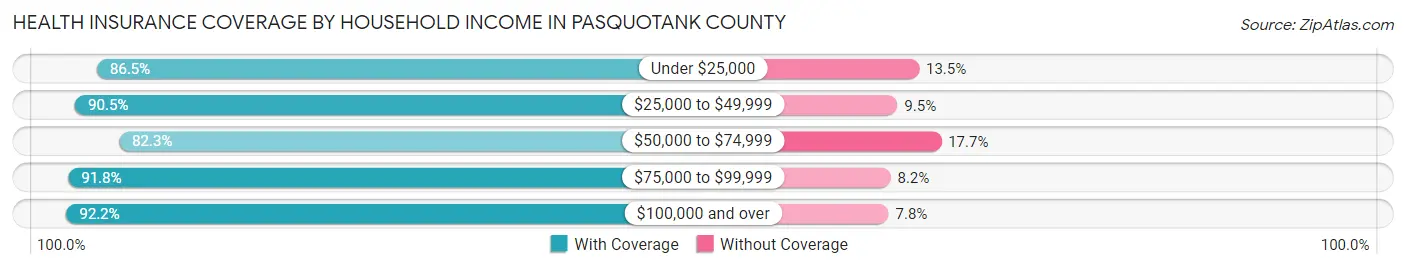
| Household Income | With Coverage | Without Coverage |
| Under $25,000 | 4,222 (86.5%) | 661 (13.5%) |
| $25,000 to $49,999 | 6,409 (90.5%) | 671 (9.5%) |
| $50,000 to $74,999 | 6,204 (82.3%) | 1,333 (17.7%) |
| $75,000 to $99,999 | 4,847 (91.8%) | 433 (8.2%) |
| $100,000 and over | 11,708 (92.2%) | 995 (7.8%) |
Public vs Private Health Insurance Coverage by Age in Pasquotank County
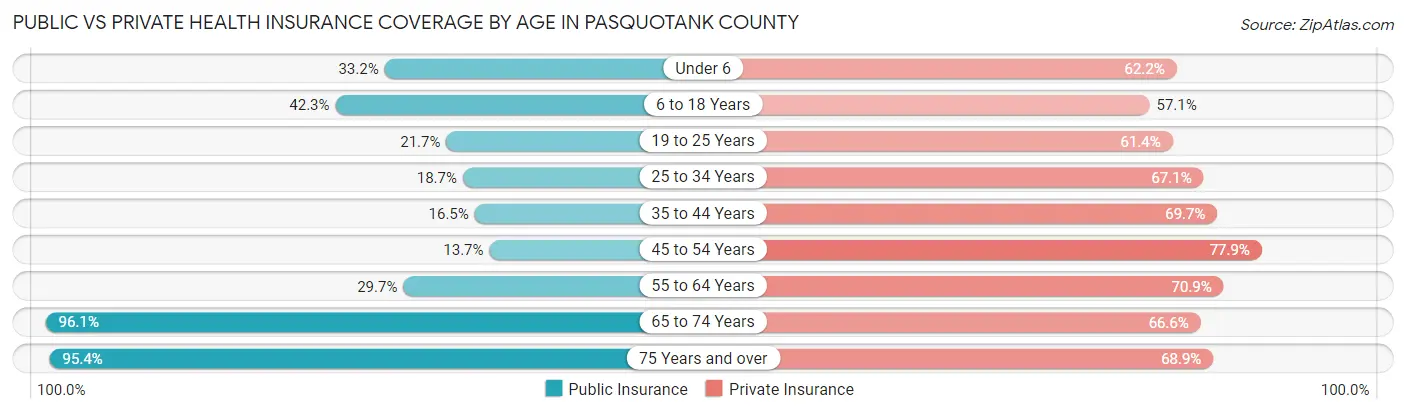
| Age Bracket | Public Insurance | Private Insurance |
| Under 6 | 944 (33.2%) | 1,767 (62.2%) |
| 6 to 18 Years | 2,797 (42.3%) | 3,775 (57.1%) |
| 19 to 25 Years | 684 (21.7%) | 1,933 (61.4%) |
| 25 to 34 Years | 935 (18.7%) | 3,364 (67.1%) |
| 35 to 44 Years | 775 (16.5%) | 3,279 (69.7%) |
| 45 to 54 Years | 579 (13.7%) | 3,287 (77.9%) |
| 55 to 64 Years | 1,597 (29.7%) | 3,808 (70.9%) |
| 65 to 74 Years | 3,966 (96.1%) | 2,749 (66.6%) |
| 75 Years and over | 2,625 (95.4%) | 1,897 (68.9%) |
| Total | 14,902 (38.4%) | 25,859 (66.7%) |
Disability Status by Sex by Age in Pasquotank County
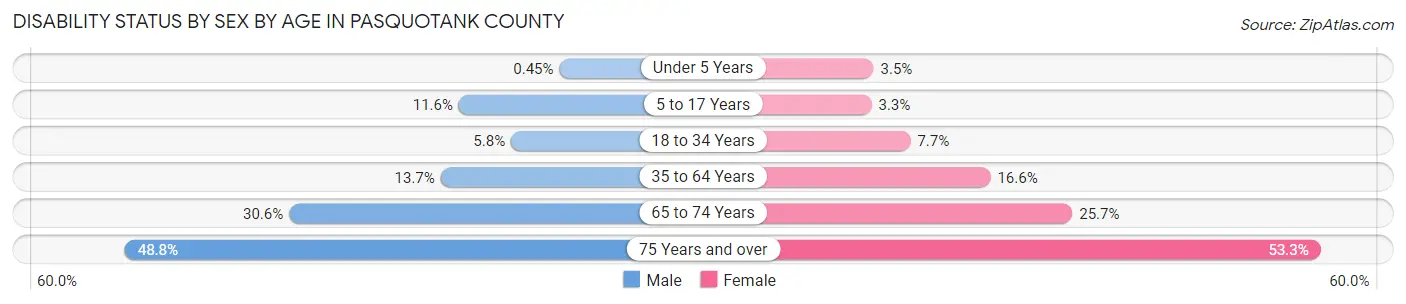
| Age Bracket | Male | Female |
| Under 5 Years | 6 (0.4%) | 36 (3.5%) |
| 5 to 17 Years | 384 (11.6%) | 102 (3.3%) |
| 18 to 34 Years | 247 (5.8%) | 355 (7.6%) |
| 35 to 64 Years | 948 (13.7%) | 1,219 (16.6%) |
| 65 to 74 Years | 567 (30.5%) | 583 (25.7%) |
| 75 Years and over | 526 (48.8%) | 893 (53.3%) |
Disability Class by Sex by Age in Pasquotank County
Disability Class: Hearing Difficulty
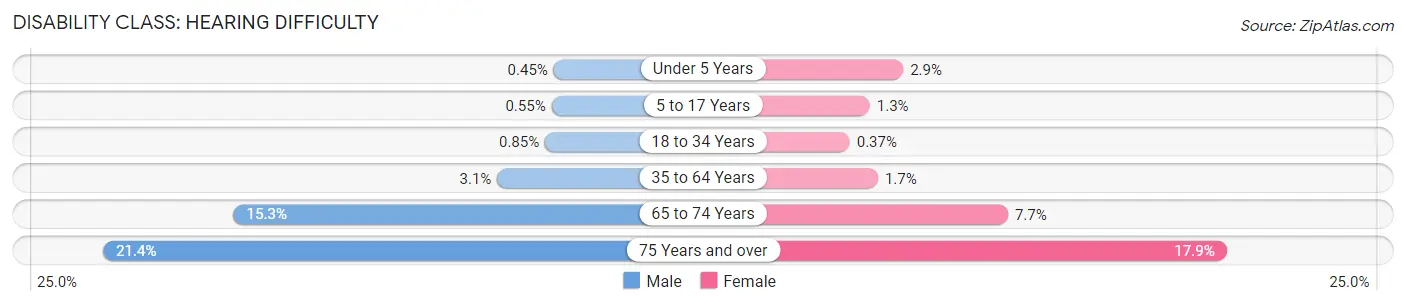
| Age Bracket | Male | Female |
| Under 5 Years | 6 (0.4%) | 29 (2.9%) |
| 5 to 17 Years | 18 (0.5%) | 40 (1.3%) |
| 18 to 34 Years | 36 (0.9%) | 17 (0.4%) |
| 35 to 64 Years | 213 (3.1%) | 124 (1.7%) |
| 65 to 74 Years | 284 (15.3%) | 175 (7.7%) |
| 75 Years and over | 230 (21.4%) | 299 (17.8%) |
Disability Class: Vision Difficulty
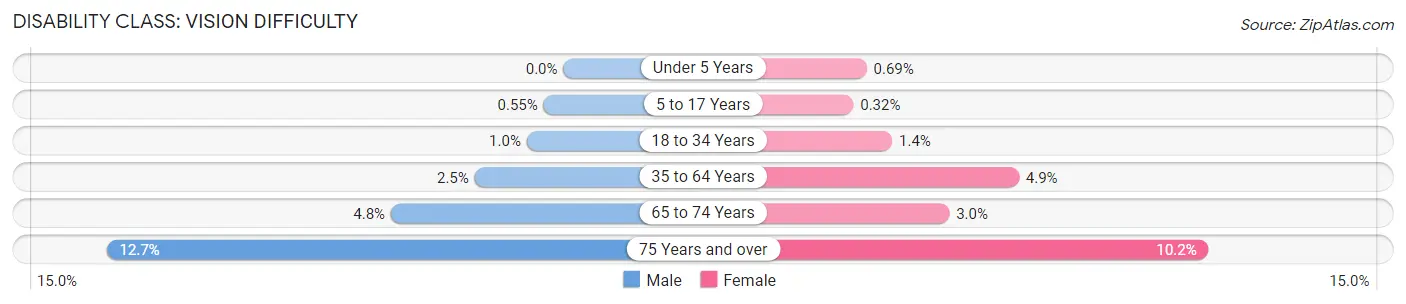
| Age Bracket | Male | Female |
| Under 5 Years | 0 (0.0%) | 7 (0.7%) |
| 5 to 17 Years | 18 (0.5%) | 10 (0.3%) |
| 18 to 34 Years | 43 (1.0%) | 65 (1.4%) |
| 35 to 64 Years | 171 (2.5%) | 363 (4.9%) |
| 65 to 74 Years | 89 (4.8%) | 68 (3.0%) |
| 75 Years and over | 137 (12.7%) | 171 (10.2%) |
Disability Class: Cognitive Difficulty
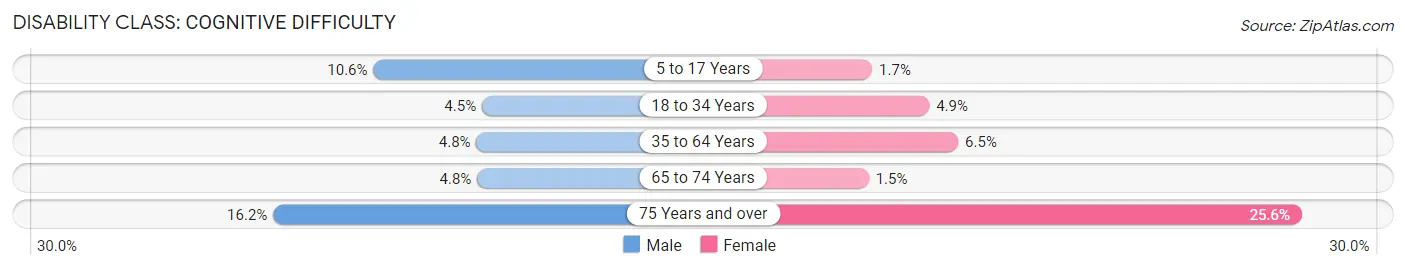
| Age Bracket | Male | Female |
| 5 to 17 Years | 349 (10.6%) | 52 (1.7%) |
| 18 to 34 Years | 192 (4.5%) | 226 (4.9%) |
| 35 to 64 Years | 336 (4.8%) | 477 (6.5%) |
| 65 to 74 Years | 89 (4.8%) | 34 (1.5%) |
| 75 Years and over | 174 (16.2%) | 429 (25.6%) |
Disability Class: Ambulatory Difficulty
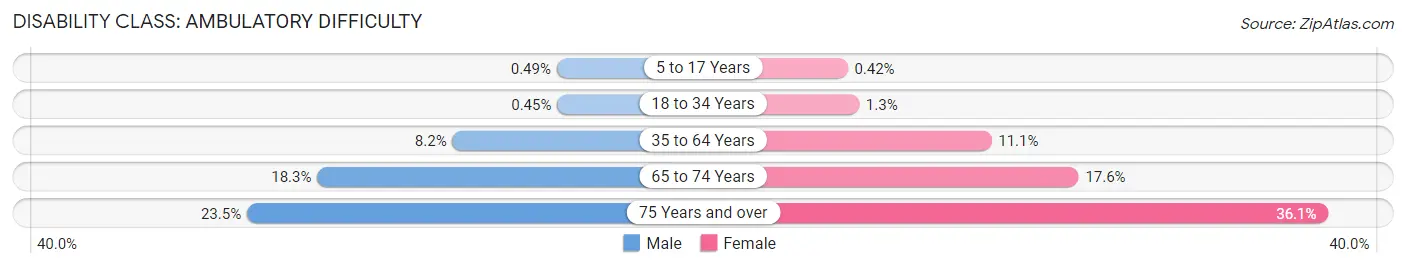
| Age Bracket | Male | Female |
| 5 to 17 Years | 16 (0.5%) | 13 (0.4%) |
| 18 to 34 Years | 19 (0.4%) | 59 (1.3%) |
| 35 to 64 Years | 571 (8.2%) | 817 (11.1%) |
| 65 to 74 Years | 339 (18.3%) | 399 (17.6%) |
| 75 Years and over | 253 (23.5%) | 605 (36.1%) |
Disability Class: Self-Care Difficulty
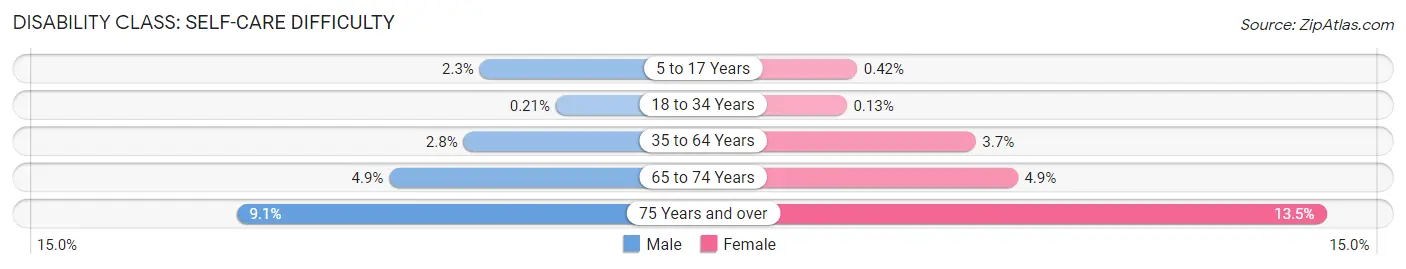
| Age Bracket | Male | Female |
| 5 to 17 Years | 77 (2.3%) | 13 (0.4%) |
| 18 to 34 Years | 9 (0.2%) | 6 (0.1%) |
| 35 to 64 Years | 193 (2.8%) | 274 (3.7%) |
| 65 to 74 Years | 90 (4.9%) | 111 (4.9%) |
| 75 Years and over | 98 (9.1%) | 226 (13.5%) |
Technology Access in Pasquotank County
Computing Device Access in Pasquotank County
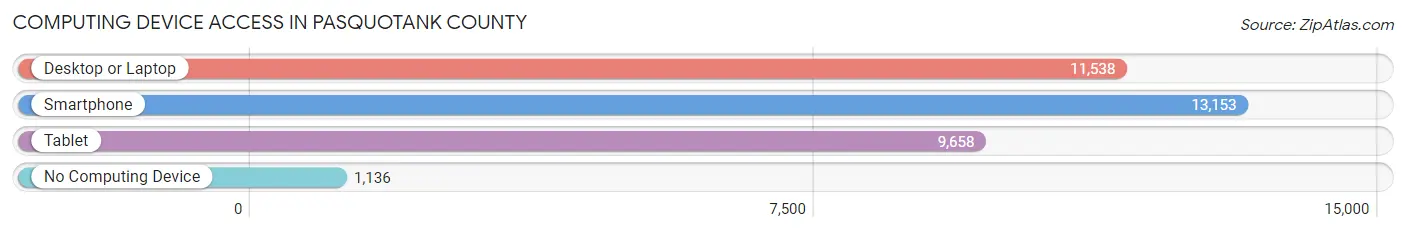
| Device Type | # Households | % Households |
| Desktop or Laptop | 11,538 | 74.8% |
| Smartphone | 13,153 | 85.3% |
| Tablet | 9,658 | 62.6% |
| No Computing Device | 1,136 | 7.4% |
| Total | 15,422 | 100.0% |
Internet Access in Pasquotank County
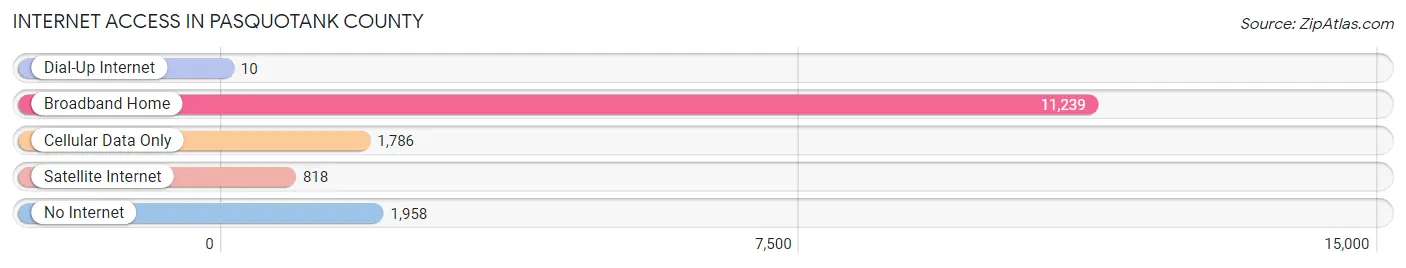
| Internet Type | # Households | % Households |
| Dial-Up Internet | 10 | 0.1% |
| Broadband Home | 11,239 | 72.9% |
| Cellular Data Only | 1,786 | 11.6% |
| Satellite Internet | 818 | 5.3% |
| No Internet | 1,958 | 12.7% |
| Total | 15,422 | 100.0% |
Pasquotank County Summary
Pasquotank County is located in the northeastern corner of North Carolina, and is part of the Albemarle Sound region. It is bordered by Camden County to the north, Perquimans County to the south, and the state of Virginia to the east. The county seat is Elizabeth City, and the county is home to a population of approximately 40,000 people.
History
Pasquotank County was formed in 1668 from parts of Albemarle County. It was named after the Pasquotank River, which runs through the county. The county was originally inhabited by the Algonquian-speaking Yeopim Indians, who were later displaced by English settlers. The county was an important center of trade and commerce in the colonial period, and was home to several prominent families, including the Whedbees, the Byrds, and the Taylors.
During the American Revolution, the county was the site of several battles, including the Battle of Elizabeth City in 1781. After the war, the county experienced a period of economic growth, with the development of the lumber and fishing industries. In the late 19th century, the county was home to several large naval bases, including the Elizabeth City Naval Air Station.
Geography
Pasquotank County covers an area of approximately 437 square miles. The terrain is generally flat, with some rolling hills in the western part of the county. The Pasquotank River runs through the county, and is fed by several smaller rivers and creeks. The county is home to several large lakes, including Lake Drummond and Lake Mattamuskeet.
The climate of Pasquotank County is humid subtropical, with hot, humid summers and mild winters. The average annual temperature is around 60 degrees Fahrenheit, and the average annual precipitation is around 45 inches.
Economy
The economy of Pasquotank County is largely based on agriculture, manufacturing, and tourism. The county is home to several large agricultural operations, including hog farms, poultry farms, and vegetable farms. The county is also home to several large manufacturing companies, including Perdue Farms, Inc., and the Elizabeth City Shipyard.
Tourism is an important part of the county's economy, with visitors coming to enjoy the county's beaches, fishing, and other outdoor activities. The county is also home to several historic sites, including the Elizabeth City Historic District and the Dismal Swamp Canal.
Demographics
As of the 2010 census, Pasquotank County had a population of 39,456 people. The racial makeup of the county was 68.3% White, 24.2% African American, 0.5% Native American, 2.2% Asian, and 4.8% from other races. The median household income was $41,945, and the median family income was $50,945.
The largest employers in the county are the Elizabeth City-Pasquotank Public Schools, Perdue Farms, Inc., and the Elizabeth City Shipyard. The county is served by several major highways, including US Highway 17, US Highway 158, and NC Highway 168. The county is also served by the Elizabeth City Regional Airport.
Common Questions
What is Per Capita Income in Pasquotank County?
Per Capita income in Pasquotank County is $31,762.
What is the Median Family Income in Pasquotank County?
Median Family Income in Pasquotank County is $77,228.
What is the Median Household income in Pasquotank County?
Median Household Income in Pasquotank County is $61,411.
What is Income or Wage Gap in Pasquotank County?
Income or Wage Gap in Pasquotank County is 28.8%.
Women in Pasquotank County earn 71.2 cents for every dollar earned by a man.
What is Family Income Deficit in Pasquotank County?
Family Income Deficit in Pasquotank County is $8,476.
Families that are below poverty line in Pasquotank County earn $8,476 less on average than the poverty threshold level.
What is Inequality or Gini Index in Pasquotank County?
Inequality or Gini Index in Pasquotank County is 0.44.
What is the Total Population of Pasquotank County?
Total Population of Pasquotank County is 40,454.
What is the Total Male Population of Pasquotank County?
Total Male Population of Pasquotank County is 20,076.
What is the Total Female Population of Pasquotank County?
Total Female Population of Pasquotank County is 20,378.
What is the Ratio of Males per 100 Females in Pasquotank County?
There are 98.52 Males per 100 Females in Pasquotank County.
What is the Ratio of Females per 100 Males in Pasquotank County?
There are 101.50 Females per 100 Males in Pasquotank County.
What is the Median Population Age in Pasquotank County?
Median Population Age in Pasquotank County is 39.0 Years.
What is the Average Family Size in Pasquotank County
Average Family Size in Pasquotank County is 3.0 People.
What is the Average Household Size in Pasquotank County
Average Household Size in Pasquotank County is 2.5 People.
How Large is the Labor Force in Pasquotank County?
There are 19,620 People in the Labor Forcein in Pasquotank County.
What is the Percentage of People in the Labor Force in Pasquotank County?
60.3% of People are in the Labor Force in Pasquotank County.
What is the Unemployment Rate in Pasquotank County?
Unemployment Rate in Pasquotank County is 5.8%.