Pamlico County, NC Map & Demographics
Pamlico County Map
Pamlico County Overview
$32,677
PER CAPITA INCOME
$78,649
AVG FAMILY INCOME
$55,867
AVG HOUSEHOLD INCOME
33.0%
WAGE / INCOME GAP [ % ]
67.0¢/ $1
WAGE / INCOME GAP [ $ ]
0.48
INEQUALITY / GINI INDEX
12,317
TOTAL POPULATION
6,337
MALE POPULATION
5,980
FEMALE POPULATION
105.97
MALES / 100 FEMALES
94.37
FEMALES / 100 MALES
54.2
MEDIAN AGE
2.8
AVG FAMILY SIZE
2.2
AVG HOUSEHOLD SIZE
4,713
LABOR FORCE [ PEOPLE ]
43.4%
PERCENT IN LABOR FORCE
4.6%
UNEMPLOYMENT RATE
Pamlico County Area Codes
Income in Pamlico County
Income Overview in Pamlico County
Per Capita Income in Pamlico County is $32,677, while median incomes of families and households are $78,649 and $55,867 respectively.
| Characteristic | Number | Measure |
| Per Capita Income | 12,317 | $32,677 |
| Median Family Income | 3,224 | $78,649 |
| Mean Family Income | 3,224 | $100,585 |
| Median Household Income | 5,130 | $55,867 |
| Mean Household Income | 5,130 | $78,395 |
| Income Deficit | 3,224 | $0 |
| Wage / Income Gap (%) | 12,317 | 32.99% |
| Wage / Income Gap ($) | 12,317 | 67.01¢ per $1 |
| Gini / Inequality Index | 12,317 | 0.48 |
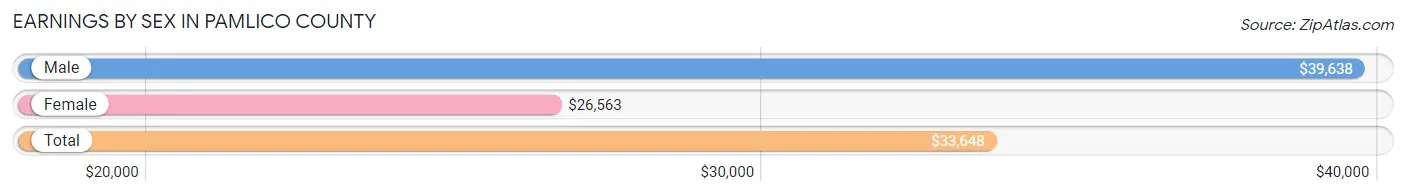
Earnings by Sex in Pamlico County
Average Earnings in Pamlico County are $33,648, $39,638 for men and $26,563 for women, a difference of 33.0%.
| Sex | Number | Average Earnings |
| Male | 2,462 (50.3%) | $39,638 |
| Female | 2,431 (49.7%) | $26,563 |
| Total | 4,893 (100.0%) | $33,648 |
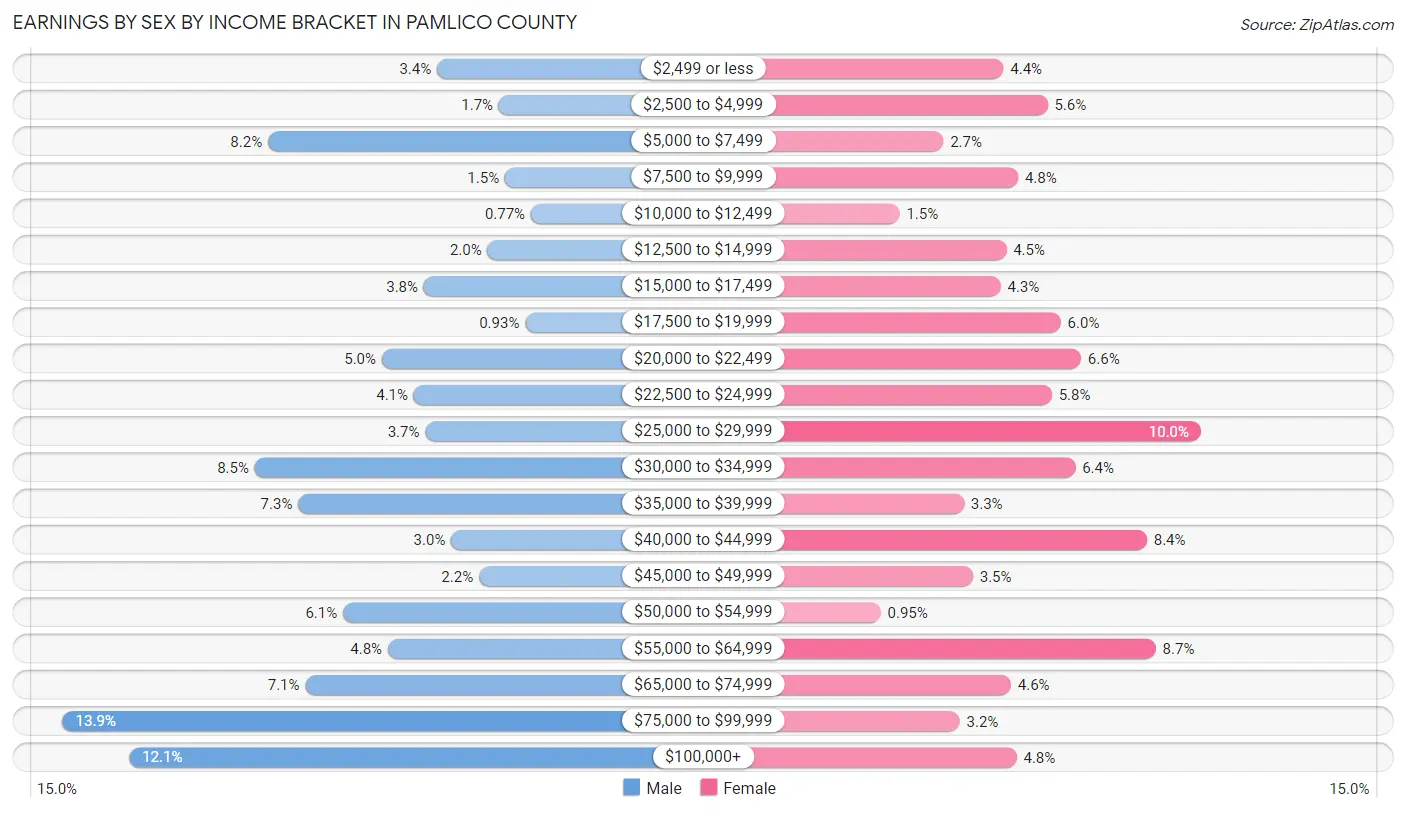
Earnings by Sex by Income Bracket in Pamlico County
The most common earnings brackets in Pamlico County are $75,000 to $99,999 for men (343 | 13.9%) and $25,000 to $29,999 for women (242 | 10.0%).
| Income | Male | Female |
| $2,499 or less | 84 (3.4%) | 107 (4.4%) |
| $2,500 to $4,999 | 41 (1.7%) | 137 (5.6%) |
| $5,000 to $7,499 | 201 (8.2%) | 66 (2.7%) |
| $7,500 to $9,999 | 37 (1.5%) | 117 (4.8%) |
| $10,000 to $12,499 | 19 (0.8%) | 36 (1.5%) |
| $12,500 to $14,999 | 49 (2.0%) | 109 (4.5%) |
| $15,000 to $17,499 | 93 (3.8%) | 105 (4.3%) |
| $17,500 to $19,999 | 23 (0.9%) | 146 (6.0%) |
| $20,000 to $22,499 | 122 (5.0%) | 160 (6.6%) |
| $22,500 to $24,999 | 100 (4.1%) | 140 (5.8%) |
| $25,000 to $29,999 | 92 (3.7%) | 242 (10.0%) |
| $30,000 to $34,999 | 210 (8.5%) | 156 (6.4%) |
| $35,000 to $39,999 | 180 (7.3%) | 80 (3.3%) |
| $40,000 to $44,999 | 74 (3.0%) | 205 (8.4%) |
| $45,000 to $49,999 | 55 (2.2%) | 86 (3.5%) |
| $50,000 to $54,999 | 149 (6.0%) | 23 (0.9%) |
| $55,000 to $64,999 | 118 (4.8%) | 211 (8.7%) |
| $65,000 to $74,999 | 175 (7.1%) | 112 (4.6%) |
| $75,000 to $99,999 | 343 (13.9%) | 77 (3.2%) |
| $100,000+ | 297 (12.1%) | 116 (4.8%) |
| Total | 2,462 (100.0%) | 2,431 (100.0%) |
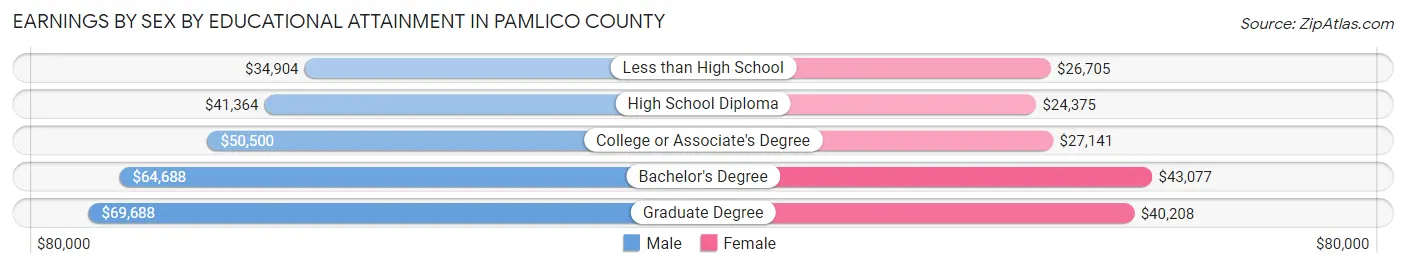
Earnings by Sex by Educational Attainment in Pamlico County
Average earnings in Pamlico County are $47,399 for men and $27,960 for women, a difference of 41.0%. Men with an educational attainment of graduate degree enjoy the highest average annual earnings of $69,688, while those with less than high school education earn the least with $34,904. Women with an educational attainment of bachelor's degree earn the most with the average annual earnings of $43,077, while those with high school diploma education have the smallest earnings of $24,375.
| Educational Attainment | Male Income | Female Income |
| Less than High School | $34,904 | $26,705 |
| High School Diploma | $41,364 | $24,375 |
| College or Associate's Degree | $50,500 | $27,141 |
| Bachelor's Degree | $64,688 | $43,077 |
| Graduate Degree | $69,688 | $40,208 |
| Total | $47,399 | $27,960 |
Family Income in Pamlico County
Family Income Brackets in Pamlico County
According to the Pamlico County family income data, there are 703 families falling into the $100,000 to $149,999 income range, which is the most common income bracket and makes up 21.8% of all families. Conversely, the $10,000 to $14,999 income bracket is the least frequent group with only 42 families (1.3%) belonging to this category.
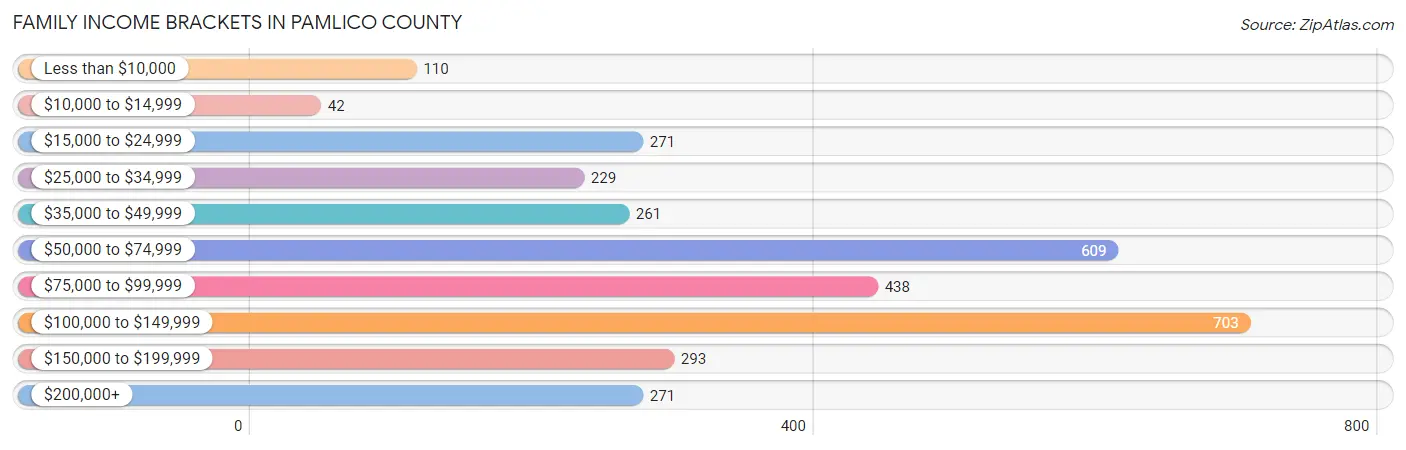
| Income Bracket | # Families | % Families |
| Less than $10,000 | 110 | 3.4% |
| $10,000 to $14,999 | 42 | 1.3% |
| $15,000 to $24,999 | 271 | 8.4% |
| $25,000 to $34,999 | 229 | 7.1% |
| $35,000 to $49,999 | 261 | 8.1% |
| $50,000 to $74,999 | 609 | 18.9% |
| $75,000 to $99,999 | 438 | 13.6% |
| $100,000 to $149,999 | 703 | 21.8% |
| $150,000 to $199,999 | 293 | 9.1% |
| $200,000+ | 271 | 8.4% |
Family Income by Famaliy Size in Pamlico County
5-person families (120 | 3.7%) account for the highest median family income in Pamlico County with $120,658 per family, while 2-person families (2,034 | 63.1%) have the highest median income of $38,264 per family member.
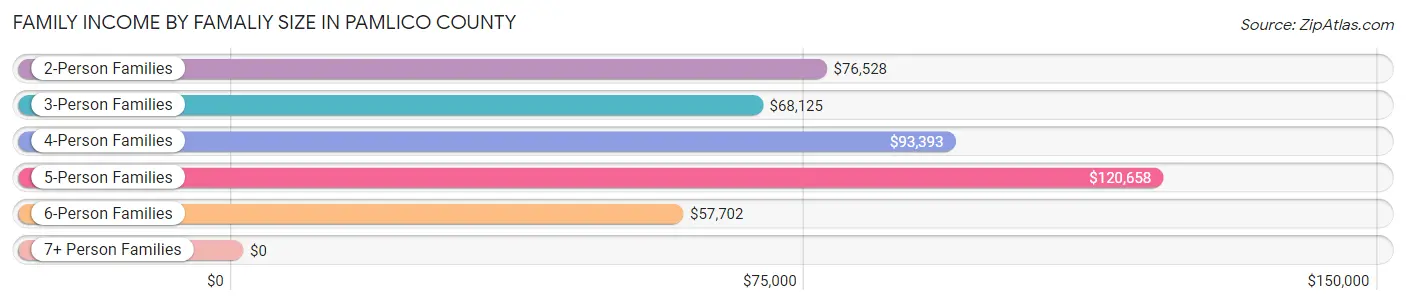
| Income Bracket | # Families | Median Income |
| 2-Person Families | 2,034 (63.1%) | $76,528 |
| 3-Person Families | 566 (17.6%) | $68,125 |
| 4-Person Families | 438 (13.6%) | $93,393 |
| 5-Person Families | 120 (3.7%) | $120,658 |
| 6-Person Families | 59 (1.8%) | $57,702 |
| 7+ Person Families | 7 (0.2%) | $0 |
| Total | 3,224 (100.0%) | $78,649 |
Family Income by Number of Earners in Pamlico County
The median family income in Pamlico County is $78,649, with families comprising 3+ earners (243) having the highest median family income of $124,240, while families with no earners (1,089) have the lowest median family income of $57,951, accounting for 7.5% and 33.8% of families, respectively.
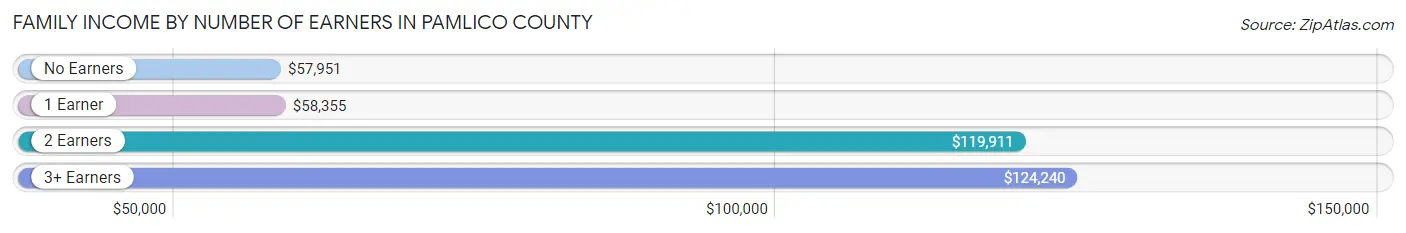
| Number of Earners | # Families | Median Income |
| No Earners | 1,089 (33.8%) | $57,951 |
| 1 Earner | 1,035 (32.1%) | $58,355 |
| 2 Earners | 857 (26.6%) | $119,911 |
| 3+ Earners | 243 (7.5%) | $124,240 |
| Total | 3,224 (100.0%) | $78,649 |
Household Income in Pamlico County
Household Income Brackets in Pamlico County
With 887 households falling in the category, the $50,000 to $74,999 income range is the most frequent in Pamlico County, accounting for 17.3% of all households. In contrast, only 246 households (4.8%) fall into the less than $10,000 income bracket, making it the least populous group.
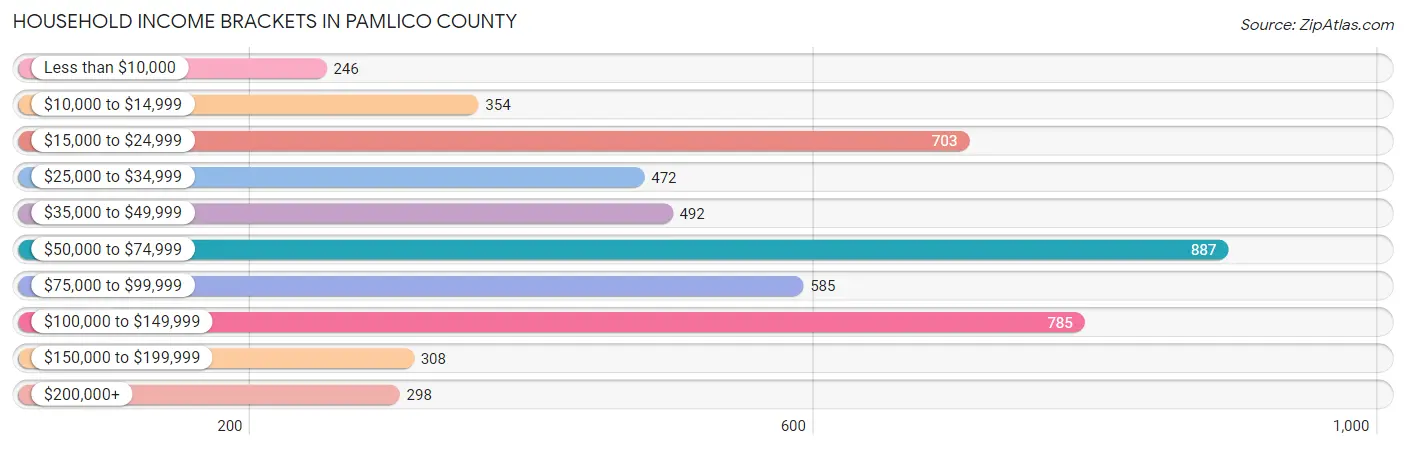
| Income Bracket | # Households | % Households |
| Less than $10,000 | 246 | 4.8% |
| $10,000 to $14,999 | 354 | 6.9% |
| $15,000 to $24,999 | 703 | 13.7% |
| $25,000 to $34,999 | 472 | 9.2% |
| $35,000 to $49,999 | 492 | 9.6% |
| $50,000 to $74,999 | 887 | 17.3% |
| $75,000 to $99,999 | 585 | 11.4% |
| $100,000 to $149,999 | 785 | 15.3% |
| $150,000 to $199,999 | 308 | 6.0% |
| $200,000+ | 298 | 5.8% |
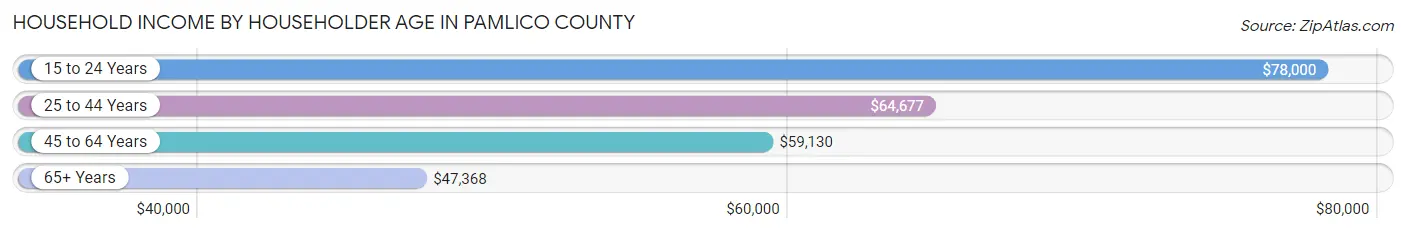
Household Income by Householder Age in Pamlico County
The median household income in Pamlico County is $55,867, with the highest median household income of $78,000 found in the 15 to 24 years age bracket for the primary householder. A total of 36 households (0.7%) fall into this category. Meanwhile, the 65+ years age bracket for the primary householder has the lowest median household income of $47,368, with 2,280 households (44.4%) in this group.
| Income Bracket | # Households | Median Income |
| 15 to 24 Years | 36 (0.7%) | $78,000 |
| 25 to 44 Years | 720 (14.0%) | $64,677 |
| 45 to 64 Years | 2,094 (40.8%) | $59,130 |
| 65+ Years | 2,280 (44.4%) | $47,368 |
| Total | 5,130 (100.0%) | $55,867 |
Poverty in Pamlico County
Income Below Poverty by Sex and Age in Pamlico County
With 14.5% poverty level for males and 13.2% for females among the residents of Pamlico County, under 5 year old males and 35 to 44 year old females are the most vulnerable to poverty, with 69 males (44.0%) and 211 females (34.1%) in their respective age groups living below the poverty level.
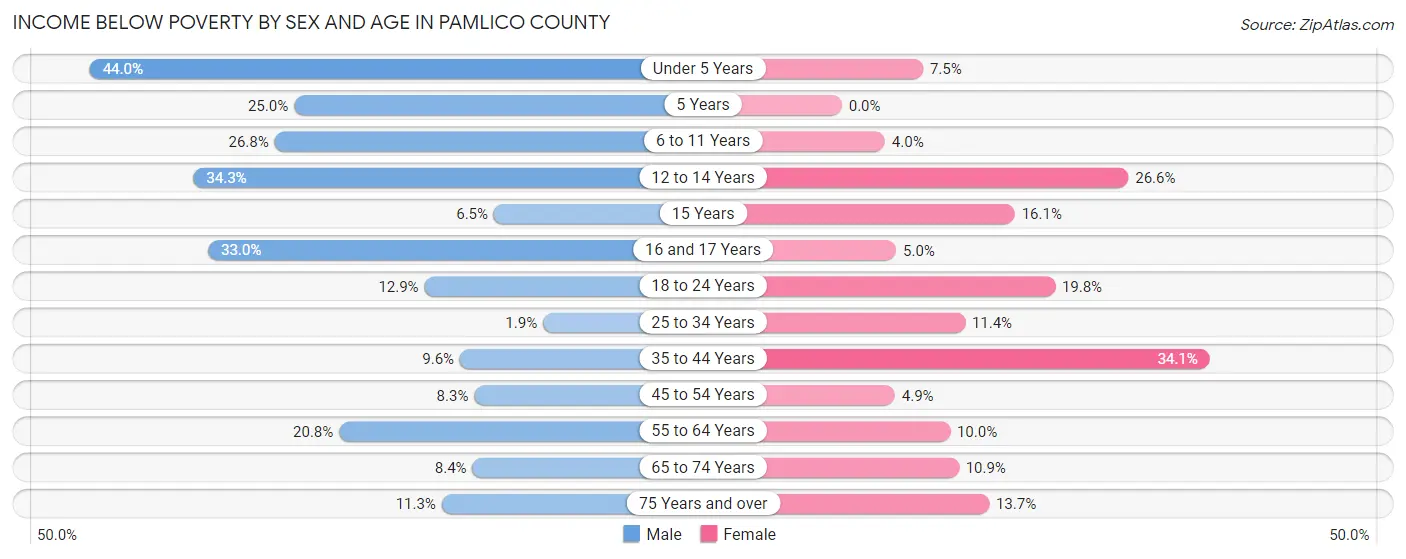
| Age Bracket | Male | Female |
| Under 5 Years | 69 (44.0%) | 11 (7.5%) |
| 5 Years | 2 (25.0%) | 0 (0.0%) |
| 6 to 11 Years | 82 (26.8%) | 8 (4.0%) |
| 12 to 14 Years | 69 (34.3%) | 46 (26.6%) |
| 15 Years | 2 (6.5%) | 13 (16.1%) |
| 16 and 17 Years | 61 (33.0%) | 7 (5.0%) |
| 18 to 24 Years | 58 (12.9%) | 55 (19.8%) |
| 25 to 34 Years | 9 (1.9%) | 52 (11.4%) |
| 35 to 44 Years | 48 (9.6%) | 211 (34.1%) |
| 45 to 54 Years | 54 (8.3%) | 32 (4.9%) |
| 55 to 64 Years | 189 (20.8%) | 114 (10.0%) |
| 65 to 74 Years | 82 (8.4%) | 124 (10.8%) |
| 75 Years and over | 78 (11.3%) | 112 (13.7%) |
| Total | 803 (14.5%) | 785 (13.2%) |
Income Above Poverty by Sex and Age in Pamlico County
According to the poverty statistics in Pamlico County, males aged 25 to 34 years and females aged 5 years are the age groups that are most secure financially, with 98.1% of males and 100.0% of females in these age groups living above the poverty line.
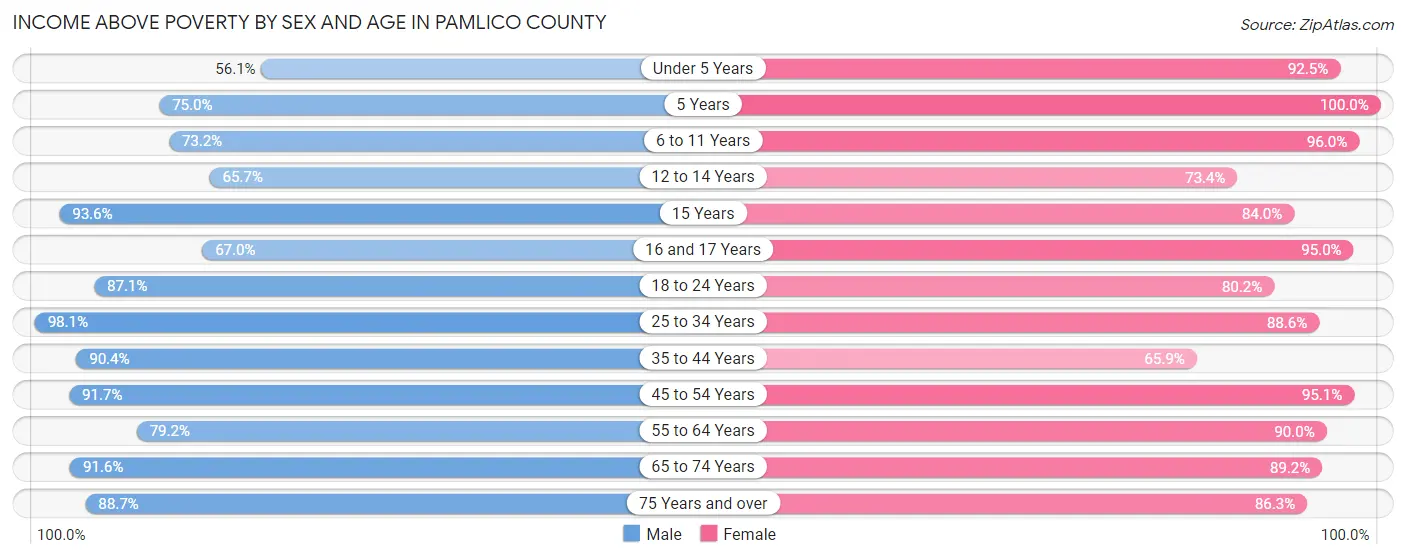
| Age Bracket | Male | Female |
| Under 5 Years | 88 (56.0%) | 135 (92.5%) |
| 5 Years | 6 (75.0%) | 111 (100.0%) |
| 6 to 11 Years | 224 (73.2%) | 192 (96.0%) |
| 12 to 14 Years | 132 (65.7%) | 127 (73.4%) |
| 15 Years | 29 (93.5%) | 68 (84.0%) |
| 16 and 17 Years | 124 (67.0%) | 132 (95.0%) |
| 18 to 24 Years | 392 (87.1%) | 223 (80.2%) |
| 25 to 34 Years | 466 (98.1%) | 403 (88.6%) |
| 35 to 44 Years | 452 (90.4%) | 407 (65.9%) |
| 45 to 54 Years | 599 (91.7%) | 619 (95.1%) |
| 55 to 64 Years | 719 (79.2%) | 1,022 (90.0%) |
| 65 to 74 Years | 890 (91.6%) | 1,019 (89.1%) |
| 75 Years and over | 613 (88.7%) | 708 (86.3%) |
| Total | 4,734 (85.5%) | 5,166 (86.8%) |
Income Below Poverty Among Married-Couple Families in Pamlico County
The poverty statistics for married-couple families in Pamlico County show that 5.2% or 131 of the total 2,541 families live below the poverty line. Families with 1 or 2 children have the highest poverty rate of 9.8%, comprising of 54 families. On the other hand, families with no children have the lowest poverty rate of 3.7%, which includes 70 families.
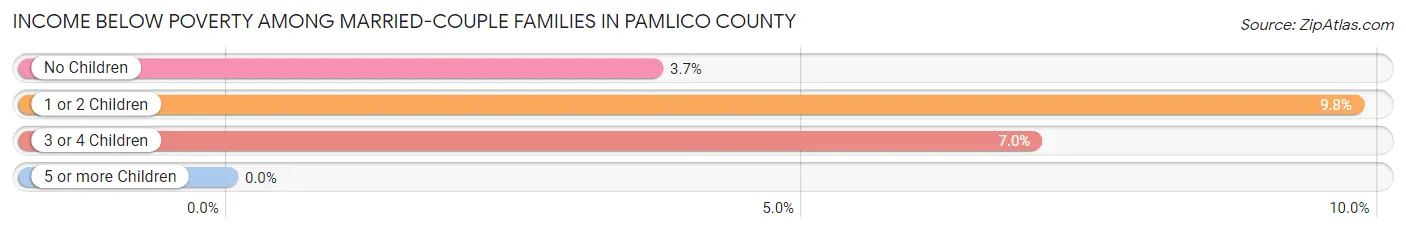
| Children | Above Poverty | Below Poverty |
| No Children | 1,820 (96.3%) | 70 (3.7%) |
| 1 or 2 Children | 497 (90.2%) | 54 (9.8%) |
| 3 or 4 Children | 93 (93.0%) | 7 (7.0%) |
| 5 or more Children | 0 (0.0%) | 0 (0.0%) |
| Total | 2,410 (94.8%) | 131 (5.2%) |
Income Below Poverty Among Single-Parent Households in Pamlico County
According to the poverty data in Pamlico County, 21.2% or 34 single-father households and 24.9% or 130 single-mother households are living below the poverty line. Among single-father households, those with 1 or 2 children have the highest poverty rate, with 34 households (28.8%) experiencing poverty. Likewise, among single-mother households, those with 3 or 4 children have the highest poverty rate, with 7 households (100.0%) falling below the poverty line.
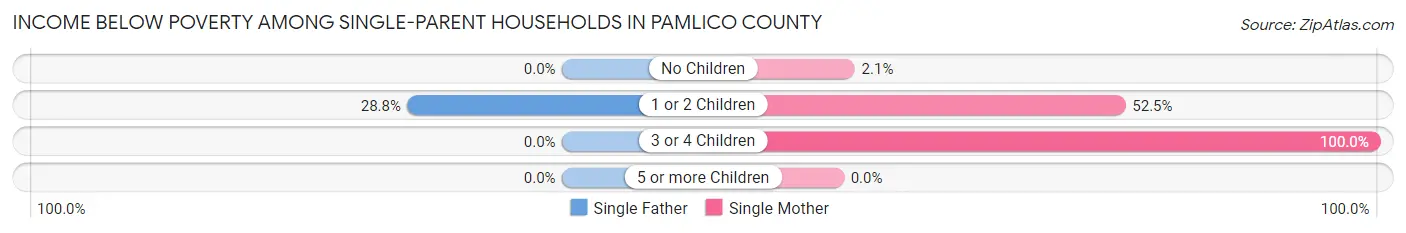
| Children | Single Father | Single Mother |
| No Children | 0 (0.0%) | 6 (2.1%) |
| 1 or 2 Children | 34 (28.8%) | 117 (52.5%) |
| 3 or 4 Children | 0 (0.0%) | 7 (100.0%) |
| 5 or more Children | 0 (0.0%) | 0 (0.0%) |
| Total | 34 (21.2%) | 130 (24.9%) |
Income Below Poverty Among Married-Couple vs Single-Parent Households in Pamlico County
The poverty data for Pamlico County shows that 131 of the married-couple family households (5.2%) and 164 of the single-parent households (24.0%) are living below the poverty level. Within the married-couple family households, those with 1 or 2 children have the highest poverty rate, with 54 households (9.8%) falling below the poverty line. Among the single-parent households, those with 3 or 4 children have the highest poverty rate, with 7 household (100.0%) living below poverty.
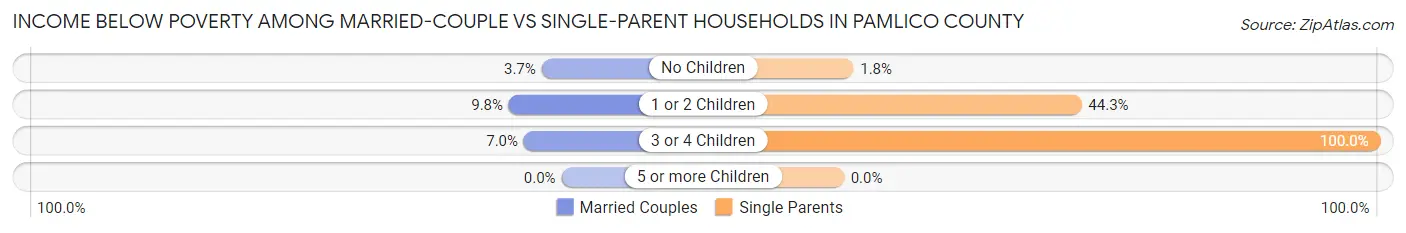
| Children | Married-Couple Families | Single-Parent Households |
| No Children | 70 (3.7%) | 6 (1.8%) |
| 1 or 2 Children | 54 (9.8%) | 151 (44.3%) |
| 3 or 4 Children | 7 (7.0%) | 7 (100.0%) |
| 5 or more Children | 0 (0.0%) | 0 (0.0%) |
| Total | 131 (5.2%) | 164 (24.0%) |
Race in Pamlico County
The most populous races in Pamlico County are White / Caucasian (9,330 | 75.7%), Black / African American (2,376 | 19.3%), and Hispanic or Latino (553 | 4.5%).
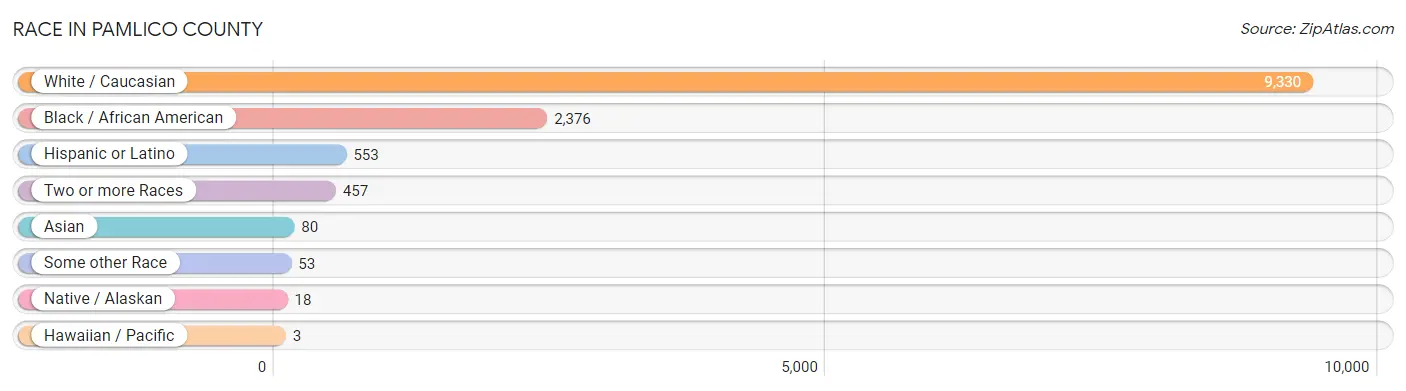
| Race | # Population | % Population |
| Asian | 80 | 0.6% |
| Black / African American | 2,376 | 19.3% |
| Hawaiian / Pacific | 3 | 0.0% |
| Hispanic or Latino | 553 | 4.5% |
| Native / Alaskan | 18 | 0.2% |
| White / Caucasian | 9,330 | 75.7% |
| Two or more Races | 457 | 3.7% |
| Some other Race | 53 | 0.4% |
| Total | 12,317 | 100.0% |
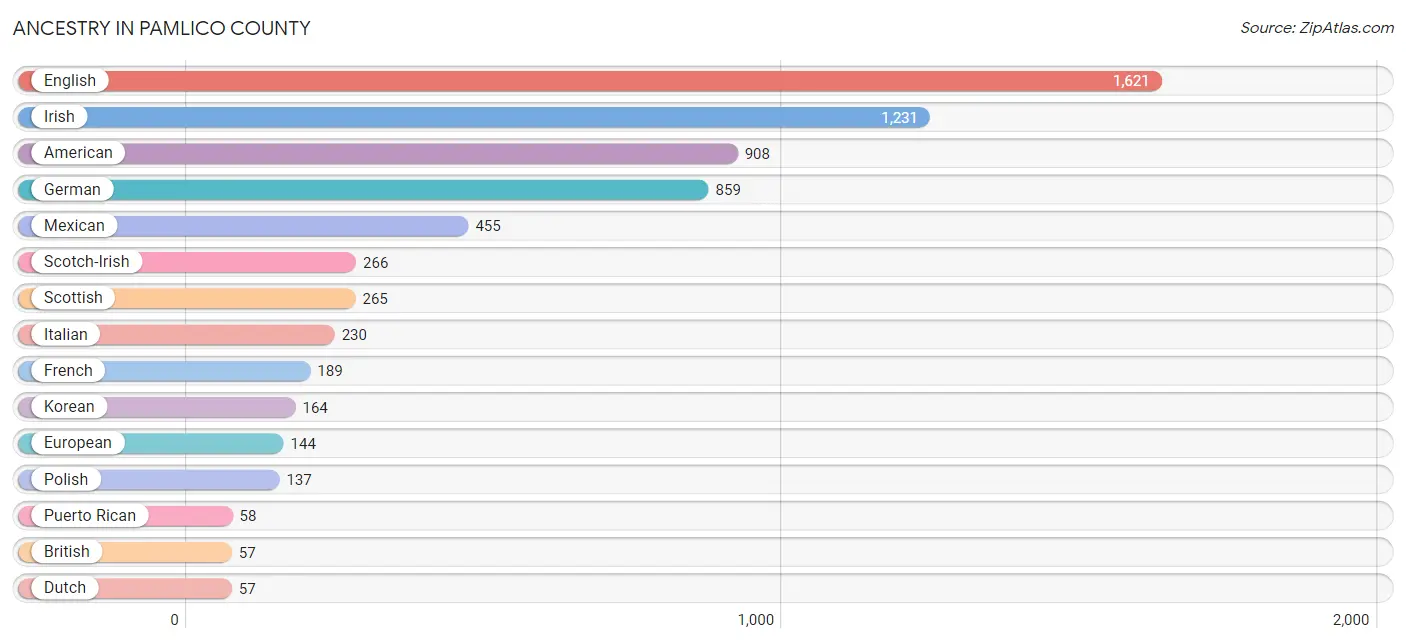
Ancestry in Pamlico County
The most populous ancestries reported in Pamlico County are English (1,621 | 13.2%), Irish (1,231 | 10.0%), American (908 | 7.4%), German (859 | 7.0%), and Mexican (455 | 3.7%), together accounting for 41.2% of all Pamlico County residents.
| Ancestry | # Population | % Population |
| African | 25 | 0.2% |
| American | 908 | 7.4% |
| Arab | 8 | 0.1% |
| Austrian | 11 | 0.1% |
| Belgian | 27 | 0.2% |
| Bhutanese | 19 | 0.2% |
| British | 57 | 0.5% |
| Cherokee | 19 | 0.2% |
| Chinese | 2 | 0.0% |
| Colombian | 6 | 0.1% |
| Croatian | 14 | 0.1% |
| Cuban | 18 | 0.2% |
| Czech | 13 | 0.1% |
| Danish | 9 | 0.1% |
| Dominican | 3 | 0.0% |
| Dutch | 57 | 0.5% |
| Eastern European | 17 | 0.1% |
| English | 1,621 | 13.2% |
| European | 144 | 1.2% |
| Finnish | 9 | 0.1% |
| French | 189 | 1.5% |
| French American Indian | 1 | 0.0% |
| French Canadian | 51 | 0.4% |
| German | 859 | 7.0% |
| Greek | 24 | 0.2% |
| Hungarian | 22 | 0.2% |
| Indian (Asian) | 12 | 0.1% |
| Irish | 1,231 | 10.0% |
| Iroquois | 2 | 0.0% |
| Italian | 230 | 1.9% |
| Kenyan | 6 | 0.1% |
| Korean | 164 | 1.3% |
| Lebanese | 6 | 0.1% |
| Lithuanian | 2 | 0.0% |
| Lumbee | 23 | 0.2% |
| Luxembourger | 4 | 0.0% |
| Mexican | 455 | 3.7% |
| Moroccan | 2 | 0.0% |
| Northern European | 3 | 0.0% |
| Norwegian | 21 | 0.2% |
| Polish | 137 | 1.1% |
| Portuguese | 2 | 0.0% |
| Puerto Rican | 58 | 0.5% |
| Romanian | 3 | 0.0% |
| Russian | 44 | 0.4% |
| Scandinavian | 18 | 0.2% |
| Scotch-Irish | 266 | 2.2% |
| Scottish | 265 | 2.1% |
| Serbian | 8 | 0.1% |
| South American | 6 | 0.1% |
| Spanish | 8 | 0.1% |
| Subsaharan African | 31 | 0.3% |
| Swedish | 27 | 0.2% |
| Swiss | 41 | 0.3% |
| Turkish | 2 | 0.0% |
| Ukrainian | 22 | 0.2% |
| Welsh | 21 | 0.2% | View All 57 Rows |
Immigrants in Pamlico County
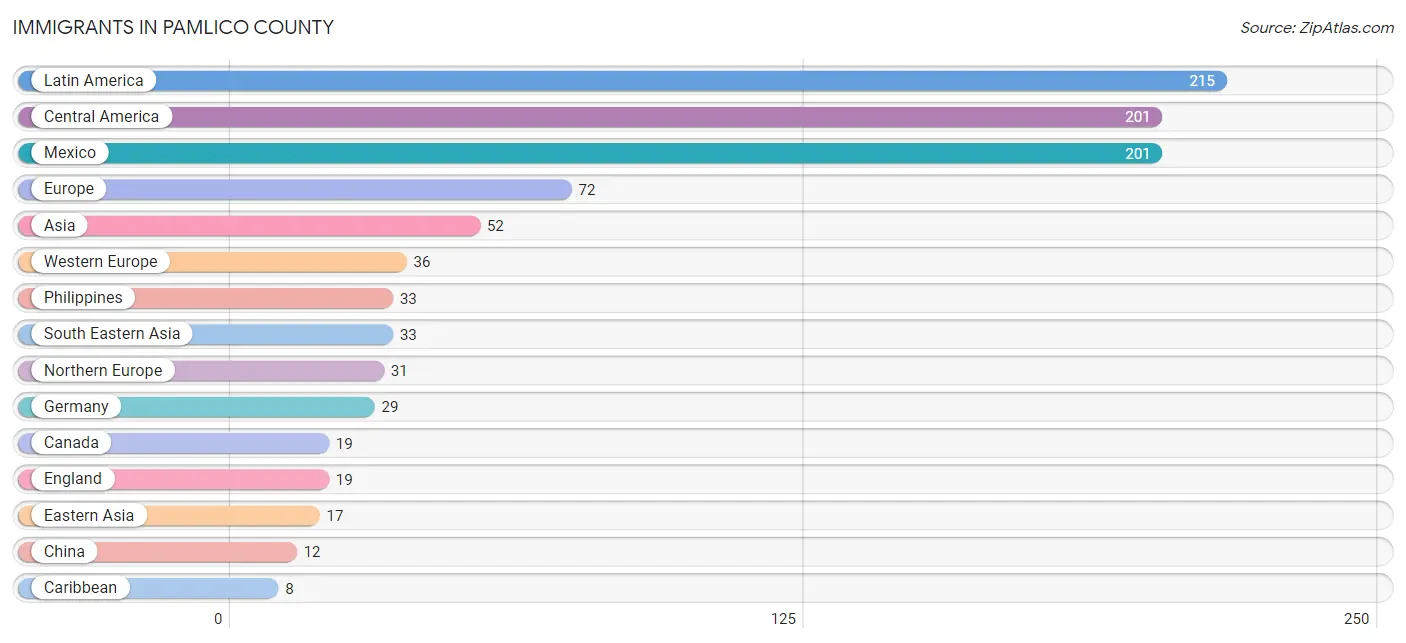
The most numerous immigrant groups reported in Pamlico County came from Latin America (215 | 1.8%), Central America (201 | 1.6%), Mexico (201 | 1.6%), Europe (72 | 0.6%), and Asia (52 | 0.4%), together accounting for 6.0% of all Pamlico County residents.
| Immigration Origin | # Population | % Population |
| Africa | 6 | 0.1% |
| Asia | 52 | 0.4% |
| Australia | 1 | 0.0% |
| Canada | 19 | 0.2% |
| Caribbean | 8 | 0.1% |
| Central America | 201 | 1.6% |
| China | 12 | 0.1% |
| Colombia | 6 | 0.1% |
| Croatia | 5 | 0.0% |
| Cuba | 5 | 0.0% |
| Denmark | 4 | 0.0% |
| Dominican Republic | 3 | 0.0% |
| Eastern Africa | 6 | 0.1% |
| Eastern Asia | 17 | 0.1% |
| Eastern Europe | 5 | 0.0% |
| England | 19 | 0.2% |
| Europe | 72 | 0.6% |
| Germany | 29 | 0.2% |
| Japan | 5 | 0.0% |
| Kenya | 6 | 0.1% |
| Latin America | 215 | 1.8% |
| Mexico | 201 | 1.6% |
| Netherlands | 7 | 0.1% |
| Northern Europe | 31 | 0.3% |
| Oceania | 1 | 0.0% |
| Philippines | 33 | 0.3% |
| Scotland | 4 | 0.0% |
| South America | 6 | 0.1% |
| South Eastern Asia | 33 | 0.3% |
| Turkey | 2 | 0.0% |
| Western Asia | 2 | 0.0% |
| Western Europe | 36 | 0.3% | View All 32 Rows |
Sex and Age in Pamlico County
Sex and Age in Pamlico County
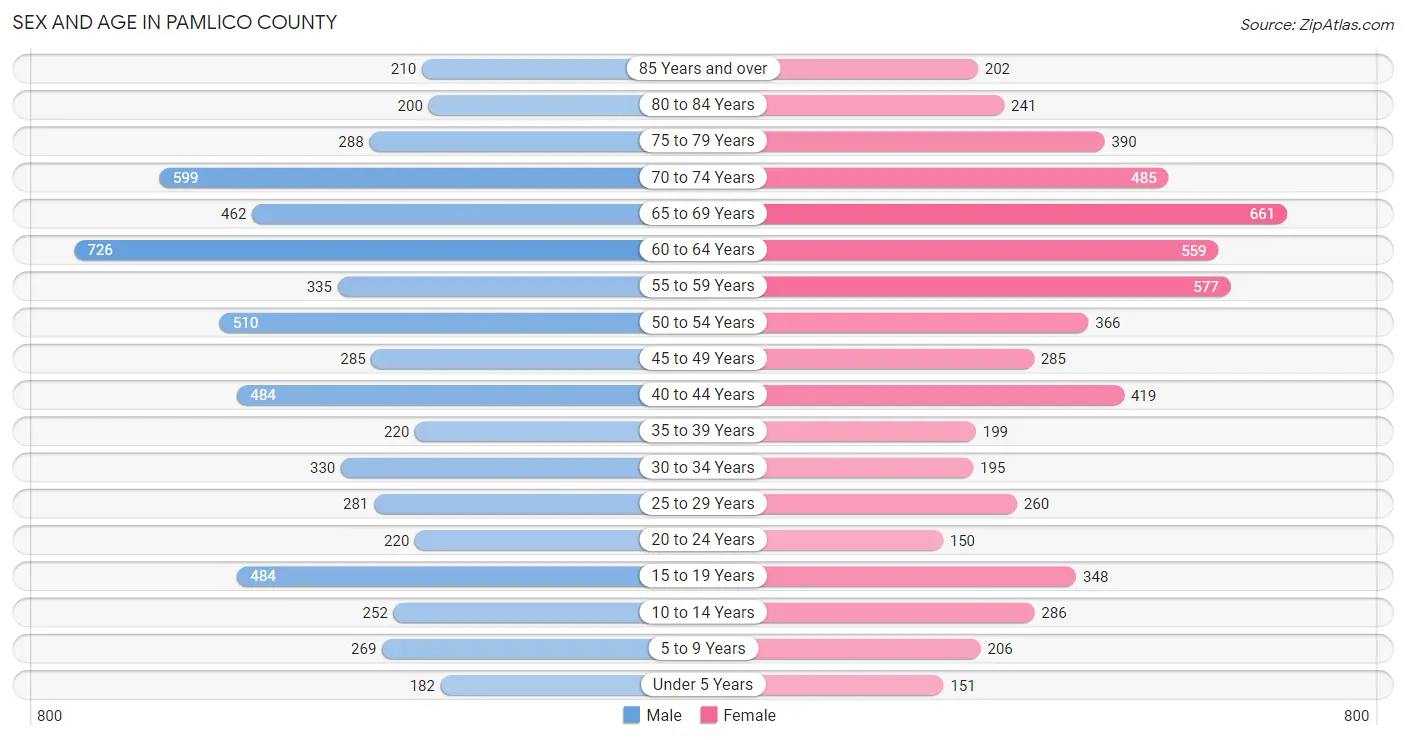
The most populous age groups in Pamlico County are 60 to 64 Years (726 | 11.5%) for men and 65 to 69 Years (661 | 11.1%) for women.
| Age Bracket | Male | Female |
| Under 5 Years | 182 (2.9%) | 151 (2.5%) |
| 5 to 9 Years | 269 (4.2%) | 206 (3.4%) |
| 10 to 14 Years | 252 (4.0%) | 286 (4.8%) |
| 15 to 19 Years | 484 (7.6%) | 348 (5.8%) |
| 20 to 24 Years | 220 (3.5%) | 150 (2.5%) |
| 25 to 29 Years | 281 (4.4%) | 260 (4.3%) |
| 30 to 34 Years | 330 (5.2%) | 195 (3.3%) |
| 35 to 39 Years | 220 (3.5%) | 199 (3.3%) |
| 40 to 44 Years | 484 (7.6%) | 419 (7.0%) |
| 45 to 49 Years | 285 (4.5%) | 285 (4.8%) |
| 50 to 54 Years | 510 (8.1%) | 366 (6.1%) |
| 55 to 59 Years | 335 (5.3%) | 577 (9.7%) |
| 60 to 64 Years | 726 (11.5%) | 559 (9.3%) |
| 65 to 69 Years | 462 (7.3%) | 661 (11.1%) |
| 70 to 74 Years | 599 (9.5%) | 485 (8.1%) |
| 75 to 79 Years | 288 (4.5%) | 390 (6.5%) |
| 80 to 84 Years | 200 (3.2%) | 241 (4.0%) |
| 85 Years and over | 210 (3.3%) | 202 (3.4%) |
| Total | 6,337 (100.0%) | 5,980 (100.0%) |
Families and Households in Pamlico County
Median Family Size in Pamlico County
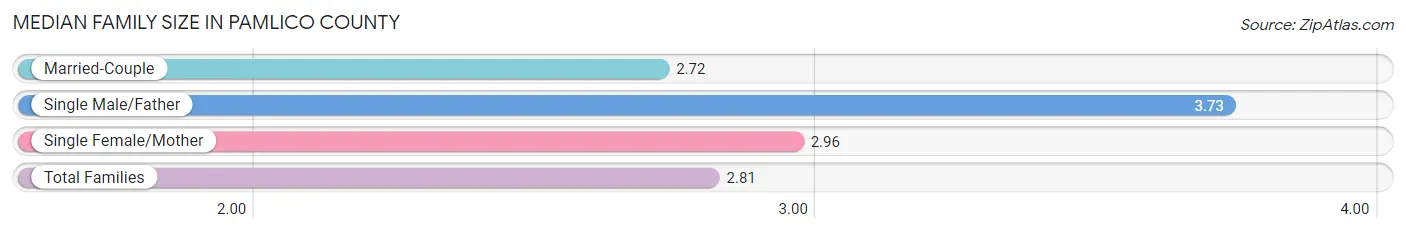
The median family size in Pamlico County is 2.81 persons per family, with single male/father families (160 | 5.0%) accounting for the largest median family size of 3.73 persons per family. On the other hand, married-couple families (2,541 | 78.8%) represent the smallest median family size with 2.72 persons per family.
| Family Type | # Families | Family Size |
| Married-Couple | 2,541 (78.8%) | 2.72 |
| Single Male/Father | 160 (5.0%) | 3.73 |
| Single Female/Mother | 523 (16.2%) | 2.96 |
| Total Families | 3,224 (100.0%) | 2.81 |
Median Household Size in Pamlico County
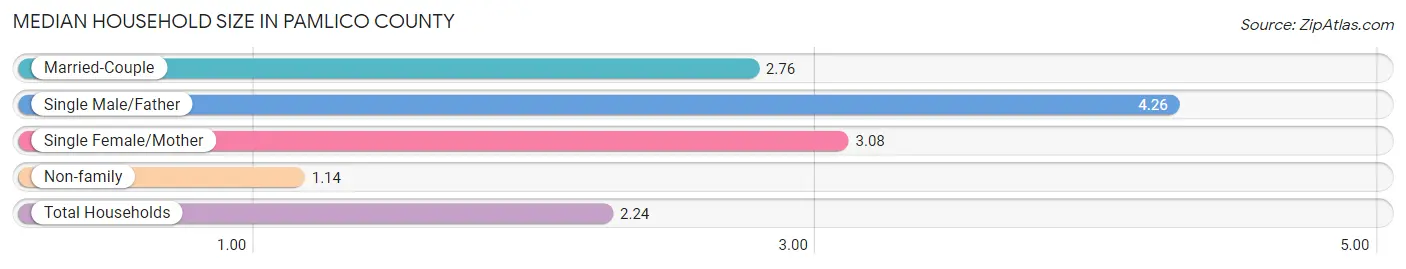
The median household size in Pamlico County is 2.24 persons per household, with single male/father households (160 | 3.1%) accounting for the largest median household size of 4.26 persons per household. non-family households (1,906 | 37.1%) represent the smallest median household size with 1.14 persons per household.
| Household Type | # Households | Household Size |
| Married-Couple | 2,541 (49.5%) | 2.76 |
| Single Male/Father | 160 (3.1%) | 4.26 |
| Single Female/Mother | 523 (10.2%) | 3.08 |
| Non-family | 1,906 (37.1%) | 1.14 |
| Total Households | 5,130 (100.0%) | 2.24 |
Household Size by Marriage Status in Pamlico County
Out of a total of 5,130 households in Pamlico County, 3,224 (62.8%) are family households, while 1,906 (37.1%) are nonfamily households. The most numerous type of family households are 2-person households, comprising 1,943, and the most common type of nonfamily households are 1-person households, comprising 1,669.
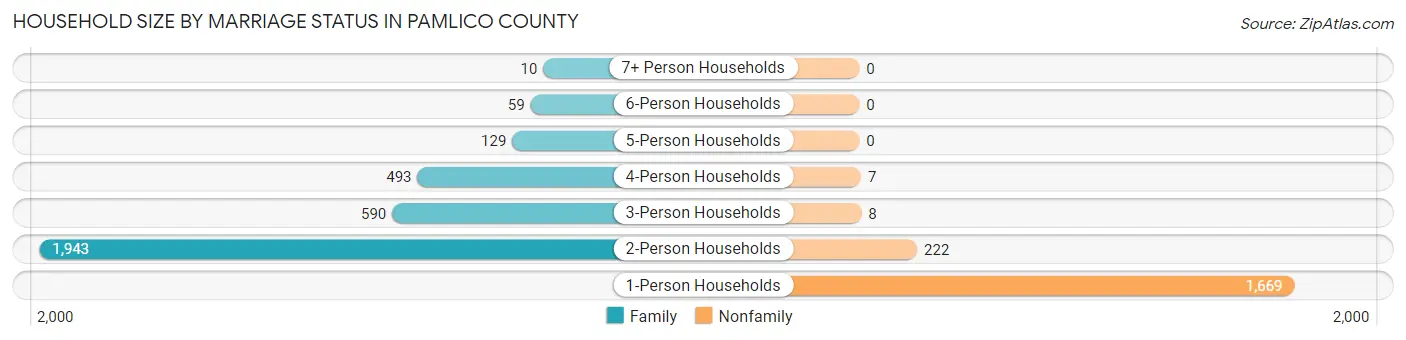
| Household Size | Family Households | Nonfamily Households |
| 1-Person Households | - | 1,669 (32.5%) |
| 2-Person Households | 1,943 (37.9%) | 222 (4.3%) |
| 3-Person Households | 590 (11.5%) | 8 (0.2%) |
| 4-Person Households | 493 (9.6%) | 7 (0.1%) |
| 5-Person Households | 129 (2.5%) | 0 (0.0%) |
| 6-Person Households | 59 (1.1%) | 0 (0.0%) |
| 7+ Person Households | 10 (0.2%) | 0 (0.0%) |
| Total | 3,224 (62.8%) | 1,906 (37.1%) |
Female Fertility in Pamlico County
Fertility by Age in Pamlico County
Average fertility rate in Pamlico County is 39.0 births per 1,000 women. Women in the age bracket of 20 to 34 years have the highest fertility rate with 71.0 births per 1,000 women. Women in the age bracket of 20 to 34 years acount for 58.1% of all women with births.
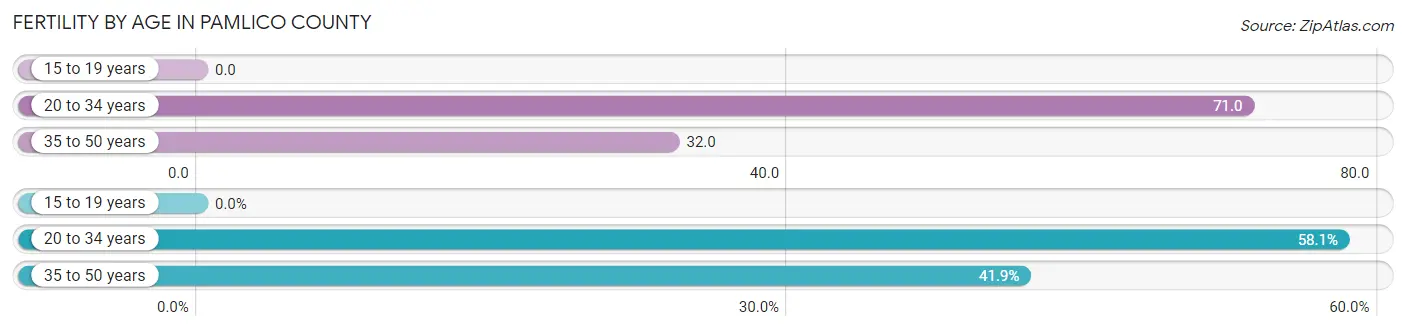
| Age Bracket | Women with Births | Births / 1,000 Women |
| 15 to 19 years | 0 (0.0%) | 0.0 |
| 20 to 34 years | 43 (58.1%) | 71.0 |
| 35 to 50 years | 31 (41.9%) | 32.0 |
| Total | 74 (100.0%) | 39.0 |
Fertility by Age by Marriage Status in Pamlico County
79.7% of women with births (74) in Pamlico County are married. The highest percentage of unmarried women with births falls into 20 to 34 years age bracket with 34.9% of them unmarried at the time of birth, while the lowest percentage of unmarried women with births belong to 35 to 50 years age bracket with 0.0% of them unmarried.
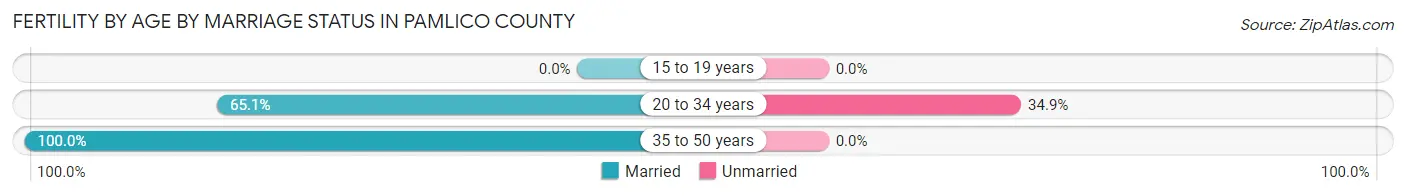
| Age Bracket | Married | Unmarried |
| 15 to 19 years | 0 (0.0%) | 0 (0.0%) |
| 20 to 34 years | 28 (65.1%) | 15 (34.9%) |
| 35 to 50 years | 31 (100.0%) | 0 (0.0%) |
| Total | 59 (79.7%) | 15 (20.3%) |
Fertility by Education in Pamlico County
Average fertility rate in Pamlico County is 39.0 births per 1,000 women. Women with the education attainment of bachelor's degree have the highest fertility rate of 89.0 births per 1,000 women, while women with the education attainment of less than high school have the lowest fertility at 11.0 births per 1,000 women. Women with the education attainment of high school diploma represent 43.2% of all women with births.
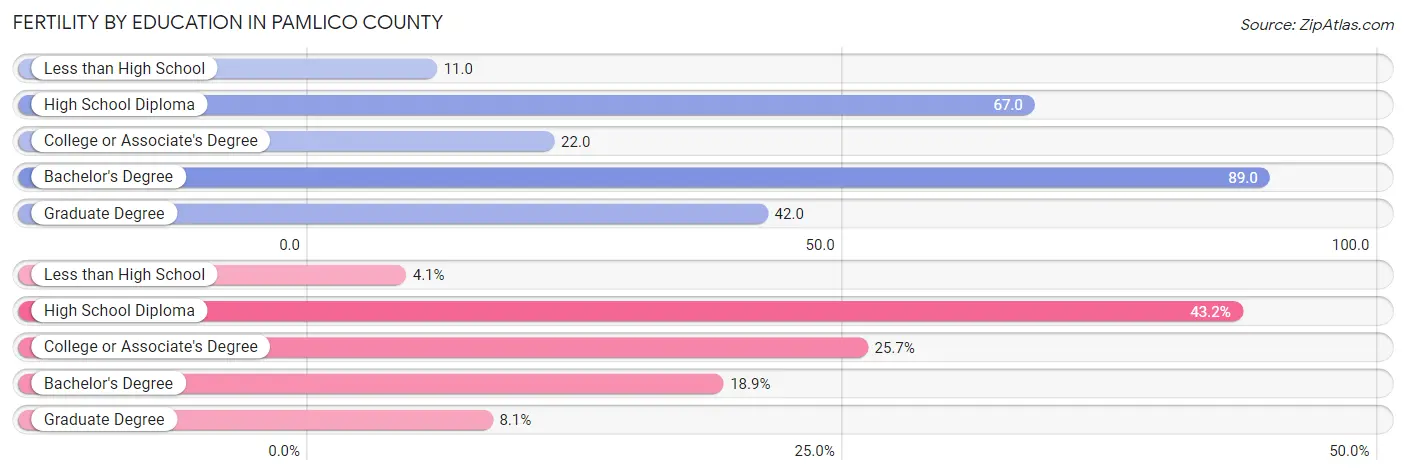
| Educational Attainment | Women with Births | Births / 1,000 Women |
| Less than High School | 3 (4.1%) | 11.0 |
| High School Diploma | 32 (43.2%) | 67.0 |
| College or Associate's Degree | 19 (25.7%) | 22.0 |
| Bachelor's Degree | 14 (18.9%) | 89.0 |
| Graduate Degree | 6 (8.1%) | 42.0 |
| Total | 74 (100.0%) | 39.0 |
Fertility by Education by Marriage Status in Pamlico County
20.3% of women with births in Pamlico County are unmarried. Women with the educational attainment of college or associate's degree are most likely to be married with 100.0% of them married at childbirth, while women with the educational attainment of less than high school are least likely to be married with 100.0% of them unmarried at childbirth.
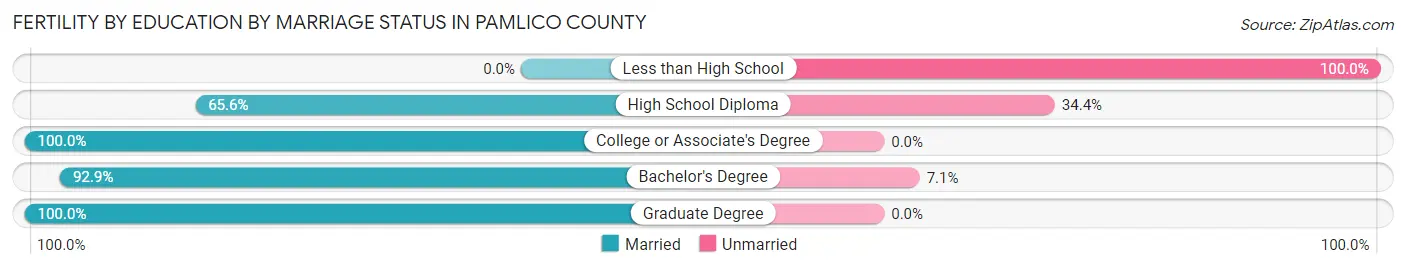
| Educational Attainment | Married | Unmarried |
| Less than High School | 0 (0.0%) | 3 (100.0%) |
| High School Diploma | 21 (65.6%) | 11 (34.4%) |
| College or Associate's Degree | 19 (100.0%) | 0 (0.0%) |
| Bachelor's Degree | 13 (92.9%) | 1 (7.1%) |
| Graduate Degree | 6 (100.0%) | 0 (0.0%) |
| Total | 59 (79.7%) | 15 (20.3%) |
Employment Characteristics in Pamlico County
Employment by Class of Employer in Pamlico County
Among the 4,402 employed individuals in Pamlico County, private company employees (2,866 | 65.1%), self-employed (not incorporated) (341 | 7.7%), and state government employees (330 | 7.5%) make up the most common classes of employment.
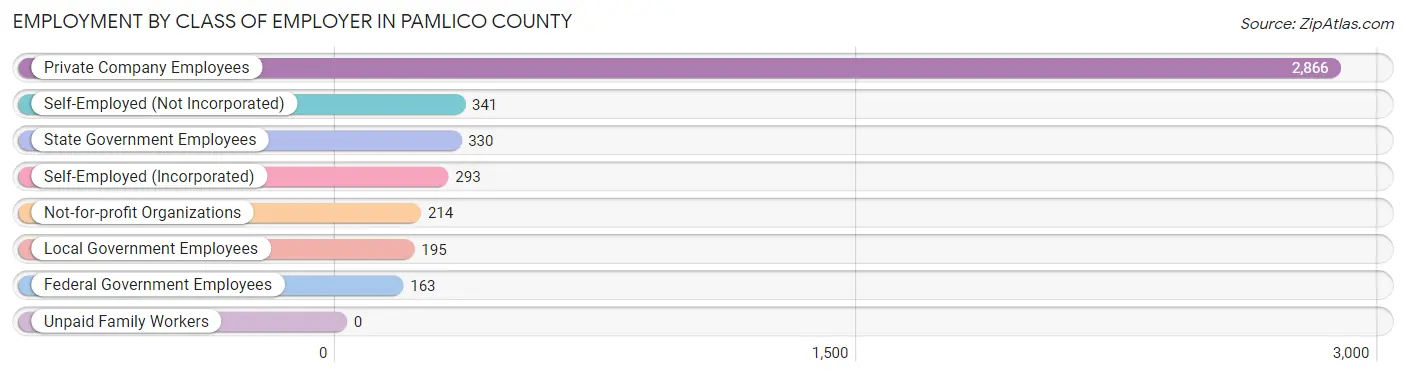
| Employer Class | # Employees | % Employees |
| Private Company Employees | 2,866 | 65.1% |
| Self-Employed (Incorporated) | 293 | 6.7% |
| Self-Employed (Not Incorporated) | 341 | 7.7% |
| Not-for-profit Organizations | 214 | 4.9% |
| Local Government Employees | 195 | 4.4% |
| State Government Employees | 330 | 7.5% |
| Federal Government Employees | 163 | 3.7% |
| Unpaid Family Workers | 0 | 0.0% |
| Total | 4,402 | 100.0% |
Employment Status by Age in Pamlico County
According to the labor force statistics for Pamlico County, out of the total population over 16 years of age (10,859), 43.4% or 4,713 individuals are in the labor force, with 4.6% or 217 of them unemployed. The age group with the highest labor force participation rate is 45 to 54 years, with 75.1% or 1,086 individuals in the labor force. Within the labor force, the 16 to 19 years age range has the highest percentage of unemployed individuals, with 14.0% or 33 of them being unemployed.
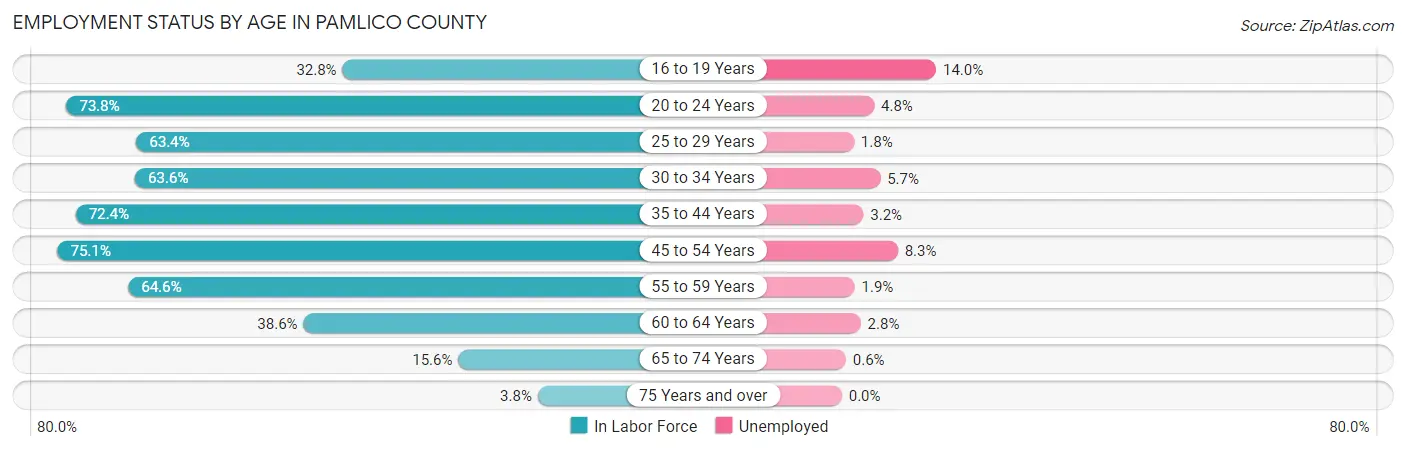
| Age Bracket | In Labor Force | Unemployed |
| 16 to 19 Years | 236 (32.8%) | 33 (14.0%) |
| 20 to 24 Years | 273 (73.8%) | 13 (4.8%) |
| 25 to 29 Years | 343 (63.4%) | 6 (1.8%) |
| 30 to 34 Years | 334 (63.6%) | 19 (5.7%) |
| 35 to 44 Years | 957 (72.4%) | 31 (3.2%) |
| 45 to 54 Years | 1,086 (75.1%) | 90 (8.3%) |
| 55 to 59 Years | 589 (64.6%) | 11 (1.9%) |
| 60 to 64 Years | 496 (38.6%) | 14 (2.8%) |
| 65 to 74 Years | 344 (15.6%) | 2 (0.6%) |
| 75 Years and over | 58 (3.8%) | 0 (0.0%) |
| Total | 4,713 (43.4%) | 217 (4.6%) |
Employment Status by Educational Attainment in Pamlico County
According to labor force statistics for Pamlico County, 63.1% of individuals (3,806) out of the total population between 25 and 64 years of age (6,031) are in the labor force, with 4.5% or 171 of them being unemployed. The group with the highest labor force participation rate are those with the educational attainment of college / associate degree, with 68.6% or 1,577 individuals in the labor force. Within the labor force, individuals with college / associate degree education have the highest percentage of unemployment, with 5.3% or 84 of them being unemployed.
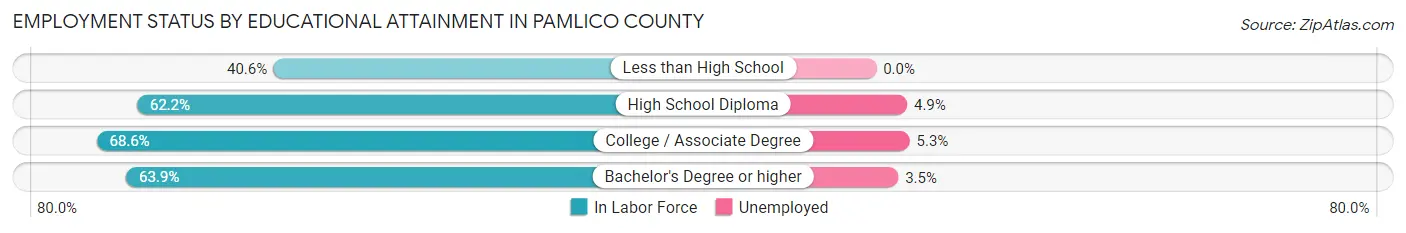
| Educational Attainment | In Labor Force | Unemployed |
| Less than High School | 212 (40.6%) | 0 (0.0%) |
| High School Diploma | 1,246 (62.2%) | 98 (4.9%) |
| College / Associate Degree | 1,577 (68.6%) | 122 (5.3%) |
| Bachelor's Degree or higher | 771 (63.9%) | 42 (3.5%) |
| Total | 3,806 (63.1%) | 271 (4.5%) |
Employment Occupations by Sex in Pamlico County
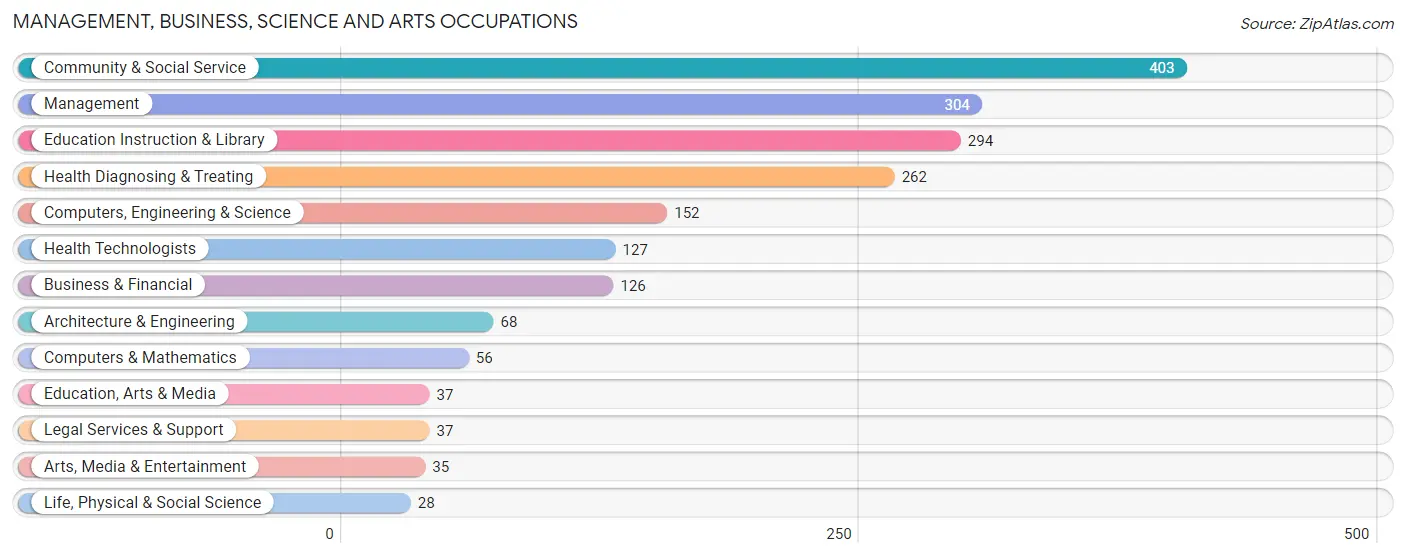
Management, Business, Science and Arts Occupations
The most common Management, Business, Science and Arts occupations in Pamlico County are Community & Social Service (403 | 9.0%), Management (304 | 6.8%), Education Instruction & Library (294 | 6.5%), Health Diagnosing & Treating (262 | 5.8%), and Computers, Engineering & Science (152 | 3.4%).
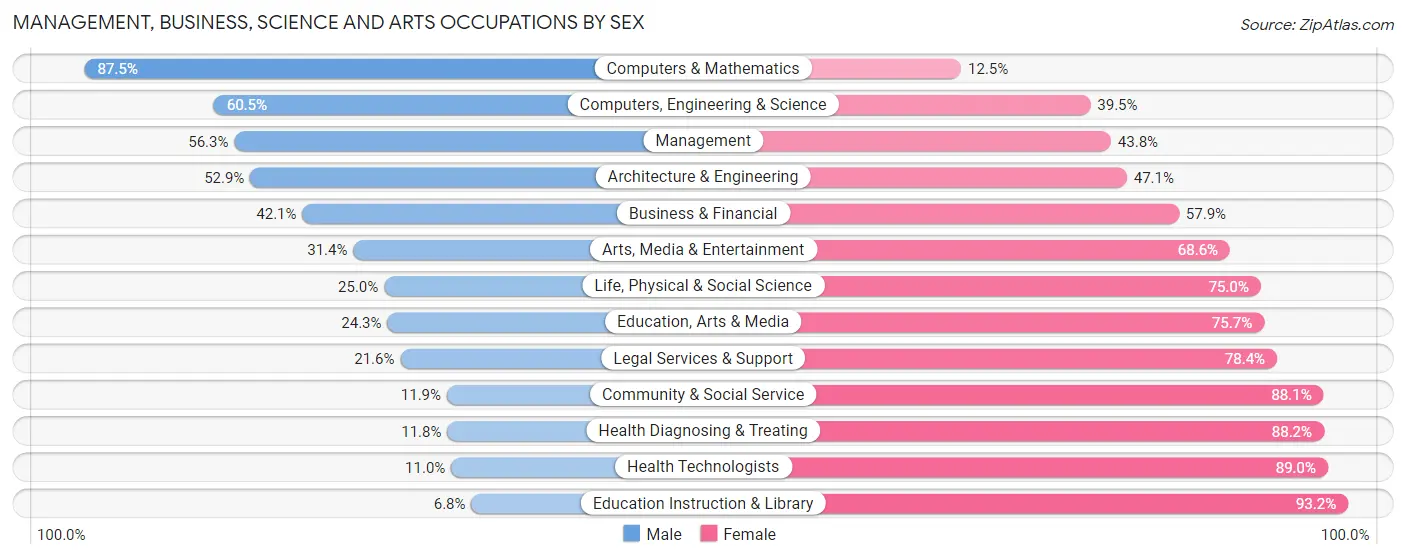
Management, Business, Science and Arts Occupations by Sex
Within the Management, Business, Science and Arts occupations in Pamlico County, the most male-oriented occupations are Computers & Mathematics (87.5%), Computers, Engineering & Science (60.5%), and Management (56.2%), while the most female-oriented occupations are Education Instruction & Library (93.2%), Health Technologists (89.0%), and Health Diagnosing & Treating (88.2%).
| Occupation | Male | Female |
| Management | 171 (56.2%) | 133 (43.8%) |
| Business & Financial | 53 (42.1%) | 73 (57.9%) |
| Computers, Engineering & Science | 92 (60.5%) | 60 (39.5%) |
| Computers & Mathematics | 49 (87.5%) | 7 (12.5%) |
| Architecture & Engineering | 36 (52.9%) | 32 (47.1%) |
| Life, Physical & Social Science | 7 (25.0%) | 21 (75.0%) |
| Community & Social Service | 48 (11.9%) | 355 (88.1%) |
| Education, Arts & Media | 9 (24.3%) | 28 (75.7%) |
| Legal Services & Support | 8 (21.6%) | 29 (78.4%) |
| Education Instruction & Library | 20 (6.8%) | 274 (93.2%) |
| Arts, Media & Entertainment | 11 (31.4%) | 24 (68.6%) |
| Health Diagnosing & Treating | 31 (11.8%) | 231 (88.2%) |
| Health Technologists | 14 (11.0%) | 113 (89.0%) |
| Total (Category) | 395 (31.7%) | 852 (68.3%) |
| Total (Overall) | 2,211 (49.2%) | 2,283 (50.8%) |
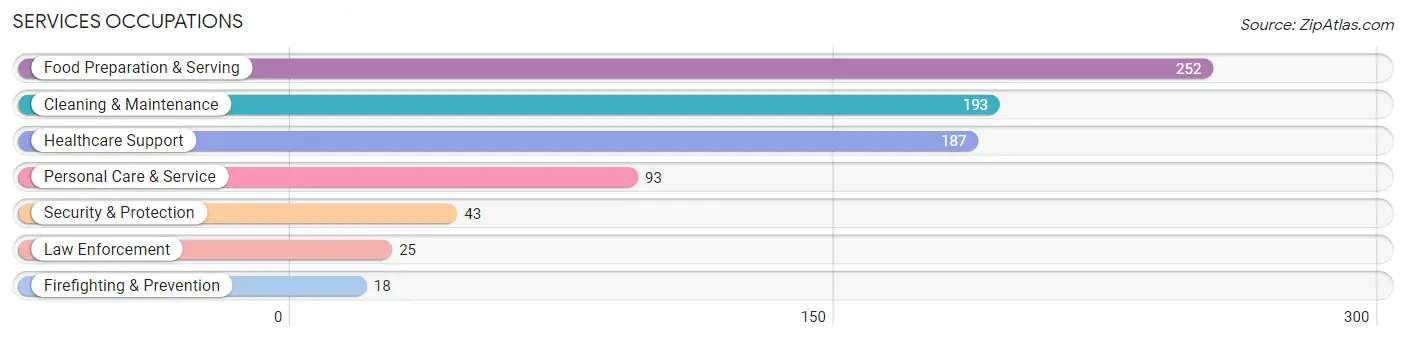
Services Occupations
The most common Services occupations in Pamlico County are Food Preparation & Serving (252 | 5.6%), Cleaning & Maintenance (193 | 4.3%), Healthcare Support (187 | 4.2%), Personal Care & Service (93 | 2.1%), and Security & Protection (43 | 1.0%).
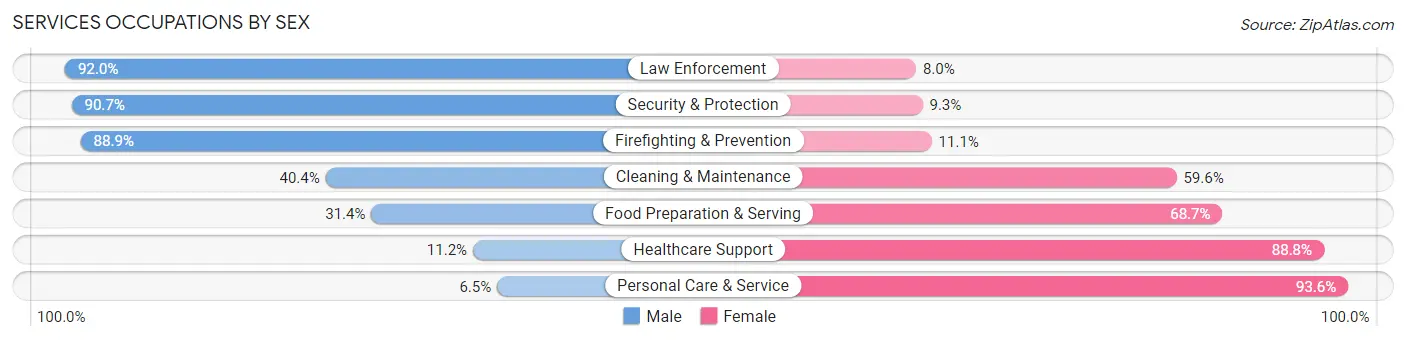
Services Occupations by Sex
Within the Services occupations in Pamlico County, the most male-oriented occupations are Law Enforcement (92.0%), Security & Protection (90.7%), and Firefighting & Prevention (88.9%), while the most female-oriented occupations are Personal Care & Service (93.5%), Healthcare Support (88.8%), and Food Preparation & Serving (68.6%).
| Occupation | Male | Female |
| Healthcare Support | 21 (11.2%) | 166 (88.8%) |
| Security & Protection | 39 (90.7%) | 4 (9.3%) |
| Firefighting & Prevention | 16 (88.9%) | 2 (11.1%) |
| Law Enforcement | 23 (92.0%) | 2 (8.0%) |
| Food Preparation & Serving | 79 (31.4%) | 173 (68.6%) |
| Cleaning & Maintenance | 78 (40.4%) | 115 (59.6%) |
| Personal Care & Service | 6 (6.5%) | 87 (93.5%) |
| Total (Category) | 223 (29.0%) | 545 (71.0%) |
| Total (Overall) | 2,211 (49.2%) | 2,283 (50.8%) |
Sales and Office Occupations
The most common Sales and Office occupations in Pamlico County are Office & Administration (448 | 10.0%), and Sales & Related (415 | 9.2%).

Sales and Office Occupations by Sex
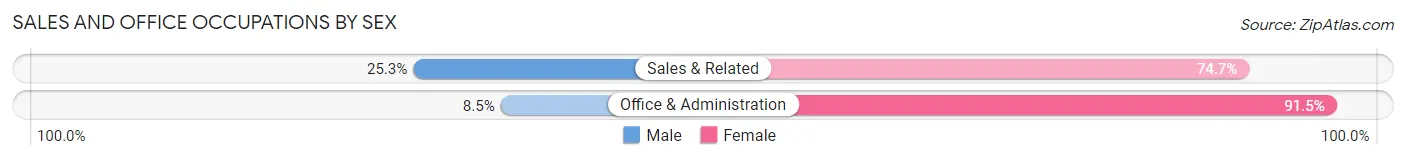
| Occupation | Male | Female |
| Sales & Related | 105 (25.3%) | 310 (74.7%) |
| Office & Administration | 38 (8.5%) | 410 (91.5%) |
| Total (Category) | 143 (16.6%) | 720 (83.4%) |
| Total (Overall) | 2,211 (49.2%) | 2,283 (50.8%) |
Natural Resources, Construction and Maintenance Occupations
The most common Natural Resources, Construction and Maintenance occupations in Pamlico County are Installation, Maintenance & Repair (350 | 7.8%), Construction & Extraction (331 | 7.4%), and Farming, Fishing & Forestry (158 | 3.5%).

Natural Resources, Construction and Maintenance Occupations by Sex
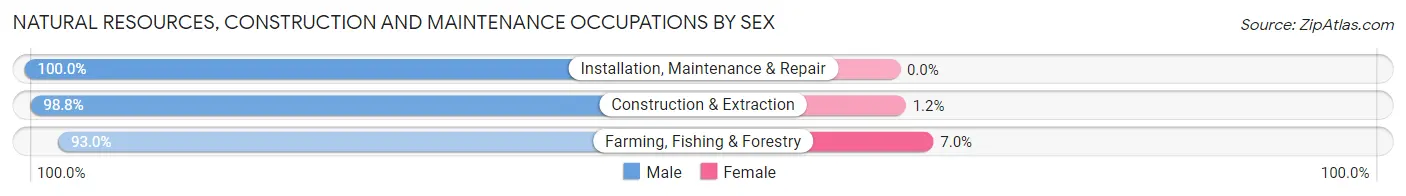
| Occupation | Male | Female |
| Farming, Fishing & Forestry | 147 (93.0%) | 11 (7.0%) |
| Construction & Extraction | 327 (98.8%) | 4 (1.2%) |
| Installation, Maintenance & Repair | 350 (100.0%) | 0 (0.0%) |
| Total (Category) | 824 (98.2%) | 15 (1.8%) |
| Total (Overall) | 2,211 (49.2%) | 2,283 (50.8%) |
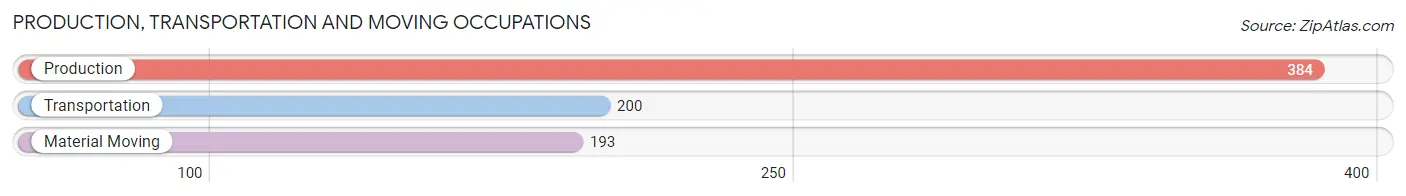
Production, Transportation and Moving Occupations
The most common Production, Transportation and Moving occupations in Pamlico County are Production (384 | 8.5%), Transportation (200 | 4.4%), and Material Moving (193 | 4.3%).
Production, Transportation and Moving Occupations by Sex
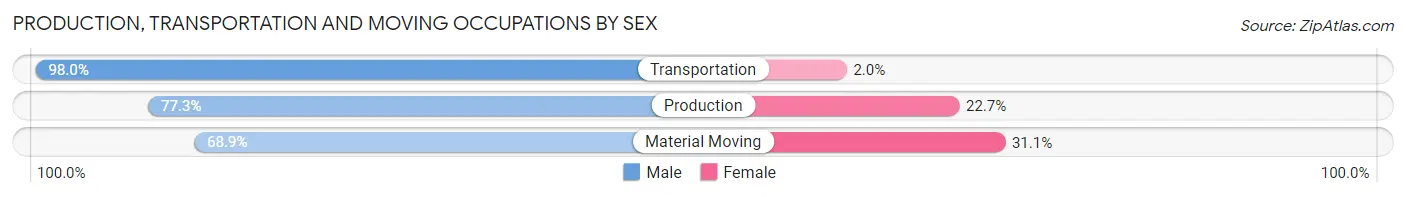
| Occupation | Male | Female |
| Production | 297 (77.3%) | 87 (22.7%) |
| Transportation | 196 (98.0%) | 4 (2.0%) |
| Material Moving | 133 (68.9%) | 60 (31.1%) |
| Total (Category) | 626 (80.6%) | 151 (19.4%) |
| Total (Overall) | 2,211 (49.2%) | 2,283 (50.8%) |
Employment Industries by Sex in Pamlico County
Employment Industries in Pamlico County
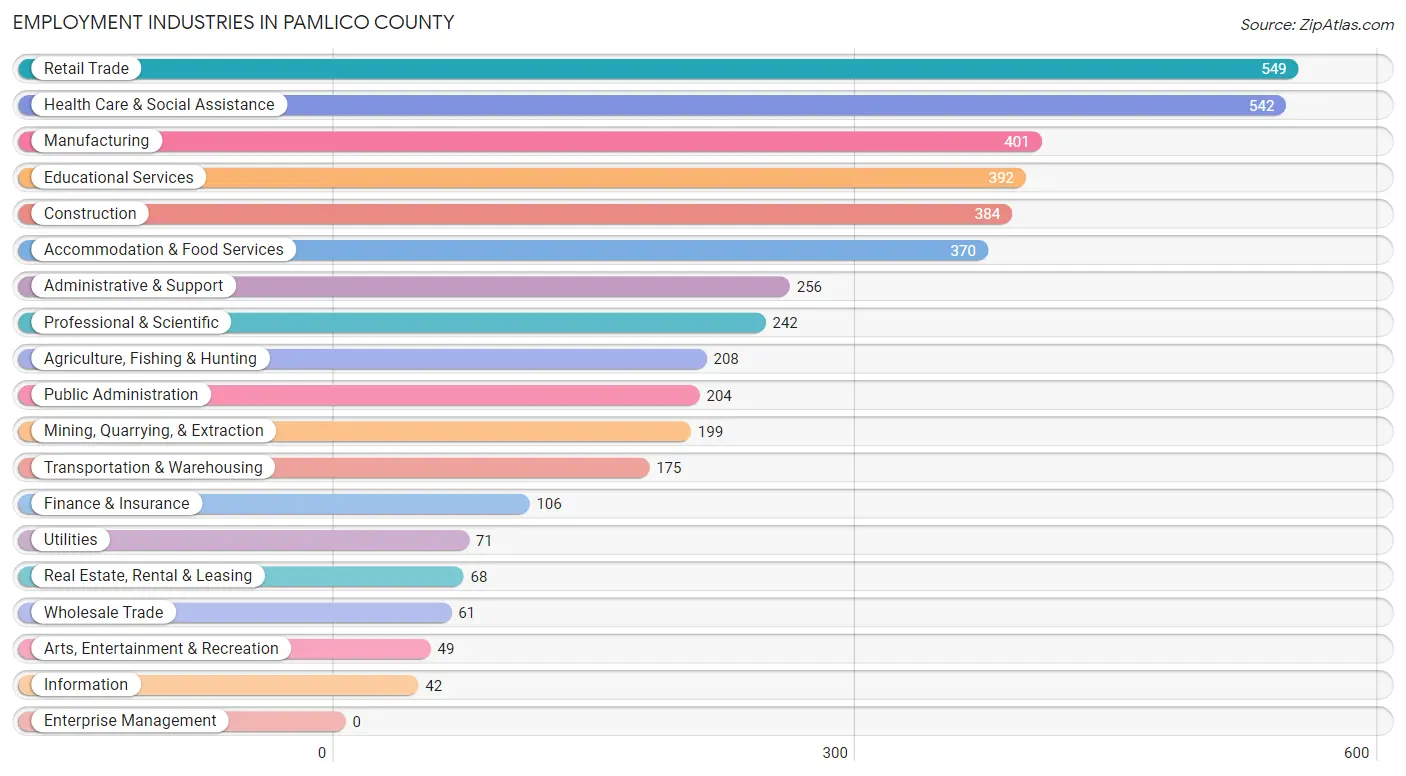
The major employment industries in Pamlico County include Retail Trade (549 | 12.2%), Health Care & Social Assistance (542 | 12.1%), Manufacturing (401 | 8.9%), Educational Services (392 | 8.7%), and Construction (384 | 8.5%).
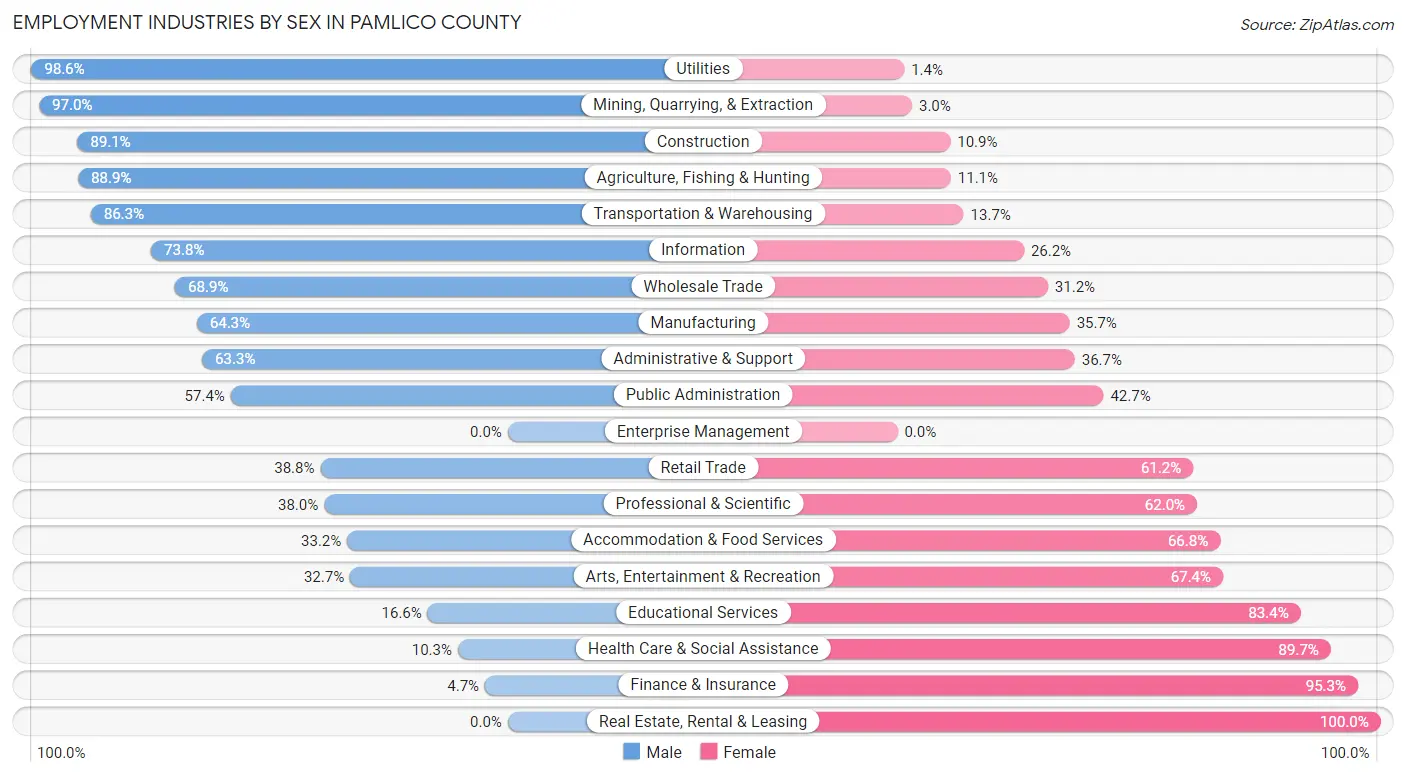
Employment Industries by Sex in Pamlico County
The Pamlico County industries that see more men than women are Utilities (98.6%), Mining, Quarrying, & Extraction (97.0%), and Construction (89.1%), whereas the industries that tend to have a higher number of women are Real Estate, Rental & Leasing (100.0%), Finance & Insurance (95.3%), and Health Care & Social Assistance (89.7%).
| Industry | Male | Female |
| Agriculture, Fishing & Hunting | 185 (88.9%) | 23 (11.1%) |
| Mining, Quarrying, & Extraction | 193 (97.0%) | 6 (3.0%) |
| Construction | 342 (89.1%) | 42 (10.9%) |
| Manufacturing | 258 (64.3%) | 143 (35.7%) |
| Wholesale Trade | 42 (68.9%) | 19 (31.1%) |
| Retail Trade | 213 (38.8%) | 336 (61.2%) |
| Transportation & Warehousing | 151 (86.3%) | 24 (13.7%) |
| Utilities | 70 (98.6%) | 1 (1.4%) |
| Information | 31 (73.8%) | 11 (26.2%) |
| Finance & Insurance | 5 (4.7%) | 101 (95.3%) |
| Real Estate, Rental & Leasing | 0 (0.0%) | 68 (100.0%) |
| Professional & Scientific | 92 (38.0%) | 150 (62.0%) |
| Enterprise Management | 0 (0.0%) | 0 (0.0%) |
| Administrative & Support | 162 (63.3%) | 94 (36.7%) |
| Educational Services | 65 (16.6%) | 327 (83.4%) |
| Health Care & Social Assistance | 56 (10.3%) | 486 (89.7%) |
| Arts, Entertainment & Recreation | 16 (32.7%) | 33 (67.3%) |
| Accommodation & Food Services | 123 (33.2%) | 247 (66.8%) |
| Public Administration | 117 (57.4%) | 87 (42.6%) |
| Total | 2,211 (49.2%) | 2,283 (50.8%) |
Education in Pamlico County
School Enrollment in Pamlico County
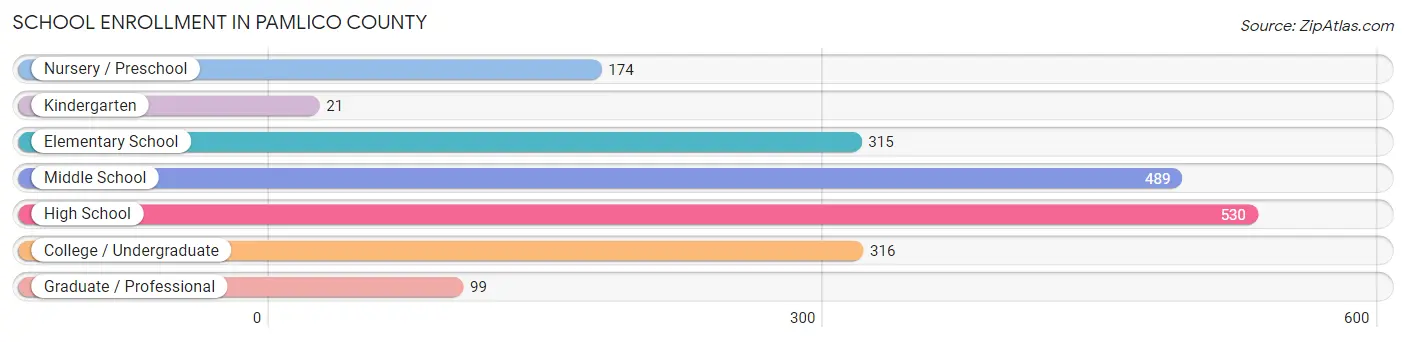
The most common levels of schooling among the 1,944 students in Pamlico County are high school (530 | 27.3%), middle school (489 | 25.2%), and college / undergraduate (316 | 16.3%).
| School Level | # Students | % Students |
| Nursery / Preschool | 174 | 8.9% |
| Kindergarten | 21 | 1.1% |
| Elementary School | 315 | 16.2% |
| Middle School | 489 | 25.2% |
| High School | 530 | 27.3% |
| College / Undergraduate | 316 | 16.3% |
| Graduate / Professional | 99 | 5.1% |
| Total | 1,944 | 100.0% |
School Enrollment by Age by Funding Source in Pamlico County
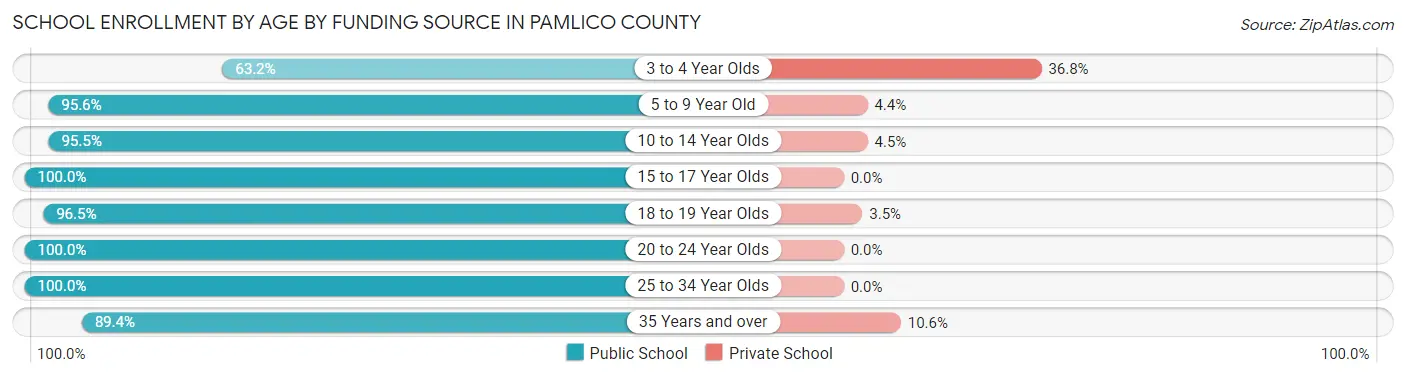
Out of a total of 1,944 students who are enrolled in schools in Pamlico County, 78 (4.0%) attend a private institution, while the remaining 1,866 (96.0%) are enrolled in public schools. The age group of 3 to 4 year olds has the highest likelihood of being enrolled in private schools, with 21 (36.8% in the age bracket) enrolled. Conversely, the age group of 15 to 17 year olds has the lowest likelihood of being enrolled in a private school, with 394 (100.0% in the age bracket) attending a public institution.
| Age Bracket | Public School | Private School |
| 3 to 4 Year Olds | 36 (63.2%) | 21 (36.8%) |
| 5 to 9 Year Old | 431 (95.6%) | 20 (4.4%) |
| 10 to 14 Year Olds | 514 (95.5%) | 24 (4.5%) |
| 15 to 17 Year Olds | 394 (100.0%) | 0 (0.0%) |
| 18 to 19 Year Olds | 222 (96.5%) | 8 (3.5%) |
| 20 to 24 Year Olds | 68 (100.0%) | 0 (0.0%) |
| 25 to 34 Year Olds | 159 (100.0%) | 0 (0.0%) |
| 35 Years and over | 42 (89.4%) | 5 (10.6%) |
| Total | 1,866 (96.0%) | 78 (4.0%) |
Educational Attainment by Field of Study in Pamlico County
Education (624 | 25.0%), business (345 | 13.8%), engineering (250 | 10.0%), science & technology (247 | 9.9%), and bio, nature & agricultural (171 | 6.9%) are the most common fields of study among 2,494 individuals in Pamlico County who have obtained a bachelor's degree or higher.
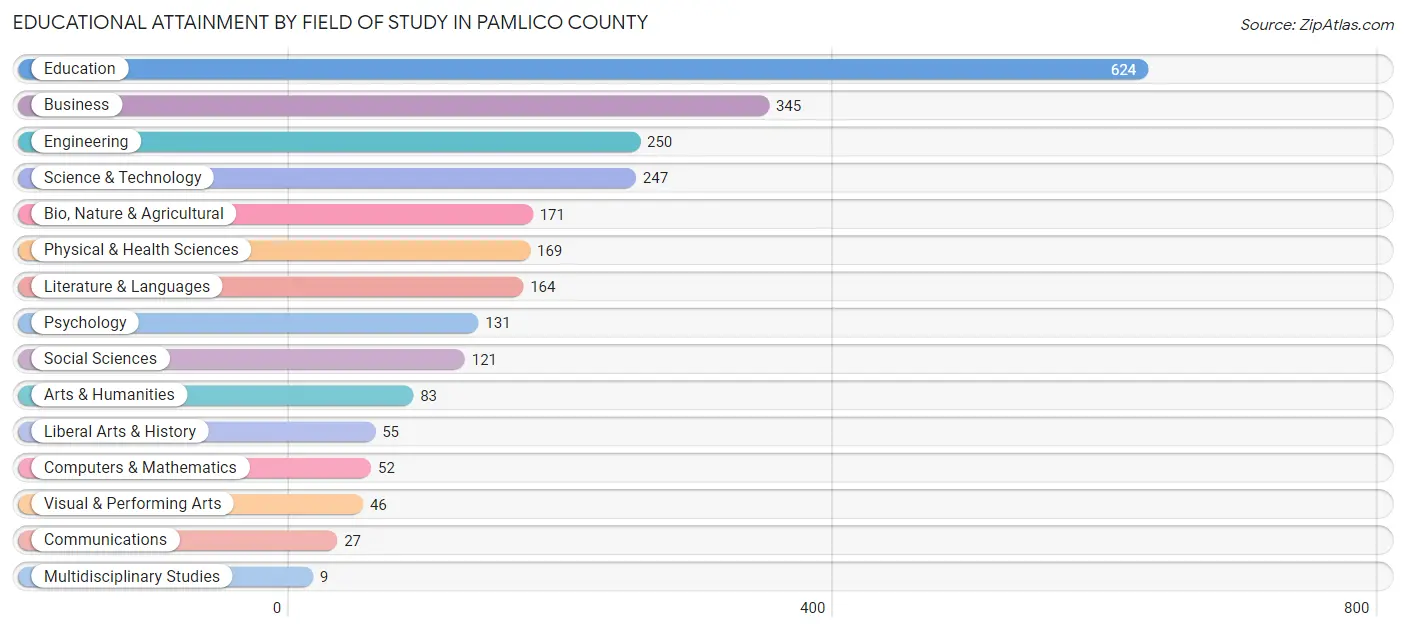
| Field of Study | # Graduates | % Graduates |
| Computers & Mathematics | 52 | 2.1% |
| Bio, Nature & Agricultural | 171 | 6.9% |
| Physical & Health Sciences | 169 | 6.8% |
| Psychology | 131 | 5.2% |
| Social Sciences | 121 | 4.9% |
| Engineering | 250 | 10.0% |
| Multidisciplinary Studies | 9 | 0.4% |
| Science & Technology | 247 | 9.9% |
| Business | 345 | 13.8% |
| Education | 624 | 25.0% |
| Literature & Languages | 164 | 6.6% |
| Liberal Arts & History | 55 | 2.2% |
| Visual & Performing Arts | 46 | 1.8% |
| Communications | 27 | 1.1% |
| Arts & Humanities | 83 | 3.3% |
| Total | 2,494 | 100.0% |
Transportation & Commute in Pamlico County
Vehicle Availability by Sex in Pamlico County
The most prevalent vehicle ownership categories in Pamlico County are males with 3 vehicles (782, accounting for 36.5%) and females with 3 vehicles (586, making up 34.7%).
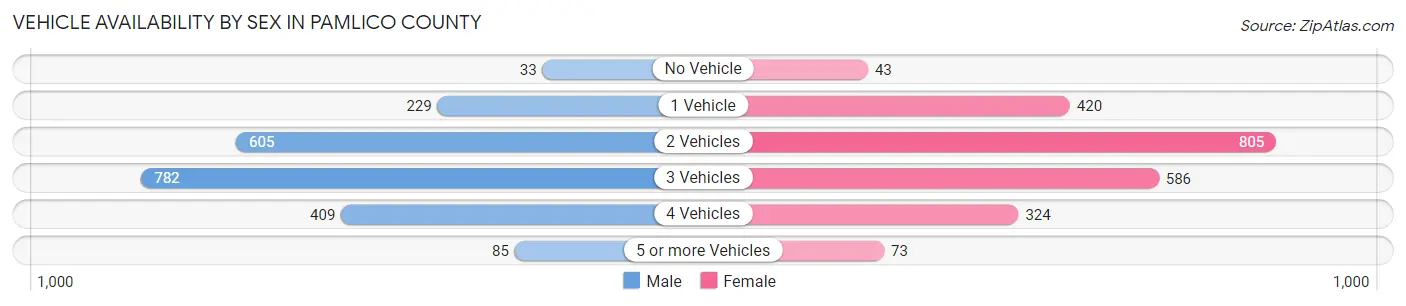
| Vehicles Available | Male | Female |
| No Vehicle | 33 (1.5%) | 43 (1.9%) |
| 1 Vehicle | 229 (10.7%) | 420 (18.7%) |
| 2 Vehicles | 605 (28.2%) | 805 (35.8%) |
| 3 Vehicles | 782 (36.5%) | 586 (26.0%) |
| 4 Vehicles | 409 (19.1%) | 324 (14.4%) |
| 5 or more Vehicles | 85 (4.0%) | 73 (3.2%) |
| Total | 2,143 (100.0%) | 2,251 (100.0%) |
Commute Time in Pamlico County
The most frequently occuring commute durations in Pamlico County are 15 to 19 minutes (722 commuters, 17.9%), 10 to 14 minutes (646 commuters, 16.0%), and 30 to 34 minutes (598 commuters, 14.8%).
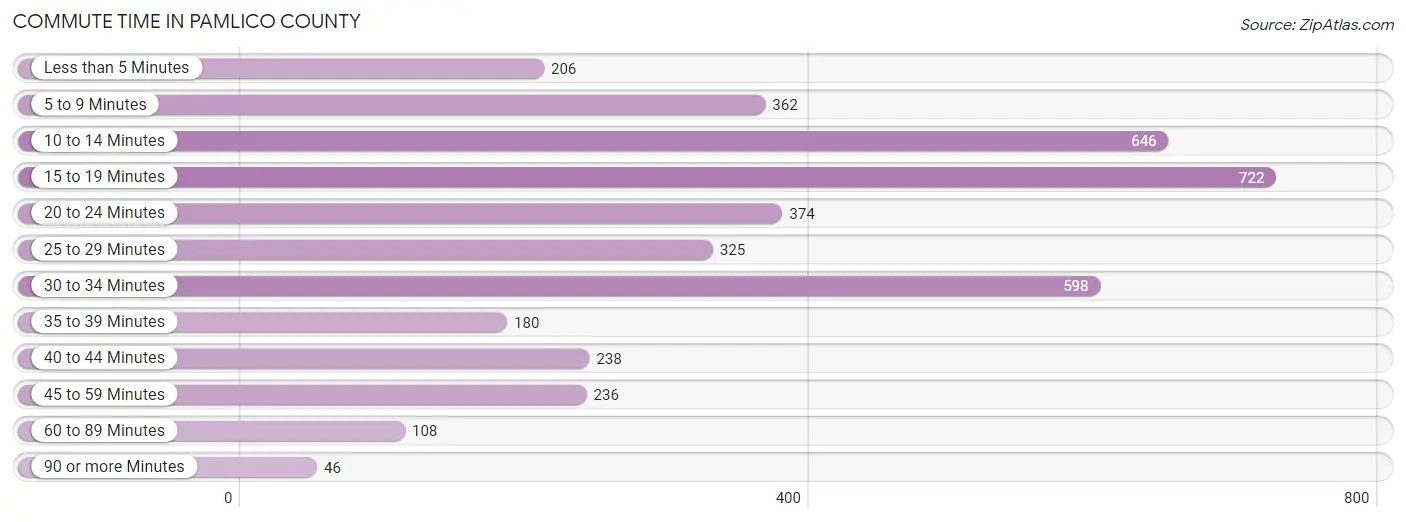
| Commute Time | # Commuters | % Commuters |
| Less than 5 Minutes | 206 | 5.1% |
| 5 to 9 Minutes | 362 | 9.0% |
| 10 to 14 Minutes | 646 | 16.0% |
| 15 to 19 Minutes | 722 | 17.9% |
| 20 to 24 Minutes | 374 | 9.3% |
| 25 to 29 Minutes | 325 | 8.0% |
| 30 to 34 Minutes | 598 | 14.8% |
| 35 to 39 Minutes | 180 | 4.4% |
| 40 to 44 Minutes | 238 | 5.9% |
| 45 to 59 Minutes | 236 | 5.8% |
| 60 to 89 Minutes | 108 | 2.7% |
| 90 or more Minutes | 46 | 1.1% |
Commute Time by Sex in Pamlico County
The most common commute times in Pamlico County are 30 to 34 minutes (401 commuters, 20.2%) for males and 15 to 19 minutes (471 commuters, 22.9%) for females.
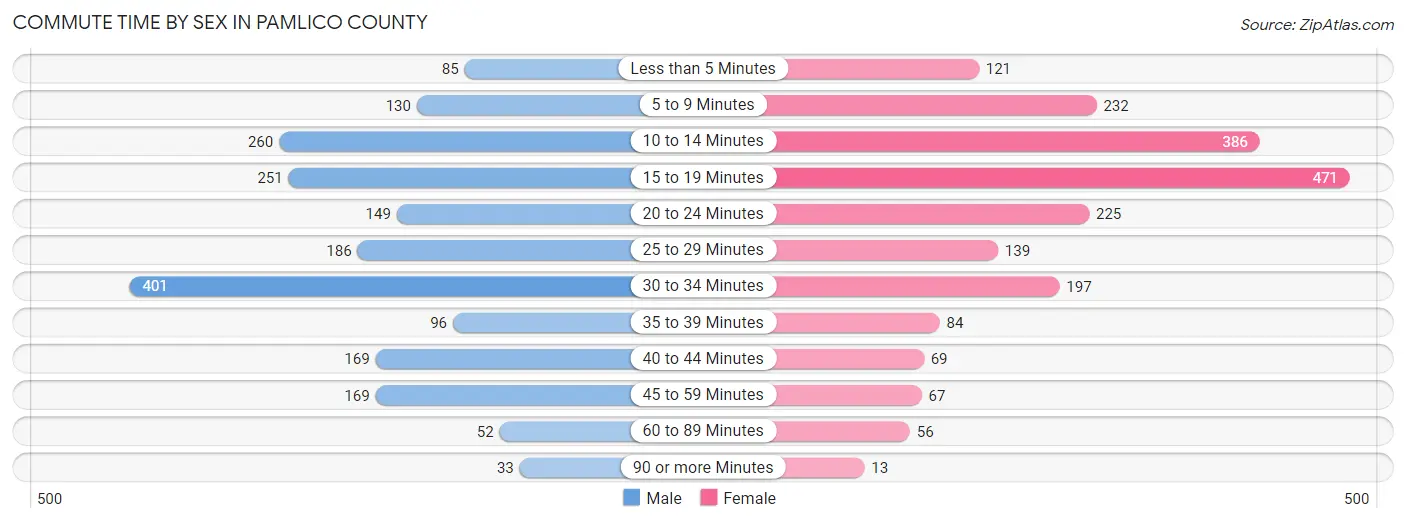
| Commute Time | Male | Female |
| Less than 5 Minutes | 85 (4.3%) | 121 (5.9%) |
| 5 to 9 Minutes | 130 (6.6%) | 232 (11.3%) |
| 10 to 14 Minutes | 260 (13.1%) | 386 (18.7%) |
| 15 to 19 Minutes | 251 (12.7%) | 471 (22.9%) |
| 20 to 24 Minutes | 149 (7.5%) | 225 (10.9%) |
| 25 to 29 Minutes | 186 (9.4%) | 139 (6.8%) |
| 30 to 34 Minutes | 401 (20.2%) | 197 (9.6%) |
| 35 to 39 Minutes | 96 (4.9%) | 84 (4.1%) |
| 40 to 44 Minutes | 169 (8.5%) | 69 (3.4%) |
| 45 to 59 Minutes | 169 (8.5%) | 67 (3.3%) |
| 60 to 89 Minutes | 52 (2.6%) | 56 (2.7%) |
| 90 or more Minutes | 33 (1.7%) | 13 (0.6%) |
Time of Departure to Work by Sex in Pamlico County
The most frequent times of departure to work in Pamlico County are 7:00 AM to 7:29 AM (494, 24.9%) for males and 7:00 AM to 7:29 AM (351, 17.0%) for females.
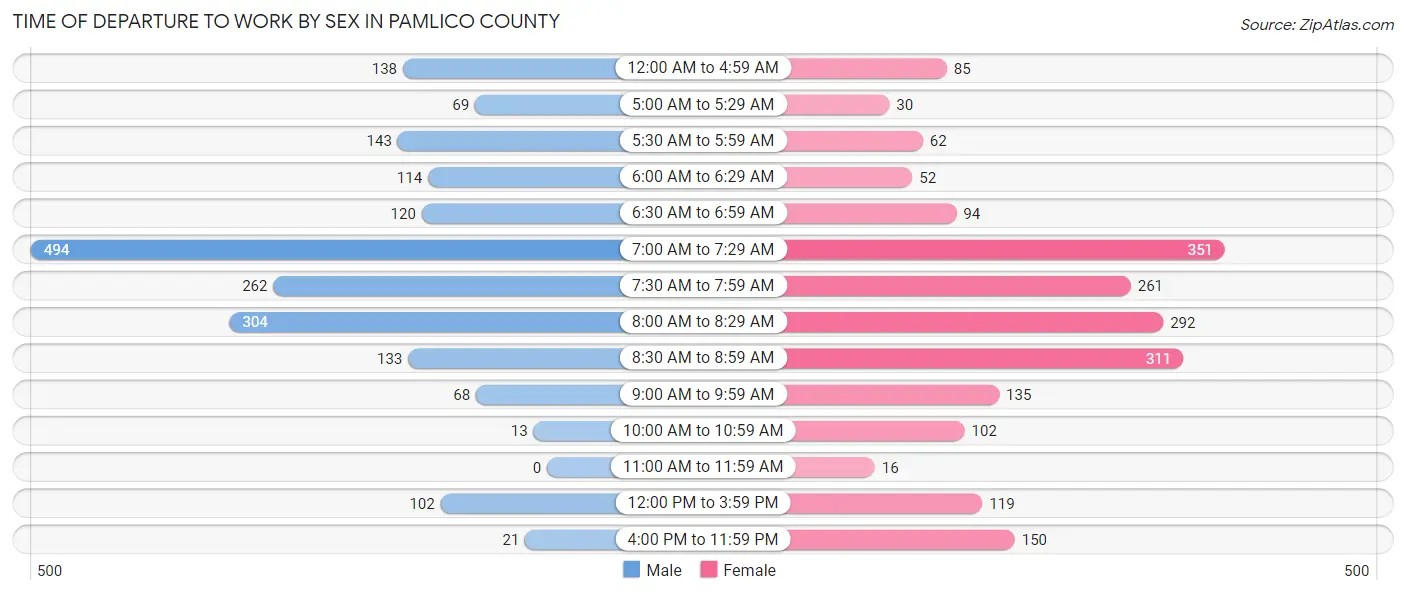
| Time of Departure | Male | Female |
| 12:00 AM to 4:59 AM | 138 (7.0%) | 85 (4.1%) |
| 5:00 AM to 5:29 AM | 69 (3.5%) | 30 (1.5%) |
| 5:30 AM to 5:59 AM | 143 (7.2%) | 62 (3.0%) |
| 6:00 AM to 6:29 AM | 114 (5.8%) | 52 (2.5%) |
| 6:30 AM to 6:59 AM | 120 (6.1%) | 94 (4.6%) |
| 7:00 AM to 7:29 AM | 494 (24.9%) | 351 (17.0%) |
| 7:30 AM to 7:59 AM | 262 (13.2%) | 261 (12.7%) |
| 8:00 AM to 8:29 AM | 304 (15.3%) | 292 (14.2%) |
| 8:30 AM to 8:59 AM | 133 (6.7%) | 311 (15.1%) |
| 9:00 AM to 9:59 AM | 68 (3.4%) | 135 (6.6%) |
| 10:00 AM to 10:59 AM | 13 (0.7%) | 102 (5.0%) |
| 11:00 AM to 11:59 AM | 0 (0.0%) | 16 (0.8%) |
| 12:00 PM to 3:59 PM | 102 (5.1%) | 119 (5.8%) |
| 4:00 PM to 11:59 PM | 21 (1.1%) | 150 (7.3%) |
| Total | 1,981 (100.0%) | 2,060 (100.0%) |
Housing Occupancy in Pamlico County
Occupancy by Ownership in Pamlico County
Of the total 5,130 dwellings in Pamlico County, owner-occupied units account for 4,185 (81.6%), while renter-occupied units make up 945 (18.4%).
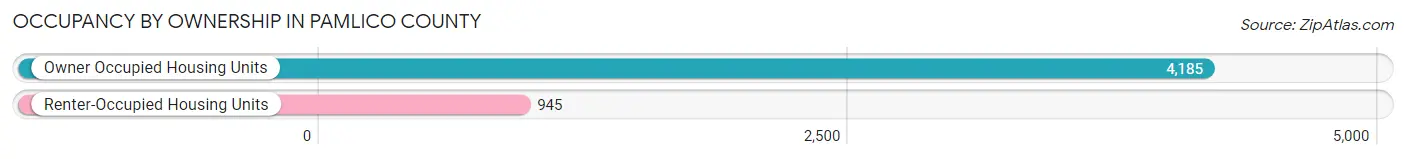
| Occupancy | # Housing Units | % Housing Units |
| Owner Occupied Housing Units | 4,185 | 81.6% |
| Renter-Occupied Housing Units | 945 | 18.4% |
| Total Occupied Housing Units | 5,130 | 100.0% |
Occupancy by Household Size in Pamlico County
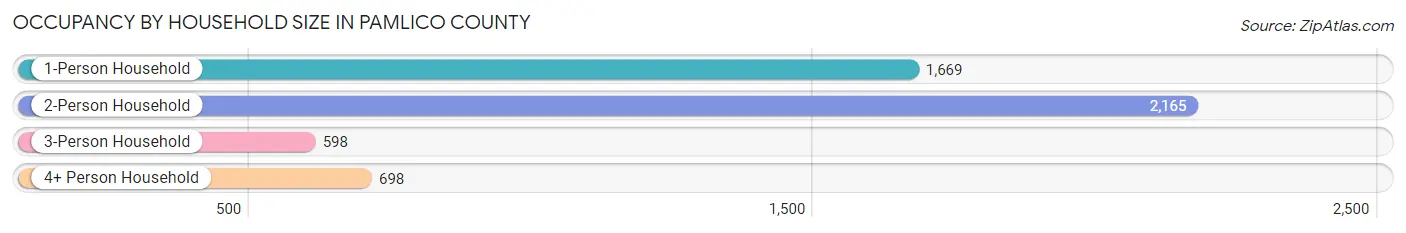
| Household Size | # Housing Units | % Housing Units |
| 1-Person Household | 1,669 | 32.5% |
| 2-Person Household | 2,165 | 42.2% |
| 3-Person Household | 598 | 11.7% |
| 4+ Person Household | 698 | 13.6% |
| Total Housing Units | 5,130 | 100.0% |
Occupancy by Ownership by Household Size in Pamlico County
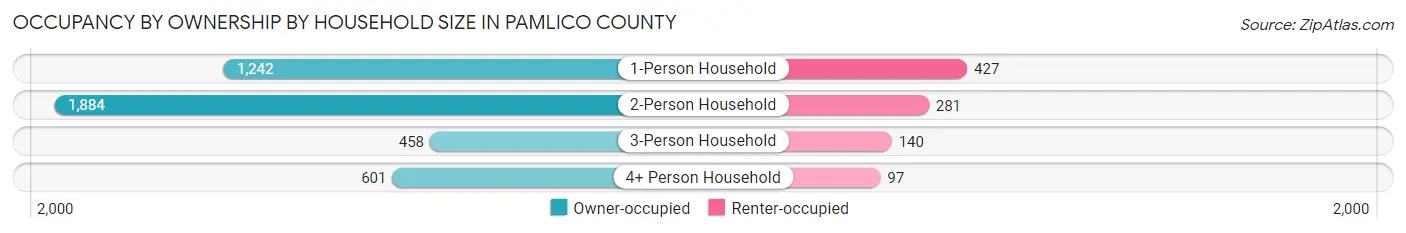
| Household Size | Owner-occupied | Renter-occupied |
| 1-Person Household | 1,242 (74.4%) | 427 (25.6%) |
| 2-Person Household | 1,884 (87.0%) | 281 (13.0%) |
| 3-Person Household | 458 (76.6%) | 140 (23.4%) |
| 4+ Person Household | 601 (86.1%) | 97 (13.9%) |
| Total Housing Units | 4,185 (81.6%) | 945 (18.4%) |
Occupancy by Educational Attainment in Pamlico County
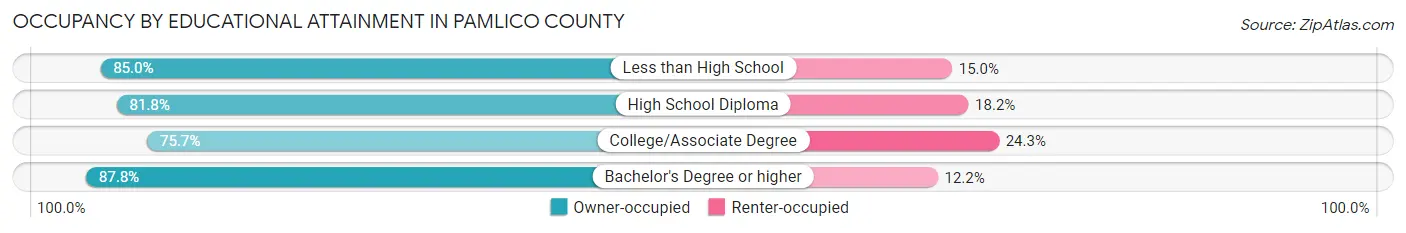
| Household Size | Owner-occupied | Renter-occupied |
| Less than High School | 374 (85.0%) | 66 (15.0%) |
| High School Diploma | 1,107 (81.8%) | 247 (18.2%) |
| College/Associate Degree | 1,411 (75.7%) | 453 (24.3%) |
| Bachelor's Degree or higher | 1,293 (87.8%) | 179 (12.2%) |
Occupancy by Age of Householder in Pamlico County
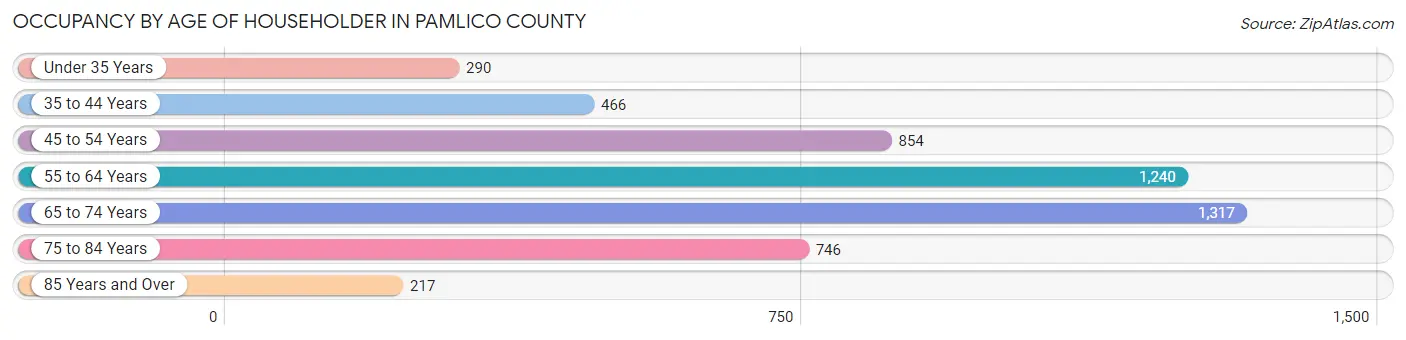
| Age Bracket | # Households | % Households |
| Under 35 Years | 290 | 5.7% |
| 35 to 44 Years | 466 | 9.1% |
| 45 to 54 Years | 854 | 16.7% |
| 55 to 64 Years | 1,240 | 24.2% |
| 65 to 74 Years | 1,317 | 25.7% |
| 75 to 84 Years | 746 | 14.5% |
| 85 Years and Over | 217 | 4.2% |
| Total | 5,130 | 100.0% |
Housing Finances in Pamlico County
Median Income by Occupancy in Pamlico County
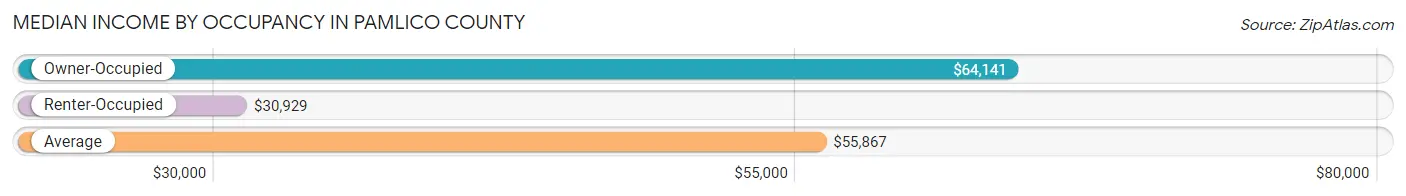
| Occupancy Type | # Households | Median Income |
| Owner-Occupied | 4,185 (81.6%) | $64,141 |
| Renter-Occupied | 945 (18.4%) | $30,929 |
| Average | 5,130 (100.0%) | $55,867 |
Occupancy by Householder Income Bracket in Pamlico County
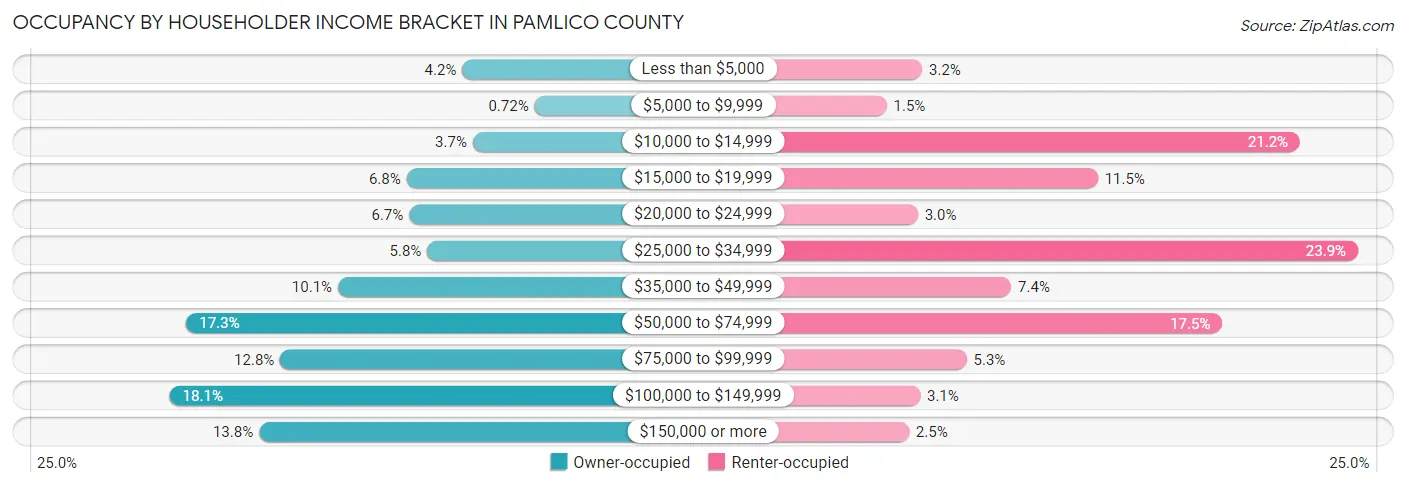
| Income Bracket | Owner-occupied | Renter-occupied |
| Less than $5,000 | 174 (4.2%) | 30 (3.2%) |
| $5,000 to $9,999 | 30 (0.7%) | 14 (1.5%) |
| $10,000 to $14,999 | 153 (3.7%) | 200 (21.2%) |
| $15,000 to $19,999 | 285 (6.8%) | 109 (11.5%) |
| $20,000 to $24,999 | 280 (6.7%) | 28 (3.0%) |
| $25,000 to $34,999 | 244 (5.8%) | 226 (23.9%) |
| $35,000 to $49,999 | 422 (10.1%) | 70 (7.4%) |
| $50,000 to $74,999 | 724 (17.3%) | 165 (17.5%) |
| $75,000 to $99,999 | 537 (12.8%) | 50 (5.3%) |
| $100,000 to $149,999 | 757 (18.1%) | 29 (3.1%) |
| $150,000 or more | 579 (13.8%) | 24 (2.5%) |
| Total | 4,185 (100.0%) | 945 (100.0%) |
Monthly Housing Cost Tiers in Pamlico County
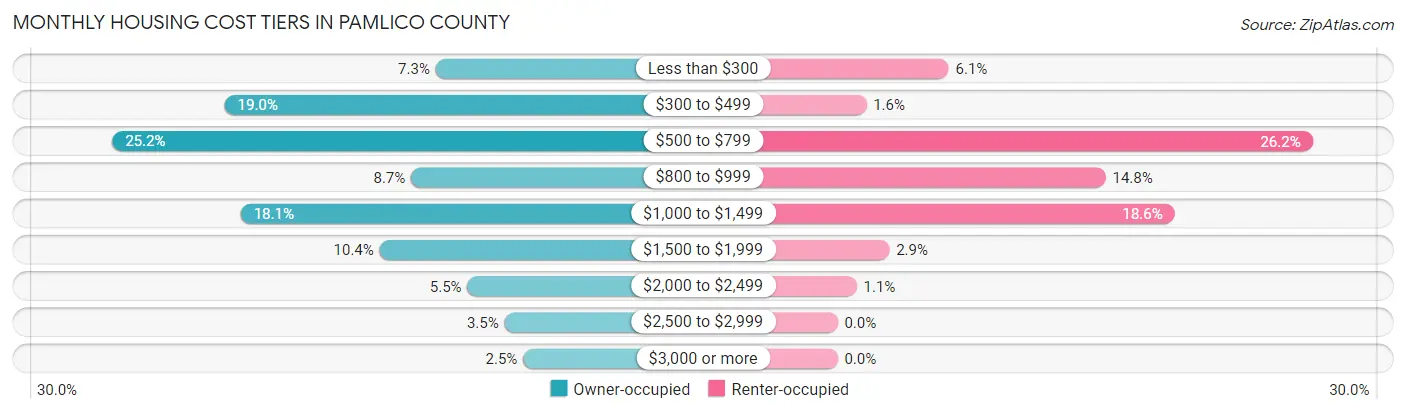
| Monthly Cost | Owner-occupied | Renter-occupied |
| Less than $300 | 305 (7.3%) | 58 (6.1%) |
| $300 to $499 | 793 (19.0%) | 15 (1.6%) |
| $500 to $799 | 1,053 (25.2%) | 248 (26.2%) |
| $800 to $999 | 362 (8.6%) | 140 (14.8%) |
| $1,000 to $1,499 | 756 (18.1%) | 176 (18.6%) |
| $1,500 to $1,999 | 435 (10.4%) | 27 (2.9%) |
| $2,000 to $2,499 | 232 (5.5%) | 10 (1.1%) |
| $2,500 to $2,999 | 146 (3.5%) | 0 (0.0%) |
| $3,000 or more | 103 (2.5%) | 0 (0.0%) |
| Total | 4,185 (100.0%) | 945 (100.0%) |
Physical Housing Characteristics in Pamlico County
Housing Structures in Pamlico County
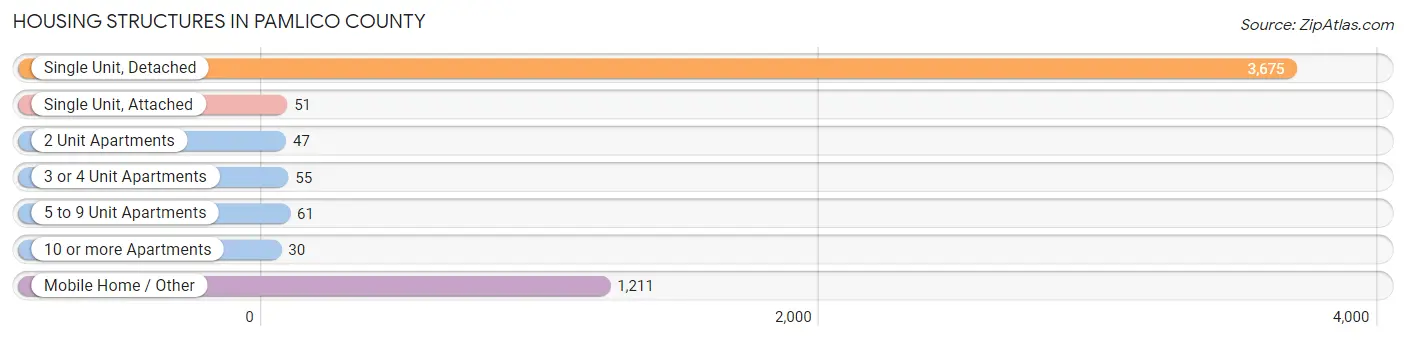
| Structure Type | # Housing Units | % Housing Units |
| Single Unit, Detached | 3,675 | 71.6% |
| Single Unit, Attached | 51 | 1.0% |
| 2 Unit Apartments | 47 | 0.9% |
| 3 or 4 Unit Apartments | 55 | 1.1% |
| 5 to 9 Unit Apartments | 61 | 1.2% |
| 10 or more Apartments | 30 | 0.6% |
| Mobile Home / Other | 1,211 | 23.6% |
| Total | 5,130 | 100.0% |
Housing Structures by Occupancy in Pamlico County
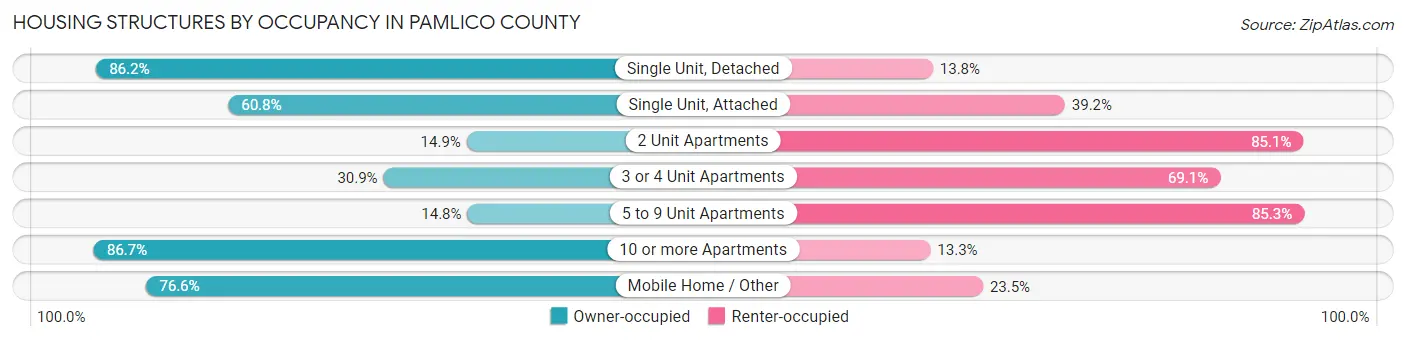
| Structure Type | Owner-occupied | Renter-occupied |
| Single Unit, Detached | 3,168 (86.2%) | 507 (13.8%) |
| Single Unit, Attached | 31 (60.8%) | 20 (39.2%) |
| 2 Unit Apartments | 7 (14.9%) | 40 (85.1%) |
| 3 or 4 Unit Apartments | 17 (30.9%) | 38 (69.1%) |
| 5 to 9 Unit Apartments | 9 (14.7%) | 52 (85.3%) |
| 10 or more Apartments | 26 (86.7%) | 4 (13.3%) |
| Mobile Home / Other | 927 (76.5%) | 284 (23.4%) |
| Total | 4,185 (81.6%) | 945 (18.4%) |
Housing Structures by Number of Rooms in Pamlico County
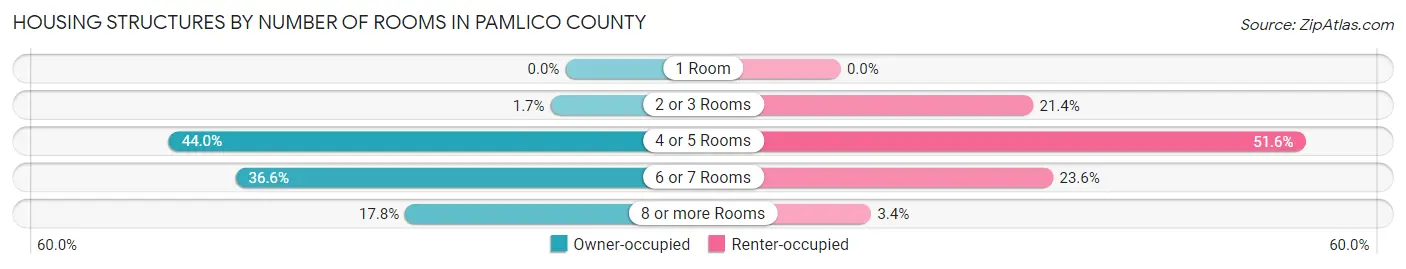
| Number of Rooms | Owner-occupied | Renter-occupied |
| 1 Room | 0 (0.0%) | 0 (0.0%) |
| 2 or 3 Rooms | 69 (1.7%) | 202 (21.4%) |
| 4 or 5 Rooms | 1,841 (44.0%) | 488 (51.6%) |
| 6 or 7 Rooms | 1,531 (36.6%) | 223 (23.6%) |
| 8 or more Rooms | 744 (17.8%) | 32 (3.4%) |
| Total | 4,185 (100.0%) | 945 (100.0%) |
Housing Structure by Heating Type in Pamlico County
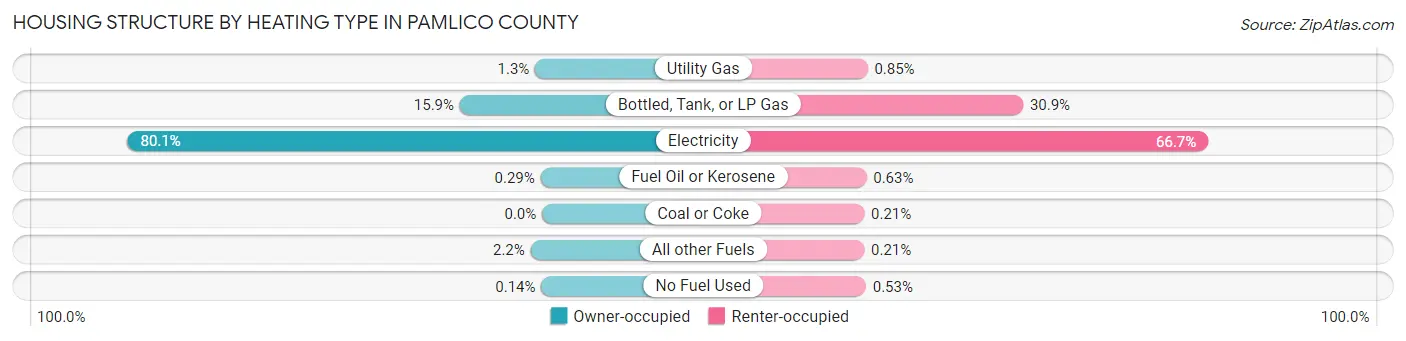
| Heating Type | Owner-occupied | Renter-occupied |
| Utility Gas | 56 (1.3%) | 8 (0.9%) |
| Bottled, Tank, or LP Gas | 665 (15.9%) | 292 (30.9%) |
| Electricity | 3,353 (80.1%) | 630 (66.7%) |
| Fuel Oil or Kerosene | 12 (0.3%) | 6 (0.6%) |
| Coal or Coke | 0 (0.0%) | 2 (0.2%) |
| All other Fuels | 93 (2.2%) | 2 (0.2%) |
| No Fuel Used | 6 (0.1%) | 5 (0.5%) |
| Total | 4,185 (100.0%) | 945 (100.0%) |
Household Vehicle Usage in Pamlico County
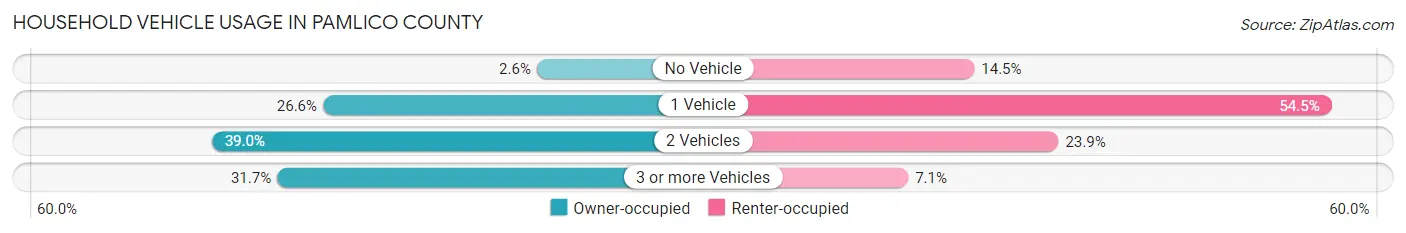
| Vehicles per Household | Owner-occupied | Renter-occupied |
| No Vehicle | 110 (2.6%) | 137 (14.5%) |
| 1 Vehicle | 1,113 (26.6%) | 515 (54.5%) |
| 2 Vehicles | 1,634 (39.0%) | 226 (23.9%) |
| 3 or more Vehicles | 1,328 (31.7%) | 67 (7.1%) |
| Total | 4,185 (100.0%) | 945 (100.0%) |
Real Estate & Mortgages in Pamlico County
Real Estate and Mortgage Overview in Pamlico County
| Characteristic | Without Mortgage | With Mortgage |
| Housing Units | 2,217 | 1,968 |
| Median Property Value | $185,500 | $213,500 |
| Median Household Income | $52,232 | $358 |
| Monthly Housing Costs | $512 | $101 |
| Real Estate Taxes | $1,100 | $11 |
Property Value by Mortgage Status in Pamlico County
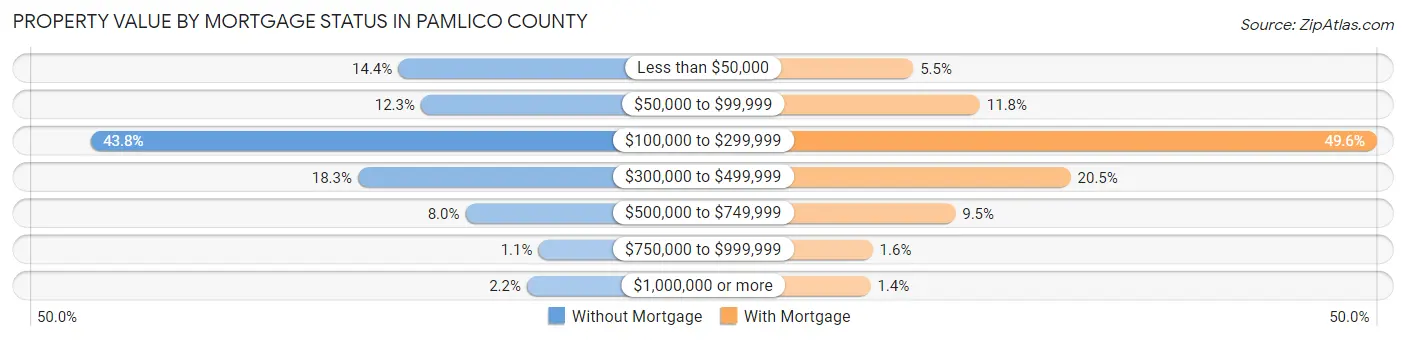
| Property Value | Without Mortgage | With Mortgage |
| Less than $50,000 | 320 (14.4%) | 108 (5.5%) |
| $50,000 to $99,999 | 272 (12.3%) | 233 (11.8%) |
| $100,000 to $299,999 | 970 (43.8%) | 977 (49.6%) |
| $300,000 to $499,999 | 405 (18.3%) | 403 (20.5%) |
| $500,000 to $749,999 | 178 (8.0%) | 187 (9.5%) |
| $750,000 to $999,999 | 24 (1.1%) | 32 (1.6%) |
| $1,000,000 or more | 48 (2.2%) | 28 (1.4%) |
| Total | 2,217 (100.0%) | 1,968 (100.0%) |
Household Income by Mortgage Status in Pamlico County
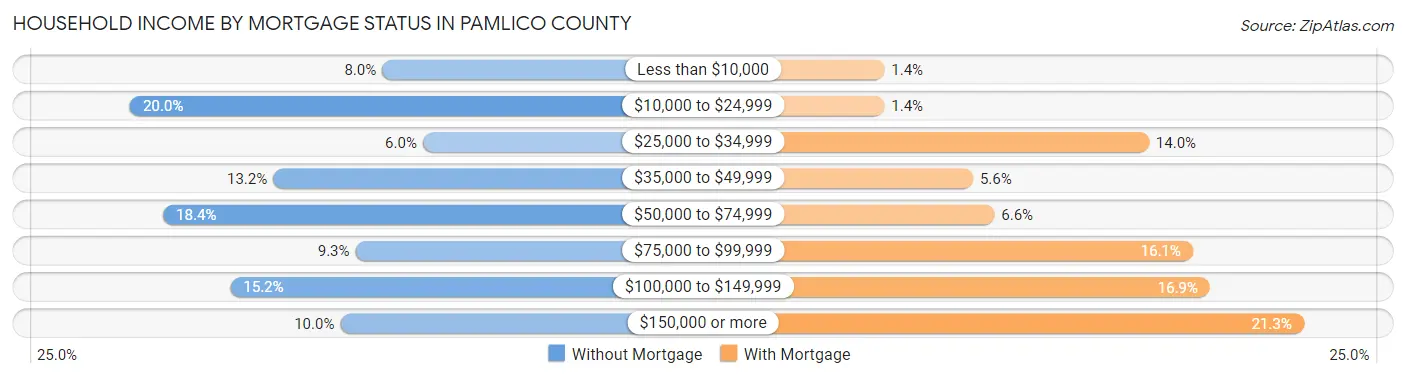
| Household Income | Without Mortgage | With Mortgage |
| Less than $10,000 | 177 (8.0%) | 27 (1.4%) |
| $10,000 to $24,999 | 443 (20.0%) | 27 (1.4%) |
| $25,000 to $34,999 | 134 (6.0%) | 275 (14.0%) |
| $35,000 to $49,999 | 292 (13.2%) | 110 (5.6%) |
| $50,000 to $74,999 | 408 (18.4%) | 130 (6.6%) |
| $75,000 to $99,999 | 205 (9.2%) | 316 (16.1%) |
| $100,000 to $149,999 | 337 (15.2%) | 332 (16.9%) |
| $150,000 or more | 221 (10.0%) | 420 (21.3%) |
| Total | 2,217 (100.0%) | 1,968 (100.0%) |
Property Value to Household Income Ratio in Pamlico County
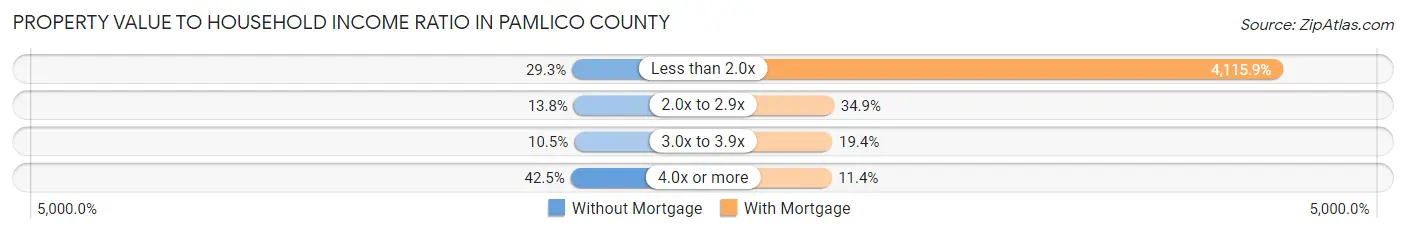
| Value-to-Income Ratio | Without Mortgage | With Mortgage |
| Less than 2.0x | 650 (29.3%) | 81,000 (4,115.8%) |
| 2.0x to 2.9x | 306 (13.8%) | 686 (34.9%) |
| 3.0x to 3.9x | 233 (10.5%) | 381 (19.4%) |
| 4.0x or more | 943 (42.5%) | 225 (11.4%) |
| Total | 2,217 (100.0%) | 1,968 (100.0%) |
Real Estate Taxes by Mortgage Status in Pamlico County
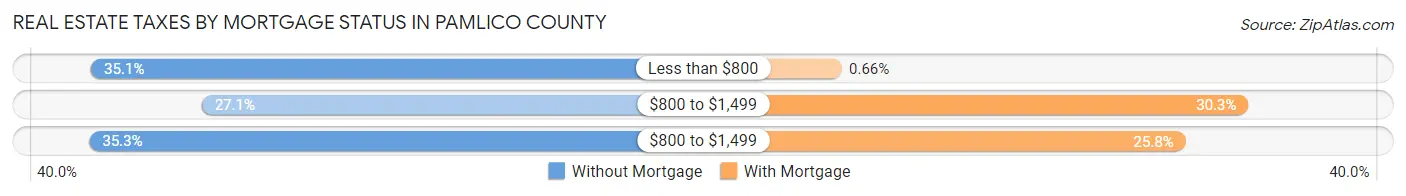
| Property Taxes | Without Mortgage | With Mortgage |
| Less than $800 | 779 (35.1%) | 13 (0.7%) |
| $800 to $1,499 | 600 (27.1%) | 597 (30.3%) |
| $800 to $1,499 | 782 (35.3%) | 507 (25.8%) |
| Total | 2,217 (100.0%) | 1,968 (100.0%) |
Health & Disability in Pamlico County
Health Insurance Coverage by Age in Pamlico County
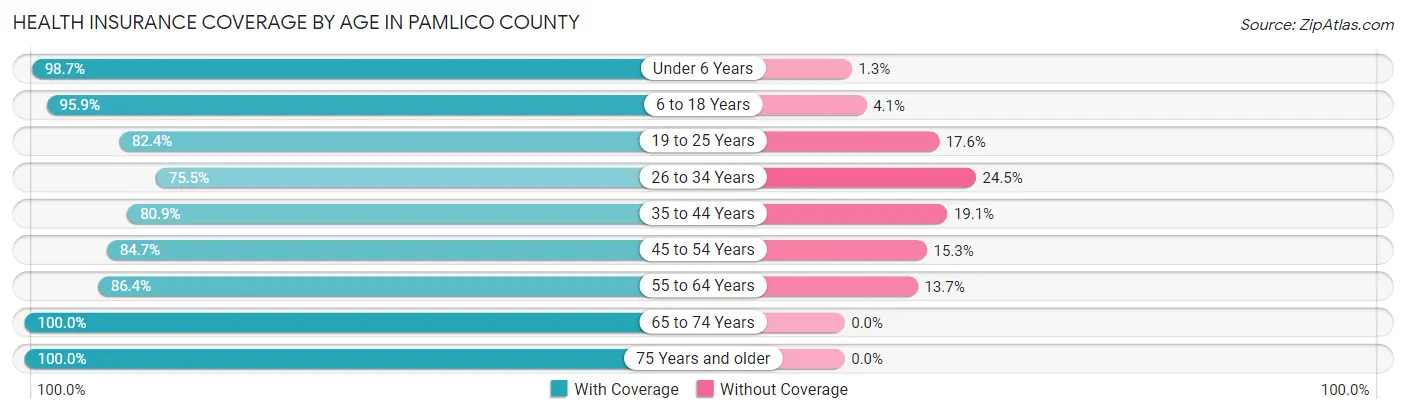
| Age Bracket | With Coverage | Without Coverage |
| Under 6 Years | 446 (98.7%) | 6 (1.3%) |
| 6 to 18 Years | 1,477 (95.9%) | 63 (4.1%) |
| 19 to 25 Years | 487 (82.4%) | 104 (17.6%) |
| 26 to 34 Years | 645 (75.5%) | 209 (24.5%) |
| 35 to 44 Years | 904 (80.9%) | 214 (19.1%) |
| 45 to 54 Years | 1,104 (84.7%) | 200 (15.3%) |
| 55 to 64 Years | 1,765 (86.4%) | 279 (13.7%) |
| 65 to 74 Years | 2,115 (100.0%) | 0 (0.0%) |
| 75 Years and older | 1,511 (100.0%) | 0 (0.0%) |
| Total | 10,454 (90.7%) | 1,075 (9.3%) |
Health Insurance Coverage by Citizenship Status in Pamlico County
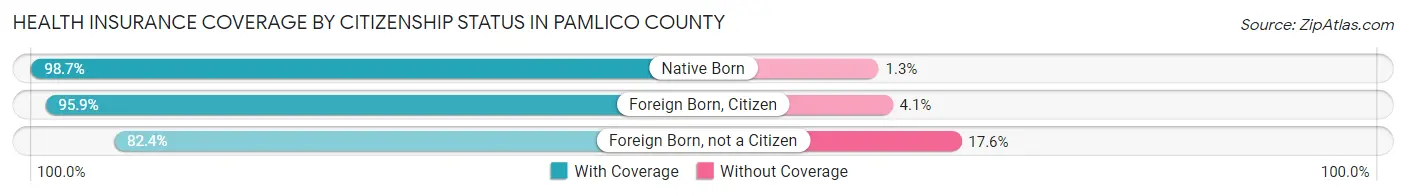
| Citizenship Status | With Coverage | Without Coverage |
| Native Born | 446 (98.7%) | 6 (1.3%) |
| Foreign Born, Citizen | 1,477 (95.9%) | 63 (4.1%) |
| Foreign Born, not a Citizen | 487 (82.4%) | 104 (17.6%) |
Health Insurance Coverage by Household Income in Pamlico County
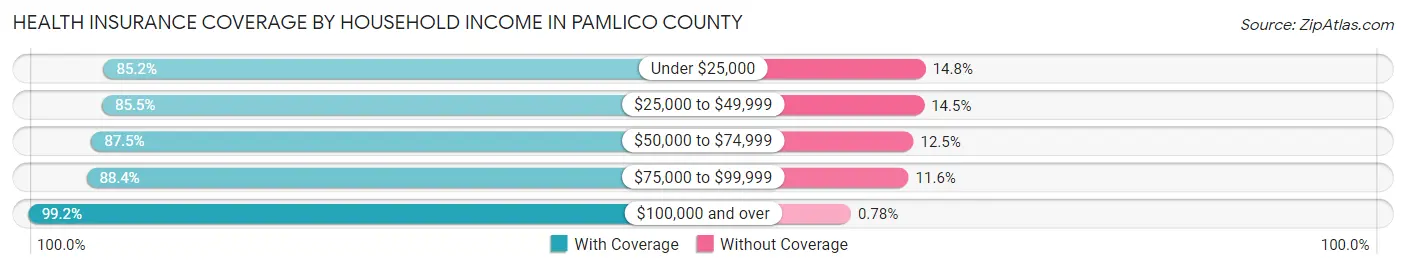
| Household Income | With Coverage | Without Coverage |
| Under $25,000 | 1,757 (85.2%) | 305 (14.8%) |
| $25,000 to $49,999 | 1,585 (85.5%) | 269 (14.5%) |
| $50,000 to $74,999 | 2,057 (87.5%) | 294 (12.5%) |
| $75,000 to $99,999 | 1,312 (88.4%) | 172 (11.6%) |
| $100,000 and over | 3,693 (99.2%) | 29 (0.8%) |
Public vs Private Health Insurance Coverage by Age in Pamlico County
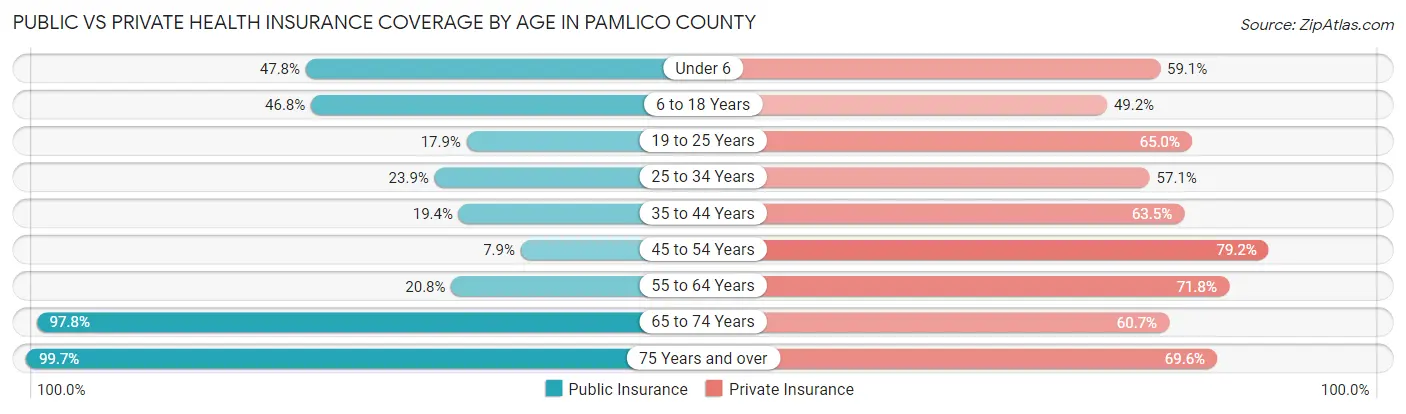
| Age Bracket | Public Insurance | Private Insurance |
| Under 6 | 216 (47.8%) | 267 (59.1%) |
| 6 to 18 Years | 721 (46.8%) | 758 (49.2%) |
| 19 to 25 Years | 106 (17.9%) | 384 (65.0%) |
| 25 to 34 Years | 204 (23.9%) | 488 (57.1%) |
| 35 to 44 Years | 217 (19.4%) | 710 (63.5%) |
| 45 to 54 Years | 103 (7.9%) | 1,033 (79.2%) |
| 55 to 64 Years | 425 (20.8%) | 1,468 (71.8%) |
| 65 to 74 Years | 2,068 (97.8%) | 1,284 (60.7%) |
| 75 Years and over | 1,507 (99.7%) | 1,052 (69.6%) |
| Total | 5,567 (48.3%) | 7,444 (64.6%) |
Disability Status by Sex by Age in Pamlico County
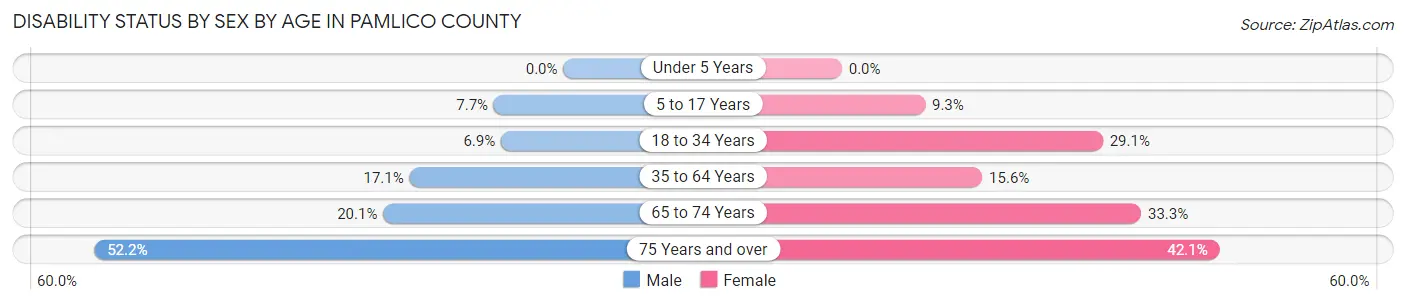
| Age Bracket | Male | Female |
| Under 5 Years | 0 (0.0%) | 0 (0.0%) |
| 5 to 17 Years | 57 (7.7%) | 66 (9.3%) |
| 18 to 34 Years | 64 (6.9%) | 213 (29.1%) |
| 35 to 64 Years | 353 (17.1%) | 376 (15.6%) |
| 65 to 74 Years | 195 (20.1%) | 381 (33.3%) |
| 75 Years and over | 361 (52.2%) | 345 (42.1%) |
Disability Class by Sex by Age in Pamlico County
Disability Class: Hearing Difficulty
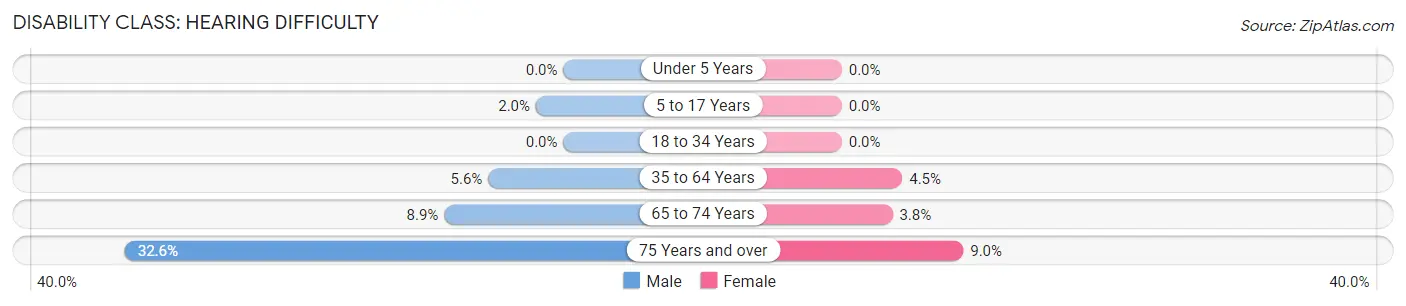
| Age Bracket | Male | Female |
| Under 5 Years | 0 (0.0%) | 0 (0.0%) |
| 5 to 17 Years | 15 (2.0%) | 0 (0.0%) |
| 18 to 34 Years | 0 (0.0%) | 0 (0.0%) |
| 35 to 64 Years | 115 (5.6%) | 108 (4.5%) |
| 65 to 74 Years | 86 (8.8%) | 43 (3.8%) |
| 75 Years and over | 225 (32.6%) | 74 (9.0%) |
Disability Class: Vision Difficulty
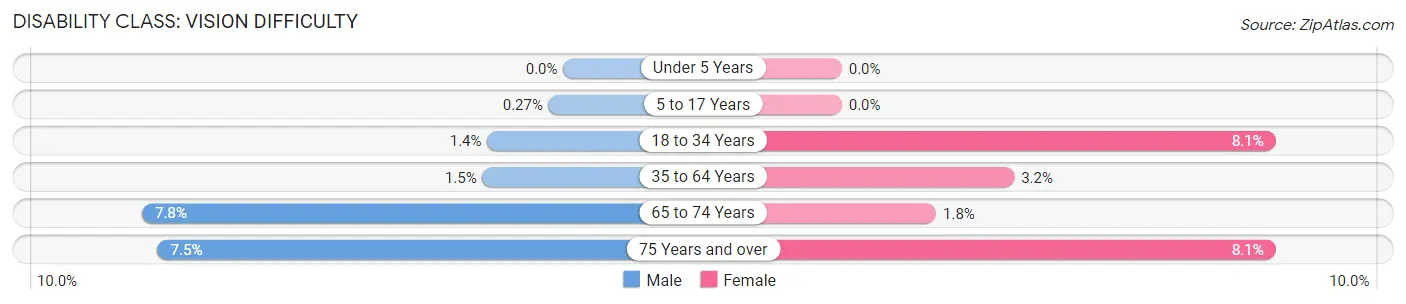
| Age Bracket | Male | Female |
| Under 5 Years | 0 (0.0%) | 0 (0.0%) |
| 5 to 17 Years | 2 (0.3%) | 0 (0.0%) |
| 18 to 34 Years | 13 (1.4%) | 59 (8.1%) |
| 35 to 64 Years | 31 (1.5%) | 77 (3.2%) |
| 65 to 74 Years | 76 (7.8%) | 20 (1.8%) |
| 75 Years and over | 52 (7.5%) | 66 (8.1%) |
Disability Class: Cognitive Difficulty
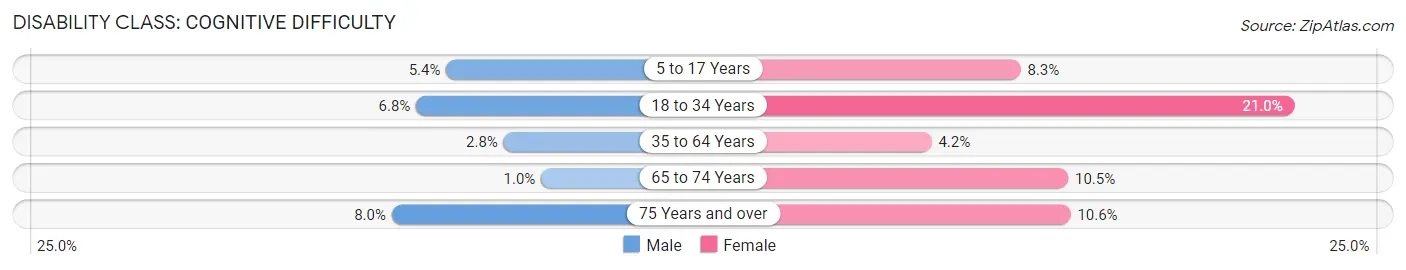
| Age Bracket | Male | Female |
| 5 to 17 Years | 40 (5.4%) | 59 (8.3%) |
| 18 to 34 Years | 63 (6.8%) | 154 (21.0%) |
| 35 to 64 Years | 57 (2.8%) | 100 (4.2%) |
| 65 to 74 Years | 10 (1.0%) | 120 (10.5%) |
| 75 Years and over | 55 (8.0%) | 87 (10.6%) |
Disability Class: Ambulatory Difficulty
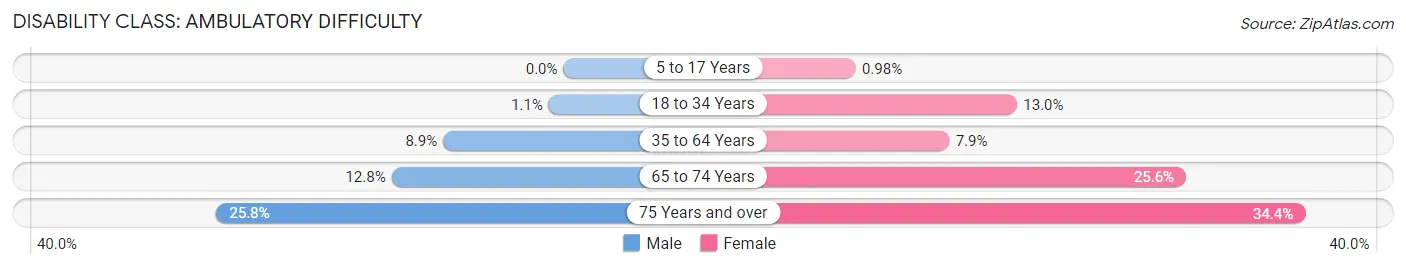
| Age Bracket | Male | Female |
| 5 to 17 Years | 0 (0.0%) | 7 (1.0%) |
| 18 to 34 Years | 10 (1.1%) | 95 (13.0%) |
| 35 to 64 Years | 184 (8.9%) | 191 (7.9%) |
| 65 to 74 Years | 124 (12.8%) | 292 (25.6%) |
| 75 Years and over | 178 (25.8%) | 282 (34.4%) |
Disability Class: Self-Care Difficulty
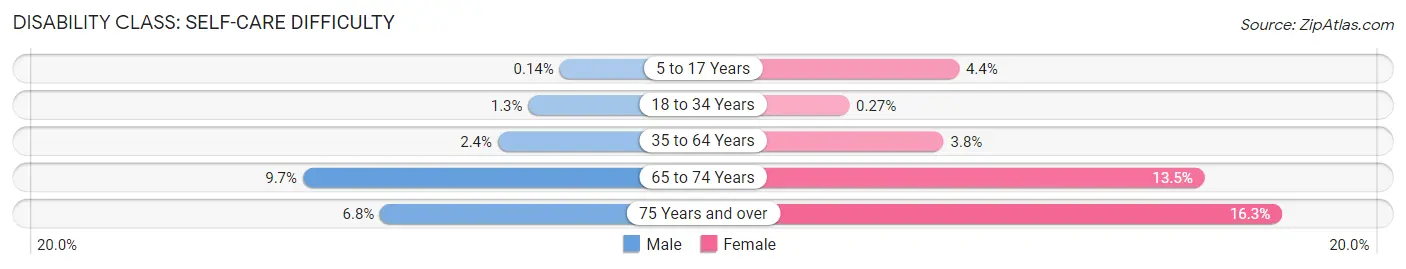
| Age Bracket | Male | Female |
| 5 to 17 Years | 1 (0.1%) | 31 (4.3%) |
| 18 to 34 Years | 12 (1.3%) | 2 (0.3%) |
| 35 to 64 Years | 50 (2.4%) | 91 (3.8%) |
| 65 to 74 Years | 94 (9.7%) | 154 (13.5%) |
| 75 Years and over | 47 (6.8%) | 134 (16.3%) |
Technology Access in Pamlico County
Computing Device Access in Pamlico County
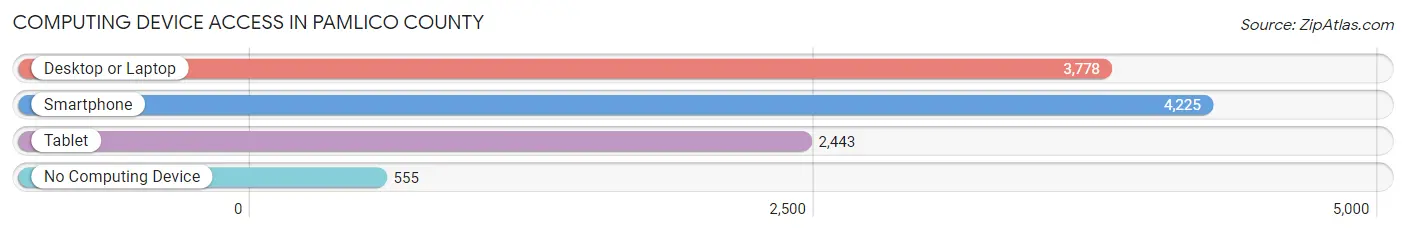
| Device Type | # Households | % Households |
| Desktop or Laptop | 3,778 | 73.7% |
| Smartphone | 4,225 | 82.4% |
| Tablet | 2,443 | 47.6% |
| No Computing Device | 555 | 10.8% |
| Total | 5,130 | 100.0% |
Internet Access in Pamlico County
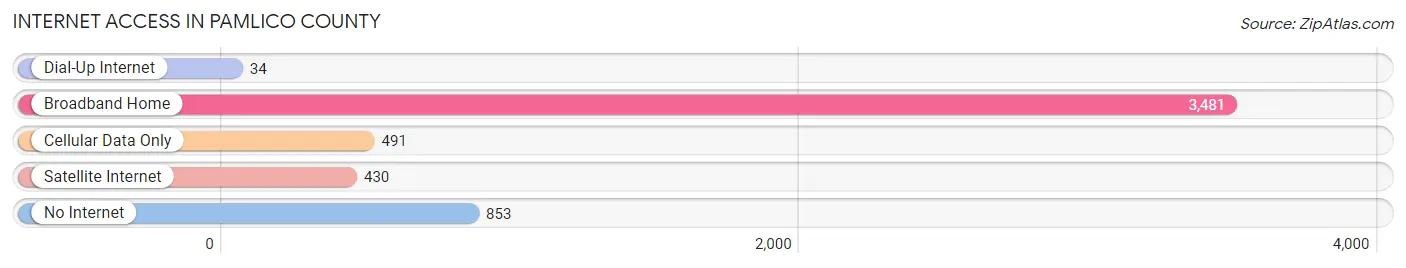
| Internet Type | # Households | % Households |
| Dial-Up Internet | 34 | 0.7% |
| Broadband Home | 3,481 | 67.9% |
| Cellular Data Only | 491 | 9.6% |
| Satellite Internet | 430 | 8.4% |
| No Internet | 853 | 16.6% |
| Total | 5,130 | 100.0% |
Pamlico County Summary
Pamlico County is a county located in the U.S. state of North Carolina. As of the 2010 census, the population was 13,144. Its county seat is Bayboro. The county was created in 1872 from parts of Beaufort and Craven counties. It is named for the Pamlico River, which forms its western boundary.
History
The area that is now Pamlico County was inhabited by Native Americans for thousands of years before the arrival of Europeans. The first Europeans to explore the area were Spanish explorers in the 16th century. The first permanent European settlers arrived in the early 18th century, and the area was part of the colonial Province of North Carolina.
Pamlico County was formed in 1872 from parts of Beaufort and Craven counties. It was named for the Pamlico River, which forms its western boundary. The county seat is Bayboro, which was established in 1874.
Geography
Pamlico County is located in the coastal plain region of North Carolina. It is bordered to the north by Craven County, to the east by Beaufort County, to the south by Hyde County, and to the west by the Pamlico River. The county has a total area of 517 square miles, of which 486 square miles is land and 31 square miles is water.
The county is divided into two distinct geographic regions. The western half of the county is part of the Inner Banks region, which is characterized by low-lying terrain and numerous rivers and streams. The eastern half of the county is part of the Outer Banks region, which is characterized by higher elevations and sandy beaches.
Economy
The economy of Pamlico County is largely based on agriculture and fishing. The county is home to several large farms, which produce a variety of crops, including corn, soybeans, wheat, and cotton. The county is also home to several commercial fishing operations, which harvest a variety of seafood, including shrimp, oysters, and crabs.
In addition to agriculture and fishing, the county is home to several manufacturing companies, which produce a variety of products, including furniture, textiles, and electronics. The county is also home to several tourism-related businesses, which cater to visitors to the area's beaches and other attractions.
Demographics
As of the 2010 census, there were 13,144 people, 5,093 households, and 3,541 families living in the county. The population density was 27 people per square mile. There were 6,845 housing units at an average density of 14 per square mile. The racial makeup of the county was 73.3% White, 22.2% African American, 0.5% Native American, 0.7% Asian, 0.1% Pacific Islander, 1.7% from other races, and 1.5% from two or more races. Hispanic or Latino of any race were 3.3% of the population.
The median income for a household in the county was $35,945, and the median income for a family was $44,945. The per capita income for the county was $18,945. About 17.3% of families and 21.2% of the population were below the poverty line, including 28.3% of those under age 18 and 16.2% of those age 65 or over.
Common Questions
What is Per Capita Income in Pamlico County?
Per Capita income in Pamlico County is $32,677.
What is the Median Family Income in Pamlico County?
Median Family Income in Pamlico County is $78,649.
What is the Median Household income in Pamlico County?
Median Household Income in Pamlico County is $55,867.
What is Income or Wage Gap in Pamlico County?
Income or Wage Gap in Pamlico County is 33.0%.
Women in Pamlico County earn 67.0 cents for every dollar earned by a man.
What is Inequality or Gini Index in Pamlico County?
Inequality or Gini Index in Pamlico County is 0.48.
What is the Total Population of Pamlico County?
Total Population of Pamlico County is 12,317.
What is the Total Male Population of Pamlico County?
Total Male Population of Pamlico County is 6,337.
What is the Total Female Population of Pamlico County?
Total Female Population of Pamlico County is 5,980.
What is the Ratio of Males per 100 Females in Pamlico County?
There are 105.97 Males per 100 Females in Pamlico County.
What is the Ratio of Females per 100 Males in Pamlico County?
There are 94.37 Females per 100 Males in Pamlico County.
What is the Median Population Age in Pamlico County?
Median Population Age in Pamlico County is 54.2 Years.
What is the Average Family Size in Pamlico County
Average Family Size in Pamlico County is 2.8 People.
What is the Average Household Size in Pamlico County
Average Household Size in Pamlico County is 2.2 People.
How Large is the Labor Force in Pamlico County?
There are 4,713 People in the Labor Forcein in Pamlico County.
What is the Percentage of People in the Labor Force in Pamlico County?
43.4% of People are in the Labor Force in Pamlico County.
What is the Unemployment Rate in Pamlico County?
Unemployment Rate in Pamlico County is 4.6%.