Northampton County, NC Map & Demographics
Northampton County Map
Northampton County Overview
$29,047
PER CAPITA INCOME
$59,301
AVG FAMILY INCOME
$45,698
AVG HOUSEHOLD INCOME
22.0%
WAGE / INCOME GAP [ % ]
78.0¢/ $1
WAGE / INCOME GAP [ $ ]
$10,979
FAMILY INCOME DEFICIT
0.49
INEQUALITY / GINI INDEX
17,528
TOTAL POPULATION
8,481
MALE POPULATION
9,047
FEMALE POPULATION
93.74
MALES / 100 FEMALES
106.67
FEMALES / 100 MALES
51.3
MEDIAN AGE
2.9
AVG FAMILY SIZE
2.2
AVG HOUSEHOLD SIZE
7,418
LABOR FORCE [ PEOPLE ]
50.1%
PERCENT IN LABOR FORCE
7.6%
UNEMPLOYMENT RATE
Northampton County Area Codes
Income in Northampton County
Income Overview in Northampton County
Per Capita Income in Northampton County is $29,047, while median incomes of families and households are $59,301 and $45,698 respectively.
| Characteristic | Number | Measure |
| Per Capita Income | 17,528 | $29,047 |
| Median Family Income | 4,607 | $59,301 |
| Mean Family Income | 4,607 | $78,696 |
| Median Household Income | 7,463 | $45,698 |
| Mean Household Income | 7,463 | $66,018 |
| Income Deficit | 4,607 | $10,979 |
| Wage / Income Gap (%) | 17,528 | 21.99% |
| Wage / Income Gap ($) | 17,528 | 78.01¢ per $1 |
| Gini / Inequality Index | 17,528 | 0.49 |
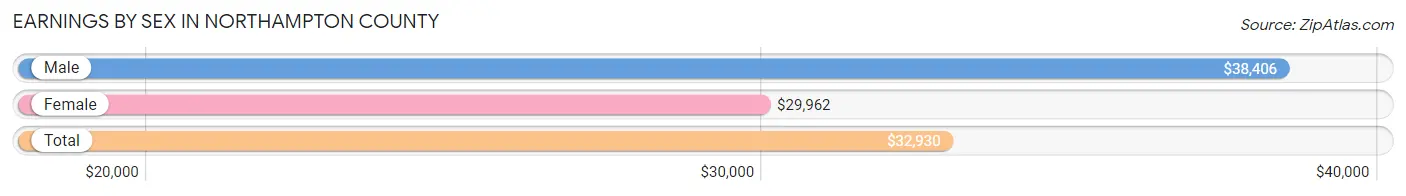
Earnings by Sex in Northampton County
Average Earnings in Northampton County are $32,930, $38,406 for men and $29,962 for women, a difference of 22.0%.
| Sex | Number | Average Earnings |
| Male | 3,609 (46.6%) | $38,406 |
| Female | 4,130 (53.4%) | $29,962 |
| Total | 7,739 (100.0%) | $32,930 |
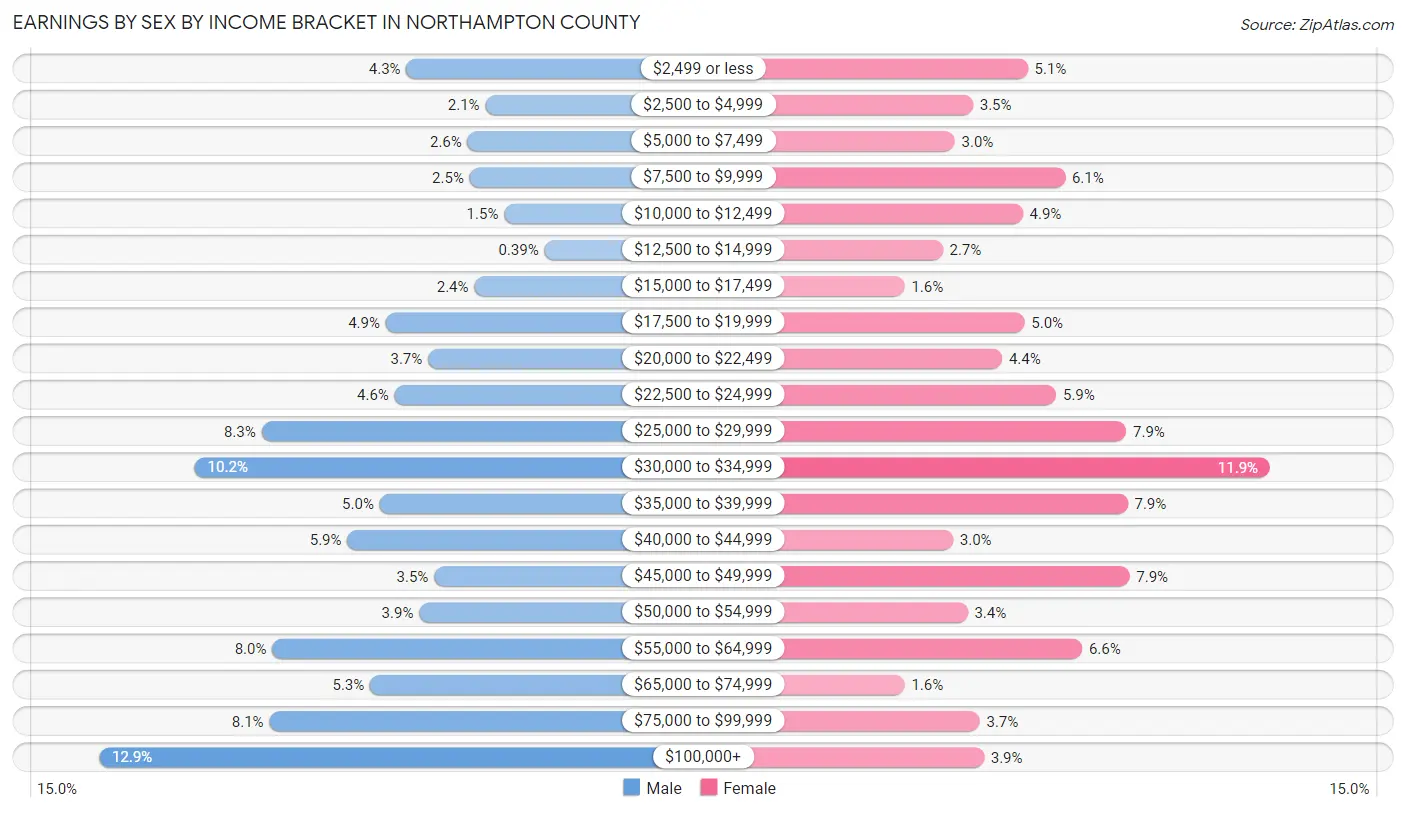
Earnings by Sex by Income Bracket in Northampton County
The most common earnings brackets in Northampton County are $100,000+ for men (466 | 12.9%) and $30,000 to $34,999 for women (491 | 11.9%).
| Income | Male | Female |
| $2,499 or less | 154 (4.3%) | 210 (5.1%) |
| $2,500 to $4,999 | 74 (2.1%) | 146 (3.5%) |
| $5,000 to $7,499 | 92 (2.5%) | 125 (3.0%) |
| $7,500 to $9,999 | 90 (2.5%) | 253 (6.1%) |
| $10,000 to $12,499 | 55 (1.5%) | 204 (4.9%) |
| $12,500 to $14,999 | 14 (0.4%) | 111 (2.7%) |
| $15,000 to $17,499 | 85 (2.4%) | 67 (1.6%) |
| $17,500 to $19,999 | 175 (4.9%) | 206 (5.0%) |
| $20,000 to $22,499 | 132 (3.7%) | 180 (4.4%) |
| $22,500 to $24,999 | 166 (4.6%) | 243 (5.9%) |
| $25,000 to $29,999 | 301 (8.3%) | 324 (7.9%) |
| $30,000 to $34,999 | 369 (10.2%) | 491 (11.9%) |
| $35,000 to $39,999 | 181 (5.0%) | 326 (7.9%) |
| $40,000 to $44,999 | 214 (5.9%) | 123 (3.0%) |
| $45,000 to $49,999 | 126 (3.5%) | 328 (7.9%) |
| $50,000 to $54,999 | 141 (3.9%) | 140 (3.4%) |
| $55,000 to $64,999 | 290 (8.0%) | 273 (6.6%) |
| $65,000 to $74,999 | 191 (5.3%) | 67 (1.6%) |
| $75,000 to $99,999 | 293 (8.1%) | 154 (3.7%) |
| $100,000+ | 466 (12.9%) | 159 (3.8%) |
| Total | 3,609 (100.0%) | 4,130 (100.0%) |
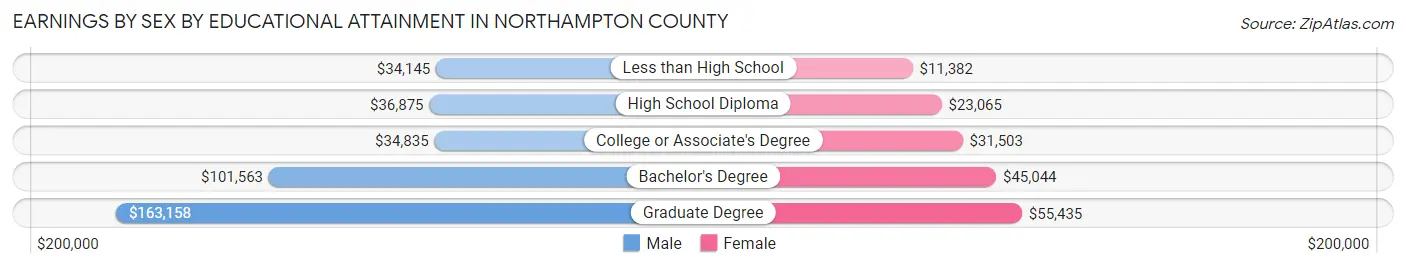
Earnings by Sex by Educational Attainment in Northampton County
Average earnings in Northampton County are $40,755 for men and $31,334 for women, a difference of 23.1%. Men with an educational attainment of graduate degree enjoy the highest average annual earnings of $163,158, while those with less than high school education earn the least with $34,145. Women with an educational attainment of graduate degree earn the most with the average annual earnings of $55,435, while those with less than high school education have the smallest earnings of $11,382.
| Educational Attainment | Male Income | Female Income |
| Less than High School | $34,145 | $11,382 |
| High School Diploma | $36,875 | $23,065 |
| College or Associate's Degree | $34,835 | $31,503 |
| Bachelor's Degree | $101,563 | $45,044 |
| Graduate Degree | $163,158 | $55,435 |
| Total | $40,755 | $31,334 |
Family Income in Northampton County
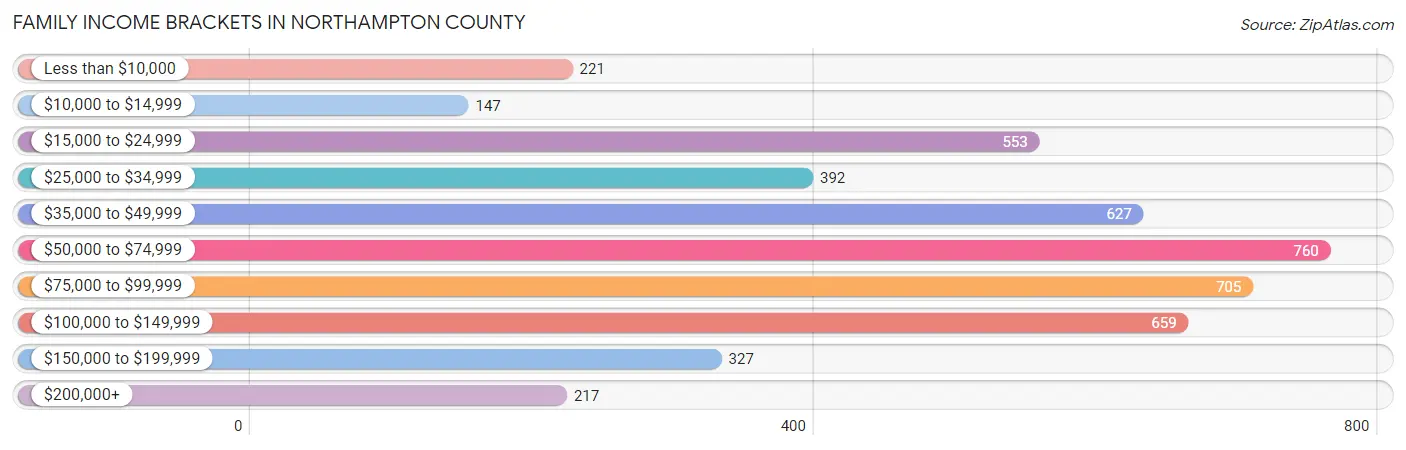
Family Income Brackets in Northampton County
According to the Northampton County family income data, there are 760 families falling into the $50,000 to $74,999 income range, which is the most common income bracket and makes up 16.5% of all families. Conversely, the $10,000 to $14,999 income bracket is the least frequent group with only 147 families (3.2%) belonging to this category.
| Income Bracket | # Families | % Families |
| Less than $10,000 | 221 | 4.8% |
| $10,000 to $14,999 | 147 | 3.2% |
| $15,000 to $24,999 | 553 | 12.0% |
| $25,000 to $34,999 | 392 | 8.5% |
| $35,000 to $49,999 | 627 | 13.6% |
| $50,000 to $74,999 | 760 | 16.5% |
| $75,000 to $99,999 | 705 | 15.3% |
| $100,000 to $149,999 | 659 | 14.3% |
| $150,000 to $199,999 | 327 | 7.1% |
| $200,000+ | 217 | 4.7% |
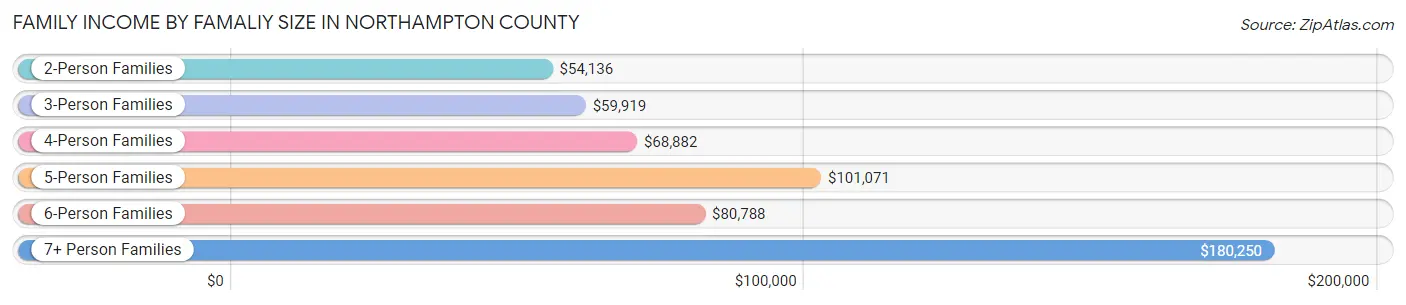
Family Income by Famaliy Size in Northampton County
7+ person families (73 | 1.6%) account for the highest median family income in Northampton County with $180,250 per family, while 2-person families (2,766 | 60.0%) have the highest median income of $27,068 per family member.
| Income Bracket | # Families | Median Income |
| 2-Person Families | 2,766 (60.0%) | $54,136 |
| 3-Person Families | 812 (17.6%) | $59,919 |
| 4-Person Families | 491 (10.7%) | $68,882 |
| 5-Person Families | 350 (7.6%) | $101,071 |
| 6-Person Families | 115 (2.5%) | $80,788 |
| 7+ Person Families | 73 (1.6%) | $180,250 |
| Total | 4,607 (100.0%) | $59,301 |
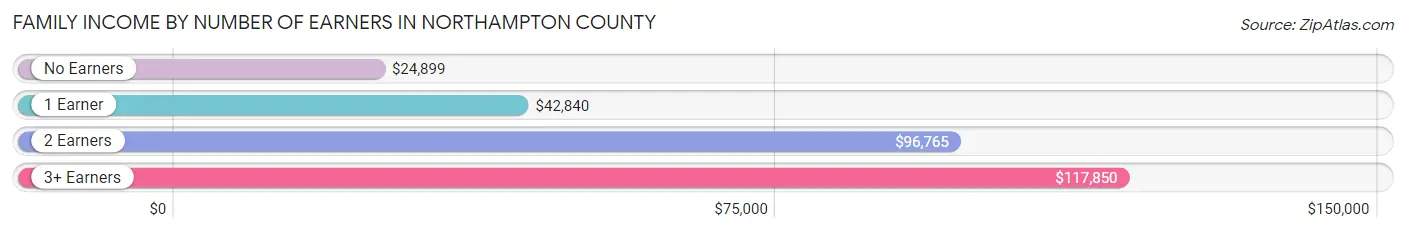
Family Income by Number of Earners in Northampton County
The median family income in Northampton County is $59,301, with families comprising 3+ earners (299) having the highest median family income of $117,850, while families with no earners (1,153) have the lowest median family income of $24,899, accounting for 6.5% and 25.0% of families, respectively.
| Number of Earners | # Families | Median Income |
| No Earners | 1,153 (25.0%) | $24,899 |
| 1 Earner | 1,565 (34.0%) | $42,840 |
| 2 Earners | 1,590 (34.5%) | $96,765 |
| 3+ Earners | 299 (6.5%) | $117,850 |
| Total | 4,607 (100.0%) | $59,301 |
Household Income in Northampton County
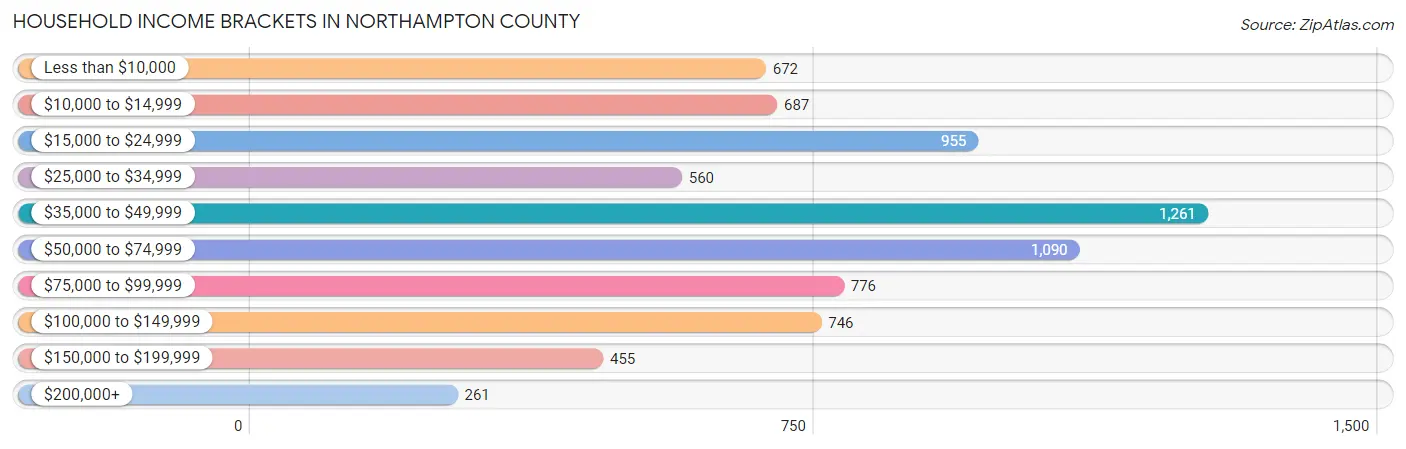
Household Income Brackets in Northampton County
With 1,261 households falling in the category, the $35,000 to $49,999 income range is the most frequent in Northampton County, accounting for 16.9% of all households. In contrast, only 261 households (3.5%) fall into the $200,000+ income bracket, making it the least populous group.
| Income Bracket | # Households | % Households |
| Less than $10,000 | 672 | 9.0% |
| $10,000 to $14,999 | 687 | 9.2% |
| $15,000 to $24,999 | 955 | 12.8% |
| $25,000 to $34,999 | 560 | 7.5% |
| $35,000 to $49,999 | 1,261 | 16.9% |
| $50,000 to $74,999 | 1,090 | 14.6% |
| $75,000 to $99,999 | 776 | 10.4% |
| $100,000 to $149,999 | 746 | 10.0% |
| $150,000 to $199,999 | 455 | 6.1% |
| $200,000+ | 261 | 3.5% |
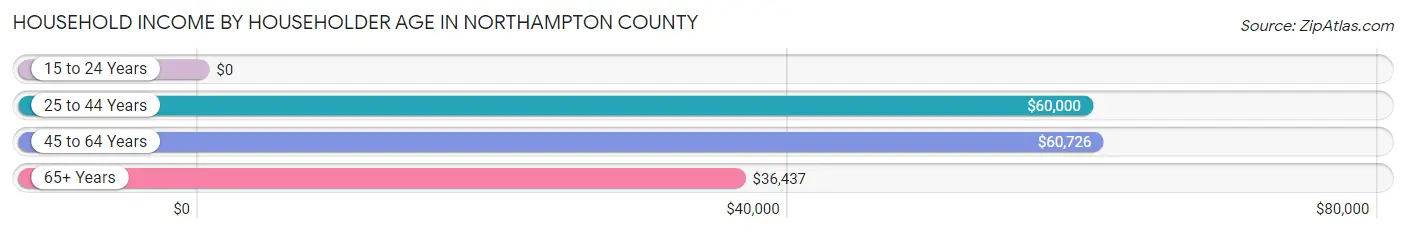
Household Income by Householder Age in Northampton County
The median household income in Northampton County is $45,698, with the highest median household income of $60,726 found in the 45 to 64 years age bracket for the primary householder. A total of 2,850 households (38.2%) fall into this category. Meanwhile, the 15 to 24 years age bracket for the primary householder has the lowest median household income of $0, with 134 households (1.8%) in this group.
| Income Bracket | # Households | Median Income |
| 15 to 24 Years | 134 (1.8%) | $0 |
| 25 to 44 Years | 1,278 (17.1%) | $60,000 |
| 45 to 64 Years | 2,850 (38.2%) | $60,726 |
| 65+ Years | 3,201 (42.9%) | $36,437 |
| Total | 7,463 (100.0%) | $45,698 |
Poverty in Northampton County
Income Below Poverty by Sex and Age in Northampton County
With 17.1% poverty level for males and 20.1% for females among the residents of Northampton County, 15 year old males and 12 to 14 year old females are the most vulnerable to poverty, with 45 males (62.5%) and 101 females (42.1%) in their respective age groups living below the poverty level.
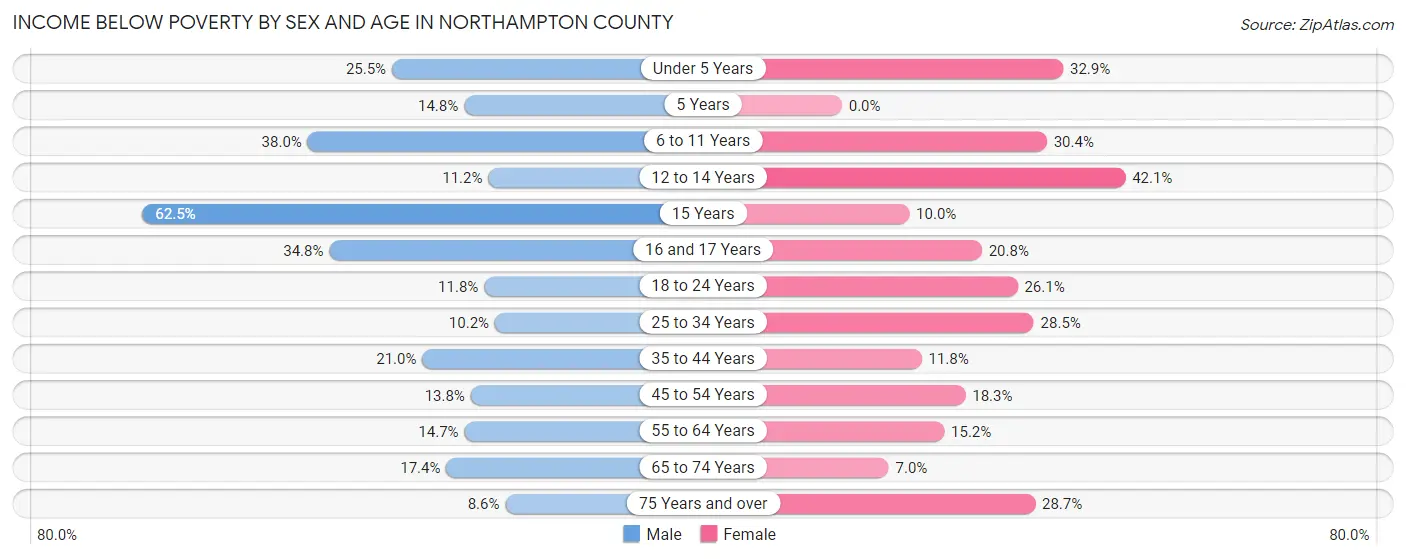
| Age Bracket | Male | Female |
| Under 5 Years | 100 (25.5%) | 159 (32.9%) |
| 5 Years | 18 (14.7%) | 0 (0.0%) |
| 6 to 11 Years | 180 (38.0%) | 140 (30.4%) |
| 12 to 14 Years | 34 (11.2%) | 101 (42.1%) |
| 15 Years | 45 (62.5%) | 11 (10.0%) |
| 16 and 17 Years | 73 (34.8%) | 32 (20.8%) |
| 18 to 24 Years | 66 (11.8%) | 149 (26.1%) |
| 25 to 34 Years | 82 (10.2%) | 245 (28.5%) |
| 35 to 44 Years | 141 (20.9%) | 94 (11.8%) |
| 45 to 54 Years | 126 (13.8%) | 186 (18.3%) |
| 55 to 64 Years | 192 (14.7%) | 241 (15.2%) |
| 65 to 74 Years | 226 (17.4%) | 98 (7.0%) |
| 75 Years and over | 65 (8.6%) | 328 (28.7%) |
| Total | 1,348 (17.1%) | 1,784 (20.1%) |
Income Above Poverty by Sex and Age in Northampton County
According to the poverty statistics in Northampton County, males aged 75 years and over and females aged 5 years are the age groups that are most secure financially, with 91.4% of males and 100.0% of females in these age groups living above the poverty line.
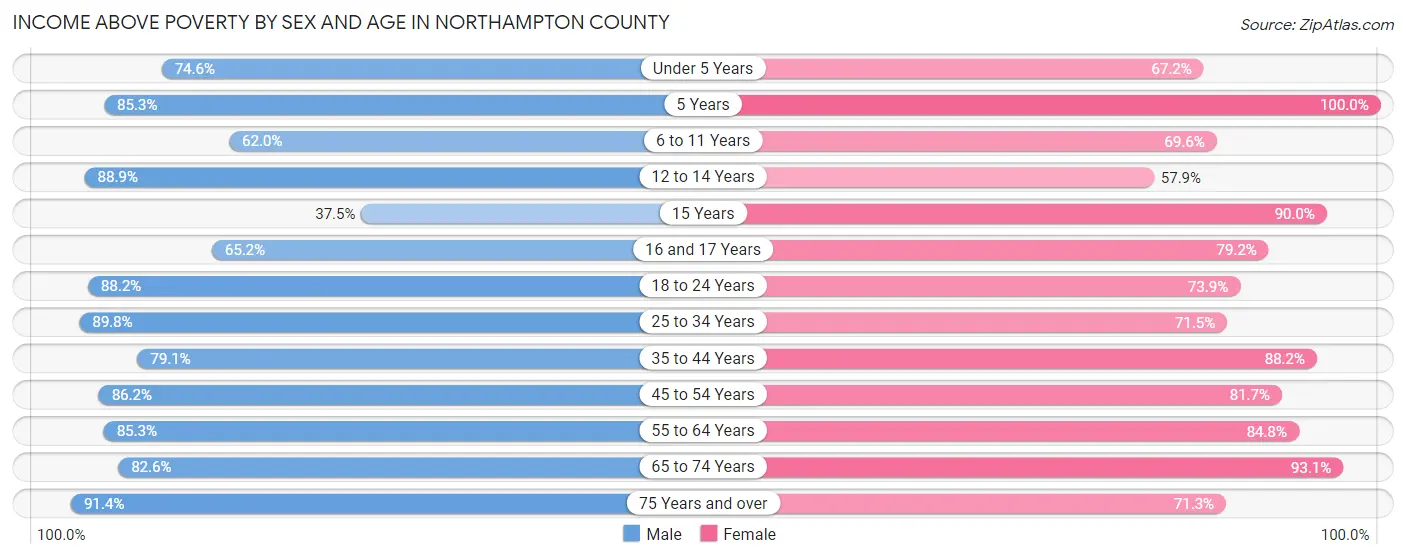
| Age Bracket | Male | Female |
| Under 5 Years | 293 (74.6%) | 325 (67.1%) |
| 5 Years | 104 (85.3%) | 48 (100.0%) |
| 6 to 11 Years | 294 (62.0%) | 320 (69.6%) |
| 12 to 14 Years | 271 (88.8%) | 139 (57.9%) |
| 15 Years | 27 (37.5%) | 99 (90.0%) |
| 16 and 17 Years | 137 (65.2%) | 122 (79.2%) |
| 18 to 24 Years | 495 (88.2%) | 422 (73.9%) |
| 25 to 34 Years | 725 (89.8%) | 615 (71.5%) |
| 35 to 44 Years | 532 (79.0%) | 700 (88.2%) |
| 45 to 54 Years | 790 (86.2%) | 828 (81.7%) |
| 55 to 64 Years | 1,115 (85.3%) | 1,346 (84.8%) |
| 65 to 74 Years | 1,074 (82.6%) | 1,312 (93.0%) |
| 75 Years and over | 689 (91.4%) | 815 (71.3%) |
| Total | 6,546 (82.9%) | 7,091 (79.9%) |
Income Below Poverty Among Married-Couple Families in Northampton County
The poverty statistics for married-couple families in Northampton County show that 5.1% or 158 of the total 3,100 families live below the poverty line. Families with 3 or 4 children have the highest poverty rate of 15.9%, comprising of 48 families. On the other hand, families with 5 or more children have the lowest poverty rate of 0.0%, which includes 0 families.
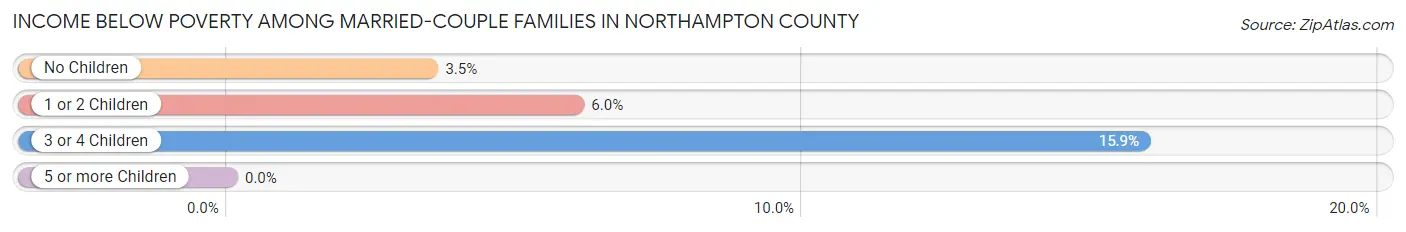
| Children | Above Poverty | Below Poverty |
| No Children | 2,155 (96.5%) | 78 (3.5%) |
| 1 or 2 Children | 499 (94.0%) | 32 (6.0%) |
| 3 or 4 Children | 254 (84.1%) | 48 (15.9%) |
| 5 or more Children | 34 (100.0%) | 0 (0.0%) |
| Total | 2,942 (94.9%) | 158 (5.1%) |
Income Below Poverty Among Single-Parent Households in Northampton County
According to the poverty data in Northampton County, 15.5% or 49 single-father households and 35.3% or 420 single-mother households are living below the poverty line. Among single-father households, those with 5 or more children have the highest poverty rate, with 4 households (100.0%) experiencing poverty. Likewise, among single-mother households, those with 3 or 4 children have the highest poverty rate, with 99 households (82.5%) falling below the poverty line.
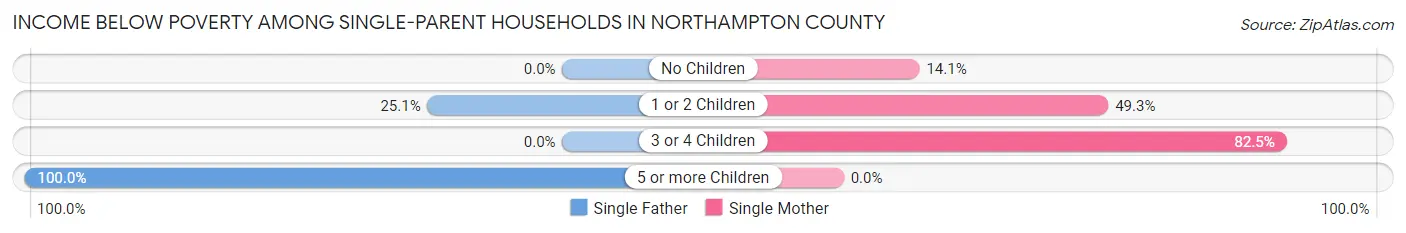
| Children | Single Father | Single Mother |
| No Children | 0 (0.0%) | 83 (14.1%) |
| 1 or 2 Children | 45 (25.1%) | 238 (49.3%) |
| 3 or 4 Children | 0 (0.0%) | 99 (82.5%) |
| 5 or more Children | 4 (100.0%) | 0 (0.0%) |
| Total | 49 (15.5%) | 420 (35.3%) |
Income Below Poverty Among Married-Couple vs Single-Parent Households in Northampton County
The poverty data for Northampton County shows that 158 of the married-couple family households (5.1%) and 469 of the single-parent households (31.1%) are living below the poverty level. Within the married-couple family households, those with 3 or 4 children have the highest poverty rate, with 48 households (15.9%) falling below the poverty line. Among the single-parent households, those with 5 or more children have the highest poverty rate, with 4 household (100.0%) living below poverty.
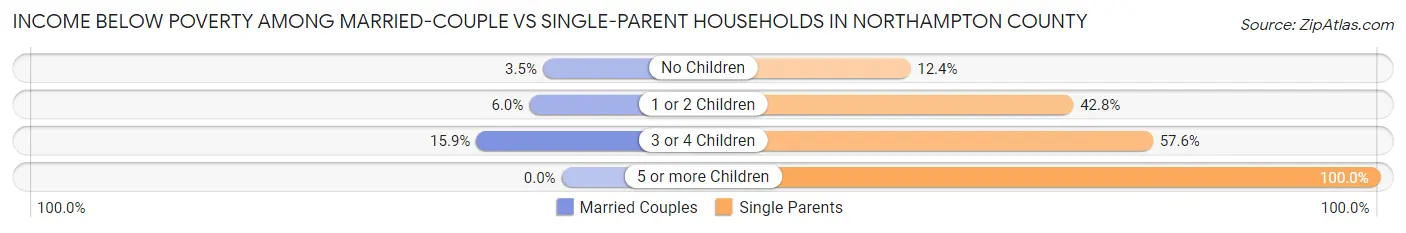
| Children | Married-Couple Families | Single-Parent Households |
| No Children | 78 (3.5%) | 83 (12.4%) |
| 1 or 2 Children | 32 (6.0%) | 283 (42.7%) |
| 3 or 4 Children | 48 (15.9%) | 99 (57.6%) |
| 5 or more Children | 0 (0.0%) | 4 (100.0%) |
| Total | 158 (5.1%) | 469 (31.1%) |
Race in Northampton County
The most populous races in Northampton County are Black / African American (9,458 | 54.0%), White / Caucasian (7,087 | 40.4%), and Two or more Races (844 | 4.8%).
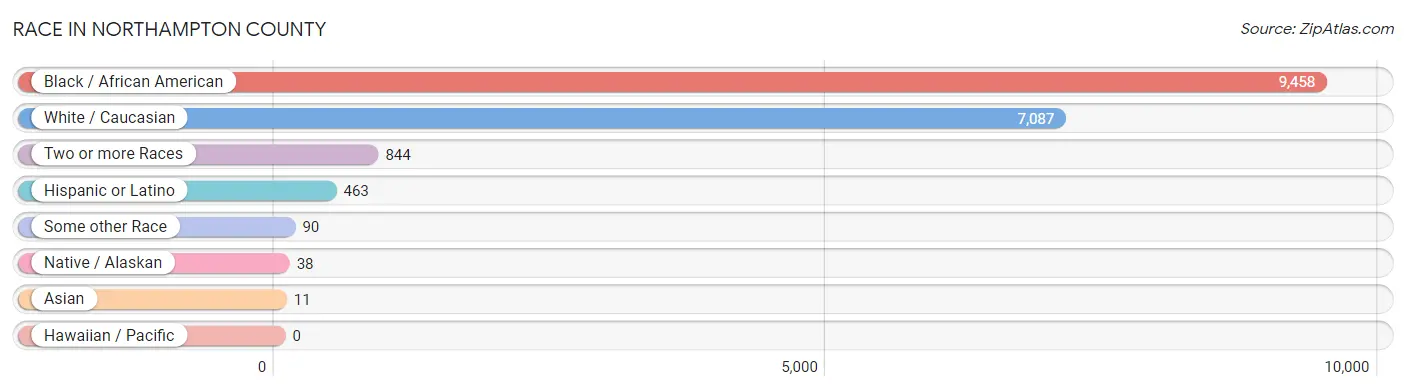
| Race | # Population | % Population |
| Asian | 11 | 0.1% |
| Black / African American | 9,458 | 54.0% |
| Hawaiian / Pacific | 0 | 0.0% |
| Hispanic or Latino | 463 | 2.6% |
| Native / Alaskan | 38 | 0.2% |
| White / Caucasian | 7,087 | 40.4% |
| Two or more Races | 844 | 4.8% |
| Some other Race | 90 | 0.5% |
| Total | 17,528 | 100.0% |
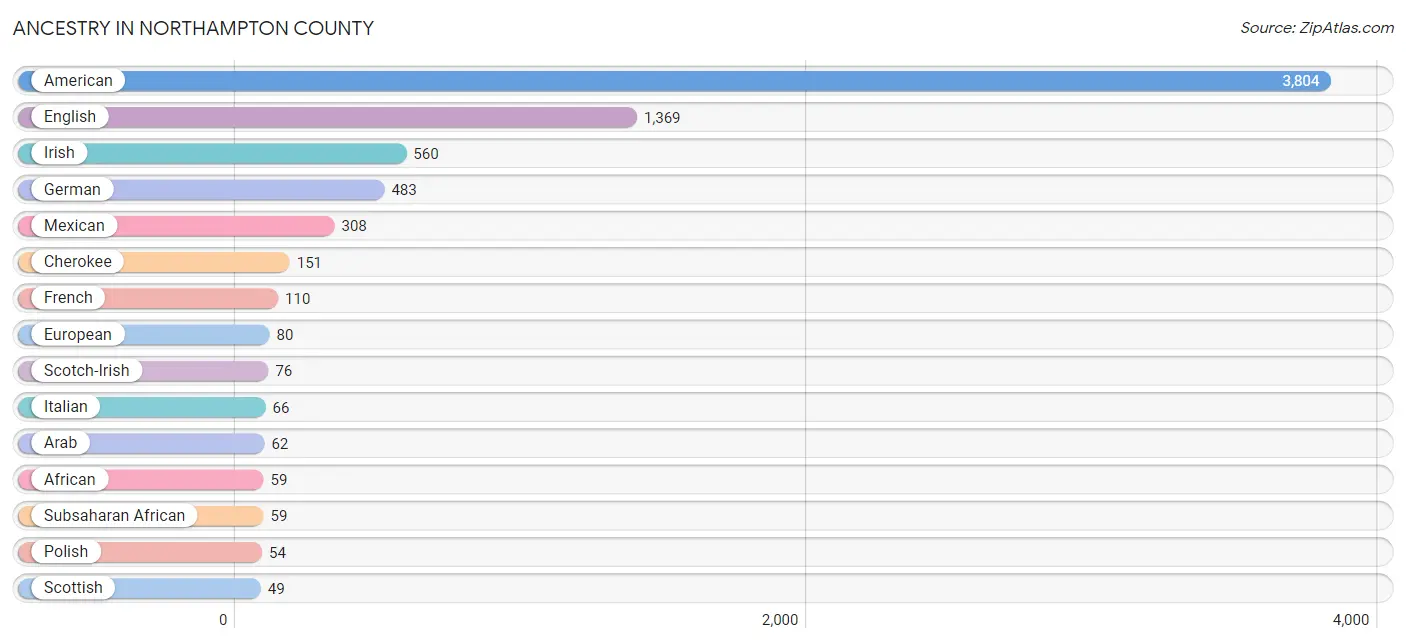
Ancestry in Northampton County
The most populous ancestries reported in Northampton County are American (3,804 | 21.7%), English (1,369 | 7.8%), Irish (560 | 3.2%), German (483 | 2.8%), and Mexican (308 | 1.8%), together accounting for 37.2% of all Northampton County residents.
| Ancestry | # Population | % Population |
| African | 59 | 0.3% |
| American | 3,804 | 21.7% |
| Apache | 8 | 0.1% |
| Arab | 62 | 0.4% |
| Australian | 11 | 0.1% |
| British | 48 | 0.3% |
| Burmese | 35 | 0.2% |
| Cambodian | 32 | 0.2% |
| Celtic | 9 | 0.1% |
| Central American | 28 | 0.2% |
| Cherokee | 151 | 0.9% |
| Creek | 46 | 0.3% |
| Cuban | 40 | 0.2% |
| Czechoslovakian | 3 | 0.0% |
| Dominican | 8 | 0.1% |
| Dutch | 18 | 0.1% |
| English | 1,369 | 7.8% |
| European | 80 | 0.5% |
| French | 110 | 0.6% |
| French Canadian | 6 | 0.0% |
| German | 483 | 2.8% |
| Greek | 16 | 0.1% |
| Guatemalan | 10 | 0.1% |
| Irish | 560 | 3.2% |
| Italian | 66 | 0.4% |
| Lithuanian | 4 | 0.0% |
| Lumbee | 19 | 0.1% |
| Mexican | 308 | 1.8% |
| Mexican American Indian | 7 | 0.0% |
| Moroccan | 10 | 0.1% |
| Norwegian | 17 | 0.1% |
| Pennsylvania German | 5 | 0.0% |
| Polish | 54 | 0.3% |
| Puerto Rican | 27 | 0.2% |
| Russian | 17 | 0.1% |
| Salvadoran | 18 | 0.1% |
| Scandinavian | 21 | 0.1% |
| Scotch-Irish | 76 | 0.4% |
| Scottish | 49 | 0.3% |
| Sioux | 14 | 0.1% |
| Slovak | 4 | 0.0% |
| Slovene | 8 | 0.1% |
| Spaniard | 10 | 0.1% |
| Sri Lankan | 10 | 0.1% |
| Subsaharan African | 59 | 0.3% |
| Swedish | 26 | 0.2% |
| Swiss | 4 | 0.0% |
| Syrian | 3 | 0.0% |
| Trinidadian and Tobagonian | 28 | 0.2% |
| Ukrainian | 20 | 0.1% |
| Welsh | 31 | 0.2% | View All 51 Rows |
Immigrants in Northampton County
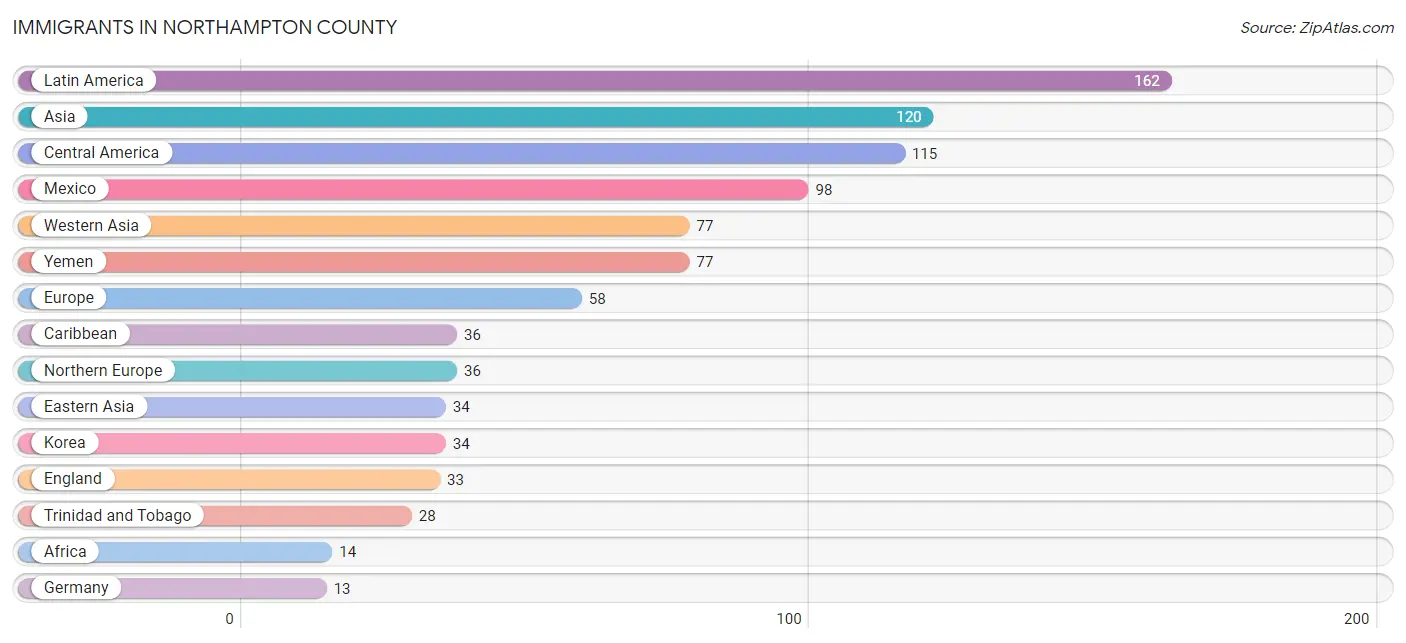
The most numerous immigrant groups reported in Northampton County came from Latin America (162 | 0.9%), Asia (120 | 0.7%), Central America (115 | 0.7%), Mexico (98 | 0.6%), and Western Asia (77 | 0.4%), together accounting for 3.3% of all Northampton County residents.
| Immigration Origin | # Population | % Population |
| Africa | 14 | 0.1% |
| Asia | 120 | 0.7% |
| Canada | 1 | 0.0% |
| Caribbean | 36 | 0.2% |
| Central America | 115 | 0.7% |
| Dominican Republic | 8 | 0.1% |
| Eastern Asia | 34 | 0.2% |
| El Salvador | 7 | 0.0% |
| England | 33 | 0.2% |
| Europe | 58 | 0.3% |
| Germany | 13 | 0.1% |
| Greece | 9 | 0.1% |
| Guatemala | 10 | 0.1% |
| Guyana | 11 | 0.1% |
| Korea | 34 | 0.2% |
| Latin America | 162 | 0.9% |
| Mexico | 98 | 0.6% |
| Northern Africa | 1 | 0.0% |
| Northern Europe | 36 | 0.2% |
| South Africa | 13 | 0.1% |
| South America | 11 | 0.1% |
| South Eastern Asia | 9 | 0.1% |
| Southern Europe | 9 | 0.1% |
| Trinidad and Tobago | 28 | 0.2% |
| Vietnam | 9 | 0.1% |
| Western Asia | 77 | 0.4% |
| Western Europe | 13 | 0.1% |
| Yemen | 77 | 0.4% | View All 28 Rows |
Sex and Age in Northampton County
Sex and Age in Northampton County
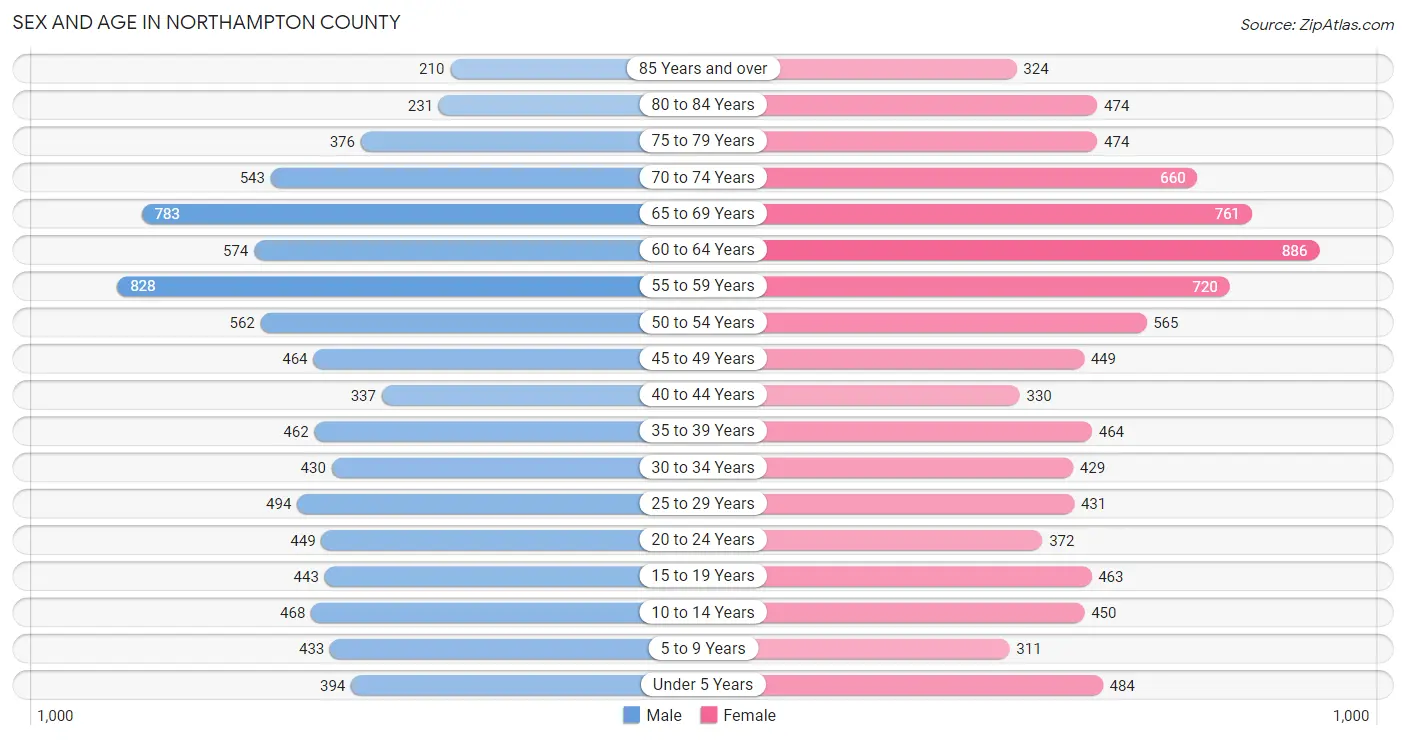
The most populous age groups in Northampton County are 55 to 59 Years (828 | 9.8%) for men and 60 to 64 Years (886 | 9.8%) for women.
| Age Bracket | Male | Female |
| Under 5 Years | 394 (4.6%) | 484 (5.3%) |
| 5 to 9 Years | 433 (5.1%) | 311 (3.4%) |
| 10 to 14 Years | 468 (5.5%) | 450 (5.0%) |
| 15 to 19 Years | 443 (5.2%) | 463 (5.1%) |
| 20 to 24 Years | 449 (5.3%) | 372 (4.1%) |
| 25 to 29 Years | 494 (5.8%) | 431 (4.8%) |
| 30 to 34 Years | 430 (5.1%) | 429 (4.7%) |
| 35 to 39 Years | 462 (5.4%) | 464 (5.1%) |
| 40 to 44 Years | 337 (4.0%) | 330 (3.6%) |
| 45 to 49 Years | 464 (5.5%) | 449 (5.0%) |
| 50 to 54 Years | 562 (6.6%) | 565 (6.2%) |
| 55 to 59 Years | 828 (9.8%) | 720 (8.0%) |
| 60 to 64 Years | 574 (6.8%) | 886 (9.8%) |
| 65 to 69 Years | 783 (9.2%) | 761 (8.4%) |
| 70 to 74 Years | 543 (6.4%) | 660 (7.3%) |
| 75 to 79 Years | 376 (4.4%) | 474 (5.2%) |
| 80 to 84 Years | 231 (2.7%) | 474 (5.2%) |
| 85 Years and over | 210 (2.5%) | 324 (3.6%) |
| Total | 8,481 (100.0%) | 9,047 (100.0%) |
Families and Households in Northampton County
Median Family Size in Northampton County
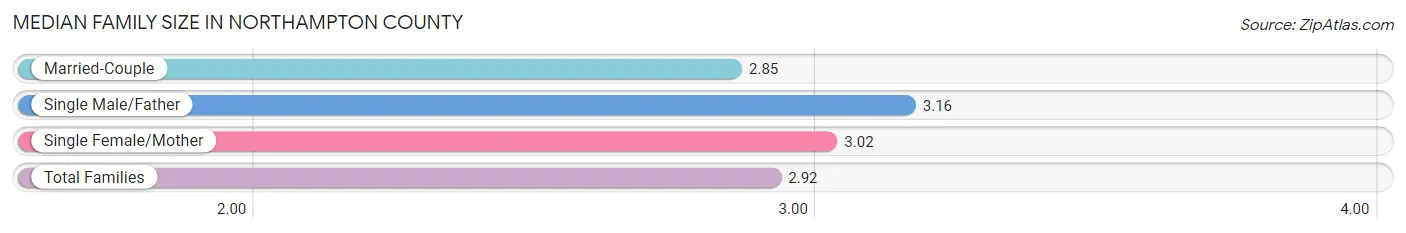
The median family size in Northampton County is 2.92 persons per family, with single male/father families (316 | 6.9%) accounting for the largest median family size of 3.16 persons per family. On the other hand, married-couple families (3,100 | 67.3%) represent the smallest median family size with 2.85 persons per family.
| Family Type | # Families | Family Size |
| Married-Couple | 3,100 (67.3%) | 2.85 |
| Single Male/Father | 316 (6.9%) | 3.16 |
| Single Female/Mother | 1,191 (25.9%) | 3.02 |
| Total Families | 4,607 (100.0%) | 2.92 |
Median Household Size in Northampton County
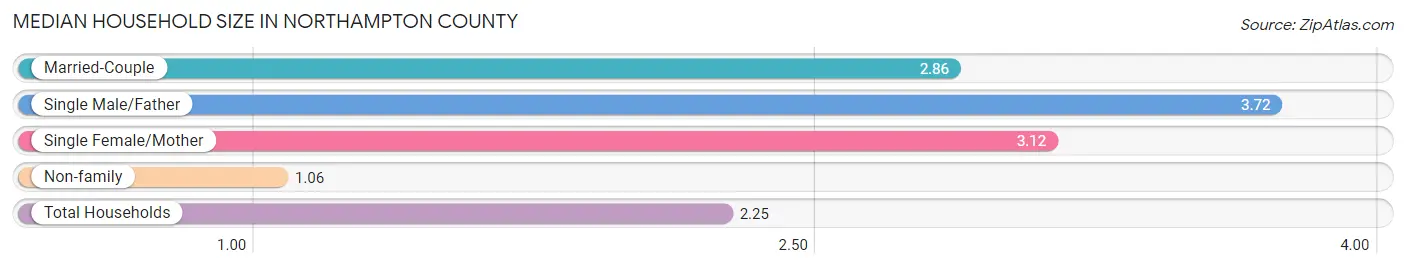
The median household size in Northampton County is 2.25 persons per household, with single male/father households (316 | 4.2%) accounting for the largest median household size of 3.72 persons per household. non-family households (2,856 | 38.3%) represent the smallest median household size with 1.06 persons per household.
| Household Type | # Households | Household Size |
| Married-Couple | 3,100 (41.5%) | 2.86 |
| Single Male/Father | 316 (4.2%) | 3.72 |
| Single Female/Mother | 1,191 (16.0%) | 3.12 |
| Non-family | 2,856 (38.3%) | 1.06 |
| Total Households | 7,463 (100.0%) | 2.25 |
Household Size by Marriage Status in Northampton County
Out of a total of 7,463 households in Northampton County, 4,607 (61.7%) are family households, while 2,856 (38.3%) are nonfamily households. The most numerous type of family households are 2-person households, comprising 2,613, and the most common type of nonfamily households are 1-person households, comprising 2,694.
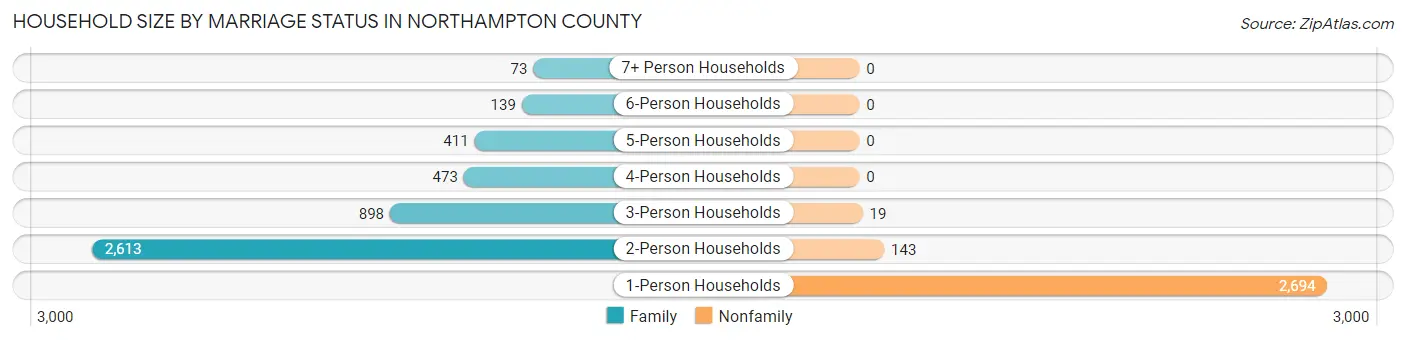
| Household Size | Family Households | Nonfamily Households |
| 1-Person Households | - | 2,694 (36.1%) |
| 2-Person Households | 2,613 (35.0%) | 143 (1.9%) |
| 3-Person Households | 898 (12.0%) | 19 (0.3%) |
| 4-Person Households | 473 (6.3%) | 0 (0.0%) |
| 5-Person Households | 411 (5.5%) | 0 (0.0%) |
| 6-Person Households | 139 (1.9%) | 0 (0.0%) |
| 7+ Person Households | 73 (1.0%) | 0 (0.0%) |
| Total | 4,607 (61.7%) | 2,856 (38.3%) |
Female Fertility in Northampton County
Fertility by Age in Northampton County
Average fertility rate in Northampton County is 99.0 births per 1,000 women. Women in the age bracket of 20 to 34 years have the highest fertility rate with 128.0 births per 1,000 women. Women in the age bracket of 20 to 34 years acount for 53.2% of all women with births.
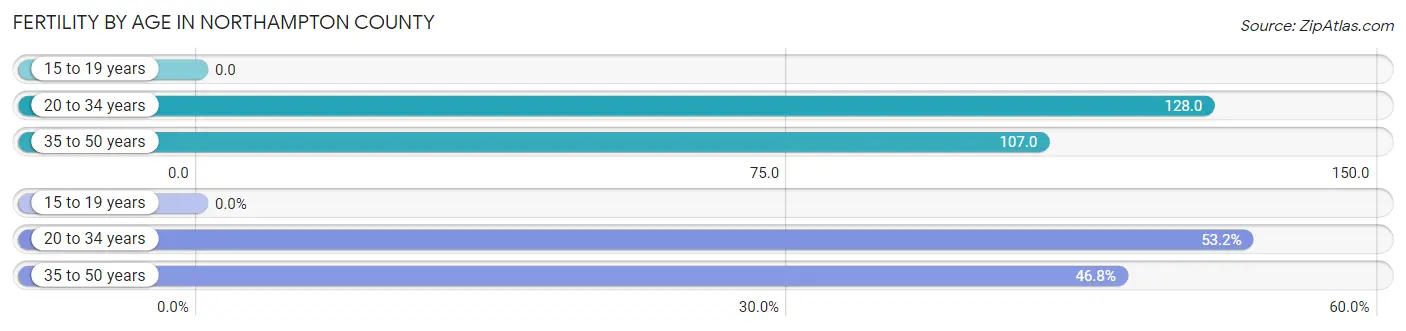
| Age Bracket | Women with Births | Births / 1,000 Women |
| 15 to 19 years | 0 (0.0%) | 0.0 |
| 20 to 34 years | 158 (53.2%) | 128.0 |
| 35 to 50 years | 139 (46.8%) | 107.0 |
| Total | 297 (100.0%) | 99.0 |
Fertility by Age by Marriage Status in Northampton County
84.2% of women with births (297) in Northampton County are married. The highest percentage of unmarried women with births falls into 20 to 34 years age bracket with 29.7% of them unmarried at the time of birth, while the lowest percentage of unmarried women with births belong to 35 to 50 years age bracket with 0.0% of them unmarried.
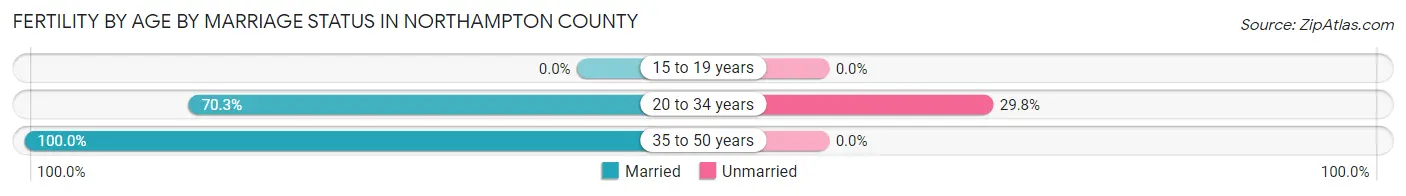
| Age Bracket | Married | Unmarried |
| 15 to 19 years | 0 (0.0%) | 0 (0.0%) |
| 20 to 34 years | 111 (70.3%) | 47 (29.7%) |
| 35 to 50 years | 139 (100.0%) | 0 (0.0%) |
| Total | 250 (84.2%) | 47 (15.8%) |
Fertility by Education in Northampton County
Average fertility rate in Northampton County is 99.0 births per 1,000 women. Women with the education attainment of graduate degree have the highest fertility rate of 726.0 births per 1,000 women, while women with the education attainment of high school diploma have the lowest fertility at 9.0 births per 1,000 women. Women with the education attainment of graduate degree represent 46.5% of all women with births.
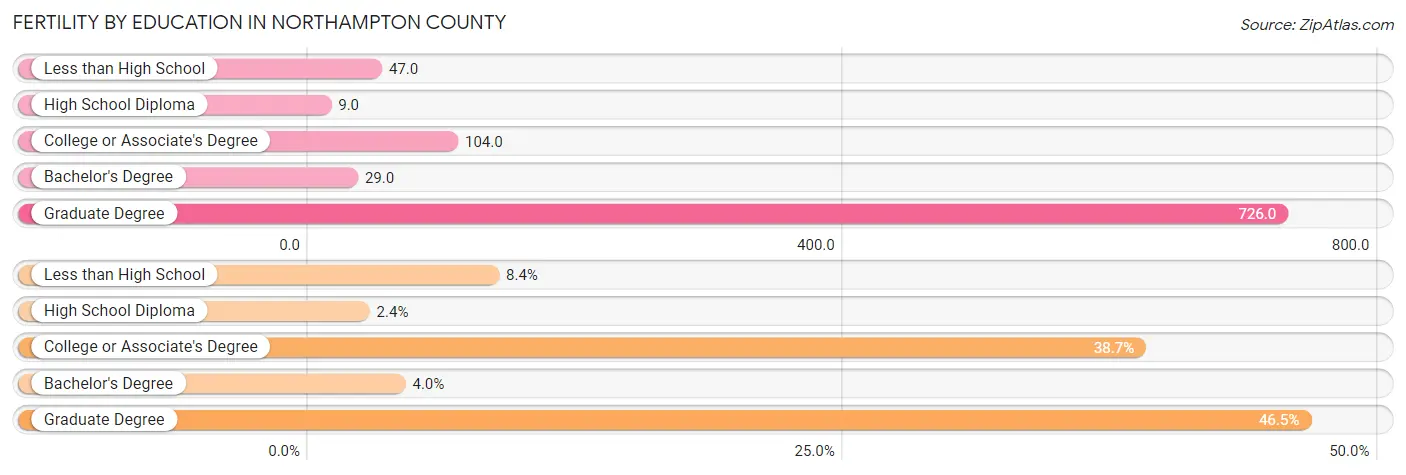
| Educational Attainment | Women with Births | Births / 1,000 Women |
| Less than High School | 25 (8.4%) | 47.0 |
| High School Diploma | 7 (2.4%) | 9.0 |
| College or Associate's Degree | 115 (38.7%) | 104.0 |
| Bachelor's Degree | 12 (4.0%) | 29.0 |
| Graduate Degree | 138 (46.5%) | 726.0 |
| Total | 297 (100.0%) | 99.0 |
Fertility by Education by Marriage Status in Northampton County
15.8% of women with births in Northampton County are unmarried. Women with the educational attainment of high school diploma are most likely to be married with 100.0% of them married at childbirth, while women with the educational attainment of less than high school are least likely to be married with 76.0% of them unmarried at childbirth.
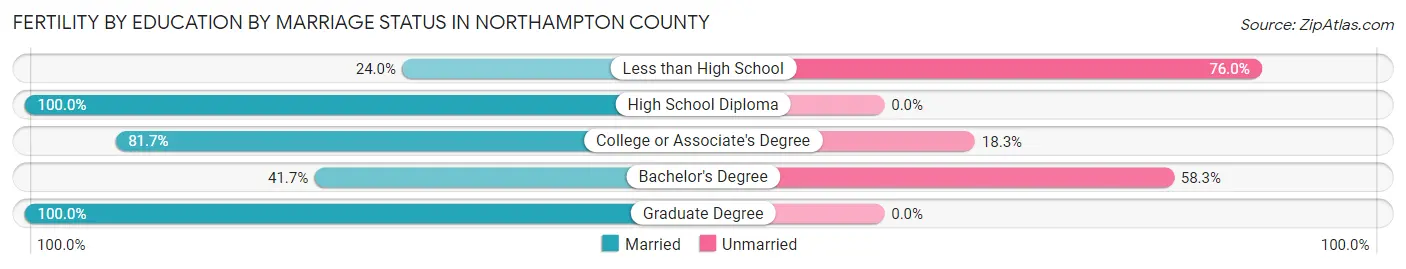
| Educational Attainment | Married | Unmarried |
| Less than High School | 6 (24.0%) | 19 (76.0%) |
| High School Diploma | 7 (100.0%) | 0 (0.0%) |
| College or Associate's Degree | 94 (81.7%) | 21 (18.3%) |
| Bachelor's Degree | 5 (41.7%) | 7 (58.3%) |
| Graduate Degree | 138 (100.0%) | 0 (0.0%) |
| Total | 250 (84.2%) | 47 (15.8%) |
Employment Characteristics in Northampton County
Employment by Class of Employer in Northampton County
Among the 6,529 employed individuals in Northampton County, private company employees (4,115 | 63.0%), local government employees (692 | 10.6%), and state government employees (617 | 9.5%) make up the most common classes of employment.
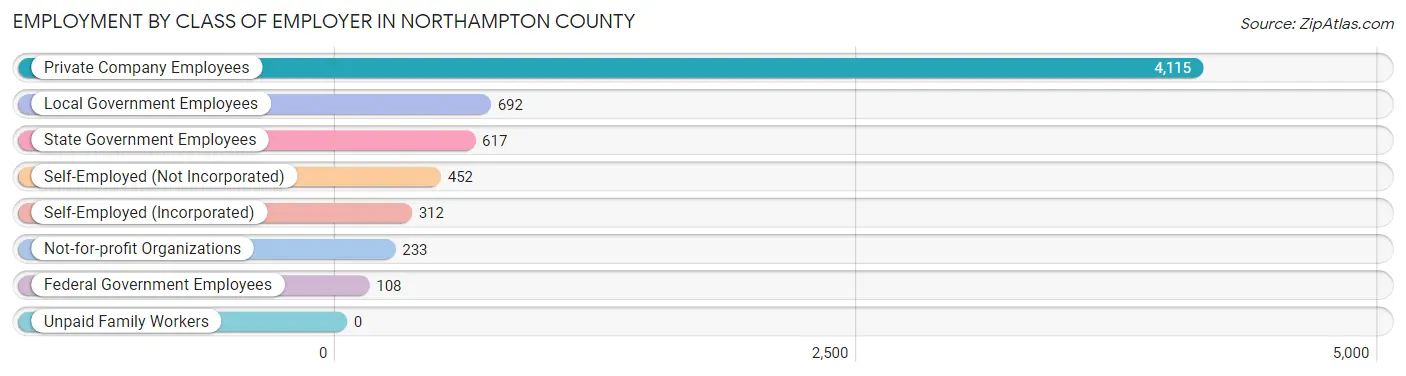
| Employer Class | # Employees | % Employees |
| Private Company Employees | 4,115 | 63.0% |
| Self-Employed (Incorporated) | 312 | 4.8% |
| Self-Employed (Not Incorporated) | 452 | 6.9% |
| Not-for-profit Organizations | 233 | 3.6% |
| Local Government Employees | 692 | 10.6% |
| State Government Employees | 617 | 9.5% |
| Federal Government Employees | 108 | 1.7% |
| Unpaid Family Workers | 0 | 0.0% |
| Total | 6,529 | 100.0% |
Employment Status by Age in Northampton County
According to the labor force statistics for Northampton County, out of the total population over 16 years of age (14,806), 50.1% or 7,418 individuals are in the labor force, with 7.6% or 564 of them unemployed. The age group with the highest labor force participation rate is 25 to 29 years, with 75.7% or 700 individuals in the labor force. Within the labor force, the 16 to 19 years age range has the highest percentage of unemployed individuals, with 34.5% or 61 of them being unemployed.
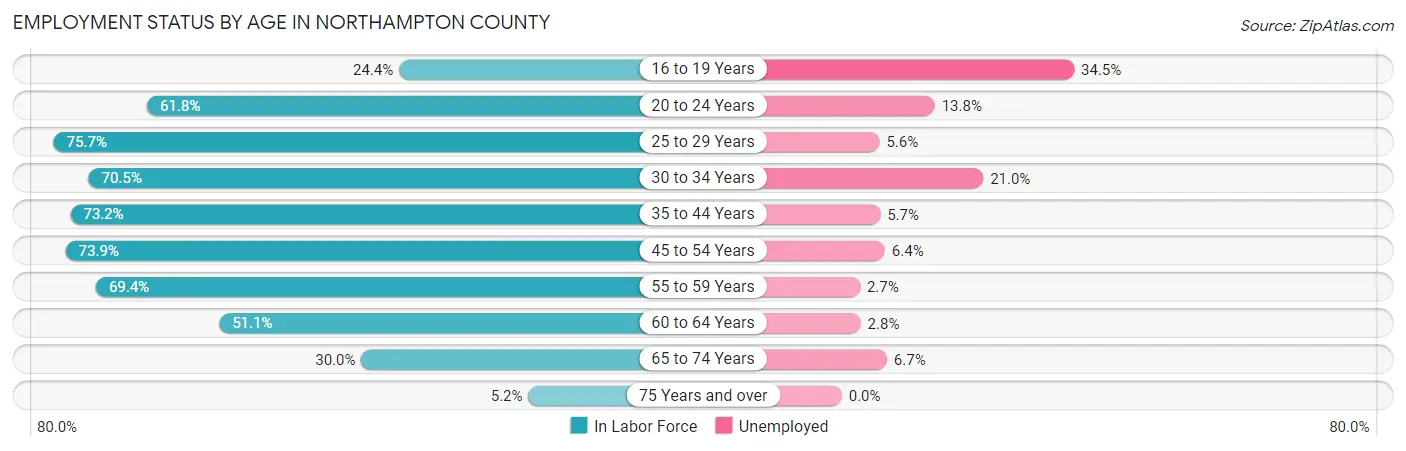
| Age Bracket | In Labor Force | Unemployed |
| 16 to 19 Years | 177 (24.4%) | 61 (34.5%) |
| 20 to 24 Years | 507 (61.8%) | 70 (13.8%) |
| 25 to 29 Years | 700 (75.7%) | 39 (5.6%) |
| 30 to 34 Years | 606 (70.5%) | 127 (21.0%) |
| 35 to 44 Years | 1,166 (73.2%) | 66 (5.7%) |
| 45 to 54 Years | 1,508 (73.9%) | 97 (6.4%) |
| 55 to 59 Years | 1,074 (69.4%) | 29 (2.7%) |
| 60 to 64 Years | 746 (51.1%) | 21 (2.8%) |
| 65 to 74 Years | 824 (30.0%) | 55 (6.7%) |
| 75 Years and over | 109 (5.2%) | 0 (0.0%) |
| Total | 7,418 (50.1%) | 564 (7.6%) |
Employment Status by Educational Attainment in Northampton County
According to labor force statistics for Northampton County, 68.8% of individuals (5,796) out of the total population between 25 and 64 years of age (8,425) are in the labor force, with 6.5% or 377 of them being unemployed. The group with the highest labor force participation rate are those with the educational attainment of bachelor's degree or higher, with 86.1% or 1,420 individuals in the labor force. Within the labor force, individuals with college / associate degree education have the highest percentage of unemployment, with 8.6% or 192 of them being unemployed.
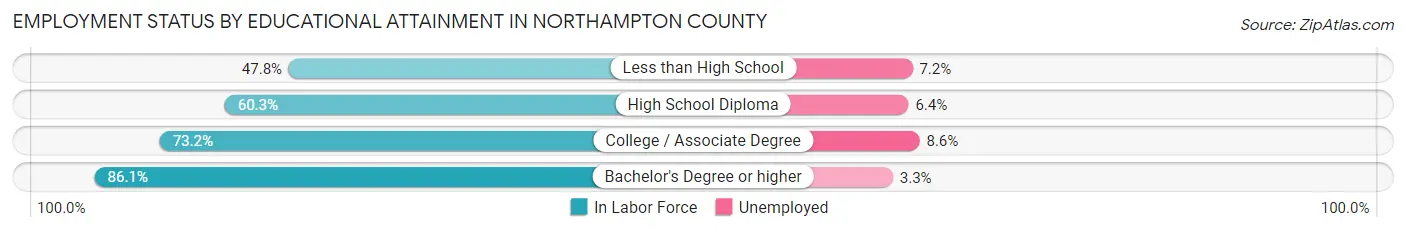
| Educational Attainment | In Labor Force | Unemployed |
| Less than High School | 376 (47.8%) | 57 (7.2%) |
| High School Diploma | 1,775 (60.3%) | 188 (6.4%) |
| College / Associate Degree | 2,230 (73.2%) | 262 (8.6%) |
| Bachelor's Degree or higher | 1,420 (86.1%) | 54 (3.3%) |
| Total | 5,796 (68.8%) | 548 (6.5%) |
Employment Occupations by Sex in Northampton County
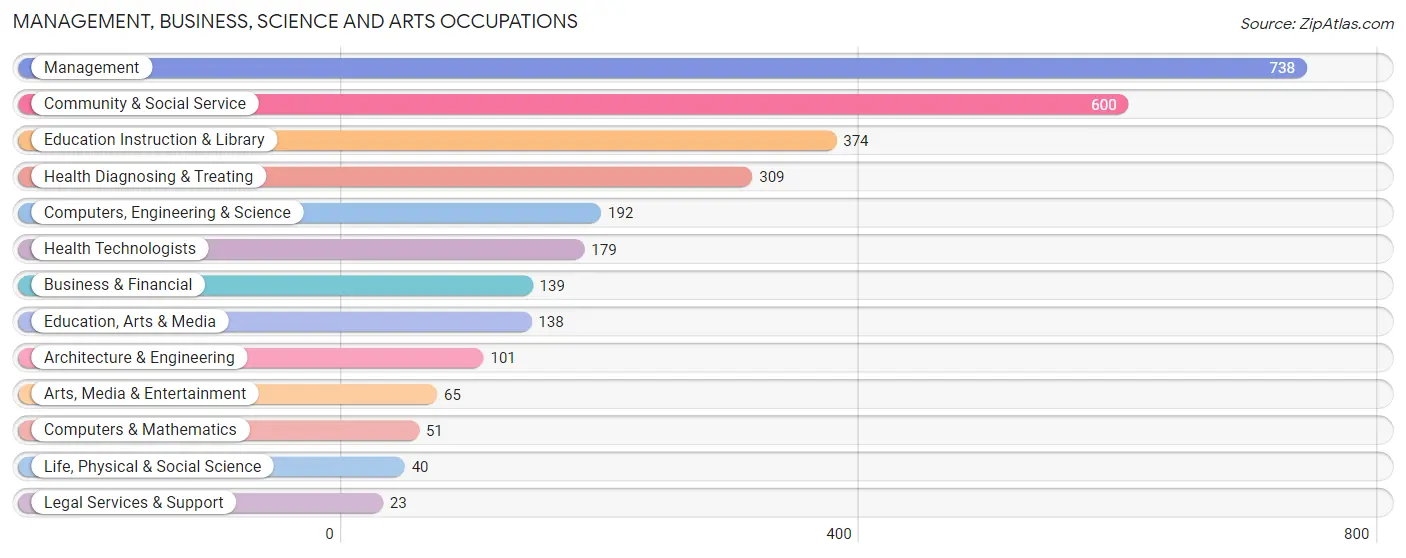
Management, Business, Science and Arts Occupations
The most common Management, Business, Science and Arts occupations in Northampton County are Management (738 | 10.8%), Community & Social Service (600 | 8.8%), Education Instruction & Library (374 | 5.5%), Health Diagnosing & Treating (309 | 4.5%), and Computers, Engineering & Science (192 | 2.8%).
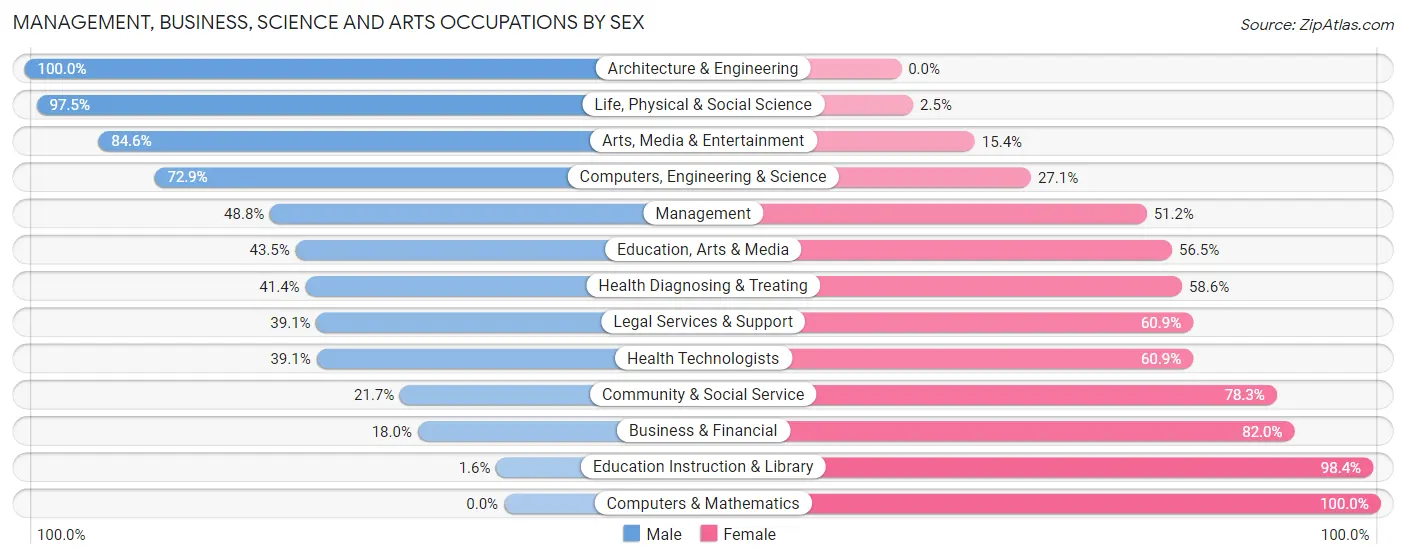
Management, Business, Science and Arts Occupations by Sex
Within the Management, Business, Science and Arts occupations in Northampton County, the most male-oriented occupations are Architecture & Engineering (100.0%), Life, Physical & Social Science (97.5%), and Arts, Media & Entertainment (84.6%), while the most female-oriented occupations are Computers & Mathematics (100.0%), Education Instruction & Library (98.4%), and Business & Financial (82.0%).
| Occupation | Male | Female |
| Management | 360 (48.8%) | 378 (51.2%) |
| Business & Financial | 25 (18.0%) | 114 (82.0%) |
| Computers, Engineering & Science | 140 (72.9%) | 52 (27.1%) |
| Computers & Mathematics | 0 (0.0%) | 51 (100.0%) |
| Architecture & Engineering | 101 (100.0%) | 0 (0.0%) |
| Life, Physical & Social Science | 39 (97.5%) | 1 (2.5%) |
| Community & Social Service | 130 (21.7%) | 470 (78.3%) |
| Education, Arts & Media | 60 (43.5%) | 78 (56.5%) |
| Legal Services & Support | 9 (39.1%) | 14 (60.9%) |
| Education Instruction & Library | 6 (1.6%) | 368 (98.4%) |
| Arts, Media & Entertainment | 55 (84.6%) | 10 (15.4%) |
| Health Diagnosing & Treating | 128 (41.4%) | 181 (58.6%) |
| Health Technologists | 70 (39.1%) | 109 (60.9%) |
| Total (Category) | 783 (39.6%) | 1,195 (60.4%) |
| Total (Overall) | 3,174 (46.3%) | 3,678 (53.7%) |
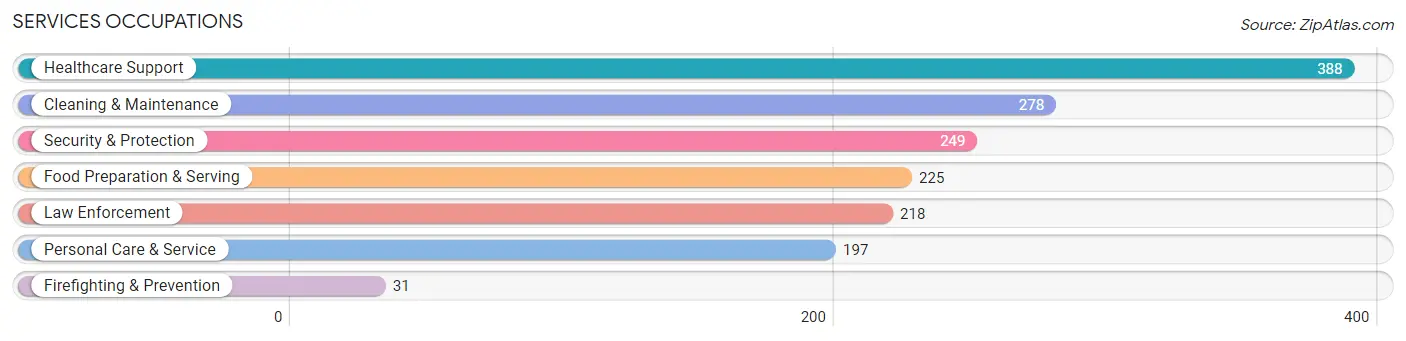
Services Occupations
The most common Services occupations in Northampton County are Healthcare Support (388 | 5.7%), Cleaning & Maintenance (278 | 4.1%), Security & Protection (249 | 3.6%), Food Preparation & Serving (225 | 3.3%), and Law Enforcement (218 | 3.2%).
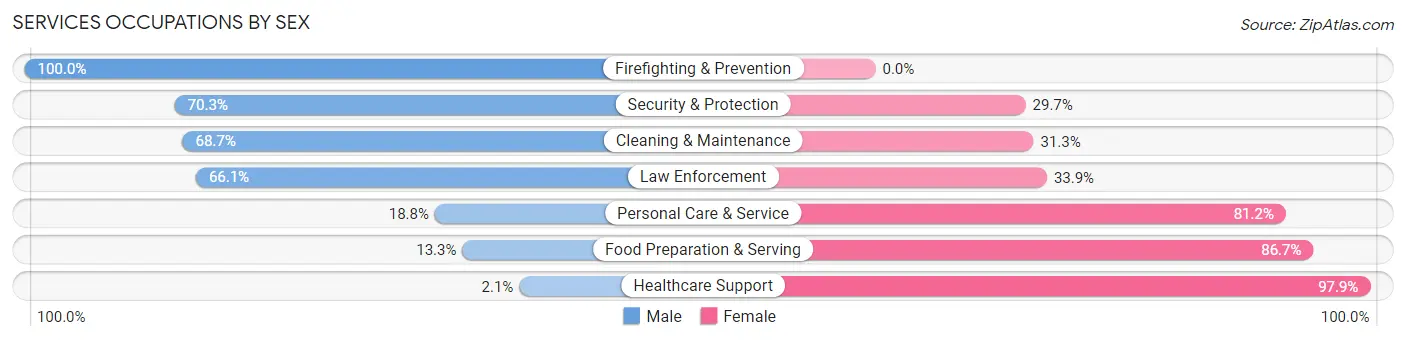
Services Occupations by Sex
Within the Services occupations in Northampton County, the most male-oriented occupations are Firefighting & Prevention (100.0%), Security & Protection (70.3%), and Cleaning & Maintenance (68.7%), while the most female-oriented occupations are Healthcare Support (97.9%), Food Preparation & Serving (86.7%), and Personal Care & Service (81.2%).
| Occupation | Male | Female |
| Healthcare Support | 8 (2.1%) | 380 (97.9%) |
| Security & Protection | 175 (70.3%) | 74 (29.7%) |
| Firefighting & Prevention | 31 (100.0%) | 0 (0.0%) |
| Law Enforcement | 144 (66.1%) | 74 (33.9%) |
| Food Preparation & Serving | 30 (13.3%) | 195 (86.7%) |
| Cleaning & Maintenance | 191 (68.7%) | 87 (31.3%) |
| Personal Care & Service | 37 (18.8%) | 160 (81.2%) |
| Total (Category) | 441 (33.0%) | 896 (67.0%) |
| Total (Overall) | 3,174 (46.3%) | 3,678 (53.7%) |
Sales and Office Occupations
The most common Sales and Office occupations in Northampton County are Office & Administration (795 | 11.6%), and Sales & Related (617 | 9.0%).
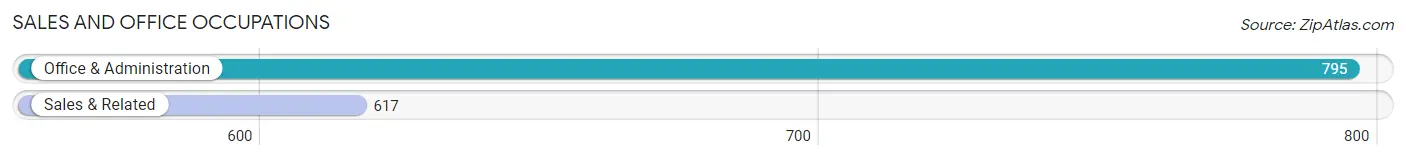
Sales and Office Occupations by Sex
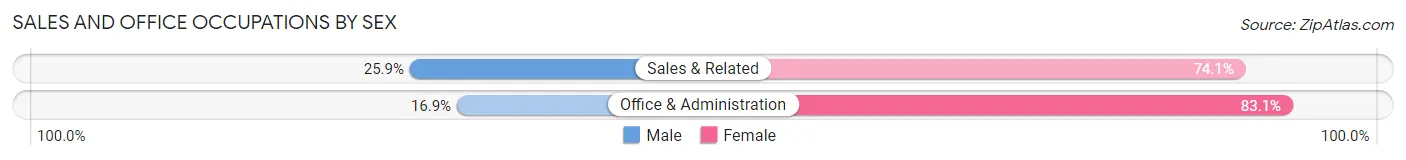
| Occupation | Male | Female |
| Sales & Related | 160 (25.9%) | 457 (74.1%) |
| Office & Administration | 134 (16.9%) | 661 (83.1%) |
| Total (Category) | 294 (20.8%) | 1,118 (79.2%) |
| Total (Overall) | 3,174 (46.3%) | 3,678 (53.7%) |
Natural Resources, Construction and Maintenance Occupations
The most common Natural Resources, Construction and Maintenance occupations in Northampton County are Construction & Extraction (314 | 4.6%), Installation, Maintenance & Repair (287 | 4.2%), and Farming, Fishing & Forestry (190 | 2.8%).
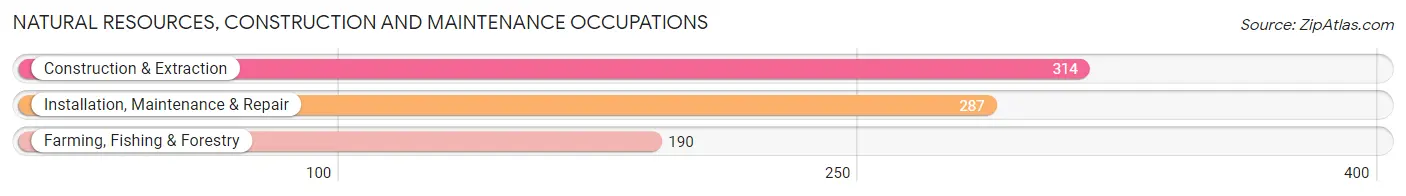
Natural Resources, Construction and Maintenance Occupations by Sex
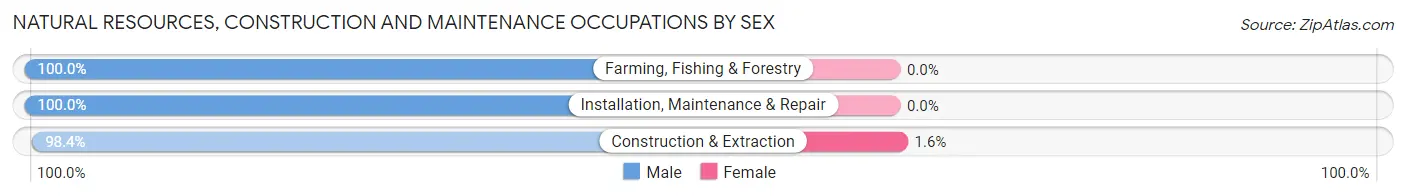
| Occupation | Male | Female |
| Farming, Fishing & Forestry | 190 (100.0%) | 0 (0.0%) |
| Construction & Extraction | 309 (98.4%) | 5 (1.6%) |
| Installation, Maintenance & Repair | 287 (100.0%) | 0 (0.0%) |
| Total (Category) | 786 (99.4%) | 5 (0.6%) |
| Total (Overall) | 3,174 (46.3%) | 3,678 (53.7%) |
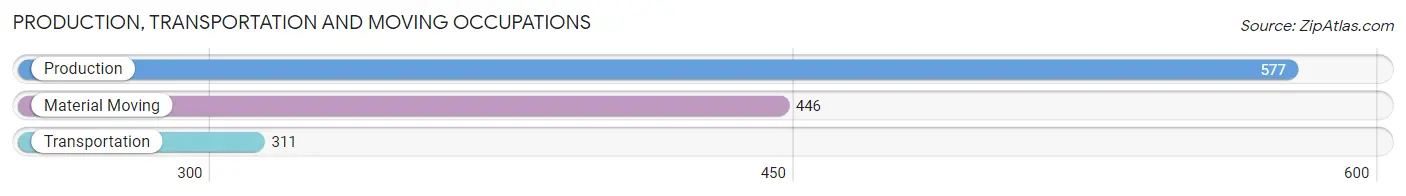
Production, Transportation and Moving Occupations
The most common Production, Transportation and Moving occupations in Northampton County are Production (577 | 8.4%), Material Moving (446 | 6.5%), and Transportation (311 | 4.5%).
Production, Transportation and Moving Occupations by Sex
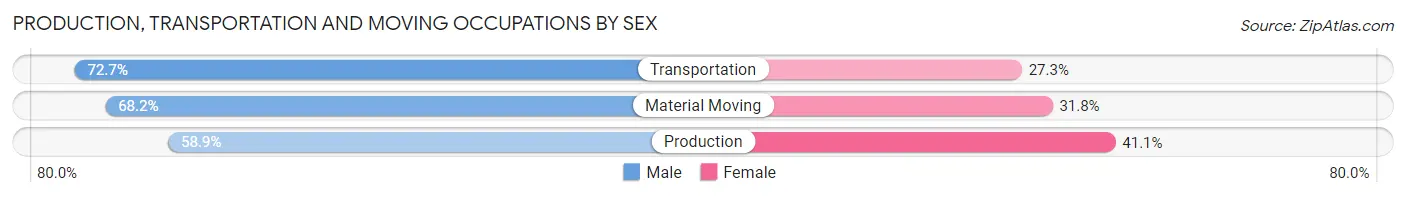
| Occupation | Male | Female |
| Production | 340 (58.9%) | 237 (41.1%) |
| Transportation | 226 (72.7%) | 85 (27.3%) |
| Material Moving | 304 (68.2%) | 142 (31.8%) |
| Total (Category) | 870 (65.2%) | 464 (34.8%) |
| Total (Overall) | 3,174 (46.3%) | 3,678 (53.7%) |
Employment Industries by Sex in Northampton County
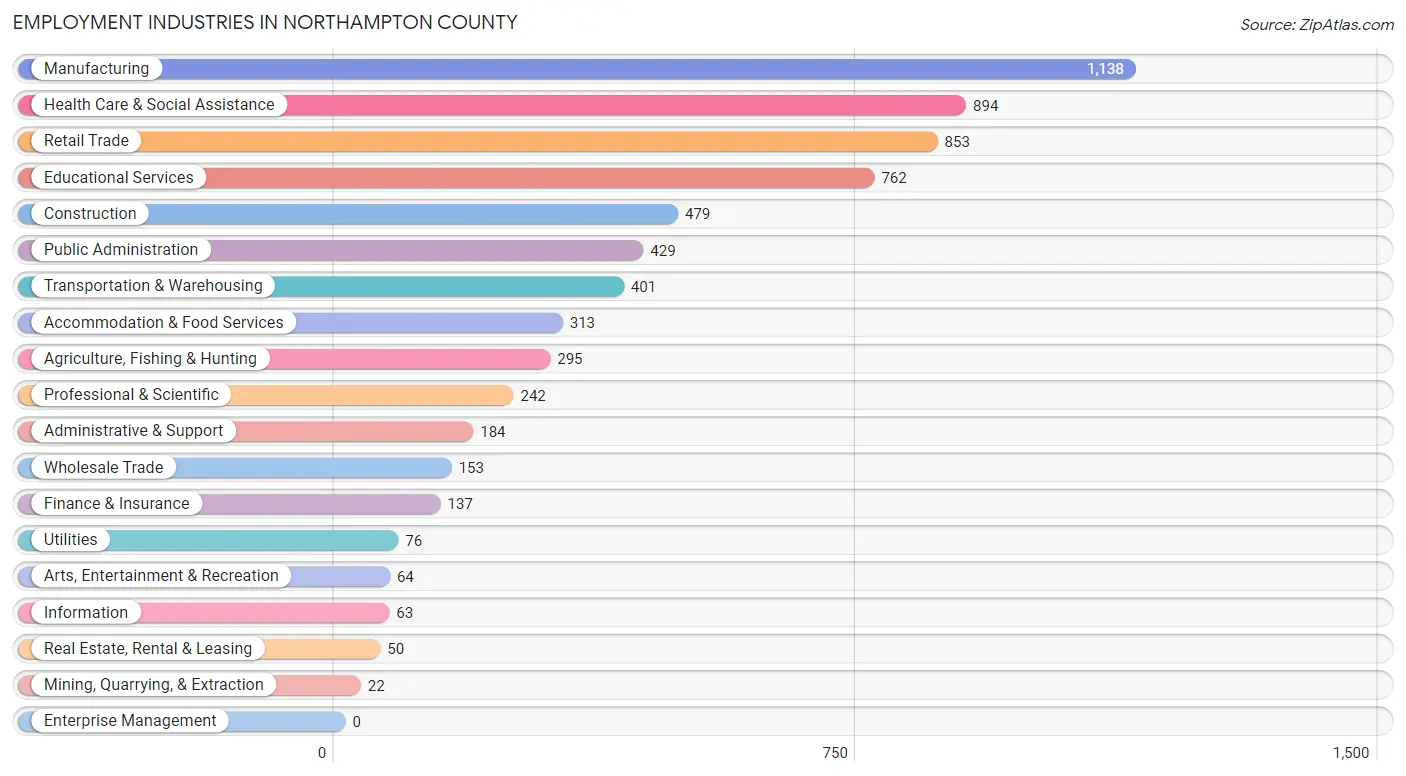
Employment Industries in Northampton County
The major employment industries in Northampton County include Manufacturing (1,138 | 16.6%), Health Care & Social Assistance (894 | 13.1%), Retail Trade (853 | 12.4%), Educational Services (762 | 11.1%), and Construction (479 | 7.0%).
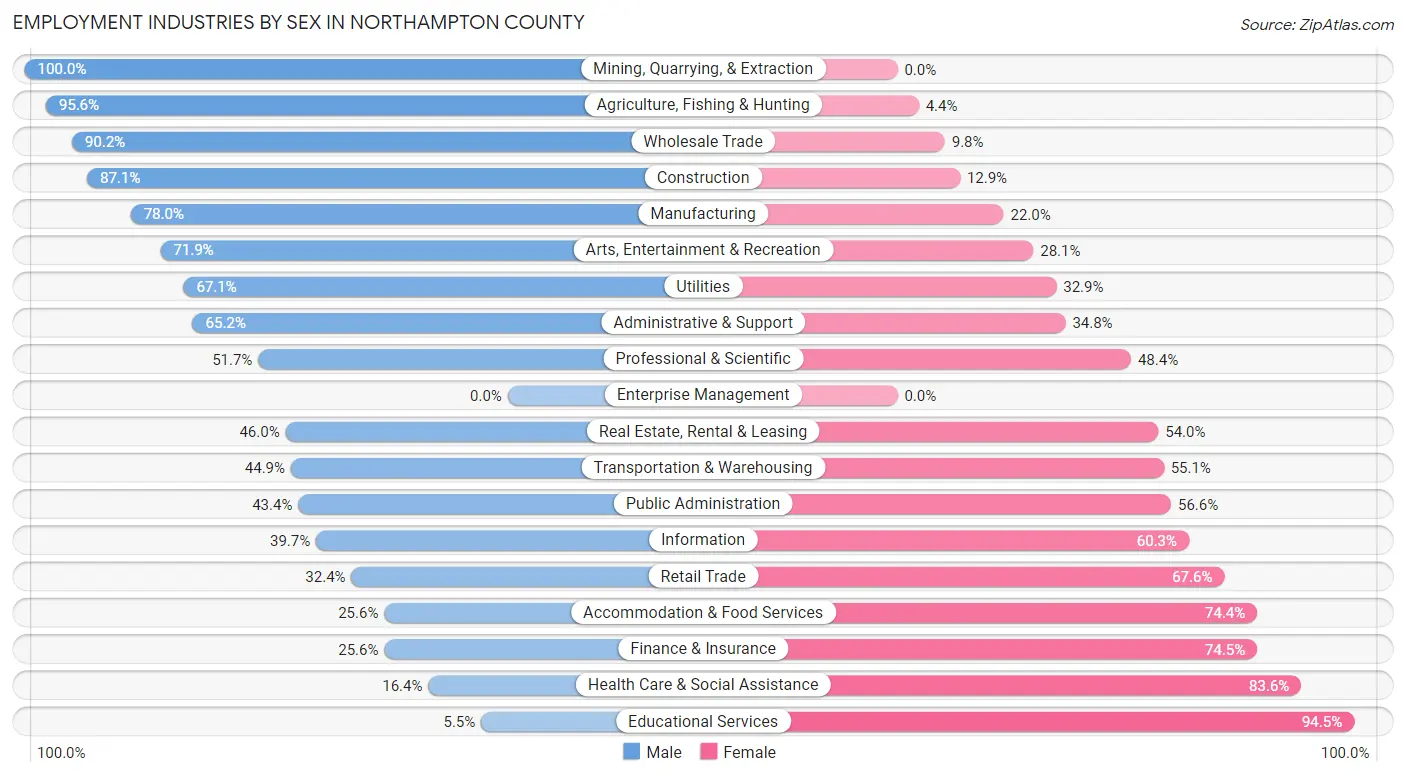
Employment Industries by Sex in Northampton County
The Northampton County industries that see more men than women are Mining, Quarrying, & Extraction (100.0%), Agriculture, Fishing & Hunting (95.6%), and Wholesale Trade (90.2%), whereas the industries that tend to have a higher number of women are Educational Services (94.5%), Health Care & Social Assistance (83.6%), and Finance & Insurance (74.5%).
| Industry | Male | Female |
| Agriculture, Fishing & Hunting | 282 (95.6%) | 13 (4.4%) |
| Mining, Quarrying, & Extraction | 22 (100.0%) | 0 (0.0%) |
| Construction | 417 (87.1%) | 62 (12.9%) |
| Manufacturing | 888 (78.0%) | 250 (22.0%) |
| Wholesale Trade | 138 (90.2%) | 15 (9.8%) |
| Retail Trade | 276 (32.4%) | 577 (67.6%) |
| Transportation & Warehousing | 180 (44.9%) | 221 (55.1%) |
| Utilities | 51 (67.1%) | 25 (32.9%) |
| Information | 25 (39.7%) | 38 (60.3%) |
| Finance & Insurance | 35 (25.6%) | 102 (74.5%) |
| Real Estate, Rental & Leasing | 23 (46.0%) | 27 (54.0%) |
| Professional & Scientific | 125 (51.6%) | 117 (48.3%) |
| Enterprise Management | 0 (0.0%) | 0 (0.0%) |
| Administrative & Support | 120 (65.2%) | 64 (34.8%) |
| Educational Services | 42 (5.5%) | 720 (94.5%) |
| Health Care & Social Assistance | 147 (16.4%) | 747 (83.6%) |
| Arts, Entertainment & Recreation | 46 (71.9%) | 18 (28.1%) |
| Accommodation & Food Services | 80 (25.6%) | 233 (74.4%) |
| Public Administration | 186 (43.4%) | 243 (56.6%) |
| Total | 3,174 (46.3%) | 3,678 (53.7%) |
Education in Northampton County
School Enrollment in Northampton County
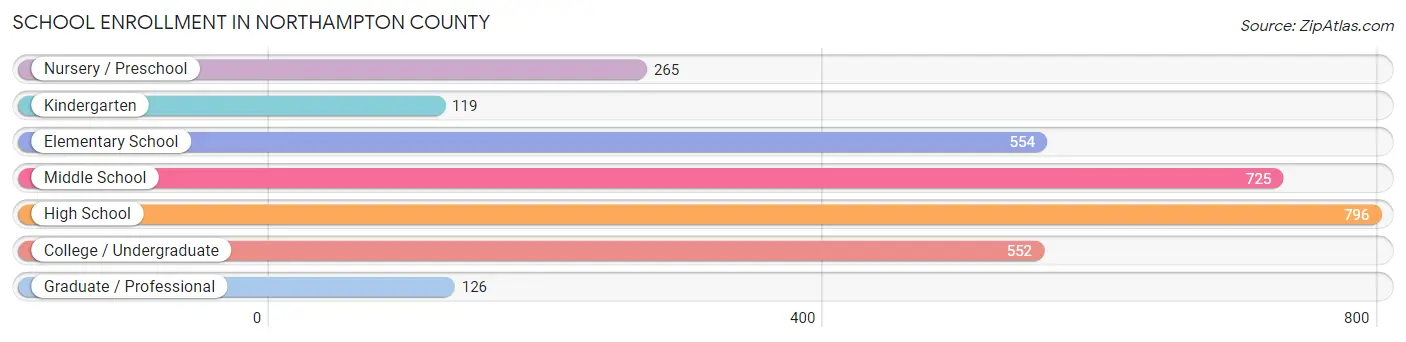
The most common levels of schooling among the 3,137 students in Northampton County are high school (796 | 25.4%), middle school (725 | 23.1%), and elementary school (554 | 17.7%).
| School Level | # Students | % Students |
| Nursery / Preschool | 265 | 8.5% |
| Kindergarten | 119 | 3.8% |
| Elementary School | 554 | 17.7% |
| Middle School | 725 | 23.1% |
| High School | 796 | 25.4% |
| College / Undergraduate | 552 | 17.6% |
| Graduate / Professional | 126 | 4.0% |
| Total | 3,137 | 100.0% |
School Enrollment by Age by Funding Source in Northampton County
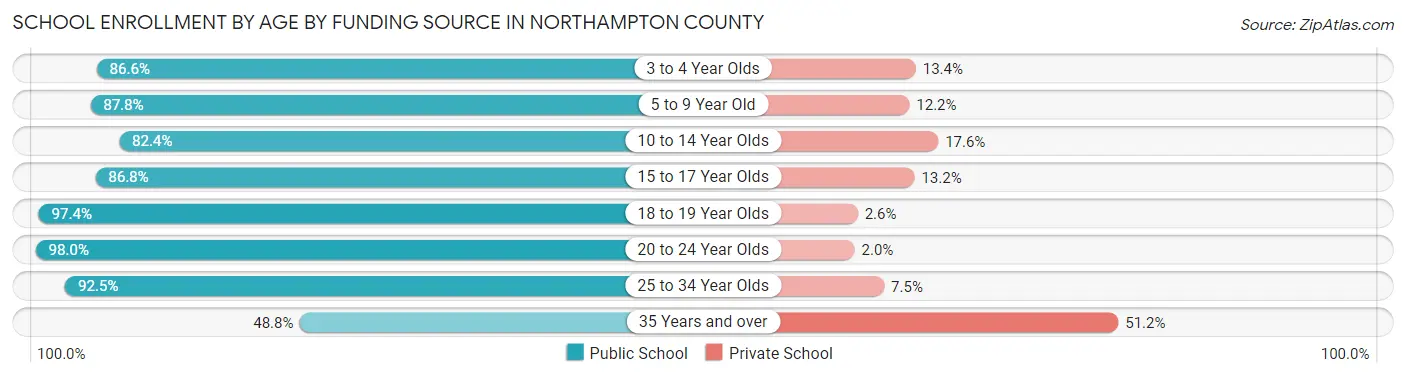
Out of a total of 3,137 students who are enrolled in schools in Northampton County, 474 (15.1%) attend a private institution, while the remaining 2,663 (84.9%) are enrolled in public schools. The age group of 35 years and over has the highest likelihood of being enrolled in private schools, with 110 (51.2% in the age bracket) enrolled. Conversely, the age group of 20 to 24 year olds has the lowest likelihood of being enrolled in a private school, with 144 (98.0% in the age bracket) attending a public institution.
| Age Bracket | Public School | Private School |
| 3 to 4 Year Olds | 116 (86.6%) | 18 (13.4%) |
| 5 to 9 Year Old | 624 (87.8%) | 87 (12.2%) |
| 10 to 14 Year Olds | 744 (82.4%) | 159 (17.6%) |
| 15 to 17 Year Olds | 474 (86.8%) | 72 (13.2%) |
| 18 to 19 Year Olds | 223 (97.4%) | 6 (2.6%) |
| 20 to 24 Year Olds | 144 (98.0%) | 3 (2.0%) |
| 25 to 34 Year Olds | 233 (92.5%) | 19 (7.5%) |
| 35 Years and over | 105 (48.8%) | 110 (51.2%) |
| Total | 2,663 (84.9%) | 474 (15.1%) |
Educational Attainment by Field of Study in Northampton County
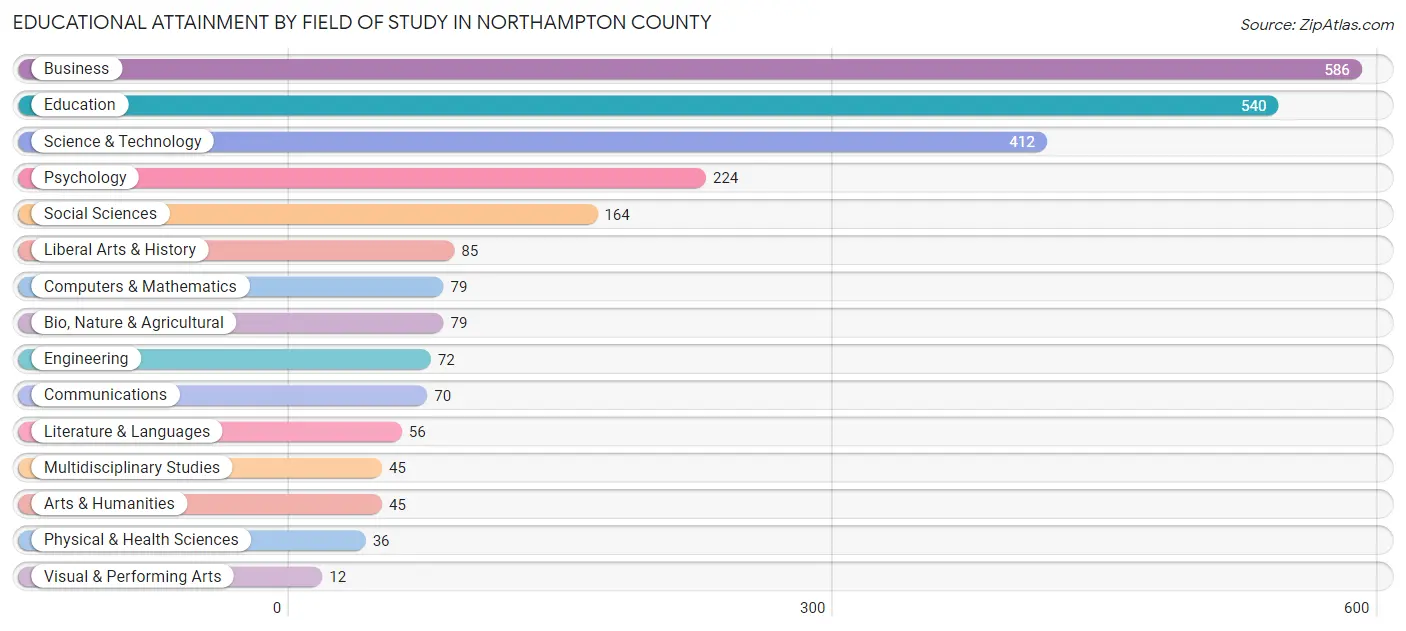
Business (586 | 23.4%), education (540 | 21.6%), science & technology (412 | 16.5%), psychology (224 | 8.9%), and social sciences (164 | 6.6%) are the most common fields of study among 2,505 individuals in Northampton County who have obtained a bachelor's degree or higher.
| Field of Study | # Graduates | % Graduates |
| Computers & Mathematics | 79 | 3.2% |
| Bio, Nature & Agricultural | 79 | 3.2% |
| Physical & Health Sciences | 36 | 1.4% |
| Psychology | 224 | 8.9% |
| Social Sciences | 164 | 6.6% |
| Engineering | 72 | 2.9% |
| Multidisciplinary Studies | 45 | 1.8% |
| Science & Technology | 412 | 16.5% |
| Business | 586 | 23.4% |
| Education | 540 | 21.6% |
| Literature & Languages | 56 | 2.2% |
| Liberal Arts & History | 85 | 3.4% |
| Visual & Performing Arts | 12 | 0.5% |
| Communications | 70 | 2.8% |
| Arts & Humanities | 45 | 1.8% |
| Total | 2,505 | 100.0% |
Transportation & Commute in Northampton County
Vehicle Availability by Sex in Northampton County
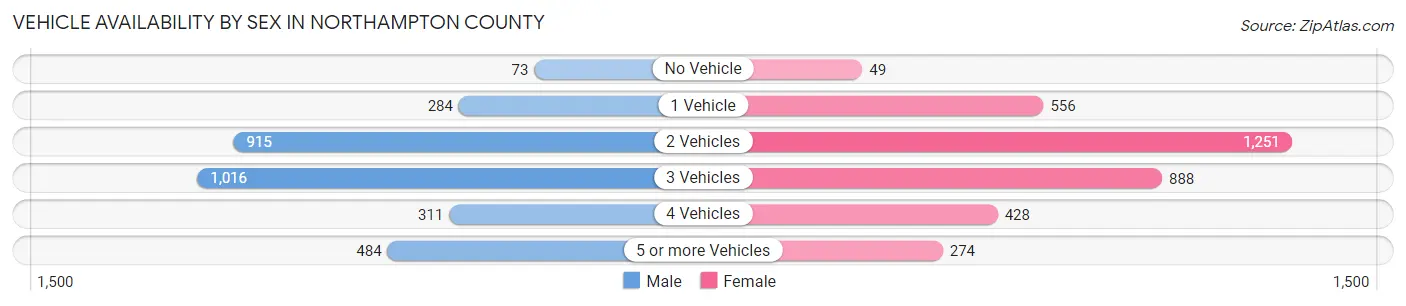
The most prevalent vehicle ownership categories in Northampton County are males with 3 vehicles (1,016, accounting for 33.0%) and females with 3 vehicles (888, making up 29.5%).
| Vehicles Available | Male | Female |
| No Vehicle | 73 (2.4%) | 49 (1.4%) |
| 1 Vehicle | 284 (9.2%) | 556 (16.1%) |
| 2 Vehicles | 915 (29.7%) | 1,251 (36.3%) |
| 3 Vehicles | 1,016 (33.0%) | 888 (25.8%) |
| 4 Vehicles | 311 (10.1%) | 428 (12.4%) |
| 5 or more Vehicles | 484 (15.7%) | 274 (8.0%) |
| Total | 3,083 (100.0%) | 3,446 (100.0%) |
Commute Time in Northampton County
The most frequently occuring commute durations in Northampton County are 30 to 34 minutes (1,076 commuters, 17.5%), 10 to 14 minutes (790 commuters, 12.8%), and 20 to 24 minutes (707 commuters, 11.5%).
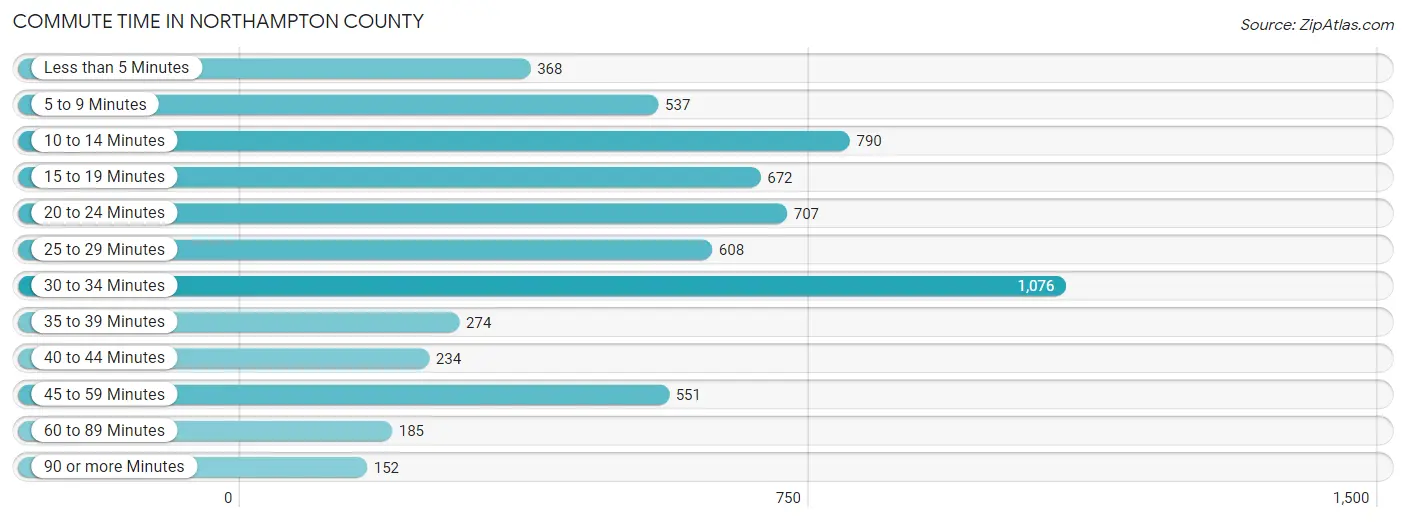
| Commute Time | # Commuters | % Commuters |
| Less than 5 Minutes | 368 | 6.0% |
| 5 to 9 Minutes | 537 | 8.7% |
| 10 to 14 Minutes | 790 | 12.8% |
| 15 to 19 Minutes | 672 | 10.9% |
| 20 to 24 Minutes | 707 | 11.5% |
| 25 to 29 Minutes | 608 | 9.9% |
| 30 to 34 Minutes | 1,076 | 17.5% |
| 35 to 39 Minutes | 274 | 4.4% |
| 40 to 44 Minutes | 234 | 3.8% |
| 45 to 59 Minutes | 551 | 8.9% |
| 60 to 89 Minutes | 185 | 3.0% |
| 90 or more Minutes | 152 | 2.5% |
Commute Time by Sex in Northampton County
The most common commute times in Northampton County are 10 to 14 minutes (414 commuters, 14.0%) for males and 30 to 34 minutes (669 commuters, 21.0%) for females.
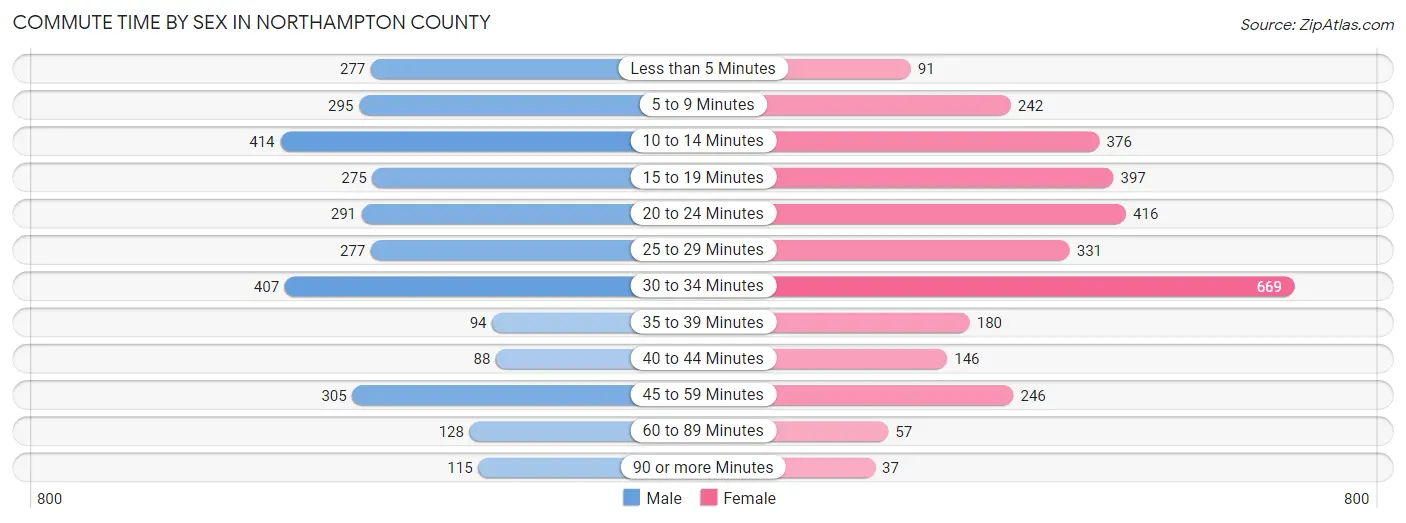
| Commute Time | Male | Female |
| Less than 5 Minutes | 277 (9.3%) | 91 (2.9%) |
| 5 to 9 Minutes | 295 (10.0%) | 242 (7.6%) |
| 10 to 14 Minutes | 414 (14.0%) | 376 (11.8%) |
| 15 to 19 Minutes | 275 (9.3%) | 397 (12.4%) |
| 20 to 24 Minutes | 291 (9.8%) | 416 (13.1%) |
| 25 to 29 Minutes | 277 (9.3%) | 331 (10.4%) |
| 30 to 34 Minutes | 407 (13.7%) | 669 (21.0%) |
| 35 to 39 Minutes | 94 (3.2%) | 180 (5.7%) |
| 40 to 44 Minutes | 88 (3.0%) | 146 (4.6%) |
| 45 to 59 Minutes | 305 (10.3%) | 246 (7.7%) |
| 60 to 89 Minutes | 128 (4.3%) | 57 (1.8%) |
| 90 or more Minutes | 115 (3.9%) | 37 (1.2%) |
Time of Departure to Work by Sex in Northampton County
The most frequent times of departure to work in Northampton County are 7:00 AM to 7:29 AM (531, 17.9%) for males and 8:00 AM to 8:29 AM (752, 23.6%) for females.
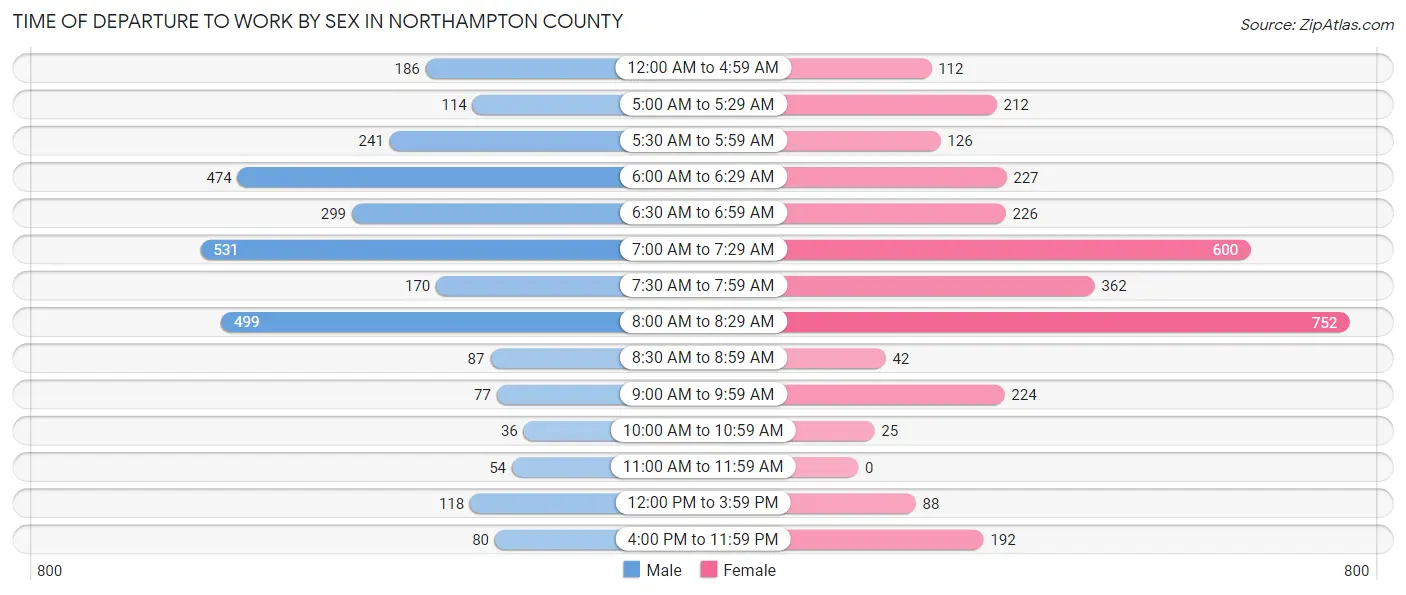
| Time of Departure | Male | Female |
| 12:00 AM to 4:59 AM | 186 (6.3%) | 112 (3.5%) |
| 5:00 AM to 5:29 AM | 114 (3.8%) | 212 (6.7%) |
| 5:30 AM to 5:59 AM | 241 (8.1%) | 126 (4.0%) |
| 6:00 AM to 6:29 AM | 474 (16.0%) | 227 (7.1%) |
| 6:30 AM to 6:59 AM | 299 (10.1%) | 226 (7.1%) |
| 7:00 AM to 7:29 AM | 531 (17.9%) | 600 (18.8%) |
| 7:30 AM to 7:59 AM | 170 (5.7%) | 362 (11.4%) |
| 8:00 AM to 8:29 AM | 499 (16.8%) | 752 (23.6%) |
| 8:30 AM to 8:59 AM | 87 (2.9%) | 42 (1.3%) |
| 9:00 AM to 9:59 AM | 77 (2.6%) | 224 (7.0%) |
| 10:00 AM to 10:59 AM | 36 (1.2%) | 25 (0.8%) |
| 11:00 AM to 11:59 AM | 54 (1.8%) | 0 (0.0%) |
| 12:00 PM to 3:59 PM | 118 (4.0%) | 88 (2.8%) |
| 4:00 PM to 11:59 PM | 80 (2.7%) | 192 (6.0%) |
| Total | 2,966 (100.0%) | 3,188 (100.0%) |
Housing Occupancy in Northampton County
Occupancy by Ownership in Northampton County
Of the total 7,463 dwellings in Northampton County, owner-occupied units account for 5,360 (71.8%), while renter-occupied units make up 2,103 (28.2%).
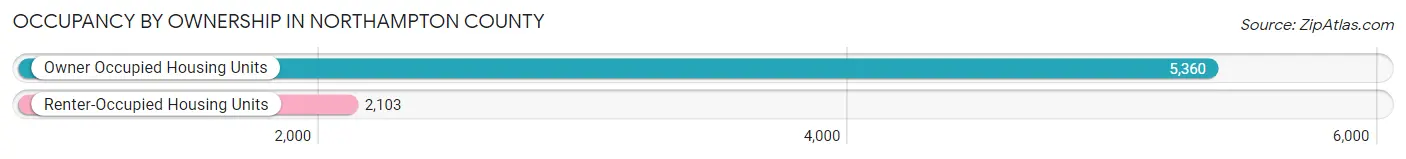
| Occupancy | # Housing Units | % Housing Units |
| Owner Occupied Housing Units | 5,360 | 71.8% |
| Renter-Occupied Housing Units | 2,103 | 28.2% |
| Total Occupied Housing Units | 7,463 | 100.0% |
Occupancy by Household Size in Northampton County
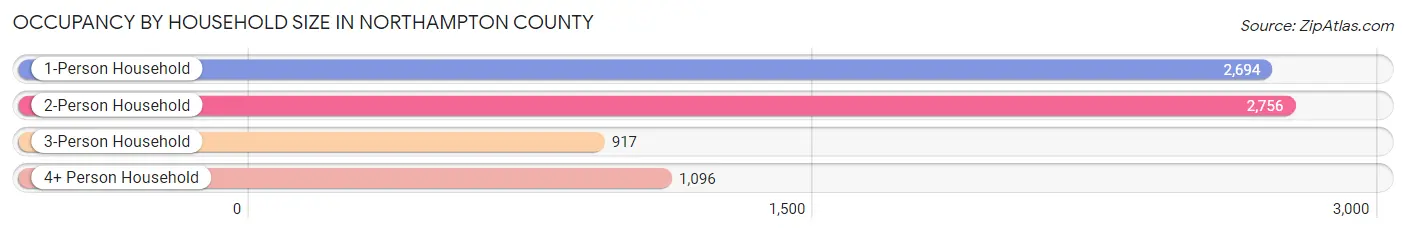
| Household Size | # Housing Units | % Housing Units |
| 1-Person Household | 2,694 | 36.1% |
| 2-Person Household | 2,756 | 36.9% |
| 3-Person Household | 917 | 12.3% |
| 4+ Person Household | 1,096 | 14.7% |
| Total Housing Units | 7,463 | 100.0% |
Occupancy by Ownership by Household Size in Northampton County
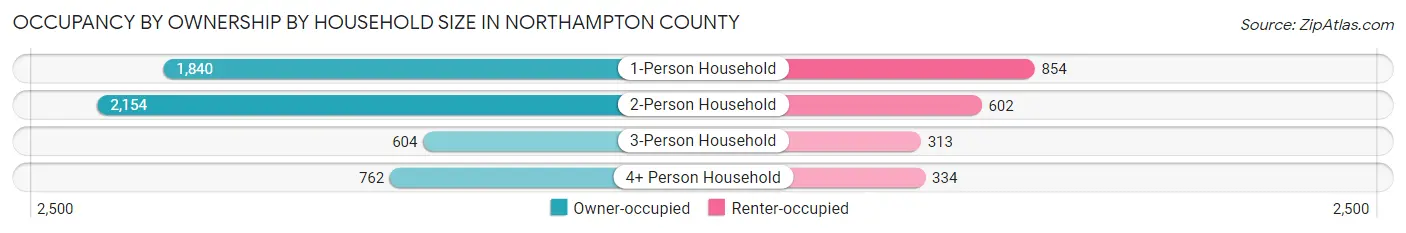
| Household Size | Owner-occupied | Renter-occupied |
| 1-Person Household | 1,840 (68.3%) | 854 (31.7%) |
| 2-Person Household | 2,154 (78.2%) | 602 (21.8%) |
| 3-Person Household | 604 (65.9%) | 313 (34.1%) |
| 4+ Person Household | 762 (69.5%) | 334 (30.5%) |
| Total Housing Units | 5,360 (71.8%) | 2,103 (28.2%) |
Occupancy by Educational Attainment in Northampton County
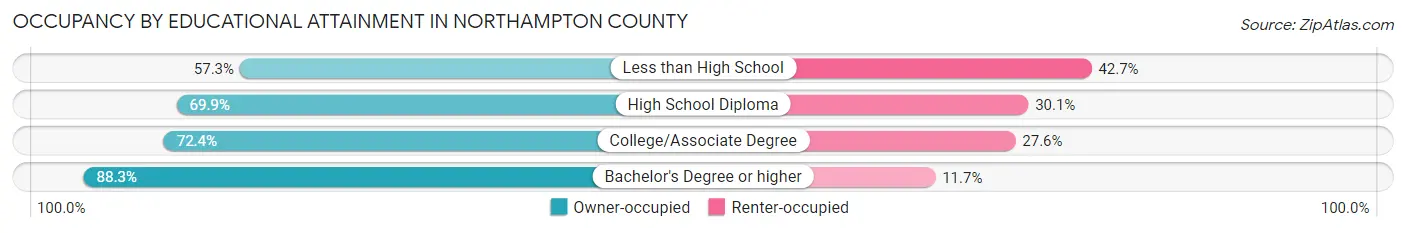
| Household Size | Owner-occupied | Renter-occupied |
| Less than High School | 799 (57.3%) | 595 (42.7%) |
| High School Diploma | 1,567 (69.9%) | 676 (30.1%) |
| College/Associate Degree | 1,750 (72.4%) | 667 (27.6%) |
| Bachelor's Degree or higher | 1,244 (88.3%) | 165 (11.7%) |
Occupancy by Age of Householder in Northampton County
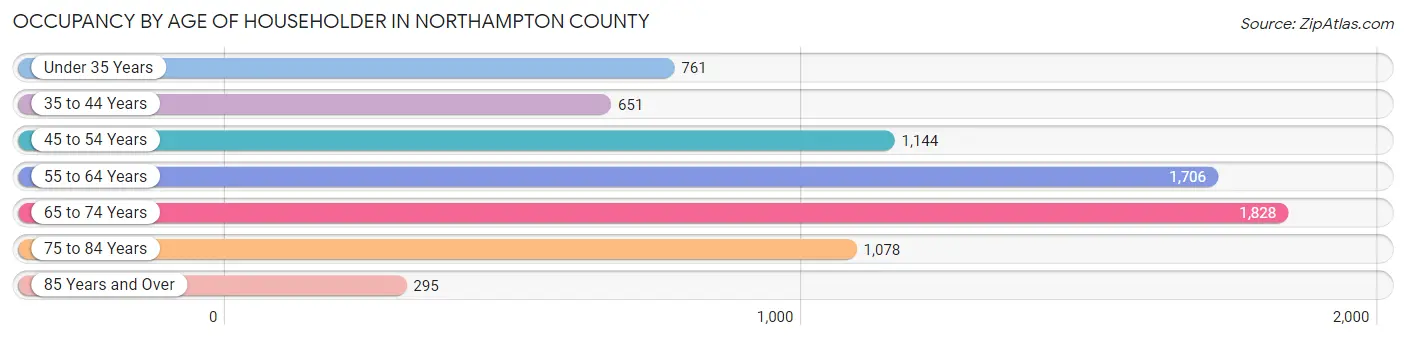
| Age Bracket | # Households | % Households |
| Under 35 Years | 761 | 10.2% |
| 35 to 44 Years | 651 | 8.7% |
| 45 to 54 Years | 1,144 | 15.3% |
| 55 to 64 Years | 1,706 | 22.9% |
| 65 to 74 Years | 1,828 | 24.5% |
| 75 to 84 Years | 1,078 | 14.4% |
| 85 Years and Over | 295 | 4.0% |
| Total | 7,463 | 100.0% |
Housing Finances in Northampton County
Median Income by Occupancy in Northampton County
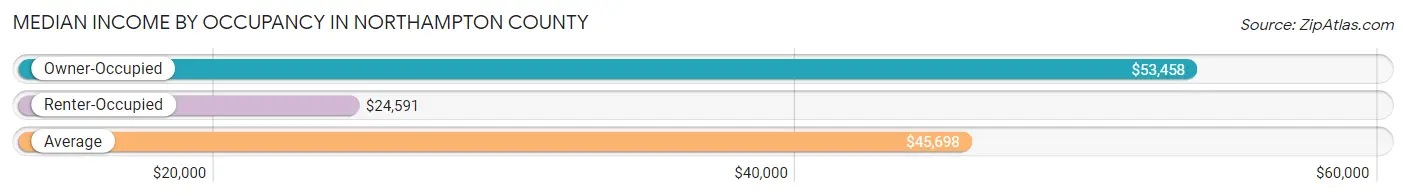
| Occupancy Type | # Households | Median Income |
| Owner-Occupied | 5,360 (71.8%) | $53,458 |
| Renter-Occupied | 2,103 (28.2%) | $24,591 |
| Average | 7,463 (100.0%) | $45,698 |
Occupancy by Householder Income Bracket in Northampton County
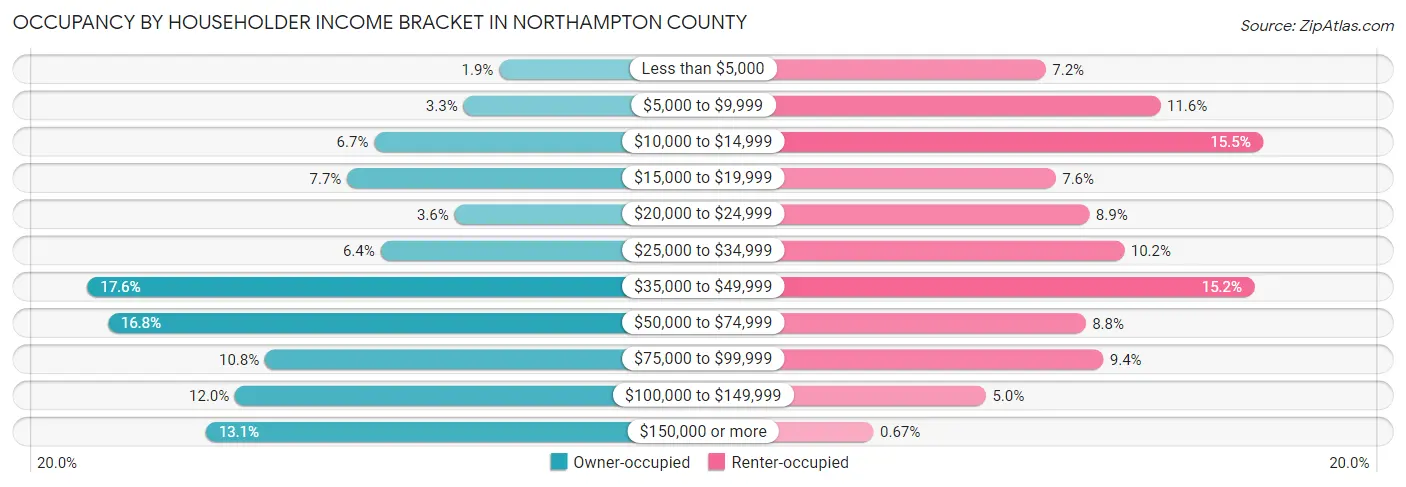
| Income Bracket | Owner-occupied | Renter-occupied |
| Less than $5,000 | 103 (1.9%) | 152 (7.2%) |
| $5,000 to $9,999 | 176 (3.3%) | 244 (11.6%) |
| $10,000 to $14,999 | 358 (6.7%) | 326 (15.5%) |
| $15,000 to $19,999 | 413 (7.7%) | 160 (7.6%) |
| $20,000 to $24,999 | 194 (3.6%) | 187 (8.9%) |
| $25,000 to $34,999 | 345 (6.4%) | 215 (10.2%) |
| $35,000 to $49,999 | 944 (17.6%) | 319 (15.2%) |
| $50,000 to $74,999 | 902 (16.8%) | 184 (8.7%) |
| $75,000 to $99,999 | 581 (10.8%) | 198 (9.4%) |
| $100,000 to $149,999 | 642 (12.0%) | 104 (5.0%) |
| $150,000 or more | 702 (13.1%) | 14 (0.7%) |
| Total | 5,360 (100.0%) | 2,103 (100.0%) |
Monthly Housing Cost Tiers in Northampton County
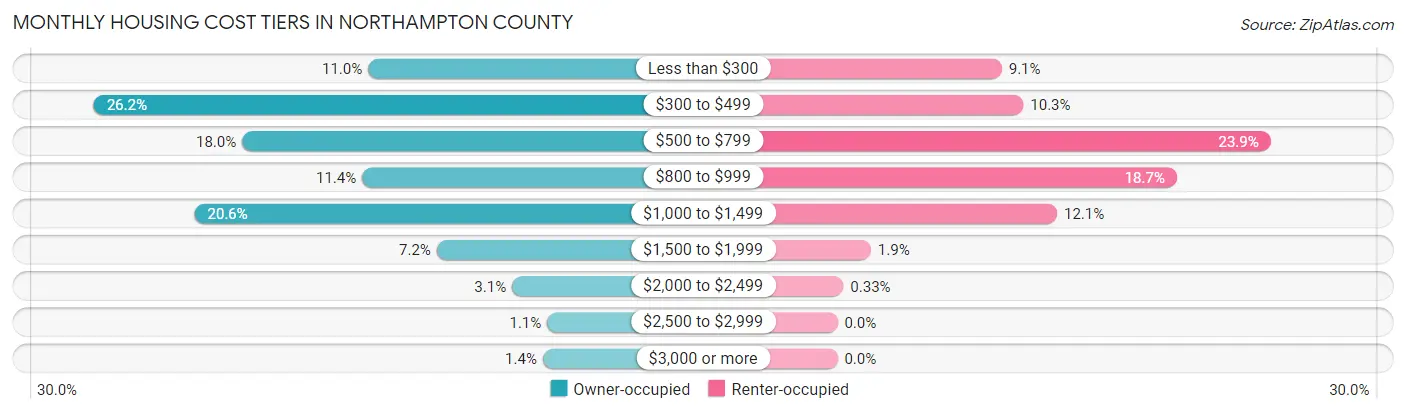
| Monthly Cost | Owner-occupied | Renter-occupied |
| Less than $300 | 591 (11.0%) | 191 (9.1%) |
| $300 to $499 | 1,403 (26.2%) | 216 (10.3%) |
| $500 to $799 | 964 (18.0%) | 503 (23.9%) |
| $800 to $999 | 609 (11.4%) | 394 (18.7%) |
| $1,000 to $1,499 | 1,105 (20.6%) | 255 (12.1%) |
| $1,500 to $1,999 | 388 (7.2%) | 39 (1.8%) |
| $2,000 to $2,499 | 165 (3.1%) | 7 (0.3%) |
| $2,500 to $2,999 | 61 (1.1%) | 0 (0.0%) |
| $3,000 or more | 74 (1.4%) | 0 (0.0%) |
| Total | 5,360 (100.0%) | 2,103 (100.0%) |
Physical Housing Characteristics in Northampton County
Housing Structures in Northampton County
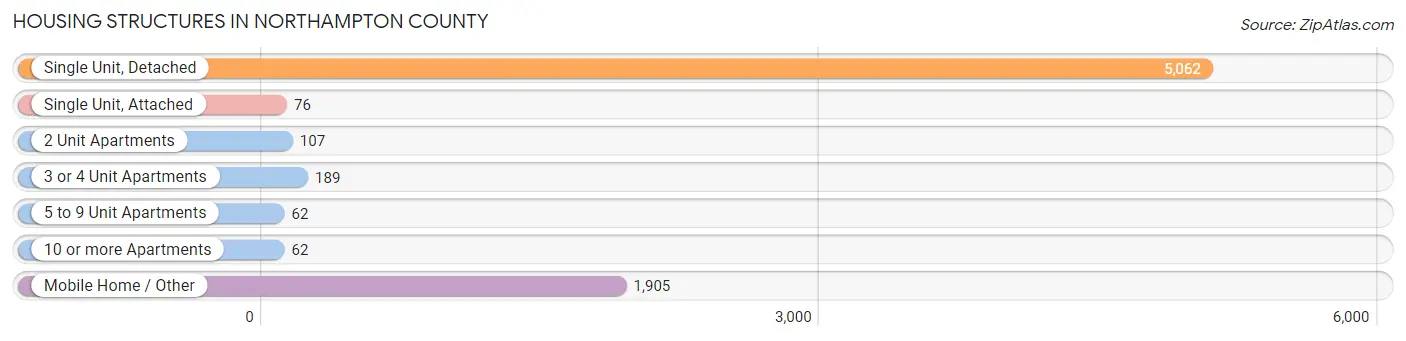
| Structure Type | # Housing Units | % Housing Units |
| Single Unit, Detached | 5,062 | 67.8% |
| Single Unit, Attached | 76 | 1.0% |
| 2 Unit Apartments | 107 | 1.4% |
| 3 or 4 Unit Apartments | 189 | 2.5% |
| 5 to 9 Unit Apartments | 62 | 0.8% |
| 10 or more Apartments | 62 | 0.8% |
| Mobile Home / Other | 1,905 | 25.5% |
| Total | 7,463 | 100.0% |
Housing Structures by Occupancy in Northampton County
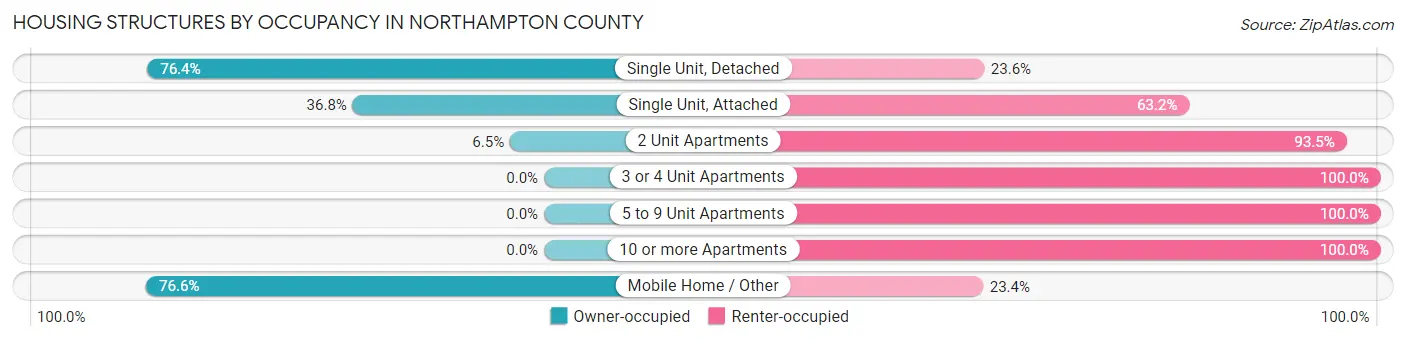
| Structure Type | Owner-occupied | Renter-occupied |
| Single Unit, Detached | 3,866 (76.4%) | 1,196 (23.6%) |
| Single Unit, Attached | 28 (36.8%) | 48 (63.2%) |
| 2 Unit Apartments | 7 (6.5%) | 100 (93.5%) |
| 3 or 4 Unit Apartments | 0 (0.0%) | 189 (100.0%) |
| 5 to 9 Unit Apartments | 0 (0.0%) | 62 (100.0%) |
| 10 or more Apartments | 0 (0.0%) | 62 (100.0%) |
| Mobile Home / Other | 1,459 (76.6%) | 446 (23.4%) |
| Total | 5,360 (71.8%) | 2,103 (28.2%) |
Housing Structures by Number of Rooms in Northampton County
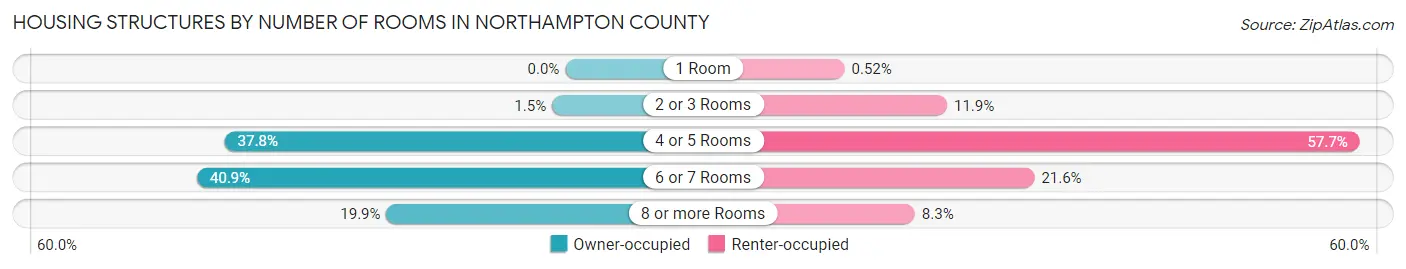
| Number of Rooms | Owner-occupied | Renter-occupied |
| 1 Room | 0 (0.0%) | 11 (0.5%) |
| 2 or 3 Rooms | 79 (1.5%) | 250 (11.9%) |
| 4 or 5 Rooms | 2,026 (37.8%) | 1,213 (57.7%) |
| 6 or 7 Rooms | 2,191 (40.9%) | 454 (21.6%) |
| 8 or more Rooms | 1,064 (19.9%) | 175 (8.3%) |
| Total | 5,360 (100.0%) | 2,103 (100.0%) |
Housing Structure by Heating Type in Northampton County
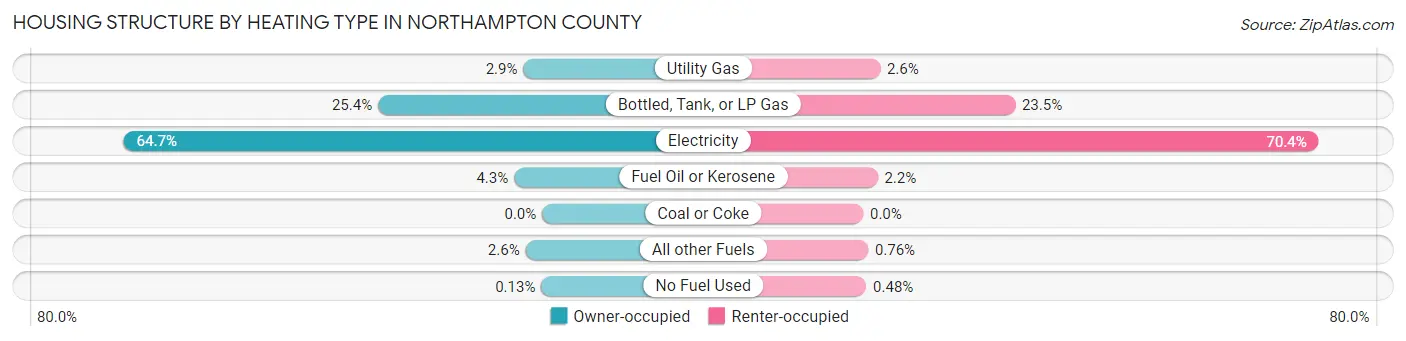
| Heating Type | Owner-occupied | Renter-occupied |
| Utility Gas | 156 (2.9%) | 55 (2.6%) |
| Bottled, Tank, or LP Gas | 1,360 (25.4%) | 494 (23.5%) |
| Electricity | 3,467 (64.7%) | 1,481 (70.4%) |
| Fuel Oil or Kerosene | 232 (4.3%) | 47 (2.2%) |
| Coal or Coke | 0 (0.0%) | 0 (0.0%) |
| All other Fuels | 138 (2.6%) | 16 (0.8%) |
| No Fuel Used | 7 (0.1%) | 10 (0.5%) |
| Total | 5,360 (100.0%) | 2,103 (100.0%) |
Household Vehicle Usage in Northampton County
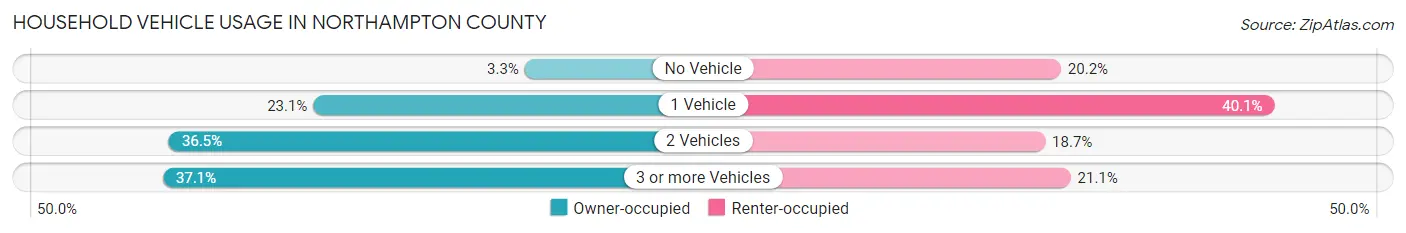
| Vehicles per Household | Owner-occupied | Renter-occupied |
| No Vehicle | 178 (3.3%) | 424 (20.2%) |
| 1 Vehicle | 1,236 (23.1%) | 843 (40.1%) |
| 2 Vehicles | 1,958 (36.5%) | 393 (18.7%) |
| 3 or more Vehicles | 1,988 (37.1%) | 443 (21.1%) |
| Total | 5,360 (100.0%) | 2,103 (100.0%) |
Real Estate & Mortgages in Northampton County
Real Estate and Mortgage Overview in Northampton County
| Characteristic | Without Mortgage | With Mortgage |
| Housing Units | 3,034 | 2,326 |
| Median Property Value | $72,800 | $140,500 |
| Median Household Income | $45,961 | $403 |
| Monthly Housing Costs | $440 | $74 |
| Real Estate Taxes | $975 | $86 |
Property Value by Mortgage Status in Northampton County
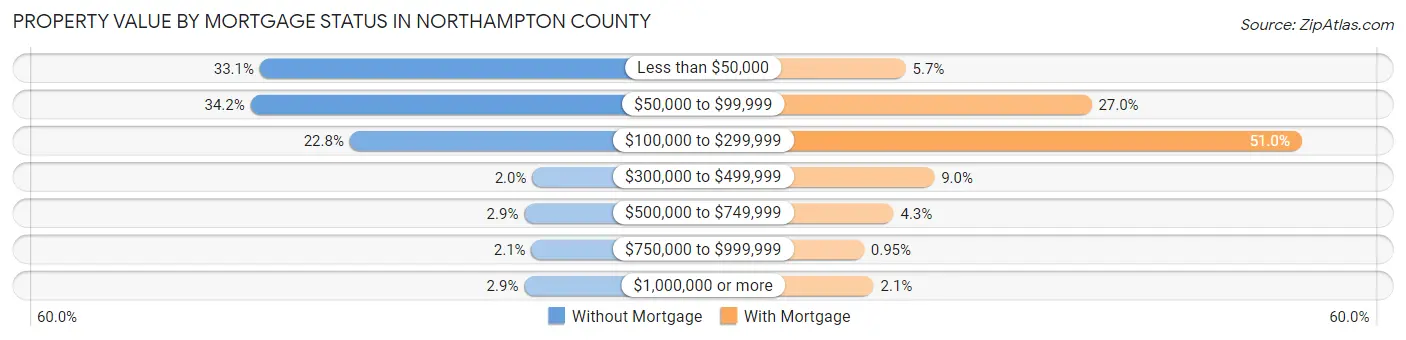
| Property Value | Without Mortgage | With Mortgage |
| Less than $50,000 | 1,005 (33.1%) | 133 (5.7%) |
| $50,000 to $99,999 | 1,037 (34.2%) | 627 (27.0%) |
| $100,000 to $299,999 | 693 (22.8%) | 1,186 (51.0%) |
| $300,000 to $499,999 | 60 (2.0%) | 209 (9.0%) |
| $500,000 to $749,999 | 88 (2.9%) | 101 (4.3%) |
| $750,000 to $999,999 | 63 (2.1%) | 22 (0.9%) |
| $1,000,000 or more | 88 (2.9%) | 48 (2.1%) |
| Total | 3,034 (100.0%) | 2,326 (100.0%) |
Household Income by Mortgage Status in Northampton County
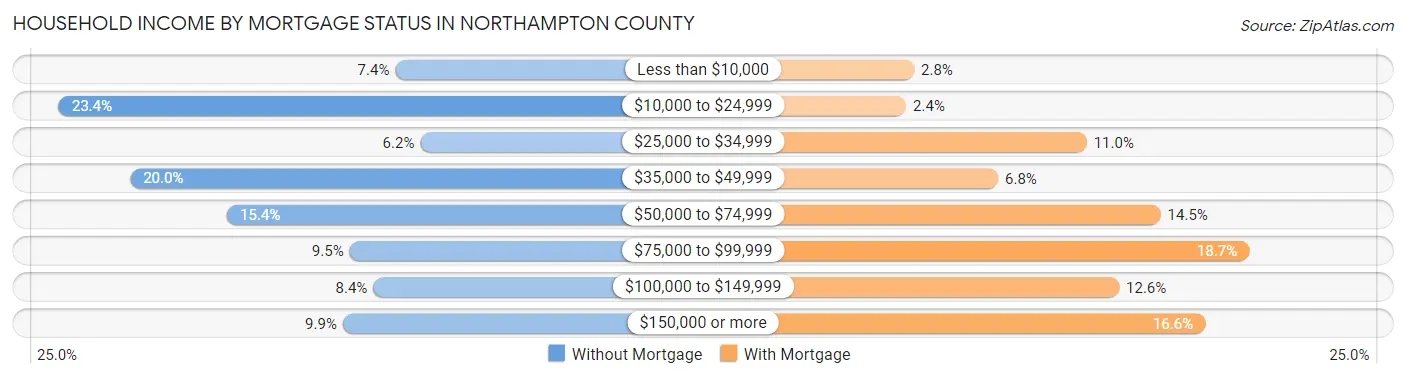
| Household Income | Without Mortgage | With Mortgage |
| Less than $10,000 | 223 (7.3%) | 65 (2.8%) |
| $10,000 to $24,999 | 709 (23.4%) | 56 (2.4%) |
| $25,000 to $34,999 | 187 (6.2%) | 256 (11.0%) |
| $35,000 to $49,999 | 606 (20.0%) | 158 (6.8%) |
| $50,000 to $74,999 | 466 (15.4%) | 338 (14.5%) |
| $75,000 to $99,999 | 289 (9.5%) | 436 (18.7%) |
| $100,000 to $149,999 | 255 (8.4%) | 292 (12.6%) |
| $150,000 or more | 299 (9.9%) | 387 (16.6%) |
| Total | 3,034 (100.0%) | 2,326 (100.0%) |
Property Value to Household Income Ratio in Northampton County
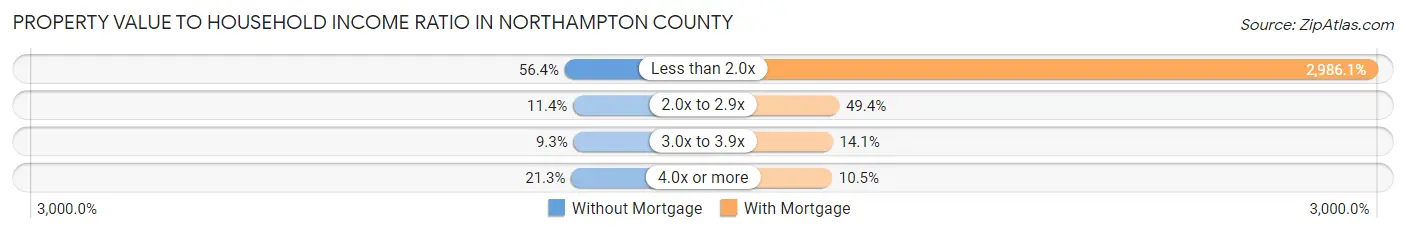
| Value-to-Income Ratio | Without Mortgage | With Mortgage |
| Less than 2.0x | 1,710 (56.4%) | 69,457 (2,986.1%) |
| 2.0x to 2.9x | 345 (11.4%) | 1,149 (49.4%) |
| 3.0x to 3.9x | 281 (9.3%) | 328 (14.1%) |
| 4.0x or more | 646 (21.3%) | 245 (10.5%) |
| Total | 3,034 (100.0%) | 2,326 (100.0%) |
Real Estate Taxes by Mortgage Status in Northampton County
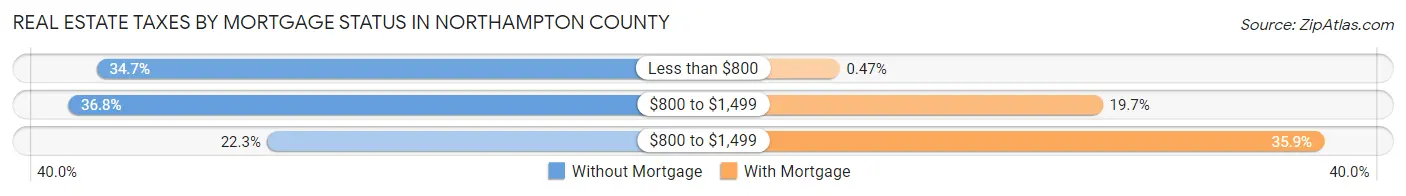
| Property Taxes | Without Mortgage | With Mortgage |
| Less than $800 | 1,054 (34.7%) | 11 (0.5%) |
| $800 to $1,499 | 1,117 (36.8%) | 458 (19.7%) |
| $800 to $1,499 | 677 (22.3%) | 834 (35.9%) |
| Total | 3,034 (100.0%) | 2,326 (100.0%) |
Health & Disability in Northampton County
Health Insurance Coverage by Age in Northampton County
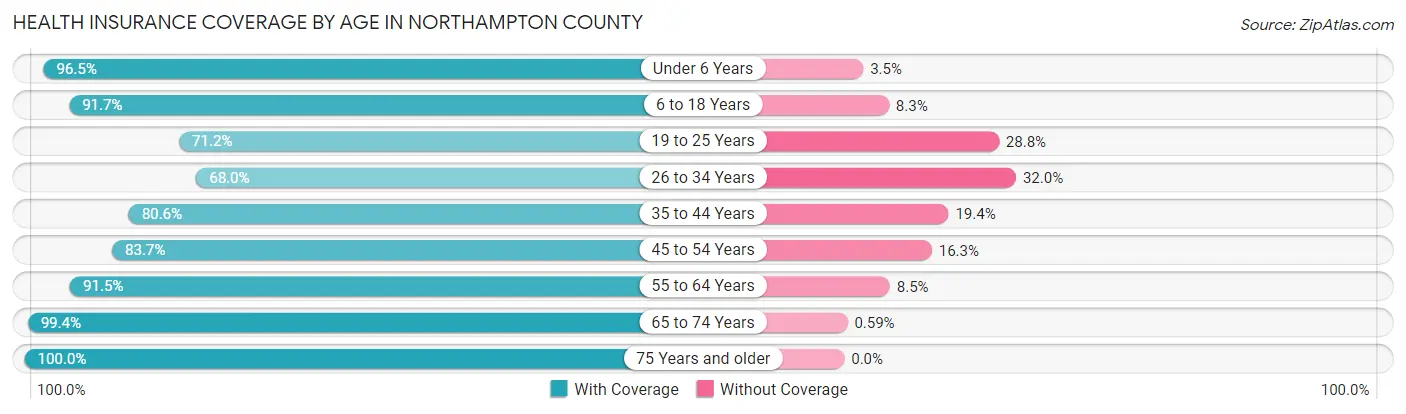
| Age Bracket | With Coverage | Without Coverage |
| Under 6 Years | 1,011 (96.5%) | 37 (3.5%) |
| 6 to 18 Years | 2,083 (91.7%) | 189 (8.3%) |
| 19 to 25 Years | 743 (71.2%) | 301 (28.8%) |
| 26 to 34 Years | 1,034 (68.0%) | 487 (32.0%) |
| 35 to 44 Years | 1,182 (80.6%) | 285 (19.4%) |
| 45 to 54 Years | 1,615 (83.7%) | 315 (16.3%) |
| 55 to 64 Years | 2,648 (91.5%) | 246 (8.5%) |
| 65 to 74 Years | 2,694 (99.4%) | 16 (0.6%) |
| 75 Years and older | 1,897 (100.0%) | 0 (0.0%) |
| Total | 14,907 (88.8%) | 1,876 (11.2%) |
Health Insurance Coverage by Citizenship Status in Northampton County
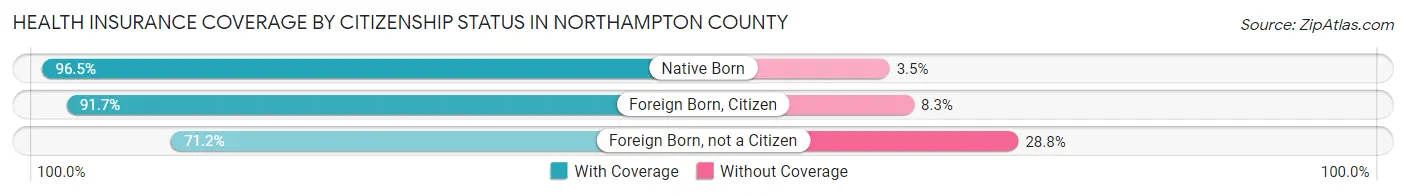
| Citizenship Status | With Coverage | Without Coverage |
| Native Born | 1,011 (96.5%) | 37 (3.5%) |
| Foreign Born, Citizen | 2,083 (91.7%) | 189 (8.3%) |
| Foreign Born, not a Citizen | 743 (71.2%) | 301 (28.8%) |
Health Insurance Coverage by Household Income in Northampton County
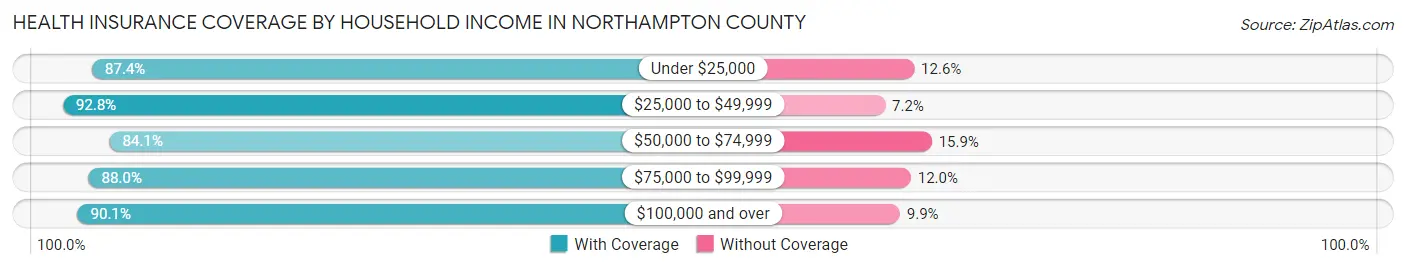
| Household Income | With Coverage | Without Coverage |
| Under $25,000 | 3,392 (87.4%) | 490 (12.6%) |
| $25,000 to $49,999 | 3,451 (92.8%) | 267 (7.2%) |
| $50,000 to $74,999 | 2,236 (84.1%) | 423 (15.9%) |
| $75,000 to $99,999 | 2,077 (88.0%) | 283 (12.0%) |
| $100,000 and over | 3,744 (90.1%) | 413 (9.9%) |
Public vs Private Health Insurance Coverage by Age in Northampton County
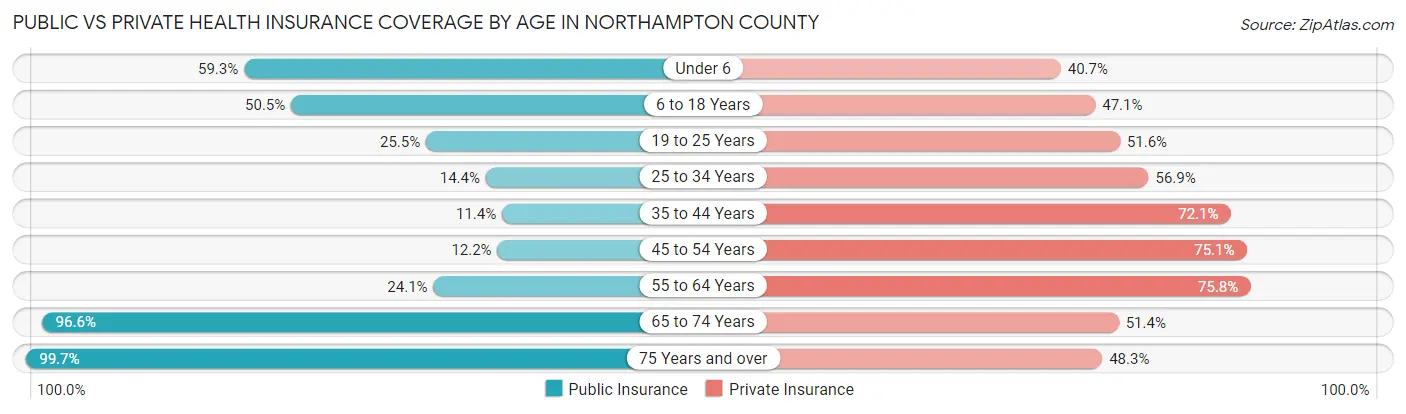
| Age Bracket | Public Insurance | Private Insurance |
| Under 6 | 621 (59.3%) | 426 (40.6%) |
| 6 to 18 Years | 1,148 (50.5%) | 1,069 (47.0%) |
| 19 to 25 Years | 266 (25.5%) | 539 (51.6%) |
| 25 to 34 Years | 219 (14.4%) | 866 (56.9%) |
| 35 to 44 Years | 167 (11.4%) | 1,058 (72.1%) |
| 45 to 54 Years | 236 (12.2%) | 1,449 (75.1%) |
| 55 to 64 Years | 698 (24.1%) | 2,193 (75.8%) |
| 65 to 74 Years | 2,619 (96.6%) | 1,393 (51.4%) |
| 75 Years and over | 1,891 (99.7%) | 917 (48.3%) |
| Total | 7,865 (46.9%) | 9,910 (59.1%) |
Disability Status by Sex by Age in Northampton County
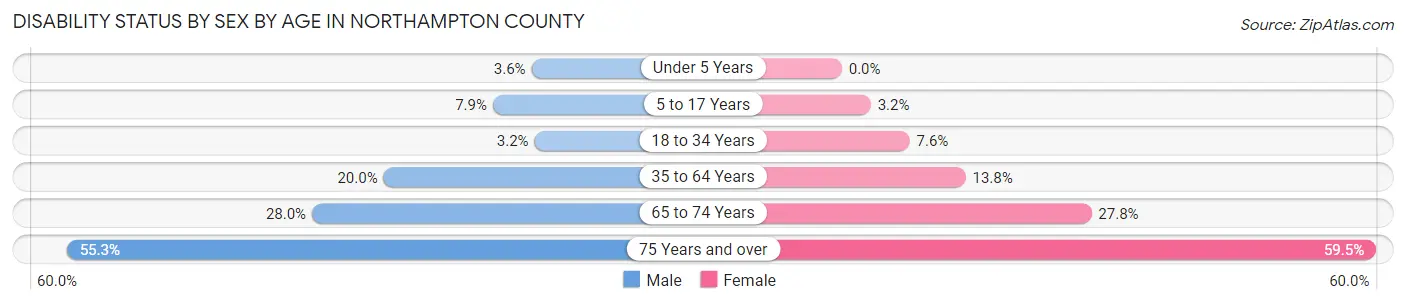
| Age Bracket | Male | Female |
| Under 5 Years | 14 (3.5%) | 0 (0.0%) |
| 5 to 17 Years | 93 (7.9%) | 33 (3.2%) |
| 18 to 34 Years | 44 (3.2%) | 108 (7.5%) |
| 35 to 64 Years | 580 (20.0%) | 468 (13.8%) |
| 65 to 74 Years | 364 (28.0%) | 392 (27.8%) |
| 75 Years and over | 417 (55.3%) | 680 (59.5%) |
Disability Class by Sex by Age in Northampton County
Disability Class: Hearing Difficulty
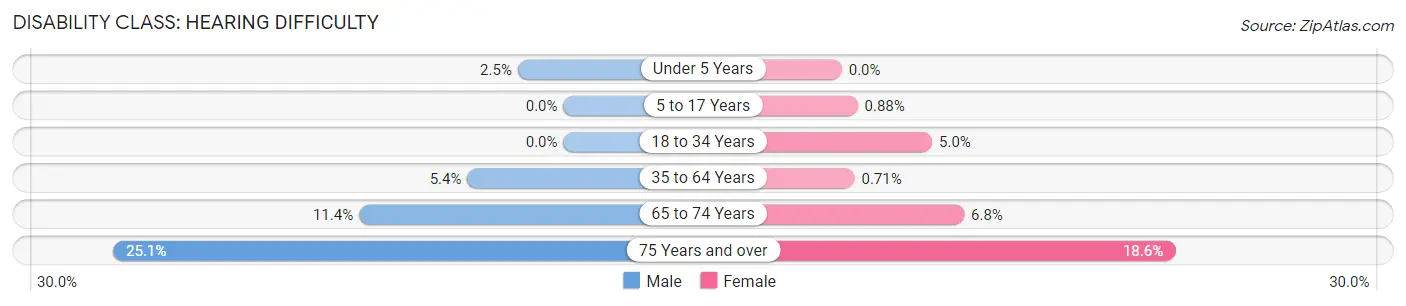
| Age Bracket | Male | Female |
| Under 5 Years | 10 (2.5%) | 0 (0.0%) |
| 5 to 17 Years | 0 (0.0%) | 9 (0.9%) |
| 18 to 34 Years | 0 (0.0%) | 72 (5.0%) |
| 35 to 64 Years | 155 (5.3%) | 24 (0.7%) |
| 65 to 74 Years | 148 (11.4%) | 96 (6.8%) |
| 75 Years and over | 189 (25.1%) | 212 (18.5%) |
Disability Class: Vision Difficulty
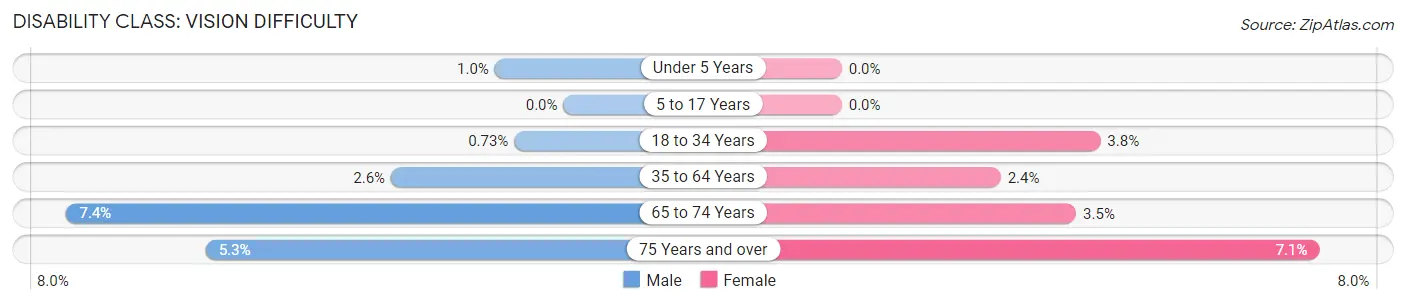
| Age Bracket | Male | Female |
| Under 5 Years | 4 (1.0%) | 0 (0.0%) |
| 5 to 17 Years | 0 (0.0%) | 0 (0.0%) |
| 18 to 34 Years | 10 (0.7%) | 55 (3.8%) |
| 35 to 64 Years | 74 (2.6%) | 80 (2.4%) |
| 65 to 74 Years | 96 (7.4%) | 49 (3.5%) |
| 75 Years and over | 40 (5.3%) | 81 (7.1%) |
Disability Class: Cognitive Difficulty
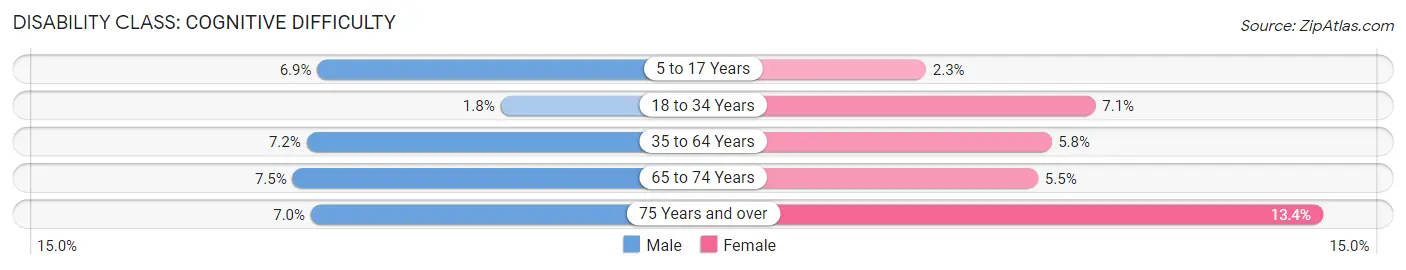
| Age Bracket | Male | Female |
| 5 to 17 Years | 81 (6.9%) | 24 (2.3%) |
| 18 to 34 Years | 24 (1.8%) | 101 (7.1%) |
| 35 to 64 Years | 207 (7.1%) | 198 (5.8%) |
| 65 to 74 Years | 98 (7.5%) | 77 (5.5%) |
| 75 Years and over | 53 (7.0%) | 153 (13.4%) |
Disability Class: Ambulatory Difficulty
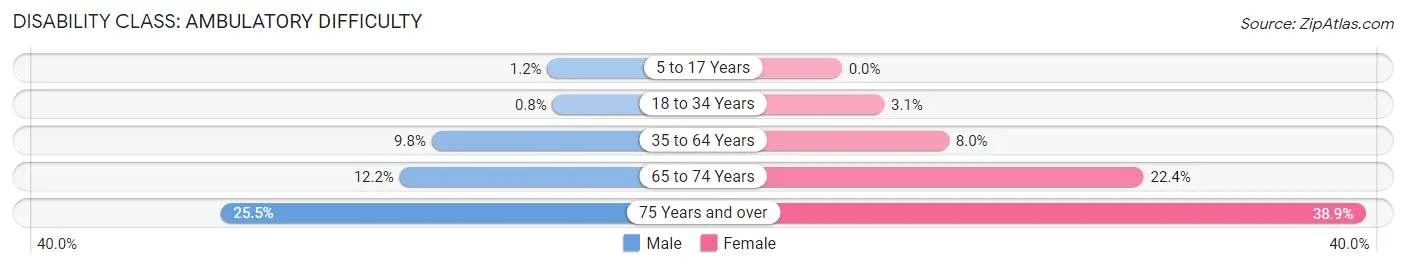
| Age Bracket | Male | Female |
| 5 to 17 Years | 14 (1.2%) | 0 (0.0%) |
| 18 to 34 Years | 11 (0.8%) | 45 (3.1%) |
| 35 to 64 Years | 283 (9.8%) | 270 (8.0%) |
| 65 to 74 Years | 158 (12.1%) | 316 (22.4%) |
| 75 Years and over | 192 (25.5%) | 444 (38.9%) |
Disability Class: Self-Care Difficulty
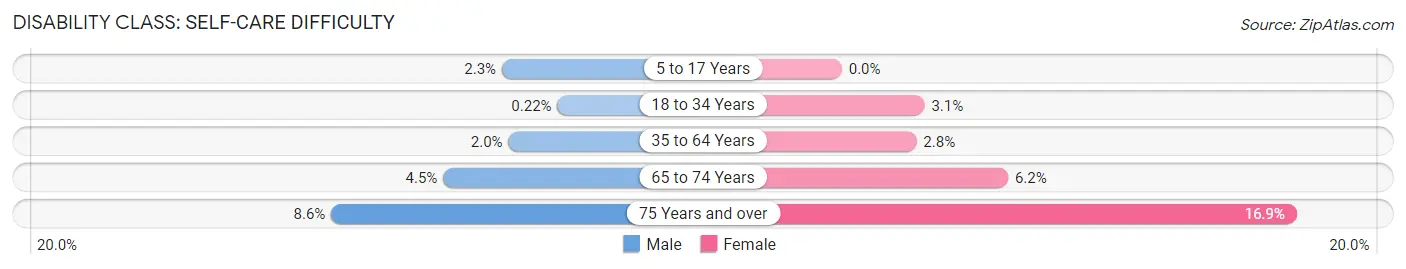
| Age Bracket | Male | Female |
| 5 to 17 Years | 27 (2.3%) | 0 (0.0%) |
| 18 to 34 Years | 3 (0.2%) | 44 (3.1%) |
| 35 to 64 Years | 59 (2.0%) | 94 (2.8%) |
| 65 to 74 Years | 58 (4.5%) | 87 (6.2%) |
| 75 Years and over | 65 (8.6%) | 193 (16.9%) |
Technology Access in Northampton County
Computing Device Access in Northampton County
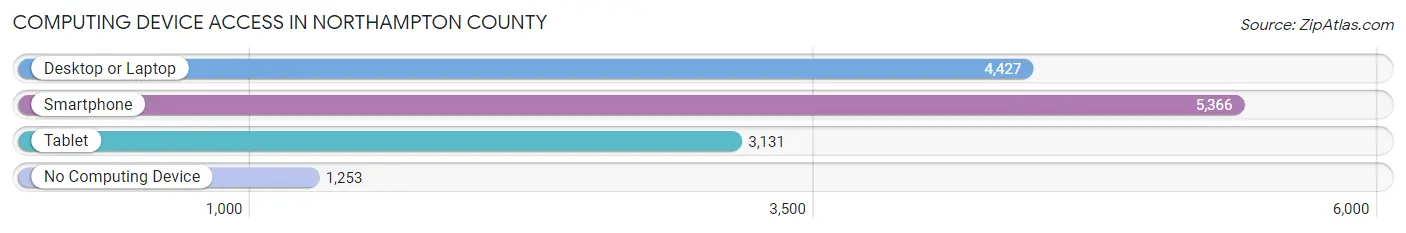
| Device Type | # Households | % Households |
| Desktop or Laptop | 4,427 | 59.3% |
| Smartphone | 5,366 | 71.9% |
| Tablet | 3,131 | 41.9% |
| No Computing Device | 1,253 | 16.8% |
| Total | 7,463 | 100.0% |
Internet Access in Northampton County
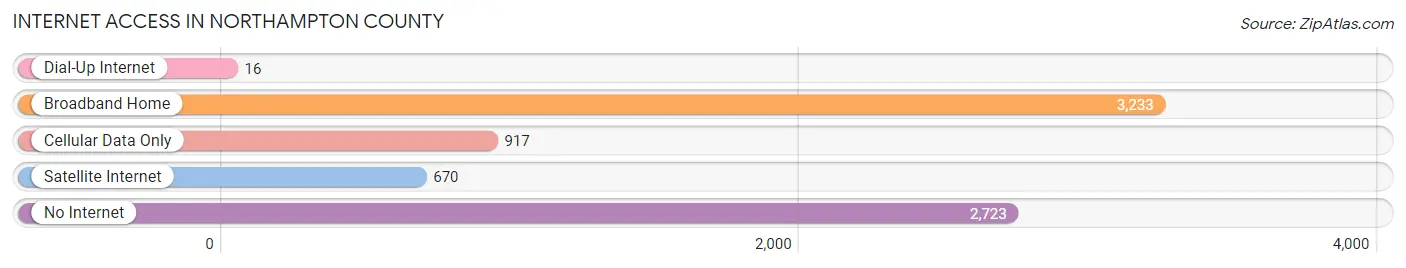
| Internet Type | # Households | % Households |
| Dial-Up Internet | 16 | 0.2% |
| Broadband Home | 3,233 | 43.3% |
| Cellular Data Only | 917 | 12.3% |
| Satellite Internet | 670 | 9.0% |
| No Internet | 2,723 | 36.5% |
| Total | 7,463 | 100.0% |
Northampton County Summary
Northampton County is located in the northeastern part of North Carolina, and is part of the Roanoke-Chowan region. It is bordered by Halifax County to the north, Hertford County to the east, Bertie County to the south, and Martin County to the west. The county seat is Jackson, and the county is home to a population of 22,099 people, as of the 2010 census.
Geography
Northampton County is located in the Coastal Plain region of North Carolina, and is characterized by flat terrain and sandy soils. The county is drained by the Roanoke River, which forms its northern border, and the Meherrin River, which forms its eastern border. The county is home to several large lakes, including Lake Gaston, Lake Phelps, and Lake Mattamuskeet. The county is also home to several state parks, including Lake Gaston State Park, Pettigrew State Park, and Mattamuskeet National Wildlife Refuge.
History
Northampton County was formed in 1741 from Bertie County. It was named for James Compton, 5th Earl of Northampton. The county was originally home to several Native American tribes, including the Tuscarora, Meherrin, and Chowanoke. During the American Revolution, the county was the site of several battles, including the Battle of Great Bridge and the Battle of Camden.
In the 19th century, the county was home to several large plantations, and the economy was largely based on agriculture. The county was also home to several prominent figures, including Confederate General Robert F. Hoke and U.S. Senator Furnifold Simmons.
Economy
Northampton County’s economy is largely based on agriculture, forestry, and manufacturing. The county is home to several large farms, and the main crops grown in the county are corn, soybeans, cotton, and tobacco. The county is also home to several large timber companies, and the main products produced in the county are lumber, pulpwood, and paper products. The county is also home to several manufacturing companies, including a furniture manufacturer, a textile manufacturer, and a plastics manufacturer.
Demographics
As of the 2010 census, Northampton County had a population of 22,099 people. The racial makeup of the county was 57.3% White, 37.2% African American, 0.5% Native American, 0.4% Asian, 0.1% Pacific Islander, 3.2% from other races, and 1.3% from two or more races. Hispanic or Latino of any race were 5.2% of the population.
The median income for a household in the county was $30,945, and the median income for a family was $37,945. The per capita income for the county was $16,845. About 19.2% of the population was below the poverty line.
Common Questions
What is Per Capita Income in Northampton County?
Per Capita income in Northampton County is $29,047.
What is the Median Family Income in Northampton County?
Median Family Income in Northampton County is $59,301.
What is the Median Household income in Northampton County?
Median Household Income in Northampton County is $45,698.
What is Income or Wage Gap in Northampton County?
Income or Wage Gap in Northampton County is 22.0%.
Women in Northampton County earn 78.0 cents for every dollar earned by a man.
What is Family Income Deficit in Northampton County?
Family Income Deficit in Northampton County is $10,979.
Families that are below poverty line in Northampton County earn $10,979 less on average than the poverty threshold level.
What is Inequality or Gini Index in Northampton County?
Inequality or Gini Index in Northampton County is 0.49.
What is the Total Population of Northampton County?
Total Population of Northampton County is 17,528.
What is the Total Male Population of Northampton County?
Total Male Population of Northampton County is 8,481.
What is the Total Female Population of Northampton County?
Total Female Population of Northampton County is 9,047.
What is the Ratio of Males per 100 Females in Northampton County?
There are 93.74 Males per 100 Females in Northampton County.
What is the Ratio of Females per 100 Males in Northampton County?
There are 106.67 Females per 100 Males in Northampton County.
What is the Median Population Age in Northampton County?
Median Population Age in Northampton County is 51.3 Years.
What is the Average Family Size in Northampton County
Average Family Size in Northampton County is 2.9 People.
What is the Average Household Size in Northampton County
Average Household Size in Northampton County is 2.2 People.
How Large is the Labor Force in Northampton County?
There are 7,418 People in the Labor Forcein in Northampton County.
What is the Percentage of People in the Labor Force in Northampton County?
50.1% of People are in the Labor Force in Northampton County.
What is the Unemployment Rate in Northampton County?
Unemployment Rate in Northampton County is 7.6%.