Mitchell County, NC Map & Demographics
Mitchell County Map
Mitchell County Overview
$31,696
PER CAPITA INCOME
$71,820
AVG FAMILY INCOME
$55,534
AVG HOUSEHOLD INCOME
20.9%
WAGE / INCOME GAP [ % ]
79.1¢/ $1
WAGE / INCOME GAP [ $ ]
$8,754
FAMILY INCOME DEFICIT
0.47
INEQUALITY / GINI INDEX
14,989
TOTAL POPULATION
7,418
MALE POPULATION
7,571
FEMALE POPULATION
97.98
MALES / 100 FEMALES
102.06
FEMALES / 100 MALES
47.4
MEDIAN AGE
2.8
AVG FAMILY SIZE
2.2
AVG HOUSEHOLD SIZE
6,987
LABOR FORCE [ PEOPLE ]
55.2%
PERCENT IN LABOR FORCE
6.3%
UNEMPLOYMENT RATE
Mitchell County Area Codes
Income in Mitchell County
Income Overview in Mitchell County
Per Capita Income in Mitchell County is $31,696, while median incomes of families and households are $71,820 and $55,534 respectively.
| Characteristic | Number | Measure |
| Per Capita Income | 14,989 | $31,696 |
| Median Family Income | 4,117 | $71,820 |
| Mean Family Income | 4,117 | $90,823 |
| Median Household Income | 6,479 | $55,534 |
| Mean Household Income | 6,479 | $72,863 |
| Income Deficit | 4,117 | $8,754 |
| Wage / Income Gap (%) | 14,989 | 20.93% |
| Wage / Income Gap ($) | 14,989 | 79.07¢ per $1 |
| Gini / Inequality Index | 14,989 | 0.47 |
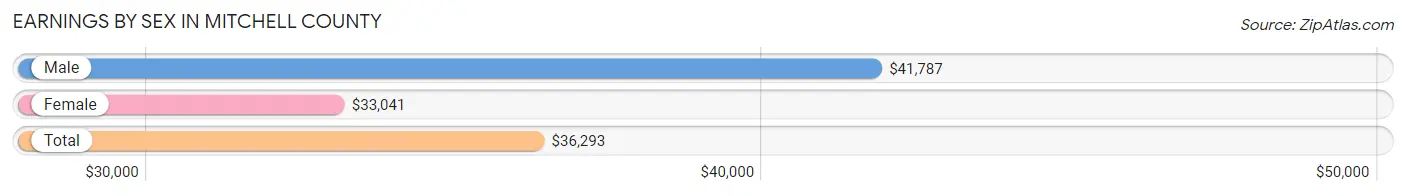
Earnings by Sex in Mitchell County
Average Earnings in Mitchell County are $36,293, $41,787 for men and $33,041 for women, a difference of 20.9%.
| Sex | Number | Average Earnings |
| Male | 3,859 (52.5%) | $41,787 |
| Female | 3,490 (47.5%) | $33,041 |
| Total | 7,349 (100.0%) | $36,293 |
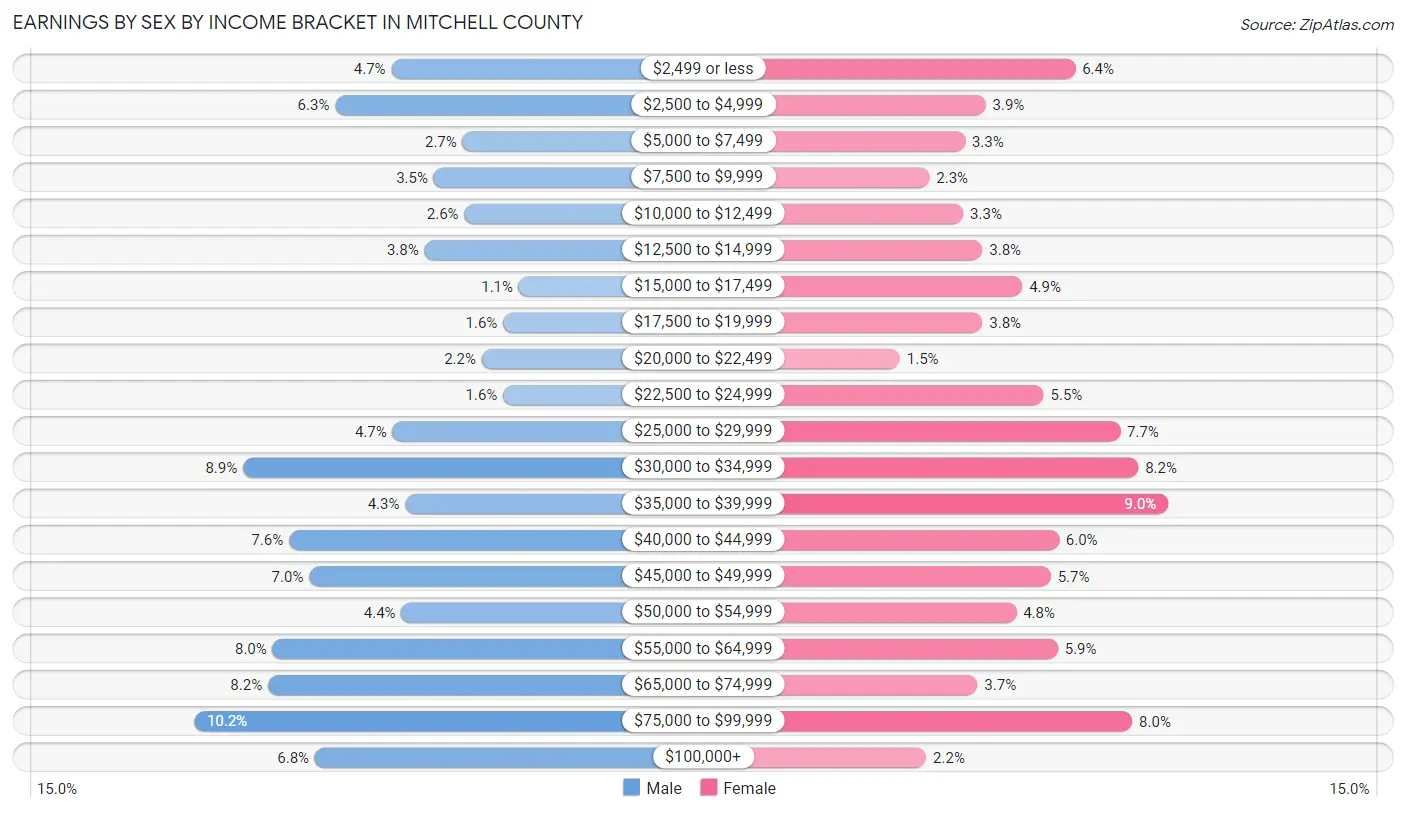
Earnings by Sex by Income Bracket in Mitchell County
The most common earnings brackets in Mitchell County are $75,000 to $99,999 for men (395 | 10.2%) and $35,000 to $39,999 for women (315 | 9.0%).
| Income | Male | Female |
| $2,499 or less | 181 (4.7%) | 224 (6.4%) |
| $2,500 to $4,999 | 242 (6.3%) | 136 (3.9%) |
| $5,000 to $7,499 | 104 (2.7%) | 116 (3.3%) |
| $7,500 to $9,999 | 135 (3.5%) | 81 (2.3%) |
| $10,000 to $12,499 | 102 (2.6%) | 114 (3.3%) |
| $12,500 to $14,999 | 145 (3.8%) | 133 (3.8%) |
| $15,000 to $17,499 | 43 (1.1%) | 172 (4.9%) |
| $17,500 to $19,999 | 60 (1.5%) | 133 (3.8%) |
| $20,000 to $22,499 | 83 (2.1%) | 52 (1.5%) |
| $22,500 to $24,999 | 60 (1.5%) | 193 (5.5%) |
| $25,000 to $29,999 | 180 (4.7%) | 268 (7.7%) |
| $30,000 to $34,999 | 342 (8.9%) | 286 (8.2%) |
| $35,000 to $39,999 | 166 (4.3%) | 315 (9.0%) |
| $40,000 to $44,999 | 292 (7.6%) | 208 (6.0%) |
| $45,000 to $49,999 | 270 (7.0%) | 200 (5.7%) |
| $50,000 to $54,999 | 170 (4.4%) | 166 (4.8%) |
| $55,000 to $64,999 | 310 (8.0%) | 207 (5.9%) |
| $65,000 to $74,999 | 315 (8.2%) | 128 (3.7%) |
| $75,000 to $99,999 | 395 (10.2%) | 280 (8.0%) |
| $100,000+ | 264 (6.8%) | 78 (2.2%) |
| Total | 3,859 (100.0%) | 3,490 (100.0%) |
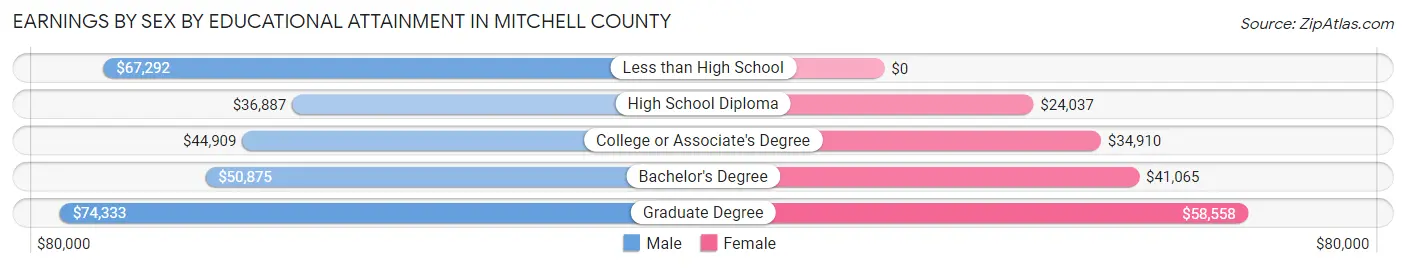
Earnings by Sex by Educational Attainment in Mitchell County
Average earnings in Mitchell County are $46,180 for men and $35,611 for women, a difference of 22.9%. Men with an educational attainment of graduate degree enjoy the highest average annual earnings of $74,333, while those with high school diploma education earn the least with $36,887. Women with an educational attainment of graduate degree earn the most with the average annual earnings of $58,558, while those with high school diploma education have the smallest earnings of $24,037.
| Educational Attainment | Male Income | Female Income |
| Less than High School | $67,292 | $0 |
| High School Diploma | $36,887 | $24,037 |
| College or Associate's Degree | $44,909 | $34,910 |
| Bachelor's Degree | $50,875 | $41,065 |
| Graduate Degree | $74,333 | $58,558 |
| Total | $46,180 | $35,611 |
Family Income in Mitchell County
Family Income Brackets in Mitchell County
According to the Mitchell County family income data, there are 914 families falling into the $50,000 to $74,999 income range, which is the most common income bracket and makes up 22.2% of all families. Conversely, the $10,000 to $14,999 income bracket is the least frequent group with only 70 families (1.7%) belonging to this category.
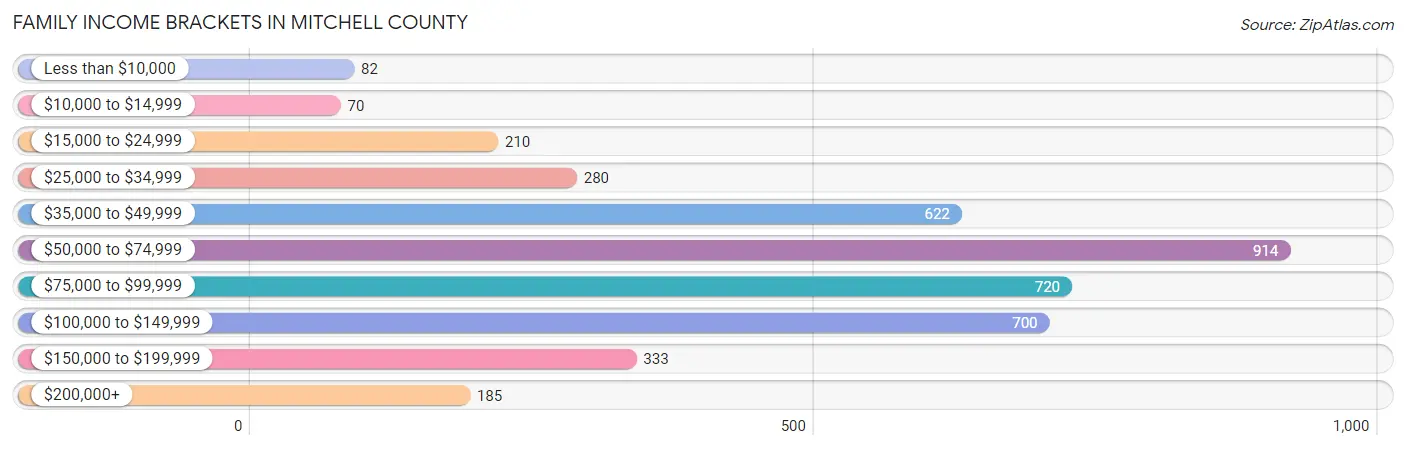
| Income Bracket | # Families | % Families |
| Less than $10,000 | 82 | 2.0% |
| $10,000 to $14,999 | 70 | 1.7% |
| $15,000 to $24,999 | 210 | 5.1% |
| $25,000 to $34,999 | 280 | 6.8% |
| $35,000 to $49,999 | 622 | 15.1% |
| $50,000 to $74,999 | 914 | 22.2% |
| $75,000 to $99,999 | 720 | 17.5% |
| $100,000 to $149,999 | 700 | 17.0% |
| $150,000 to $199,999 | 333 | 8.1% |
| $200,000+ | 185 | 4.5% |
Family Income by Famaliy Size in Mitchell County
6-person families (79 | 1.9%) account for the highest median family income in Mitchell County with $99,539 per family, while 2-person families (2,439 | 59.2%) have the highest median income of $34,682 per family member.
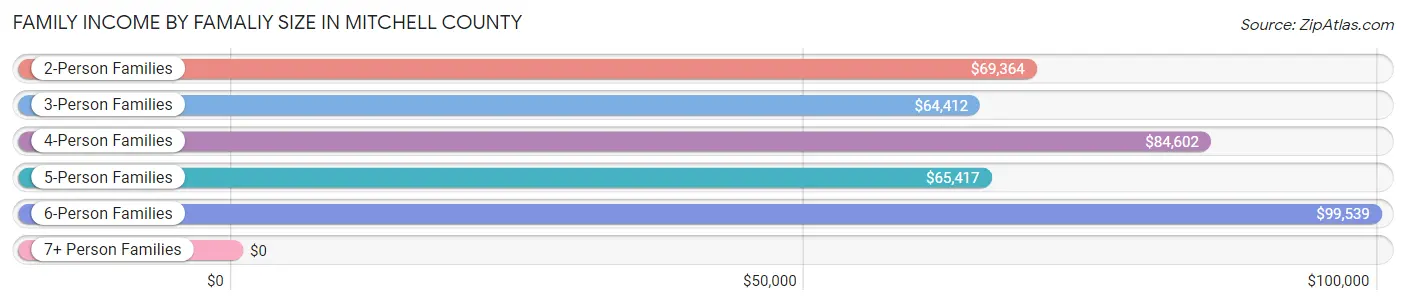
| Income Bracket | # Families | Median Income |
| 2-Person Families | 2,439 (59.2%) | $69,364 |
| 3-Person Families | 914 (22.2%) | $64,412 |
| 4-Person Families | 521 (12.7%) | $84,602 |
| 5-Person Families | 144 (3.5%) | $65,417 |
| 6-Person Families | 79 (1.9%) | $99,539 |
| 7+ Person Families | 20 (0.5%) | $0 |
| Total | 4,117 (100.0%) | $71,820 |
Family Income by Number of Earners in Mitchell County
The median family income in Mitchell County is $71,820, with families comprising 3+ earners (188) having the highest median family income of $107,727, while families with no earners (903) have the lowest median family income of $41,829, accounting for 4.6% and 21.9% of families, respectively.
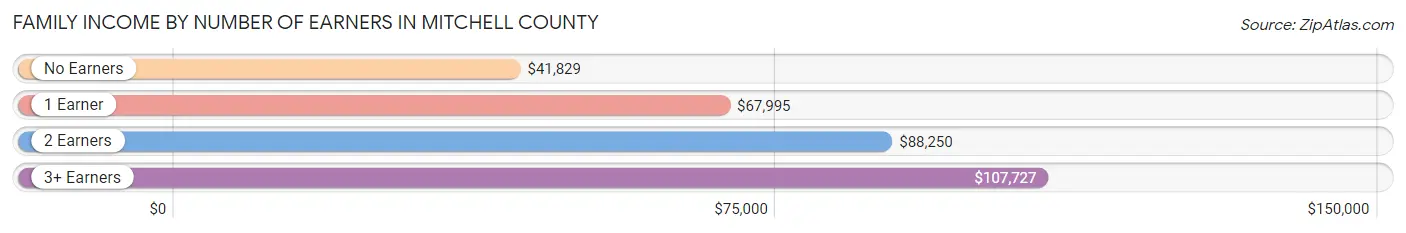
| Number of Earners | # Families | Median Income |
| No Earners | 903 (21.9%) | $41,829 |
| 1 Earner | 1,111 (27.0%) | $67,995 |
| 2 Earners | 1,915 (46.5%) | $88,250 |
| 3+ Earners | 188 (4.6%) | $107,727 |
| Total | 4,117 (100.0%) | $71,820 |
Household Income in Mitchell County
Household Income Brackets in Mitchell County
With 1,173 households falling in the category, the $50,000 to $74,999 income range is the most frequent in Mitchell County, accounting for 18.1% of all households. In contrast, only 201 households (3.1%) fall into the $200,000+ income bracket, making it the least populous group.
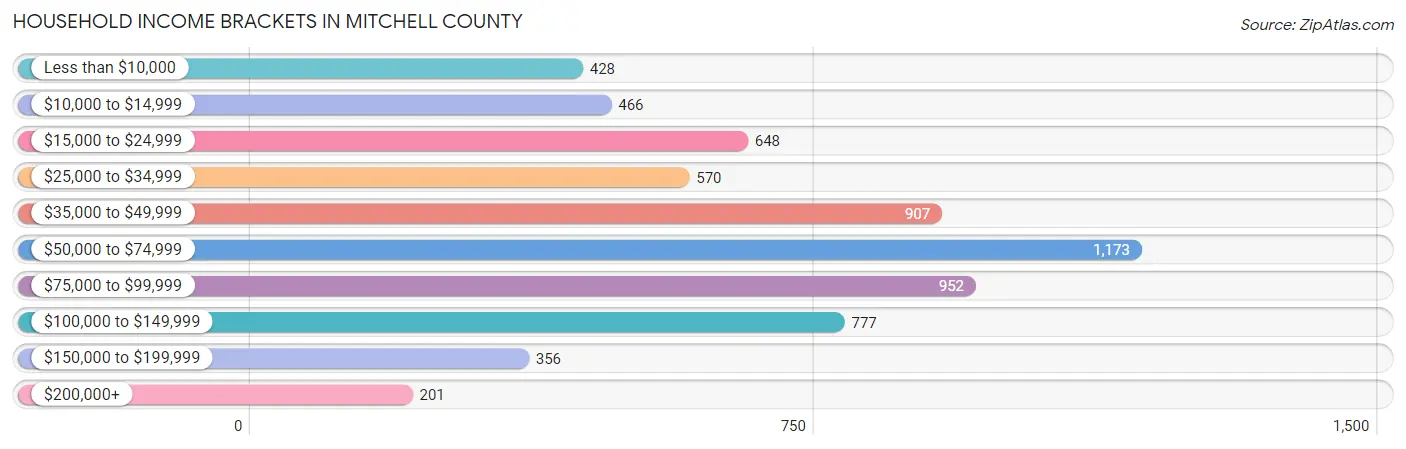
| Income Bracket | # Households | % Households |
| Less than $10,000 | 428 | 6.6% |
| $10,000 to $14,999 | 466 | 7.2% |
| $15,000 to $24,999 | 648 | 10.0% |
| $25,000 to $34,999 | 570 | 8.8% |
| $35,000 to $49,999 | 907 | 14.0% |
| $50,000 to $74,999 | 1,173 | 18.1% |
| $75,000 to $99,999 | 952 | 14.7% |
| $100,000 to $149,999 | 777 | 12.0% |
| $150,000 to $199,999 | 356 | 5.5% |
| $200,000+ | 201 | 3.1% |
Household Income by Householder Age in Mitchell County
The median household income in Mitchell County is $55,534, with the highest median household income of $69,511 found in the 45 to 64 years age bracket for the primary householder. A total of 2,253 households (34.8%) fall into this category. Meanwhile, the 65+ years age bracket for the primary householder has the lowest median household income of $35,374, with 2,594 households (40.0%) in this group.
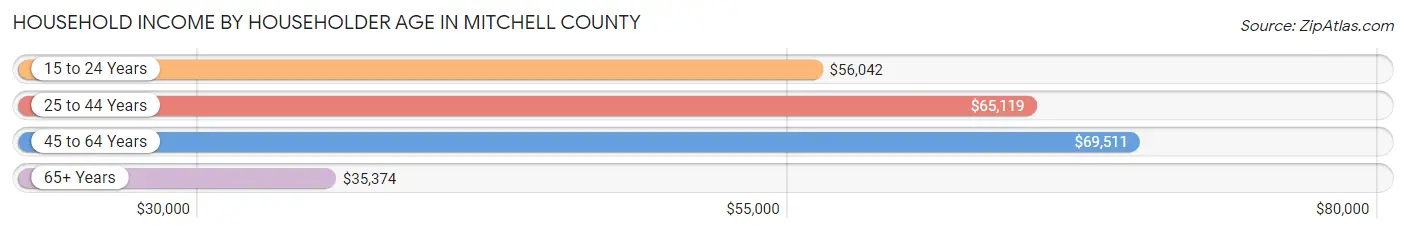
| Income Bracket | # Households | Median Income |
| 15 to 24 Years | 150 (2.3%) | $56,042 |
| 25 to 44 Years | 1,482 (22.9%) | $65,119 |
| 45 to 64 Years | 2,253 (34.8%) | $69,511 |
| 65+ Years | 2,594 (40.0%) | $35,374 |
| Total | 6,479 (100.0%) | $55,534 |
Poverty in Mitchell County
Income Below Poverty by Sex and Age in Mitchell County
With 13.9% poverty level for males and 12.9% for females among the residents of Mitchell County, 5 year old males and 6 to 11 year old females are the most vulnerable to poverty, with 16 males (23.5%) and 102 females (26.0%) in their respective age groups living below the poverty level.
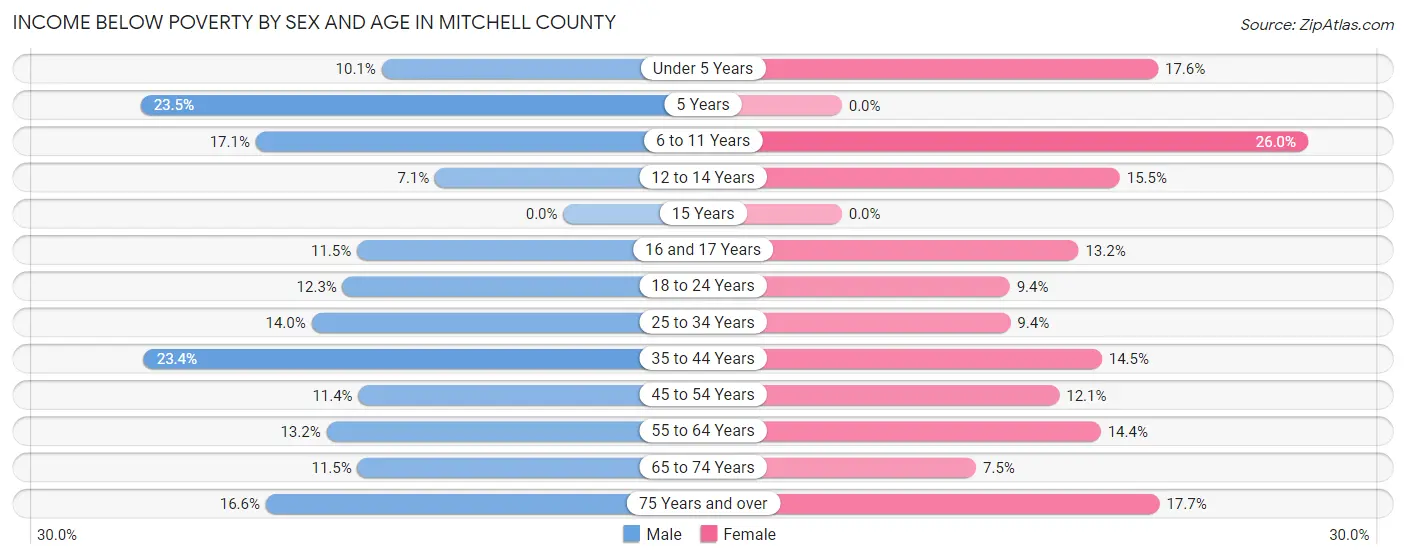
| Age Bracket | Male | Female |
| Under 5 Years | 35 (10.1%) | 59 (17.6%) |
| 5 Years | 16 (23.5%) | 0 (0.0%) |
| 6 to 11 Years | 68 (17.1%) | 102 (26.0%) |
| 12 to 14 Years | 22 (7.1%) | 26 (15.5%) |
| 15 Years | 0 (0.0%) | 0 (0.0%) |
| 16 and 17 Years | 30 (11.5%) | 17 (13.2%) |
| 18 to 24 Years | 65 (12.3%) | 30 (9.3%) |
| 25 to 34 Years | 127 (14.0%) | 79 (9.4%) |
| 35 to 44 Years | 174 (23.4%) | 106 (14.5%) |
| 45 to 54 Years | 107 (11.4%) | 118 (12.1%) |
| 55 to 64 Years | 145 (13.2%) | 167 (14.4%) |
| 65 to 74 Years | 116 (11.5%) | 83 (7.5%) |
| 75 Years and over | 109 (16.6%) | 158 (17.7%) |
| Total | 1,014 (13.9%) | 945 (12.9%) |
Income Above Poverty by Sex and Age in Mitchell County
According to the poverty statistics in Mitchell County, males aged 15 years and females aged 5 years are the age groups that are most secure financially, with 100.0% of males and 100.0% of females in these age groups living above the poverty line.
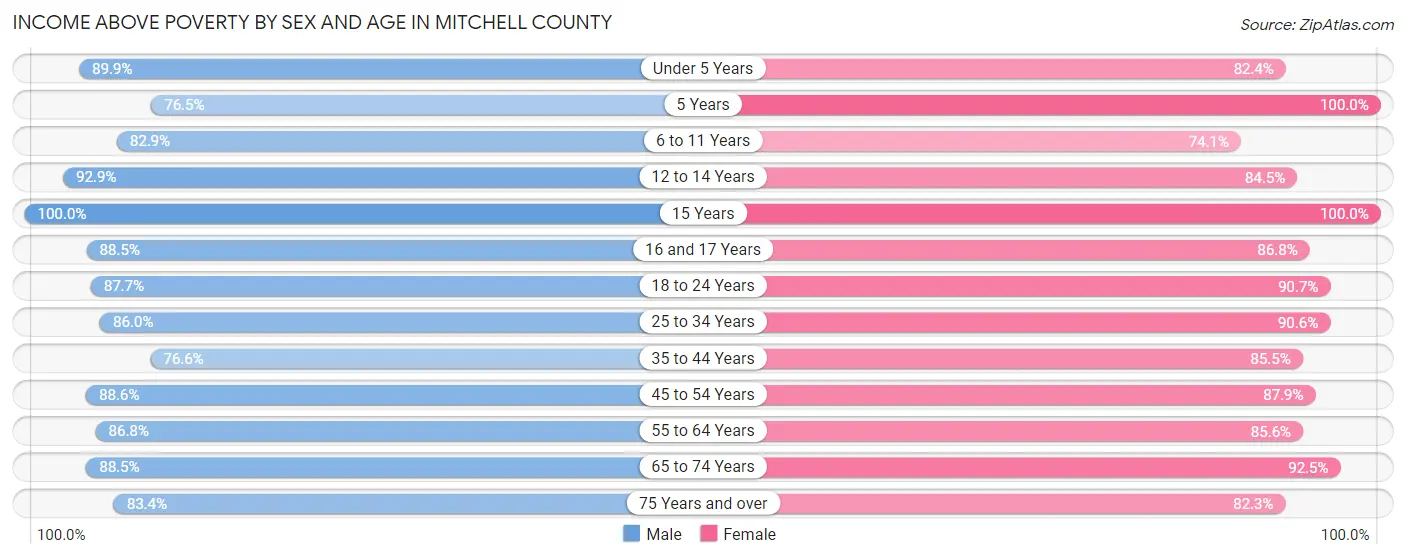
| Age Bracket | Male | Female |
| Under 5 Years | 311 (89.9%) | 276 (82.4%) |
| 5 Years | 52 (76.5%) | 158 (100.0%) |
| 6 to 11 Years | 329 (82.9%) | 291 (74.1%) |
| 12 to 14 Years | 286 (92.9%) | 142 (84.5%) |
| 15 Years | 47 (100.0%) | 96 (100.0%) |
| 16 and 17 Years | 231 (88.5%) | 112 (86.8%) |
| 18 to 24 Years | 464 (87.7%) | 291 (90.6%) |
| 25 to 34 Years | 779 (86.0%) | 762 (90.6%) |
| 35 to 44 Years | 571 (76.6%) | 626 (85.5%) |
| 45 to 54 Years | 831 (88.6%) | 856 (87.9%) |
| 55 to 64 Years | 954 (86.8%) | 991 (85.6%) |
| 65 to 74 Years | 896 (88.5%) | 1,026 (92.5%) |
| 75 Years and over | 549 (83.4%) | 735 (82.3%) |
| Total | 6,300 (86.1%) | 6,362 (87.1%) |
Income Below Poverty Among Married-Couple Families in Mitchell County
The poverty statistics for married-couple families in Mitchell County show that 6.4% or 213 of the total 3,342 families live below the poverty line. Families with 3 or 4 children have the highest poverty rate of 18.6%, comprising of 29 families. On the other hand, families with 5 or more children have the lowest poverty rate of 0.0%, which includes 0 families.
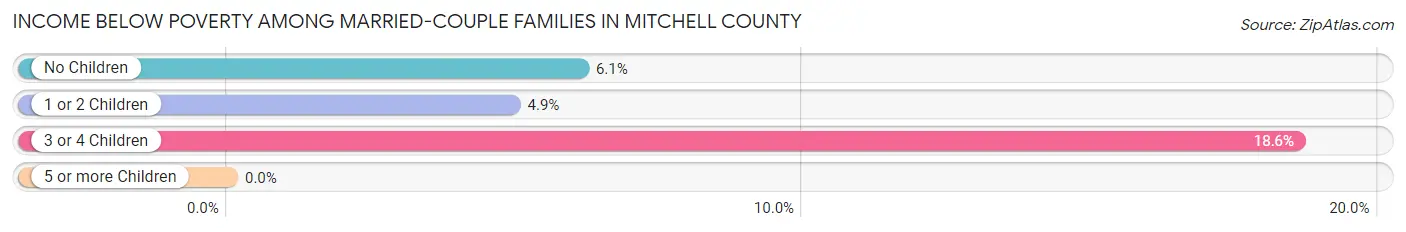
| Children | Above Poverty | Below Poverty |
| No Children | 2,182 (93.9%) | 142 (6.1%) |
| 1 or 2 Children | 811 (95.1%) | 42 (4.9%) |
| 3 or 4 Children | 127 (81.4%) | 29 (18.6%) |
| 5 or more Children | 9 (100.0%) | 0 (0.0%) |
| Total | 3,129 (93.6%) | 213 (6.4%) |
Income Below Poverty Among Single-Parent Households in Mitchell County
According to the poverty data in Mitchell County, 24.3% or 36 single-father households and 13.6% or 85 single-mother households are living below the poverty line. Among single-father households, those with 3 or 4 children have the highest poverty rate, with 22 households (100.0%) experiencing poverty. Likewise, among single-mother households, those with 3 or 4 children have the highest poverty rate, with 33 households (48.5%) falling below the poverty line.
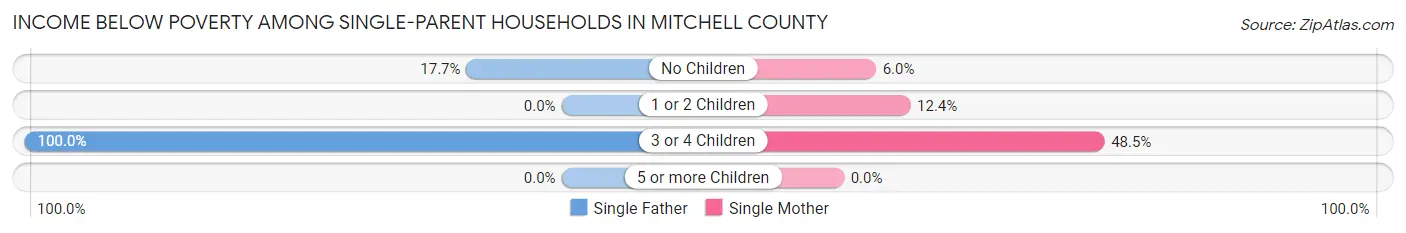
| Children | Single Father | Single Mother |
| No Children | 14 (17.7%) | 16 (6.0%) |
| 1 or 2 Children | 0 (0.0%) | 36 (12.4%) |
| 3 or 4 Children | 22 (100.0%) | 33 (48.5%) |
| 5 or more Children | 0 (0.0%) | 0 (0.0%) |
| Total | 36 (24.3%) | 85 (13.6%) |
Income Below Poverty Among Married-Couple vs Single-Parent Households in Mitchell County
The poverty data for Mitchell County shows that 213 of the married-couple family households (6.4%) and 121 of the single-parent households (15.6%) are living below the poverty level. Within the married-couple family households, those with 3 or 4 children have the highest poverty rate, with 29 households (18.6%) falling below the poverty line. Among the single-parent households, those with 3 or 4 children have the highest poverty rate, with 55 household (61.1%) living below poverty.
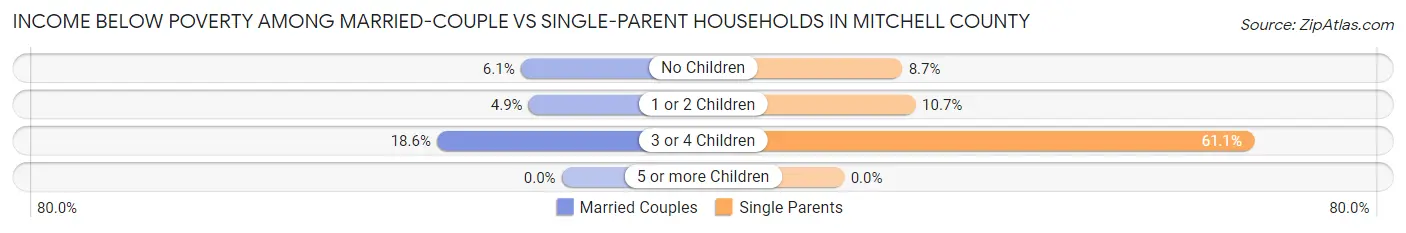
| Children | Married-Couple Families | Single-Parent Households |
| No Children | 142 (6.1%) | 30 (8.6%) |
| 1 or 2 Children | 42 (4.9%) | 36 (10.6%) |
| 3 or 4 Children | 29 (18.6%) | 55 (61.1%) |
| 5 or more Children | 0 (0.0%) | 0 (0.0%) |
| Total | 213 (6.4%) | 121 (15.6%) |
Race in Mitchell County
The most populous races in Mitchell County are White / Caucasian (13,980 | 93.3%), Hispanic or Latino (901 | 6.0%), and Two or more Races (538 | 3.6%).
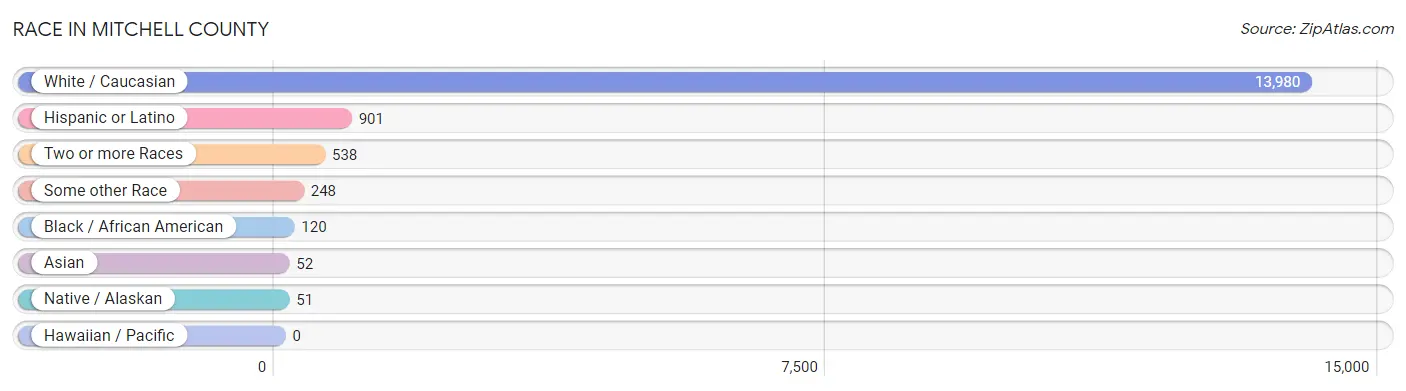
| Race | # Population | % Population |
| Asian | 52 | 0.4% |
| Black / African American | 120 | 0.8% |
| Hawaiian / Pacific | 0 | 0.0% |
| Hispanic or Latino | 901 | 6.0% |
| Native / Alaskan | 51 | 0.3% |
| White / Caucasian | 13,980 | 93.3% |
| Two or more Races | 538 | 3.6% |
| Some other Race | 248 | 1.7% |
| Total | 14,989 | 100.0% |
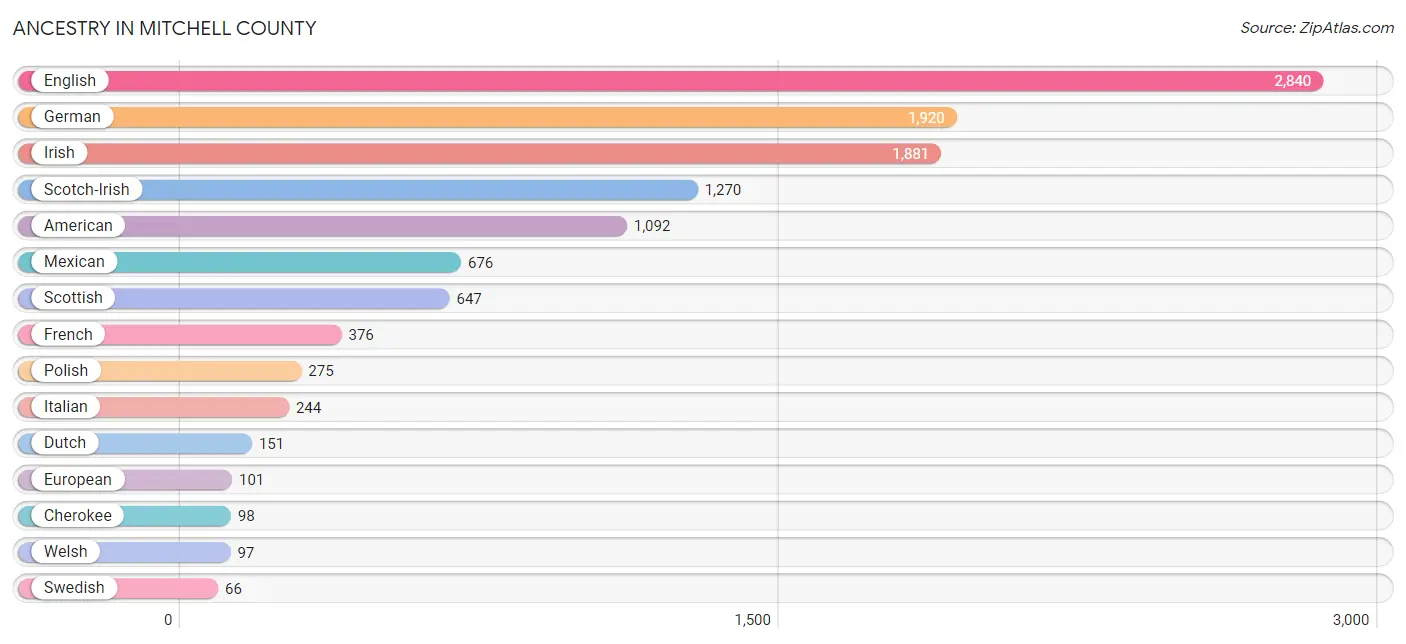
Ancestry in Mitchell County
The most populous ancestries reported in Mitchell County are English (2,840 | 19.0%), German (1,920 | 12.8%), Irish (1,881 | 12.6%), Scotch-Irish (1,270 | 8.5%), and American (1,092 | 7.3%), together accounting for 60.1% of all Mitchell County residents.
| Ancestry | # Population | % Population |
| African | 2 | 0.0% |
| Albanian | 7 | 0.1% |
| Aleut | 5 | 0.0% |
| American | 1,092 | 7.3% |
| Apache | 46 | 0.3% |
| Arab | 31 | 0.2% |
| Australian | 8 | 0.1% |
| Belgian | 7 | 0.1% |
| Bhutanese | 40 | 0.3% |
| Blackfeet | 9 | 0.1% |
| British | 35 | 0.2% |
| Canadian | 3 | 0.0% |
| Central American | 36 | 0.2% |
| Cherokee | 98 | 0.6% |
| Colombian | 31 | 0.2% |
| Creek | 5 | 0.0% |
| Cuban | 42 | 0.3% |
| Danish | 27 | 0.2% |
| Dominican | 43 | 0.3% |
| Dutch | 151 | 1.0% |
| Eastern European | 8 | 0.1% |
| English | 2,840 | 19.0% |
| European | 101 | 0.7% |
| Filipino | 1 | 0.0% |
| French | 376 | 2.5% |
| French Canadian | 50 | 0.3% |
| German | 1,920 | 12.8% |
| Hungarian | 28 | 0.2% |
| Indian (Asian) | 11 | 0.1% |
| Irish | 1,881 | 12.6% |
| Italian | 244 | 1.6% |
| Korean | 60 | 0.4% |
| Lebanese | 8 | 0.1% |
| Lumbee | 9 | 0.1% |
| Mexican | 676 | 4.5% |
| Moroccan | 23 | 0.2% |
| Nigerian | 6 | 0.0% |
| Northern European | 6 | 0.0% |
| Norwegian | 21 | 0.1% |
| Panamanian | 36 | 0.2% |
| Polish | 275 | 1.8% |
| Portuguese | 17 | 0.1% |
| Pueblo | 46 | 0.3% |
| Russian | 3 | 0.0% |
| Scotch-Irish | 1,270 | 8.5% |
| Scottish | 647 | 4.3% |
| Slovak | 22 | 0.2% |
| South American | 31 | 0.2% |
| Spaniard | 53 | 0.4% |
| Spanish | 20 | 0.1% |
| Sri Lankan | 4 | 0.0% |
| Subsaharan African | 8 | 0.1% |
| Swedish | 66 | 0.4% |
| Swiss | 43 | 0.3% |
| Thai | 4 | 0.0% |
| Welsh | 97 | 0.6% |
| Yugoslavian | 7 | 0.1% | View All 57 Rows |
Immigrants in Mitchell County
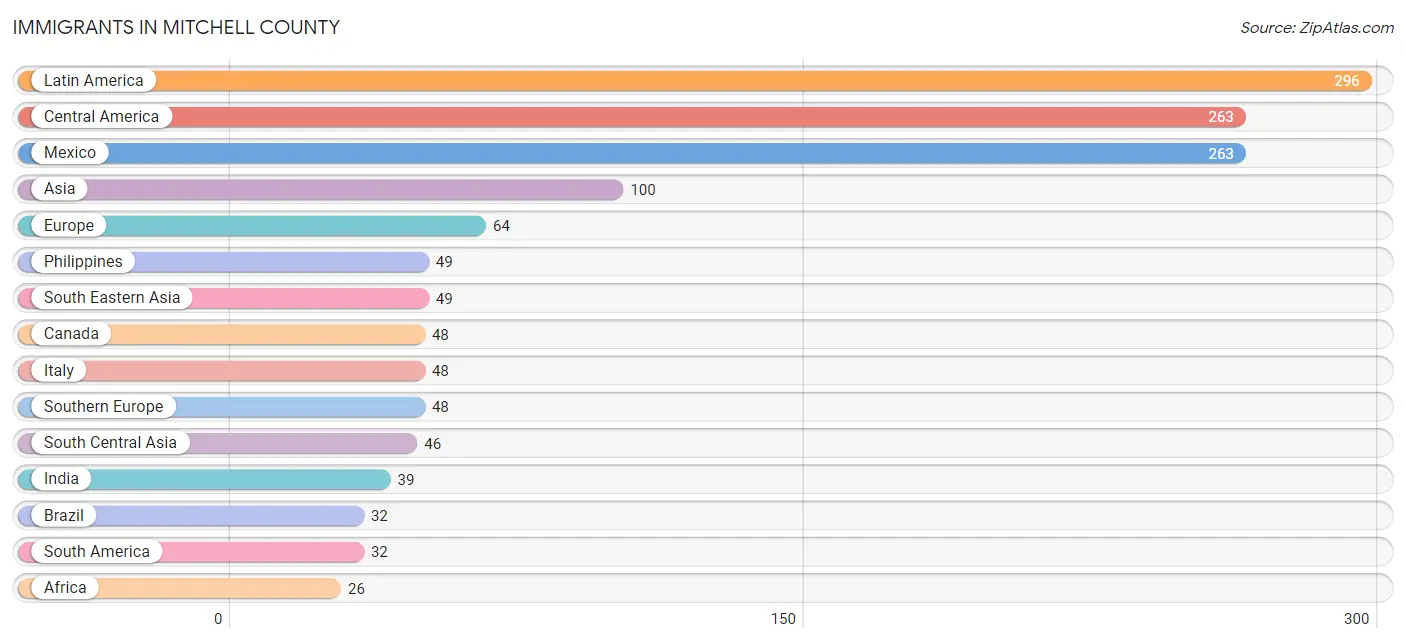
The most numerous immigrant groups reported in Mitchell County came from Latin America (296 | 2.0%), Central America (263 | 1.8%), Mexico (263 | 1.8%), Asia (100 | 0.7%), and Europe (64 | 0.4%), together accounting for 6.6% of all Mitchell County residents.
| Immigration Origin | # Population | % Population |
| Africa | 26 | 0.2% |
| Asia | 100 | 0.7% |
| Belgium | 7 | 0.1% |
| Brazil | 32 | 0.2% |
| Canada | 48 | 0.3% |
| Caribbean | 1 | 0.0% |
| Central America | 263 | 1.8% |
| China | 5 | 0.0% |
| Cuba | 1 | 0.0% |
| Eastern Asia | 5 | 0.0% |
| Europe | 64 | 0.4% |
| Fiji | 7 | 0.1% |
| Germany | 7 | 0.1% |
| India | 39 | 0.3% |
| Ireland | 2 | 0.0% |
| Italy | 48 | 0.3% |
| Kazakhstan | 7 | 0.1% |
| Latin America | 296 | 2.0% |
| Mexico | 263 | 1.8% |
| Morocco | 20 | 0.1% |
| Northern Africa | 20 | 0.1% |
| Northern Europe | 2 | 0.0% |
| Oceania | 7 | 0.1% |
| Philippines | 49 | 0.3% |
| South Africa | 6 | 0.0% |
| South America | 32 | 0.2% |
| South Central Asia | 46 | 0.3% |
| South Eastern Asia | 49 | 0.3% |
| Southern Europe | 48 | 0.3% |
| Taiwan | 5 | 0.0% |
| Western Europe | 14 | 0.1% | View All 31 Rows |
Sex and Age in Mitchell County
Sex and Age in Mitchell County
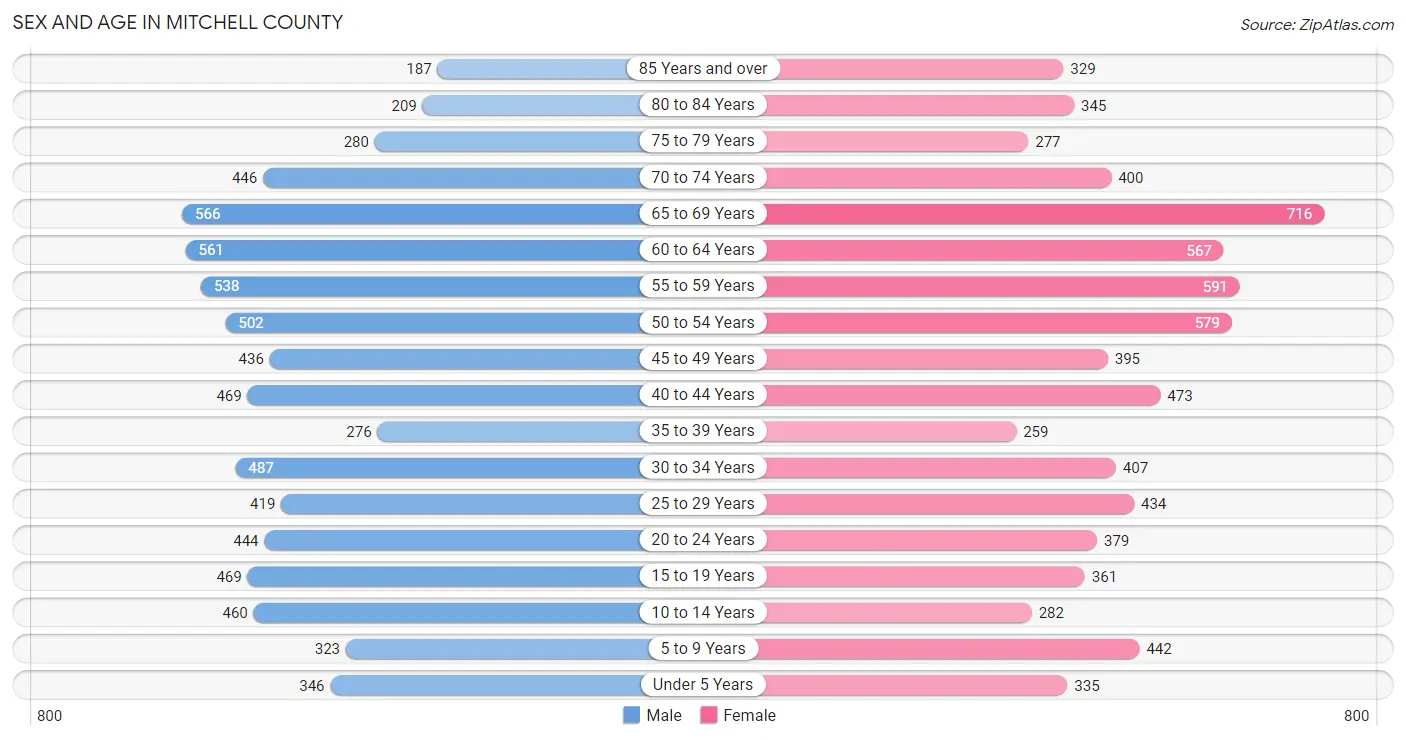
The most populous age groups in Mitchell County are 65 to 69 Years (566 | 7.6%) for men and 65 to 69 Years (716 | 9.5%) for women.
| Age Bracket | Male | Female |
| Under 5 Years | 346 (4.7%) | 335 (4.4%) |
| 5 to 9 Years | 323 (4.3%) | 442 (5.8%) |
| 10 to 14 Years | 460 (6.2%) | 282 (3.7%) |
| 15 to 19 Years | 469 (6.3%) | 361 (4.8%) |
| 20 to 24 Years | 444 (6.0%) | 379 (5.0%) |
| 25 to 29 Years | 419 (5.7%) | 434 (5.7%) |
| 30 to 34 Years | 487 (6.6%) | 407 (5.4%) |
| 35 to 39 Years | 276 (3.7%) | 259 (3.4%) |
| 40 to 44 Years | 469 (6.3%) | 473 (6.2%) |
| 45 to 49 Years | 436 (5.9%) | 395 (5.2%) |
| 50 to 54 Years | 502 (6.8%) | 579 (7.6%) |
| 55 to 59 Years | 538 (7.2%) | 591 (7.8%) |
| 60 to 64 Years | 561 (7.6%) | 567 (7.5%) |
| 65 to 69 Years | 566 (7.6%) | 716 (9.5%) |
| 70 to 74 Years | 446 (6.0%) | 400 (5.3%) |
| 75 to 79 Years | 280 (3.8%) | 277 (3.7%) |
| 80 to 84 Years | 209 (2.8%) | 345 (4.6%) |
| 85 Years and over | 187 (2.5%) | 329 (4.3%) |
| Total | 7,418 (100.0%) | 7,571 (100.0%) |
Families and Households in Mitchell County
Median Family Size in Mitchell County
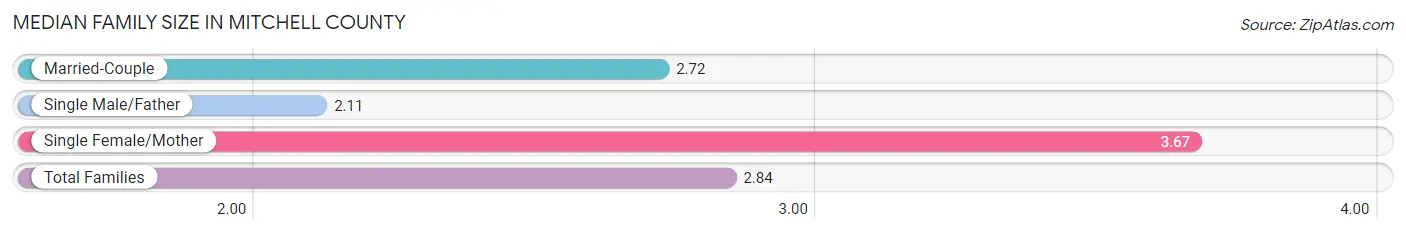
The median family size in Mitchell County is 2.84 persons per family, with single female/mother families (627 | 15.2%) accounting for the largest median family size of 3.67 persons per family. On the other hand, single male/father families (148 | 3.6%) represent the smallest median family size with 2.11 persons per family.
| Family Type | # Families | Family Size |
| Married-Couple | 3,342 (81.2%) | 2.72 |
| Single Male/Father | 148 (3.6%) | 2.11 |
| Single Female/Mother | 627 (15.2%) | 3.67 |
| Total Families | 4,117 (100.0%) | 2.84 |
Median Household Size in Mitchell County
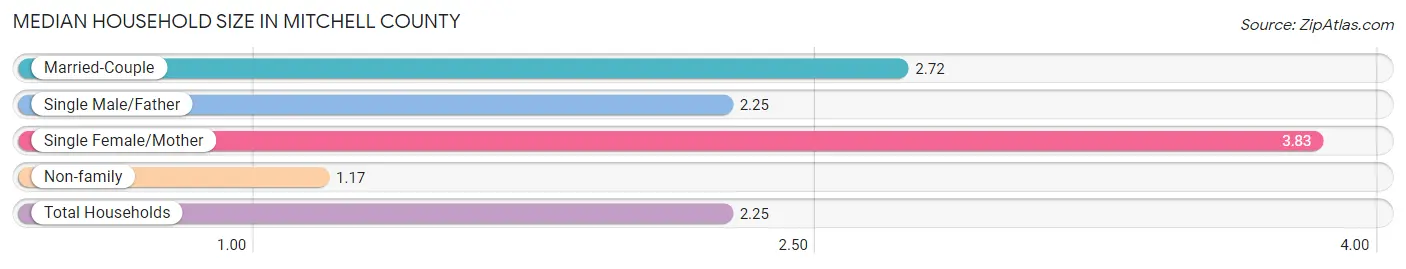
The median household size in Mitchell County is 2.25 persons per household, with single female/mother households (627 | 9.7%) accounting for the largest median household size of 3.83 persons per household. non-family households (2,362 | 36.5%) represent the smallest median household size with 1.17 persons per household.
| Household Type | # Households | Household Size |
| Married-Couple | 3,342 (51.6%) | 2.72 |
| Single Male/Father | 148 (2.3%) | 2.25 |
| Single Female/Mother | 627 (9.7%) | 3.83 |
| Non-family | 2,362 (36.5%) | 1.17 |
| Total Households | 6,479 (100.0%) | 2.25 |
Household Size by Marriage Status in Mitchell County
Out of a total of 6,479 households in Mitchell County, 4,117 (63.5%) are family households, while 2,362 (36.5%) are nonfamily households. The most numerous type of family households are 2-person households, comprising 2,408, and the most common type of nonfamily households are 1-person households, comprising 2,079.
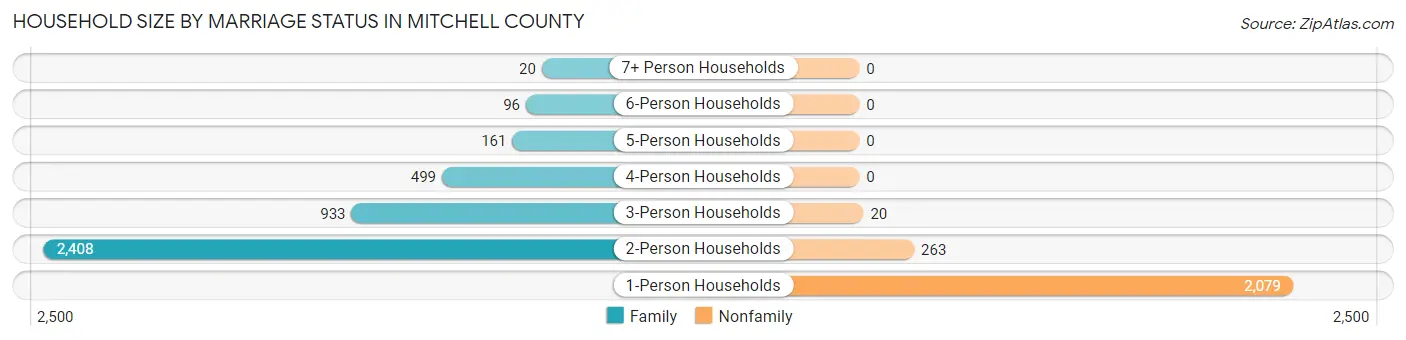
| Household Size | Family Households | Nonfamily Households |
| 1-Person Households | - | 2,079 (32.1%) |
| 2-Person Households | 2,408 (37.2%) | 263 (4.1%) |
| 3-Person Households | 933 (14.4%) | 20 (0.3%) |
| 4-Person Households | 499 (7.7%) | 0 (0.0%) |
| 5-Person Households | 161 (2.5%) | 0 (0.0%) |
| 6-Person Households | 96 (1.5%) | 0 (0.0%) |
| 7+ Person Households | 20 (0.3%) | 0 (0.0%) |
| Total | 4,117 (63.5%) | 2,362 (36.5%) |
Female Fertility in Mitchell County
Fertility by Age in Mitchell County
Average fertility rate in Mitchell County is 47.0 births per 1,000 women. Women in the age bracket of 20 to 34 years have the highest fertility rate with 85.0 births per 1,000 women. Women in the age bracket of 20 to 34 years acount for 78.2% of all women with births.
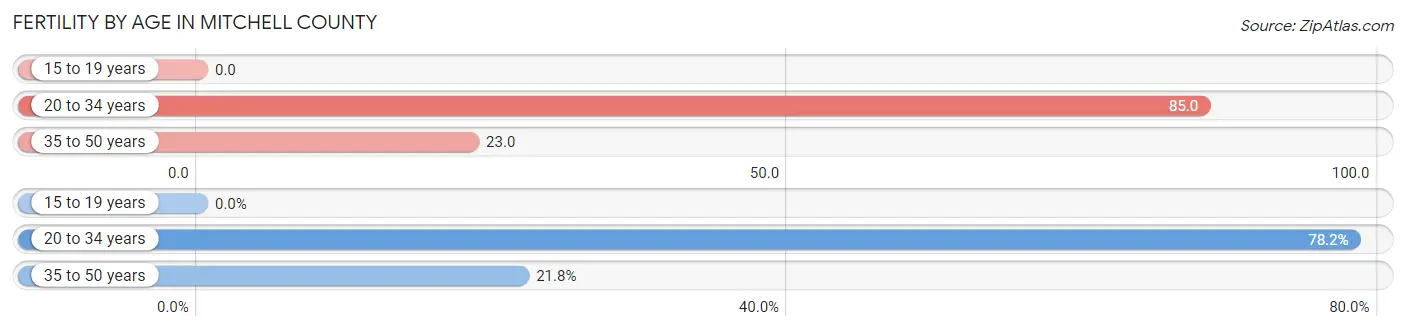
| Age Bracket | Women with Births | Births / 1,000 Women |
| 15 to 19 years | 0 (0.0%) | 0.0 |
| 20 to 34 years | 104 (78.2%) | 85.0 |
| 35 to 50 years | 29 (21.8%) | 23.0 |
| Total | 133 (100.0%) | 47.0 |
Fertility by Age by Marriage Status in Mitchell County
92.5% of women with births (133) in Mitchell County are married. The highest percentage of unmarried women with births falls into 20 to 34 years age bracket with 9.6% of them unmarried at the time of birth, while the lowest percentage of unmarried women with births belong to 35 to 50 years age bracket with 0.0% of them unmarried.
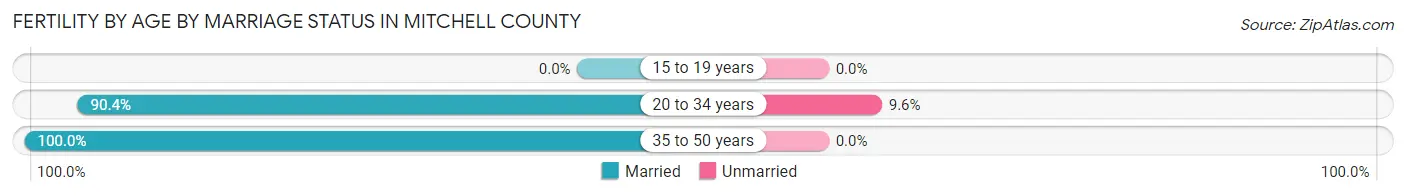
| Age Bracket | Married | Unmarried |
| 15 to 19 years | 0 (0.0%) | 0 (0.0%) |
| 20 to 34 years | 94 (90.4%) | 10 (9.6%) |
| 35 to 50 years | 29 (100.0%) | 0 (0.0%) |
| Total | 123 (92.5%) | 10 (7.5%) |
Fertility by Education in Mitchell County
Average fertility rate in Mitchell County is 47.0 births per 1,000 women. Women with the education attainment of bachelor's degree have the highest fertility rate of 90.0 births per 1,000 women, while women with the education attainment of graduate degree have the lowest fertility at 7.0 births per 1,000 women. Women with the education attainment of bachelor's degree represent 38.4% of all women with births.
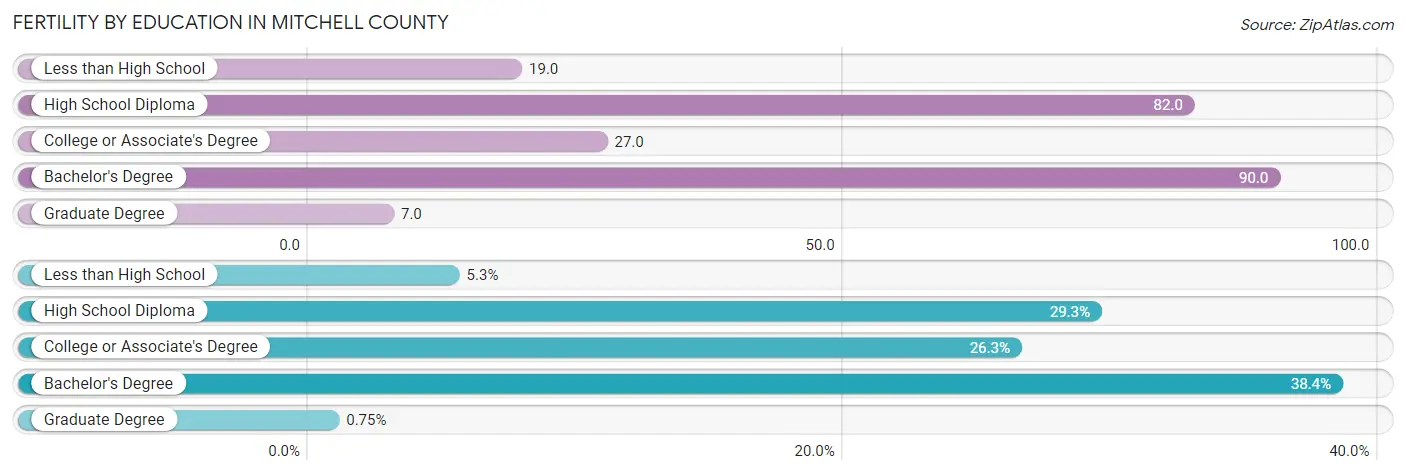
| Educational Attainment | Women with Births | Births / 1,000 Women |
| Less than High School | 7 (5.3%) | 19.0 |
| High School Diploma | 39 (29.3%) | 82.0 |
| College or Associate's Degree | 35 (26.3%) | 27.0 |
| Bachelor's Degree | 51 (38.4%) | 90.0 |
| Graduate Degree | 1 (0.7%) | 7.0 |
| Total | 133 (100.0%) | 47.0 |
Fertility by Education by Marriage Status in Mitchell County
7.5% of women with births in Mitchell County are unmarried. Women with the educational attainment of high school diploma are most likely to be married with 100.0% of them married at childbirth, while women with the educational attainment of less than high school are least likely to be married with 57.1% of them unmarried at childbirth.
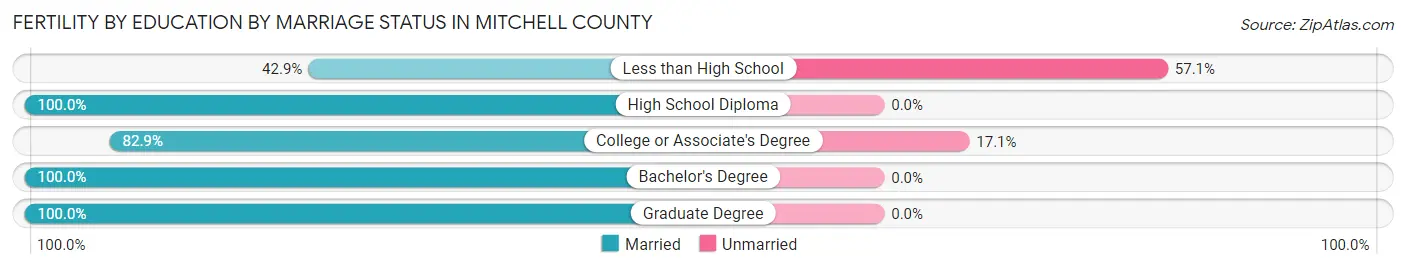
| Educational Attainment | Married | Unmarried |
| Less than High School | 3 (42.9%) | 4 (57.1%) |
| High School Diploma | 39 (100.0%) | 0 (0.0%) |
| College or Associate's Degree | 29 (82.9%) | 6 (17.1%) |
| Bachelor's Degree | 51 (100.0%) | 0 (0.0%) |
| Graduate Degree | 1 (100.0%) | 0 (0.0%) |
| Total | 123 (92.5%) | 10 (7.5%) |
Employment Characteristics in Mitchell County
Employment by Class of Employer in Mitchell County
Among the 6,316 employed individuals in Mitchell County, private company employees (4,105 | 65.0%), state government employees (568 | 9.0%), and local government employees (565 | 8.9%) make up the most common classes of employment.
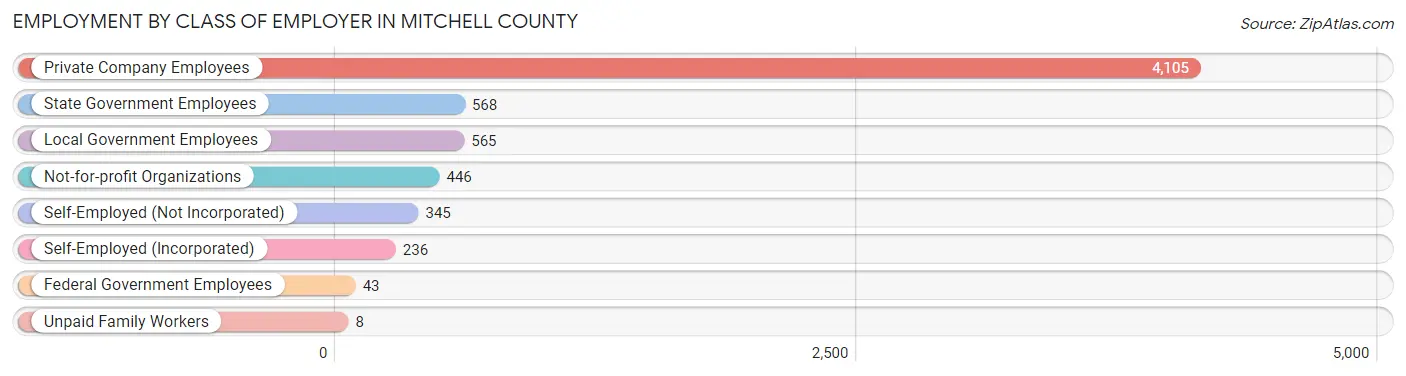
| Employer Class | # Employees | % Employees |
| Private Company Employees | 4,105 | 65.0% |
| Self-Employed (Incorporated) | 236 | 3.7% |
| Self-Employed (Not Incorporated) | 345 | 5.5% |
| Not-for-profit Organizations | 446 | 7.1% |
| Local Government Employees | 565 | 8.9% |
| State Government Employees | 568 | 9.0% |
| Federal Government Employees | 43 | 0.7% |
| Unpaid Family Workers | 8 | 0.1% |
| Total | 6,316 | 100.0% |
Employment Status by Age in Mitchell County
According to the labor force statistics for Mitchell County, out of the total population over 16 years of age (12,658), 55.2% or 6,987 individuals are in the labor force, with 6.3% or 440 of them unemployed. The age group with the highest labor force participation rate is 25 to 29 years, with 90.5% or 772 individuals in the labor force. Within the labor force, the 75 years and over age range has the highest percentage of unemployed individuals, with 36.1% or 13 of them being unemployed.
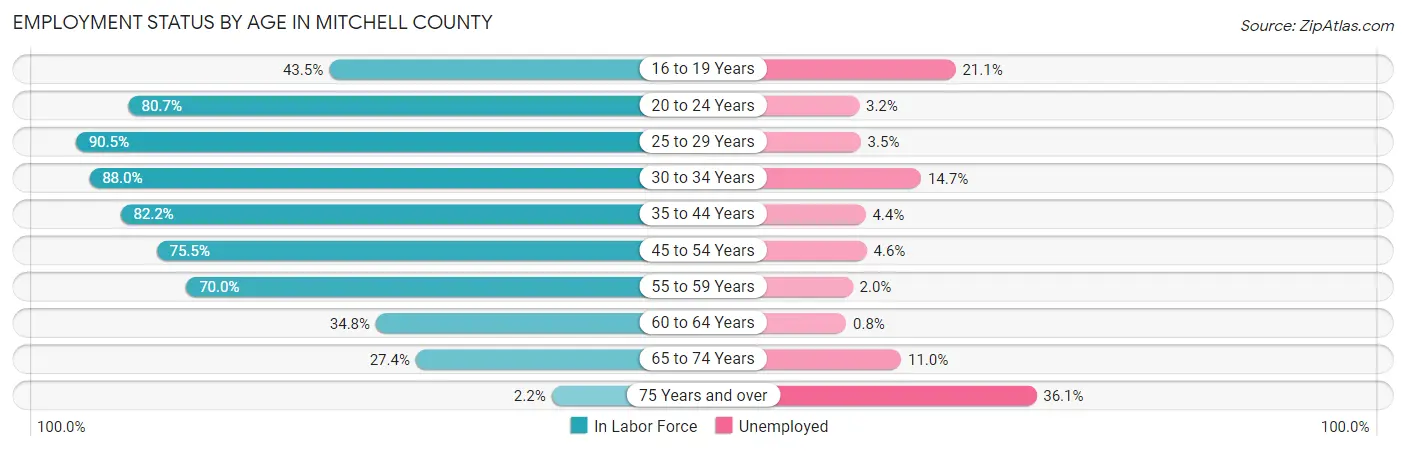
| Age Bracket | In Labor Force | Unemployed |
| 16 to 19 Years | 299 (43.5%) | 63 (21.1%) |
| 20 to 24 Years | 664 (80.7%) | 21 (3.2%) |
| 25 to 29 Years | 772 (90.5%) | 27 (3.5%) |
| 30 to 34 Years | 787 (88.0%) | 116 (14.7%) |
| 35 to 44 Years | 1,214 (82.2%) | 53 (4.4%) |
| 45 to 54 Years | 1,444 (75.5%) | 66 (4.6%) |
| 55 to 59 Years | 790 (70.0%) | 16 (2.0%) |
| 60 to 64 Years | 393 (34.8%) | 3 (0.8%) |
| 65 to 74 Years | 583 (27.4%) | 64 (11.0%) |
| 75 Years and over | 36 (2.2%) | 13 (36.1%) |
| Total | 6,987 (55.2%) | 440 (6.3%) |
Employment Status by Educational Attainment in Mitchell County
According to labor force statistics for Mitchell County, 73.0% of individuals (5,397) out of the total population between 25 and 64 years of age (7,393) are in the labor force, with 5.2% or 281 of them being unemployed. The group with the highest labor force participation rate are those with the educational attainment of bachelor's degree or higher, with 82.8% or 1,560 individuals in the labor force. Within the labor force, individuals with high school diploma education have the highest percentage of unemployment, with 7.5% or 94 of them being unemployed.
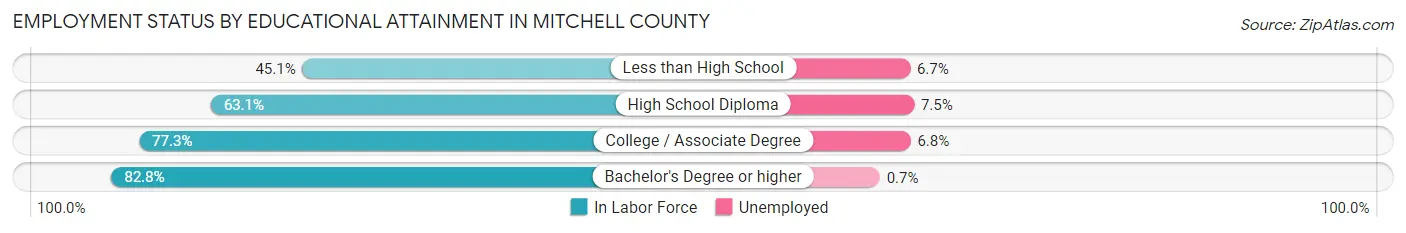
| Educational Attainment | In Labor Force | Unemployed |
| Less than High School | 193 (45.1%) | 29 (6.7%) |
| High School Diploma | 1,259 (63.1%) | 150 (7.5%) |
| College / Associate Degree | 2,385 (77.3%) | 210 (6.8%) |
| Bachelor's Degree or higher | 1,560 (82.8%) | 13 (0.7%) |
| Total | 5,397 (73.0%) | 384 (5.2%) |
Employment Occupations by Sex in Mitchell County
Management, Business, Science and Arts Occupations
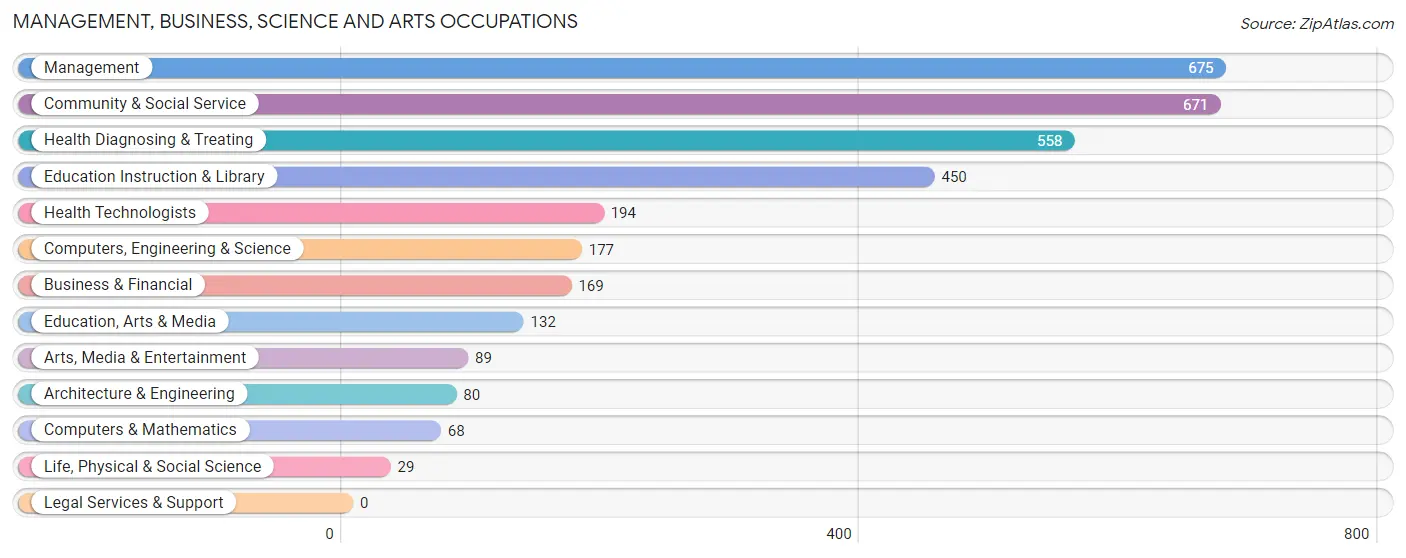
The most common Management, Business, Science and Arts occupations in Mitchell County are Management (675 | 10.3%), Community & Social Service (671 | 10.3%), Health Diagnosing & Treating (558 | 8.5%), Education Instruction & Library (450 | 6.9%), and Health Technologists (194 | 3.0%).
Management, Business, Science and Arts Occupations by Sex
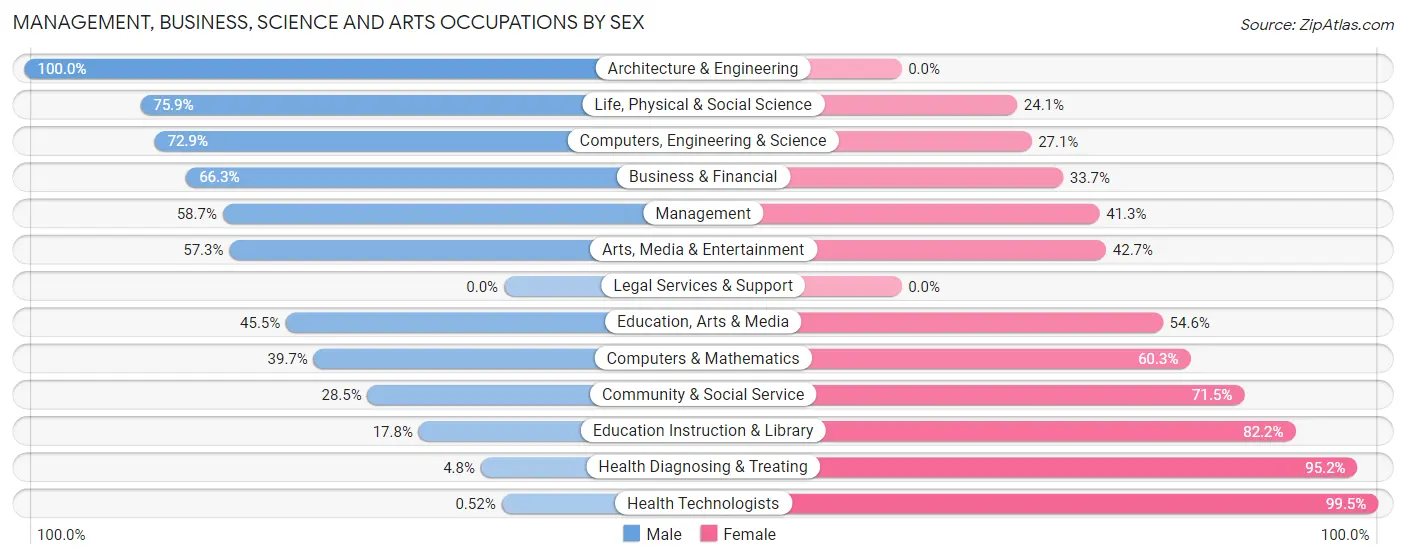
Within the Management, Business, Science and Arts occupations in Mitchell County, the most male-oriented occupations are Architecture & Engineering (100.0%), Life, Physical & Social Science (75.9%), and Computers, Engineering & Science (72.9%), while the most female-oriented occupations are Health Technologists (99.5%), Health Diagnosing & Treating (95.2%), and Education Instruction & Library (82.2%).
| Occupation | Male | Female |
| Management | 396 (58.7%) | 279 (41.3%) |
| Business & Financial | 112 (66.3%) | 57 (33.7%) |
| Computers, Engineering & Science | 129 (72.9%) | 48 (27.1%) |
| Computers & Mathematics | 27 (39.7%) | 41 (60.3%) |
| Architecture & Engineering | 80 (100.0%) | 0 (0.0%) |
| Life, Physical & Social Science | 22 (75.9%) | 7 (24.1%) |
| Community & Social Service | 191 (28.5%) | 480 (71.5%) |
| Education, Arts & Media | 60 (45.5%) | 72 (54.5%) |
| Legal Services & Support | 0 (0.0%) | 0 (0.0%) |
| Education Instruction & Library | 80 (17.8%) | 370 (82.2%) |
| Arts, Media & Entertainment | 51 (57.3%) | 38 (42.7%) |
| Health Diagnosing & Treating | 27 (4.8%) | 531 (95.2%) |
| Health Technologists | 1 (0.5%) | 193 (99.5%) |
| Total (Category) | 855 (38.0%) | 1,395 (62.0%) |
| Total (Overall) | 3,444 (52.7%) | 3,094 (47.3%) |
Services Occupations
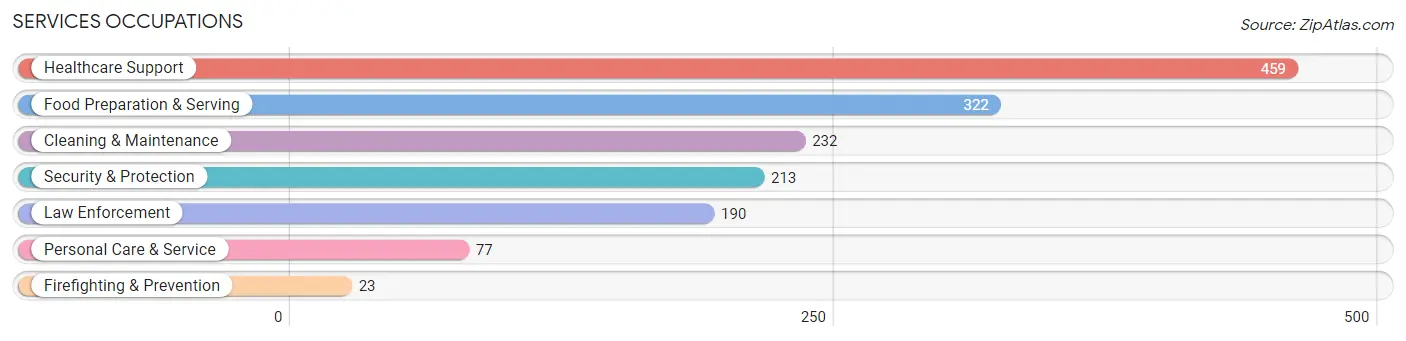
The most common Services occupations in Mitchell County are Healthcare Support (459 | 7.0%), Food Preparation & Serving (322 | 4.9%), Cleaning & Maintenance (232 | 3.5%), Security & Protection (213 | 3.3%), and Law Enforcement (190 | 2.9%).
Services Occupations by Sex
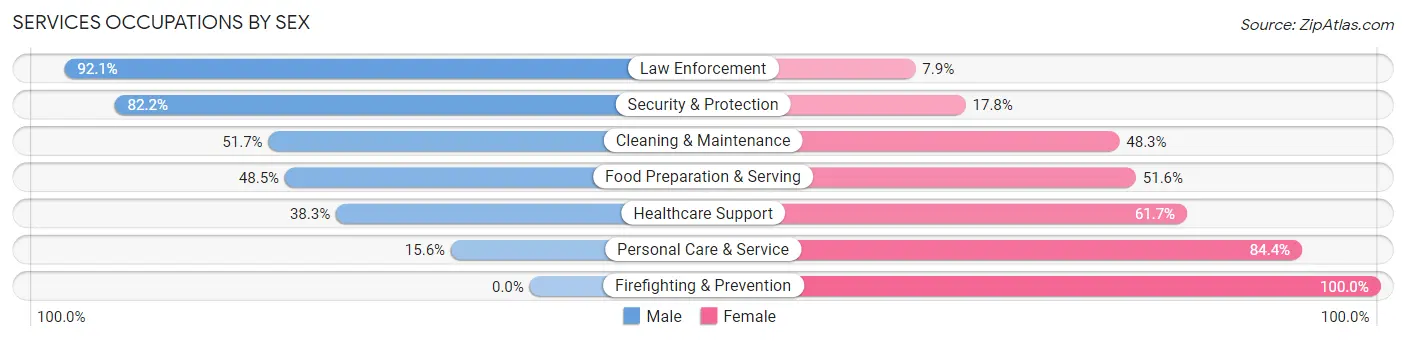
Within the Services occupations in Mitchell County, the most male-oriented occupations are Law Enforcement (92.1%), Security & Protection (82.2%), and Cleaning & Maintenance (51.7%), while the most female-oriented occupations are Firefighting & Prevention (100.0%), Personal Care & Service (84.4%), and Healthcare Support (61.7%).
| Occupation | Male | Female |
| Healthcare Support | 176 (38.3%) | 283 (61.7%) |
| Security & Protection | 175 (82.2%) | 38 (17.8%) |
| Firefighting & Prevention | 0 (0.0%) | 23 (100.0%) |
| Law Enforcement | 175 (92.1%) | 15 (7.9%) |
| Food Preparation & Serving | 156 (48.4%) | 166 (51.5%) |
| Cleaning & Maintenance | 120 (51.7%) | 112 (48.3%) |
| Personal Care & Service | 12 (15.6%) | 65 (84.4%) |
| Total (Category) | 639 (49.0%) | 664 (51.0%) |
| Total (Overall) | 3,444 (52.7%) | 3,094 (47.3%) |
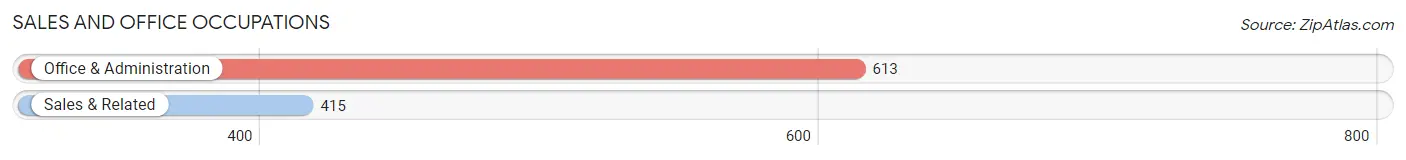
Sales and Office Occupations
The most common Sales and Office occupations in Mitchell County are Office & Administration (613 | 9.4%), and Sales & Related (415 | 6.4%).
Sales and Office Occupations by Sex

| Occupation | Male | Female |
| Sales & Related | 177 (42.6%) | 238 (57.4%) |
| Office & Administration | 97 (15.8%) | 516 (84.2%) |
| Total (Category) | 274 (26.7%) | 754 (73.4%) |
| Total (Overall) | 3,444 (52.7%) | 3,094 (47.3%) |
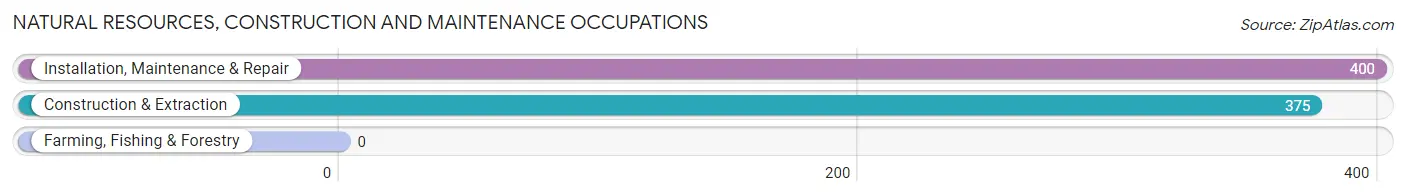
Natural Resources, Construction and Maintenance Occupations
The most common Natural Resources, Construction and Maintenance occupations in Mitchell County are Installation, Maintenance & Repair (400 | 6.1%), and Construction & Extraction (375 | 5.7%).
Natural Resources, Construction and Maintenance Occupations by Sex
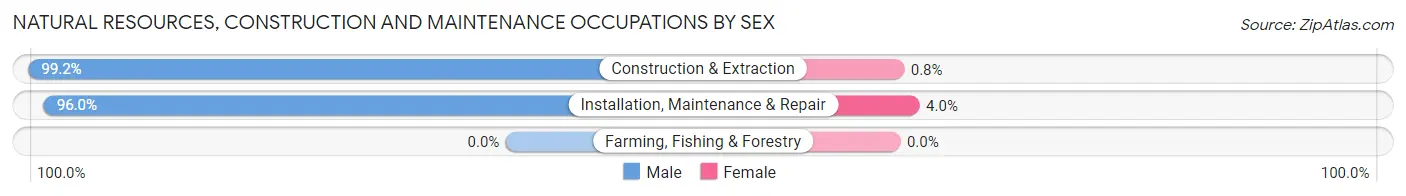
| Occupation | Male | Female |
| Farming, Fishing & Forestry | 0 (0.0%) | 0 (0.0%) |
| Construction & Extraction | 372 (99.2%) | 3 (0.8%) |
| Installation, Maintenance & Repair | 384 (96.0%) | 16 (4.0%) |
| Total (Category) | 756 (97.6%) | 19 (2.5%) |
| Total (Overall) | 3,444 (52.7%) | 3,094 (47.3%) |
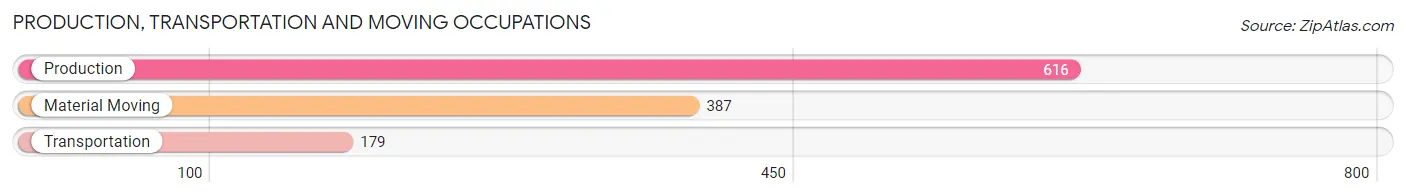
Production, Transportation and Moving Occupations
The most common Production, Transportation and Moving occupations in Mitchell County are Production (616 | 9.4%), Material Moving (387 | 5.9%), and Transportation (179 | 2.7%).
Production, Transportation and Moving Occupations by Sex
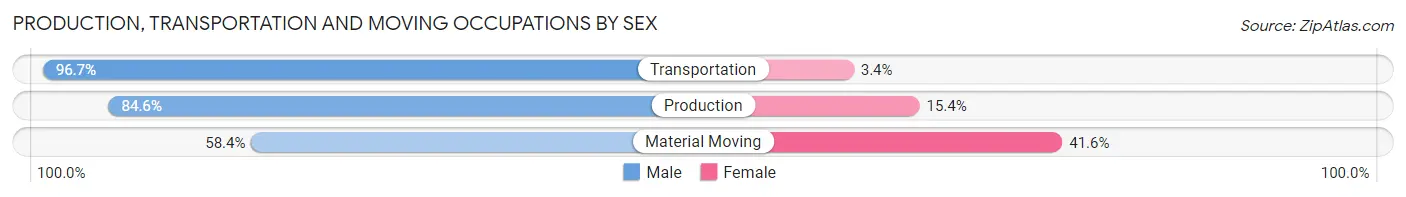
| Occupation | Male | Female |
| Production | 521 (84.6%) | 95 (15.4%) |
| Transportation | 173 (96.7%) | 6 (3.4%) |
| Material Moving | 226 (58.4%) | 161 (41.6%) |
| Total (Category) | 920 (77.8%) | 262 (22.2%) |
| Total (Overall) | 3,444 (52.7%) | 3,094 (47.3%) |
Employment Industries by Sex in Mitchell County
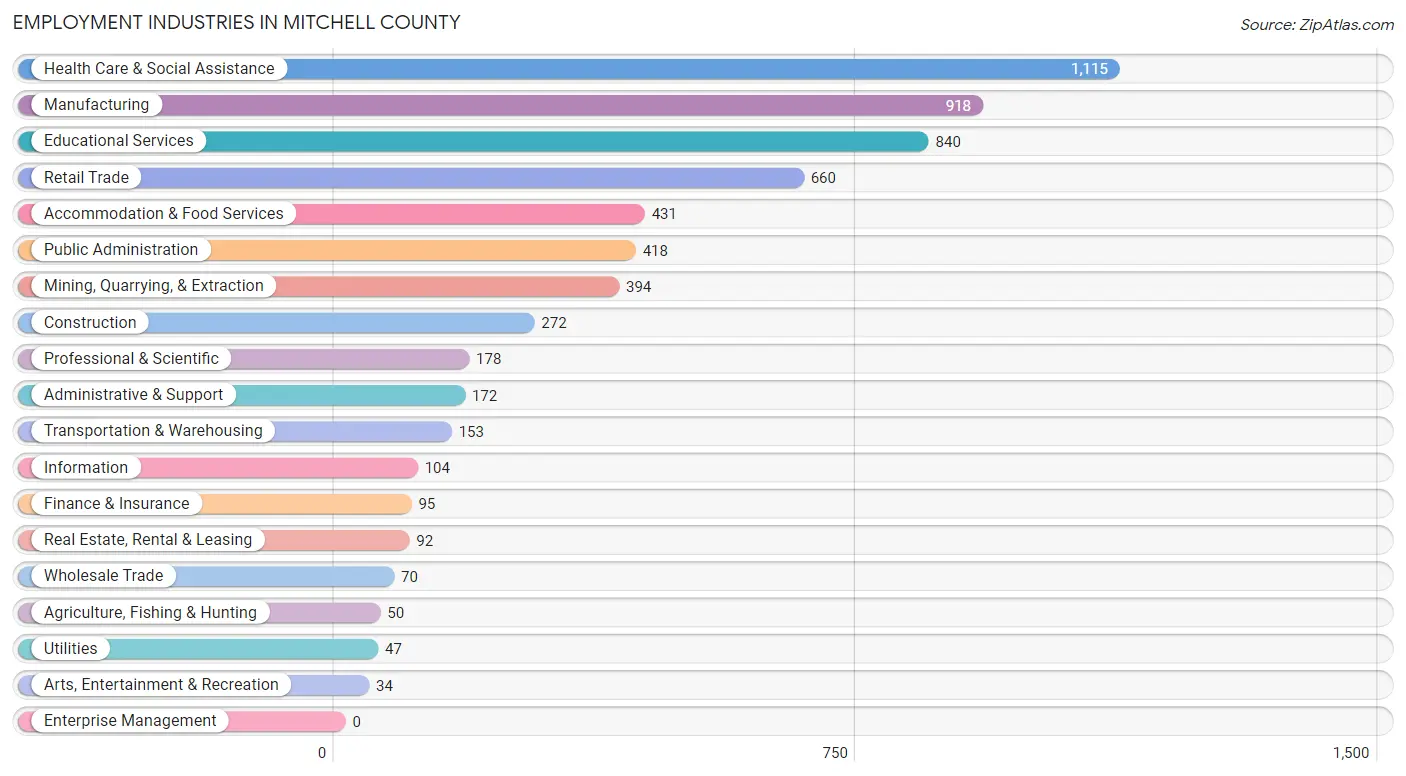
Employment Industries in Mitchell County
The major employment industries in Mitchell County include Health Care & Social Assistance (1,115 | 17.1%), Manufacturing (918 | 14.0%), Educational Services (840 | 12.9%), Retail Trade (660 | 10.1%), and Accommodation & Food Services (431 | 6.6%).
Employment Industries by Sex in Mitchell County
The Mitchell County industries that see more men than women are Construction (93.8%), Arts, Entertainment & Recreation (91.2%), and Transportation & Warehousing (90.8%), whereas the industries that tend to have a higher number of women are Health Care & Social Assistance (78.6%), Educational Services (70.0%), and Finance & Insurance (61.1%).
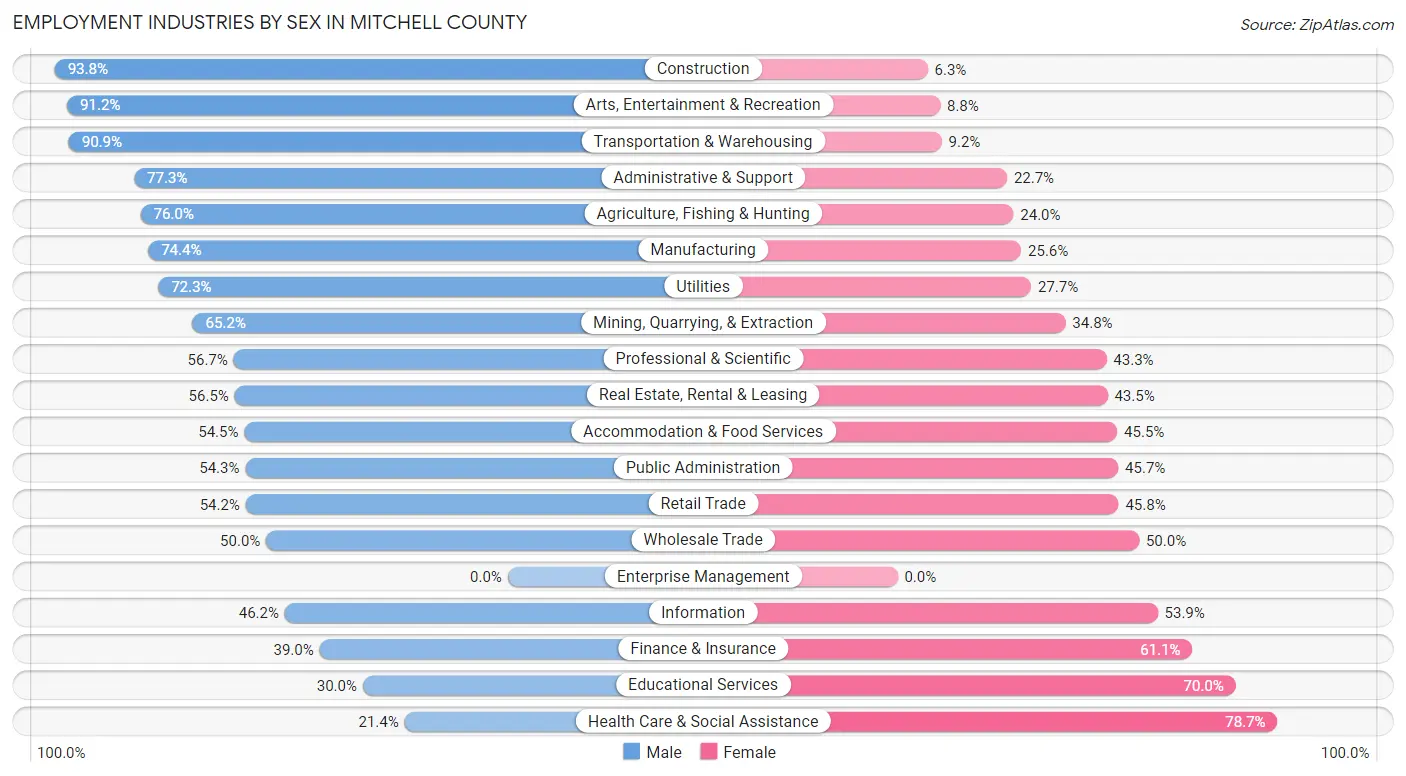
| Industry | Male | Female |
| Agriculture, Fishing & Hunting | 38 (76.0%) | 12 (24.0%) |
| Mining, Quarrying, & Extraction | 257 (65.2%) | 137 (34.8%) |
| Construction | 255 (93.8%) | 17 (6.2%) |
| Manufacturing | 683 (74.4%) | 235 (25.6%) |
| Wholesale Trade | 35 (50.0%) | 35 (50.0%) |
| Retail Trade | 358 (54.2%) | 302 (45.8%) |
| Transportation & Warehousing | 139 (90.8%) | 14 (9.1%) |
| Utilities | 34 (72.3%) | 13 (27.7%) |
| Information | 48 (46.2%) | 56 (53.8%) |
| Finance & Insurance | 37 (39.0%) | 58 (61.1%) |
| Real Estate, Rental & Leasing | 52 (56.5%) | 40 (43.5%) |
| Professional & Scientific | 101 (56.7%) | 77 (43.3%) |
| Enterprise Management | 0 (0.0%) | 0 (0.0%) |
| Administrative & Support | 133 (77.3%) | 39 (22.7%) |
| Educational Services | 252 (30.0%) | 588 (70.0%) |
| Health Care & Social Assistance | 238 (21.3%) | 877 (78.6%) |
| Arts, Entertainment & Recreation | 31 (91.2%) | 3 (8.8%) |
| Accommodation & Food Services | 235 (54.5%) | 196 (45.5%) |
| Public Administration | 227 (54.3%) | 191 (45.7%) |
| Total | 3,444 (52.7%) | 3,094 (47.3%) |
Education in Mitchell County
School Enrollment in Mitchell County
The most common levels of schooling among the 3,073 students in Mitchell County are college / undergraduate (867 | 28.2%), middle school (638 | 20.8%), and high school (597 | 19.4%).
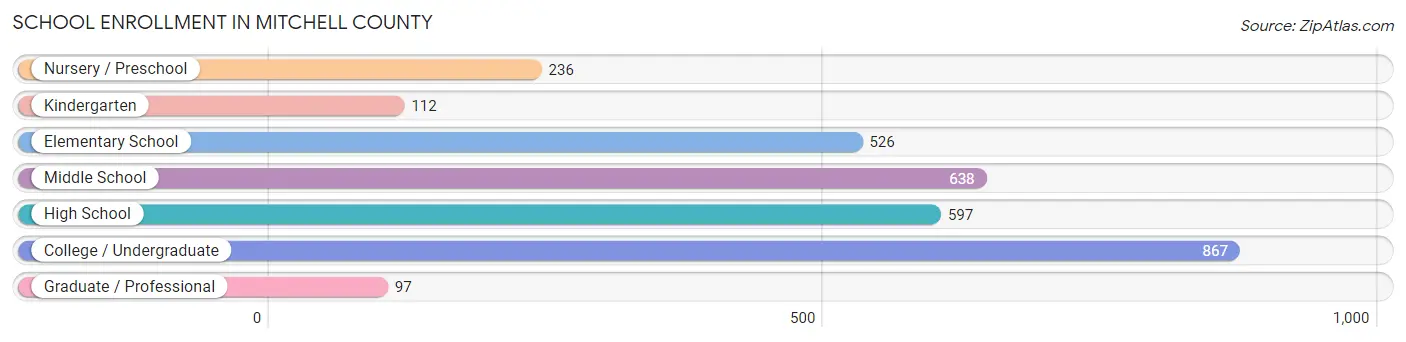
| School Level | # Students | % Students |
| Nursery / Preschool | 236 | 7.7% |
| Kindergarten | 112 | 3.6% |
| Elementary School | 526 | 17.1% |
| Middle School | 638 | 20.8% |
| High School | 597 | 19.4% |
| College / Undergraduate | 867 | 28.2% |
| Graduate / Professional | 97 | 3.2% |
| Total | 3,073 | 100.0% |
School Enrollment by Age by Funding Source in Mitchell County
Out of a total of 3,073 students who are enrolled in schools in Mitchell County, 433 (14.1%) attend a private institution, while the remaining 2,640 (85.9%) are enrolled in public schools. The age group of 3 to 4 year olds has the highest likelihood of being enrolled in private schools, with 47 (63.5% in the age bracket) enrolled. Conversely, the age group of 35 years and over has the lowest likelihood of being enrolled in a private school, with 256 (94.5% in the age bracket) attending a public institution.
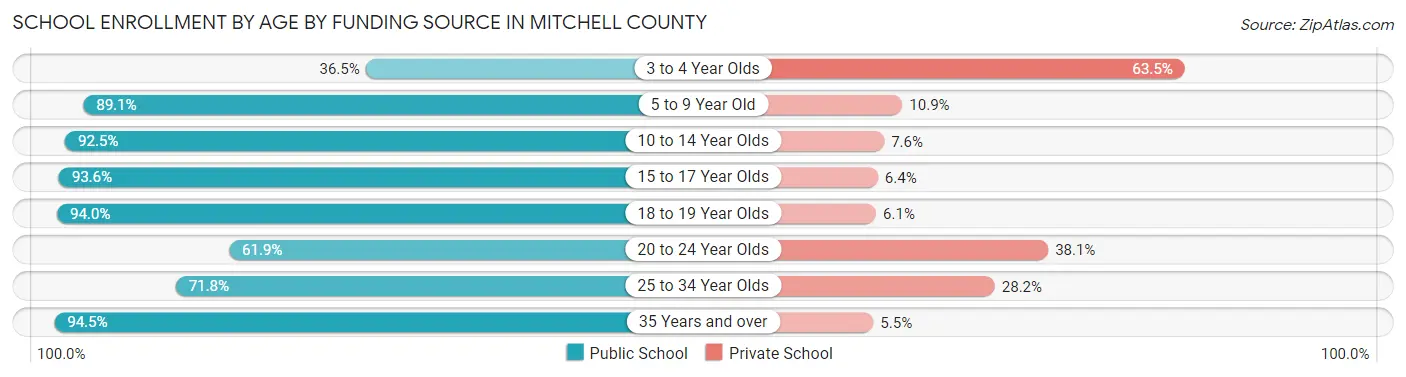
| Age Bracket | Public School | Private School |
| 3 to 4 Year Olds | 27 (36.5%) | 47 (63.5%) |
| 5 to 9 Year Old | 651 (89.1%) | 80 (10.9%) |
| 10 to 14 Year Olds | 686 (92.4%) | 56 (7.5%) |
| 15 to 17 Year Olds | 484 (93.6%) | 33 (6.4%) |
| 18 to 19 Year Olds | 202 (94.0%) | 13 (6.0%) |
| 20 to 24 Year Olds | 260 (61.9%) | 160 (38.1%) |
| 25 to 34 Year Olds | 74 (71.8%) | 29 (28.2%) |
| 35 Years and over | 256 (94.5%) | 15 (5.5%) |
| Total | 2,640 (85.9%) | 433 (14.1%) |
Educational Attainment by Field of Study in Mitchell County
Education (454 | 17.5%), business (433 | 16.7%), visual & performing arts (245 | 9.4%), psychology (220 | 8.5%), and science & technology (212 | 8.2%) are the most common fields of study among 2,595 individuals in Mitchell County who have obtained a bachelor's degree or higher.
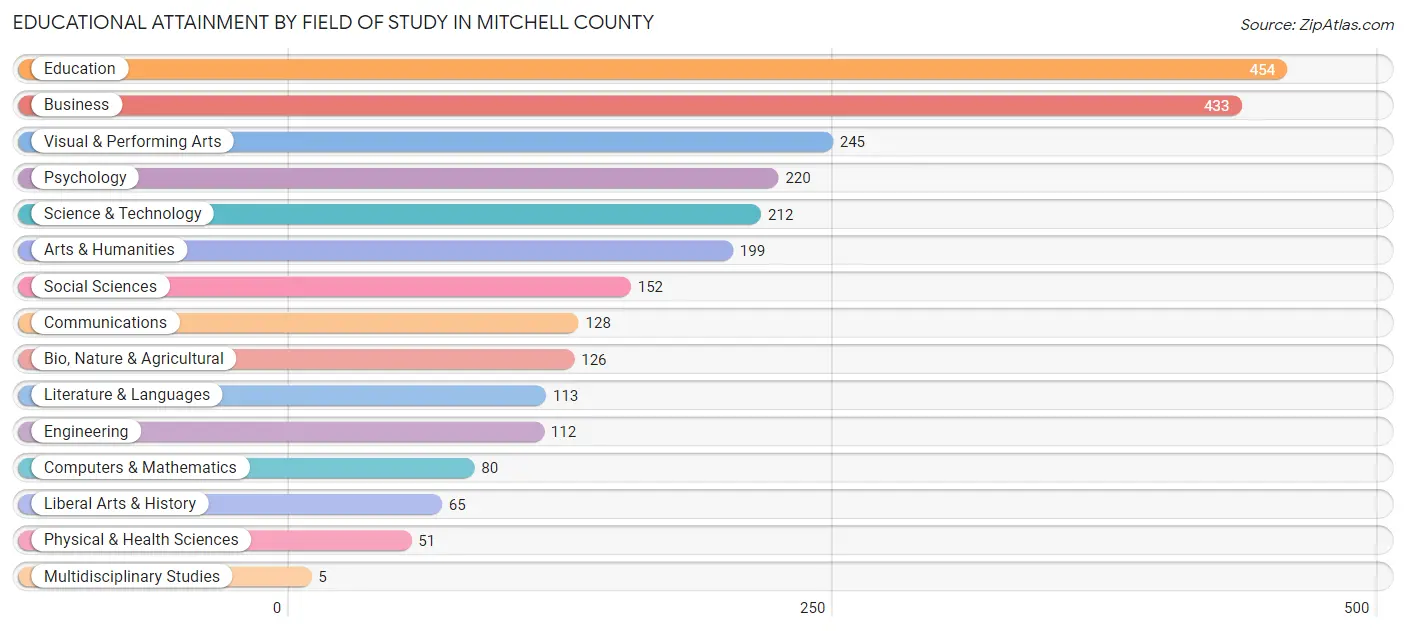
| Field of Study | # Graduates | % Graduates |
| Computers & Mathematics | 80 | 3.1% |
| Bio, Nature & Agricultural | 126 | 4.9% |
| Physical & Health Sciences | 51 | 2.0% |
| Psychology | 220 | 8.5% |
| Social Sciences | 152 | 5.9% |
| Engineering | 112 | 4.3% |
| Multidisciplinary Studies | 5 | 0.2% |
| Science & Technology | 212 | 8.2% |
| Business | 433 | 16.7% |
| Education | 454 | 17.5% |
| Literature & Languages | 113 | 4.3% |
| Liberal Arts & History | 65 | 2.5% |
| Visual & Performing Arts | 245 | 9.4% |
| Communications | 128 | 4.9% |
| Arts & Humanities | 199 | 7.7% |
| Total | 2,595 | 100.0% |
Transportation & Commute in Mitchell County
Vehicle Availability by Sex in Mitchell County
The most prevalent vehicle ownership categories in Mitchell County are males with 3 vehicles (1,259, accounting for 37.7%) and females with 3 vehicles (957, making up 44.4%).
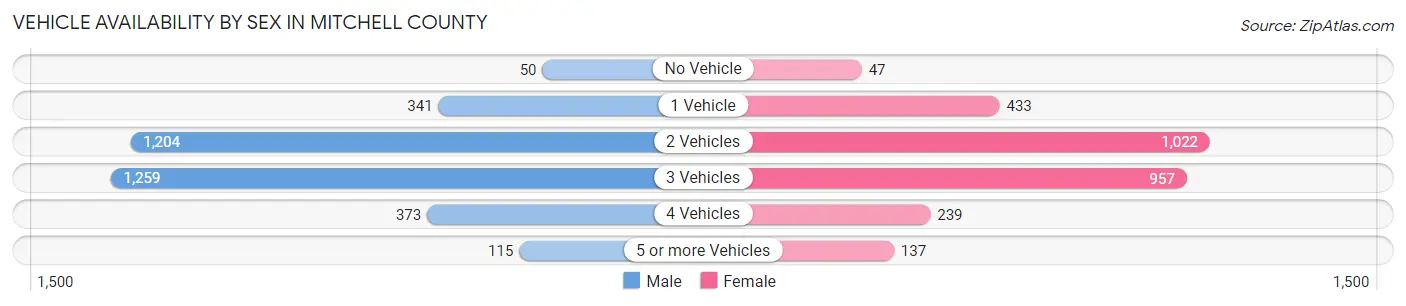
| Vehicles Available | Male | Female |
| No Vehicle | 50 (1.5%) | 47 (1.7%) |
| 1 Vehicle | 341 (10.2%) | 433 (15.3%) |
| 2 Vehicles | 1,204 (36.0%) | 1,022 (36.0%) |
| 3 Vehicles | 1,259 (37.7%) | 957 (33.8%) |
| 4 Vehicles | 373 (11.2%) | 239 (8.4%) |
| 5 or more Vehicles | 115 (3.4%) | 137 (4.8%) |
| Total | 3,342 (100.0%) | 2,835 (100.0%) |
Commute Time in Mitchell County
The most frequently occuring commute durations in Mitchell County are 30 to 34 minutes (1,019 commuters, 17.0%), 10 to 14 minutes (923 commuters, 15.4%), and 5 to 9 minutes (857 commuters, 14.3%).
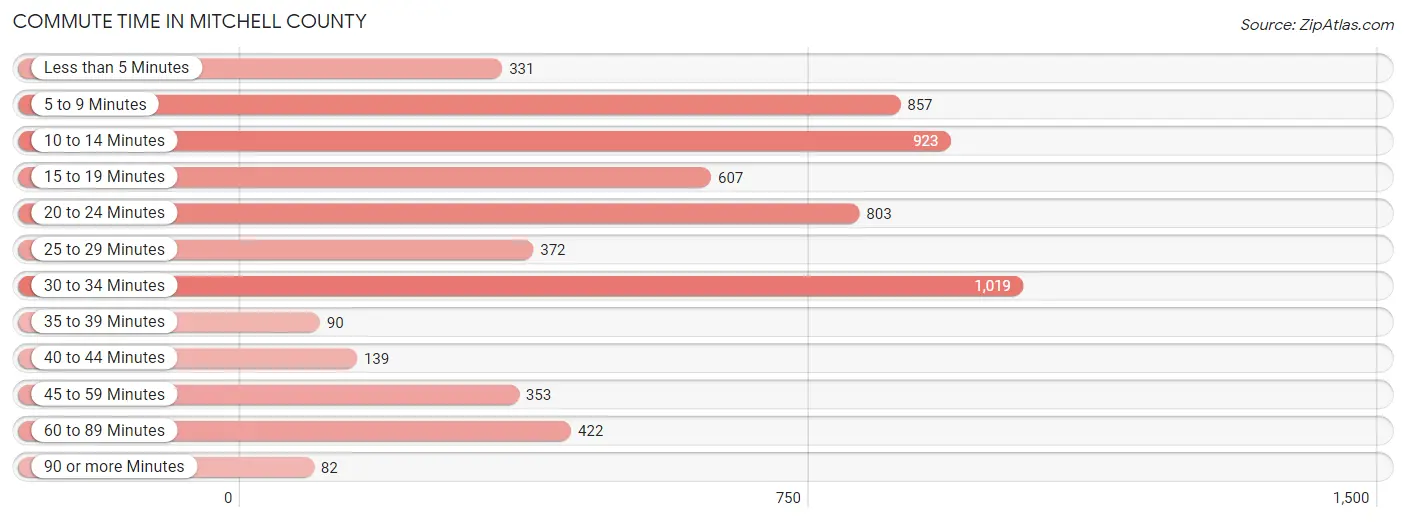
| Commute Time | # Commuters | % Commuters |
| Less than 5 Minutes | 331 | 5.5% |
| 5 to 9 Minutes | 857 | 14.3% |
| 10 to 14 Minutes | 923 | 15.4% |
| 15 to 19 Minutes | 607 | 10.1% |
| 20 to 24 Minutes | 803 | 13.4% |
| 25 to 29 Minutes | 372 | 6.2% |
| 30 to 34 Minutes | 1,019 | 17.0% |
| 35 to 39 Minutes | 90 | 1.5% |
| 40 to 44 Minutes | 139 | 2.3% |
| 45 to 59 Minutes | 353 | 5.9% |
| 60 to 89 Minutes | 422 | 7.0% |
| 90 or more Minutes | 82 | 1.4% |
Commute Time by Sex in Mitchell County
The most common commute times in Mitchell County are 30 to 34 minutes (562 commuters, 17.6%) for males and 5 to 9 minutes (485 commuters, 17.3%) for females.
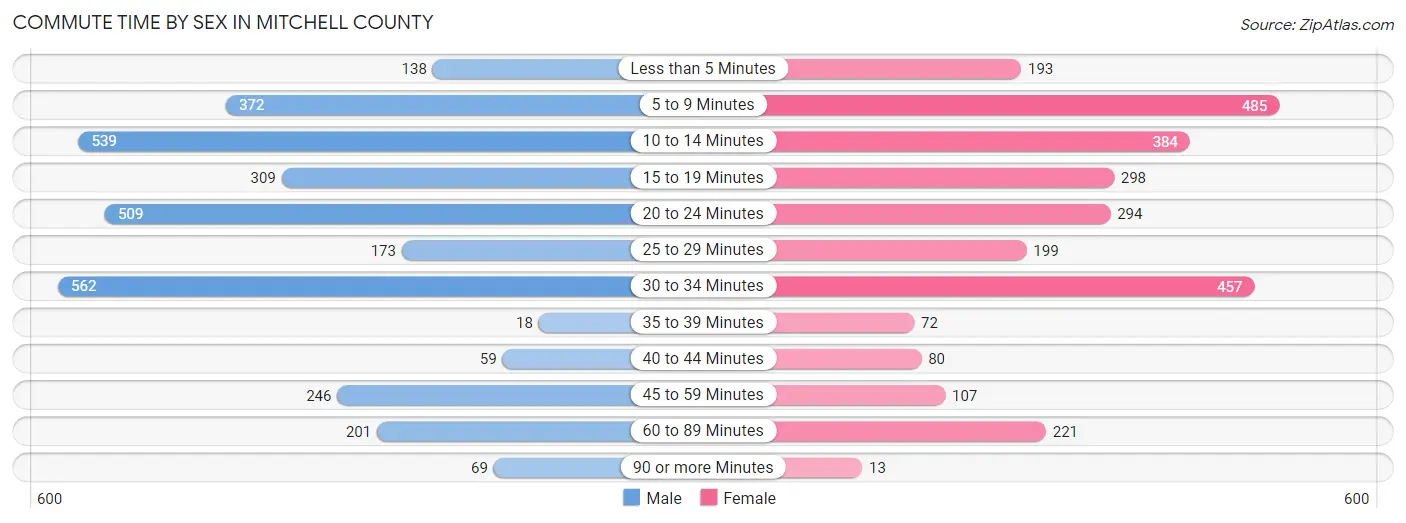
| Commute Time | Male | Female |
| Less than 5 Minutes | 138 (4.3%) | 193 (6.9%) |
| 5 to 9 Minutes | 372 (11.6%) | 485 (17.3%) |
| 10 to 14 Minutes | 539 (16.9%) | 384 (13.7%) |
| 15 to 19 Minutes | 309 (9.7%) | 298 (10.6%) |
| 20 to 24 Minutes | 509 (15.9%) | 294 (10.5%) |
| 25 to 29 Minutes | 173 (5.4%) | 199 (7.1%) |
| 30 to 34 Minutes | 562 (17.6%) | 457 (16.3%) |
| 35 to 39 Minutes | 18 (0.6%) | 72 (2.6%) |
| 40 to 44 Minutes | 59 (1.8%) | 80 (2.9%) |
| 45 to 59 Minutes | 246 (7.7%) | 107 (3.8%) |
| 60 to 89 Minutes | 201 (6.3%) | 221 (7.9%) |
| 90 or more Minutes | 69 (2.2%) | 13 (0.5%) |
Time of Departure to Work by Sex in Mitchell County
The most frequent times of departure to work in Mitchell County are 7:00 AM to 7:29 AM (463, 14.5%) for males and 7:00 AM to 7:29 AM (542, 19.3%) for females.
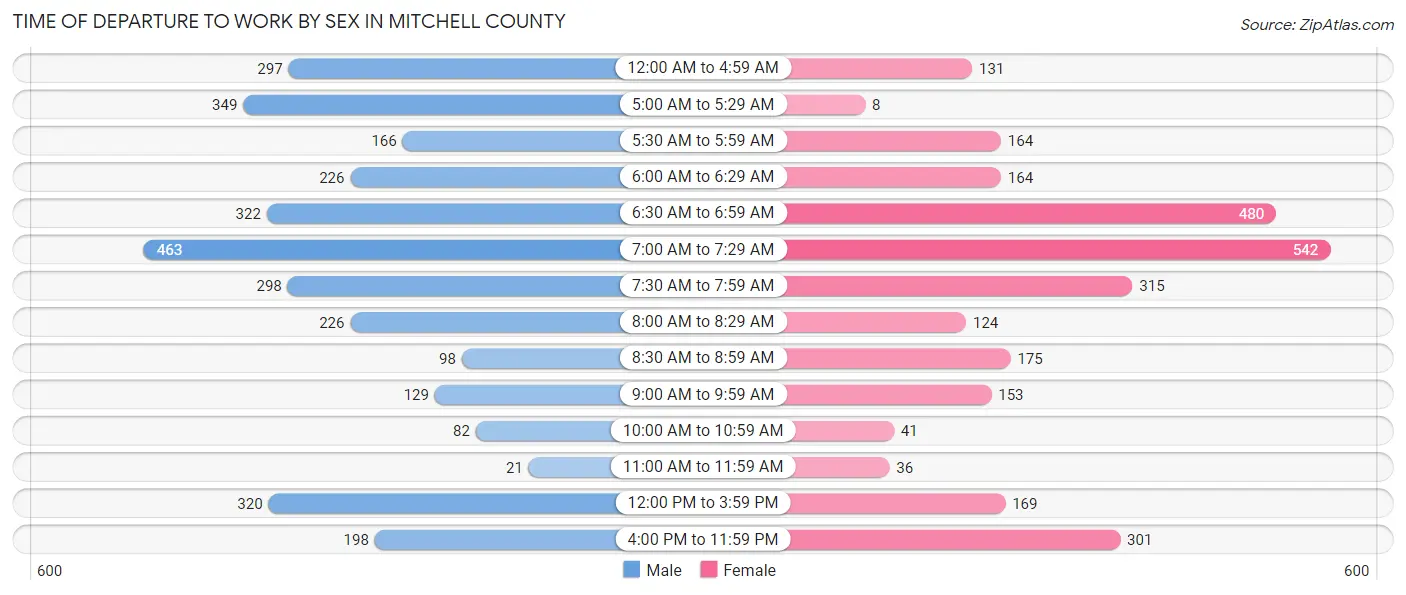
| Time of Departure | Male | Female |
| 12:00 AM to 4:59 AM | 297 (9.3%) | 131 (4.7%) |
| 5:00 AM to 5:29 AM | 349 (10.9%) | 8 (0.3%) |
| 5:30 AM to 5:59 AM | 166 (5.2%) | 164 (5.9%) |
| 6:00 AM to 6:29 AM | 226 (7.1%) | 164 (5.9%) |
| 6:30 AM to 6:59 AM | 322 (10.1%) | 480 (17.1%) |
| 7:00 AM to 7:29 AM | 463 (14.5%) | 542 (19.3%) |
| 7:30 AM to 7:59 AM | 298 (9.3%) | 315 (11.2%) |
| 8:00 AM to 8:29 AM | 226 (7.1%) | 124 (4.4%) |
| 8:30 AM to 8:59 AM | 98 (3.1%) | 175 (6.2%) |
| 9:00 AM to 9:59 AM | 129 (4.0%) | 153 (5.5%) |
| 10:00 AM to 10:59 AM | 82 (2.6%) | 41 (1.5%) |
| 11:00 AM to 11:59 AM | 21 (0.7%) | 36 (1.3%) |
| 12:00 PM to 3:59 PM | 320 (10.0%) | 169 (6.0%) |
| 4:00 PM to 11:59 PM | 198 (6.2%) | 301 (10.7%) |
| Total | 3,195 (100.0%) | 2,803 (100.0%) |
Housing Occupancy in Mitchell County
Occupancy by Ownership in Mitchell County
Of the total 6,479 dwellings in Mitchell County, owner-occupied units account for 5,148 (79.5%), while renter-occupied units make up 1,331 (20.5%).
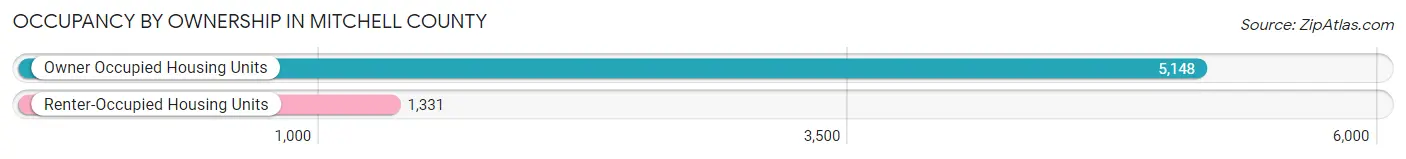
| Occupancy | # Housing Units | % Housing Units |
| Owner Occupied Housing Units | 5,148 | 79.5% |
| Renter-Occupied Housing Units | 1,331 | 20.5% |
| Total Occupied Housing Units | 6,479 | 100.0% |
Occupancy by Household Size in Mitchell County
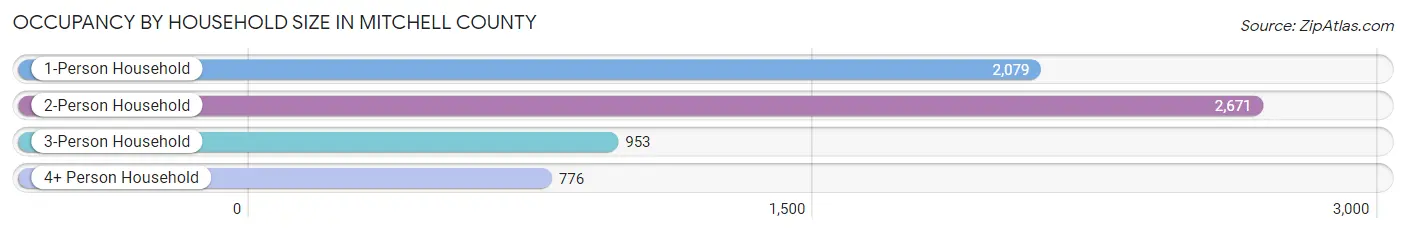
| Household Size | # Housing Units | % Housing Units |
| 1-Person Household | 2,079 | 32.1% |
| 2-Person Household | 2,671 | 41.2% |
| 3-Person Household | 953 | 14.7% |
| 4+ Person Household | 776 | 12.0% |
| Total Housing Units | 6,479 | 100.0% |
Occupancy by Ownership by Household Size in Mitchell County
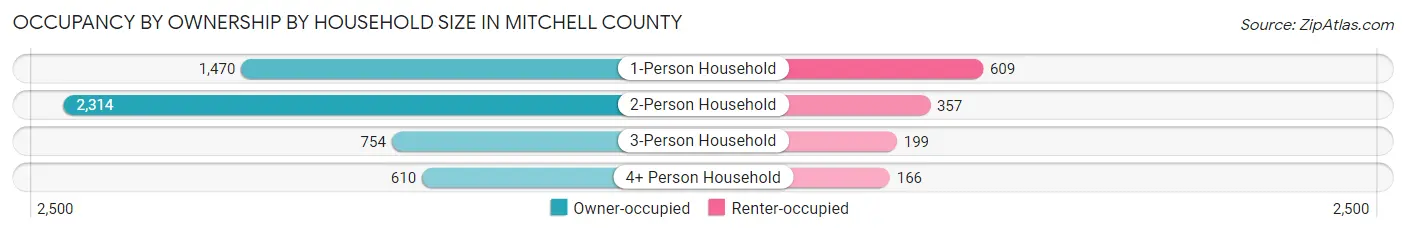
| Household Size | Owner-occupied | Renter-occupied |
| 1-Person Household | 1,470 (70.7%) | 609 (29.3%) |
| 2-Person Household | 2,314 (86.6%) | 357 (13.4%) |
| 3-Person Household | 754 (79.1%) | 199 (20.9%) |
| 4+ Person Household | 610 (78.6%) | 166 (21.4%) |
| Total Housing Units | 5,148 (79.5%) | 1,331 (20.5%) |
Occupancy by Educational Attainment in Mitchell County
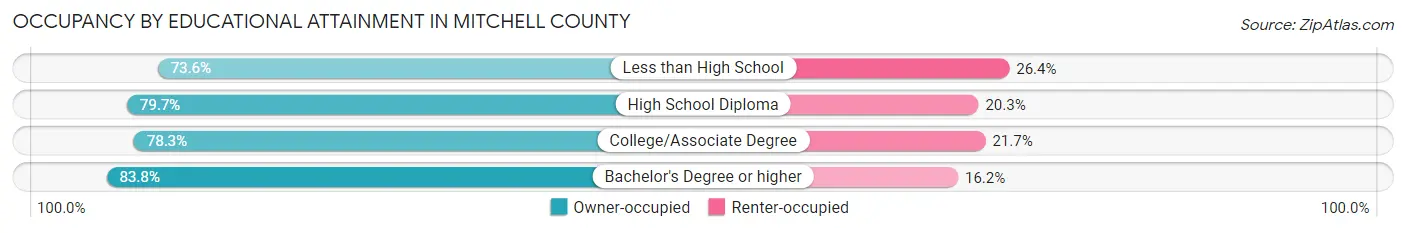
| Household Size | Owner-occupied | Renter-occupied |
| Less than High School | 552 (73.6%) | 198 (26.4%) |
| High School Diploma | 1,481 (79.7%) | 377 (20.3%) |
| College/Associate Degree | 1,836 (78.3%) | 508 (21.7%) |
| Bachelor's Degree or higher | 1,279 (83.8%) | 248 (16.2%) |
Occupancy by Age of Householder in Mitchell County
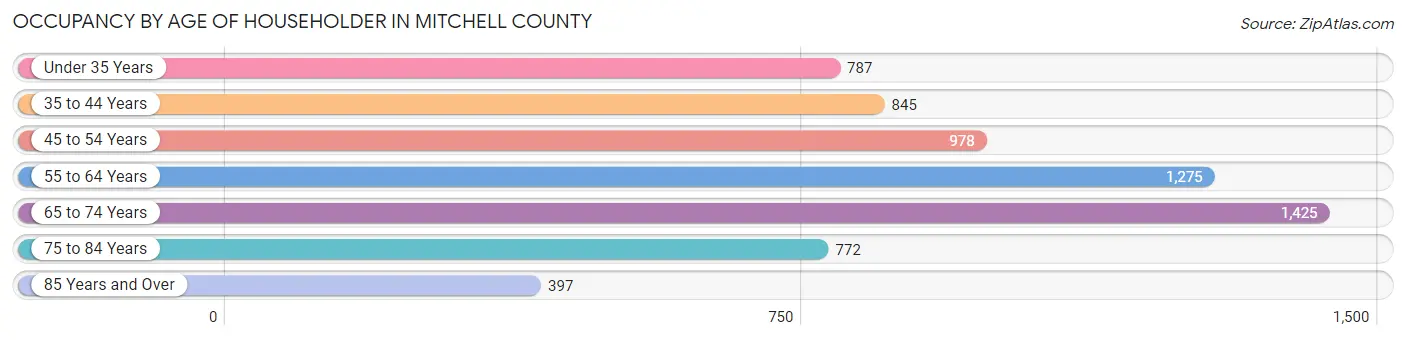
| Age Bracket | # Households | % Households |
| Under 35 Years | 787 | 12.1% |
| 35 to 44 Years | 845 | 13.0% |
| 45 to 54 Years | 978 | 15.1% |
| 55 to 64 Years | 1,275 | 19.7% |
| 65 to 74 Years | 1,425 | 22.0% |
| 75 to 84 Years | 772 | 11.9% |
| 85 Years and Over | 397 | 6.1% |
| Total | 6,479 | 100.0% |
Housing Finances in Mitchell County
Median Income by Occupancy in Mitchell County
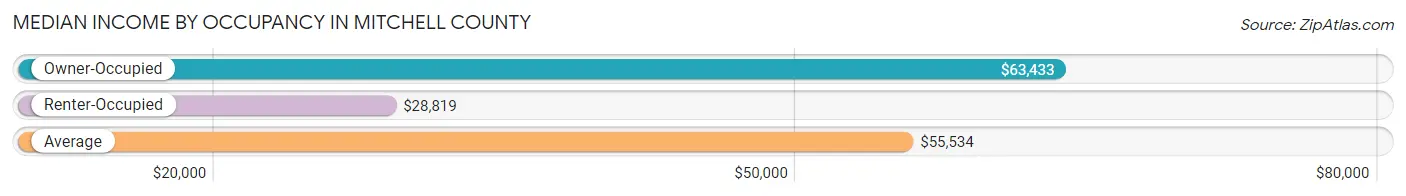
| Occupancy Type | # Households | Median Income |
| Owner-Occupied | 5,148 (79.5%) | $63,433 |
| Renter-Occupied | 1,331 (20.5%) | $28,819 |
| Average | 6,479 (100.0%) | $55,534 |
Occupancy by Householder Income Bracket in Mitchell County
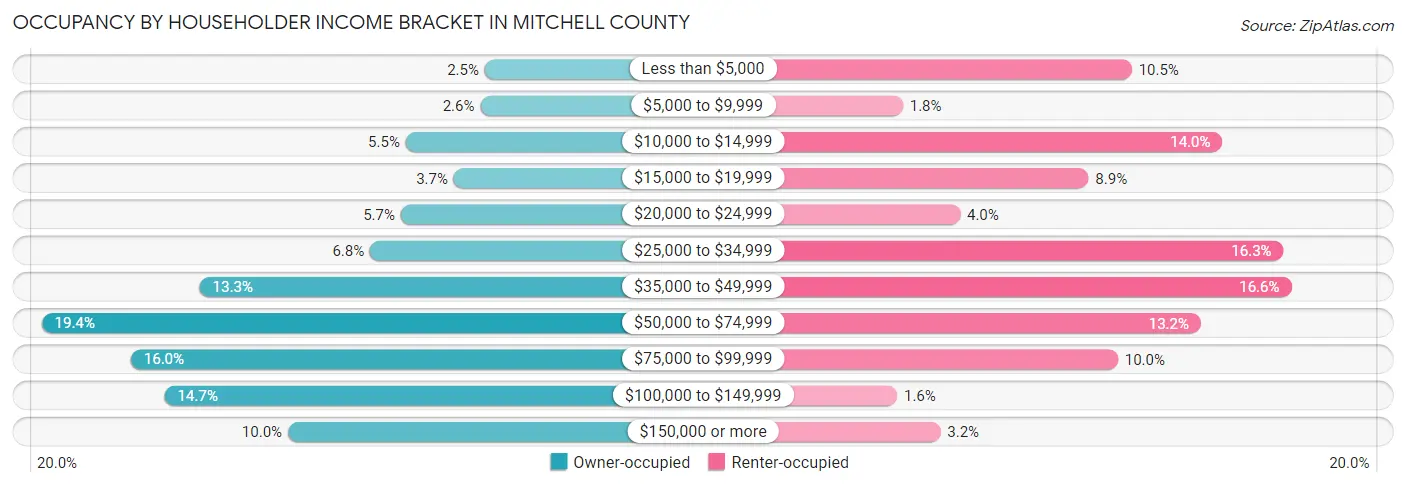
| Income Bracket | Owner-occupied | Renter-occupied |
| Less than $5,000 | 127 (2.5%) | 140 (10.5%) |
| $5,000 to $9,999 | 136 (2.6%) | 24 (1.8%) |
| $10,000 to $14,999 | 282 (5.5%) | 186 (14.0%) |
| $15,000 to $19,999 | 188 (3.6%) | 118 (8.9%) |
| $20,000 to $24,999 | 292 (5.7%) | 53 (4.0%) |
| $25,000 to $34,999 | 352 (6.8%) | 217 (16.3%) |
| $35,000 to $49,999 | 686 (13.3%) | 221 (16.6%) |
| $50,000 to $74,999 | 996 (19.4%) | 175 (13.2%) |
| $75,000 to $99,999 | 821 (16.0%) | 133 (10.0%) |
| $100,000 to $149,999 | 755 (14.7%) | 21 (1.6%) |
| $150,000 or more | 513 (10.0%) | 43 (3.2%) |
| Total | 5,148 (100.0%) | 1,331 (100.0%) |
Monthly Housing Cost Tiers in Mitchell County
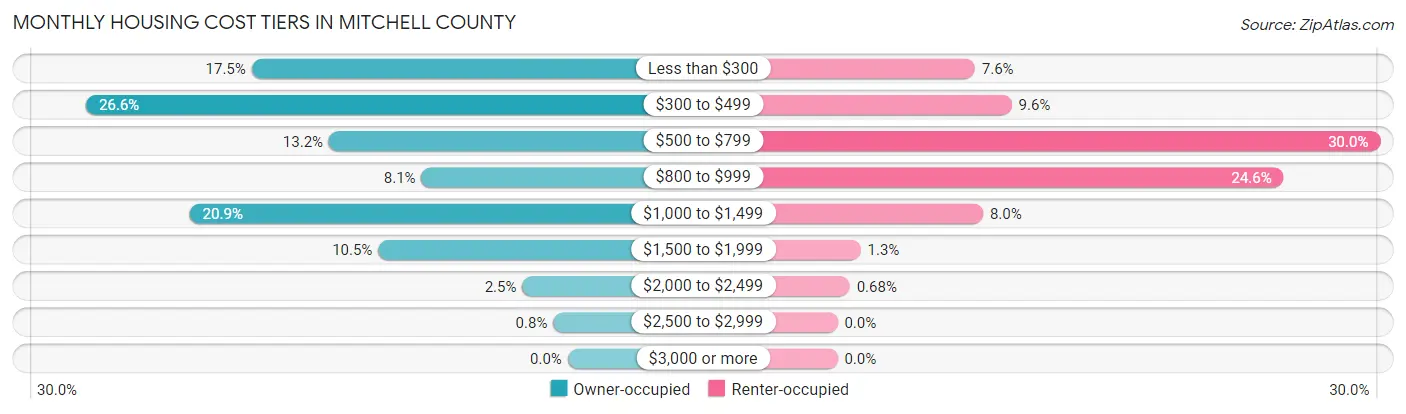
| Monthly Cost | Owner-occupied | Renter-occupied |
| Less than $300 | 899 (17.5%) | 101 (7.6%) |
| $300 to $499 | 1,370 (26.6%) | 128 (9.6%) |
| $500 to $799 | 679 (13.2%) | 399 (30.0%) |
| $800 to $999 | 416 (8.1%) | 328 (24.6%) |
| $1,000 to $1,499 | 1,075 (20.9%) | 107 (8.0%) |
| $1,500 to $1,999 | 539 (10.5%) | 17 (1.3%) |
| $2,000 to $2,499 | 129 (2.5%) | 9 (0.7%) |
| $2,500 to $2,999 | 41 (0.8%) | 0 (0.0%) |
| $3,000 or more | 0 (0.0%) | 0 (0.0%) |
| Total | 5,148 (100.0%) | 1,331 (100.0%) |
Physical Housing Characteristics in Mitchell County
Housing Structures in Mitchell County
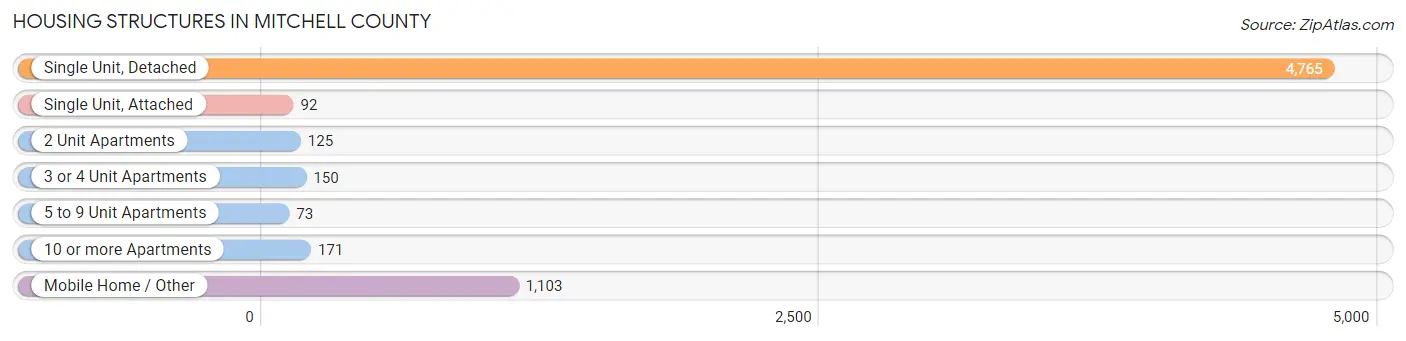
| Structure Type | # Housing Units | % Housing Units |
| Single Unit, Detached | 4,765 | 73.6% |
| Single Unit, Attached | 92 | 1.4% |
| 2 Unit Apartments | 125 | 1.9% |
| 3 or 4 Unit Apartments | 150 | 2.3% |
| 5 to 9 Unit Apartments | 73 | 1.1% |
| 10 or more Apartments | 171 | 2.6% |
| Mobile Home / Other | 1,103 | 17.0% |
| Total | 6,479 | 100.0% |
Housing Structures by Occupancy in Mitchell County
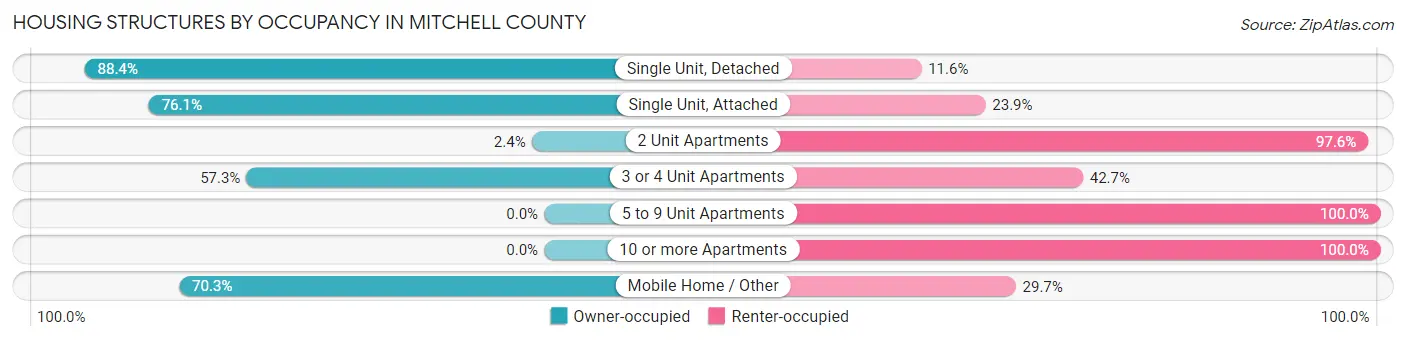
| Structure Type | Owner-occupied | Renter-occupied |
| Single Unit, Detached | 4,214 (88.4%) | 551 (11.6%) |
| Single Unit, Attached | 70 (76.1%) | 22 (23.9%) |
| 2 Unit Apartments | 3 (2.4%) | 122 (97.6%) |
| 3 or 4 Unit Apartments | 86 (57.3%) | 64 (42.7%) |
| 5 to 9 Unit Apartments | 0 (0.0%) | 73 (100.0%) |
| 10 or more Apartments | 0 (0.0%) | 171 (100.0%) |
| Mobile Home / Other | 775 (70.3%) | 328 (29.7%) |
| Total | 5,148 (79.5%) | 1,331 (20.5%) |
Housing Structures by Number of Rooms in Mitchell County
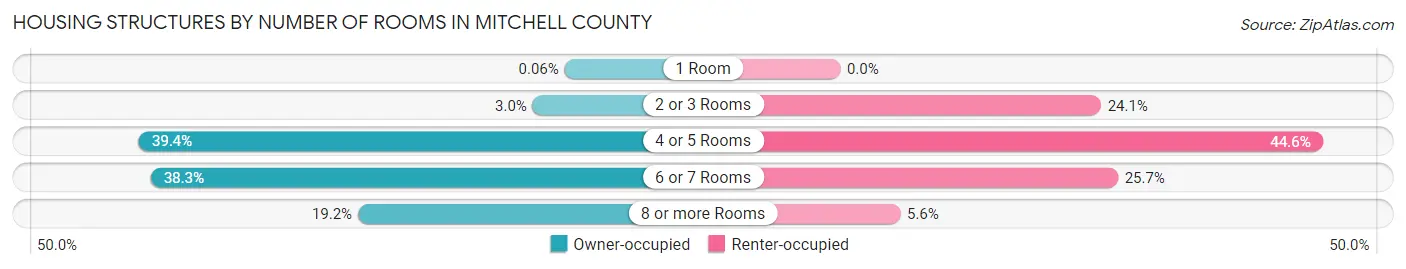
| Number of Rooms | Owner-occupied | Renter-occupied |
| 1 Room | 3 (0.1%) | 0 (0.0%) |
| 2 or 3 Rooms | 155 (3.0%) | 321 (24.1%) |
| 4 or 5 Rooms | 2,030 (39.4%) | 594 (44.6%) |
| 6 or 7 Rooms | 1,973 (38.3%) | 342 (25.7%) |
| 8 or more Rooms | 987 (19.2%) | 74 (5.6%) |
| Total | 5,148 (100.0%) | 1,331 (100.0%) |
Housing Structure by Heating Type in Mitchell County
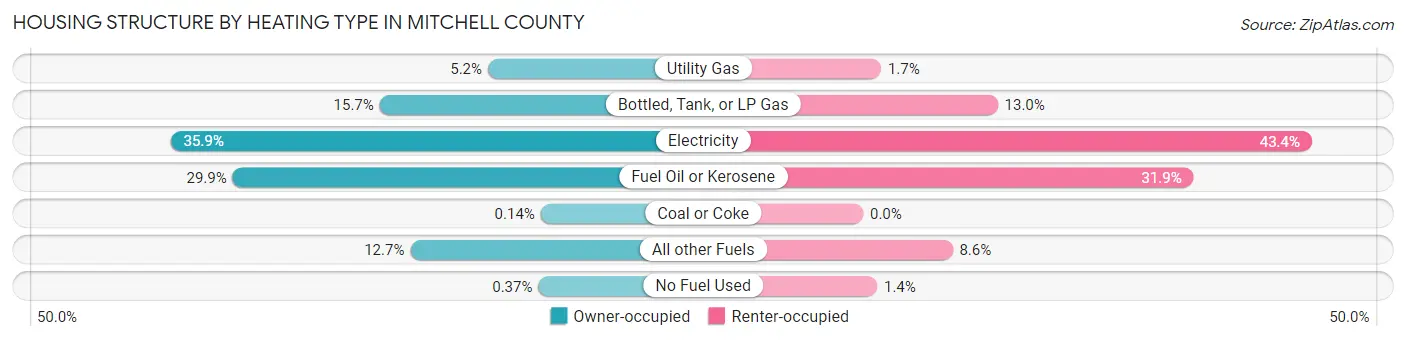
| Heating Type | Owner-occupied | Renter-occupied |
| Utility Gas | 270 (5.2%) | 23 (1.7%) |
| Bottled, Tank, or LP Gas | 808 (15.7%) | 173 (13.0%) |
| Electricity | 1,848 (35.9%) | 577 (43.3%) |
| Fuel Oil or Kerosene | 1,540 (29.9%) | 425 (31.9%) |
| Coal or Coke | 7 (0.1%) | 0 (0.0%) |
| All other Fuels | 656 (12.7%) | 115 (8.6%) |
| No Fuel Used | 19 (0.4%) | 18 (1.3%) |
| Total | 5,148 (100.0%) | 1,331 (100.0%) |
Household Vehicle Usage in Mitchell County
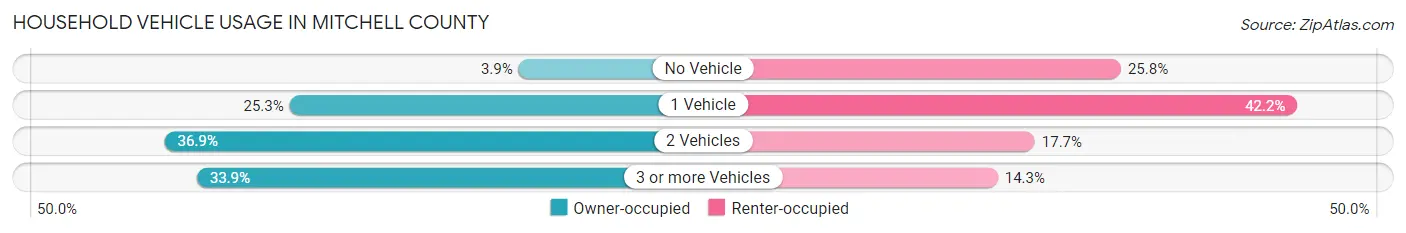
| Vehicles per Household | Owner-occupied | Renter-occupied |
| No Vehicle | 200 (3.9%) | 343 (25.8%) |
| 1 Vehicle | 1,301 (25.3%) | 562 (42.2%) |
| 2 Vehicles | 1,901 (36.9%) | 236 (17.7%) |
| 3 or more Vehicles | 1,746 (33.9%) | 190 (14.3%) |
| Total | 5,148 (100.0%) | 1,331 (100.0%) |
Real Estate & Mortgages in Mitchell County
Real Estate and Mortgage Overview in Mitchell County
| Characteristic | Without Mortgage | With Mortgage |
| Housing Units | 2,787 | 2,361 |
| Median Property Value | $170,300 | $208,400 |
| Median Household Income | $42,809 | $395 |
| Monthly Housing Costs | $362 | $0 |
| Real Estate Taxes | $874 | $21 |
Property Value by Mortgage Status in Mitchell County
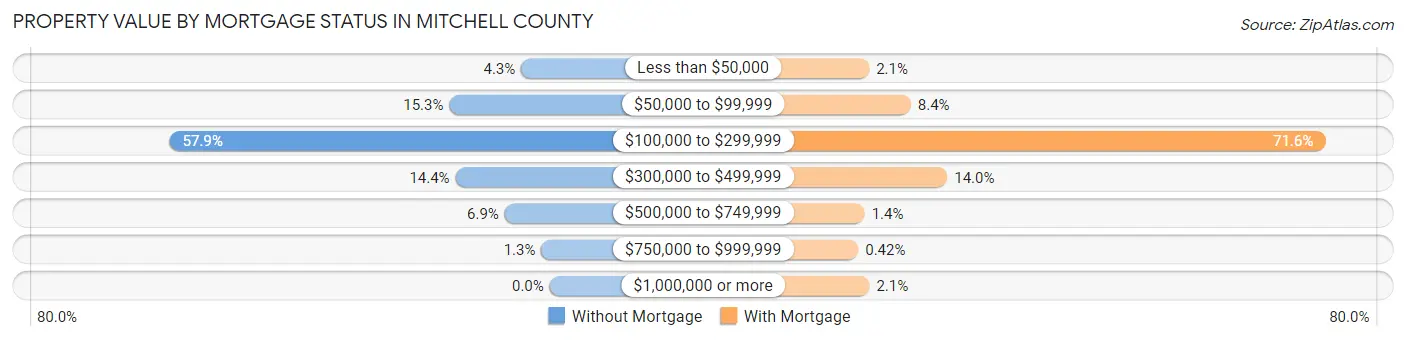
| Property Value | Without Mortgage | With Mortgage |
| Less than $50,000 | 121 (4.3%) | 49 (2.1%) |
| $50,000 to $99,999 | 426 (15.3%) | 199 (8.4%) |
| $100,000 to $299,999 | 1,614 (57.9%) | 1,690 (71.6%) |
| $300,000 to $499,999 | 400 (14.3%) | 330 (14.0%) |
| $500,000 to $749,999 | 191 (6.9%) | 33 (1.4%) |
| $750,000 to $999,999 | 35 (1.3%) | 10 (0.4%) |
| $1,000,000 or more | 0 (0.0%) | 50 (2.1%) |
| Total | 2,787 (100.0%) | 2,361 (100.0%) |
Household Income by Mortgage Status in Mitchell County
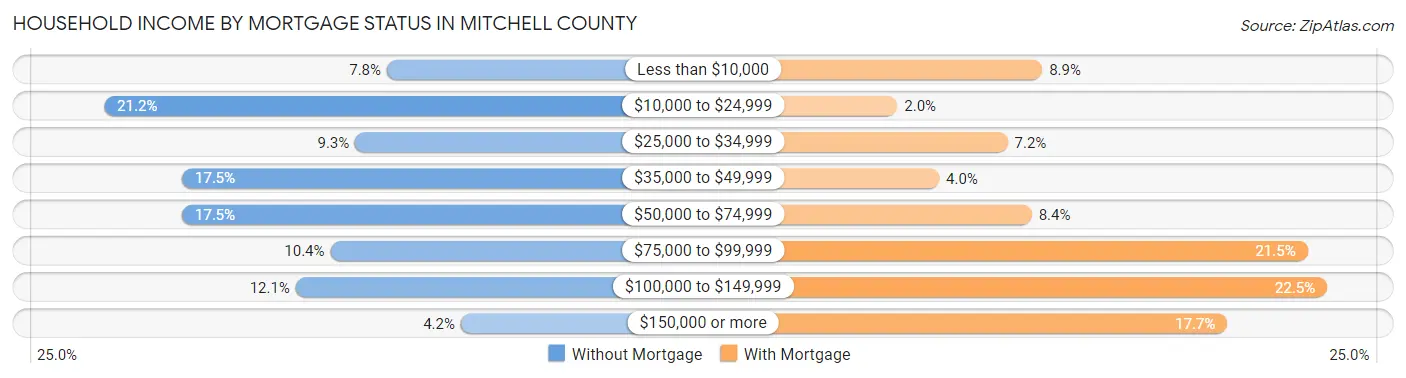
| Household Income | Without Mortgage | With Mortgage |
| Less than $10,000 | 216 (7.7%) | 210 (8.9%) |
| $10,000 to $24,999 | 591 (21.2%) | 47 (2.0%) |
| $25,000 to $34,999 | 258 (9.3%) | 171 (7.2%) |
| $35,000 to $49,999 | 488 (17.5%) | 94 (4.0%) |
| $50,000 to $74,999 | 488 (17.5%) | 198 (8.4%) |
| $75,000 to $99,999 | 291 (10.4%) | 508 (21.5%) |
| $100,000 to $149,999 | 337 (12.1%) | 530 (22.5%) |
| $150,000 or more | 118 (4.2%) | 418 (17.7%) |
| Total | 2,787 (100.0%) | 2,361 (100.0%) |
Property Value to Household Income Ratio in Mitchell County
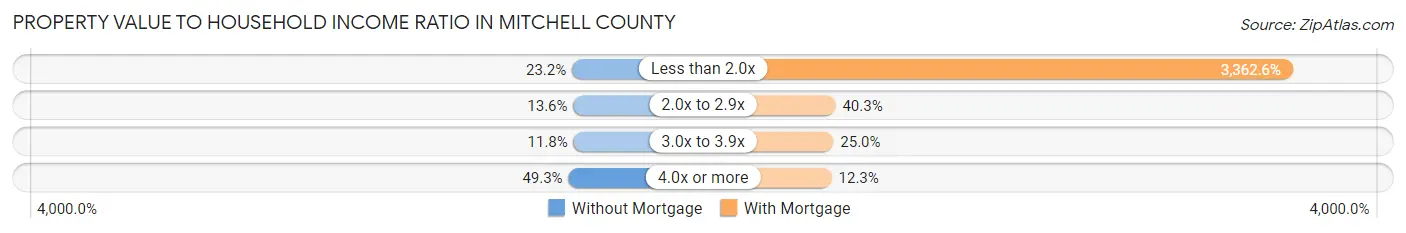
| Value-to-Income Ratio | Without Mortgage | With Mortgage |
| Less than 2.0x | 646 (23.2%) | 79,391 (3,362.6%) |
| 2.0x to 2.9x | 379 (13.6%) | 952 (40.3%) |
| 3.0x to 3.9x | 329 (11.8%) | 590 (25.0%) |
| 4.0x or more | 1,375 (49.3%) | 290 (12.3%) |
| Total | 2,787 (100.0%) | 2,361 (100.0%) |
Real Estate Taxes by Mortgage Status in Mitchell County
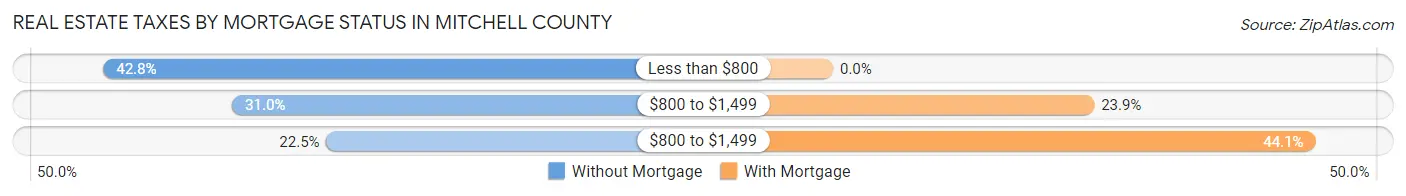
| Property Taxes | Without Mortgage | With Mortgage |
| Less than $800 | 1,193 (42.8%) | 0 (0.0%) |
| $800 to $1,499 | 865 (31.0%) | 563 (23.8%) |
| $800 to $1,499 | 628 (22.5%) | 1,040 (44.1%) |
| Total | 2,787 (100.0%) | 2,361 (100.0%) |
Health & Disability in Mitchell County
Health Insurance Coverage by Age in Mitchell County
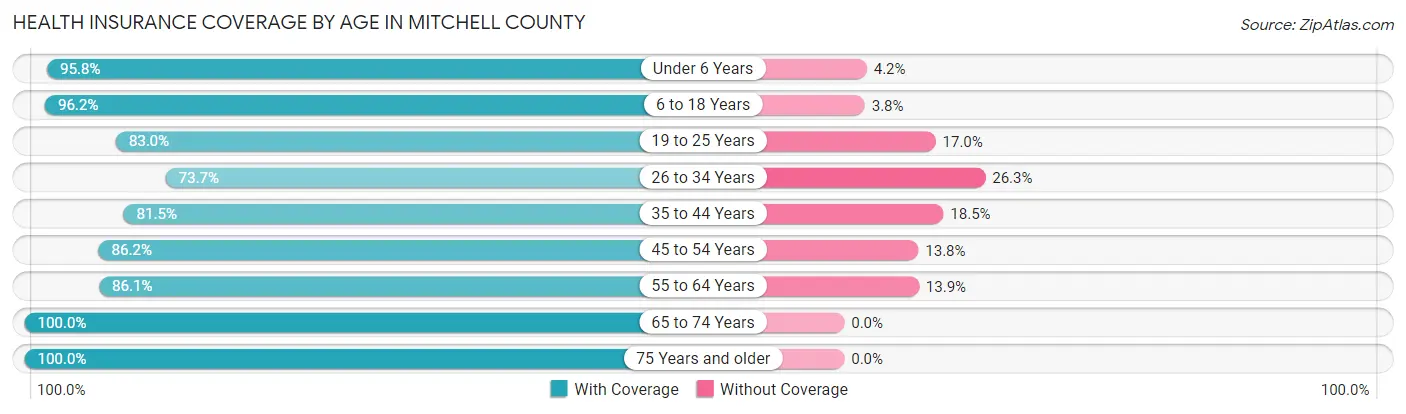
| Age Bracket | With Coverage | Without Coverage |
| Under 6 Years | 869 (95.8%) | 38 (4.2%) |
| 6 to 18 Years | 1,912 (96.2%) | 76 (3.8%) |
| 19 to 25 Years | 833 (83.0%) | 171 (17.0%) |
| 26 to 34 Years | 1,244 (73.7%) | 444 (26.3%) |
| 35 to 44 Years | 1,204 (81.5%) | 273 (18.5%) |
| 45 to 54 Years | 1,648 (86.2%) | 264 (13.8%) |
| 55 to 64 Years | 1,943 (86.1%) | 314 (13.9%) |
| 65 to 74 Years | 2,121 (100.0%) | 0 (0.0%) |
| 75 Years and older | 1,551 (100.0%) | 0 (0.0%) |
| Total | 13,325 (89.4%) | 1,580 (10.6%) |
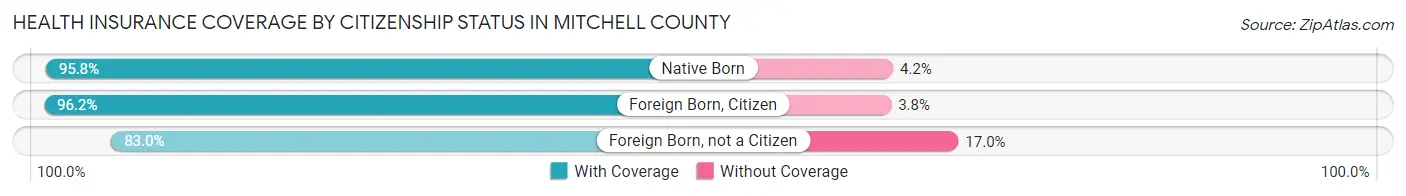
Health Insurance Coverage by Citizenship Status in Mitchell County
| Citizenship Status | With Coverage | Without Coverage |
| Native Born | 869 (95.8%) | 38 (4.2%) |
| Foreign Born, Citizen | 1,912 (96.2%) | 76 (3.8%) |
| Foreign Born, not a Citizen | 833 (83.0%) | 171 (17.0%) |
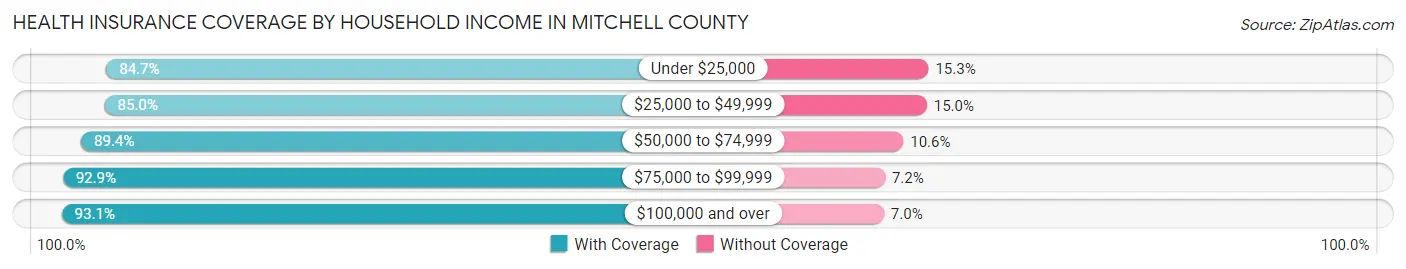
Health Insurance Coverage by Household Income in Mitchell County
| Household Income | With Coverage | Without Coverage |
| Under $25,000 | 1,958 (84.7%) | 354 (15.3%) |
| $25,000 to $49,999 | 2,586 (85.0%) | 456 (15.0%) |
| $50,000 to $74,999 | 2,779 (89.4%) | 329 (10.6%) |
| $75,000 to $99,999 | 2,235 (92.8%) | 172 (7.1%) |
| $100,000 and over | 3,467 (93.0%) | 259 (7.0%) |
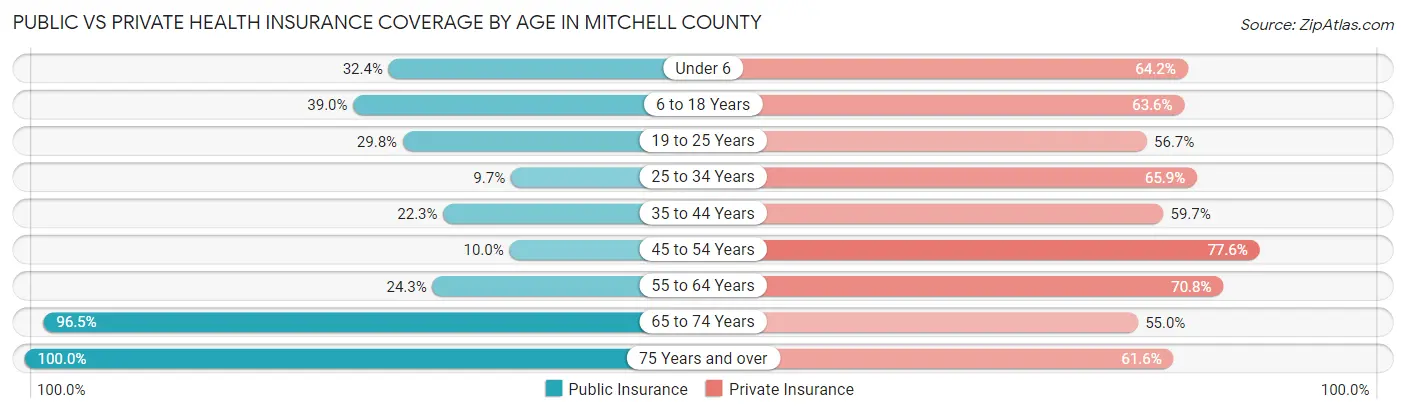
Public vs Private Health Insurance Coverage by Age in Mitchell County
| Age Bracket | Public Insurance | Private Insurance |
| Under 6 | 294 (32.4%) | 582 (64.2%) |
| 6 to 18 Years | 775 (39.0%) | 1,264 (63.6%) |
| 19 to 25 Years | 299 (29.8%) | 569 (56.7%) |
| 25 to 34 Years | 164 (9.7%) | 1,113 (65.9%) |
| 35 to 44 Years | 329 (22.3%) | 882 (59.7%) |
| 45 to 54 Years | 191 (10.0%) | 1,483 (77.6%) |
| 55 to 64 Years | 548 (24.3%) | 1,598 (70.8%) |
| 65 to 74 Years | 2,047 (96.5%) | 1,167 (55.0%) |
| 75 Years and over | 1,551 (100.0%) | 955 (61.6%) |
| Total | 6,198 (41.6%) | 9,613 (64.5%) |
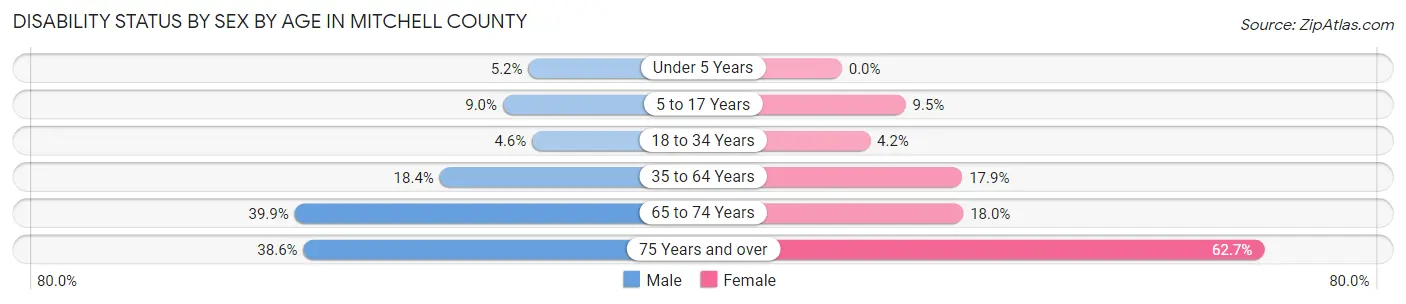
Disability Status by Sex by Age in Mitchell County
| Age Bracket | Male | Female |
| Under 5 Years | 18 (5.2%) | 0 (0.0%) |
| 5 to 17 Years | 98 (9.0%) | 90 (9.5%) |
| 18 to 34 Years | 70 (4.6%) | 57 (4.2%) |
| 35 to 64 Years | 511 (18.4%) | 512 (17.9%) |
| 65 to 74 Years | 404 (39.9%) | 200 (18.0%) |
| 75 Years and over | 254 (38.6%) | 560 (62.7%) |
Disability Class by Sex by Age in Mitchell County
Disability Class: Hearing Difficulty
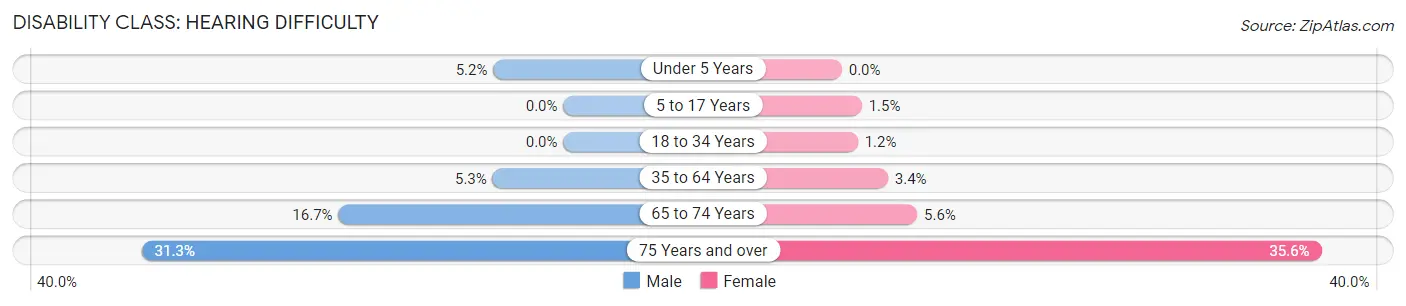
| Age Bracket | Male | Female |
| Under 5 Years | 18 (5.2%) | 0 (0.0%) |
| 5 to 17 Years | 0 (0.0%) | 14 (1.5%) |
| 18 to 34 Years | 0 (0.0%) | 16 (1.2%) |
| 35 to 64 Years | 146 (5.2%) | 98 (3.4%) |
| 65 to 74 Years | 169 (16.7%) | 62 (5.6%) |
| 75 Years and over | 206 (31.3%) | 318 (35.6%) |
Disability Class: Vision Difficulty
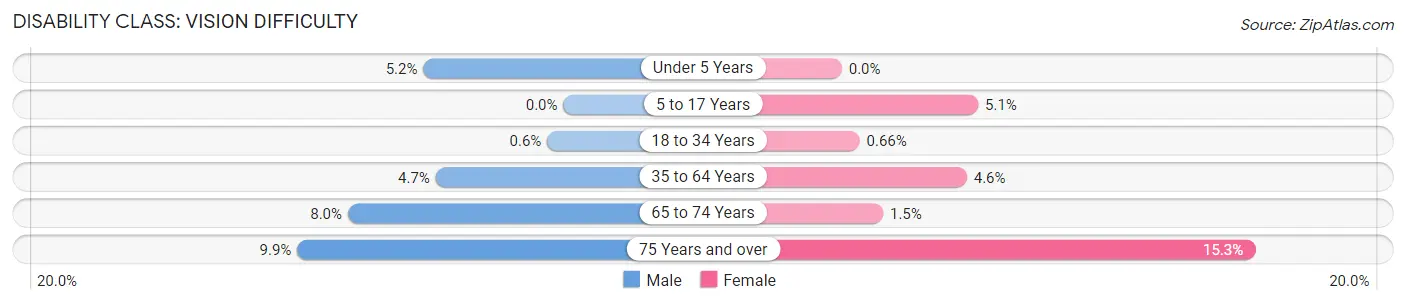
| Age Bracket | Male | Female |
| Under 5 Years | 18 (5.2%) | 0 (0.0%) |
| 5 to 17 Years | 0 (0.0%) | 48 (5.1%) |
| 18 to 34 Years | 9 (0.6%) | 9 (0.7%) |
| 35 to 64 Years | 132 (4.7%) | 133 (4.6%) |
| 65 to 74 Years | 81 (8.0%) | 17 (1.5%) |
| 75 Years and over | 65 (9.9%) | 137 (15.3%) |
Disability Class: Cognitive Difficulty
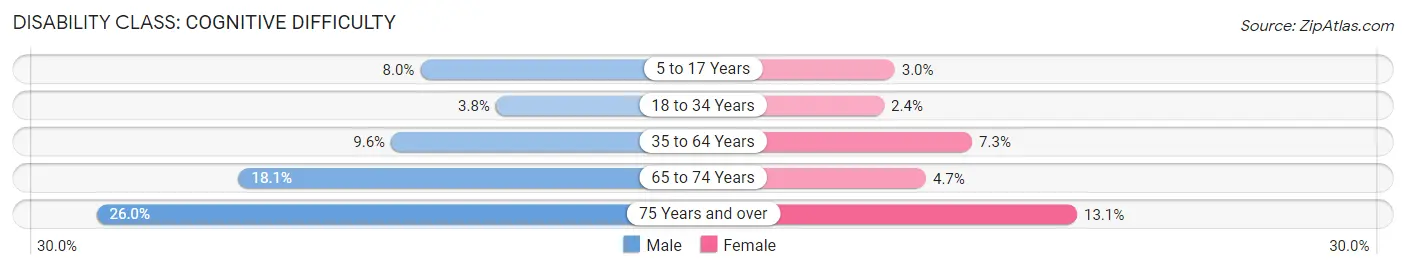
| Age Bracket | Male | Female |
| 5 to 17 Years | 87 (8.0%) | 28 (2.9%) |
| 18 to 34 Years | 57 (3.8%) | 32 (2.4%) |
| 35 to 64 Years | 267 (9.6%) | 208 (7.3%) |
| 65 to 74 Years | 183 (18.1%) | 52 (4.7%) |
| 75 Years and over | 171 (26.0%) | 117 (13.1%) |
Disability Class: Ambulatory Difficulty
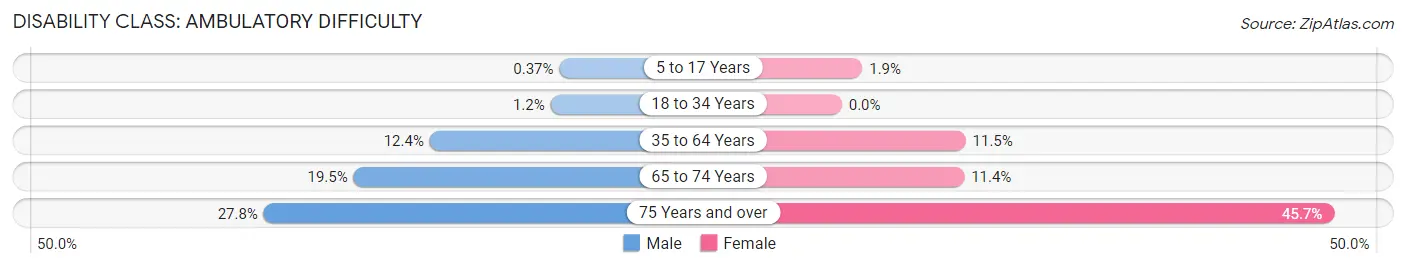
| Age Bracket | Male | Female |
| 5 to 17 Years | 4 (0.4%) | 18 (1.9%) |
| 18 to 34 Years | 18 (1.2%) | 0 (0.0%) |
| 35 to 64 Years | 345 (12.4%) | 329 (11.5%) |
| 65 to 74 Years | 197 (19.5%) | 126 (11.4%) |
| 75 Years and over | 183 (27.8%) | 408 (45.7%) |
Disability Class: Self-Care Difficulty
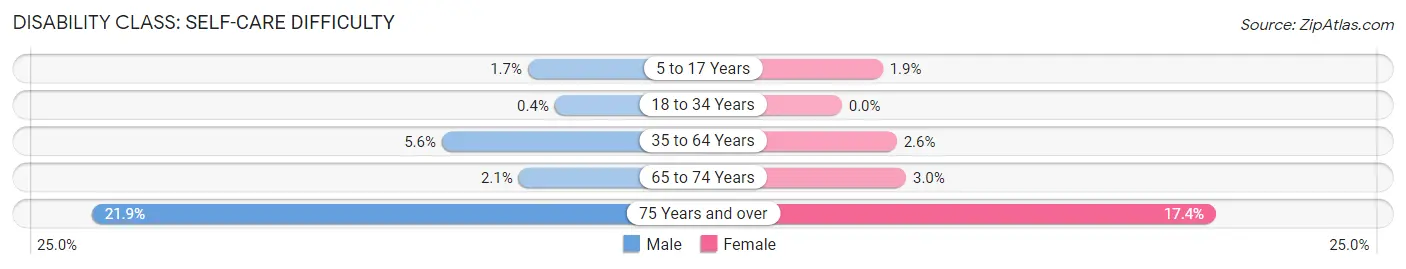
| Age Bracket | Male | Female |
| 5 to 17 Years | 18 (1.7%) | 18 (1.9%) |
| 18 to 34 Years | 6 (0.4%) | 0 (0.0%) |
| 35 to 64 Years | 157 (5.6%) | 73 (2.5%) |
| 65 to 74 Years | 21 (2.1%) | 33 (3.0%) |
| 75 Years and over | 144 (21.9%) | 155 (17.4%) |
Technology Access in Mitchell County
Computing Device Access in Mitchell County
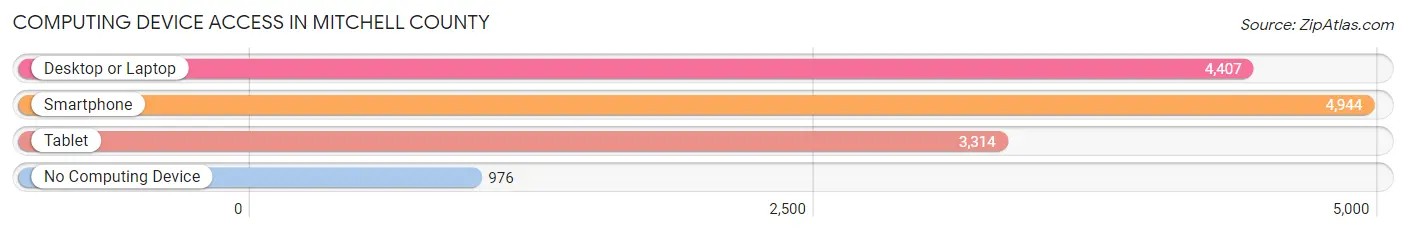
| Device Type | # Households | % Households |
| Desktop or Laptop | 4,407 | 68.0% |
| Smartphone | 4,944 | 76.3% |
| Tablet | 3,314 | 51.1% |
| No Computing Device | 976 | 15.1% |
| Total | 6,479 | 100.0% |
Internet Access in Mitchell County
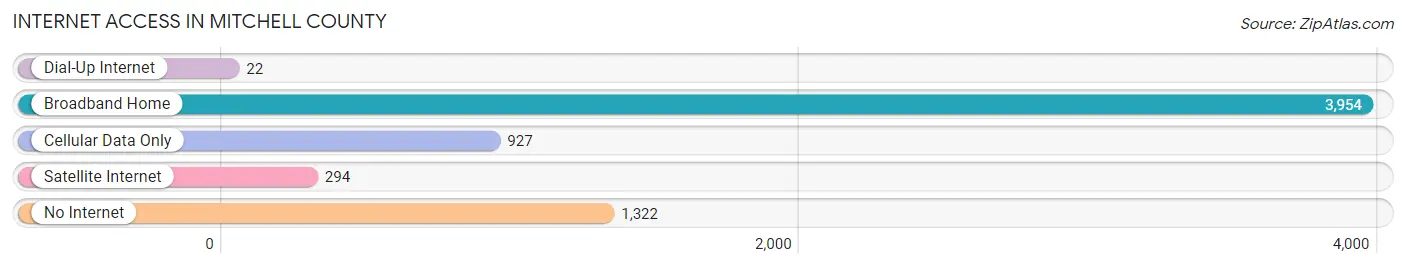
| Internet Type | # Households | % Households |
| Dial-Up Internet | 22 | 0.3% |
| Broadband Home | 3,954 | 61.0% |
| Cellular Data Only | 927 | 14.3% |
| Satellite Internet | 294 | 4.5% |
| No Internet | 1,322 | 20.4% |
| Total | 6,479 | 100.0% |
Mitchell County Summary
Mitchell County is located in the western part of North Carolina, in the Appalachian Mountains. It is bordered by Avery County to the north, Yancey County to the east, McDowell County to the south, and Burke County to the west. The county seat is Bakersville, and the county has a total area of 441 square miles.
History
Mitchell County was formed in 1861 from parts of Yancey and Burke counties. It was named for Elisha Mitchell, a professor at the University of North Carolina who was the first to measure the height of Mount Mitchell, the highest peak in the eastern United States.
The county was home to the Cherokee Indians prior to the arrival of European settlers. The first settlers arrived in the late 1700s, and the county was officially established in 1861.
During the Civil War, Mitchell County was a Confederate stronghold. The county was the site of several battles, including the Battle of Bakersville in 1863.
Geography
Mitchell County is located in the Appalachian Mountains of western North Carolina. The county is mostly mountainous, with elevations ranging from 1,000 to 6,000 feet. The highest point in the county is Mount Mitchell, which has an elevation of 6,684 feet.
The county is home to several rivers, including the Toe, Cane, and Roanoke rivers. The county also contains several lakes, including Lake Mitchell and Lake Rhodhiss.
Economy
The economy of Mitchell County is largely based on agriculture and tourism. The county is home to several farms, which produce a variety of crops, including corn, soybeans, hay, and tobacco.
The county is also home to several tourist attractions, including the Blue Ridge Parkway, the Appalachian Trail, and the Mount Mitchell State Park. These attractions bring in thousands of visitors each year, providing a boost to the local economy.
Demographics
As of the 2010 census, Mitchell County had a population of 15,579. The population was 97.2% white, 0.7% black or African American, 0.3% Native American, 0.2% Asian, 0.1% Pacific Islander, 0.7% from other races, and 0.9% from two or more races. Hispanic or Latino of any race were 1.7% of the population.
The median household income in the county was $30,945, and the median family income was $37,917. The per capita income was $17,845. About 17.2% of the population was below the poverty line.
Common Questions
What is Per Capita Income in Mitchell County?
Per Capita income in Mitchell County is $31,696.
What is the Median Family Income in Mitchell County?
Median Family Income in Mitchell County is $71,820.
What is the Median Household income in Mitchell County?
Median Household Income in Mitchell County is $55,534.
What is Income or Wage Gap in Mitchell County?
Income or Wage Gap in Mitchell County is 20.9%.
Women in Mitchell County earn 79.1 cents for every dollar earned by a man.
What is Family Income Deficit in Mitchell County?
Family Income Deficit in Mitchell County is $8,754.
Families that are below poverty line in Mitchell County earn $8,754 less on average than the poverty threshold level.
What is Inequality or Gini Index in Mitchell County?
Inequality or Gini Index in Mitchell County is 0.47.
What is the Total Population of Mitchell County?
Total Population of Mitchell County is 14,989.
What is the Total Male Population of Mitchell County?
Total Male Population of Mitchell County is 7,418.
What is the Total Female Population of Mitchell County?
Total Female Population of Mitchell County is 7,571.
What is the Ratio of Males per 100 Females in Mitchell County?
There are 97.98 Males per 100 Females in Mitchell County.
What is the Ratio of Females per 100 Males in Mitchell County?
There are 102.06 Females per 100 Males in Mitchell County.
What is the Median Population Age in Mitchell County?
Median Population Age in Mitchell County is 47.4 Years.
What is the Average Family Size in Mitchell County
Average Family Size in Mitchell County is 2.8 People.
What is the Average Household Size in Mitchell County
Average Household Size in Mitchell County is 2.2 People.
How Large is the Labor Force in Mitchell County?
There are 6,987 People in the Labor Forcein in Mitchell County.
What is the Percentage of People in the Labor Force in Mitchell County?
55.2% of People are in the Labor Force in Mitchell County.
What is the Unemployment Rate in Mitchell County?
Unemployment Rate in Mitchell County is 6.3%.