Macon County, NC Map & Demographics
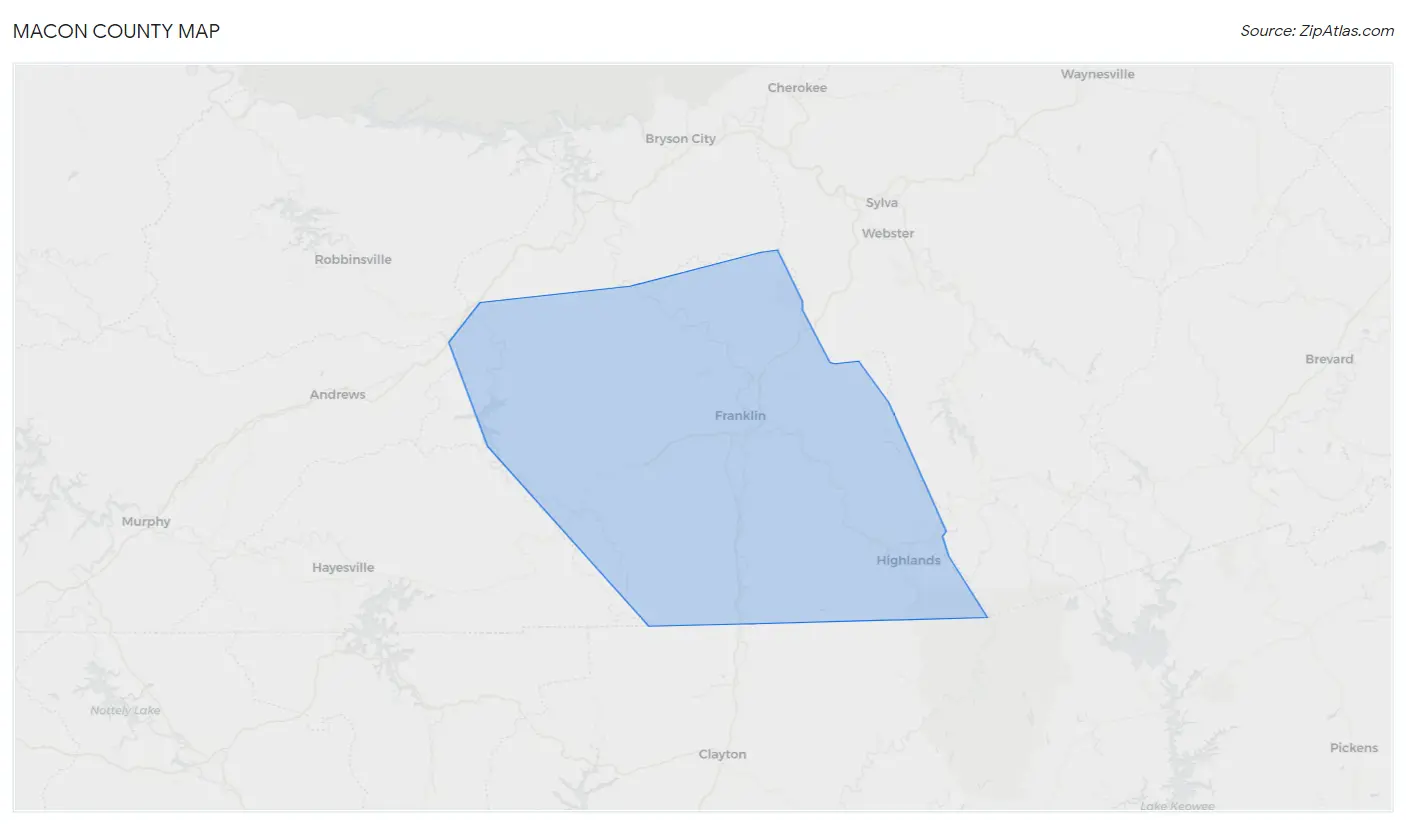
Macon County Map
Macon County Overview
$32,623
PER CAPITA INCOME
$68,113
AVG FAMILY INCOME
$51,042
AVG HOUSEHOLD INCOME
26.2%
WAGE / INCOME GAP [ % ]
73.8¢/ $1
WAGE / INCOME GAP [ $ ]
0.47
INEQUALITY / GINI INDEX
37,088
TOTAL POPULATION
18,191
MALE POPULATION
18,897
FEMALE POPULATION
96.26
MALES / 100 FEMALES
103.88
FEMALES / 100 MALES
50.6
MEDIAN AGE
2.7
AVG FAMILY SIZE
2.1
AVG HOUSEHOLD SIZE
16,290
LABOR FORCE [ PEOPLE ]
52.0%
PERCENT IN LABOR FORCE
3.5%
UNEMPLOYMENT RATE
Macon County Area Codes
Income in Macon County
Income Overview in Macon County
Per Capita Income in Macon County is $32,623, while median incomes of families and households are $68,113 and $51,042 respectively.
| Characteristic | Number | Measure |
| Per Capita Income | 37,088 | $32,623 |
| Median Family Income | 10,507 | $68,113 |
| Mean Family Income | 10,507 | $88,897 |
| Median Household Income | 17,386 | $51,042 |
| Mean Household Income | 17,386 | $70,954 |
| Income Deficit | 10,507 | $0 |
| Wage / Income Gap (%) | 37,088 | 26.21% |
| Wage / Income Gap ($) | 37,088 | 73.79¢ per $1 |
| Gini / Inequality Index | 37,088 | 0.47 |
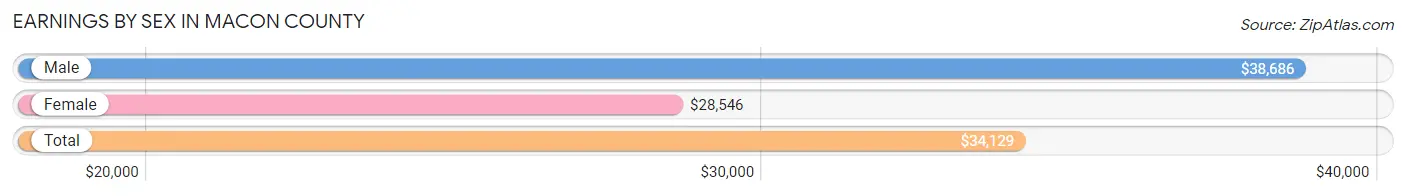
Earnings by Sex in Macon County
Average Earnings in Macon County are $34,129, $38,686 for men and $28,546 for women, a difference of 26.2%.
| Sex | Number | Average Earnings |
| Male | 9,238 (54.0%) | $38,686 |
| Female | 7,866 (46.0%) | $28,546 |
| Total | 17,104 (100.0%) | $34,129 |
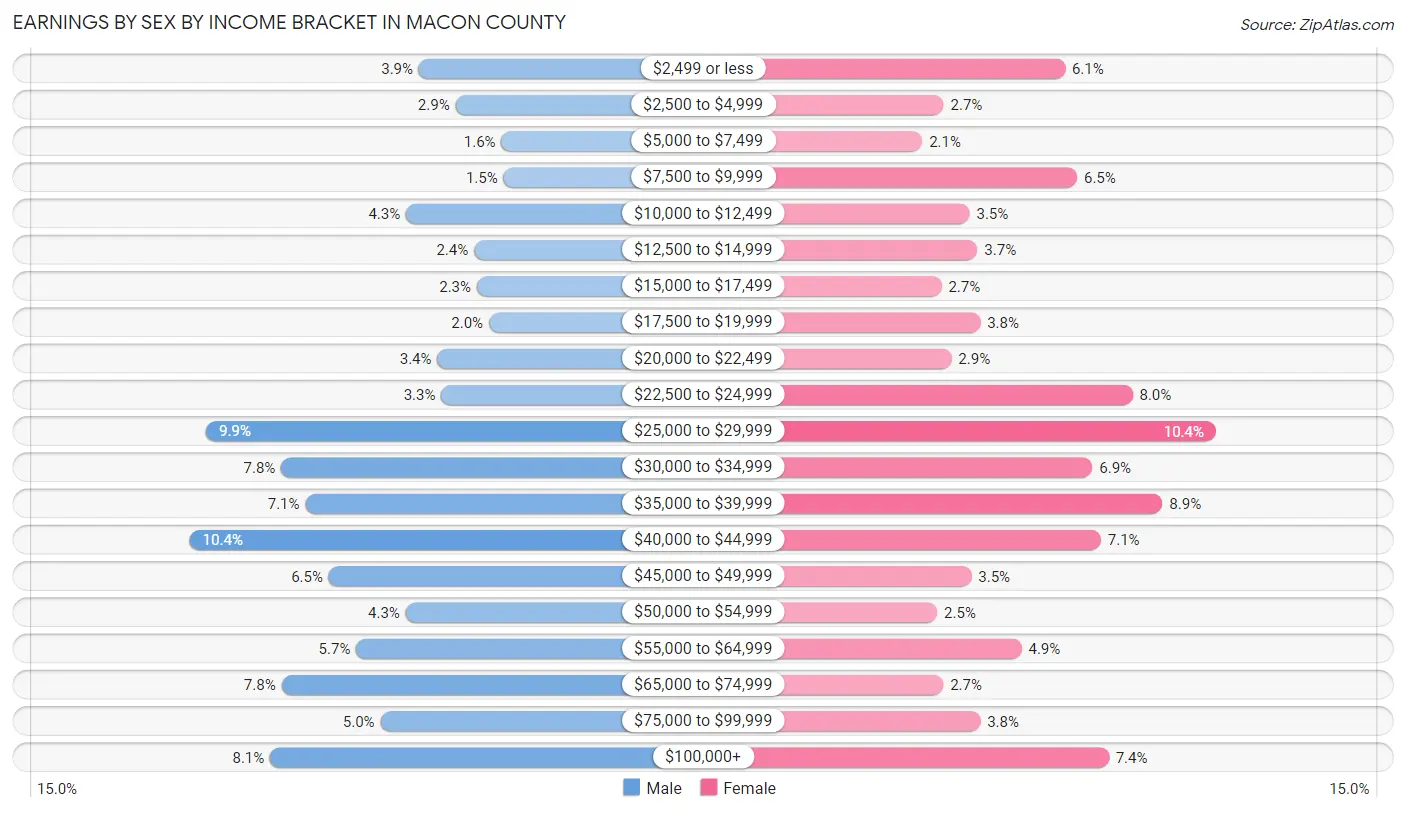
Earnings by Sex by Income Bracket in Macon County
The most common earnings brackets in Macon County are $40,000 to $44,999 for men (957 | 10.4%) and $25,000 to $29,999 for women (816 | 10.4%).
| Income | Male | Female |
| $2,499 or less | 362 (3.9%) | 482 (6.1%) |
| $2,500 to $4,999 | 267 (2.9%) | 214 (2.7%) |
| $5,000 to $7,499 | 148 (1.6%) | 167 (2.1%) |
| $7,500 to $9,999 | 142 (1.5%) | 509 (6.5%) |
| $10,000 to $12,499 | 395 (4.3%) | 271 (3.5%) |
| $12,500 to $14,999 | 219 (2.4%) | 289 (3.7%) |
| $15,000 to $17,499 | 212 (2.3%) | 209 (2.7%) |
| $17,500 to $19,999 | 180 (1.9%) | 295 (3.7%) |
| $20,000 to $22,499 | 314 (3.4%) | 231 (2.9%) |
| $22,500 to $24,999 | 304 (3.3%) | 632 (8.0%) |
| $25,000 to $29,999 | 915 (9.9%) | 816 (10.4%) |
| $30,000 to $34,999 | 720 (7.8%) | 543 (6.9%) |
| $35,000 to $39,999 | 657 (7.1%) | 698 (8.9%) |
| $40,000 to $44,999 | 957 (10.4%) | 562 (7.1%) |
| $45,000 to $49,999 | 596 (6.5%) | 275 (3.5%) |
| $50,000 to $54,999 | 396 (4.3%) | 200 (2.5%) |
| $55,000 to $64,999 | 525 (5.7%) | 386 (4.9%) |
| $65,000 to $74,999 | 719 (7.8%) | 213 (2.7%) |
| $75,000 to $99,999 | 462 (5.0%) | 295 (3.7%) |
| $100,000+ | 748 (8.1%) | 579 (7.4%) |
| Total | 9,238 (100.0%) | 7,866 (100.0%) |
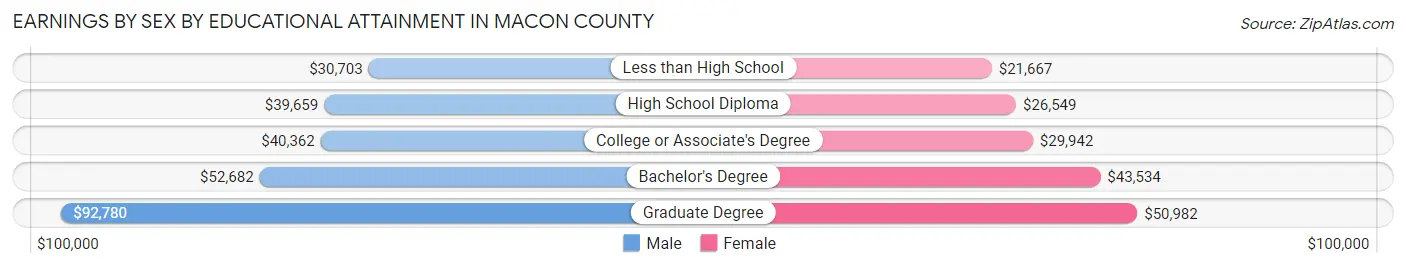
Earnings by Sex by Educational Attainment in Macon County
Average earnings in Macon County are $40,976 for men and $32,757 for women, a difference of 20.1%. Men with an educational attainment of graduate degree enjoy the highest average annual earnings of $92,780, while those with less than high school education earn the least with $30,703. Women with an educational attainment of graduate degree earn the most with the average annual earnings of $50,982, while those with less than high school education have the smallest earnings of $21,667.
| Educational Attainment | Male Income | Female Income |
| Less than High School | $30,703 | $21,667 |
| High School Diploma | $39,659 | $26,549 |
| College or Associate's Degree | $40,362 | $29,942 |
| Bachelor's Degree | $52,682 | $43,534 |
| Graduate Degree | $92,780 | $50,982 |
| Total | $40,976 | $32,757 |
Family Income in Macon County
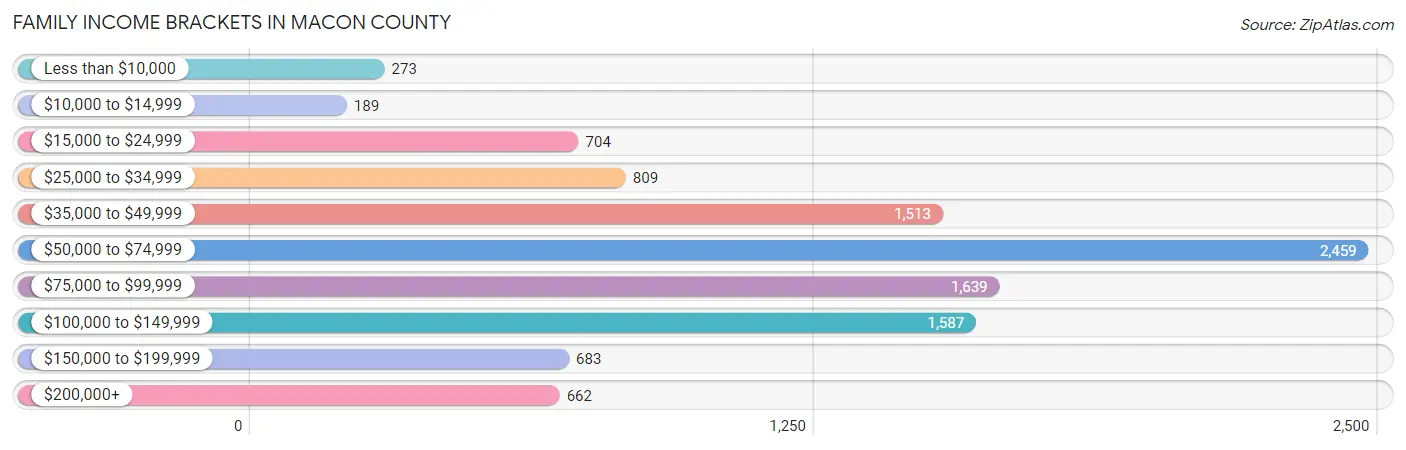
Family Income Brackets in Macon County
According to the Macon County family income data, there are 2,459 families falling into the $50,000 to $74,999 income range, which is the most common income bracket and makes up 23.4% of all families. Conversely, the $10,000 to $14,999 income bracket is the least frequent group with only 189 families (1.8%) belonging to this category.
| Income Bracket | # Families | % Families |
| Less than $10,000 | 273 | 2.6% |
| $10,000 to $14,999 | 189 | 1.8% |
| $15,000 to $24,999 | 704 | 6.7% |
| $25,000 to $34,999 | 809 | 7.7% |
| $35,000 to $49,999 | 1,513 | 14.4% |
| $50,000 to $74,999 | 2,459 | 23.4% |
| $75,000 to $99,999 | 1,639 | 15.6% |
| $100,000 to $149,999 | 1,587 | 15.1% |
| $150,000 to $199,999 | 683 | 6.5% |
| $200,000+ | 662 | 6.3% |
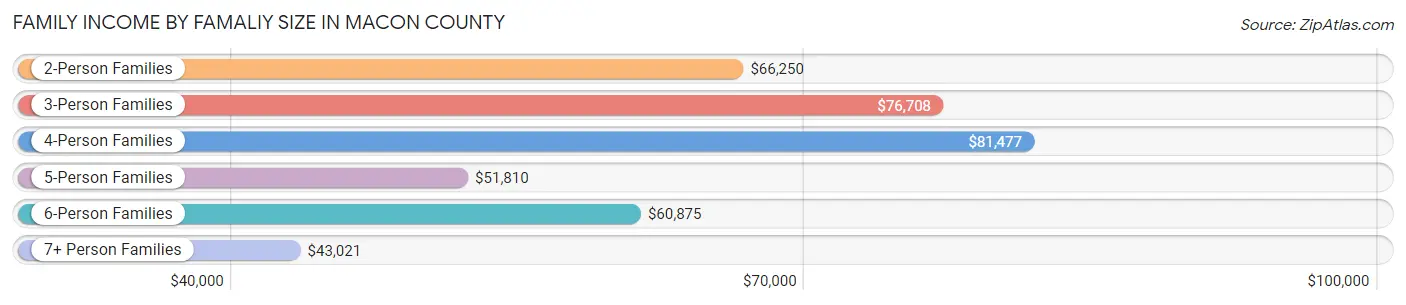
Family Income by Famaliy Size in Macon County
4-person families (1,401 | 13.3%) account for the highest median family income in Macon County with $81,477 per family, while 2-person families (6,236 | 59.4%) have the highest median income of $33,125 per family member.
| Income Bracket | # Families | Median Income |
| 2-Person Families | 6,236 (59.4%) | $66,250 |
| 3-Person Families | 1,973 (18.8%) | $76,708 |
| 4-Person Families | 1,401 (13.3%) | $81,477 |
| 5-Person Families | 708 (6.7%) | $51,810 |
| 6-Person Families | 132 (1.3%) | $60,875 |
| 7+ Person Families | 57 (0.5%) | $43,021 |
| Total | 10,507 (100.0%) | $68,113 |
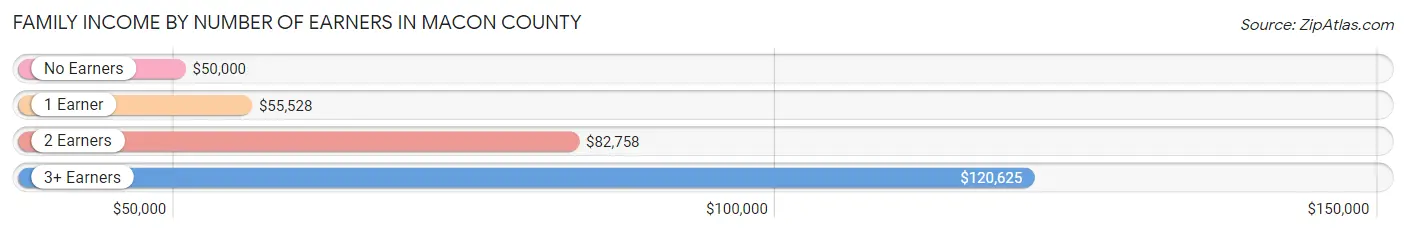
Family Income by Number of Earners in Macon County
The median family income in Macon County is $68,113, with families comprising 3+ earners (797) having the highest median family income of $120,625, while families with no earners (3,016) have the lowest median family income of $50,000, accounting for 7.6% and 28.7% of families, respectively.
| Number of Earners | # Families | Median Income |
| No Earners | 3,016 (28.7%) | $50,000 |
| 1 Earner | 2,963 (28.2%) | $55,528 |
| 2 Earners | 3,731 (35.5%) | $82,758 |
| 3+ Earners | 797 (7.6%) | $120,625 |
| Total | 10,507 (100.0%) | $68,113 |
Household Income in Macon County
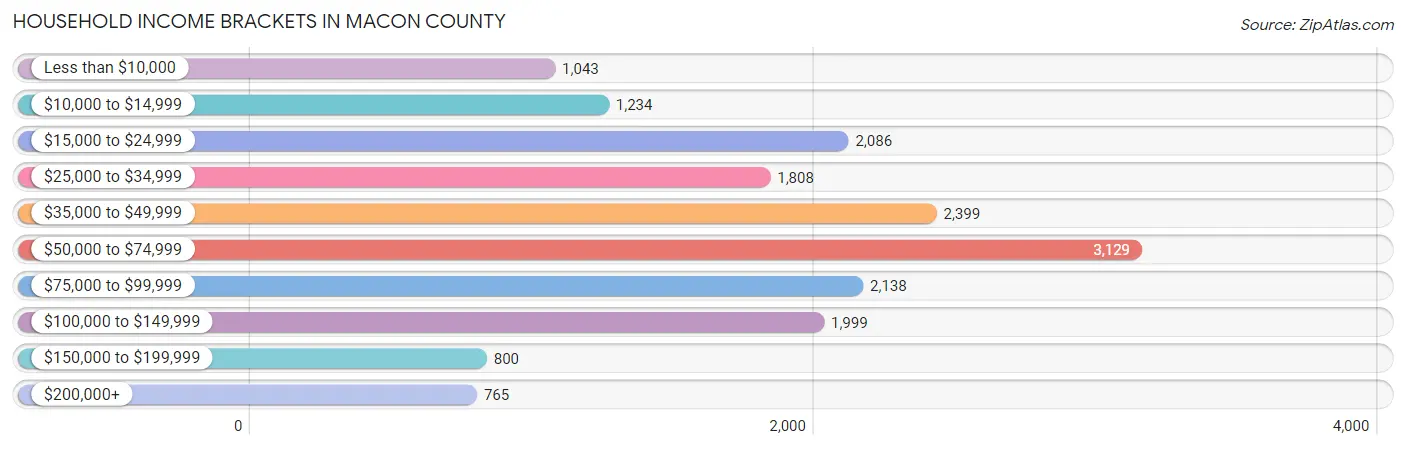
Household Income Brackets in Macon County
With 3,129 households falling in the category, the $50,000 to $74,999 income range is the most frequent in Macon County, accounting for 18.0% of all households. In contrast, only 765 households (4.4%) fall into the $200,000+ income bracket, making it the least populous group.
| Income Bracket | # Households | % Households |
| Less than $10,000 | 1,043 | 6.0% |
| $10,000 to $14,999 | 1,234 | 7.1% |
| $15,000 to $24,999 | 2,086 | 12.0% |
| $25,000 to $34,999 | 1,808 | 10.4% |
| $35,000 to $49,999 | 2,399 | 13.8% |
| $50,000 to $74,999 | 3,129 | 18.0% |
| $75,000 to $99,999 | 2,138 | 12.3% |
| $100,000 to $149,999 | 1,999 | 11.5% |
| $150,000 to $199,999 | 800 | 4.6% |
| $200,000+ | 765 | 4.4% |
Household Income by Householder Age in Macon County
The median household income in Macon County is $51,042, with the highest median household income of $66,565 found in the 25 to 44 years age bracket for the primary householder. A total of 3,561 households (20.5%) fall into this category. Meanwhile, the 15 to 24 years age bracket for the primary householder has the lowest median household income of $40,593, with 749 households (4.3%) in this group.
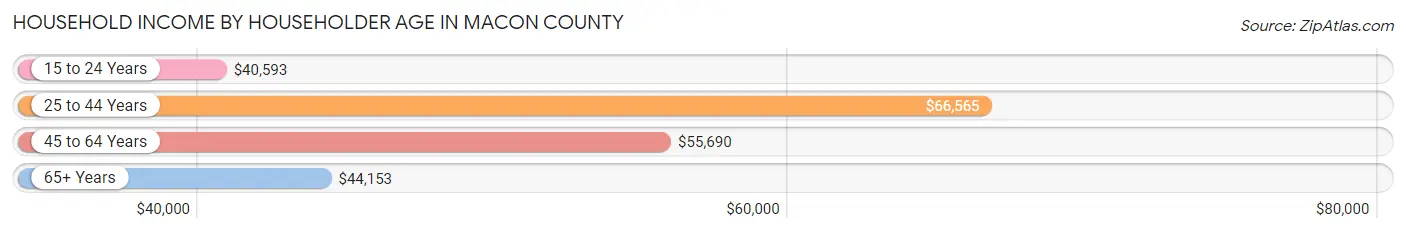
| Income Bracket | # Households | Median Income |
| 15 to 24 Years | 749 (4.3%) | $40,593 |
| 25 to 44 Years | 3,561 (20.5%) | $66,565 |
| 45 to 64 Years | 6,222 (35.8%) | $55,690 |
| 65+ Years | 6,854 (39.4%) | $44,153 |
| Total | 17,386 (100.0%) | $51,042 |
Poverty in Macon County
Income Below Poverty by Sex and Age in Macon County
With 12.7% poverty level for males and 18.0% for females among the residents of Macon County, 16 and 17 year old males and 6 to 11 year old females are the most vulnerable to poverty, with 172 males (39.6%) and 332 females (31.6%) in their respective age groups living below the poverty level.
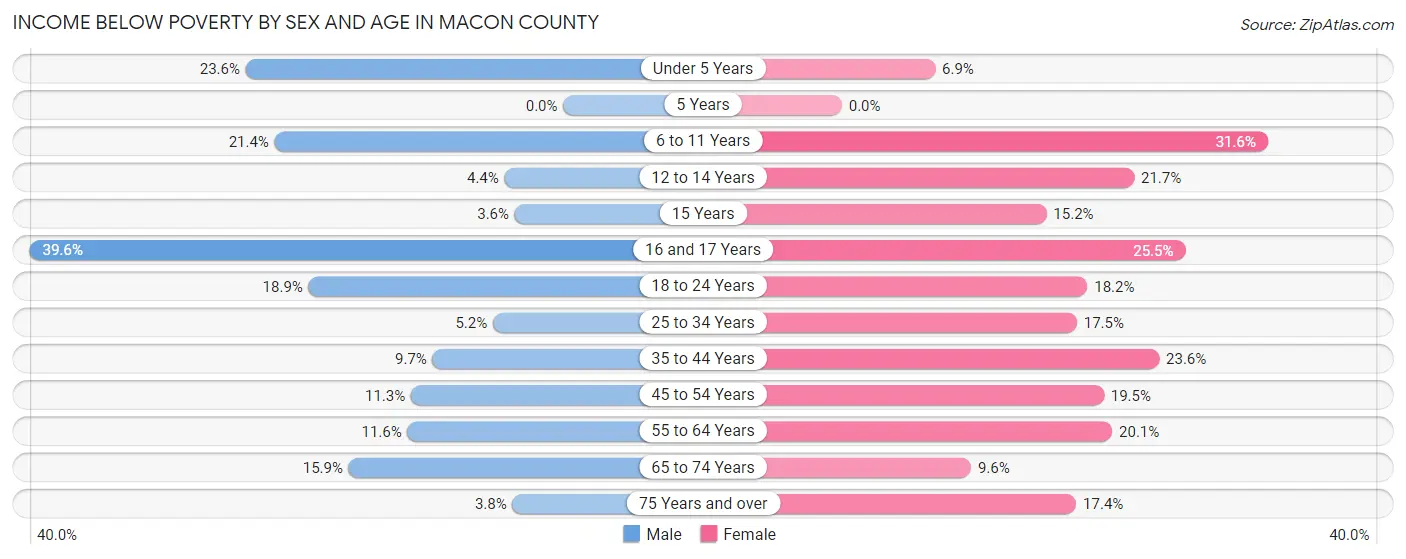
| Age Bracket | Male | Female |
| Under 5 Years | 229 (23.6%) | 45 (6.9%) |
| 5 Years | 0 (0.0%) | 0 (0.0%) |
| 6 to 11 Years | 239 (21.4%) | 332 (31.6%) |
| 12 to 14 Years | 26 (4.4%) | 133 (21.7%) |
| 15 Years | 8 (3.6%) | 41 (15.2%) |
| 16 and 17 Years | 172 (39.6%) | 102 (25.5%) |
| 18 to 24 Years | 256 (18.9%) | 214 (18.2%) |
| 25 to 34 Years | 88 (5.2%) | 336 (17.4%) |
| 35 to 44 Years | 175 (9.7%) | 432 (23.6%) |
| 45 to 54 Years | 239 (11.3%) | 396 (19.5%) |
| 55 to 64 Years | 329 (11.6%) | 591 (20.1%) |
| 65 to 74 Years | 455 (15.9%) | 318 (9.6%) |
| 75 Years and over | 73 (3.8%) | 432 (17.4%) |
| Total | 2,289 (12.7%) | 3,372 (18.0%) |
Income Above Poverty by Sex and Age in Macon County
According to the poverty statistics in Macon County, males aged 5 years and females aged 5 years are the age groups that are most secure financially, with 100.0% of males and 100.0% of females in these age groups living above the poverty line.
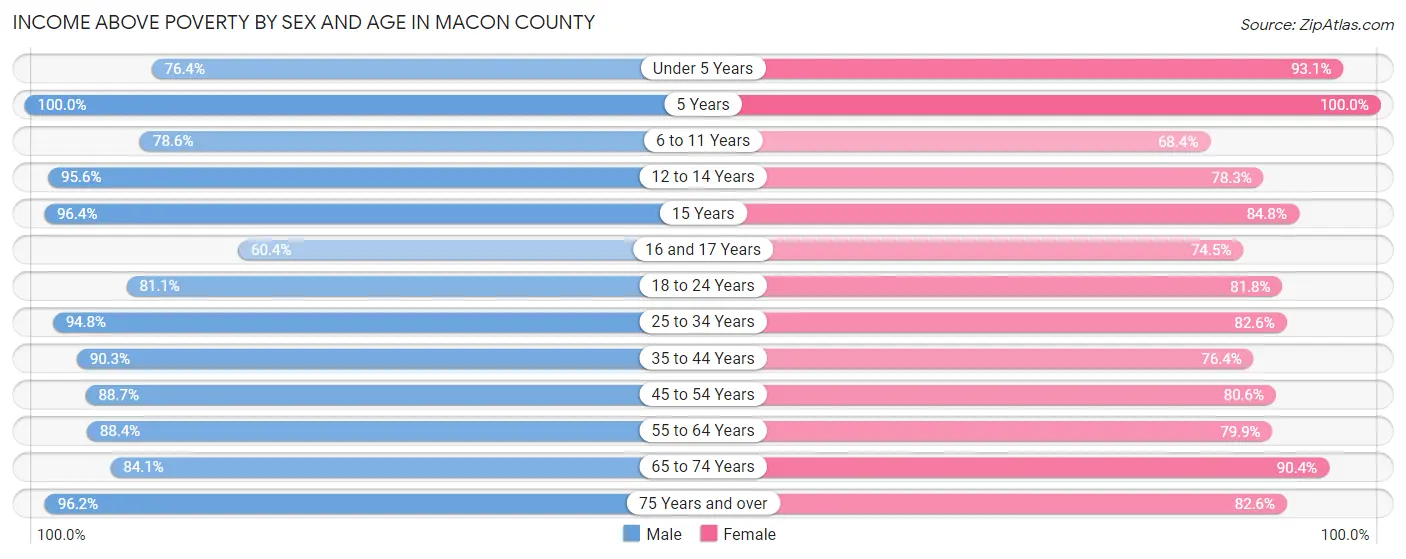
| Age Bracket | Male | Female |
| Under 5 Years | 742 (76.4%) | 604 (93.1%) |
| 5 Years | 31 (100.0%) | 40 (100.0%) |
| 6 to 11 Years | 876 (78.6%) | 718 (68.4%) |
| 12 to 14 Years | 570 (95.6%) | 480 (78.3%) |
| 15 Years | 214 (96.4%) | 229 (84.8%) |
| 16 and 17 Years | 262 (60.4%) | 298 (74.5%) |
| 18 to 24 Years | 1,098 (81.1%) | 960 (81.8%) |
| 25 to 34 Years | 1,599 (94.8%) | 1,589 (82.6%) |
| 35 to 44 Years | 1,630 (90.3%) | 1,402 (76.4%) |
| 45 to 54 Years | 1,875 (88.7%) | 1,640 (80.5%) |
| 55 to 64 Years | 2,514 (88.4%) | 2,353 (79.9%) |
| 65 to 74 Years | 2,401 (84.1%) | 2,998 (90.4%) |
| 75 Years and over | 1,864 (96.2%) | 2,051 (82.6%) |
| Total | 15,676 (87.3%) | 15,362 (82.0%) |
Income Below Poverty Among Married-Couple Families in Macon County
The poverty statistics for married-couple families in Macon County show that 5.8% or 495 of the total 8,521 families live below the poverty line. Families with 5 or more children have the highest poverty rate of 66.7%, comprising of 38 families. On the other hand, families with no children have the lowest poverty rate of 4.9%, which includes 281 families.
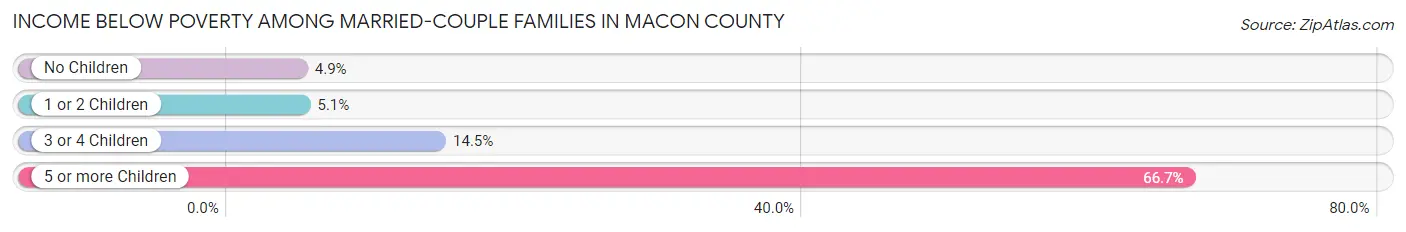
| Children | Above Poverty | Below Poverty |
| No Children | 5,496 (95.1%) | 281 (4.9%) |
| 1 or 2 Children | 2,145 (95.0%) | 114 (5.1%) |
| 3 or 4 Children | 366 (85.5%) | 62 (14.5%) |
| 5 or more Children | 19 (33.3%) | 38 (66.7%) |
| Total | 8,026 (94.2%) | 495 (5.8%) |
Income Below Poverty Among Single-Parent Households in Macon County
According to the poverty data in Macon County, 3.5% or 20 single-father households and 34.7% or 491 single-mother households are living below the poverty line. Among single-father households, those with 3 or 4 children have the highest poverty rate, with 20 households (35.7%) experiencing poverty. Likewise, among single-mother households, those with 3 or 4 children have the highest poverty rate, with 105 households (77.2%) falling below the poverty line.
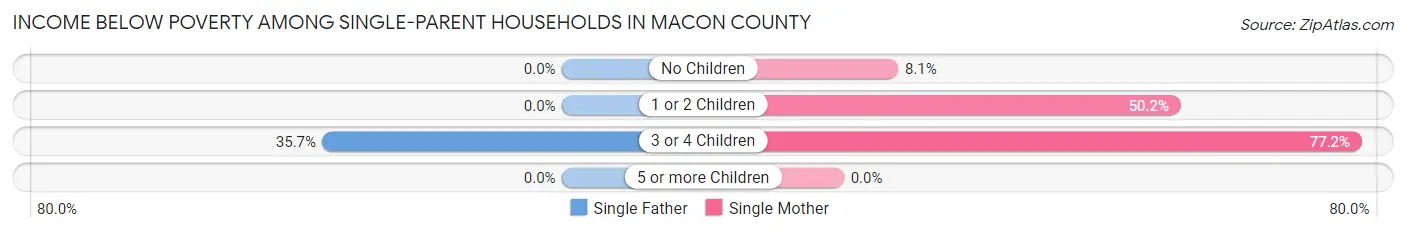
| Children | Single Father | Single Mother |
| No Children | 0 (0.0%) | 49 (8.1%) |
| 1 or 2 Children | 0 (0.0%) | 337 (50.2%) |
| 3 or 4 Children | 20 (35.7%) | 105 (77.2%) |
| 5 or more Children | 0 (0.0%) | 0 (0.0%) |
| Total | 20 (3.5%) | 491 (34.7%) |
Income Below Poverty Among Married-Couple vs Single-Parent Households in Macon County
The poverty data for Macon County shows that 495 of the married-couple family households (5.8%) and 511 of the single-parent households (25.7%) are living below the poverty level. Within the married-couple family households, those with 5 or more children have the highest poverty rate, with 38 households (66.7%) falling below the poverty line. Among the single-parent households, those with 3 or 4 children have the highest poverty rate, with 125 household (65.1%) living below poverty.
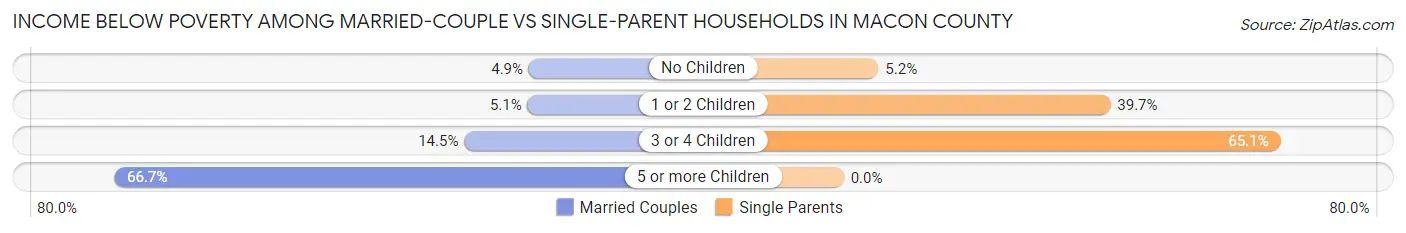
| Children | Married-Couple Families | Single-Parent Households |
| No Children | 281 (4.9%) | 49 (5.2%) |
| 1 or 2 Children | 114 (5.1%) | 337 (39.7%) |
| 3 or 4 Children | 62 (14.5%) | 125 (65.1%) |
| 5 or more Children | 38 (66.7%) | 0 (0.0%) |
| Total | 495 (5.8%) | 511 (25.7%) |
Race in Macon County
The most populous races in Macon County are White / Caucasian (33,707 | 90.9%), Hispanic or Latino (2,918 | 7.9%), and Some other Race (1,325 | 3.6%).
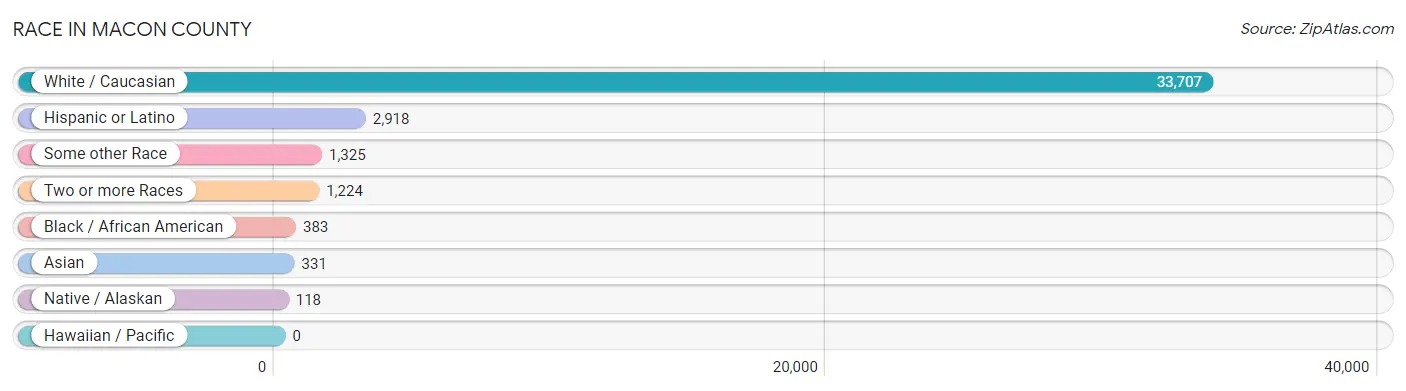
| Race | # Population | % Population |
| Asian | 331 | 0.9% |
| Black / African American | 383 | 1.0% |
| Hawaiian / Pacific | 0 | 0.0% |
| Hispanic or Latino | 2,918 | 7.9% |
| Native / Alaskan | 118 | 0.3% |
| White / Caucasian | 33,707 | 90.9% |
| Two or more Races | 1,224 | 3.3% |
| Some other Race | 1,325 | 3.6% |
| Total | 37,088 | 100.0% |
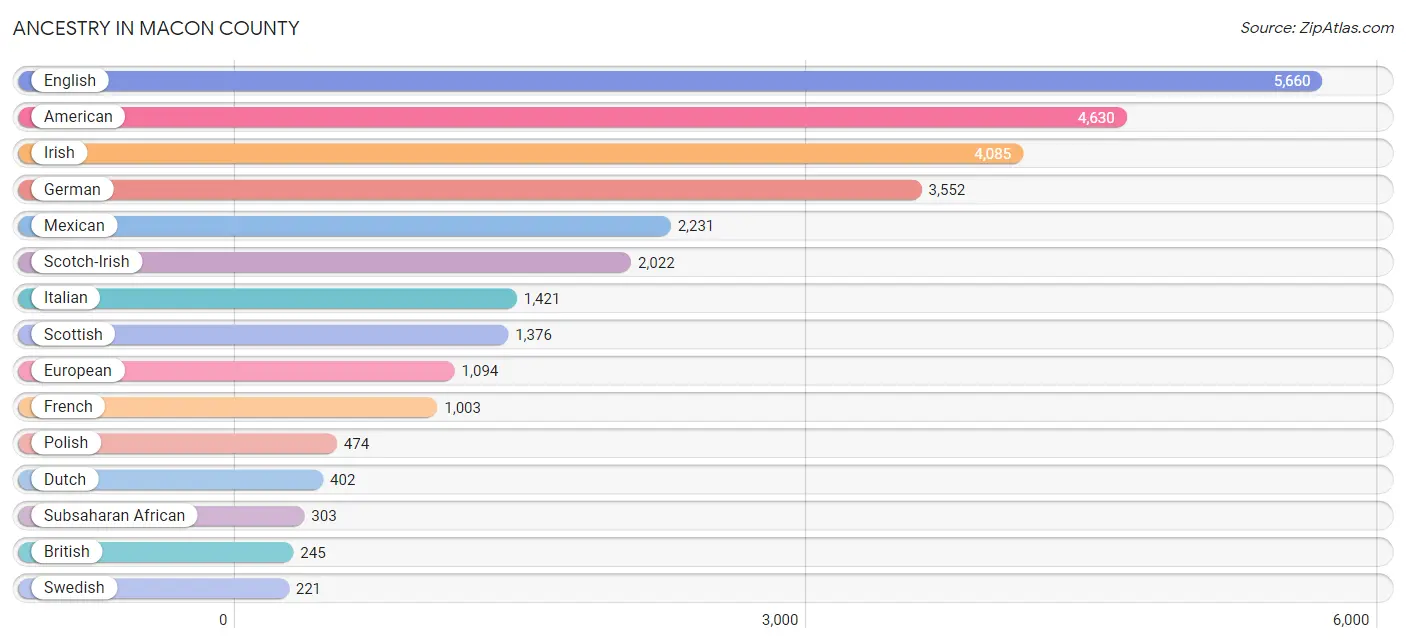
Ancestry in Macon County
The most populous ancestries reported in Macon County are English (5,660 | 15.3%), American (4,630 | 12.5%), Irish (4,085 | 11.0%), German (3,552 | 9.6%), and Mexican (2,231 | 6.0%), together accounting for 54.3% of all Macon County residents.
| Ancestry | # Population | % Population |
| African | 133 | 0.4% |
| American | 4,630 | 12.5% |
| Arab | 105 | 0.3% |
| Australian | 29 | 0.1% |
| Austrian | 22 | 0.1% |
| Bhutanese | 102 | 0.3% |
| Brazilian | 22 | 0.1% |
| British | 245 | 0.7% |
| Cajun | 71 | 0.2% |
| Canadian | 60 | 0.2% |
| Central American | 50 | 0.1% |
| Central American Indian | 7 | 0.0% |
| Cherokee | 163 | 0.4% |
| Choctaw | 4 | 0.0% |
| Colombian | 134 | 0.4% |
| Costa Rican | 44 | 0.1% |
| Cuban | 87 | 0.2% |
| Czech | 22 | 0.1% |
| Czechoslovakian | 77 | 0.2% |
| Danish | 41 | 0.1% |
| Dominican | 96 | 0.3% |
| Dutch | 402 | 1.1% |
| Eastern European | 35 | 0.1% |
| English | 5,660 | 15.3% |
| Ethiopian | 39 | 0.1% |
| European | 1,094 | 2.9% |
| Finnish | 70 | 0.2% |
| French | 1,003 | 2.7% |
| French Canadian | 157 | 0.4% |
| German | 3,552 | 9.6% |
| Greek | 89 | 0.2% |
| Guatemalan | 6 | 0.0% |
| Hungarian | 162 | 0.4% |
| Indian (Asian) | 119 | 0.3% |
| Irish | 4,085 | 11.0% |
| Iroquois | 11 | 0.0% |
| Italian | 1,421 | 3.8% |
| Korean | 114 | 0.3% |
| Latvian | 21 | 0.1% |
| Lebanese | 16 | 0.0% |
| Lithuanian | 49 | 0.1% |
| Lumbee | 6 | 0.0% |
| Maltese | 10 | 0.0% |
| Mexican | 2,231 | 6.0% |
| Nigerian | 101 | 0.3% |
| Northern European | 20 | 0.1% |
| Norwegian | 86 | 0.2% |
| Polish | 474 | 1.3% |
| Portuguese | 25 | 0.1% |
| Puerto Rican | 216 | 0.6% |
| Russian | 106 | 0.3% |
| Scandinavian | 87 | 0.2% |
| Scotch-Irish | 2,022 | 5.4% |
| Scottish | 1,376 | 3.7% |
| Slavic | 7 | 0.0% |
| Slovak | 31 | 0.1% |
| South African | 30 | 0.1% |
| South American | 137 | 0.4% |
| Spaniard | 22 | 0.1% |
| Spanish | 7 | 0.0% |
| Sri Lankan | 119 | 0.3% |
| Subsaharan African | 303 | 0.8% |
| Swedish | 221 | 0.6% |
| Swiss | 75 | 0.2% |
| Syrian | 19 | 0.1% |
| Thai | 14 | 0.0% |
| Ukrainian | 15 | 0.0% |
| Venezuelan | 3 | 0.0% |
| Welsh | 102 | 0.3% | View All 69 Rows |
Immigrants in Macon County
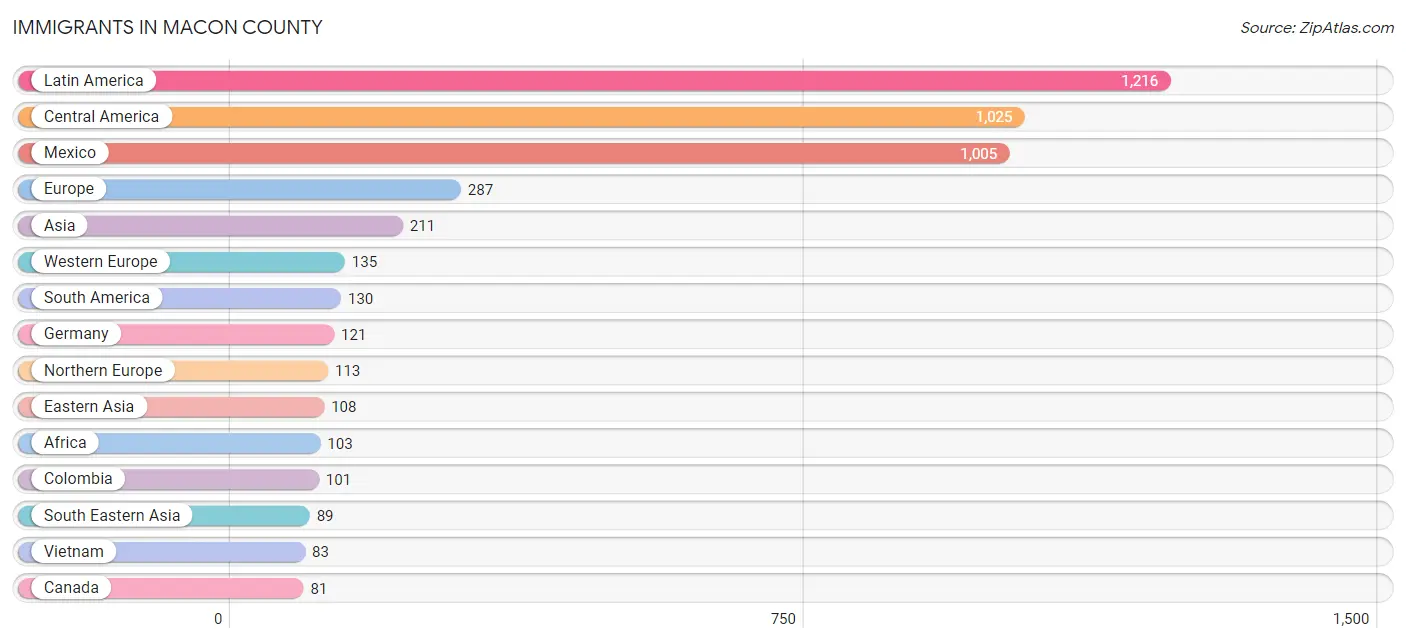
The most numerous immigrant groups reported in Macon County came from Latin America (1,216 | 3.3%), Central America (1,025 | 2.8%), Mexico (1,005 | 2.7%), Europe (287 | 0.8%), and Asia (211 | 0.6%), together accounting for 10.1% of all Macon County residents.
| Immigration Origin | # Population | % Population |
| Africa | 103 | 0.3% |
| Asia | 211 | 0.6% |
| Australia | 10 | 0.0% |
| Brazil | 22 | 0.1% |
| Canada | 81 | 0.2% |
| Caribbean | 61 | 0.2% |
| Central America | 1,025 | 2.8% |
| China | 34 | 0.1% |
| Colombia | 101 | 0.3% |
| Costa Rica | 7 | 0.0% |
| Cuba | 59 | 0.2% |
| Czechoslovakia | 3 | 0.0% |
| Dominican Republic | 2 | 0.0% |
| Eastern Africa | 58 | 0.2% |
| Eastern Asia | 108 | 0.3% |
| Eastern Europe | 32 | 0.1% |
| England | 15 | 0.0% |
| Ethiopia | 39 | 0.1% |
| Europe | 287 | 0.8% |
| France | 14 | 0.0% |
| Germany | 121 | 0.3% |
| Guatemala | 13 | 0.0% |
| Hungary | 8 | 0.0% |
| India | 14 | 0.0% |
| Italy | 7 | 0.0% |
| Japan | 74 | 0.2% |
| Kenya | 19 | 0.1% |
| Latin America | 1,216 | 3.3% |
| Mexico | 1,005 | 2.7% |
| Northern Africa | 12 | 0.0% |
| Northern Europe | 113 | 0.3% |
| Oceania | 10 | 0.0% |
| Peru | 4 | 0.0% |
| Poland | 18 | 0.1% |
| Russia | 3 | 0.0% |
| Scotland | 3 | 0.0% |
| Singapore | 6 | 0.0% |
| South Africa | 33 | 0.1% |
| South America | 130 | 0.4% |
| South Central Asia | 14 | 0.0% |
| South Eastern Asia | 89 | 0.2% |
| Southern Europe | 7 | 0.0% |
| Sweden | 9 | 0.0% |
| Venezuela | 3 | 0.0% |
| Vietnam | 83 | 0.2% |
| Western Europe | 135 | 0.4% | View All 46 Rows |
Sex and Age in Macon County
Sex and Age in Macon County
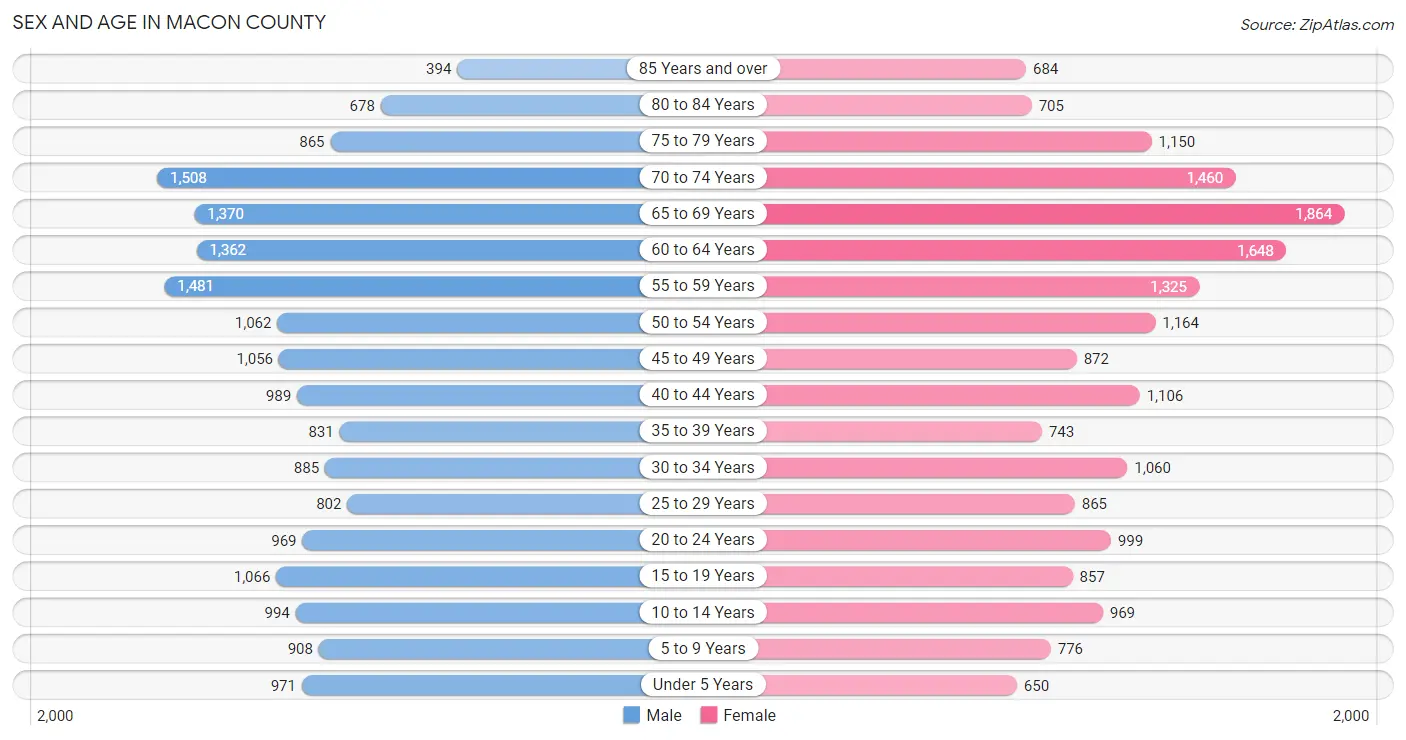
The most populous age groups in Macon County are 70 to 74 Years (1,508 | 8.3%) for men and 65 to 69 Years (1,864 | 9.9%) for women.
| Age Bracket | Male | Female |
| Under 5 Years | 971 (5.3%) | 650 (3.4%) |
| 5 to 9 Years | 908 (5.0%) | 776 (4.1%) |
| 10 to 14 Years | 994 (5.5%) | 969 (5.1%) |
| 15 to 19 Years | 1,066 (5.9%) | 857 (4.5%) |
| 20 to 24 Years | 969 (5.3%) | 999 (5.3%) |
| 25 to 29 Years | 802 (4.4%) | 865 (4.6%) |
| 30 to 34 Years | 885 (4.9%) | 1,060 (5.6%) |
| 35 to 39 Years | 831 (4.6%) | 743 (3.9%) |
| 40 to 44 Years | 989 (5.4%) | 1,106 (5.9%) |
| 45 to 49 Years | 1,056 (5.8%) | 872 (4.6%) |
| 50 to 54 Years | 1,062 (5.8%) | 1,164 (6.2%) |
| 55 to 59 Years | 1,481 (8.1%) | 1,325 (7.0%) |
| 60 to 64 Years | 1,362 (7.5%) | 1,648 (8.7%) |
| 65 to 69 Years | 1,370 (7.5%) | 1,864 (9.9%) |
| 70 to 74 Years | 1,508 (8.3%) | 1,460 (7.7%) |
| 75 to 79 Years | 865 (4.8%) | 1,150 (6.1%) |
| 80 to 84 Years | 678 (3.7%) | 705 (3.7%) |
| 85 Years and over | 394 (2.2%) | 684 (3.6%) |
| Total | 18,191 (100.0%) | 18,897 (100.0%) |
Families and Households in Macon County
Median Family Size in Macon County
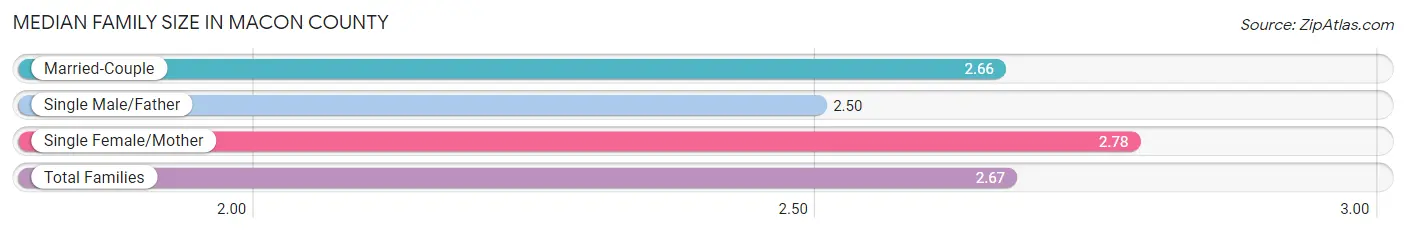
The median family size in Macon County is 2.67 persons per family, with single female/mother families (1,413 | 13.5%) accounting for the largest median family size of 2.78 persons per family. On the other hand, single male/father families (573 | 5.4%) represent the smallest median family size with 2.50 persons per family.
| Family Type | # Families | Family Size |
| Married-Couple | 8,521 (81.1%) | 2.66 |
| Single Male/Father | 573 (5.4%) | 2.50 |
| Single Female/Mother | 1,413 (13.5%) | 2.78 |
| Total Families | 10,507 (100.0%) | 2.67 |
Median Household Size in Macon County
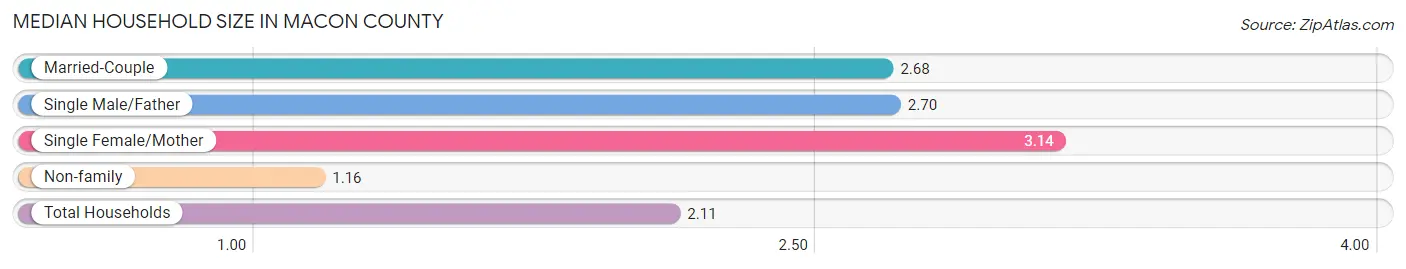
The median household size in Macon County is 2.11 persons per household, with single female/mother households (1,413 | 8.1%) accounting for the largest median household size of 3.14 persons per household. non-family households (6,879 | 39.6%) represent the smallest median household size with 1.16 persons per household.
| Household Type | # Households | Household Size |
| Married-Couple | 8,521 (49.0%) | 2.68 |
| Single Male/Father | 573 (3.3%) | 2.70 |
| Single Female/Mother | 1,413 (8.1%) | 3.14 |
| Non-family | 6,879 (39.6%) | 1.16 |
| Total Households | 17,386 (100.0%) | 2.11 |
Household Size by Marriage Status in Macon County
Out of a total of 17,386 households in Macon County, 10,507 (60.4%) are family households, while 6,879 (39.6%) are nonfamily households. The most numerous type of family households are 2-person households, comprising 5,730, and the most common type of nonfamily households are 1-person households, comprising 5,802.
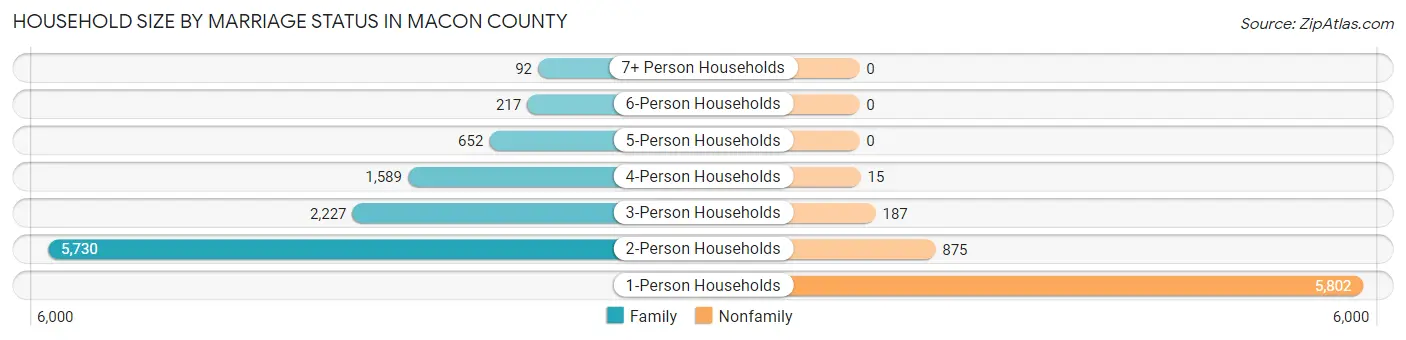
| Household Size | Family Households | Nonfamily Households |
| 1-Person Households | - | 5,802 (33.4%) |
| 2-Person Households | 5,730 (33.0%) | 875 (5.0%) |
| 3-Person Households | 2,227 (12.8%) | 187 (1.1%) |
| 4-Person Households | 1,589 (9.1%) | 15 (0.1%) |
| 5-Person Households | 652 (3.7%) | 0 (0.0%) |
| 6-Person Households | 217 (1.3%) | 0 (0.0%) |
| 7+ Person Households | 92 (0.5%) | 0 (0.0%) |
| Total | 10,507 (60.4%) | 6,879 (39.6%) |
Female Fertility in Macon County
Fertility by Age in Macon County
Average fertility rate in Macon County is 52.0 births per 1,000 women. Women in the age bracket of 20 to 34 years have the highest fertility rate with 97.0 births per 1,000 women. Women in the age bracket of 20 to 34 years acount for 82.6% of all women with births.
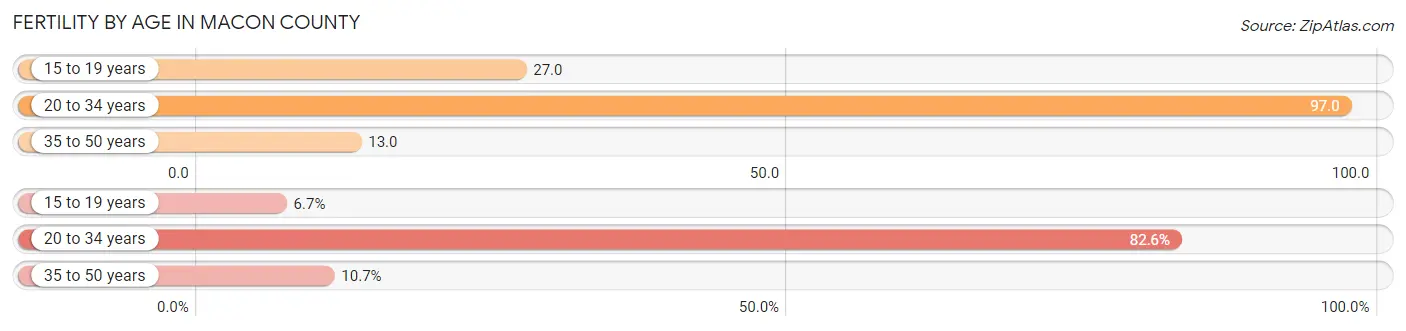
| Age Bracket | Women with Births | Births / 1,000 Women |
| 15 to 19 years | 23 (6.7%) | 27.0 |
| 20 to 34 years | 285 (82.6%) | 97.0 |
| 35 to 50 years | 37 (10.7%) | 13.0 |
| Total | 345 (100.0%) | 52.0 |
Fertility by Age by Marriage Status in Macon County
81.4% of women with births (345) in Macon County are married. The highest percentage of unmarried women with births falls into 15 to 19 years age bracket with 100.0% of them unmarried at the time of birth, while the lowest percentage of unmarried women with births belong to 20 to 34 years age bracket with 11.2% of them unmarried.
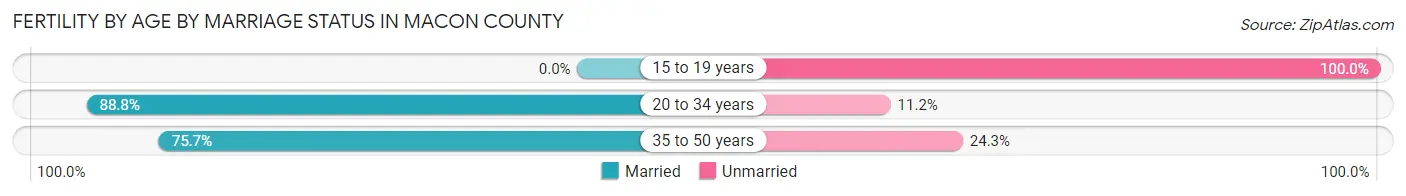
| Age Bracket | Married | Unmarried |
| 15 to 19 years | 0 (0.0%) | 23 (100.0%) |
| 20 to 34 years | 253 (88.8%) | 32 (11.2%) |
| 35 to 50 years | 28 (75.7%) | 9 (24.3%) |
| Total | 281 (81.5%) | 64 (18.5%) |
Fertility by Education in Macon County
Average fertility rate in Macon County is 52.0 births per 1,000 women. Women with the education attainment of college or associate's degree have the highest fertility rate of 80.0 births per 1,000 women, while women with the education attainment of bachelor's degree have the lowest fertility at 3.0 births per 1,000 women. Women with the education attainment of college or associate's degree represent 64.1% of all women with births.
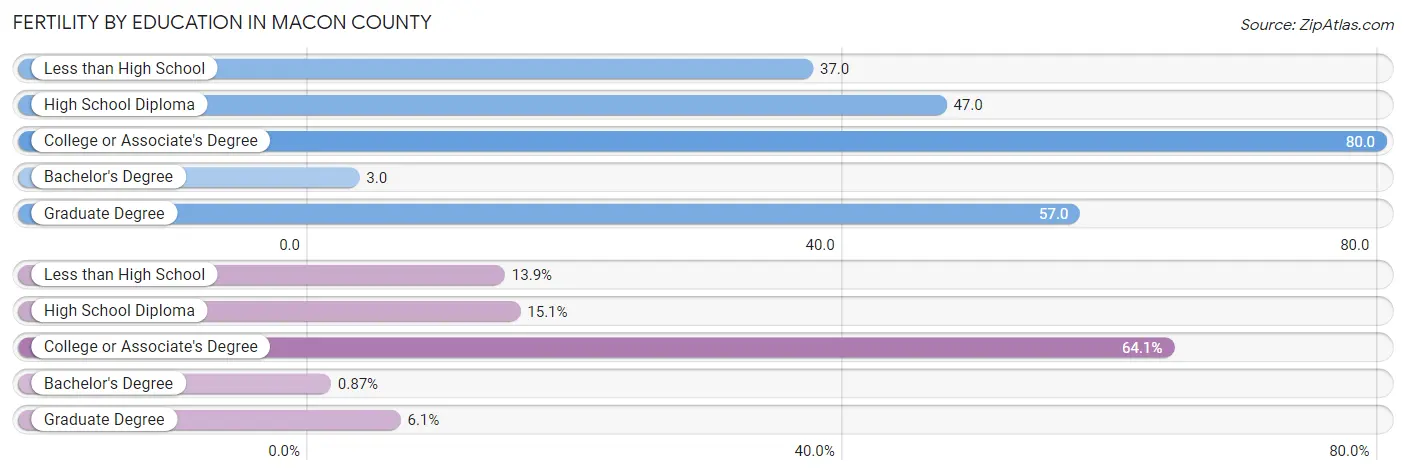
| Educational Attainment | Women with Births | Births / 1,000 Women |
| Less than High School | 48 (13.9%) | 37.0 |
| High School Diploma | 52 (15.1%) | 47.0 |
| College or Associate's Degree | 221 (64.1%) | 80.0 |
| Bachelor's Degree | 3 (0.9%) | 3.0 |
| Graduate Degree | 21 (6.1%) | 57.0 |
| Total | 345 (100.0%) | 52.0 |
Fertility by Education by Marriage Status in Macon County
18.5% of women with births in Macon County are unmarried. Women with the educational attainment of high school diploma are most likely to be married with 100.0% of them married at childbirth, while women with the educational attainment of less than high school are least likely to be married with 68.8% of them unmarried at childbirth.
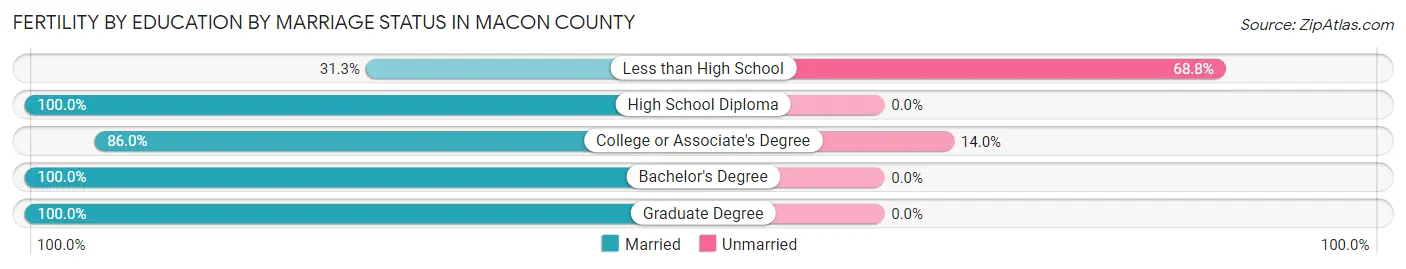
| Educational Attainment | Married | Unmarried |
| Less than High School | 15 (31.2%) | 33 (68.8%) |
| High School Diploma | 52 (100.0%) | 0 (0.0%) |
| College or Associate's Degree | 190 (86.0%) | 31 (14.0%) |
| Bachelor's Degree | 3 (100.0%) | 0 (0.0%) |
| Graduate Degree | 21 (100.0%) | 0 (0.0%) |
| Total | 281 (81.5%) | 64 (18.5%) |
Employment Characteristics in Macon County
Employment by Class of Employer in Macon County
Among the 15,362 employed individuals in Macon County, private company employees (9,763 | 63.5%), local government employees (1,372 | 8.9%), and self-employed (not incorporated) (1,118 | 7.3%) make up the most common classes of employment.
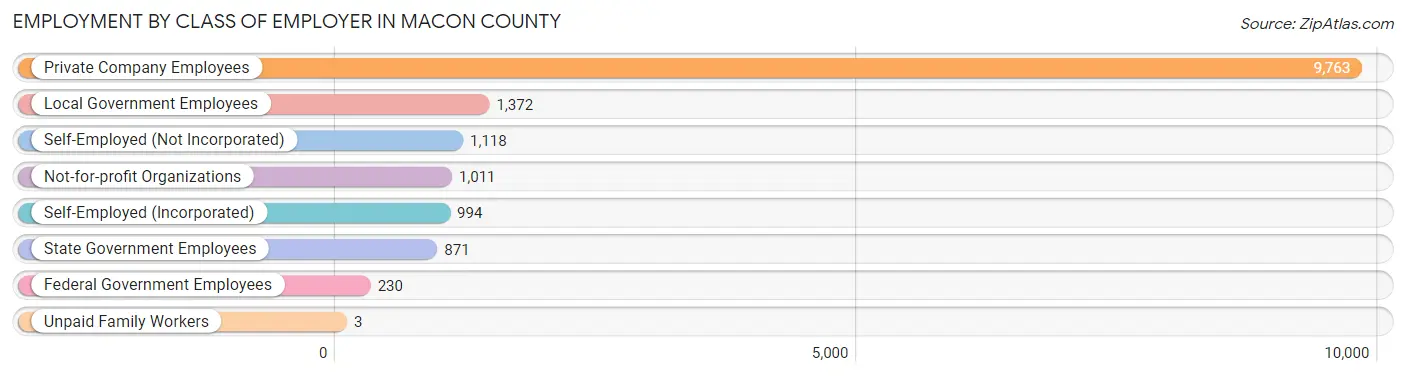
| Employer Class | # Employees | % Employees |
| Private Company Employees | 9,763 | 63.5% |
| Self-Employed (Incorporated) | 994 | 6.5% |
| Self-Employed (Not Incorporated) | 1,118 | 7.3% |
| Not-for-profit Organizations | 1,011 | 6.6% |
| Local Government Employees | 1,372 | 8.9% |
| State Government Employees | 871 | 5.7% |
| Federal Government Employees | 230 | 1.5% |
| Unpaid Family Workers | 3 | 0.0% |
| Total | 15,362 | 100.0% |
Employment Status by Age in Macon County
According to the labor force statistics for Macon County, out of the total population over 16 years of age (31,327), 52.0% or 16,290 individuals are in the labor force, with 3.5% or 570 of them unemployed. The age group with the highest labor force participation rate is 25 to 29 years, with 88.8% or 1,480 individuals in the labor force. Within the labor force, the 16 to 19 years age range has the highest percentage of unemployed individuals, with 8.2% or 48 of them being unemployed.
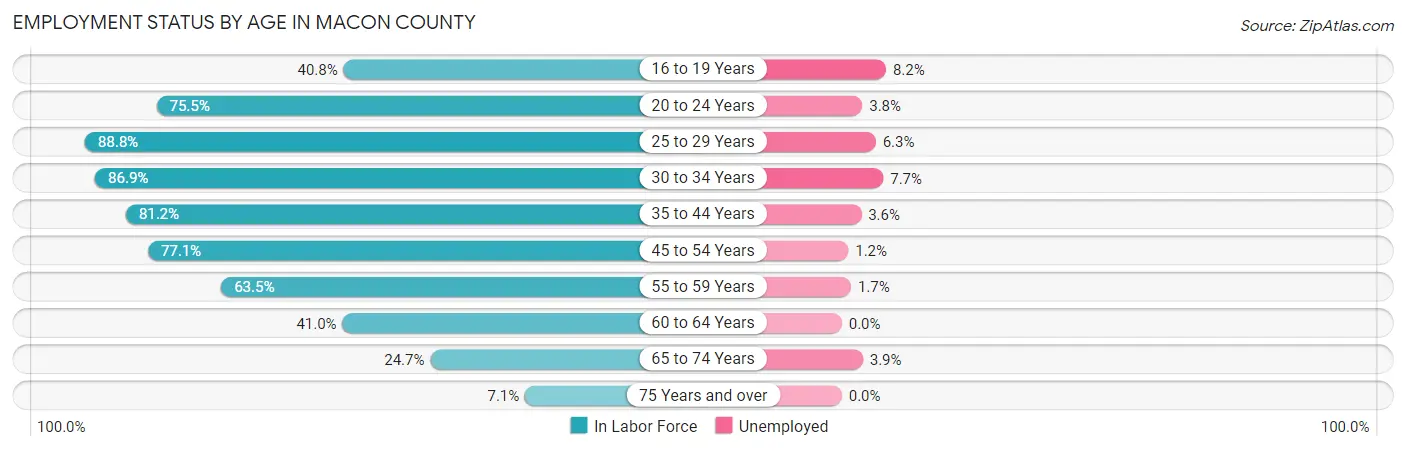
| Age Bracket | In Labor Force | Unemployed |
| 16 to 19 Years | 583 (40.8%) | 48 (8.2%) |
| 20 to 24 Years | 1,486 (75.5%) | 56 (3.8%) |
| 25 to 29 Years | 1,480 (88.8%) | 93 (6.3%) |
| 30 to 34 Years | 1,690 (86.9%) | 130 (7.7%) |
| 35 to 44 Years | 2,979 (81.2%) | 107 (3.6%) |
| 45 to 54 Years | 3,203 (77.1%) | 38 (1.2%) |
| 55 to 59 Years | 1,782 (63.5%) | 30 (1.7%) |
| 60 to 64 Years | 1,234 (41.0%) | 0 (0.0%) |
| 65 to 74 Years | 1,532 (24.7%) | 60 (3.9%) |
| 75 Years and over | 318 (7.1%) | 0 (0.0%) |
| Total | 16,290 (52.0%) | 570 (3.5%) |
Employment Status by Educational Attainment in Macon County
According to labor force statistics for Macon County, 71.7% of individuals (12,369) out of the total population between 25 and 64 years of age (17,251) are in the labor force, with 3.2% or 396 of them being unemployed. The group with the highest labor force participation rate are those with the educational attainment of college / associate degree, with 75.0% or 4,512 individuals in the labor force. Within the labor force, individuals with less than high school education have the highest percentage of unemployment, with 10.2% or 113 of them being unemployed.
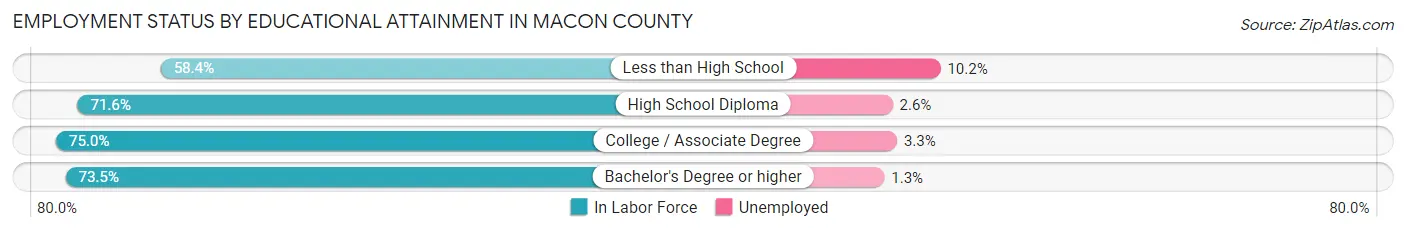
| Educational Attainment | In Labor Force | Unemployed |
| Less than High School | 1,108 (58.4%) | 193 (10.2%) |
| High School Diploma | 3,958 (71.6%) | 144 (2.6%) |
| College / Associate Degree | 4,512 (75.0%) | 199 (3.3%) |
| Bachelor's Degree or higher | 2,800 (73.5%) | 50 (1.3%) |
| Total | 12,369 (71.7%) | 552 (3.2%) |
Employment Occupations by Sex in Macon County
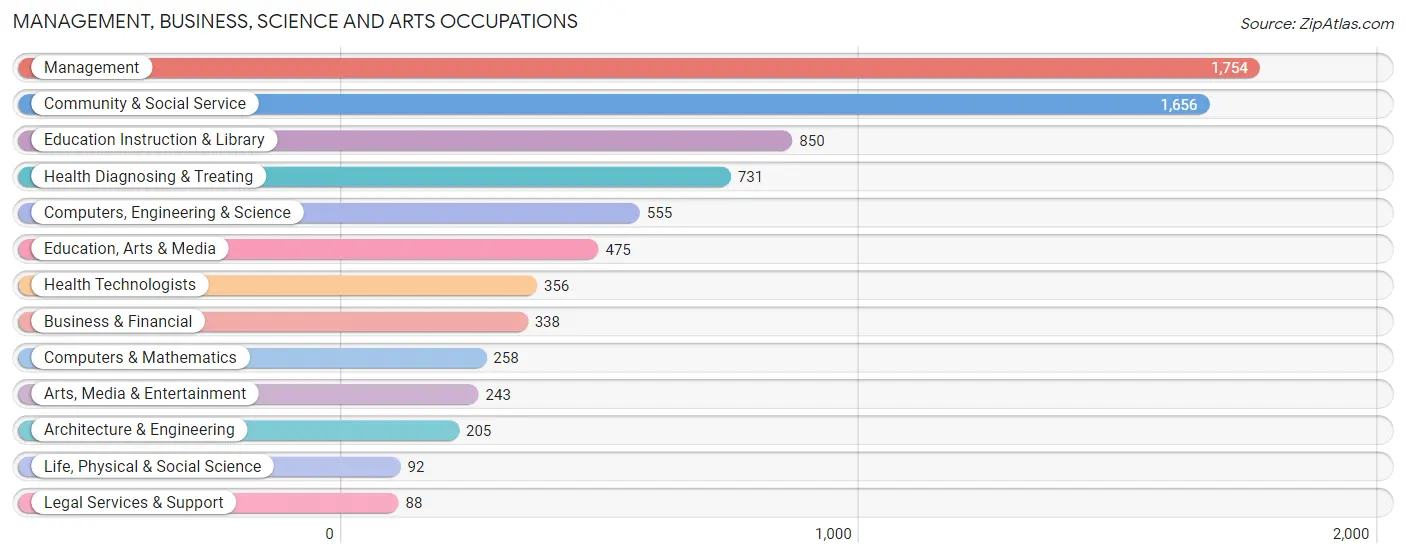
Management, Business, Science and Arts Occupations
The most common Management, Business, Science and Arts occupations in Macon County are Management (1,754 | 11.2%), Community & Social Service (1,656 | 10.5%), Education Instruction & Library (850 | 5.4%), Health Diagnosing & Treating (731 | 4.6%), and Computers, Engineering & Science (555 | 3.5%).
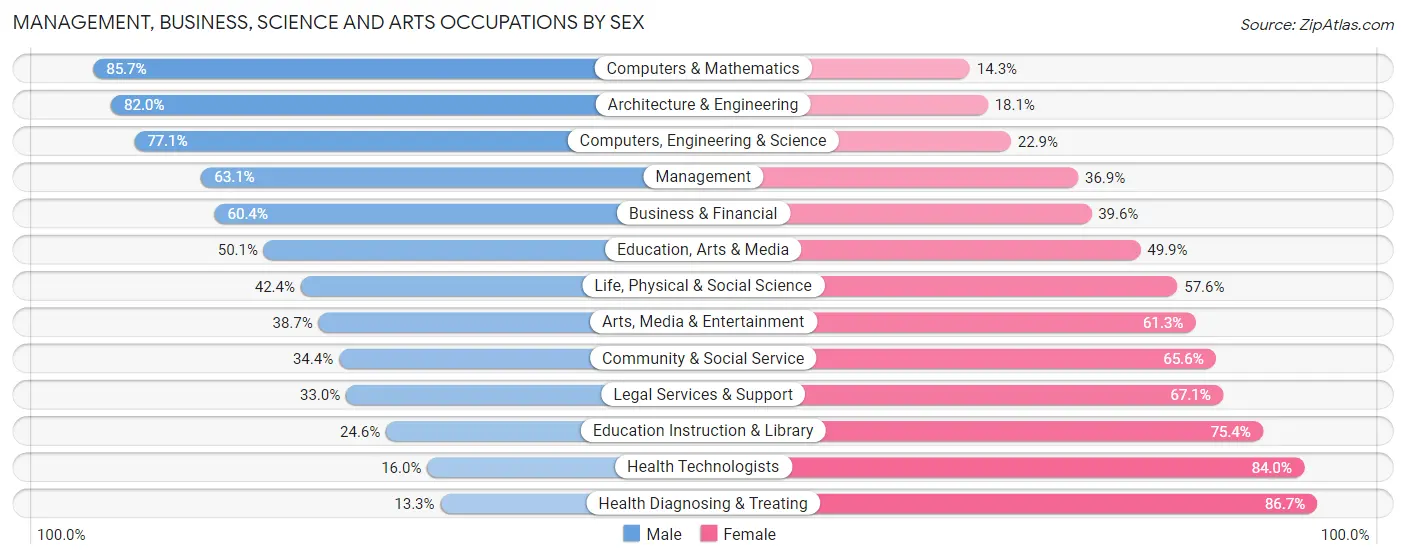
Management, Business, Science and Arts Occupations by Sex
Within the Management, Business, Science and Arts occupations in Macon County, the most male-oriented occupations are Computers & Mathematics (85.7%), Architecture & Engineering (82.0%), and Computers, Engineering & Science (77.1%), while the most female-oriented occupations are Health Diagnosing & Treating (86.7%), Health Technologists (84.0%), and Education Instruction & Library (75.4%).
| Occupation | Male | Female |
| Management | 1,107 (63.1%) | 647 (36.9%) |
| Business & Financial | 204 (60.4%) | 134 (39.6%) |
| Computers, Engineering & Science | 428 (77.1%) | 127 (22.9%) |
| Computers & Mathematics | 221 (85.7%) | 37 (14.3%) |
| Architecture & Engineering | 168 (82.0%) | 37 (18.0%) |
| Life, Physical & Social Science | 39 (42.4%) | 53 (57.6%) |
| Community & Social Service | 570 (34.4%) | 1,086 (65.6%) |
| Education, Arts & Media | 238 (50.1%) | 237 (49.9%) |
| Legal Services & Support | 29 (33.0%) | 59 (67.0%) |
| Education Instruction & Library | 209 (24.6%) | 641 (75.4%) |
| Arts, Media & Entertainment | 94 (38.7%) | 149 (61.3%) |
| Health Diagnosing & Treating | 97 (13.3%) | 634 (86.7%) |
| Health Technologists | 57 (16.0%) | 299 (84.0%) |
| Total (Category) | 2,406 (47.8%) | 2,628 (52.2%) |
| Total (Overall) | 8,522 (54.2%) | 7,194 (45.8%) |
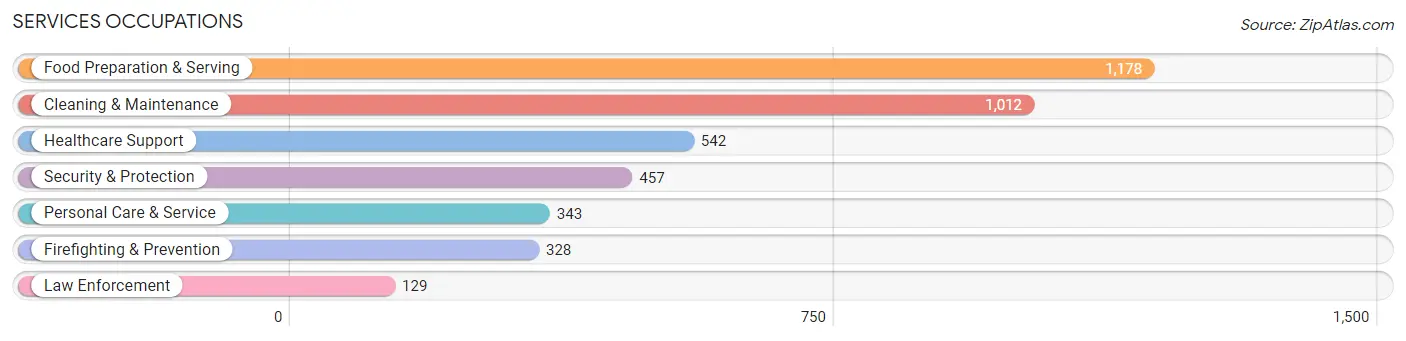
Services Occupations
The most common Services occupations in Macon County are Food Preparation & Serving (1,178 | 7.5%), Cleaning & Maintenance (1,012 | 6.4%), Healthcare Support (542 | 3.5%), Security & Protection (457 | 2.9%), and Personal Care & Service (343 | 2.2%).
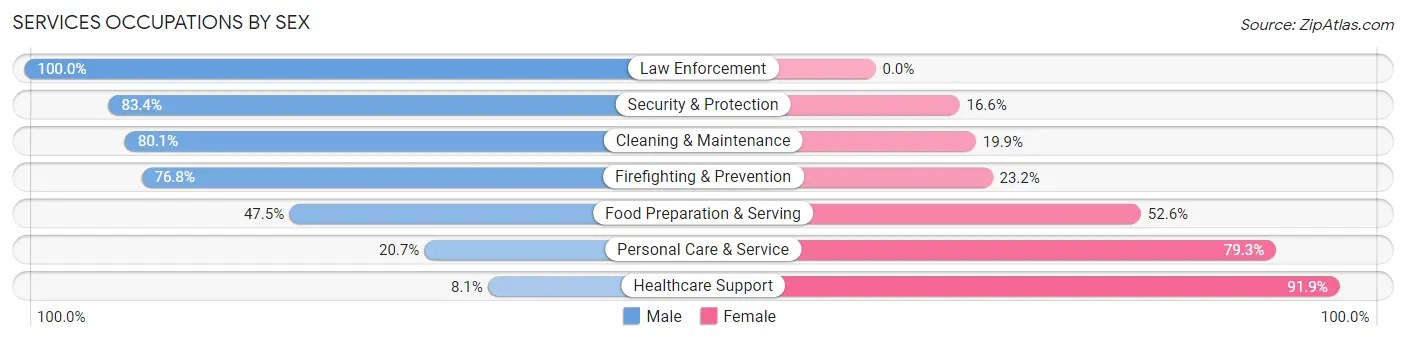
Services Occupations by Sex
Within the Services occupations in Macon County, the most male-oriented occupations are Law Enforcement (100.0%), Security & Protection (83.4%), and Cleaning & Maintenance (80.1%), while the most female-oriented occupations are Healthcare Support (91.9%), Personal Care & Service (79.3%), and Food Preparation & Serving (52.5%).
| Occupation | Male | Female |
| Healthcare Support | 44 (8.1%) | 498 (91.9%) |
| Security & Protection | 381 (83.4%) | 76 (16.6%) |
| Firefighting & Prevention | 252 (76.8%) | 76 (23.2%) |
| Law Enforcement | 129 (100.0%) | 0 (0.0%) |
| Food Preparation & Serving | 559 (47.4%) | 619 (52.5%) |
| Cleaning & Maintenance | 811 (80.1%) | 201 (19.9%) |
| Personal Care & Service | 71 (20.7%) | 272 (79.3%) |
| Total (Category) | 1,866 (52.8%) | 1,666 (47.2%) |
| Total (Overall) | 8,522 (54.2%) | 7,194 (45.8%) |
Sales and Office Occupations
The most common Sales and Office occupations in Macon County are Office & Administration (1,996 | 12.7%), and Sales & Related (1,319 | 8.4%).
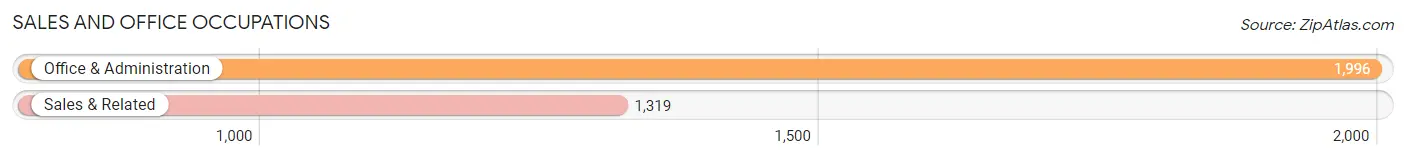
Sales and Office Occupations by Sex

| Occupation | Male | Female |
| Sales & Related | 707 (53.6%) | 612 (46.4%) |
| Office & Administration | 254 (12.7%) | 1,742 (87.3%) |
| Total (Category) | 961 (29.0%) | 2,354 (71.0%) |
| Total (Overall) | 8,522 (54.2%) | 7,194 (45.8%) |
Natural Resources, Construction and Maintenance Occupations
The most common Natural Resources, Construction and Maintenance occupations in Macon County are Construction & Extraction (1,232 | 7.8%), Installation, Maintenance & Repair (635 | 4.0%), and Farming, Fishing & Forestry (132 | 0.8%).
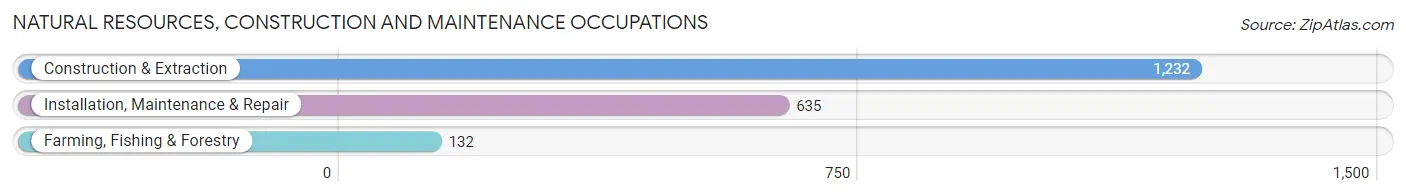
Natural Resources, Construction and Maintenance Occupations by Sex
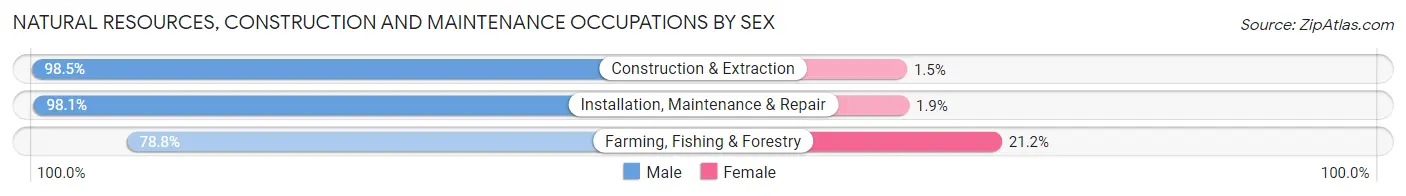
| Occupation | Male | Female |
| Farming, Fishing & Forestry | 104 (78.8%) | 28 (21.2%) |
| Construction & Extraction | 1,214 (98.5%) | 18 (1.5%) |
| Installation, Maintenance & Repair | 623 (98.1%) | 12 (1.9%) |
| Total (Category) | 1,941 (97.1%) | 58 (2.9%) |
| Total (Overall) | 8,522 (54.2%) | 7,194 (45.8%) |
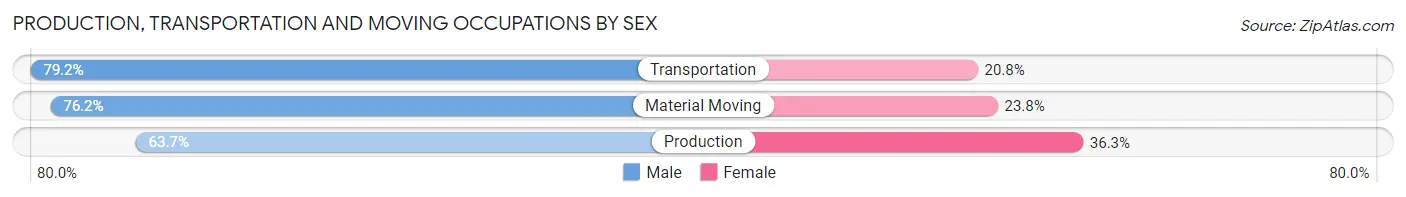
Production, Transportation and Moving Occupations
The most common Production, Transportation and Moving occupations in Macon County are Transportation (691 | 4.4%), Production (573 | 3.6%), and Material Moving (572 | 3.6%).
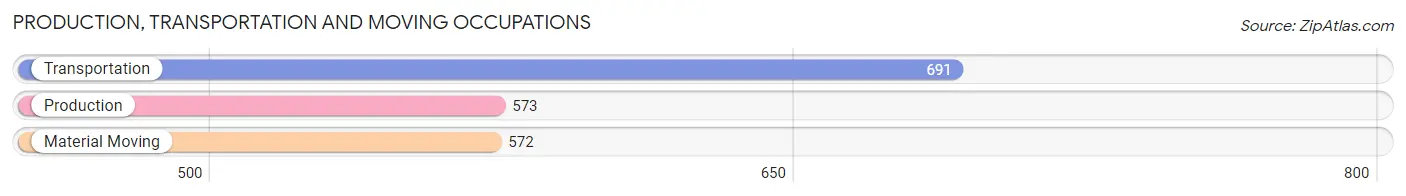
Production, Transportation and Moving Occupations by Sex
| Occupation | Male | Female |
| Production | 365 (63.7%) | 208 (36.3%) |
| Transportation | 547 (79.2%) | 144 (20.8%) |
| Material Moving | 436 (76.2%) | 136 (23.8%) |
| Total (Category) | 1,348 (73.4%) | 488 (26.6%) |
| Total (Overall) | 8,522 (54.2%) | 7,194 (45.8%) |
Employment Industries by Sex in Macon County
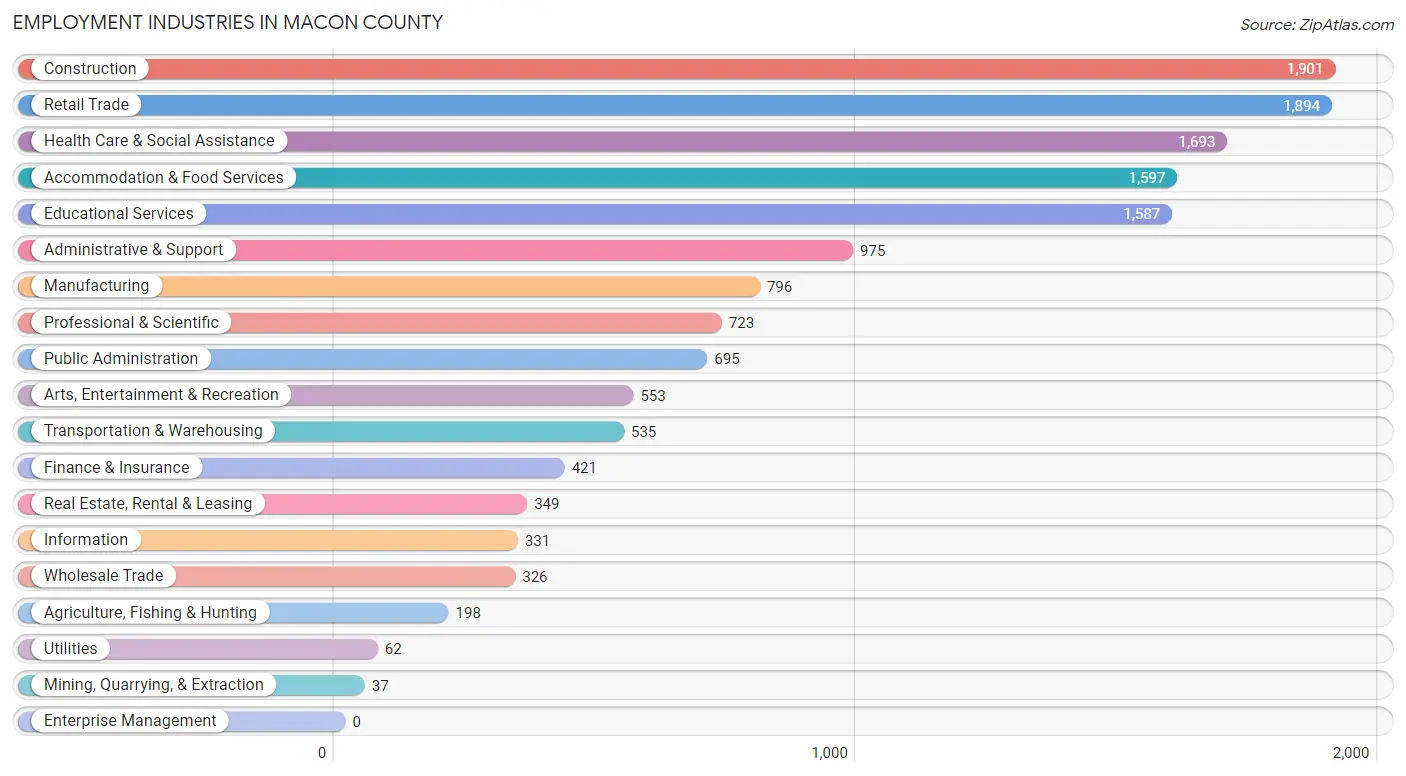
Employment Industries in Macon County
The major employment industries in Macon County include Construction (1,901 | 12.1%), Retail Trade (1,894 | 12.0%), Health Care & Social Assistance (1,693 | 10.8%), Accommodation & Food Services (1,597 | 10.2%), and Educational Services (1,587 | 10.1%).
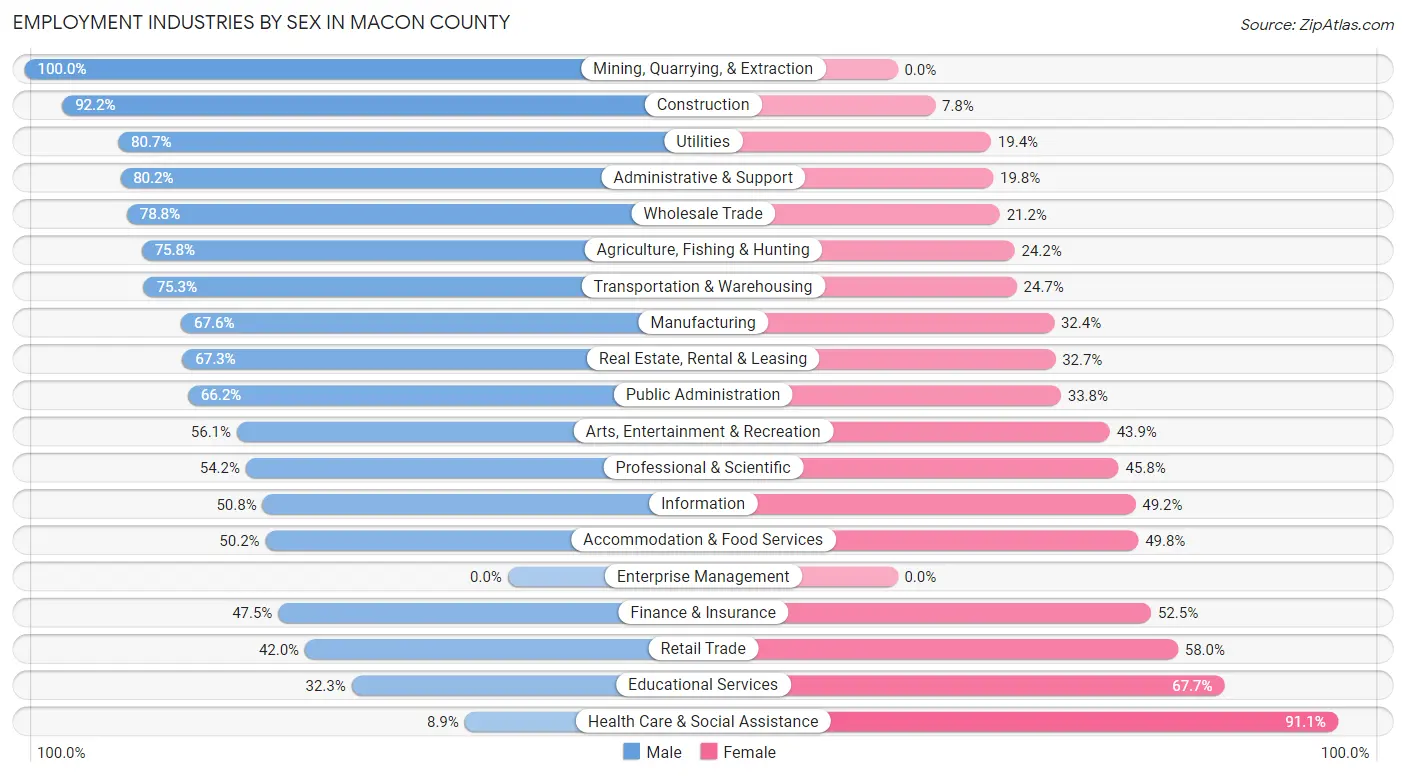
Employment Industries by Sex in Macon County
The Macon County industries that see more men than women are Mining, Quarrying, & Extraction (100.0%), Construction (92.2%), and Utilities (80.6%), whereas the industries that tend to have a higher number of women are Health Care & Social Assistance (91.1%), Educational Services (67.7%), and Retail Trade (58.0%).
| Industry | Male | Female |
| Agriculture, Fishing & Hunting | 150 (75.8%) | 48 (24.2%) |
| Mining, Quarrying, & Extraction | 37 (100.0%) | 0 (0.0%) |
| Construction | 1,753 (92.2%) | 148 (7.8%) |
| Manufacturing | 538 (67.6%) | 258 (32.4%) |
| Wholesale Trade | 257 (78.8%) | 69 (21.2%) |
| Retail Trade | 795 (42.0%) | 1,099 (58.0%) |
| Transportation & Warehousing | 403 (75.3%) | 132 (24.7%) |
| Utilities | 50 (80.6%) | 12 (19.4%) |
| Information | 168 (50.8%) | 163 (49.2%) |
| Finance & Insurance | 200 (47.5%) | 221 (52.5%) |
| Real Estate, Rental & Leasing | 235 (67.3%) | 114 (32.7%) |
| Professional & Scientific | 392 (54.2%) | 331 (45.8%) |
| Enterprise Management | 0 (0.0%) | 0 (0.0%) |
| Administrative & Support | 782 (80.2%) | 193 (19.8%) |
| Educational Services | 513 (32.3%) | 1,074 (67.7%) |
| Health Care & Social Assistance | 151 (8.9%) | 1,542 (91.1%) |
| Arts, Entertainment & Recreation | 310 (56.1%) | 243 (43.9%) |
| Accommodation & Food Services | 801 (50.2%) | 796 (49.8%) |
| Public Administration | 460 (66.2%) | 235 (33.8%) |
| Total | 8,522 (54.2%) | 7,194 (45.8%) |
Education in Macon County
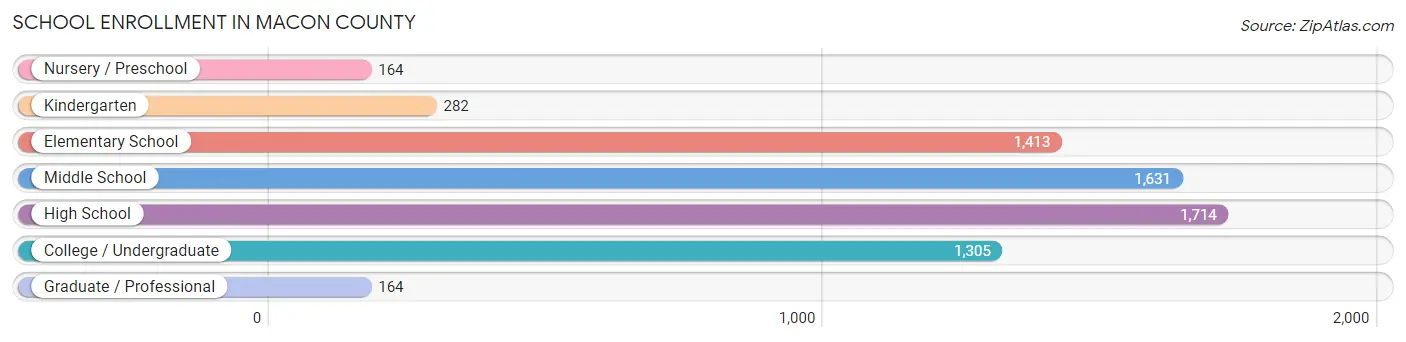
School Enrollment in Macon County
The most common levels of schooling among the 6,673 students in Macon County are high school (1,714 | 25.7%), middle school (1,631 | 24.4%), and elementary school (1,413 | 21.2%).
| School Level | # Students | % Students |
| Nursery / Preschool | 164 | 2.5% |
| Kindergarten | 282 | 4.2% |
| Elementary School | 1,413 | 21.2% |
| Middle School | 1,631 | 24.4% |
| High School | 1,714 | 25.7% |
| College / Undergraduate | 1,305 | 19.6% |
| Graduate / Professional | 164 | 2.5% |
| Total | 6,673 | 100.0% |
School Enrollment by Age by Funding Source in Macon County
Out of a total of 6,673 students who are enrolled in schools in Macon County, 1,555 (23.3%) attend a private institution, while the remaining 5,118 (76.7%) are enrolled in public schools. The age group of 35 years and over has the highest likelihood of being enrolled in private schools, with 115 (51.6% in the age bracket) enrolled. Conversely, the age group of 10 to 14 year olds has the lowest likelihood of being enrolled in a private school, with 1,624 (83.0% in the age bracket) attending a public institution.
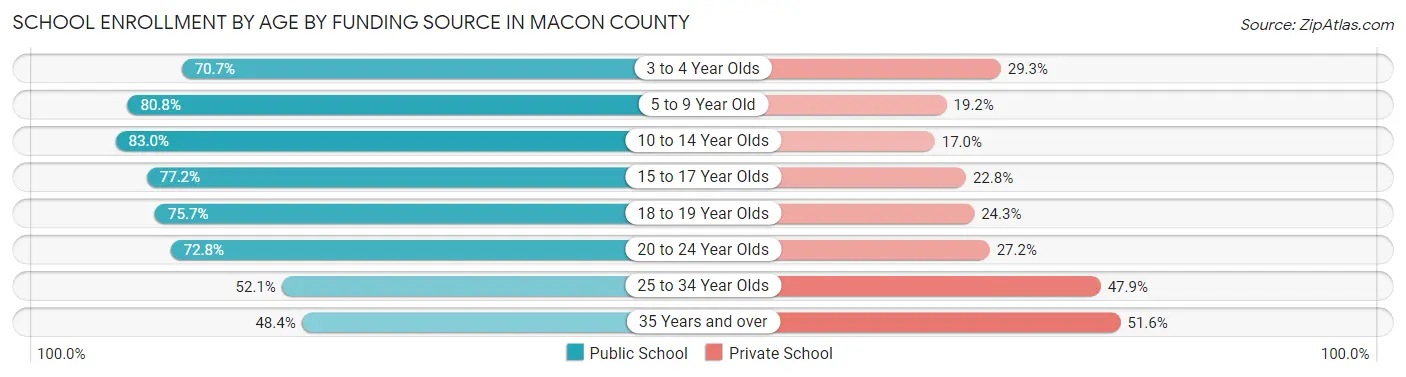
| Age Bracket | Public School | Private School |
| 3 to 4 Year Olds | 116 (70.7%) | 48 (29.3%) |
| 5 to 9 Year Old | 1,273 (80.8%) | 302 (19.2%) |
| 10 to 14 Year Olds | 1,624 (83.0%) | 332 (17.0%) |
| 15 to 17 Year Olds | 993 (77.2%) | 293 (22.8%) |
| 18 to 19 Year Olds | 280 (75.7%) | 90 (24.3%) |
| 20 to 24 Year Olds | 543 (72.8%) | 203 (27.2%) |
| 25 to 34 Year Olds | 184 (52.1%) | 169 (47.9%) |
| 35 Years and over | 108 (48.4%) | 115 (51.6%) |
| Total | 5,118 (76.7%) | 1,555 (23.3%) |
Educational Attainment by Field of Study in Macon County
Business (1,555 | 21.2%), education (1,074 | 14.7%), science & technology (851 | 11.6%), arts & humanities (529 | 7.2%), and social sciences (457 | 6.2%) are the most common fields of study among 7,326 individuals in Macon County who have obtained a bachelor's degree or higher.
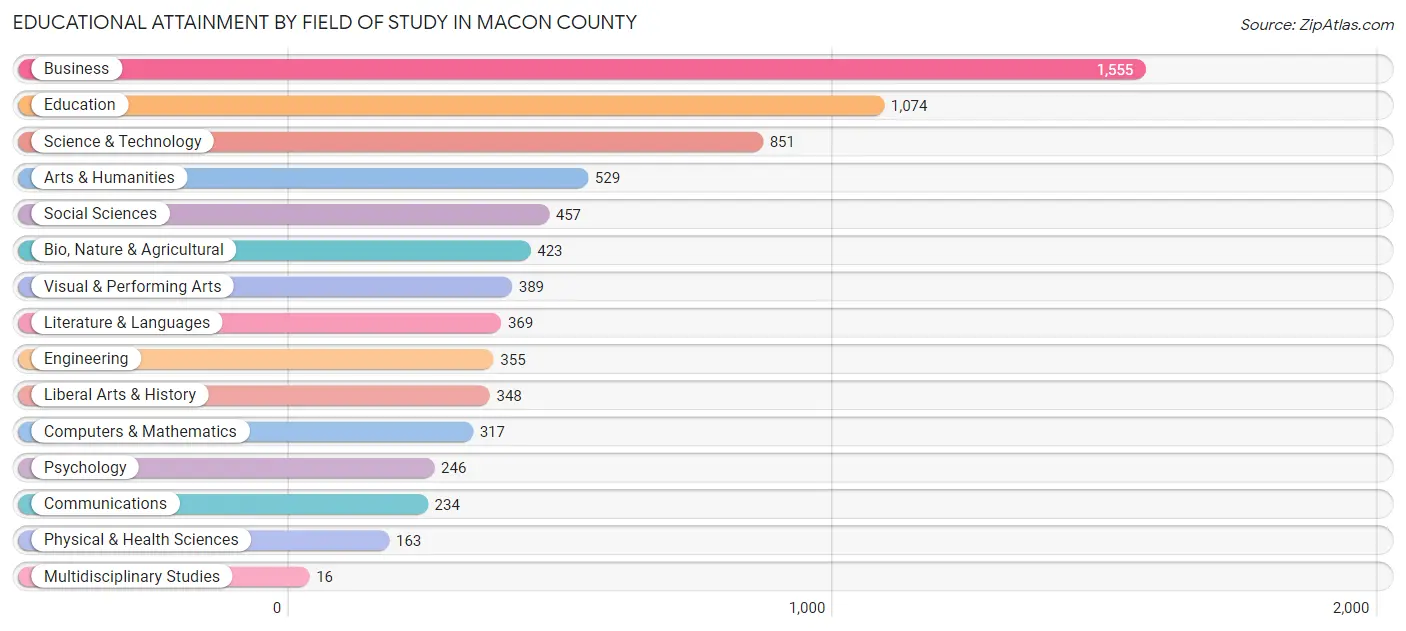
| Field of Study | # Graduates | % Graduates |
| Computers & Mathematics | 317 | 4.3% |
| Bio, Nature & Agricultural | 423 | 5.8% |
| Physical & Health Sciences | 163 | 2.2% |
| Psychology | 246 | 3.4% |
| Social Sciences | 457 | 6.2% |
| Engineering | 355 | 4.9% |
| Multidisciplinary Studies | 16 | 0.2% |
| Science & Technology | 851 | 11.6% |
| Business | 1,555 | 21.2% |
| Education | 1,074 | 14.7% |
| Literature & Languages | 369 | 5.0% |
| Liberal Arts & History | 348 | 4.8% |
| Visual & Performing Arts | 389 | 5.3% |
| Communications | 234 | 3.2% |
| Arts & Humanities | 529 | 7.2% |
| Total | 7,326 | 100.0% |
Transportation & Commute in Macon County
Vehicle Availability by Sex in Macon County
The most prevalent vehicle ownership categories in Macon County are males with 2 vehicles (3,445, accounting for 41.5%) and females with 2 vehicles (2,992, making up 49.4%).
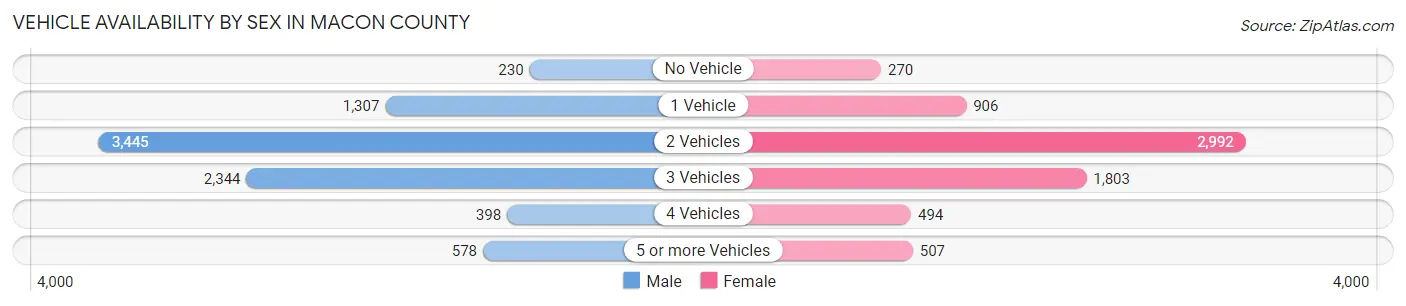
| Vehicles Available | Male | Female |
| No Vehicle | 230 (2.8%) | 270 (3.9%) |
| 1 Vehicle | 1,307 (15.7%) | 906 (13.0%) |
| 2 Vehicles | 3,445 (41.5%) | 2,992 (42.9%) |
| 3 Vehicles | 2,344 (28.2%) | 1,803 (25.9%) |
| 4 Vehicles | 398 (4.8%) | 494 (7.1%) |
| 5 or more Vehicles | 578 (7.0%) | 507 (7.3%) |
| Total | 8,302 (100.0%) | 6,972 (100.0%) |
Commute Time in Macon County
The most frequently occuring commute durations in Macon County are 10 to 14 minutes (3,050 commuters, 21.0%), 15 to 19 minutes (2,500 commuters, 17.2%), and 5 to 9 minutes (2,090 commuters, 14.4%).
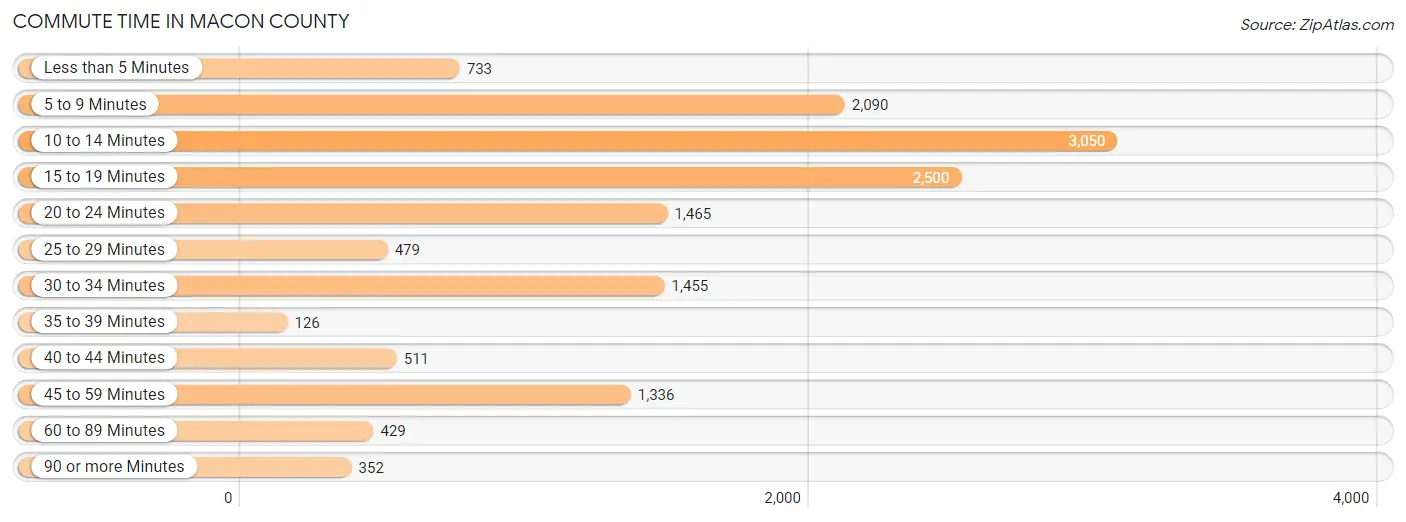
| Commute Time | # Commuters | % Commuters |
| Less than 5 Minutes | 733 | 5.1% |
| 5 to 9 Minutes | 2,090 | 14.4% |
| 10 to 14 Minutes | 3,050 | 21.0% |
| 15 to 19 Minutes | 2,500 | 17.2% |
| 20 to 24 Minutes | 1,465 | 10.1% |
| 25 to 29 Minutes | 479 | 3.3% |
| 30 to 34 Minutes | 1,455 | 10.0% |
| 35 to 39 Minutes | 126 | 0.9% |
| 40 to 44 Minutes | 511 | 3.5% |
| 45 to 59 Minutes | 1,336 | 9.2% |
| 60 to 89 Minutes | 429 | 2.9% |
| 90 or more Minutes | 352 | 2.4% |
Commute Time by Sex in Macon County
The most common commute times in Macon County are 15 to 19 minutes (1,497 commuters, 18.9%) for males and 10 to 14 minutes (1,589 commuters, 24.0%) for females.
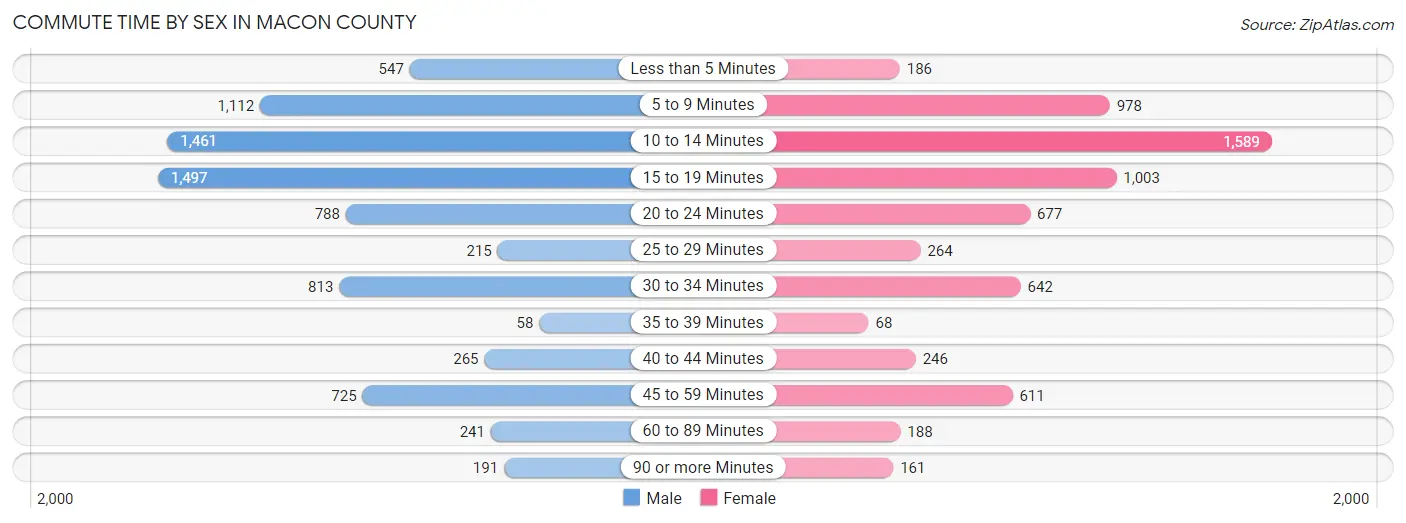
| Commute Time | Male | Female |
| Less than 5 Minutes | 547 (6.9%) | 186 (2.8%) |
| 5 to 9 Minutes | 1,112 (14.1%) | 978 (14.8%) |
| 10 to 14 Minutes | 1,461 (18.5%) | 1,589 (24.0%) |
| 15 to 19 Minutes | 1,497 (18.9%) | 1,003 (15.2%) |
| 20 to 24 Minutes | 788 (10.0%) | 677 (10.2%) |
| 25 to 29 Minutes | 215 (2.7%) | 264 (4.0%) |
| 30 to 34 Minutes | 813 (10.3%) | 642 (9.7%) |
| 35 to 39 Minutes | 58 (0.7%) | 68 (1.0%) |
| 40 to 44 Minutes | 265 (3.4%) | 246 (3.7%) |
| 45 to 59 Minutes | 725 (9.2%) | 611 (9.2%) |
| 60 to 89 Minutes | 241 (3.0%) | 188 (2.8%) |
| 90 or more Minutes | 191 (2.4%) | 161 (2.4%) |
Time of Departure to Work by Sex in Macon County
The most frequent times of departure to work in Macon County are 7:00 AM to 7:29 AM (1,342, 17.0%) for males and 7:30 AM to 7:59 AM (1,244, 18.8%) for females.
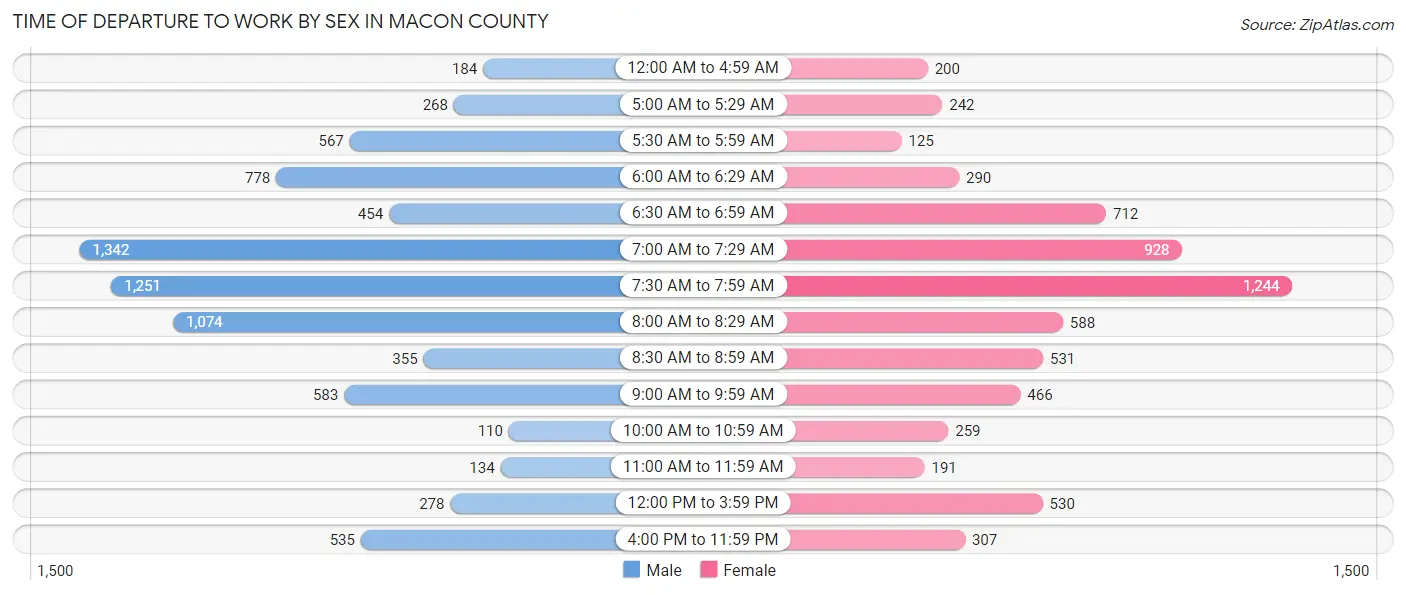
| Time of Departure | Male | Female |
| 12:00 AM to 4:59 AM | 184 (2.3%) | 200 (3.0%) |
| 5:00 AM to 5:29 AM | 268 (3.4%) | 242 (3.7%) |
| 5:30 AM to 5:59 AM | 567 (7.2%) | 125 (1.9%) |
| 6:00 AM to 6:29 AM | 778 (9.8%) | 290 (4.4%) |
| 6:30 AM to 6:59 AM | 454 (5.7%) | 712 (10.8%) |
| 7:00 AM to 7:29 AM | 1,342 (17.0%) | 928 (14.0%) |
| 7:30 AM to 7:59 AM | 1,251 (15.8%) | 1,244 (18.8%) |
| 8:00 AM to 8:29 AM | 1,074 (13.6%) | 588 (8.9%) |
| 8:30 AM to 8:59 AM | 355 (4.5%) | 531 (8.0%) |
| 9:00 AM to 9:59 AM | 583 (7.4%) | 466 (7.0%) |
| 10:00 AM to 10:59 AM | 110 (1.4%) | 259 (3.9%) |
| 11:00 AM to 11:59 AM | 134 (1.7%) | 191 (2.9%) |
| 12:00 PM to 3:59 PM | 278 (3.5%) | 530 (8.0%) |
| 4:00 PM to 11:59 PM | 535 (6.8%) | 307 (4.6%) |
| Total | 7,913 (100.0%) | 6,613 (100.0%) |
Housing Occupancy in Macon County
Occupancy by Ownership in Macon County
Of the total 17,386 dwellings in Macon County, owner-occupied units account for 12,835 (73.8%), while renter-occupied units make up 4,551 (26.2%).
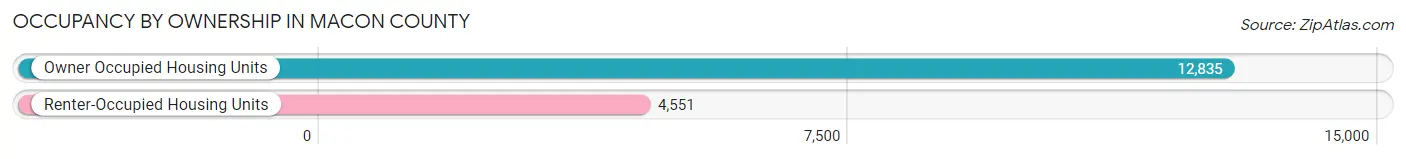
| Occupancy | # Housing Units | % Housing Units |
| Owner Occupied Housing Units | 12,835 | 73.8% |
| Renter-Occupied Housing Units | 4,551 | 26.2% |
| Total Occupied Housing Units | 17,386 | 100.0% |
Occupancy by Household Size in Macon County
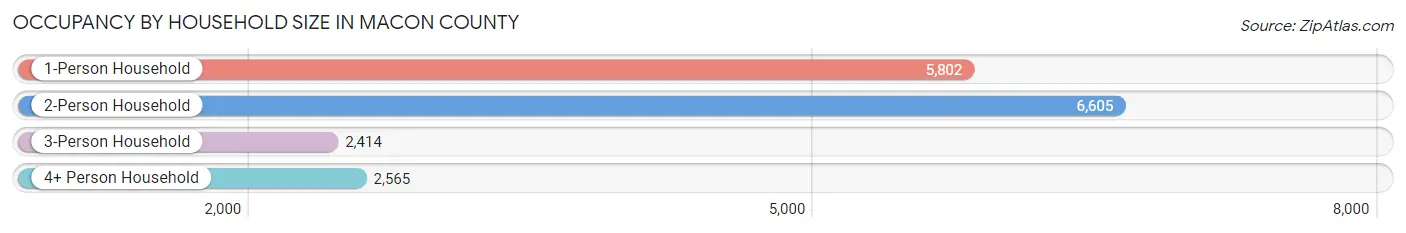
| Household Size | # Housing Units | % Housing Units |
| 1-Person Household | 5,802 | 33.4% |
| 2-Person Household | 6,605 | 38.0% |
| 3-Person Household | 2,414 | 13.9% |
| 4+ Person Household | 2,565 | 14.7% |
| Total Housing Units | 17,386 | 100.0% |
Occupancy by Ownership by Household Size in Macon County
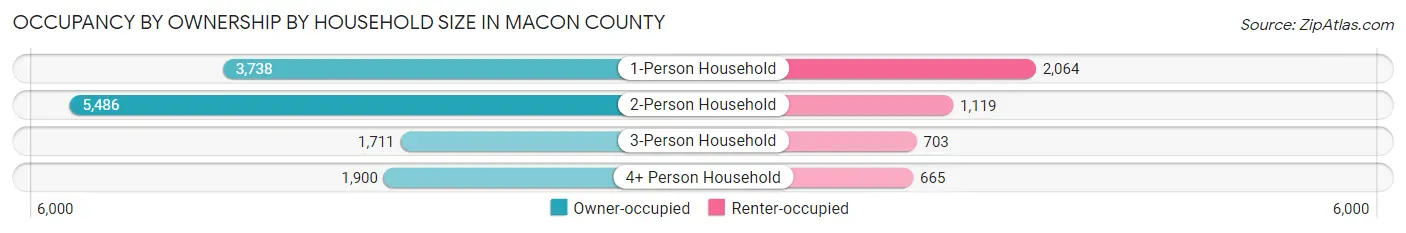
| Household Size | Owner-occupied | Renter-occupied |
| 1-Person Household | 3,738 (64.4%) | 2,064 (35.6%) |
| 2-Person Household | 5,486 (83.1%) | 1,119 (16.9%) |
| 3-Person Household | 1,711 (70.9%) | 703 (29.1%) |
| 4+ Person Household | 1,900 (74.1%) | 665 (25.9%) |
| Total Housing Units | 12,835 (73.8%) | 4,551 (26.2%) |
Occupancy by Educational Attainment in Macon County
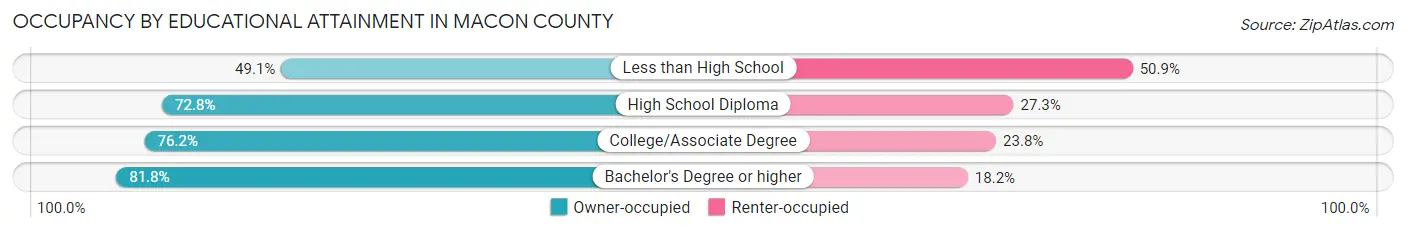
| Household Size | Owner-occupied | Renter-occupied |
| Less than High School | 852 (49.1%) | 882 (50.9%) |
| High School Diploma | 3,848 (72.8%) | 1,441 (27.3%) |
| College/Associate Degree | 4,668 (76.2%) | 1,457 (23.8%) |
| Bachelor's Degree or higher | 3,467 (81.8%) | 771 (18.2%) |
Occupancy by Age of Householder in Macon County
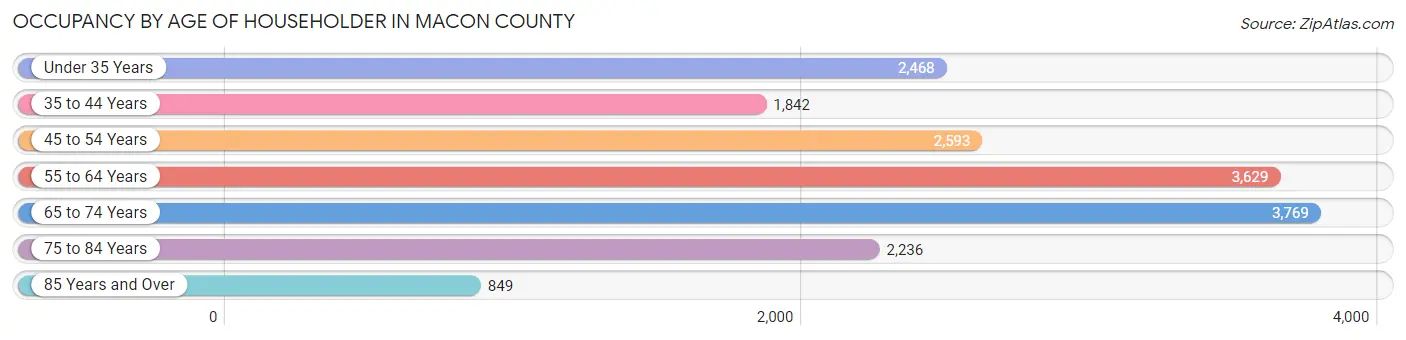
| Age Bracket | # Households | % Households |
| Under 35 Years | 2,468 | 14.2% |
| 35 to 44 Years | 1,842 | 10.6% |
| 45 to 54 Years | 2,593 | 14.9% |
| 55 to 64 Years | 3,629 | 20.9% |
| 65 to 74 Years | 3,769 | 21.7% |
| 75 to 84 Years | 2,236 | 12.9% |
| 85 Years and Over | 849 | 4.9% |
| Total | 17,386 | 100.0% |
Housing Finances in Macon County
Median Income by Occupancy in Macon County
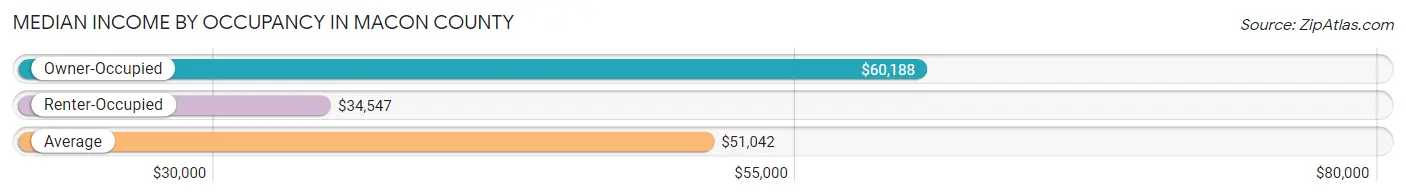
| Occupancy Type | # Households | Median Income |
| Owner-Occupied | 12,835 (73.8%) | $60,188 |
| Renter-Occupied | 4,551 (26.2%) | $34,547 |
| Average | 17,386 (100.0%) | $51,042 |
Occupancy by Householder Income Bracket in Macon County
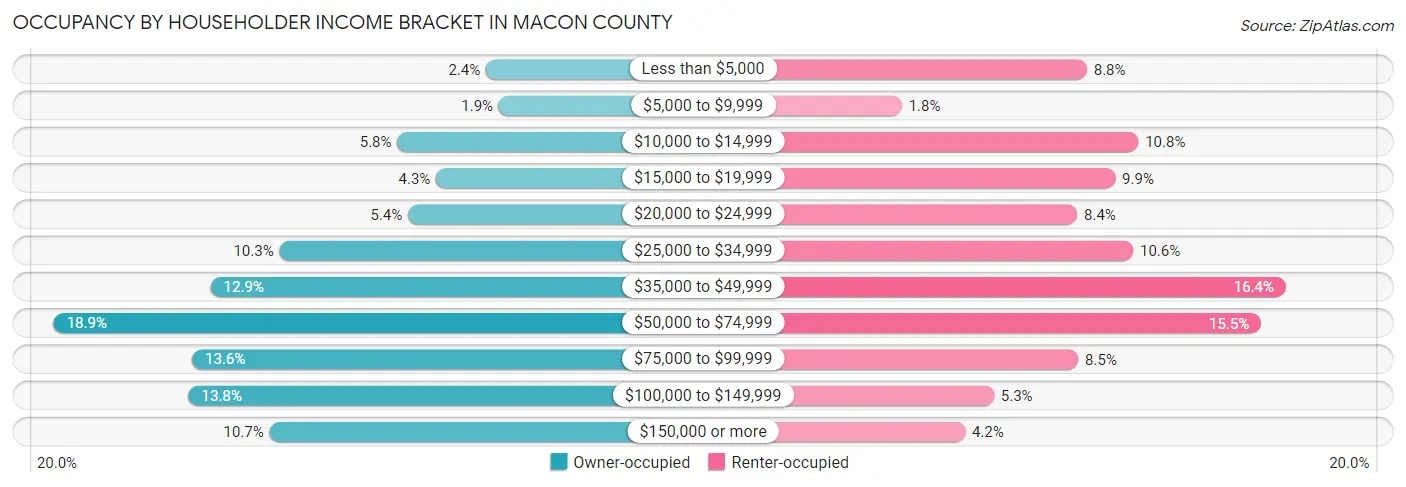
| Income Bracket | Owner-occupied | Renter-occupied |
| Less than $5,000 | 311 (2.4%) | 401 (8.8%) |
| $5,000 to $9,999 | 248 (1.9%) | 80 (1.8%) |
| $10,000 to $14,999 | 744 (5.8%) | 490 (10.8%) |
| $15,000 to $19,999 | 555 (4.3%) | 450 (9.9%) |
| $20,000 to $24,999 | 692 (5.4%) | 384 (8.4%) |
| $25,000 to $34,999 | 1,321 (10.3%) | 481 (10.6%) |
| $35,000 to $49,999 | 1,657 (12.9%) | 746 (16.4%) |
| $50,000 to $74,999 | 2,425 (18.9%) | 703 (15.4%) |
| $75,000 to $99,999 | 1,748 (13.6%) | 386 (8.5%) |
| $100,000 to $149,999 | 1,765 (13.8%) | 240 (5.3%) |
| $150,000 or more | 1,369 (10.7%) | 190 (4.2%) |
| Total | 12,835 (100.0%) | 4,551 (100.0%) |
Monthly Housing Cost Tiers in Macon County
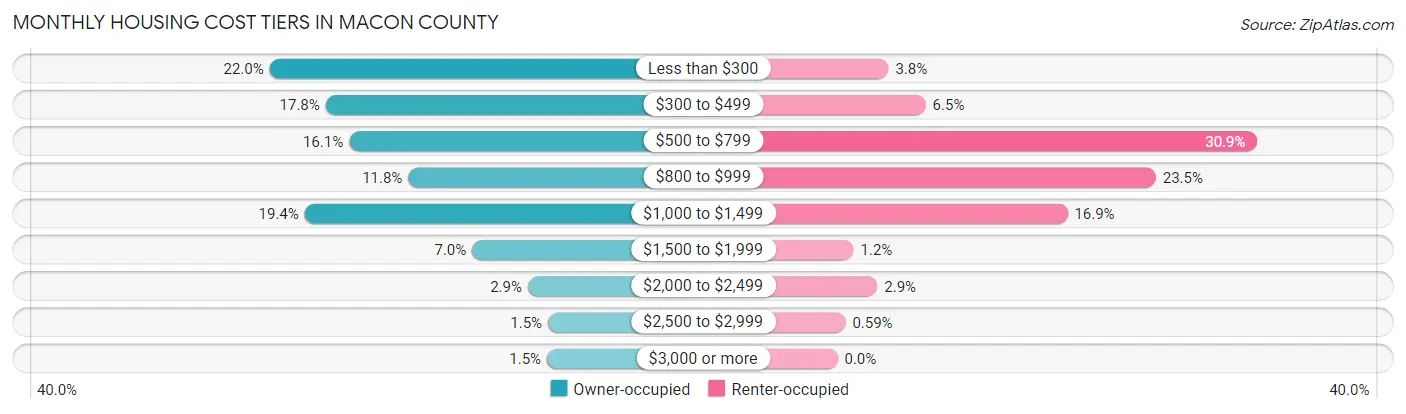
| Monthly Cost | Owner-occupied | Renter-occupied |
| Less than $300 | 2,818 (22.0%) | 171 (3.8%) |
| $300 to $499 | 2,288 (17.8%) | 296 (6.5%) |
| $500 to $799 | 2,068 (16.1%) | 1,407 (30.9%) |
| $800 to $999 | 1,508 (11.7%) | 1,067 (23.4%) |
| $1,000 to $1,499 | 2,488 (19.4%) | 771 (16.9%) |
| $1,500 to $1,999 | 904 (7.0%) | 54 (1.2%) |
| $2,000 to $2,499 | 377 (2.9%) | 134 (2.9%) |
| $2,500 to $2,999 | 188 (1.5%) | 27 (0.6%) |
| $3,000 or more | 196 (1.5%) | 0 (0.0%) |
| Total | 12,835 (100.0%) | 4,551 (100.0%) |
Physical Housing Characteristics in Macon County
Housing Structures in Macon County
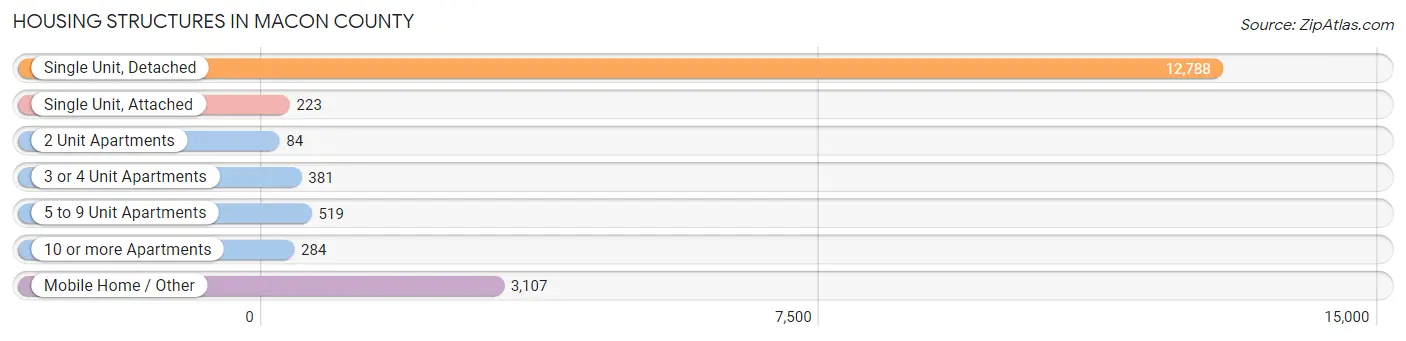
| Structure Type | # Housing Units | % Housing Units |
| Single Unit, Detached | 12,788 | 73.6% |
| Single Unit, Attached | 223 | 1.3% |
| 2 Unit Apartments | 84 | 0.5% |
| 3 or 4 Unit Apartments | 381 | 2.2% |
| 5 to 9 Unit Apartments | 519 | 3.0% |
| 10 or more Apartments | 284 | 1.6% |
| Mobile Home / Other | 3,107 | 17.9% |
| Total | 17,386 | 100.0% |
Housing Structures by Occupancy in Macon County
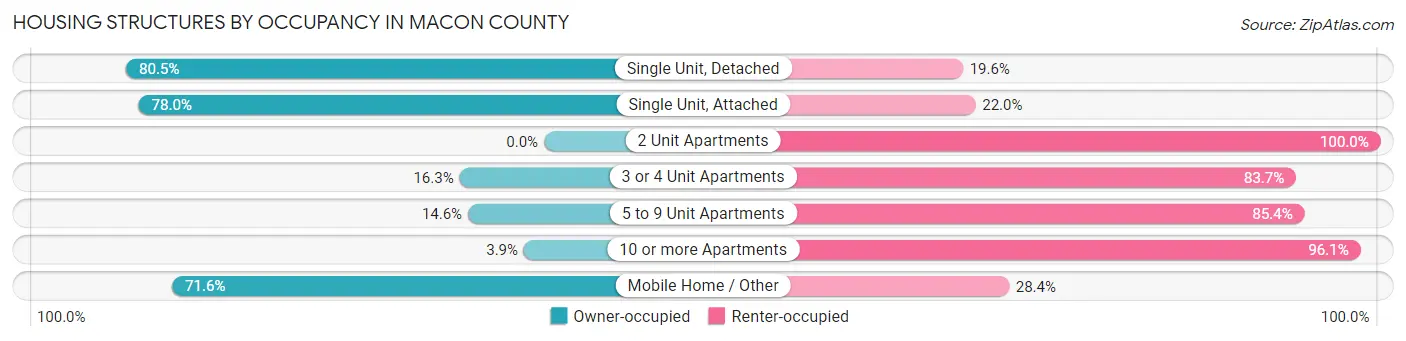
| Structure Type | Owner-occupied | Renter-occupied |
| Single Unit, Detached | 10,288 (80.4%) | 2,500 (19.6%) |
| Single Unit, Attached | 174 (78.0%) | 49 (22.0%) |
| 2 Unit Apartments | 0 (0.0%) | 84 (100.0%) |
| 3 or 4 Unit Apartments | 62 (16.3%) | 319 (83.7%) |
| 5 to 9 Unit Apartments | 76 (14.6%) | 443 (85.4%) |
| 10 or more Apartments | 11 (3.9%) | 273 (96.1%) |
| Mobile Home / Other | 2,224 (71.6%) | 883 (28.4%) |
| Total | 12,835 (73.8%) | 4,551 (26.2%) |
Housing Structures by Number of Rooms in Macon County
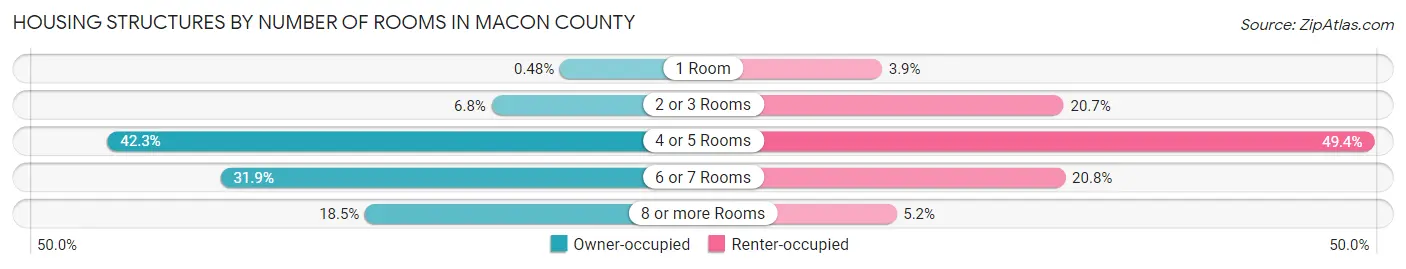
| Number of Rooms | Owner-occupied | Renter-occupied |
| 1 Room | 61 (0.5%) | 176 (3.9%) |
| 2 or 3 Rooms | 873 (6.8%) | 941 (20.7%) |
| 4 or 5 Rooms | 5,434 (42.3%) | 2,249 (49.4%) |
| 6 or 7 Rooms | 4,092 (31.9%) | 948 (20.8%) |
| 8 or more Rooms | 2,375 (18.5%) | 237 (5.2%) |
| Total | 12,835 (100.0%) | 4,551 (100.0%) |
Housing Structure by Heating Type in Macon County
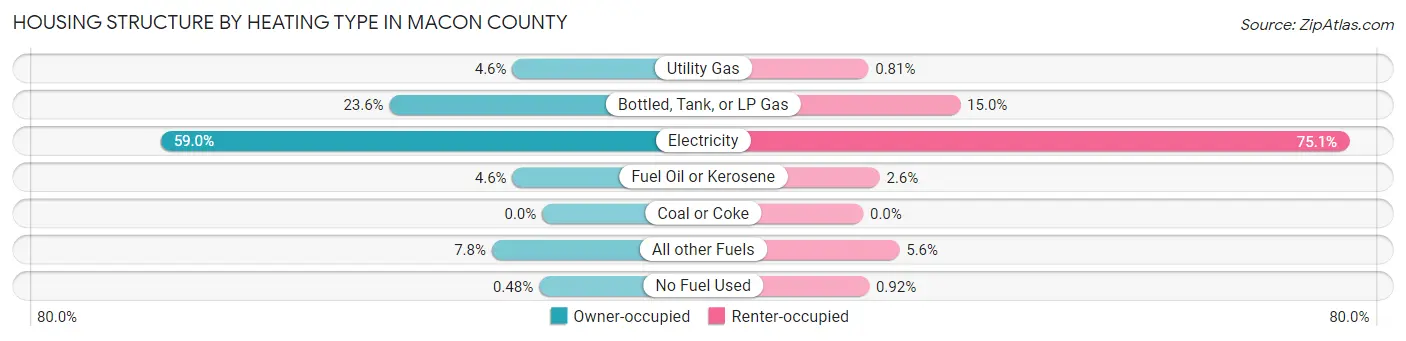
| Heating Type | Owner-occupied | Renter-occupied |
| Utility Gas | 591 (4.6%) | 37 (0.8%) |
| Bottled, Tank, or LP Gas | 3,029 (23.6%) | 683 (15.0%) |
| Electricity | 7,566 (59.0%) | 3,418 (75.1%) |
| Fuel Oil or Kerosene | 589 (4.6%) | 116 (2.5%) |
| Coal or Coke | 0 (0.0%) | 0 (0.0%) |
| All other Fuels | 998 (7.8%) | 255 (5.6%) |
| No Fuel Used | 62 (0.5%) | 42 (0.9%) |
| Total | 12,835 (100.0%) | 4,551 (100.0%) |
Household Vehicle Usage in Macon County
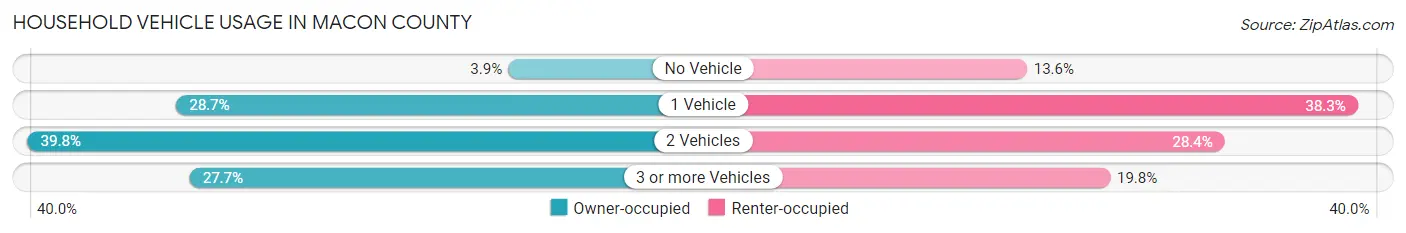
| Vehicles per Household | Owner-occupied | Renter-occupied |
| No Vehicle | 501 (3.9%) | 618 (13.6%) |
| 1 Vehicle | 3,680 (28.7%) | 1,742 (38.3%) |
| 2 Vehicles | 5,104 (39.8%) | 1,290 (28.3%) |
| 3 or more Vehicles | 3,550 (27.7%) | 901 (19.8%) |
| Total | 12,835 (100.0%) | 4,551 (100.0%) |
Real Estate & Mortgages in Macon County
Real Estate and Mortgage Overview in Macon County
| Characteristic | Without Mortgage | With Mortgage |
| Housing Units | 6,579 | 6,256 |
| Median Property Value | $194,000 | $219,100 |
| Median Household Income | $43,806 | $848 |
| Monthly Housing Costs | $324 | $193 |
| Real Estate Taxes | $860 | $104 |
Property Value by Mortgage Status in Macon County
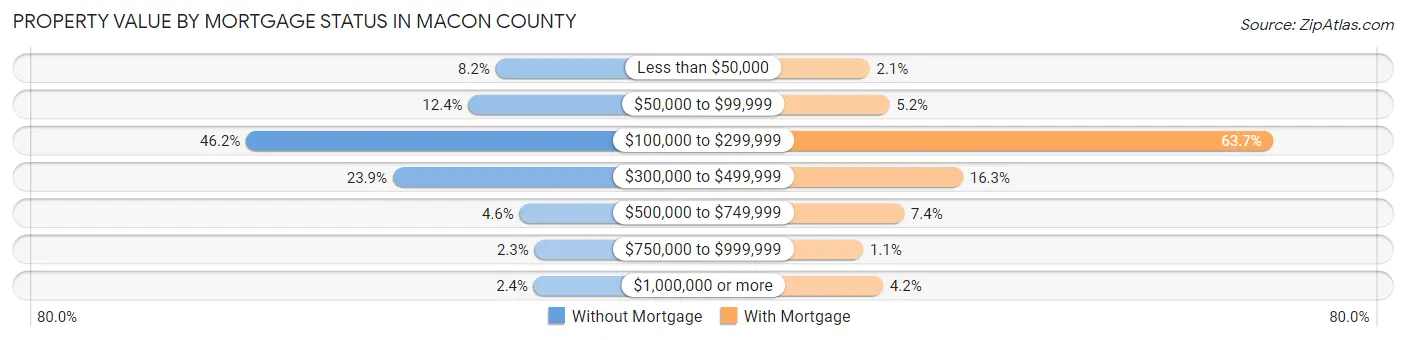
| Property Value | Without Mortgage | With Mortgage |
| Less than $50,000 | 541 (8.2%) | 133 (2.1%) |
| $50,000 to $99,999 | 814 (12.4%) | 322 (5.1%) |
| $100,000 to $299,999 | 3,042 (46.2%) | 3,986 (63.7%) |
| $300,000 to $499,999 | 1,572 (23.9%) | 1,022 (16.3%) |
| $500,000 to $749,999 | 301 (4.6%) | 461 (7.4%) |
| $750,000 to $999,999 | 151 (2.3%) | 71 (1.1%) |
| $1,000,000 or more | 158 (2.4%) | 261 (4.2%) |
| Total | 6,579 (100.0%) | 6,256 (100.0%) |
Household Income by Mortgage Status in Macon County
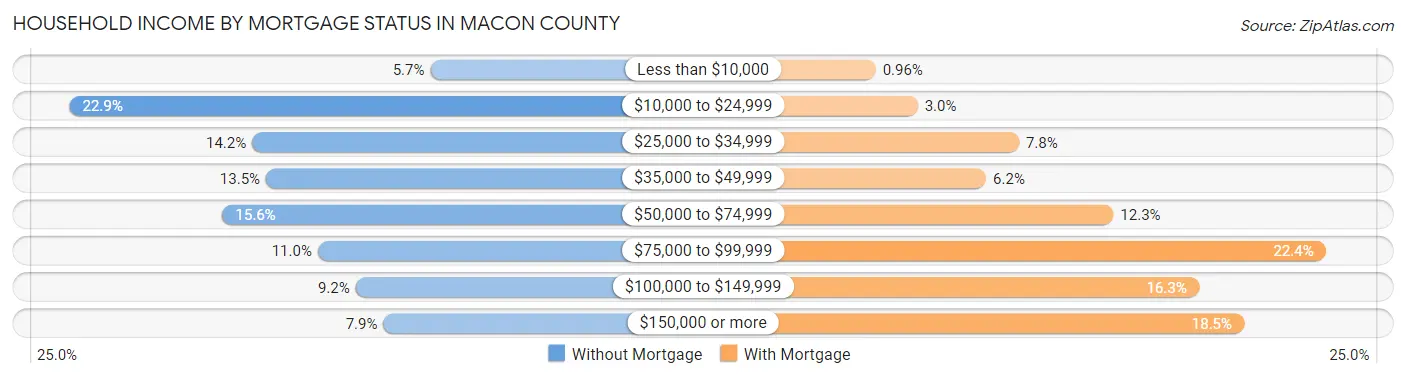
| Household Income | Without Mortgage | With Mortgage |
| Less than $10,000 | 374 (5.7%) | 60 (1.0%) |
| $10,000 to $24,999 | 1,504 (22.9%) | 185 (3.0%) |
| $25,000 to $34,999 | 932 (14.2%) | 487 (7.8%) |
| $35,000 to $49,999 | 889 (13.5%) | 389 (6.2%) |
| $50,000 to $74,999 | 1,025 (15.6%) | 768 (12.3%) |
| $75,000 to $99,999 | 726 (11.0%) | 1,400 (22.4%) |
| $100,000 to $149,999 | 608 (9.2%) | 1,022 (16.3%) |
| $150,000 or more | 521 (7.9%) | 1,157 (18.5%) |
| Total | 6,579 (100.0%) | 6,256 (100.0%) |
Property Value to Household Income Ratio in Macon County
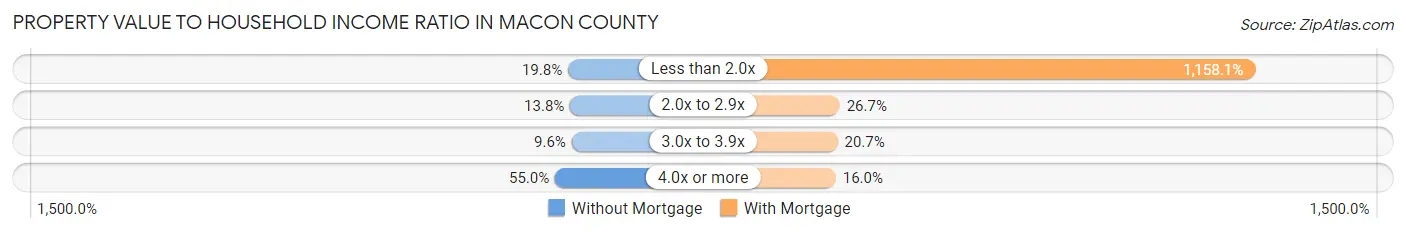
| Value-to-Income Ratio | Without Mortgage | With Mortgage |
| Less than 2.0x | 1,302 (19.8%) | 72,453 (1,158.1%) |
| 2.0x to 2.9x | 907 (13.8%) | 1,673 (26.7%) |
| 3.0x to 3.9x | 633 (9.6%) | 1,297 (20.7%) |
| 4.0x or more | 3,615 (54.9%) | 1,000 (16.0%) |
| Total | 6,579 (100.0%) | 6,256 (100.0%) |
Real Estate Taxes by Mortgage Status in Macon County
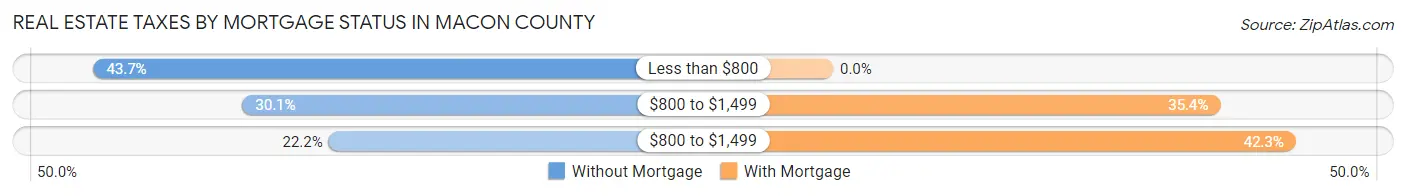
| Property Taxes | Without Mortgage | With Mortgage |
| Less than $800 | 2,876 (43.7%) | 0 (0.0%) |
| $800 to $1,499 | 1,981 (30.1%) | 2,212 (35.4%) |
| $800 to $1,499 | 1,463 (22.2%) | 2,644 (42.3%) |
| Total | 6,579 (100.0%) | 6,256 (100.0%) |
Health & Disability in Macon County
Health Insurance Coverage by Age in Macon County
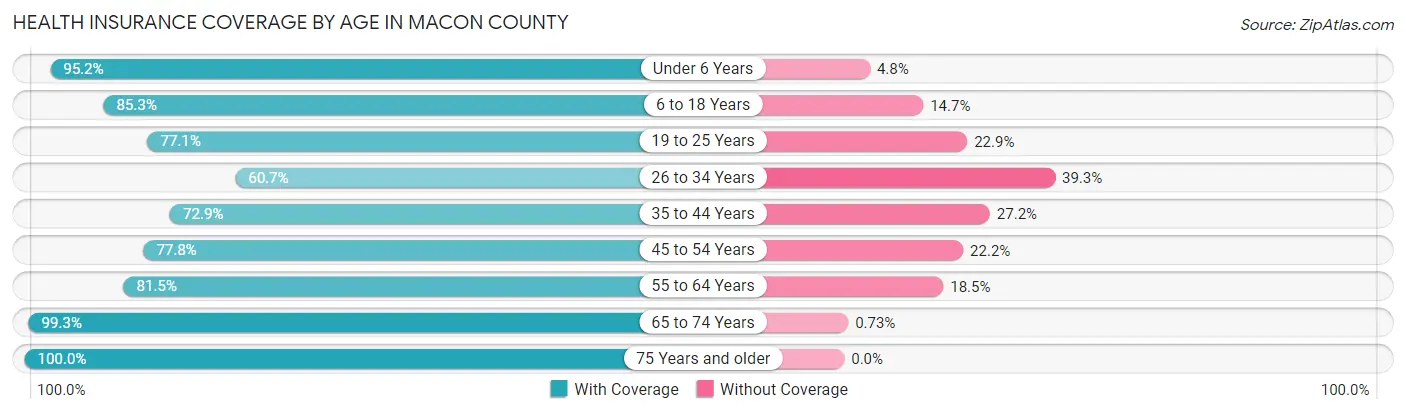
| Age Bracket | With Coverage | Without Coverage |
| Under 6 Years | 1,610 (95.2%) | 81 (4.8%) |
| 6 to 18 Years | 4,471 (85.3%) | 772 (14.7%) |
| 19 to 25 Years | 2,087 (77.1%) | 621 (22.9%) |
| 26 to 34 Years | 1,881 (60.7%) | 1,218 (39.3%) |
| 35 to 44 Years | 2,651 (72.9%) | 988 (27.2%) |
| 45 to 54 Years | 3,230 (77.8%) | 920 (22.2%) |
| 55 to 64 Years | 4,719 (81.5%) | 1,068 (18.5%) |
| 65 to 74 Years | 6,127 (99.3%) | 45 (0.7%) |
| 75 Years and older | 4,420 (100.0%) | 0 (0.0%) |
| Total | 31,196 (84.5%) | 5,713 (15.5%) |
Health Insurance Coverage by Citizenship Status in Macon County
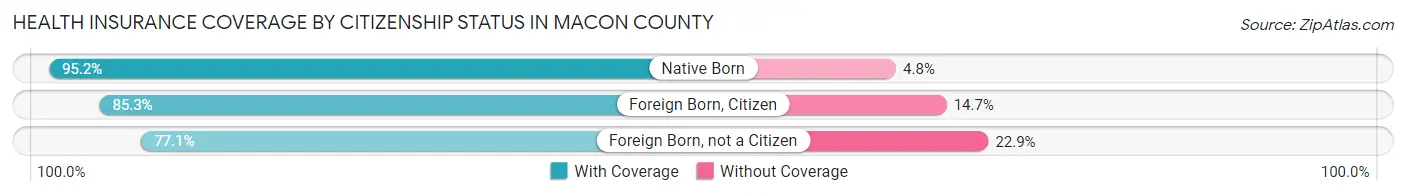
| Citizenship Status | With Coverage | Without Coverage |
| Native Born | 1,610 (95.2%) | 81 (4.8%) |
| Foreign Born, Citizen | 4,471 (85.3%) | 772 (14.7%) |
| Foreign Born, not a Citizen | 2,087 (77.1%) | 621 (22.9%) |
Health Insurance Coverage by Household Income in Macon County
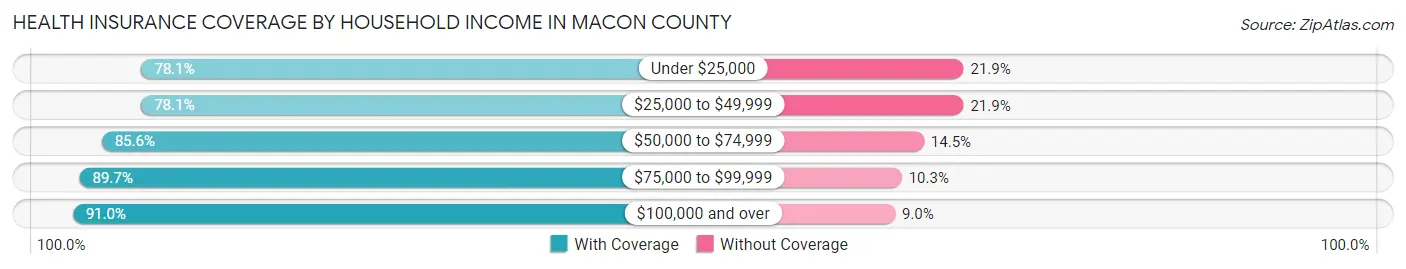
| Household Income | With Coverage | Without Coverage |
| Under $25,000 | 4,884 (78.1%) | 1,367 (21.9%) |
| $25,000 to $49,999 | 6,559 (78.1%) | 1,835 (21.9%) |
| $50,000 to $74,999 | 6,531 (85.6%) | 1,103 (14.4%) |
| $75,000 to $99,999 | 4,846 (89.7%) | 556 (10.3%) |
| $100,000 and over | 8,242 (91.0%) | 817 (9.0%) |
Public vs Private Health Insurance Coverage by Age in Macon County
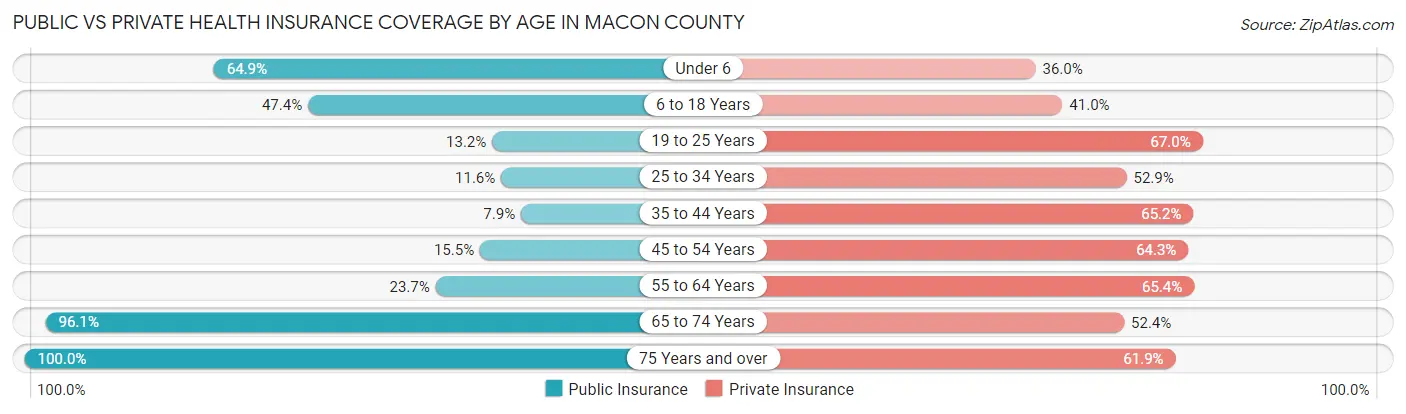
| Age Bracket | Public Insurance | Private Insurance |
| Under 6 | 1,097 (64.9%) | 608 (36.0%) |
| 6 to 18 Years | 2,485 (47.4%) | 2,147 (40.9%) |
| 19 to 25 Years | 358 (13.2%) | 1,813 (66.9%) |
| 25 to 34 Years | 358 (11.6%) | 1,638 (52.9%) |
| 35 to 44 Years | 286 (7.9%) | 2,374 (65.2%) |
| 45 to 54 Years | 642 (15.5%) | 2,668 (64.3%) |
| 55 to 64 Years | 1,373 (23.7%) | 3,783 (65.4%) |
| 65 to 74 Years | 5,932 (96.1%) | 3,234 (52.4%) |
| 75 Years and over | 4,420 (100.0%) | 2,737 (61.9%) |
| Total | 16,951 (45.9%) | 21,002 (56.9%) |
Disability Status by Sex by Age in Macon County
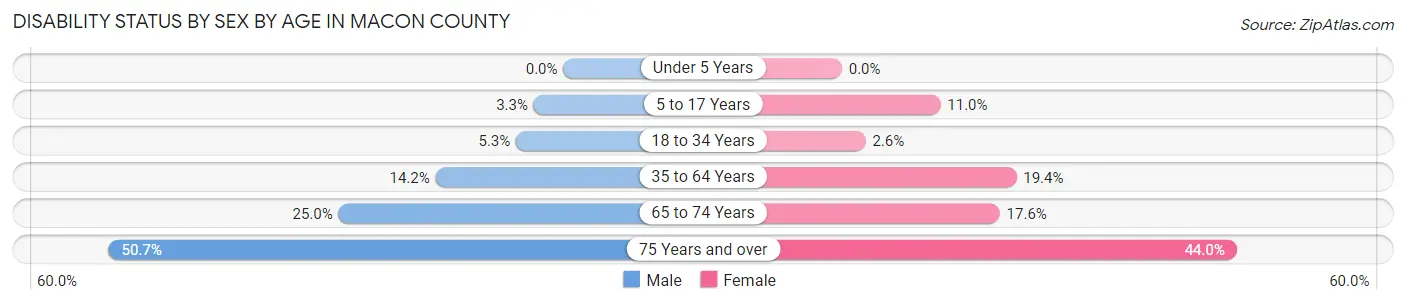
| Age Bracket | Male | Female |
| Under 5 Years | 0 (0.0%) | 0 (0.0%) |
| 5 to 17 Years | 84 (3.3%) | 265 (11.0%) |
| 18 to 34 Years | 160 (5.3%) | 82 (2.6%) |
| 35 to 64 Years | 962 (14.2%) | 1,324 (19.4%) |
| 65 to 74 Years | 715 (25.0%) | 583 (17.6%) |
| 75 Years and over | 981 (50.6%) | 1,092 (44.0%) |
Disability Class by Sex by Age in Macon County
Disability Class: Hearing Difficulty
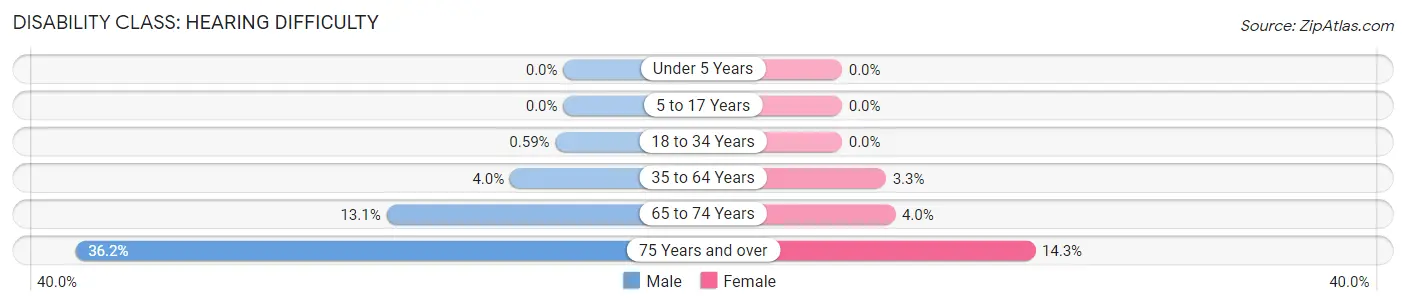
| Age Bracket | Male | Female |
| Under 5 Years | 0 (0.0%) | 0 (0.0%) |
| 5 to 17 Years | 0 (0.0%) | 0 (0.0%) |
| 18 to 34 Years | 18 (0.6%) | 0 (0.0%) |
| 35 to 64 Years | 268 (4.0%) | 222 (3.3%) |
| 65 to 74 Years | 375 (13.1%) | 131 (4.0%) |
| 75 Years and over | 702 (36.2%) | 356 (14.3%) |
Disability Class: Vision Difficulty
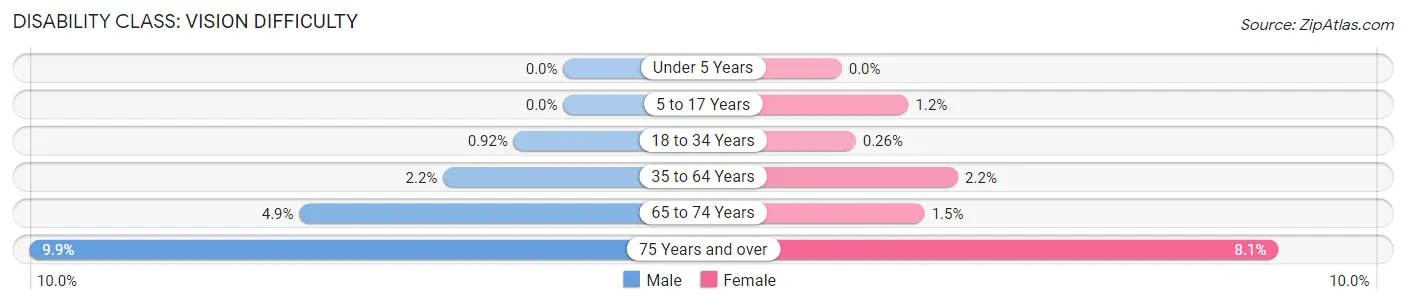
| Age Bracket | Male | Female |
| Under 5 Years | 0 (0.0%) | 0 (0.0%) |
| 5 to 17 Years | 0 (0.0%) | 30 (1.2%) |
| 18 to 34 Years | 28 (0.9%) | 8 (0.3%) |
| 35 to 64 Years | 151 (2.2%) | 147 (2.2%) |
| 65 to 74 Years | 140 (4.9%) | 51 (1.5%) |
| 75 Years and over | 192 (9.9%) | 201 (8.1%) |
Disability Class: Cognitive Difficulty
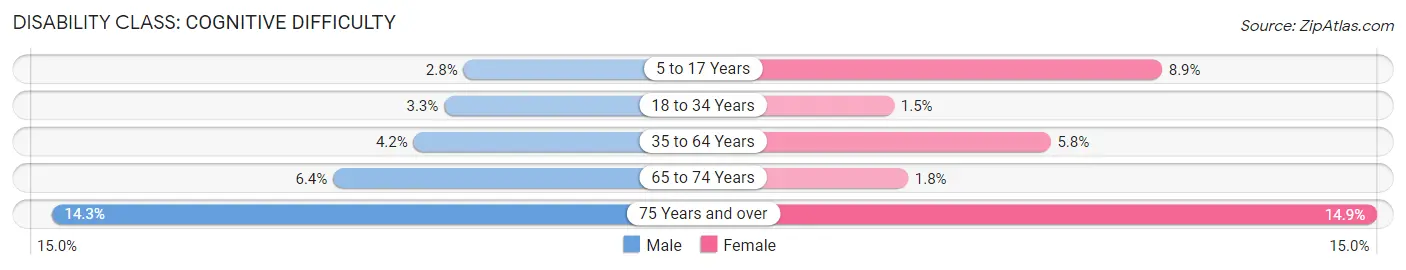
| Age Bracket | Male | Female |
| 5 to 17 Years | 71 (2.8%) | 215 (8.9%) |
| 18 to 34 Years | 101 (3.3%) | 45 (1.5%) |
| 35 to 64 Years | 282 (4.2%) | 396 (5.8%) |
| 65 to 74 Years | 183 (6.4%) | 61 (1.8%) |
| 75 Years and over | 276 (14.2%) | 370 (14.9%) |
Disability Class: Ambulatory Difficulty
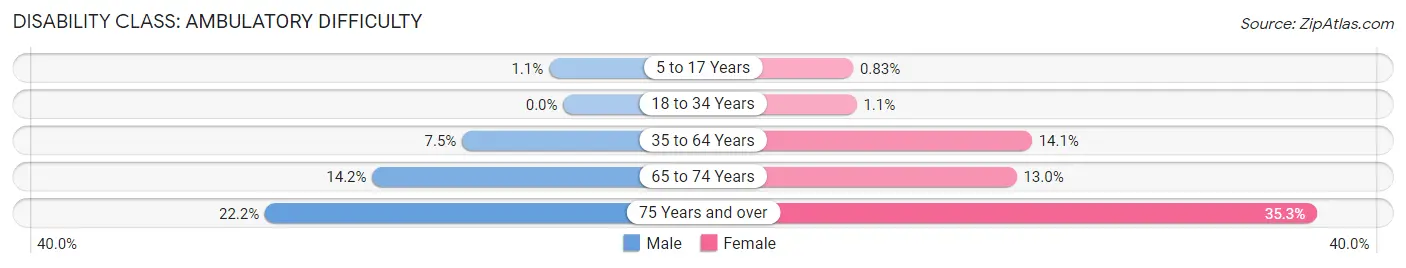
| Age Bracket | Male | Female |
| 5 to 17 Years | 27 (1.1%) | 20 (0.8%) |
| 18 to 34 Years | 0 (0.0%) | 34 (1.1%) |
| 35 to 64 Years | 508 (7.5%) | 961 (14.1%) |
| 65 to 74 Years | 405 (14.2%) | 430 (13.0%) |
| 75 Years and over | 429 (22.2%) | 876 (35.3%) |
Disability Class: Self-Care Difficulty
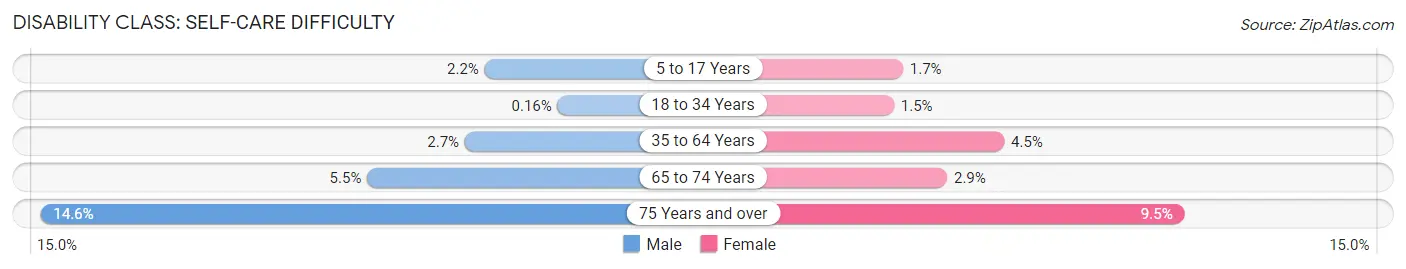
| Age Bracket | Male | Female |
| 5 to 17 Years | 56 (2.2%) | 41 (1.7%) |
| 18 to 34 Years | 5 (0.2%) | 45 (1.5%) |
| 35 to 64 Years | 185 (2.7%) | 308 (4.5%) |
| 65 to 74 Years | 156 (5.5%) | 97 (2.9%) |
| 75 Years and over | 282 (14.6%) | 237 (9.5%) |
Technology Access in Macon County
Computing Device Access in Macon County
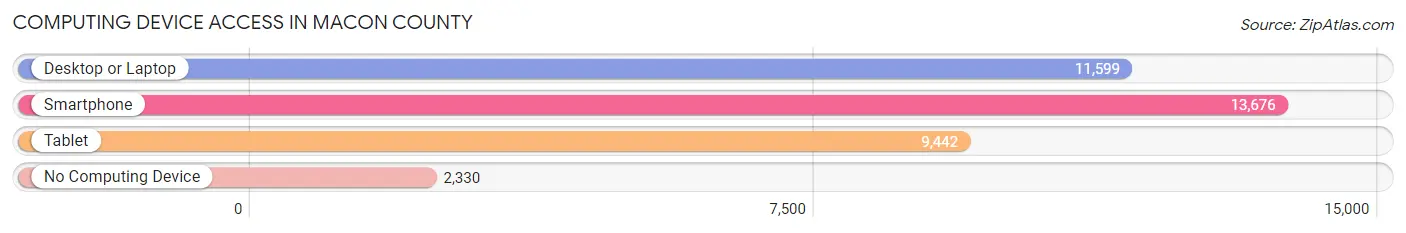
| Device Type | # Households | % Households |
| Desktop or Laptop | 11,599 | 66.7% |
| Smartphone | 13,676 | 78.7% |
| Tablet | 9,442 | 54.3% |
| No Computing Device | 2,330 | 13.4% |
| Total | 17,386 | 100.0% |
Internet Access in Macon County
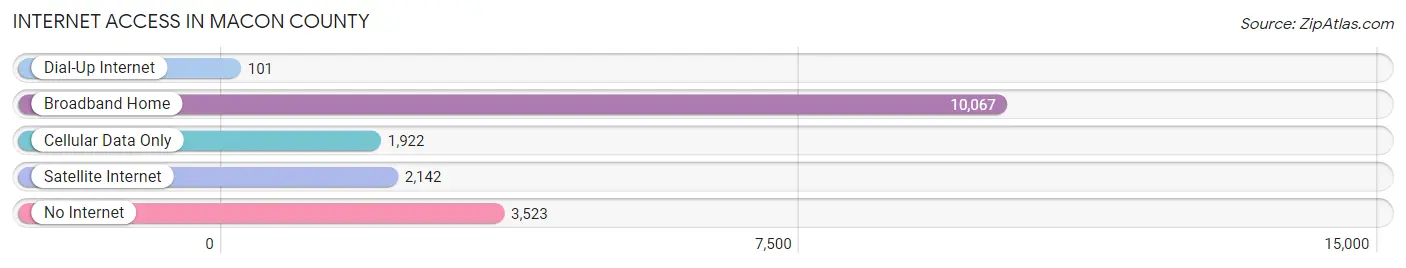
| Internet Type | # Households | % Households |
| Dial-Up Internet | 101 | 0.6% |
| Broadband Home | 10,067 | 57.9% |
| Cellular Data Only | 1,922 | 11.1% |
| Satellite Internet | 2,142 | 12.3% |
| No Internet | 3,523 | 20.3% |
| Total | 17,386 | 100.0% |
Macon County Summary
Macon County is located in the western part of North Carolina, in the Appalachian Mountains. It is bordered by Cherokee, Clay, Graham, Jackson, and Swain counties. The county seat is Franklin, and the largest city is Highlands. The county was formed in 1828 from the western part of Haywood County. It was named for Nathaniel Macon, a Revolutionary War hero and U.S. Senator from North Carolina.
Geography
Macon County is located in the Appalachian Mountains of western North Carolina. It is bordered by Cherokee, Clay, Graham, Jackson, and Swain counties. The county covers an area of 517 square miles, with a population of 33,922 as of the 2010 census. The terrain is mostly mountainous, with elevations ranging from 1,000 to 6,000 feet. The highest point in the county is Whiteside Mountain, at 5,964 feet. The county is home to the Nantahala National Forest, which covers over 500,000 acres.
The county is drained by the Little Tennessee River, which flows through the county from east to west. The county is also home to several lakes, including Lake Chatuge, Lake Emory, and Lake Nantahala.
Climate
Macon County has a humid subtropical climate, with hot, humid summers and mild winters. The average annual temperature is 57°F, with an average high of 73°F in July and an average low of 41°F in January. The average annual precipitation is 55 inches, with the wettest month being July, with an average of 6.5 inches of rain.
Demographics
As of the 2010 census, Macon County had a population of 33,922. The racial makeup of the county was 92.3% White, 4.2% Black or African American, 0.5% Native American, 0.3% Asian, 0.1% Pacific Islander, 1.3% from other races, and 1.3% from two or more races. Hispanic or Latino of any race were 3.2% of the population.
The median income for a household in the county was $35,945, and the median income for a family was $41,945. The per capita income for the county was $19,945. About 15.3% of families and 19.2% of the population were below the poverty line, including 25.2% of those under age 18 and 14.2% of those age 65 or over.
Economy
Macon County's economy is largely based on tourism, with the county's scenic mountains and lakes attracting visitors from all over the world. The county is also home to several manufacturing companies, including a paper mill, a furniture factory, and a plastics plant. Agriculture is also an important part of the county's economy, with the main crops being corn, soybeans, and hay.
The county is home to several colleges and universities, including Western Carolina University, Southwestern Community College, and the University of North Carolina at Asheville. The county is also home to several hospitals, including Angel Medical Center and Highlands-Cashiers Hospital.
Conclusion
Macon County is located in the western part of North Carolina, in the Appalachian Mountains. It is bordered by Cherokee, Clay, Graham, Jackson, and Swain counties. The county covers an area of 517 square miles, with a population of 33,922 as of the 2010 census. The county's economy is largely based on tourism, with the county's scenic mountains and lakes attracting visitors from all over the world. The county is also home to several manufacturing companies, as well as several colleges and universities. Macon County is a beautiful and diverse county, with something to offer everyone.
Common Questions
What is Per Capita Income in Macon County?
Per Capita income in Macon County is $32,623.
What is the Median Family Income in Macon County?
Median Family Income in Macon County is $68,113.
What is the Median Household income in Macon County?
Median Household Income in Macon County is $51,042.
What is Income or Wage Gap in Macon County?
Income or Wage Gap in Macon County is 26.2%.
Women in Macon County earn 73.8 cents for every dollar earned by a man.
What is Inequality or Gini Index in Macon County?
Inequality or Gini Index in Macon County is 0.47.
What is the Total Population of Macon County?
Total Population of Macon County is 37,088.
What is the Total Male Population of Macon County?
Total Male Population of Macon County is 18,191.
What is the Total Female Population of Macon County?
Total Female Population of Macon County is 18,897.
What is the Ratio of Males per 100 Females in Macon County?
There are 96.26 Males per 100 Females in Macon County.
What is the Ratio of Females per 100 Males in Macon County?
There are 103.88 Females per 100 Males in Macon County.
What is the Median Population Age in Macon County?
Median Population Age in Macon County is 50.6 Years.
What is the Average Family Size in Macon County
Average Family Size in Macon County is 2.7 People.
What is the Average Household Size in Macon County
Average Household Size in Macon County is 2.1 People.
How Large is the Labor Force in Macon County?
There are 16,290 People in the Labor Forcein in Macon County.
What is the Percentage of People in the Labor Force in Macon County?
52.0% of People are in the Labor Force in Macon County.
What is the Unemployment Rate in Macon County?
Unemployment Rate in Macon County is 3.5%.