Lenoir County, NC Map & Demographics
Lenoir County Map
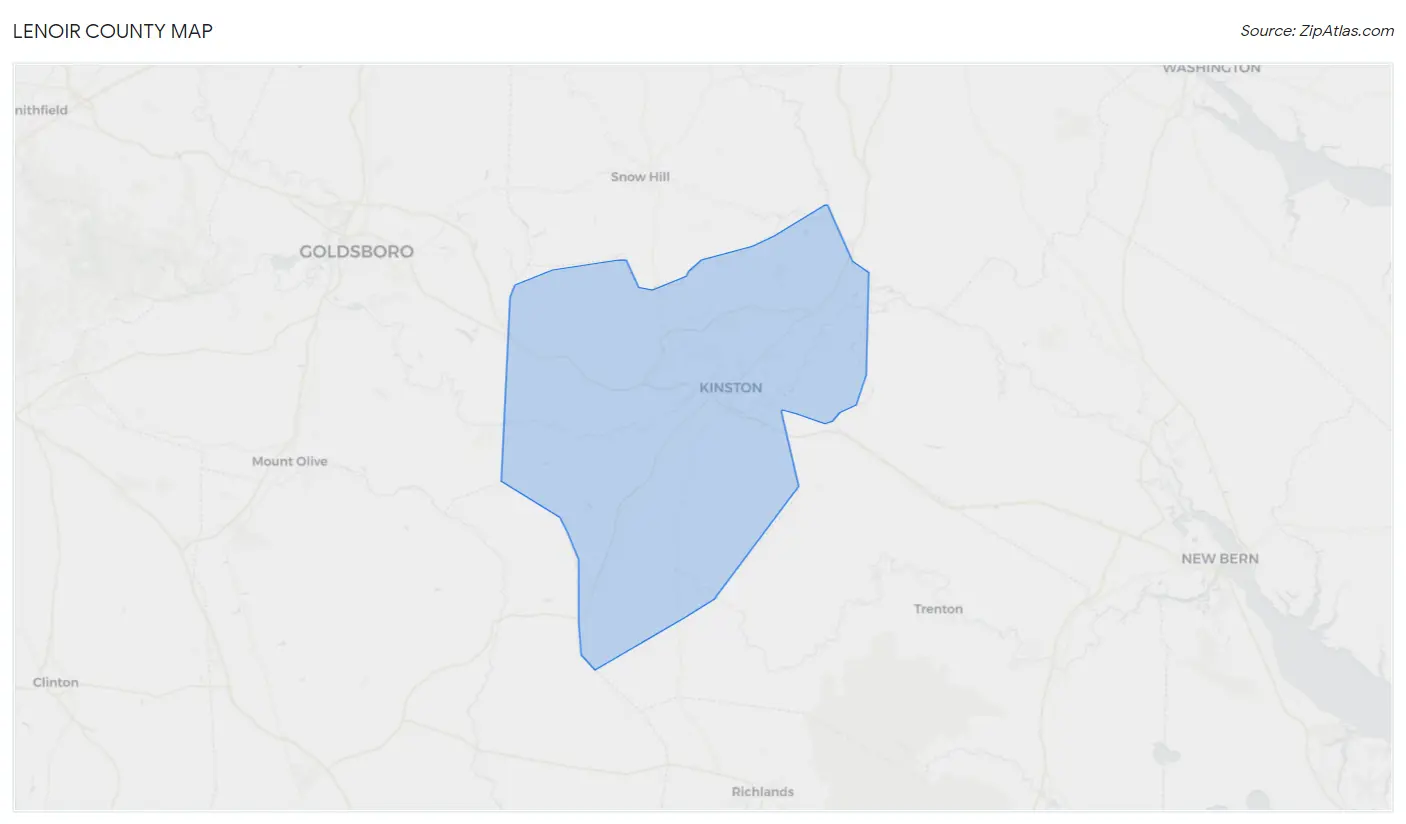
Lenoir County Overview
$26,697
PER CAPITA INCOME
$56,723
AVG FAMILY INCOME
$43,063
AVG HOUSEHOLD INCOME
17.7%
WAGE / INCOME GAP [ % ]
82.3¢/ $1
WAGE / INCOME GAP [ $ ]
$10,299
FAMILY INCOME DEFICIT
0.47
INEQUALITY / GINI INDEX
55,071
TOTAL POPULATION
26,348
MALE POPULATION
28,723
FEMALE POPULATION
91.73
MALES / 100 FEMALES
109.01
FEMALES / 100 MALES
42.7
MEDIAN AGE
3.0
AVG FAMILY SIZE
2.4
AVG HOUSEHOLD SIZE
24,538
LABOR FORCE [ PEOPLE ]
55.4%
PERCENT IN LABOR FORCE
7.1%
UNEMPLOYMENT RATE
Lenoir County Area Codes
Income in Lenoir County
Income Overview in Lenoir County
Per Capita Income in Lenoir County is $26,697, while median incomes of families and households are $56,723 and $43,063 respectively.
| Characteristic | Number | Measure |
| Per Capita Income | 55,071 | $26,697 |
| Median Family Income | 13,578 | $56,723 |
| Mean Family Income | 13,578 | $74,600 |
| Median Household Income | 22,665 | $43,063 |
| Mean Household Income | 22,665 | $60,635 |
| Income Deficit | 13,578 | $10,299 |
| Wage / Income Gap (%) | 55,071 | 17.70% |
| Wage / Income Gap ($) | 55,071 | 82.30¢ per $1 |
| Gini / Inequality Index | 55,071 | 0.47 |
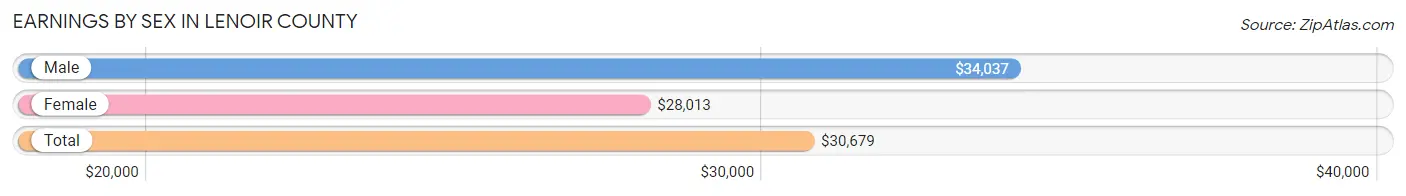
Earnings by Sex in Lenoir County
Average Earnings in Lenoir County are $30,679, $34,037 for men and $28,013 for women, a difference of 17.7%.
| Sex | Number | Average Earnings |
| Male | 12,763 (50.4%) | $34,037 |
| Female | 12,536 (49.5%) | $28,013 |
| Total | 25,299 (100.0%) | $30,679 |
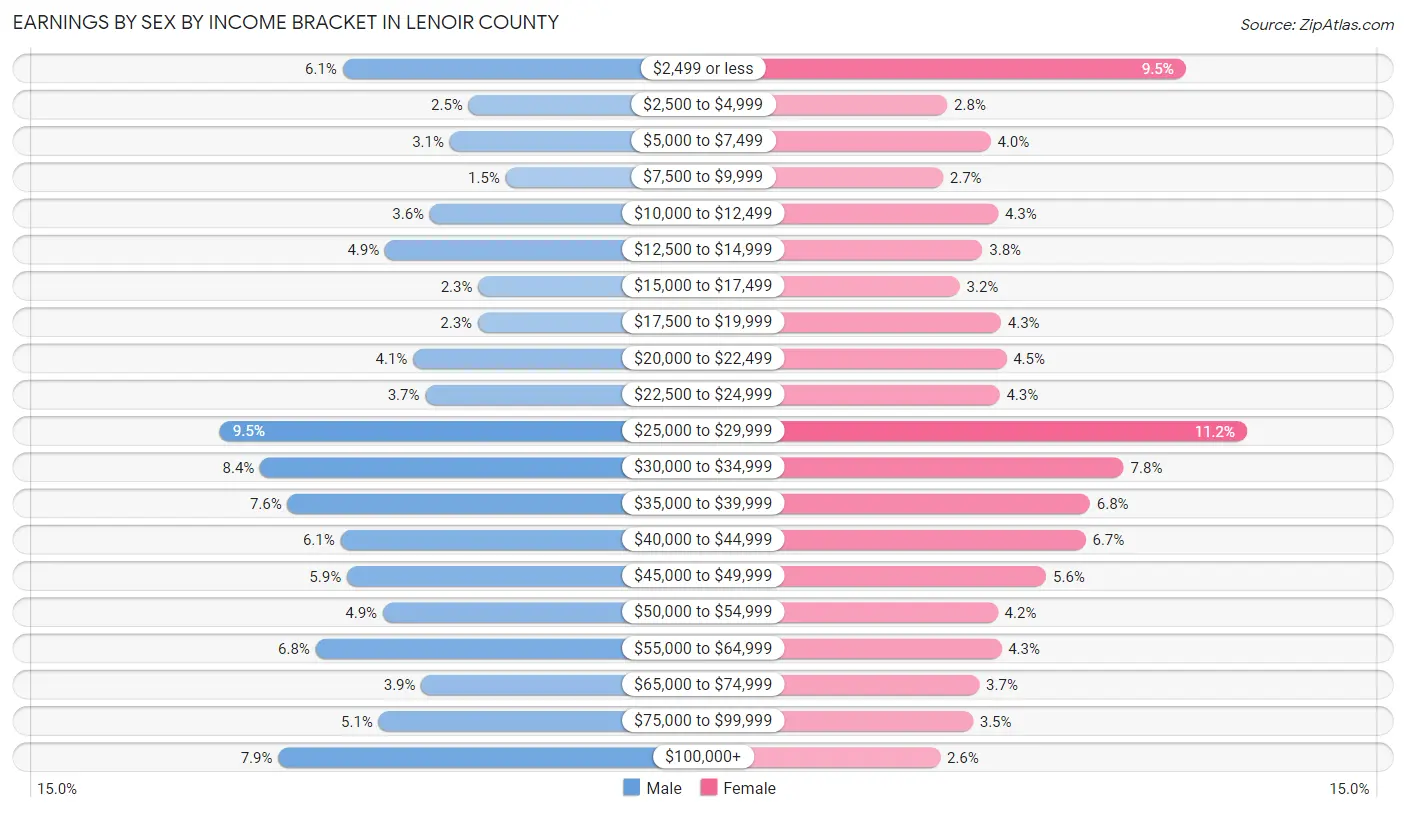
Earnings by Sex by Income Bracket in Lenoir County
The most common earnings brackets in Lenoir County are $25,000 to $29,999 for men (1,214 | 9.5%) and $25,000 to $29,999 for women (1,409 | 11.2%).
| Income | Male | Female |
| $2,499 or less | 774 (6.1%) | 1,193 (9.5%) |
| $2,500 to $4,999 | 322 (2.5%) | 353 (2.8%) |
| $5,000 to $7,499 | 389 (3.0%) | 506 (4.0%) |
| $7,500 to $9,999 | 189 (1.5%) | 338 (2.7%) |
| $10,000 to $12,499 | 461 (3.6%) | 533 (4.3%) |
| $12,500 to $14,999 | 622 (4.9%) | 478 (3.8%) |
| $15,000 to $17,499 | 287 (2.2%) | 397 (3.2%) |
| $17,500 to $19,999 | 288 (2.3%) | 543 (4.3%) |
| $20,000 to $22,499 | 521 (4.1%) | 561 (4.5%) |
| $22,500 to $24,999 | 477 (3.7%) | 538 (4.3%) |
| $25,000 to $29,999 | 1,214 (9.5%) | 1,409 (11.2%) |
| $30,000 to $34,999 | 1,069 (8.4%) | 975 (7.8%) |
| $35,000 to $39,999 | 971 (7.6%) | 856 (6.8%) |
| $40,000 to $44,999 | 781 (6.1%) | 841 (6.7%) |
| $45,000 to $49,999 | 758 (5.9%) | 702 (5.6%) |
| $50,000 to $54,999 | 629 (4.9%) | 531 (4.2%) |
| $55,000 to $64,999 | 870 (6.8%) | 544 (4.3%) |
| $65,000 to $74,999 | 491 (3.8%) | 466 (3.7%) |
| $75,000 to $99,999 | 645 (5.1%) | 444 (3.5%) |
| $100,000+ | 1,005 (7.9%) | 328 (2.6%) |
| Total | 12,763 (100.0%) | 12,536 (100.0%) |
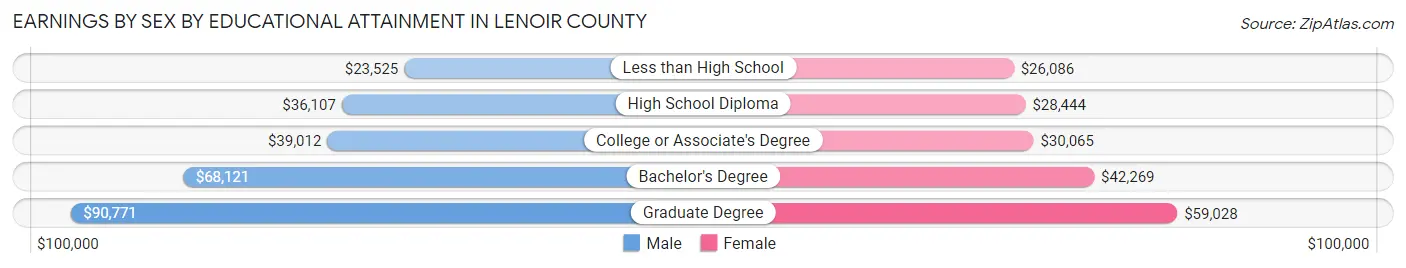
Earnings by Sex by Educational Attainment in Lenoir County
Average earnings in Lenoir County are $36,737 for men and $31,784 for women, a difference of 13.5%. Men with an educational attainment of graduate degree enjoy the highest average annual earnings of $90,771, while those with less than high school education earn the least with $23,525. Women with an educational attainment of graduate degree earn the most with the average annual earnings of $59,028, while those with less than high school education have the smallest earnings of $26,086.
| Educational Attainment | Male Income | Female Income |
| Less than High School | $23,525 | $26,086 |
| High School Diploma | $36,107 | $28,444 |
| College or Associate's Degree | $39,012 | $30,065 |
| Bachelor's Degree | $68,121 | $42,269 |
| Graduate Degree | $90,771 | $59,028 |
| Total | $36,737 | $31,784 |
Family Income in Lenoir County
Family Income Brackets in Lenoir County
According to the Lenoir County family income data, there are 2,485 families falling into the $50,000 to $74,999 income range, which is the most common income bracket and makes up 18.3% of all families. Conversely, the $200,000+ income bracket is the least frequent group with only 448 families (3.3%) belonging to this category.
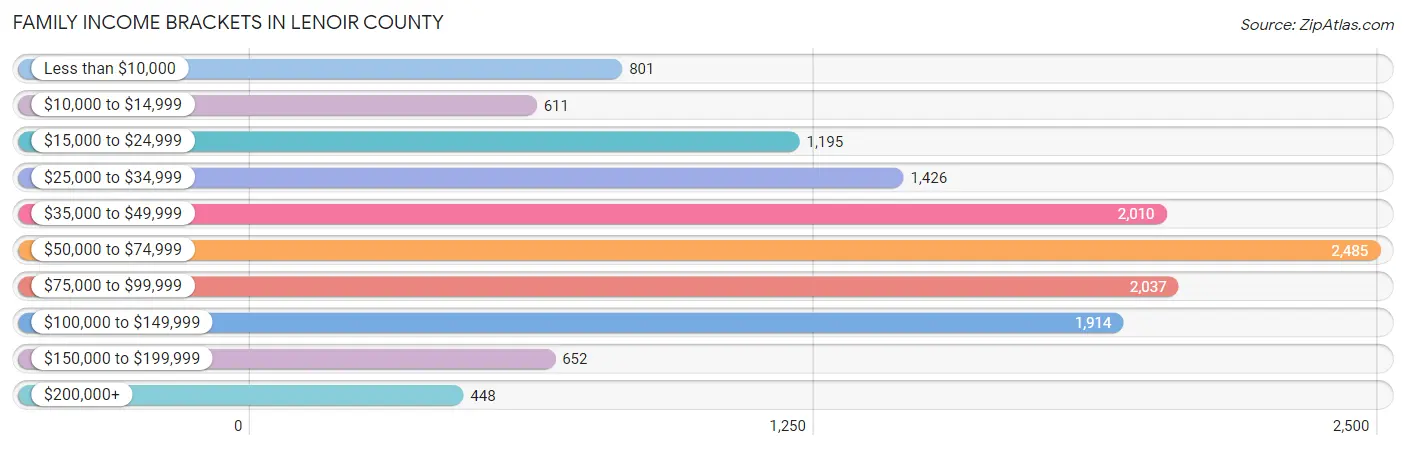
| Income Bracket | # Families | % Families |
| Less than $10,000 | 801 | 5.9% |
| $10,000 to $14,999 | 611 | 4.5% |
| $15,000 to $24,999 | 1,195 | 8.8% |
| $25,000 to $34,999 | 1,426 | 10.5% |
| $35,000 to $49,999 | 2,010 | 14.8% |
| $50,000 to $74,999 | 2,485 | 18.3% |
| $75,000 to $99,999 | 2,037 | 15.0% |
| $100,000 to $149,999 | 1,914 | 14.1% |
| $150,000 to $199,999 | 652 | 4.8% |
| $200,000+ | 448 | 3.3% |
Family Income by Famaliy Size in Lenoir County
7+ person families (216 | 1.6%) account for the highest median family income in Lenoir County with $95,242 per family, while 2-person families (6,677 | 49.2%) have the highest median income of $27,988 per family member.
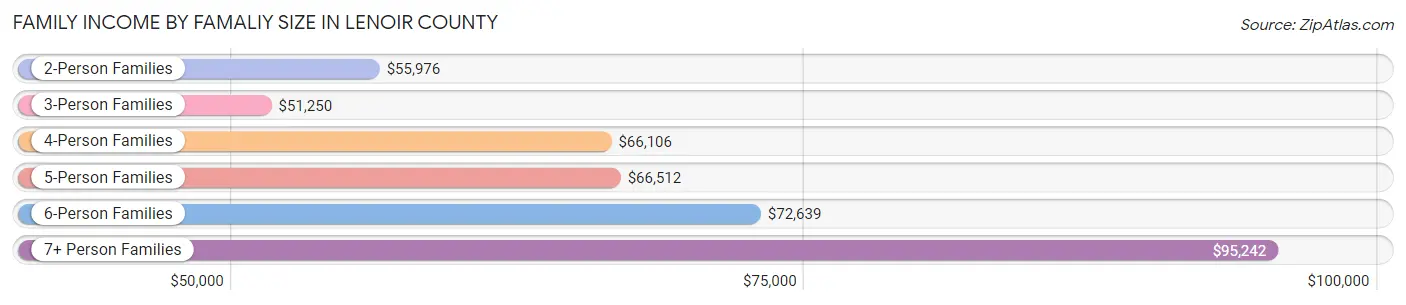
| Income Bracket | # Families | Median Income |
| 2-Person Families | 6,677 (49.2%) | $55,976 |
| 3-Person Families | 3,006 (22.1%) | $51,250 |
| 4-Person Families | 2,337 (17.2%) | $66,106 |
| 5-Person Families | 1,154 (8.5%) | $66,512 |
| 6-Person Families | 188 (1.4%) | $72,639 |
| 7+ Person Families | 216 (1.6%) | $95,242 |
| Total | 13,578 (100.0%) | $56,723 |
Family Income by Number of Earners in Lenoir County
The median family income in Lenoir County is $56,723, with families comprising 3+ earners (1,016) having the highest median family income of $108,889, while families with no earners (2,725) have the lowest median family income of $33,698, accounting for 7.5% and 20.1% of families, respectively.
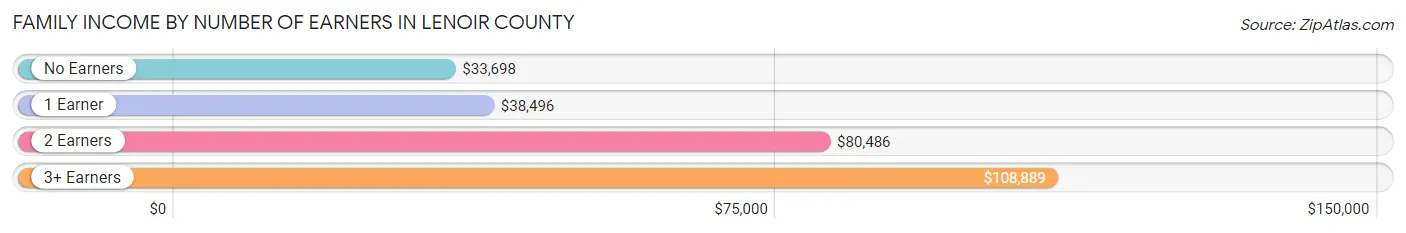
| Number of Earners | # Families | Median Income |
| No Earners | 2,725 (20.1%) | $33,698 |
| 1 Earner | 4,720 (34.8%) | $38,496 |
| 2 Earners | 5,117 (37.7%) | $80,486 |
| 3+ Earners | 1,016 (7.5%) | $108,889 |
| Total | 13,578 (100.0%) | $56,723 |
Household Income in Lenoir County
Household Income Brackets in Lenoir County
With 3,853 households falling in the category, the $35,000 to $49,999 income range is the most frequent in Lenoir County, accounting for 17.0% of all households. In contrast, only 521 households (2.3%) fall into the $200,000+ income bracket, making it the least populous group.
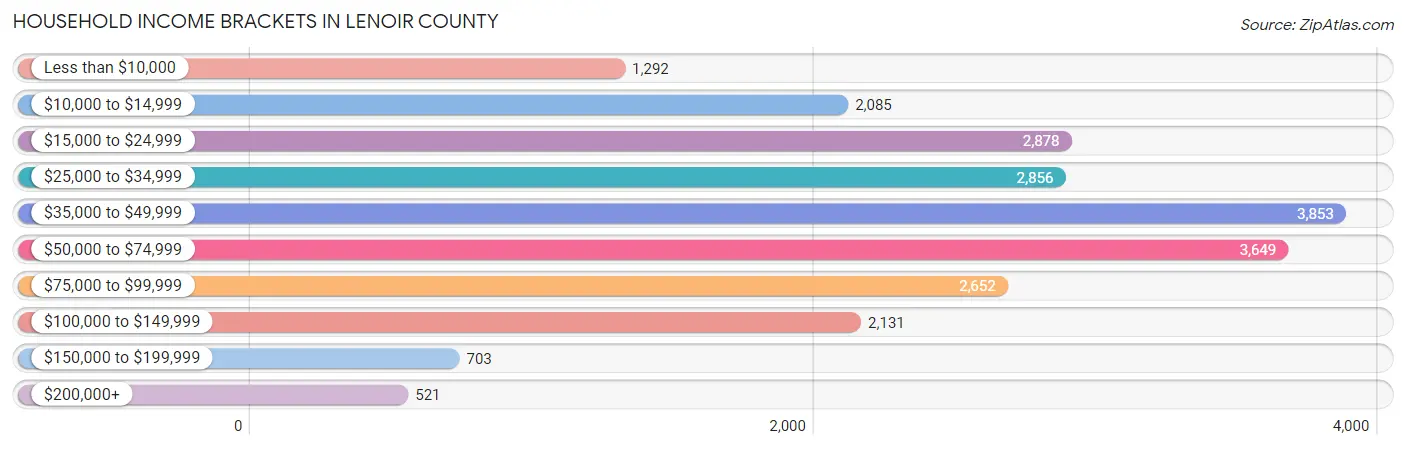
| Income Bracket | # Households | % Households |
| Less than $10,000 | 1,292 | 5.7% |
| $10,000 to $14,999 | 2,085 | 9.2% |
| $15,000 to $24,999 | 2,878 | 12.7% |
| $25,000 to $34,999 | 2,856 | 12.6% |
| $35,000 to $49,999 | 3,853 | 17.0% |
| $50,000 to $74,999 | 3,649 | 16.1% |
| $75,000 to $99,999 | 2,652 | 11.7% |
| $100,000 to $149,999 | 2,131 | 9.4% |
| $150,000 to $199,999 | 703 | 3.1% |
| $200,000+ | 521 | 2.3% |
Household Income by Householder Age in Lenoir County
The median household income in Lenoir County is $43,063, with the highest median household income of $54,600 found in the 45 to 64 years age bracket for the primary householder. A total of 8,332 households (36.8%) fall into this category. Meanwhile, the 65+ years age bracket for the primary householder has the lowest median household income of $38,153, with 7,522 households (33.2%) in this group.
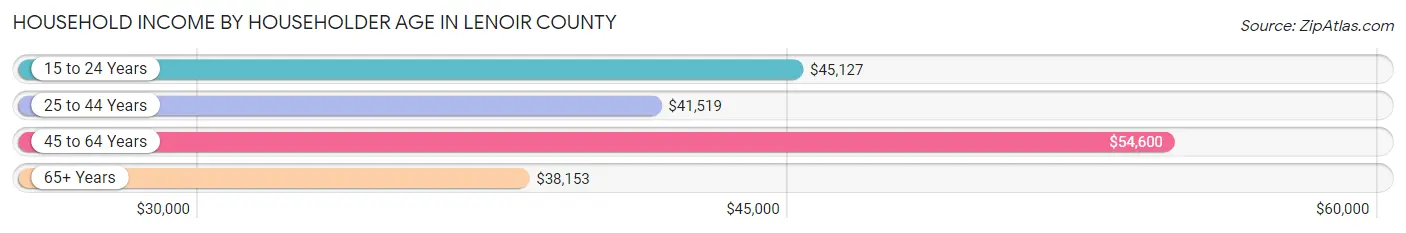
| Income Bracket | # Households | Median Income |
| 15 to 24 Years | 882 (3.9%) | $45,127 |
| 25 to 44 Years | 5,929 (26.2%) | $41,519 |
| 45 to 64 Years | 8,332 (36.8%) | $54,600 |
| 65+ Years | 7,522 (33.2%) | $38,153 |
| Total | 22,665 (100.0%) | $43,063 |
Poverty in Lenoir County
Income Below Poverty by Sex and Age in Lenoir County
With 20.1% poverty level for males and 24.5% for females among the residents of Lenoir County, 15 year old males and 15 year old females are the most vulnerable to poverty, with 133 males (42.2%) and 236 females (74.0%) in their respective age groups living below the poverty level.
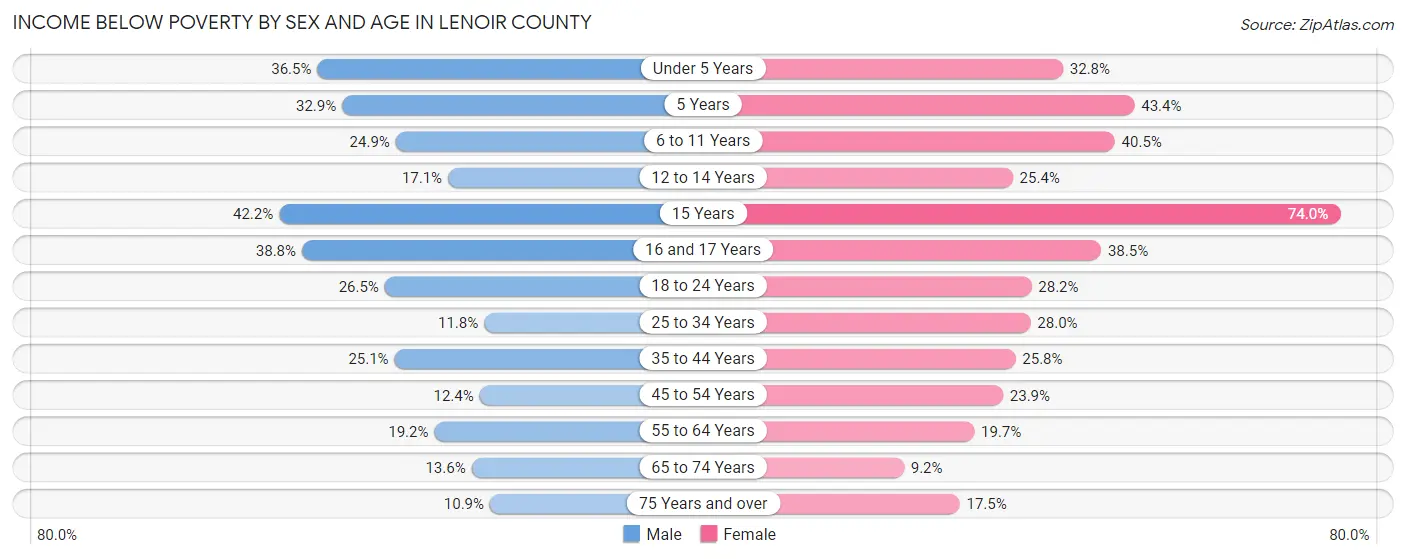
| Age Bracket | Male | Female |
| Under 5 Years | 616 (36.5%) | 455 (32.8%) |
| 5 Years | 184 (32.9%) | 129 (43.4%) |
| 6 to 11 Years | 435 (24.9%) | 799 (40.5%) |
| 12 to 14 Years | 187 (17.1%) | 292 (25.4%) |
| 15 Years | 133 (42.2%) | 236 (74.0%) |
| 16 and 17 Years | 325 (38.8%) | 276 (38.5%) |
| 18 to 24 Years | 528 (26.5%) | 615 (28.1%) |
| 25 to 34 Years | 350 (11.8%) | 838 (28.0%) |
| 35 to 44 Years | 674 (25.1%) | 791 (25.8%) |
| 45 to 54 Years | 390 (12.4%) | 841 (23.9%) |
| 55 to 64 Years | 732 (19.2%) | 821 (19.7%) |
| 65 to 74 Years | 404 (13.6%) | 332 (9.2%) |
| 75 Years and over | 199 (10.9%) | 511 (17.5%) |
| Total | 5,157 (20.1%) | 6,936 (24.5%) |
Income Above Poverty by Sex and Age in Lenoir County
According to the poverty statistics in Lenoir County, males aged 75 years and over and females aged 65 to 74 years are the age groups that are most secure financially, with 89.1% of males and 90.8% of females in these age groups living above the poverty line.
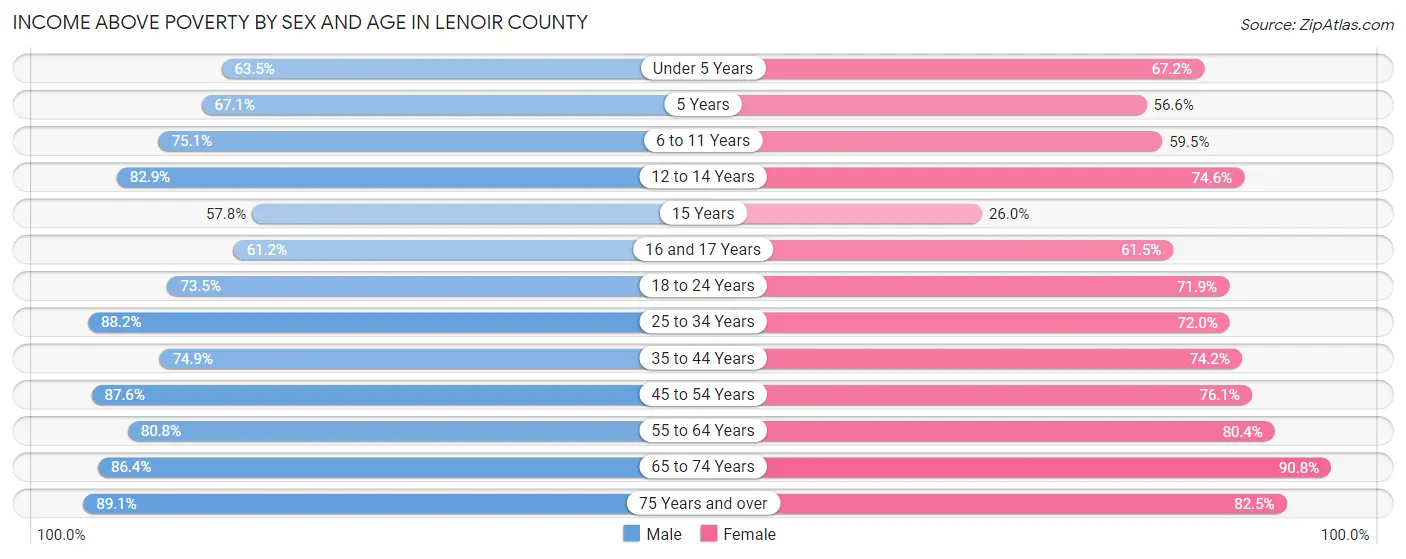
| Age Bracket | Male | Female |
| Under 5 Years | 1,070 (63.5%) | 931 (67.2%) |
| 5 Years | 376 (67.1%) | 168 (56.6%) |
| 6 to 11 Years | 1,312 (75.1%) | 1,173 (59.5%) |
| 12 to 14 Years | 904 (82.9%) | 859 (74.6%) |
| 15 Years | 182 (57.8%) | 83 (26.0%) |
| 16 and 17 Years | 512 (61.2%) | 441 (61.5%) |
| 18 to 24 Years | 1,462 (73.5%) | 1,570 (71.9%) |
| 25 to 34 Years | 2,621 (88.2%) | 2,154 (72.0%) |
| 35 to 44 Years | 2,013 (74.9%) | 2,278 (74.2%) |
| 45 to 54 Years | 2,744 (87.6%) | 2,675 (76.1%) |
| 55 to 64 Years | 3,089 (80.8%) | 3,357 (80.3%) |
| 65 to 74 Years | 2,557 (86.4%) | 3,278 (90.8%) |
| 75 Years and over | 1,625 (89.1%) | 2,412 (82.5%) |
| Total | 20,467 (79.9%) | 21,379 (75.5%) |
Income Below Poverty Among Married-Couple Families in Lenoir County
The poverty statistics for married-couple families in Lenoir County show that 6.9% or 555 of the total 8,106 families live below the poverty line. Families with 3 or 4 children have the highest poverty rate of 20.2%, comprising of 98 families. On the other hand, families with 5 or more children have the lowest poverty rate of 0.0%, which includes 0 families.
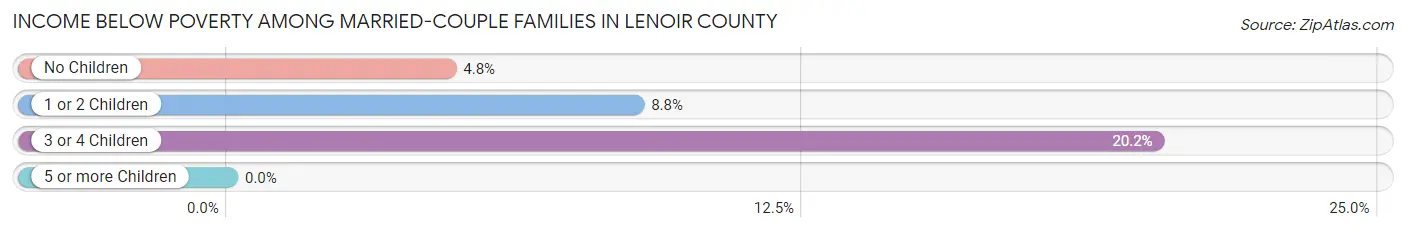
| Children | Above Poverty | Below Poverty |
| No Children | 4,992 (95.3%) | 249 (4.8%) |
| 1 or 2 Children | 2,144 (91.2%) | 208 (8.8%) |
| 3 or 4 Children | 388 (79.8%) | 98 (20.2%) |
| 5 or more Children | 27 (100.0%) | 0 (0.0%) |
| Total | 7,551 (93.1%) | 555 (6.9%) |
Income Below Poverty Among Single-Parent Households in Lenoir County
According to the poverty data in Lenoir County, 24.9% or 273 single-father households and 39.7% or 1,738 single-mother households are living below the poverty line. Among single-father households, those with 3 or 4 children have the highest poverty rate, with 51 households (92.7%) experiencing poverty. Likewise, among single-mother households, those with 3 or 4 children have the highest poverty rate, with 447 households (59.8%) falling below the poverty line.
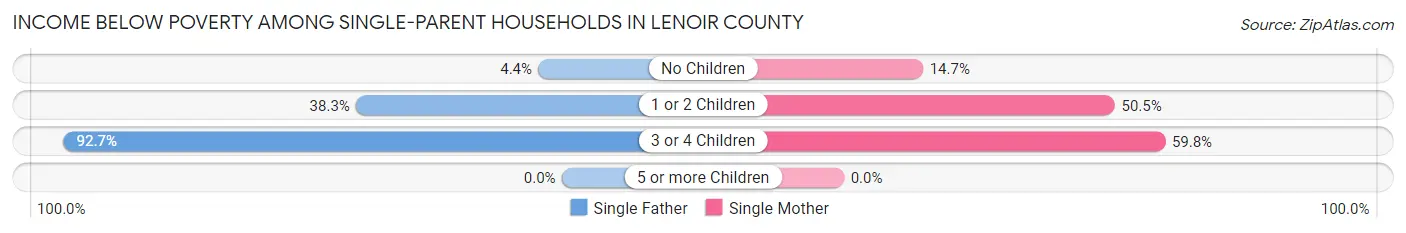
| Children | Single Father | Single Mother |
| No Children | 23 (4.4%) | 218 (14.7%) |
| 1 or 2 Children | 199 (38.3%) | 1,073 (50.4%) |
| 3 or 4 Children | 51 (92.7%) | 447 (59.8%) |
| 5 or more Children | 0 (0.0%) | 0 (0.0%) |
| Total | 273 (24.9%) | 1,738 (39.7%) |
Income Below Poverty Among Married-Couple vs Single-Parent Households in Lenoir County
The poverty data for Lenoir County shows that 555 of the married-couple family households (6.9%) and 2,011 of the single-parent households (36.7%) are living below the poverty level. Within the married-couple family households, those with 3 or 4 children have the highest poverty rate, with 98 households (20.2%) falling below the poverty line. Among the single-parent households, those with 3 or 4 children have the highest poverty rate, with 498 household (62.1%) living below poverty.
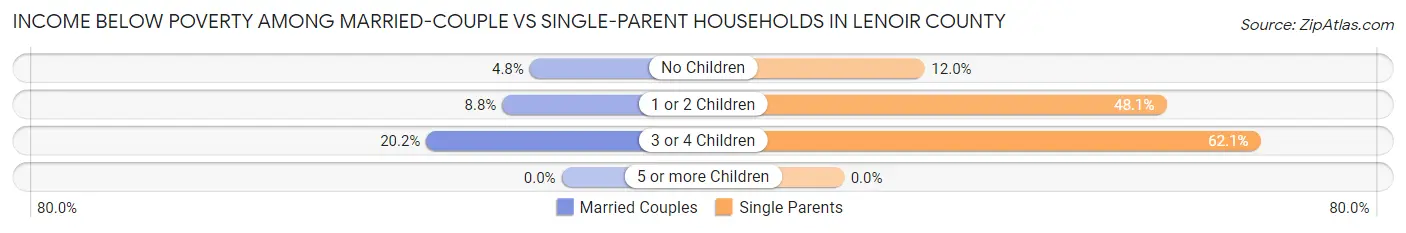
| Children | Married-Couple Families | Single-Parent Households |
| No Children | 249 (4.8%) | 241 (12.0%) |
| 1 or 2 Children | 208 (8.8%) | 1,272 (48.1%) |
| 3 or 4 Children | 98 (20.2%) | 498 (62.1%) |
| 5 or more Children | 0 (0.0%) | 0 (0.0%) |
| Total | 555 (6.9%) | 2,011 (36.7%) |
Race in Lenoir County
The most populous races in Lenoir County are White / Caucasian (28,400 | 51.6%), Black / African American (22,117 | 40.2%), and Hispanic or Latino (4,553 | 8.3%).
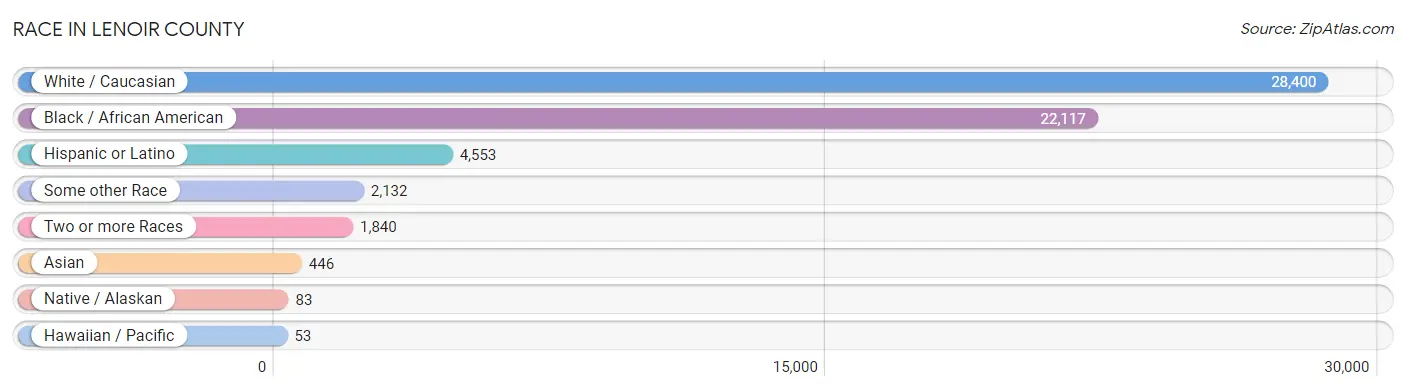
| Race | # Population | % Population |
| Asian | 446 | 0.8% |
| Black / African American | 22,117 | 40.2% |
| Hawaiian / Pacific | 53 | 0.1% |
| Hispanic or Latino | 4,553 | 8.3% |
| Native / Alaskan | 83 | 0.2% |
| White / Caucasian | 28,400 | 51.6% |
| Two or more Races | 1,840 | 3.3% |
| Some other Race | 2,132 | 3.9% |
| Total | 55,071 | 100.0% |
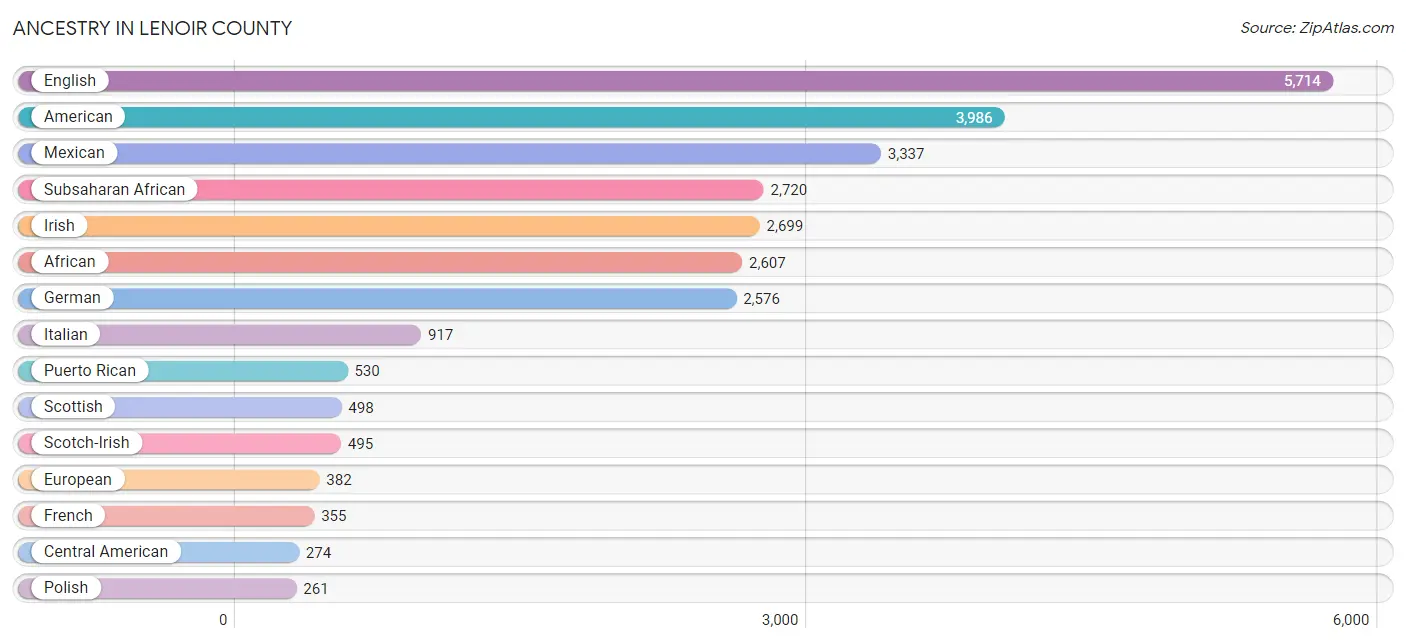
Ancestry in Lenoir County
The most populous ancestries reported in Lenoir County are English (5,714 | 10.4%), American (3,986 | 7.2%), Mexican (3,337 | 6.1%), Subsaharan African (2,720 | 4.9%), and Irish (2,699 | 4.9%), together accounting for 33.5% of all Lenoir County residents.
| Ancestry | # Population | % Population |
| African | 2,607 | 4.7% |
| American | 3,986 | 7.2% |
| Arab | 64 | 0.1% |
| Austrian | 52 | 0.1% |
| Bahamian | 66 | 0.1% |
| Barbadian | 50 | 0.1% |
| Bhutanese | 40 | 0.1% |
| Blackfeet | 17 | 0.0% |
| British | 139 | 0.3% |
| Burmese | 68 | 0.1% |
| Celtic | 6 | 0.0% |
| Central American | 274 | 0.5% |
| Cherokee | 242 | 0.4% |
| Chilean | 21 | 0.0% |
| Croatian | 3 | 0.0% |
| Cuban | 62 | 0.1% |
| Czechoslovakian | 67 | 0.1% |
| Danish | 12 | 0.0% |
| Dominican | 44 | 0.1% |
| Dutch | 203 | 0.4% |
| Eastern European | 48 | 0.1% |
| Ecuadorian | 2 | 0.0% |
| English | 5,714 | 10.4% |
| European | 382 | 0.7% |
| French | 355 | 0.6% |
| French Canadian | 92 | 0.2% |
| German | 2,576 | 4.7% |
| Greek | 28 | 0.1% |
| Guatemalan | 150 | 0.3% |
| Haitian | 42 | 0.1% |
| Honduran | 98 | 0.2% |
| Hungarian | 86 | 0.2% |
| Indian (Asian) | 70 | 0.1% |
| Irish | 2,699 | 4.9% |
| Italian | 917 | 1.7% |
| Jamaican | 178 | 0.3% |
| Japanese | 59 | 0.1% |
| Korean | 54 | 0.1% |
| Lebanese | 7 | 0.0% |
| Lumbee | 59 | 0.1% |
| Mexican | 3,337 | 6.1% |
| Mexican American Indian | 45 | 0.1% |
| Mongolian | 21 | 0.0% |
| Native Hawaiian | 15 | 0.0% |
| Nigerian | 32 | 0.1% |
| Norwegian | 134 | 0.2% |
| Palestinian | 25 | 0.1% |
| Panamanian | 26 | 0.1% |
| Polish | 261 | 0.5% |
| Portuguese | 18 | 0.0% |
| Puerto Rican | 530 | 1.0% |
| Romanian | 43 | 0.1% |
| Russian | 44 | 0.1% |
| Scandinavian | 31 | 0.1% |
| Scotch-Irish | 495 | 0.9% |
| Scottish | 498 | 0.9% |
| Sioux | 33 | 0.1% |
| Slovak | 26 | 0.1% |
| South American | 23 | 0.0% |
| Sri Lankan | 244 | 0.4% |
| Subsaharan African | 2,720 | 4.9% |
| Swedish | 135 | 0.3% |
| Thai | 32 | 0.1% |
| Trinidadian and Tobagonian | 27 | 0.1% |
| Ugandan | 81 | 0.2% |
| Ukrainian | 64 | 0.1% |
| Welsh | 112 | 0.2% |
| West Indian | 50 | 0.1% | View All 68 Rows |
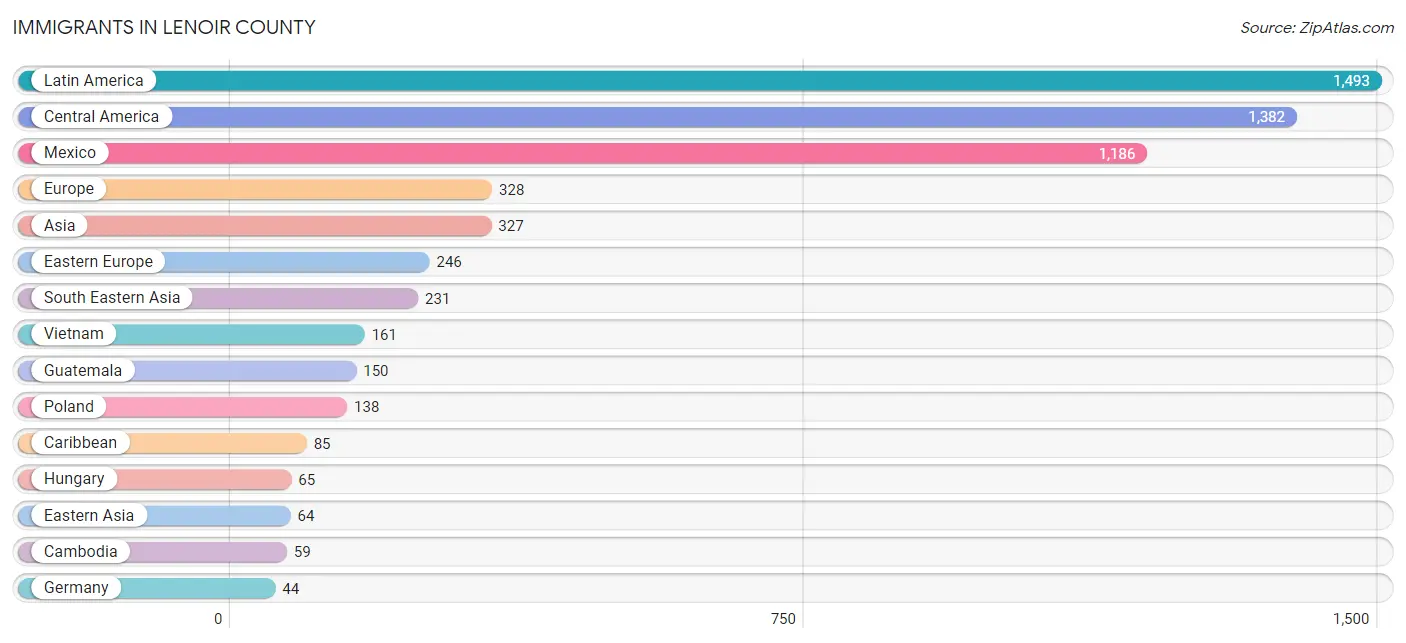
Immigrants in Lenoir County
The most numerous immigrant groups reported in Lenoir County came from Latin America (1,493 | 2.7%), Central America (1,382 | 2.5%), Mexico (1,186 | 2.1%), Europe (328 | 0.6%), and Asia (327 | 0.6%), together accounting for 8.6% of all Lenoir County residents.
| Immigration Origin | # Population | % Population |
| Africa | 42 | 0.1% |
| Asia | 327 | 0.6% |
| Brazil | 3 | 0.0% |
| Cambodia | 59 | 0.1% |
| Canada | 9 | 0.0% |
| Caribbean | 85 | 0.2% |
| Central America | 1,382 | 2.5% |
| Chile | 21 | 0.0% |
| China | 24 | 0.0% |
| Cuba | 41 | 0.1% |
| Dominican Republic | 23 | 0.0% |
| Eastern Africa | 17 | 0.0% |
| Eastern Asia | 64 | 0.1% |
| Eastern Europe | 246 | 0.4% |
| Ecuador | 2 | 0.0% |
| El Salvador | 29 | 0.1% |
| England | 10 | 0.0% |
| Europe | 328 | 0.6% |
| Germany | 44 | 0.1% |
| Greece | 7 | 0.0% |
| Guatemala | 150 | 0.3% |
| Haiti | 13 | 0.0% |
| Honduras | 17 | 0.0% |
| Hungary | 65 | 0.1% |
| Jamaica | 7 | 0.0% |
| Korea | 40 | 0.1% |
| Latin America | 1,493 | 2.7% |
| Mexico | 1,186 | 2.1% |
| Nigeria | 9 | 0.0% |
| Northern Europe | 31 | 0.1% |
| Philippines | 11 | 0.0% |
| Poland | 138 | 0.3% |
| Romania | 43 | 0.1% |
| South Africa | 8 | 0.0% |
| South America | 26 | 0.1% |
| South Eastern Asia | 231 | 0.4% |
| Southern Europe | 7 | 0.0% |
| Trinidad and Tobago | 1 | 0.0% |
| Uganda | 17 | 0.0% |
| Vietnam | 161 | 0.3% |
| Western Africa | 9 | 0.0% |
| Western Asia | 32 | 0.1% |
| Western Europe | 44 | 0.1% |
| Yemen | 32 | 0.1% | View All 44 Rows |
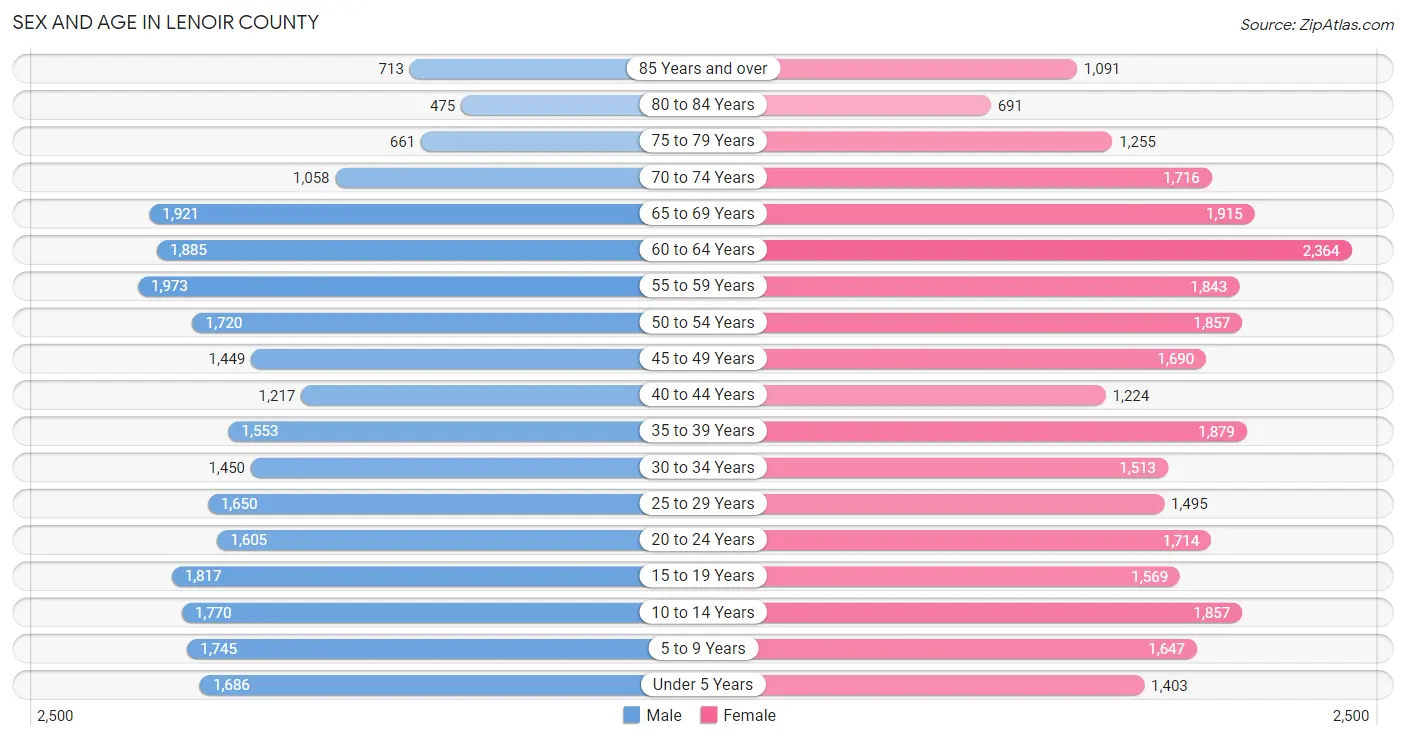
Sex and Age in Lenoir County
Sex and Age in Lenoir County
The most populous age groups in Lenoir County are 55 to 59 Years (1,973 | 7.5%) for men and 60 to 64 Years (2,364 | 8.2%) for women.
| Age Bracket | Male | Female |
| Under 5 Years | 1,686 (6.4%) | 1,403 (4.9%) |
| 5 to 9 Years | 1,745 (6.6%) | 1,647 (5.7%) |
| 10 to 14 Years | 1,770 (6.7%) | 1,857 (6.5%) |
| 15 to 19 Years | 1,817 (6.9%) | 1,569 (5.5%) |
| 20 to 24 Years | 1,605 (6.1%) | 1,714 (6.0%) |
| 25 to 29 Years | 1,650 (6.3%) | 1,495 (5.2%) |
| 30 to 34 Years | 1,450 (5.5%) | 1,513 (5.3%) |
| 35 to 39 Years | 1,553 (5.9%) | 1,879 (6.5%) |
| 40 to 44 Years | 1,217 (4.6%) | 1,224 (4.3%) |
| 45 to 49 Years | 1,449 (5.5%) | 1,690 (5.9%) |
| 50 to 54 Years | 1,720 (6.5%) | 1,857 (6.5%) |
| 55 to 59 Years | 1,973 (7.5%) | 1,843 (6.4%) |
| 60 to 64 Years | 1,885 (7.1%) | 2,364 (8.2%) |
| 65 to 69 Years | 1,921 (7.3%) | 1,915 (6.7%) |
| 70 to 74 Years | 1,058 (4.0%) | 1,716 (6.0%) |
| 75 to 79 Years | 661 (2.5%) | 1,255 (4.4%) |
| 80 to 84 Years | 475 (1.8%) | 691 (2.4%) |
| 85 Years and over | 713 (2.7%) | 1,091 (3.8%) |
| Total | 26,348 (100.0%) | 28,723 (100.0%) |
Families and Households in Lenoir County
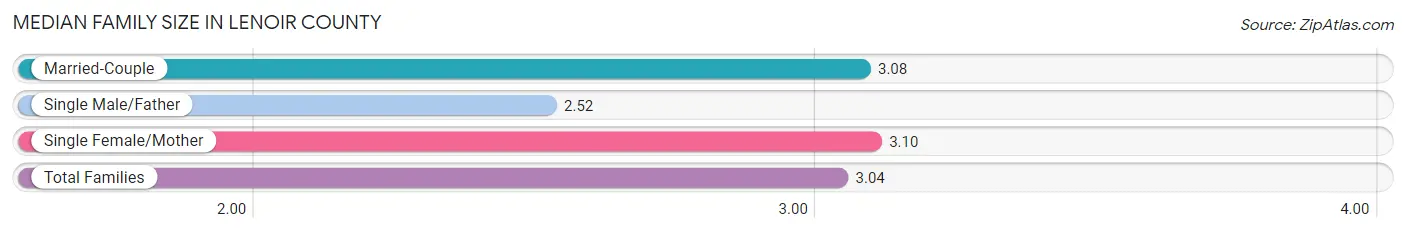
Median Family Size in Lenoir County
The median family size in Lenoir County is 3.04 persons per family, with single female/mother families (4,375 | 32.2%) accounting for the largest median family size of 3.1 persons per family. On the other hand, single male/father families (1,097 | 8.1%) represent the smallest median family size with 2.52 persons per family.
| Family Type | # Families | Family Size |
| Married-Couple | 8,106 (59.7%) | 3.08 |
| Single Male/Father | 1,097 (8.1%) | 2.52 |
| Single Female/Mother | 4,375 (32.2%) | 3.10 |
| Total Families | 13,578 (100.0%) | 3.04 |
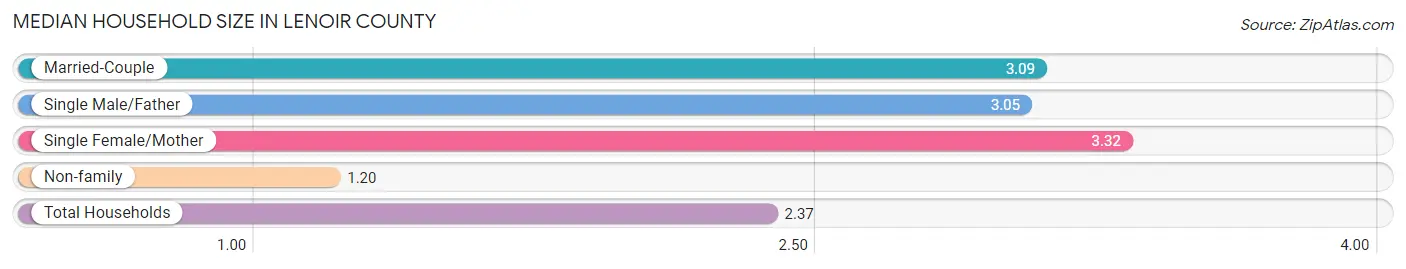
Median Household Size in Lenoir County
The median household size in Lenoir County is 2.37 persons per household, with single female/mother households (4,375 | 19.3%) accounting for the largest median household size of 3.32 persons per household. non-family households (9,087 | 40.1%) represent the smallest median household size with 1.20 persons per household.
| Household Type | # Households | Household Size |
| Married-Couple | 8,106 (35.8%) | 3.09 |
| Single Male/Father | 1,097 (4.8%) | 3.05 |
| Single Female/Mother | 4,375 (19.3%) | 3.32 |
| Non-family | 9,087 (40.1%) | 1.20 |
| Total Households | 22,665 (100.0%) | 2.37 |
Household Size by Marriage Status in Lenoir County
Out of a total of 22,665 households in Lenoir County, 13,578 (59.9%) are family households, while 9,087 (40.1%) are nonfamily households. The most numerous type of family households are 2-person households, comprising 6,144, and the most common type of nonfamily households are 1-person households, comprising 7,834.
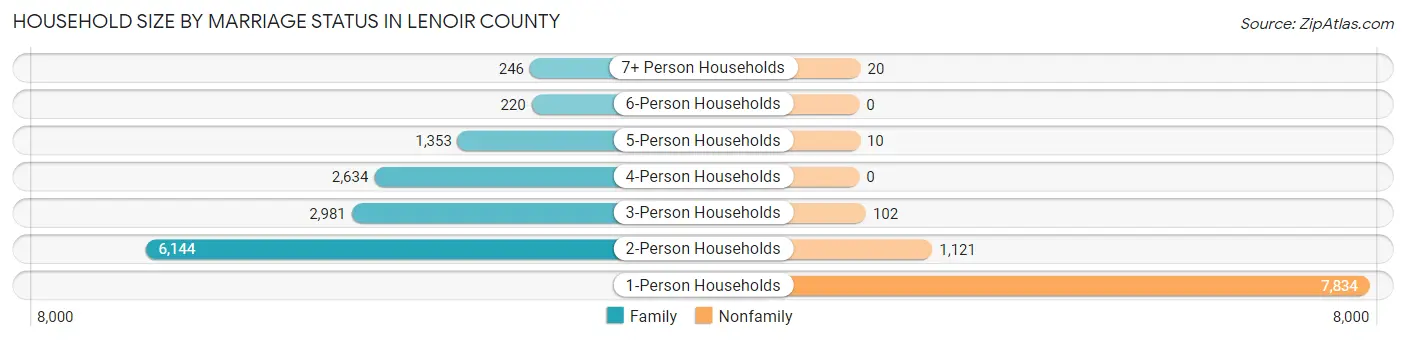
| Household Size | Family Households | Nonfamily Households |
| 1-Person Households | - | 7,834 (34.6%) |
| 2-Person Households | 6,144 (27.1%) | 1,121 (5.0%) |
| 3-Person Households | 2,981 (13.2%) | 102 (0.4%) |
| 4-Person Households | 2,634 (11.6%) | 0 (0.0%) |
| 5-Person Households | 1,353 (6.0%) | 10 (0.0%) |
| 6-Person Households | 220 (1.0%) | 0 (0.0%) |
| 7+ Person Households | 246 (1.1%) | 20 (0.1%) |
| Total | 13,578 (59.9%) | 9,087 (40.1%) |
Female Fertility in Lenoir County
Fertility by Age in Lenoir County
Average fertility rate in Lenoir County is 73.0 births per 1,000 women. Women in the age bracket of 20 to 34 years have the highest fertility rate with 155.0 births per 1,000 women. Women in the age bracket of 20 to 34 years acount for 88.2% of all women with births.
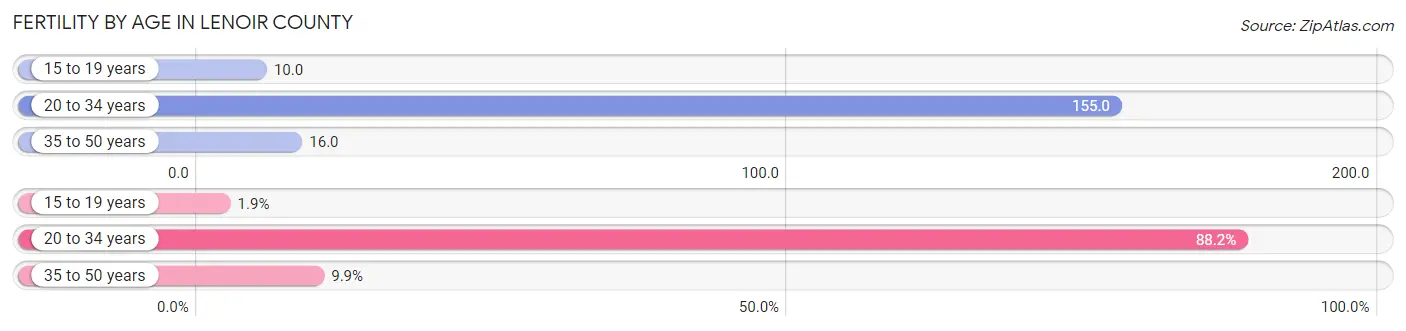
| Age Bracket | Women with Births | Births / 1,000 Women |
| 15 to 19 years | 16 (1.9%) | 10.0 |
| 20 to 34 years | 734 (88.2%) | 155.0 |
| 35 to 50 years | 82 (9.9%) | 16.0 |
| Total | 832 (100.0%) | 73.0 |
Fertility by Age by Marriage Status in Lenoir County
28.0% of women with births (832) in Lenoir County are married. The highest percentage of unmarried women with births falls into 15 to 19 years age bracket with 100.0% of them unmarried at the time of birth, while the lowest percentage of unmarried women with births belong to 35 to 50 years age bracket with 0.0% of them unmarried.
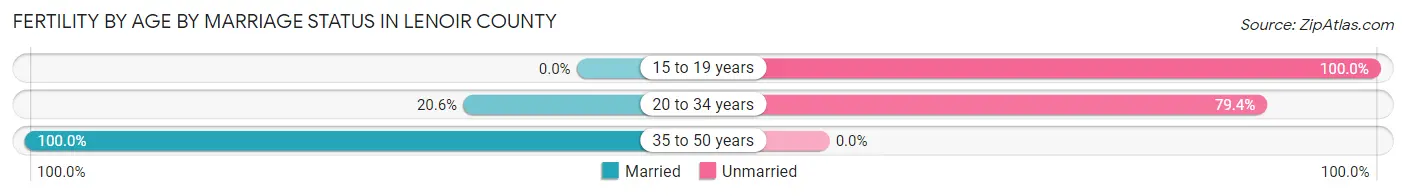
| Age Bracket | Married | Unmarried |
| 15 to 19 years | 0 (0.0%) | 16 (100.0%) |
| 20 to 34 years | 151 (20.6%) | 583 (79.4%) |
| 35 to 50 years | 82 (100.0%) | 0 (0.0%) |
| Total | 233 (28.0%) | 599 (72.0%) |
Fertility by Education in Lenoir County
Average fertility rate in Lenoir County is 73.0 births per 1,000 women. Women with the education attainment of high school diploma have the highest fertility rate of 120.0 births per 1,000 women, while women with the education attainment of less than high school have the lowest fertility at 16.0 births per 1,000 women. Women with the education attainment of high school diploma represent 45.2% of all women with births.
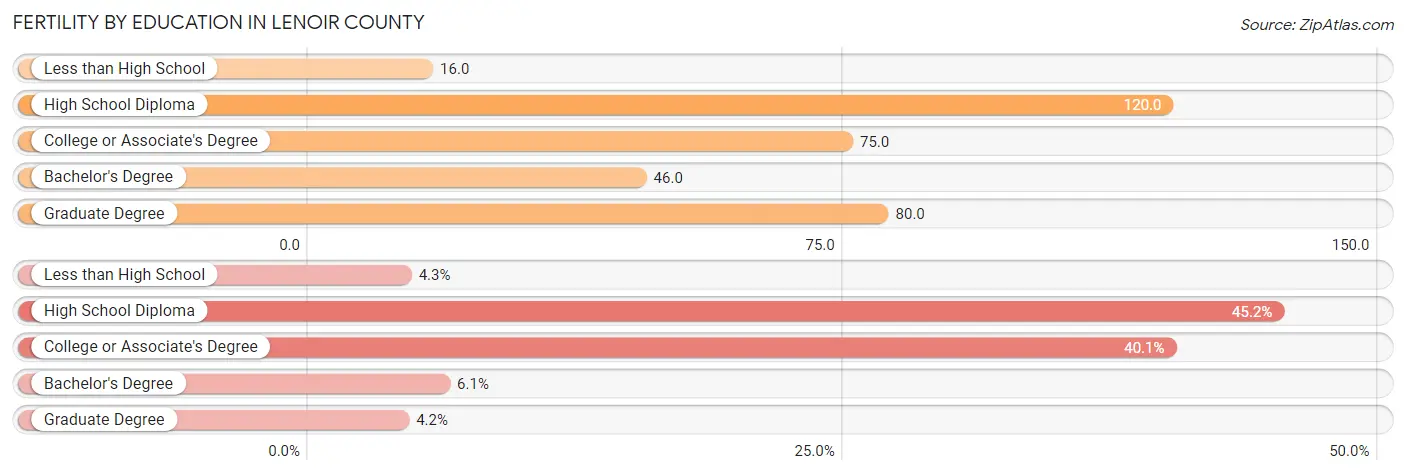
| Educational Attainment | Women with Births | Births / 1,000 Women |
| Less than High School | 36 (4.3%) | 16.0 |
| High School Diploma | 376 (45.2%) | 120.0 |
| College or Associate's Degree | 334 (40.1%) | 75.0 |
| Bachelor's Degree | 51 (6.1%) | 46.0 |
| Graduate Degree | 35 (4.2%) | 80.0 |
| Total | 832 (100.0%) | 73.0 |
Fertility by Education by Marriage Status in Lenoir County
72.0% of women with births in Lenoir County are unmarried. Women with the educational attainment of graduate degree are most likely to be married with 100.0% of them married at childbirth, while women with the educational attainment of less than high school are least likely to be married with 100.0% of them unmarried at childbirth.
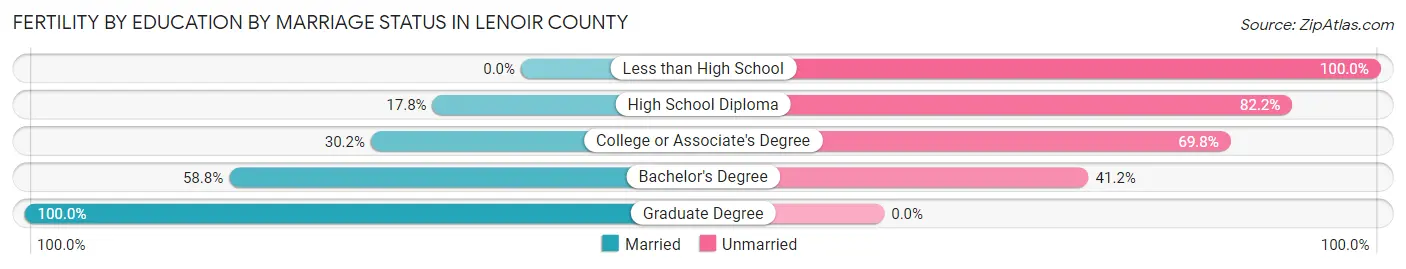
| Educational Attainment | Married | Unmarried |
| Less than High School | 0 (0.0%) | 36 (100.0%) |
| High School Diploma | 67 (17.8%) | 309 (82.2%) |
| College or Associate's Degree | 101 (30.2%) | 233 (69.8%) |
| Bachelor's Degree | 30 (58.8%) | 21 (41.2%) |
| Graduate Degree | 35 (100.0%) | 0 (0.0%) |
| Total | 233 (28.0%) | 599 (72.0%) |
Employment Characteristics in Lenoir County
Employment by Class of Employer in Lenoir County
Among the 22,131 employed individuals in Lenoir County, private company employees (14,676 | 66.3%), local government employees (1,877 | 8.5%), and state government employees (1,680 | 7.6%) make up the most common classes of employment.
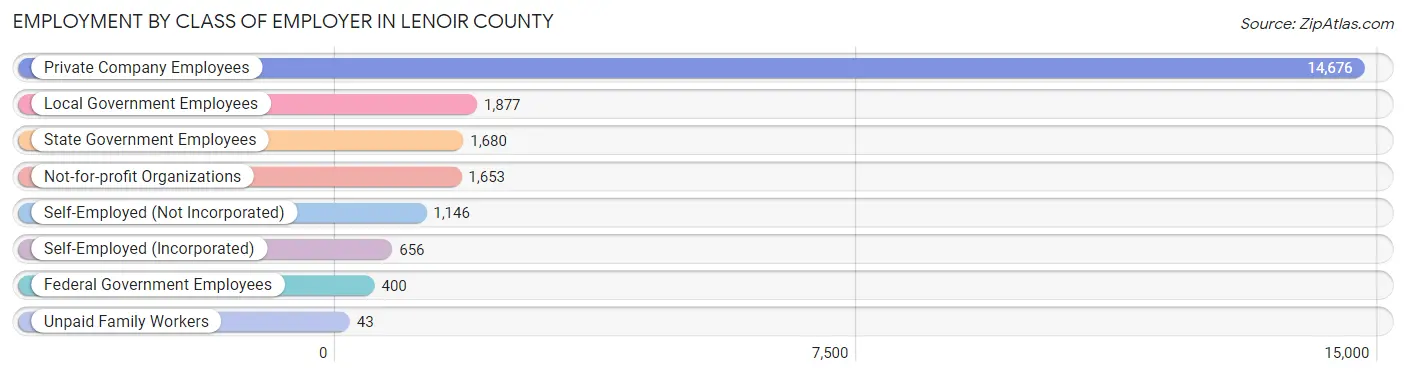
| Employer Class | # Employees | % Employees |
| Private Company Employees | 14,676 | 66.3% |
| Self-Employed (Incorporated) | 656 | 3.0% |
| Self-Employed (Not Incorporated) | 1,146 | 5.2% |
| Not-for-profit Organizations | 1,653 | 7.5% |
| Local Government Employees | 1,877 | 8.5% |
| State Government Employees | 1,680 | 7.6% |
| Federal Government Employees | 400 | 1.8% |
| Unpaid Family Workers | 43 | 0.2% |
| Total | 22,131 | 100.0% |
Employment Status by Age in Lenoir County
According to the labor force statistics for Lenoir County, out of the total population over 16 years of age (44,293), 55.4% or 24,538 individuals are in the labor force, with 7.1% or 1,742 of them unemployed. The age group with the highest labor force participation rate is 30 to 34 years, with 85.4% or 2,530 individuals in the labor force. Within the labor force, the 20 to 24 years age range has the highest percentage of unemployed individuals, with 18.2% or 459 of them being unemployed.
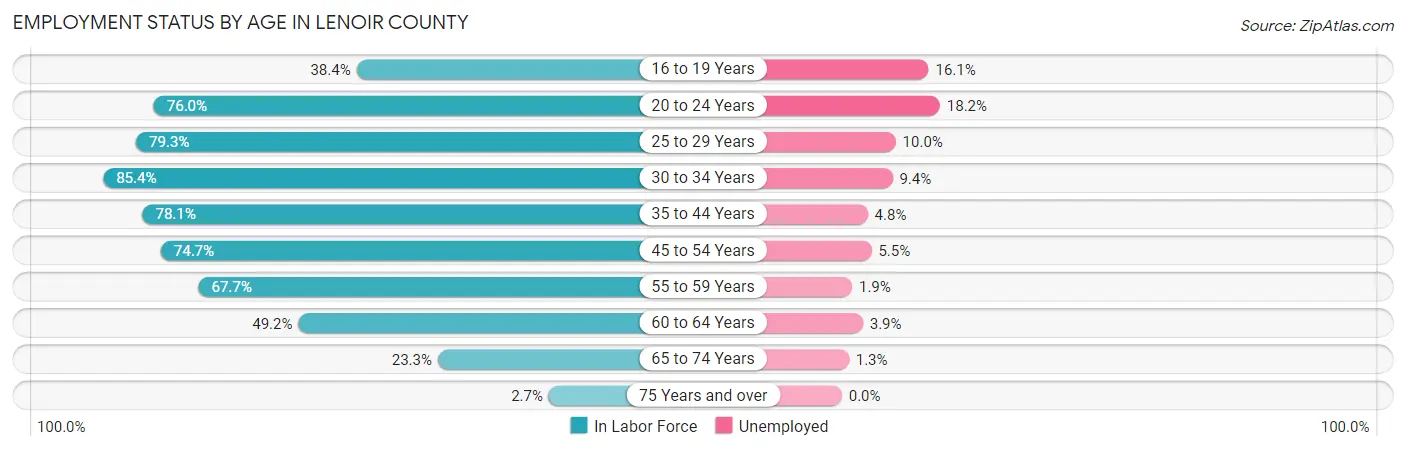
| Age Bracket | In Labor Force | Unemployed |
| 16 to 19 Years | 1,043 (38.4%) | 168 (16.1%) |
| 20 to 24 Years | 2,522 (76.0%) | 459 (18.2%) |
| 25 to 29 Years | 2,494 (79.3%) | 249 (10.0%) |
| 30 to 34 Years | 2,530 (85.4%) | 238 (9.4%) |
| 35 to 44 Years | 4,587 (78.1%) | 220 (4.8%) |
| 45 to 54 Years | 5,017 (74.7%) | 276 (5.5%) |
| 55 to 59 Years | 2,583 (67.7%) | 49 (1.9%) |
| 60 to 64 Years | 2,091 (49.2%) | 82 (3.9%) |
| 65 to 74 Years | 1,540 (23.3%) | 20 (1.3%) |
| 75 Years and over | 132 (2.7%) | 0 (0.0%) |
| Total | 24,538 (55.4%) | 1,742 (7.1%) |
Employment Status by Educational Attainment in Lenoir County
According to labor force statistics for Lenoir County, 72.1% of individuals (19,295) out of the total population between 25 and 64 years of age (26,762) are in the labor force, with 5.8% or 1,119 of them being unemployed. The group with the highest labor force participation rate are those with the educational attainment of bachelor's degree or higher, with 86.2% or 3,224 individuals in the labor force. Within the labor force, individuals with less than high school education have the highest percentage of unemployment, with 9.3% or 188 of them being unemployed.
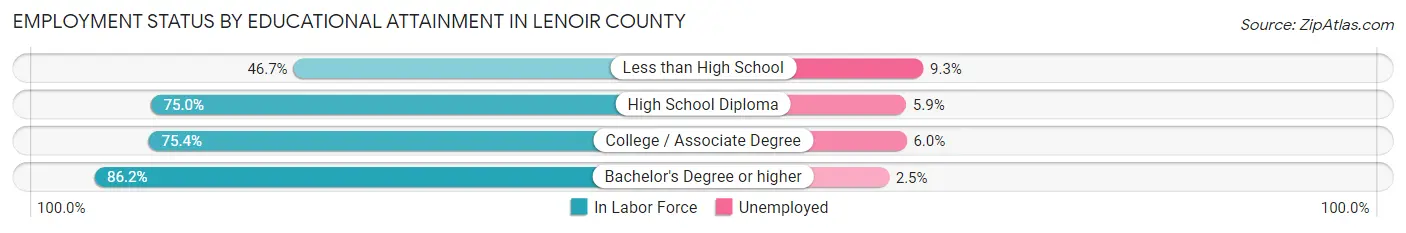
| Educational Attainment | In Labor Force | Unemployed |
| Less than High School | 2,017 (46.7%) | 402 (9.3%) |
| High School Diploma | 6,635 (75.0%) | 522 (5.9%) |
| College / Associate Degree | 7,431 (75.4%) | 591 (6.0%) |
| Bachelor's Degree or higher | 3,224 (86.2%) | 94 (2.5%) |
| Total | 19,295 (72.1%) | 1,552 (5.8%) |
Employment Occupations by Sex in Lenoir County
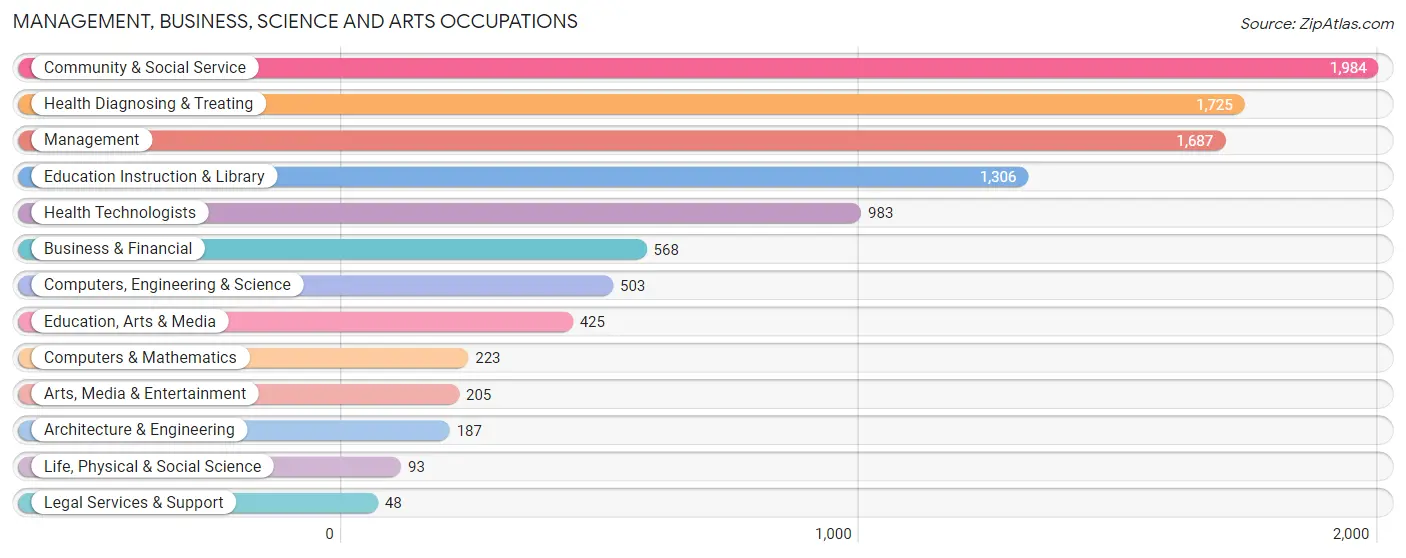
Management, Business, Science and Arts Occupations
The most common Management, Business, Science and Arts occupations in Lenoir County are Community & Social Service (1,984 | 8.7%), Health Diagnosing & Treating (1,725 | 7.6%), Management (1,687 | 7.4%), Education Instruction & Library (1,306 | 5.8%), and Health Technologists (983 | 4.3%).
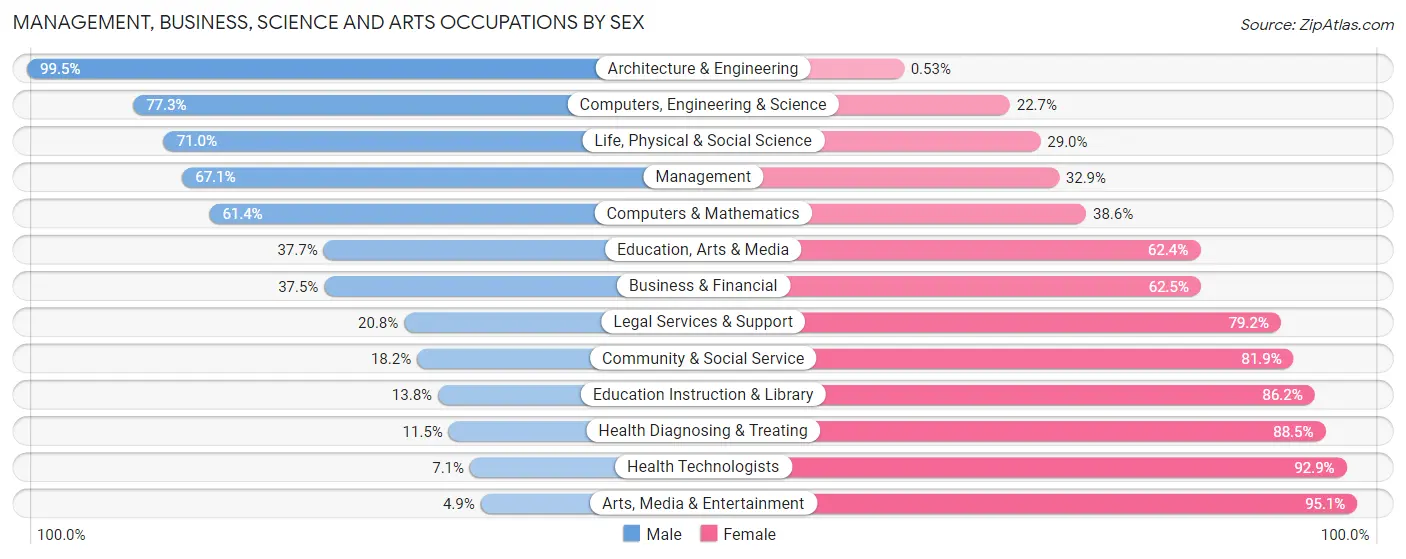
Management, Business, Science and Arts Occupations by Sex
Within the Management, Business, Science and Arts occupations in Lenoir County, the most male-oriented occupations are Architecture & Engineering (99.5%), Computers, Engineering & Science (77.3%), and Life, Physical & Social Science (71.0%), while the most female-oriented occupations are Arts, Media & Entertainment (95.1%), Health Technologists (92.9%), and Health Diagnosing & Treating (88.5%).
| Occupation | Male | Female |
| Management | 1,132 (67.1%) | 555 (32.9%) |
| Business & Financial | 213 (37.5%) | 355 (62.5%) |
| Computers, Engineering & Science | 389 (77.3%) | 114 (22.7%) |
| Computers & Mathematics | 137 (61.4%) | 86 (38.6%) |
| Architecture & Engineering | 186 (99.5%) | 1 (0.5%) |
| Life, Physical & Social Science | 66 (71.0%) | 27 (29.0%) |
| Community & Social Service | 360 (18.1%) | 1,624 (81.9%) |
| Education, Arts & Media | 160 (37.7%) | 265 (62.4%) |
| Legal Services & Support | 10 (20.8%) | 38 (79.2%) |
| Education Instruction & Library | 180 (13.8%) | 1,126 (86.2%) |
| Arts, Media & Entertainment | 10 (4.9%) | 195 (95.1%) |
| Health Diagnosing & Treating | 199 (11.5%) | 1,526 (88.5%) |
| Health Technologists | 70 (7.1%) | 913 (92.9%) |
| Total (Category) | 2,293 (35.5%) | 4,174 (64.5%) |
| Total (Overall) | 11,643 (51.3%) | 11,058 (48.7%) |
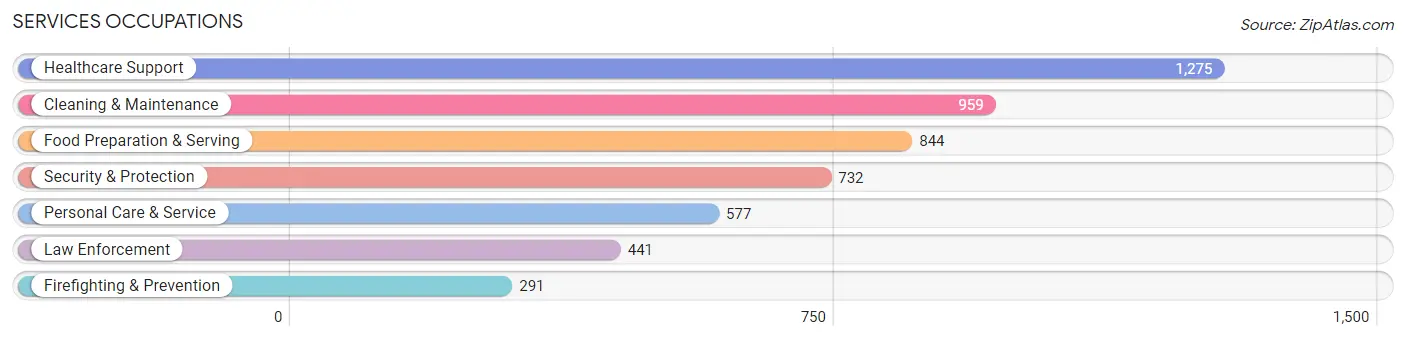
Services Occupations
The most common Services occupations in Lenoir County are Healthcare Support (1,275 | 5.6%), Cleaning & Maintenance (959 | 4.2%), Food Preparation & Serving (844 | 3.7%), Security & Protection (732 | 3.2%), and Personal Care & Service (577 | 2.5%).
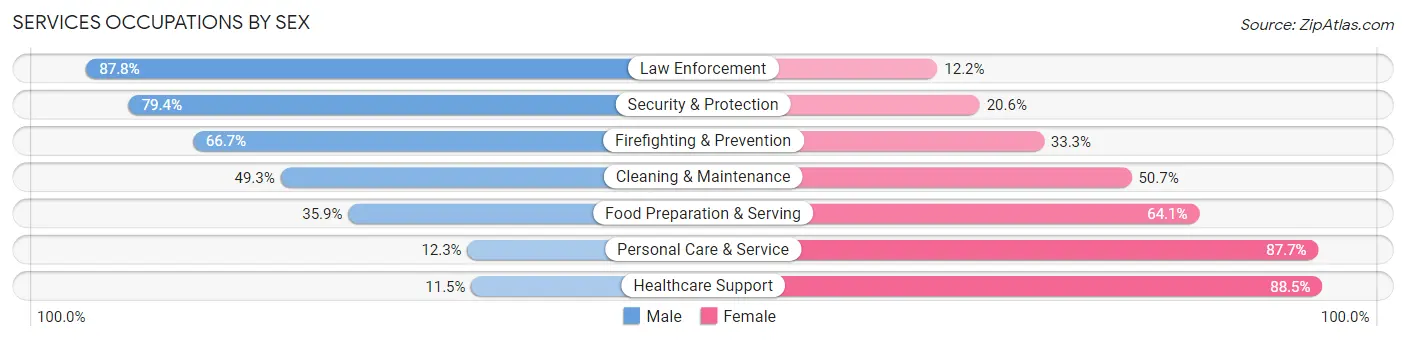
Services Occupations by Sex
Within the Services occupations in Lenoir County, the most male-oriented occupations are Law Enforcement (87.8%), Security & Protection (79.4%), and Firefighting & Prevention (66.7%), while the most female-oriented occupations are Healthcare Support (88.5%), Personal Care & Service (87.7%), and Food Preparation & Serving (64.1%).
| Occupation | Male | Female |
| Healthcare Support | 147 (11.5%) | 1,128 (88.5%) |
| Security & Protection | 581 (79.4%) | 151 (20.6%) |
| Firefighting & Prevention | 194 (66.7%) | 97 (33.3%) |
| Law Enforcement | 387 (87.8%) | 54 (12.2%) |
| Food Preparation & Serving | 303 (35.9%) | 541 (64.1%) |
| Cleaning & Maintenance | 473 (49.3%) | 486 (50.7%) |
| Personal Care & Service | 71 (12.3%) | 506 (87.7%) |
| Total (Category) | 1,575 (35.9%) | 2,812 (64.1%) |
| Total (Overall) | 11,643 (51.3%) | 11,058 (48.7%) |
Sales and Office Occupations
The most common Sales and Office occupations in Lenoir County are Sales & Related (1,969 | 8.7%), and Office & Administration (1,773 | 7.8%).
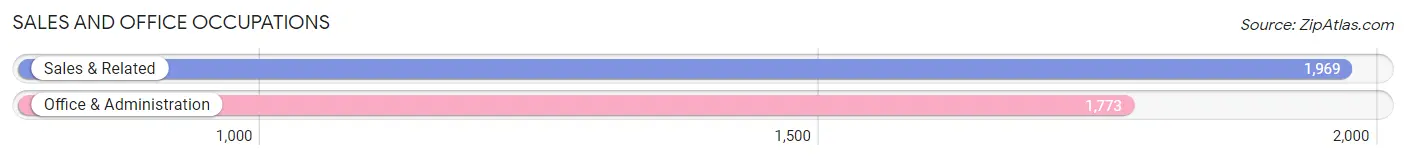
Sales and Office Occupations by Sex

| Occupation | Male | Female |
| Sales & Related | 1,067 (54.2%) | 902 (45.8%) |
| Office & Administration | 347 (19.6%) | 1,426 (80.4%) |
| Total (Category) | 1,414 (37.8%) | 2,328 (62.2%) |
| Total (Overall) | 11,643 (51.3%) | 11,058 (48.7%) |
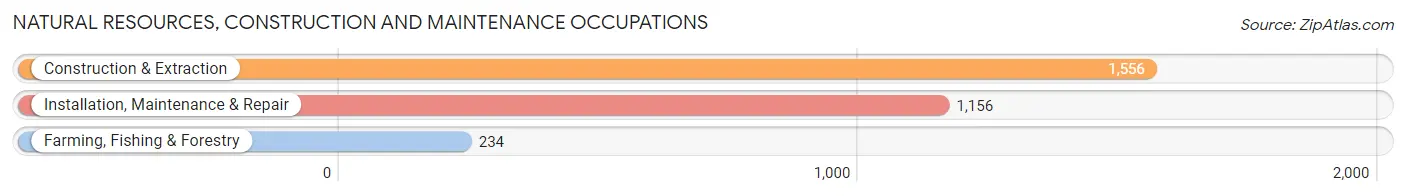
Natural Resources, Construction and Maintenance Occupations
The most common Natural Resources, Construction and Maintenance occupations in Lenoir County are Construction & Extraction (1,556 | 6.9%), Installation, Maintenance & Repair (1,156 | 5.1%), and Farming, Fishing & Forestry (234 | 1.0%).
Natural Resources, Construction and Maintenance Occupations by Sex
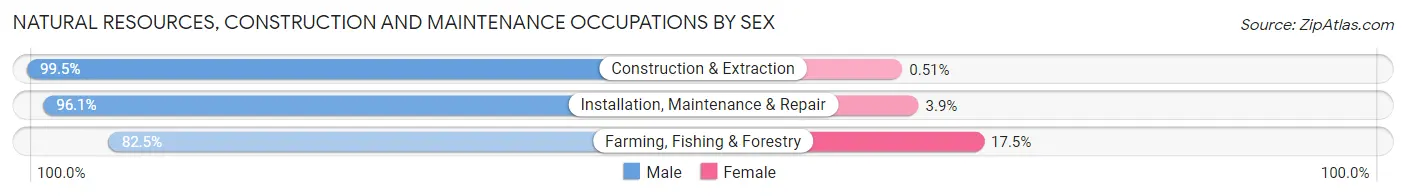
| Occupation | Male | Female |
| Farming, Fishing & Forestry | 193 (82.5%) | 41 (17.5%) |
| Construction & Extraction | 1,548 (99.5%) | 8 (0.5%) |
| Installation, Maintenance & Repair | 1,111 (96.1%) | 45 (3.9%) |
| Total (Category) | 2,852 (96.8%) | 94 (3.2%) |
| Total (Overall) | 11,643 (51.3%) | 11,058 (48.7%) |
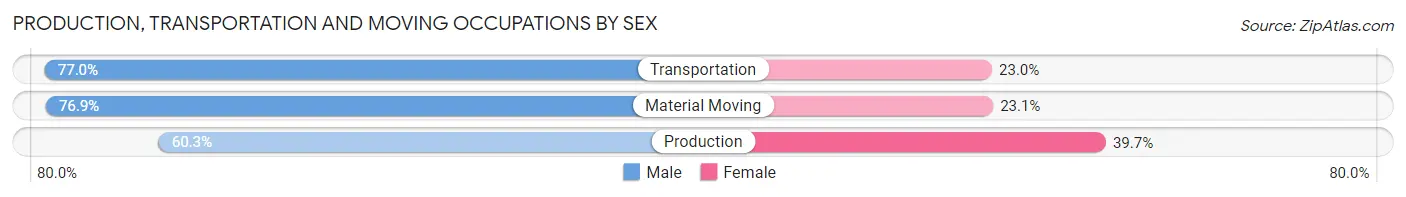
Production, Transportation and Moving Occupations
The most common Production, Transportation and Moving occupations in Lenoir County are Production (2,766 | 12.2%), Material Moving (1,266 | 5.6%), and Transportation (1,127 | 5.0%).
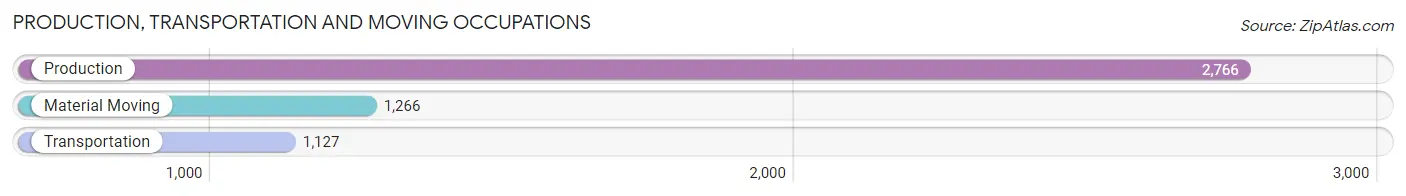
Production, Transportation and Moving Occupations by Sex
| Occupation | Male | Female |
| Production | 1,668 (60.3%) | 1,098 (39.7%) |
| Transportation | 868 (77.0%) | 259 (23.0%) |
| Material Moving | 973 (76.9%) | 293 (23.1%) |
| Total (Category) | 3,509 (68.0%) | 1,650 (32.0%) |
| Total (Overall) | 11,643 (51.3%) | 11,058 (48.7%) |
Employment Industries by Sex in Lenoir County
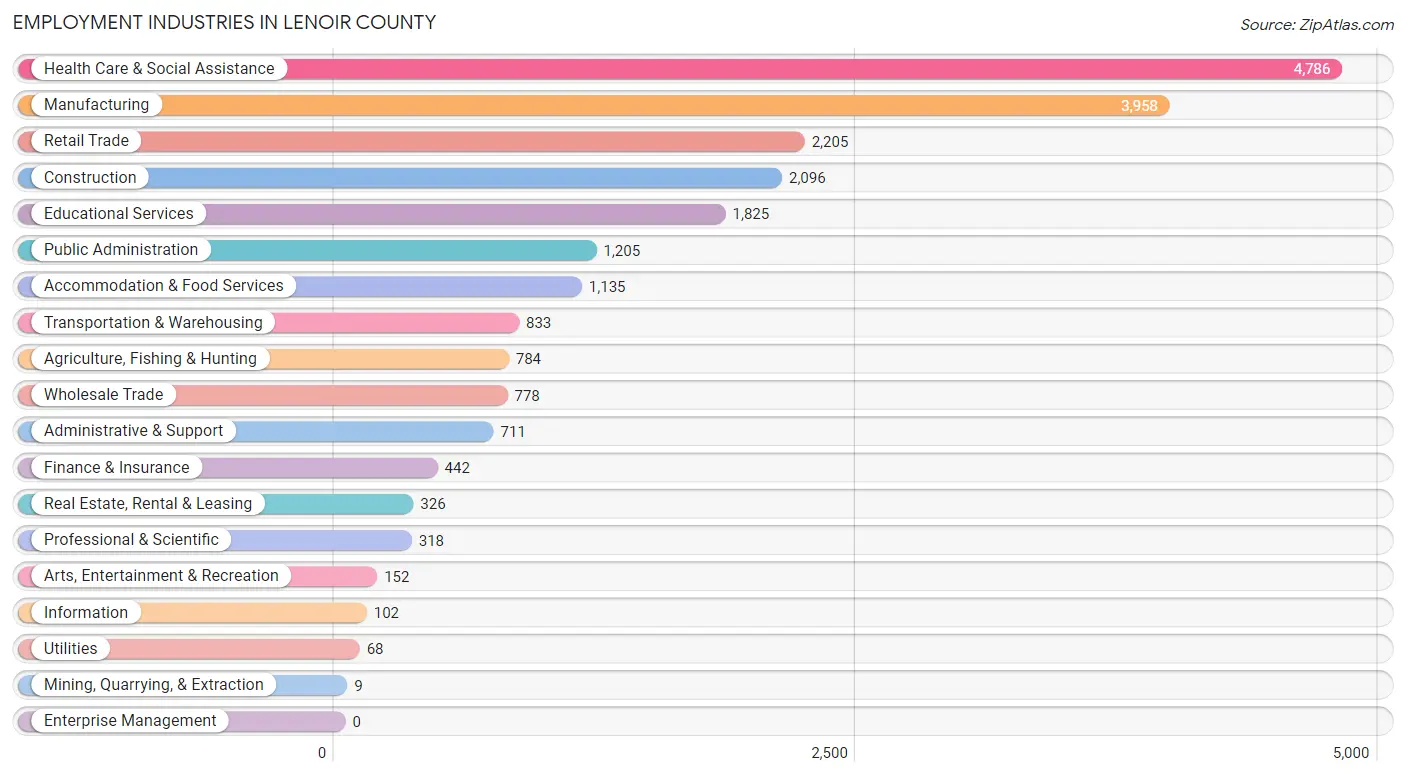
Employment Industries in Lenoir County
The major employment industries in Lenoir County include Health Care & Social Assistance (4,786 | 21.1%), Manufacturing (3,958 | 17.4%), Retail Trade (2,205 | 9.7%), Construction (2,096 | 9.2%), and Educational Services (1,825 | 8.0%).
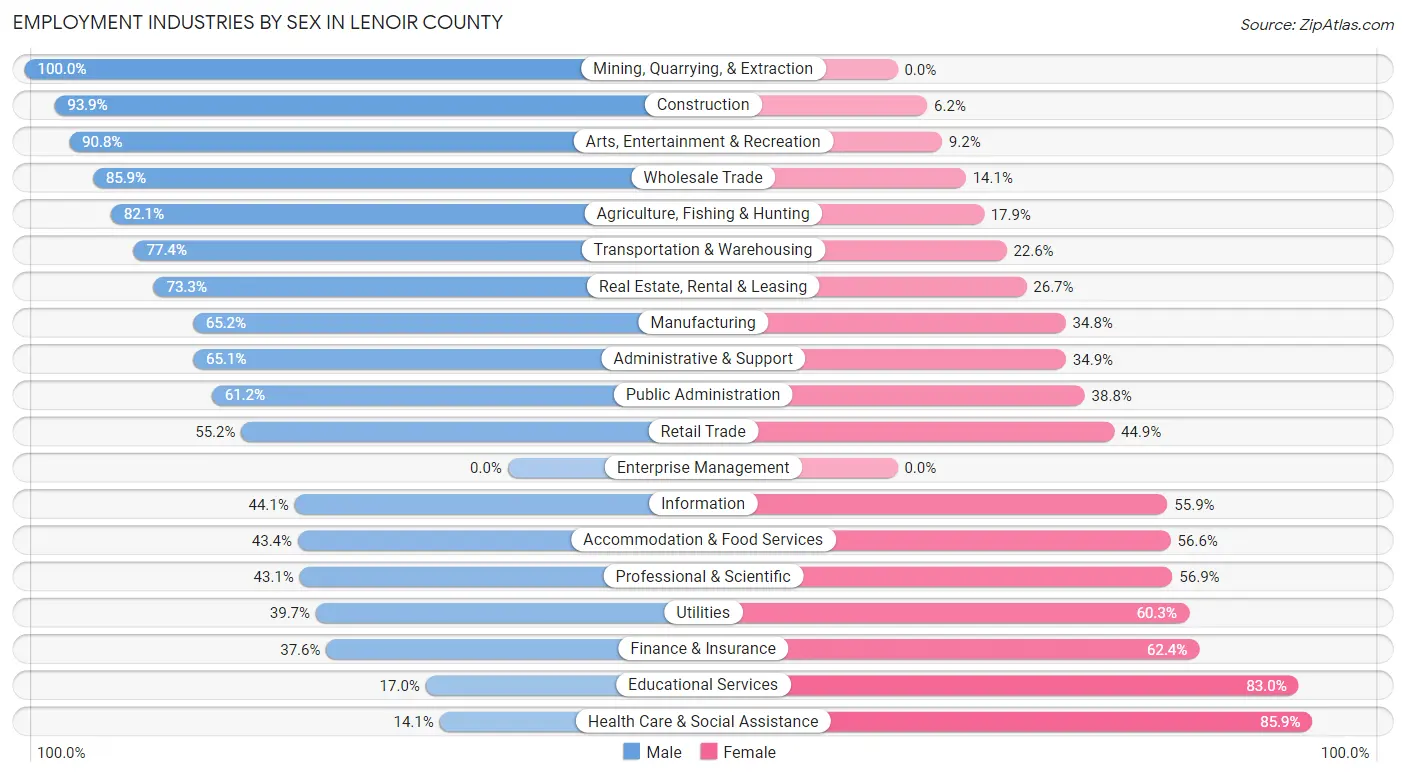
Employment Industries by Sex in Lenoir County
The Lenoir County industries that see more men than women are Mining, Quarrying, & Extraction (100.0%), Construction (93.9%), and Arts, Entertainment & Recreation (90.8%), whereas the industries that tend to have a higher number of women are Health Care & Social Assistance (85.9%), Educational Services (83.0%), and Finance & Insurance (62.4%).
| Industry | Male | Female |
| Agriculture, Fishing & Hunting | 644 (82.1%) | 140 (17.9%) |
| Mining, Quarrying, & Extraction | 9 (100.0%) | 0 (0.0%) |
| Construction | 1,967 (93.9%) | 129 (6.1%) |
| Manufacturing | 2,580 (65.2%) | 1,378 (34.8%) |
| Wholesale Trade | 668 (85.9%) | 110 (14.1%) |
| Retail Trade | 1,216 (55.1%) | 989 (44.9%) |
| Transportation & Warehousing | 645 (77.4%) | 188 (22.6%) |
| Utilities | 27 (39.7%) | 41 (60.3%) |
| Information | 45 (44.1%) | 57 (55.9%) |
| Finance & Insurance | 166 (37.6%) | 276 (62.4%) |
| Real Estate, Rental & Leasing | 239 (73.3%) | 87 (26.7%) |
| Professional & Scientific | 137 (43.1%) | 181 (56.9%) |
| Enterprise Management | 0 (0.0%) | 0 (0.0%) |
| Administrative & Support | 463 (65.1%) | 248 (34.9%) |
| Educational Services | 310 (17.0%) | 1,515 (83.0%) |
| Health Care & Social Assistance | 676 (14.1%) | 4,110 (85.9%) |
| Arts, Entertainment & Recreation | 138 (90.8%) | 14 (9.2%) |
| Accommodation & Food Services | 493 (43.4%) | 642 (56.6%) |
| Public Administration | 738 (61.2%) | 467 (38.8%) |
| Total | 11,643 (51.3%) | 11,058 (48.7%) |
Education in Lenoir County
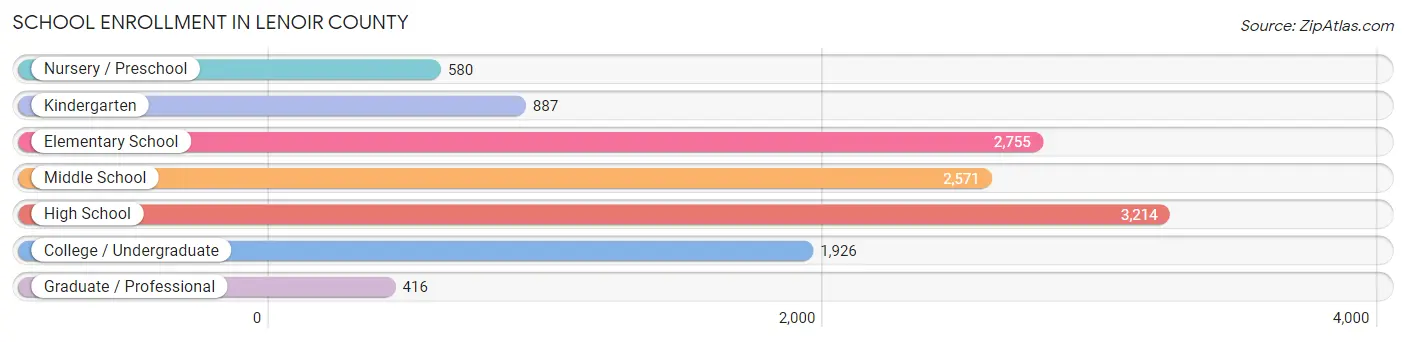
School Enrollment in Lenoir County
The most common levels of schooling among the 12,349 students in Lenoir County are high school (3,214 | 26.0%), elementary school (2,755 | 22.3%), and middle school (2,571 | 20.8%).
| School Level | # Students | % Students |
| Nursery / Preschool | 580 | 4.7% |
| Kindergarten | 887 | 7.2% |
| Elementary School | 2,755 | 22.3% |
| Middle School | 2,571 | 20.8% |
| High School | 3,214 | 26.0% |
| College / Undergraduate | 1,926 | 15.6% |
| Graduate / Professional | 416 | 3.4% |
| Total | 12,349 | 100.0% |
School Enrollment by Age by Funding Source in Lenoir County
Out of a total of 12,349 students who are enrolled in schools in Lenoir County, 1,717 (13.9%) attend a private institution, while the remaining 10,632 (86.1%) are enrolled in public schools. The age group of 18 to 19 year olds has the highest likelihood of being enrolled in private schools, with 157 (22.8% in the age bracket) enrolled. Conversely, the age group of 25 to 34 year olds has the lowest likelihood of being enrolled in a private school, with 485 (91.9% in the age bracket) attending a public institution.
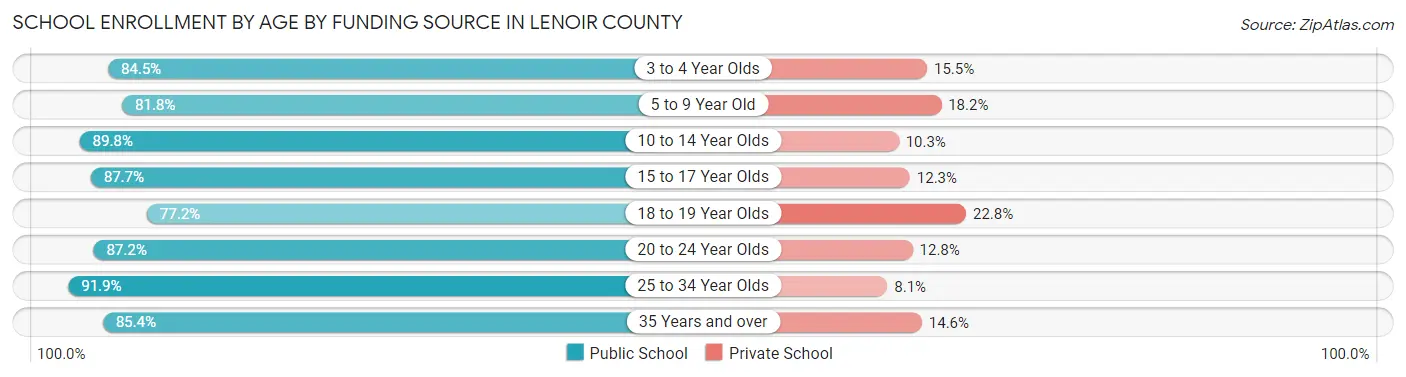
| Age Bracket | Public School | Private School |
| 3 to 4 Year Olds | 397 (84.5%) | 73 (15.5%) |
| 5 to 9 Year Old | 2,608 (81.8%) | 579 (18.2%) |
| 10 to 14 Year Olds | 3,144 (89.7%) | 359 (10.2%) |
| 15 to 17 Year Olds | 1,942 (87.7%) | 273 (12.3%) |
| 18 to 19 Year Olds | 532 (77.2%) | 157 (22.8%) |
| 20 to 24 Year Olds | 903 (87.2%) | 133 (12.8%) |
| 25 to 34 Year Olds | 485 (91.9%) | 43 (8.1%) |
| 35 Years and over | 616 (85.4%) | 105 (14.6%) |
| Total | 10,632 (86.1%) | 1,717 (13.9%) |
Educational Attainment by Field of Study in Lenoir County
Education (1,415 | 23.0%), business (1,122 | 18.2%), science & technology (635 | 10.3%), arts & humanities (633 | 10.3%), and social sciences (490 | 8.0%) are the most common fields of study among 6,147 individuals in Lenoir County who have obtained a bachelor's degree or higher.
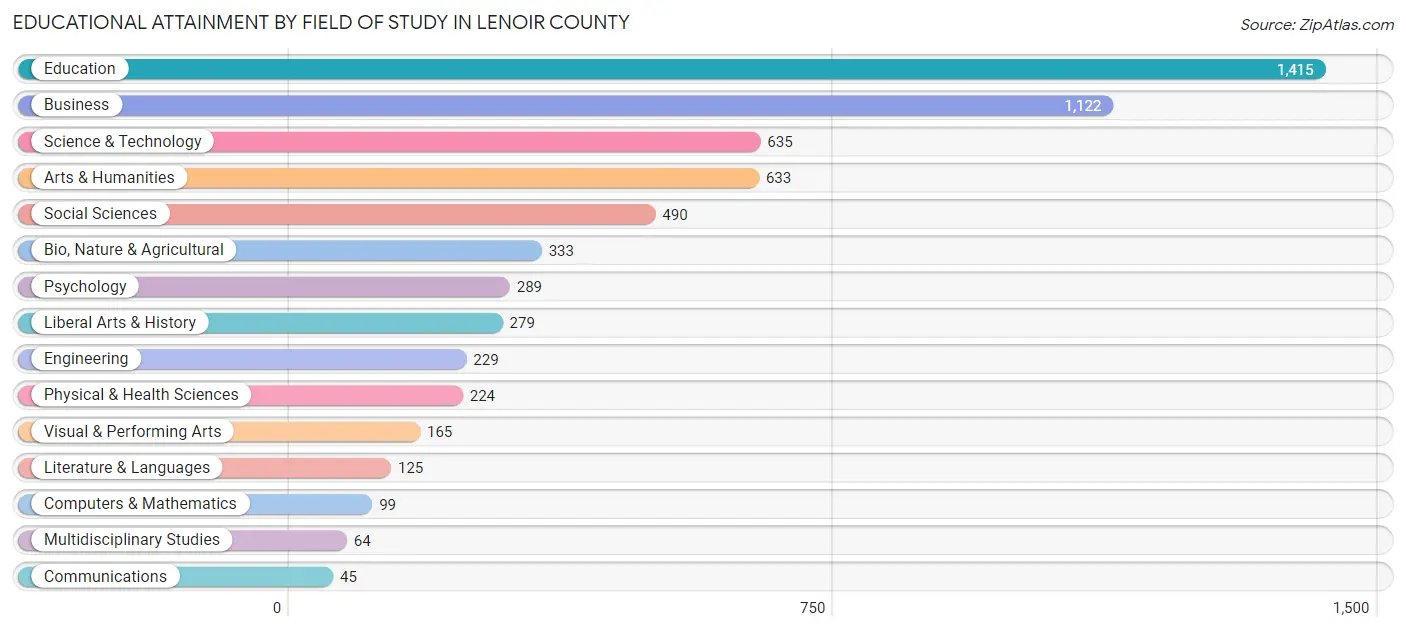
| Field of Study | # Graduates | % Graduates |
| Computers & Mathematics | 99 | 1.6% |
| Bio, Nature & Agricultural | 333 | 5.4% |
| Physical & Health Sciences | 224 | 3.6% |
| Psychology | 289 | 4.7% |
| Social Sciences | 490 | 8.0% |
| Engineering | 229 | 3.7% |
| Multidisciplinary Studies | 64 | 1.0% |
| Science & Technology | 635 | 10.3% |
| Business | 1,122 | 18.2% |
| Education | 1,415 | 23.0% |
| Literature & Languages | 125 | 2.0% |
| Liberal Arts & History | 279 | 4.5% |
| Visual & Performing Arts | 165 | 2.7% |
| Communications | 45 | 0.7% |
| Arts & Humanities | 633 | 10.3% |
| Total | 6,147 | 100.0% |
Transportation & Commute in Lenoir County
Vehicle Availability by Sex in Lenoir County
The most prevalent vehicle ownership categories in Lenoir County are males with 2 vehicles (4,053, accounting for 35.7%) and females with 2 vehicles (3,537, making up 37.7%).
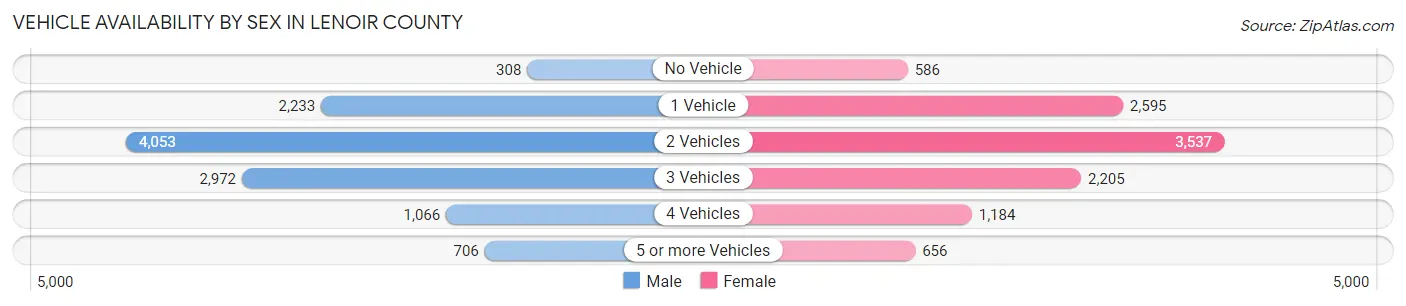
| Vehicles Available | Male | Female |
| No Vehicle | 308 (2.7%) | 586 (5.4%) |
| 1 Vehicle | 2,233 (19.7%) | 2,595 (24.1%) |
| 2 Vehicles | 4,053 (35.7%) | 3,537 (32.9%) |
| 3 Vehicles | 2,972 (26.2%) | 2,205 (20.5%) |
| 4 Vehicles | 1,066 (9.4%) | 1,184 (11.0%) |
| 5 or more Vehicles | 706 (6.2%) | 656 (6.1%) |
| Total | 11,338 (100.0%) | 10,763 (100.0%) |
Commute Time in Lenoir County
The most frequently occuring commute durations in Lenoir County are 10 to 14 minutes (4,208 commuters, 19.5%), 15 to 19 minutes (4,125 commuters, 19.1%), and 20 to 24 minutes (2,899 commuters, 13.4%).
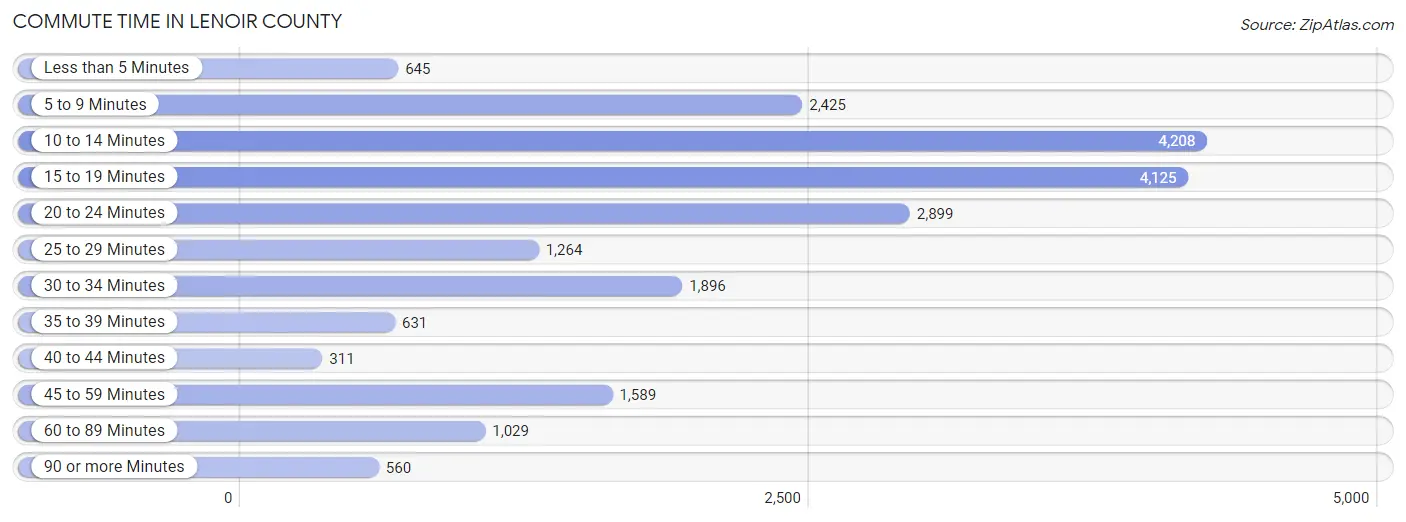
| Commute Time | # Commuters | % Commuters |
| Less than 5 Minutes | 645 | 3.0% |
| 5 to 9 Minutes | 2,425 | 11.2% |
| 10 to 14 Minutes | 4,208 | 19.5% |
| 15 to 19 Minutes | 4,125 | 19.1% |
| 20 to 24 Minutes | 2,899 | 13.4% |
| 25 to 29 Minutes | 1,264 | 5.9% |
| 30 to 34 Minutes | 1,896 | 8.8% |
| 35 to 39 Minutes | 631 | 2.9% |
| 40 to 44 Minutes | 311 | 1.4% |
| 45 to 59 Minutes | 1,589 | 7.4% |
| 60 to 89 Minutes | 1,029 | 4.8% |
| 90 or more Minutes | 560 | 2.6% |
Commute Time by Sex in Lenoir County
The most common commute times in Lenoir County are 10 to 14 minutes (2,188 commuters, 19.8%) for males and 15 to 19 minutes (2,263 commuters, 21.5%) for females.
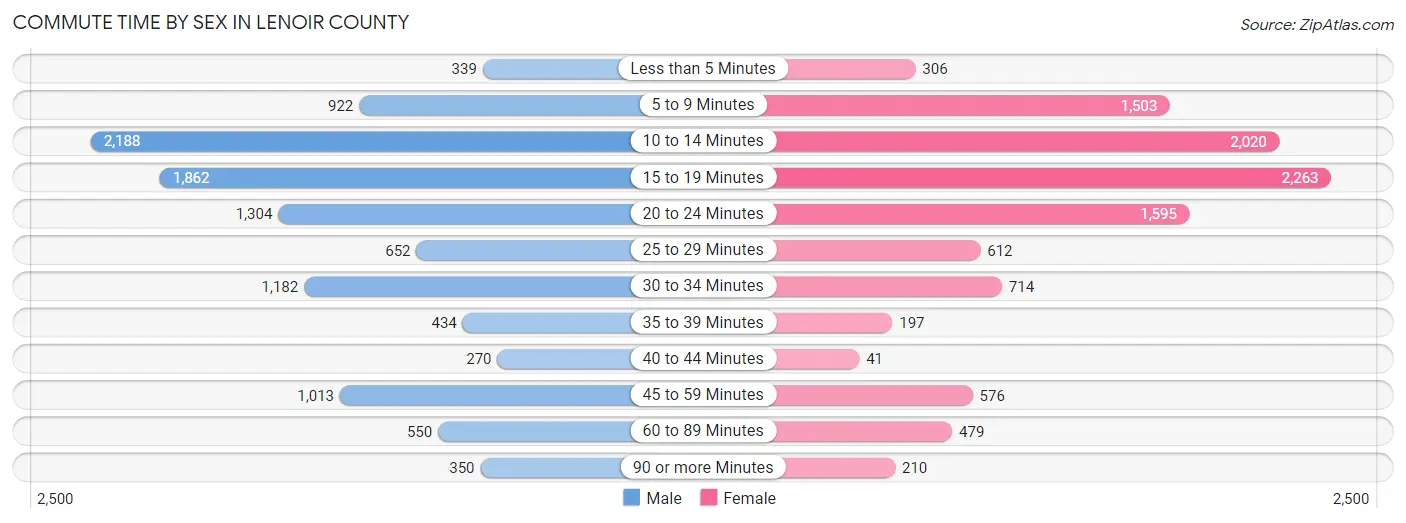
| Commute Time | Male | Female |
| Less than 5 Minutes | 339 (3.1%) | 306 (2.9%) |
| 5 to 9 Minutes | 922 (8.3%) | 1,503 (14.3%) |
| 10 to 14 Minutes | 2,188 (19.8%) | 2,020 (19.2%) |
| 15 to 19 Minutes | 1,862 (16.8%) | 2,263 (21.5%) |
| 20 to 24 Minutes | 1,304 (11.8%) | 1,595 (15.2%) |
| 25 to 29 Minutes | 652 (5.9%) | 612 (5.8%) |
| 30 to 34 Minutes | 1,182 (10.7%) | 714 (6.8%) |
| 35 to 39 Minutes | 434 (3.9%) | 197 (1.9%) |
| 40 to 44 Minutes | 270 (2.4%) | 41 (0.4%) |
| 45 to 59 Minutes | 1,013 (9.1%) | 576 (5.5%) |
| 60 to 89 Minutes | 550 (5.0%) | 479 (4.5%) |
| 90 or more Minutes | 350 (3.2%) | 210 (2.0%) |
Time of Departure to Work by Sex in Lenoir County
The most frequent times of departure to work in Lenoir County are 6:30 AM to 6:59 AM (1,696, 15.3%) for males and 7:00 AM to 7:29 AM (1,996, 19.0%) for females.
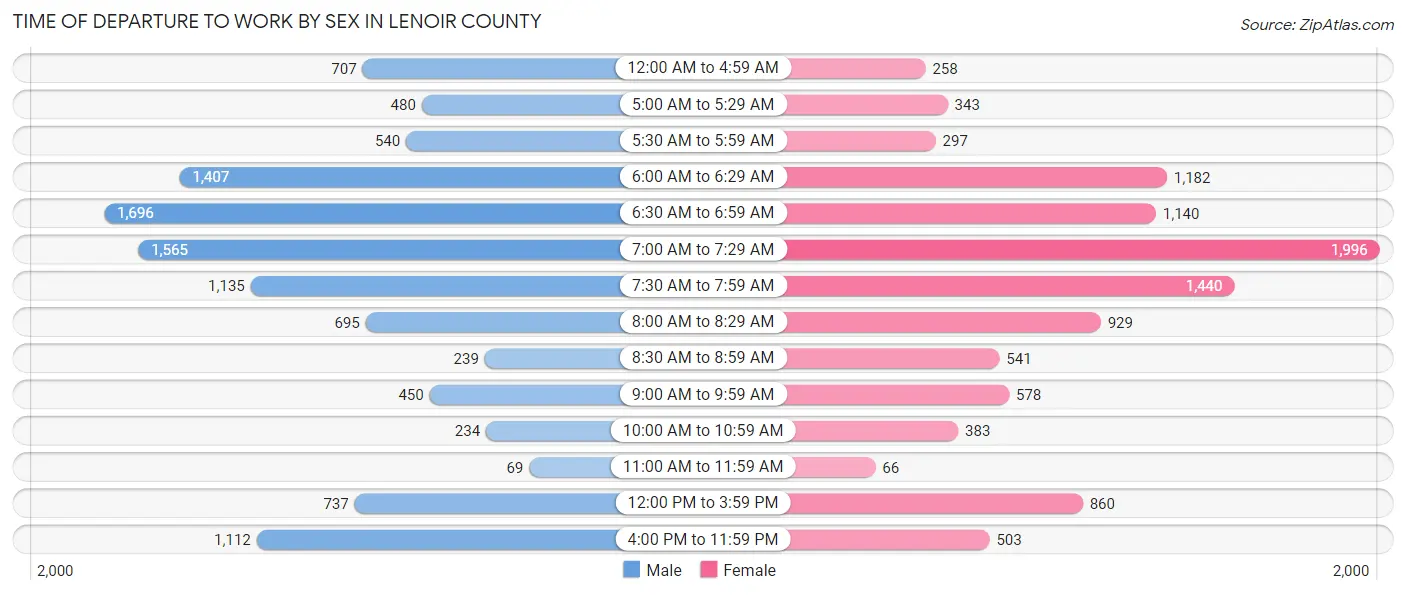
| Time of Departure | Male | Female |
| 12:00 AM to 4:59 AM | 707 (6.4%) | 258 (2.5%) |
| 5:00 AM to 5:29 AM | 480 (4.3%) | 343 (3.3%) |
| 5:30 AM to 5:59 AM | 540 (4.9%) | 297 (2.8%) |
| 6:00 AM to 6:29 AM | 1,407 (12.7%) | 1,182 (11.2%) |
| 6:30 AM to 6:59 AM | 1,696 (15.3%) | 1,140 (10.8%) |
| 7:00 AM to 7:29 AM | 1,565 (14.1%) | 1,996 (19.0%) |
| 7:30 AM to 7:59 AM | 1,135 (10.3%) | 1,440 (13.7%) |
| 8:00 AM to 8:29 AM | 695 (6.3%) | 929 (8.8%) |
| 8:30 AM to 8:59 AM | 239 (2.2%) | 541 (5.1%) |
| 9:00 AM to 9:59 AM | 450 (4.1%) | 578 (5.5%) |
| 10:00 AM to 10:59 AM | 234 (2.1%) | 383 (3.6%) |
| 11:00 AM to 11:59 AM | 69 (0.6%) | 66 (0.6%) |
| 12:00 PM to 3:59 PM | 737 (6.7%) | 860 (8.2%) |
| 4:00 PM to 11:59 PM | 1,112 (10.1%) | 503 (4.8%) |
| Total | 11,066 (100.0%) | 10,516 (100.0%) |
Housing Occupancy in Lenoir County
Occupancy by Ownership in Lenoir County
Of the total 22,665 dwellings in Lenoir County, owner-occupied units account for 13,332 (58.8%), while renter-occupied units make up 9,333 (41.2%).
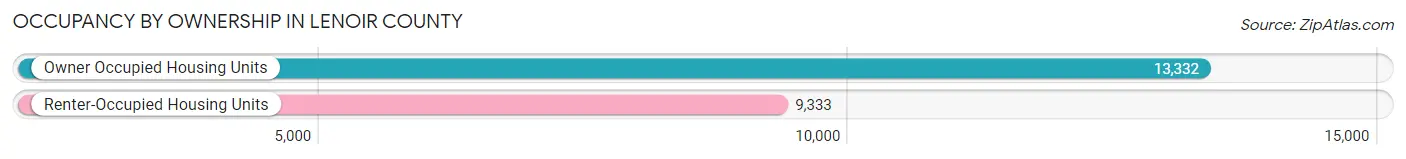
| Occupancy | # Housing Units | % Housing Units |
| Owner Occupied Housing Units | 13,332 | 58.8% |
| Renter-Occupied Housing Units | 9,333 | 41.2% |
| Total Occupied Housing Units | 22,665 | 100.0% |
Occupancy by Household Size in Lenoir County
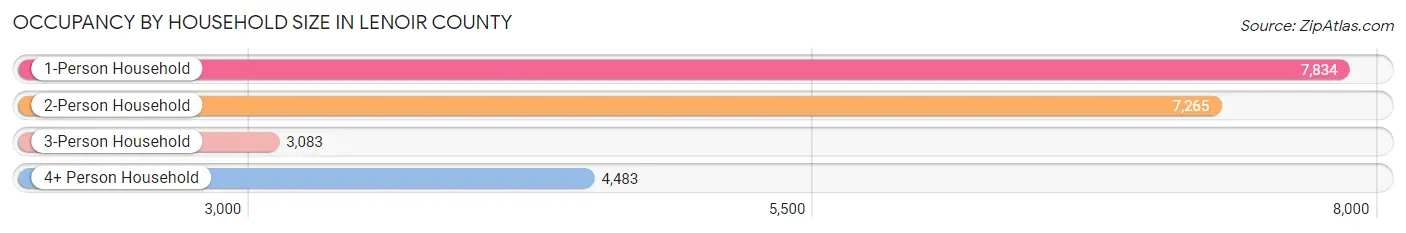
| Household Size | # Housing Units | % Housing Units |
| 1-Person Household | 7,834 | 34.6% |
| 2-Person Household | 7,265 | 32.1% |
| 3-Person Household | 3,083 | 13.6% |
| 4+ Person Household | 4,483 | 19.8% |
| Total Housing Units | 22,665 | 100.0% |
Occupancy by Ownership by Household Size in Lenoir County
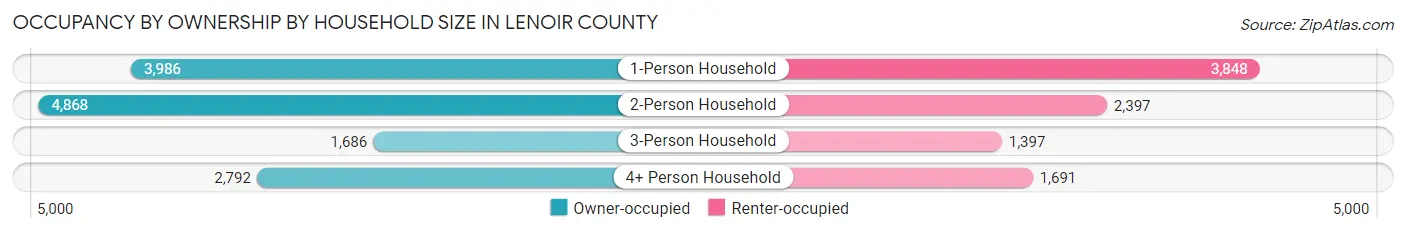
| Household Size | Owner-occupied | Renter-occupied |
| 1-Person Household | 3,986 (50.9%) | 3,848 (49.1%) |
| 2-Person Household | 4,868 (67.0%) | 2,397 (33.0%) |
| 3-Person Household | 1,686 (54.7%) | 1,397 (45.3%) |
| 4+ Person Household | 2,792 (62.3%) | 1,691 (37.7%) |
| Total Housing Units | 13,332 (58.8%) | 9,333 (41.2%) |
Occupancy by Educational Attainment in Lenoir County
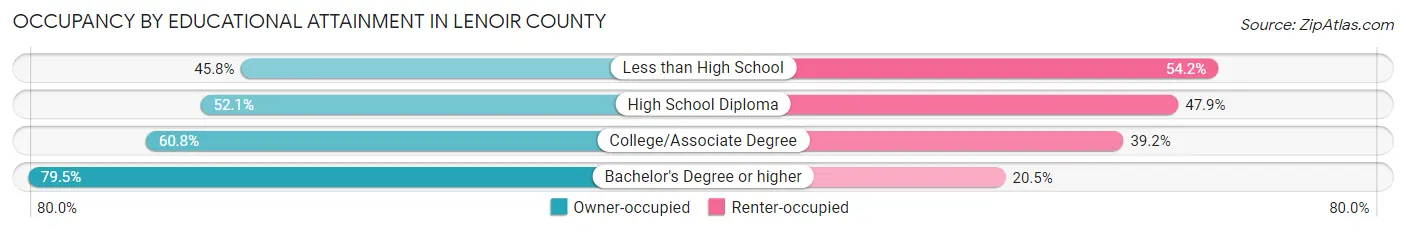
| Household Size | Owner-occupied | Renter-occupied |
| Less than High School | 1,573 (45.8%) | 1,863 (54.2%) |
| High School Diploma | 3,814 (52.1%) | 3,510 (47.9%) |
| College/Associate Degree | 4,928 (60.8%) | 3,181 (39.2%) |
| Bachelor's Degree or higher | 3,017 (79.5%) | 779 (20.5%) |
Occupancy by Age of Householder in Lenoir County
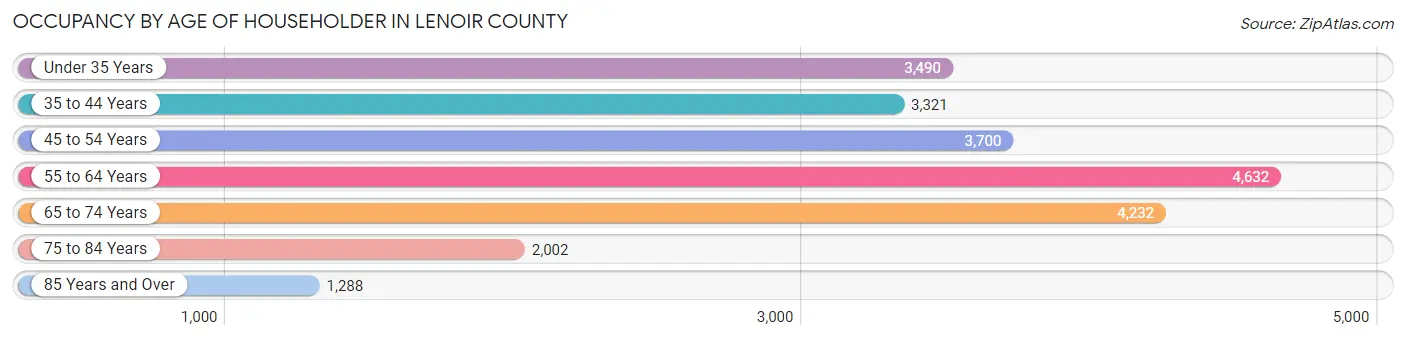
| Age Bracket | # Households | % Households |
| Under 35 Years | 3,490 | 15.4% |
| 35 to 44 Years | 3,321 | 14.6% |
| 45 to 54 Years | 3,700 | 16.3% |
| 55 to 64 Years | 4,632 | 20.4% |
| 65 to 74 Years | 4,232 | 18.7% |
| 75 to 84 Years | 2,002 | 8.8% |
| 85 Years and Over | 1,288 | 5.7% |
| Total | 22,665 | 100.0% |
Housing Finances in Lenoir County
Median Income by Occupancy in Lenoir County
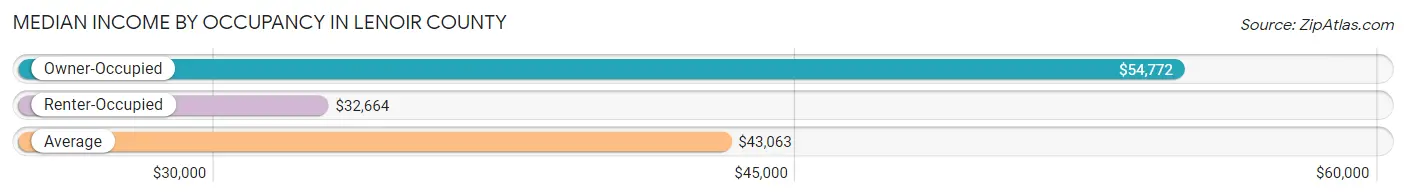
| Occupancy Type | # Households | Median Income |
| Owner-Occupied | 13,332 (58.8%) | $54,772 |
| Renter-Occupied | 9,333 (41.2%) | $32,664 |
| Average | 22,665 (100.0%) | $43,063 |
Occupancy by Householder Income Bracket in Lenoir County
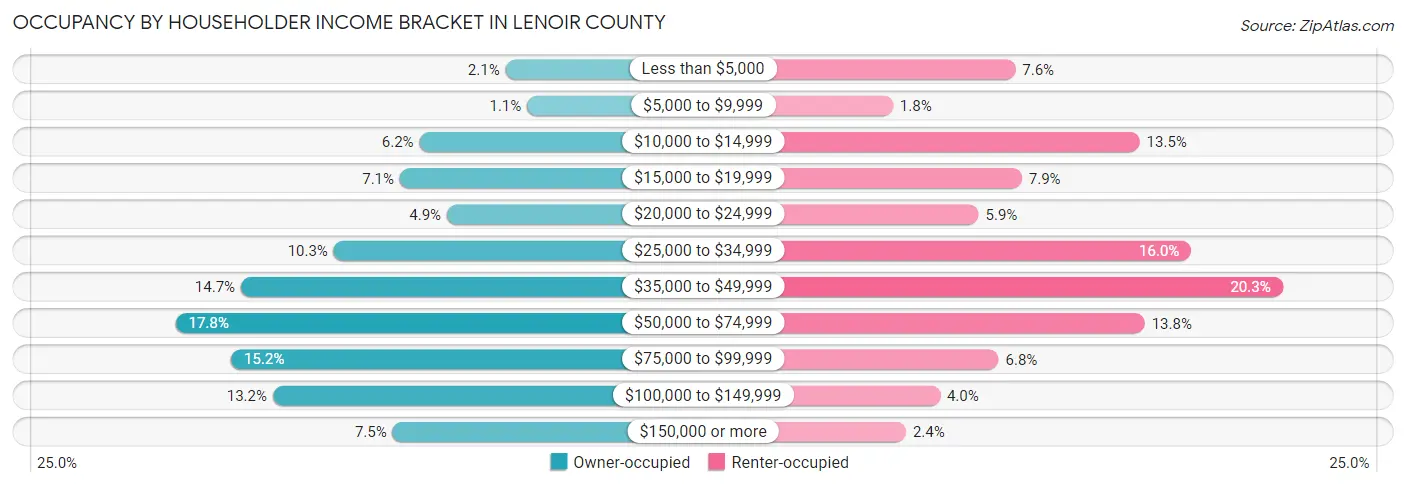
| Income Bracket | Owner-occupied | Renter-occupied |
| Less than $5,000 | 280 (2.1%) | 710 (7.6%) |
| $5,000 to $9,999 | 142 (1.1%) | 166 (1.8%) |
| $10,000 to $14,999 | 826 (6.2%) | 1,263 (13.5%) |
| $15,000 to $19,999 | 950 (7.1%) | 739 (7.9%) |
| $20,000 to $24,999 | 652 (4.9%) | 547 (5.9%) |
| $25,000 to $34,999 | 1,371 (10.3%) | 1,491 (16.0%) |
| $35,000 to $49,999 | 1,960 (14.7%) | 1,897 (20.3%) |
| $50,000 to $74,999 | 2,375 (17.8%) | 1,285 (13.8%) |
| $75,000 to $99,999 | 2,022 (15.2%) | 636 (6.8%) |
| $100,000 to $149,999 | 1,757 (13.2%) | 375 (4.0%) |
| $150,000 or more | 997 (7.5%) | 224 (2.4%) |
| Total | 13,332 (100.0%) | 9,333 (100.0%) |
Monthly Housing Cost Tiers in Lenoir County
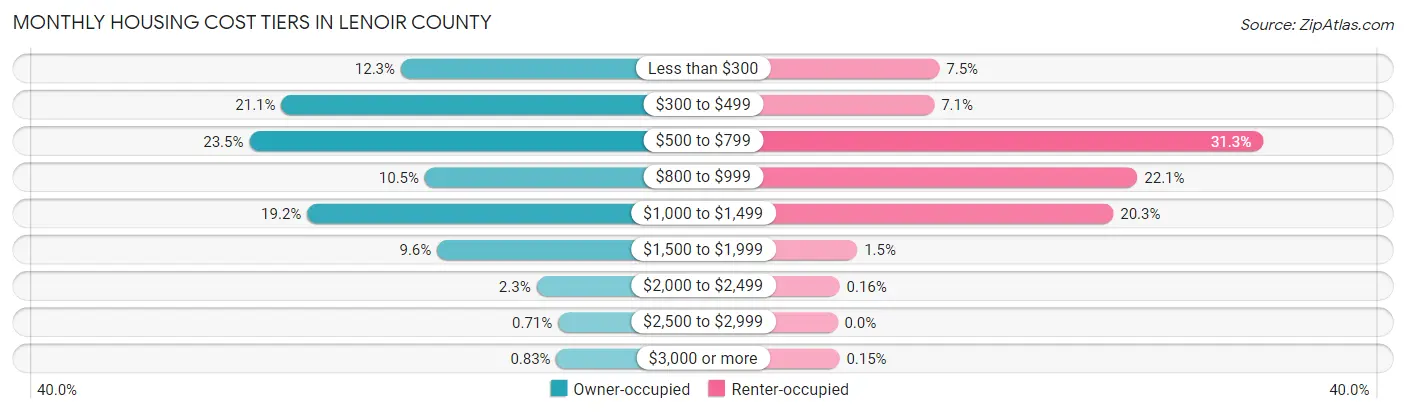
| Monthly Cost | Owner-occupied | Renter-occupied |
| Less than $300 | 1,639 (12.3%) | 701 (7.5%) |
| $300 to $499 | 2,812 (21.1%) | 665 (7.1%) |
| $500 to $799 | 3,126 (23.4%) | 2,925 (31.3%) |
| $800 to $999 | 1,403 (10.5%) | 2,062 (22.1%) |
| $1,000 to $1,499 | 2,558 (19.2%) | 1,896 (20.3%) |
| $1,500 to $1,999 | 1,282 (9.6%) | 136 (1.5%) |
| $2,000 to $2,499 | 306 (2.3%) | 15 (0.2%) |
| $2,500 to $2,999 | 95 (0.7%) | 0 (0.0%) |
| $3,000 or more | 111 (0.8%) | 14 (0.2%) |
| Total | 13,332 (100.0%) | 9,333 (100.0%) |
Physical Housing Characteristics in Lenoir County
Housing Structures in Lenoir County
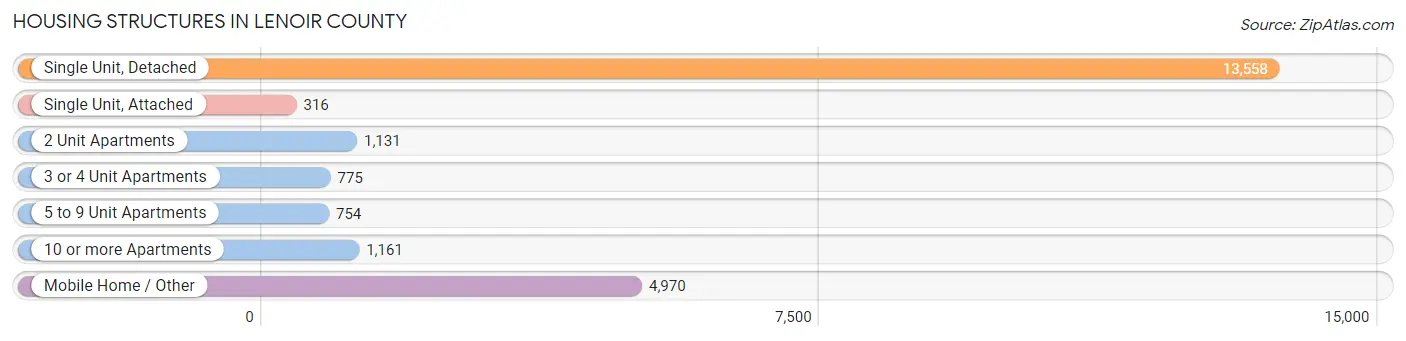
| Structure Type | # Housing Units | % Housing Units |
| Single Unit, Detached | 13,558 | 59.8% |
| Single Unit, Attached | 316 | 1.4% |
| 2 Unit Apartments | 1,131 | 5.0% |
| 3 or 4 Unit Apartments | 775 | 3.4% |
| 5 to 9 Unit Apartments | 754 | 3.3% |
| 10 or more Apartments | 1,161 | 5.1% |
| Mobile Home / Other | 4,970 | 21.9% |
| Total | 22,665 | 100.0% |
Housing Structures by Occupancy in Lenoir County
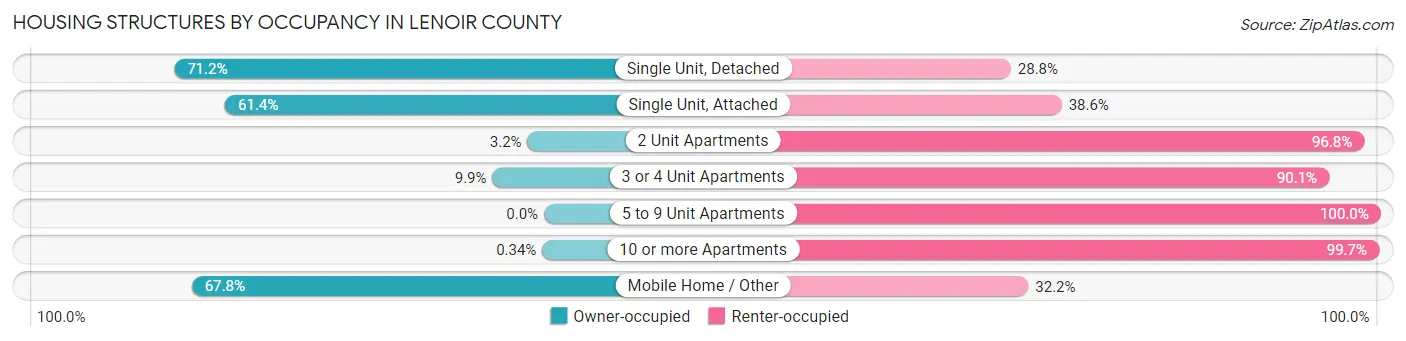
| Structure Type | Owner-occupied | Renter-occupied |
| Single Unit, Detached | 9,651 (71.2%) | 3,907 (28.8%) |
| Single Unit, Attached | 194 (61.4%) | 122 (38.6%) |
| 2 Unit Apartments | 36 (3.2%) | 1,095 (96.8%) |
| 3 or 4 Unit Apartments | 77 (9.9%) | 698 (90.1%) |
| 5 to 9 Unit Apartments | 0 (0.0%) | 754 (100.0%) |
| 10 or more Apartments | 4 (0.3%) | 1,157 (99.7%) |
| Mobile Home / Other | 3,370 (67.8%) | 1,600 (32.2%) |
| Total | 13,332 (58.8%) | 9,333 (41.2%) |
Housing Structures by Number of Rooms in Lenoir County
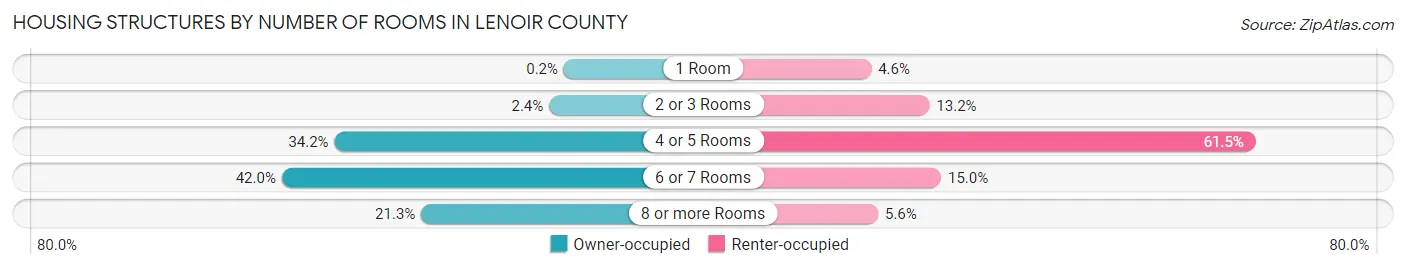
| Number of Rooms | Owner-occupied | Renter-occupied |
| 1 Room | 26 (0.2%) | 432 (4.6%) |
| 2 or 3 Rooms | 317 (2.4%) | 1,236 (13.2%) |
| 4 or 5 Rooms | 4,553 (34.2%) | 5,742 (61.5%) |
| 6 or 7 Rooms | 5,593 (41.9%) | 1,397 (15.0%) |
| 8 or more Rooms | 2,843 (21.3%) | 526 (5.6%) |
| Total | 13,332 (100.0%) | 9,333 (100.0%) |
Housing Structure by Heating Type in Lenoir County
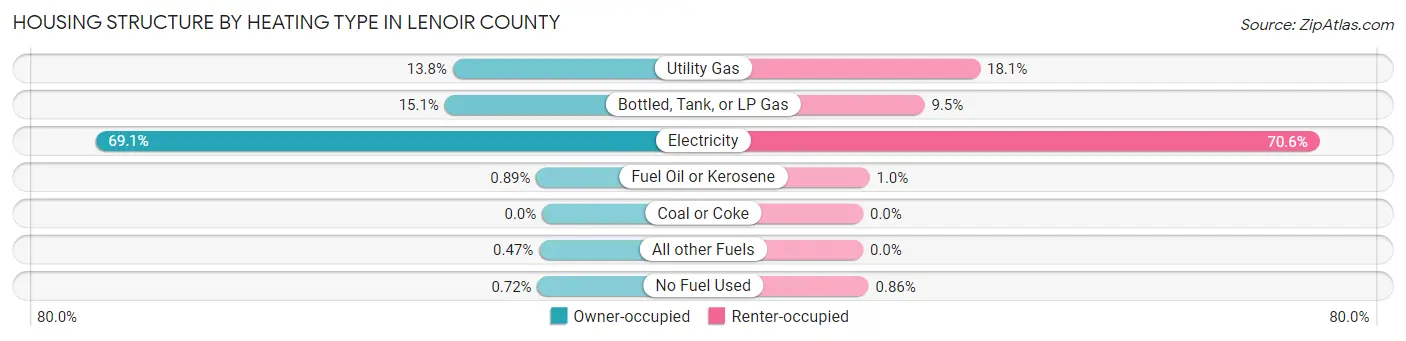
| Heating Type | Owner-occupied | Renter-occupied |
| Utility Gas | 1,840 (13.8%) | 1,688 (18.1%) |
| Bottled, Tank, or LP Gas | 2,008 (15.1%) | 886 (9.5%) |
| Electricity | 9,207 (69.1%) | 6,586 (70.6%) |
| Fuel Oil or Kerosene | 119 (0.9%) | 93 (1.0%) |
| Coal or Coke | 0 (0.0%) | 0 (0.0%) |
| All other Fuels | 62 (0.5%) | 0 (0.0%) |
| No Fuel Used | 96 (0.7%) | 80 (0.9%) |
| Total | 13,332 (100.0%) | 9,333 (100.0%) |
Household Vehicle Usage in Lenoir County
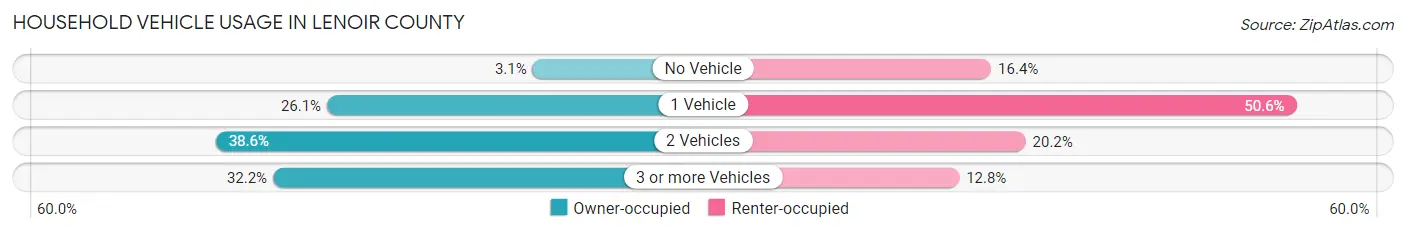
| Vehicles per Household | Owner-occupied | Renter-occupied |
| No Vehicle | 413 (3.1%) | 1,529 (16.4%) |
| 1 Vehicle | 3,484 (26.1%) | 4,720 (50.6%) |
| 2 Vehicles | 5,145 (38.6%) | 1,889 (20.2%) |
| 3 or more Vehicles | 4,290 (32.2%) | 1,195 (12.8%) |
| Total | 13,332 (100.0%) | 9,333 (100.0%) |
Real Estate & Mortgages in Lenoir County
Real Estate and Mortgage Overview in Lenoir County
| Characteristic | Without Mortgage | With Mortgage |
| Housing Units | 7,283 | 6,049 |
| Median Property Value | $86,900 | $121,300 |
| Median Household Income | $44,747 | $631 |
| Monthly Housing Costs | $436 | $111 |
| Real Estate Taxes | $827 | $274 |
Property Value by Mortgage Status in Lenoir County
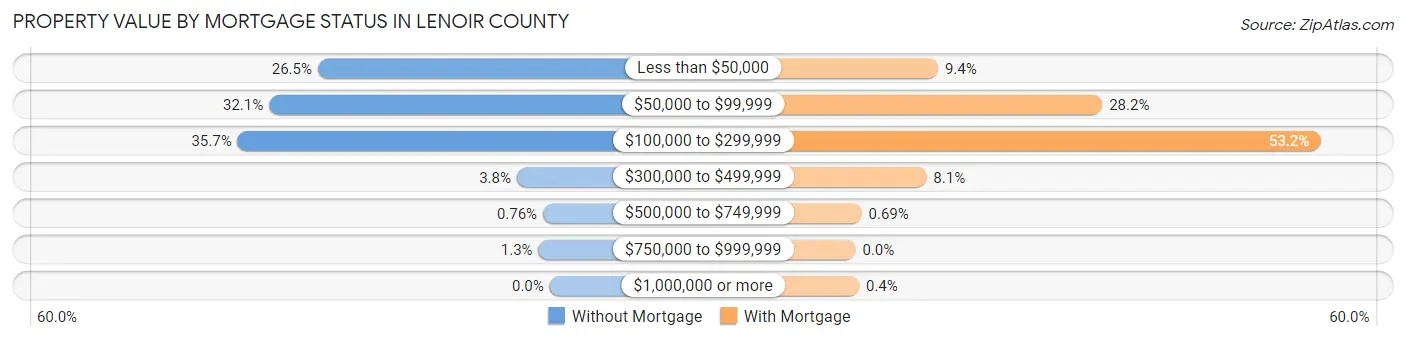
| Property Value | Without Mortgage | With Mortgage |
| Less than $50,000 | 1,929 (26.5%) | 570 (9.4%) |
| $50,000 to $99,999 | 2,335 (32.1%) | 1,705 (28.2%) |
| $100,000 to $299,999 | 2,598 (35.7%) | 3,218 (53.2%) |
| $300,000 to $499,999 | 273 (3.7%) | 490 (8.1%) |
| $500,000 to $749,999 | 55 (0.8%) | 42 (0.7%) |
| $750,000 to $999,999 | 93 (1.3%) | 0 (0.0%) |
| $1,000,000 or more | 0 (0.0%) | 24 (0.4%) |
| Total | 7,283 (100.0%) | 6,049 (100.0%) |
Household Income by Mortgage Status in Lenoir County
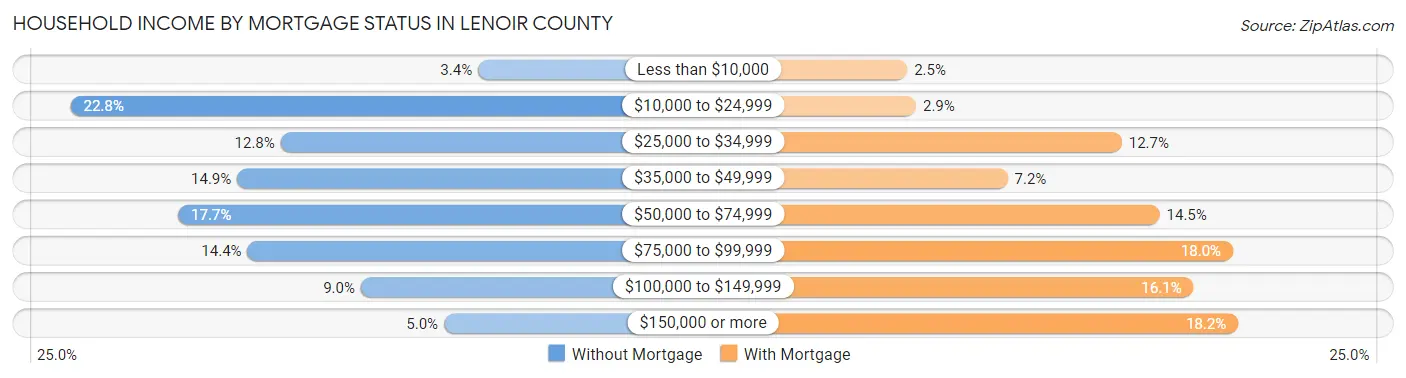
| Household Income | Without Mortgage | With Mortgage |
| Less than $10,000 | 248 (3.4%) | 149 (2.5%) |
| $10,000 to $24,999 | 1,661 (22.8%) | 174 (2.9%) |
| $25,000 to $34,999 | 933 (12.8%) | 767 (12.7%) |
| $35,000 to $49,999 | 1,084 (14.9%) | 438 (7.2%) |
| $50,000 to $74,999 | 1,288 (17.7%) | 876 (14.5%) |
| $75,000 to $99,999 | 1,048 (14.4%) | 1,087 (18.0%) |
| $100,000 to $149,999 | 655 (9.0%) | 974 (16.1%) |
| $150,000 or more | 366 (5.0%) | 1,102 (18.2%) |
| Total | 7,283 (100.0%) | 6,049 (100.0%) |
Property Value to Household Income Ratio in Lenoir County
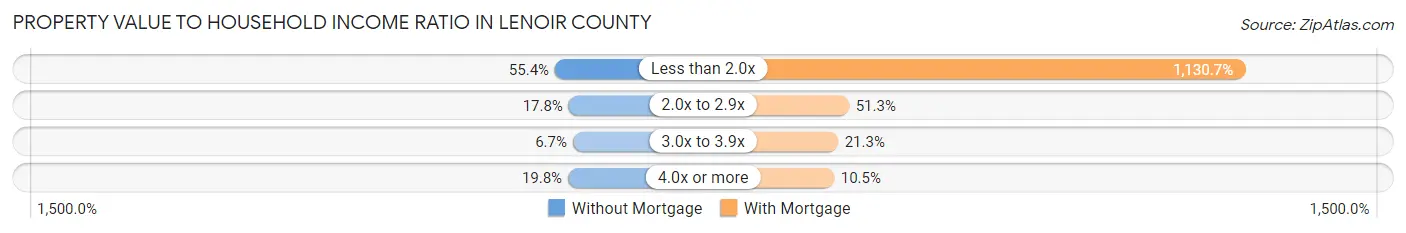
| Value-to-Income Ratio | Without Mortgage | With Mortgage |
| Less than 2.0x | 4,032 (55.4%) | 68,395 (1,130.7%) |
| 2.0x to 2.9x | 1,298 (17.8%) | 3,101 (51.3%) |
| 3.0x to 3.9x | 486 (6.7%) | 1,290 (21.3%) |
| 4.0x or more | 1,443 (19.8%) | 632 (10.4%) |
| Total | 7,283 (100.0%) | 6,049 (100.0%) |
Real Estate Taxes by Mortgage Status in Lenoir County
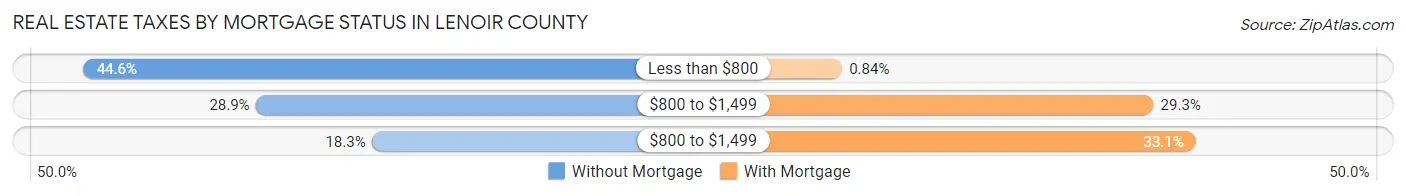
| Property Taxes | Without Mortgage | With Mortgage |
| Less than $800 | 3,248 (44.6%) | 51 (0.8%) |
| $800 to $1,499 | 2,106 (28.9%) | 1,771 (29.3%) |
| $800 to $1,499 | 1,334 (18.3%) | 2,002 (33.1%) |
| Total | 7,283 (100.0%) | 6,049 (100.0%) |
Health & Disability in Lenoir County
Health Insurance Coverage by Age in Lenoir County
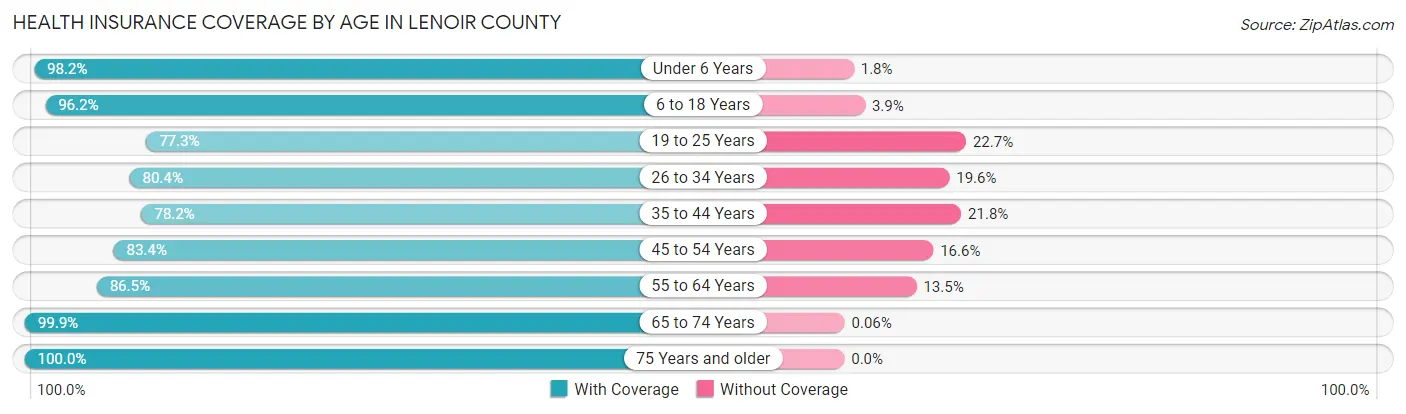
| Age Bracket | With Coverage | Without Coverage |
| Under 6 Years | 3,893 (98.2%) | 70 (1.8%) |
| 6 to 18 Years | 8,465 (96.2%) | 339 (3.8%) |
| 19 to 25 Years | 3,295 (77.3%) | 967 (22.7%) |
| 26 to 34 Years | 4,262 (80.4%) | 1,038 (19.6%) |
| 35 to 44 Years | 4,475 (78.2%) | 1,247 (21.8%) |
| 45 to 54 Years | 5,547 (83.4%) | 1,103 (16.6%) |
| 55 to 64 Years | 6,922 (86.5%) | 1,077 (13.5%) |
| 65 to 74 Years | 6,567 (99.9%) | 4 (0.1%) |
| 75 Years and older | 4,747 (100.0%) | 0 (0.0%) |
| Total | 48,173 (89.2%) | 5,845 (10.8%) |
Health Insurance Coverage by Citizenship Status in Lenoir County
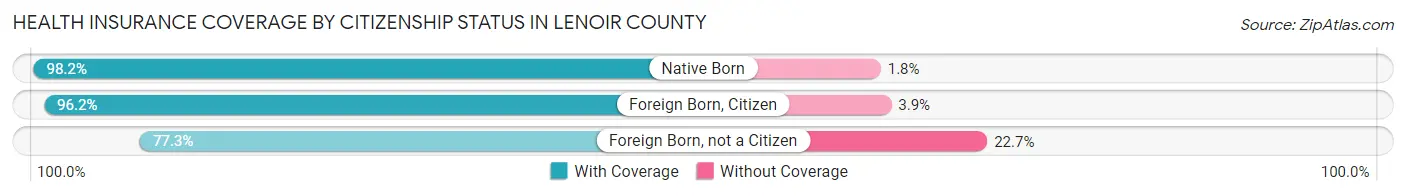
| Citizenship Status | With Coverage | Without Coverage |
| Native Born | 3,893 (98.2%) | 70 (1.8%) |
| Foreign Born, Citizen | 8,465 (96.2%) | 339 (3.8%) |
| Foreign Born, not a Citizen | 3,295 (77.3%) | 967 (22.7%) |
Health Insurance Coverage by Household Income in Lenoir County
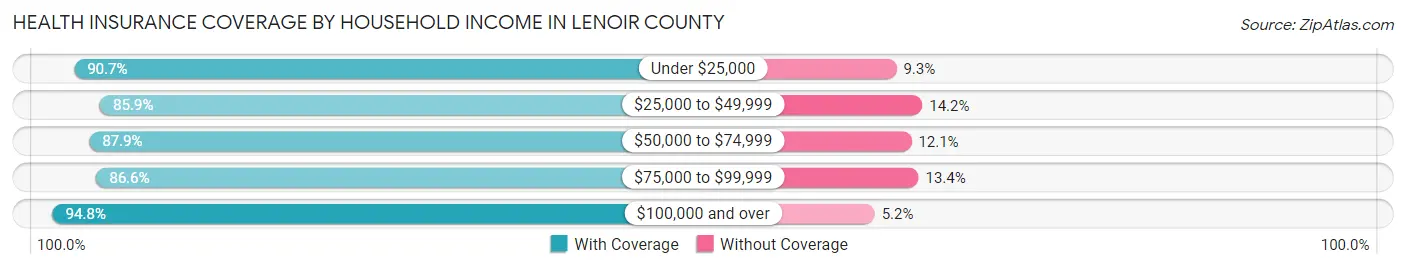
| Household Income | With Coverage | Without Coverage |
| Under $25,000 | 9,909 (90.7%) | 1,016 (9.3%) |
| $25,000 to $49,999 | 12,269 (85.9%) | 2,022 (14.1%) |
| $50,000 to $74,999 | 8,237 (87.9%) | 1,135 (12.1%) |
| $75,000 to $99,999 | 6,755 (86.6%) | 1,049 (13.4%) |
| $100,000 and over | 10,704 (94.8%) | 592 (5.2%) |
Public vs Private Health Insurance Coverage by Age in Lenoir County
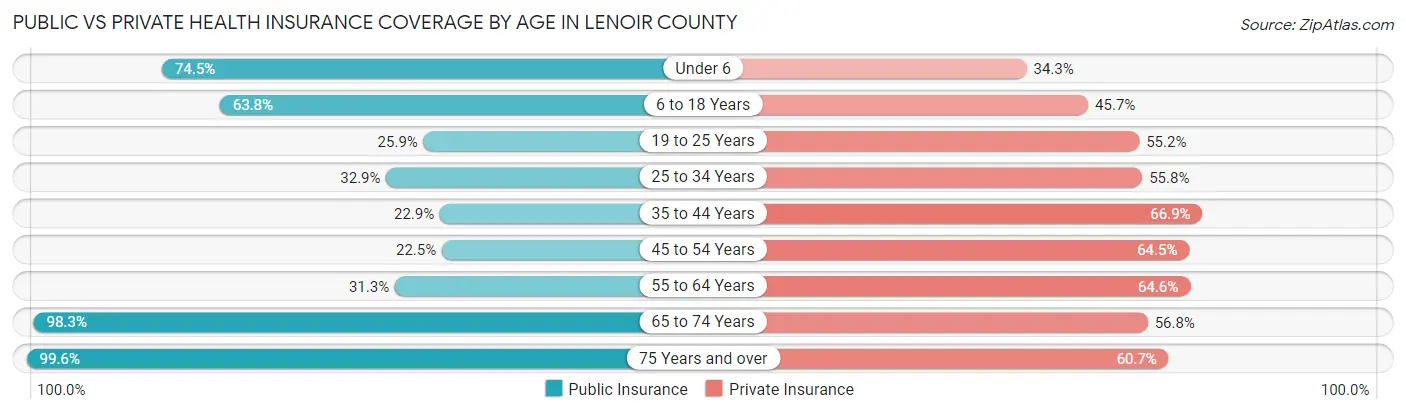
| Age Bracket | Public Insurance | Private Insurance |
| Under 6 | 2,953 (74.5%) | 1,359 (34.3%) |
| 6 to 18 Years | 5,613 (63.8%) | 4,026 (45.7%) |
| 19 to 25 Years | 1,105 (25.9%) | 2,353 (55.2%) |
| 25 to 34 Years | 1,741 (32.9%) | 2,956 (55.8%) |
| 35 to 44 Years | 1,309 (22.9%) | 3,830 (66.9%) |
| 45 to 54 Years | 1,497 (22.5%) | 4,288 (64.5%) |
| 55 to 64 Years | 2,500 (31.2%) | 5,170 (64.6%) |
| 65 to 74 Years | 6,461 (98.3%) | 3,731 (56.8%) |
| 75 Years and over | 4,729 (99.6%) | 2,880 (60.7%) |
| Total | 27,908 (51.7%) | 30,593 (56.6%) |
Disability Status by Sex by Age in Lenoir County
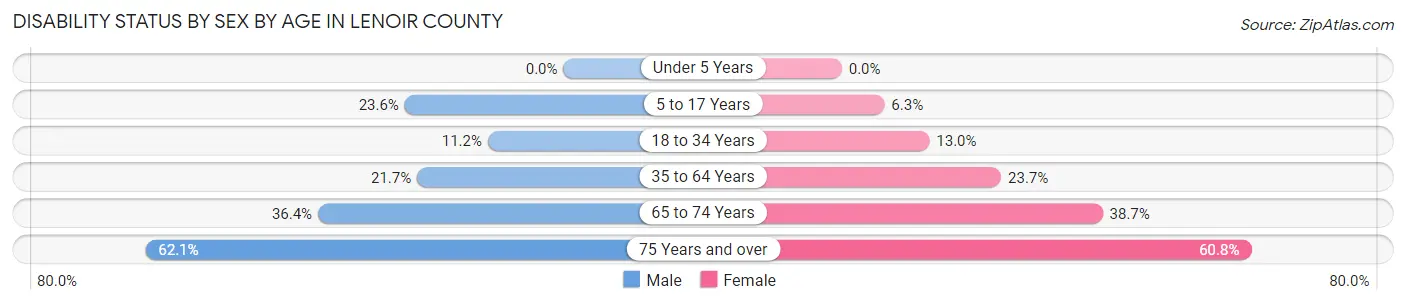
| Age Bracket | Male | Female |
| Under 5 Years | 0 (0.0%) | 0 (0.0%) |
| 5 to 17 Years | 1,096 (23.6%) | 286 (6.3%) |
| 18 to 34 Years | 555 (11.2%) | 666 (13.0%) |
| 35 to 64 Years | 2,094 (21.7%) | 2,539 (23.7%) |
| 65 to 74 Years | 1,079 (36.4%) | 1,398 (38.7%) |
| 75 Years and over | 1,132 (62.1%) | 1,777 (60.8%) |
Disability Class by Sex by Age in Lenoir County
Disability Class: Hearing Difficulty
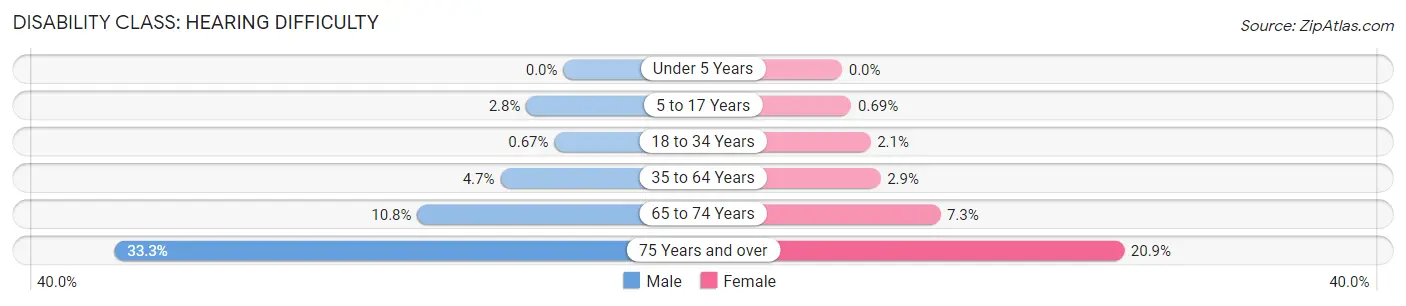
| Age Bracket | Male | Female |
| Under 5 Years | 0 (0.0%) | 0 (0.0%) |
| 5 to 17 Years | 128 (2.8%) | 31 (0.7%) |
| 18 to 34 Years | 33 (0.7%) | 108 (2.1%) |
| 35 to 64 Years | 451 (4.7%) | 306 (2.9%) |
| 65 to 74 Years | 321 (10.8%) | 263 (7.3%) |
| 75 Years and over | 608 (33.3%) | 612 (20.9%) |
Disability Class: Vision Difficulty
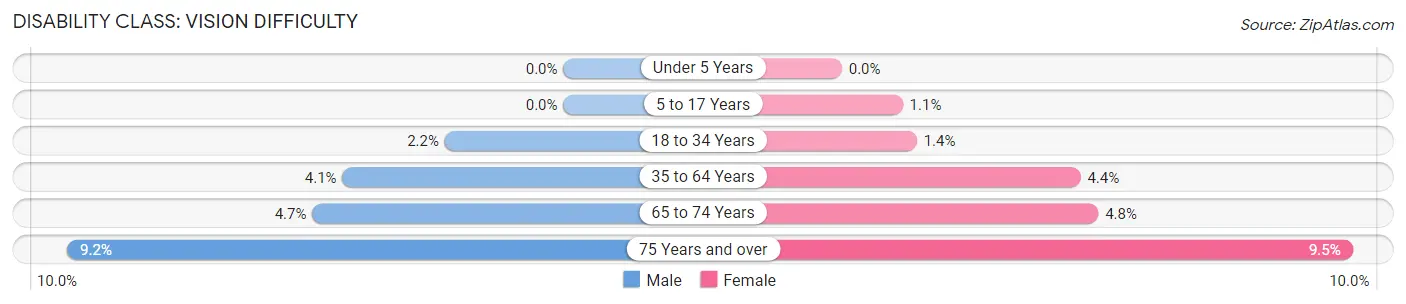
| Age Bracket | Male | Female |
| Under 5 Years | 0 (0.0%) | 0 (0.0%) |
| 5 to 17 Years | 0 (0.0%) | 51 (1.1%) |
| 18 to 34 Years | 109 (2.2%) | 71 (1.4%) |
| 35 to 64 Years | 395 (4.1%) | 475 (4.4%) |
| 65 to 74 Years | 138 (4.7%) | 172 (4.8%) |
| 75 Years and over | 168 (9.2%) | 277 (9.5%) |
Disability Class: Cognitive Difficulty
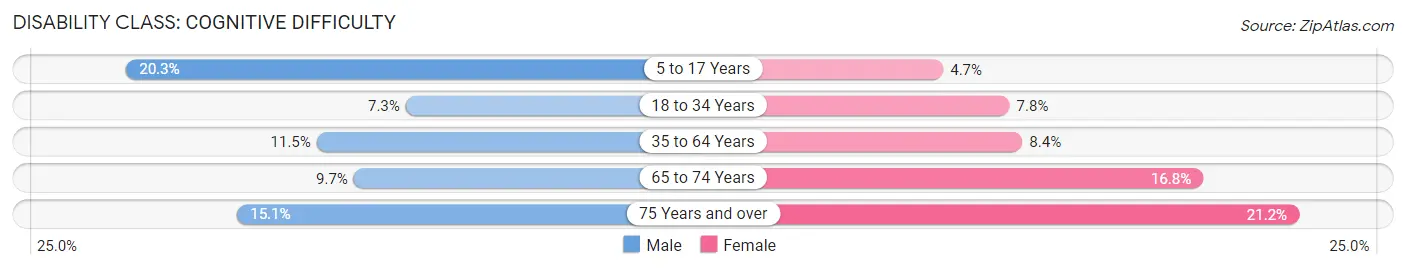
| Age Bracket | Male | Female |
| 5 to 17 Years | 943 (20.3%) | 213 (4.7%) |
| 18 to 34 Years | 362 (7.3%) | 399 (7.8%) |
| 35 to 64 Years | 1,104 (11.5%) | 899 (8.4%) |
| 65 to 74 Years | 288 (9.7%) | 605 (16.8%) |
| 75 Years and over | 276 (15.1%) | 620 (21.2%) |
Disability Class: Ambulatory Difficulty
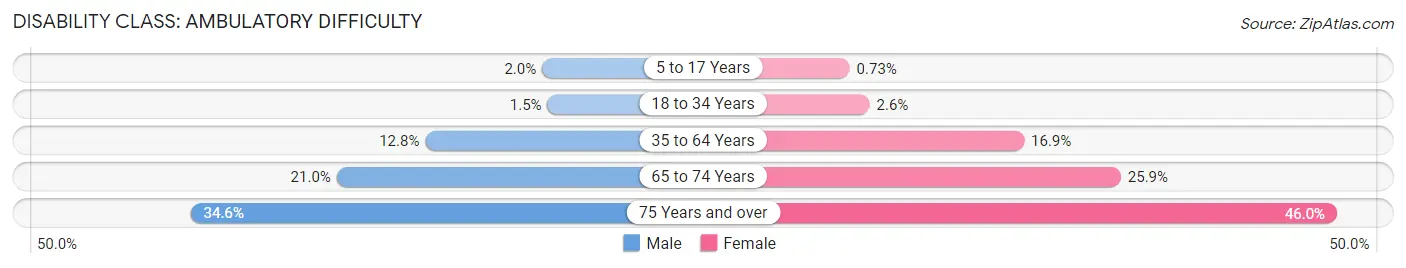
| Age Bracket | Male | Female |
| 5 to 17 Years | 92 (2.0%) | 33 (0.7%) |
| 18 to 34 Years | 73 (1.5%) | 132 (2.6%) |
| 35 to 64 Years | 1,236 (12.8%) | 1,815 (16.9%) |
| 65 to 74 Years | 623 (21.0%) | 935 (25.9%) |
| 75 Years and over | 631 (34.6%) | 1,343 (46.0%) |
Disability Class: Self-Care Difficulty
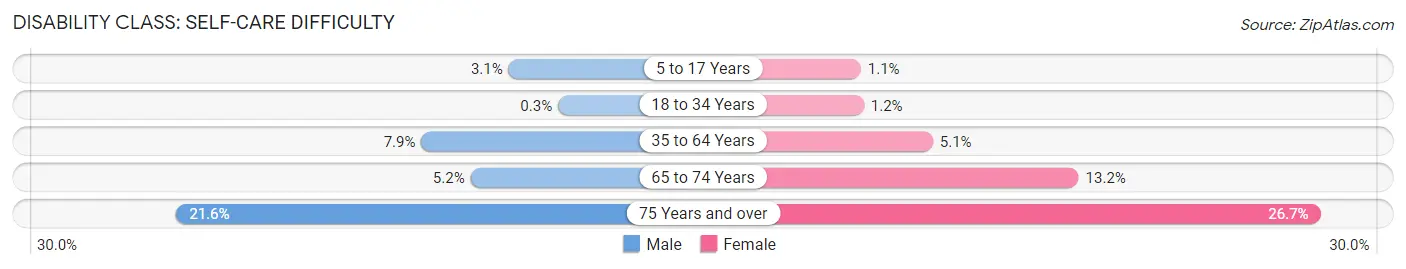
| Age Bracket | Male | Female |
| 5 to 17 Years | 142 (3.0%) | 48 (1.1%) |
| 18 to 34 Years | 15 (0.3%) | 63 (1.2%) |
| 35 to 64 Years | 763 (7.9%) | 544 (5.1%) |
| 65 to 74 Years | 153 (5.2%) | 476 (13.2%) |
| 75 Years and over | 393 (21.5%) | 779 (26.7%) |
Technology Access in Lenoir County
Computing Device Access in Lenoir County
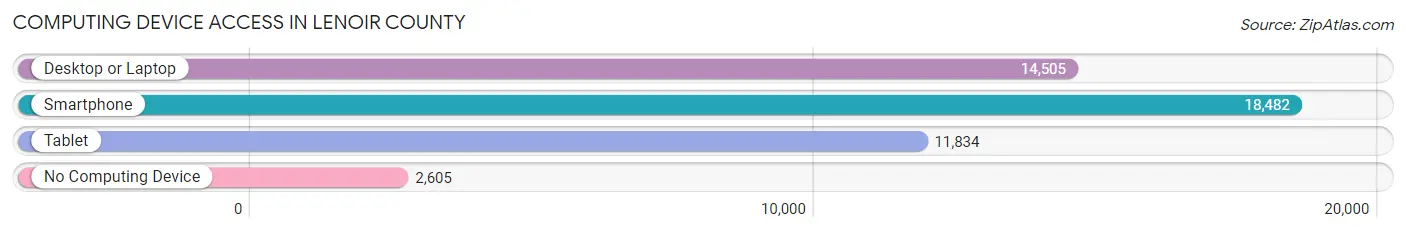
| Device Type | # Households | % Households |
| Desktop or Laptop | 14,505 | 64.0% |
| Smartphone | 18,482 | 81.5% |
| Tablet | 11,834 | 52.2% |
| No Computing Device | 2,605 | 11.5% |
| Total | 22,665 | 100.0% |
Internet Access in Lenoir County
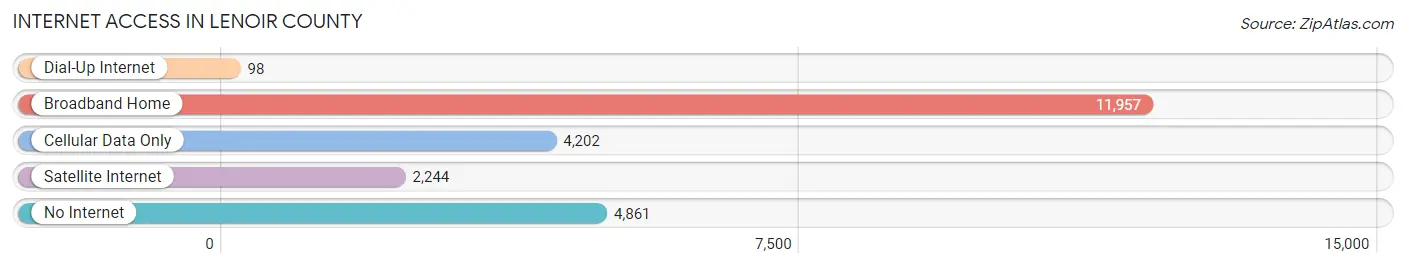
| Internet Type | # Households | % Households |
| Dial-Up Internet | 98 | 0.4% |
| Broadband Home | 11,957 | 52.8% |
| Cellular Data Only | 4,202 | 18.5% |
| Satellite Internet | 2,244 | 9.9% |
| No Internet | 4,861 | 21.4% |
| Total | 22,665 | 100.0% |
Lenoir County Summary
Introduction
Lenoir County is located in the eastern part of North Carolina, and is part of the Inner Banks region. It is bordered by Jones County to the north, Pitt County to the east, Greene County to the south, and Wayne County to the west. The county seat is Kinston, and the county is named after William Lenoir, a Revolutionary War hero and early settler of the area. Lenoir County has a population of 59,495, according to the 2020 census, and is the fourth most populous county in the state.
History
Lenoir County was formed in 1791 from Dobbs County. It was named after William Lenoir, a Revolutionary War hero and early settler of the area. The county was originally part of Craven County, which was divided into three counties in 1729. The county seat was established in Kinston in 1791, and the county was divided into five townships in 1855.
The county was home to several prominent figures in North Carolina history, including William Lenoir, William Gaston, and William A. Graham. Lenoir County was also the site of several Civil War battles, including the Battle of Kinston in December 1862.
Geography
Lenoir County is located in the eastern part of North Carolina, and is part of the Inner Banks region. It is bordered by Jones County to the north, Pitt County to the east, Greene County to the south, and Wayne County to the west. The county covers an area of 545 square miles, and is the fourth largest county in the state.
The terrain of Lenoir County is mostly flat, with some rolling hills in the northern and western parts of the county. The Neuse River forms the eastern border of the county, and the Trent River forms the western border. The county is home to several lakes, including Contentnea Lake, Lake Waccamaw, and Lake Phelps.
Economy
Lenoir County has a diverse economy, with a mix of manufacturing, agriculture, and services. The county is home to several large employers, including Lenoir County Public Schools, Lenoir Memorial Hospital, and the United States Navy.
The county is also home to several manufacturing companies, including the Kinston-based Grady-White Boats, which produces recreational boats, and the Kinston-based Lenoir County Industries, which produces furniture. Agriculture is also an important part of the county's economy, with tobacco, corn, soybeans, and cotton being the main crops.
Demographics
According to the 2020 census, Lenoir County has a population of 59,495. The population is 53.2% White, 39.3% African American, 2.2% Hispanic or Latino, 2.1% Asian, and 0.2% Native American. The median household income is $41,945, and the median age is 38.7 years.
Conclusion
Lenoir County is a diverse county located in the eastern part of North Carolina. It has a rich history, with several prominent figures in North Carolina history having lived in the county. The county has a diverse economy, with a mix of manufacturing, agriculture, and services. The population is mostly White, with a significant African American population. The median household income is $41,945, and the median age is 38.7 years.
Common Questions
What is Per Capita Income in Lenoir County?
Per Capita income in Lenoir County is $26,697.
What is the Median Family Income in Lenoir County?
Median Family Income in Lenoir County is $56,723.
What is the Median Household income in Lenoir County?
Median Household Income in Lenoir County is $43,063.
What is Income or Wage Gap in Lenoir County?
Income or Wage Gap in Lenoir County is 17.7%.
Women in Lenoir County earn 82.3 cents for every dollar earned by a man.
What is Family Income Deficit in Lenoir County?
Family Income Deficit in Lenoir County is $10,299.
Families that are below poverty line in Lenoir County earn $10,299 less on average than the poverty threshold level.
What is Inequality or Gini Index in Lenoir County?
Inequality or Gini Index in Lenoir County is 0.47.
What is the Total Population of Lenoir County?
Total Population of Lenoir County is 55,071.
What is the Total Male Population of Lenoir County?
Total Male Population of Lenoir County is 26,348.
What is the Total Female Population of Lenoir County?
Total Female Population of Lenoir County is 28,723.
What is the Ratio of Males per 100 Females in Lenoir County?
There are 91.73 Males per 100 Females in Lenoir County.
What is the Ratio of Females per 100 Males in Lenoir County?
There are 109.01 Females per 100 Males in Lenoir County.
What is the Median Population Age in Lenoir County?
Median Population Age in Lenoir County is 42.7 Years.
What is the Average Family Size in Lenoir County
Average Family Size in Lenoir County is 3.0 People.
What is the Average Household Size in Lenoir County
Average Household Size in Lenoir County is 2.4 People.
How Large is the Labor Force in Lenoir County?
There are 24,538 People in the Labor Forcein in Lenoir County.
What is the Percentage of People in the Labor Force in Lenoir County?
55.4% of People are in the Labor Force in Lenoir County.
What is the Unemployment Rate in Lenoir County?
Unemployment Rate in Lenoir County is 7.1%.