Lee County, NC Map & Demographics
Lee County Map
Lee County Overview
$30,083
PER CAPITA INCOME
$67,217
AVG FAMILY INCOME
$60,941
AVG HOUSEHOLD INCOME
28.7%
WAGE / INCOME GAP [ % ]
71.3¢/ $1
WAGE / INCOME GAP [ $ ]
$10,412
FAMILY INCOME DEFICIT
0.43
INEQUALITY / GINI INDEX
63,560
TOTAL POPULATION
31,219
MALE POPULATION
32,341
FEMALE POPULATION
96.53
MALES / 100 FEMALES
103.59
FEMALES / 100 MALES
39.6
MEDIAN AGE
3.0
AVG FAMILY SIZE
2.6
AVG HOUSEHOLD SIZE
30,407
LABOR FORCE [ PEOPLE ]
60.5%
PERCENT IN LABOR FORCE
5.2%
UNEMPLOYMENT RATE
Lee County Area Codes
Income in Lee County
Income Overview in Lee County
Per Capita Income in Lee County is $30,083, while median incomes of families and households are $67,217 and $60,941 respectively.
| Characteristic | Number | Measure |
| Per Capita Income | 63,560 | $30,083 |
| Median Family Income | 16,931 | $67,217 |
| Mean Family Income | 16,931 | $87,189 |
| Median Household Income | 24,050 | $60,941 |
| Mean Household Income | 24,050 | $77,283 |
| Income Deficit | 16,931 | $10,412 |
| Wage / Income Gap (%) | 63,560 | 28.68% |
| Wage / Income Gap ($) | 63,560 | 71.32¢ per $1 |
| Gini / Inequality Index | 63,560 | 0.43 |
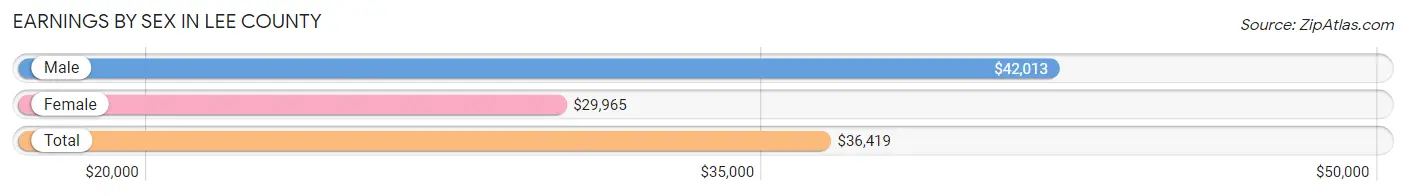
Earnings by Sex in Lee County
Average Earnings in Lee County are $36,419, $42,013 for men and $29,965 for women, a difference of 28.7%.
| Sex | Number | Average Earnings |
| Male | 17,111 (53.6%) | $42,013 |
| Female | 14,797 (46.4%) | $29,965 |
| Total | 31,908 (100.0%) | $36,419 |
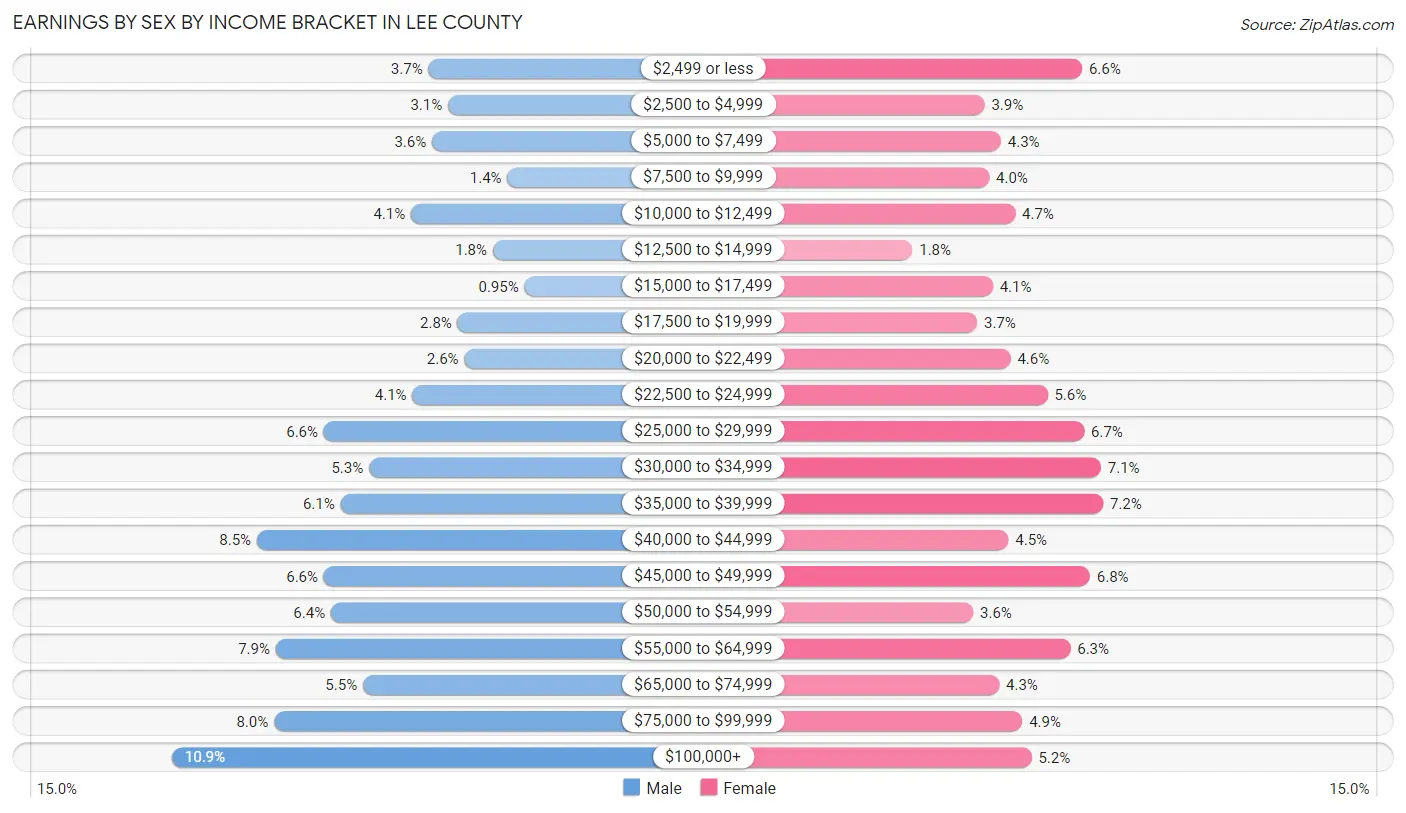
Earnings by Sex by Income Bracket in Lee County
The most common earnings brackets in Lee County are $100,000+ for men (1,859 | 10.9%) and $35,000 to $39,999 for women (1,066 | 7.2%).
| Income | Male | Female |
| $2,499 or less | 625 (3.6%) | 978 (6.6%) |
| $2,500 to $4,999 | 530 (3.1%) | 573 (3.9%) |
| $5,000 to $7,499 | 608 (3.5%) | 640 (4.3%) |
| $7,500 to $9,999 | 244 (1.4%) | 592 (4.0%) |
| $10,000 to $12,499 | 709 (4.1%) | 700 (4.7%) |
| $12,500 to $14,999 | 314 (1.8%) | 272 (1.8%) |
| $15,000 to $17,499 | 163 (0.9%) | 607 (4.1%) |
| $17,500 to $19,999 | 484 (2.8%) | 542 (3.7%) |
| $20,000 to $22,499 | 452 (2.6%) | 681 (4.6%) |
| $22,500 to $24,999 | 701 (4.1%) | 835 (5.6%) |
| $25,000 to $29,999 | 1,128 (6.6%) | 987 (6.7%) |
| $30,000 to $34,999 | 911 (5.3%) | 1,056 (7.1%) |
| $35,000 to $39,999 | 1,048 (6.1%) | 1,066 (7.2%) |
| $40,000 to $44,999 | 1,450 (8.5%) | 672 (4.5%) |
| $45,000 to $49,999 | 1,127 (6.6%) | 1,010 (6.8%) |
| $50,000 to $54,999 | 1,093 (6.4%) | 526 (3.5%) |
| $55,000 to $64,999 | 1,358 (7.9%) | 929 (6.3%) |
| $65,000 to $74,999 | 939 (5.5%) | 634 (4.3%) |
| $75,000 to $99,999 | 1,368 (8.0%) | 729 (4.9%) |
| $100,000+ | 1,859 (10.9%) | 768 (5.2%) |
| Total | 17,111 (100.0%) | 14,797 (100.0%) |
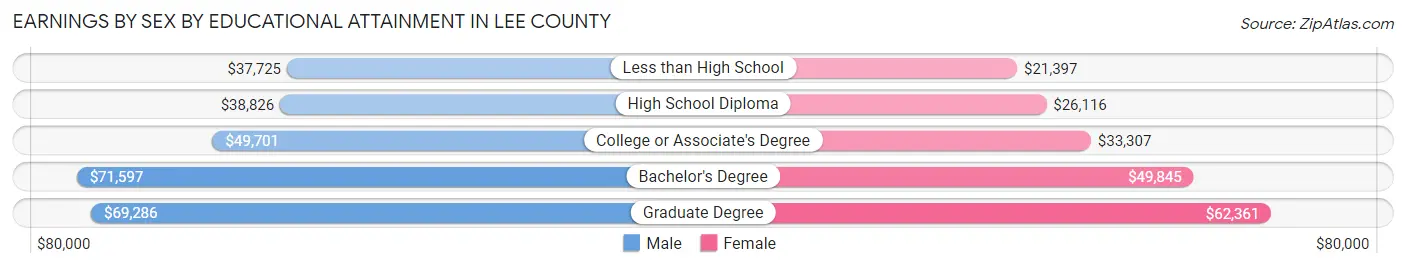
Earnings by Sex by Educational Attainment in Lee County
Average earnings in Lee County are $45,523 for men and $34,619 for women, a difference of 23.9%. Men with an educational attainment of bachelor's degree enjoy the highest average annual earnings of $71,597, while those with less than high school education earn the least with $37,725. Women with an educational attainment of graduate degree earn the most with the average annual earnings of $62,361, while those with less than high school education have the smallest earnings of $21,397.
| Educational Attainment | Male Income | Female Income |
| Less than High School | $37,725 | $21,397 |
| High School Diploma | $38,826 | $26,116 |
| College or Associate's Degree | $49,701 | $33,307 |
| Bachelor's Degree | $71,597 | $49,845 |
| Graduate Degree | $69,286 | $62,361 |
| Total | $45,523 | $34,619 |
Family Income in Lee County
Family Income Brackets in Lee County
According to the Lee County family income data, there are 3,928 families falling into the $50,000 to $74,999 income range, which is the most common income bracket and makes up 23.2% of all families. Conversely, the $10,000 to $14,999 income bracket is the least frequent group with only 356 families (2.1%) belonging to this category.
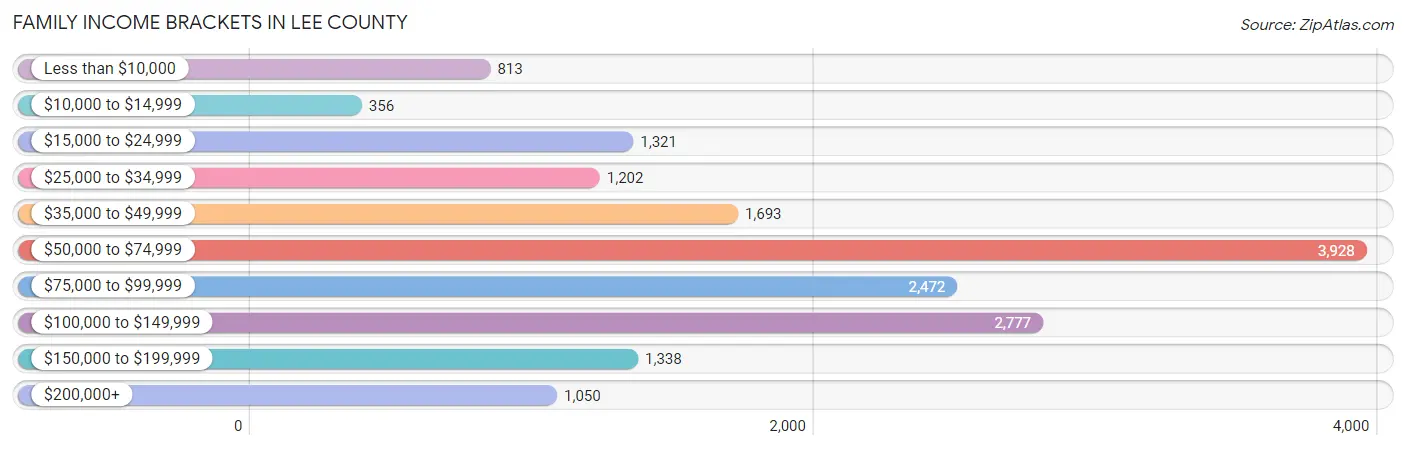
| Income Bracket | # Families | % Families |
| Less than $10,000 | 813 | 4.8% |
| $10,000 to $14,999 | 356 | 2.1% |
| $15,000 to $24,999 | 1,321 | 7.8% |
| $25,000 to $34,999 | 1,202 | 7.1% |
| $35,000 to $49,999 | 1,693 | 10.0% |
| $50,000 to $74,999 | 3,928 | 23.2% |
| $75,000 to $99,999 | 2,472 | 14.6% |
| $100,000 to $149,999 | 2,777 | 16.4% |
| $150,000 to $199,999 | 1,338 | 7.9% |
| $200,000+ | 1,050 | 6.2% |
Family Income by Famaliy Size in Lee County
4-person families (2,429 | 14.3%) account for the highest median family income in Lee County with $87,582 per family, while 2-person families (8,225 | 48.6%) have the highest median income of $33,681 per family member.
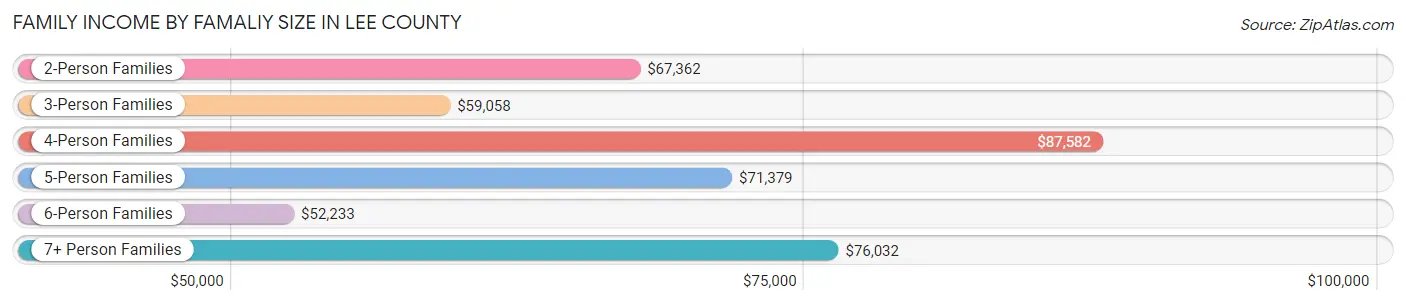
| Income Bracket | # Families | Median Income |
| 2-Person Families | 8,225 (48.6%) | $67,362 |
| 3-Person Families | 4,094 (24.2%) | $59,058 |
| 4-Person Families | 2,429 (14.3%) | $87,582 |
| 5-Person Families | 1,506 (8.9%) | $71,379 |
| 6-Person Families | 477 (2.8%) | $52,233 |
| 7+ Person Families | 200 (1.2%) | $76,032 |
| Total | 16,931 (100.0%) | $67,217 |
Family Income by Number of Earners in Lee County
The median family income in Lee County is $67,217, with families comprising 3+ earners (1,826) having the highest median family income of $106,377, while families with no earners (2,853) have the lowest median family income of $43,257, accounting for 10.8% and 16.9% of families, respectively.
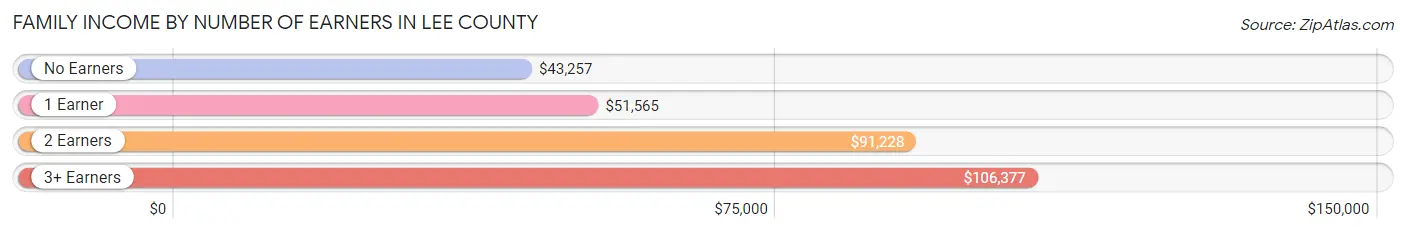
| Number of Earners | # Families | Median Income |
| No Earners | 2,853 (16.9%) | $43,257 |
| 1 Earner | 6,054 (35.8%) | $51,565 |
| 2 Earners | 6,198 (36.6%) | $91,228 |
| 3+ Earners | 1,826 (10.8%) | $106,377 |
| Total | 16,931 (100.0%) | $67,217 |
Household Income in Lee County
Household Income Brackets in Lee County
With 5,315 households falling in the category, the $50,000 to $74,999 income range is the most frequent in Lee County, accounting for 22.1% of all households. In contrast, only 1,058 households (4.4%) fall into the $10,000 to $14,999 income bracket, making it the least populous group.
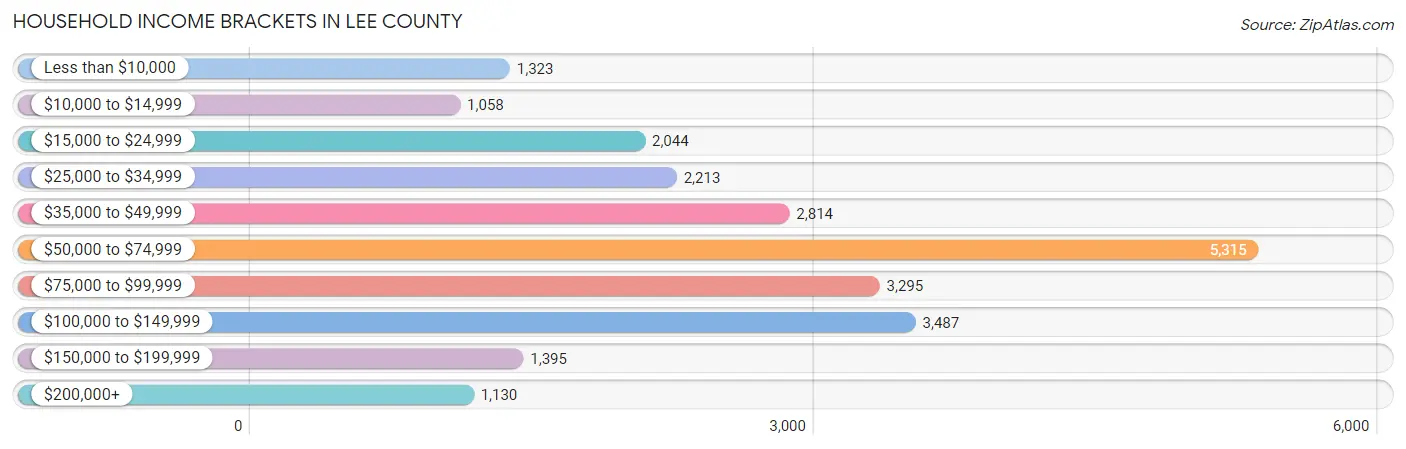
| Income Bracket | # Households | % Households |
| Less than $10,000 | 1,323 | 5.5% |
| $10,000 to $14,999 | 1,058 | 4.4% |
| $15,000 to $24,999 | 2,044 | 8.5% |
| $25,000 to $34,999 | 2,213 | 9.2% |
| $35,000 to $49,999 | 2,814 | 11.7% |
| $50,000 to $74,999 | 5,315 | 22.1% |
| $75,000 to $99,999 | 3,295 | 13.7% |
| $100,000 to $149,999 | 3,487 | 14.5% |
| $150,000 to $199,999 | 1,395 | 5.8% |
| $200,000+ | 1,130 | 4.7% |
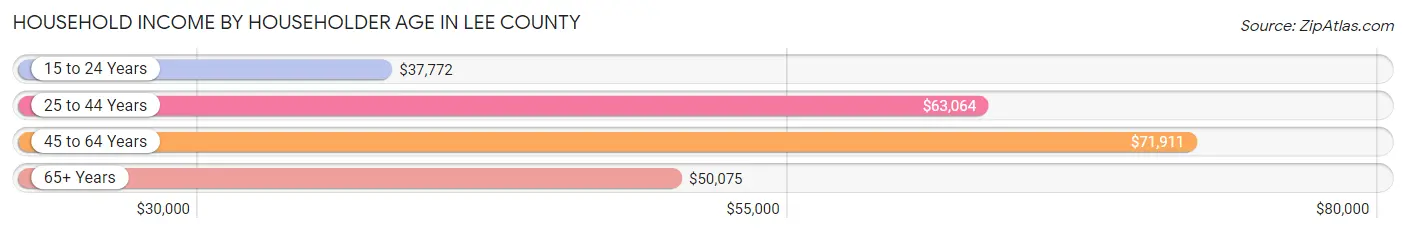
Household Income by Householder Age in Lee County
The median household income in Lee County is $60,941, with the highest median household income of $71,911 found in the 45 to 64 years age bracket for the primary householder. A total of 9,191 households (38.2%) fall into this category. Meanwhile, the 15 to 24 years age bracket for the primary householder has the lowest median household income of $37,772, with 701 households (2.9%) in this group.
| Income Bracket | # Households | Median Income |
| 15 to 24 Years | 701 (2.9%) | $37,772 |
| 25 to 44 Years | 7,403 (30.8%) | $63,064 |
| 45 to 64 Years | 9,191 (38.2%) | $71,911 |
| 65+ Years | 6,755 (28.1%) | $50,075 |
| Total | 24,050 (100.0%) | $60,941 |
Poverty in Lee County
Income Below Poverty by Sex and Age in Lee County
With 14.5% poverty level for males and 17.4% for females among the residents of Lee County, 15 year old males and 5 year old females are the most vulnerable to poverty, with 130 males (37.6%) and 151 females (47.0%) in their respective age groups living below the poverty level.
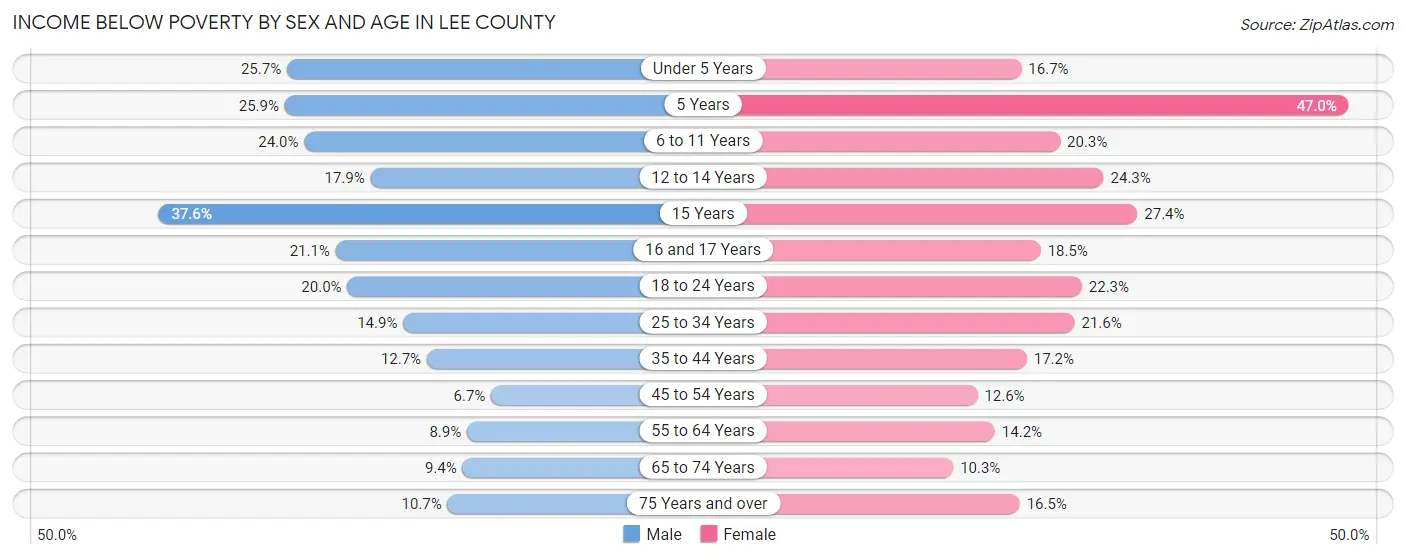
| Age Bracket | Male | Female |
| Under 5 Years | 506 (25.7%) | 306 (16.7%) |
| 5 Years | 53 (25.9%) | 151 (47.0%) |
| 6 to 11 Years | 543 (24.0%) | 559 (20.3%) |
| 12 to 14 Years | 268 (17.9%) | 261 (24.3%) |
| 15 Years | 130 (37.6%) | 124 (27.4%) |
| 16 and 17 Years | 198 (21.1%) | 161 (18.5%) |
| 18 to 24 Years | 536 (20.0%) | 563 (22.3%) |
| 25 to 34 Years | 580 (14.9%) | 875 (21.6%) |
| 35 to 44 Years | 527 (12.7%) | 676 (17.2%) |
| 45 to 54 Years | 245 (6.7%) | 524 (12.6%) |
| 55 to 64 Years | 361 (8.9%) | 602 (14.2%) |
| 65 to 74 Years | 274 (9.3%) | 339 (10.3%) |
| 75 Years and over | 179 (10.7%) | 393 (16.5%) |
| Total | 4,400 (14.5%) | 5,534 (17.4%) |
Income Above Poverty by Sex and Age in Lee County
According to the poverty statistics in Lee County, males aged 45 to 54 years and females aged 65 to 74 years are the age groups that are most secure financially, with 93.3% of males and 89.7% of females in these age groups living above the poverty line.
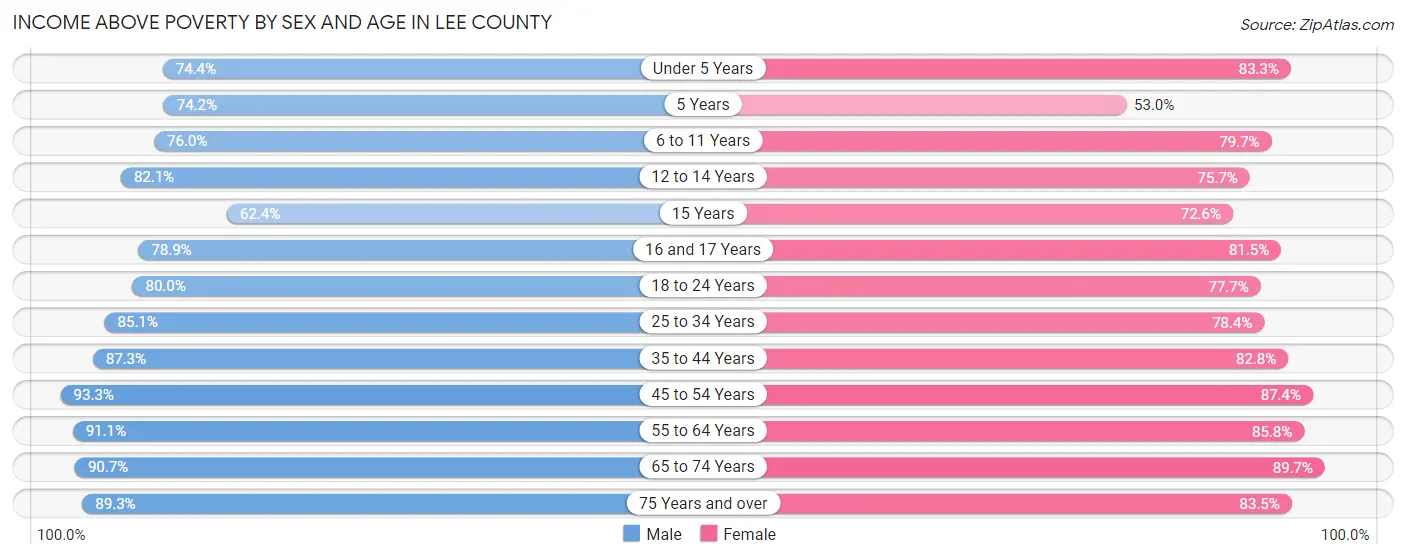
| Age Bracket | Male | Female |
| Under 5 Years | 1,467 (74.4%) | 1,530 (83.3%) |
| 5 Years | 152 (74.2%) | 170 (53.0%) |
| 6 to 11 Years | 1,716 (76.0%) | 2,200 (79.7%) |
| 12 to 14 Years | 1,230 (82.1%) | 813 (75.7%) |
| 15 Years | 216 (62.4%) | 328 (72.6%) |
| 16 and 17 Years | 739 (78.9%) | 711 (81.5%) |
| 18 to 24 Years | 2,139 (80.0%) | 1,964 (77.7%) |
| 25 to 34 Years | 3,322 (85.1%) | 3,175 (78.4%) |
| 35 to 44 Years | 3,637 (87.3%) | 3,261 (82.8%) |
| 45 to 54 Years | 3,412 (93.3%) | 3,639 (87.4%) |
| 55 to 64 Years | 3,677 (91.1%) | 3,633 (85.8%) |
| 65 to 74 Years | 2,657 (90.6%) | 2,941 (89.7%) |
| 75 Years and over | 1,487 (89.3%) | 1,988 (83.5%) |
| Total | 25,851 (85.5%) | 26,353 (82.6%) |
Income Below Poverty Among Married-Couple Families in Lee County
The poverty statistics for married-couple families in Lee County show that 6.0% or 678 of the total 11,380 families live below the poverty line. Families with 3 or 4 children have the highest poverty rate of 20.2%, comprising of 244 families. On the other hand, families with no children have the lowest poverty rate of 3.8%, which includes 267 families.
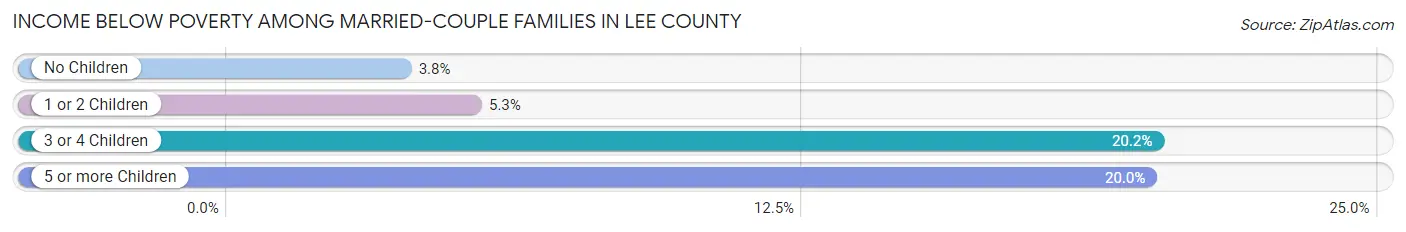
| Children | Above Poverty | Below Poverty |
| No Children | 6,801 (96.2%) | 267 (3.8%) |
| 1 or 2 Children | 2,922 (94.7%) | 164 (5.3%) |
| 3 or 4 Children | 967 (79.8%) | 244 (20.2%) |
| 5 or more Children | 12 (80.0%) | 3 (20.0%) |
| Total | 10,702 (94.0%) | 678 (6.0%) |
Income Below Poverty Among Single-Parent Households in Lee County
According to the poverty data in Lee County, 15.7% or 256 single-father households and 33.6% or 1,319 single-mother households are living below the poverty line. Among single-father households, those with 3 or 4 children have the highest poverty rate, with 27 households (33.3%) experiencing poverty. Likewise, among single-mother households, those with 5 or more children have the highest poverty rate, with 29 households (100.0%) falling below the poverty line.
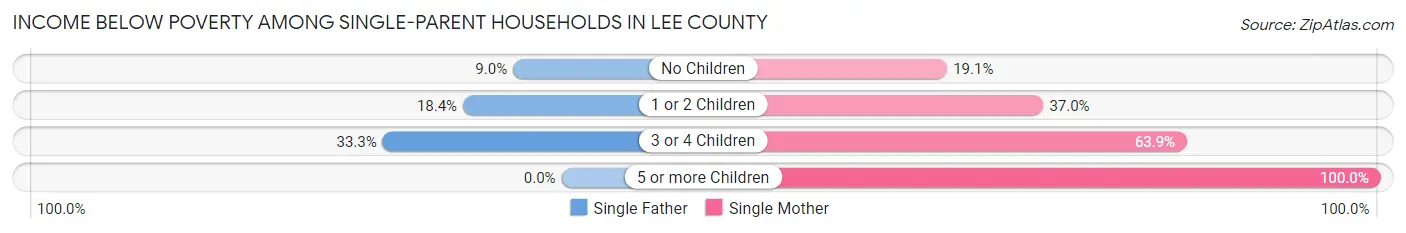
| Children | Single Father | Single Mother |
| No Children | 53 (9.0%) | 267 (19.1%) |
| 1 or 2 Children | 176 (18.3%) | 789 (37.0%) |
| 3 or 4 Children | 27 (33.3%) | 234 (63.9%) |
| 5 or more Children | 0 (0.0%) | 29 (100.0%) |
| Total | 256 (15.7%) | 1,319 (33.6%) |
Income Below Poverty Among Married-Couple vs Single-Parent Households in Lee County
The poverty data for Lee County shows that 678 of the married-couple family households (6.0%) and 1,575 of the single-parent households (28.4%) are living below the poverty level. Within the married-couple family households, those with 3 or 4 children have the highest poverty rate, with 244 households (20.2%) falling below the poverty line. Among the single-parent households, those with 5 or more children have the highest poverty rate, with 29 household (100.0%) living below poverty.
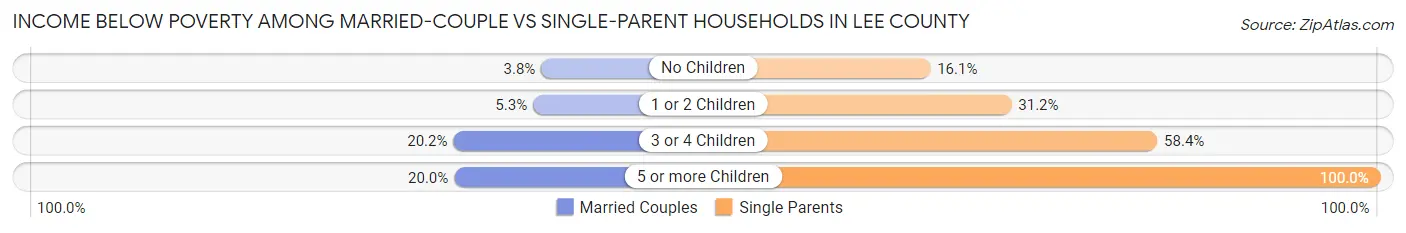
| Children | Married-Couple Families | Single-Parent Households |
| No Children | 267 (3.8%) | 320 (16.1%) |
| 1 or 2 Children | 164 (5.3%) | 965 (31.2%) |
| 3 or 4 Children | 244 (20.2%) | 261 (58.4%) |
| 5 or more Children | 3 (20.0%) | 29 (100.0%) |
| Total | 678 (6.0%) | 1,575 (28.4%) |
Race in Lee County
The most populous races in Lee County are White / Caucasian (43,650 | 68.7%), Hispanic or Latino (12,691 | 20.0%), and Black / African American (12,054 | 19.0%).
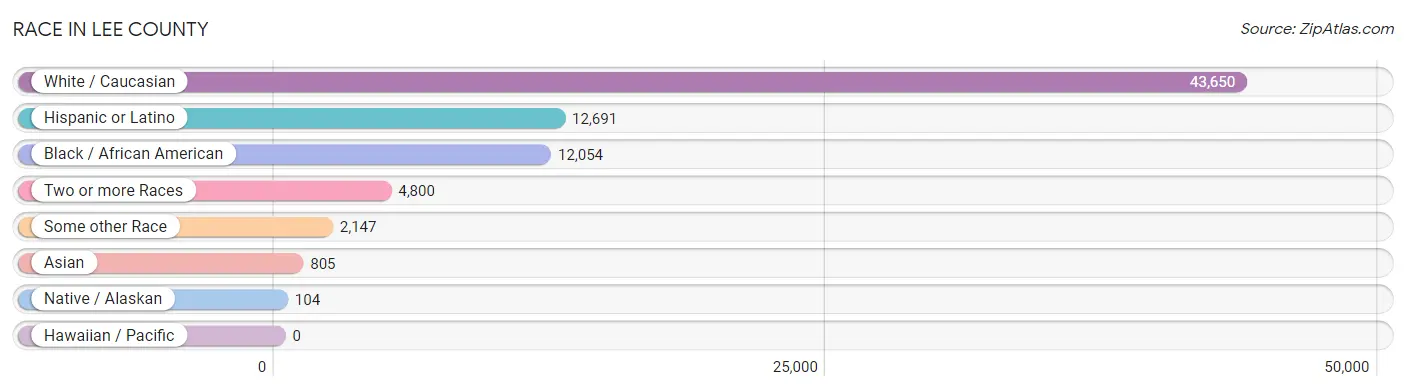
| Race | # Population | % Population |
| Asian | 805 | 1.3% |
| Black / African American | 12,054 | 19.0% |
| Hawaiian / Pacific | 0 | 0.0% |
| Hispanic or Latino | 12,691 | 20.0% |
| Native / Alaskan | 104 | 0.2% |
| White / Caucasian | 43,650 | 68.7% |
| Two or more Races | 4,800 | 7.5% |
| Some other Race | 2,147 | 3.4% |
| Total | 63,560 | 100.0% |
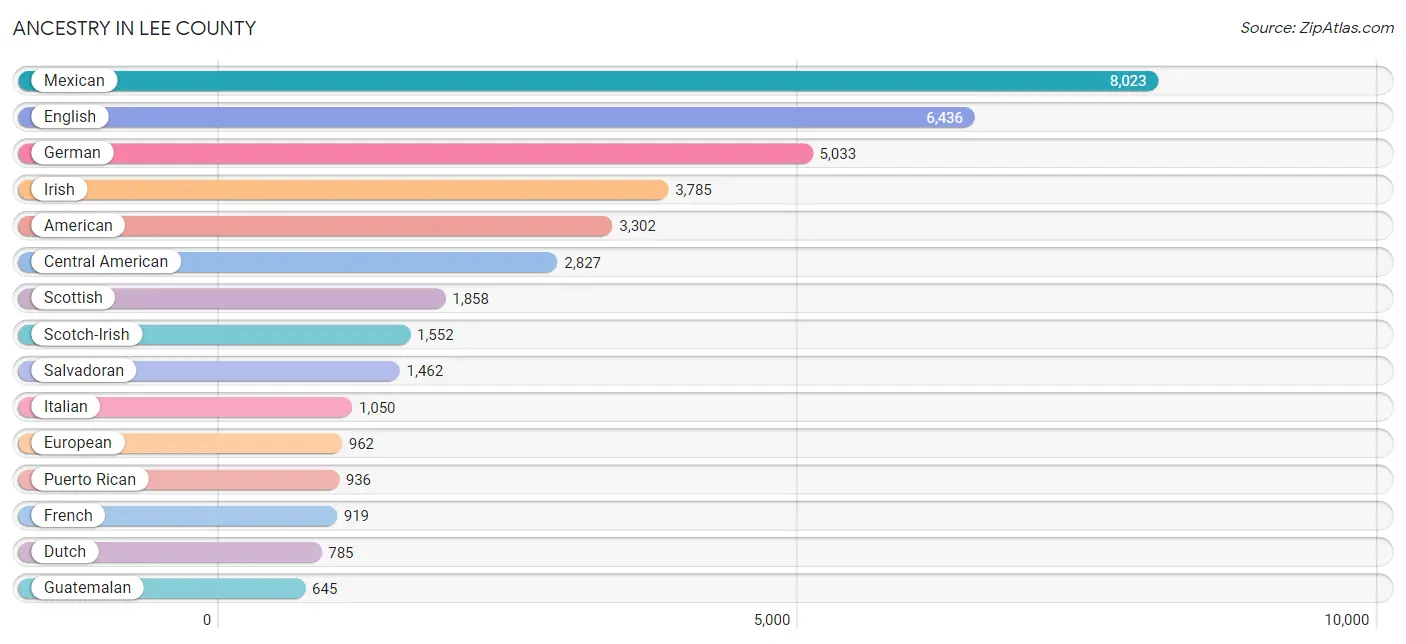
Ancestry in Lee County
The most populous ancestries reported in Lee County are Mexican (8,023 | 12.6%), English (6,436 | 10.1%), German (5,033 | 7.9%), Irish (3,785 | 6.0%), and American (3,302 | 5.2%), together accounting for 41.8% of all Lee County residents.
| Ancestry | # Population | % Population |
| African | 203 | 0.3% |
| American | 3,302 | 5.2% |
| Arab | 91 | 0.1% |
| Argentinean | 4 | 0.0% |
| Australian | 7 | 0.0% |
| Austrian | 56 | 0.1% |
| Bhutanese | 105 | 0.2% |
| Blackfeet | 77 | 0.1% |
| Bolivian | 39 | 0.1% |
| Brazilian | 22 | 0.0% |
| British | 304 | 0.5% |
| Burmese | 320 | 0.5% |
| Canadian | 20 | 0.0% |
| Cape Verdean | 52 | 0.1% |
| Celtic | 15 | 0.0% |
| Central American | 2,827 | 4.4% |
| Central American Indian | 11 | 0.0% |
| Cherokee | 380 | 0.6% |
| Choctaw | 23 | 0.0% |
| Colombian | 24 | 0.0% |
| Creek | 12 | 0.0% |
| Cuban | 183 | 0.3% |
| Czech | 158 | 0.3% |
| Danish | 135 | 0.2% |
| Dominican | 162 | 0.3% |
| Dutch | 785 | 1.2% |
| Eastern European | 118 | 0.2% |
| Ecuadorian | 69 | 0.1% |
| English | 6,436 | 10.1% |
| European | 962 | 1.5% |
| Filipino | 16 | 0.0% |
| Finnish | 200 | 0.3% |
| French | 919 | 1.5% |
| French Canadian | 196 | 0.3% |
| German | 5,033 | 7.9% |
| Greek | 61 | 0.1% |
| Guatemalan | 645 | 1.0% |
| Guyanese | 15 | 0.0% |
| Haitian | 75 | 0.1% |
| Honduran | 464 | 0.7% |
| Hungarian | 51 | 0.1% |
| Indian (Asian) | 86 | 0.1% |
| Irish | 3,785 | 6.0% |
| Iroquois | 6 | 0.0% |
| Israeli | 4 | 0.0% |
| Italian | 1,050 | 1.7% |
| Jamaican | 37 | 0.1% |
| Korean | 235 | 0.4% |
| Latvian | 14 | 0.0% |
| Lebanese | 10 | 0.0% |
| Lithuanian | 55 | 0.1% |
| Lumbee | 219 | 0.3% |
| Mexican | 8,023 | 12.6% |
| Moroccan | 76 | 0.1% |
| Native Hawaiian | 6 | 0.0% |
| Navajo | 18 | 0.0% |
| New Zealander | 12 | 0.0% |
| Nicaraguan | 68 | 0.1% |
| Nigerian | 164 | 0.3% |
| Norwegian | 292 | 0.5% |
| Pakistani | 14 | 0.0% |
| Panamanian | 188 | 0.3% |
| Pennsylvania German | 22 | 0.0% |
| Peruvian | 38 | 0.1% |
| Polish | 405 | 0.6% |
| Portuguese | 113 | 0.2% |
| Puerto Rican | 936 | 1.5% |
| Russian | 169 | 0.3% |
| Salvadoran | 1,462 | 2.3% |
| Samoan | 16 | 0.0% |
| Scandinavian | 105 | 0.2% |
| Scotch-Irish | 1,552 | 2.4% |
| Scottish | 1,858 | 2.9% |
| Slavic | 11 | 0.0% |
| Slovene | 19 | 0.0% |
| South American | 261 | 0.4% |
| Spaniard | 132 | 0.2% |
| Sri Lankan | 336 | 0.5% |
| Subsaharan African | 419 | 0.7% |
| Swedish | 282 | 0.4% |
| Swiss | 72 | 0.1% |
| Syrian | 5 | 0.0% |
| Thai | 33 | 0.1% |
| Ukrainian | 35 | 0.1% |
| Venezuelan | 87 | 0.1% |
| Welsh | 472 | 0.7% | View All 86 Rows |
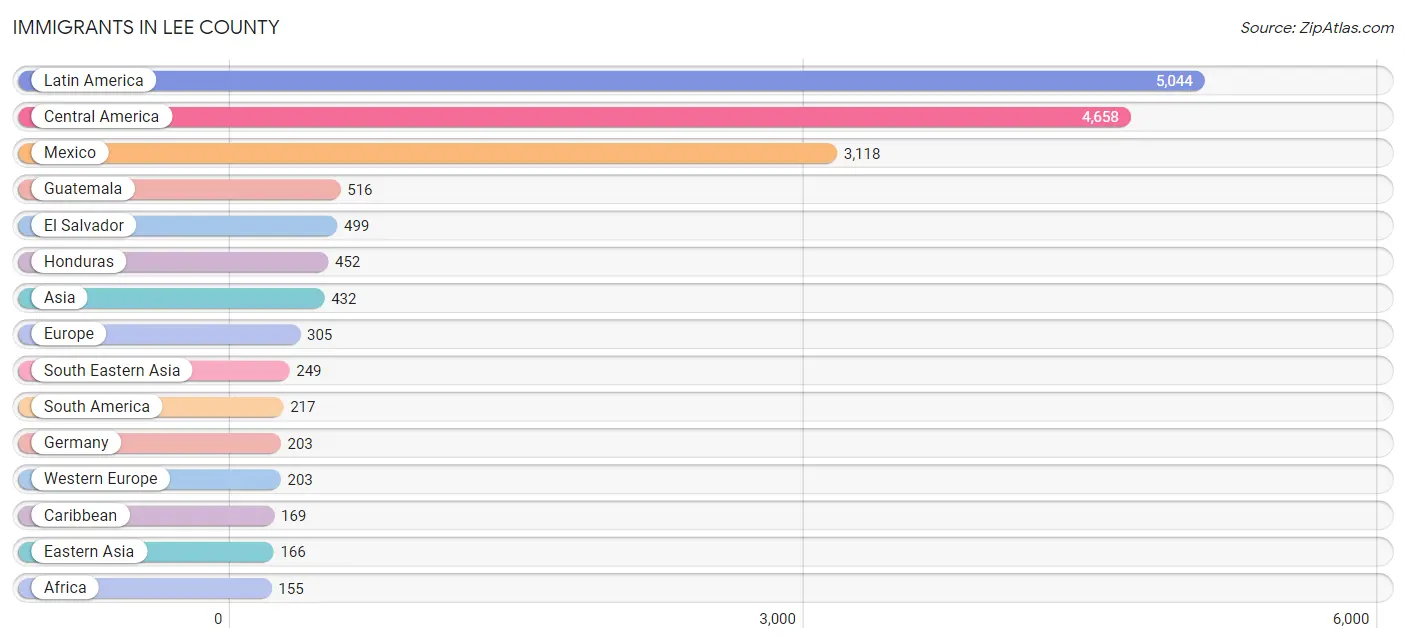
Immigrants in Lee County
The most numerous immigrant groups reported in Lee County came from Latin America (5,044 | 7.9%), Central America (4,658 | 7.3%), Mexico (3,118 | 4.9%), Guatemala (516 | 0.8%), and El Salvador (499 | 0.8%), together accounting for 21.8% of all Lee County residents.
| Immigration Origin | # Population | % Population |
| Africa | 155 | 0.2% |
| Argentina | 4 | 0.0% |
| Asia | 432 | 0.7% |
| Australia | 18 | 0.0% |
| Bolivia | 39 | 0.1% |
| Brazil | 10 | 0.0% |
| Canada | 22 | 0.0% |
| Caribbean | 169 | 0.3% |
| Central America | 4,658 | 7.3% |
| Chile | 7 | 0.0% |
| China | 32 | 0.1% |
| Colombia | 69 | 0.1% |
| Cuba | 45 | 0.1% |
| Czechoslovakia | 23 | 0.0% |
| Dominican Republic | 98 | 0.2% |
| Eastern Asia | 166 | 0.3% |
| Eastern Europe | 23 | 0.0% |
| Ecuador | 32 | 0.1% |
| El Salvador | 499 | 0.8% |
| Europe | 305 | 0.5% |
| Germany | 203 | 0.3% |
| Guatemala | 516 | 0.8% |
| Guyana | 16 | 0.0% |
| Honduras | 452 | 0.7% |
| India | 17 | 0.0% |
| Italy | 15 | 0.0% |
| Jamaica | 15 | 0.0% |
| Japan | 13 | 0.0% |
| Korea | 121 | 0.2% |
| Latin America | 5,044 | 7.9% |
| Mexico | 3,118 | 4.9% |
| Nicaragua | 23 | 0.0% |
| Nigeria | 152 | 0.2% |
| Northern Europe | 23 | 0.0% |
| Oceania | 18 | 0.0% |
| Panama | 50 | 0.1% |
| Peru | 28 | 0.0% |
| Philippines | 116 | 0.2% |
| South Africa | 3 | 0.0% |
| South America | 217 | 0.3% |
| South Central Asia | 17 | 0.0% |
| South Eastern Asia | 249 | 0.4% |
| Southern Europe | 56 | 0.1% |
| Spain | 41 | 0.1% |
| Taiwan | 16 | 0.0% |
| Thailand | 14 | 0.0% |
| Trinidad and Tobago | 11 | 0.0% |
| Venezuela | 12 | 0.0% |
| Vietnam | 119 | 0.2% |
| Western Africa | 152 | 0.2% |
| Western Europe | 203 | 0.3% | View All 51 Rows |
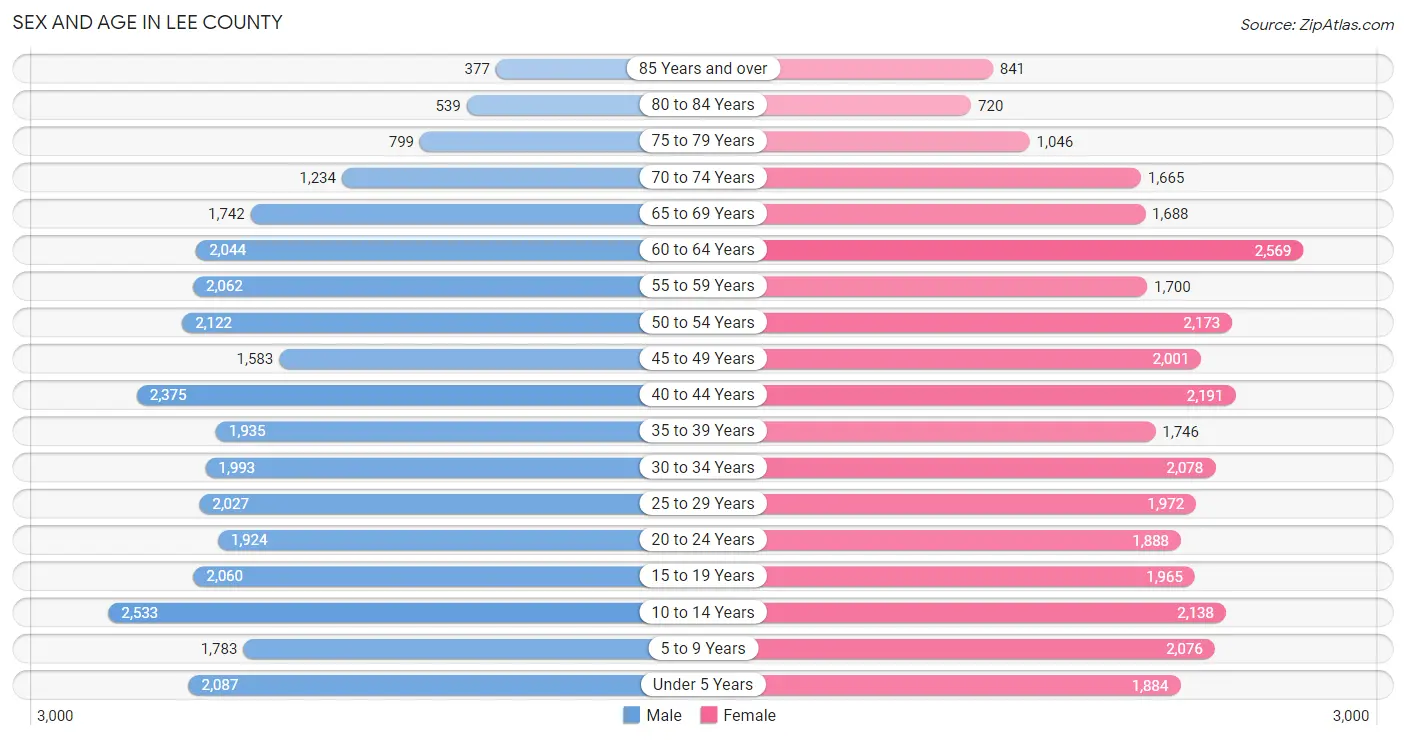
Sex and Age in Lee County
Sex and Age in Lee County
The most populous age groups in Lee County are 10 to 14 Years (2,533 | 8.1%) for men and 60 to 64 Years (2,569 | 7.9%) for women.
| Age Bracket | Male | Female |
| Under 5 Years | 2,087 (6.7%) | 1,884 (5.8%) |
| 5 to 9 Years | 1,783 (5.7%) | 2,076 (6.4%) |
| 10 to 14 Years | 2,533 (8.1%) | 2,138 (6.6%) |
| 15 to 19 Years | 2,060 (6.6%) | 1,965 (6.1%) |
| 20 to 24 Years | 1,924 (6.2%) | 1,888 (5.8%) |
| 25 to 29 Years | 2,027 (6.5%) | 1,972 (6.1%) |
| 30 to 34 Years | 1,993 (6.4%) | 2,078 (6.4%) |
| 35 to 39 Years | 1,935 (6.2%) | 1,746 (5.4%) |
| 40 to 44 Years | 2,375 (7.6%) | 2,191 (6.8%) |
| 45 to 49 Years | 1,583 (5.1%) | 2,001 (6.2%) |
| 50 to 54 Years | 2,122 (6.8%) | 2,173 (6.7%) |
| 55 to 59 Years | 2,062 (6.6%) | 1,700 (5.3%) |
| 60 to 64 Years | 2,044 (6.6%) | 2,569 (7.9%) |
| 65 to 69 Years | 1,742 (5.6%) | 1,688 (5.2%) |
| 70 to 74 Years | 1,234 (4.0%) | 1,665 (5.1%) |
| 75 to 79 Years | 799 (2.6%) | 1,046 (3.2%) |
| 80 to 84 Years | 539 (1.7%) | 720 (2.2%) |
| 85 Years and over | 377 (1.2%) | 841 (2.6%) |
| Total | 31,219 (100.0%) | 32,341 (100.0%) |
Families and Households in Lee County
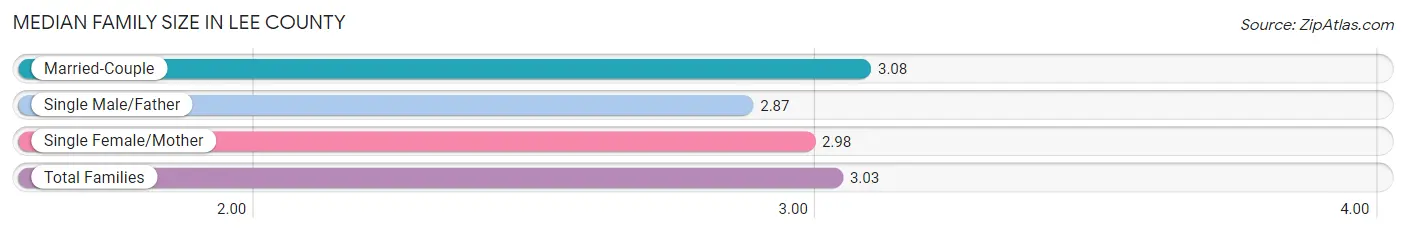
Median Family Size in Lee County
The median family size in Lee County is 3.03 persons per family, with married-couple families (11,380 | 67.2%) accounting for the largest median family size of 3.08 persons per family. On the other hand, single male/father families (1,627 | 9.6%) represent the smallest median family size with 2.87 persons per family.
| Family Type | # Families | Family Size |
| Married-Couple | 11,380 (67.2%) | 3.08 |
| Single Male/Father | 1,627 (9.6%) | 2.87 |
| Single Female/Mother | 3,924 (23.2%) | 2.98 |
| Total Families | 16,931 (100.0%) | 3.03 |
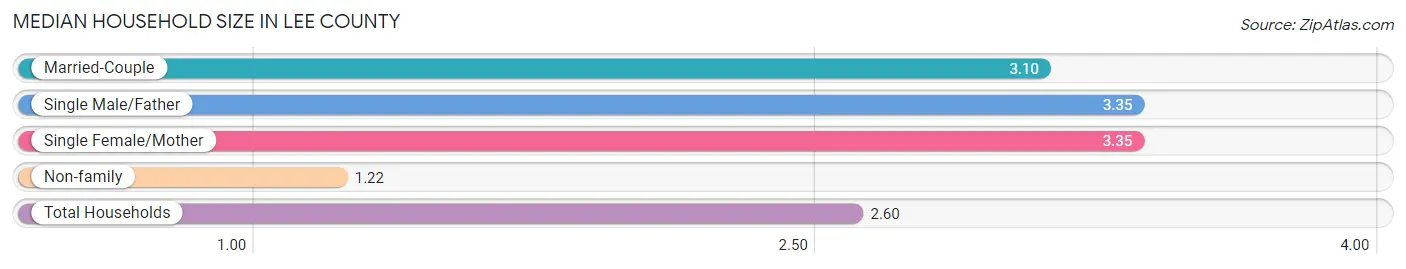
Median Household Size in Lee County
The median household size in Lee County is 2.60 persons per household, with single male/father households (1,627 | 6.8%) accounting for the largest median household size of 3.35 persons per household. non-family households (7,119 | 29.6%) represent the smallest median household size with 1.22 persons per household.
| Household Type | # Households | Household Size |
| Married-Couple | 11,380 (47.3%) | 3.10 |
| Single Male/Father | 1,627 (6.8%) | 3.35 |
| Single Female/Mother | 3,924 (16.3%) | 3.35 |
| Non-family | 7,119 (29.6%) | 1.22 |
| Total Households | 24,050 (100.0%) | 2.60 |
Household Size by Marriage Status in Lee County
Out of a total of 24,050 households in Lee County, 16,931 (70.4%) are family households, while 7,119 (29.6%) are nonfamily households. The most numerous type of family households are 2-person households, comprising 7,485, and the most common type of nonfamily households are 1-person households, comprising 5,900.
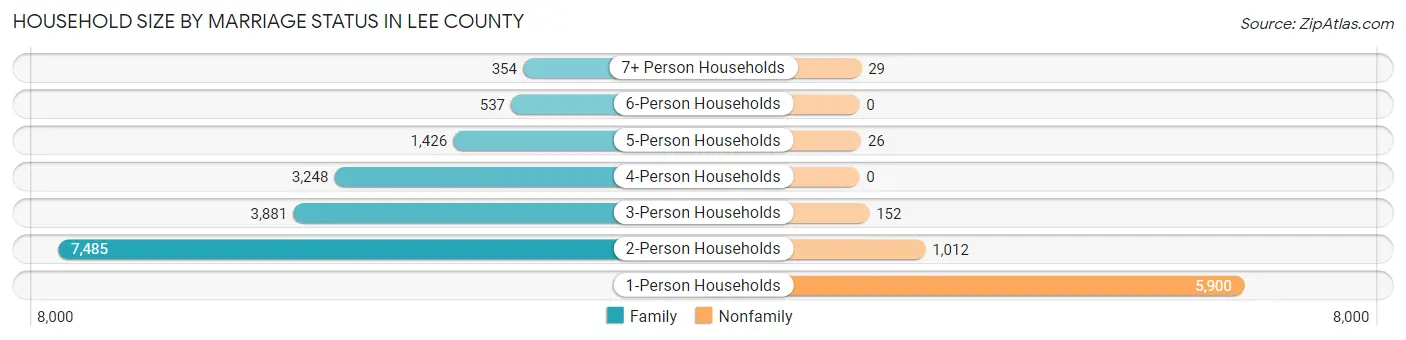
| Household Size | Family Households | Nonfamily Households |
| 1-Person Households | - | 5,900 (24.5%) |
| 2-Person Households | 7,485 (31.1%) | 1,012 (4.2%) |
| 3-Person Households | 3,881 (16.1%) | 152 (0.6%) |
| 4-Person Households | 3,248 (13.5%) | 0 (0.0%) |
| 5-Person Households | 1,426 (5.9%) | 26 (0.1%) |
| 6-Person Households | 537 (2.2%) | 0 (0.0%) |
| 7+ Person Households | 354 (1.5%) | 29 (0.1%) |
| Total | 16,931 (70.4%) | 7,119 (29.6%) |
Female Fertility in Lee County
Fertility by Age in Lee County
Average fertility rate in Lee County is 53.0 births per 1,000 women. Women in the age bracket of 20 to 34 years have the highest fertility rate with 101.0 births per 1,000 women. Women in the age bracket of 20 to 34 years acount for 80.1% of all women with births.
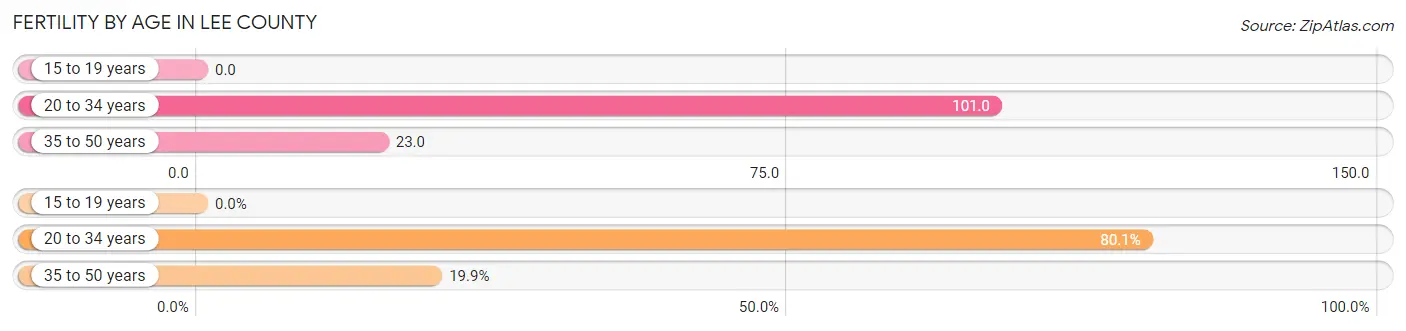
| Age Bracket | Women with Births | Births / 1,000 Women |
| 15 to 19 years | 0 (0.0%) | 0.0 |
| 20 to 34 years | 601 (80.1%) | 101.0 |
| 35 to 50 years | 149 (19.9%) | 23.0 |
| Total | 750 (100.0%) | 53.0 |
Fertility by Age by Marriage Status in Lee County
43.9% of women with births (750) in Lee County are married. The highest percentage of unmarried women with births falls into 20 to 34 years age bracket with 57.9% of them unmarried at the time of birth, while the lowest percentage of unmarried women with births belong to 35 to 50 years age bracket with 49.0% of them unmarried.
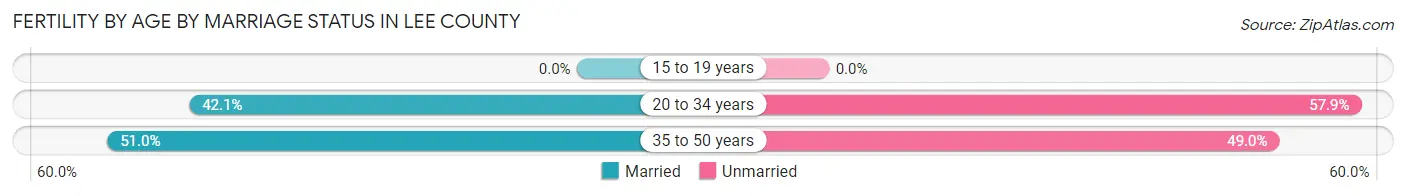
| Age Bracket | Married | Unmarried |
| 15 to 19 years | 0 (0.0%) | 0 (0.0%) |
| 20 to 34 years | 253 (42.1%) | 348 (57.9%) |
| 35 to 50 years | 76 (51.0%) | 73 (49.0%) |
| Total | 329 (43.9%) | 421 (56.1%) |
Fertility by Education in Lee County
Average fertility rate in Lee County is 53.0 births per 1,000 women. Women with the education attainment of bachelor's degree have the highest fertility rate of 77.0 births per 1,000 women, while women with the education attainment of less than high school have the lowest fertility at 31.0 births per 1,000 women. Women with the education attainment of college or associate's degree represent 40.3% of all women with births.
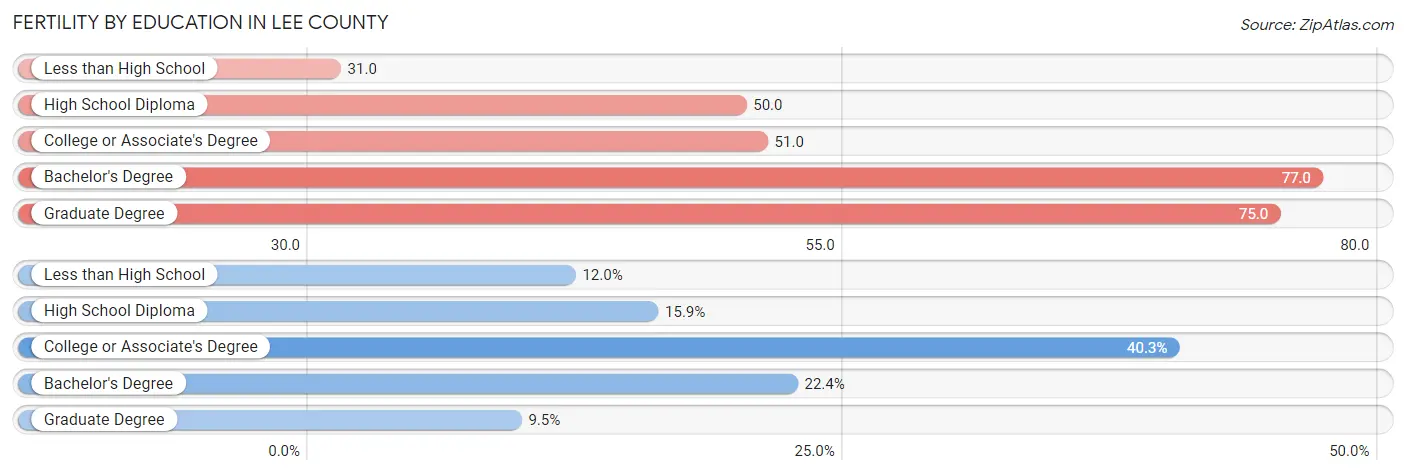
| Educational Attainment | Women with Births | Births / 1,000 Women |
| Less than High School | 90 (12.0%) | 31.0 |
| High School Diploma | 119 (15.9%) | 50.0 |
| College or Associate's Degree | 302 (40.3%) | 51.0 |
| Bachelor's Degree | 168 (22.4%) | 77.0 |
| Graduate Degree | 71 (9.5%) | 75.0 |
| Total | 750 (100.0%) | 53.0 |
Fertility by Education by Marriage Status in Lee County
56.1% of women with births in Lee County are unmarried. Women with the educational attainment of graduate degree are most likely to be married with 100.0% of them married at childbirth, while women with the educational attainment of less than high school are least likely to be married with 91.1% of them unmarried at childbirth.
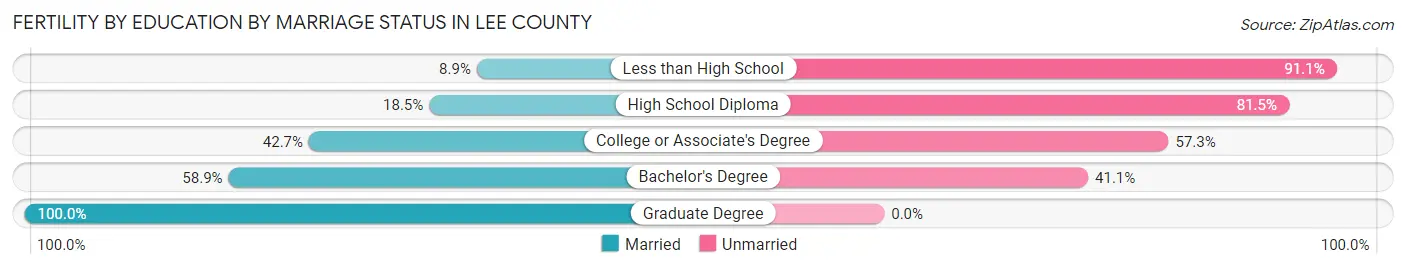
| Educational Attainment | Married | Unmarried |
| Less than High School | 8 (8.9%) | 82 (91.1%) |
| High School Diploma | 22 (18.5%) | 97 (81.5%) |
| College or Associate's Degree | 129 (42.7%) | 173 (57.3%) |
| Bachelor's Degree | 99 (58.9%) | 69 (41.1%) |
| Graduate Degree | 71 (100.0%) | 0 (0.0%) |
| Total | 329 (43.9%) | 421 (56.1%) |
Employment Characteristics in Lee County
Employment by Class of Employer in Lee County
Among the 28,339 employed individuals in Lee County, private company employees (20,199 | 71.3%), local government employees (1,857 | 6.6%), and state government employees (1,681 | 5.9%) make up the most common classes of employment.
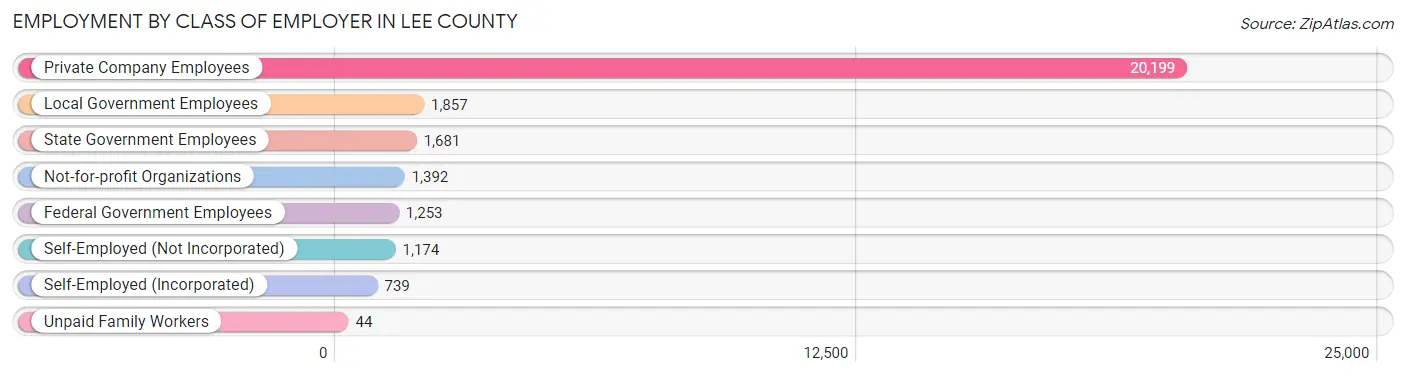
| Employer Class | # Employees | % Employees |
| Private Company Employees | 20,199 | 71.3% |
| Self-Employed (Incorporated) | 739 | 2.6% |
| Self-Employed (Not Incorporated) | 1,174 | 4.1% |
| Not-for-profit Organizations | 1,392 | 4.9% |
| Local Government Employees | 1,857 | 6.6% |
| State Government Employees | 1,681 | 5.9% |
| Federal Government Employees | 1,253 | 4.4% |
| Unpaid Family Workers | 44 | 0.2% |
| Total | 28,339 | 100.0% |
Employment Status by Age in Lee County
According to the labor force statistics for Lee County, out of the total population over 16 years of age (50,259), 60.5% or 30,407 individuals are in the labor force, with 5.2% or 1,581 of them unemployed. The age group with the highest labor force participation rate is 30 to 34 years, with 84.9% or 3,456 individuals in the labor force. Within the labor force, the 30 to 34 years age range has the highest percentage of unemployed individuals, with 8.4% or 290 of them being unemployed.
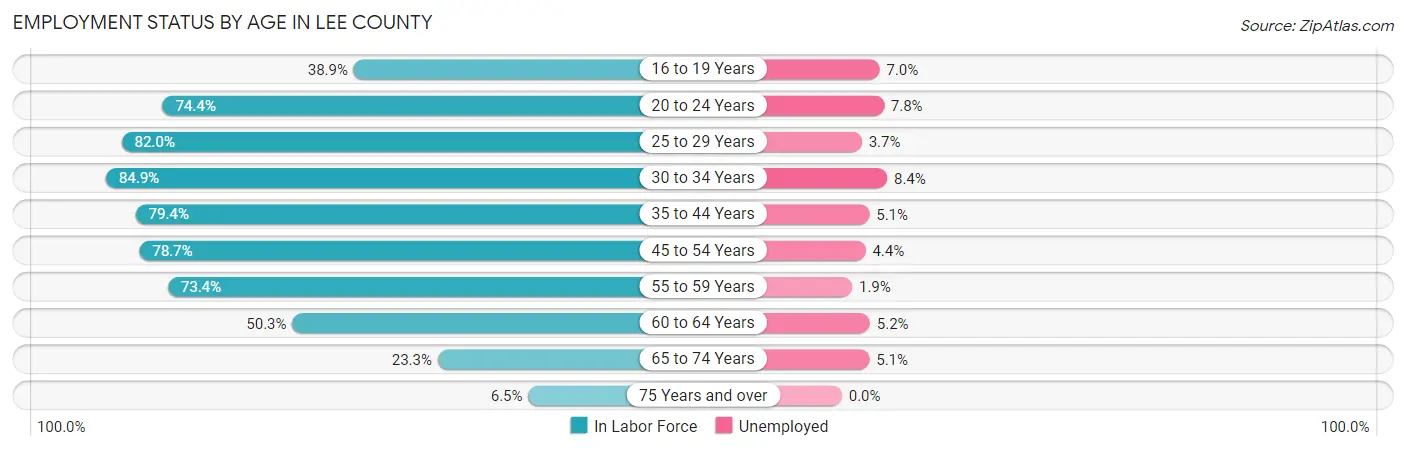
| Age Bracket | In Labor Force | Unemployed |
| 16 to 19 Years | 1,255 (38.9%) | 88 (7.0%) |
| 20 to 24 Years | 2,836 (74.4%) | 221 (7.8%) |
| 25 to 29 Years | 3,279 (82.0%) | 121 (3.7%) |
| 30 to 34 Years | 3,456 (84.9%) | 290 (8.4%) |
| 35 to 44 Years | 6,548 (79.4%) | 334 (5.1%) |
| 45 to 54 Years | 6,201 (78.7%) | 273 (4.4%) |
| 55 to 59 Years | 2,761 (73.4%) | 52 (1.9%) |
| 60 to 64 Years | 2,320 (50.3%) | 121 (5.2%) |
| 65 to 74 Years | 1,475 (23.3%) | 75 (5.1%) |
| 75 Years and over | 281 (6.5%) | 0 (0.0%) |
| Total | 30,407 (60.5%) | 1,581 (5.2%) |
Employment Status by Educational Attainment in Lee County
According to labor force statistics for Lee County, 75.4% of individuals (24,559) out of the total population between 25 and 64 years of age (32,571) are in the labor force, with 4.8% or 1,179 of them being unemployed. The group with the highest labor force participation rate are those with the educational attainment of bachelor's degree or higher, with 84.6% or 5,896 individuals in the labor force. Within the labor force, individuals with less than high school education have the highest percentage of unemployment, with 7.3% or 235 of them being unemployed.
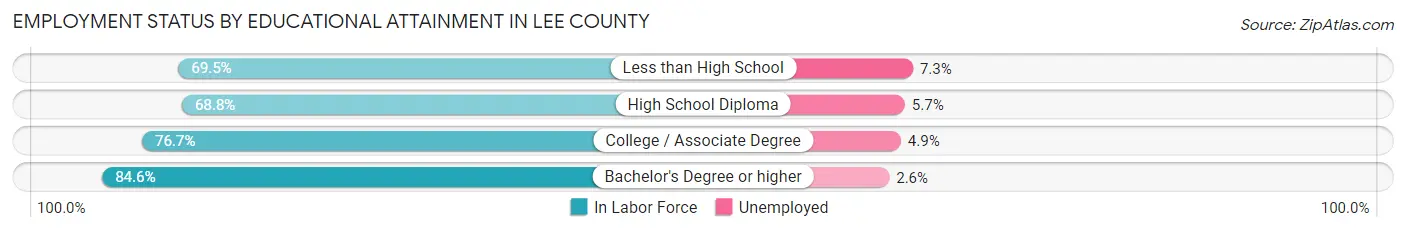
| Educational Attainment | In Labor Force | Unemployed |
| Less than High School | 3,221 (69.5%) | 338 (7.3%) |
| High School Diploma | 5,448 (68.8%) | 451 (5.7%) |
| College / Associate Degree | 10,009 (76.7%) | 639 (4.9%) |
| Bachelor's Degree or higher | 5,896 (84.6%) | 181 (2.6%) |
| Total | 24,559 (75.4%) | 1,563 (4.8%) |
Employment Occupations by Sex in Lee County
Management, Business, Science and Arts Occupations
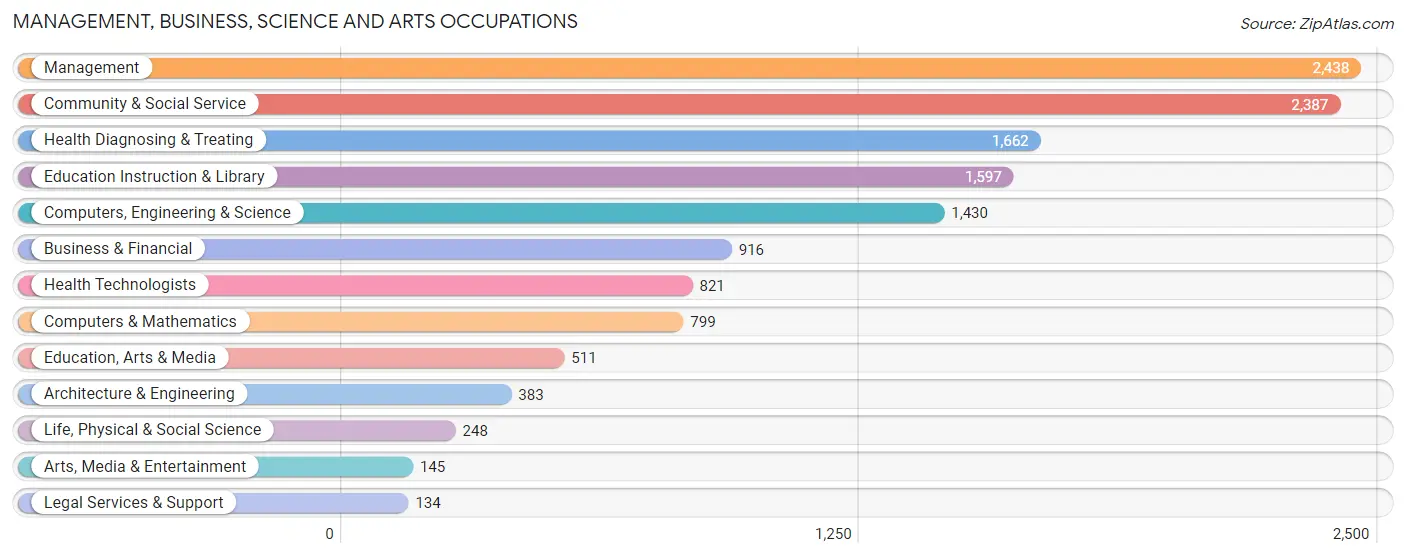
The most common Management, Business, Science and Arts occupations in Lee County are Management (2,438 | 8.5%), Community & Social Service (2,387 | 8.4%), Health Diagnosing & Treating (1,662 | 5.8%), Education Instruction & Library (1,597 | 5.6%), and Computers, Engineering & Science (1,430 | 5.0%).
Management, Business, Science and Arts Occupations by Sex
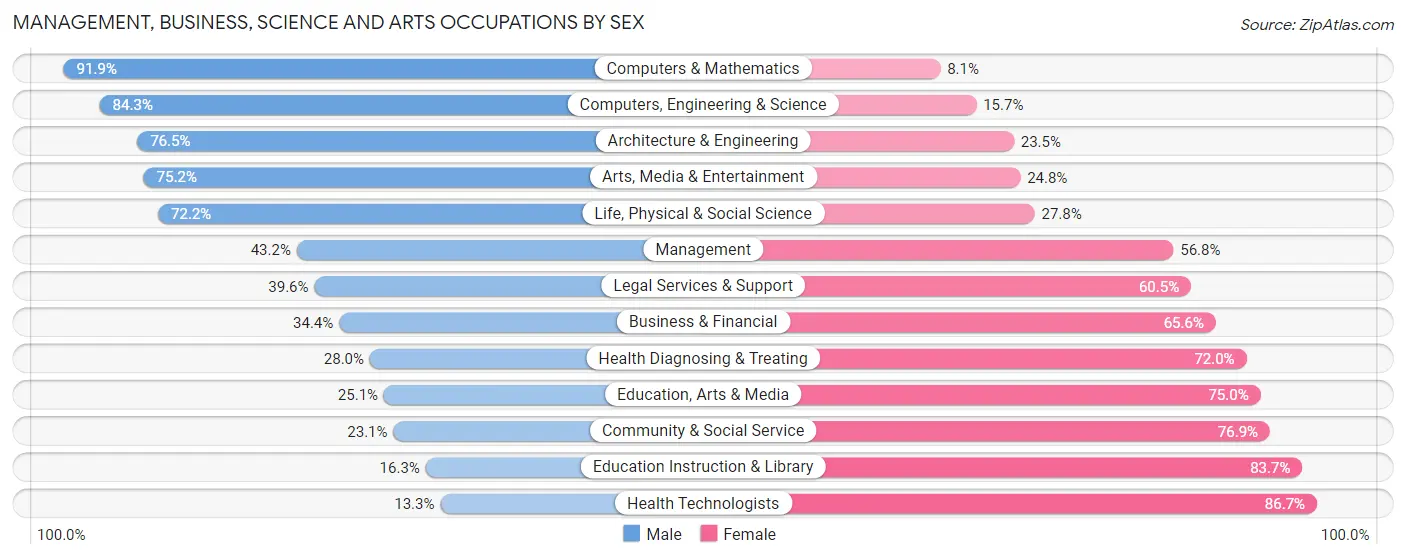
Within the Management, Business, Science and Arts occupations in Lee County, the most male-oriented occupations are Computers & Mathematics (91.9%), Computers, Engineering & Science (84.3%), and Architecture & Engineering (76.5%), while the most female-oriented occupations are Health Technologists (86.7%), Education Instruction & Library (83.7%), and Community & Social Service (76.9%).
| Occupation | Male | Female |
| Management | 1,054 (43.2%) | 1,384 (56.8%) |
| Business & Financial | 315 (34.4%) | 601 (65.6%) |
| Computers, Engineering & Science | 1,206 (84.3%) | 224 (15.7%) |
| Computers & Mathematics | 734 (91.9%) | 65 (8.1%) |
| Architecture & Engineering | 293 (76.5%) | 90 (23.5%) |
| Life, Physical & Social Science | 179 (72.2%) | 69 (27.8%) |
| Community & Social Service | 551 (23.1%) | 1,836 (76.9%) |
| Education, Arts & Media | 128 (25.1%) | 383 (75.0%) |
| Legal Services & Support | 53 (39.6%) | 81 (60.5%) |
| Education Instruction & Library | 261 (16.3%) | 1,336 (83.7%) |
| Arts, Media & Entertainment | 109 (75.2%) | 36 (24.8%) |
| Health Diagnosing & Treating | 465 (28.0%) | 1,197 (72.0%) |
| Health Technologists | 109 (13.3%) | 712 (86.7%) |
| Total (Category) | 3,591 (40.6%) | 5,242 (59.4%) |
| Total (Overall) | 15,348 (53.7%) | 13,222 (46.3%) |
Services Occupations
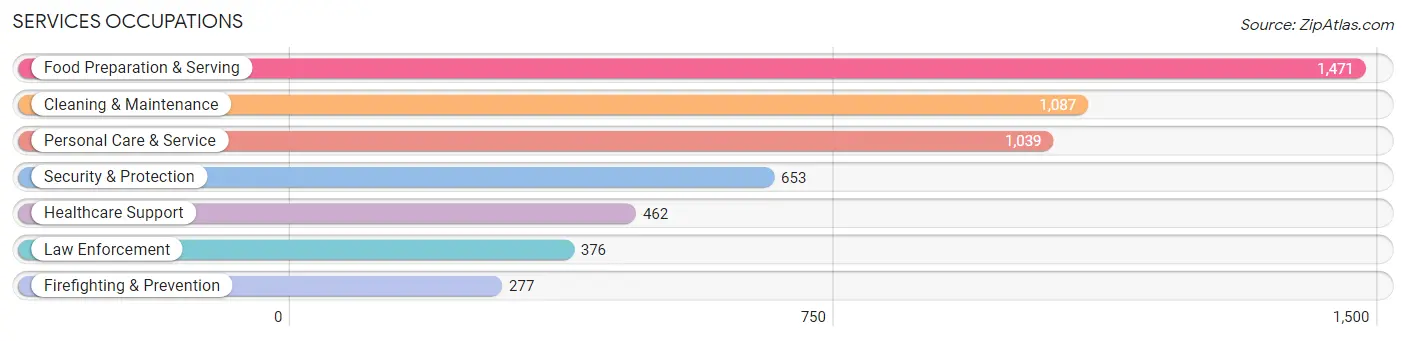
The most common Services occupations in Lee County are Food Preparation & Serving (1,471 | 5.1%), Cleaning & Maintenance (1,087 | 3.8%), Personal Care & Service (1,039 | 3.6%), Security & Protection (653 | 2.3%), and Healthcare Support (462 | 1.6%).
Services Occupations by Sex
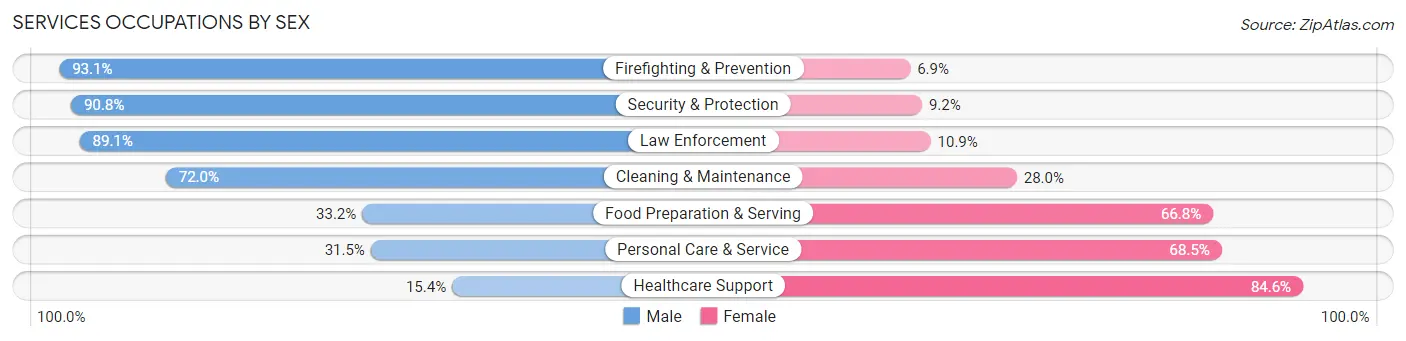
Within the Services occupations in Lee County, the most male-oriented occupations are Firefighting & Prevention (93.1%), Security & Protection (90.8%), and Law Enforcement (89.1%), while the most female-oriented occupations are Healthcare Support (84.6%), Personal Care & Service (68.5%), and Food Preparation & Serving (66.8%).
| Occupation | Male | Female |
| Healthcare Support | 71 (15.4%) | 391 (84.6%) |
| Security & Protection | 593 (90.8%) | 60 (9.2%) |
| Firefighting & Prevention | 258 (93.1%) | 19 (6.9%) |
| Law Enforcement | 335 (89.1%) | 41 (10.9%) |
| Food Preparation & Serving | 488 (33.2%) | 983 (66.8%) |
| Cleaning & Maintenance | 783 (72.0%) | 304 (28.0%) |
| Personal Care & Service | 327 (31.5%) | 712 (68.5%) |
| Total (Category) | 2,262 (48.0%) | 2,450 (52.0%) |
| Total (Overall) | 15,348 (53.7%) | 13,222 (46.3%) |
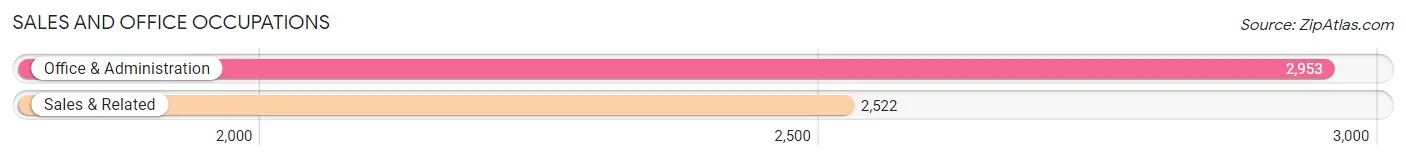
Sales and Office Occupations
The most common Sales and Office occupations in Lee County are Office & Administration (2,953 | 10.3%), and Sales & Related (2,522 | 8.8%).
Sales and Office Occupations by Sex
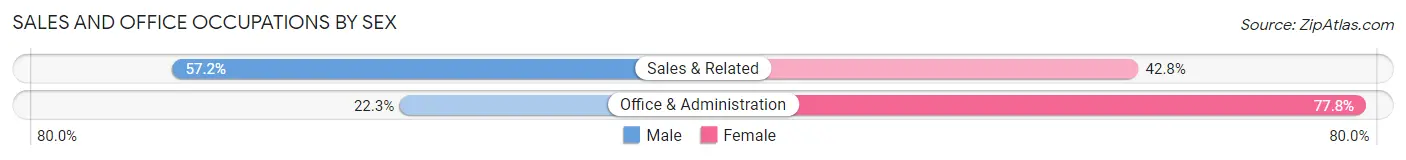
| Occupation | Male | Female |
| Sales & Related | 1,443 (57.2%) | 1,079 (42.8%) |
| Office & Administration | 657 (22.3%) | 2,296 (77.7%) |
| Total (Category) | 2,100 (38.4%) | 3,375 (61.6%) |
| Total (Overall) | 15,348 (53.7%) | 13,222 (46.3%) |
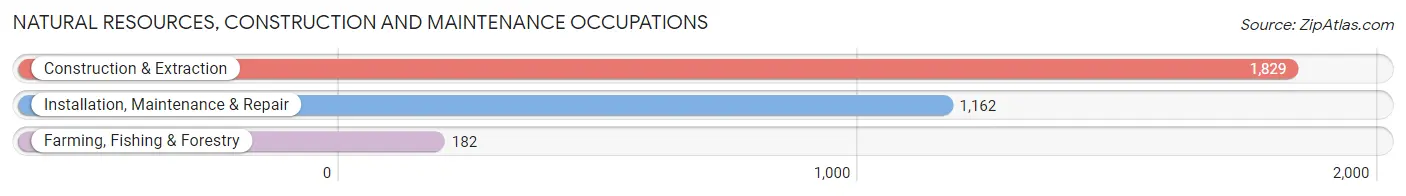
Natural Resources, Construction and Maintenance Occupations
The most common Natural Resources, Construction and Maintenance occupations in Lee County are Construction & Extraction (1,829 | 6.4%), Installation, Maintenance & Repair (1,162 | 4.1%), and Farming, Fishing & Forestry (182 | 0.6%).
Natural Resources, Construction and Maintenance Occupations by Sex
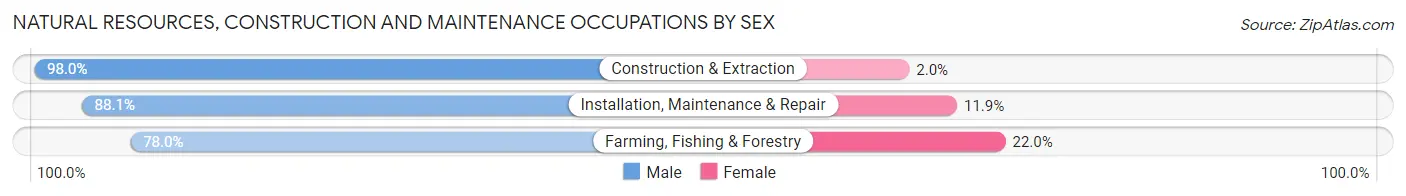
| Occupation | Male | Female |
| Farming, Fishing & Forestry | 142 (78.0%) | 40 (22.0%) |
| Construction & Extraction | 1,793 (98.0%) | 36 (2.0%) |
| Installation, Maintenance & Repair | 1,024 (88.1%) | 138 (11.9%) |
| Total (Category) | 2,959 (93.3%) | 214 (6.7%) |
| Total (Overall) | 15,348 (53.7%) | 13,222 (46.3%) |
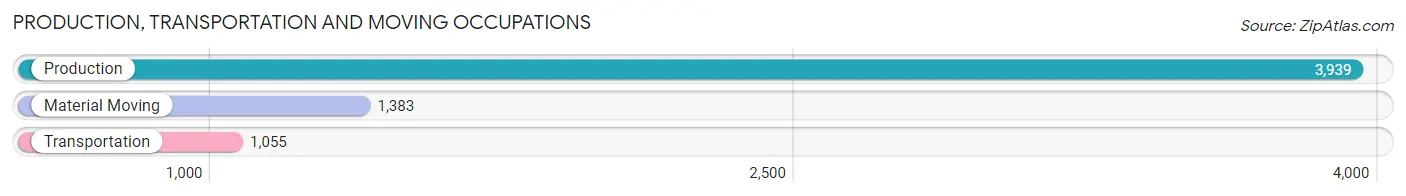
Production, Transportation and Moving Occupations
The most common Production, Transportation and Moving occupations in Lee County are Production (3,939 | 13.8%), Material Moving (1,383 | 4.8%), and Transportation (1,055 | 3.7%).
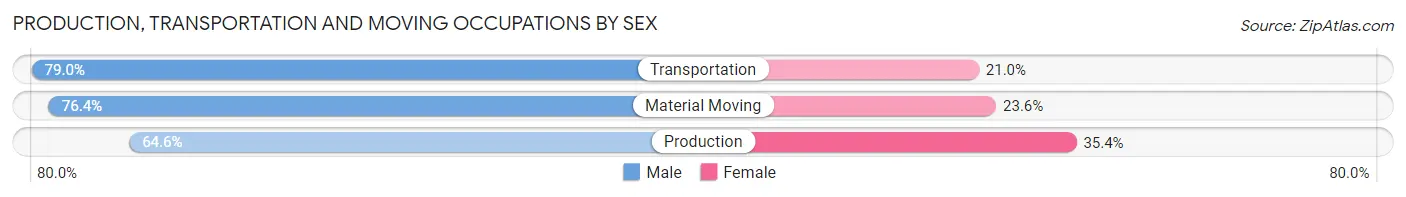
Production, Transportation and Moving Occupations by Sex
| Occupation | Male | Female |
| Production | 2,546 (64.6%) | 1,393 (35.4%) |
| Transportation | 833 (79.0%) | 222 (21.0%) |
| Material Moving | 1,057 (76.4%) | 326 (23.6%) |
| Total (Category) | 4,436 (69.6%) | 1,941 (30.4%) |
| Total (Overall) | 15,348 (53.7%) | 13,222 (46.3%) |
Employment Industries by Sex in Lee County
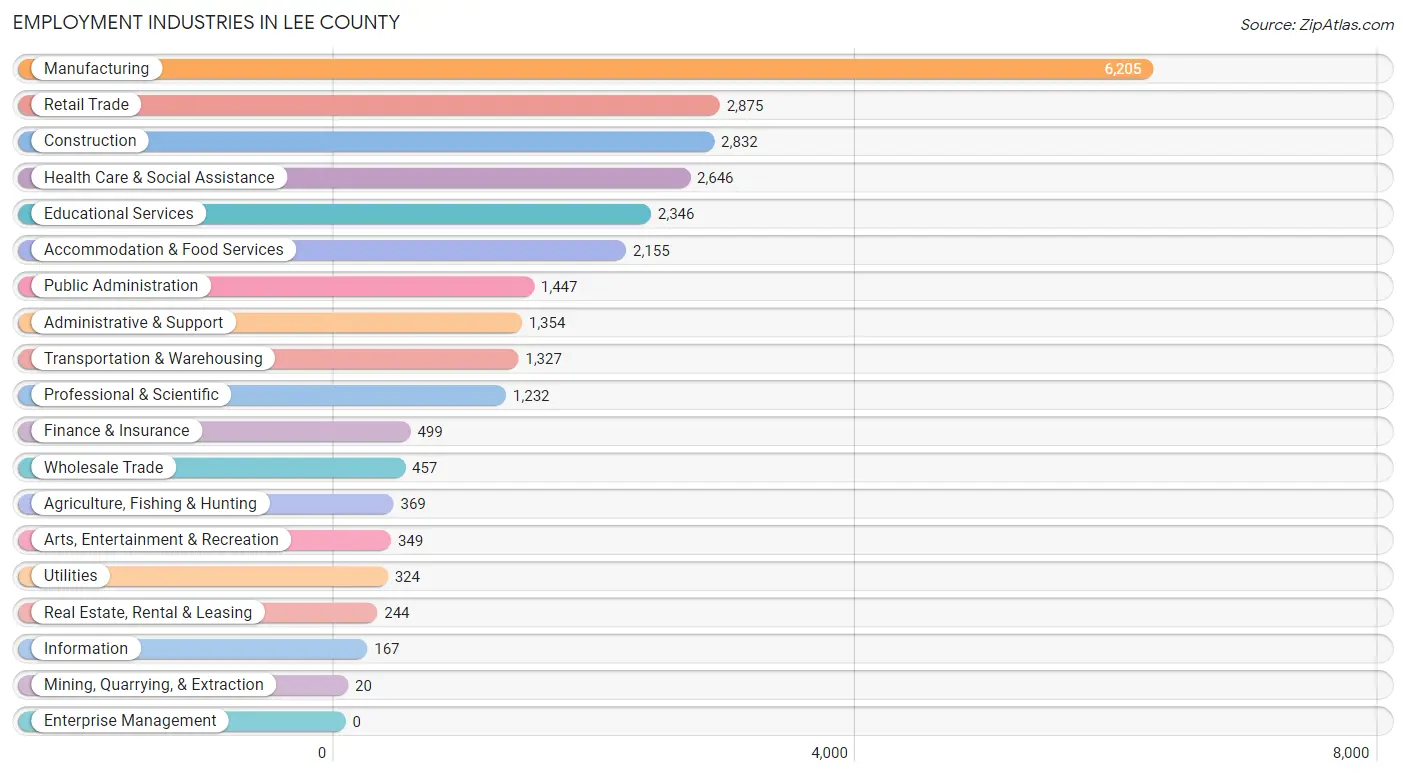
Employment Industries in Lee County
The major employment industries in Lee County include Manufacturing (6,205 | 21.7%), Retail Trade (2,875 | 10.1%), Construction (2,832 | 9.9%), Health Care & Social Assistance (2,646 | 9.3%), and Educational Services (2,346 | 8.2%).
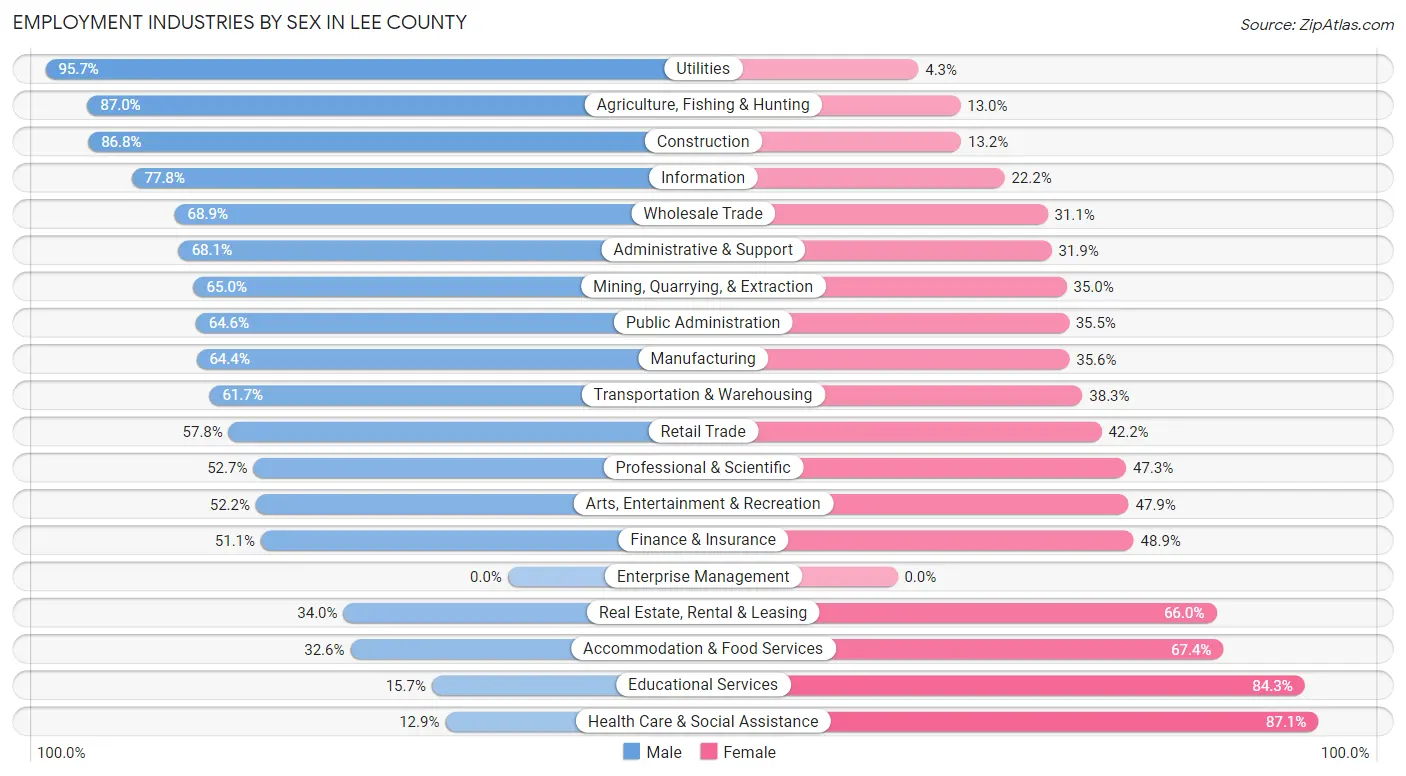
Employment Industries by Sex in Lee County
The Lee County industries that see more men than women are Utilities (95.7%), Agriculture, Fishing & Hunting (87.0%), and Construction (86.8%), whereas the industries that tend to have a higher number of women are Health Care & Social Assistance (87.1%), Educational Services (84.3%), and Accommodation & Food Services (67.4%).
| Industry | Male | Female |
| Agriculture, Fishing & Hunting | 321 (87.0%) | 48 (13.0%) |
| Mining, Quarrying, & Extraction | 13 (65.0%) | 7 (35.0%) |
| Construction | 2,459 (86.8%) | 373 (13.2%) |
| Manufacturing | 3,997 (64.4%) | 2,208 (35.6%) |
| Wholesale Trade | 315 (68.9%) | 142 (31.1%) |
| Retail Trade | 1,661 (57.8%) | 1,214 (42.2%) |
| Transportation & Warehousing | 819 (61.7%) | 508 (38.3%) |
| Utilities | 310 (95.7%) | 14 (4.3%) |
| Information | 130 (77.8%) | 37 (22.2%) |
| Finance & Insurance | 255 (51.1%) | 244 (48.9%) |
| Real Estate, Rental & Leasing | 83 (34.0%) | 161 (66.0%) |
| Professional & Scientific | 649 (52.7%) | 583 (47.3%) |
| Enterprise Management | 0 (0.0%) | 0 (0.0%) |
| Administrative & Support | 922 (68.1%) | 432 (31.9%) |
| Educational Services | 369 (15.7%) | 1,977 (84.3%) |
| Health Care & Social Assistance | 342 (12.9%) | 2,304 (87.1%) |
| Arts, Entertainment & Recreation | 182 (52.1%) | 167 (47.8%) |
| Accommodation & Food Services | 702 (32.6%) | 1,453 (67.4%) |
| Public Administration | 934 (64.5%) | 513 (35.4%) |
| Total | 15,348 (53.7%) | 13,222 (46.3%) |
Education in Lee County
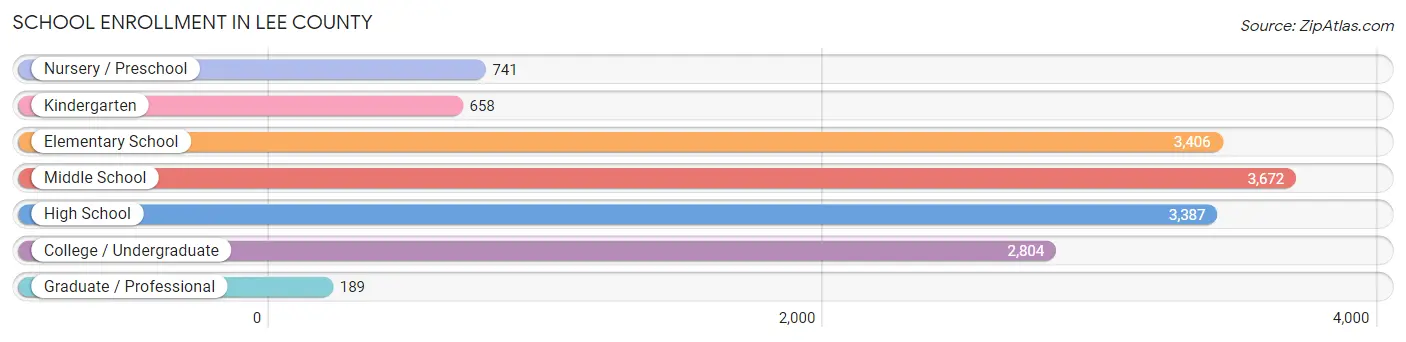
School Enrollment in Lee County
The most common levels of schooling among the 14,857 students in Lee County are middle school (3,672 | 24.7%), elementary school (3,406 | 22.9%), and high school (3,387 | 22.8%).
| School Level | # Students | % Students |
| Nursery / Preschool | 741 | 5.0% |
| Kindergarten | 658 | 4.4% |
| Elementary School | 3,406 | 22.9% |
| Middle School | 3,672 | 24.7% |
| High School | 3,387 | 22.8% |
| College / Undergraduate | 2,804 | 18.9% |
| Graduate / Professional | 189 | 1.3% |
| Total | 14,857 | 100.0% |
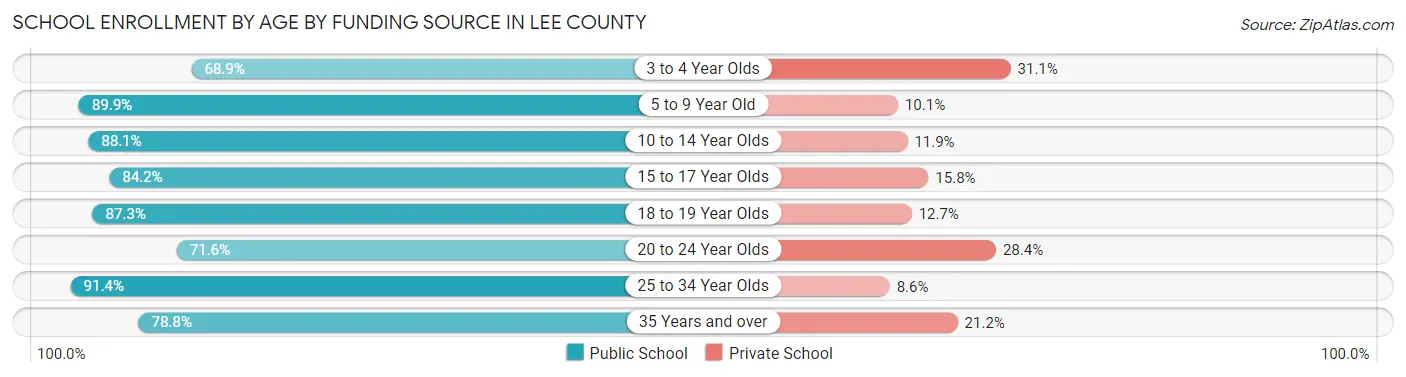
School Enrollment by Age by Funding Source in Lee County
Out of a total of 14,857 students who are enrolled in schools in Lee County, 2,169 (14.6%) attend a private institution, while the remaining 12,688 (85.4%) are enrolled in public schools. The age group of 3 to 4 year olds has the highest likelihood of being enrolled in private schools, with 194 (31.1% in the age bracket) enrolled. Conversely, the age group of 25 to 34 year olds has the lowest likelihood of being enrolled in a private school, with 565 (91.4% in the age bracket) attending a public institution.
| Age Bracket | Public School | Private School |
| 3 to 4 Year Olds | 430 (68.9%) | 194 (31.1%) |
| 5 to 9 Year Old | 3,278 (89.9%) | 369 (10.1%) |
| 10 to 14 Year Olds | 4,093 (88.1%) | 552 (11.9%) |
| 15 to 17 Year Olds | 2,060 (84.2%) | 386 (15.8%) |
| 18 to 19 Year Olds | 724 (87.3%) | 105 (12.7%) |
| 20 to 24 Year Olds | 755 (71.6%) | 299 (28.4%) |
| 25 to 34 Year Olds | 565 (91.4%) | 53 (8.6%) |
| 35 Years and over | 783 (78.8%) | 211 (21.2%) |
| Total | 12,688 (85.4%) | 2,169 (14.6%) |
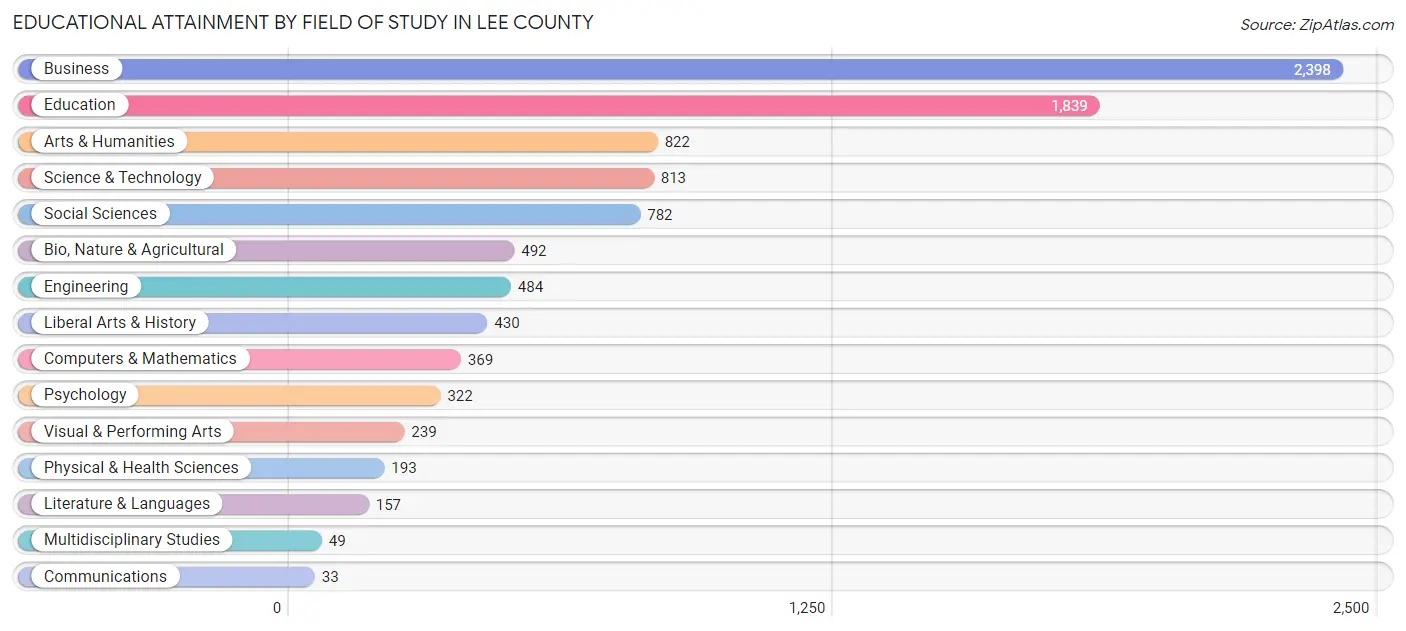
Educational Attainment by Field of Study in Lee County
Business (2,398 | 25.5%), education (1,839 | 19.5%), arts & humanities (822 | 8.7%), science & technology (813 | 8.6%), and social sciences (782 | 8.3%) are the most common fields of study among 9,422 individuals in Lee County who have obtained a bachelor's degree or higher.
| Field of Study | # Graduates | % Graduates |
| Computers & Mathematics | 369 | 3.9% |
| Bio, Nature & Agricultural | 492 | 5.2% |
| Physical & Health Sciences | 193 | 2.1% |
| Psychology | 322 | 3.4% |
| Social Sciences | 782 | 8.3% |
| Engineering | 484 | 5.1% |
| Multidisciplinary Studies | 49 | 0.5% |
| Science & Technology | 813 | 8.6% |
| Business | 2,398 | 25.5% |
| Education | 1,839 | 19.5% |
| Literature & Languages | 157 | 1.7% |
| Liberal Arts & History | 430 | 4.6% |
| Visual & Performing Arts | 239 | 2.5% |
| Communications | 33 | 0.4% |
| Arts & Humanities | 822 | 8.7% |
| Total | 9,422 | 100.0% |
Transportation & Commute in Lee County
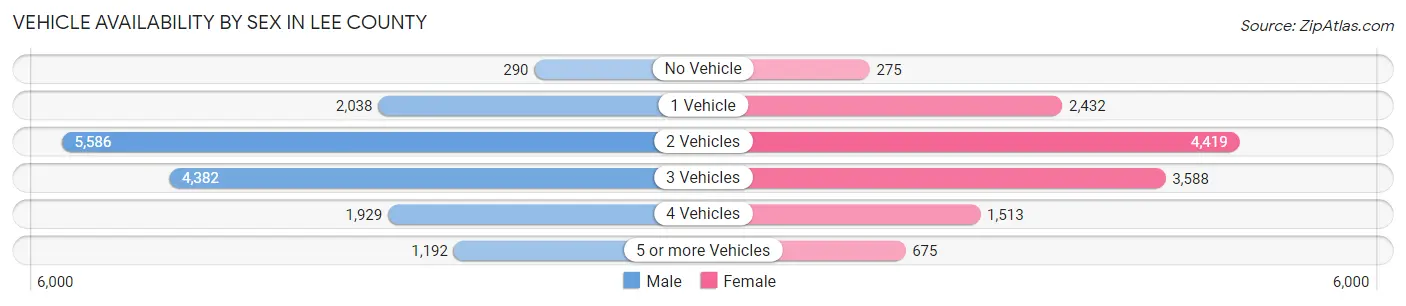
Vehicle Availability by Sex in Lee County
The most prevalent vehicle ownership categories in Lee County are males with 2 vehicles (5,586, accounting for 36.2%) and females with 2 vehicles (4,419, making up 43.3%).
| Vehicles Available | Male | Female |
| No Vehicle | 290 (1.9%) | 275 (2.1%) |
| 1 Vehicle | 2,038 (13.2%) | 2,432 (18.9%) |
| 2 Vehicles | 5,586 (36.2%) | 4,419 (34.3%) |
| 3 Vehicles | 4,382 (28.4%) | 3,588 (27.8%) |
| 4 Vehicles | 1,929 (12.5%) | 1,513 (11.7%) |
| 5 or more Vehicles | 1,192 (7.7%) | 675 (5.2%) |
| Total | 15,417 (100.0%) | 12,902 (100.0%) |
Commute Time in Lee County
The most frequently occuring commute durations in Lee County are 15 to 19 minutes (4,324 commuters, 16.0%), 10 to 14 minutes (3,790 commuters, 14.0%), and 5 to 9 minutes (3,397 commuters, 12.6%).
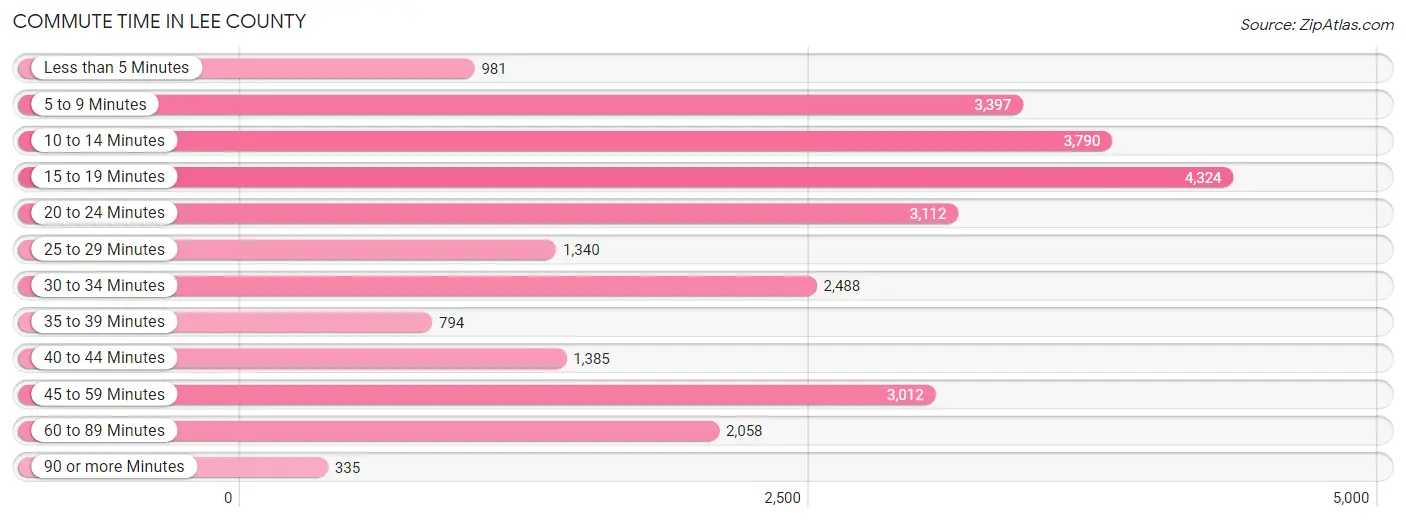
| Commute Time | # Commuters | % Commuters |
| Less than 5 Minutes | 981 | 3.6% |
| 5 to 9 Minutes | 3,397 | 12.6% |
| 10 to 14 Minutes | 3,790 | 14.0% |
| 15 to 19 Minutes | 4,324 | 16.0% |
| 20 to 24 Minutes | 3,112 | 11.5% |
| 25 to 29 Minutes | 1,340 | 5.0% |
| 30 to 34 Minutes | 2,488 | 9.2% |
| 35 to 39 Minutes | 794 | 2.9% |
| 40 to 44 Minutes | 1,385 | 5.1% |
| 45 to 59 Minutes | 3,012 | 11.2% |
| 60 to 89 Minutes | 2,058 | 7.6% |
| 90 or more Minutes | 335 | 1.2% |
Commute Time by Sex in Lee County
The most common commute times in Lee County are 10 to 14 minutes (2,161 commuters, 14.6%) for males and 15 to 19 minutes (2,370 commuters, 19.4%) for females.
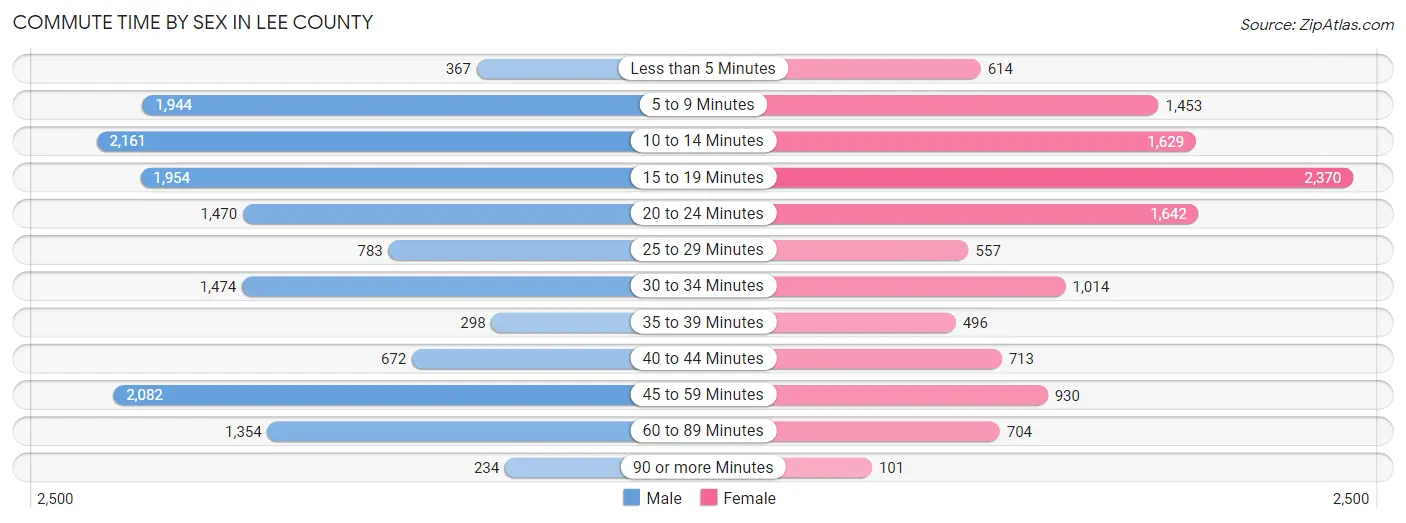
| Commute Time | Male | Female |
| Less than 5 Minutes | 367 (2.5%) | 614 (5.0%) |
| 5 to 9 Minutes | 1,944 (13.1%) | 1,453 (11.9%) |
| 10 to 14 Minutes | 2,161 (14.6%) | 1,629 (13.3%) |
| 15 to 19 Minutes | 1,954 (13.2%) | 2,370 (19.4%) |
| 20 to 24 Minutes | 1,470 (9.9%) | 1,642 (13.4%) |
| 25 to 29 Minutes | 783 (5.3%) | 557 (4.6%) |
| 30 to 34 Minutes | 1,474 (10.0%) | 1,014 (8.3%) |
| 35 to 39 Minutes | 298 (2.0%) | 496 (4.1%) |
| 40 to 44 Minutes | 672 (4.5%) | 713 (5.8%) |
| 45 to 59 Minutes | 2,082 (14.1%) | 930 (7.6%) |
| 60 to 89 Minutes | 1,354 (9.1%) | 704 (5.8%) |
| 90 or more Minutes | 234 (1.6%) | 101 (0.8%) |
Time of Departure to Work by Sex in Lee County
The most frequent times of departure to work in Lee County are 7:00 AM to 7:29 AM (2,554, 17.3%) for males and 7:00 AM to 7:29 AM (2,351, 19.2%) for females.
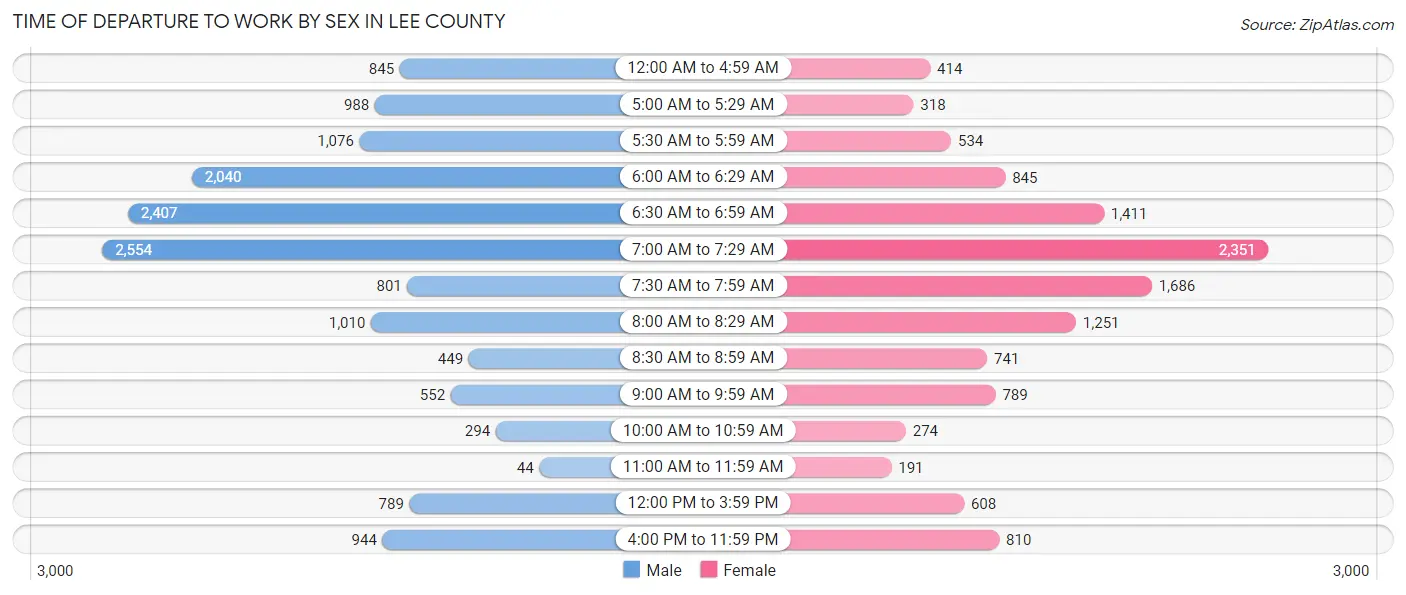
| Time of Departure | Male | Female |
| 12:00 AM to 4:59 AM | 845 (5.7%) | 414 (3.4%) |
| 5:00 AM to 5:29 AM | 988 (6.7%) | 318 (2.6%) |
| 5:30 AM to 5:59 AM | 1,076 (7.3%) | 534 (4.4%) |
| 6:00 AM to 6:29 AM | 2,040 (13.8%) | 845 (6.9%) |
| 6:30 AM to 6:59 AM | 2,407 (16.3%) | 1,411 (11.5%) |
| 7:00 AM to 7:29 AM | 2,554 (17.3%) | 2,351 (19.2%) |
| 7:30 AM to 7:59 AM | 801 (5.4%) | 1,686 (13.8%) |
| 8:00 AM to 8:29 AM | 1,010 (6.8%) | 1,251 (10.2%) |
| 8:30 AM to 8:59 AM | 449 (3.0%) | 741 (6.1%) |
| 9:00 AM to 9:59 AM | 552 (3.7%) | 789 (6.5%) |
| 10:00 AM to 10:59 AM | 294 (2.0%) | 274 (2.2%) |
| 11:00 AM to 11:59 AM | 44 (0.3%) | 191 (1.6%) |
| 12:00 PM to 3:59 PM | 789 (5.3%) | 608 (5.0%) |
| 4:00 PM to 11:59 PM | 944 (6.4%) | 810 (6.6%) |
| Total | 14,793 (100.0%) | 12,223 (100.0%) |
Housing Occupancy in Lee County
Occupancy by Ownership in Lee County
Of the total 24,050 dwellings in Lee County, owner-occupied units account for 15,706 (65.3%), while renter-occupied units make up 8,344 (34.7%).
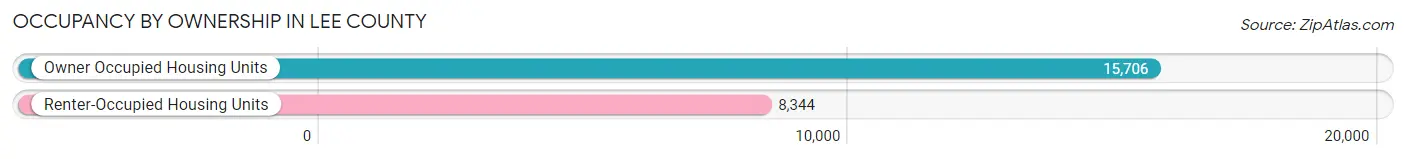
| Occupancy | # Housing Units | % Housing Units |
| Owner Occupied Housing Units | 15,706 | 65.3% |
| Renter-Occupied Housing Units | 8,344 | 34.7% |
| Total Occupied Housing Units | 24,050 | 100.0% |
Occupancy by Household Size in Lee County
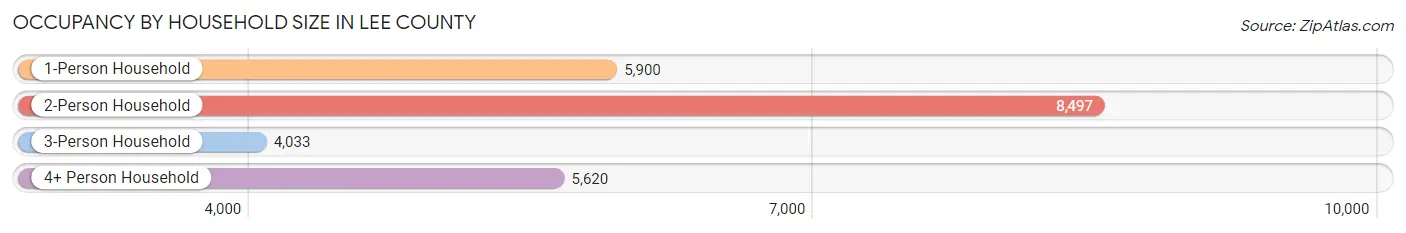
| Household Size | # Housing Units | % Housing Units |
| 1-Person Household | 5,900 | 24.5% |
| 2-Person Household | 8,497 | 35.3% |
| 3-Person Household | 4,033 | 16.8% |
| 4+ Person Household | 5,620 | 23.4% |
| Total Housing Units | 24,050 | 100.0% |
Occupancy by Ownership by Household Size in Lee County
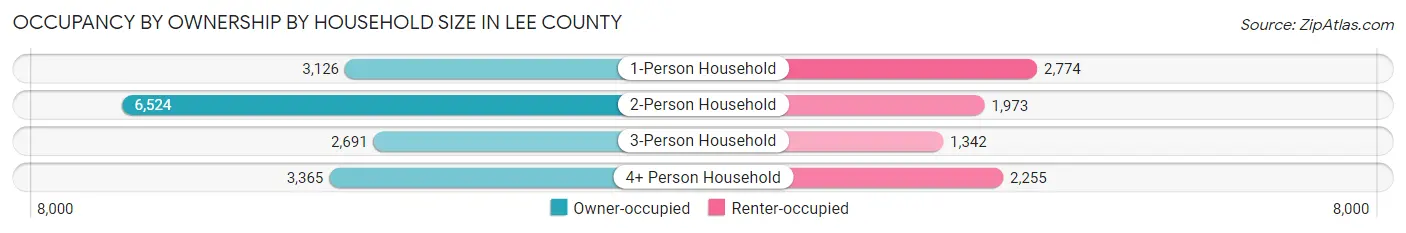
| Household Size | Owner-occupied | Renter-occupied |
| 1-Person Household | 3,126 (53.0%) | 2,774 (47.0%) |
| 2-Person Household | 6,524 (76.8%) | 1,973 (23.2%) |
| 3-Person Household | 2,691 (66.7%) | 1,342 (33.3%) |
| 4+ Person Household | 3,365 (59.9%) | 2,255 (40.1%) |
| Total Housing Units | 15,706 (65.3%) | 8,344 (34.7%) |
Occupancy by Educational Attainment in Lee County
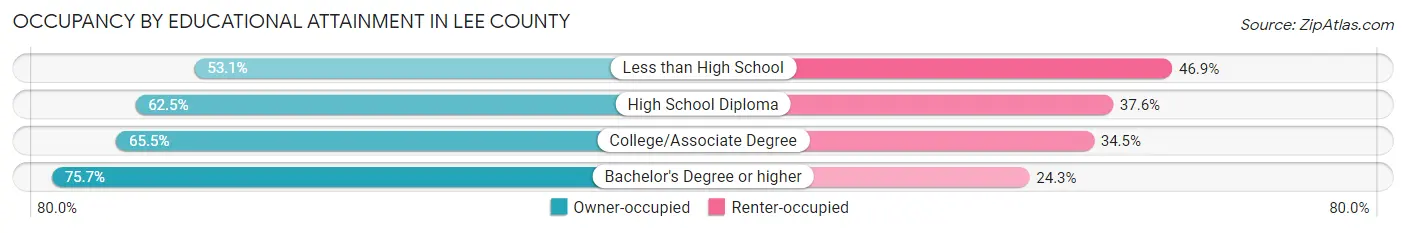
| Household Size | Owner-occupied | Renter-occupied |
| Less than High School | 1,780 (53.1%) | 1,574 (46.9%) |
| High School Diploma | 3,447 (62.5%) | 2,073 (37.6%) |
| College/Associate Degree | 6,464 (65.5%) | 3,408 (34.5%) |
| Bachelor's Degree or higher | 4,015 (75.7%) | 1,289 (24.3%) |
Occupancy by Age of Householder in Lee County
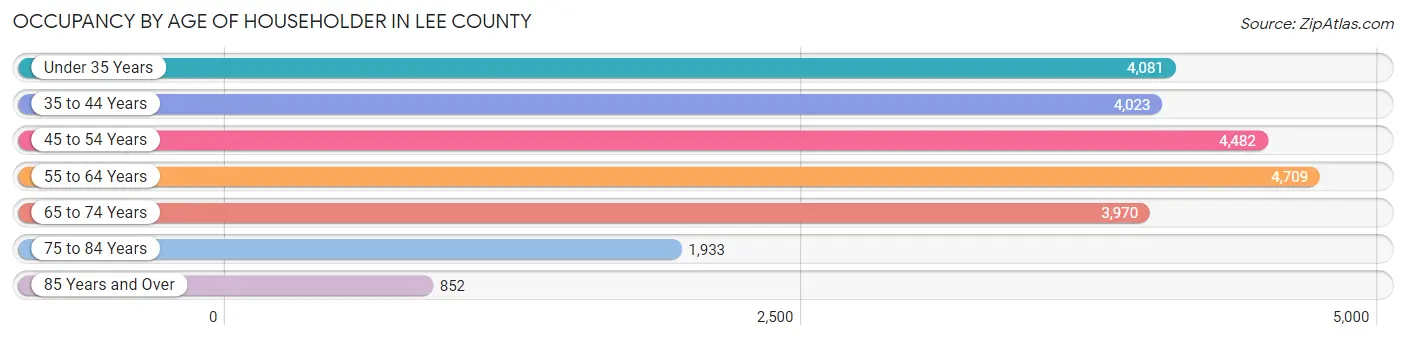
| Age Bracket | # Households | % Households |
| Under 35 Years | 4,081 | 17.0% |
| 35 to 44 Years | 4,023 | 16.7% |
| 45 to 54 Years | 4,482 | 18.6% |
| 55 to 64 Years | 4,709 | 19.6% |
| 65 to 74 Years | 3,970 | 16.5% |
| 75 to 84 Years | 1,933 | 8.0% |
| 85 Years and Over | 852 | 3.5% |
| Total | 24,050 | 100.0% |
Housing Finances in Lee County
Median Income by Occupancy in Lee County
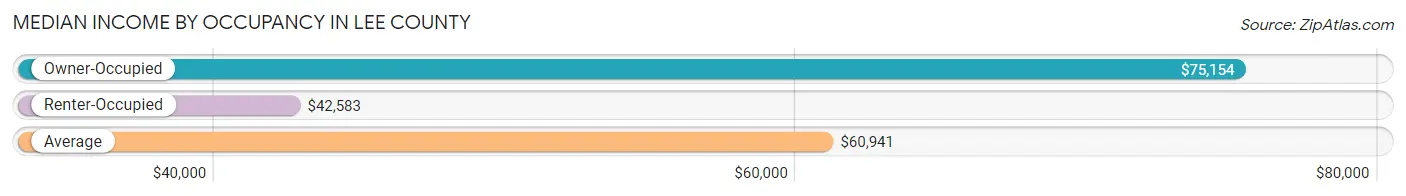
| Occupancy Type | # Households | Median Income |
| Owner-Occupied | 15,706 (65.3%) | $75,154 |
| Renter-Occupied | 8,344 (34.7%) | $42,583 |
| Average | 24,050 (100.0%) | $60,941 |
Occupancy by Householder Income Bracket in Lee County
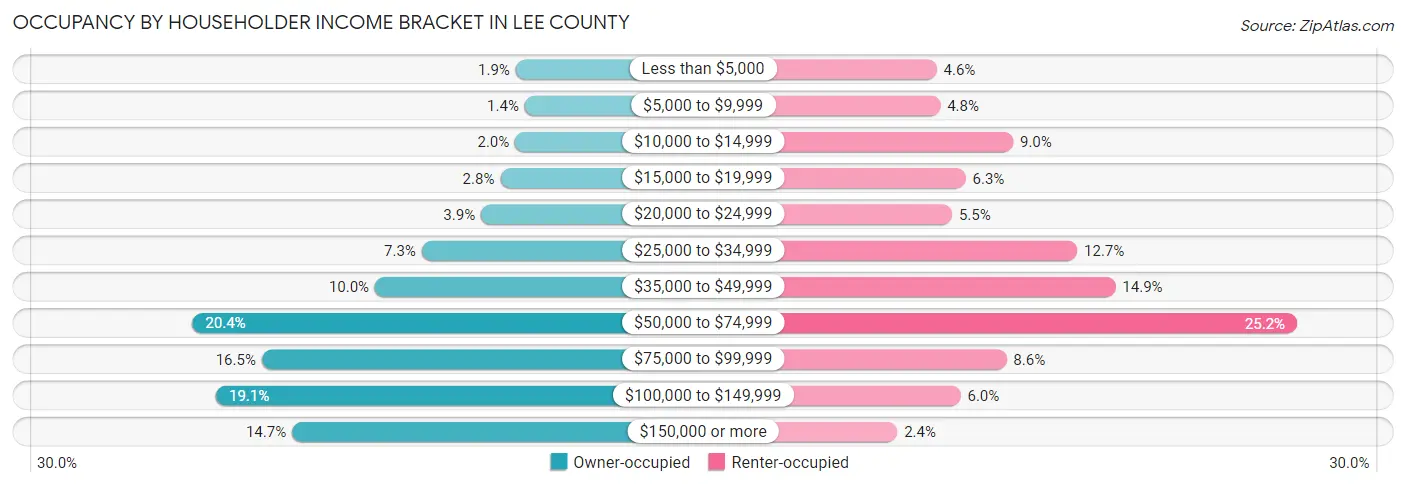
| Income Bracket | Owner-occupied | Renter-occupied |
| Less than $5,000 | 305 (1.9%) | 386 (4.6%) |
| $5,000 to $9,999 | 223 (1.4%) | 404 (4.8%) |
| $10,000 to $14,999 | 309 (2.0%) | 751 (9.0%) |
| $15,000 to $19,999 | 443 (2.8%) | 525 (6.3%) |
| $20,000 to $24,999 | 616 (3.9%) | 460 (5.5%) |
| $25,000 to $34,999 | 1,148 (7.3%) | 1,056 (12.7%) |
| $35,000 to $49,999 | 1,567 (10.0%) | 1,239 (14.8%) |
| $50,000 to $74,999 | 3,206 (20.4%) | 2,104 (25.2%) |
| $75,000 to $99,999 | 2,584 (16.5%) | 719 (8.6%) |
| $100,000 to $149,999 | 2,993 (19.1%) | 501 (6.0%) |
| $150,000 or more | 2,312 (14.7%) | 199 (2.4%) |
| Total | 15,706 (100.0%) | 8,344 (100.0%) |
Monthly Housing Cost Tiers in Lee County
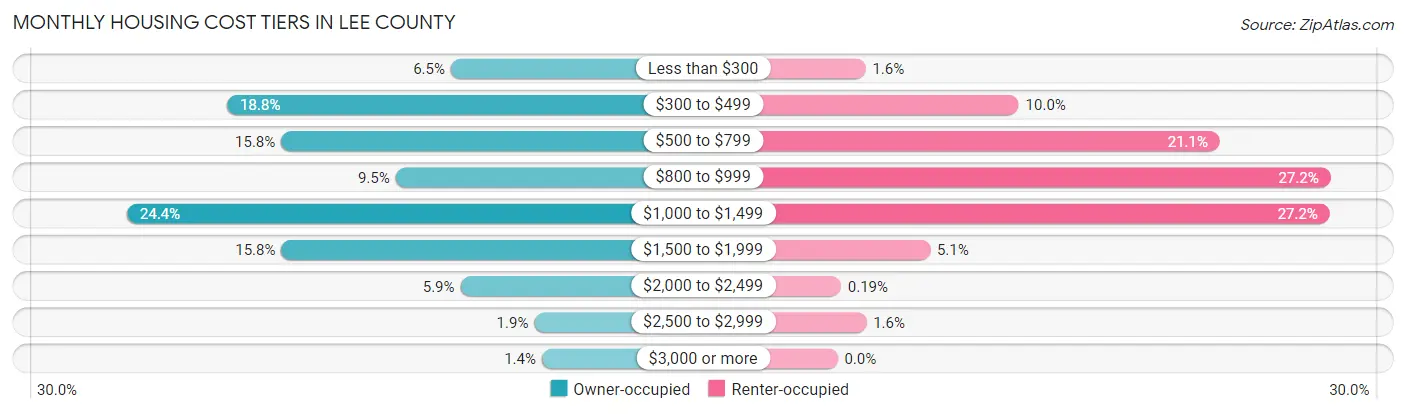
| Monthly Cost | Owner-occupied | Renter-occupied |
| Less than $300 | 1,014 (6.5%) | 129 (1.5%) |
| $300 to $499 | 2,956 (18.8%) | 835 (10.0%) |
| $500 to $799 | 2,487 (15.8%) | 1,762 (21.1%) |
| $800 to $999 | 1,493 (9.5%) | 2,273 (27.2%) |
| $1,000 to $1,499 | 3,825 (24.3%) | 2,269 (27.2%) |
| $1,500 to $1,999 | 2,485 (15.8%) | 426 (5.1%) |
| $2,000 to $2,499 | 932 (5.9%) | 16 (0.2%) |
| $2,500 to $2,999 | 290 (1.8%) | 133 (1.6%) |
| $3,000 or more | 224 (1.4%) | 0 (0.0%) |
| Total | 15,706 (100.0%) | 8,344 (100.0%) |
Physical Housing Characteristics in Lee County
Housing Structures in Lee County
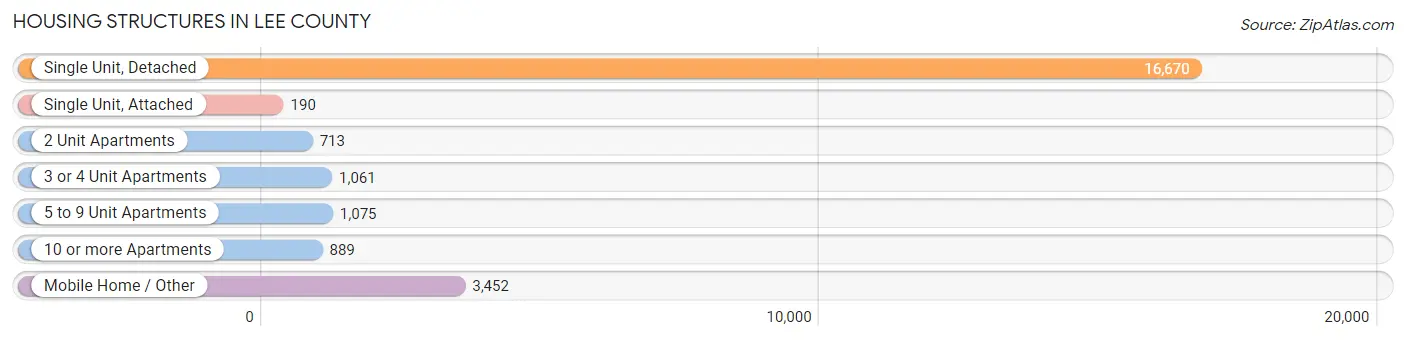
| Structure Type | # Housing Units | % Housing Units |
| Single Unit, Detached | 16,670 | 69.3% |
| Single Unit, Attached | 190 | 0.8% |
| 2 Unit Apartments | 713 | 3.0% |
| 3 or 4 Unit Apartments | 1,061 | 4.4% |
| 5 to 9 Unit Apartments | 1,075 | 4.5% |
| 10 or more Apartments | 889 | 3.7% |
| Mobile Home / Other | 3,452 | 14.3% |
| Total | 24,050 | 100.0% |
Housing Structures by Occupancy in Lee County
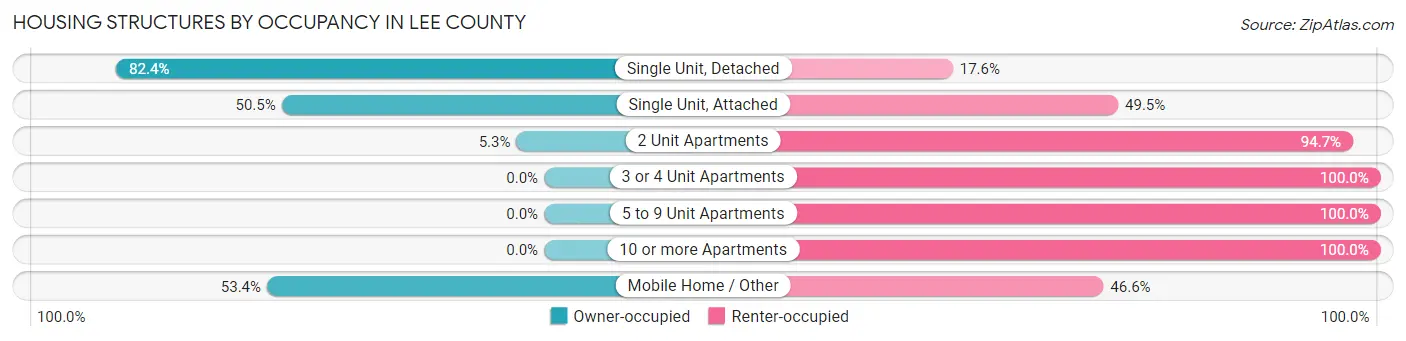
| Structure Type | Owner-occupied | Renter-occupied |
| Single Unit, Detached | 13,730 (82.4%) | 2,940 (17.6%) |
| Single Unit, Attached | 96 (50.5%) | 94 (49.5%) |
| 2 Unit Apartments | 38 (5.3%) | 675 (94.7%) |
| 3 or 4 Unit Apartments | 0 (0.0%) | 1,061 (100.0%) |
| 5 to 9 Unit Apartments | 0 (0.0%) | 1,075 (100.0%) |
| 10 or more Apartments | 0 (0.0%) | 889 (100.0%) |
| Mobile Home / Other | 1,842 (53.4%) | 1,610 (46.6%) |
| Total | 15,706 (65.3%) | 8,344 (34.7%) |
Housing Structures by Number of Rooms in Lee County
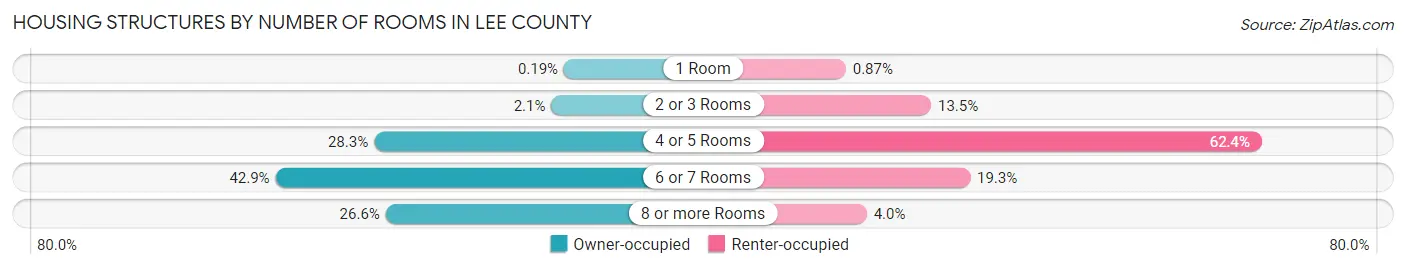
| Number of Rooms | Owner-occupied | Renter-occupied |
| 1 Room | 30 (0.2%) | 73 (0.9%) |
| 2 or 3 Rooms | 323 (2.1%) | 1,126 (13.5%) |
| 4 or 5 Rooms | 4,445 (28.3%) | 5,208 (62.4%) |
| 6 or 7 Rooms | 6,735 (42.9%) | 1,606 (19.3%) |
| 8 or more Rooms | 4,173 (26.6%) | 331 (4.0%) |
| Total | 15,706 (100.0%) | 8,344 (100.0%) |
Housing Structure by Heating Type in Lee County
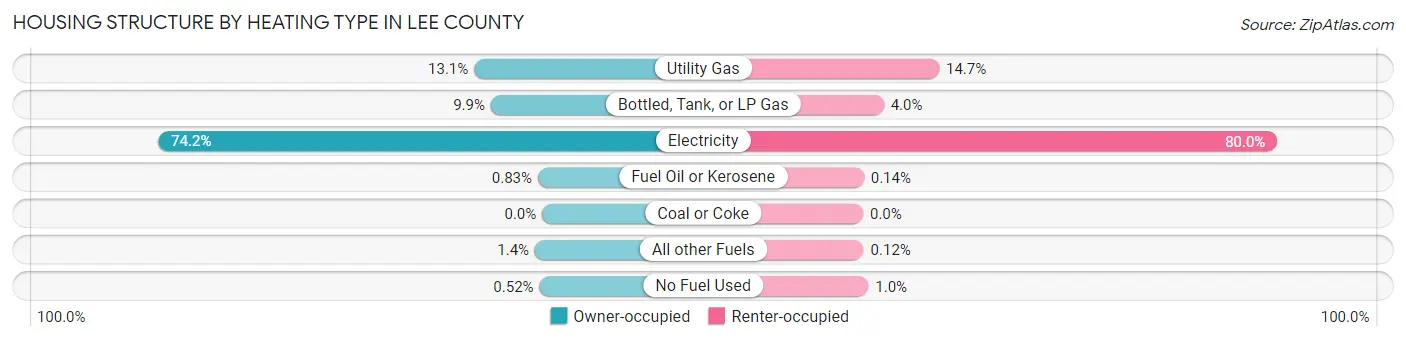
| Heating Type | Owner-occupied | Renter-occupied |
| Utility Gas | 2,064 (13.1%) | 1,225 (14.7%) |
| Bottled, Tank, or LP Gas | 1,556 (9.9%) | 334 (4.0%) |
| Electricity | 11,656 (74.2%) | 6,677 (80.0%) |
| Fuel Oil or Kerosene | 131 (0.8%) | 12 (0.1%) |
| Coal or Coke | 0 (0.0%) | 0 (0.0%) |
| All other Fuels | 217 (1.4%) | 10 (0.1%) |
| No Fuel Used | 82 (0.5%) | 86 (1.0%) |
| Total | 15,706 (100.0%) | 8,344 (100.0%) |
Household Vehicle Usage in Lee County
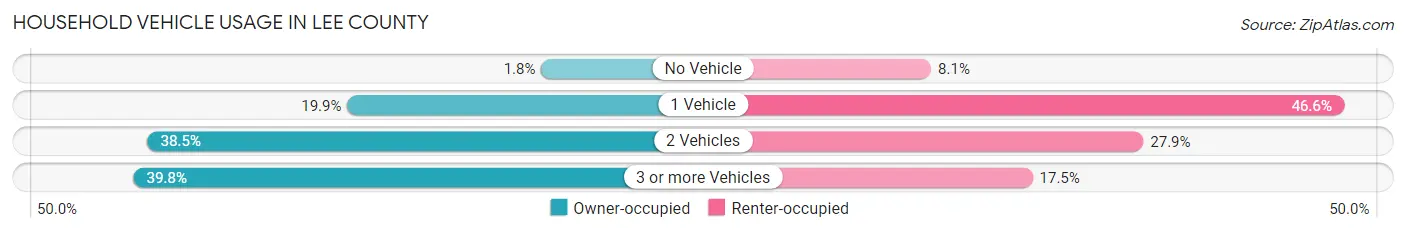
| Vehicles per Household | Owner-occupied | Renter-occupied |
| No Vehicle | 278 (1.8%) | 672 (8.1%) |
| 1 Vehicle | 3,122 (19.9%) | 3,885 (46.6%) |
| 2 Vehicles | 6,050 (38.5%) | 2,325 (27.9%) |
| 3 or more Vehicles | 6,256 (39.8%) | 1,462 (17.5%) |
| Total | 15,706 (100.0%) | 8,344 (100.0%) |
Real Estate & Mortgages in Lee County
Real Estate and Mortgage Overview in Lee County
| Characteristic | Without Mortgage | With Mortgage |
| Housing Units | 6,263 | 9,443 |
| Median Property Value | $148,400 | $212,800 |
| Median Household Income | $56,084 | $1,803 |
| Monthly Housing Costs | $447 | $224 |
| Real Estate Taxes | $1,354 | $165 |
Property Value by Mortgage Status in Lee County
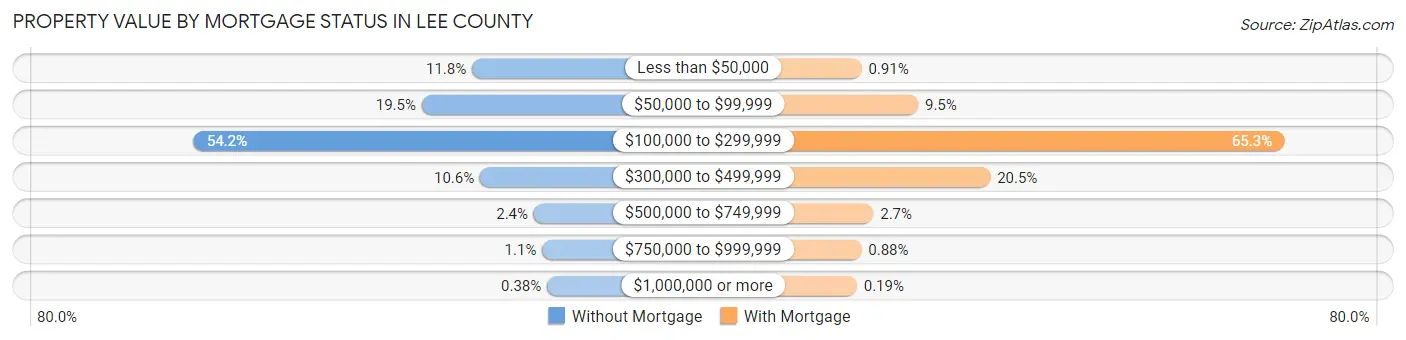
| Property Value | Without Mortgage | With Mortgage |
| Less than $50,000 | 740 (11.8%) | 86 (0.9%) |
| $50,000 to $99,999 | 1,220 (19.5%) | 899 (9.5%) |
| $100,000 to $299,999 | 3,395 (54.2%) | 6,164 (65.3%) |
| $300,000 to $499,999 | 664 (10.6%) | 1,938 (20.5%) |
| $500,000 to $749,999 | 150 (2.4%) | 255 (2.7%) |
| $750,000 to $999,999 | 70 (1.1%) | 83 (0.9%) |
| $1,000,000 or more | 24 (0.4%) | 18 (0.2%) |
| Total | 6,263 (100.0%) | 9,443 (100.0%) |
Household Income by Mortgage Status in Lee County
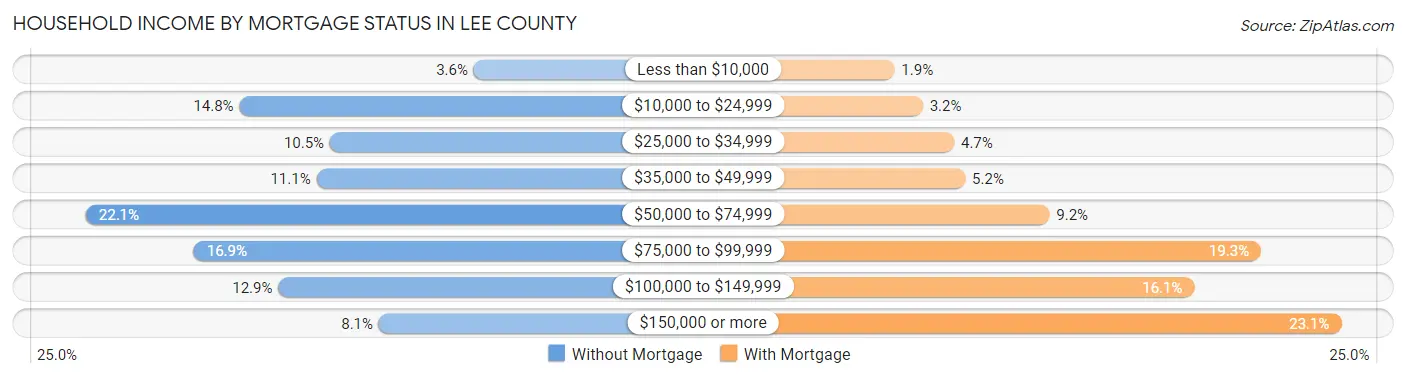
| Household Income | Without Mortgage | With Mortgage |
| Less than $10,000 | 226 (3.6%) | 175 (1.8%) |
| $10,000 to $24,999 | 925 (14.8%) | 302 (3.2%) |
| $25,000 to $34,999 | 655 (10.5%) | 443 (4.7%) |
| $35,000 to $49,999 | 695 (11.1%) | 493 (5.2%) |
| $50,000 to $74,999 | 1,383 (22.1%) | 872 (9.2%) |
| $75,000 to $99,999 | 1,061 (16.9%) | 1,823 (19.3%) |
| $100,000 to $149,999 | 809 (12.9%) | 1,523 (16.1%) |
| $150,000 or more | 509 (8.1%) | 2,184 (23.1%) |
| Total | 6,263 (100.0%) | 9,443 (100.0%) |
Property Value to Household Income Ratio in Lee County
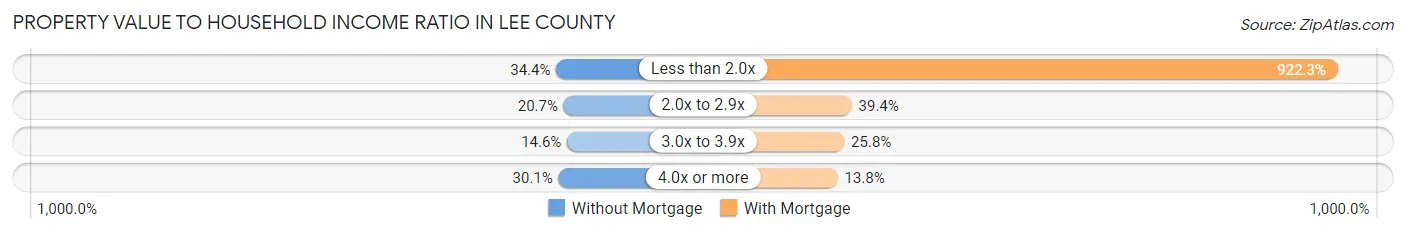
| Value-to-Income Ratio | Without Mortgage | With Mortgage |
| Less than 2.0x | 2,153 (34.4%) | 87,092 (922.3%) |
| 2.0x to 2.9x | 1,299 (20.7%) | 3,721 (39.4%) |
| 3.0x to 3.9x | 913 (14.6%) | 2,440 (25.8%) |
| 4.0x or more | 1,884 (30.1%) | 1,304 (13.8%) |
| Total | 6,263 (100.0%) | 9,443 (100.0%) |
Real Estate Taxes by Mortgage Status in Lee County
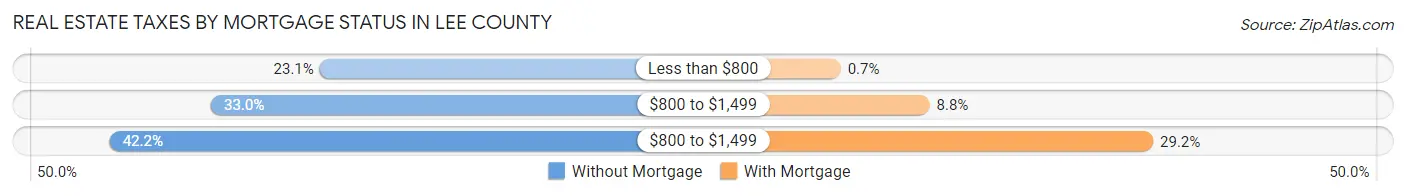
| Property Taxes | Without Mortgage | With Mortgage |
| Less than $800 | 1,444 (23.1%) | 66 (0.7%) |
| $800 to $1,499 | 2,065 (33.0%) | 833 (8.8%) |
| $800 to $1,499 | 2,644 (42.2%) | 2,760 (29.2%) |
| Total | 6,263 (100.0%) | 9,443 (100.0%) |
Health & Disability in Lee County
Health Insurance Coverage by Age in Lee County
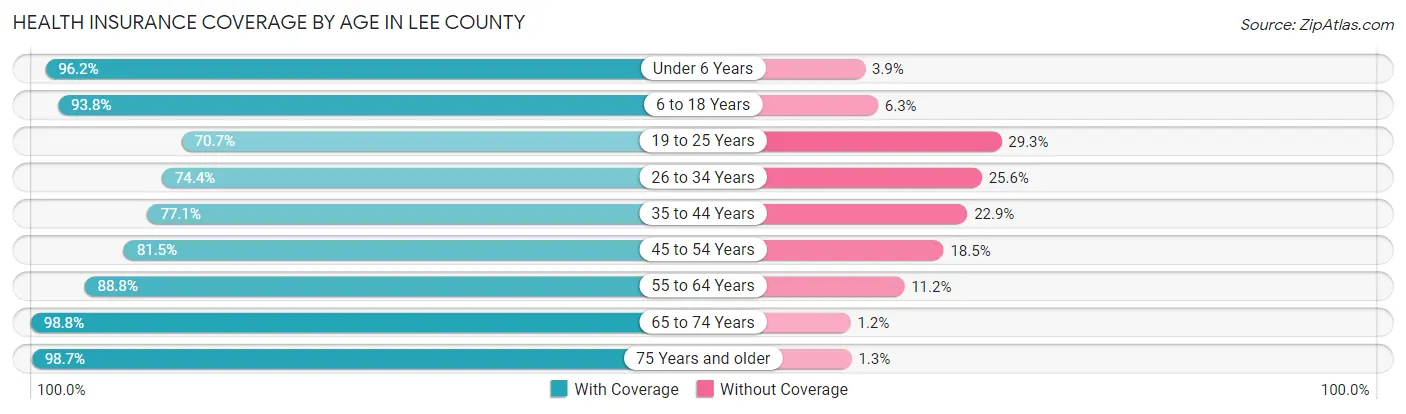
| Age Bracket | With Coverage | Without Coverage |
| Under 6 Years | 4,324 (96.2%) | 173 (3.8%) |
| 6 to 18 Years | 10,645 (93.8%) | 710 (6.2%) |
| 19 to 25 Years | 3,611 (70.7%) | 1,496 (29.3%) |
| 26 to 34 Years | 5,333 (74.4%) | 1,837 (25.6%) |
| 35 to 44 Years | 6,134 (77.1%) | 1,824 (22.9%) |
| 45 to 54 Years | 6,365 (81.5%) | 1,445 (18.5%) |
| 55 to 64 Years | 7,348 (88.8%) | 925 (11.2%) |
| 65 to 74 Years | 6,139 (98.8%) | 72 (1.2%) |
| 75 Years and older | 3,993 (98.7%) | 54 (1.3%) |
| Total | 53,892 (86.3%) | 8,536 (13.7%) |
Health Insurance Coverage by Citizenship Status in Lee County
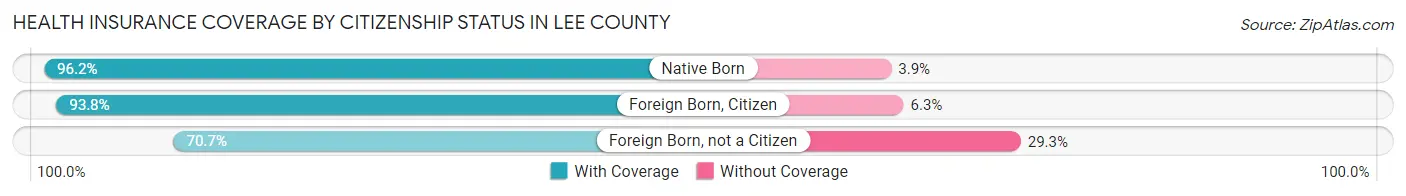
| Citizenship Status | With Coverage | Without Coverage |
| Native Born | 4,324 (96.2%) | 173 (3.8%) |
| Foreign Born, Citizen | 10,645 (93.8%) | 710 (6.2%) |
| Foreign Born, not a Citizen | 3,611 (70.7%) | 1,496 (29.3%) |
Health Insurance Coverage by Household Income in Lee County
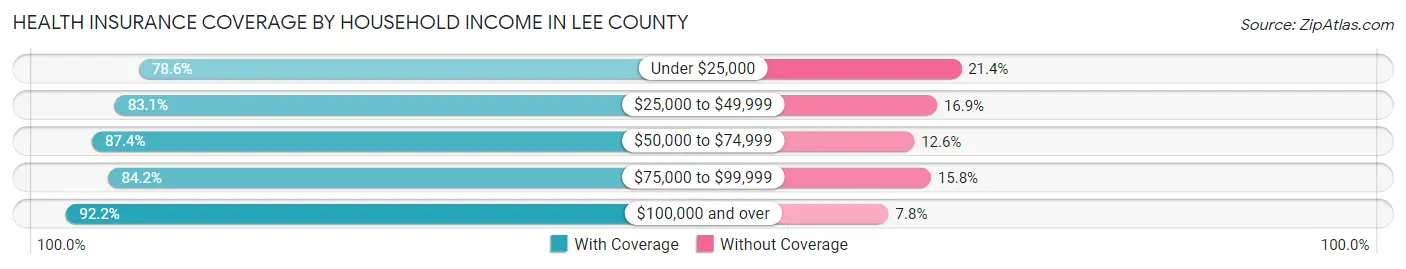
| Household Income | With Coverage | Without Coverage |
| Under $25,000 | 7,041 (78.6%) | 1,921 (21.4%) |
| $25,000 to $49,999 | 9,549 (83.1%) | 1,941 (16.9%) |
| $50,000 to $74,999 | 11,859 (87.4%) | 1,715 (12.6%) |
| $75,000 to $99,999 | 7,737 (84.2%) | 1,448 (15.8%) |
| $100,000 and over | 17,579 (92.2%) | 1,495 (7.8%) |
Public vs Private Health Insurance Coverage by Age in Lee County
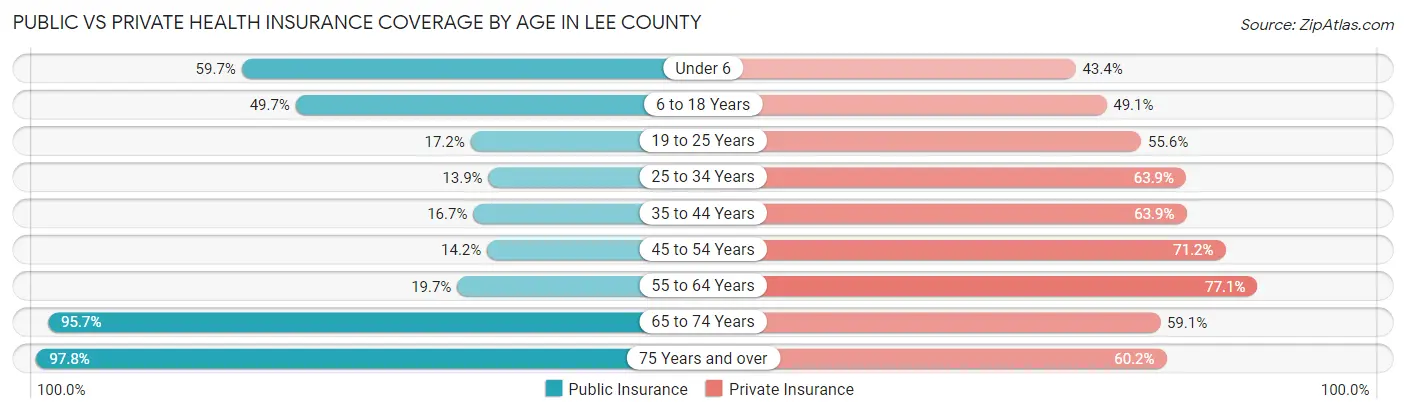
| Age Bracket | Public Insurance | Private Insurance |
| Under 6 | 2,685 (59.7%) | 1,951 (43.4%) |
| 6 to 18 Years | 5,641 (49.7%) | 5,575 (49.1%) |
| 19 to 25 Years | 880 (17.2%) | 2,837 (55.5%) |
| 25 to 34 Years | 997 (13.9%) | 4,579 (63.9%) |
| 35 to 44 Years | 1,331 (16.7%) | 5,088 (63.9%) |
| 45 to 54 Years | 1,105 (14.1%) | 5,560 (71.2%) |
| 55 to 64 Years | 1,630 (19.7%) | 6,380 (77.1%) |
| 65 to 74 Years | 5,941 (95.7%) | 3,668 (59.1%) |
| 75 Years and over | 3,958 (97.8%) | 2,438 (60.2%) |
| Total | 24,168 (38.7%) | 38,076 (61.0%) |
Disability Status by Sex by Age in Lee County
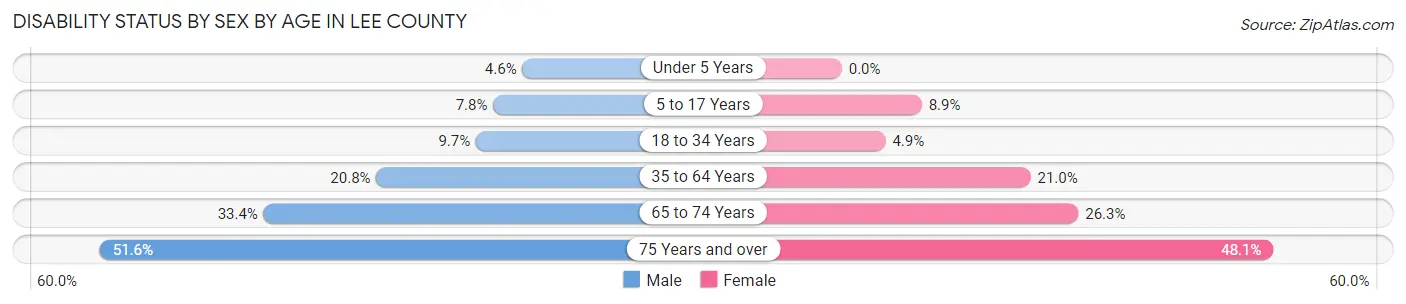
| Age Bracket | Male | Female |
| Under 5 Years | 95 (4.5%) | 0 (0.0%) |
| 5 to 17 Years | 437 (7.8%) | 493 (8.9%) |
| 18 to 34 Years | 627 (9.7%) | 319 (4.9%) |
| 35 to 64 Years | 2,437 (20.8%) | 2,593 (21.0%) |
| 65 to 74 Years | 978 (33.4%) | 864 (26.3%) |
| 75 Years and over | 860 (51.6%) | 1,144 (48.0%) |
Disability Class by Sex by Age in Lee County
Disability Class: Hearing Difficulty
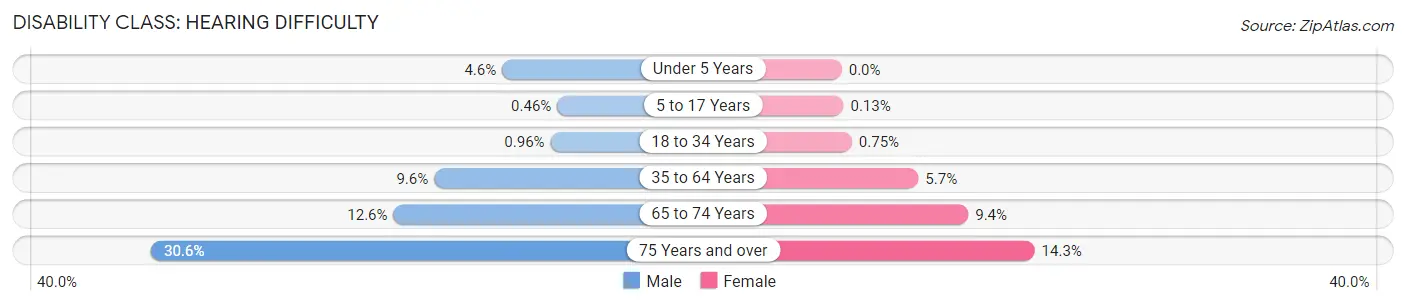
| Age Bracket | Male | Female |
| Under 5 Years | 95 (4.5%) | 0 (0.0%) |
| 5 to 17 Years | 26 (0.5%) | 7 (0.1%) |
| 18 to 34 Years | 62 (1.0%) | 49 (0.7%) |
| 35 to 64 Years | 1,124 (9.6%) | 702 (5.7%) |
| 65 to 74 Years | 370 (12.6%) | 308 (9.4%) |
| 75 Years and over | 510 (30.6%) | 341 (14.3%) |
Disability Class: Vision Difficulty
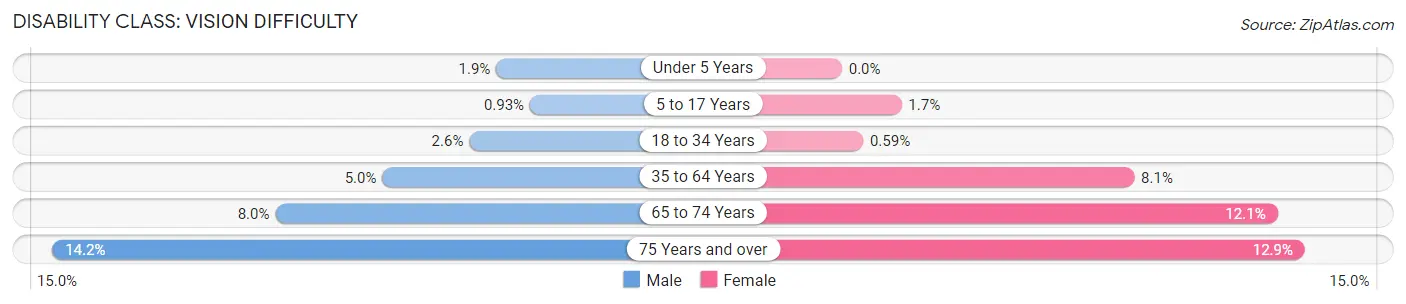
| Age Bracket | Male | Female |
| Under 5 Years | 39 (1.9%) | 0 (0.0%) |
| 5 to 17 Years | 52 (0.9%) | 92 (1.7%) |
| 18 to 34 Years | 169 (2.6%) | 39 (0.6%) |
| 35 to 64 Years | 590 (5.0%) | 1,004 (8.1%) |
| 65 to 74 Years | 235 (8.0%) | 398 (12.1%) |
| 75 Years and over | 237 (14.2%) | 307 (12.9%) |
Disability Class: Cognitive Difficulty
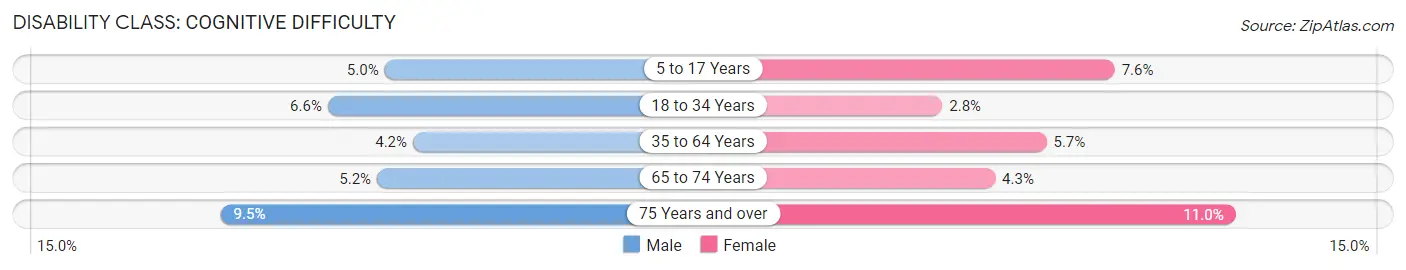
| Age Bracket | Male | Female |
| 5 to 17 Years | 279 (5.0%) | 421 (7.6%) |
| 18 to 34 Years | 423 (6.6%) | 184 (2.8%) |
| 35 to 64 Years | 490 (4.2%) | 703 (5.7%) |
| 65 to 74 Years | 152 (5.2%) | 140 (4.3%) |
| 75 Years and over | 159 (9.5%) | 261 (11.0%) |
Disability Class: Ambulatory Difficulty
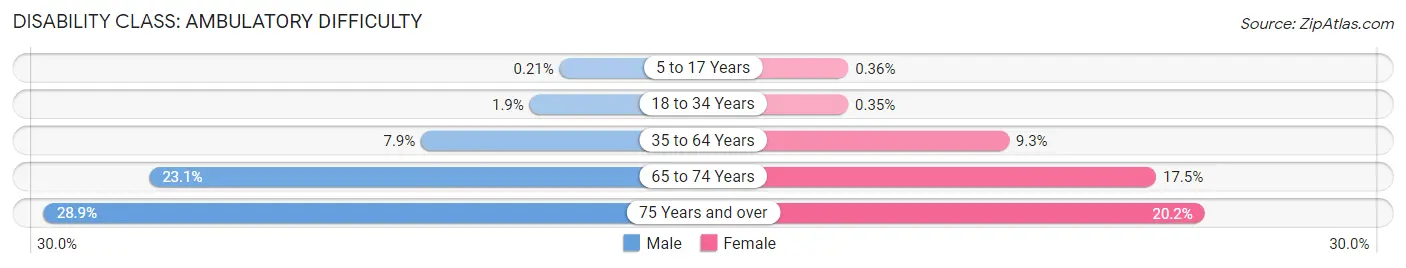
| Age Bracket | Male | Female |
| 5 to 17 Years | 12 (0.2%) | 20 (0.4%) |
| 18 to 34 Years | 121 (1.9%) | 23 (0.4%) |
| 35 to 64 Years | 927 (7.9%) | 1,147 (9.3%) |
| 65 to 74 Years | 676 (23.1%) | 574 (17.5%) |
| 75 Years and over | 482 (28.9%) | 481 (20.2%) |
Disability Class: Self-Care Difficulty
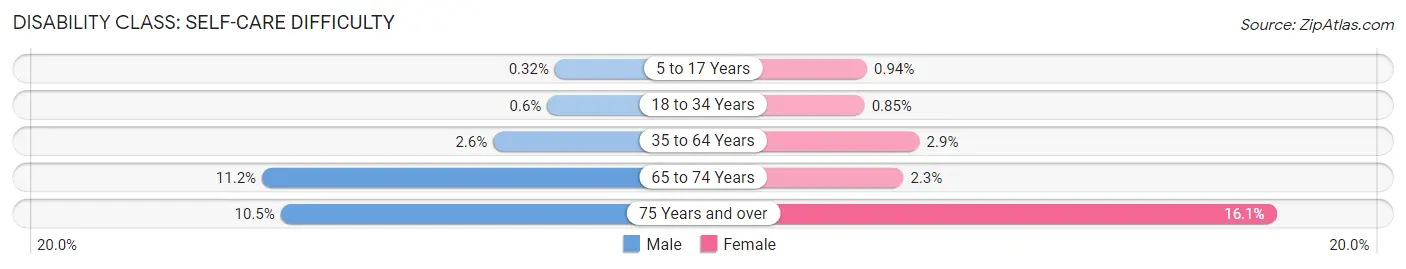
| Age Bracket | Male | Female |
| 5 to 17 Years | 18 (0.3%) | 52 (0.9%) |
| 18 to 34 Years | 39 (0.6%) | 56 (0.9%) |
| 35 to 64 Years | 306 (2.6%) | 357 (2.9%) |
| 65 to 74 Years | 328 (11.2%) | 75 (2.3%) |
| 75 Years and over | 175 (10.5%) | 384 (16.1%) |
Technology Access in Lee County
Computing Device Access in Lee County
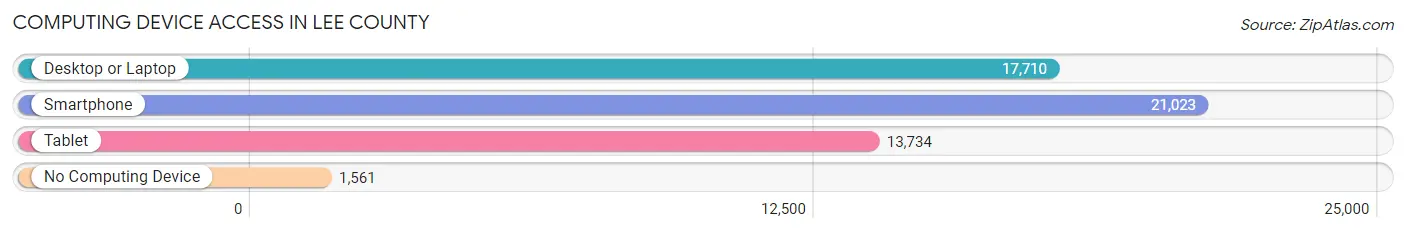
| Device Type | # Households | % Households |
| Desktop or Laptop | 17,710 | 73.6% |
| Smartphone | 21,023 | 87.4% |
| Tablet | 13,734 | 57.1% |
| No Computing Device | 1,561 | 6.5% |
| Total | 24,050 | 100.0% |
Internet Access in Lee County
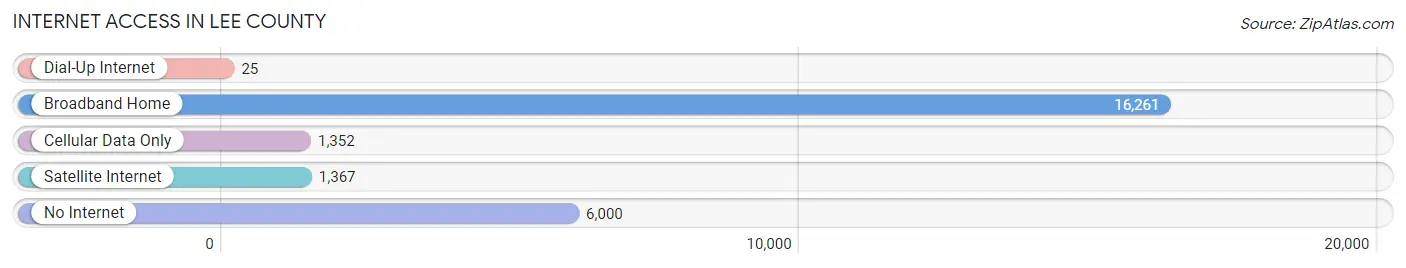
| Internet Type | # Households | % Households |
| Dial-Up Internet | 25 | 0.1% |
| Broadband Home | 16,261 | 67.6% |
| Cellular Data Only | 1,352 | 5.6% |
| Satellite Internet | 1,367 | 5.7% |
| No Internet | 6,000 | 24.9% |
| Total | 24,050 | 100.0% |
Lee County Summary
Lee County is located in the central part of North Carolina, and is part of the Piedmont region. It is bordered by Chatham County to the north, Moore County to the east, Harnett County to the south, and Hoke and Cumberland counties to the west. The county seat is Sanford, and the county is named for General Robert E. Lee.
Geography
Lee County covers an area of 437 square miles, and is located in the Piedmont region of North Carolina. The terrain is mostly flat, with some rolling hills in the western part of the county. The county is drained by the Deep River, which flows through the center of the county. The county is also home to several lakes, including Jordan Lake, which is located in the northern part of the county.
Climate
Lee County has a humid subtropical climate, with hot, humid summers and mild winters. The average annual temperature is around 61°F, and the average annual precipitation is around 44 inches.
Demographics
As of the 2010 census, Lee County had a population of 57,866. The racial makeup of the county was 73.3% White, 19.2% African American, 0.5% Native American, 1.7% Asian, 0.1% Pacific Islander, 3.2% from other races, and 2.1% from two or more races. Hispanic or Latino of any race were 6.7% of the population.
Economy
Lee County has a diverse economy, with a mix of manufacturing, agriculture, and services. The county is home to several large employers, including Caterpillar, Inc., which has a manufacturing plant in Sanford. Other major employers include Lee County Schools, Central Carolina Community College, and FirstHealth of the Carolinas.
Agriculture is also an important part of the county's economy. The county is home to several large farms, and is a major producer of tobacco, corn, soybeans, and hay.
The county is also home to several tourist attractions, including the Carolina Tiger Rescue, the Lee County Historical Museum, and the Sanford Historic District.
Conclusion
Lee County is a diverse county located in the Piedmont region of North Carolina. It has a humid subtropical climate, and a population of 57,866 as of the 2010 census. The county has a diverse economy, with a mix of manufacturing, agriculture, and services. It is also home to several tourist attractions, making it a popular destination for visitors.
Common Questions
What is Per Capita Income in Lee County?
Per Capita income in Lee County is $30,083.
What is the Median Family Income in Lee County?
Median Family Income in Lee County is $67,217.
What is the Median Household income in Lee County?
Median Household Income in Lee County is $60,941.
What is Income or Wage Gap in Lee County?
Income or Wage Gap in Lee County is 28.7%.
Women in Lee County earn 71.3 cents for every dollar earned by a man.
What is Family Income Deficit in Lee County?
Family Income Deficit in Lee County is $10,412.
Families that are below poverty line in Lee County earn $10,412 less on average than the poverty threshold level.
What is Inequality or Gini Index in Lee County?
Inequality or Gini Index in Lee County is 0.43.
What is the Total Population of Lee County?
Total Population of Lee County is 63,560.
What is the Total Male Population of Lee County?
Total Male Population of Lee County is 31,219.
What is the Total Female Population of Lee County?
Total Female Population of Lee County is 32,341.
What is the Ratio of Males per 100 Females in Lee County?
There are 96.53 Males per 100 Females in Lee County.
What is the Ratio of Females per 100 Males in Lee County?
There are 103.59 Females per 100 Males in Lee County.
What is the Median Population Age in Lee County?
Median Population Age in Lee County is 39.6 Years.
What is the Average Family Size in Lee County
Average Family Size in Lee County is 3.0 People.
What is the Average Household Size in Lee County
Average Household Size in Lee County is 2.6 People.
How Large is the Labor Force in Lee County?
There are 30,407 People in the Labor Forcein in Lee County.
What is the Percentage of People in the Labor Force in Lee County?
60.5% of People are in the Labor Force in Lee County.
What is the Unemployment Rate in Lee County?
Unemployment Rate in Lee County is 5.2%.