Jones County, NC Map & Demographics
Jones County Map
Jones County Overview
$28,373
PER CAPITA INCOME
$68,705
AVG FAMILY INCOME
$53,053
AVG HOUSEHOLD INCOME
33.6%
WAGE / INCOME GAP [ % ]
66.4¢/ $1
WAGE / INCOME GAP [ $ ]
0.45
INEQUALITY / GINI INDEX
9,263
TOTAL POPULATION
4,636
MALE POPULATION
4,627
FEMALE POPULATION
100.19
MALES / 100 FEMALES
99.81
FEMALES / 100 MALES
47.9
MEDIAN AGE
3.0
AVG FAMILY SIZE
2.4
AVG HOUSEHOLD SIZE
4,063
LABOR FORCE [ PEOPLE ]
52.2%
PERCENT IN LABOR FORCE
4.8%
UNEMPLOYMENT RATE
Jones County Area Codes
Income in Jones County
Income Overview in Jones County
Per Capita Income in Jones County is $28,373, while median incomes of families and households are $68,705 and $53,053 respectively.
| Characteristic | Number | Measure |
| Per Capita Income | 9,263 | $28,373 |
| Median Family Income | 2,452 | $68,705 |
| Mean Family Income | 2,452 | $81,796 |
| Median Household Income | 3,815 | $53,053 |
| Mean Household Income | 3,815 | $66,122 |
| Income Deficit | 2,452 | $0 |
| Wage / Income Gap (%) | 9,263 | 33.57% |
| Wage / Income Gap ($) | 9,263 | 66.43¢ per $1 |
| Gini / Inequality Index | 9,263 | 0.45 |
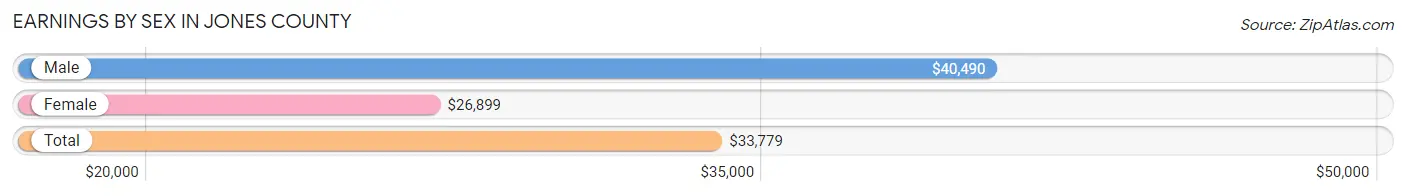
Earnings by Sex in Jones County
Average Earnings in Jones County are $33,779, $40,490 for men and $26,899 for women, a difference of 33.6%.
| Sex | Number | Average Earnings |
| Male | 2,199 (51.8%) | $40,490 |
| Female | 2,046 (48.2%) | $26,899 |
| Total | 4,245 (100.0%) | $33,779 |
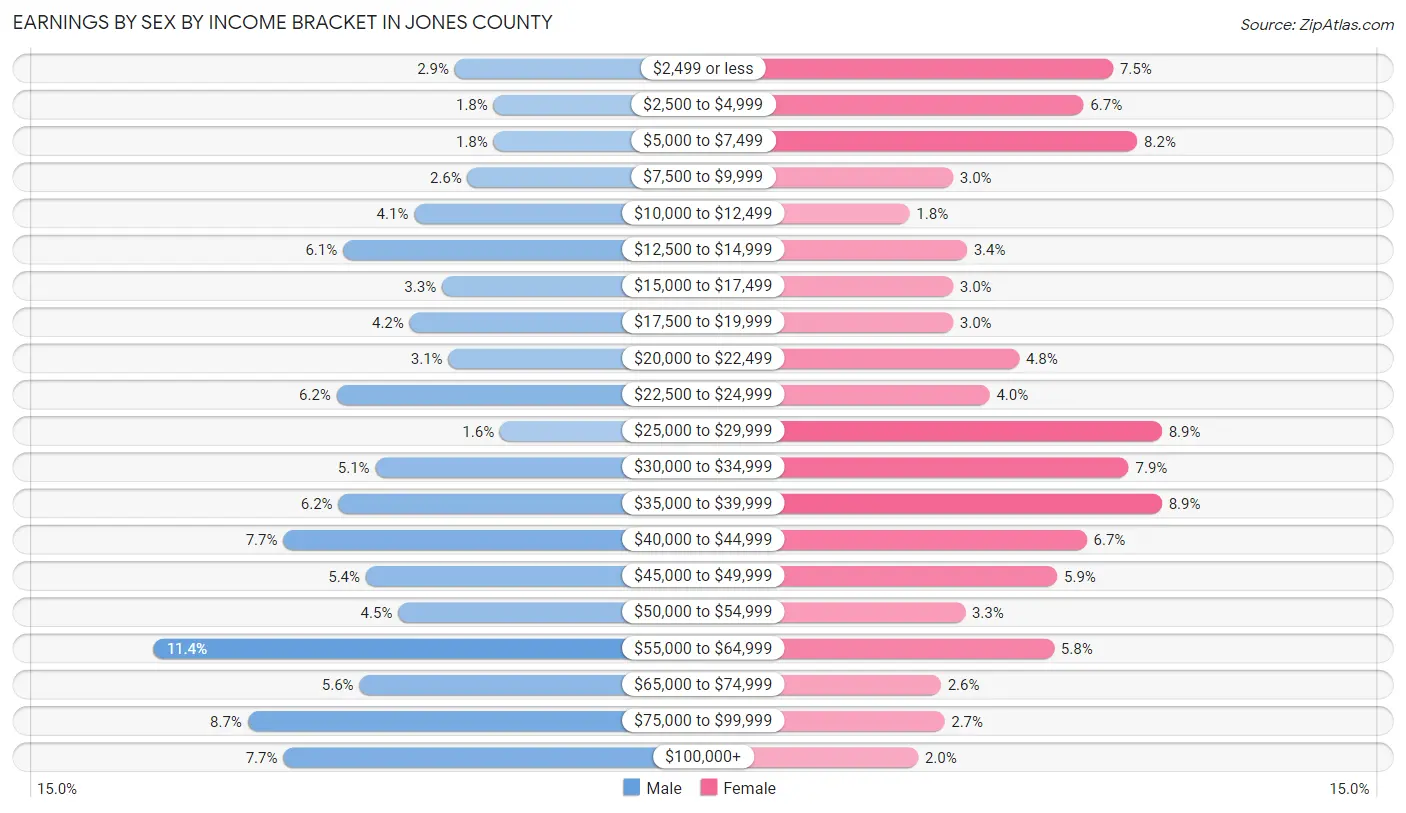
Earnings by Sex by Income Bracket in Jones County
The most common earnings brackets in Jones County are $55,000 to $64,999 for men (250 | 11.4%) and $25,000 to $29,999 for women (181 | 8.8%).
| Income | Male | Female |
| $2,499 or less | 64 (2.9%) | 153 (7.5%) |
| $2,500 to $4,999 | 40 (1.8%) | 136 (6.7%) |
| $5,000 to $7,499 | 40 (1.8%) | 167 (8.2%) |
| $7,500 to $9,999 | 56 (2.5%) | 61 (3.0%) |
| $10,000 to $12,499 | 89 (4.1%) | 36 (1.8%) |
| $12,500 to $14,999 | 133 (6.0%) | 69 (3.4%) |
| $15,000 to $17,499 | 72 (3.3%) | 61 (3.0%) |
| $17,500 to $19,999 | 92 (4.2%) | 61 (3.0%) |
| $20,000 to $22,499 | 68 (3.1%) | 99 (4.8%) |
| $22,500 to $24,999 | 137 (6.2%) | 82 (4.0%) |
| $25,000 to $29,999 | 36 (1.6%) | 181 (8.8%) |
| $30,000 to $34,999 | 113 (5.1%) | 162 (7.9%) |
| $35,000 to $39,999 | 136 (6.2%) | 181 (8.8%) |
| $40,000 to $44,999 | 170 (7.7%) | 138 (6.7%) |
| $45,000 to $49,999 | 119 (5.4%) | 121 (5.9%) |
| $50,000 to $54,999 | 99 (4.5%) | 68 (3.3%) |
| $55,000 to $64,999 | 250 (11.4%) | 119 (5.8%) |
| $65,000 to $74,999 | 123 (5.6%) | 54 (2.6%) |
| $75,000 to $99,999 | 192 (8.7%) | 56 (2.7%) |
| $100,000+ | 170 (7.7%) | 41 (2.0%) |
| Total | 2,199 (100.0%) | 2,046 (100.0%) |
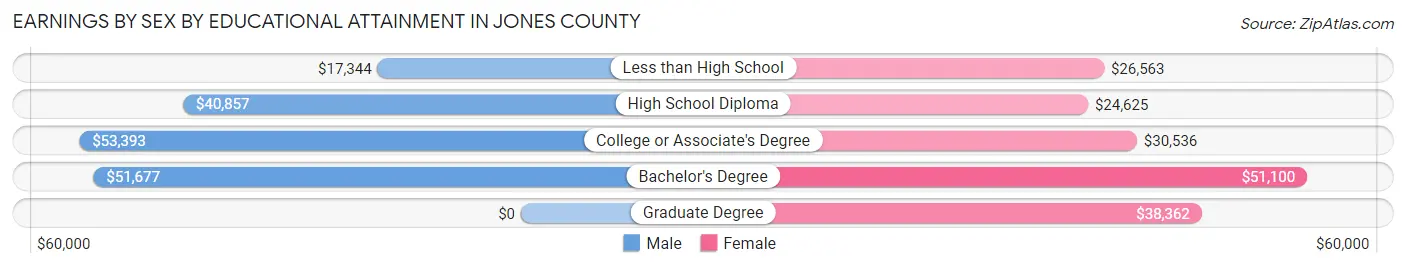
Earnings by Sex by Educational Attainment in Jones County
Average earnings in Jones County are $42,292 for men and $33,100 for women, a difference of 21.7%. Men with an educational attainment of college or associate's degree enjoy the highest average annual earnings of $53,393, while those with less than high school education earn the least with $17,344. Women with an educational attainment of bachelor's degree earn the most with the average annual earnings of $51,100, while those with high school diploma education have the smallest earnings of $24,625.
| Educational Attainment | Male Income | Female Income |
| Less than High School | $17,344 | $26,563 |
| High School Diploma | $40,857 | $24,625 |
| College or Associate's Degree | $53,393 | $30,536 |
| Bachelor's Degree | $51,677 | $51,100 |
| Graduate Degree | - | - |
| Total | $42,292 | $33,100 |
Family Income in Jones County
Family Income Brackets in Jones County
According to the Jones County family income data, there are 674 families falling into the $50,000 to $74,999 income range, which is the most common income bracket and makes up 27.5% of all families. Conversely, the less than $10,000 income bracket is the least frequent group with only 59 families (2.4%) belonging to this category.
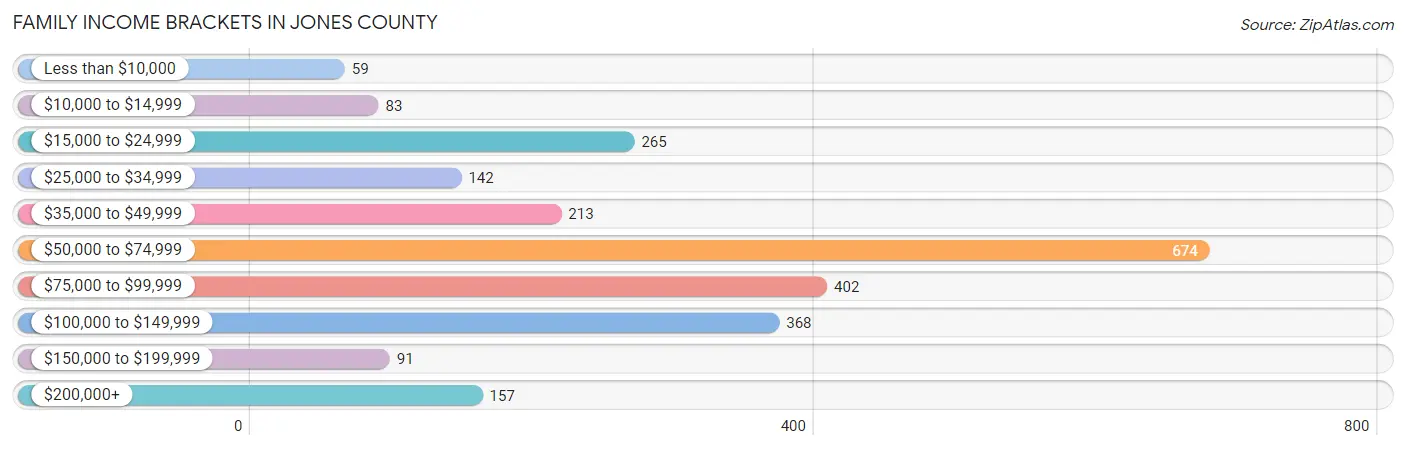
| Income Bracket | # Families | % Families |
| Less than $10,000 | 59 | 2.4% |
| $10,000 to $14,999 | 83 | 3.4% |
| $15,000 to $24,999 | 265 | 10.8% |
| $25,000 to $34,999 | 142 | 5.8% |
| $35,000 to $49,999 | 213 | 8.7% |
| $50,000 to $74,999 | 674 | 27.5% |
| $75,000 to $99,999 | 402 | 16.4% |
| $100,000 to $149,999 | 368 | 15.0% |
| $150,000 to $199,999 | 91 | 3.7% |
| $200,000+ | 157 | 6.4% |
Family Income by Famaliy Size in Jones County
5-person families (117 | 4.8%) account for the highest median family income in Jones County with $250,001 per family, while 5-person families (117 | 4.8%) have the highest median income of $50,000 per family member.
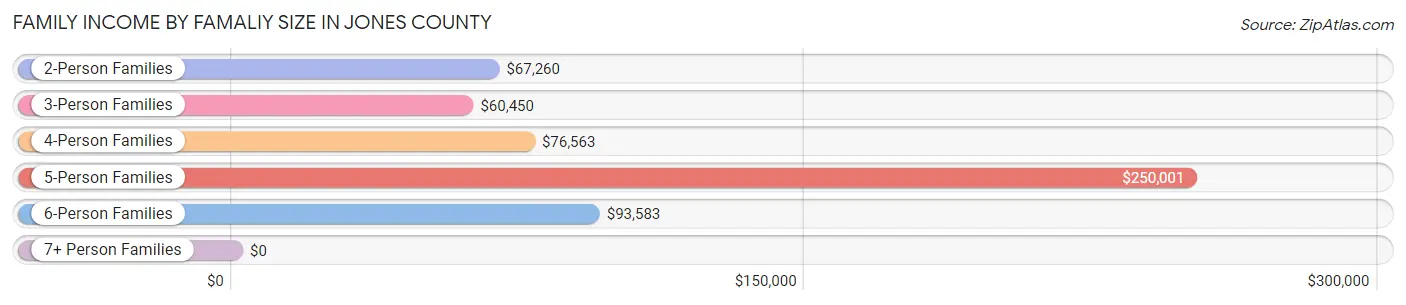
| Income Bracket | # Families | Median Income |
| 2-Person Families | 1,392 (56.8%) | $67,260 |
| 3-Person Families | 473 (19.3%) | $60,450 |
| 4-Person Families | 397 (16.2%) | $76,563 |
| 5-Person Families | 117 (4.8%) | $250,001 |
| 6-Person Families | 48 (2.0%) | $93,583 |
| 7+ Person Families | 25 (1.0%) | $0 |
| Total | 2,452 (100.0%) | $68,705 |
Family Income by Number of Earners in Jones County
The median family income in Jones County is $68,705, with families comprising 3+ earners (225) having the highest median family income of $94,125, while families with no earners (598) have the lowest median family income of $44,500, accounting for 9.2% and 24.4% of families, respectively.
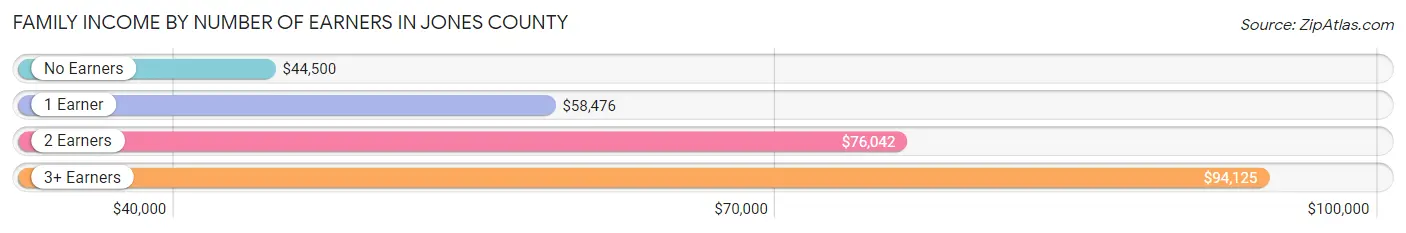
| Number of Earners | # Families | Median Income |
| No Earners | 598 (24.4%) | $44,500 |
| 1 Earner | 782 (31.9%) | $58,476 |
| 2 Earners | 847 (34.5%) | $76,042 |
| 3+ Earners | 225 (9.2%) | $94,125 |
| Total | 2,452 (100.0%) | $68,705 |
Household Income in Jones County
Household Income Brackets in Jones County
With 809 households falling in the category, the $50,000 to $74,999 income range is the most frequent in Jones County, accounting for 21.2% of all households. In contrast, only 95 households (2.5%) fall into the $150,000 to $199,999 income bracket, making it the least populous group.
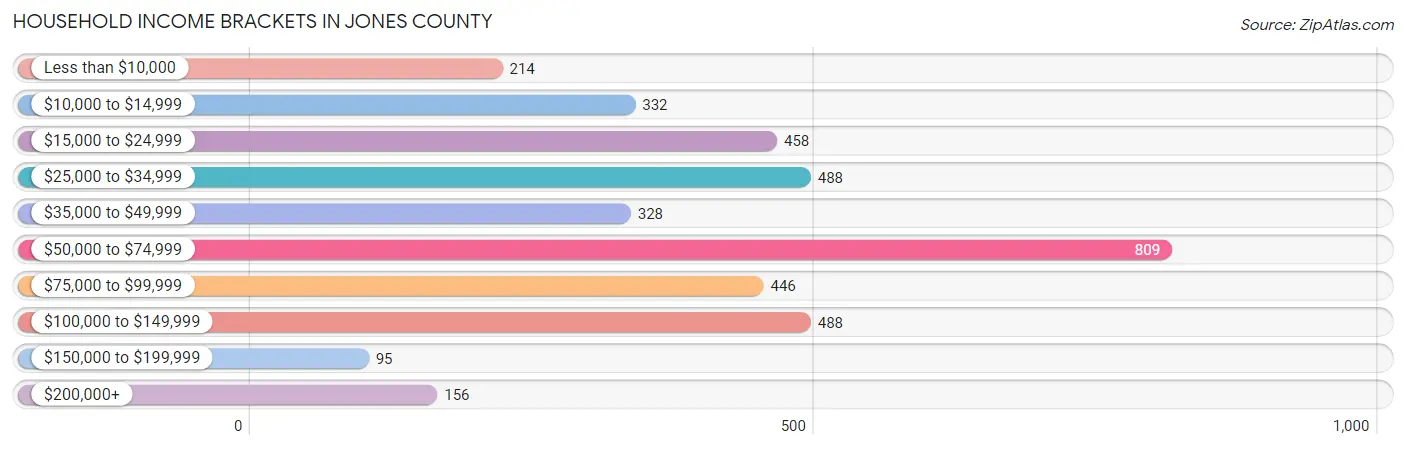
| Income Bracket | # Households | % Households |
| Less than $10,000 | 214 | 5.6% |
| $10,000 to $14,999 | 332 | 8.7% |
| $15,000 to $24,999 | 458 | 12.0% |
| $25,000 to $34,999 | 488 | 12.8% |
| $35,000 to $49,999 | 328 | 8.6% |
| $50,000 to $74,999 | 809 | 21.2% |
| $75,000 to $99,999 | 446 | 11.7% |
| $100,000 to $149,999 | 488 | 12.8% |
| $150,000 to $199,999 | 95 | 2.5% |
| $200,000+ | 156 | 4.1% |
Household Income by Householder Age in Jones County
The median household income in Jones County is $53,053, with the highest median household income of $58,696 found in the 25 to 44 years age bracket for the primary householder. A total of 782 households (20.5%) fall into this category. Meanwhile, the 15 to 24 years age bracket for the primary householder has the lowest median household income of $38,971, with 108 households (2.8%) in this group.
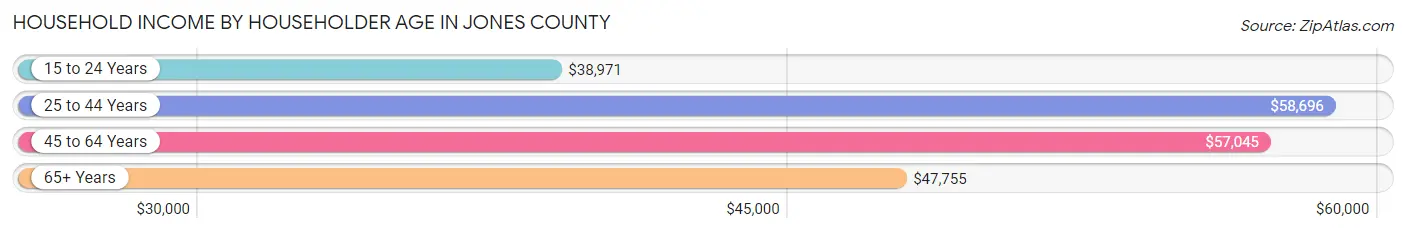
| Income Bracket | # Households | Median Income |
| 15 to 24 Years | 108 (2.8%) | $38,971 |
| 25 to 44 Years | 782 (20.5%) | $58,696 |
| 45 to 64 Years | 1,528 (40.1%) | $57,045 |
| 65+ Years | 1,397 (36.6%) | $47,755 |
| Total | 3,815 (100.0%) | $53,053 |
Poverty in Jones County
Income Below Poverty by Sex and Age in Jones County
With 17.5% poverty level for males and 17.9% for females among the residents of Jones County, 5 year old males and 16 and 17 year old females are the most vulnerable to poverty, with 21 males (52.5%) and 50 females (32.9%) in their respective age groups living below the poverty level.
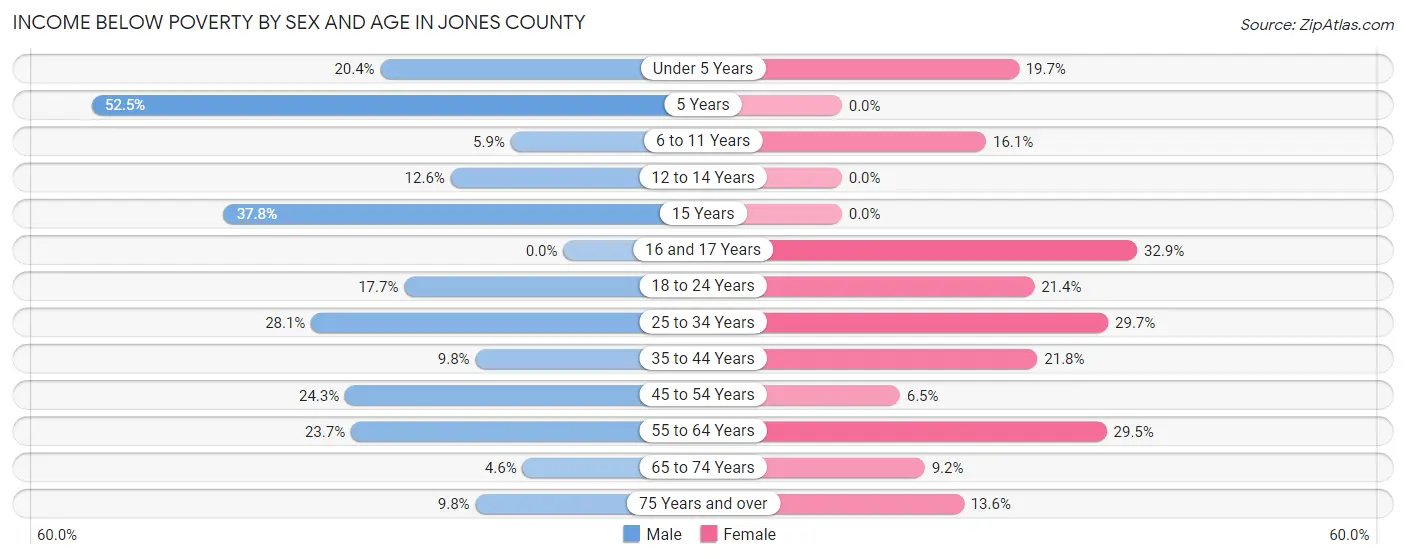
| Age Bracket | Male | Female |
| Under 5 Years | 44 (20.4%) | 39 (19.7%) |
| 5 Years | 21 (52.5%) | 0 (0.0%) |
| 6 to 11 Years | 15 (5.9%) | 27 (16.1%) |
| 12 to 14 Years | 31 (12.6%) | 0 (0.0%) |
| 15 Years | 45 (37.8%) | 0 (0.0%) |
| 16 and 17 Years | 0 (0.0%) | 50 (32.9%) |
| 18 to 24 Years | 59 (17.7%) | 78 (21.4%) |
| 25 to 34 Years | 162 (28.1%) | 113 (29.7%) |
| 35 to 44 Years | 42 (9.8%) | 105 (21.8%) |
| 45 to 54 Years | 149 (24.3%) | 41 (6.5%) |
| 55 to 64 Years | 175 (23.6%) | 238 (29.5%) |
| 65 to 74 Years | 28 (4.5%) | 61 (9.2%) |
| 75 Years and over | 33 (9.8%) | 66 (13.6%) |
| Total | 804 (17.5%) | 818 (17.9%) |
Income Above Poverty by Sex and Age in Jones County
According to the poverty statistics in Jones County, males aged 16 and 17 years and females aged 5 years are the age groups that are most secure financially, with 100.0% of males and 100.0% of females in these age groups living above the poverty line.
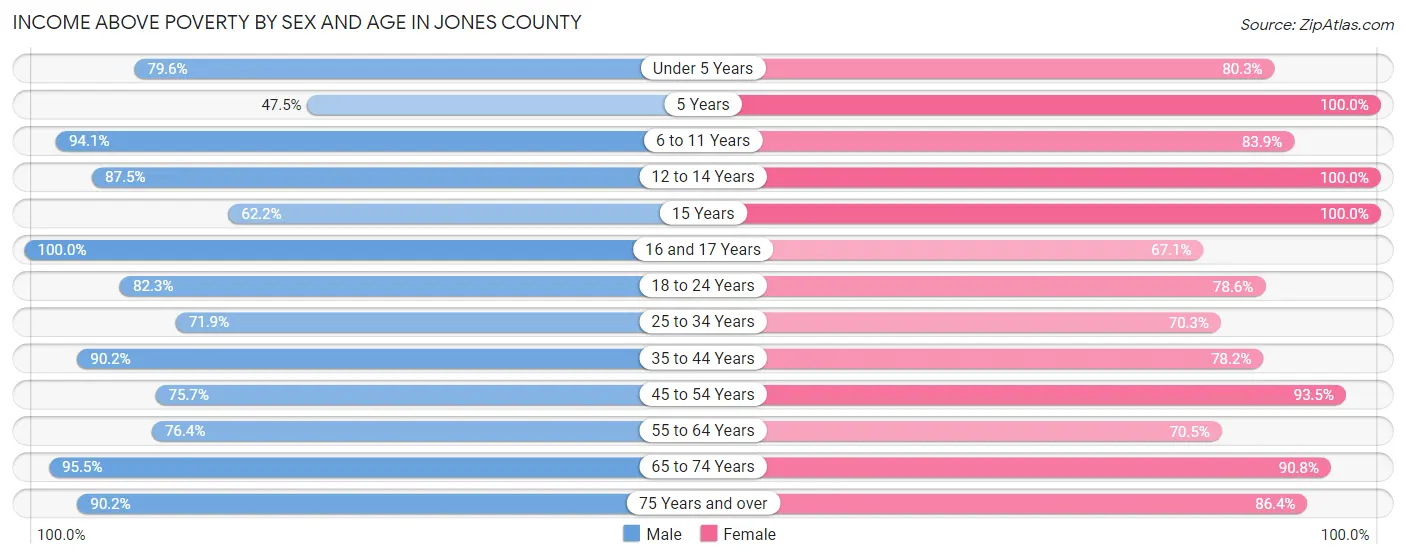
| Age Bracket | Male | Female |
| Under 5 Years | 172 (79.6%) | 159 (80.3%) |
| 5 Years | 19 (47.5%) | 39 (100.0%) |
| 6 to 11 Years | 241 (94.1%) | 141 (83.9%) |
| 12 to 14 Years | 216 (87.5%) | 150 (100.0%) |
| 15 Years | 74 (62.2%) | 38 (100.0%) |
| 16 and 17 Years | 76 (100.0%) | 102 (67.1%) |
| 18 to 24 Years | 274 (82.3%) | 286 (78.6%) |
| 25 to 34 Years | 415 (71.9%) | 268 (70.3%) |
| 35 to 44 Years | 387 (90.2%) | 377 (78.2%) |
| 45 to 54 Years | 464 (75.7%) | 594 (93.5%) |
| 55 to 64 Years | 565 (76.3%) | 569 (70.5%) |
| 65 to 74 Years | 587 (95.5%) | 599 (90.8%) |
| 75 Years and over | 304 (90.2%) | 420 (86.4%) |
| Total | 3,794 (82.5%) | 3,742 (82.1%) |
Income Below Poverty Among Married-Couple Families in Jones County
The poverty statistics for married-couple families in Jones County show that 7.9% or 138 of the total 1,759 families live below the poverty line. Families with 3 or 4 children have the highest poverty rate of 17.6%, comprising of 12 families. On the other hand, families with no children have the lowest poverty rate of 5.5%, which includes 62 families.
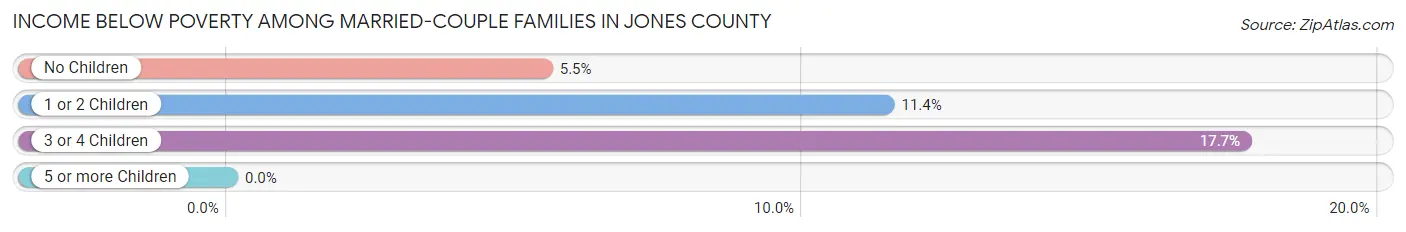
| Children | Above Poverty | Below Poverty |
| No Children | 1,069 (94.5%) | 62 (5.5%) |
| 1 or 2 Children | 496 (88.6%) | 64 (11.4%) |
| 3 or 4 Children | 56 (82.4%) | 12 (17.6%) |
| 5 or more Children | 0 (0.0%) | 0 (0.0%) |
| Total | 1,621 (92.1%) | 138 (7.9%) |
Income Below Poverty Among Single-Parent Households in Jones County
According to the poverty data in Jones County, 32.7% or 53 single-father households and 30.3% or 161 single-mother households are living below the poverty line. Among single-father households, those with no children have the highest poverty rate, with 40 households (33.3%) experiencing poverty. Likewise, among single-mother households, those with 1 or 2 children have the highest poverty rate, with 101 households (43.5%) falling below the poverty line.
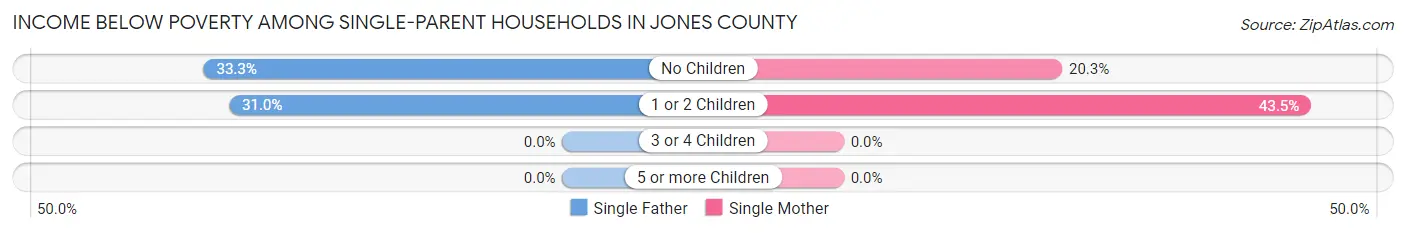
| Children | Single Father | Single Mother |
| No Children | 40 (33.3%) | 60 (20.3%) |
| 1 or 2 Children | 13 (30.9%) | 101 (43.5%) |
| 3 or 4 Children | 0 (0.0%) | 0 (0.0%) |
| 5 or more Children | 0 (0.0%) | 0 (0.0%) |
| Total | 53 (32.7%) | 161 (30.3%) |
Income Below Poverty Among Married-Couple vs Single-Parent Households in Jones County
The poverty data for Jones County shows that 138 of the married-couple family households (7.9%) and 214 of the single-parent households (30.9%) are living below the poverty level. Within the married-couple family households, those with 3 or 4 children have the highest poverty rate, with 12 households (17.6%) falling below the poverty line. Among the single-parent households, those with 1 or 2 children have the highest poverty rate, with 114 household (41.6%) living below poverty.
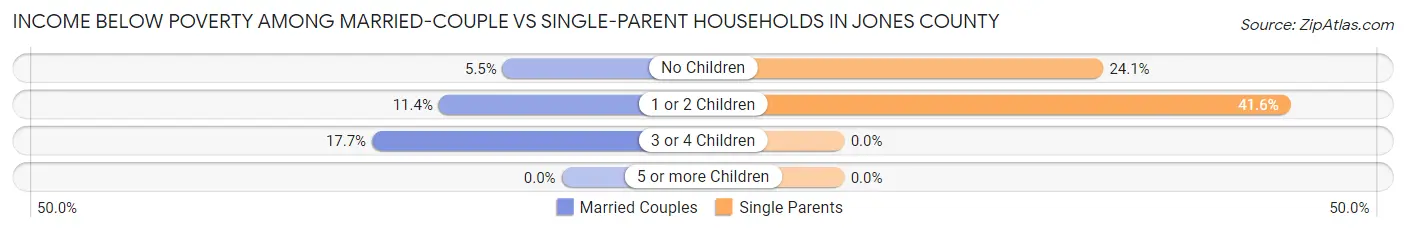
| Children | Married-Couple Families | Single-Parent Households |
| No Children | 62 (5.5%) | 100 (24.1%) |
| 1 or 2 Children | 64 (11.4%) | 114 (41.6%) |
| 3 or 4 Children | 12 (17.6%) | 0 (0.0%) |
| 5 or more Children | 0 (0.0%) | 0 (0.0%) |
| Total | 138 (7.9%) | 214 (30.9%) |
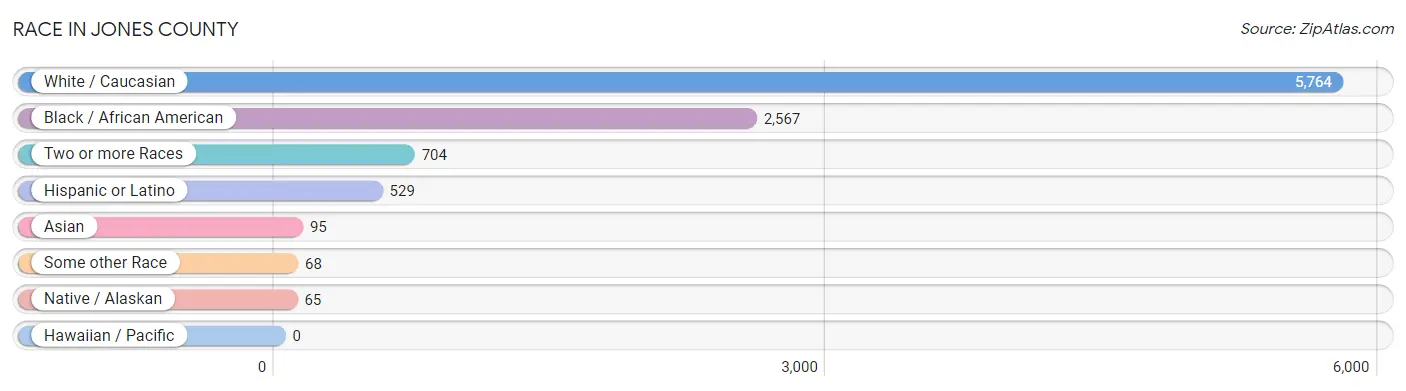
Race in Jones County
The most populous races in Jones County are White / Caucasian (5,764 | 62.2%), Black / African American (2,567 | 27.7%), and Two or more Races (704 | 7.6%).
| Race | # Population | % Population |
| Asian | 95 | 1.0% |
| Black / African American | 2,567 | 27.7% |
| Hawaiian / Pacific | 0 | 0.0% |
| Hispanic or Latino | 529 | 5.7% |
| Native / Alaskan | 65 | 0.7% |
| White / Caucasian | 5,764 | 62.2% |
| Two or more Races | 704 | 7.6% |
| Some other Race | 68 | 0.7% |
| Total | 9,263 | 100.0% |
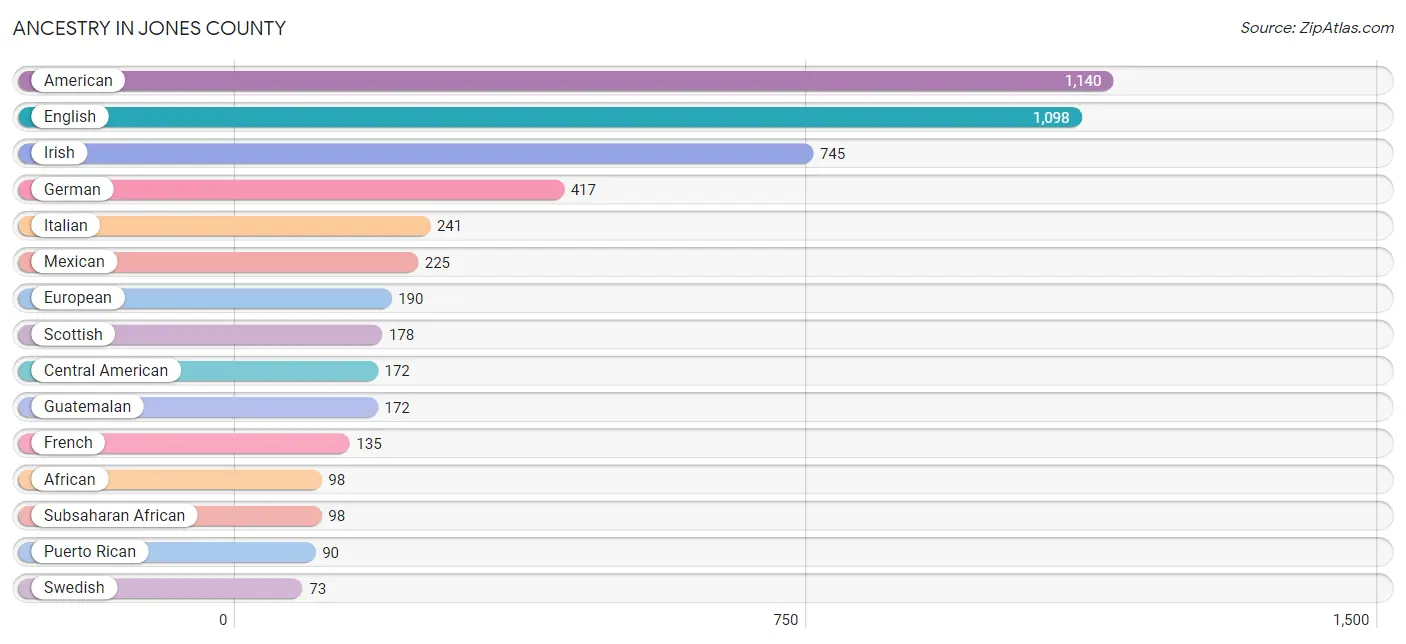
Ancestry in Jones County
The most populous ancestries reported in Jones County are American (1,140 | 12.3%), English (1,098 | 11.8%), Irish (745 | 8.0%), German (417 | 4.5%), and Italian (241 | 2.6%), together accounting for 39.3% of all Jones County residents.
| Ancestry | # Population | % Population |
| African | 98 | 1.1% |
| American | 1,140 | 12.3% |
| British | 14 | 0.2% |
| Central American | 172 | 1.9% |
| Cherokee | 27 | 0.3% |
| Chinese | 1 | 0.0% |
| Colombian | 11 | 0.1% |
| Cuban | 30 | 0.3% |
| Czech | 13 | 0.1% |
| Czechoslovakian | 7 | 0.1% |
| Dutch | 55 | 0.6% |
| Eastern European | 15 | 0.2% |
| English | 1,098 | 11.8% |
| European | 190 | 2.1% |
| Finnish | 34 | 0.4% |
| French | 135 | 1.5% |
| French Canadian | 21 | 0.2% |
| German | 417 | 4.5% |
| Guatemalan | 172 | 1.9% |
| Hungarian | 7 | 0.1% |
| Inupiat | 20 | 0.2% |
| Irish | 745 | 8.0% |
| Italian | 241 | 2.6% |
| Jamaican | 1 | 0.0% |
| Korean | 8 | 0.1% |
| Lumbee | 59 | 0.6% |
| Malaysian | 4 | 0.0% |
| Mexican | 225 | 2.4% |
| Norwegian | 33 | 0.4% |
| Polish | 49 | 0.5% |
| Portuguese | 15 | 0.2% |
| Puerto Rican | 90 | 1.0% |
| Romanian | 37 | 0.4% |
| Russian | 7 | 0.1% |
| Scandinavian | 20 | 0.2% |
| Scotch-Irish | 7 | 0.1% |
| Scottish | 178 | 1.9% |
| Slavic | 2 | 0.0% |
| South American | 11 | 0.1% |
| Subsaharan African | 98 | 1.1% |
| Swedish | 73 | 0.8% |
| Swiss | 4 | 0.0% |
| Thai | 54 | 0.6% |
| Ukrainian | 38 | 0.4% |
| Welsh | 36 | 0.4% | View All 45 Rows |
Immigrants in Jones County
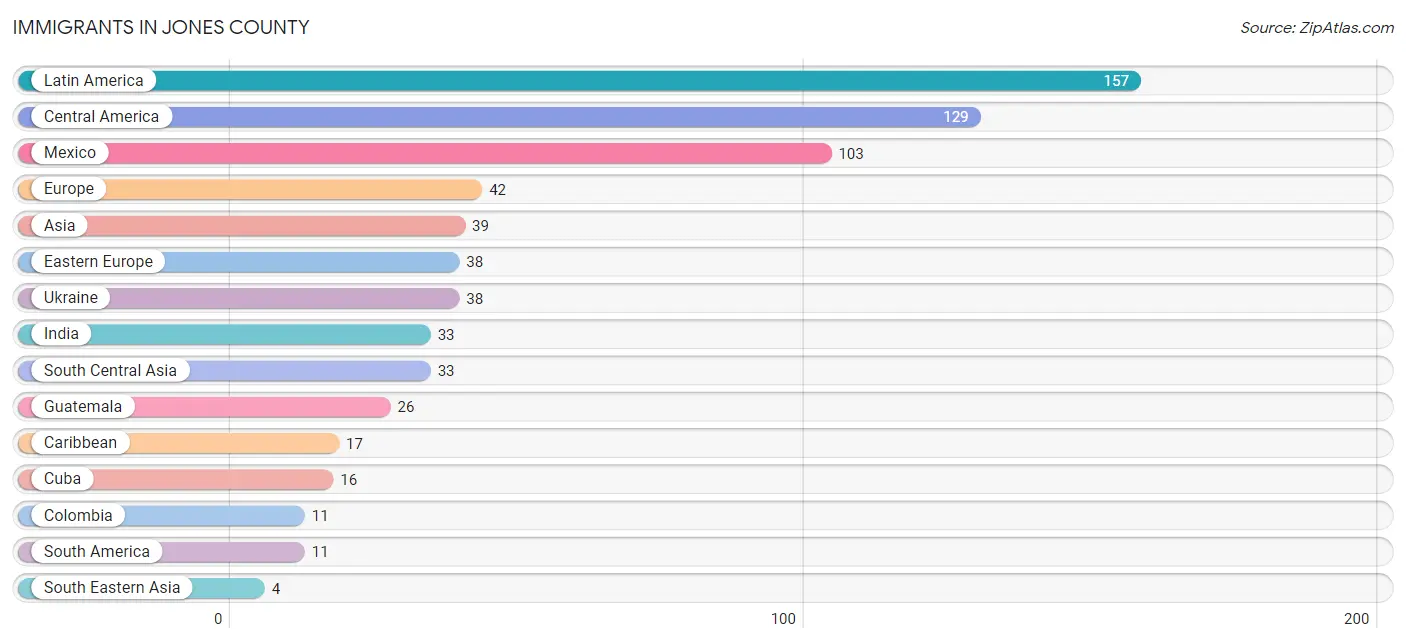
The most numerous immigrant groups reported in Jones County came from Latin America (157 | 1.7%), Central America (129 | 1.4%), Mexico (103 | 1.1%), Europe (42 | 0.4%), and Asia (39 | 0.4%), together accounting for 5.1% of all Jones County residents.
| Immigration Origin | # Population | % Population |
| Asia | 39 | 0.4% |
| Caribbean | 17 | 0.2% |
| Central America | 129 | 1.4% |
| Colombia | 11 | 0.1% |
| Cuba | 16 | 0.2% |
| Eastern Europe | 38 | 0.4% |
| Europe | 42 | 0.4% |
| Guatemala | 26 | 0.3% |
| India | 33 | 0.4% |
| Jamaica | 1 | 0.0% |
| Latin America | 157 | 1.7% |
| Mexico | 103 | 1.1% |
| South America | 11 | 0.1% |
| South Central Asia | 33 | 0.4% |
| South Eastern Asia | 4 | 0.0% |
| Switzerland | 4 | 0.0% |
| Ukraine | 38 | 0.4% |
| Vietnam | 4 | 0.0% |
| Western Asia | 2 | 0.0% |
| Western Europe | 4 | 0.0% | View All 20 Rows |
Sex and Age in Jones County
Sex and Age in Jones County
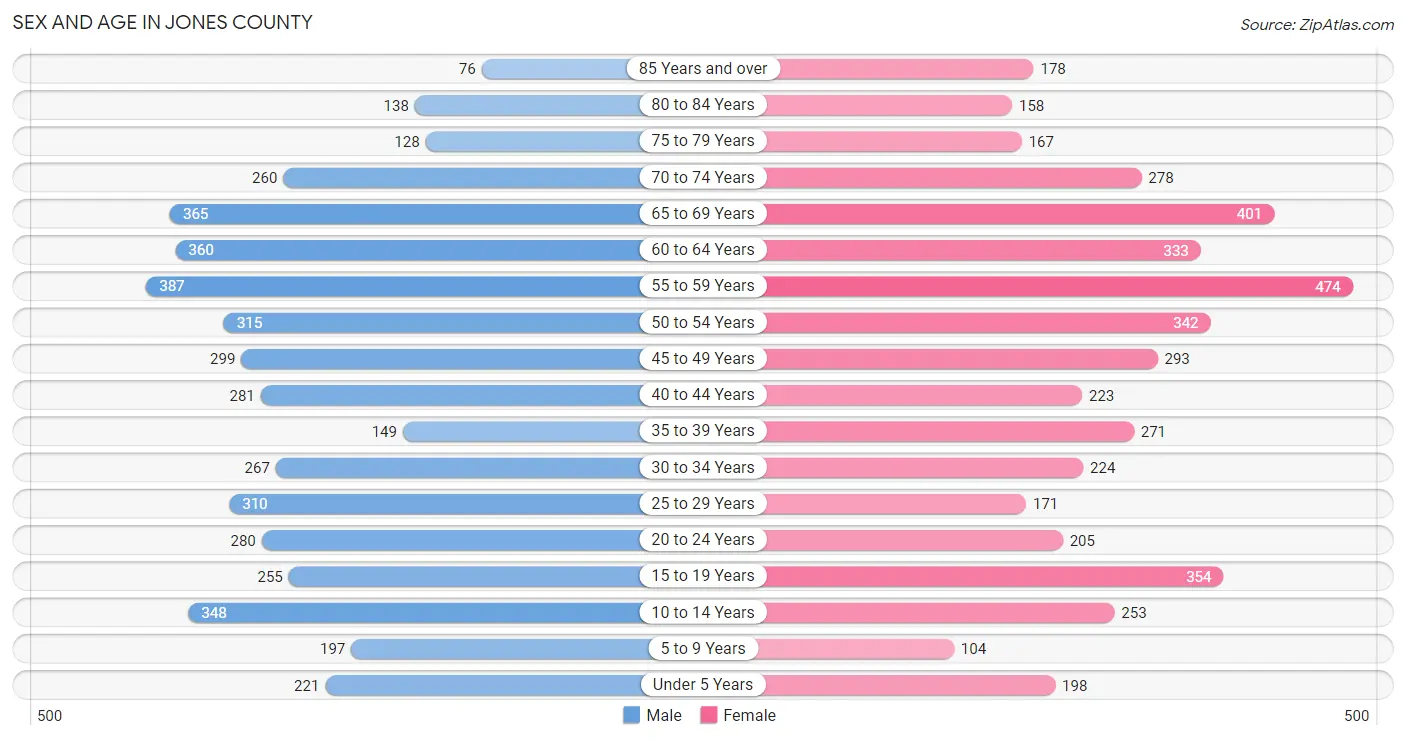
The most populous age groups in Jones County are 55 to 59 Years (387 | 8.4%) for men and 55 to 59 Years (474 | 10.2%) for women.
| Age Bracket | Male | Female |
| Under 5 Years | 221 (4.8%) | 198 (4.3%) |
| 5 to 9 Years | 197 (4.3%) | 104 (2.2%) |
| 10 to 14 Years | 348 (7.5%) | 253 (5.5%) |
| 15 to 19 Years | 255 (5.5%) | 354 (7.6%) |
| 20 to 24 Years | 280 (6.0%) | 205 (4.4%) |
| 25 to 29 Years | 310 (6.7%) | 171 (3.7%) |
| 30 to 34 Years | 267 (5.8%) | 224 (4.8%) |
| 35 to 39 Years | 149 (3.2%) | 271 (5.9%) |
| 40 to 44 Years | 281 (6.1%) | 223 (4.8%) |
| 45 to 49 Years | 299 (6.5%) | 293 (6.3%) |
| 50 to 54 Years | 315 (6.8%) | 342 (7.4%) |
| 55 to 59 Years | 387 (8.4%) | 474 (10.2%) |
| 60 to 64 Years | 360 (7.8%) | 333 (7.2%) |
| 65 to 69 Years | 365 (7.9%) | 401 (8.7%) |
| 70 to 74 Years | 260 (5.6%) | 278 (6.0%) |
| 75 to 79 Years | 128 (2.8%) | 167 (3.6%) |
| 80 to 84 Years | 138 (3.0%) | 158 (3.4%) |
| 85 Years and over | 76 (1.6%) | 178 (3.8%) |
| Total | 4,636 (100.0%) | 4,627 (100.0%) |
Families and Households in Jones County
Median Family Size in Jones County
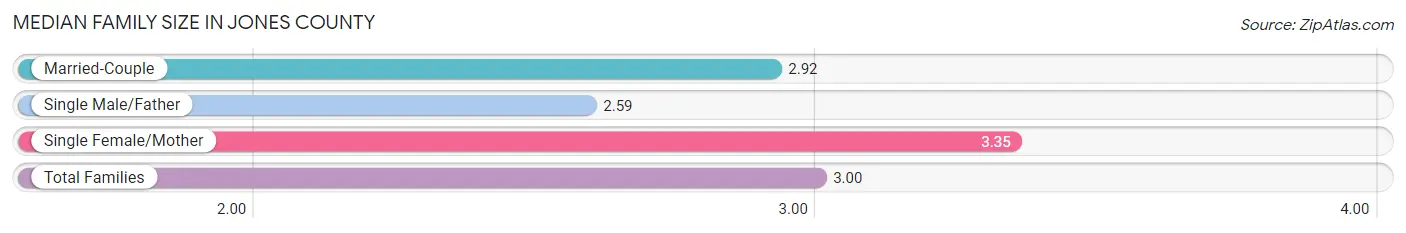
The median family size in Jones County is 3.00 persons per family, with single female/mother families (531 | 21.7%) accounting for the largest median family size of 3.35 persons per family. On the other hand, single male/father families (162 | 6.6%) represent the smallest median family size with 2.59 persons per family.
| Family Type | # Families | Family Size |
| Married-Couple | 1,759 (71.7%) | 2.92 |
| Single Male/Father | 162 (6.6%) | 2.59 |
| Single Female/Mother | 531 (21.7%) | 3.35 |
| Total Families | 2,452 (100.0%) | 3.00 |
Median Household Size in Jones County
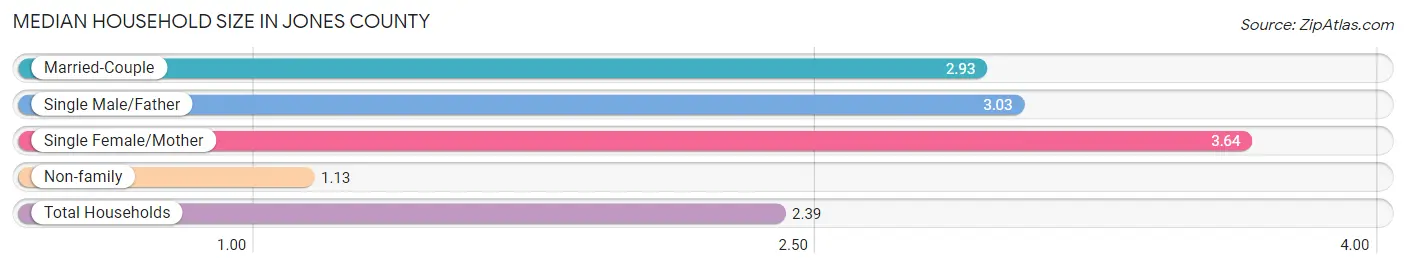
The median household size in Jones County is 2.39 persons per household, with single female/mother households (531 | 13.9%) accounting for the largest median household size of 3.64 persons per household. non-family households (1,363 | 35.7%) represent the smallest median household size with 1.13 persons per household.
| Household Type | # Households | Household Size |
| Married-Couple | 1,759 (46.1%) | 2.93 |
| Single Male/Father | 162 (4.3%) | 3.03 |
| Single Female/Mother | 531 (13.9%) | 3.64 |
| Non-family | 1,363 (35.7%) | 1.13 |
| Total Households | 3,815 (100.0%) | 2.39 |
Household Size by Marriage Status in Jones County
Out of a total of 3,815 households in Jones County, 2,452 (64.3%) are family households, while 1,363 (35.7%) are nonfamily households. The most numerous type of family households are 2-person households, comprising 1,341, and the most common type of nonfamily households are 1-person households, comprising 1,203.
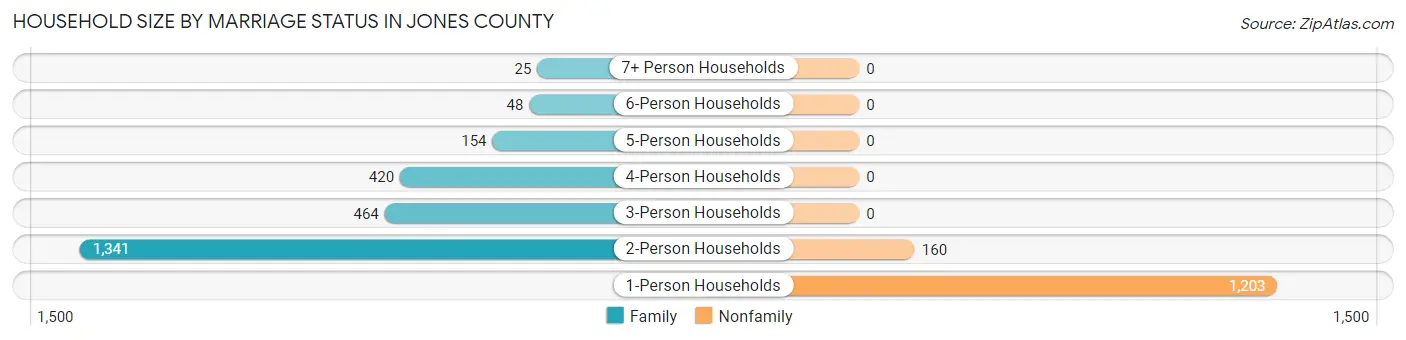
| Household Size | Family Households | Nonfamily Households |
| 1-Person Households | - | 1,203 (31.5%) |
| 2-Person Households | 1,341 (35.1%) | 160 (4.2%) |
| 3-Person Households | 464 (12.2%) | 0 (0.0%) |
| 4-Person Households | 420 (11.0%) | 0 (0.0%) |
| 5-Person Households | 154 (4.0%) | 0 (0.0%) |
| 6-Person Households | 48 (1.3%) | 0 (0.0%) |
| 7+ Person Households | 25 (0.7%) | 0 (0.0%) |
| Total | 2,452 (64.3%) | 1,363 (35.7%) |
Female Fertility in Jones County
Fertility by Age in Jones County
Average fertility rate in Jones County is 44.0 births per 1,000 women. Women in the age bracket of 20 to 34 years have the highest fertility rate with 128.0 births per 1,000 women. Women in the age bracket of 20 to 34 years acount for 100.0% of all women with births.
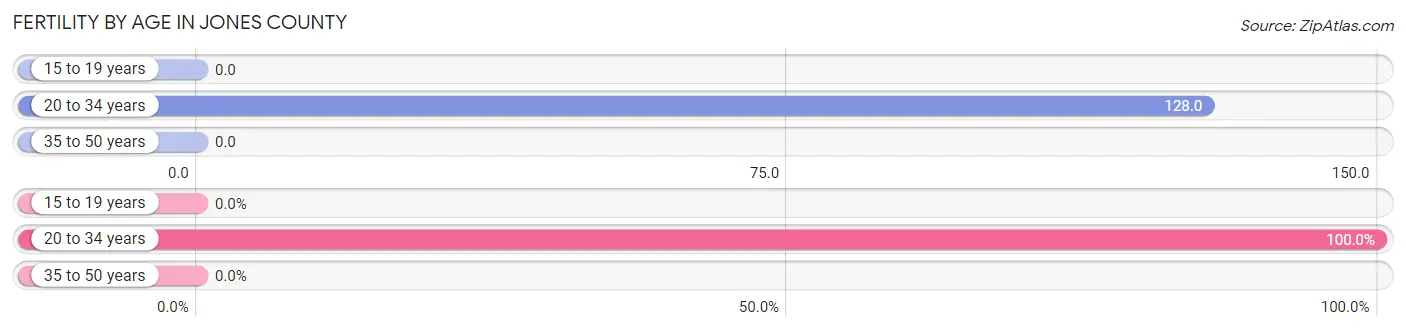
| Age Bracket | Women with Births | Births / 1,000 Women |
| 15 to 19 years | 0 (0.0%) | 0.0 |
| 20 to 34 years | 77 (100.0%) | 128.0 |
| 35 to 50 years | 0 (0.0%) | 0.0 |
| Total | 77 (100.0%) | 44.0 |
Fertility by Age by Marriage Status in Jones County
46.8% of women with births (77) in Jones County are married. The highest percentage of unmarried women with births falls into 20 to 34 years age bracket with 53.2% of them unmarried at the time of birth, while the lowest percentage of unmarried women with births belong to 20 to 34 years age bracket with 53.2% of them unmarried.
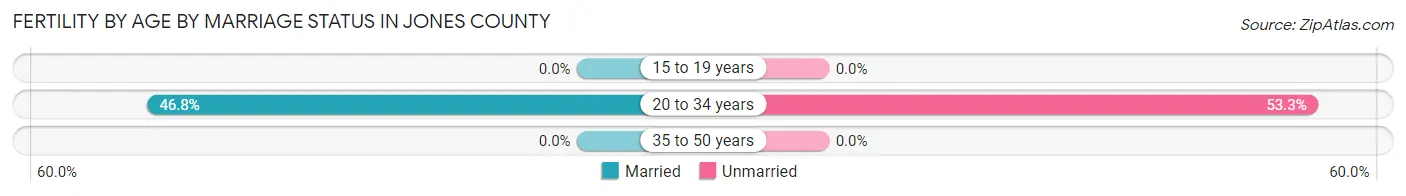
| Age Bracket | Married | Unmarried |
| 15 to 19 years | 0 (0.0%) | 0 (0.0%) |
| 20 to 34 years | 36 (46.8%) | 41 (53.2%) |
| 35 to 50 years | 0 (0.0%) | 0 (0.0%) |
| Total | 36 (46.8%) | 41 (53.2%) |
Fertility by Education in Jones County
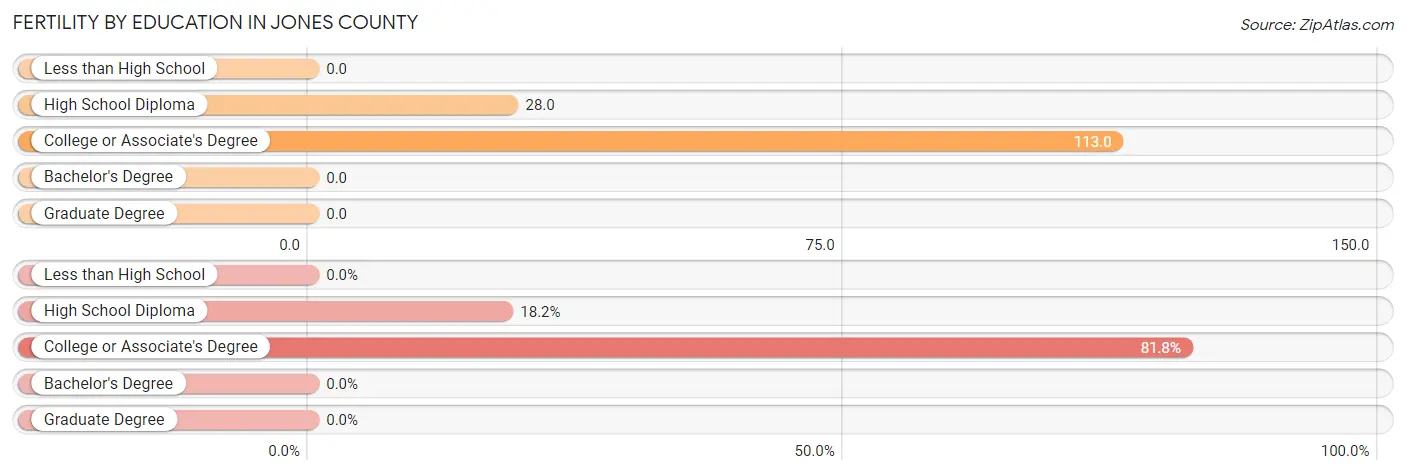
| Educational Attainment | Women with Births | Births / 1,000 Women |
| Less than High School | 0 (0.0%) | 0.0 |
| High School Diploma | 14 (18.2%) | 28.0 |
| College or Associate's Degree | 63 (81.8%) | 113.0 |
| Bachelor's Degree | 0 (0.0%) | 0.0 |
| Graduate Degree | 0 (0.0%) | 0.0 |
| Total | 77 (100.0%) | 44.0 |
Fertility by Education by Marriage Status in Jones County
53.2% of women with births in Jones County are unmarried. Women with the educational attainment of college or associate's degree are most likely to be married with 57.1% of them married at childbirth, while women with the educational attainment of high school diploma are least likely to be married with 100.0% of them unmarried at childbirth.
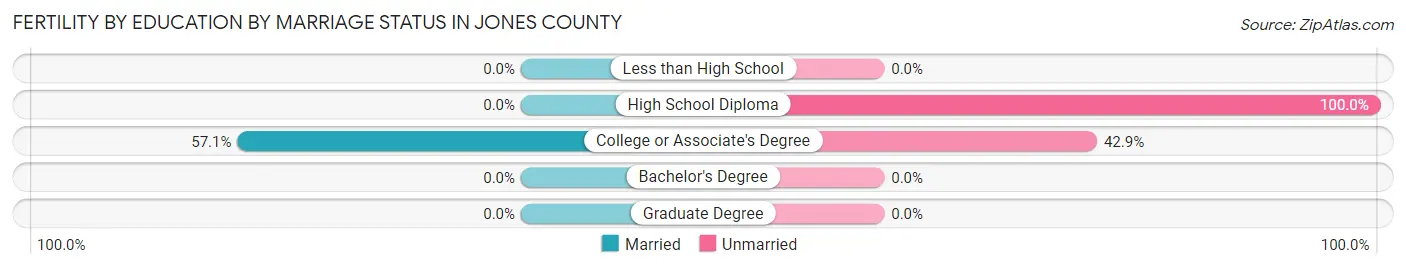
| Educational Attainment | Married | Unmarried |
| Less than High School | 0 (0.0%) | 0 (0.0%) |
| High School Diploma | 0 (0.0%) | 14 (100.0%) |
| College or Associate's Degree | 36 (57.1%) | 27 (42.9%) |
| Bachelor's Degree | 0 (0.0%) | 0 (0.0%) |
| Graduate Degree | 0 (0.0%) | 0 (0.0%) |
| Total | 36 (46.8%) | 41 (53.2%) |
Employment Characteristics in Jones County
Employment by Class of Employer in Jones County
Among the 3,815 employed individuals in Jones County, private company employees (2,412 | 63.2%), local government employees (353 | 9.2%), and self-employed (not incorporated) (243 | 6.4%) make up the most common classes of employment.
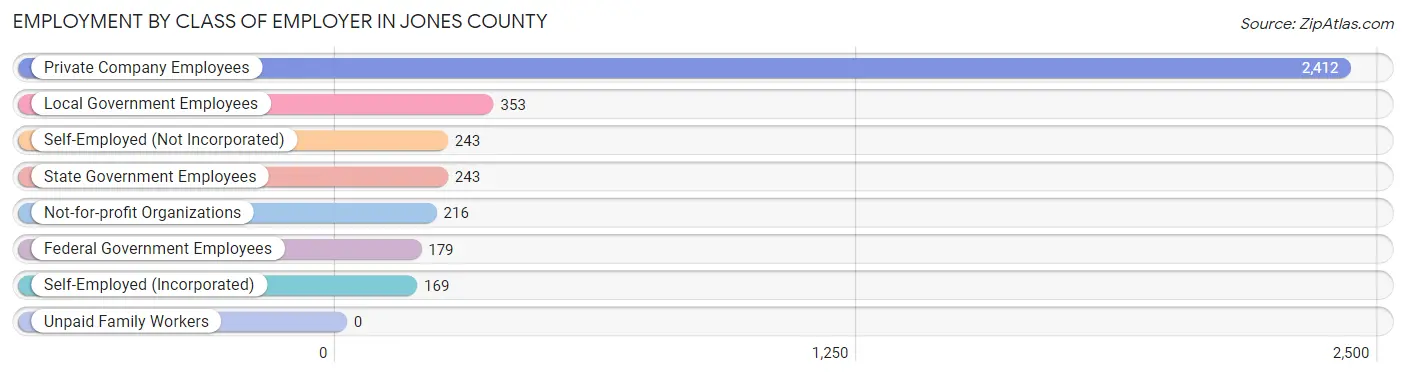
| Employer Class | # Employees | % Employees |
| Private Company Employees | 2,412 | 63.2% |
| Self-Employed (Incorporated) | 169 | 4.4% |
| Self-Employed (Not Incorporated) | 243 | 6.4% |
| Not-for-profit Organizations | 216 | 5.7% |
| Local Government Employees | 353 | 9.2% |
| State Government Employees | 243 | 6.4% |
| Federal Government Employees | 179 | 4.7% |
| Unpaid Family Workers | 0 | 0.0% |
| Total | 3,815 | 100.0% |
Employment Status by Age in Jones County
According to the labor force statistics for Jones County, out of the total population over 16 years of age (7,784), 52.2% or 4,063 individuals are in the labor force, with 4.8% or 195 of them unemployed. The age group with the highest labor force participation rate is 45 to 54 years, with 80.7% or 1,008 individuals in the labor force. Within the labor force, the 45 to 54 years age range has the highest percentage of unemployed individuals, with 11.2% or 113 of them being unemployed.
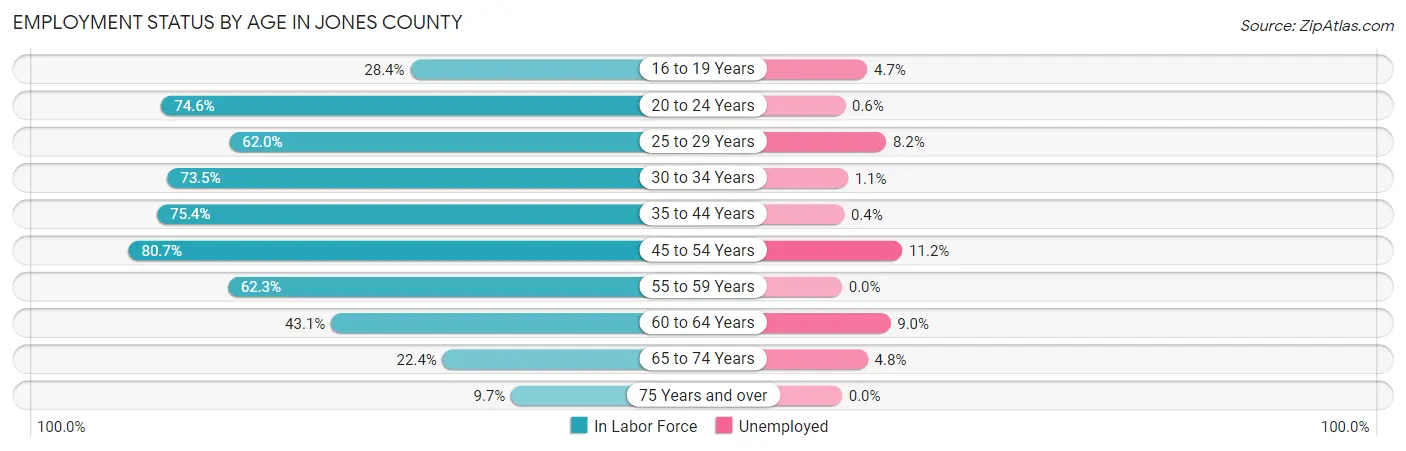
| Age Bracket | In Labor Force | Unemployed |
| 16 to 19 Years | 128 (28.4%) | 6 (4.7%) |
| 20 to 24 Years | 362 (74.6%) | 2 (0.6%) |
| 25 to 29 Years | 298 (62.0%) | 24 (8.2%) |
| 30 to 34 Years | 361 (73.5%) | 4 (1.1%) |
| 35 to 44 Years | 697 (75.4%) | 3 (0.4%) |
| 45 to 54 Years | 1,008 (80.7%) | 113 (11.2%) |
| 55 to 59 Years | 536 (62.3%) | 0 (0.0%) |
| 60 to 64 Years | 299 (43.1%) | 27 (9.0%) |
| 65 to 74 Years | 292 (22.4%) | 14 (4.8%) |
| 75 Years and over | 82 (9.7%) | 0 (0.0%) |
| Total | 4,063 (52.2%) | 195 (4.8%) |
Employment Status by Educational Attainment in Jones County
According to labor force statistics for Jones County, 68.1% of individuals (3,200) out of the total population between 25 and 64 years of age (4,699) are in the labor force, with 5.4% or 173 of them being unemployed. The group with the highest labor force participation rate are those with the educational attainment of bachelor's degree or higher, with 78.9% or 599 individuals in the labor force. Within the labor force, individuals with bachelor's degree or higher education have the highest percentage of unemployment, with 7.4% or 44 of them being unemployed.
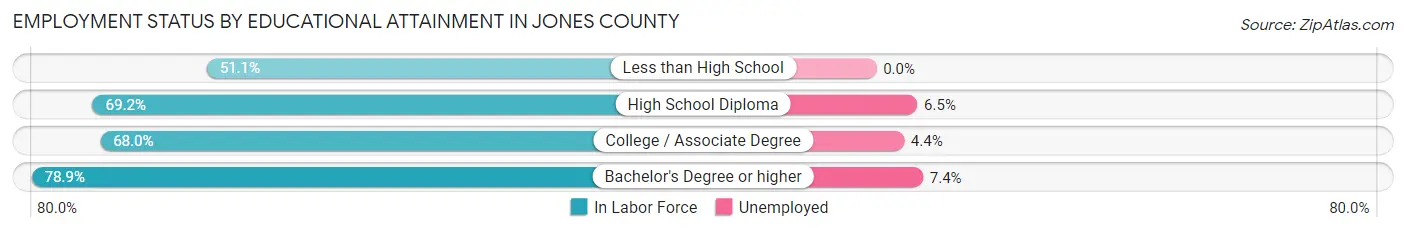
| Educational Attainment | In Labor Force | Unemployed |
| Less than High School | 303 (51.1%) | 0 (0.0%) |
| High School Diploma | 1,226 (69.2%) | 115 (6.5%) |
| College / Associate Degree | 1,071 (68.0%) | 69 (4.4%) |
| Bachelor's Degree or higher | 599 (78.9%) | 56 (7.4%) |
| Total | 3,200 (68.1%) | 254 (5.4%) |
Employment Occupations by Sex in Jones County
Management, Business, Science and Arts Occupations
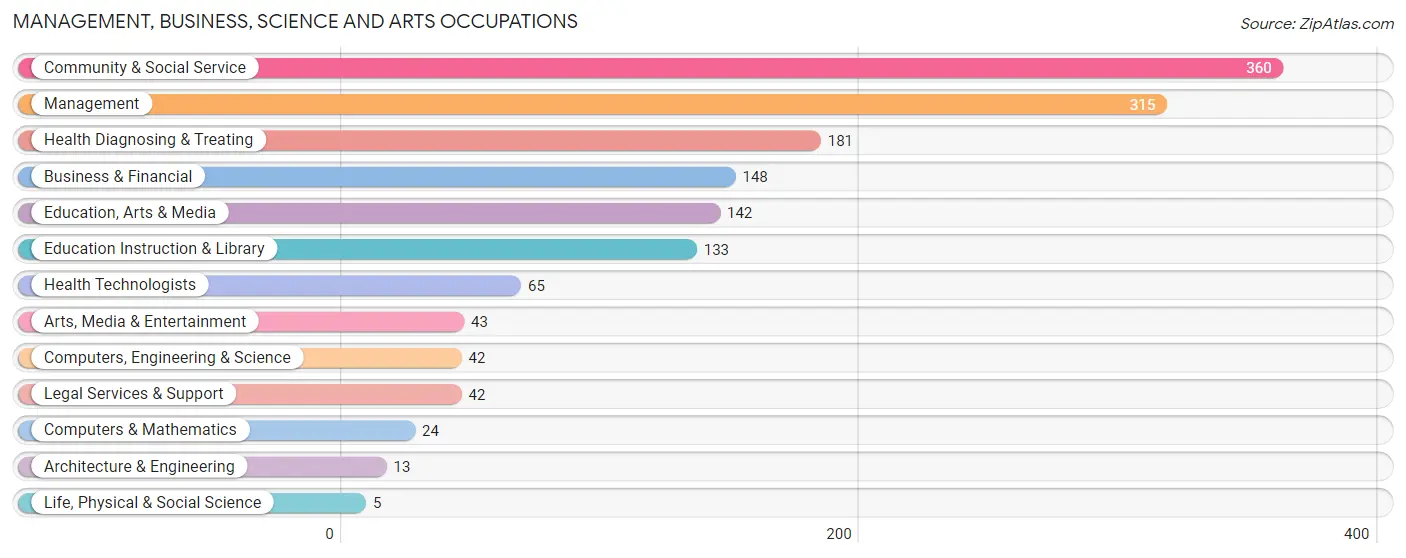
The most common Management, Business, Science and Arts occupations in Jones County are Community & Social Service (360 | 9.3%), Management (315 | 8.2%), Health Diagnosing & Treating (181 | 4.7%), Business & Financial (148 | 3.8%), and Education, Arts & Media (142 | 3.7%).
Management, Business, Science and Arts Occupations by Sex
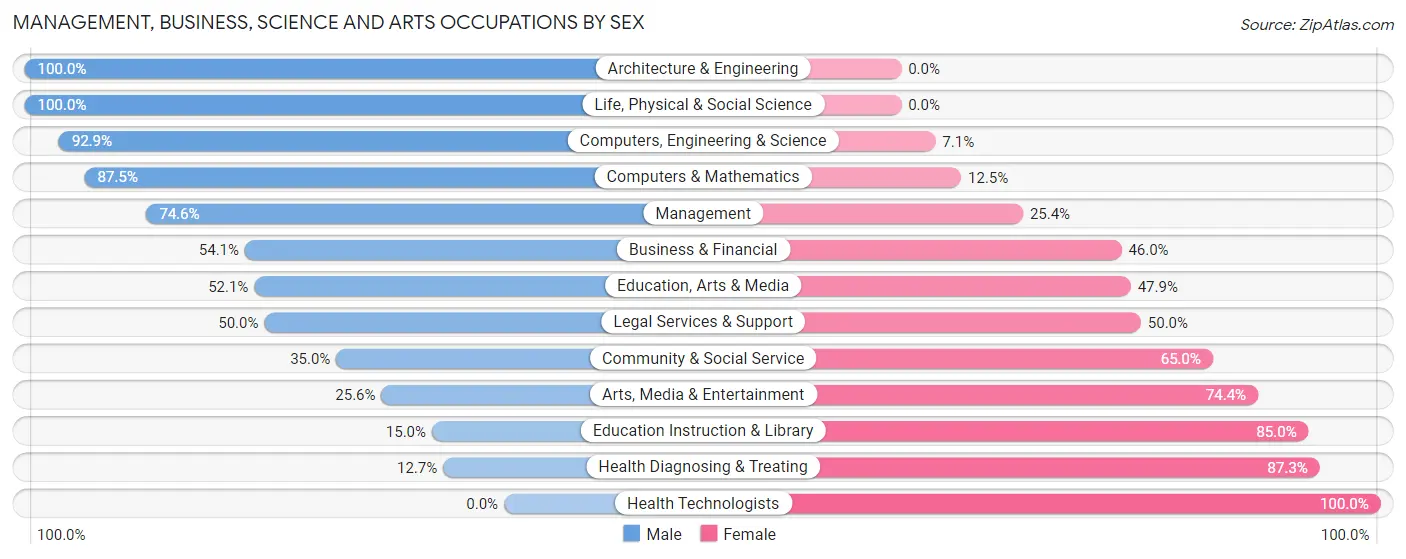
Within the Management, Business, Science and Arts occupations in Jones County, the most male-oriented occupations are Architecture & Engineering (100.0%), Life, Physical & Social Science (100.0%), and Computers, Engineering & Science (92.9%), while the most female-oriented occupations are Health Technologists (100.0%), Health Diagnosing & Treating (87.3%), and Education Instruction & Library (85.0%).
| Occupation | Male | Female |
| Management | 235 (74.6%) | 80 (25.4%) |
| Business & Financial | 80 (54.0%) | 68 (46.0%) |
| Computers, Engineering & Science | 39 (92.9%) | 3 (7.1%) |
| Computers & Mathematics | 21 (87.5%) | 3 (12.5%) |
| Architecture & Engineering | 13 (100.0%) | 0 (0.0%) |
| Life, Physical & Social Science | 5 (100.0%) | 0 (0.0%) |
| Community & Social Service | 126 (35.0%) | 234 (65.0%) |
| Education, Arts & Media | 74 (52.1%) | 68 (47.9%) |
| Legal Services & Support | 21 (50.0%) | 21 (50.0%) |
| Education Instruction & Library | 20 (15.0%) | 113 (85.0%) |
| Arts, Media & Entertainment | 11 (25.6%) | 32 (74.4%) |
| Health Diagnosing & Treating | 23 (12.7%) | 158 (87.3%) |
| Health Technologists | 0 (0.0%) | 65 (100.0%) |
| Total (Category) | 503 (48.1%) | 543 (51.9%) |
| Total (Overall) | 2,006 (52.0%) | 1,852 (48.0%) |
Services Occupations
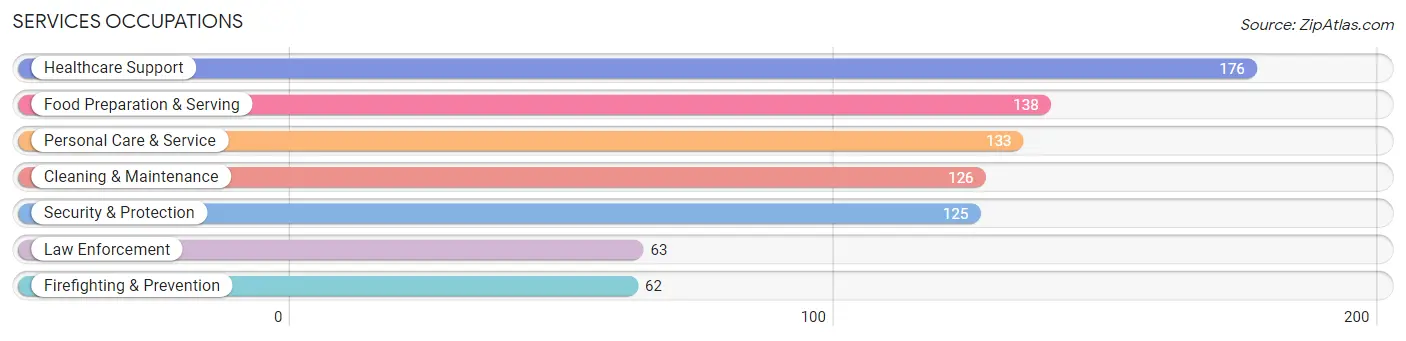
The most common Services occupations in Jones County are Healthcare Support (176 | 4.6%), Food Preparation & Serving (138 | 3.6%), Personal Care & Service (133 | 3.5%), Cleaning & Maintenance (126 | 3.3%), and Security & Protection (125 | 3.2%).
Services Occupations by Sex
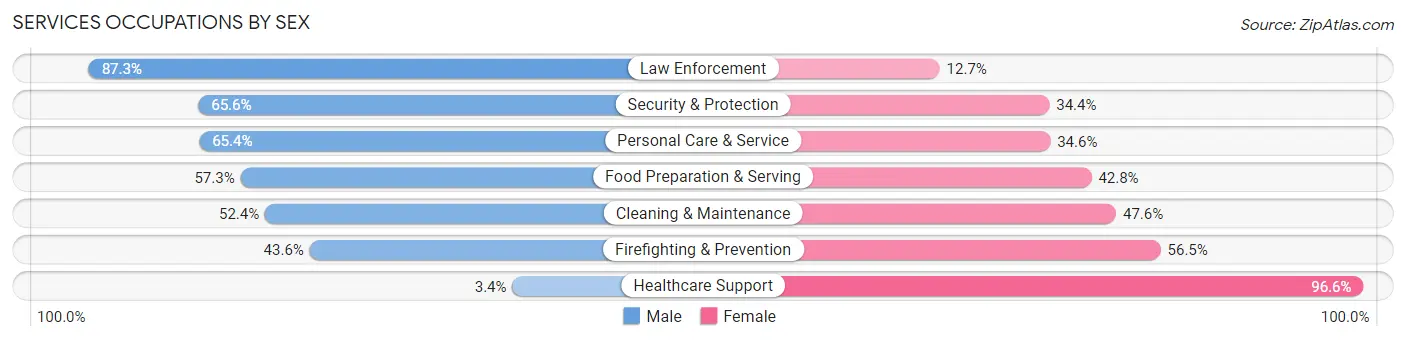
Within the Services occupations in Jones County, the most male-oriented occupations are Law Enforcement (87.3%), Security & Protection (65.6%), and Personal Care & Service (65.4%), while the most female-oriented occupations are Healthcare Support (96.6%), Firefighting & Prevention (56.5%), and Cleaning & Maintenance (47.6%).
| Occupation | Male | Female |
| Healthcare Support | 6 (3.4%) | 170 (96.6%) |
| Security & Protection | 82 (65.6%) | 43 (34.4%) |
| Firefighting & Prevention | 27 (43.5%) | 35 (56.5%) |
| Law Enforcement | 55 (87.3%) | 8 (12.7%) |
| Food Preparation & Serving | 79 (57.3%) | 59 (42.7%) |
| Cleaning & Maintenance | 66 (52.4%) | 60 (47.6%) |
| Personal Care & Service | 87 (65.4%) | 46 (34.6%) |
| Total (Category) | 320 (45.9%) | 378 (54.1%) |
| Total (Overall) | 2,006 (52.0%) | 1,852 (48.0%) |
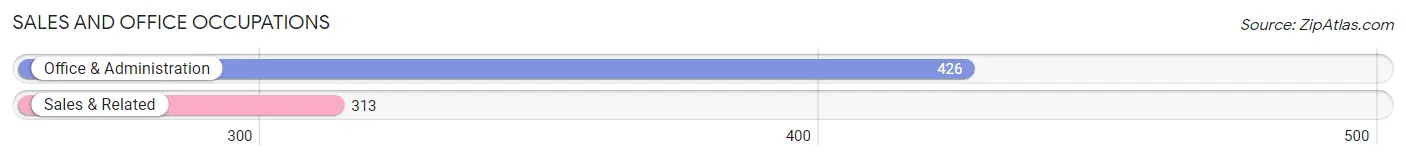
Sales and Office Occupations
The most common Sales and Office occupations in Jones County are Office & Administration (426 | 11.0%), and Sales & Related (313 | 8.1%).
Sales and Office Occupations by Sex
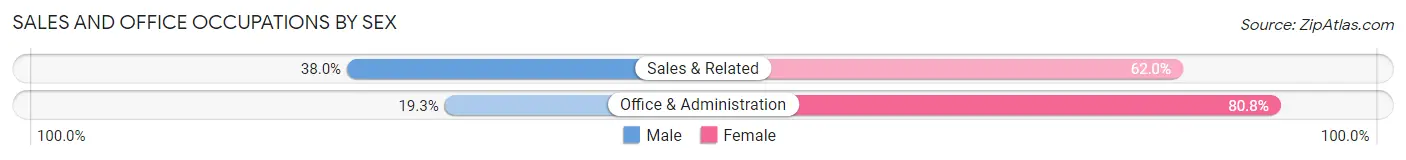
| Occupation | Male | Female |
| Sales & Related | 119 (38.0%) | 194 (62.0%) |
| Office & Administration | 82 (19.3%) | 344 (80.7%) |
| Total (Category) | 201 (27.2%) | 538 (72.8%) |
| Total (Overall) | 2,006 (52.0%) | 1,852 (48.0%) |
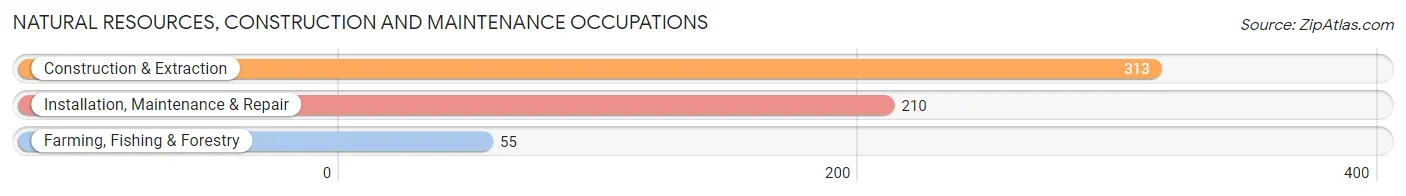
Natural Resources, Construction and Maintenance Occupations
The most common Natural Resources, Construction and Maintenance occupations in Jones County are Construction & Extraction (313 | 8.1%), Installation, Maintenance & Repair (210 | 5.4%), and Farming, Fishing & Forestry (55 | 1.4%).
Natural Resources, Construction and Maintenance Occupations by Sex
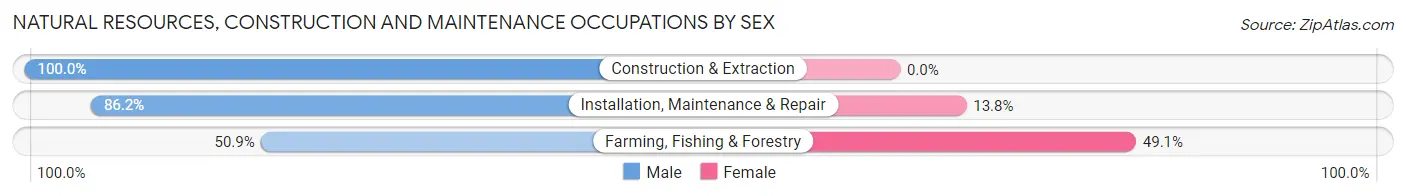
| Occupation | Male | Female |
| Farming, Fishing & Forestry | 28 (50.9%) | 27 (49.1%) |
| Construction & Extraction | 313 (100.0%) | 0 (0.0%) |
| Installation, Maintenance & Repair | 181 (86.2%) | 29 (13.8%) |
| Total (Category) | 522 (90.3%) | 56 (9.7%) |
| Total (Overall) | 2,006 (52.0%) | 1,852 (48.0%) |
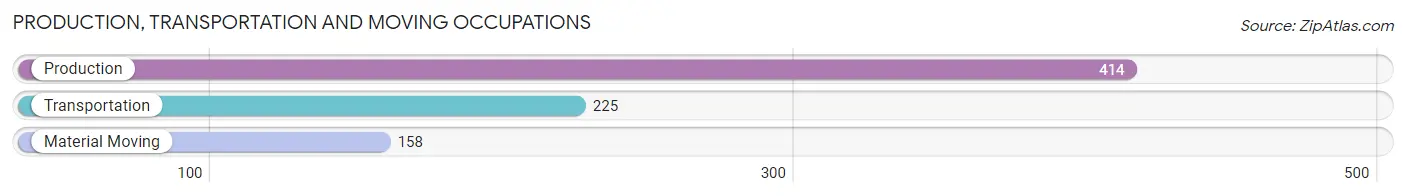
Production, Transportation and Moving Occupations
The most common Production, Transportation and Moving occupations in Jones County are Production (414 | 10.7%), Transportation (225 | 5.8%), and Material Moving (158 | 4.1%).
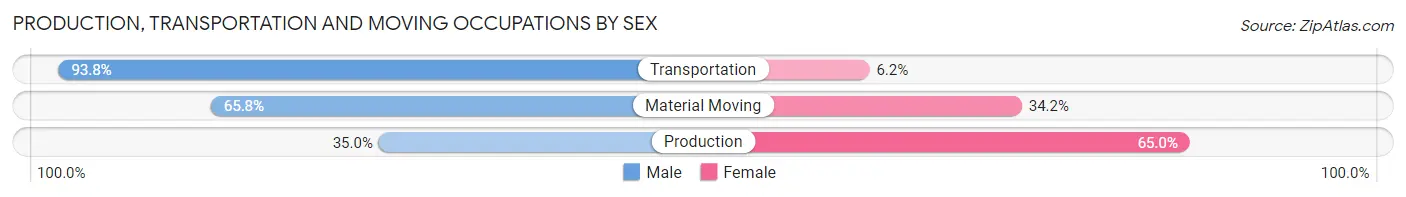
Production, Transportation and Moving Occupations by Sex
| Occupation | Male | Female |
| Production | 145 (35.0%) | 269 (65.0%) |
| Transportation | 211 (93.8%) | 14 (6.2%) |
| Material Moving | 104 (65.8%) | 54 (34.2%) |
| Total (Category) | 460 (57.7%) | 337 (42.3%) |
| Total (Overall) | 2,006 (52.0%) | 1,852 (48.0%) |
Employment Industries by Sex in Jones County
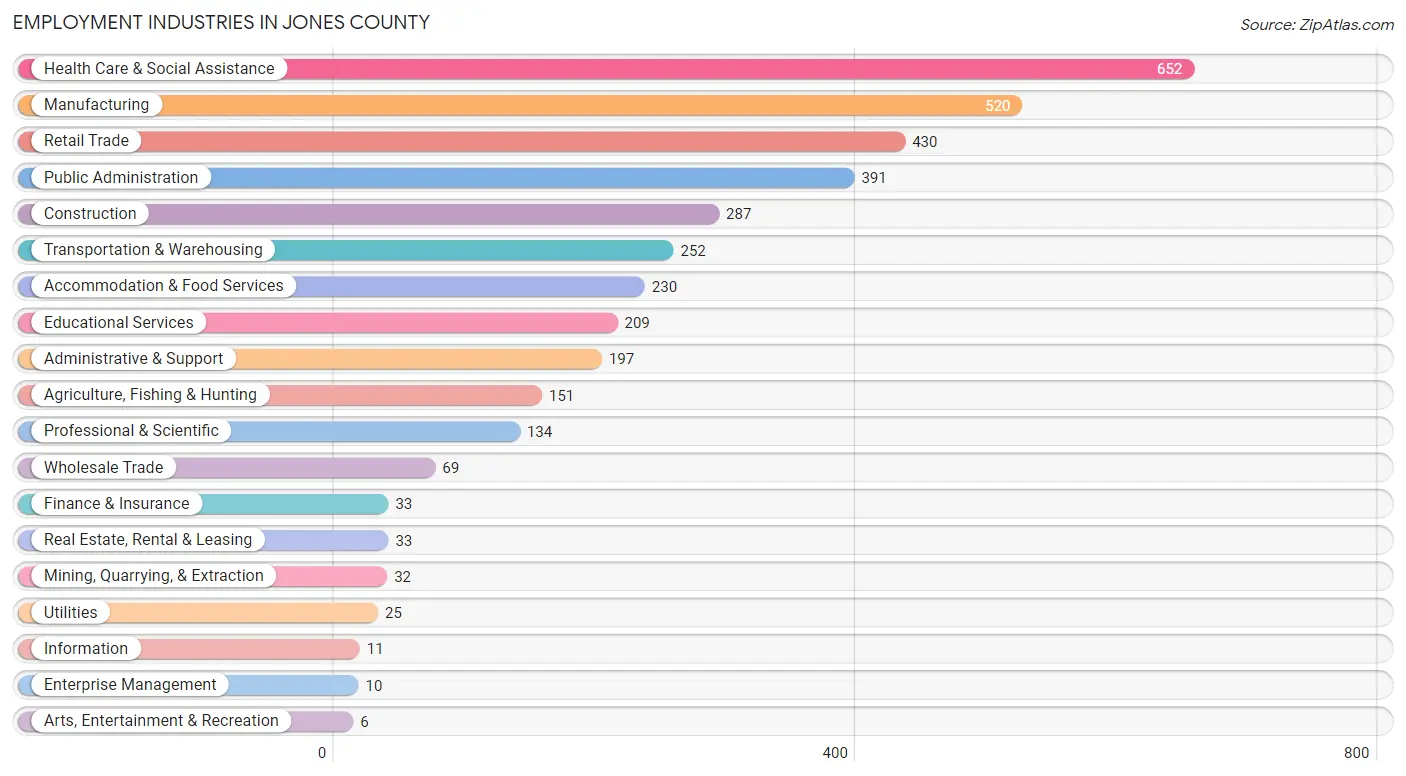
Employment Industries in Jones County
The major employment industries in Jones County include Health Care & Social Assistance (652 | 16.9%), Manufacturing (520 | 13.5%), Retail Trade (430 | 11.2%), Public Administration (391 | 10.1%), and Construction (287 | 7.4%).
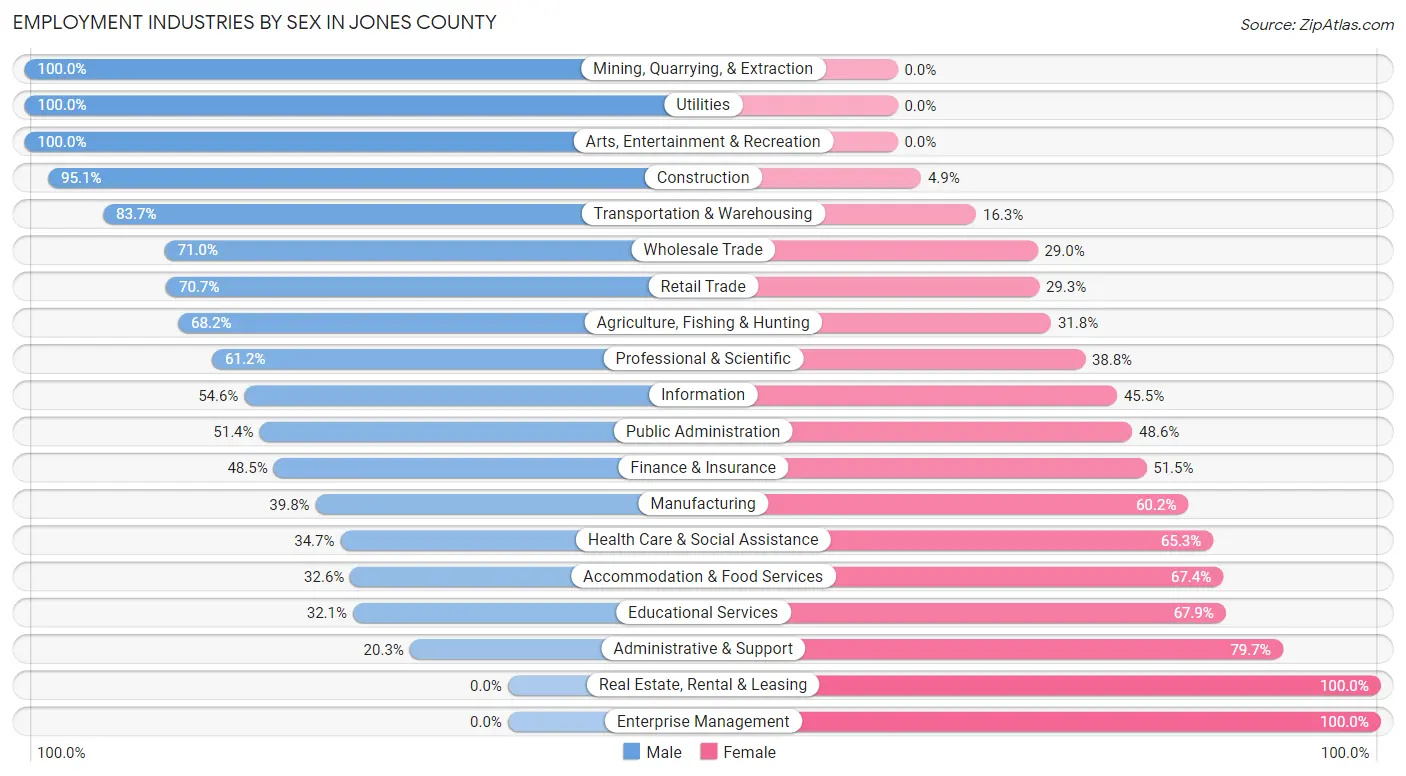
Employment Industries by Sex in Jones County
The Jones County industries that see more men than women are Mining, Quarrying, & Extraction (100.0%), Utilities (100.0%), and Arts, Entertainment & Recreation (100.0%), whereas the industries that tend to have a higher number of women are Real Estate, Rental & Leasing (100.0%), Enterprise Management (100.0%), and Administrative & Support (79.7%).
| Industry | Male | Female |
| Agriculture, Fishing & Hunting | 103 (68.2%) | 48 (31.8%) |
| Mining, Quarrying, & Extraction | 32 (100.0%) | 0 (0.0%) |
| Construction | 273 (95.1%) | 14 (4.9%) |
| Manufacturing | 207 (39.8%) | 313 (60.2%) |
| Wholesale Trade | 49 (71.0%) | 20 (29.0%) |
| Retail Trade | 304 (70.7%) | 126 (29.3%) |
| Transportation & Warehousing | 211 (83.7%) | 41 (16.3%) |
| Utilities | 25 (100.0%) | 0 (0.0%) |
| Information | 6 (54.5%) | 5 (45.5%) |
| Finance & Insurance | 16 (48.5%) | 17 (51.5%) |
| Real Estate, Rental & Leasing | 0 (0.0%) | 33 (100.0%) |
| Professional & Scientific | 82 (61.2%) | 52 (38.8%) |
| Enterprise Management | 0 (0.0%) | 10 (100.0%) |
| Administrative & Support | 40 (20.3%) | 157 (79.7%) |
| Educational Services | 67 (32.1%) | 142 (67.9%) |
| Health Care & Social Assistance | 226 (34.7%) | 426 (65.3%) |
| Arts, Entertainment & Recreation | 6 (100.0%) | 0 (0.0%) |
| Accommodation & Food Services | 75 (32.6%) | 155 (67.4%) |
| Public Administration | 201 (51.4%) | 190 (48.6%) |
| Total | 2,006 (52.0%) | 1,852 (48.0%) |
Education in Jones County
School Enrollment in Jones County
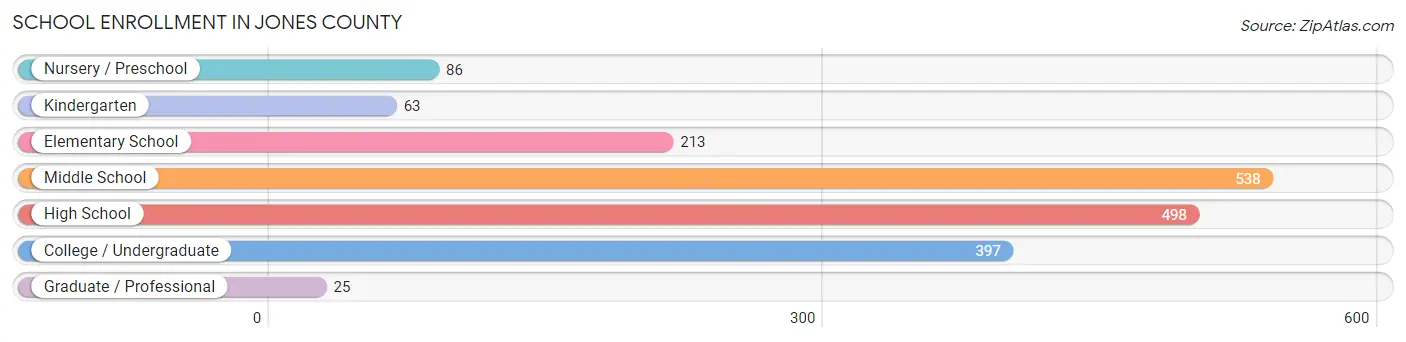
The most common levels of schooling among the 1,820 students in Jones County are middle school (538 | 29.6%), high school (498 | 27.4%), and college / undergraduate (397 | 21.8%).
| School Level | # Students | % Students |
| Nursery / Preschool | 86 | 4.7% |
| Kindergarten | 63 | 3.5% |
| Elementary School | 213 | 11.7% |
| Middle School | 538 | 29.6% |
| High School | 498 | 27.4% |
| College / Undergraduate | 397 | 21.8% |
| Graduate / Professional | 25 | 1.4% |
| Total | 1,820 | 100.0% |
School Enrollment by Age by Funding Source in Jones County
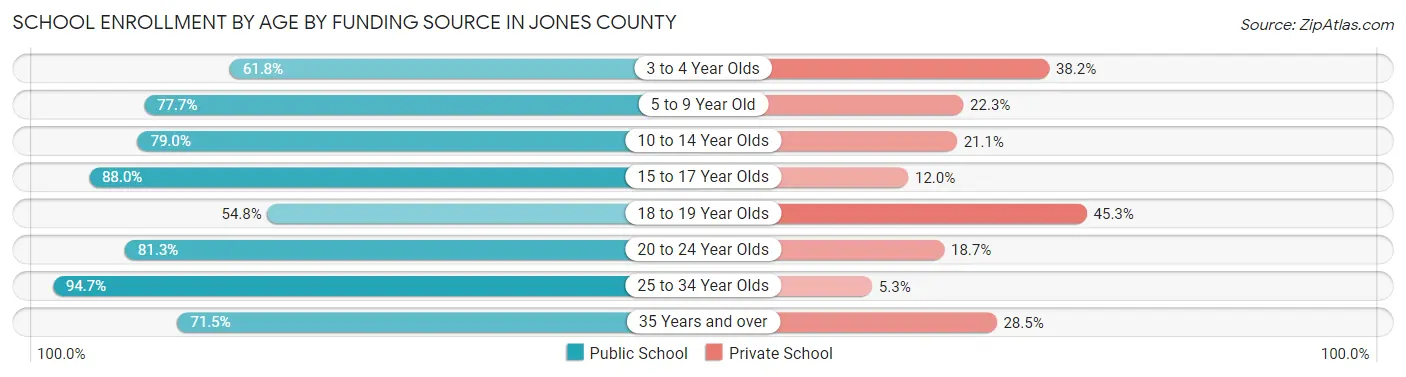
Out of a total of 1,820 students who are enrolled in schools in Jones County, 391 (21.5%) attend a private institution, while the remaining 1,429 (78.5%) are enrolled in public schools. The age group of 18 to 19 year olds has the highest likelihood of being enrolled in private schools, with 81 (45.3% in the age bracket) enrolled. Conversely, the age group of 25 to 34 year olds has the lowest likelihood of being enrolled in a private school, with 90 (94.7% in the age bracket) attending a public institution.
| Age Bracket | Public School | Private School |
| 3 to 4 Year Olds | 21 (61.8%) | 13 (38.2%) |
| 5 to 9 Year Old | 234 (77.7%) | 67 (22.3%) |
| 10 to 14 Year Olds | 465 (78.9%) | 124 (21.0%) |
| 15 to 17 Year Olds | 345 (88.0%) | 47 (12.0%) |
| 18 to 19 Year Olds | 98 (54.7%) | 81 (45.3%) |
| 20 to 24 Year Olds | 87 (81.3%) | 20 (18.7%) |
| 25 to 34 Year Olds | 90 (94.7%) | 5 (5.3%) |
| 35 Years and over | 88 (71.5%) | 35 (28.5%) |
| Total | 1,429 (78.5%) | 391 (21.5%) |
Educational Attainment by Field of Study in Jones County
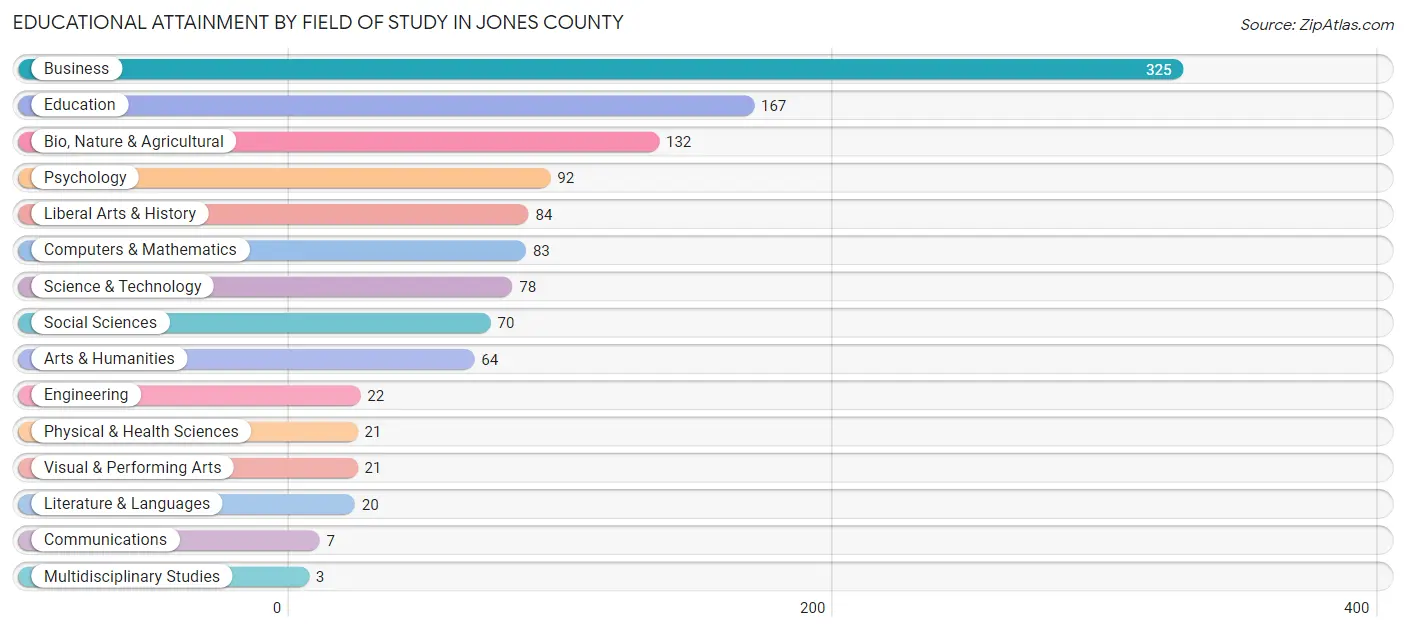
Business (325 | 27.3%), education (167 | 14.1%), bio, nature & agricultural (132 | 11.1%), psychology (92 | 7.7%), and liberal arts & history (84 | 7.1%) are the most common fields of study among 1,189 individuals in Jones County who have obtained a bachelor's degree or higher.
| Field of Study | # Graduates | % Graduates |
| Computers & Mathematics | 83 | 7.0% |
| Bio, Nature & Agricultural | 132 | 11.1% |
| Physical & Health Sciences | 21 | 1.8% |
| Psychology | 92 | 7.7% |
| Social Sciences | 70 | 5.9% |
| Engineering | 22 | 1.8% |
| Multidisciplinary Studies | 3 | 0.3% |
| Science & Technology | 78 | 6.6% |
| Business | 325 | 27.3% |
| Education | 167 | 14.1% |
| Literature & Languages | 20 | 1.7% |
| Liberal Arts & History | 84 | 7.1% |
| Visual & Performing Arts | 21 | 1.8% |
| Communications | 7 | 0.6% |
| Arts & Humanities | 64 | 5.4% |
| Total | 1,189 | 100.0% |
Transportation & Commute in Jones County
Vehicle Availability by Sex in Jones County
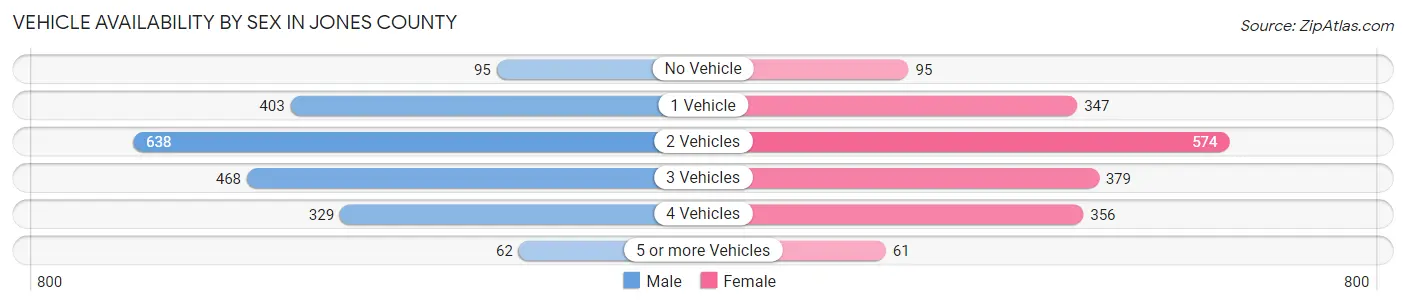
The most prevalent vehicle ownership categories in Jones County are males with 2 vehicles (638, accounting for 32.0%) and females with 2 vehicles (574, making up 35.2%).
| Vehicles Available | Male | Female |
| No Vehicle | 95 (4.8%) | 95 (5.2%) |
| 1 Vehicle | 403 (20.2%) | 347 (19.2%) |
| 2 Vehicles | 638 (32.0%) | 574 (31.7%) |
| 3 Vehicles | 468 (23.5%) | 379 (20.9%) |
| 4 Vehicles | 329 (16.5%) | 356 (19.7%) |
| 5 or more Vehicles | 62 (3.1%) | 61 (3.4%) |
| Total | 1,995 (100.0%) | 1,812 (100.0%) |
Commute Time in Jones County
The most frequently occuring commute durations in Jones County are 30 to 34 minutes (776 commuters, 21.1%), 20 to 24 minutes (583 commuters, 15.9%), and 10 to 14 minutes (410 commuters, 11.2%).
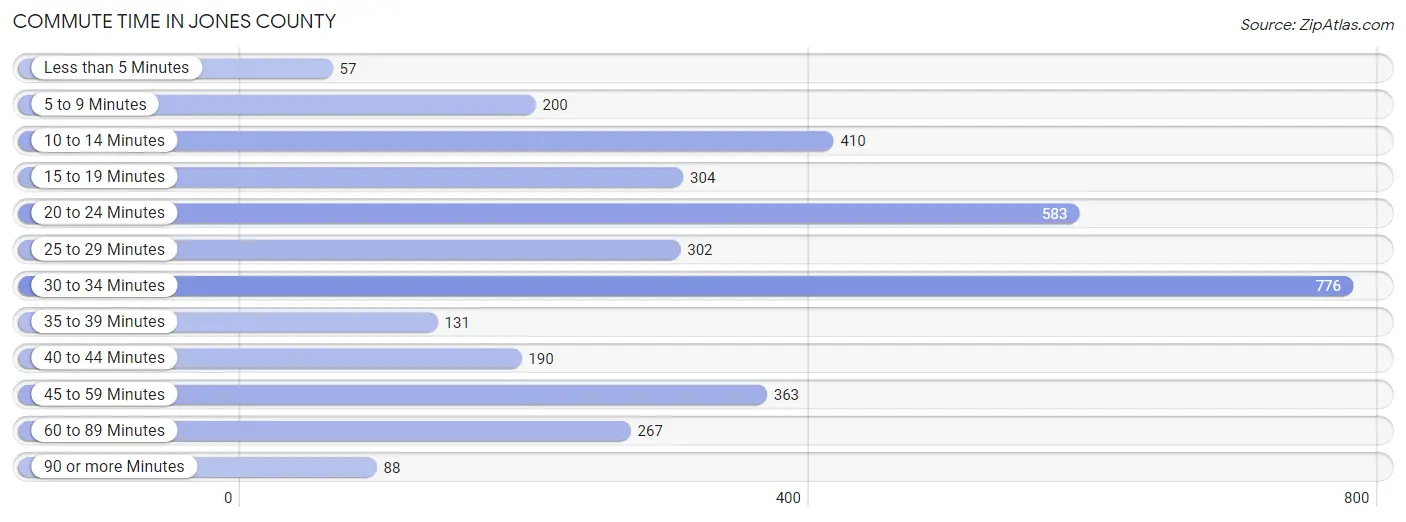
| Commute Time | # Commuters | % Commuters |
| Less than 5 Minutes | 57 | 1.5% |
| 5 to 9 Minutes | 200 | 5.4% |
| 10 to 14 Minutes | 410 | 11.2% |
| 15 to 19 Minutes | 304 | 8.3% |
| 20 to 24 Minutes | 583 | 15.9% |
| 25 to 29 Minutes | 302 | 8.2% |
| 30 to 34 Minutes | 776 | 21.1% |
| 35 to 39 Minutes | 131 | 3.6% |
| 40 to 44 Minutes | 190 | 5.2% |
| 45 to 59 Minutes | 363 | 9.9% |
| 60 to 89 Minutes | 267 | 7.3% |
| 90 or more Minutes | 88 | 2.4% |
Commute Time by Sex in Jones County
The most common commute times in Jones County are 30 to 34 minutes (454 commuters, 23.4%) for males and 20 to 24 minutes (364 commuters, 21.1%) for females.
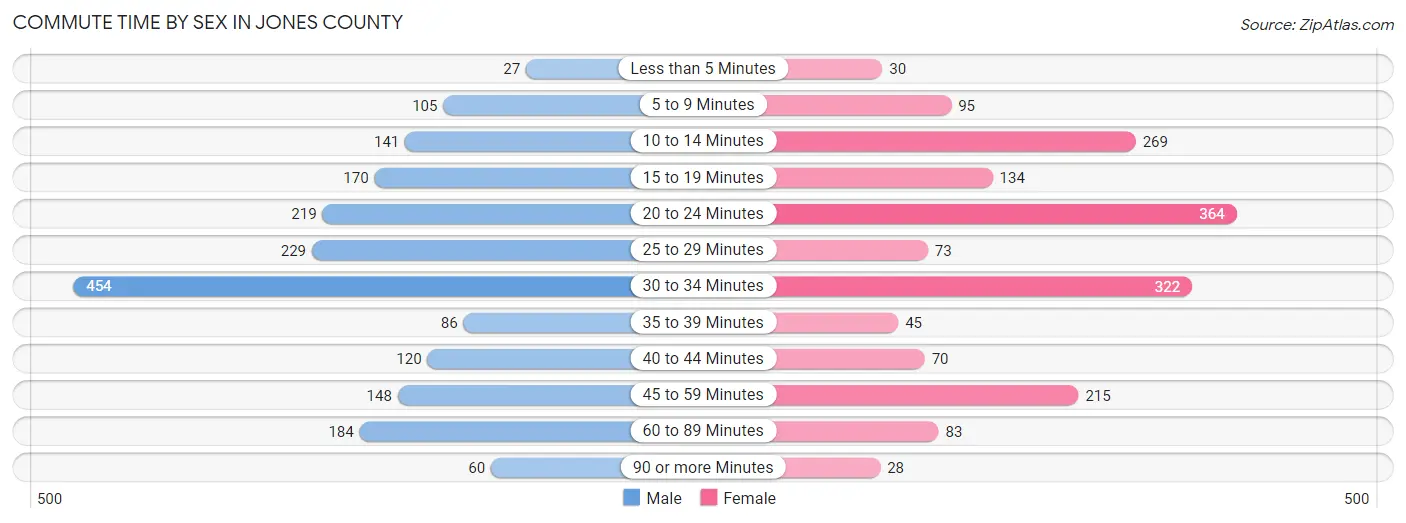
| Commute Time | Male | Female |
| Less than 5 Minutes | 27 (1.4%) | 30 (1.7%) |
| 5 to 9 Minutes | 105 (5.4%) | 95 (5.5%) |
| 10 to 14 Minutes | 141 (7.3%) | 269 (15.6%) |
| 15 to 19 Minutes | 170 (8.7%) | 134 (7.7%) |
| 20 to 24 Minutes | 219 (11.3%) | 364 (21.1%) |
| 25 to 29 Minutes | 229 (11.8%) | 73 (4.2%) |
| 30 to 34 Minutes | 454 (23.4%) | 322 (18.6%) |
| 35 to 39 Minutes | 86 (4.4%) | 45 (2.6%) |
| 40 to 44 Minutes | 120 (6.2%) | 70 (4.1%) |
| 45 to 59 Minutes | 148 (7.6%) | 215 (12.4%) |
| 60 to 89 Minutes | 184 (9.5%) | 83 (4.8%) |
| 90 or more Minutes | 60 (3.1%) | 28 (1.6%) |
Time of Departure to Work by Sex in Jones County
The most frequent times of departure to work in Jones County are 7:30 AM to 7:59 AM (297, 15.3%) for males and 6:30 AM to 6:59 AM (241, 14.0%) for females.
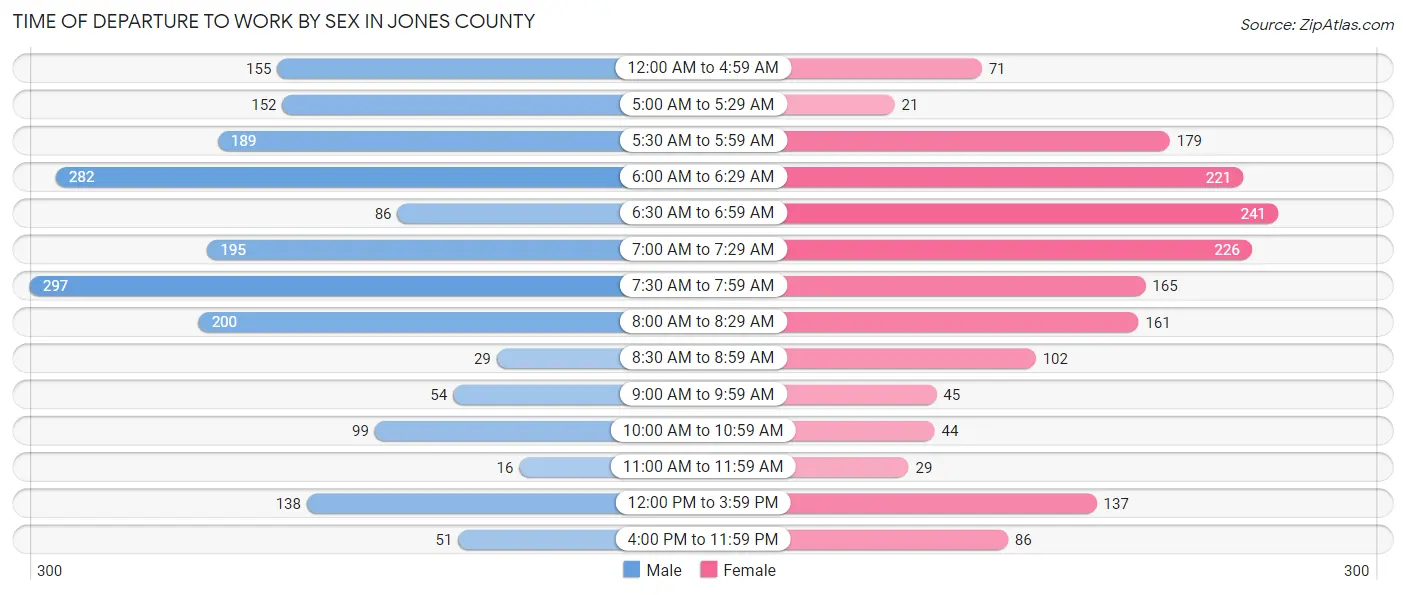
| Time of Departure | Male | Female |
| 12:00 AM to 4:59 AM | 155 (8.0%) | 71 (4.1%) |
| 5:00 AM to 5:29 AM | 152 (7.8%) | 21 (1.2%) |
| 5:30 AM to 5:59 AM | 189 (9.7%) | 179 (10.4%) |
| 6:00 AM to 6:29 AM | 282 (14.5%) | 221 (12.8%) |
| 6:30 AM to 6:59 AM | 86 (4.4%) | 241 (14.0%) |
| 7:00 AM to 7:29 AM | 195 (10.0%) | 226 (13.1%) |
| 7:30 AM to 7:59 AM | 297 (15.3%) | 165 (9.6%) |
| 8:00 AM to 8:29 AM | 200 (10.3%) | 161 (9.3%) |
| 8:30 AM to 8:59 AM | 29 (1.5%) | 102 (5.9%) |
| 9:00 AM to 9:59 AM | 54 (2.8%) | 45 (2.6%) |
| 10:00 AM to 10:59 AM | 99 (5.1%) | 44 (2.5%) |
| 11:00 AM to 11:59 AM | 16 (0.8%) | 29 (1.7%) |
| 12:00 PM to 3:59 PM | 138 (7.1%) | 137 (7.9%) |
| 4:00 PM to 11:59 PM | 51 (2.6%) | 86 (5.0%) |
| Total | 1,943 (100.0%) | 1,728 (100.0%) |
Housing Occupancy in Jones County
Occupancy by Ownership in Jones County
Of the total 3,815 dwellings in Jones County, owner-occupied units account for 2,898 (76.0%), while renter-occupied units make up 917 (24.0%).
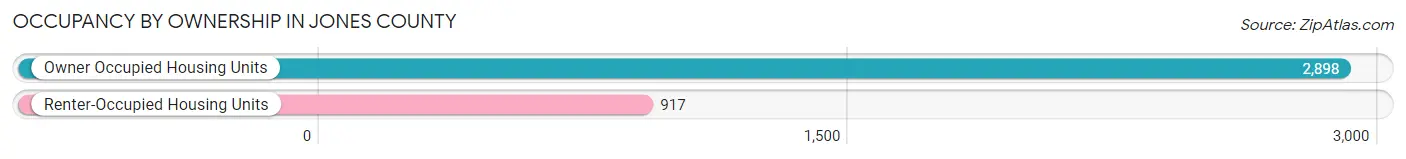
| Occupancy | # Housing Units | % Housing Units |
| Owner Occupied Housing Units | 2,898 | 76.0% |
| Renter-Occupied Housing Units | 917 | 24.0% |
| Total Occupied Housing Units | 3,815 | 100.0% |
Occupancy by Household Size in Jones County
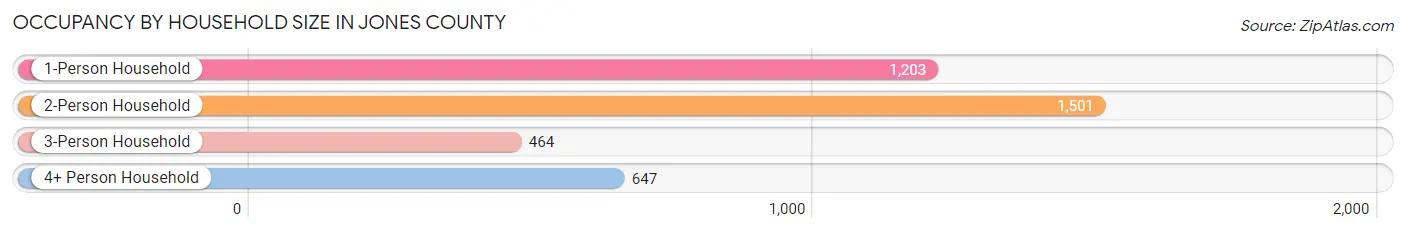
| Household Size | # Housing Units | % Housing Units |
| 1-Person Household | 1,203 | 31.5% |
| 2-Person Household | 1,501 | 39.3% |
| 3-Person Household | 464 | 12.2% |
| 4+ Person Household | 647 | 17.0% |
| Total Housing Units | 3,815 | 100.0% |
Occupancy by Ownership by Household Size in Jones County
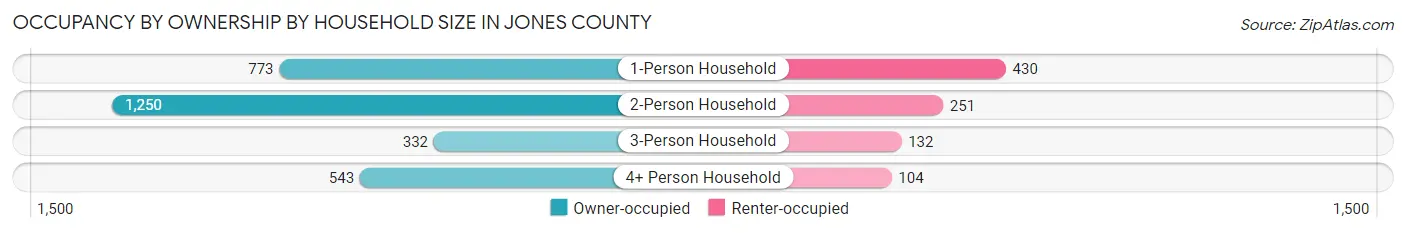
| Household Size | Owner-occupied | Renter-occupied |
| 1-Person Household | 773 (64.3%) | 430 (35.7%) |
| 2-Person Household | 1,250 (83.3%) | 251 (16.7%) |
| 3-Person Household | 332 (71.6%) | 132 (28.4%) |
| 4+ Person Household | 543 (83.9%) | 104 (16.1%) |
| Total Housing Units | 2,898 (76.0%) | 917 (24.0%) |
Occupancy by Educational Attainment in Jones County
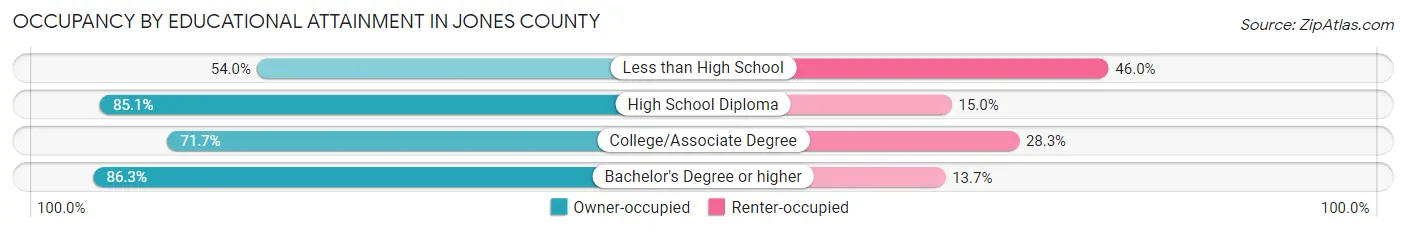
| Household Size | Owner-occupied | Renter-occupied |
| Less than High School | 286 (54.0%) | 244 (46.0%) |
| High School Diploma | 1,058 (85.1%) | 186 (14.9%) |
| College/Associate Degree | 1,018 (71.7%) | 402 (28.3%) |
| Bachelor's Degree or higher | 536 (86.3%) | 85 (13.7%) |
Occupancy by Age of Householder in Jones County
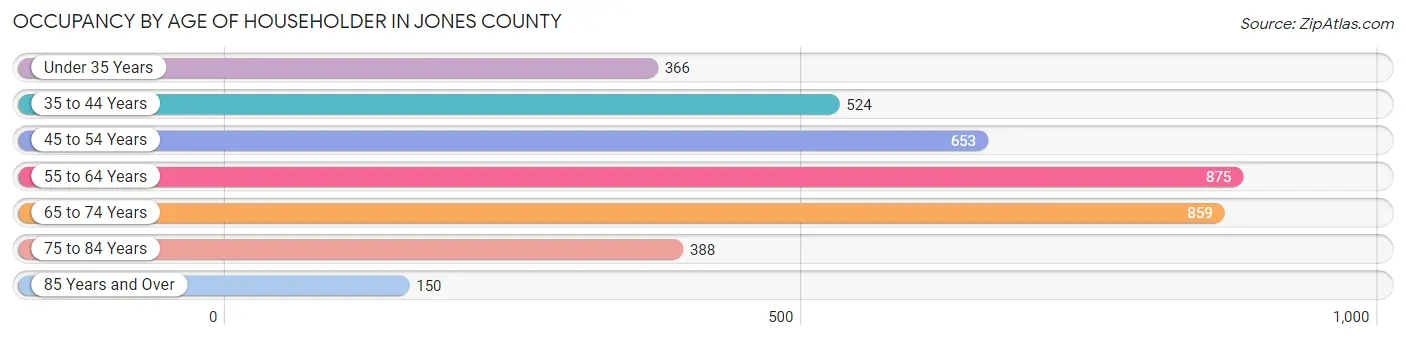
| Age Bracket | # Households | % Households |
| Under 35 Years | 366 | 9.6% |
| 35 to 44 Years | 524 | 13.7% |
| 45 to 54 Years | 653 | 17.1% |
| 55 to 64 Years | 875 | 22.9% |
| 65 to 74 Years | 859 | 22.5% |
| 75 to 84 Years | 388 | 10.2% |
| 85 Years and Over | 150 | 3.9% |
| Total | 3,815 | 100.0% |
Housing Finances in Jones County
Median Income by Occupancy in Jones County
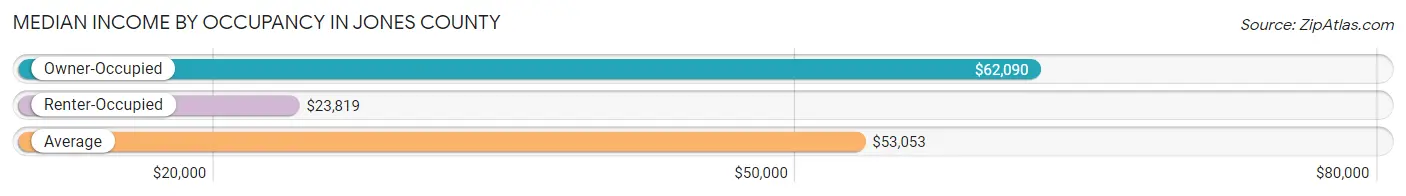
| Occupancy Type | # Households | Median Income |
| Owner-Occupied | 2,898 (76.0%) | $62,090 |
| Renter-Occupied | 917 (24.0%) | $23,819 |
| Average | 3,815 (100.0%) | $53,053 |
Occupancy by Householder Income Bracket in Jones County
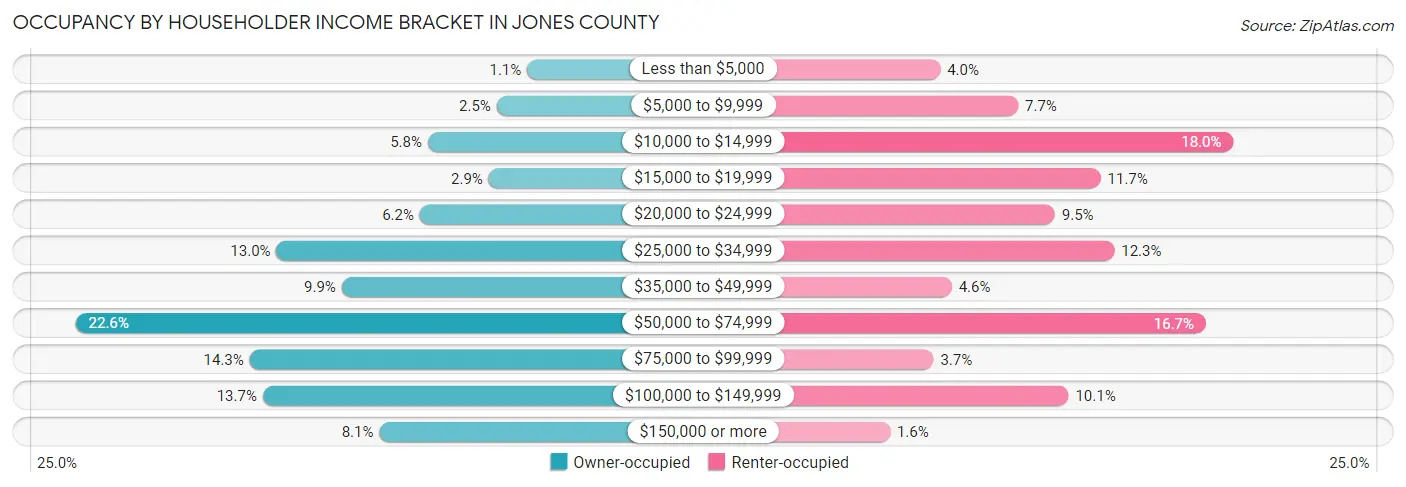
| Income Bracket | Owner-occupied | Renter-occupied |
| Less than $5,000 | 31 (1.1%) | 37 (4.0%) |
| $5,000 to $9,999 | 73 (2.5%) | 71 (7.7%) |
| $10,000 to $14,999 | 168 (5.8%) | 165 (18.0%) |
| $15,000 to $19,999 | 84 (2.9%) | 107 (11.7%) |
| $20,000 to $24,999 | 179 (6.2%) | 87 (9.5%) |
| $25,000 to $34,999 | 377 (13.0%) | 113 (12.3%) |
| $35,000 to $49,999 | 287 (9.9%) | 42 (4.6%) |
| $50,000 to $74,999 | 654 (22.6%) | 153 (16.7%) |
| $75,000 to $99,999 | 414 (14.3%) | 34 (3.7%) |
| $100,000 to $149,999 | 396 (13.7%) | 93 (10.1%) |
| $150,000 or more | 235 (8.1%) | 15 (1.6%) |
| Total | 2,898 (100.0%) | 917 (100.0%) |
Monthly Housing Cost Tiers in Jones County
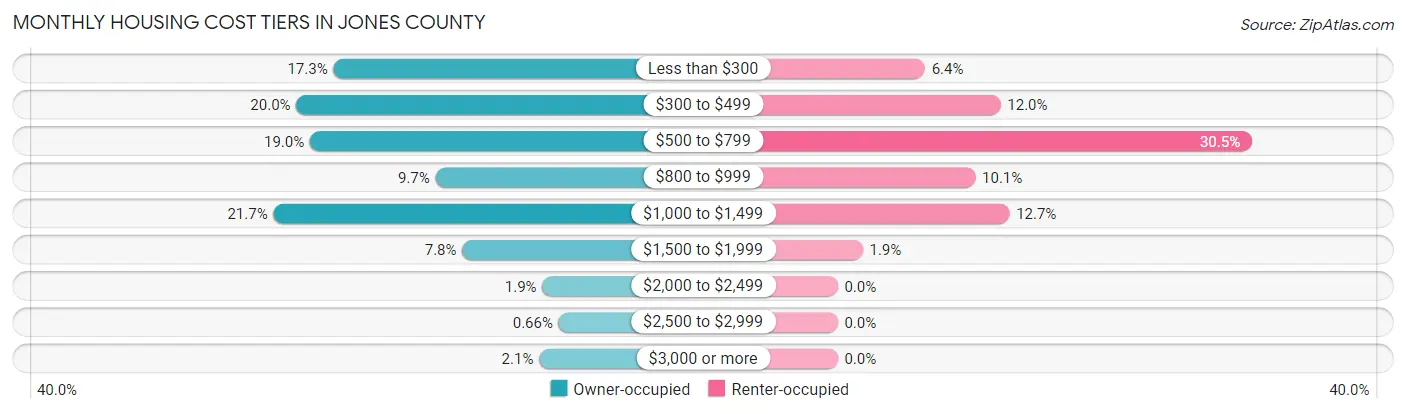
| Monthly Cost | Owner-occupied | Renter-occupied |
| Less than $300 | 500 (17.2%) | 59 (6.4%) |
| $300 to $499 | 579 (20.0%) | 110 (12.0%) |
| $500 to $799 | 550 (19.0%) | 280 (30.5%) |
| $800 to $999 | 282 (9.7%) | 93 (10.1%) |
| $1,000 to $1,499 | 628 (21.7%) | 116 (12.7%) |
| $1,500 to $1,999 | 225 (7.8%) | 17 (1.8%) |
| $2,000 to $2,499 | 54 (1.9%) | 0 (0.0%) |
| $2,500 to $2,999 | 19 (0.7%) | 0 (0.0%) |
| $3,000 or more | 61 (2.1%) | 0 (0.0%) |
| Total | 2,898 (100.0%) | 917 (100.0%) |
Physical Housing Characteristics in Jones County
Housing Structures in Jones County
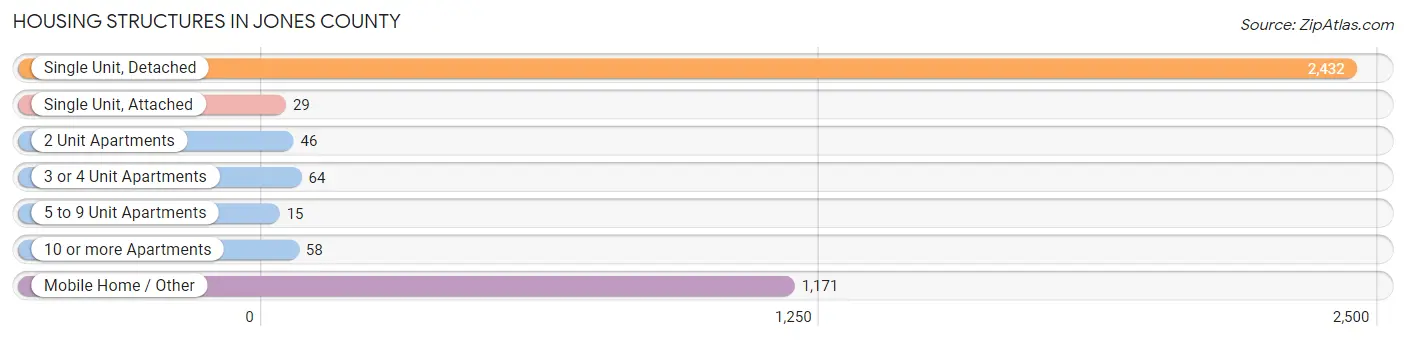
| Structure Type | # Housing Units | % Housing Units |
| Single Unit, Detached | 2,432 | 63.7% |
| Single Unit, Attached | 29 | 0.8% |
| 2 Unit Apartments | 46 | 1.2% |
| 3 or 4 Unit Apartments | 64 | 1.7% |
| 5 to 9 Unit Apartments | 15 | 0.4% |
| 10 or more Apartments | 58 | 1.5% |
| Mobile Home / Other | 1,171 | 30.7% |
| Total | 3,815 | 100.0% |
Housing Structures by Occupancy in Jones County
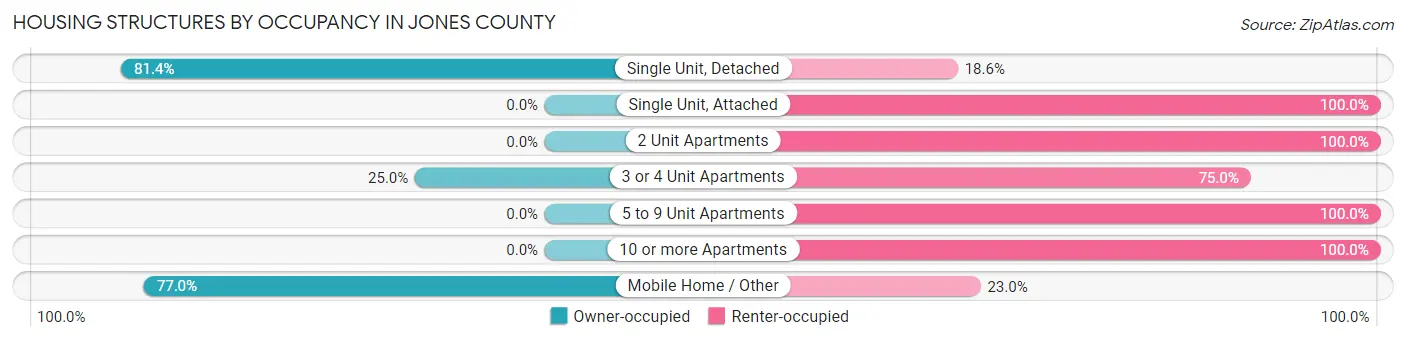
| Structure Type | Owner-occupied | Renter-occupied |
| Single Unit, Detached | 1,980 (81.4%) | 452 (18.6%) |
| Single Unit, Attached | 0 (0.0%) | 29 (100.0%) |
| 2 Unit Apartments | 0 (0.0%) | 46 (100.0%) |
| 3 or 4 Unit Apartments | 16 (25.0%) | 48 (75.0%) |
| 5 to 9 Unit Apartments | 0 (0.0%) | 15 (100.0%) |
| 10 or more Apartments | 0 (0.0%) | 58 (100.0%) |
| Mobile Home / Other | 902 (77.0%) | 269 (23.0%) |
| Total | 2,898 (76.0%) | 917 (24.0%) |
Housing Structures by Number of Rooms in Jones County
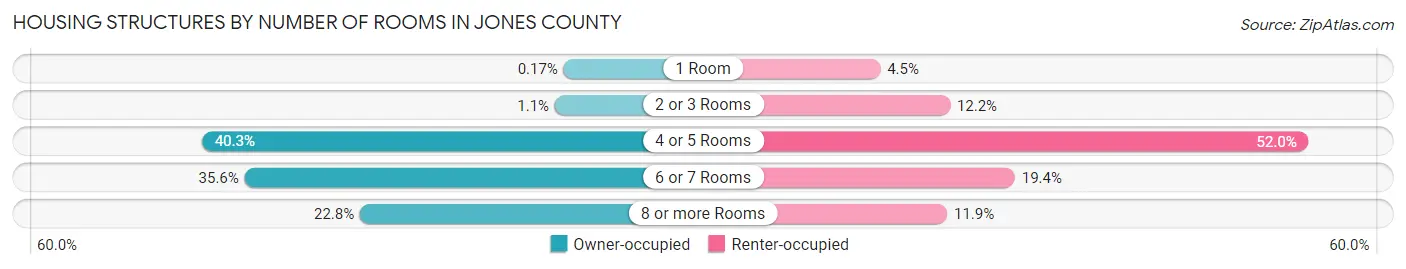
| Number of Rooms | Owner-occupied | Renter-occupied |
| 1 Room | 5 (0.2%) | 41 (4.5%) |
| 2 or 3 Rooms | 33 (1.1%) | 112 (12.2%) |
| 4 or 5 Rooms | 1,169 (40.3%) | 477 (52.0%) |
| 6 or 7 Rooms | 1,031 (35.6%) | 178 (19.4%) |
| 8 or more Rooms | 660 (22.8%) | 109 (11.9%) |
| Total | 2,898 (100.0%) | 917 (100.0%) |
Housing Structure by Heating Type in Jones County
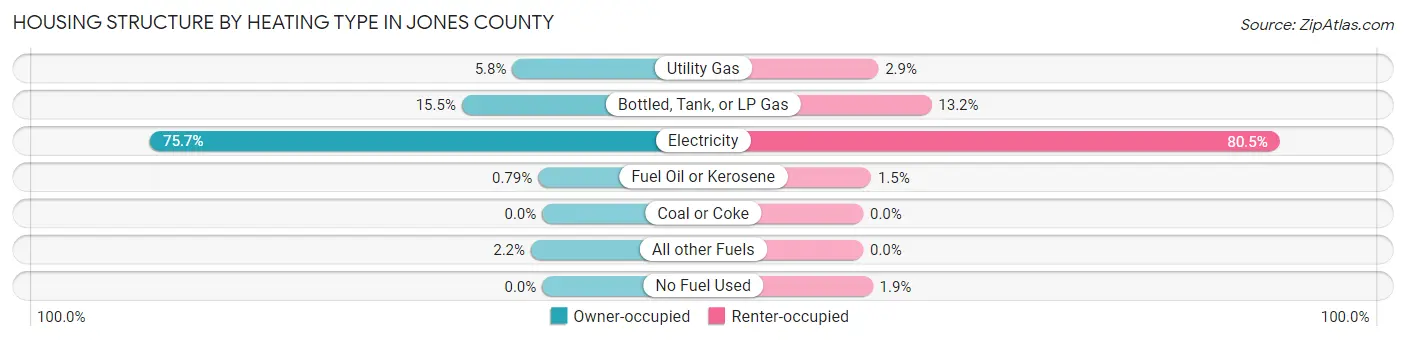
| Heating Type | Owner-occupied | Renter-occupied |
| Utility Gas | 167 (5.8%) | 27 (2.9%) |
| Bottled, Tank, or LP Gas | 450 (15.5%) | 121 (13.2%) |
| Electricity | 2,195 (75.7%) | 738 (80.5%) |
| Fuel Oil or Kerosene | 23 (0.8%) | 14 (1.5%) |
| Coal or Coke | 0 (0.0%) | 0 (0.0%) |
| All other Fuels | 63 (2.2%) | 0 (0.0%) |
| No Fuel Used | 0 (0.0%) | 17 (1.8%) |
| Total | 2,898 (100.0%) | 917 (100.0%) |
Household Vehicle Usage in Jones County
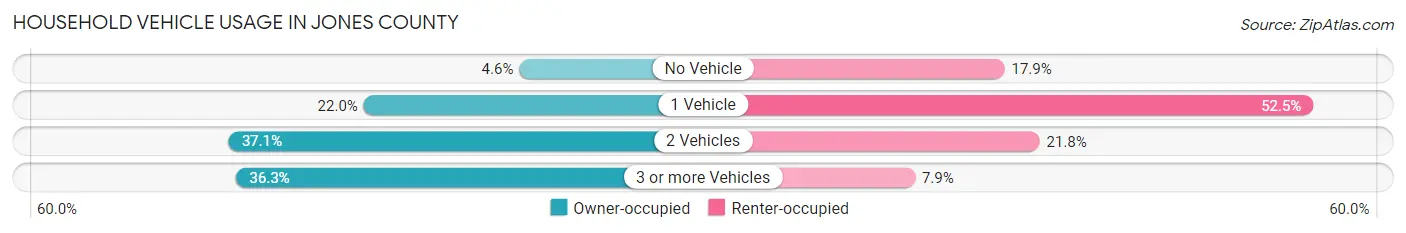
| Vehicles per Household | Owner-occupied | Renter-occupied |
| No Vehicle | 133 (4.6%) | 164 (17.9%) |
| 1 Vehicle | 638 (22.0%) | 481 (52.4%) |
| 2 Vehicles | 1,076 (37.1%) | 200 (21.8%) |
| 3 or more Vehicles | 1,051 (36.3%) | 72 (7.9%) |
| Total | 2,898 (100.0%) | 917 (100.0%) |
Real Estate & Mortgages in Jones County
Real Estate and Mortgage Overview in Jones County
| Characteristic | Without Mortgage | With Mortgage |
| Housing Units | 1,594 | 1,304 |
| Median Property Value | $85,700 | $137,800 |
| Median Household Income | $47,292 | $199 |
| Monthly Housing Costs | $420 | $61 |
| Real Estate Taxes | $746 | $34 |
Property Value by Mortgage Status in Jones County
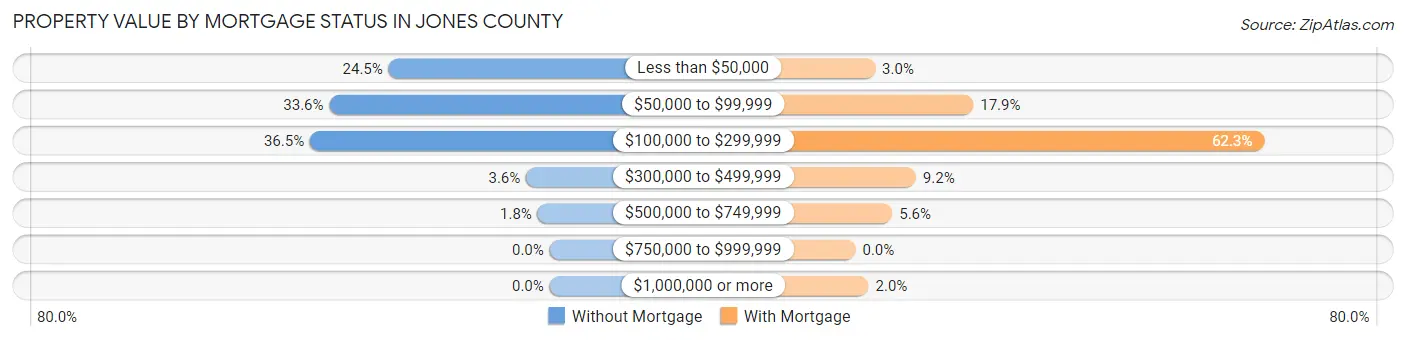
| Property Value | Without Mortgage | With Mortgage |
| Less than $50,000 | 391 (24.5%) | 39 (3.0%) |
| $50,000 to $99,999 | 535 (33.6%) | 234 (17.9%) |
| $100,000 to $299,999 | 582 (36.5%) | 812 (62.3%) |
| $300,000 to $499,999 | 57 (3.6%) | 120 (9.2%) |
| $500,000 to $749,999 | 29 (1.8%) | 73 (5.6%) |
| $750,000 to $999,999 | 0 (0.0%) | 0 (0.0%) |
| $1,000,000 or more | 0 (0.0%) | 26 (2.0%) |
| Total | 1,594 (100.0%) | 1,304 (100.0%) |
Household Income by Mortgage Status in Jones County
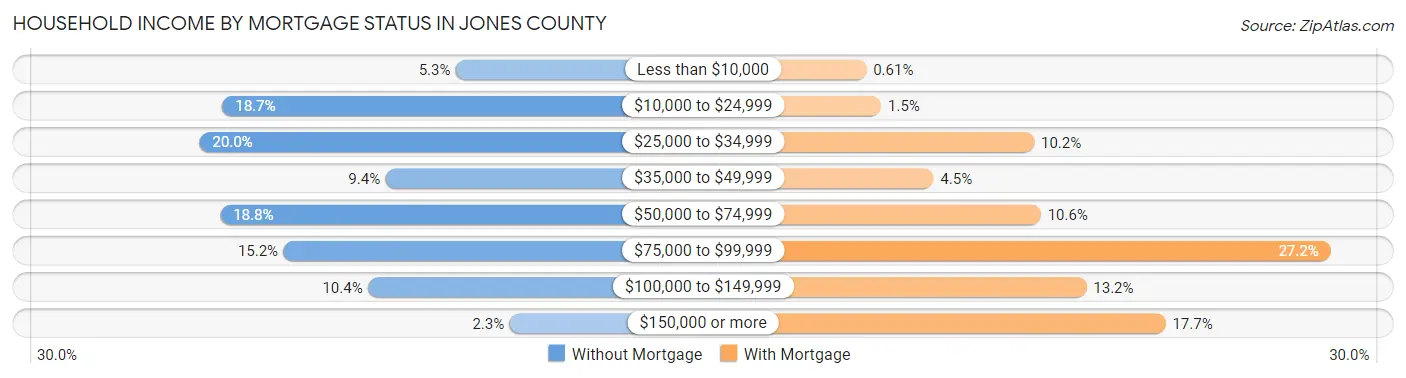
| Household Income | Without Mortgage | With Mortgage |
| Less than $10,000 | 85 (5.3%) | 8 (0.6%) |
| $10,000 to $24,999 | 298 (18.7%) | 19 (1.5%) |
| $25,000 to $34,999 | 319 (20.0%) | 133 (10.2%) |
| $35,000 to $49,999 | 149 (9.3%) | 58 (4.4%) |
| $50,000 to $74,999 | 300 (18.8%) | 138 (10.6%) |
| $75,000 to $99,999 | 242 (15.2%) | 354 (27.2%) |
| $100,000 to $149,999 | 165 (10.3%) | 172 (13.2%) |
| $150,000 or more | 36 (2.3%) | 231 (17.7%) |
| Total | 1,594 (100.0%) | 1,304 (100.0%) |
Property Value to Household Income Ratio in Jones County
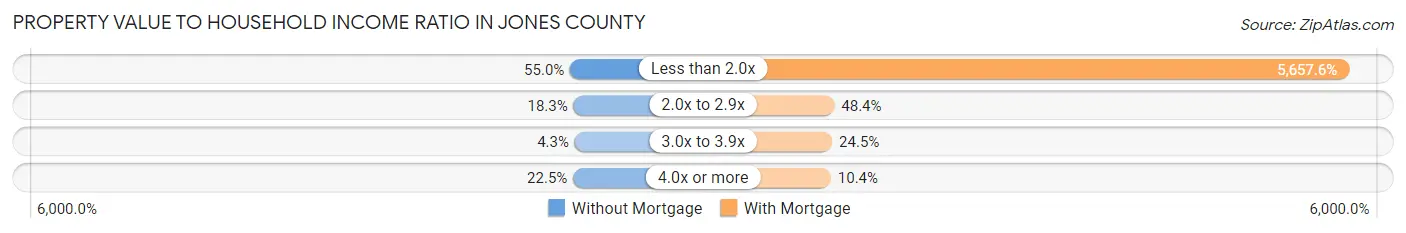
| Value-to-Income Ratio | Without Mortgage | With Mortgage |
| Less than 2.0x | 876 (55.0%) | 73,775 (5,657.6%) |
| 2.0x to 2.9x | 291 (18.3%) | 631 (48.4%) |
| 3.0x to 3.9x | 68 (4.3%) | 319 (24.5%) |
| 4.0x or more | 359 (22.5%) | 135 (10.3%) |
| Total | 1,594 (100.0%) | 1,304 (100.0%) |
Real Estate Taxes by Mortgage Status in Jones County
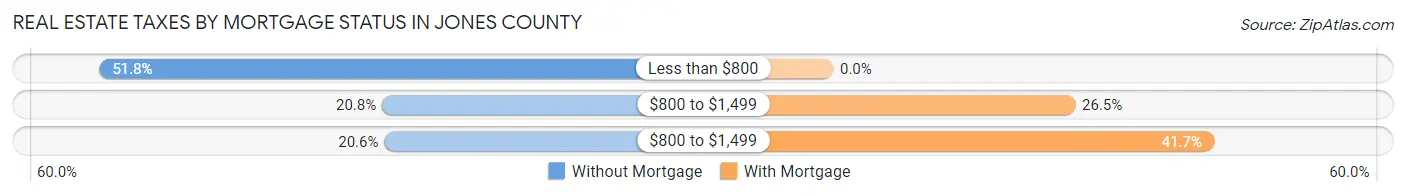
| Property Taxes | Without Mortgage | With Mortgage |
| Less than $800 | 826 (51.8%) | 0 (0.0%) |
| $800 to $1,499 | 332 (20.8%) | 346 (26.5%) |
| $800 to $1,499 | 328 (20.6%) | 544 (41.7%) |
| Total | 1,594 (100.0%) | 1,304 (100.0%) |
Health & Disability in Jones County
Health Insurance Coverage by Age in Jones County
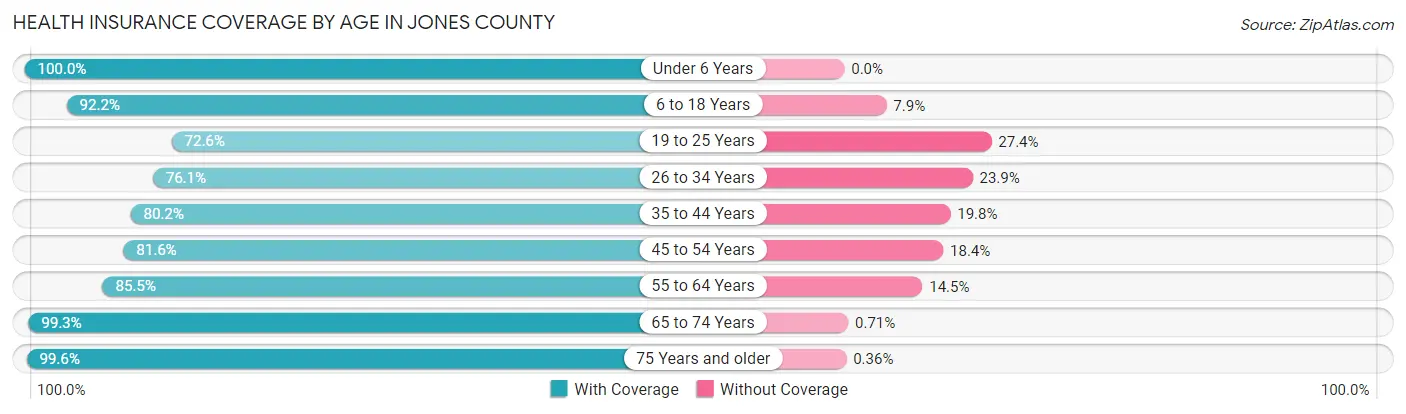
| Age Bracket | With Coverage | Without Coverage |
| Under 6 Years | 498 (100.0%) | 0 (0.0%) |
| 6 to 18 Years | 1,197 (92.1%) | 102 (7.9%) |
| 19 to 25 Years | 524 (72.6%) | 198 (27.4%) |
| 26 to 34 Years | 630 (76.1%) | 198 (23.9%) |
| 35 to 44 Years | 731 (80.2%) | 180 (19.8%) |
| 45 to 54 Years | 1,018 (81.6%) | 230 (18.4%) |
| 55 to 64 Years | 1,322 (85.5%) | 225 (14.5%) |
| 65 to 74 Years | 1,266 (99.3%) | 9 (0.7%) |
| 75 Years and older | 820 (99.6%) | 3 (0.4%) |
| Total | 8,006 (87.5%) | 1,145 (12.5%) |
Health Insurance Coverage by Citizenship Status in Jones County
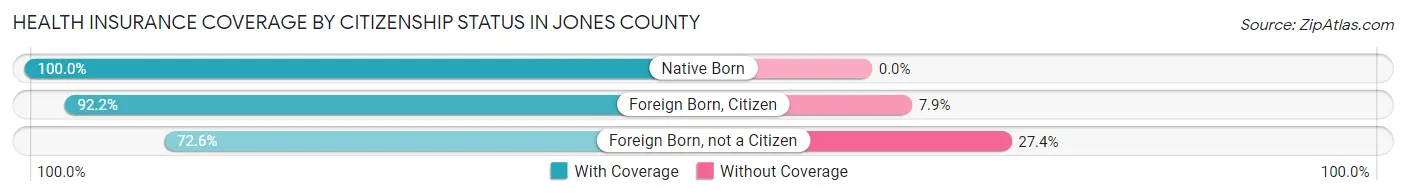
| Citizenship Status | With Coverage | Without Coverage |
| Native Born | 498 (100.0%) | 0 (0.0%) |
| Foreign Born, Citizen | 1,197 (92.1%) | 102 (7.9%) |
| Foreign Born, not a Citizen | 524 (72.6%) | 198 (27.4%) |
Health Insurance Coverage by Household Income in Jones County
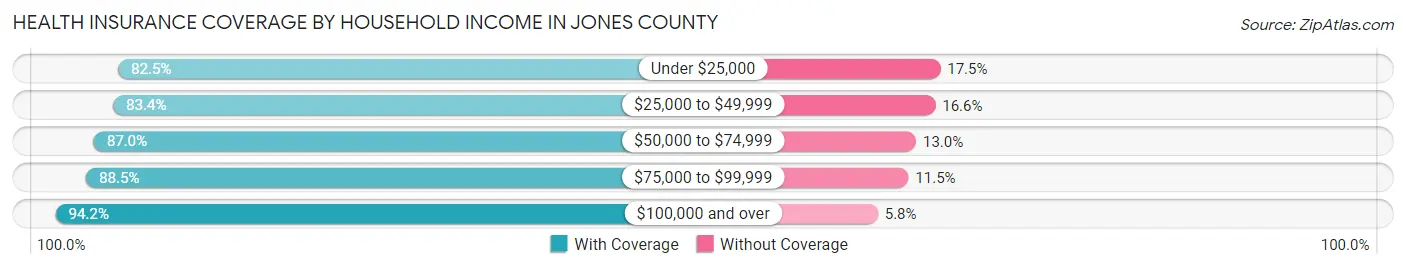
| Household Income | With Coverage | Without Coverage |
| Under $25,000 | 1,361 (82.5%) | 289 (17.5%) |
| $25,000 to $49,999 | 1,555 (83.4%) | 309 (16.6%) |
| $50,000 to $74,999 | 1,785 (87.0%) | 266 (13.0%) |
| $75,000 to $99,999 | 1,089 (88.5%) | 142 (11.5%) |
| $100,000 and over | 2,178 (94.2%) | 134 (5.8%) |
Public vs Private Health Insurance Coverage by Age in Jones County
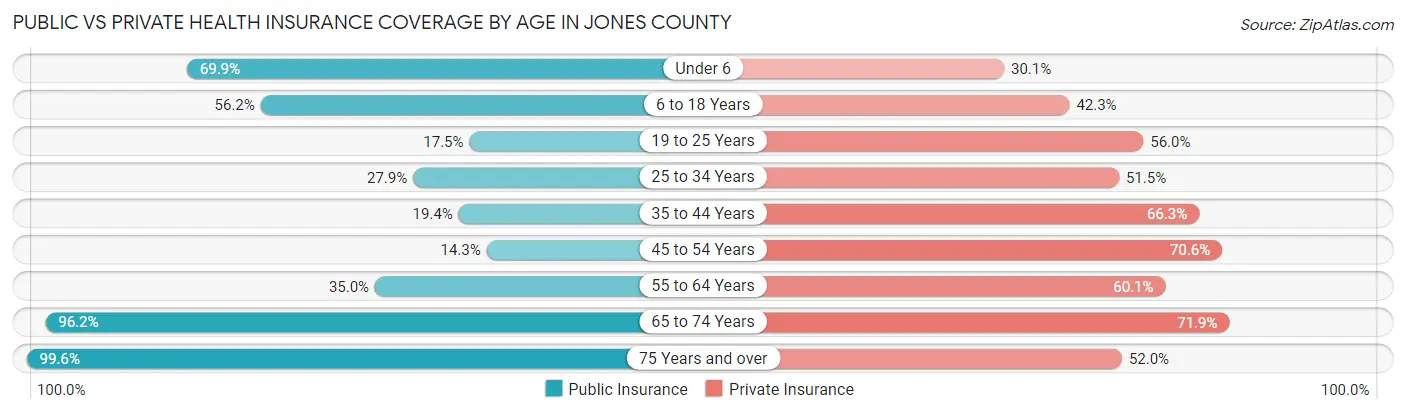
| Age Bracket | Public Insurance | Private Insurance |
| Under 6 | 348 (69.9%) | 150 (30.1%) |
| 6 to 18 Years | 730 (56.2%) | 549 (42.3%) |
| 19 to 25 Years | 126 (17.4%) | 404 (56.0%) |
| 25 to 34 Years | 231 (27.9%) | 426 (51.4%) |
| 35 to 44 Years | 177 (19.4%) | 604 (66.3%) |
| 45 to 54 Years | 178 (14.3%) | 881 (70.6%) |
| 55 to 64 Years | 541 (35.0%) | 929 (60.1%) |
| 65 to 74 Years | 1,226 (96.2%) | 917 (71.9%) |
| 75 Years and over | 820 (99.6%) | 428 (52.0%) |
| Total | 4,377 (47.8%) | 5,288 (57.8%) |
Disability Status by Sex by Age in Jones County
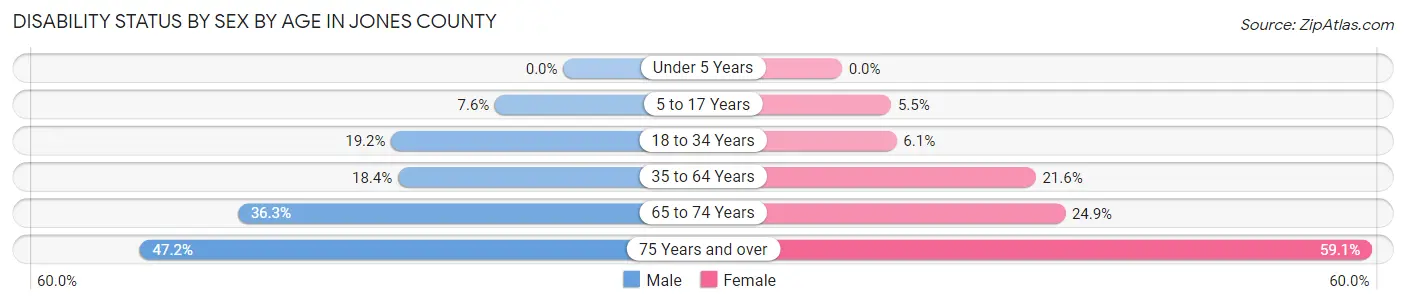
| Age Bracket | Male | Female |
| Under 5 Years | 0 (0.0%) | 0 (0.0%) |
| 5 to 17 Years | 56 (7.6%) | 30 (5.5%) |
| 18 to 34 Years | 173 (19.2%) | 45 (6.1%) |
| 35 to 64 Years | 328 (18.4%) | 415 (21.6%) |
| 65 to 74 Years | 223 (36.3%) | 164 (24.8%) |
| 75 Years and over | 159 (47.2%) | 287 (59.1%) |
Disability Class by Sex by Age in Jones County
Disability Class: Hearing Difficulty
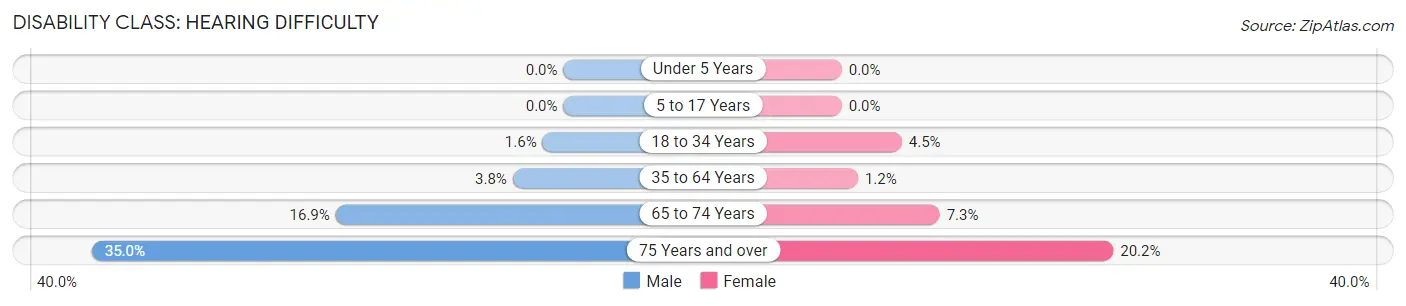
| Age Bracket | Male | Female |
| Under 5 Years | 0 (0.0%) | 0 (0.0%) |
| 5 to 17 Years | 0 (0.0%) | 0 (0.0%) |
| 18 to 34 Years | 14 (1.5%) | 33 (4.5%) |
| 35 to 64 Years | 67 (3.8%) | 23 (1.2%) |
| 65 to 74 Years | 104 (16.9%) | 48 (7.3%) |
| 75 Years and over | 118 (35.0%) | 98 (20.2%) |
Disability Class: Vision Difficulty
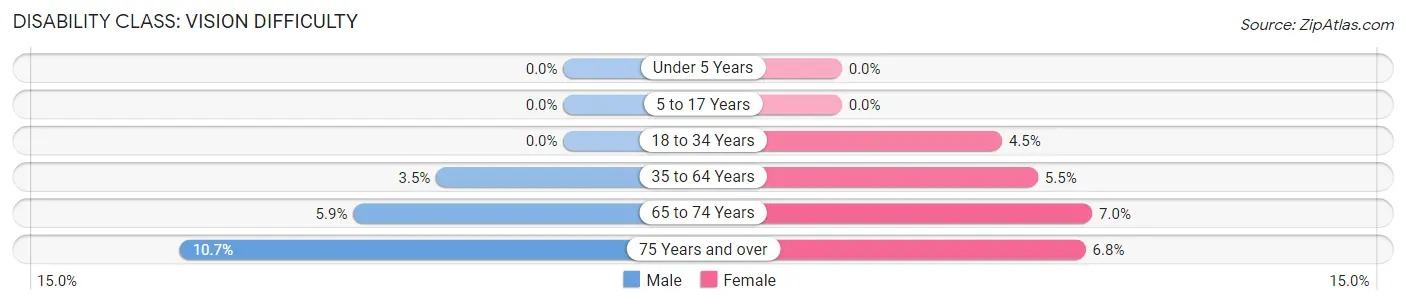
| Age Bracket | Male | Female |
| Under 5 Years | 0 (0.0%) | 0 (0.0%) |
| 5 to 17 Years | 0 (0.0%) | 0 (0.0%) |
| 18 to 34 Years | 0 (0.0%) | 33 (4.5%) |
| 35 to 64 Years | 63 (3.5%) | 105 (5.5%) |
| 65 to 74 Years | 36 (5.9%) | 46 (7.0%) |
| 75 Years and over | 36 (10.7%) | 33 (6.8%) |
Disability Class: Cognitive Difficulty
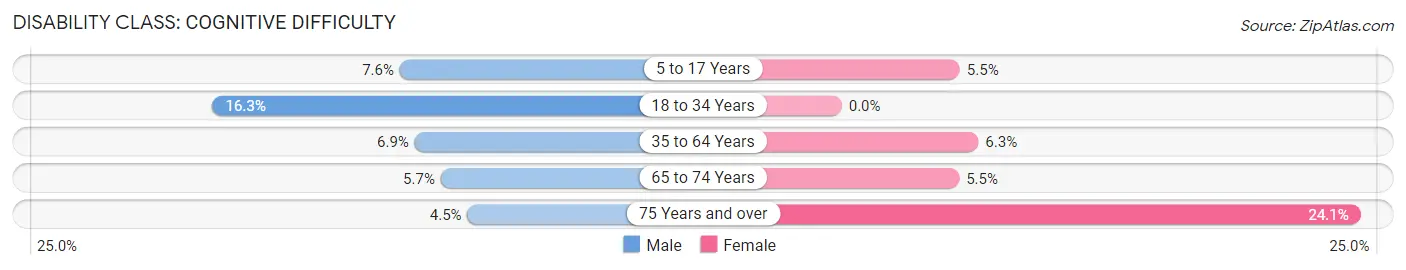
| Age Bracket | Male | Female |
| 5 to 17 Years | 56 (7.6%) | 30 (5.5%) |
| 18 to 34 Years | 147 (16.3%) | 0 (0.0%) |
| 35 to 64 Years | 123 (6.9%) | 122 (6.3%) |
| 65 to 74 Years | 35 (5.7%) | 36 (5.4%) |
| 75 Years and over | 15 (4.4%) | 117 (24.1%) |
Disability Class: Ambulatory Difficulty
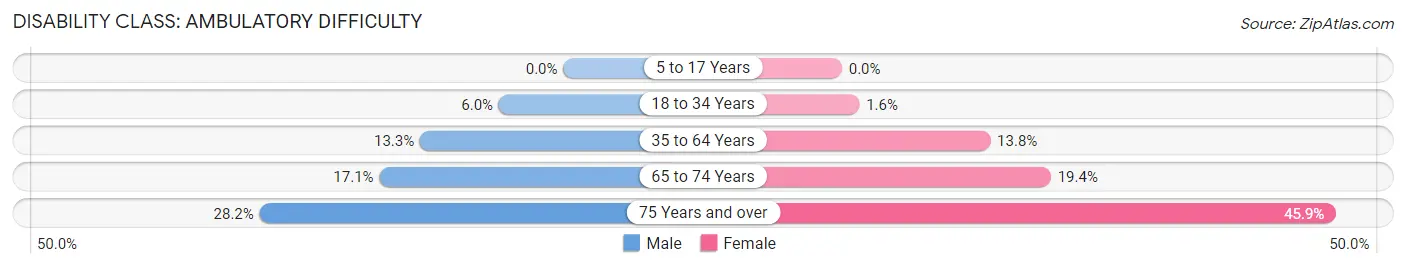
| Age Bracket | Male | Female |
| 5 to 17 Years | 0 (0.0%) | 0 (0.0%) |
| 18 to 34 Years | 54 (6.0%) | 12 (1.6%) |
| 35 to 64 Years | 237 (13.3%) | 265 (13.8%) |
| 65 to 74 Years | 105 (17.1%) | 128 (19.4%) |
| 75 Years and over | 95 (28.2%) | 223 (45.9%) |
Disability Class: Self-Care Difficulty
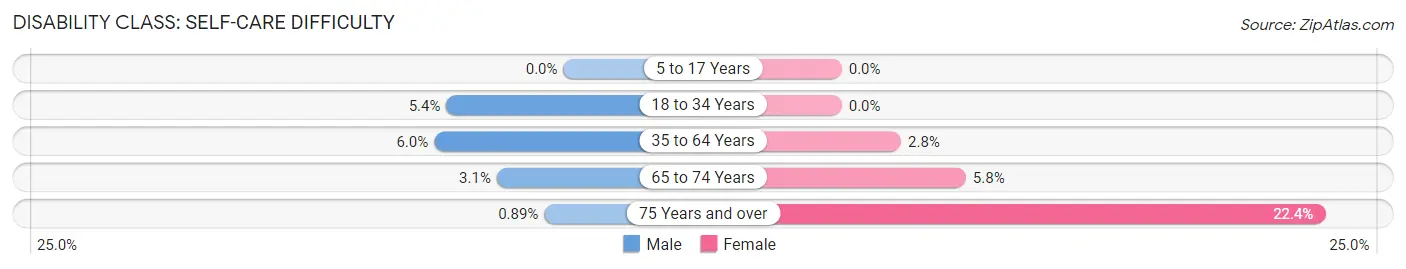
| Age Bracket | Male | Female |
| 5 to 17 Years | 0 (0.0%) | 0 (0.0%) |
| 18 to 34 Years | 49 (5.4%) | 0 (0.0%) |
| 35 to 64 Years | 107 (6.0%) | 53 (2.8%) |
| 65 to 74 Years | 19 (3.1%) | 38 (5.8%) |
| 75 Years and over | 3 (0.9%) | 109 (22.4%) |
Technology Access in Jones County
Computing Device Access in Jones County
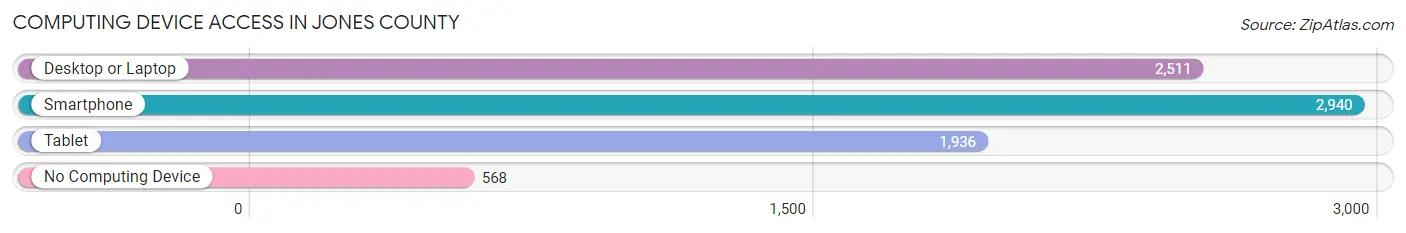
| Device Type | # Households | % Households |
| Desktop or Laptop | 2,511 | 65.8% |
| Smartphone | 2,940 | 77.1% |
| Tablet | 1,936 | 50.7% |
| No Computing Device | 568 | 14.9% |
| Total | 3,815 | 100.0% |
Internet Access in Jones County
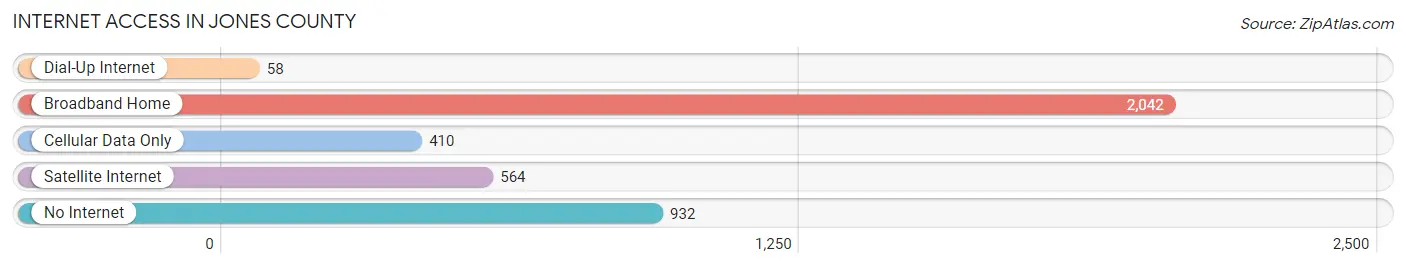
| Internet Type | # Households | % Households |
| Dial-Up Internet | 58 | 1.5% |
| Broadband Home | 2,042 | 53.5% |
| Cellular Data Only | 410 | 10.7% |
| Satellite Internet | 564 | 14.8% |
| No Internet | 932 | 24.4% |
| Total | 3,815 | 100.0% |
Jones County Summary
Jones County is located in the eastern part of North Carolina, in the Coastal Plain region. It is bordered by Craven County to the north, Lenoir County to the east, Pitt County to the south, and Onslow County to the west. The county seat is Trenton, and the county is named after Willie Jones, a prominent North Carolina politician and Revolutionary War leader.
Geography
Jones County covers an area of 545 square miles, with a population of 10,717 people as of the 2010 census. The county is mostly rural, with the majority of the population living in small towns and villages. The terrain is mostly flat, with some rolling hills in the northern part of the county. The county is drained by the Trent River, which flows through the county from north to south.
The climate of Jones County is humid subtropical, with hot, humid summers and mild winters. The average annual temperature is around 70 degrees Fahrenheit, and the average annual precipitation is around 45 inches.
Economy
The economy of Jones County is largely based on agriculture. The county is home to a number of farms, which produce a variety of crops, including corn, soybeans, cotton, and tobacco. The county also has a number of timber and lumber operations, as well as some manufacturing and service industries.
Demographics
As of the 2010 census, the population of Jones County was 10,717, with a population density of 19.7 people per square mile. The racial makeup of the county was 79.2% White, 17.3% African American, 0.7% Native American, 0.4% Asian, 0.1% Pacific Islander, 1.2% from other races, and 1.1% from two or more races. Hispanic or Latino of any race were 2.7% of the population.
The median income for a household in the county was $35,945, and the median income for a family was $43,945. The per capita income for the county was $17,845. About 17.2% of the population was below the poverty line.
Conclusion
Jones County is a rural county located in the eastern part of North Carolina. It is home to a largely agricultural economy, with a population of 10,717 people as of the 2010 census. The county is mostly flat, with some rolling hills in the northern part of the county. The climate is humid subtropical, with hot, humid summers and mild winters. The racial makeup of the county is mostly White, with a significant African American population. The median income for a household in the county is $35,945, and the per capita income is $17,845.
Common Questions
What is Per Capita Income in Jones County?
Per Capita income in Jones County is $28,373.
What is the Median Family Income in Jones County?
Median Family Income in Jones County is $68,705.
What is the Median Household income in Jones County?
Median Household Income in Jones County is $53,053.
What is Income or Wage Gap in Jones County?
Income or Wage Gap in Jones County is 33.6%.
Women in Jones County earn 66.4 cents for every dollar earned by a man.
What is Inequality or Gini Index in Jones County?
Inequality or Gini Index in Jones County is 0.45.
What is the Total Population of Jones County?
Total Population of Jones County is 9,263.
What is the Total Male Population of Jones County?
Total Male Population of Jones County is 4,636.
What is the Total Female Population of Jones County?
Total Female Population of Jones County is 4,627.
What is the Ratio of Males per 100 Females in Jones County?
There are 100.19 Males per 100 Females in Jones County.
What is the Ratio of Females per 100 Males in Jones County?
There are 99.81 Females per 100 Males in Jones County.
What is the Median Population Age in Jones County?
Median Population Age in Jones County is 47.9 Years.
What is the Average Family Size in Jones County
Average Family Size in Jones County is 3.0 People.
What is the Average Household Size in Jones County
Average Household Size in Jones County is 2.4 People.
How Large is the Labor Force in Jones County?
There are 4,063 People in the Labor Forcein in Jones County.
What is the Percentage of People in the Labor Force in Jones County?
52.2% of People are in the Labor Force in Jones County.
What is the Unemployment Rate in Jones County?
Unemployment Rate in Jones County is 4.8%.