Haywood County, NC Map & Demographics
Haywood County Map
Haywood County Overview
$34,609
PER CAPITA INCOME
$78,553
AVG FAMILY INCOME
$56,596
AVG HOUSEHOLD INCOME
27.5%
WAGE / INCOME GAP [ % ]
72.5¢/ $1
WAGE / INCOME GAP [ $ ]
$10,144
FAMILY INCOME DEFICIT
0.45
INEQUALITY / GINI INDEX
62,152
TOTAL POPULATION
30,253
MALE POPULATION
31,899
FEMALE POPULATION
94.84
MALES / 100 FEMALES
105.44
FEMALES / 100 MALES
47.7
MEDIAN AGE
2.9
AVG FAMILY SIZE
2.3
AVG HOUSEHOLD SIZE
29,080
LABOR FORCE [ PEOPLE ]
55.5%
PERCENT IN LABOR FORCE
3.5%
UNEMPLOYMENT RATE
Haywood County Area Codes
Income in Haywood County
Income Overview in Haywood County
Per Capita Income in Haywood County is $34,609, while median incomes of families and households are $78,553 and $56,596 respectively.
| Characteristic | Number | Measure |
| Per Capita Income | 62,152 | $34,609 |
| Median Family Income | 16,874 | $78,553 |
| Mean Family Income | 16,874 | $92,754 |
| Median Household Income | 26,481 | $56,596 |
| Mean Household Income | 26,481 | $77,027 |
| Income Deficit | 16,874 | $10,144 |
| Wage / Income Gap (%) | 62,152 | 27.45% |
| Wage / Income Gap ($) | 62,152 | 72.55¢ per $1 |
| Gini / Inequality Index | 62,152 | 0.45 |
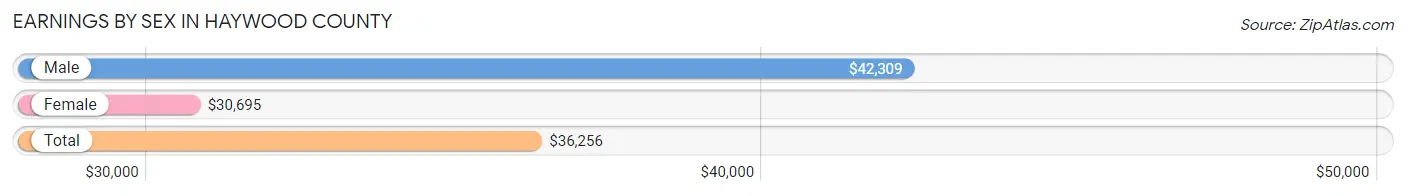
Earnings by Sex in Haywood County
Average Earnings in Haywood County are $36,256, $42,309 for men and $30,695 for women, a difference of 27.5%.
| Sex | Number | Average Earnings |
| Male | 15,160 (50.4%) | $42,309 |
| Female | 14,905 (49.6%) | $30,695 |
| Total | 30,065 (100.0%) | $36,256 |
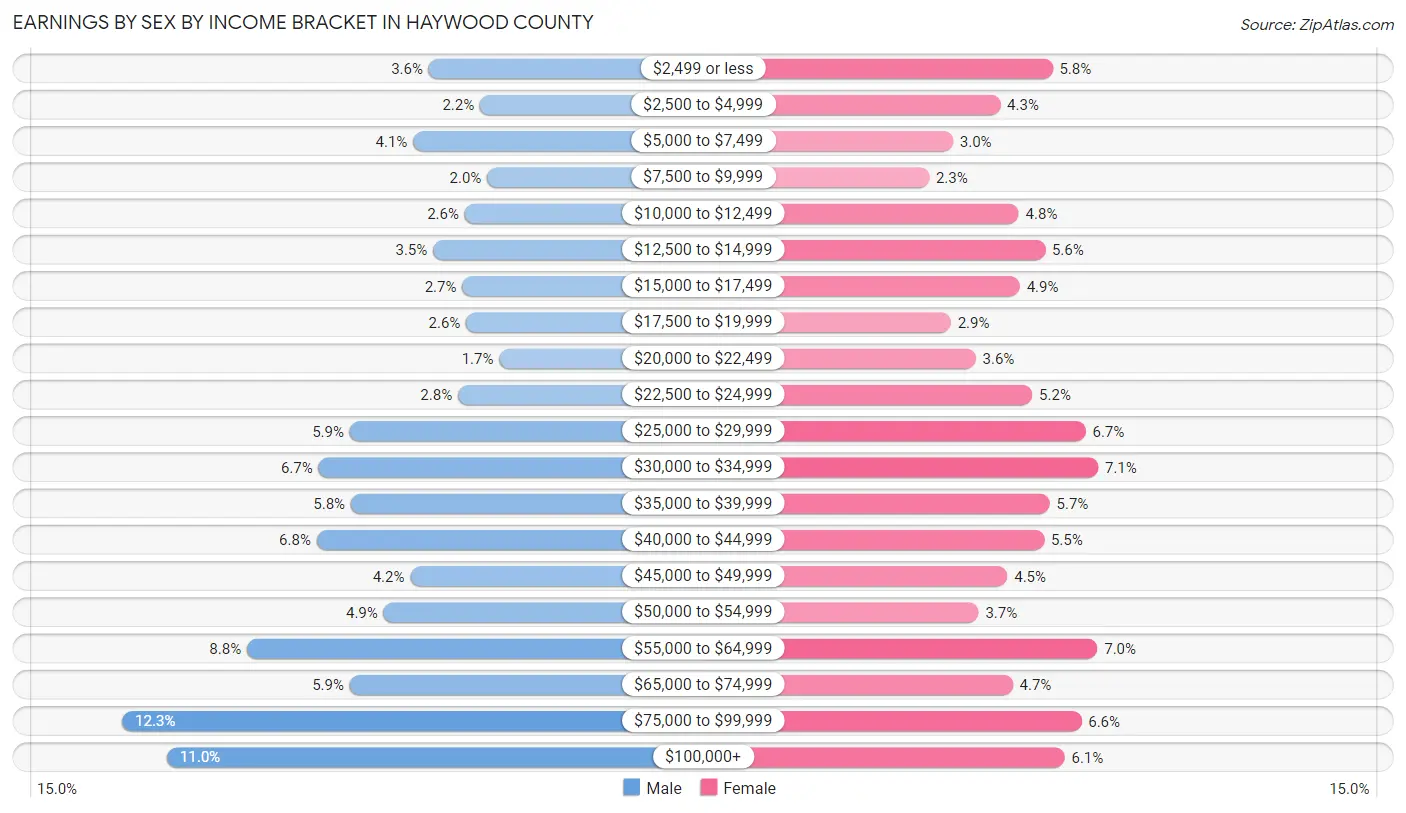
Earnings by Sex by Income Bracket in Haywood County
The most common earnings brackets in Haywood County are $75,000 to $99,999 for men (1,859 | 12.3%) and $30,000 to $34,999 for women (1,052 | 7.1%).
| Income | Male | Female |
| $2,499 or less | 552 (3.6%) | 862 (5.8%) |
| $2,500 to $4,999 | 333 (2.2%) | 642 (4.3%) |
| $5,000 to $7,499 | 618 (4.1%) | 444 (3.0%) |
| $7,500 to $9,999 | 303 (2.0%) | 344 (2.3%) |
| $10,000 to $12,499 | 399 (2.6%) | 720 (4.8%) |
| $12,500 to $14,999 | 533 (3.5%) | 830 (5.6%) |
| $15,000 to $17,499 | 409 (2.7%) | 725 (4.9%) |
| $17,500 to $19,999 | 393 (2.6%) | 435 (2.9%) |
| $20,000 to $22,499 | 251 (1.7%) | 540 (3.6%) |
| $22,500 to $24,999 | 428 (2.8%) | 776 (5.2%) |
| $25,000 to $29,999 | 888 (5.9%) | 1,000 (6.7%) |
| $30,000 to $34,999 | 1,022 (6.7%) | 1,052 (7.1%) |
| $35,000 to $39,999 | 884 (5.8%) | 849 (5.7%) |
| $40,000 to $44,999 | 1,030 (6.8%) | 825 (5.5%) |
| $45,000 to $49,999 | 631 (4.2%) | 672 (4.5%) |
| $50,000 to $54,999 | 745 (4.9%) | 551 (3.7%) |
| $55,000 to $64,999 | 1,327 (8.7%) | 1,049 (7.0%) |
| $65,000 to $74,999 | 888 (5.9%) | 695 (4.7%) |
| $75,000 to $99,999 | 1,859 (12.3%) | 982 (6.6%) |
| $100,000+ | 1,667 (11.0%) | 912 (6.1%) |
| Total | 15,160 (100.0%) | 14,905 (100.0%) |
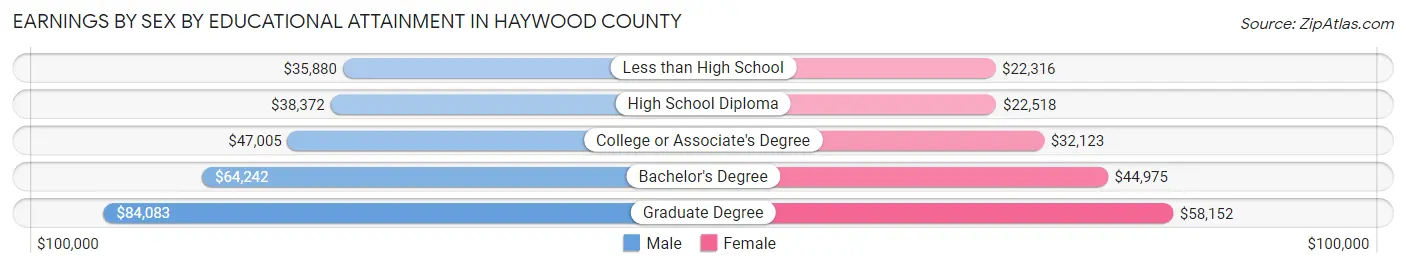
Earnings by Sex by Educational Attainment in Haywood County
Average earnings in Haywood County are $46,421 for men and $34,708 for women, a difference of 25.2%. Men with an educational attainment of graduate degree enjoy the highest average annual earnings of $84,083, while those with less than high school education earn the least with $35,880. Women with an educational attainment of graduate degree earn the most with the average annual earnings of $58,152, while those with less than high school education have the smallest earnings of $22,316.
| Educational Attainment | Male Income | Female Income |
| Less than High School | $35,880 | $22,316 |
| High School Diploma | $38,372 | $22,518 |
| College or Associate's Degree | $47,005 | $32,123 |
| Bachelor's Degree | $64,242 | $44,975 |
| Graduate Degree | $84,083 | $58,152 |
| Total | $46,421 | $34,708 |
Family Income in Haywood County
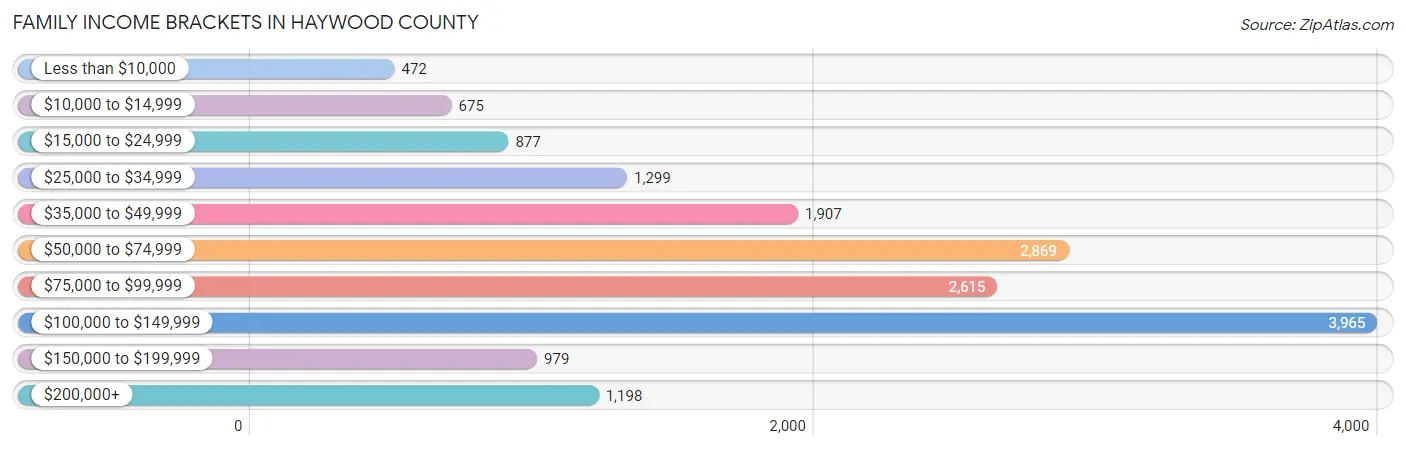
Family Income Brackets in Haywood County
According to the Haywood County family income data, there are 3,965 families falling into the $100,000 to $149,999 income range, which is the most common income bracket and makes up 23.5% of all families. Conversely, the less than $10,000 income bracket is the least frequent group with only 472 families (2.8%) belonging to this category.
| Income Bracket | # Families | % Families |
| Less than $10,000 | 472 | 2.8% |
| $10,000 to $14,999 | 675 | 4.0% |
| $15,000 to $24,999 | 877 | 5.2% |
| $25,000 to $34,999 | 1,299 | 7.7% |
| $35,000 to $49,999 | 1,907 | 11.3% |
| $50,000 to $74,999 | 2,869 | 17.0% |
| $75,000 to $99,999 | 2,615 | 15.5% |
| $100,000 to $149,999 | 3,965 | 23.5% |
| $150,000 to $199,999 | 979 | 5.8% |
| $200,000+ | 1,198 | 7.1% |
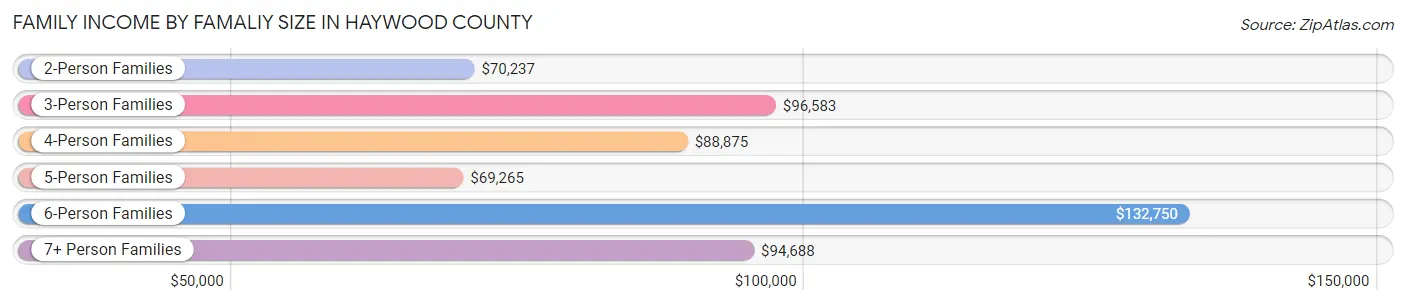
Family Income by Famaliy Size in Haywood County
6-person families (316 | 1.9%) account for the highest median family income in Haywood County with $132,750 per family, while 2-person families (10,179 | 60.3%) have the highest median income of $35,118 per family member.
| Income Bracket | # Families | Median Income |
| 2-Person Families | 10,179 (60.3%) | $70,237 |
| 3-Person Families | 3,461 (20.5%) | $96,583 |
| 4-Person Families | 2,275 (13.5%) | $88,875 |
| 5-Person Families | 578 (3.4%) | $69,265 |
| 6-Person Families | 316 (1.9%) | $132,750 |
| 7+ Person Families | 65 (0.4%) | $94,688 |
| Total | 16,874 (100.0%) | $78,553 |
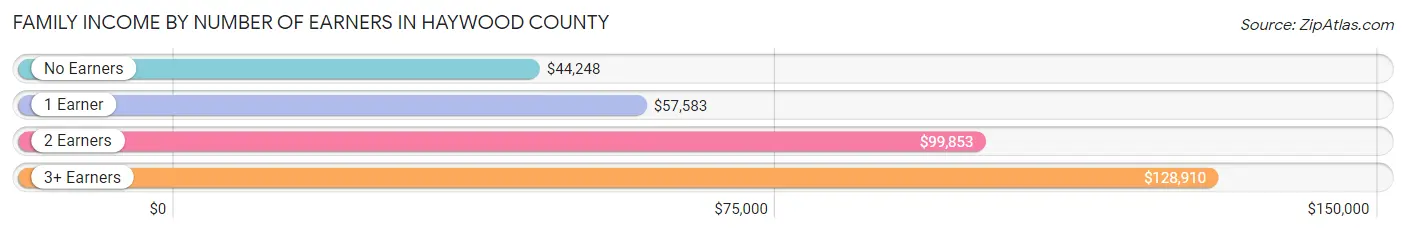
Family Income by Number of Earners in Haywood County
The median family income in Haywood County is $78,553, with families comprising 3+ earners (1,377) having the highest median family income of $128,910, while families with no earners (4,298) have the lowest median family income of $44,248, accounting for 8.2% and 25.5% of families, respectively.
| Number of Earners | # Families | Median Income |
| No Earners | 4,298 (25.5%) | $44,248 |
| 1 Earner | 5,271 (31.2%) | $57,583 |
| 2 Earners | 5,928 (35.1%) | $99,853 |
| 3+ Earners | 1,377 (8.2%) | $128,910 |
| Total | 16,874 (100.0%) | $78,553 |
Household Income in Haywood County
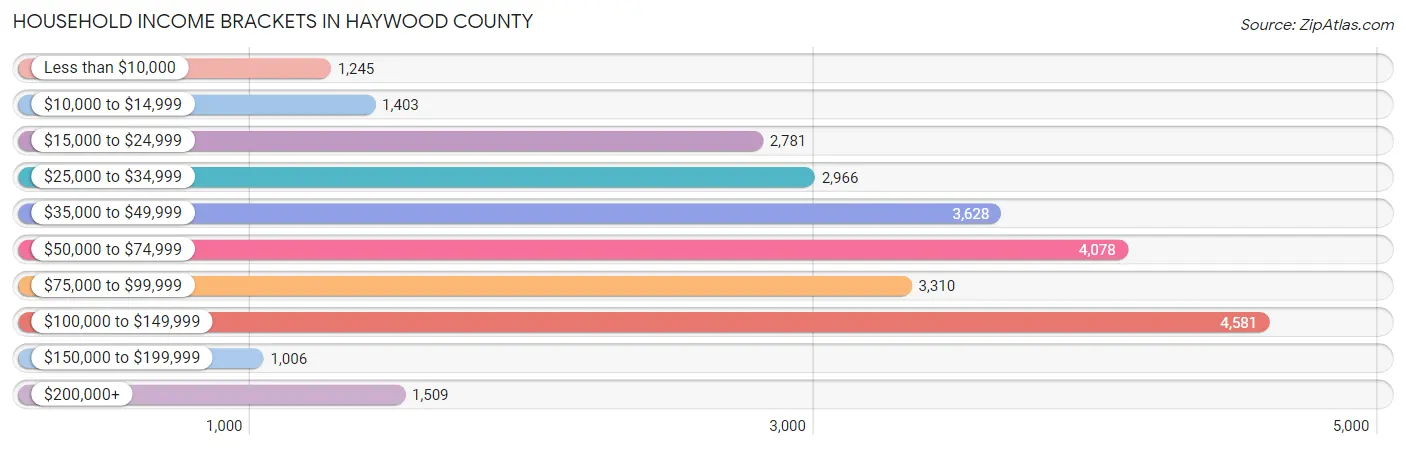
Household Income Brackets in Haywood County
With 4,581 households falling in the category, the $100,000 to $149,999 income range is the most frequent in Haywood County, accounting for 17.3% of all households. In contrast, only 1,006 households (3.8%) fall into the $150,000 to $199,999 income bracket, making it the least populous group.
| Income Bracket | # Households | % Households |
| Less than $10,000 | 1,245 | 4.7% |
| $10,000 to $14,999 | 1,403 | 5.3% |
| $15,000 to $24,999 | 2,781 | 10.5% |
| $25,000 to $34,999 | 2,966 | 11.2% |
| $35,000 to $49,999 | 3,628 | 13.7% |
| $50,000 to $74,999 | 4,078 | 15.4% |
| $75,000 to $99,999 | 3,310 | 12.5% |
| $100,000 to $149,999 | 4,581 | 17.3% |
| $150,000 to $199,999 | 1,006 | 3.8% |
| $200,000+ | 1,509 | 5.7% |
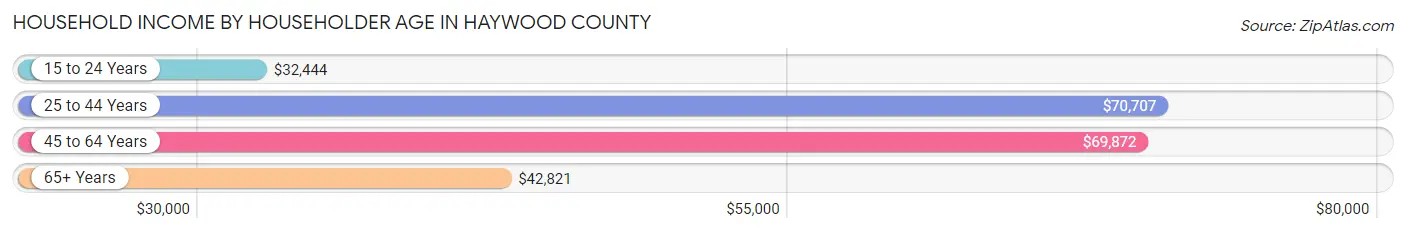
Household Income by Householder Age in Haywood County
The median household income in Haywood County is $56,596, with the highest median household income of $70,707 found in the 25 to 44 years age bracket for the primary householder. A total of 5,887 households (22.2%) fall into this category. Meanwhile, the 15 to 24 years age bracket for the primary householder has the lowest median household income of $32,444, with 1,010 households (3.8%) in this group.
| Income Bracket | # Households | Median Income |
| 15 to 24 Years | 1,010 (3.8%) | $32,444 |
| 25 to 44 Years | 5,887 (22.2%) | $70,707 |
| 45 to 64 Years | 9,790 (37.0%) | $69,872 |
| 65+ Years | 9,794 (37.0%) | $42,821 |
| Total | 26,481 (100.0%) | $56,596 |
Poverty in Haywood County
Income Below Poverty by Sex and Age in Haywood County
With 10.8% poverty level for males and 13.4% for females among the residents of Haywood County, 5 year old males and 6 to 11 year old females are the most vulnerable to poverty, with 213 males (42.0%) and 568 females (29.9%) in their respective age groups living below the poverty level.
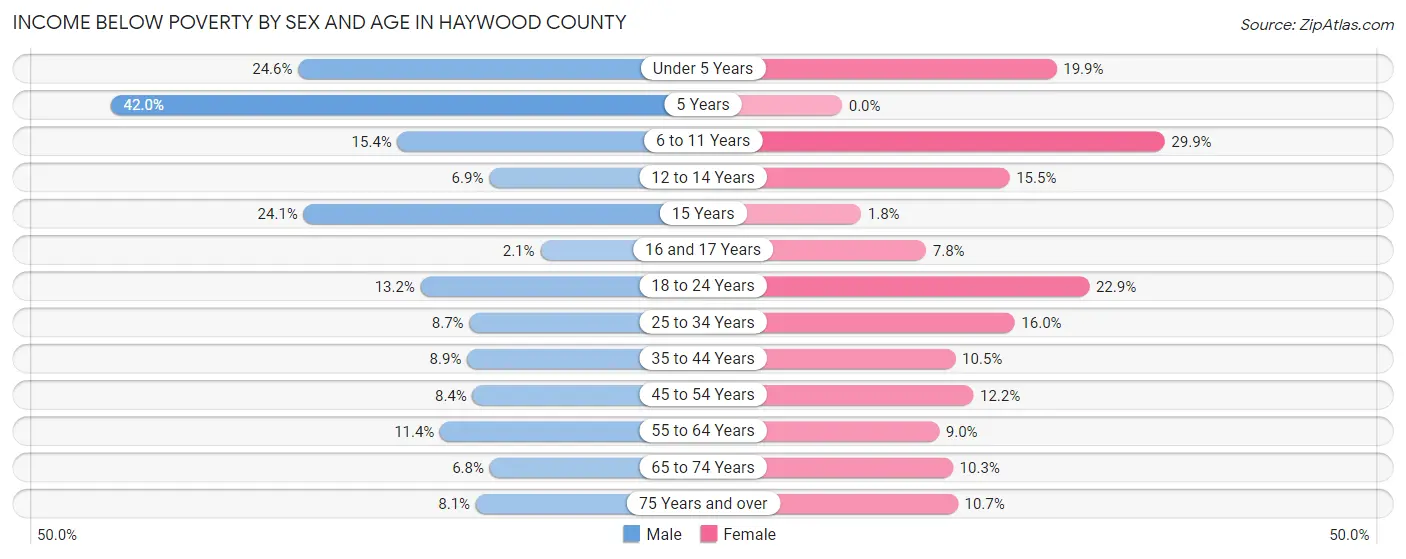
| Age Bracket | Male | Female |
| Under 5 Years | 340 (24.6%) | 255 (19.9%) |
| 5 Years | 213 (42.0%) | 0 (0.0%) |
| 6 to 11 Years | 290 (15.4%) | 568 (29.9%) |
| 12 to 14 Years | 55 (6.9%) | 127 (15.5%) |
| 15 Years | 80 (24.1%) | 6 (1.8%) |
| 16 and 17 Years | 16 (2.1%) | 46 (7.8%) |
| 18 to 24 Years | 288 (13.2%) | 470 (22.9%) |
| 25 to 34 Years | 325 (8.7%) | 566 (16.0%) |
| 35 to 44 Years | 287 (8.9%) | 353 (10.5%) |
| 45 to 54 Years | 323 (8.4%) | 495 (12.2%) |
| 55 to 64 Years | 502 (11.4%) | 453 (9.0%) |
| 65 to 74 Years | 287 (6.8%) | 486 (10.3%) |
| 75 Years and over | 225 (8.1%) | 384 (10.7%) |
| Total | 3,231 (10.8%) | 4,209 (13.4%) |
Income Above Poverty by Sex and Age in Haywood County
According to the poverty statistics in Haywood County, males aged 16 and 17 years and females aged 5 years are the age groups that are most secure financially, with 97.9% of males and 100.0% of females in these age groups living above the poverty line.
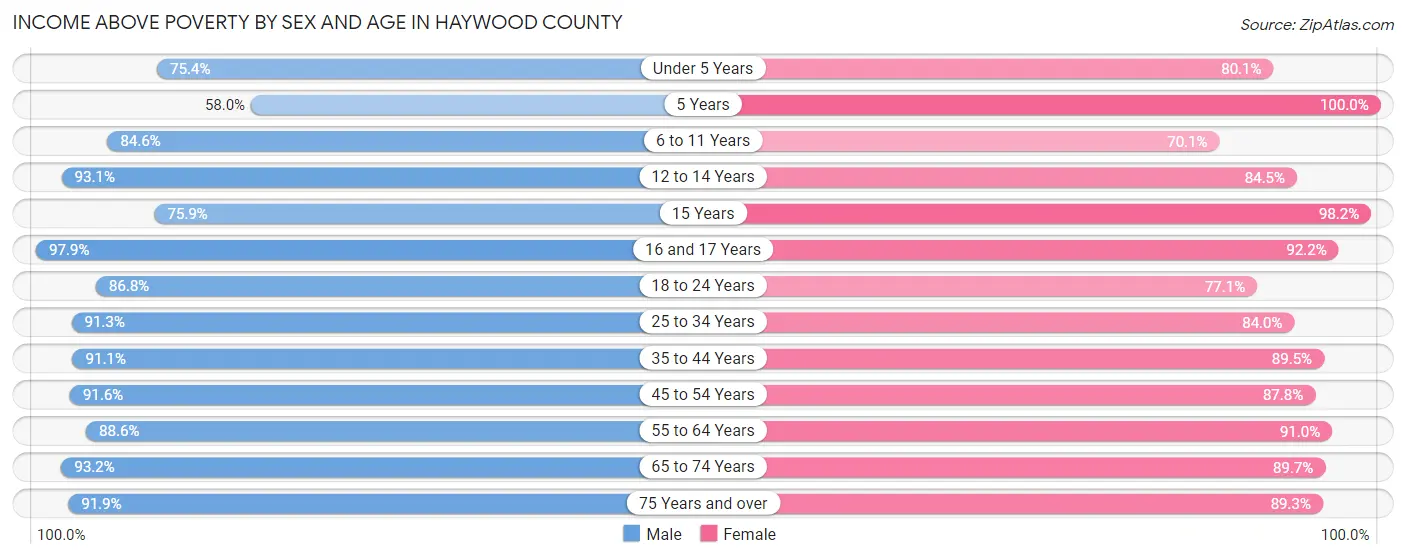
| Age Bracket | Male | Female |
| Under 5 Years | 1,042 (75.4%) | 1,026 (80.1%) |
| 5 Years | 294 (58.0%) | 177 (100.0%) |
| 6 to 11 Years | 1,595 (84.6%) | 1,329 (70.1%) |
| 12 to 14 Years | 744 (93.1%) | 690 (84.5%) |
| 15 Years | 252 (75.9%) | 333 (98.2%) |
| 16 and 17 Years | 736 (97.9%) | 544 (92.2%) |
| 18 to 24 Years | 1,888 (86.8%) | 1,579 (77.1%) |
| 25 to 34 Years | 3,402 (91.3%) | 2,966 (84.0%) |
| 35 to 44 Years | 2,930 (91.1%) | 3,003 (89.5%) |
| 45 to 54 Years | 3,513 (91.6%) | 3,569 (87.8%) |
| 55 to 64 Years | 3,891 (88.6%) | 4,572 (91.0%) |
| 65 to 74 Years | 3,917 (93.2%) | 4,235 (89.7%) |
| 75 Years and over | 2,548 (91.9%) | 3,190 (89.3%) |
| Total | 26,752 (89.2%) | 27,213 (86.6%) |
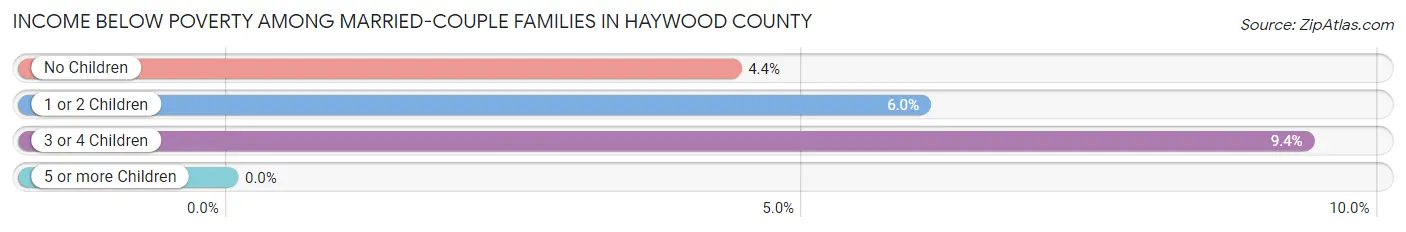
Income Below Poverty Among Married-Couple Families in Haywood County
The poverty statistics for married-couple families in Haywood County show that 5.0% or 643 of the total 12,998 families live below the poverty line. Families with 3 or 4 children have the highest poverty rate of 9.4%, comprising of 37 families. On the other hand, families with 5 or more children have the lowest poverty rate of 0.0%, which includes 0 families.
| Children | Above Poverty | Below Poverty |
| No Children | 8,799 (95.6%) | 403 (4.4%) |
| 1 or 2 Children | 3,163 (94.0%) | 203 (6.0%) |
| 3 or 4 Children | 358 (90.6%) | 37 (9.4%) |
| 5 or more Children | 35 (100.0%) | 0 (0.0%) |
| Total | 12,355 (95.1%) | 643 (5.0%) |
Income Below Poverty Among Single-Parent Households in Haywood County
According to the poverty data in Haywood County, 4.2% or 37 single-father households and 29.3% or 877 single-mother households are living below the poverty line. Among single-father households, those with 1 or 2 children have the highest poverty rate, with 34 households (5.9%) experiencing poverty. Likewise, among single-mother households, those with 3 or 4 children have the highest poverty rate, with 138 households (66.7%) falling below the poverty line.
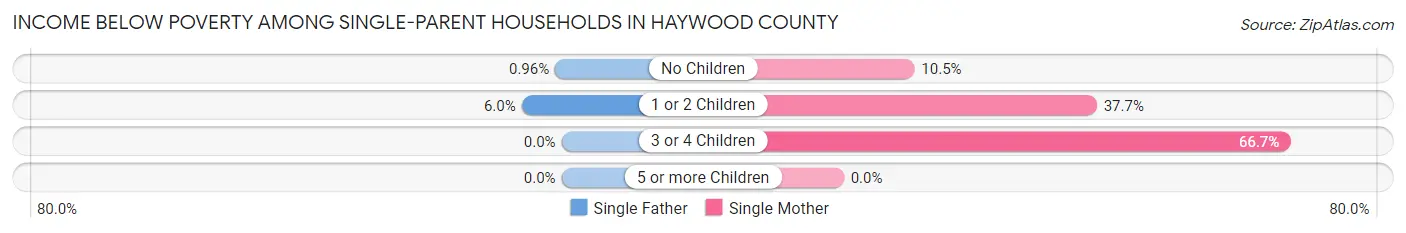
| Children | Single Father | Single Mother |
| No Children | 3 (1.0%) | 121 (10.5%) |
| 1 or 2 Children | 34 (5.9%) | 618 (37.7%) |
| 3 or 4 Children | 0 (0.0%) | 138 (66.7%) |
| 5 or more Children | 0 (0.0%) | 0 (0.0%) |
| Total | 37 (4.2%) | 877 (29.3%) |
Income Below Poverty Among Married-Couple vs Single-Parent Households in Haywood County
The poverty data for Haywood County shows that 643 of the married-couple family households (5.0%) and 914 of the single-parent households (23.6%) are living below the poverty level. Within the married-couple family households, those with 3 or 4 children have the highest poverty rate, with 37 households (9.4%) falling below the poverty line. Among the single-parent households, those with 3 or 4 children have the highest poverty rate, with 138 household (66.7%) living below poverty.
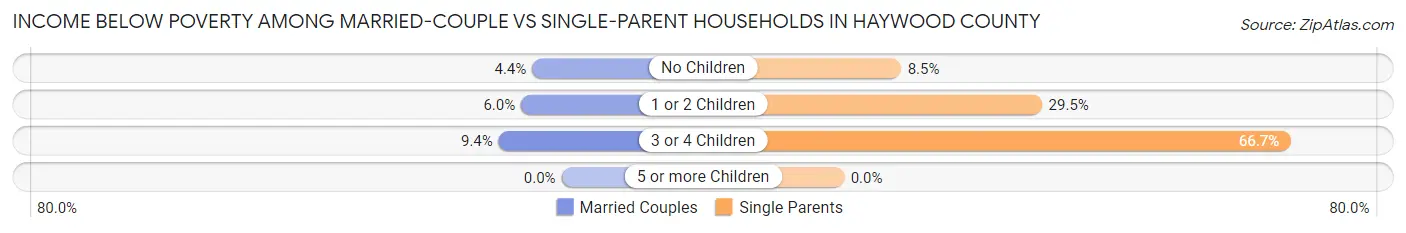
| Children | Married-Couple Families | Single-Parent Households |
| No Children | 403 (4.4%) | 124 (8.5%) |
| 1 or 2 Children | 203 (6.0%) | 652 (29.5%) |
| 3 or 4 Children | 37 (9.4%) | 138 (66.7%) |
| 5 or more Children | 0 (0.0%) | 0 (0.0%) |
| Total | 643 (5.0%) | 914 (23.6%) |
Race in Haywood County
The most populous races in Haywood County are White / Caucasian (57,454 | 92.4%), Two or more Races (2,947 | 4.7%), and Hispanic or Latino (2,812 | 4.5%).
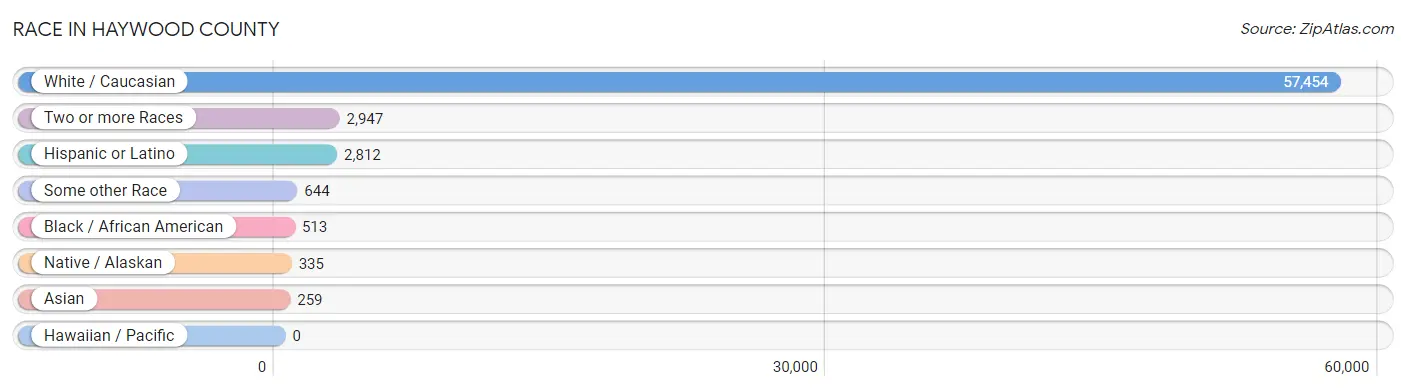
| Race | # Population | % Population |
| Asian | 259 | 0.4% |
| Black / African American | 513 | 0.8% |
| Hawaiian / Pacific | 0 | 0.0% |
| Hispanic or Latino | 2,812 | 4.5% |
| Native / Alaskan | 335 | 0.5% |
| White / Caucasian | 57,454 | 92.4% |
| Two or more Races | 2,947 | 4.7% |
| Some other Race | 644 | 1.0% |
| Total | 62,152 | 100.0% |
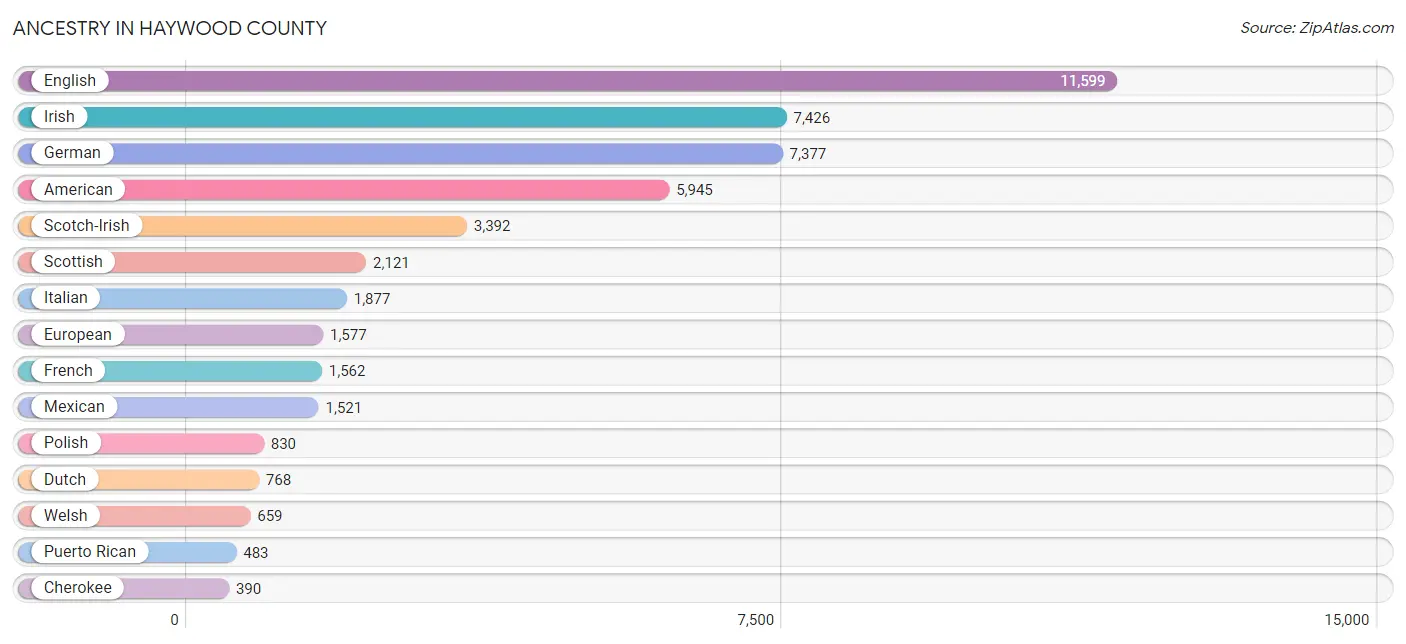
Ancestry in Haywood County
The most populous ancestries reported in Haywood County are English (11,599 | 18.7%), Irish (7,426 | 11.9%), German (7,377 | 11.9%), American (5,945 | 9.6%), and Scotch-Irish (3,392 | 5.5%), together accounting for 57.5% of all Haywood County residents.
| Ancestry | # Population | % Population |
| African | 13 | 0.0% |
| Alaska Native | 11 | 0.0% |
| American | 5,945 | 9.6% |
| Apache | 15 | 0.0% |
| Arab | 157 | 0.3% |
| Argentinean | 7 | 0.0% |
| Armenian | 58 | 0.1% |
| Australian | 9 | 0.0% |
| Austrian | 19 | 0.0% |
| Belgian | 58 | 0.1% |
| Bhutanese | 6 | 0.0% |
| Blackfeet | 35 | 0.1% |
| British | 300 | 0.5% |
| Burmese | 32 | 0.1% |
| Cajun | 83 | 0.1% |
| Cambodian | 132 | 0.2% |
| Canadian | 118 | 0.2% |
| Celtic | 32 | 0.1% |
| Central American | 84 | 0.1% |
| Cherokee | 390 | 0.6% |
| Chickasaw | 24 | 0.0% |
| Chippewa | 10 | 0.0% |
| Colombian | 77 | 0.1% |
| Croatian | 19 | 0.0% |
| Cuban | 288 | 0.5% |
| Czech | 59 | 0.1% |
| Czechoslovakian | 9 | 0.0% |
| Danish | 128 | 0.2% |
| Dominican | 11 | 0.0% |
| Dutch | 768 | 1.2% |
| Dutch West Indian | 6 | 0.0% |
| Eastern European | 71 | 0.1% |
| Ecuadorian | 28 | 0.1% |
| English | 11,599 | 18.7% |
| European | 1,577 | 2.5% |
| Finnish | 55 | 0.1% |
| French | 1,562 | 2.5% |
| French Canadian | 331 | 0.5% |
| German | 7,377 | 11.9% |
| Greek | 77 | 0.1% |
| Haitian | 3 | 0.0% |
| Hungarian | 142 | 0.2% |
| Indian (Asian) | 145 | 0.2% |
| Irish | 7,426 | 11.9% |
| Iroquois | 25 | 0.0% |
| Italian | 1,877 | 3.0% |
| Korean | 186 | 0.3% |
| Latvian | 24 | 0.0% |
| Lebanese | 70 | 0.1% |
| Lithuanian | 59 | 0.1% |
| Lumbee | 17 | 0.0% |
| Mexican | 1,521 | 2.5% |
| Mexican American Indian | 207 | 0.3% |
| Mongolian | 2 | 0.0% |
| Moroccan | 35 | 0.1% |
| Native Hawaiian | 32 | 0.1% |
| Nicaraguan | 69 | 0.1% |
| Northern European | 111 | 0.2% |
| Norwegian | 219 | 0.4% |
| Pakistani | 4 | 0.0% |
| Pennsylvania German | 2 | 0.0% |
| Polish | 830 | 1.3% |
| Portuguese | 101 | 0.2% |
| Pueblo | 79 | 0.1% |
| Puerto Rican | 483 | 0.8% |
| Romanian | 32 | 0.1% |
| Russian | 303 | 0.5% |
| Salvadoran | 15 | 0.0% |
| Scandinavian | 302 | 0.5% |
| Scotch-Irish | 3,392 | 5.5% |
| Scottish | 2,121 | 3.4% |
| Seminole | 31 | 0.1% |
| Sioux | 22 | 0.0% |
| Slovak | 35 | 0.1% |
| Slovene | 7 | 0.0% |
| South American | 131 | 0.2% |
| Spaniard | 128 | 0.2% |
| Spanish | 86 | 0.1% |
| Sri Lankan | 50 | 0.1% |
| Subsaharan African | 29 | 0.1% |
| Swedish | 296 | 0.5% |
| Swiss | 44 | 0.1% |
| Syrian | 44 | 0.1% |
| Thai | 46 | 0.1% |
| Trinidadian and Tobagonian | 8 | 0.0% |
| Ukrainian | 22 | 0.0% |
| Venezuelan | 19 | 0.0% |
| Welsh | 659 | 1.1% |
| Yugoslavian | 9 | 0.0% | View All 89 Rows |
Immigrants in Haywood County
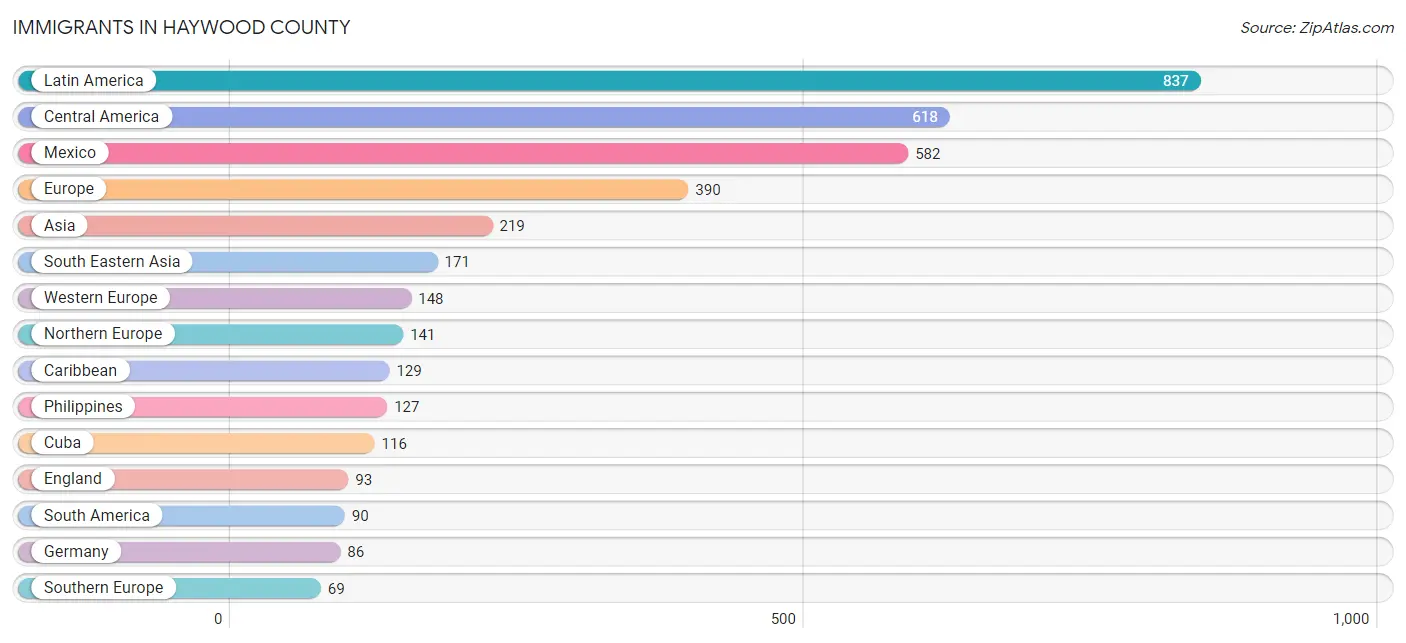
The most numerous immigrant groups reported in Haywood County came from Latin America (837 | 1.3%), Central America (618 | 1.0%), Mexico (582 | 0.9%), Europe (390 | 0.6%), and Asia (219 | 0.4%), together accounting for 4.3% of all Haywood County residents.
| Immigration Origin | # Population | % Population |
| Africa | 9 | 0.0% |
| Asia | 219 | 0.4% |
| Belarus | 2 | 0.0% |
| Brazil | 14 | 0.0% |
| Canada | 37 | 0.1% |
| Caribbean | 129 | 0.2% |
| Central America | 618 | 1.0% |
| China | 11 | 0.0% |
| Colombia | 57 | 0.1% |
| Cuba | 116 | 0.2% |
| Dominican Republic | 2 | 0.0% |
| Eastern Asia | 11 | 0.0% |
| Eastern Europe | 32 | 0.1% |
| El Salvador | 8 | 0.0% |
| England | 93 | 0.2% |
| Europe | 390 | 0.6% |
| France | 62 | 0.1% |
| Germany | 86 | 0.1% |
| Haiti | 3 | 0.0% |
| India | 30 | 0.1% |
| Italy | 29 | 0.1% |
| Latin America | 837 | 1.3% |
| Latvia | 16 | 0.0% |
| Malaysia | 2 | 0.0% |
| Mexico | 582 | 0.9% |
| Nicaragua | 28 | 0.1% |
| Northern Europe | 141 | 0.2% |
| Philippines | 127 | 0.2% |
| Romania | 7 | 0.0% |
| South Africa | 9 | 0.0% |
| South America | 90 | 0.1% |
| South Central Asia | 37 | 0.1% |
| South Eastern Asia | 171 | 0.3% |
| Southern Europe | 69 | 0.1% |
| Spain | 40 | 0.1% |
| Sri Lanka | 7 | 0.0% |
| Sweden | 9 | 0.0% |
| Thailand | 4 | 0.0% |
| Trinidad and Tobago | 8 | 0.0% |
| Venezuela | 19 | 0.0% |
| Vietnam | 38 | 0.1% |
| Western Europe | 148 | 0.2% | View All 42 Rows |
Sex and Age in Haywood County
Sex and Age in Haywood County
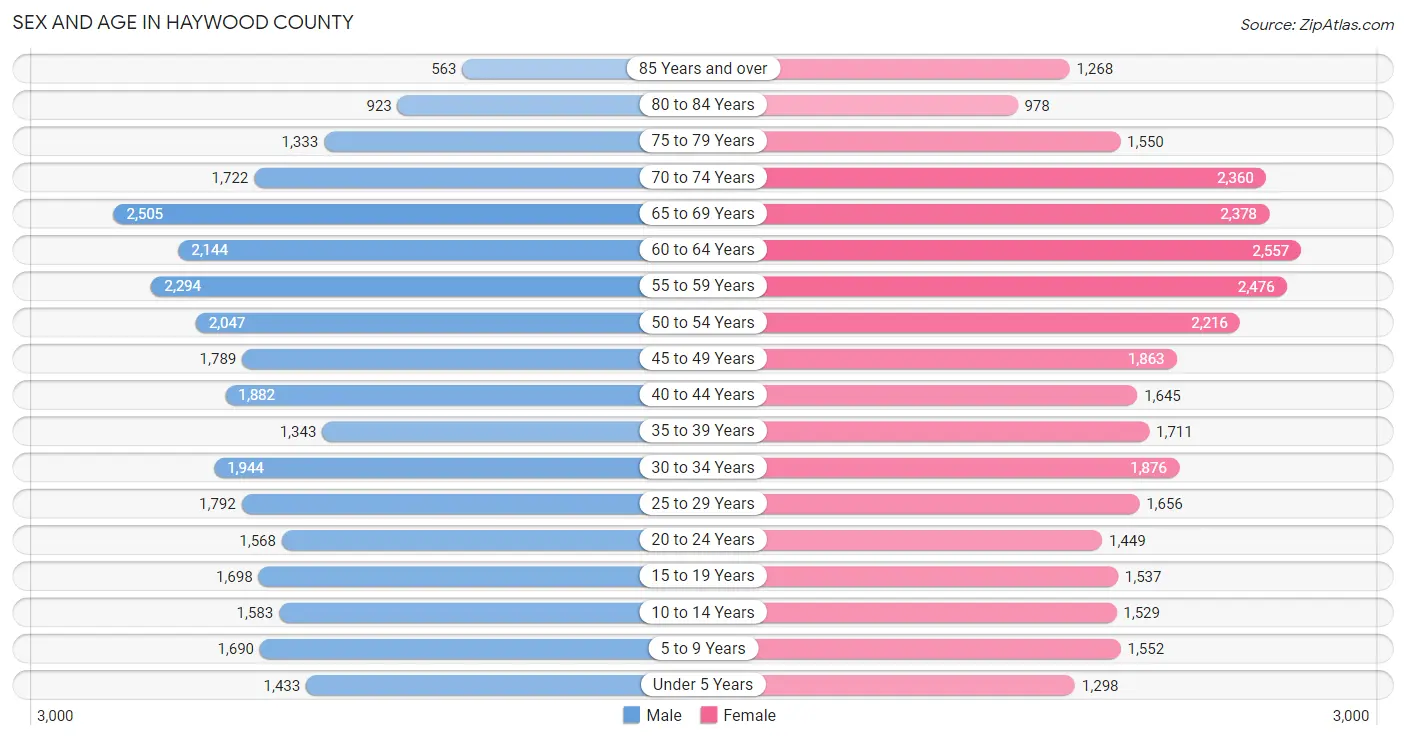
The most populous age groups in Haywood County are 65 to 69 Years (2,505 | 8.3%) for men and 60 to 64 Years (2,557 | 8.0%) for women.
| Age Bracket | Male | Female |
| Under 5 Years | 1,433 (4.7%) | 1,298 (4.1%) |
| 5 to 9 Years | 1,690 (5.6%) | 1,552 (4.9%) |
| 10 to 14 Years | 1,583 (5.2%) | 1,529 (4.8%) |
| 15 to 19 Years | 1,698 (5.6%) | 1,537 (4.8%) |
| 20 to 24 Years | 1,568 (5.2%) | 1,449 (4.5%) |
| 25 to 29 Years | 1,792 (5.9%) | 1,656 (5.2%) |
| 30 to 34 Years | 1,944 (6.4%) | 1,876 (5.9%) |
| 35 to 39 Years | 1,343 (4.4%) | 1,711 (5.4%) |
| 40 to 44 Years | 1,882 (6.2%) | 1,645 (5.2%) |
| 45 to 49 Years | 1,789 (5.9%) | 1,863 (5.8%) |
| 50 to 54 Years | 2,047 (6.8%) | 2,216 (7.0%) |
| 55 to 59 Years | 2,294 (7.6%) | 2,476 (7.8%) |
| 60 to 64 Years | 2,144 (7.1%) | 2,557 (8.0%) |
| 65 to 69 Years | 2,505 (8.3%) | 2,378 (7.4%) |
| 70 to 74 Years | 1,722 (5.7%) | 2,360 (7.4%) |
| 75 to 79 Years | 1,333 (4.4%) | 1,550 (4.9%) |
| 80 to 84 Years | 923 (3.0%) | 978 (3.1%) |
| 85 Years and over | 563 (1.9%) | 1,268 (4.0%) |
| Total | 30,253 (100.0%) | 31,899 (100.0%) |
Families and Households in Haywood County
Median Family Size in Haywood County
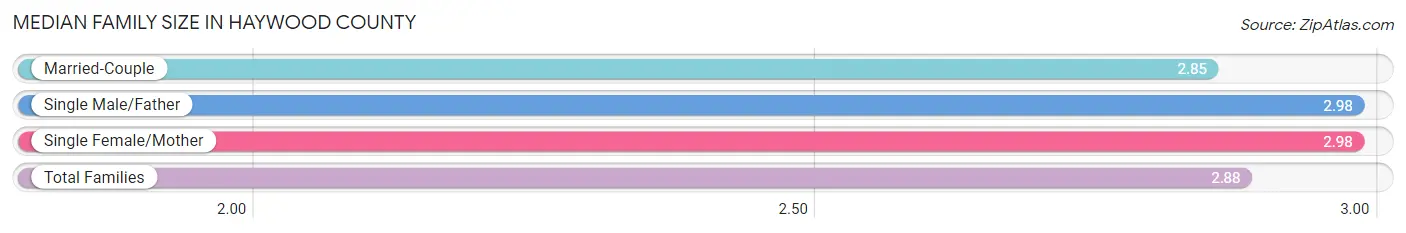
The median family size in Haywood County is 2.88 persons per family, with single male/father families (882 | 5.2%) accounting for the largest median family size of 2.98 persons per family. On the other hand, married-couple families (12,998 | 77.0%) represent the smallest median family size with 2.85 persons per family.
| Family Type | # Families | Family Size |
| Married-Couple | 12,998 (77.0%) | 2.85 |
| Single Male/Father | 882 (5.2%) | 2.98 |
| Single Female/Mother | 2,994 (17.7%) | 2.98 |
| Total Families | 16,874 (100.0%) | 2.88 |
Median Household Size in Haywood County
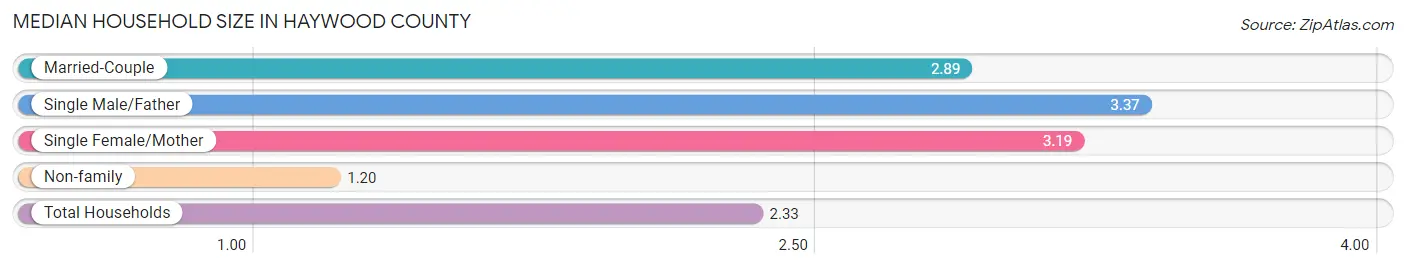
The median household size in Haywood County is 2.33 persons per household, with single male/father households (882 | 3.3%) accounting for the largest median household size of 3.37 persons per household. non-family households (9,607 | 36.3%) represent the smallest median household size with 1.20 persons per household.
| Household Type | # Households | Household Size |
| Married-Couple | 12,998 (49.1%) | 2.89 |
| Single Male/Father | 882 (3.3%) | 3.37 |
| Single Female/Mother | 2,994 (11.3%) | 3.19 |
| Non-family | 9,607 (36.3%) | 1.20 |
| Total Households | 26,481 (100.0%) | 2.33 |
Household Size by Marriage Status in Haywood County
Out of a total of 26,481 households in Haywood County, 16,874 (63.7%) are family households, while 9,607 (36.3%) are nonfamily households. The most numerous type of family households are 2-person households, comprising 9,573, and the most common type of nonfamily households are 1-person households, comprising 8,334.
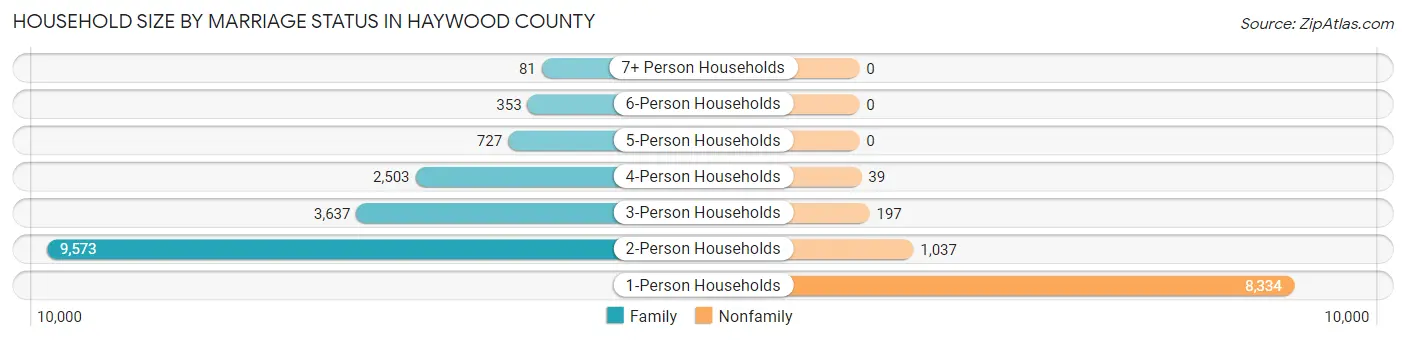
| Household Size | Family Households | Nonfamily Households |
| 1-Person Households | - | 8,334 (31.5%) |
| 2-Person Households | 9,573 (36.1%) | 1,037 (3.9%) |
| 3-Person Households | 3,637 (13.7%) | 197 (0.7%) |
| 4-Person Households | 2,503 (9.5%) | 39 (0.2%) |
| 5-Person Households | 727 (2.8%) | 0 (0.0%) |
| 6-Person Households | 353 (1.3%) | 0 (0.0%) |
| 7+ Person Households | 81 (0.3%) | 0 (0.0%) |
| Total | 16,874 (63.7%) | 9,607 (36.3%) |
Female Fertility in Haywood County
Fertility by Age in Haywood County
Average fertility rate in Haywood County is 33.0 births per 1,000 women. Women in the age bracket of 20 to 34 years have the highest fertility rate with 64.0 births per 1,000 women. Women in the age bracket of 20 to 34 years acount for 80.5% of all women with births.
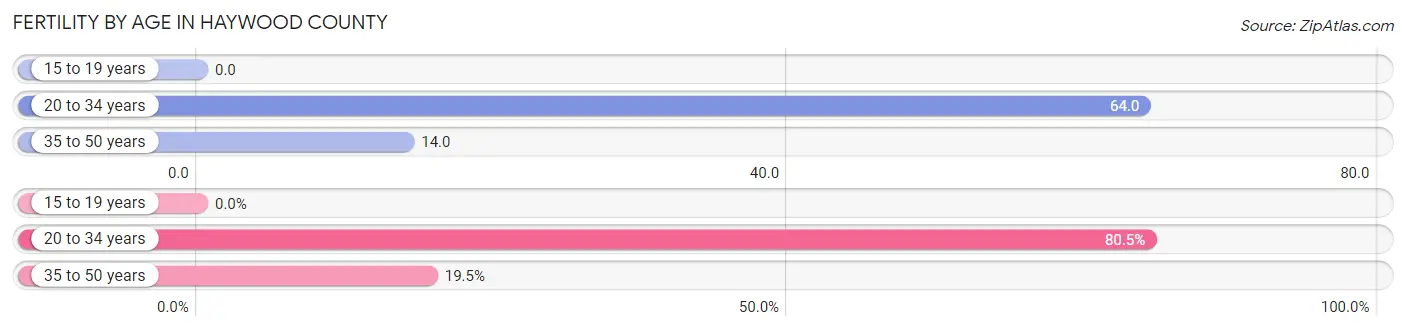
| Age Bracket | Women with Births | Births / 1,000 Women |
| 15 to 19 years | 0 (0.0%) | 0.0 |
| 20 to 34 years | 318 (80.5%) | 64.0 |
| 35 to 50 years | 77 (19.5%) | 14.0 |
| Total | 395 (100.0%) | 33.0 |
Fertility by Age by Marriage Status in Haywood County
74.2% of women with births (395) in Haywood County are married. The highest percentage of unmarried women with births falls into 20 to 34 years age bracket with 32.1% of them unmarried at the time of birth, while the lowest percentage of unmarried women with births belong to 35 to 50 years age bracket with 0.0% of them unmarried.
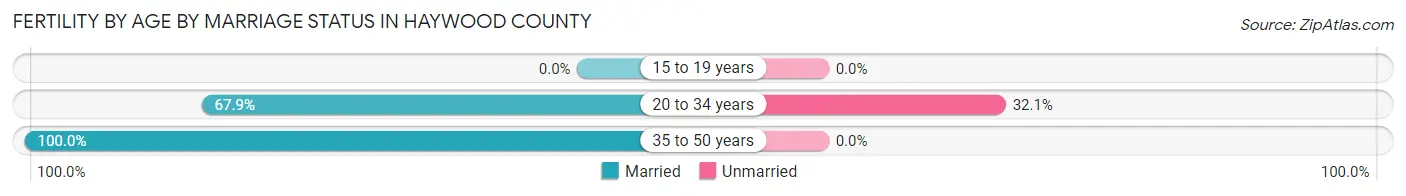
| Age Bracket | Married | Unmarried |
| 15 to 19 years | 0 (0.0%) | 0 (0.0%) |
| 20 to 34 years | 216 (67.9%) | 102 (32.1%) |
| 35 to 50 years | 77 (100.0%) | 0 (0.0%) |
| Total | 293 (74.2%) | 102 (25.8%) |
Fertility by Education in Haywood County
Average fertility rate in Haywood County is 33.0 births per 1,000 women. Women with the education attainment of graduate degree have the highest fertility rate of 67.0 births per 1,000 women, while women with the education attainment of less than high school have the lowest fertility at 2.0 births per 1,000 women. Women with the education attainment of college or associate's degree represent 35.2% of all women with births.
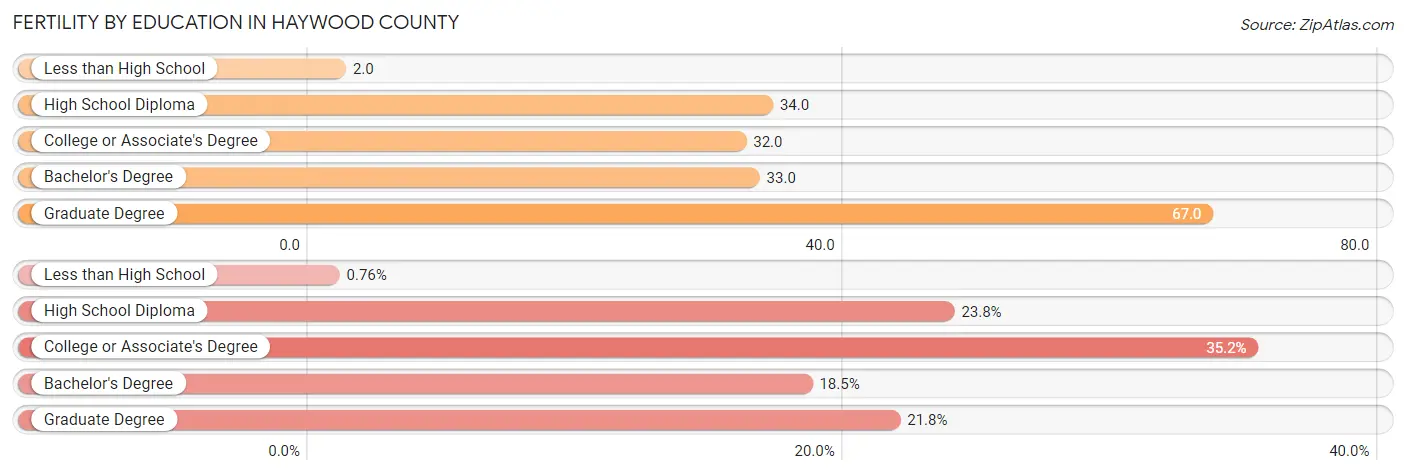
| Educational Attainment | Women with Births | Births / 1,000 Women |
| Less than High School | 3 (0.8%) | 2.0 |
| High School Diploma | 94 (23.8%) | 34.0 |
| College or Associate's Degree | 139 (35.2%) | 32.0 |
| Bachelor's Degree | 73 (18.5%) | 33.0 |
| Graduate Degree | 86 (21.8%) | 67.0 |
| Total | 395 (100.0%) | 33.0 |
Fertility by Education by Marriage Status in Haywood County
25.8% of women with births in Haywood County are unmarried. Women with the educational attainment of less than high school are most likely to be married with 100.0% of them married at childbirth, while women with the educational attainment of college or associate's degree are least likely to be married with 47.5% of them unmarried at childbirth.
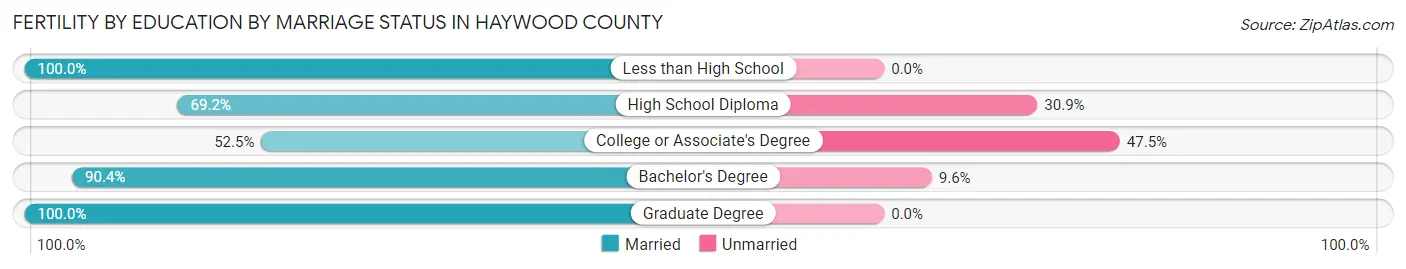
| Educational Attainment | Married | Unmarried |
| Less than High School | 3 (100.0%) | 0 (0.0%) |
| High School Diploma | 65 (69.2%) | 29 (30.8%) |
| College or Associate's Degree | 73 (52.5%) | 66 (47.5%) |
| Bachelor's Degree | 66 (90.4%) | 7 (9.6%) |
| Graduate Degree | 86 (100.0%) | 0 (0.0%) |
| Total | 293 (74.2%) | 102 (25.8%) |
Employment Characteristics in Haywood County
Employment by Class of Employer in Haywood County
Among the 27,174 employed individuals in Haywood County, private company employees (17,830 | 65.6%), local government employees (2,591 | 9.5%), and self-employed (not incorporated) (1,822 | 6.7%) make up the most common classes of employment.
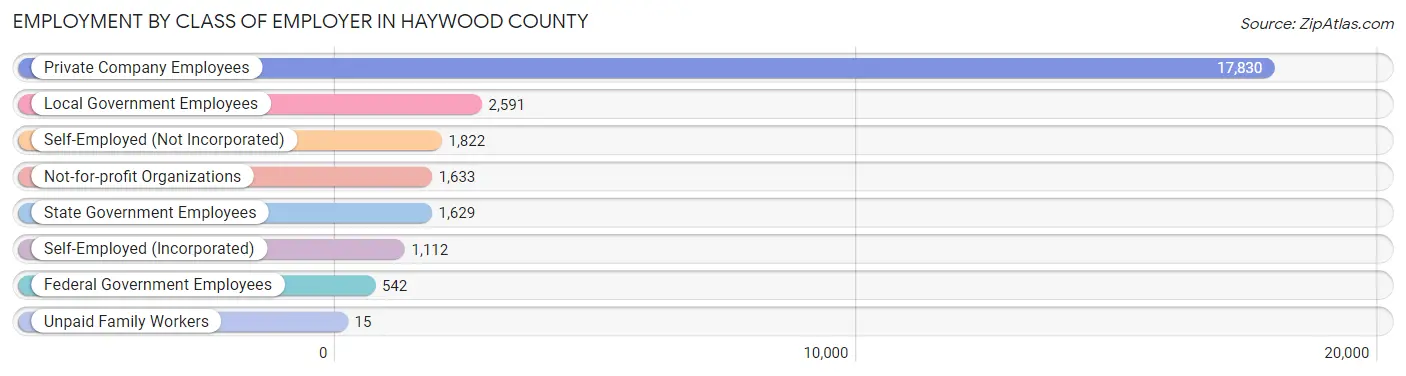
| Employer Class | # Employees | % Employees |
| Private Company Employees | 17,830 | 65.6% |
| Self-Employed (Incorporated) | 1,112 | 4.1% |
| Self-Employed (Not Incorporated) | 1,822 | 6.7% |
| Not-for-profit Organizations | 1,633 | 6.0% |
| Local Government Employees | 2,591 | 9.5% |
| State Government Employees | 1,629 | 6.0% |
| Federal Government Employees | 542 | 2.0% |
| Unpaid Family Workers | 15 | 0.1% |
| Total | 27,174 | 100.0% |
Employment Status by Age in Haywood County
According to the labor force statistics for Haywood County, out of the total population over 16 years of age (52,396), 55.5% or 29,080 individuals are in the labor force, with 3.5% or 1,018 of them unemployed. The age group with the highest labor force participation rate is 30 to 34 years, with 86.6% or 3,308 individuals in the labor force. Within the labor force, the 25 to 29 years age range has the highest percentage of unemployed individuals, with 9.2% or 268 of them being unemployed.
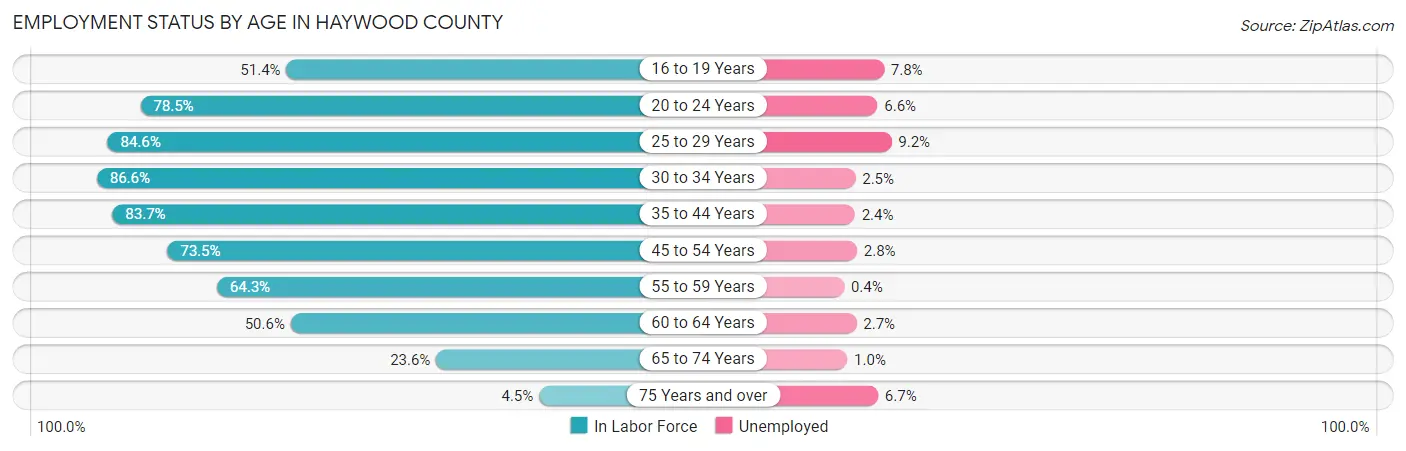
| Age Bracket | In Labor Force | Unemployed |
| 16 to 19 Years | 1,318 (51.4%) | 103 (7.8%) |
| 20 to 24 Years | 2,368 (78.5%) | 156 (6.6%) |
| 25 to 29 Years | 2,917 (84.6%) | 268 (9.2%) |
| 30 to 34 Years | 3,308 (86.6%) | 83 (2.5%) |
| 35 to 44 Years | 5,508 (83.7%) | 132 (2.4%) |
| 45 to 54 Years | 5,818 (73.5%) | 163 (2.8%) |
| 55 to 59 Years | 3,067 (64.3%) | 12 (0.4%) |
| 60 to 64 Years | 2,379 (50.6%) | 64 (2.7%) |
| 65 to 74 Years | 2,116 (23.6%) | 21 (1.0%) |
| 75 Years and over | 298 (4.5%) | 20 (6.7%) |
| Total | 29,080 (55.5%) | 1,018 (3.5%) |
Employment Status by Educational Attainment in Haywood County
According to labor force statistics for Haywood County, 73.6% of individuals (22,989) out of the total population between 25 and 64 years of age (31,235) are in the labor force, with 3.1% or 713 of them being unemployed. The group with the highest labor force participation rate are those with the educational attainment of bachelor's degree or higher, with 79.6% or 7,096 individuals in the labor force. Within the labor force, individuals with high school diploma education have the highest percentage of unemployment, with 6.2% or 322 of them being unemployed.
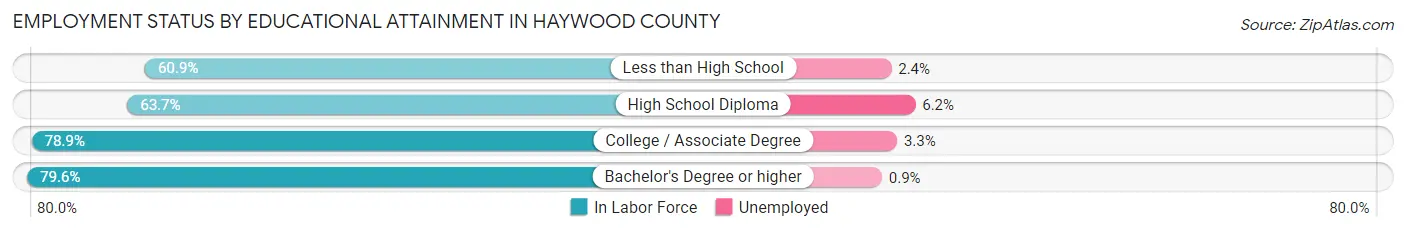
| Educational Attainment | In Labor Force | Unemployed |
| Less than High School | 1,559 (60.9%) | 61 (2.4%) |
| High School Diploma | 5,200 (63.7%) | 506 (6.2%) |
| College / Associate Degree | 9,151 (78.9%) | 383 (3.3%) |
| Bachelor's Degree or higher | 7,096 (79.6%) | 80 (0.9%) |
| Total | 22,989 (73.6%) | 968 (3.1%) |
Employment Occupations by Sex in Haywood County
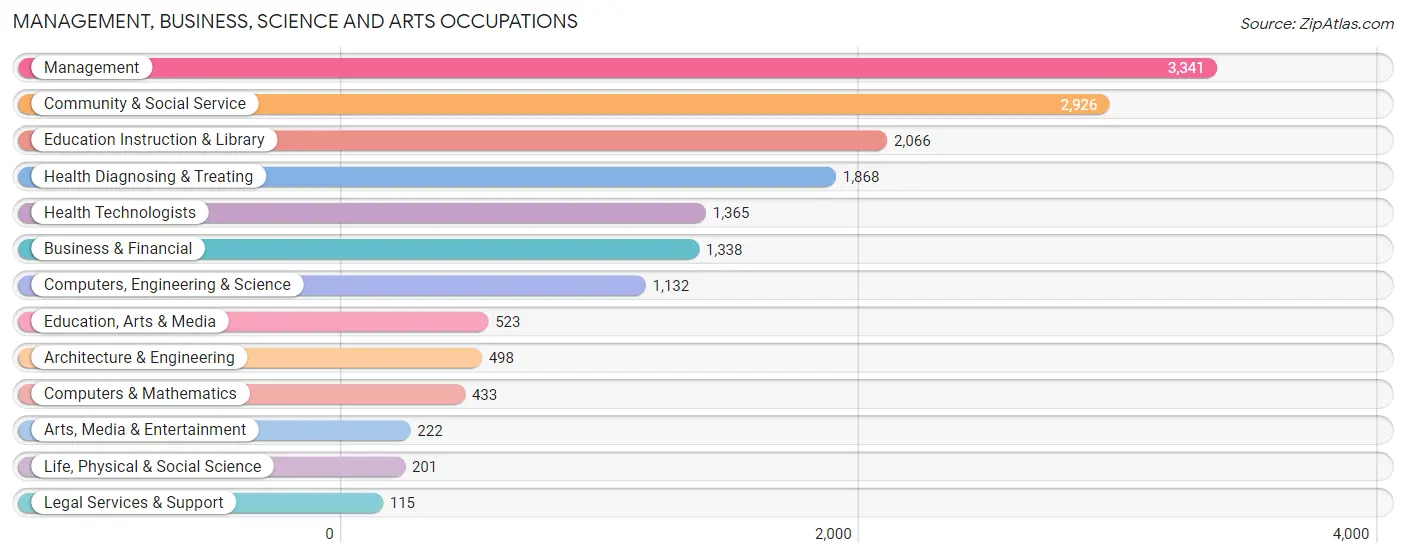
Management, Business, Science and Arts Occupations
The most common Management, Business, Science and Arts occupations in Haywood County are Management (3,341 | 11.9%), Community & Social Service (2,926 | 10.4%), Education Instruction & Library (2,066 | 7.4%), Health Diagnosing & Treating (1,868 | 6.7%), and Health Technologists (1,365 | 4.9%).
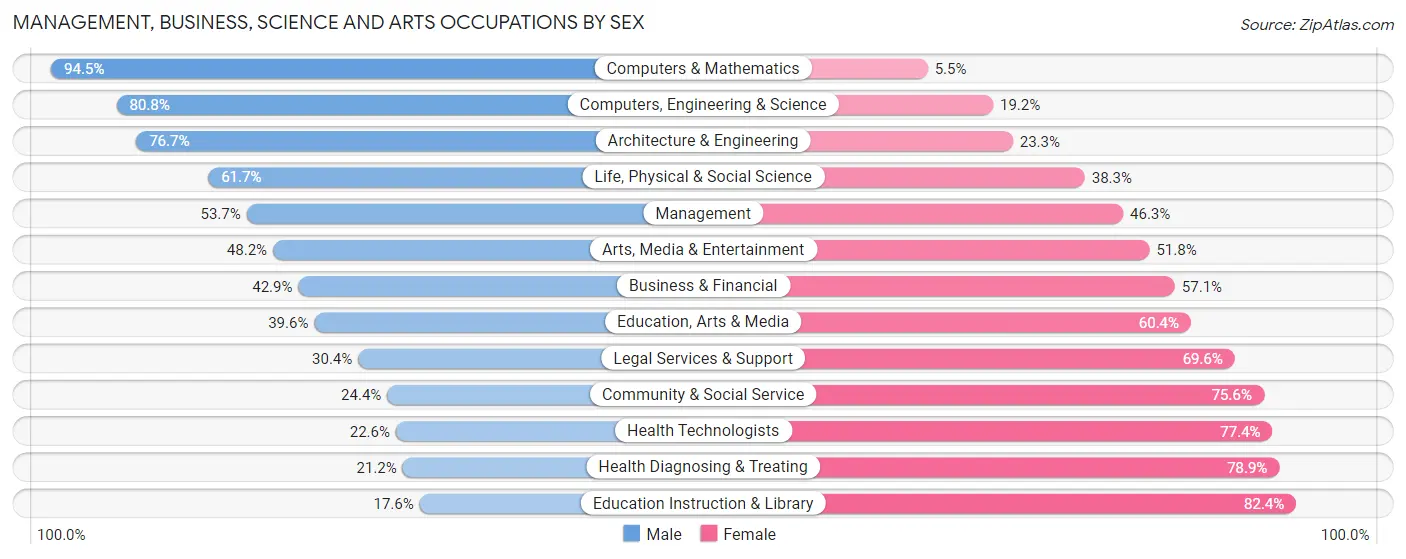
Management, Business, Science and Arts Occupations by Sex
Within the Management, Business, Science and Arts occupations in Haywood County, the most male-oriented occupations are Computers & Mathematics (94.5%), Computers, Engineering & Science (80.8%), and Architecture & Engineering (76.7%), while the most female-oriented occupations are Education Instruction & Library (82.4%), Health Diagnosing & Treating (78.8%), and Health Technologists (77.4%).
| Occupation | Male | Female |
| Management | 1,794 (53.7%) | 1,547 (46.3%) |
| Business & Financial | 574 (42.9%) | 764 (57.1%) |
| Computers, Engineering & Science | 915 (80.8%) | 217 (19.2%) |
| Computers & Mathematics | 409 (94.5%) | 24 (5.5%) |
| Architecture & Engineering | 382 (76.7%) | 116 (23.3%) |
| Life, Physical & Social Science | 124 (61.7%) | 77 (38.3%) |
| Community & Social Service | 713 (24.4%) | 2,213 (75.6%) |
| Education, Arts & Media | 207 (39.6%) | 316 (60.4%) |
| Legal Services & Support | 35 (30.4%) | 80 (69.6%) |
| Education Instruction & Library | 364 (17.6%) | 1,702 (82.4%) |
| Arts, Media & Entertainment | 107 (48.2%) | 115 (51.8%) |
| Health Diagnosing & Treating | 395 (21.1%) | 1,473 (78.8%) |
| Health Technologists | 308 (22.6%) | 1,057 (77.4%) |
| Total (Category) | 4,391 (41.4%) | 6,214 (58.6%) |
| Total (Overall) | 14,197 (50.7%) | 13,813 (49.3%) |
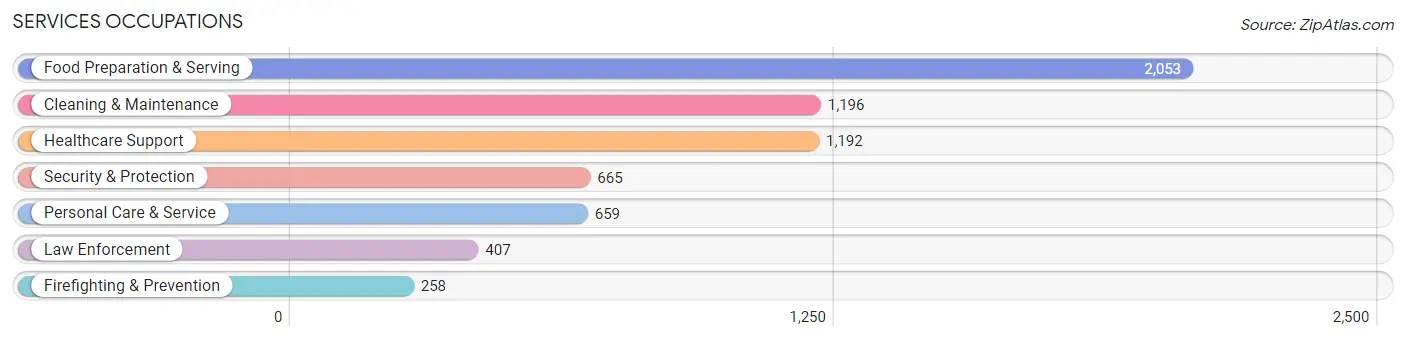
Services Occupations
The most common Services occupations in Haywood County are Food Preparation & Serving (2,053 | 7.3%), Cleaning & Maintenance (1,196 | 4.3%), Healthcare Support (1,192 | 4.3%), Security & Protection (665 | 2.4%), and Personal Care & Service (659 | 2.4%).
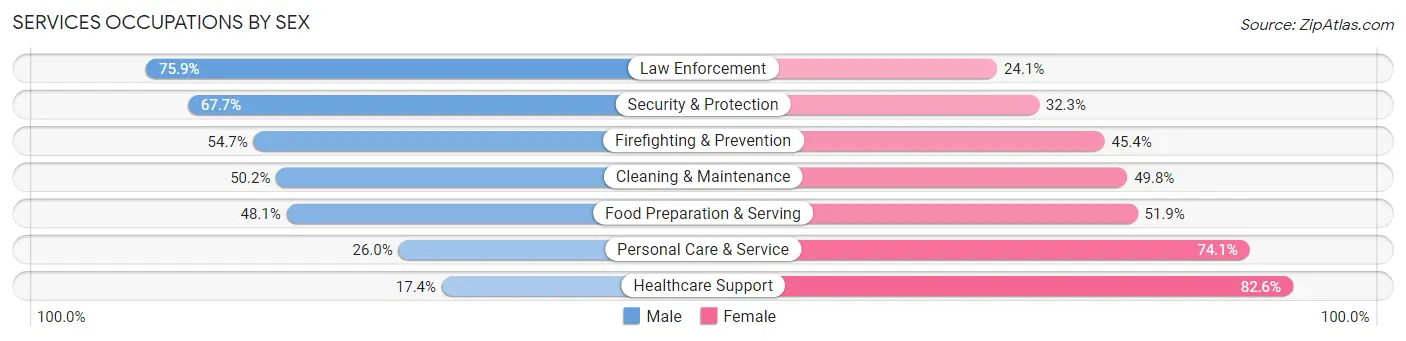
Services Occupations by Sex
Within the Services occupations in Haywood County, the most male-oriented occupations are Law Enforcement (75.9%), Security & Protection (67.7%), and Firefighting & Prevention (54.6%), while the most female-oriented occupations are Healthcare Support (82.6%), Personal Care & Service (74.1%), and Food Preparation & Serving (51.9%).
| Occupation | Male | Female |
| Healthcare Support | 207 (17.4%) | 985 (82.6%) |
| Security & Protection | 450 (67.7%) | 215 (32.3%) |
| Firefighting & Prevention | 141 (54.6%) | 117 (45.4%) |
| Law Enforcement | 309 (75.9%) | 98 (24.1%) |
| Food Preparation & Serving | 988 (48.1%) | 1,065 (51.9%) |
| Cleaning & Maintenance | 600 (50.2%) | 596 (49.8%) |
| Personal Care & Service | 171 (26.0%) | 488 (74.1%) |
| Total (Category) | 2,416 (41.9%) | 3,349 (58.1%) |
| Total (Overall) | 14,197 (50.7%) | 13,813 (49.3%) |
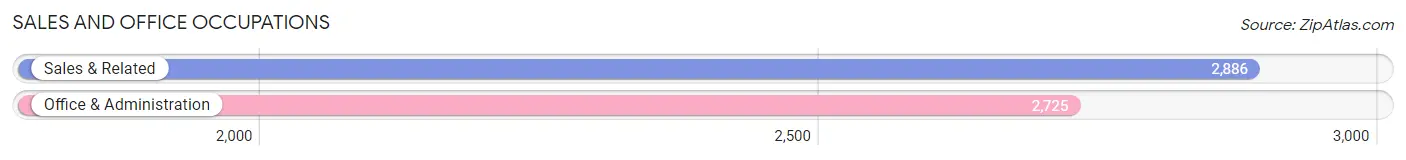
Sales and Office Occupations
The most common Sales and Office occupations in Haywood County are Sales & Related (2,886 | 10.3%), and Office & Administration (2,725 | 9.7%).
Sales and Office Occupations by Sex
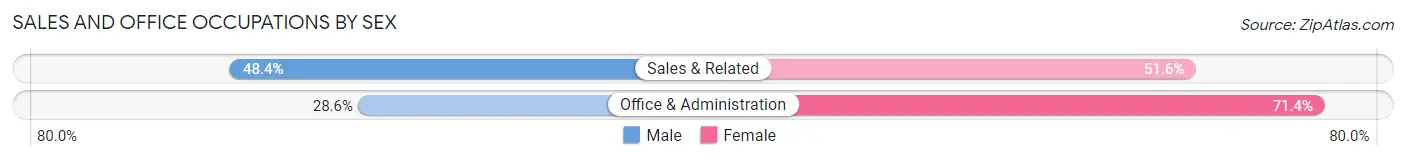
| Occupation | Male | Female |
| Sales & Related | 1,396 (48.4%) | 1,490 (51.6%) |
| Office & Administration | 779 (28.6%) | 1,946 (71.4%) |
| Total (Category) | 2,175 (38.8%) | 3,436 (61.2%) |
| Total (Overall) | 14,197 (50.7%) | 13,813 (49.3%) |
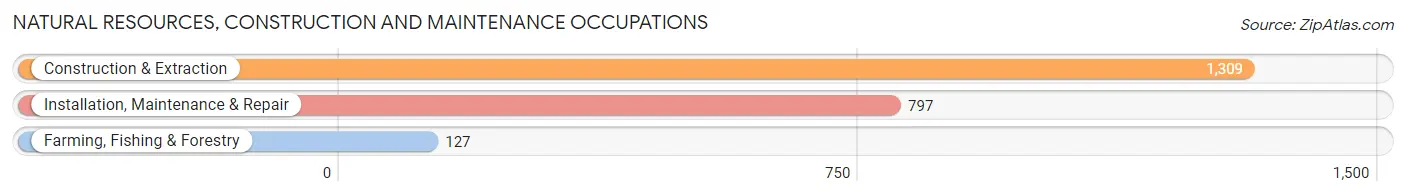
Natural Resources, Construction and Maintenance Occupations
The most common Natural Resources, Construction and Maintenance occupations in Haywood County are Construction & Extraction (1,309 | 4.7%), Installation, Maintenance & Repair (797 | 2.9%), and Farming, Fishing & Forestry (127 | 0.4%).
Natural Resources, Construction and Maintenance Occupations by Sex
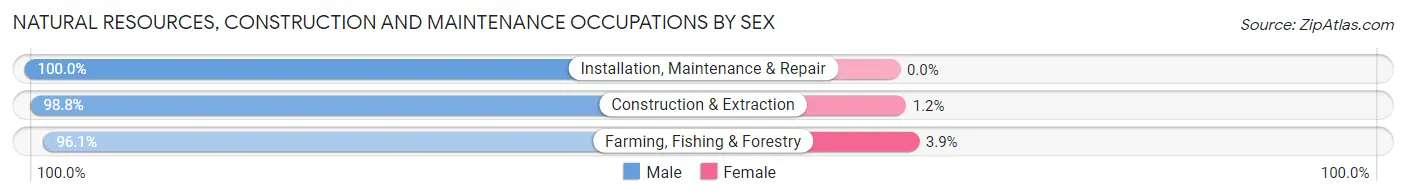
| Occupation | Male | Female |
| Farming, Fishing & Forestry | 122 (96.1%) | 5 (3.9%) |
| Construction & Extraction | 1,293 (98.8%) | 16 (1.2%) |
| Installation, Maintenance & Repair | 797 (100.0%) | 0 (0.0%) |
| Total (Category) | 2,212 (99.1%) | 21 (0.9%) |
| Total (Overall) | 14,197 (50.7%) | 13,813 (49.3%) |
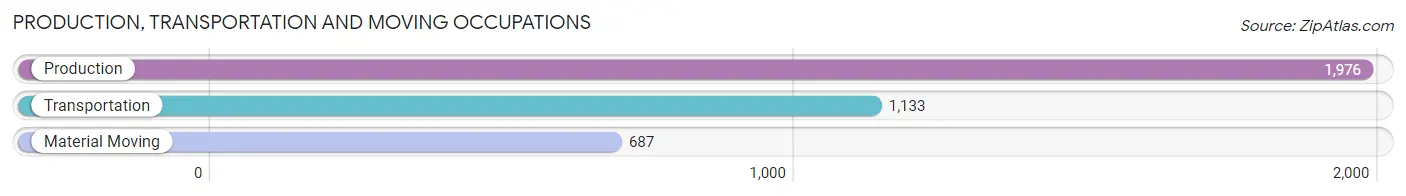
Production, Transportation and Moving Occupations
The most common Production, Transportation and Moving occupations in Haywood County are Production (1,976 | 7.0%), Transportation (1,133 | 4.0%), and Material Moving (687 | 2.5%).
Production, Transportation and Moving Occupations by Sex
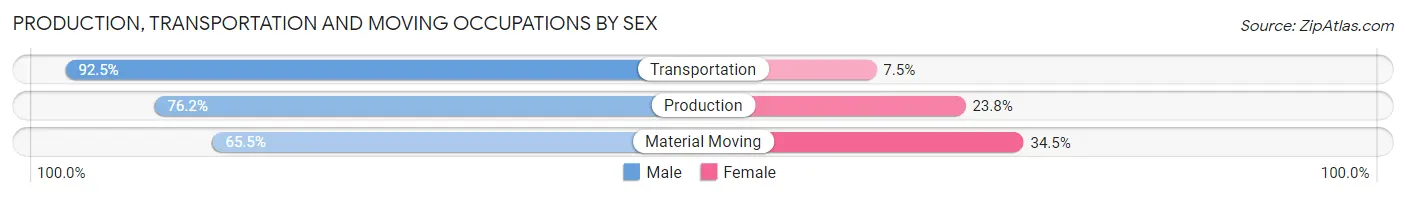
| Occupation | Male | Female |
| Production | 1,505 (76.2%) | 471 (23.8%) |
| Transportation | 1,048 (92.5%) | 85 (7.5%) |
| Material Moving | 450 (65.5%) | 237 (34.5%) |
| Total (Category) | 3,003 (79.1%) | 793 (20.9%) |
| Total (Overall) | 14,197 (50.7%) | 13,813 (49.3%) |
Employment Industries by Sex in Haywood County
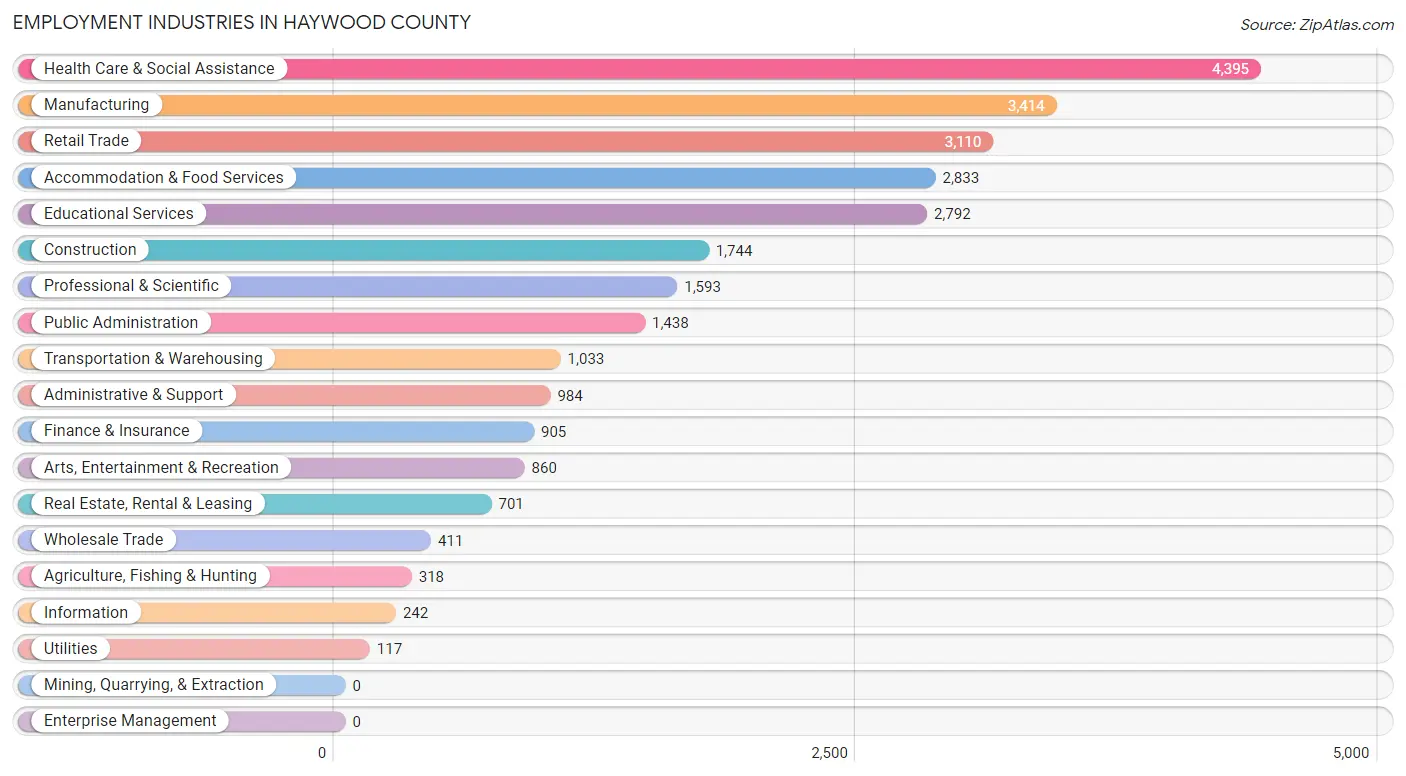
Employment Industries in Haywood County
The major employment industries in Haywood County include Health Care & Social Assistance (4,395 | 15.7%), Manufacturing (3,414 | 12.2%), Retail Trade (3,110 | 11.1%), Accommodation & Food Services (2,833 | 10.1%), and Educational Services (2,792 | 10.0%).
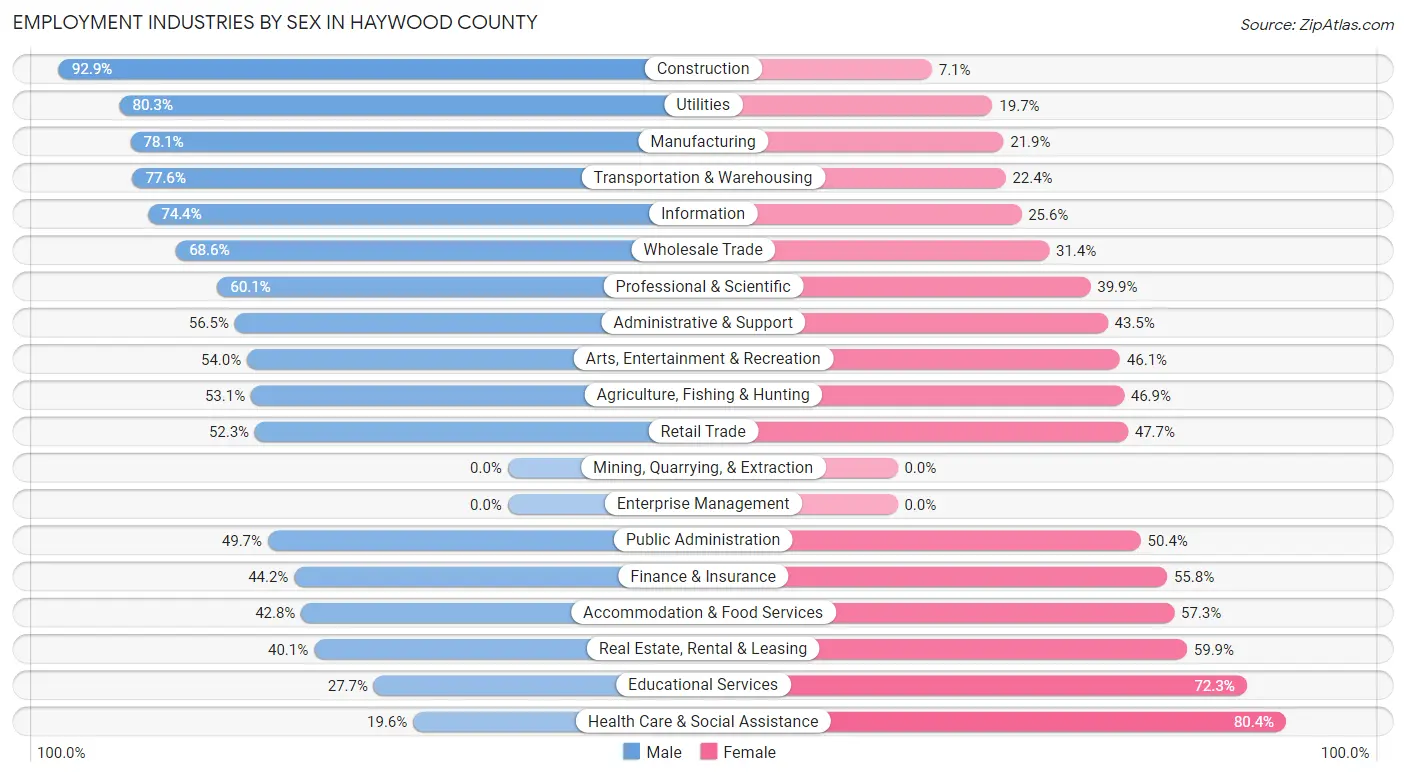
Employment Industries by Sex in Haywood County
The Haywood County industries that see more men than women are Construction (92.9%), Utilities (80.3%), and Manufacturing (78.1%), whereas the industries that tend to have a higher number of women are Health Care & Social Assistance (80.4%), Educational Services (72.3%), and Real Estate, Rental & Leasing (59.9%).
| Industry | Male | Female |
| Agriculture, Fishing & Hunting | 169 (53.1%) | 149 (46.9%) |
| Mining, Quarrying, & Extraction | 0 (0.0%) | 0 (0.0%) |
| Construction | 1,620 (92.9%) | 124 (7.1%) |
| Manufacturing | 2,666 (78.1%) | 748 (21.9%) |
| Wholesale Trade | 282 (68.6%) | 129 (31.4%) |
| Retail Trade | 1,627 (52.3%) | 1,483 (47.7%) |
| Transportation & Warehousing | 802 (77.6%) | 231 (22.4%) |
| Utilities | 94 (80.3%) | 23 (19.7%) |
| Information | 180 (74.4%) | 62 (25.6%) |
| Finance & Insurance | 400 (44.2%) | 505 (55.8%) |
| Real Estate, Rental & Leasing | 281 (40.1%) | 420 (59.9%) |
| Professional & Scientific | 957 (60.1%) | 636 (39.9%) |
| Enterprise Management | 0 (0.0%) | 0 (0.0%) |
| Administrative & Support | 556 (56.5%) | 428 (43.5%) |
| Educational Services | 774 (27.7%) | 2,018 (72.3%) |
| Health Care & Social Assistance | 861 (19.6%) | 3,534 (80.4%) |
| Arts, Entertainment & Recreation | 464 (53.9%) | 396 (46.1%) |
| Accommodation & Food Services | 1,211 (42.7%) | 1,622 (57.3%) |
| Public Administration | 714 (49.6%) | 724 (50.3%) |
| Total | 14,197 (50.7%) | 13,813 (49.3%) |
Education in Haywood County
School Enrollment in Haywood County
The most common levels of schooling among the 11,446 students in Haywood County are elementary school (2,614 | 22.8%), middle school (2,528 | 22.1%), and high school (2,477 | 21.6%).
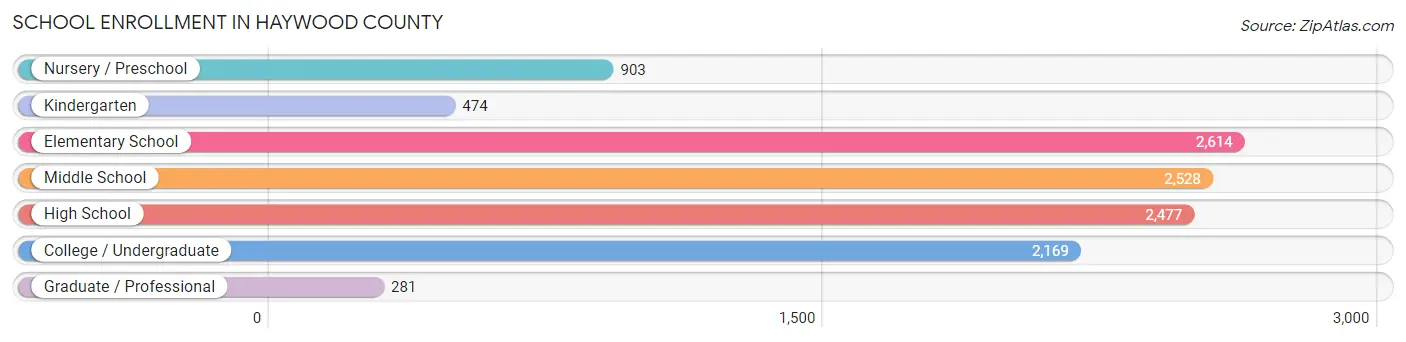
| School Level | # Students | % Students |
| Nursery / Preschool | 903 | 7.9% |
| Kindergarten | 474 | 4.1% |
| Elementary School | 2,614 | 22.8% |
| Middle School | 2,528 | 22.1% |
| High School | 2,477 | 21.6% |
| College / Undergraduate | 2,169 | 19.0% |
| Graduate / Professional | 281 | 2.5% |
| Total | 11,446 | 100.0% |
School Enrollment by Age by Funding Source in Haywood County
Out of a total of 11,446 students who are enrolled in schools in Haywood County, 1,580 (13.8%) attend a private institution, while the remaining 9,866 (86.2%) are enrolled in public schools. The age group of 3 to 4 year olds has the highest likelihood of being enrolled in private schools, with 313 (56.4% in the age bracket) enrolled. Conversely, the age group of 20 to 24 year olds has the lowest likelihood of being enrolled in a private school, with 838 (98.7% in the age bracket) attending a public institution.
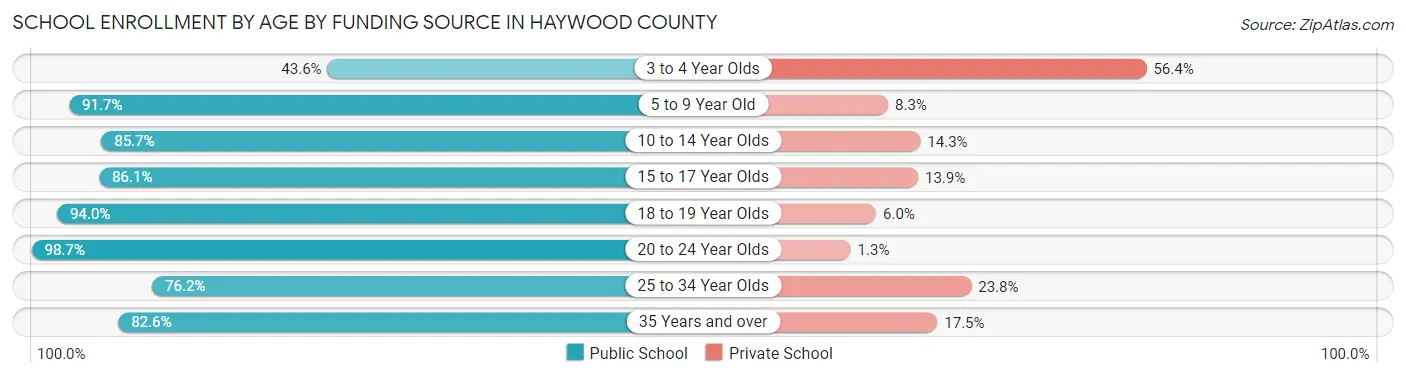
| Age Bracket | Public School | Private School |
| 3 to 4 Year Olds | 242 (43.6%) | 313 (56.4%) |
| 5 to 9 Year Old | 2,803 (91.7%) | 253 (8.3%) |
| 10 to 14 Year Olds | 2,663 (85.7%) | 444 (14.3%) |
| 15 to 17 Year Olds | 1,647 (86.1%) | 265 (13.9%) |
| 18 to 19 Year Olds | 731 (94.0%) | 47 (6.0%) |
| 20 to 24 Year Olds | 838 (98.7%) | 11 (1.3%) |
| 25 to 34 Year Olds | 404 (76.2%) | 126 (23.8%) |
| 35 Years and over | 544 (82.6%) | 115 (17.4%) |
| Total | 9,866 (86.2%) | 1,580 (13.8%) |
Educational Attainment by Field of Study in Haywood County
Education (2,952 | 20.1%), business (2,402 | 16.4%), science & technology (1,855 | 12.6%), arts & humanities (1,026 | 7.0%), and bio, nature & agricultural (945 | 6.4%) are the most common fields of study among 14,681 individuals in Haywood County who have obtained a bachelor's degree or higher.
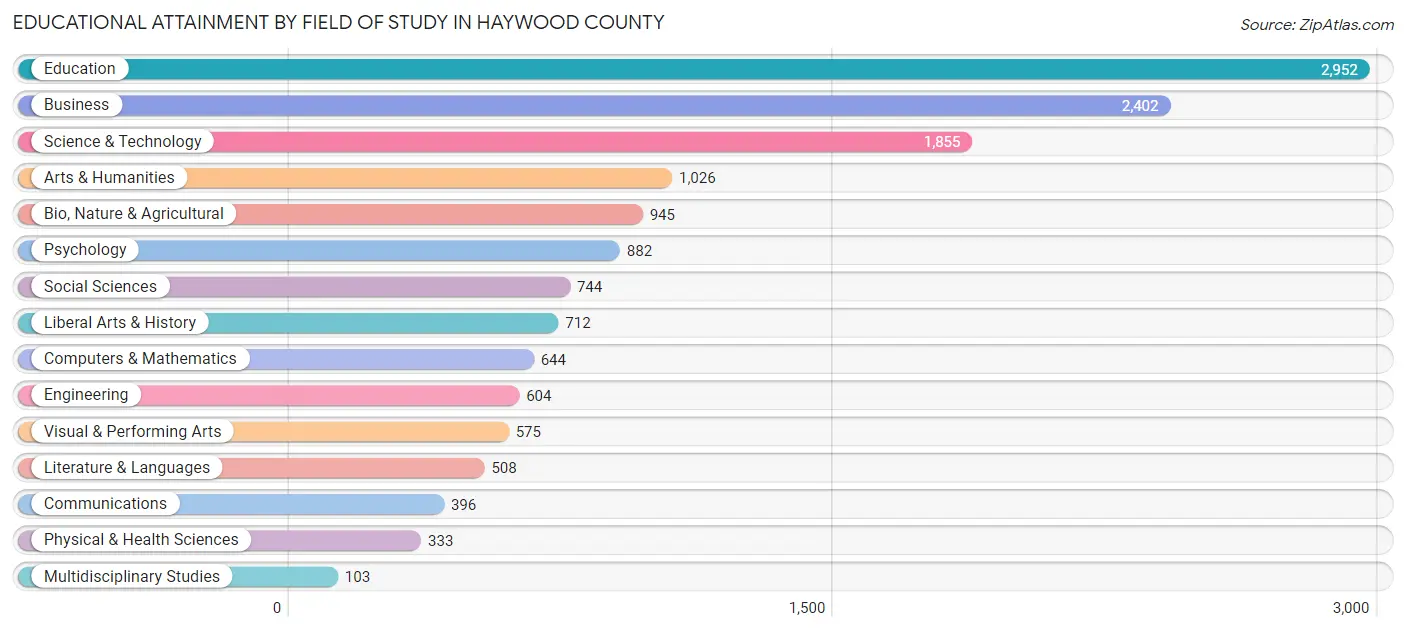
| Field of Study | # Graduates | % Graduates |
| Computers & Mathematics | 644 | 4.4% |
| Bio, Nature & Agricultural | 945 | 6.4% |
| Physical & Health Sciences | 333 | 2.3% |
| Psychology | 882 | 6.0% |
| Social Sciences | 744 | 5.1% |
| Engineering | 604 | 4.1% |
| Multidisciplinary Studies | 103 | 0.7% |
| Science & Technology | 1,855 | 12.6% |
| Business | 2,402 | 16.4% |
| Education | 2,952 | 20.1% |
| Literature & Languages | 508 | 3.5% |
| Liberal Arts & History | 712 | 4.9% |
| Visual & Performing Arts | 575 | 3.9% |
| Communications | 396 | 2.7% |
| Arts & Humanities | 1,026 | 7.0% |
| Total | 14,681 | 100.0% |
Transportation & Commute in Haywood County
Vehicle Availability by Sex in Haywood County
The most prevalent vehicle ownership categories in Haywood County are males with 2 vehicles (5,136, accounting for 37.2%) and females with 2 vehicles (5,049, making up 38.5%).
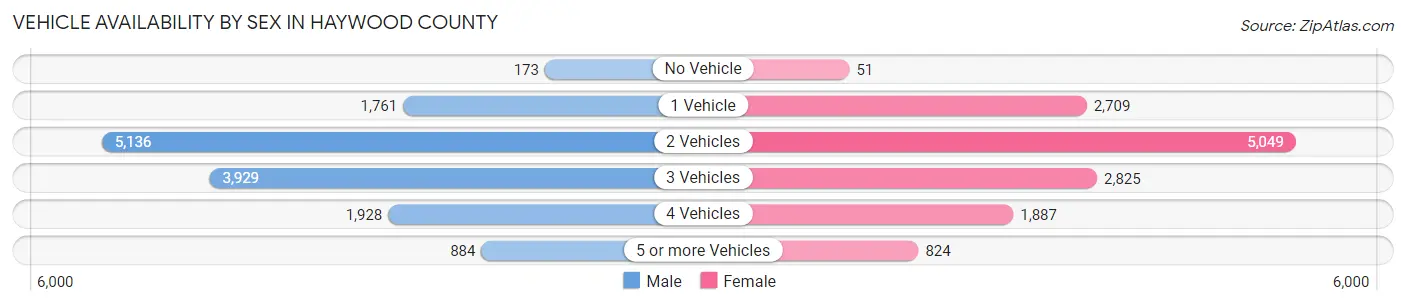
| Vehicles Available | Male | Female |
| No Vehicle | 173 (1.3%) | 51 (0.4%) |
| 1 Vehicle | 1,761 (12.8%) | 2,709 (20.3%) |
| 2 Vehicles | 5,136 (37.2%) | 5,049 (37.8%) |
| 3 Vehicles | 3,929 (28.4%) | 2,825 (21.2%) |
| 4 Vehicles | 1,928 (14.0%) | 1,887 (14.1%) |
| 5 or more Vehicles | 884 (6.4%) | 824 (6.2%) |
| Total | 13,811 (100.0%) | 13,345 (100.0%) |
Commute Time in Haywood County
The most frequently occuring commute durations in Haywood County are 15 to 19 minutes (4,336 commuters, 17.2%), 10 to 14 minutes (4,016 commuters, 15.9%), and 5 to 9 minutes (3,281 commuters, 13.0%).
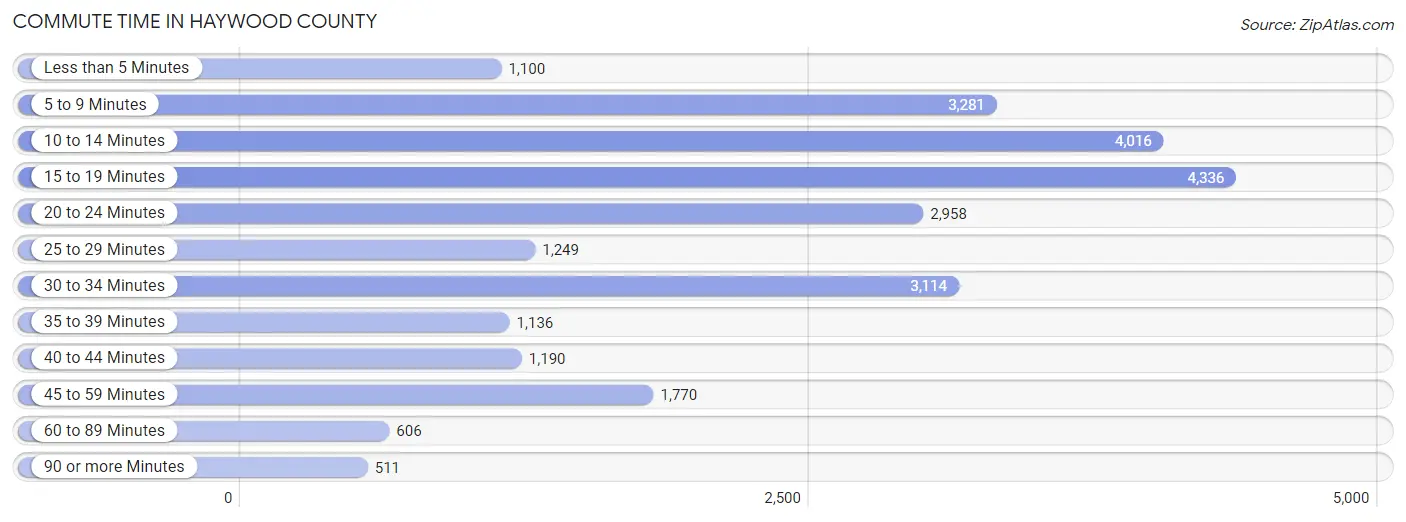
| Commute Time | # Commuters | % Commuters |
| Less than 5 Minutes | 1,100 | 4.3% |
| 5 to 9 Minutes | 3,281 | 13.0% |
| 10 to 14 Minutes | 4,016 | 15.9% |
| 15 to 19 Minutes | 4,336 | 17.2% |
| 20 to 24 Minutes | 2,958 | 11.7% |
| 25 to 29 Minutes | 1,249 | 4.9% |
| 30 to 34 Minutes | 3,114 | 12.3% |
| 35 to 39 Minutes | 1,136 | 4.5% |
| 40 to 44 Minutes | 1,190 | 4.7% |
| 45 to 59 Minutes | 1,770 | 7.0% |
| 60 to 89 Minutes | 606 | 2.4% |
| 90 or more Minutes | 511 | 2.0% |
Commute Time by Sex in Haywood County
The most common commute times in Haywood County are 15 to 19 minutes (2,286 commuters, 17.9%) for males and 10 to 14 minutes (2,133 commuters, 17.0%) for females.
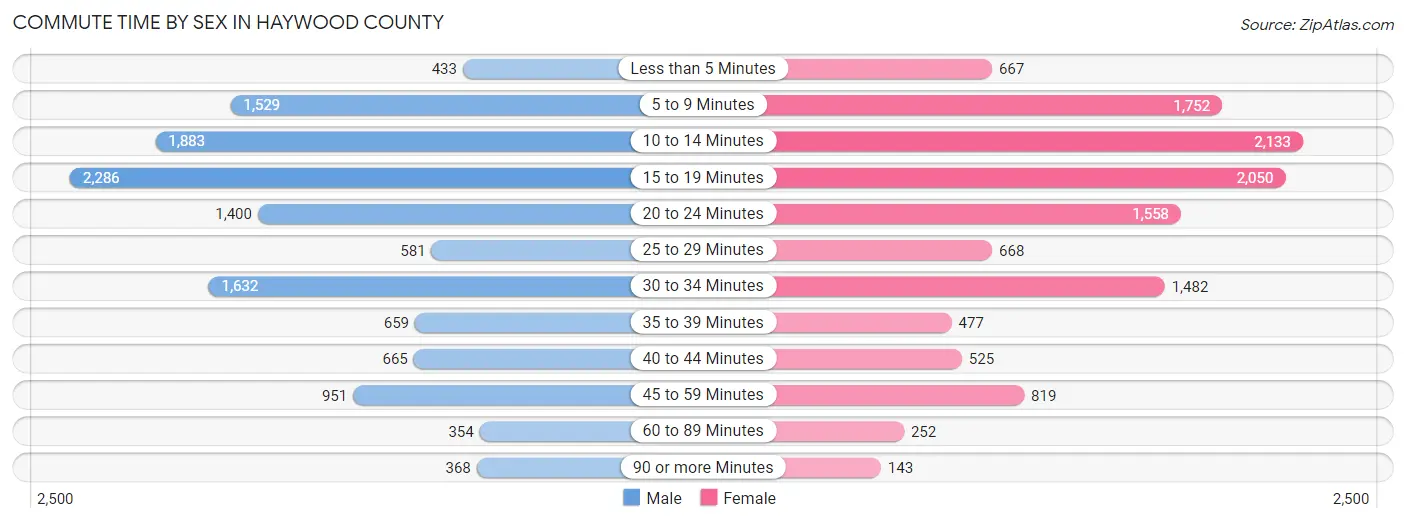
| Commute Time | Male | Female |
| Less than 5 Minutes | 433 (3.4%) | 667 (5.3%) |
| 5 to 9 Minutes | 1,529 (12.0%) | 1,752 (14.0%) |
| 10 to 14 Minutes | 1,883 (14.8%) | 2,133 (17.0%) |
| 15 to 19 Minutes | 2,286 (17.9%) | 2,050 (16.4%) |
| 20 to 24 Minutes | 1,400 (11.0%) | 1,558 (12.4%) |
| 25 to 29 Minutes | 581 (4.6%) | 668 (5.3%) |
| 30 to 34 Minutes | 1,632 (12.8%) | 1,482 (11.8%) |
| 35 to 39 Minutes | 659 (5.2%) | 477 (3.8%) |
| 40 to 44 Minutes | 665 (5.2%) | 525 (4.2%) |
| 45 to 59 Minutes | 951 (7.5%) | 819 (6.5%) |
| 60 to 89 Minutes | 354 (2.8%) | 252 (2.0%) |
| 90 or more Minutes | 368 (2.9%) | 143 (1.1%) |
Time of Departure to Work by Sex in Haywood County
The most frequent times of departure to work in Haywood County are 7:00 AM to 7:29 AM (1,872, 14.7%) for males and 7:30 AM to 7:59 AM (2,832, 22.6%) for females.
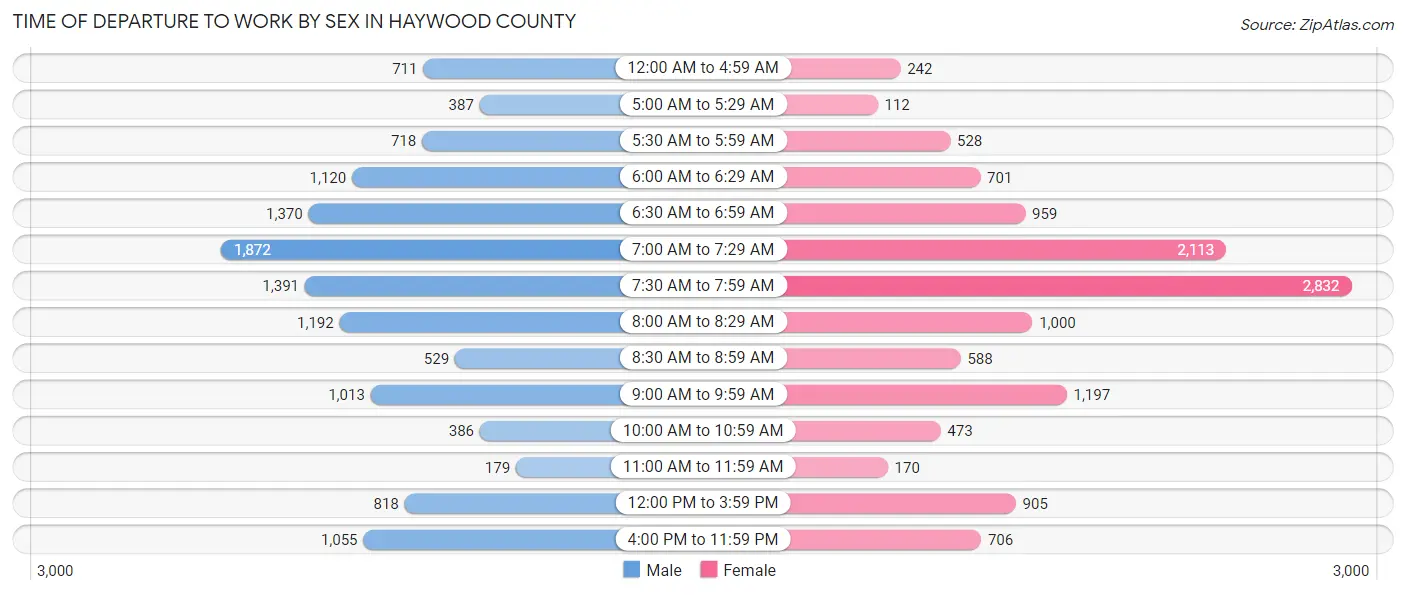
| Time of Departure | Male | Female |
| 12:00 AM to 4:59 AM | 711 (5.6%) | 242 (1.9%) |
| 5:00 AM to 5:29 AM | 387 (3.0%) | 112 (0.9%) |
| 5:30 AM to 5:59 AM | 718 (5.6%) | 528 (4.2%) |
| 6:00 AM to 6:29 AM | 1,120 (8.8%) | 701 (5.6%) |
| 6:30 AM to 6:59 AM | 1,370 (10.7%) | 959 (7.7%) |
| 7:00 AM to 7:29 AM | 1,872 (14.7%) | 2,113 (16.9%) |
| 7:30 AM to 7:59 AM | 1,391 (10.9%) | 2,832 (22.6%) |
| 8:00 AM to 8:29 AM | 1,192 (9.4%) | 1,000 (8.0%) |
| 8:30 AM to 8:59 AM | 529 (4.2%) | 588 (4.7%) |
| 9:00 AM to 9:59 AM | 1,013 (8.0%) | 1,197 (9.6%) |
| 10:00 AM to 10:59 AM | 386 (3.0%) | 473 (3.8%) |
| 11:00 AM to 11:59 AM | 179 (1.4%) | 170 (1.4%) |
| 12:00 PM to 3:59 PM | 818 (6.4%) | 905 (7.2%) |
| 4:00 PM to 11:59 PM | 1,055 (8.3%) | 706 (5.6%) |
| Total | 12,741 (100.0%) | 12,526 (100.0%) |
Housing Occupancy in Haywood County
Occupancy by Ownership in Haywood County
Of the total 26,481 dwellings in Haywood County, owner-occupied units account for 19,807 (74.8%), while renter-occupied units make up 6,674 (25.2%).
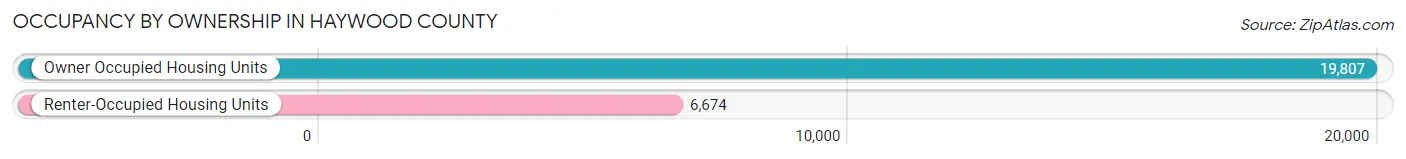
| Occupancy | # Housing Units | % Housing Units |
| Owner Occupied Housing Units | 19,807 | 74.8% |
| Renter-Occupied Housing Units | 6,674 | 25.2% |
| Total Occupied Housing Units | 26,481 | 100.0% |
Occupancy by Household Size in Haywood County
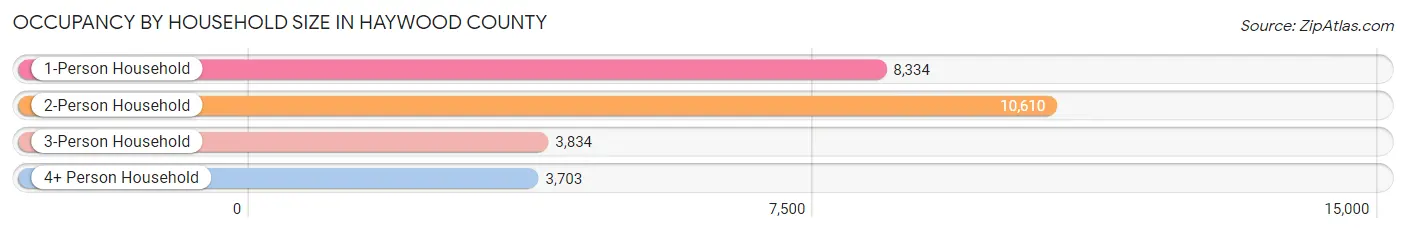
| Household Size | # Housing Units | % Housing Units |
| 1-Person Household | 8,334 | 31.5% |
| 2-Person Household | 10,610 | 40.1% |
| 3-Person Household | 3,834 | 14.5% |
| 4+ Person Household | 3,703 | 14.0% |
| Total Housing Units | 26,481 | 100.0% |
Occupancy by Ownership by Household Size in Haywood County
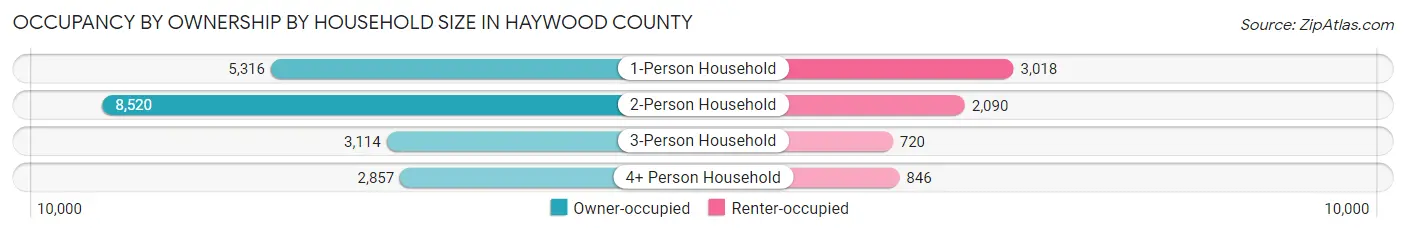
| Household Size | Owner-occupied | Renter-occupied |
| 1-Person Household | 5,316 (63.8%) | 3,018 (36.2%) |
| 2-Person Household | 8,520 (80.3%) | 2,090 (19.7%) |
| 3-Person Household | 3,114 (81.2%) | 720 (18.8%) |
| 4+ Person Household | 2,857 (77.1%) | 846 (22.9%) |
| Total Housing Units | 19,807 (74.8%) | 6,674 (25.2%) |
Occupancy by Educational Attainment in Haywood County
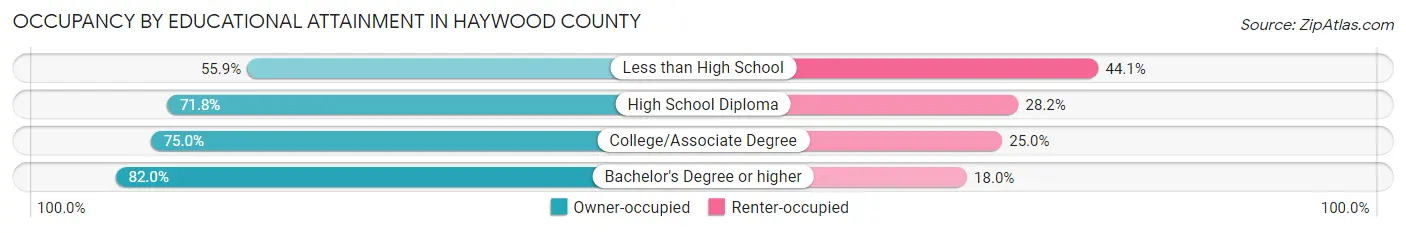
| Household Size | Owner-occupied | Renter-occupied |
| Less than High School | 1,253 (55.9%) | 988 (44.1%) |
| High School Diploma | 4,544 (71.8%) | 1,787 (28.2%) |
| College/Associate Degree | 7,198 (75.0%) | 2,400 (25.0%) |
| Bachelor's Degree or higher | 6,812 (82.0%) | 1,499 (18.0%) |
Occupancy by Age of Householder in Haywood County
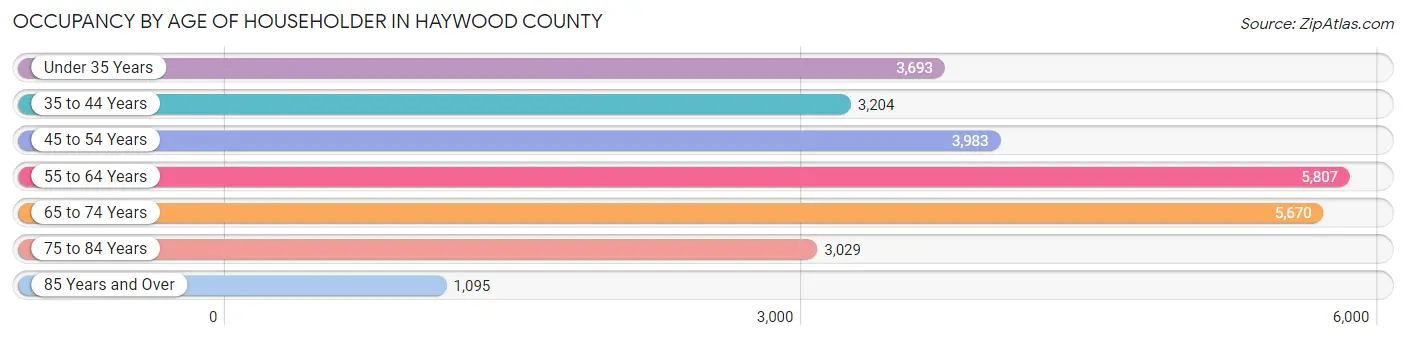
| Age Bracket | # Households | % Households |
| Under 35 Years | 3,693 | 14.0% |
| 35 to 44 Years | 3,204 | 12.1% |
| 45 to 54 Years | 3,983 | 15.0% |
| 55 to 64 Years | 5,807 | 21.9% |
| 65 to 74 Years | 5,670 | 21.4% |
| 75 to 84 Years | 3,029 | 11.4% |
| 85 Years and Over | 1,095 | 4.1% |
| Total | 26,481 | 100.0% |
Housing Finances in Haywood County
Median Income by Occupancy in Haywood County
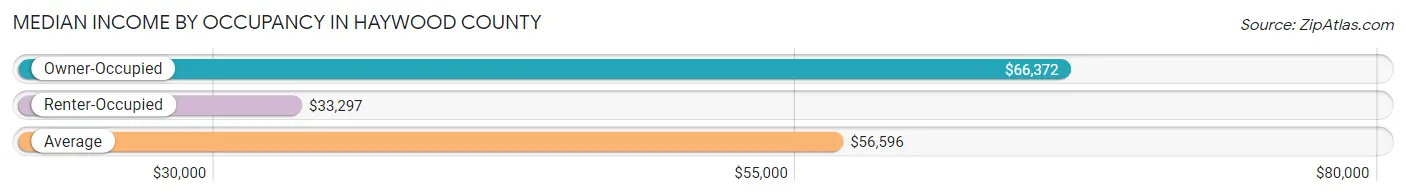
| Occupancy Type | # Households | Median Income |
| Owner-Occupied | 19,807 (74.8%) | $66,372 |
| Renter-Occupied | 6,674 (25.2%) | $33,297 |
| Average | 26,481 (100.0%) | $56,596 |
Occupancy by Householder Income Bracket in Haywood County
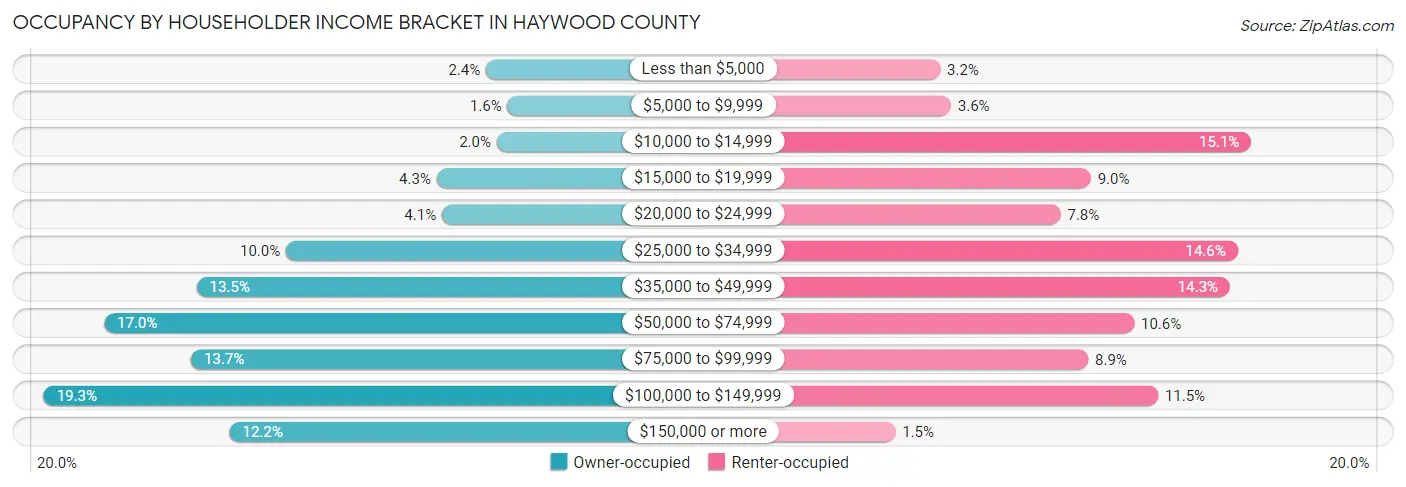
| Income Bracket | Owner-occupied | Renter-occupied |
| Less than $5,000 | 479 (2.4%) | 215 (3.2%) |
| $5,000 to $9,999 | 316 (1.6%) | 242 (3.6%) |
| $10,000 to $14,999 | 399 (2.0%) | 1,006 (15.1%) |
| $15,000 to $19,999 | 852 (4.3%) | 598 (9.0%) |
| $20,000 to $24,999 | 812 (4.1%) | 521 (7.8%) |
| $25,000 to $34,999 | 1,988 (10.0%) | 971 (14.5%) |
| $35,000 to $49,999 | 2,664 (13.5%) | 952 (14.3%) |
| $50,000 to $74,999 | 3,361 (17.0%) | 708 (10.6%) |
| $75,000 to $99,999 | 2,706 (13.7%) | 591 (8.9%) |
| $100,000 to $149,999 | 3,816 (19.3%) | 769 (11.5%) |
| $150,000 or more | 2,414 (12.2%) | 101 (1.5%) |
| Total | 19,807 (100.0%) | 6,674 (100.0%) |
Monthly Housing Cost Tiers in Haywood County
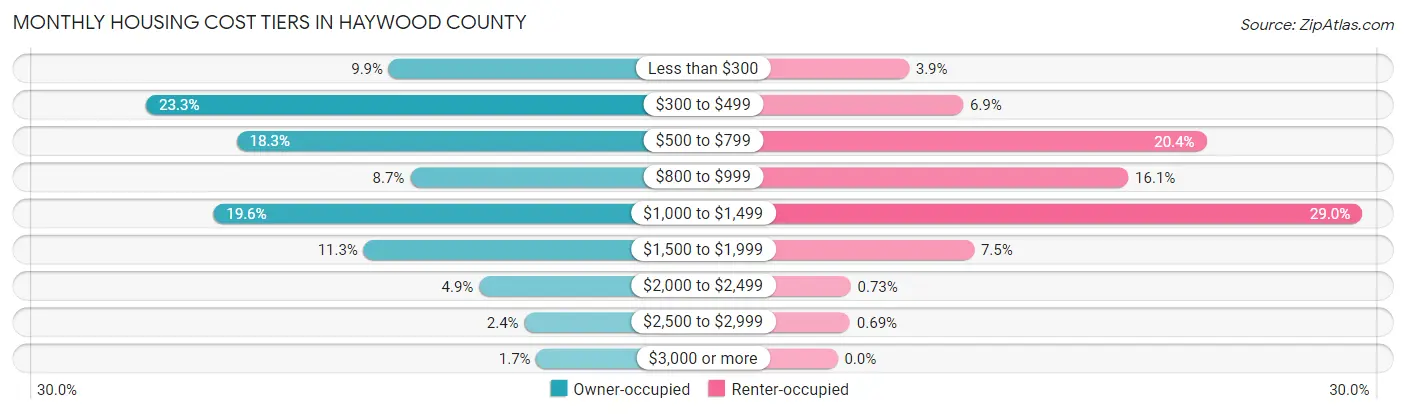
| Monthly Cost | Owner-occupied | Renter-occupied |
| Less than $300 | 1,956 (9.9%) | 263 (3.9%) |
| $300 to $499 | 4,613 (23.3%) | 463 (6.9%) |
| $500 to $799 | 3,622 (18.3%) | 1,360 (20.4%) |
| $800 to $999 | 1,724 (8.7%) | 1,072 (16.1%) |
| $1,000 to $1,499 | 3,876 (19.6%) | 1,934 (29.0%) |
| $1,500 to $1,999 | 2,233 (11.3%) | 503 (7.5%) |
| $2,000 to $2,499 | 968 (4.9%) | 49 (0.7%) |
| $2,500 to $2,999 | 473 (2.4%) | 46 (0.7%) |
| $3,000 or more | 342 (1.7%) | 0 (0.0%) |
| Total | 19,807 (100.0%) | 6,674 (100.0%) |
Physical Housing Characteristics in Haywood County
Housing Structures in Haywood County
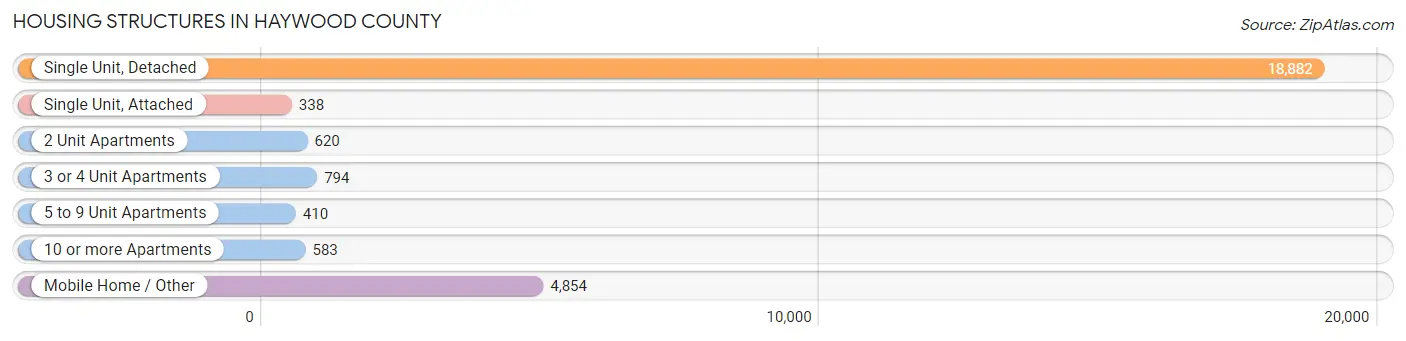
| Structure Type | # Housing Units | % Housing Units |
| Single Unit, Detached | 18,882 | 71.3% |
| Single Unit, Attached | 338 | 1.3% |
| 2 Unit Apartments | 620 | 2.3% |
| 3 or 4 Unit Apartments | 794 | 3.0% |
| 5 to 9 Unit Apartments | 410 | 1.5% |
| 10 or more Apartments | 583 | 2.2% |
| Mobile Home / Other | 4,854 | 18.3% |
| Total | 26,481 | 100.0% |
Housing Structures by Occupancy in Haywood County
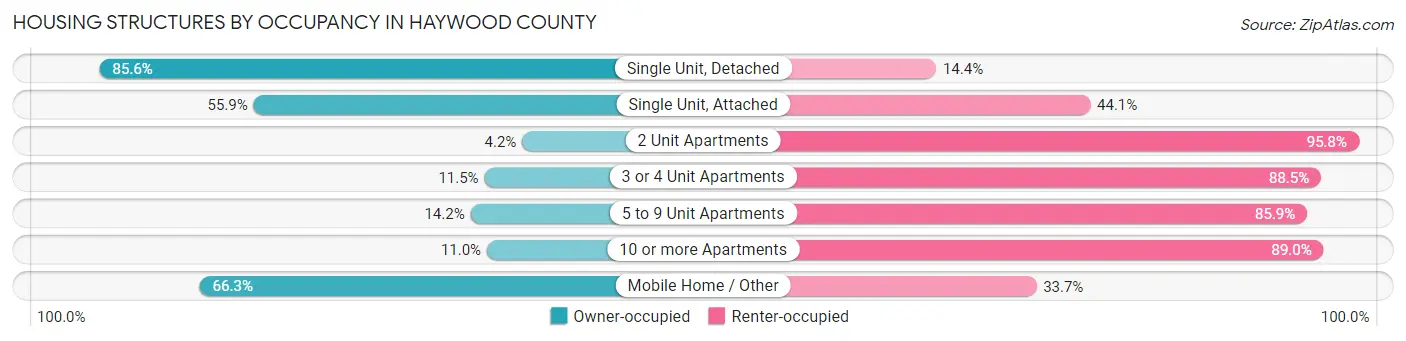
| Structure Type | Owner-occupied | Renter-occupied |
| Single Unit, Detached | 16,161 (85.6%) | 2,721 (14.4%) |
| Single Unit, Attached | 189 (55.9%) | 149 (44.1%) |
| 2 Unit Apartments | 26 (4.2%) | 594 (95.8%) |
| 3 or 4 Unit Apartments | 91 (11.5%) | 703 (88.5%) |
| 5 to 9 Unit Apartments | 58 (14.1%) | 352 (85.9%) |
| 10 or more Apartments | 64 (11.0%) | 519 (89.0%) |
| Mobile Home / Other | 3,218 (66.3%) | 1,636 (33.7%) |
| Total | 19,807 (74.8%) | 6,674 (25.2%) |
Housing Structures by Number of Rooms in Haywood County
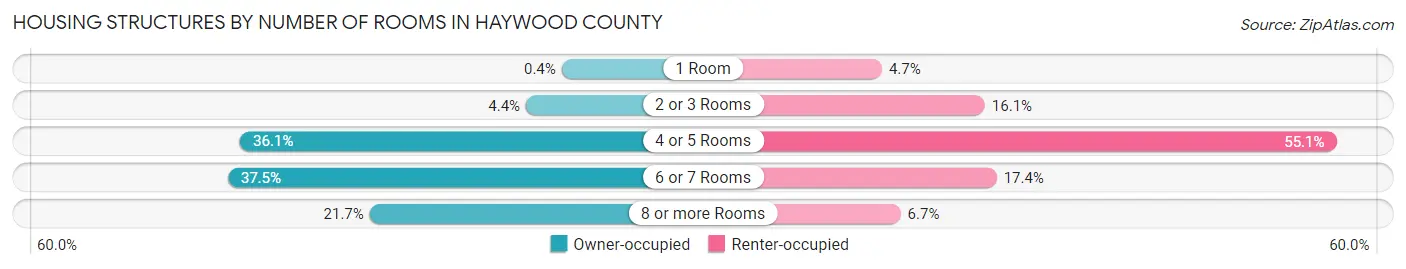
| Number of Rooms | Owner-occupied | Renter-occupied |
| 1 Room | 80 (0.4%) | 312 (4.7%) |
| 2 or 3 Rooms | 864 (4.4%) | 1,074 (16.1%) |
| 4 or 5 Rooms | 7,146 (36.1%) | 3,677 (55.1%) |
| 6 or 7 Rooms | 7,417 (37.4%) | 1,161 (17.4%) |
| 8 or more Rooms | 4,300 (21.7%) | 450 (6.7%) |
| Total | 19,807 (100.0%) | 6,674 (100.0%) |
Housing Structure by Heating Type in Haywood County
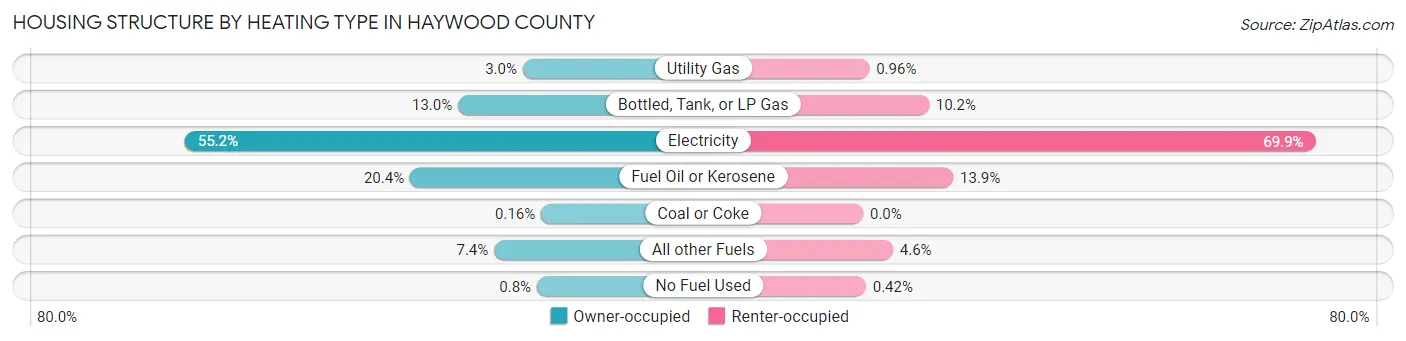
| Heating Type | Owner-occupied | Renter-occupied |
| Utility Gas | 591 (3.0%) | 64 (1.0%) |
| Bottled, Tank, or LP Gas | 2,573 (13.0%) | 678 (10.2%) |
| Electricity | 10,940 (55.2%) | 4,667 (69.9%) |
| Fuel Oil or Kerosene | 4,044 (20.4%) | 929 (13.9%) |
| Coal or Coke | 31 (0.2%) | 0 (0.0%) |
| All other Fuels | 1,469 (7.4%) | 308 (4.6%) |
| No Fuel Used | 159 (0.8%) | 28 (0.4%) |
| Total | 19,807 (100.0%) | 6,674 (100.0%) |
Household Vehicle Usage in Haywood County
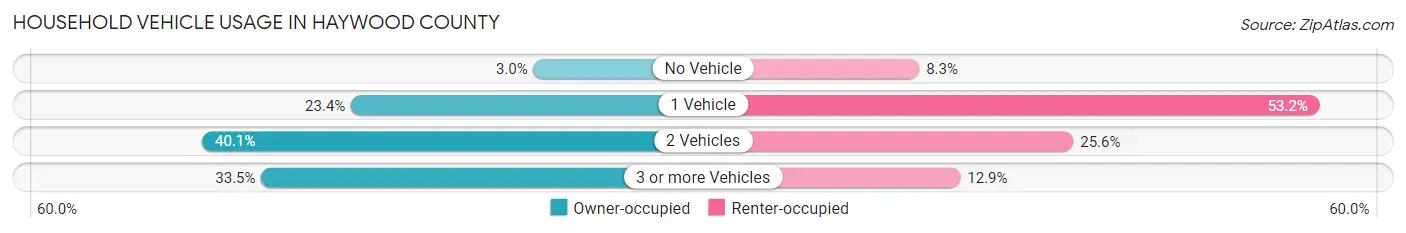
| Vehicles per Household | Owner-occupied | Renter-occupied |
| No Vehicle | 591 (3.0%) | 555 (8.3%) |
| 1 Vehicle | 4,639 (23.4%) | 3,549 (53.2%) |
| 2 Vehicles | 7,946 (40.1%) | 1,707 (25.6%) |
| 3 or more Vehicles | 6,631 (33.5%) | 863 (12.9%) |
| Total | 19,807 (100.0%) | 6,674 (100.0%) |
Real Estate & Mortgages in Haywood County
Real Estate and Mortgage Overview in Haywood County
| Characteristic | Without Mortgage | With Mortgage |
| Housing Units | 9,911 | 9,896 |
| Median Property Value | $206,900 | $241,600 |
| Median Household Income | $51,288 | $1,577 |
| Monthly Housing Costs | $433 | $333 |
| Real Estate Taxes | $1,460 | $150 |
Property Value by Mortgage Status in Haywood County
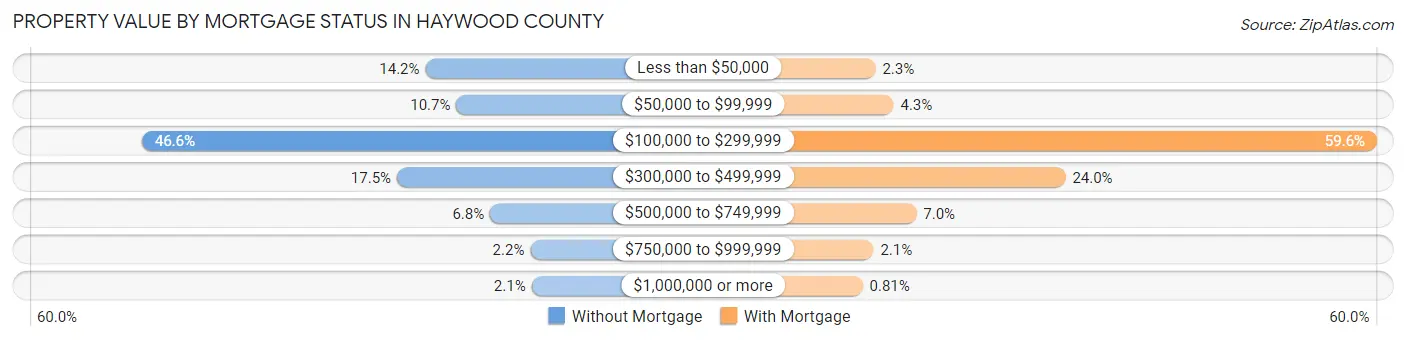
| Property Value | Without Mortgage | With Mortgage |
| Less than $50,000 | 1,407 (14.2%) | 226 (2.3%) |
| $50,000 to $99,999 | 1,057 (10.7%) | 429 (4.3%) |
| $100,000 to $299,999 | 4,619 (46.6%) | 5,896 (59.6%) |
| $300,000 to $499,999 | 1,729 (17.4%) | 2,374 (24.0%) |
| $500,000 to $749,999 | 675 (6.8%) | 688 (7.0%) |
| $750,000 to $999,999 | 219 (2.2%) | 203 (2.1%) |
| $1,000,000 or more | 205 (2.1%) | 80 (0.8%) |
| Total | 9,911 (100.0%) | 9,896 (100.0%) |
Household Income by Mortgage Status in Haywood County
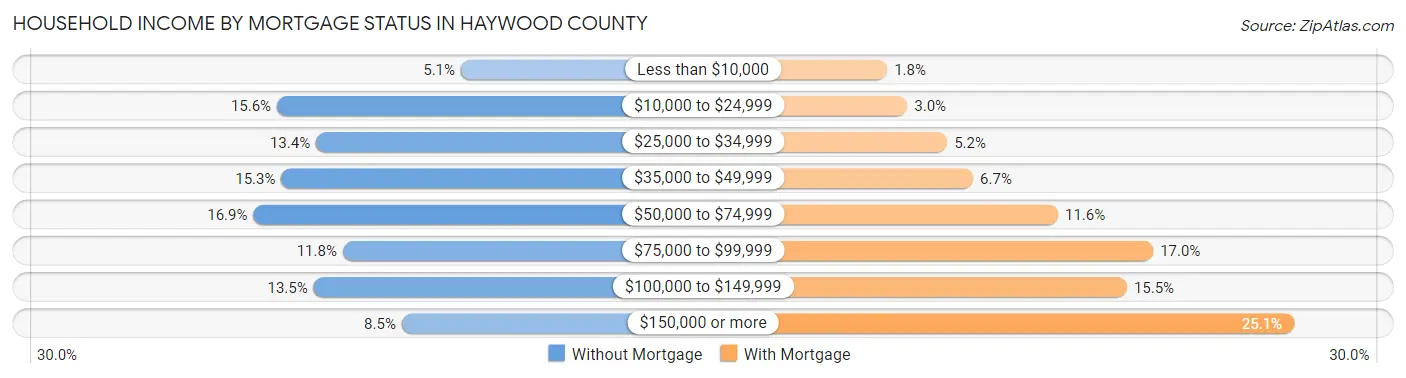
| Household Income | Without Mortgage | With Mortgage |
| Less than $10,000 | 502 (5.1%) | 179 (1.8%) |
| $10,000 to $24,999 | 1,544 (15.6%) | 293 (3.0%) |
| $25,000 to $34,999 | 1,323 (13.4%) | 519 (5.2%) |
| $35,000 to $49,999 | 1,519 (15.3%) | 665 (6.7%) |
| $50,000 to $74,999 | 1,678 (16.9%) | 1,145 (11.6%) |
| $75,000 to $99,999 | 1,171 (11.8%) | 1,683 (17.0%) |
| $100,000 to $149,999 | 1,337 (13.5%) | 1,535 (15.5%) |
| $150,000 or more | 837 (8.5%) | 2,479 (25.1%) |
| Total | 9,911 (100.0%) | 9,896 (100.0%) |
Property Value to Household Income Ratio in Haywood County
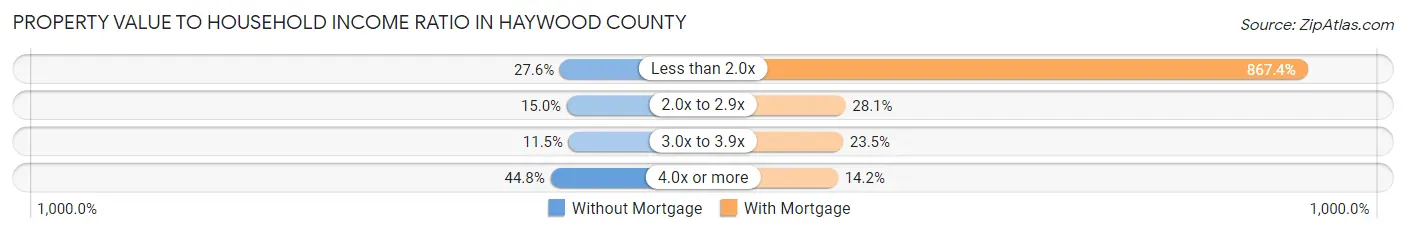
| Value-to-Income Ratio | Without Mortgage | With Mortgage |
| Less than 2.0x | 2,733 (27.6%) | 85,841 (867.4%) |
| 2.0x to 2.9x | 1,488 (15.0%) | 2,779 (28.1%) |
| 3.0x to 3.9x | 1,144 (11.5%) | 2,324 (23.5%) |
| 4.0x or more | 4,442 (44.8%) | 1,401 (14.2%) |
| Total | 9,911 (100.0%) | 9,896 (100.0%) |
Real Estate Taxes by Mortgage Status in Haywood County
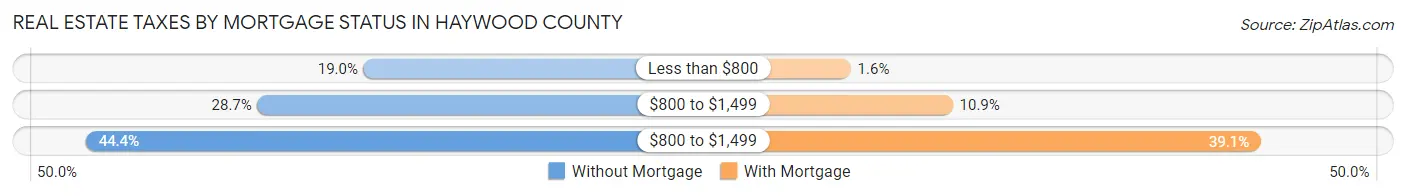
| Property Taxes | Without Mortgage | With Mortgage |
| Less than $800 | 1,885 (19.0%) | 159 (1.6%) |
| $800 to $1,499 | 2,846 (28.7%) | 1,081 (10.9%) |
| $800 to $1,499 | 4,401 (44.4%) | 3,868 (39.1%) |
| Total | 9,911 (100.0%) | 9,896 (100.0%) |
Health & Disability in Haywood County
Health Insurance Coverage by Age in Haywood County
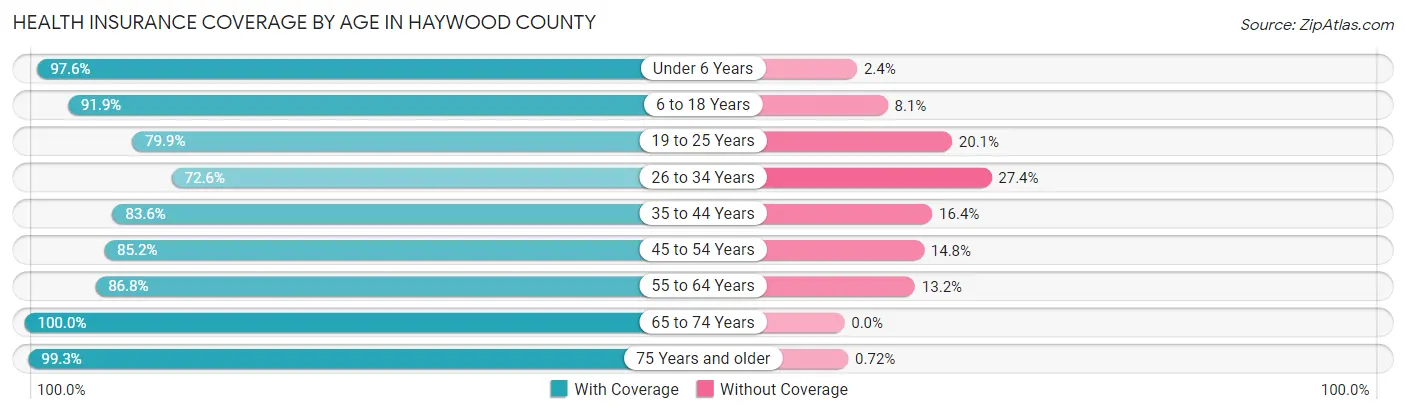
| Age Bracket | With Coverage | Without Coverage |
| Under 6 Years | 3,349 (97.6%) | 81 (2.4%) |
| 6 to 18 Years | 7,561 (91.9%) | 665 (8.1%) |
| 19 to 25 Years | 3,518 (79.9%) | 883 (20.1%) |
| 26 to 34 Years | 4,702 (72.6%) | 1,776 (27.4%) |
| 35 to 44 Years | 5,473 (83.6%) | 1,072 (16.4%) |
| 45 to 54 Years | 6,728 (85.2%) | 1,172 (14.8%) |
| 55 to 64 Years | 8,178 (86.8%) | 1,240 (13.2%) |
| 65 to 74 Years | 8,925 (100.0%) | 0 (0.0%) |
| 75 Years and older | 6,301 (99.3%) | 46 (0.7%) |
| Total | 54,735 (88.7%) | 6,935 (11.3%) |
Health Insurance Coverage by Citizenship Status in Haywood County
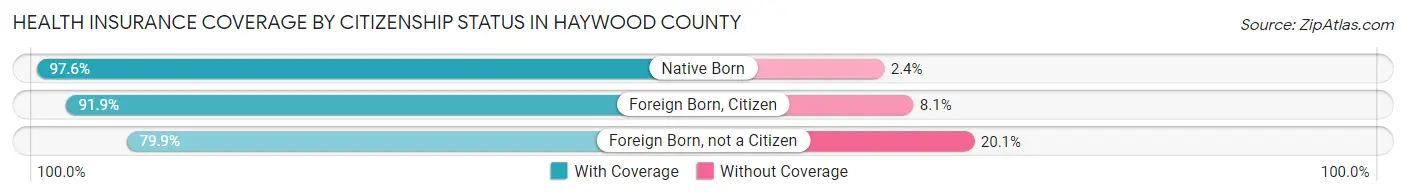
| Citizenship Status | With Coverage | Without Coverage |
| Native Born | 3,349 (97.6%) | 81 (2.4%) |
| Foreign Born, Citizen | 7,561 (91.9%) | 665 (8.1%) |
| Foreign Born, not a Citizen | 3,518 (79.9%) | 883 (20.1%) |
Health Insurance Coverage by Household Income in Haywood County
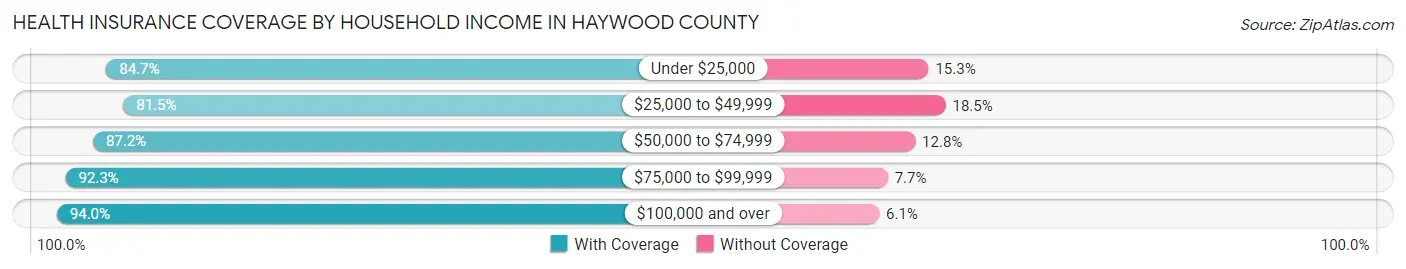
| Household Income | With Coverage | Without Coverage |
| Under $25,000 | 7,285 (84.7%) | 1,317 (15.3%) |
| $25,000 to $49,999 | 10,202 (81.5%) | 2,316 (18.5%) |
| $50,000 to $74,999 | 9,081 (87.2%) | 1,334 (12.8%) |
| $75,000 to $99,999 | 8,036 (92.3%) | 667 (7.7%) |
| $100,000 and over | 20,032 (94.0%) | 1,290 (6.0%) |
Public vs Private Health Insurance Coverage by Age in Haywood County
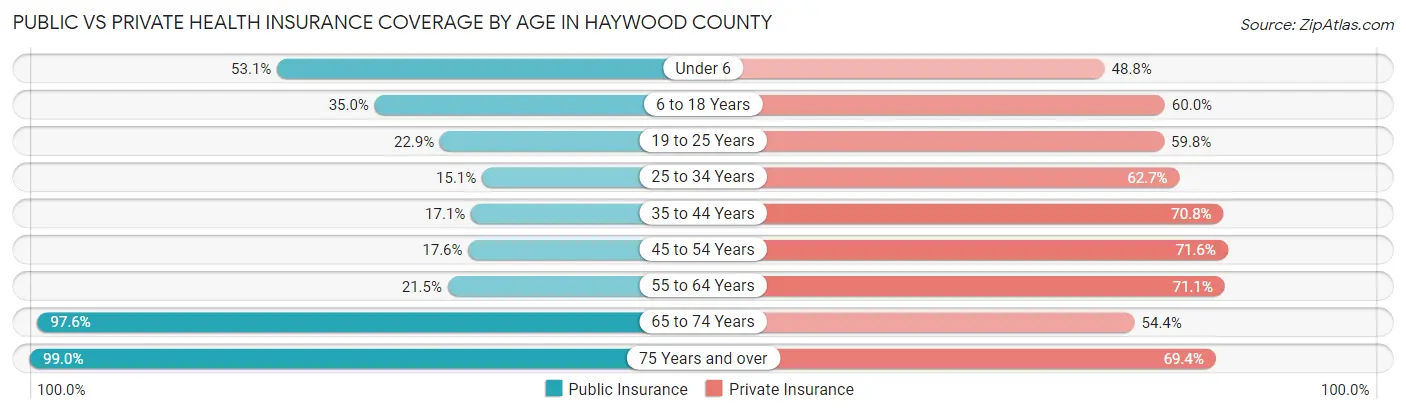
| Age Bracket | Public Insurance | Private Insurance |
| Under 6 | 1,822 (53.1%) | 1,673 (48.8%) |
| 6 to 18 Years | 2,881 (35.0%) | 4,933 (60.0%) |
| 19 to 25 Years | 1,007 (22.9%) | 2,633 (59.8%) |
| 25 to 34 Years | 977 (15.1%) | 4,060 (62.7%) |
| 35 to 44 Years | 1,120 (17.1%) | 4,636 (70.8%) |
| 45 to 54 Years | 1,393 (17.6%) | 5,658 (71.6%) |
| 55 to 64 Years | 2,020 (21.4%) | 6,695 (71.1%) |
| 65 to 74 Years | 8,713 (97.6%) | 4,851 (54.3%) |
| 75 Years and over | 6,282 (99.0%) | 4,405 (69.4%) |
| Total | 26,215 (42.5%) | 39,544 (64.1%) |
Disability Status by Sex by Age in Haywood County
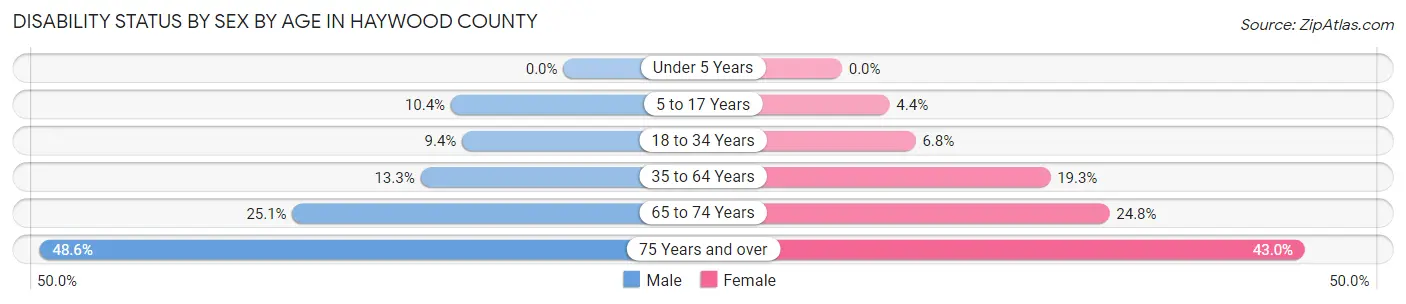
| Age Bracket | Male | Female |
| Under 5 Years | 0 (0.0%) | 0 (0.0%) |
| 5 to 17 Years | 454 (10.4%) | 177 (4.4%) |
| 18 to 34 Years | 552 (9.4%) | 381 (6.8%) |
| 35 to 64 Years | 1,514 (13.3%) | 2,407 (19.3%) |
| 65 to 74 Years | 1,057 (25.1%) | 1,172 (24.8%) |
| 75 Years and over | 1,348 (48.6%) | 1,536 (43.0%) |
Disability Class by Sex by Age in Haywood County
Disability Class: Hearing Difficulty
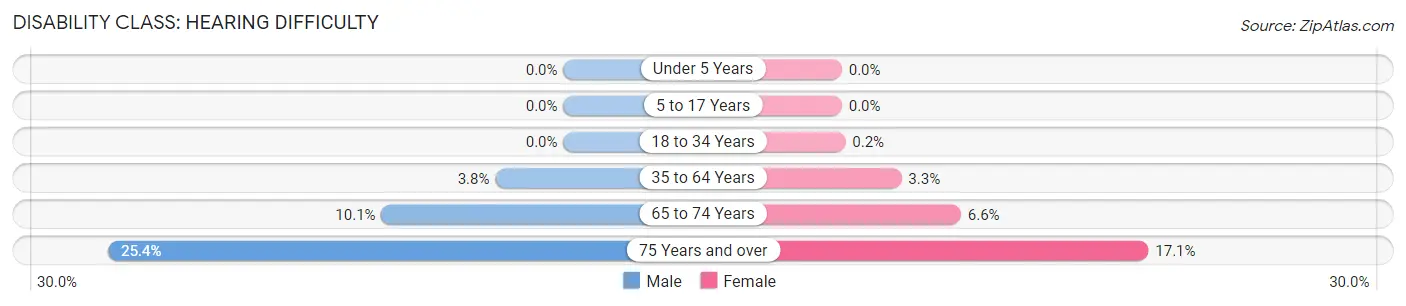
| Age Bracket | Male | Female |
| Under 5 Years | 0 (0.0%) | 0 (0.0%) |
| 5 to 17 Years | 0 (0.0%) | 0 (0.0%) |
| 18 to 34 Years | 0 (0.0%) | 11 (0.2%) |
| 35 to 64 Years | 433 (3.8%) | 413 (3.3%) |
| 65 to 74 Years | 426 (10.1%) | 313 (6.6%) |
| 75 Years and over | 703 (25.4%) | 610 (17.1%) |
Disability Class: Vision Difficulty
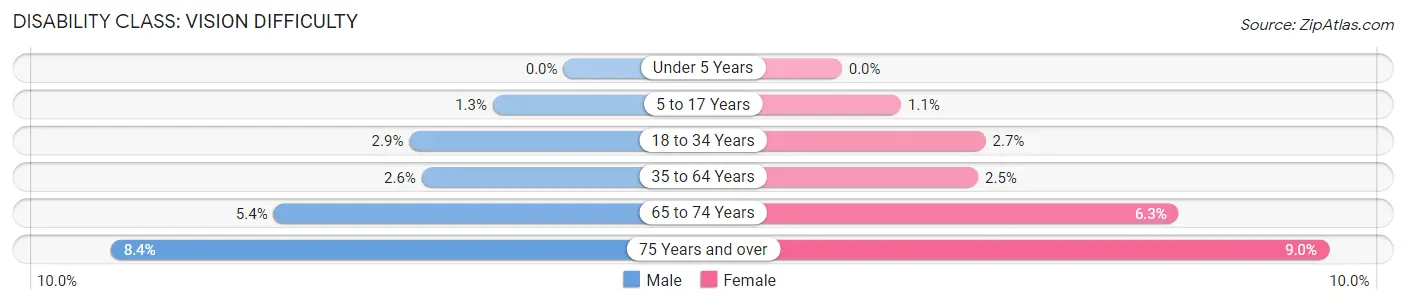
| Age Bracket | Male | Female |
| Under 5 Years | 0 (0.0%) | 0 (0.0%) |
| 5 to 17 Years | 57 (1.3%) | 44 (1.1%) |
| 18 to 34 Years | 168 (2.9%) | 149 (2.7%) |
| 35 to 64 Years | 300 (2.6%) | 315 (2.5%) |
| 65 to 74 Years | 226 (5.4%) | 295 (6.2%) |
| 75 Years and over | 233 (8.4%) | 323 (9.0%) |
Disability Class: Cognitive Difficulty
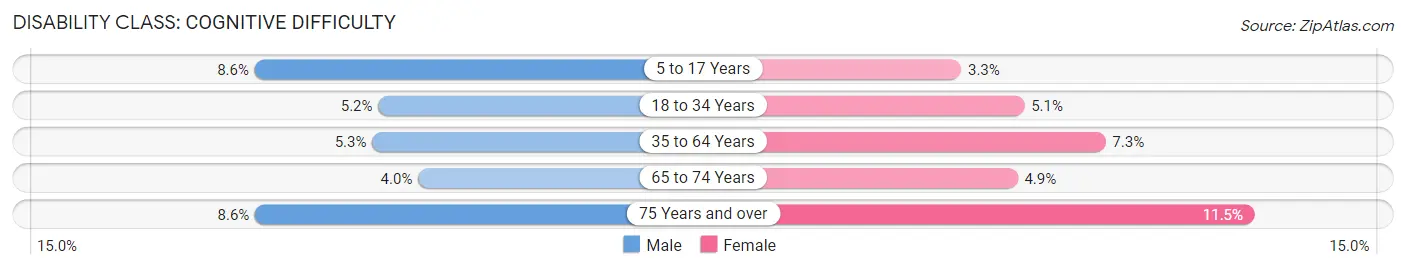
| Age Bracket | Male | Female |
| 5 to 17 Years | 374 (8.6%) | 133 (3.3%) |
| 18 to 34 Years | 303 (5.1%) | 283 (5.1%) |
| 35 to 64 Years | 607 (5.3%) | 914 (7.3%) |
| 65 to 74 Years | 170 (4.0%) | 231 (4.9%) |
| 75 Years and over | 238 (8.6%) | 411 (11.5%) |
Disability Class: Ambulatory Difficulty
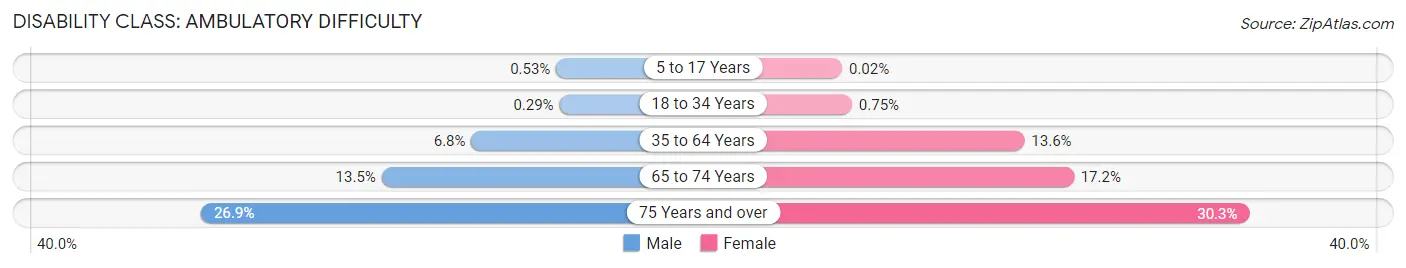
| Age Bracket | Male | Female |
| 5 to 17 Years | 23 (0.5%) | 1 (0.0%) |
| 18 to 34 Years | 17 (0.3%) | 42 (0.7%) |
| 35 to 64 Years | 780 (6.8%) | 1,688 (13.6%) |
| 65 to 74 Years | 567 (13.5%) | 813 (17.2%) |
| 75 Years and over | 746 (26.9%) | 1,081 (30.2%) |
Disability Class: Self-Care Difficulty
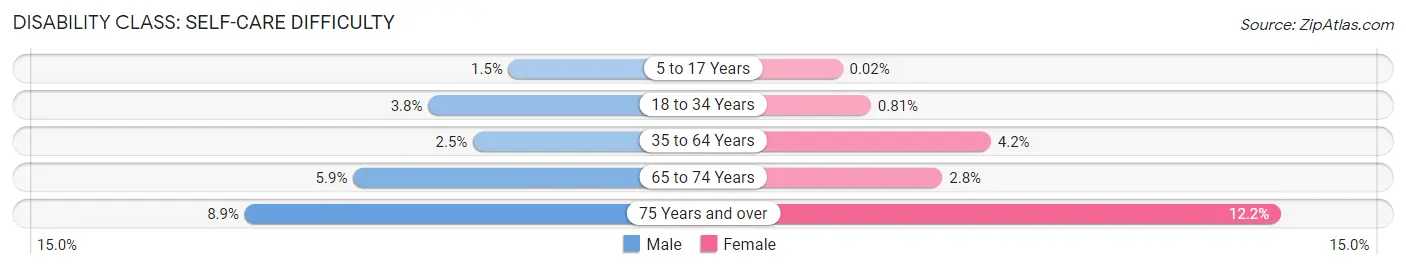
| Age Bracket | Male | Female |
| 5 to 17 Years | 66 (1.5%) | 1 (0.0%) |
| 18 to 34 Years | 221 (3.8%) | 45 (0.8%) |
| 35 to 64 Years | 287 (2.5%) | 517 (4.2%) |
| 65 to 74 Years | 246 (5.9%) | 132 (2.8%) |
| 75 Years and over | 246 (8.9%) | 437 (12.2%) |
Technology Access in Haywood County
Computing Device Access in Haywood County
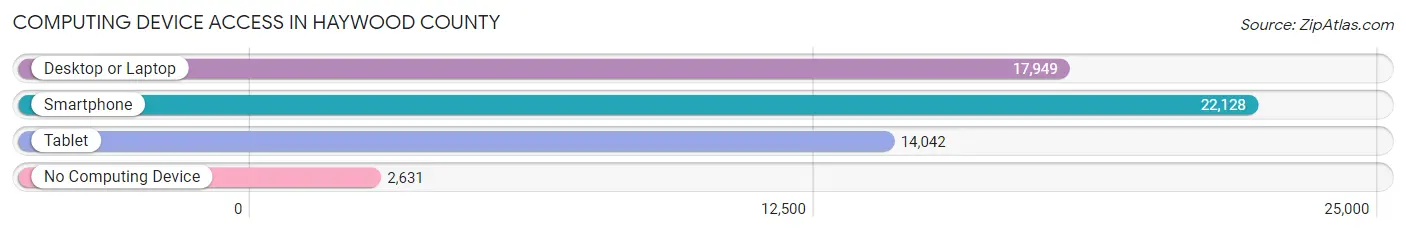
| Device Type | # Households | % Households |
| Desktop or Laptop | 17,949 | 67.8% |
| Smartphone | 22,128 | 83.6% |
| Tablet | 14,042 | 53.0% |
| No Computing Device | 2,631 | 9.9% |
| Total | 26,481 | 100.0% |
Internet Access in Haywood County
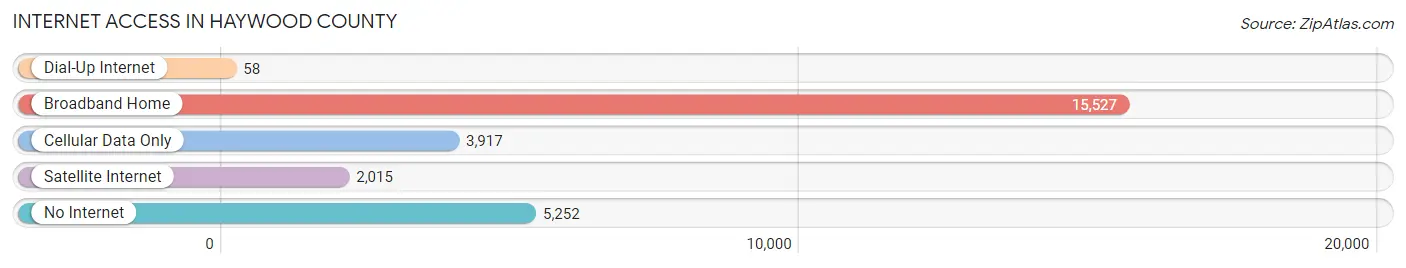
| Internet Type | # Households | % Households |
| Dial-Up Internet | 58 | 0.2% |
| Broadband Home | 15,527 | 58.6% |
| Cellular Data Only | 3,917 | 14.8% |
| Satellite Internet | 2,015 | 7.6% |
| No Internet | 5,252 | 19.8% |
| Total | 26,481 | 100.0% |
Haywood County Summary
Haywood County is located in the western part of North Carolina, in the Appalachian Mountains. It is bordered by Buncombe County to the north, Madison County to the east, Jackson County to the south, and Swain County to the west. The county seat is Waynesville, and the largest city is Canton. The county was formed in 1808 from parts of Buncombe and Macon counties.
Geography
Haywood County covers an area of 545 square miles, making it the fourth largest county in North Carolina. The terrain is mostly mountainous, with elevations ranging from 1,000 to 6,000 feet. The highest point in the county is Richland Balsam, at 6,410 feet. The county is home to the Great Smoky Mountains National Park, the Pisgah National Forest, and the Blue Ridge Parkway. The county is also home to several rivers, including the Pigeon, French Broad, and Tuckasegee.
Climate
Haywood County has a humid subtropical climate, with hot, humid summers and mild winters. The average annual temperature is 57°F, and the average annual precipitation is 47 inches.
Demographics
As of the 2010 census, Haywood County had a population of 59,036. The racial makeup of the county was 92.3% White, 4.2% Black or African American, 0.7% Native American, 0.7% Asian, 0.1% Pacific Islander, 1.2% from other races, and 1.1% from two or more races. Hispanic or Latino of any race were 3.2% of the population.
Economy
Haywood County has a diverse economy, with a mix of agriculture, manufacturing, and tourism. The county is home to several large employers, including Evergreen Packaging, Haywood Regional Medical Center, and Haywood Community College. Agriculture is a major part of the economy, with the county producing apples, beef cattle, hay, and poultry. Manufacturing is also important, with the county producing furniture, textiles, and wood products. Tourism is also a major part of the economy, with the county being home to the Great Smoky Mountains National Park, the Blue Ridge Parkway, and several ski resorts.
History
The area that is now Haywood County was originally inhabited by the Cherokee and Catawba Native American tribes. The first European settlers arrived in the area in the late 1700s, and the county was officially formed in 1808. The county was named for John Haywood, the state treasurer of North Carolina.
During the Civil War, Haywood County was a Confederate stronghold. The county was the site of several battles, including the Battle of Waynesville in 1865. After the war, the county experienced a period of economic growth, with the development of the railroad and the timber industry.
In the early 1900s, the county began to develop its tourism industry, with the opening of the Great Smoky Mountains National Park in 1934. The county also experienced a period of population growth, with the population increasing from 17,000 in 1950 to over 59,000 in 2010.
Common Questions
What is Per Capita Income in Haywood County?
Per Capita income in Haywood County is $34,609.
What is the Median Family Income in Haywood County?
Median Family Income in Haywood County is $78,553.
What is the Median Household income in Haywood County?
Median Household Income in Haywood County is $56,596.
What is Income or Wage Gap in Haywood County?
Income or Wage Gap in Haywood County is 27.5%.
Women in Haywood County earn 72.5 cents for every dollar earned by a man.
What is Family Income Deficit in Haywood County?
Family Income Deficit in Haywood County is $10,144.
Families that are below poverty line in Haywood County earn $10,144 less on average than the poverty threshold level.
What is Inequality or Gini Index in Haywood County?
Inequality or Gini Index in Haywood County is 0.45.
What is the Total Population of Haywood County?
Total Population of Haywood County is 62,152.
What is the Total Male Population of Haywood County?
Total Male Population of Haywood County is 30,253.
What is the Total Female Population of Haywood County?
Total Female Population of Haywood County is 31,899.
What is the Ratio of Males per 100 Females in Haywood County?
There are 94.84 Males per 100 Females in Haywood County.
What is the Ratio of Females per 100 Males in Haywood County?
There are 105.44 Females per 100 Males in Haywood County.
What is the Median Population Age in Haywood County?
Median Population Age in Haywood County is 47.7 Years.
What is the Average Family Size in Haywood County
Average Family Size in Haywood County is 2.9 People.
What is the Average Household Size in Haywood County
Average Household Size in Haywood County is 2.3 People.
How Large is the Labor Force in Haywood County?
There are 29,080 People in the Labor Forcein in Haywood County.
What is the Percentage of People in the Labor Force in Haywood County?
55.5% of People are in the Labor Force in Haywood County.
What is the Unemployment Rate in Haywood County?
Unemployment Rate in Haywood County is 3.5%.