Halifax County, NC Map & Demographics
Halifax County Map
Halifax County Overview
$25,504
PER CAPITA INCOME
$54,419
AVG FAMILY INCOME
$41,629
AVG HOUSEHOLD INCOME
13.7%
WAGE / INCOME GAP [ % ]
86.3¢/ $1
WAGE / INCOME GAP [ $ ]
$9,645
FAMILY INCOME DEFICIT
0.49
INEQUALITY / GINI INDEX
48,772
TOTAL POPULATION
23,755
MALE POPULATION
25,017
FEMALE POPULATION
94.96
MALES / 100 FEMALES
105.31
FEMALES / 100 MALES
43.6
MEDIAN AGE
3.0
AVG FAMILY SIZE
2.4
AVG HOUSEHOLD SIZE
20,180
LABOR FORCE [ PEOPLE ]
50.7%
PERCENT IN LABOR FORCE
9.3%
UNEMPLOYMENT RATE
Halifax County Area Codes
Income in Halifax County
Income Overview in Halifax County
Per Capita Income in Halifax County is $25,504, while median incomes of families and households are $54,419 and $41,629 respectively.
| Characteristic | Number | Measure |
| Per Capita Income | 48,772 | $25,504 |
| Median Family Income | 12,850 | $54,419 |
| Mean Family Income | 12,850 | $71,716 |
| Median Household Income | 20,139 | $41,629 |
| Mean Household Income | 20,139 | $59,133 |
| Income Deficit | 12,850 | $9,645 |
| Wage / Income Gap (%) | 48,772 | 13.67% |
| Wage / Income Gap ($) | 48,772 | 86.33¢ per $1 |
| Gini / Inequality Index | 48,772 | 0.49 |
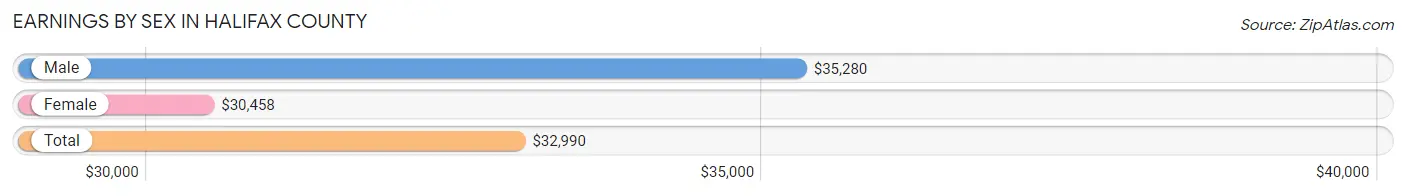
Earnings by Sex in Halifax County
Average Earnings in Halifax County are $32,990, $35,280 for men and $30,458 for women, a difference of 13.7%.
| Sex | Number | Average Earnings |
| Male | 10,565 (51.3%) | $35,280 |
| Female | 10,032 (48.7%) | $30,458 |
| Total | 20,597 (100.0%) | $32,990 |
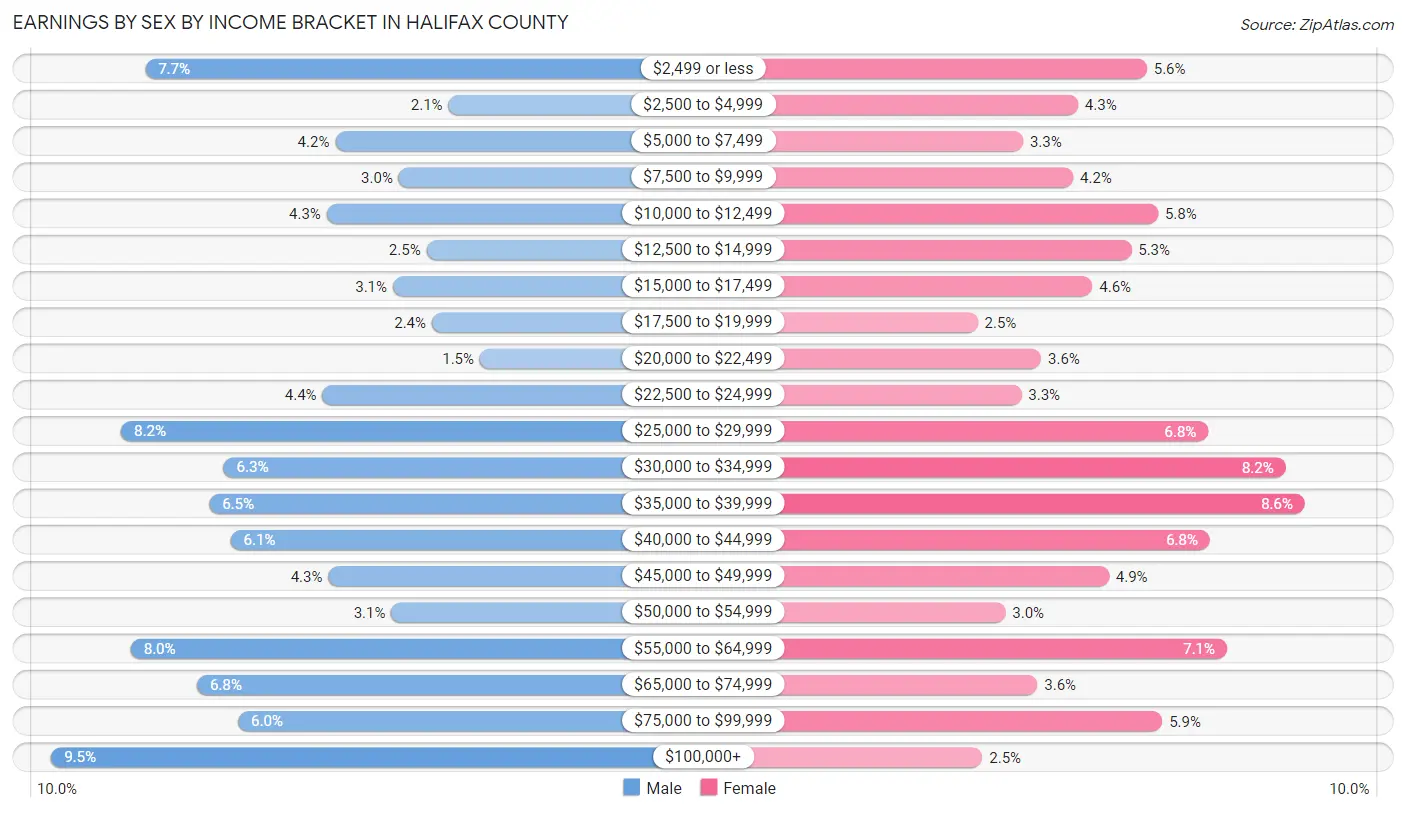
Earnings by Sex by Income Bracket in Halifax County
The most common earnings brackets in Halifax County are $100,000+ for men (1,004 | 9.5%) and $35,000 to $39,999 for women (861 | 8.6%).
| Income | Male | Female |
| $2,499 or less | 818 (7.7%) | 564 (5.6%) |
| $2,500 to $4,999 | 218 (2.1%) | 434 (4.3%) |
| $5,000 to $7,499 | 442 (4.2%) | 331 (3.3%) |
| $7,500 to $9,999 | 316 (3.0%) | 425 (4.2%) |
| $10,000 to $12,499 | 459 (4.3%) | 585 (5.8%) |
| $12,500 to $14,999 | 261 (2.5%) | 535 (5.3%) |
| $15,000 to $17,499 | 327 (3.1%) | 461 (4.6%) |
| $17,500 to $19,999 | 250 (2.4%) | 246 (2.5%) |
| $20,000 to $22,499 | 155 (1.5%) | 365 (3.6%) |
| $22,500 to $24,999 | 467 (4.4%) | 328 (3.3%) |
| $25,000 to $29,999 | 865 (8.2%) | 679 (6.8%) |
| $30,000 to $34,999 | 662 (6.3%) | 825 (8.2%) |
| $35,000 to $39,999 | 691 (6.5%) | 861 (8.6%) |
| $40,000 to $44,999 | 649 (6.1%) | 682 (6.8%) |
| $45,000 to $49,999 | 455 (4.3%) | 493 (4.9%) |
| $50,000 to $54,999 | 331 (3.1%) | 298 (3.0%) |
| $55,000 to $64,999 | 846 (8.0%) | 714 (7.1%) |
| $65,000 to $74,999 | 715 (6.8%) | 358 (3.6%) |
| $75,000 to $99,999 | 634 (6.0%) | 593 (5.9%) |
| $100,000+ | 1,004 (9.5%) | 255 (2.5%) |
| Total | 10,565 (100.0%) | 10,032 (100.0%) |
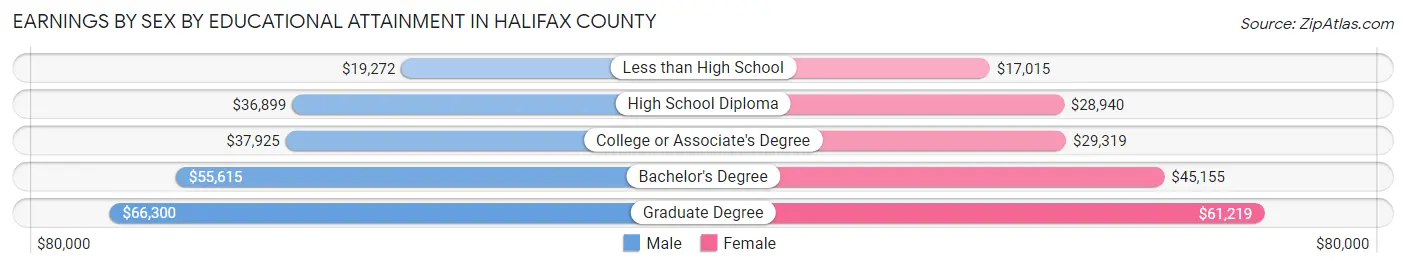
Earnings by Sex by Educational Attainment in Halifax County
Average earnings in Halifax County are $38,624 for men and $33,130 for women, a difference of 14.2%. Men with an educational attainment of graduate degree enjoy the highest average annual earnings of $66,300, while those with less than high school education earn the least with $19,272. Women with an educational attainment of graduate degree earn the most with the average annual earnings of $61,219, while those with less than high school education have the smallest earnings of $17,015.
| Educational Attainment | Male Income | Female Income |
| Less than High School | $19,272 | $17,015 |
| High School Diploma | $36,899 | $28,940 |
| College or Associate's Degree | $37,925 | $29,319 |
| Bachelor's Degree | $55,615 | $45,155 |
| Graduate Degree | $66,300 | $61,219 |
| Total | $38,624 | $33,130 |
Family Income in Halifax County
Family Income Brackets in Halifax County
According to the Halifax County family income data, there are 2,570 families falling into the $50,000 to $74,999 income range, which is the most common income bracket and makes up 20.0% of all families. Conversely, the $200,000+ income bracket is the least frequent group with only 527 families (4.1%) belonging to this category.
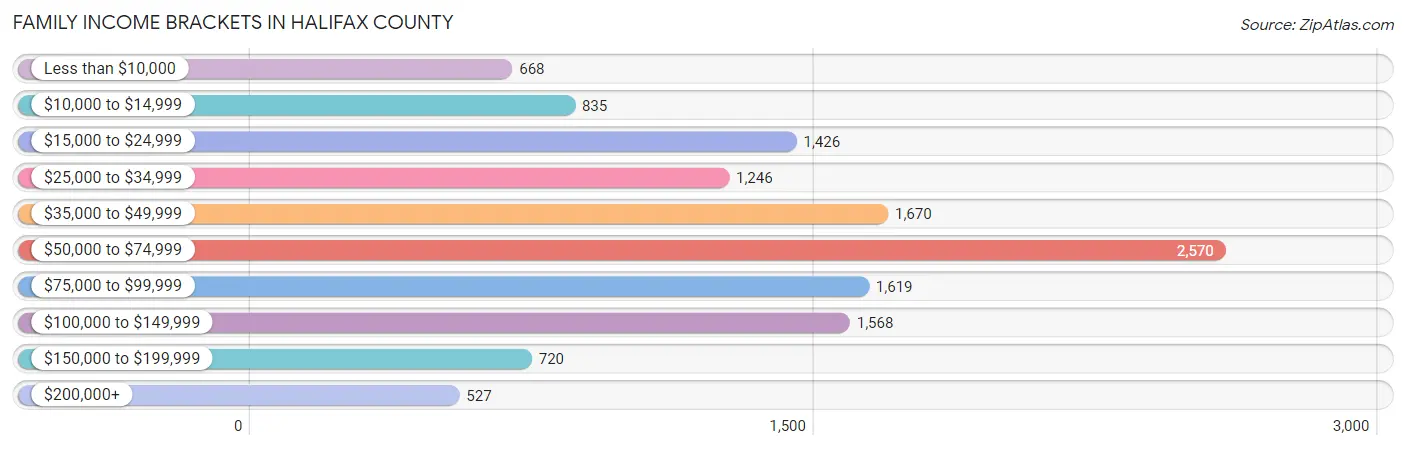
| Income Bracket | # Families | % Families |
| Less than $10,000 | 668 | 5.2% |
| $10,000 to $14,999 | 835 | 6.5% |
| $15,000 to $24,999 | 1,426 | 11.1% |
| $25,000 to $34,999 | 1,246 | 9.7% |
| $35,000 to $49,999 | 1,670 | 13.0% |
| $50,000 to $74,999 | 2,570 | 20.0% |
| $75,000 to $99,999 | 1,619 | 12.6% |
| $100,000 to $149,999 | 1,568 | 12.2% |
| $150,000 to $199,999 | 720 | 5.6% |
| $200,000+ | 527 | 4.1% |
Family Income by Famaliy Size in Halifax County
5-person families (581 | 4.5%) account for the highest median family income in Halifax County with $82,361 per family, while 2-person families (6,801 | 52.9%) have the highest median income of $26,658 per family member.
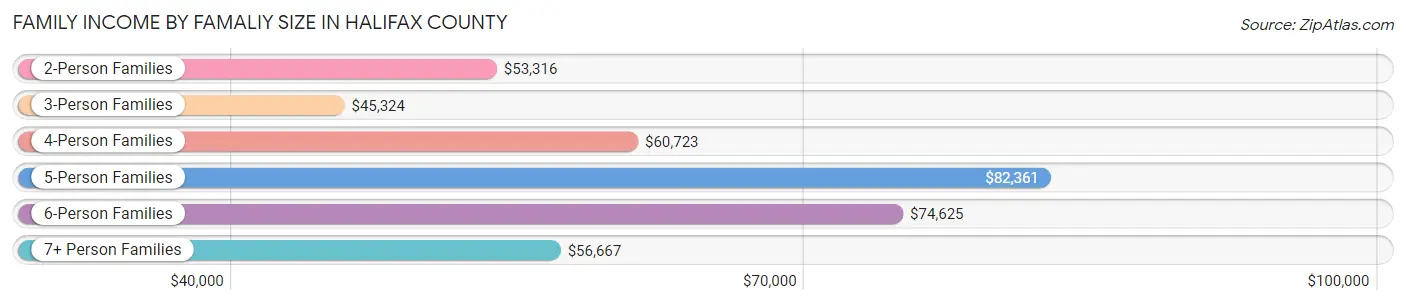
| Income Bracket | # Families | Median Income |
| 2-Person Families | 6,801 (52.9%) | $53,316 |
| 3-Person Families | 3,136 (24.4%) | $45,324 |
| 4-Person Families | 1,956 (15.2%) | $60,723 |
| 5-Person Families | 581 (4.5%) | $82,361 |
| 6-Person Families | 206 (1.6%) | $74,625 |
| 7+ Person Families | 170 (1.3%) | $56,667 |
| Total | 12,850 (100.0%) | $54,419 |
Family Income by Number of Earners in Halifax County
The median family income in Halifax County is $54,419, with families comprising 3+ earners (817) having the highest median family income of $114,235, while families with no earners (3,162) have the lowest median family income of $29,903, accounting for 6.4% and 24.6% of families, respectively.
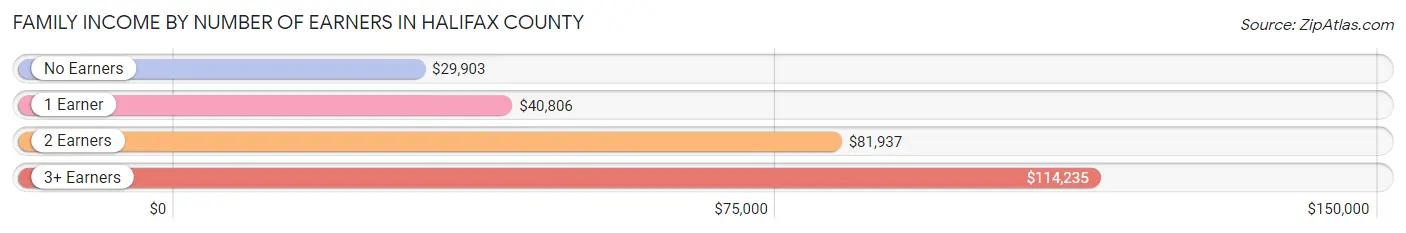
| Number of Earners | # Families | Median Income |
| No Earners | 3,162 (24.6%) | $29,903 |
| 1 Earner | 4,873 (37.9%) | $40,806 |
| 2 Earners | 3,998 (31.1%) | $81,937 |
| 3+ Earners | 817 (6.4%) | $114,235 |
| Total | 12,850 (100.0%) | $54,419 |
Household Income in Halifax County
Household Income Brackets in Halifax County
With 3,242 households falling in the category, the $50,000 to $74,999 income range is the most frequent in Halifax County, accounting for 16.1% of all households. In contrast, only 604 households (3.0%) fall into the $200,000+ income bracket, making it the least populous group.
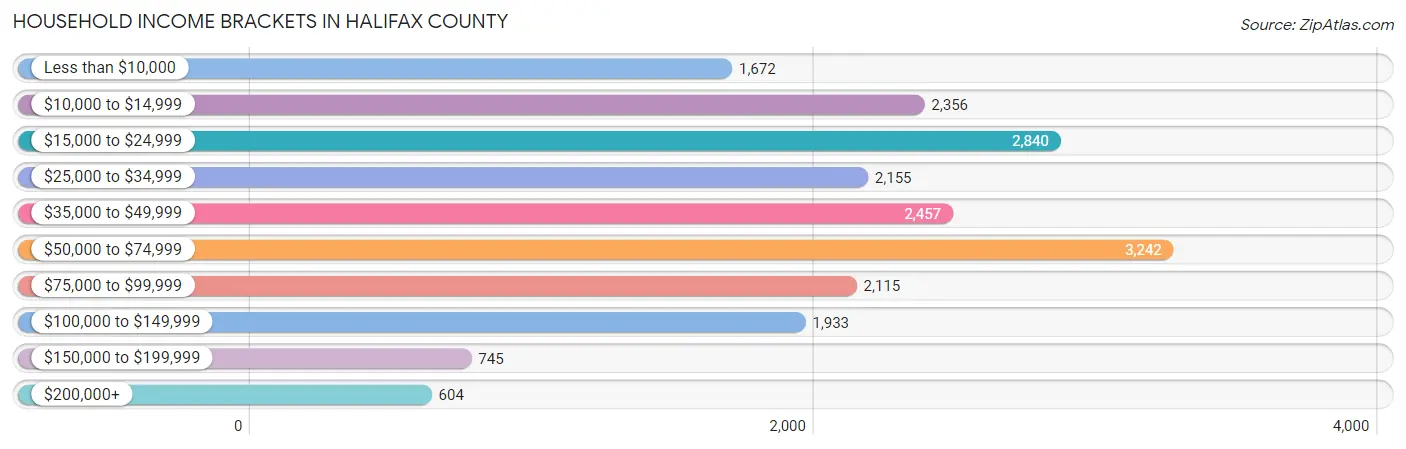
| Income Bracket | # Households | % Households |
| Less than $10,000 | 1,672 | 8.3% |
| $10,000 to $14,999 | 2,356 | 11.7% |
| $15,000 to $24,999 | 2,840 | 14.1% |
| $25,000 to $34,999 | 2,155 | 10.7% |
| $35,000 to $49,999 | 2,457 | 12.2% |
| $50,000 to $74,999 | 3,242 | 16.1% |
| $75,000 to $99,999 | 2,115 | 10.5% |
| $100,000 to $149,999 | 1,933 | 9.6% |
| $150,000 to $199,999 | 745 | 3.7% |
| $200,000+ | 604 | 3.0% |
Household Income by Householder Age in Halifax County
The median household income in Halifax County is $41,629, with the highest median household income of $52,729 found in the 45 to 64 years age bracket for the primary householder. A total of 7,714 households (38.3%) fall into this category. Meanwhile, the 15 to 24 years age bracket for the primary householder has the lowest median household income of $0, with 496 households (2.5%) in this group.
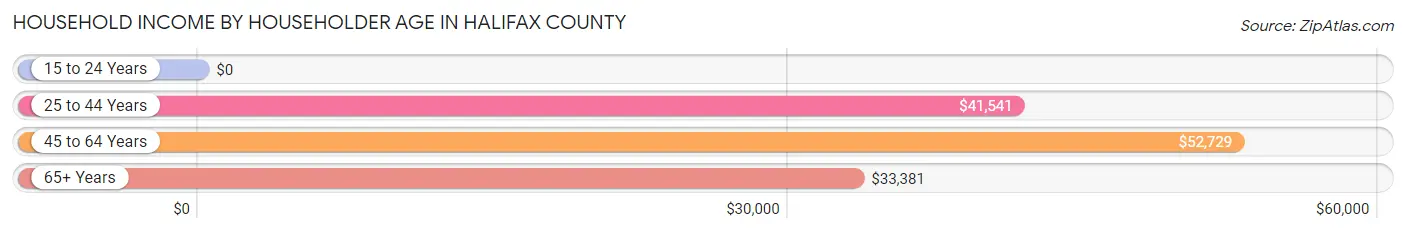
| Income Bracket | # Households | Median Income |
| 15 to 24 Years | 496 (2.5%) | $0 |
| 25 to 44 Years | 4,776 (23.7%) | $41,541 |
| 45 to 64 Years | 7,714 (38.3%) | $52,729 |
| 65+ Years | 7,153 (35.5%) | $33,381 |
| Total | 20,139 (100.0%) | $41,629 |
Poverty in Halifax County
Income Below Poverty by Sex and Age in Halifax County
With 21.5% poverty level for males and 26.0% for females among the residents of Halifax County, 15 year old males and 6 to 11 year old females are the most vulnerable to poverty, with 112 males (48.3%) and 726 females (43.1%) in their respective age groups living below the poverty level.
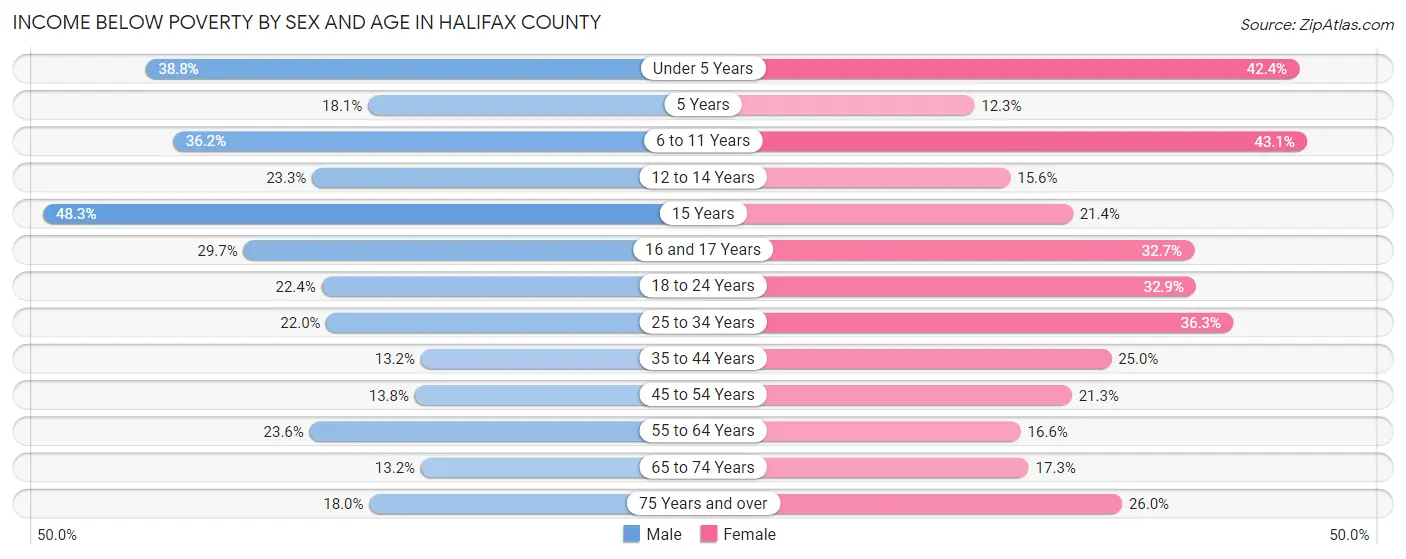
| Age Bracket | Male | Female |
| Under 5 Years | 489 (38.8%) | 560 (42.4%) |
| 5 Years | 27 (18.1%) | 39 (12.3%) |
| 6 to 11 Years | 591 (36.2%) | 726 (43.1%) |
| 12 to 14 Years | 286 (23.3%) | 124 (15.6%) |
| 15 Years | 112 (48.3%) | 54 (21.4%) |
| 16 and 17 Years | 233 (29.7%) | 198 (32.7%) |
| 18 to 24 Years | 410 (22.4%) | 585 (32.9%) |
| 25 to 34 Years | 604 (22.0%) | 1,016 (36.3%) |
| 35 to 44 Years | 332 (13.2%) | 660 (25.0%) |
| 45 to 54 Years | 373 (13.8%) | 633 (21.3%) |
| 55 to 64 Years | 802 (23.5%) | 632 (16.6%) |
| 65 to 74 Years | 362 (13.2%) | 582 (17.3%) |
| 75 Years and over | 286 (18.0%) | 631 (26.0%) |
| Total | 4,907 (21.5%) | 6,440 (26.0%) |
Income Above Poverty by Sex and Age in Halifax County
According to the poverty statistics in Halifax County, males aged 65 to 74 years and females aged 5 years are the age groups that are most secure financially, with 86.8% of males and 87.7% of females in these age groups living above the poverty line.
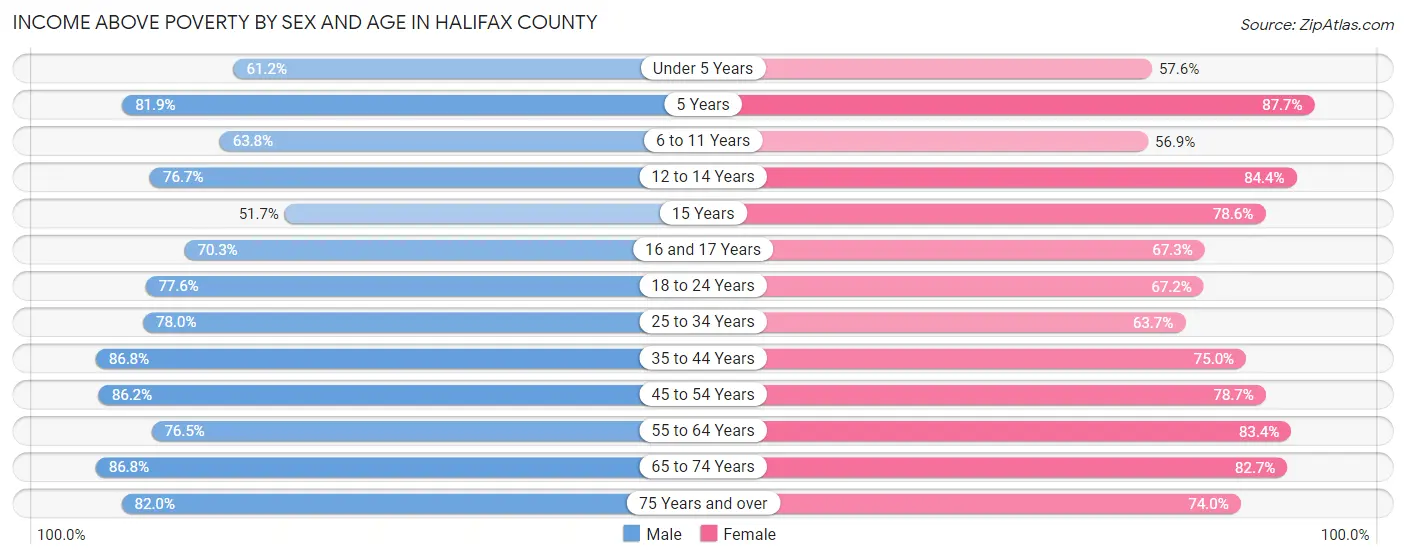
| Age Bracket | Male | Female |
| Under 5 Years | 772 (61.2%) | 760 (57.6%) |
| 5 Years | 122 (81.9%) | 278 (87.7%) |
| 6 to 11 Years | 1,040 (63.8%) | 957 (56.9%) |
| 12 to 14 Years | 941 (76.7%) | 669 (84.4%) |
| 15 Years | 120 (51.7%) | 198 (78.6%) |
| 16 and 17 Years | 552 (70.3%) | 408 (67.3%) |
| 18 to 24 Years | 1,417 (77.6%) | 1,196 (67.1%) |
| 25 to 34 Years | 2,143 (78.0%) | 1,784 (63.7%) |
| 35 to 44 Years | 2,177 (86.8%) | 1,980 (75.0%) |
| 45 to 54 Years | 2,331 (86.2%) | 2,333 (78.7%) |
| 55 to 64 Years | 2,604 (76.4%) | 3,176 (83.4%) |
| 65 to 74 Years | 2,377 (86.8%) | 2,774 (82.7%) |
| 75 Years and over | 1,302 (82.0%) | 1,796 (74.0%) |
| Total | 17,898 (78.5%) | 18,309 (74.0%) |
Income Below Poverty Among Married-Couple Families in Halifax County
The poverty statistics for married-couple families in Halifax County show that 6.4% or 500 of the total 7,875 families live below the poverty line. Families with 3 or 4 children have the highest poverty rate of 7.5%, comprising of 29 families. On the other hand, families with 5 or more children have the lowest poverty rate of 0.0%, which includes 0 families.
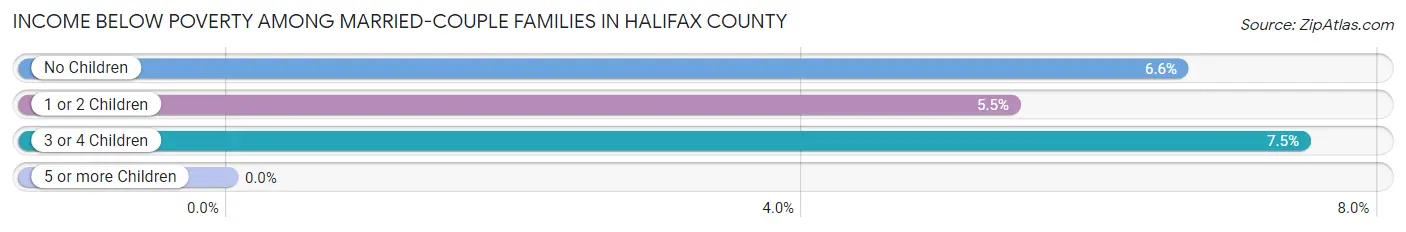
| Children | Above Poverty | Below Poverty |
| No Children | 5,276 (93.4%) | 374 (6.6%) |
| 1 or 2 Children | 1,683 (94.6%) | 97 (5.4%) |
| 3 or 4 Children | 359 (92.5%) | 29 (7.5%) |
| 5 or more Children | 57 (100.0%) | 0 (0.0%) |
| Total | 7,375 (93.6%) | 500 (6.4%) |
Income Below Poverty Among Single-Parent Households in Halifax County
According to the poverty data in Halifax County, 37.3% or 274 single-father households and 43.2% or 1,830 single-mother households are living below the poverty line. Among single-father households, those with 3 or 4 children have the highest poverty rate, with 57 households (52.3%) experiencing poverty. Likewise, among single-mother households, those with 5 or more children have the highest poverty rate, with 50 households (96.2%) falling below the poverty line.
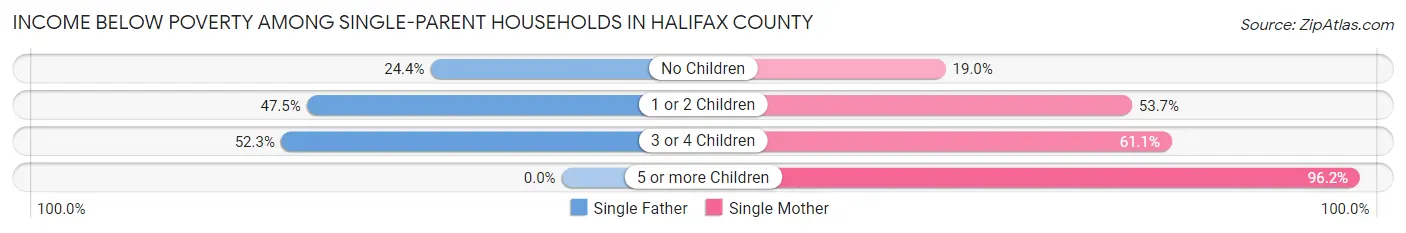
| Children | Single Father | Single Mother |
| No Children | 85 (24.4%) | 268 (19.0%) |
| 1 or 2 Children | 132 (47.5%) | 1,336 (53.7%) |
| 3 or 4 Children | 57 (52.3%) | 176 (61.1%) |
| 5 or more Children | 0 (0.0%) | 50 (96.2%) |
| Total | 274 (37.3%) | 1,830 (43.2%) |
Income Below Poverty Among Married-Couple vs Single-Parent Households in Halifax County
The poverty data for Halifax County shows that 500 of the married-couple family households (6.4%) and 2,104 of the single-parent households (42.3%) are living below the poverty level. Within the married-couple family households, those with 3 or 4 children have the highest poverty rate, with 29 households (7.5%) falling below the poverty line. Among the single-parent households, those with 5 or more children have the highest poverty rate, with 50 household (96.2%) living below poverty.
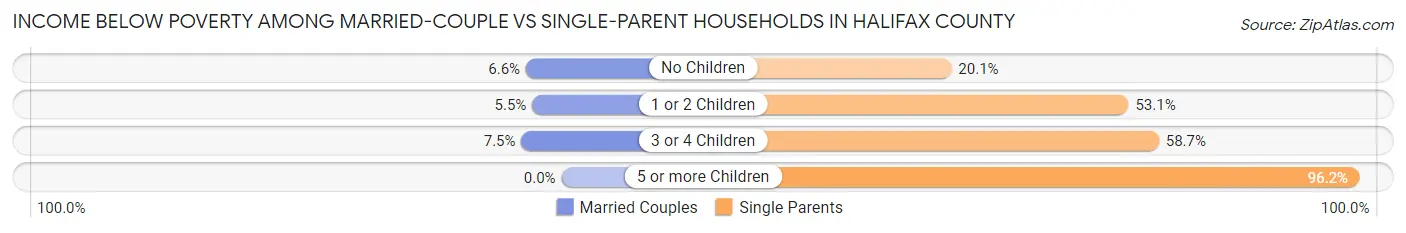
| Children | Married-Couple Families | Single-Parent Households |
| No Children | 374 (6.6%) | 353 (20.1%) |
| 1 or 2 Children | 97 (5.4%) | 1,468 (53.0%) |
| 3 or 4 Children | 29 (7.5%) | 233 (58.7%) |
| 5 or more Children | 0 (0.0%) | 50 (96.2%) |
| Total | 500 (6.4%) | 2,104 (42.3%) |
Race in Halifax County
The most populous races in Halifax County are Black / African American (25,181 | 51.6%), White / Caucasian (18,584 | 38.1%), and Two or more Races (2,400 | 4.9%).
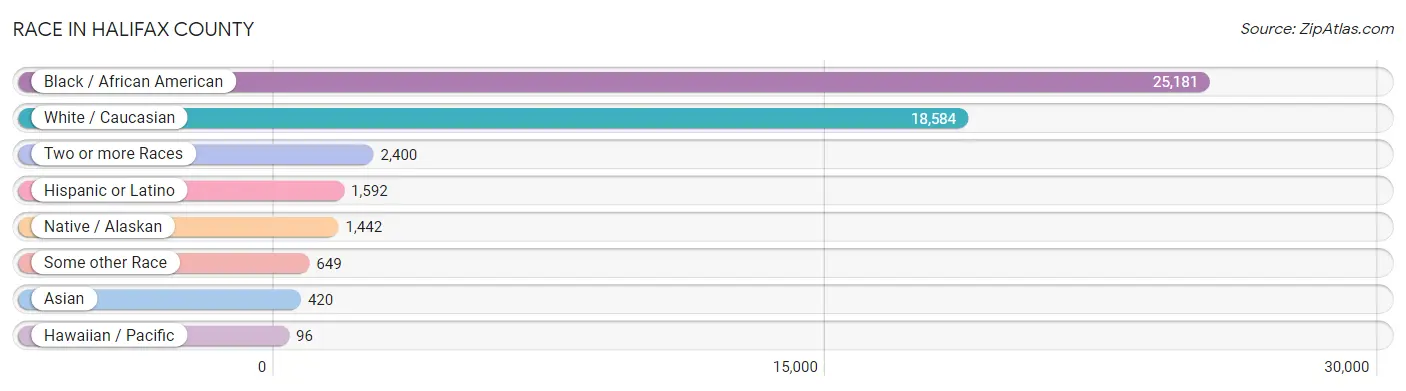
| Race | # Population | % Population |
| Asian | 420 | 0.9% |
| Black / African American | 25,181 | 51.6% |
| Hawaiian / Pacific | 96 | 0.2% |
| Hispanic or Latino | 1,592 | 3.3% |
| Native / Alaskan | 1,442 | 3.0% |
| White / Caucasian | 18,584 | 38.1% |
| Two or more Races | 2,400 | 4.9% |
| Some other Race | 649 | 1.3% |
| Total | 48,772 | 100.0% |
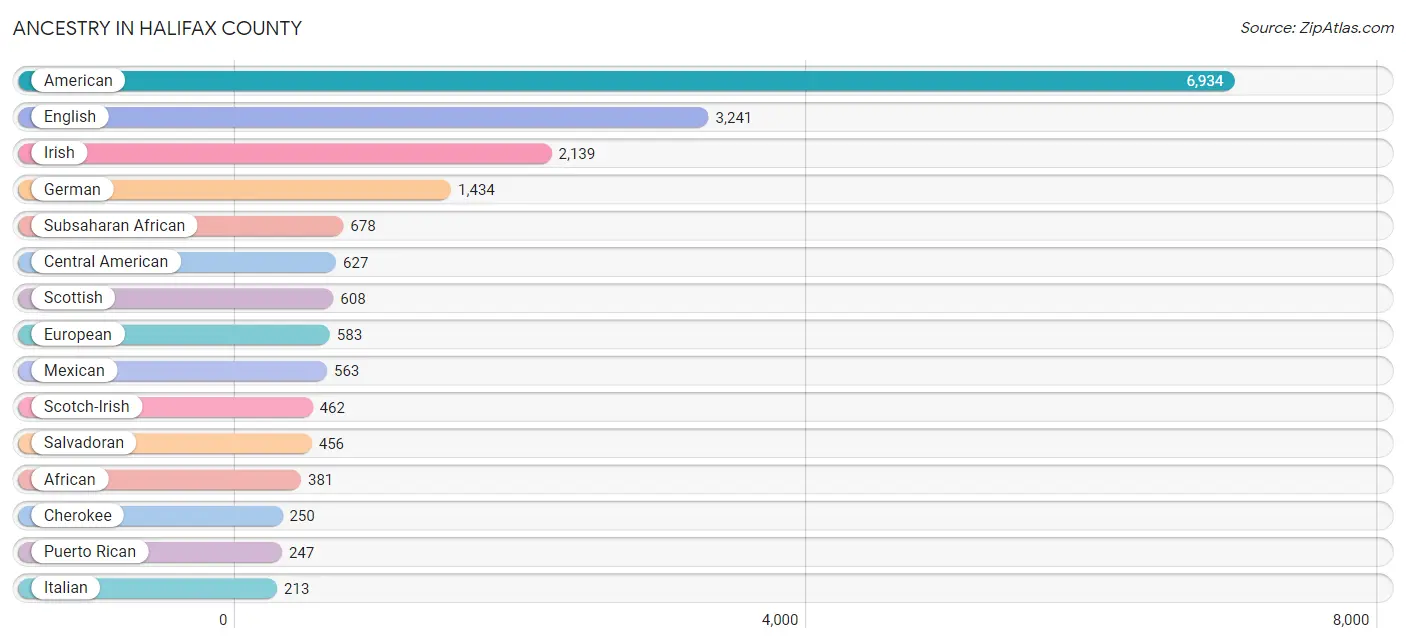
Ancestry in Halifax County
The most populous ancestries reported in Halifax County are American (6,934 | 14.2%), English (3,241 | 6.7%), Irish (2,139 | 4.4%), German (1,434 | 2.9%), and Subsaharan African (678 | 1.4%), together accounting for 29.6% of all Halifax County residents.
| Ancestry | # Population | % Population |
| African | 381 | 0.8% |
| Alaska Native | 4 | 0.0% |
| American | 6,934 | 14.2% |
| Apache | 16 | 0.0% |
| Arab | 54 | 0.1% |
| Belgian | 5 | 0.0% |
| Bhutanese | 97 | 0.2% |
| Blackfeet | 59 | 0.1% |
| Bolivian | 8 | 0.0% |
| British | 83 | 0.2% |
| British West Indian | 4 | 0.0% |
| Burmese | 5 | 0.0% |
| Canadian | 15 | 0.0% |
| Central American | 627 | 1.3% |
| Central American Indian | 4 | 0.0% |
| Cherokee | 250 | 0.5% |
| Chilean | 16 | 0.0% |
| Chippewa | 5 | 0.0% |
| Croatian | 6 | 0.0% |
| Cuban | 18 | 0.0% |
| Czech | 25 | 0.1% |
| Delaware | 5 | 0.0% |
| Dominican | 50 | 0.1% |
| Dutch | 196 | 0.4% |
| Egyptian | 4 | 0.0% |
| English | 3,241 | 6.7% |
| Ethiopian | 4 | 0.0% |
| European | 583 | 1.2% |
| French | 176 | 0.4% |
| French Canadian | 29 | 0.1% |
| German | 1,434 | 2.9% |
| Guamanian / Chamorro | 76 | 0.2% |
| Guatemalan | 153 | 0.3% |
| Guyanese | 3 | 0.0% |
| Haitian | 44 | 0.1% |
| Honduran | 18 | 0.0% |
| Hungarian | 17 | 0.0% |
| Indian (Asian) | 37 | 0.1% |
| Irish | 2,139 | 4.4% |
| Iroquois | 6 | 0.0% |
| Israeli | 3 | 0.0% |
| Italian | 213 | 0.4% |
| Jamaican | 96 | 0.2% |
| Kenyan | 197 | 0.4% |
| Korean | 72 | 0.2% |
| Lebanese | 37 | 0.1% |
| Lithuanian | 8 | 0.0% |
| Lumbee | 201 | 0.4% |
| Mexican | 563 | 1.1% |
| Mexican American Indian | 7 | 0.0% |
| Native Hawaiian | 91 | 0.2% |
| Navajo | 4 | 0.0% |
| Nigerian | 10 | 0.0% |
| Northern European | 17 | 0.0% |
| Norwegian | 101 | 0.2% |
| Pakistani | 15 | 0.0% |
| Pennsylvania German | 9 | 0.0% |
| Polish | 171 | 0.4% |
| Portuguese | 77 | 0.2% |
| Puerto Rican | 247 | 0.5% |
| Russian | 79 | 0.2% |
| Salvadoran | 456 | 0.9% |
| Samoan | 4 | 0.0% |
| Scandinavian | 61 | 0.1% |
| Scotch-Irish | 462 | 0.9% |
| Scottish | 608 | 1.3% |
| Slovak | 5 | 0.0% |
| South American | 24 | 0.1% |
| Sri Lankan | 200 | 0.4% |
| Subsaharan African | 678 | 1.4% |
| Swedish | 40 | 0.1% |
| Swiss | 23 | 0.1% |
| Thai | 150 | 0.3% |
| Trinidadian and Tobagonian | 16 | 0.0% |
| Ukrainian | 13 | 0.0% |
| Welsh | 75 | 0.2% | View All 76 Rows |
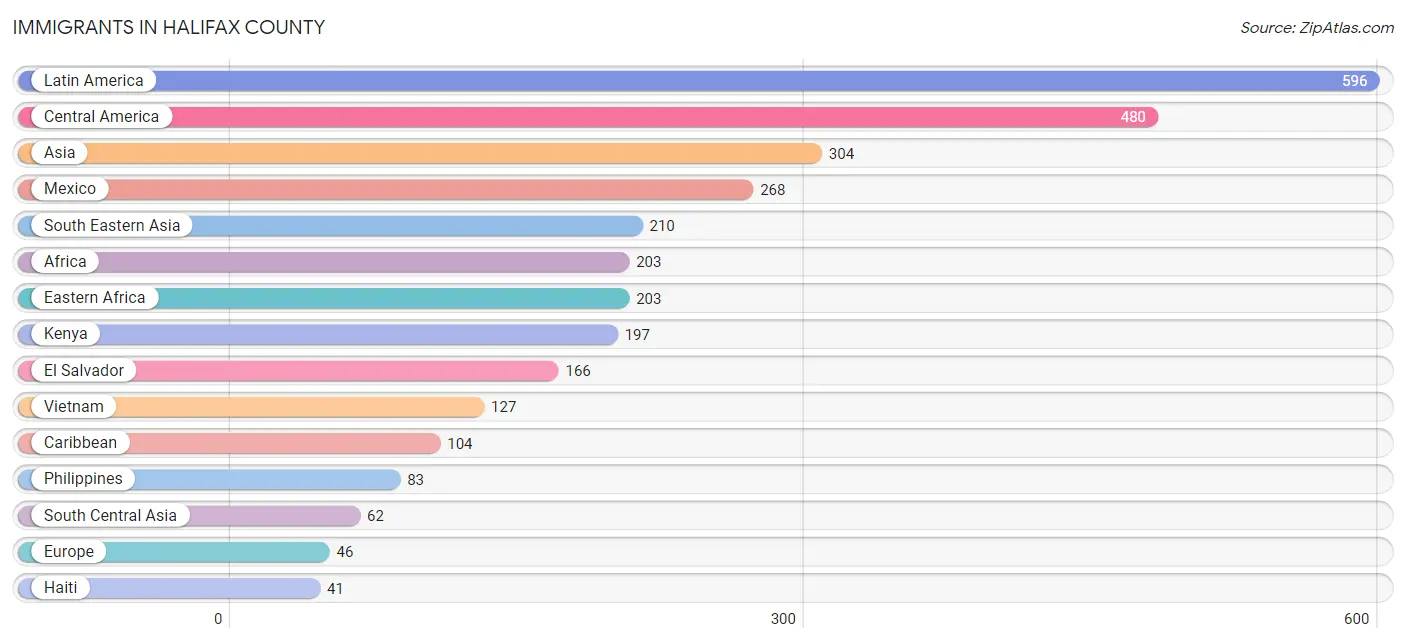
Immigrants in Halifax County
The most numerous immigrant groups reported in Halifax County came from Latin America (596 | 1.2%), Central America (480 | 1.0%), Asia (304 | 0.6%), Mexico (268 | 0.5%), and South Eastern Asia (210 | 0.4%), together accounting for 3.8% of all Halifax County residents.
| Immigration Origin | # Population | % Population |
| Africa | 203 | 0.4% |
| Asia | 304 | 0.6% |
| Australia | 6 | 0.0% |
| Bolivia | 8 | 0.0% |
| Canada | 24 | 0.1% |
| Caribbean | 104 | 0.2% |
| Central America | 480 | 1.0% |
| China | 19 | 0.0% |
| Dominican Republic | 15 | 0.0% |
| Eastern Africa | 203 | 0.4% |
| Eastern Asia | 23 | 0.1% |
| El Salvador | 166 | 0.3% |
| England | 10 | 0.0% |
| Europe | 46 | 0.1% |
| France | 4 | 0.0% |
| Germany | 22 | 0.1% |
| Guatemala | 31 | 0.1% |
| Guyana | 4 | 0.0% |
| Haiti | 41 | 0.1% |
| Honduras | 15 | 0.0% |
| India | 41 | 0.1% |
| Iran | 5 | 0.0% |
| Israel | 3 | 0.0% |
| Italy | 10 | 0.0% |
| Jamaica | 39 | 0.1% |
| Japan | 4 | 0.0% |
| Kenya | 197 | 0.4% |
| Latin America | 596 | 1.2% |
| Mexico | 268 | 0.5% |
| Nepal | 12 | 0.0% |
| Northern Europe | 10 | 0.0% |
| Oceania | 6 | 0.0% |
| Pakistan | 4 | 0.0% |
| Philippines | 83 | 0.2% |
| South America | 12 | 0.0% |
| South Central Asia | 62 | 0.1% |
| South Eastern Asia | 210 | 0.4% |
| Southern Europe | 10 | 0.0% |
| Trinidad and Tobago | 9 | 0.0% |
| Uganda | 6 | 0.0% |
| Vietnam | 127 | 0.3% |
| Western Asia | 9 | 0.0% |
| Western Europe | 26 | 0.1% |
| Yemen | 6 | 0.0% | View All 44 Rows |
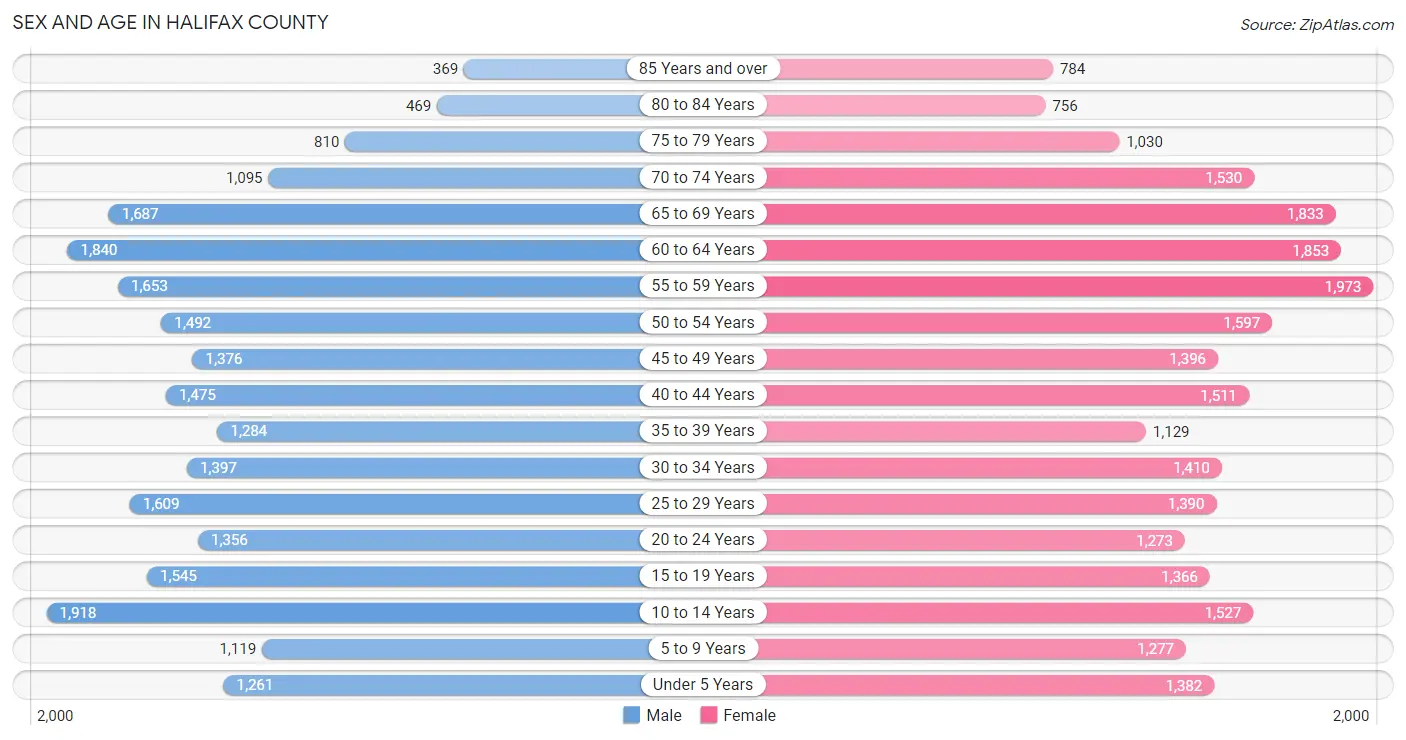
Sex and Age in Halifax County
Sex and Age in Halifax County
The most populous age groups in Halifax County are 10 to 14 Years (1,918 | 8.1%) for men and 55 to 59 Years (1,973 | 7.9%) for women.
| Age Bracket | Male | Female |
| Under 5 Years | 1,261 (5.3%) | 1,382 (5.5%) |
| 5 to 9 Years | 1,119 (4.7%) | 1,277 (5.1%) |
| 10 to 14 Years | 1,918 (8.1%) | 1,527 (6.1%) |
| 15 to 19 Years | 1,545 (6.5%) | 1,366 (5.5%) |
| 20 to 24 Years | 1,356 (5.7%) | 1,273 (5.1%) |
| 25 to 29 Years | 1,609 (6.8%) | 1,390 (5.6%) |
| 30 to 34 Years | 1,397 (5.9%) | 1,410 (5.6%) |
| 35 to 39 Years | 1,284 (5.4%) | 1,129 (4.5%) |
| 40 to 44 Years | 1,475 (6.2%) | 1,511 (6.0%) |
| 45 to 49 Years | 1,376 (5.8%) | 1,396 (5.6%) |
| 50 to 54 Years | 1,492 (6.3%) | 1,597 (6.4%) |
| 55 to 59 Years | 1,653 (7.0%) | 1,973 (7.9%) |
| 60 to 64 Years | 1,840 (7.7%) | 1,853 (7.4%) |
| 65 to 69 Years | 1,687 (7.1%) | 1,833 (7.3%) |
| 70 to 74 Years | 1,095 (4.6%) | 1,530 (6.1%) |
| 75 to 79 Years | 810 (3.4%) | 1,030 (4.1%) |
| 80 to 84 Years | 469 (2.0%) | 756 (3.0%) |
| 85 Years and over | 369 (1.5%) | 784 (3.1%) |
| Total | 23,755 (100.0%) | 25,017 (100.0%) |
Families and Households in Halifax County
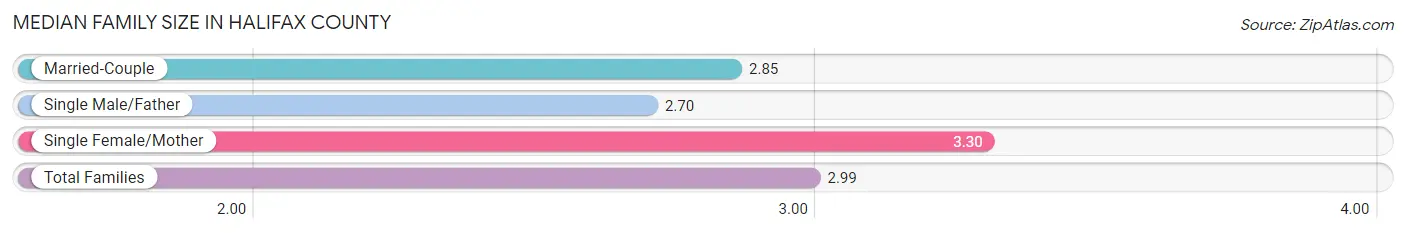
Median Family Size in Halifax County
The median family size in Halifax County is 2.99 persons per family, with single female/mother families (4,240 | 33.0%) accounting for the largest median family size of 3.3 persons per family. On the other hand, single male/father families (735 | 5.7%) represent the smallest median family size with 2.70 persons per family.
| Family Type | # Families | Family Size |
| Married-Couple | 7,875 (61.3%) | 2.85 |
| Single Male/Father | 735 (5.7%) | 2.70 |
| Single Female/Mother | 4,240 (33.0%) | 3.30 |
| Total Families | 12,850 (100.0%) | 2.99 |
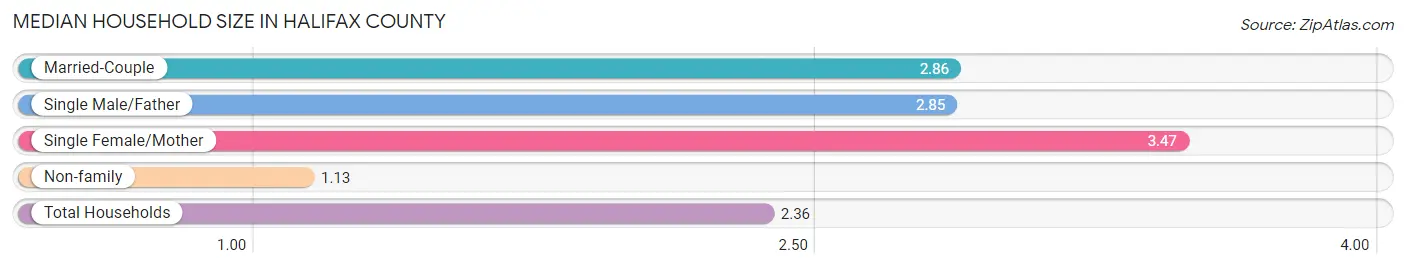
Median Household Size in Halifax County
The median household size in Halifax County is 2.36 persons per household, with single female/mother households (4,240 | 21.0%) accounting for the largest median household size of 3.47 persons per household. non-family households (7,289 | 36.2%) represent the smallest median household size with 1.13 persons per household.
| Household Type | # Households | Household Size |
| Married-Couple | 7,875 (39.1%) | 2.86 |
| Single Male/Father | 735 (3.6%) | 2.85 |
| Single Female/Mother | 4,240 (21.0%) | 3.47 |
| Non-family | 7,289 (36.2%) | 1.13 |
| Total Households | 20,139 (100.0%) | 2.36 |
Household Size by Marriage Status in Halifax County
Out of a total of 20,139 households in Halifax County, 12,850 (63.8%) are family households, while 7,289 (36.2%) are nonfamily households. The most numerous type of family households are 2-person households, comprising 6,508, and the most common type of nonfamily households are 1-person households, comprising 6,463.
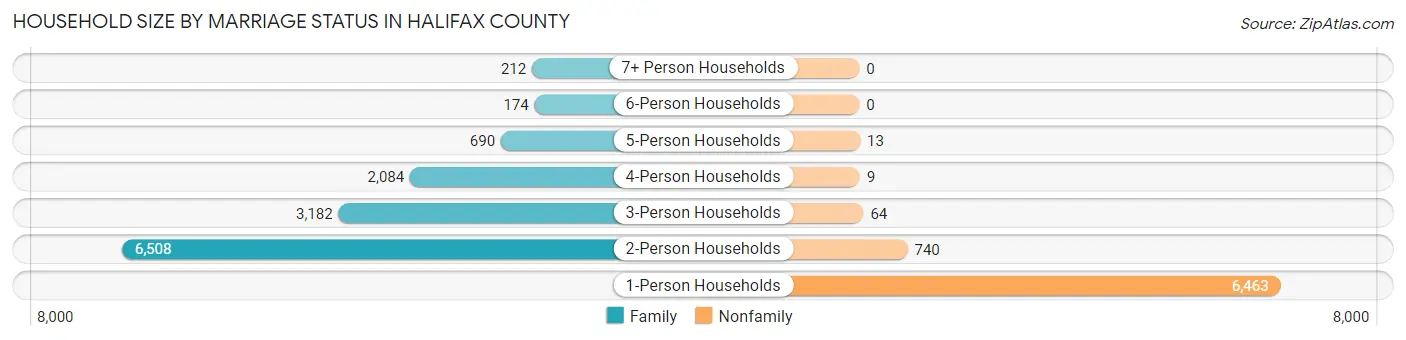
| Household Size | Family Households | Nonfamily Households |
| 1-Person Households | - | 6,463 (32.1%) |
| 2-Person Households | 6,508 (32.3%) | 740 (3.7%) |
| 3-Person Households | 3,182 (15.8%) | 64 (0.3%) |
| 4-Person Households | 2,084 (10.3%) | 9 (0.0%) |
| 5-Person Households | 690 (3.4%) | 13 (0.1%) |
| 6-Person Households | 174 (0.9%) | 0 (0.0%) |
| 7+ Person Households | 212 (1.1%) | 0 (0.0%) |
| Total | 12,850 (63.8%) | 7,289 (36.2%) |
Female Fertility in Halifax County
Fertility by Age in Halifax County
Average fertility rate in Halifax County is 39.0 births per 1,000 women. Women in the age bracket of 20 to 34 years have the highest fertility rate with 85.0 births per 1,000 women. Women in the age bracket of 20 to 34 years acount for 90.3% of all women with births.
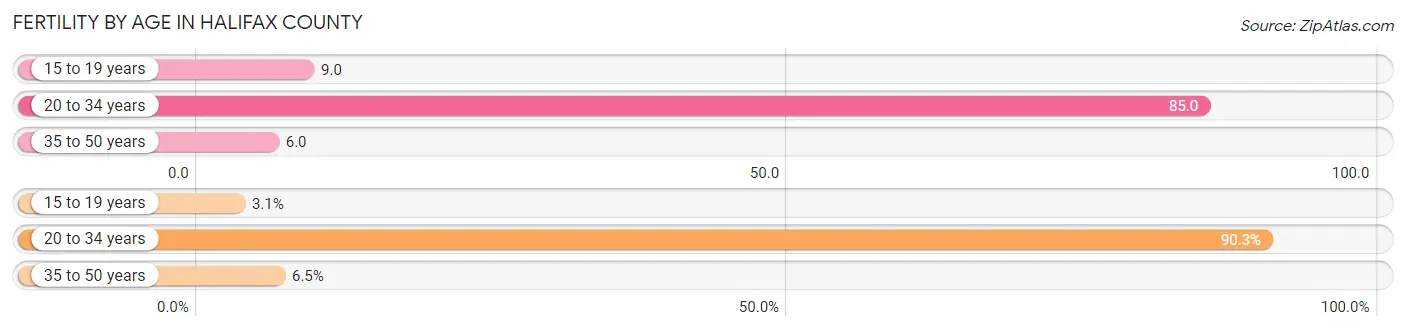
| Age Bracket | Women with Births | Births / 1,000 Women |
| 15 to 19 years | 12 (3.1%) | 9.0 |
| 20 to 34 years | 346 (90.3%) | 85.0 |
| 35 to 50 years | 25 (6.5%) | 6.0 |
| Total | 383 (100.0%) | 39.0 |
Fertility by Age by Marriage Status in Halifax County
28.2% of women with births (383) in Halifax County are married. The highest percentage of unmarried women with births falls into 20 to 34 years age bracket with 76.6% of them unmarried at the time of birth, while the lowest percentage of unmarried women with births belong to 35 to 50 years age bracket with 12.0% of them unmarried.
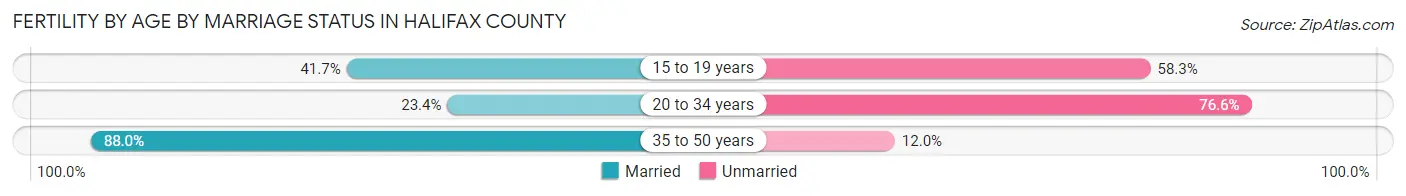
| Age Bracket | Married | Unmarried |
| 15 to 19 years | 5 (41.7%) | 7 (58.3%) |
| 20 to 34 years | 81 (23.4%) | 265 (76.6%) |
| 35 to 50 years | 22 (88.0%) | 3 (12.0%) |
| Total | 108 (28.2%) | 275 (71.8%) |
Fertility by Education in Halifax County
Average fertility rate in Halifax County is 39.0 births per 1,000 women. Women with the education attainment of college or associate's degree have the highest fertility rate of 43.0 births per 1,000 women, while women with the education attainment of graduate degree have the lowest fertility at 22.0 births per 1,000 women. Women with the education attainment of college or associate's degree represent 38.9% of all women with births.
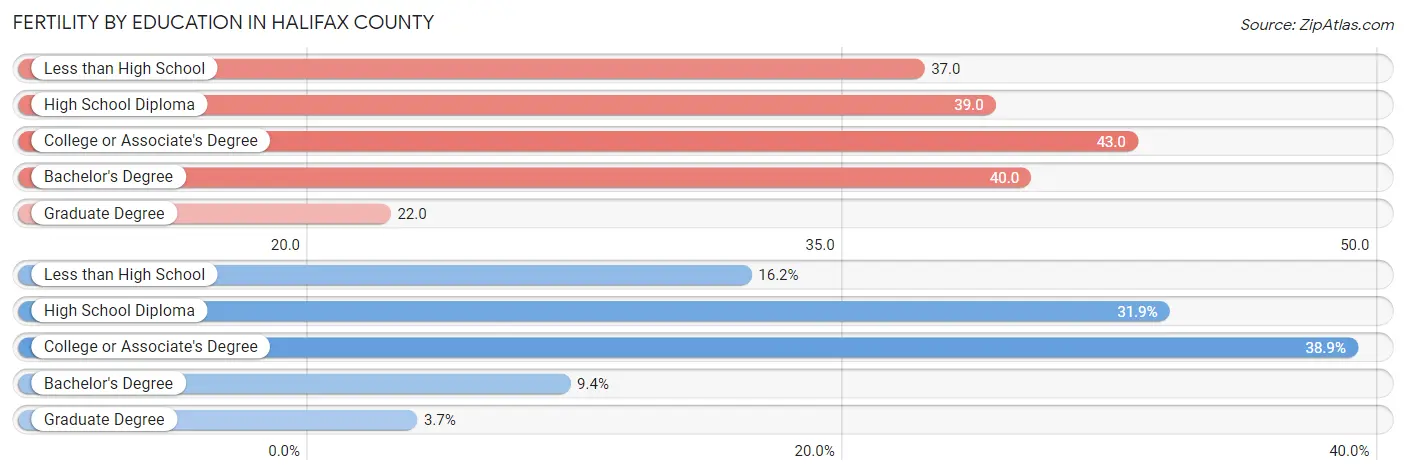
| Educational Attainment | Women with Births | Births / 1,000 Women |
| Less than High School | 62 (16.2%) | 37.0 |
| High School Diploma | 122 (31.9%) | 39.0 |
| College or Associate's Degree | 149 (38.9%) | 43.0 |
| Bachelor's Degree | 36 (9.4%) | 40.0 |
| Graduate Degree | 14 (3.7%) | 22.0 |
| Total | 383 (100.0%) | 39.0 |
Fertility by Education by Marriage Status in Halifax County
71.8% of women with births in Halifax County are unmarried. Women with the educational attainment of bachelor's degree are most likely to be married with 63.9% of them married at childbirth, while women with the educational attainment of high school diploma are least likely to be married with 100.0% of them unmarried at childbirth.
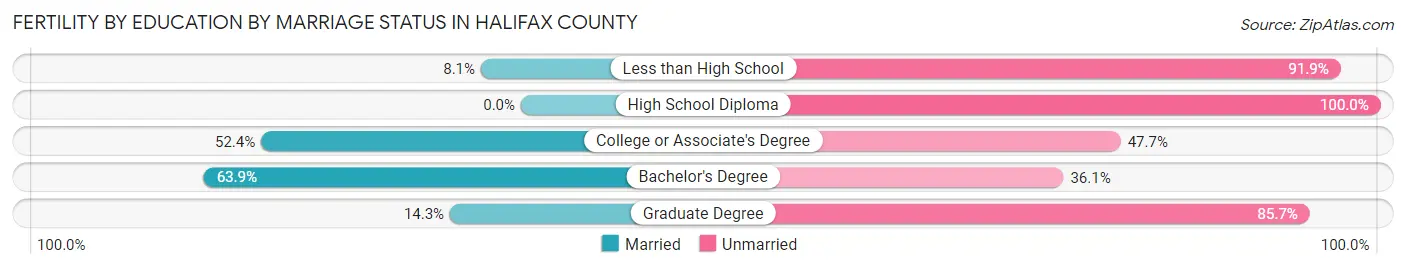
| Educational Attainment | Married | Unmarried |
| Less than High School | 5 (8.1%) | 57 (91.9%) |
| High School Diploma | 0 (0.0%) | 122 (100.0%) |
| College or Associate's Degree | 78 (52.3%) | 71 (47.6%) |
| Bachelor's Degree | 23 (63.9%) | 13 (36.1%) |
| Graduate Degree | 2 (14.3%) | 12 (85.7%) |
| Total | 108 (28.2%) | 275 (71.8%) |
Employment Characteristics in Halifax County
Employment by Class of Employer in Halifax County
Among the 17,869 employed individuals in Halifax County, private company employees (11,622 | 65.0%), local government employees (1,917 | 10.7%), and state government employees (1,404 | 7.9%) make up the most common classes of employment.
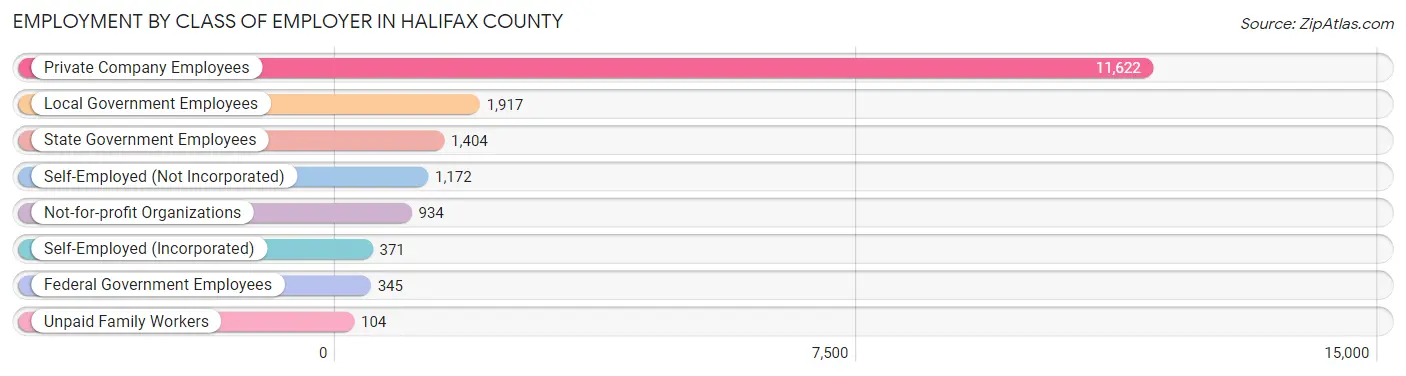
| Employer Class | # Employees | % Employees |
| Private Company Employees | 11,622 | 65.0% |
| Self-Employed (Incorporated) | 371 | 2.1% |
| Self-Employed (Not Incorporated) | 1,172 | 6.6% |
| Not-for-profit Organizations | 934 | 5.2% |
| Local Government Employees | 1,917 | 10.7% |
| State Government Employees | 1,404 | 7.9% |
| Federal Government Employees | 345 | 1.9% |
| Unpaid Family Workers | 104 | 0.6% |
| Total | 17,869 | 100.0% |
Employment Status by Age in Halifax County
According to the labor force statistics for Halifax County, out of the total population over 16 years of age (39,802), 50.7% or 20,180 individuals are in the labor force, with 9.3% or 1,877 of them unemployed. The age group with the highest labor force participation rate is 25 to 29 years, with 75.8% or 2,273 individuals in the labor force. Within the labor force, the 20 to 24 years age range has the highest percentage of unemployed individuals, with 29.1% or 523 of them being unemployed.
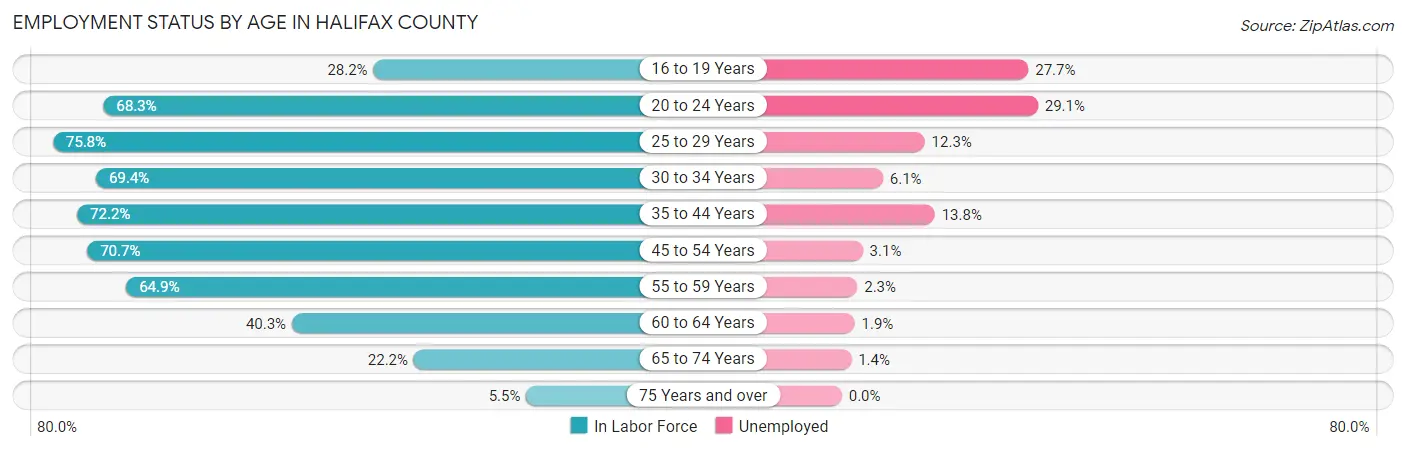
| Age Bracket | In Labor Force | Unemployed |
| 16 to 19 Years | 684 (28.2%) | 189 (27.7%) |
| 20 to 24 Years | 1,796 (68.3%) | 523 (29.1%) |
| 25 to 29 Years | 2,273 (75.8%) | 280 (12.3%) |
| 30 to 34 Years | 1,948 (69.4%) | 119 (6.1%) |
| 35 to 44 Years | 3,898 (72.2%) | 538 (13.8%) |
| 45 to 54 Years | 4,144 (70.7%) | 128 (3.1%) |
| 55 to 59 Years | 2,353 (64.9%) | 54 (2.3%) |
| 60 to 64 Years | 1,488 (40.3%) | 28 (1.9%) |
| 65 to 74 Years | 1,364 (22.2%) | 19 (1.4%) |
| 75 Years and over | 232 (5.5%) | 0 (0.0%) |
| Total | 20,180 (50.7%) | 1,877 (9.3%) |
Employment Status by Educational Attainment in Halifax County
According to labor force statistics for Halifax County, 66.1% of individuals (16,118) out of the total population between 25 and 64 years of age (24,385) are in the labor force, with 7.1% or 1,144 of them being unemployed. The group with the highest labor force participation rate are those with the educational attainment of bachelor's degree or higher, with 84.7% or 3,384 individuals in the labor force. Within the labor force, individuals with less than high school education have the highest percentage of unemployment, with 17.5% or 226 of them being unemployed.
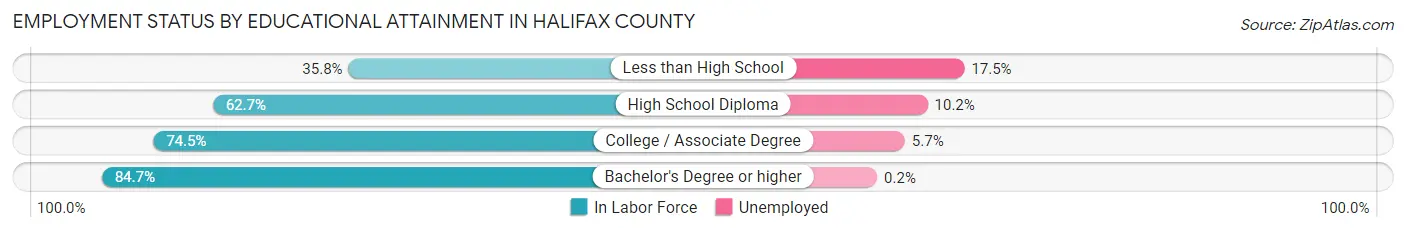
| Educational Attainment | In Labor Force | Unemployed |
| Less than High School | 1,294 (35.8%) | 633 (17.5%) |
| High School Diploma | 5,675 (62.7%) | 923 (10.2%) |
| College / Associate Degree | 5,754 (74.5%) | 440 (5.7%) |
| Bachelor's Degree or higher | 3,384 (84.7%) | 8 (0.2%) |
| Total | 16,118 (66.1%) | 1,731 (7.1%) |
Employment Occupations by Sex in Halifax County
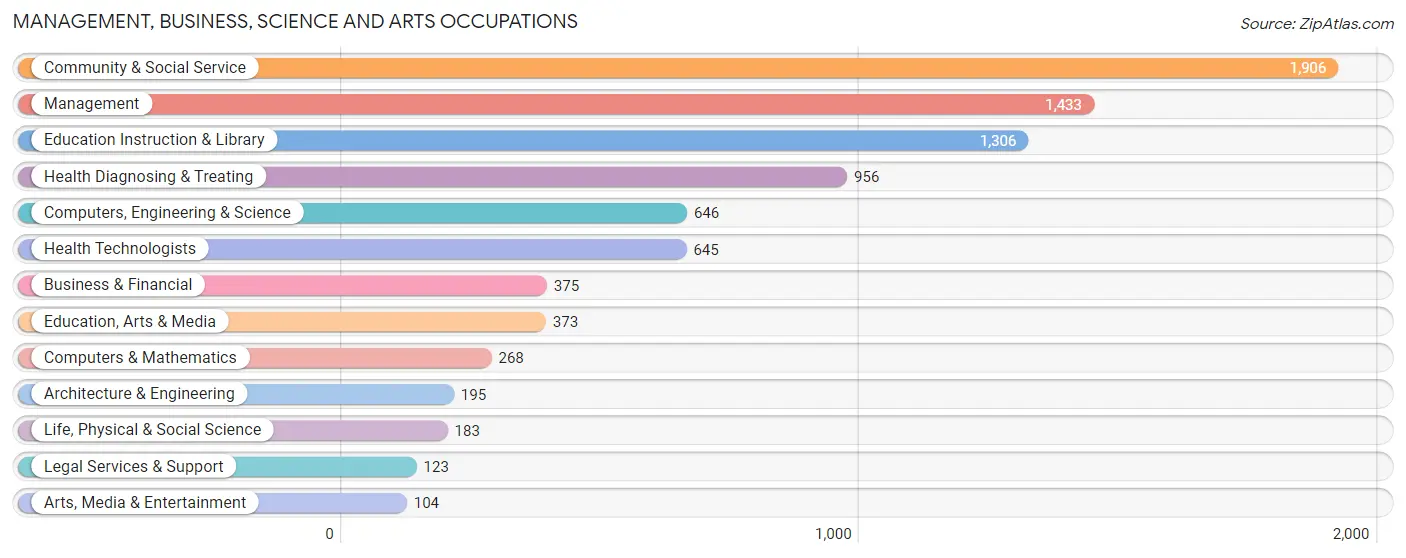
Management, Business, Science and Arts Occupations
The most common Management, Business, Science and Arts occupations in Halifax County are Community & Social Service (1,906 | 10.4%), Management (1,433 | 7.8%), Education Instruction & Library (1,306 | 7.1%), Health Diagnosing & Treating (956 | 5.2%), and Computers, Engineering & Science (646 | 3.5%).
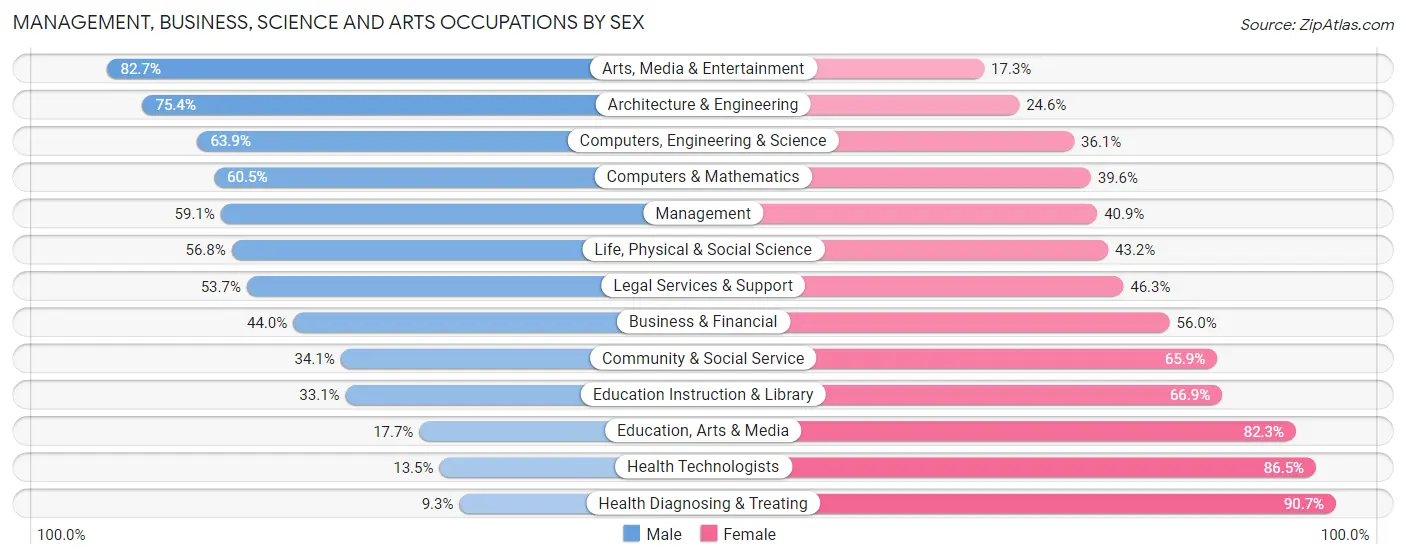
Management, Business, Science and Arts Occupations by Sex
Within the Management, Business, Science and Arts occupations in Halifax County, the most male-oriented occupations are Arts, Media & Entertainment (82.7%), Architecture & Engineering (75.4%), and Computers, Engineering & Science (63.9%), while the most female-oriented occupations are Health Diagnosing & Treating (90.7%), Health Technologists (86.5%), and Education, Arts & Media (82.3%).
| Occupation | Male | Female |
| Management | 847 (59.1%) | 586 (40.9%) |
| Business & Financial | 165 (44.0%) | 210 (56.0%) |
| Computers, Engineering & Science | 413 (63.9%) | 233 (36.1%) |
| Computers & Mathematics | 162 (60.5%) | 106 (39.6%) |
| Architecture & Engineering | 147 (75.4%) | 48 (24.6%) |
| Life, Physical & Social Science | 104 (56.8%) | 79 (43.2%) |
| Community & Social Service | 650 (34.1%) | 1,256 (65.9%) |
| Education, Arts & Media | 66 (17.7%) | 307 (82.3%) |
| Legal Services & Support | 66 (53.7%) | 57 (46.3%) |
| Education Instruction & Library | 432 (33.1%) | 874 (66.9%) |
| Arts, Media & Entertainment | 86 (82.7%) | 18 (17.3%) |
| Health Diagnosing & Treating | 89 (9.3%) | 867 (90.7%) |
| Health Technologists | 87 (13.5%) | 558 (86.5%) |
| Total (Category) | 2,164 (40.7%) | 3,152 (59.3%) |
| Total (Overall) | 9,457 (51.7%) | 8,839 (48.3%) |
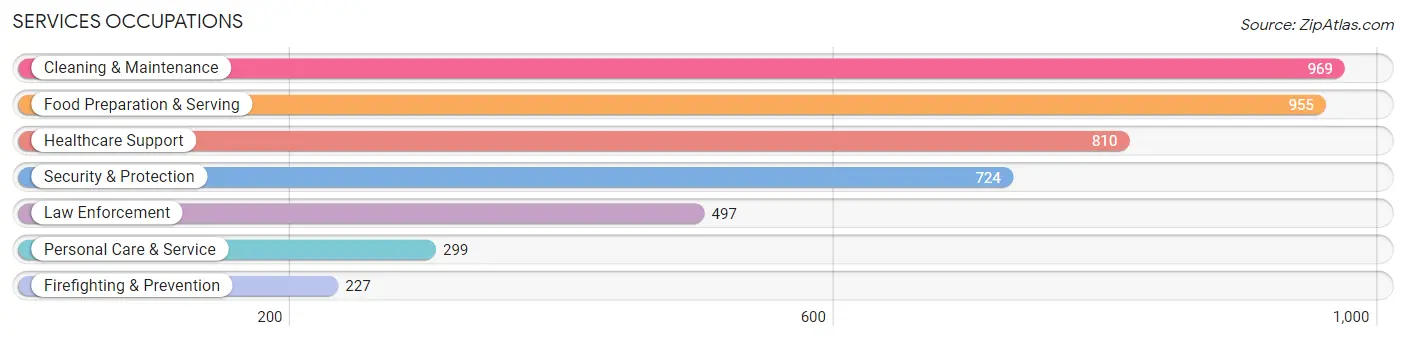
Services Occupations
The most common Services occupations in Halifax County are Cleaning & Maintenance (969 | 5.3%), Food Preparation & Serving (955 | 5.2%), Healthcare Support (810 | 4.4%), Security & Protection (724 | 4.0%), and Law Enforcement (497 | 2.7%).
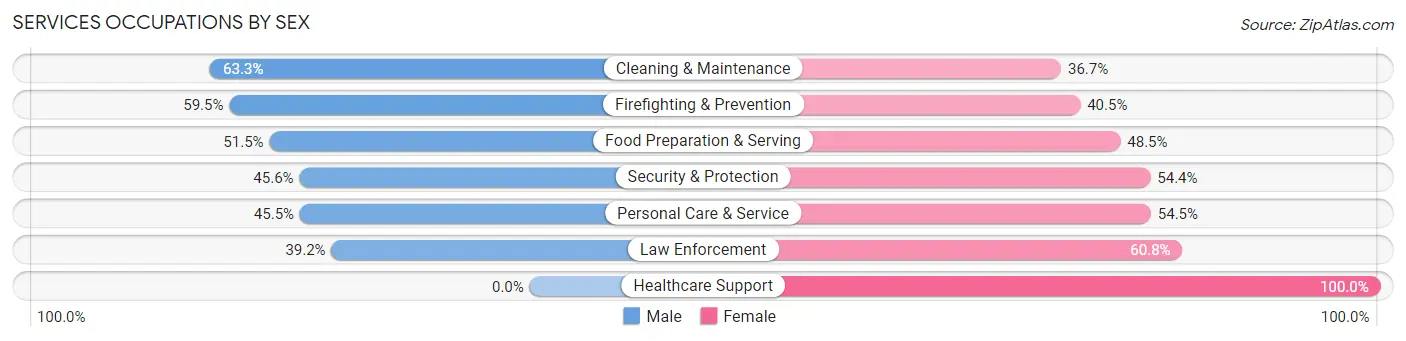
Services Occupations by Sex
Within the Services occupations in Halifax County, the most male-oriented occupations are Cleaning & Maintenance (63.3%), Firefighting & Prevention (59.5%), and Food Preparation & Serving (51.5%), while the most female-oriented occupations are Healthcare Support (100.0%), Law Enforcement (60.8%), and Personal Care & Service (54.5%).
| Occupation | Male | Female |
| Healthcare Support | 0 (0.0%) | 810 (100.0%) |
| Security & Protection | 330 (45.6%) | 394 (54.4%) |
| Firefighting & Prevention | 135 (59.5%) | 92 (40.5%) |
| Law Enforcement | 195 (39.2%) | 302 (60.8%) |
| Food Preparation & Serving | 492 (51.5%) | 463 (48.5%) |
| Cleaning & Maintenance | 613 (63.3%) | 356 (36.7%) |
| Personal Care & Service | 136 (45.5%) | 163 (54.5%) |
| Total (Category) | 1,571 (41.8%) | 2,186 (58.2%) |
| Total (Overall) | 9,457 (51.7%) | 8,839 (48.3%) |
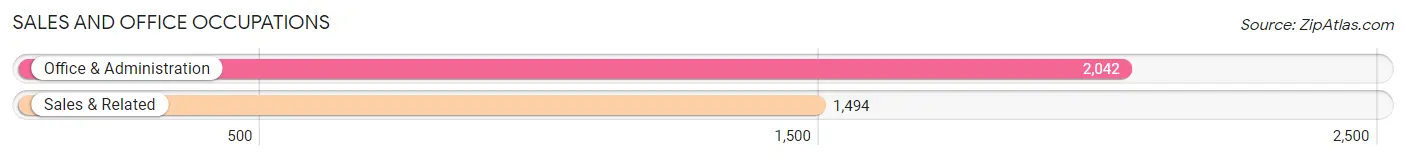
Sales and Office Occupations
The most common Sales and Office occupations in Halifax County are Office & Administration (2,042 | 11.2%), and Sales & Related (1,494 | 8.2%).
Sales and Office Occupations by Sex
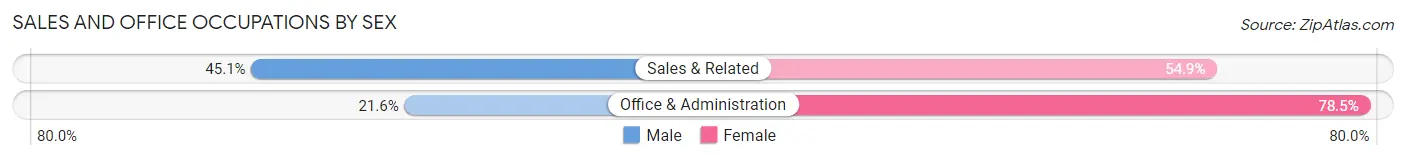
| Occupation | Male | Female |
| Sales & Related | 674 (45.1%) | 820 (54.9%) |
| Office & Administration | 440 (21.5%) | 1,602 (78.4%) |
| Total (Category) | 1,114 (31.5%) | 2,422 (68.5%) |
| Total (Overall) | 9,457 (51.7%) | 8,839 (48.3%) |
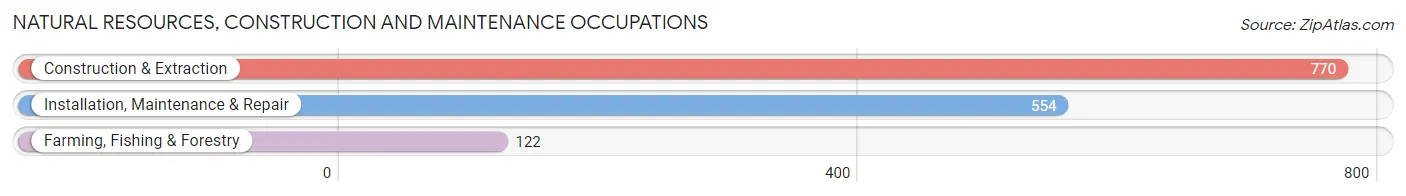
Natural Resources, Construction and Maintenance Occupations
The most common Natural Resources, Construction and Maintenance occupations in Halifax County are Construction & Extraction (770 | 4.2%), Installation, Maintenance & Repair (554 | 3.0%), and Farming, Fishing & Forestry (122 | 0.7%).
Natural Resources, Construction and Maintenance Occupations by Sex
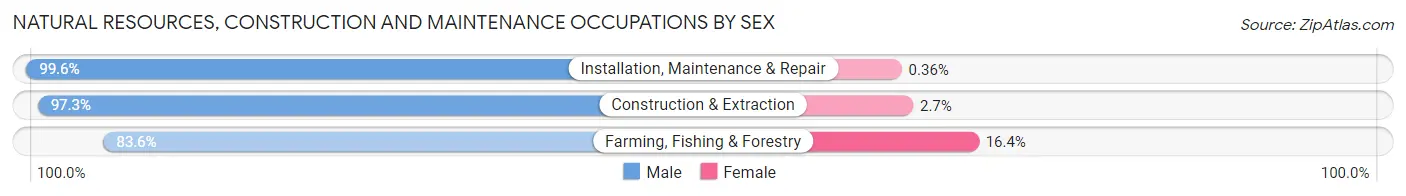
| Occupation | Male | Female |
| Farming, Fishing & Forestry | 102 (83.6%) | 20 (16.4%) |
| Construction & Extraction | 749 (97.3%) | 21 (2.7%) |
| Installation, Maintenance & Repair | 552 (99.6%) | 2 (0.4%) |
| Total (Category) | 1,403 (97.0%) | 43 (3.0%) |
| Total (Overall) | 9,457 (51.7%) | 8,839 (48.3%) |
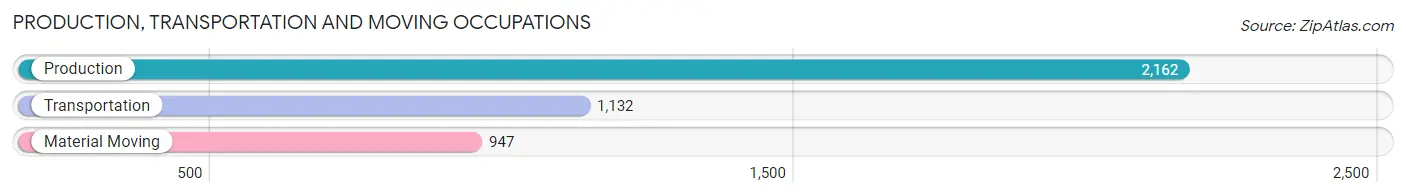
Production, Transportation and Moving Occupations
The most common Production, Transportation and Moving occupations in Halifax County are Production (2,162 | 11.8%), Transportation (1,132 | 6.2%), and Material Moving (947 | 5.2%).
Production, Transportation and Moving Occupations by Sex
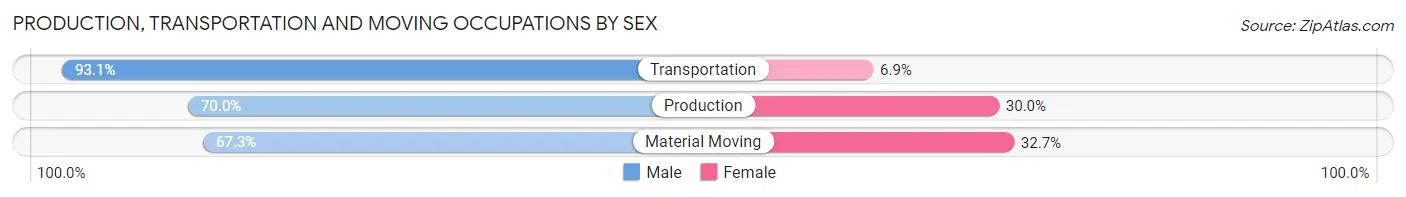
| Occupation | Male | Female |
| Production | 1,514 (70.0%) | 648 (30.0%) |
| Transportation | 1,054 (93.1%) | 78 (6.9%) |
| Material Moving | 637 (67.3%) | 310 (32.7%) |
| Total (Category) | 3,205 (75.6%) | 1,036 (24.4%) |
| Total (Overall) | 9,457 (51.7%) | 8,839 (48.3%) |
Employment Industries by Sex in Halifax County
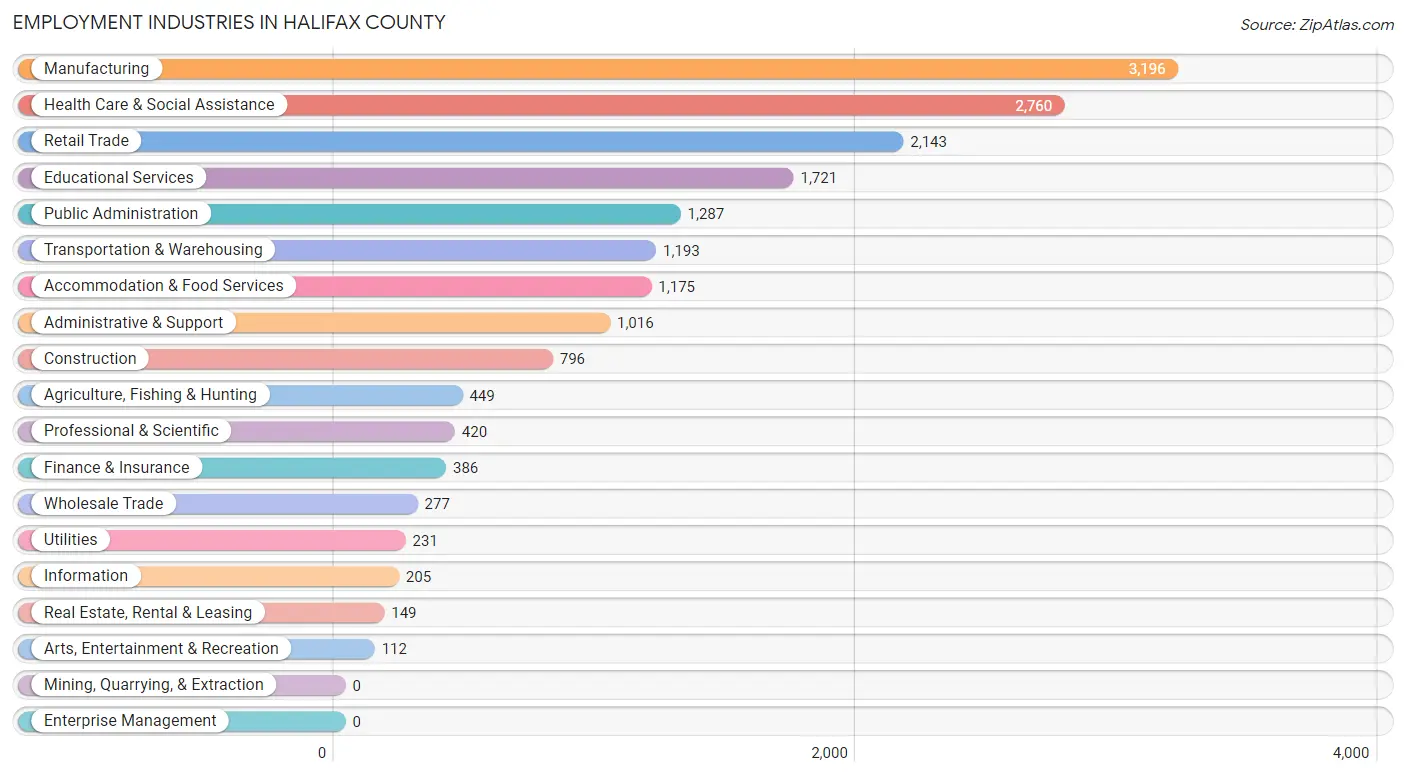
Employment Industries in Halifax County
The major employment industries in Halifax County include Manufacturing (3,196 | 17.5%), Health Care & Social Assistance (2,760 | 15.1%), Retail Trade (2,143 | 11.7%), Educational Services (1,721 | 9.4%), and Public Administration (1,287 | 7.0%).
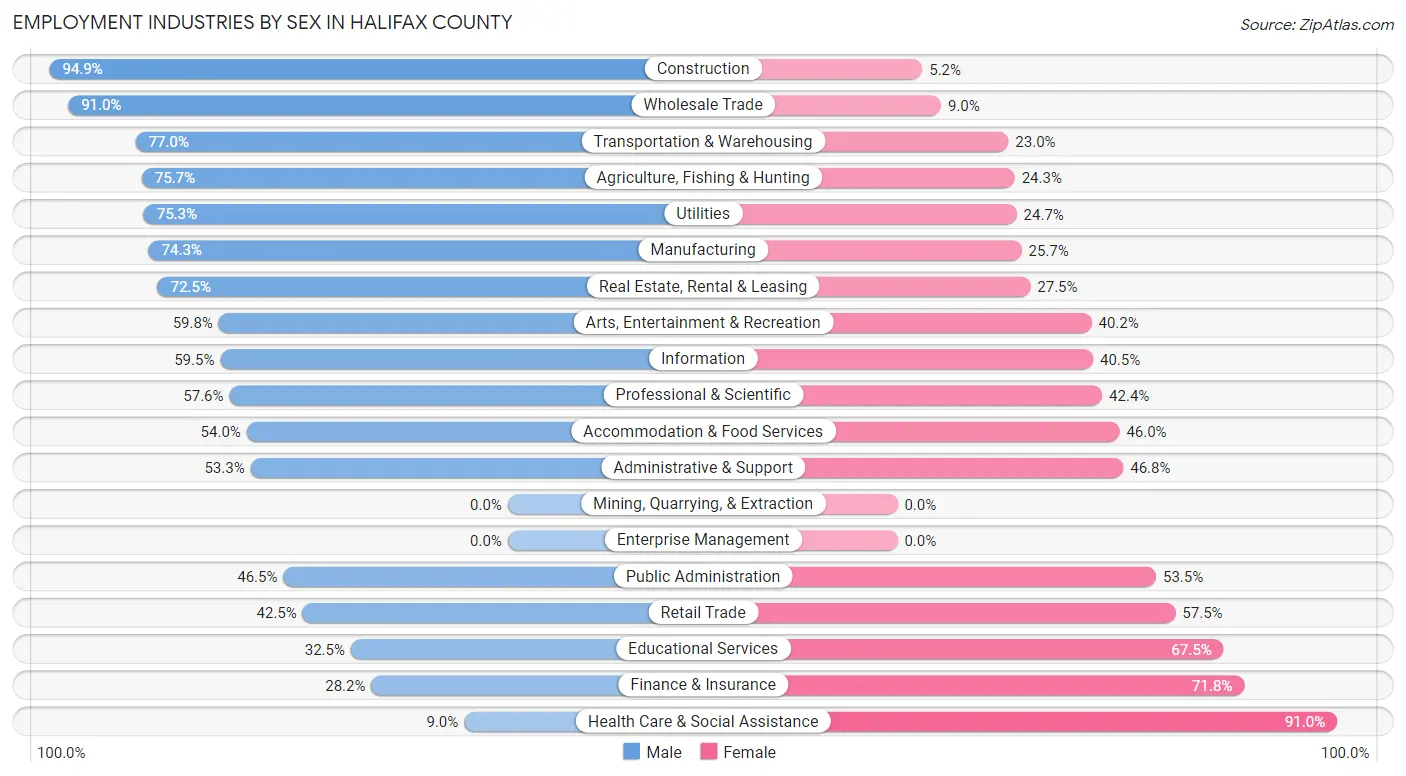
Employment Industries by Sex in Halifax County
The Halifax County industries that see more men than women are Construction (94.9%), Wholesale Trade (91.0%), and Transportation & Warehousing (77.0%), whereas the industries that tend to have a higher number of women are Health Care & Social Assistance (91.0%), Finance & Insurance (71.8%), and Educational Services (67.5%).
| Industry | Male | Female |
| Agriculture, Fishing & Hunting | 340 (75.7%) | 109 (24.3%) |
| Mining, Quarrying, & Extraction | 0 (0.0%) | 0 (0.0%) |
| Construction | 755 (94.9%) | 41 (5.1%) |
| Manufacturing | 2,375 (74.3%) | 821 (25.7%) |
| Wholesale Trade | 252 (91.0%) | 25 (9.0%) |
| Retail Trade | 910 (42.5%) | 1,233 (57.5%) |
| Transportation & Warehousing | 919 (77.0%) | 274 (23.0%) |
| Utilities | 174 (75.3%) | 57 (24.7%) |
| Information | 122 (59.5%) | 83 (40.5%) |
| Finance & Insurance | 109 (28.2%) | 277 (71.8%) |
| Real Estate, Rental & Leasing | 108 (72.5%) | 41 (27.5%) |
| Professional & Scientific | 242 (57.6%) | 178 (42.4%) |
| Enterprise Management | 0 (0.0%) | 0 (0.0%) |
| Administrative & Support | 541 (53.2%) | 475 (46.8%) |
| Educational Services | 559 (32.5%) | 1,162 (67.5%) |
| Health Care & Social Assistance | 249 (9.0%) | 2,511 (91.0%) |
| Arts, Entertainment & Recreation | 67 (59.8%) | 45 (40.2%) |
| Accommodation & Food Services | 635 (54.0%) | 540 (46.0%) |
| Public Administration | 598 (46.5%) | 689 (53.5%) |
| Total | 9,457 (51.7%) | 8,839 (48.3%) |
Education in Halifax County
School Enrollment in Halifax County
The most common levels of schooling among the 9,918 students in Halifax County are high school (2,549 | 25.7%), middle school (2,506 | 25.3%), and elementary school (1,940 | 19.6%).
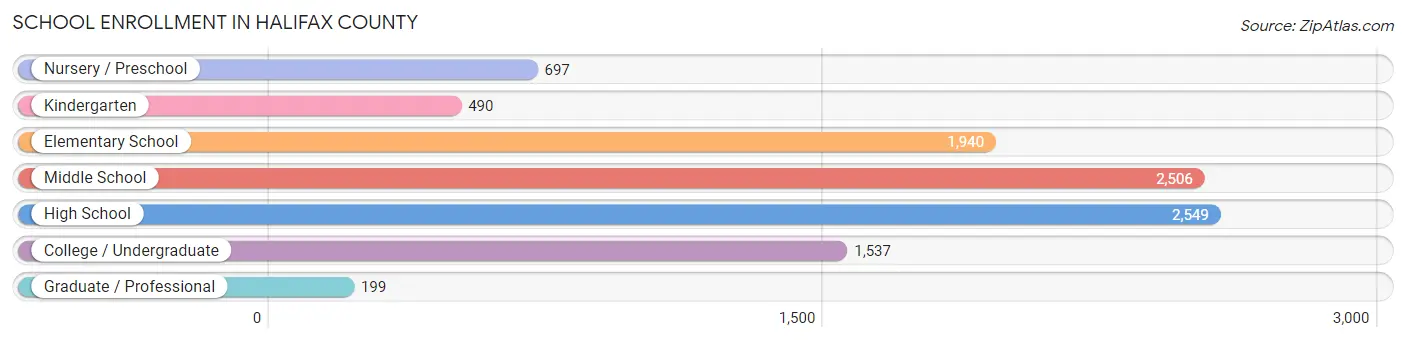
| School Level | # Students | % Students |
| Nursery / Preschool | 697 | 7.0% |
| Kindergarten | 490 | 4.9% |
| Elementary School | 1,940 | 19.6% |
| Middle School | 2,506 | 25.3% |
| High School | 2,549 | 25.7% |
| College / Undergraduate | 1,537 | 15.5% |
| Graduate / Professional | 199 | 2.0% |
| Total | 9,918 | 100.0% |
School Enrollment by Age by Funding Source in Halifax County
Out of a total of 9,918 students who are enrolled in schools in Halifax County, 1,299 (13.1%) attend a private institution, while the remaining 8,619 (86.9%) are enrolled in public schools. The age group of 35 years and over has the highest likelihood of being enrolled in private schools, with 144 (25.4% in the age bracket) enrolled. Conversely, the age group of 3 to 4 year olds has the lowest likelihood of being enrolled in a private school, with 498 (99.6% in the age bracket) attending a public institution.
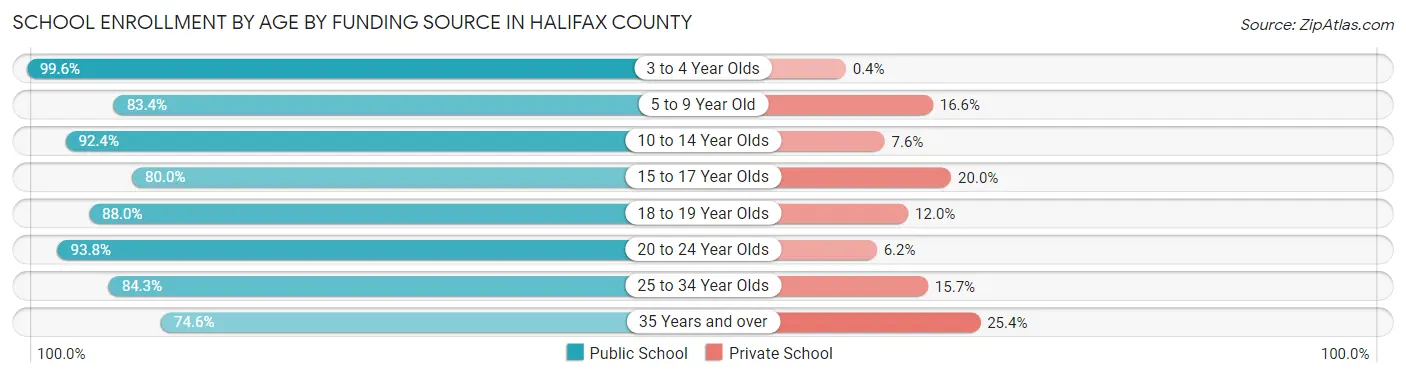
| Age Bracket | Public School | Private School |
| 3 to 4 Year Olds | 498 (99.6%) | 2 (0.4%) |
| 5 to 9 Year Old | 1,869 (83.4%) | 372 (16.6%) |
| 10 to 14 Year Olds | 3,030 (92.4%) | 250 (7.6%) |
| 15 to 17 Year Olds | 1,398 (80.0%) | 350 (20.0%) |
| 18 to 19 Year Olds | 513 (88.0%) | 70 (12.0%) |
| 20 to 24 Year Olds | 442 (93.8%) | 29 (6.2%) |
| 25 to 34 Year Olds | 446 (84.3%) | 83 (15.7%) |
| 35 Years and over | 422 (74.6%) | 144 (25.4%) |
| Total | 8,619 (86.9%) | 1,299 (13.1%) |
Educational Attainment by Field of Study in Halifax County
Education (1,077 | 18.0%), business (934 | 15.6%), science & technology (743 | 12.4%), arts & humanities (729 | 12.2%), and social sciences (441 | 7.4%) are the most common fields of study among 5,972 individuals in Halifax County who have obtained a bachelor's degree or higher.
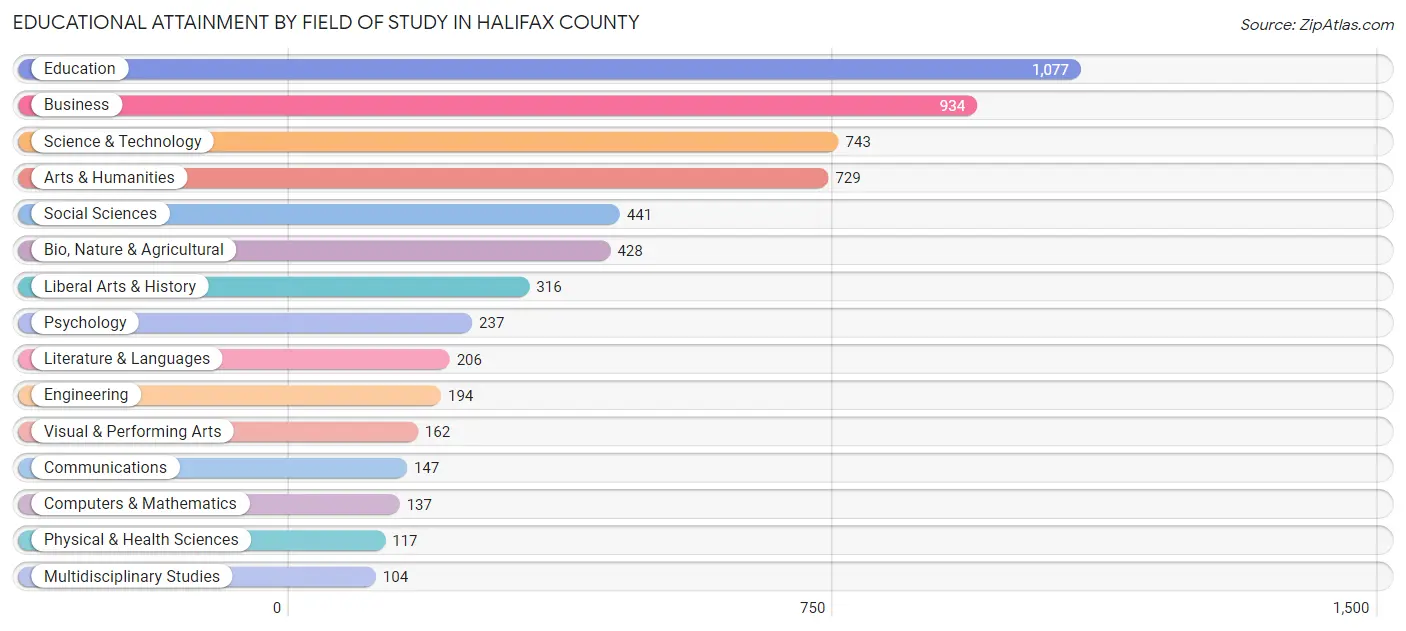
| Field of Study | # Graduates | % Graduates |
| Computers & Mathematics | 137 | 2.3% |
| Bio, Nature & Agricultural | 428 | 7.2% |
| Physical & Health Sciences | 117 | 2.0% |
| Psychology | 237 | 4.0% |
| Social Sciences | 441 | 7.4% |
| Engineering | 194 | 3.3% |
| Multidisciplinary Studies | 104 | 1.7% |
| Science & Technology | 743 | 12.4% |
| Business | 934 | 15.6% |
| Education | 1,077 | 18.0% |
| Literature & Languages | 206 | 3.5% |
| Liberal Arts & History | 316 | 5.3% |
| Visual & Performing Arts | 162 | 2.7% |
| Communications | 147 | 2.5% |
| Arts & Humanities | 729 | 12.2% |
| Total | 5,972 | 100.0% |
Transportation & Commute in Halifax County
Vehicle Availability by Sex in Halifax County
The most prevalent vehicle ownership categories in Halifax County are males with 2 vehicles (3,058, accounting for 33.0%) and females with 2 vehicles (2,698, making up 35.6%).
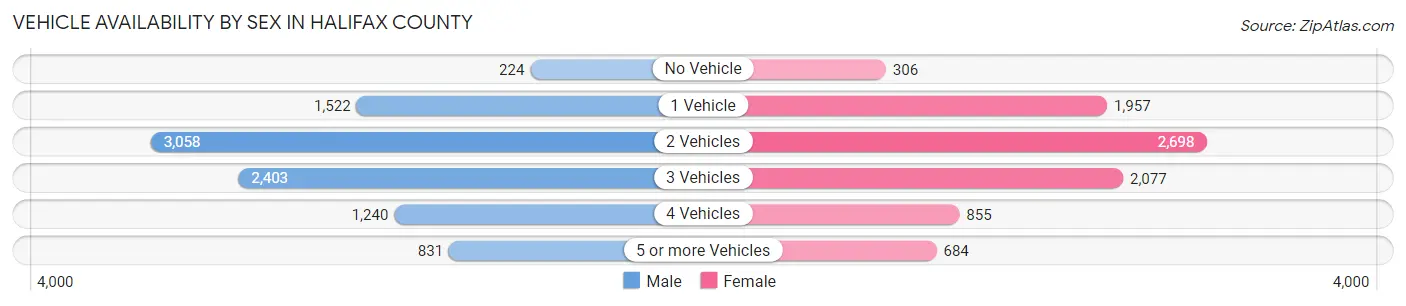
| Vehicles Available | Male | Female |
| No Vehicle | 224 (2.4%) | 306 (3.6%) |
| 1 Vehicle | 1,522 (16.4%) | 1,957 (22.8%) |
| 2 Vehicles | 3,058 (33.0%) | 2,698 (31.5%) |
| 3 Vehicles | 2,403 (25.9%) | 2,077 (24.2%) |
| 4 Vehicles | 1,240 (13.4%) | 855 (10.0%) |
| 5 or more Vehicles | 831 (9.0%) | 684 (8.0%) |
| Total | 9,278 (100.0%) | 8,577 (100.0%) |
Commute Time in Halifax County
The most frequently occuring commute durations in Halifax County are 10 to 14 minutes (3,187 commuters, 19.0%), 5 to 9 minutes (2,602 commuters, 15.5%), and 30 to 34 minutes (2,449 commuters, 14.6%).
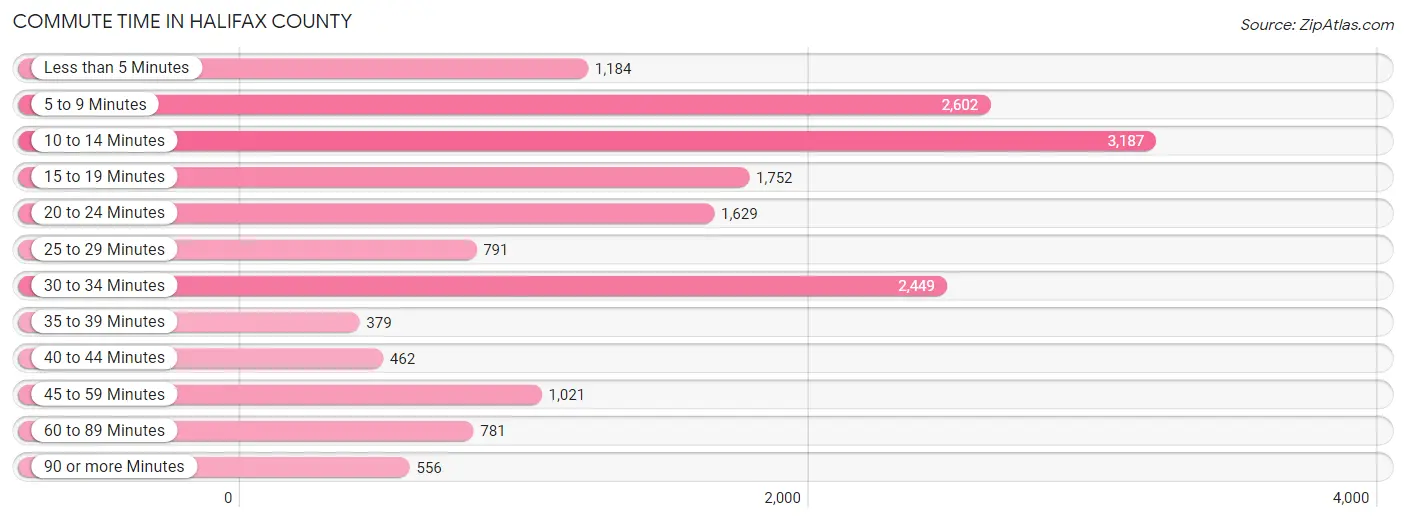
| Commute Time | # Commuters | % Commuters |
| Less than 5 Minutes | 1,184 | 7.0% |
| 5 to 9 Minutes | 2,602 | 15.5% |
| 10 to 14 Minutes | 3,187 | 19.0% |
| 15 to 19 Minutes | 1,752 | 10.4% |
| 20 to 24 Minutes | 1,629 | 9.7% |
| 25 to 29 Minutes | 791 | 4.7% |
| 30 to 34 Minutes | 2,449 | 14.6% |
| 35 to 39 Minutes | 379 | 2.3% |
| 40 to 44 Minutes | 462 | 2.8% |
| 45 to 59 Minutes | 1,021 | 6.1% |
| 60 to 89 Minutes | 781 | 4.6% |
| 90 or more Minutes | 556 | 3.3% |
Commute Time by Sex in Halifax County
The most common commute times in Halifax County are 10 to 14 minutes (1,755 commuters, 19.9%) for males and 10 to 14 minutes (1,432 commuters, 18.0%) for females.
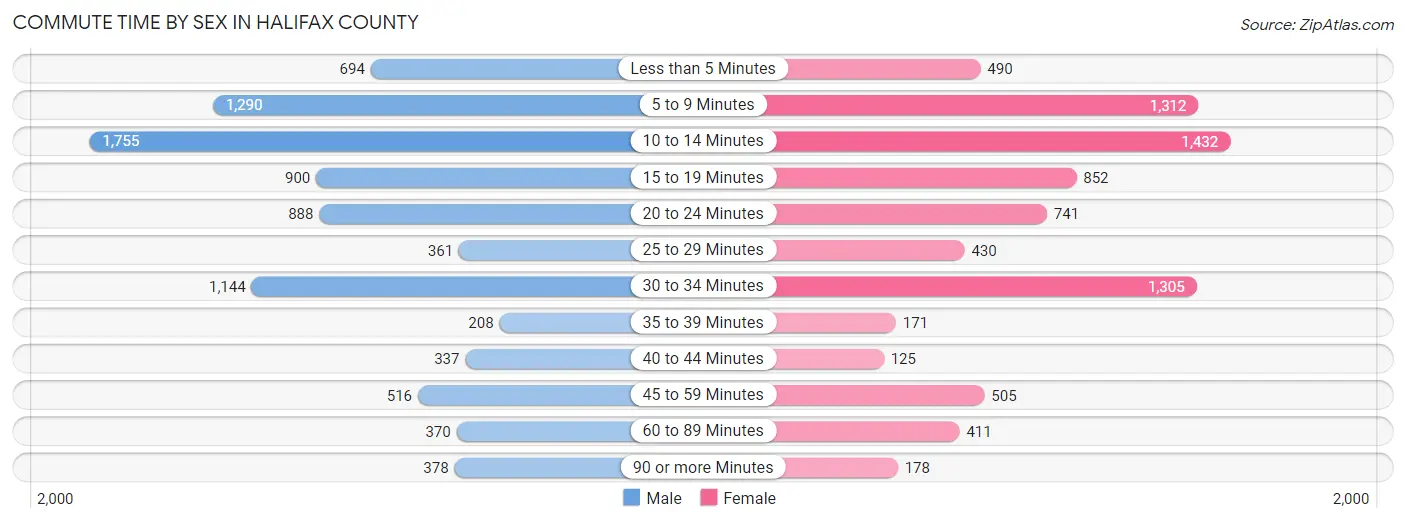
| Commute Time | Male | Female |
| Less than 5 Minutes | 694 (7.9%) | 490 (6.2%) |
| 5 to 9 Minutes | 1,290 (14.6%) | 1,312 (16.5%) |
| 10 to 14 Minutes | 1,755 (19.9%) | 1,432 (18.0%) |
| 15 to 19 Minutes | 900 (10.2%) | 852 (10.7%) |
| 20 to 24 Minutes | 888 (10.0%) | 741 (9.3%) |
| 25 to 29 Minutes | 361 (4.1%) | 430 (5.4%) |
| 30 to 34 Minutes | 1,144 (12.9%) | 1,305 (16.4%) |
| 35 to 39 Minutes | 208 (2.4%) | 171 (2.1%) |
| 40 to 44 Minutes | 337 (3.8%) | 125 (1.6%) |
| 45 to 59 Minutes | 516 (5.8%) | 505 (6.4%) |
| 60 to 89 Minutes | 370 (4.2%) | 411 (5.2%) |
| 90 or more Minutes | 378 (4.3%) | 178 (2.2%) |
Time of Departure to Work by Sex in Halifax County
The most frequent times of departure to work in Halifax County are 8:00 AM to 8:29 AM (1,346, 15.2%) for males and 7:30 AM to 7:59 AM (1,368, 17.2%) for females.
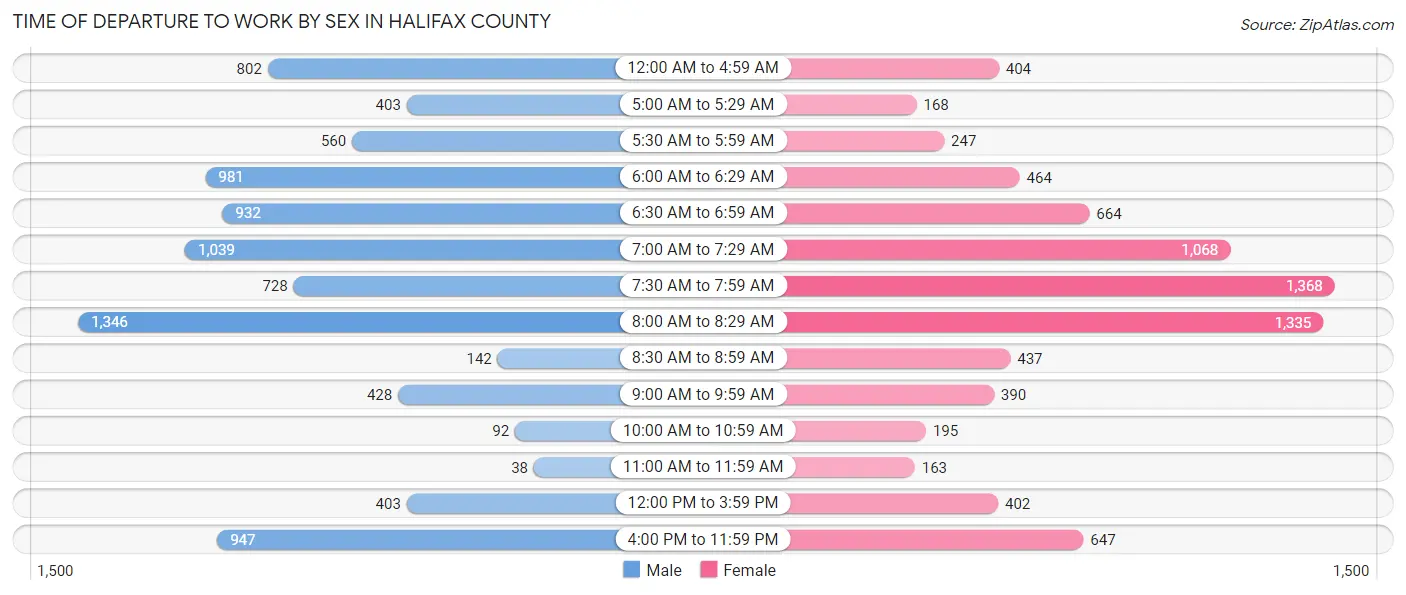
| Time of Departure | Male | Female |
| 12:00 AM to 4:59 AM | 802 (9.1%) | 404 (5.1%) |
| 5:00 AM to 5:29 AM | 403 (4.6%) | 168 (2.1%) |
| 5:30 AM to 5:59 AM | 560 (6.3%) | 247 (3.1%) |
| 6:00 AM to 6:29 AM | 981 (11.1%) | 464 (5.8%) |
| 6:30 AM to 6:59 AM | 932 (10.5%) | 664 (8.4%) |
| 7:00 AM to 7:29 AM | 1,039 (11.7%) | 1,068 (13.4%) |
| 7:30 AM to 7:59 AM | 728 (8.2%) | 1,368 (17.2%) |
| 8:00 AM to 8:29 AM | 1,346 (15.2%) | 1,335 (16.8%) |
| 8:30 AM to 8:59 AM | 142 (1.6%) | 437 (5.5%) |
| 9:00 AM to 9:59 AM | 428 (4.8%) | 390 (4.9%) |
| 10:00 AM to 10:59 AM | 92 (1.0%) | 195 (2.5%) |
| 11:00 AM to 11:59 AM | 38 (0.4%) | 163 (2.1%) |
| 12:00 PM to 3:59 PM | 403 (4.6%) | 402 (5.1%) |
| 4:00 PM to 11:59 PM | 947 (10.7%) | 647 (8.1%) |
| Total | 8,841 (100.0%) | 7,952 (100.0%) |
Housing Occupancy in Halifax County
Occupancy by Ownership in Halifax County
Of the total 20,139 dwellings in Halifax County, owner-occupied units account for 12,788 (63.5%), while renter-occupied units make up 7,351 (36.5%).
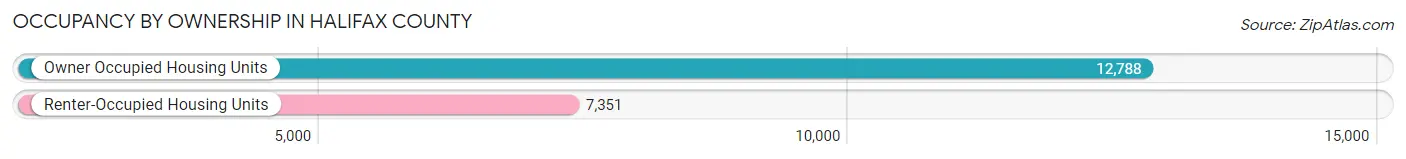
| Occupancy | # Housing Units | % Housing Units |
| Owner Occupied Housing Units | 12,788 | 63.5% |
| Renter-Occupied Housing Units | 7,351 | 36.5% |
| Total Occupied Housing Units | 20,139 | 100.0% |
Occupancy by Household Size in Halifax County
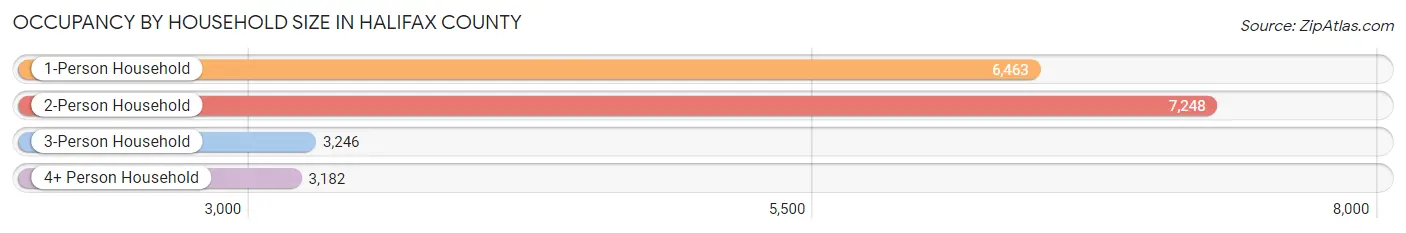
| Household Size | # Housing Units | % Housing Units |
| 1-Person Household | 6,463 | 32.1% |
| 2-Person Household | 7,248 | 36.0% |
| 3-Person Household | 3,246 | 16.1% |
| 4+ Person Household | 3,182 | 15.8% |
| Total Housing Units | 20,139 | 100.0% |
Occupancy by Ownership by Household Size in Halifax County
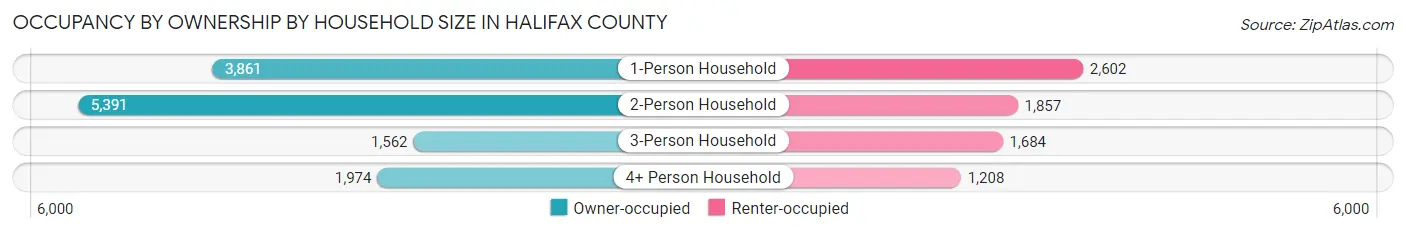
| Household Size | Owner-occupied | Renter-occupied |
| 1-Person Household | 3,861 (59.7%) | 2,602 (40.3%) |
| 2-Person Household | 5,391 (74.4%) | 1,857 (25.6%) |
| 3-Person Household | 1,562 (48.1%) | 1,684 (51.9%) |
| 4+ Person Household | 1,974 (62.0%) | 1,208 (38.0%) |
| Total Housing Units | 12,788 (63.5%) | 7,351 (36.5%) |
Occupancy by Educational Attainment in Halifax County
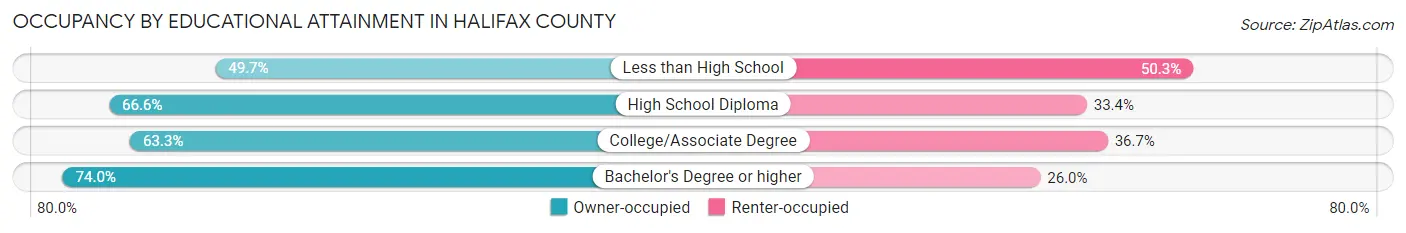
| Household Size | Owner-occupied | Renter-occupied |
| Less than High School | 1,938 (49.7%) | 1,958 (50.3%) |
| High School Diploma | 4,641 (66.6%) | 2,328 (33.4%) |
| College/Associate Degree | 3,851 (63.3%) | 2,235 (36.7%) |
| Bachelor's Degree or higher | 2,358 (74.0%) | 830 (26.0%) |
Occupancy by Age of Householder in Halifax County
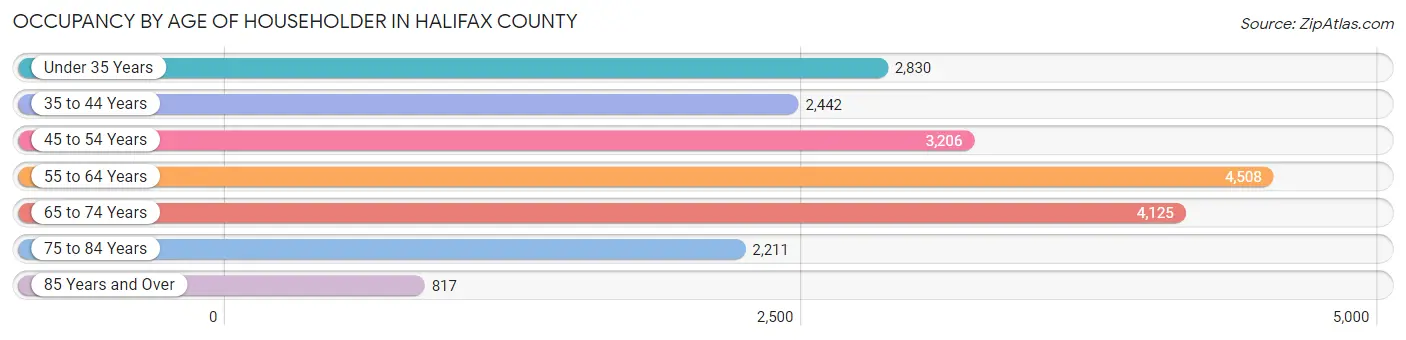
| Age Bracket | # Households | % Households |
| Under 35 Years | 2,830 | 14.1% |
| 35 to 44 Years | 2,442 | 12.1% |
| 45 to 54 Years | 3,206 | 15.9% |
| 55 to 64 Years | 4,508 | 22.4% |
| 65 to 74 Years | 4,125 | 20.5% |
| 75 to 84 Years | 2,211 | 11.0% |
| 85 Years and Over | 817 | 4.1% |
| Total | 20,139 | 100.0% |
Housing Finances in Halifax County
Median Income by Occupancy in Halifax County
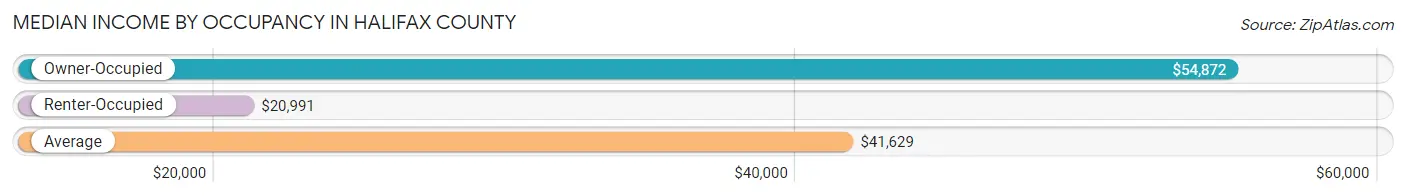
| Occupancy Type | # Households | Median Income |
| Owner-Occupied | 12,788 (63.5%) | $54,872 |
| Renter-Occupied | 7,351 (36.5%) | $20,991 |
| Average | 20,139 (100.0%) | $41,629 |
Occupancy by Householder Income Bracket in Halifax County
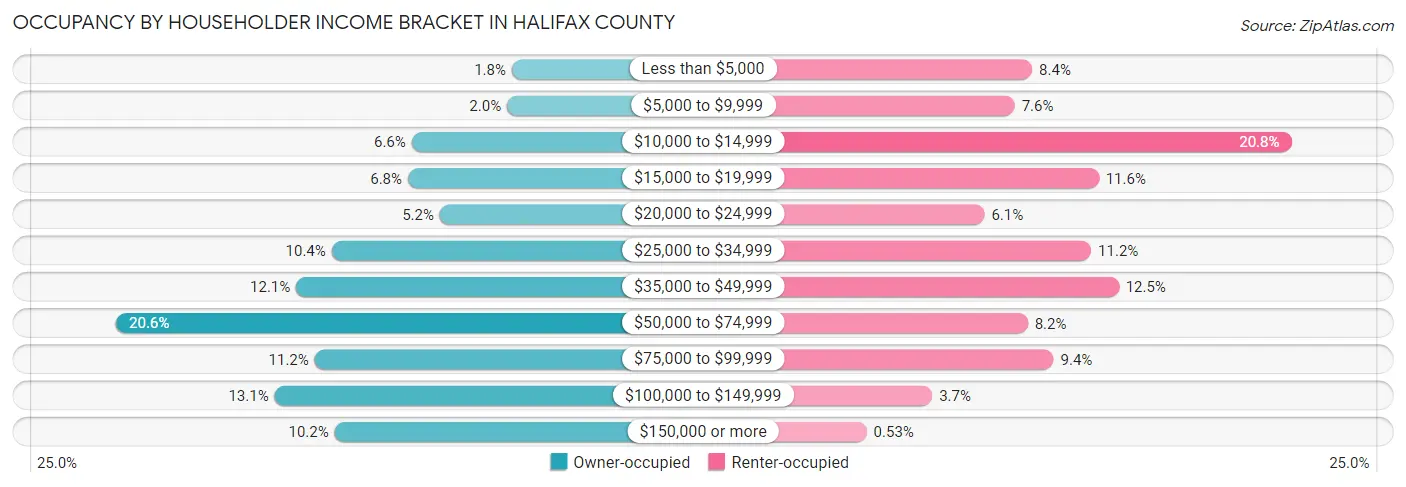
| Income Bracket | Owner-occupied | Renter-occupied |
| Less than $5,000 | 230 (1.8%) | 618 (8.4%) |
| $5,000 to $9,999 | 259 (2.0%) | 557 (7.6%) |
| $10,000 to $14,999 | 840 (6.6%) | 1,525 (20.7%) |
| $15,000 to $19,999 | 863 (6.8%) | 851 (11.6%) |
| $20,000 to $24,999 | 669 (5.2%) | 451 (6.1%) |
| $25,000 to $34,999 | 1,328 (10.4%) | 825 (11.2%) |
| $35,000 to $49,999 | 1,544 (12.1%) | 921 (12.5%) |
| $50,000 to $74,999 | 2,639 (20.6%) | 603 (8.2%) |
| $75,000 to $99,999 | 1,431 (11.2%) | 693 (9.4%) |
| $100,000 to $149,999 | 1,675 (13.1%) | 268 (3.6%) |
| $150,000 or more | 1,310 (10.2%) | 39 (0.5%) |
| Total | 12,788 (100.0%) | 7,351 (100.0%) |
Monthly Housing Cost Tiers in Halifax County
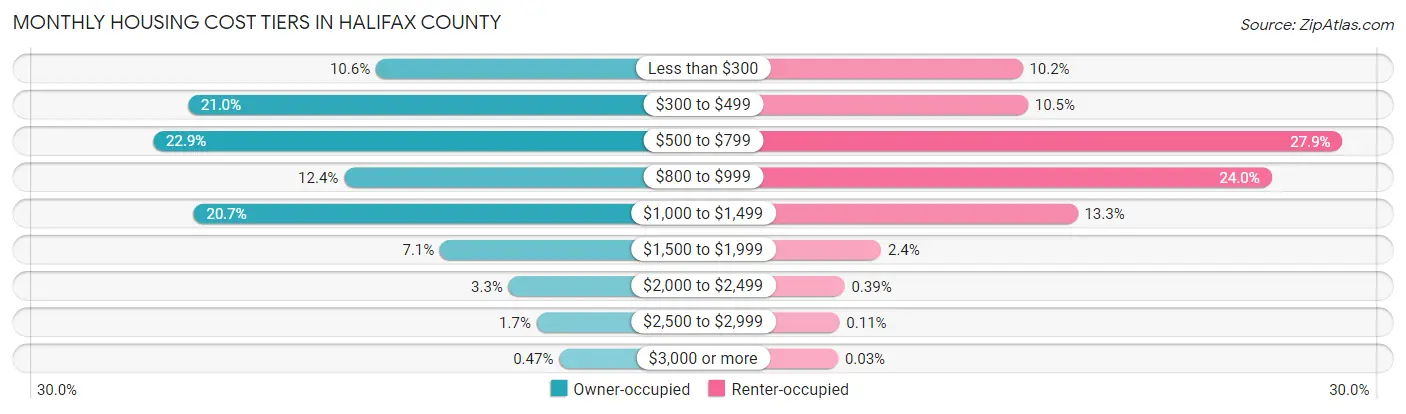
| Monthly Cost | Owner-occupied | Renter-occupied |
| Less than $300 | 1,354 (10.6%) | 751 (10.2%) |
| $300 to $499 | 2,683 (21.0%) | 773 (10.5%) |
| $500 to $799 | 2,930 (22.9%) | 2,050 (27.9%) |
| $800 to $999 | 1,579 (12.3%) | 1,763 (24.0%) |
| $1,000 to $1,499 | 2,644 (20.7%) | 975 (13.3%) |
| $1,500 to $1,999 | 902 (7.0%) | 177 (2.4%) |
| $2,000 to $2,499 | 417 (3.3%) | 29 (0.4%) |
| $2,500 to $2,999 | 219 (1.7%) | 8 (0.1%) |
| $3,000 or more | 60 (0.5%) | 2 (0.0%) |
| Total | 12,788 (100.0%) | 7,351 (100.0%) |
Physical Housing Characteristics in Halifax County
Housing Structures in Halifax County
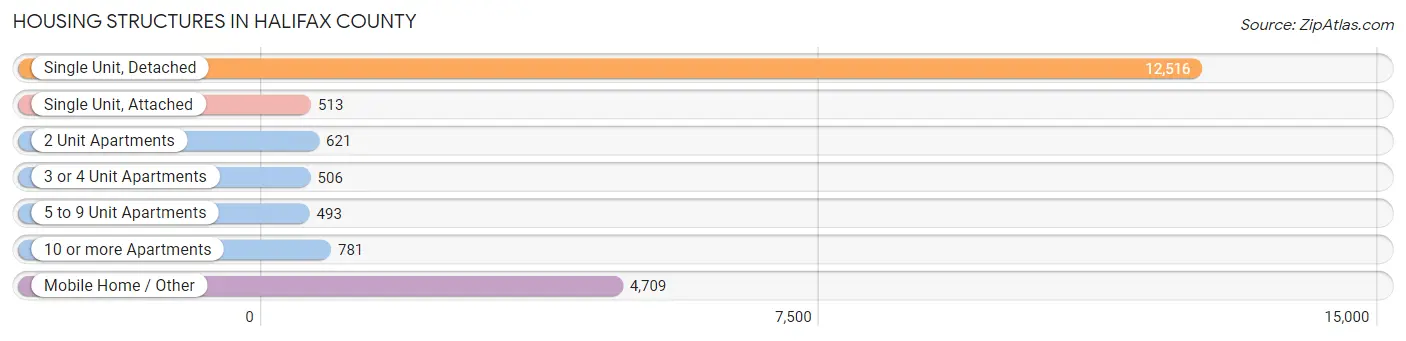
| Structure Type | # Housing Units | % Housing Units |
| Single Unit, Detached | 12,516 | 62.2% |
| Single Unit, Attached | 513 | 2.5% |
| 2 Unit Apartments | 621 | 3.1% |
| 3 or 4 Unit Apartments | 506 | 2.5% |
| 5 to 9 Unit Apartments | 493 | 2.5% |
| 10 or more Apartments | 781 | 3.9% |
| Mobile Home / Other | 4,709 | 23.4% |
| Total | 20,139 | 100.0% |
Housing Structures by Occupancy in Halifax County
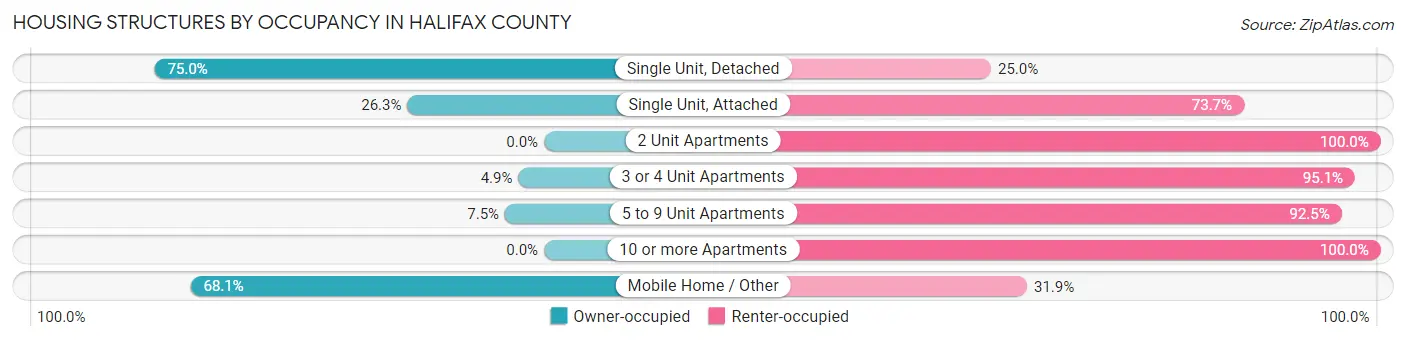
| Structure Type | Owner-occupied | Renter-occupied |
| Single Unit, Detached | 9,386 (75.0%) | 3,130 (25.0%) |
| Single Unit, Attached | 135 (26.3%) | 378 (73.7%) |
| 2 Unit Apartments | 0 (0.0%) | 621 (100.0%) |
| 3 or 4 Unit Apartments | 25 (4.9%) | 481 (95.1%) |
| 5 to 9 Unit Apartments | 37 (7.5%) | 456 (92.5%) |
| 10 or more Apartments | 0 (0.0%) | 781 (100.0%) |
| Mobile Home / Other | 3,205 (68.1%) | 1,504 (31.9%) |
| Total | 12,788 (63.5%) | 7,351 (36.5%) |
Housing Structures by Number of Rooms in Halifax County
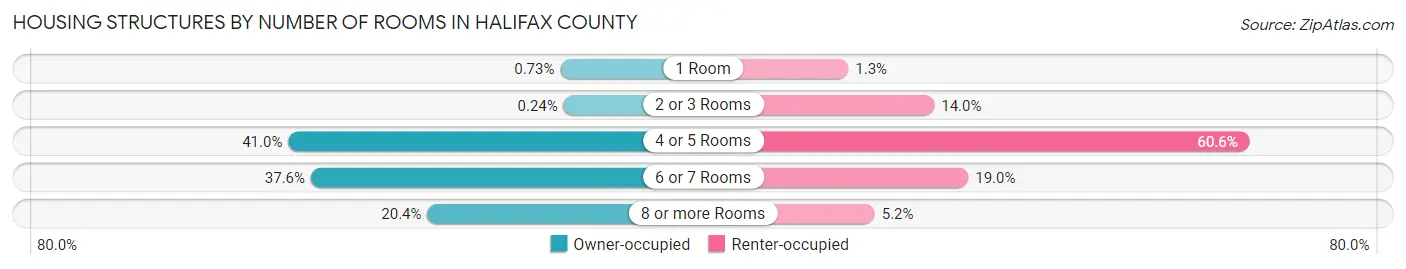
| Number of Rooms | Owner-occupied | Renter-occupied |
| 1 Room | 93 (0.7%) | 92 (1.3%) |
| 2 or 3 Rooms | 31 (0.2%) | 1,027 (14.0%) |
| 4 or 5 Rooms | 5,242 (41.0%) | 4,456 (60.6%) |
| 6 or 7 Rooms | 4,813 (37.6%) | 1,397 (19.0%) |
| 8 or more Rooms | 2,609 (20.4%) | 379 (5.2%) |
| Total | 12,788 (100.0%) | 7,351 (100.0%) |
Housing Structure by Heating Type in Halifax County
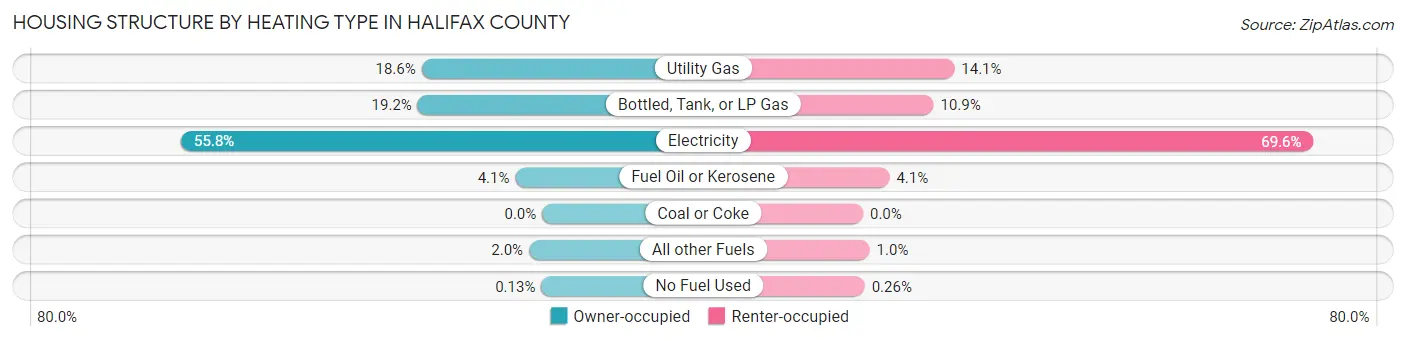
| Heating Type | Owner-occupied | Renter-occupied |
| Utility Gas | 2,382 (18.6%) | 1,038 (14.1%) |
| Bottled, Tank, or LP Gas | 2,461 (19.2%) | 801 (10.9%) |
| Electricity | 7,139 (55.8%) | 5,117 (69.6%) |
| Fuel Oil or Kerosene | 530 (4.1%) | 301 (4.1%) |
| Coal or Coke | 0 (0.0%) | 0 (0.0%) |
| All other Fuels | 260 (2.0%) | 75 (1.0%) |
| No Fuel Used | 16 (0.1%) | 19 (0.3%) |
| Total | 12,788 (100.0%) | 7,351 (100.0%) |
Household Vehicle Usage in Halifax County
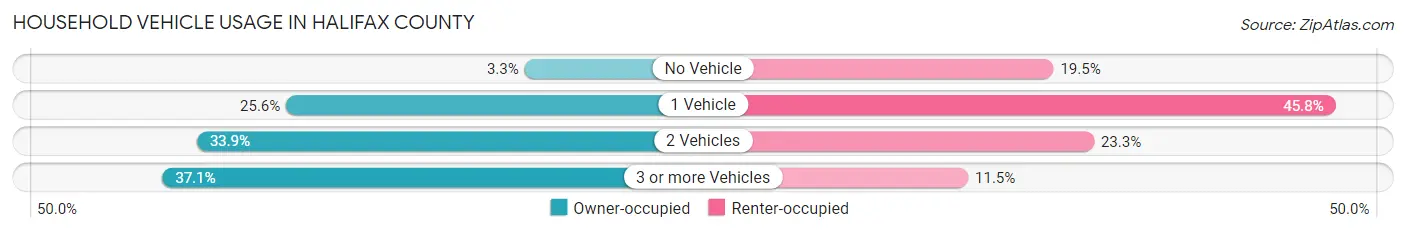
| Vehicles per Household | Owner-occupied | Renter-occupied |
| No Vehicle | 426 (3.3%) | 1,431 (19.5%) |
| 1 Vehicle | 3,273 (25.6%) | 3,366 (45.8%) |
| 2 Vehicles | 4,339 (33.9%) | 1,709 (23.3%) |
| 3 or more Vehicles | 4,750 (37.1%) | 845 (11.5%) |
| Total | 12,788 (100.0%) | 7,351 (100.0%) |
Real Estate & Mortgages in Halifax County
Real Estate and Mortgage Overview in Halifax County
| Characteristic | Without Mortgage | With Mortgage |
| Housing Units | 6,725 | 6,063 |
| Median Property Value | $81,300 | $115,500 |
| Median Household Income | $45,064 | $626 |
| Monthly Housing Costs | $460 | $44 |
| Real Estate Taxes | $994 | $104 |
Property Value by Mortgage Status in Halifax County
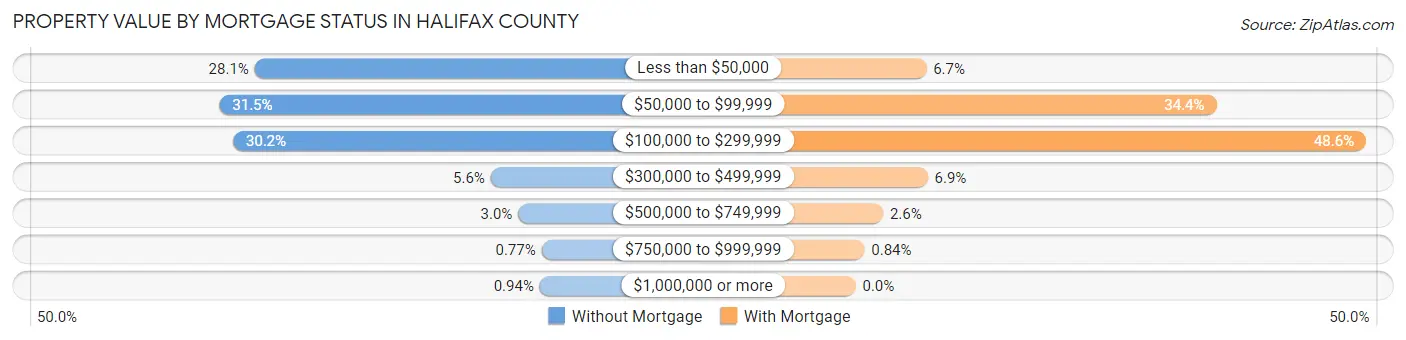
| Property Value | Without Mortgage | With Mortgage |
| Less than $50,000 | 1,889 (28.1%) | 408 (6.7%) |
| $50,000 to $99,999 | 2,115 (31.5%) | 2,083 (34.4%) |
| $100,000 to $299,999 | 2,028 (30.2%) | 2,947 (48.6%) |
| $300,000 to $499,999 | 377 (5.6%) | 416 (6.9%) |
| $500,000 to $749,999 | 201 (3.0%) | 158 (2.6%) |
| $750,000 to $999,999 | 52 (0.8%) | 51 (0.8%) |
| $1,000,000 or more | 63 (0.9%) | 0 (0.0%) |
| Total | 6,725 (100.0%) | 6,063 (100.0%) |
Household Income by Mortgage Status in Halifax County
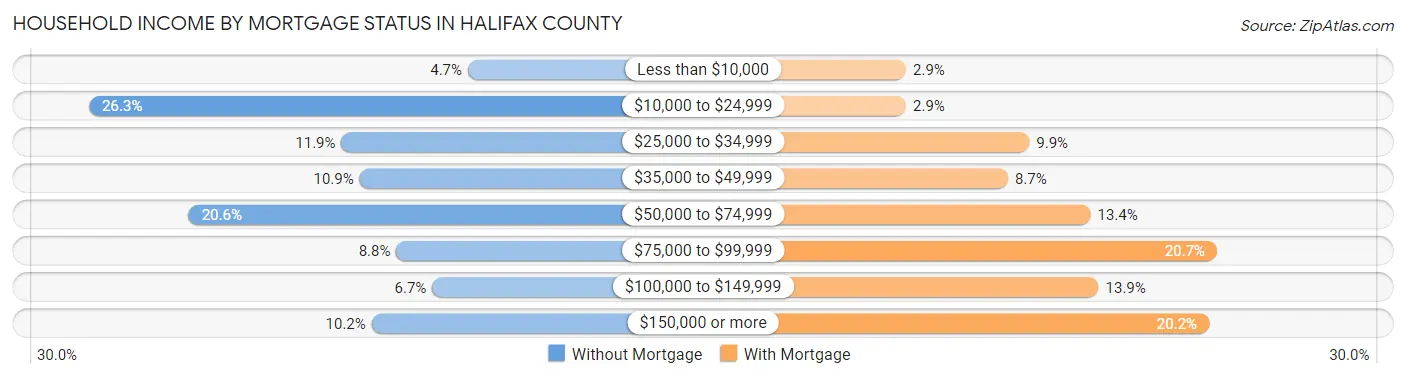
| Household Income | Without Mortgage | With Mortgage |
| Less than $10,000 | 314 (4.7%) | 175 (2.9%) |
| $10,000 to $24,999 | 1,770 (26.3%) | 175 (2.9%) |
| $25,000 to $34,999 | 800 (11.9%) | 602 (9.9%) |
| $35,000 to $49,999 | 730 (10.9%) | 528 (8.7%) |
| $50,000 to $74,999 | 1,387 (20.6%) | 814 (13.4%) |
| $75,000 to $99,999 | 589 (8.8%) | 1,252 (20.6%) |
| $100,000 to $149,999 | 451 (6.7%) | 842 (13.9%) |
| $150,000 or more | 684 (10.2%) | 1,224 (20.2%) |
| Total | 6,725 (100.0%) | 6,063 (100.0%) |
Property Value to Household Income Ratio in Halifax County
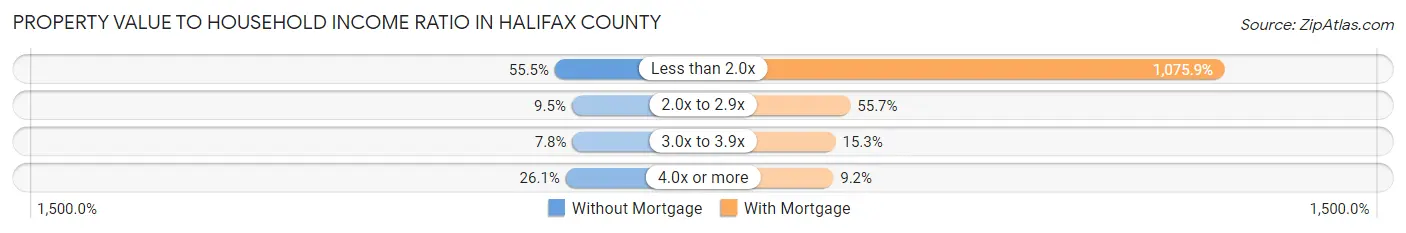
| Value-to-Income Ratio | Without Mortgage | With Mortgage |
| Less than 2.0x | 3,733 (55.5%) | 65,232 (1,075.9%) |
| 2.0x to 2.9x | 638 (9.5%) | 3,379 (55.7%) |
| 3.0x to 3.9x | 524 (7.8%) | 926 (15.3%) |
| 4.0x or more | 1,755 (26.1%) | 559 (9.2%) |
| Total | 6,725 (100.0%) | 6,063 (100.0%) |
Real Estate Taxes by Mortgage Status in Halifax County
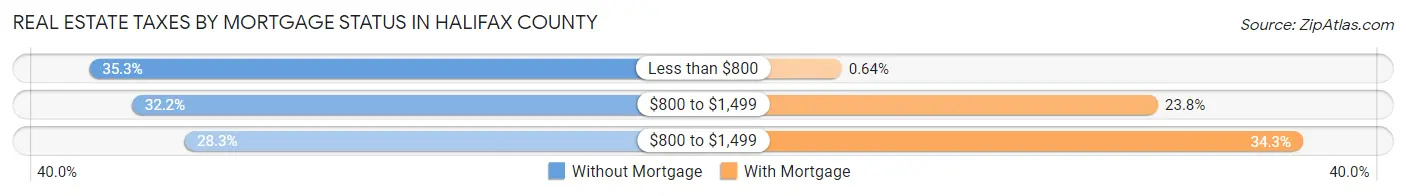
| Property Taxes | Without Mortgage | With Mortgage |
| Less than $800 | 2,372 (35.3%) | 39 (0.6%) |
| $800 to $1,499 | 2,163 (32.2%) | 1,440 (23.7%) |
| $800 to $1,499 | 1,906 (28.3%) | 2,081 (34.3%) |
| Total | 6,725 (100.0%) | 6,063 (100.0%) |
Health & Disability in Halifax County
Health Insurance Coverage by Age in Halifax County
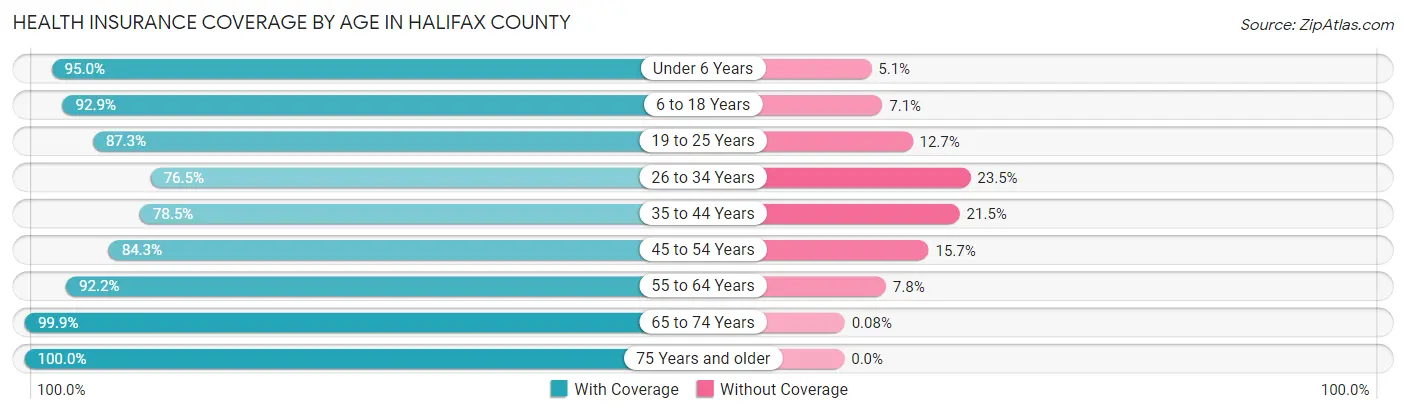
| Age Bracket | With Coverage | Without Coverage |
| Under 6 Years | 2,952 (95.0%) | 157 (5.1%) |
| 6 to 18 Years | 7,226 (92.9%) | 552 (7.1%) |
| 19 to 25 Years | 3,013 (87.3%) | 439 (12.7%) |
| 26 to 34 Years | 3,958 (76.5%) | 1,217 (23.5%) |
| 35 to 44 Years | 4,025 (78.5%) | 1,103 (21.5%) |
| 45 to 54 Years | 4,779 (84.3%) | 891 (15.7%) |
| 55 to 64 Years | 6,654 (92.2%) | 560 (7.8%) |
| 65 to 74 Years | 6,090 (99.9%) | 5 (0.1%) |
| 75 Years and older | 4,015 (100.0%) | 0 (0.0%) |
| Total | 42,712 (89.7%) | 4,924 (10.3%) |
Health Insurance Coverage by Citizenship Status in Halifax County
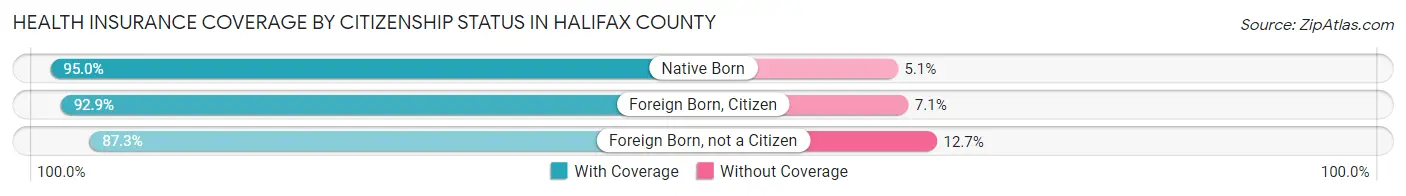
| Citizenship Status | With Coverage | Without Coverage |
| Native Born | 2,952 (95.0%) | 157 (5.1%) |
| Foreign Born, Citizen | 7,226 (92.9%) | 552 (7.1%) |
| Foreign Born, not a Citizen | 3,013 (87.3%) | 439 (12.7%) |
Health Insurance Coverage by Household Income in Halifax County
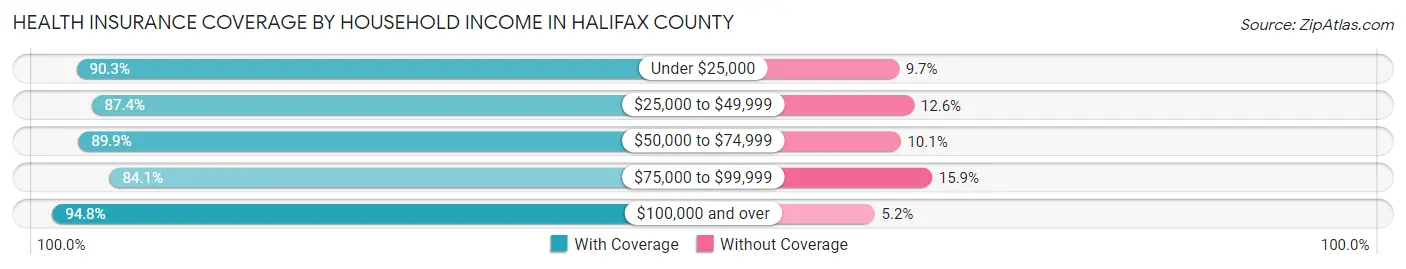
| Household Income | With Coverage | Without Coverage |
| Under $25,000 | 10,957 (90.3%) | 1,183 (9.7%) |
| $25,000 to $49,999 | 9,511 (87.4%) | 1,368 (12.6%) |
| $50,000 to $74,999 | 7,812 (89.9%) | 874 (10.1%) |
| $75,000 to $99,999 | 5,254 (84.1%) | 996 (15.9%) |
| $100,000 and over | 9,093 (94.8%) | 500 (5.2%) |
Public vs Private Health Insurance Coverage by Age in Halifax County
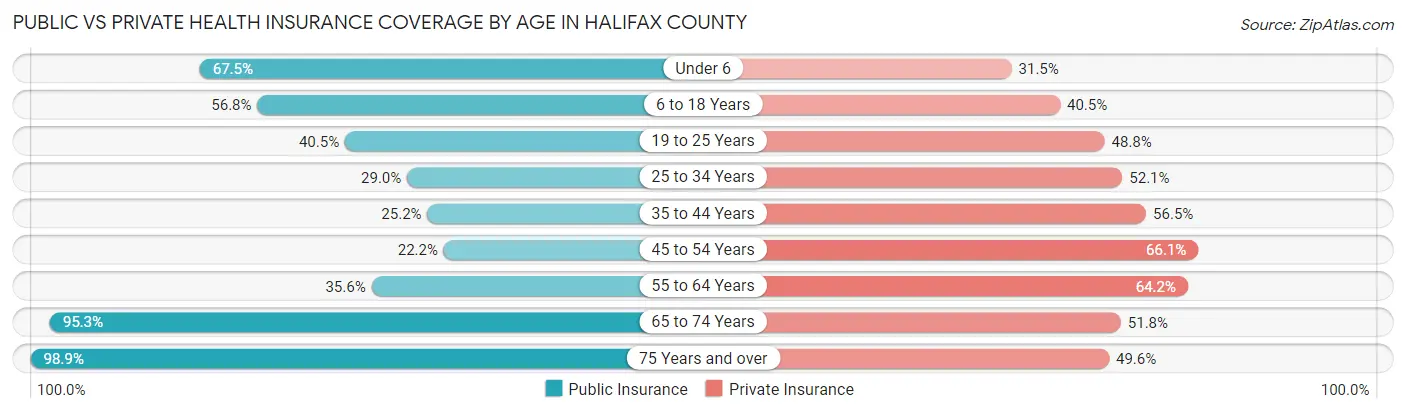
| Age Bracket | Public Insurance | Private Insurance |
| Under 6 | 2,098 (67.5%) | 980 (31.5%) |
| 6 to 18 Years | 4,418 (56.8%) | 3,151 (40.5%) |
| 19 to 25 Years | 1,399 (40.5%) | 1,684 (48.8%) |
| 25 to 34 Years | 1,501 (29.0%) | 2,695 (52.1%) |
| 35 to 44 Years | 1,294 (25.2%) | 2,897 (56.5%) |
| 45 to 54 Years | 1,258 (22.2%) | 3,750 (66.1%) |
| 55 to 64 Years | 2,569 (35.6%) | 4,632 (64.2%) |
| 65 to 74 Years | 5,810 (95.3%) | 3,157 (51.8%) |
| 75 Years and over | 3,971 (98.9%) | 1,992 (49.6%) |
| Total | 24,318 (51.0%) | 24,938 (52.3%) |
Disability Status by Sex by Age in Halifax County
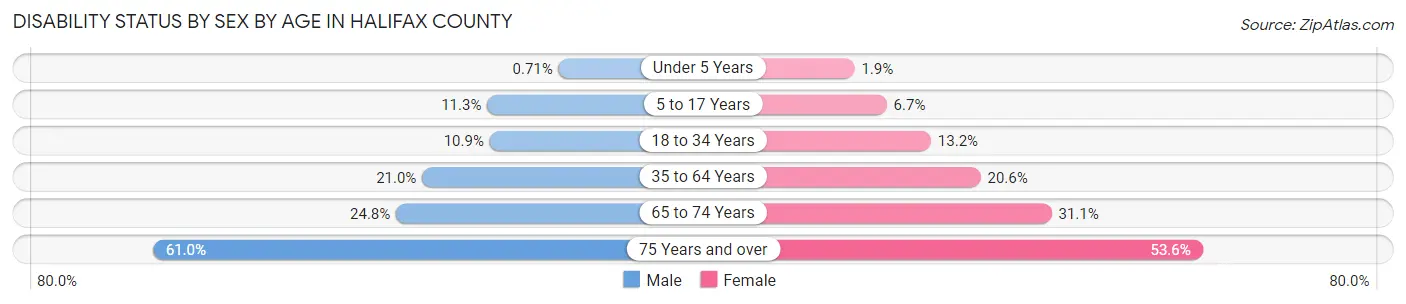
| Age Bracket | Male | Female |
| Under 5 Years | 9 (0.7%) | 26 (1.9%) |
| 5 to 17 Years | 458 (11.3%) | 244 (6.7%) |
| 18 to 34 Years | 500 (10.9%) | 606 (13.2%) |
| 35 to 64 Years | 1,802 (21.0%) | 1,939 (20.6%) |
| 65 to 74 Years | 680 (24.8%) | 1,045 (31.1%) |
| 75 Years and over | 968 (61.0%) | 1,300 (53.6%) |
Disability Class by Sex by Age in Halifax County
Disability Class: Hearing Difficulty
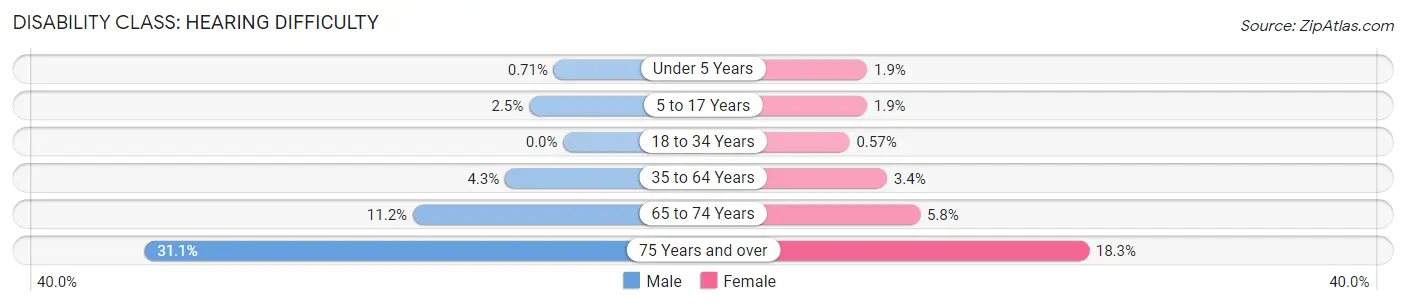
| Age Bracket | Male | Female |
| Under 5 Years | 9 (0.7%) | 26 (1.9%) |
| 5 to 17 Years | 103 (2.5%) | 68 (1.9%) |
| 18 to 34 Years | 0 (0.0%) | 26 (0.6%) |
| 35 to 64 Years | 372 (4.3%) | 315 (3.4%) |
| 65 to 74 Years | 306 (11.2%) | 195 (5.8%) |
| 75 Years and over | 494 (31.1%) | 445 (18.3%) |
Disability Class: Vision Difficulty
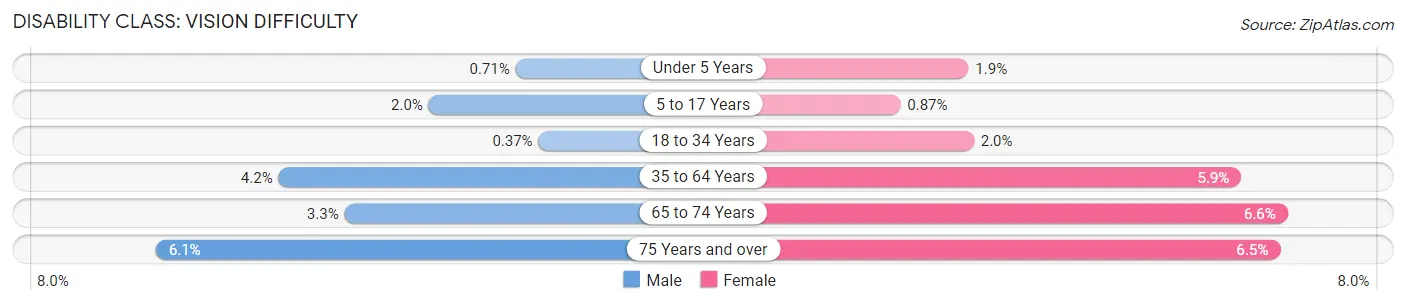
| Age Bracket | Male | Female |
| Under 5 Years | 9 (0.7%) | 26 (1.9%) |
| 5 to 17 Years | 81 (2.0%) | 32 (0.9%) |
| 18 to 34 Years | 17 (0.4%) | 90 (2.0%) |
| 35 to 64 Years | 364 (4.2%) | 558 (5.9%) |
| 65 to 74 Years | 89 (3.3%) | 222 (6.6%) |
| 75 Years and over | 96 (6.0%) | 158 (6.5%) |
Disability Class: Cognitive Difficulty
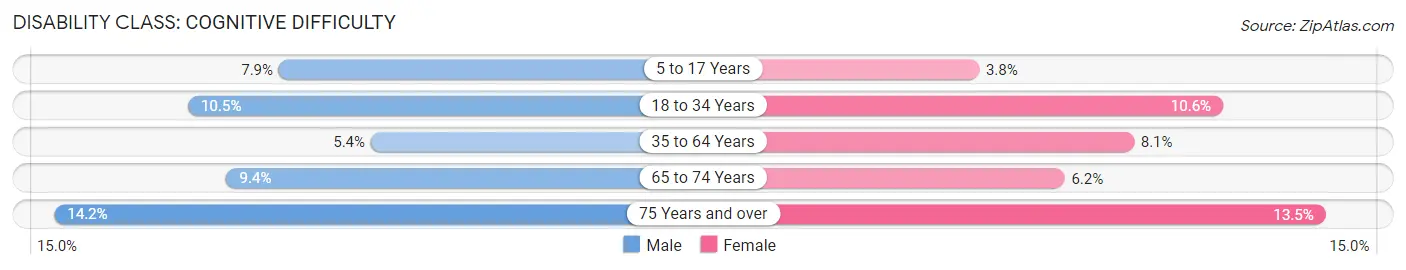
| Age Bracket | Male | Female |
| 5 to 17 Years | 321 (7.9%) | 140 (3.8%) |
| 18 to 34 Years | 478 (10.4%) | 486 (10.6%) |
| 35 to 64 Years | 461 (5.4%) | 765 (8.1%) |
| 65 to 74 Years | 257 (9.4%) | 208 (6.2%) |
| 75 Years and over | 225 (14.2%) | 327 (13.5%) |
Disability Class: Ambulatory Difficulty
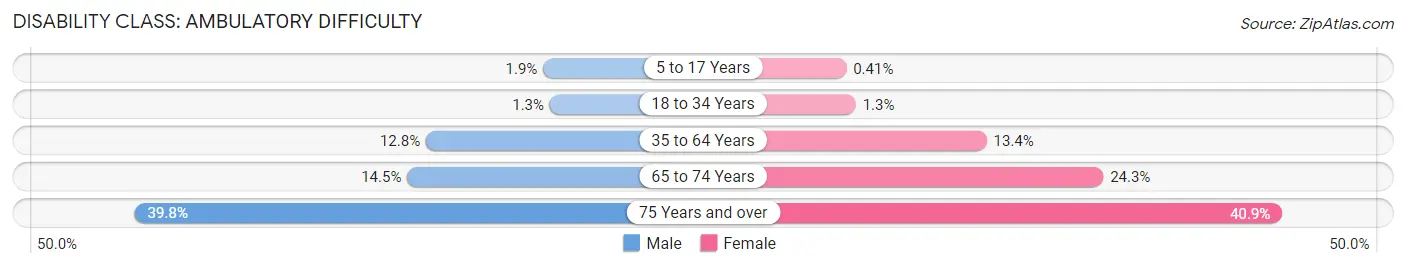
| Age Bracket | Male | Female |
| 5 to 17 Years | 76 (1.9%) | 15 (0.4%) |
| 18 to 34 Years | 57 (1.3%) | 59 (1.3%) |
| 35 to 64 Years | 1,096 (12.8%) | 1,265 (13.4%) |
| 65 to 74 Years | 397 (14.5%) | 814 (24.3%) |
| 75 Years and over | 632 (39.8%) | 992 (40.9%) |
Disability Class: Self-Care Difficulty
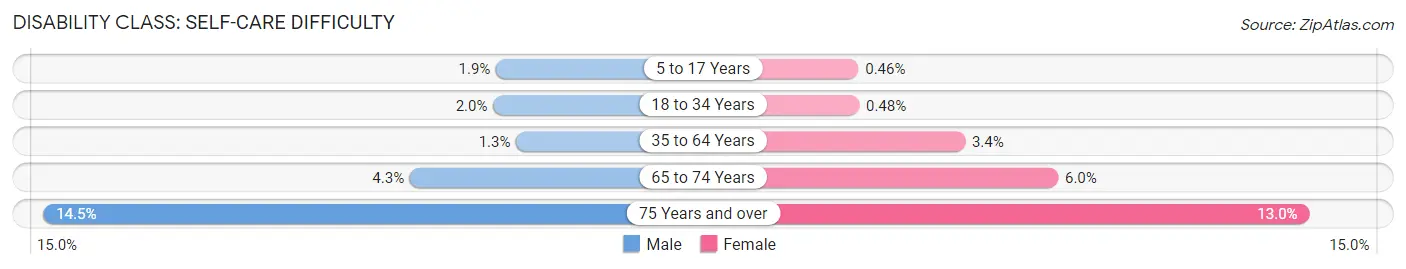
| Age Bracket | Male | Female |
| 5 to 17 Years | 76 (1.9%) | 17 (0.5%) |
| 18 to 34 Years | 89 (1.9%) | 22 (0.5%) |
| 35 to 64 Years | 113 (1.3%) | 323 (3.4%) |
| 65 to 74 Years | 117 (4.3%) | 202 (6.0%) |
| 75 Years and over | 230 (14.5%) | 316 (13.0%) |
Technology Access in Halifax County
Computing Device Access in Halifax County
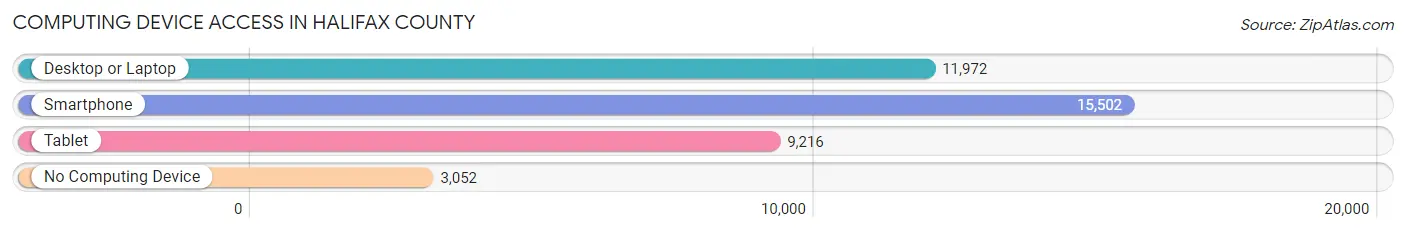
| Device Type | # Households | % Households |
| Desktop or Laptop | 11,972 | 59.5% |
| Smartphone | 15,502 | 77.0% |
| Tablet | 9,216 | 45.8% |
| No Computing Device | 3,052 | 15.1% |
| Total | 20,139 | 100.0% |
Internet Access in Halifax County
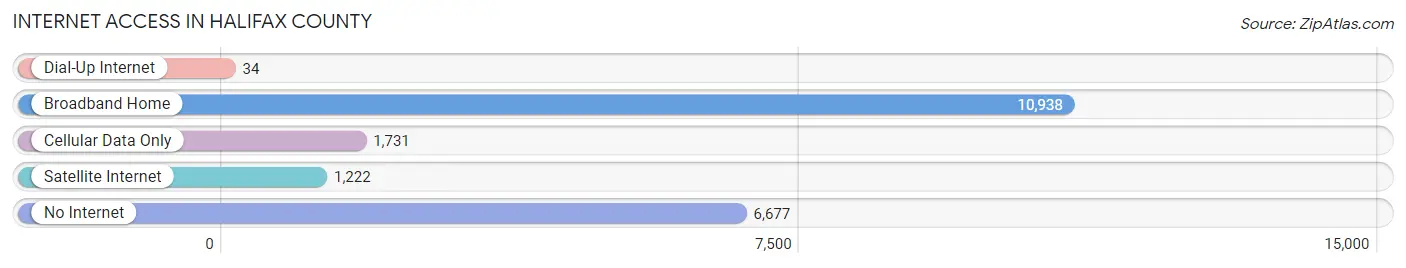
| Internet Type | # Households | % Households |
| Dial-Up Internet | 34 | 0.2% |
| Broadband Home | 10,938 | 54.3% |
| Cellular Data Only | 1,731 | 8.6% |
| Satellite Internet | 1,222 | 6.1% |
| No Internet | 6,677 | 33.2% |
| Total | 20,139 | 100.0% |
Halifax County Summary
Halifax County is located in the northeastern part of North Carolina, and is bordered by the counties of Northampton, Nash, Edgecombe, Warren, and Vance. It is part of the Roanoke Rapids, North Carolina Metropolitan Statistical Area. The county seat is Halifax, and the county has a total area of 545 square miles.
History
Halifax County was formed in 1758 from Edgecombe County. It was named for George Montagu-Dunk, 2nd Earl of Halifax, who was the President of the Board of Trade from 1748 to 1761. The county was originally part of the Tuscarora Indian Nation, and the first European settlers arrived in the area in the early 1700s.
During the American Revolution, Halifax County was the site of several battles, including the Battle of Halifax Courthouse in 1776. The county was also the site of the Halifax Resolves, which was the first official call for independence from Great Britain.
Geography
Halifax County is located in the northeastern part of North Carolina, and is bordered by the counties of Northampton, Nash, Edgecombe, Warren, and Vance. It is part of the Roanoke Rapids, North Carolina Metropolitan Statistical Area. The county seat is Halifax, and the county has a total area of 545 square miles.
The terrain of Halifax County is mostly flat, with some rolling hills in the western part of the county. The county is drained by the Roanoke River, which flows through the county from north to south. The county is also home to several lakes, including Lake Gaston, Lake Phelps, and Lake Gaston.
Economy
The economy of Halifax County is largely based on agriculture, with tobacco, cotton, and soybeans being the main crops. The county is also home to several manufacturing companies, including a paper mill, a furniture factory, and a textile mill.
The county is also home to several military bases, including the Marine Corps Air Station Cherry Point, the Marine Corps Air Station New River, and the Marine Corps Air Station Bogue Field. These bases provide a significant economic boost to the county.
Demographics
As of the 2010 census, the population of Halifax County was 54,691. The racial makeup of the county was 57.3% White, 37.2% African American, 0.4% Native American, 0.7% Asian, 0.1% Pacific Islander, 2.7% from other races, and 1.6% from two or more races. Hispanic or Latino of any race were 4.7% of the population.
The median income for a household in the county was $35,945, and the median income for a family was $43,945. The per capita income for the county was $17,945. About 17.3% of the population was below the poverty line.
Common Questions
What is Per Capita Income in Halifax County?
Per Capita income in Halifax County is $25,504.
What is the Median Family Income in Halifax County?
Median Family Income in Halifax County is $54,419.
What is the Median Household income in Halifax County?
Median Household Income in Halifax County is $41,629.
What is Income or Wage Gap in Halifax County?
Income or Wage Gap in Halifax County is 13.7%.
Women in Halifax County earn 86.3 cents for every dollar earned by a man.
What is Family Income Deficit in Halifax County?
Family Income Deficit in Halifax County is $9,645.
Families that are below poverty line in Halifax County earn $9,645 less on average than the poverty threshold level.
What is Inequality or Gini Index in Halifax County?
Inequality or Gini Index in Halifax County is 0.49.
What is the Total Population of Halifax County?
Total Population of Halifax County is 48,772.
What is the Total Male Population of Halifax County?
Total Male Population of Halifax County is 23,755.
What is the Total Female Population of Halifax County?
Total Female Population of Halifax County is 25,017.
What is the Ratio of Males per 100 Females in Halifax County?
There are 94.96 Males per 100 Females in Halifax County.
What is the Ratio of Females per 100 Males in Halifax County?
There are 105.31 Females per 100 Males in Halifax County.
What is the Median Population Age in Halifax County?
Median Population Age in Halifax County is 43.6 Years.
What is the Average Family Size in Halifax County
Average Family Size in Halifax County is 3.0 People.
What is the Average Household Size in Halifax County
Average Household Size in Halifax County is 2.4 People.
How Large is the Labor Force in Halifax County?
There are 20,180 People in the Labor Forcein in Halifax County.
What is the Percentage of People in the Labor Force in Halifax County?
50.7% of People are in the Labor Force in Halifax County.
What is the Unemployment Rate in Halifax County?
Unemployment Rate in Halifax County is 9.3%.