Greene County, NC Map & Demographics
Greene County Map
Greene County Overview
$21,972
PER CAPITA INCOME
$61,301
AVG FAMILY INCOME
$50,320
AVG HOUSEHOLD INCOME
20.8%
WAGE / INCOME GAP [ % ]
79.2¢/ $1
WAGE / INCOME GAP [ $ ]
$10,677
FAMILY INCOME DEFICIT
0.40
INEQUALITY / GINI INDEX
20,407
TOTAL POPULATION
11,779
MALE POPULATION
8,628
FEMALE POPULATION
136.52
MALES / 100 FEMALES
73.25
FEMALES / 100 MALES
40.0
MEDIAN AGE
3.3
AVG FAMILY SIZE
2.6
AVG HOUSEHOLD SIZE
8,573
LABOR FORCE [ PEOPLE ]
50.6%
PERCENT IN LABOR FORCE
5.5%
UNEMPLOYMENT RATE
Greene County Area Codes
Income in Greene County
Income Overview in Greene County
Per Capita Income in Greene County is $21,972, while median incomes of families and households are $61,301 and $50,320 respectively.
| Characteristic | Number | Measure |
| Per Capita Income | 20,407 | $21,972 |
| Median Family Income | 4,260 | $61,301 |
| Mean Family Income | 4,260 | $69,034 |
| Median Household Income | 6,793 | $50,320 |
| Mean Household Income | 6,793 | $59,360 |
| Income Deficit | 4,260 | $10,677 |
| Wage / Income Gap (%) | 20,407 | 20.76% |
| Wage / Income Gap ($) | 20,407 | 79.24¢ per $1 |
| Gini / Inequality Index | 20,407 | 0.40 |
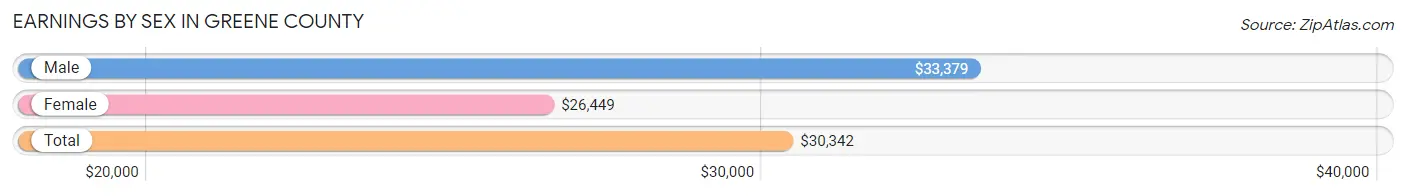
Earnings by Sex in Greene County
Average Earnings in Greene County are $30,342, $33,379 for men and $26,449 for women, a difference of 20.8%.
| Sex | Number | Average Earnings |
| Male | 5,242 (57.9%) | $33,379 |
| Female | 3,806 (42.1%) | $26,449 |
| Total | 9,048 (100.0%) | $30,342 |
Earnings by Sex by Income Bracket in Greene County
The most common earnings brackets in Greene County are $45,000 to $49,999 for men (700 | 13.4%) and $5,000 to $7,499 for women (349 | 9.2%).
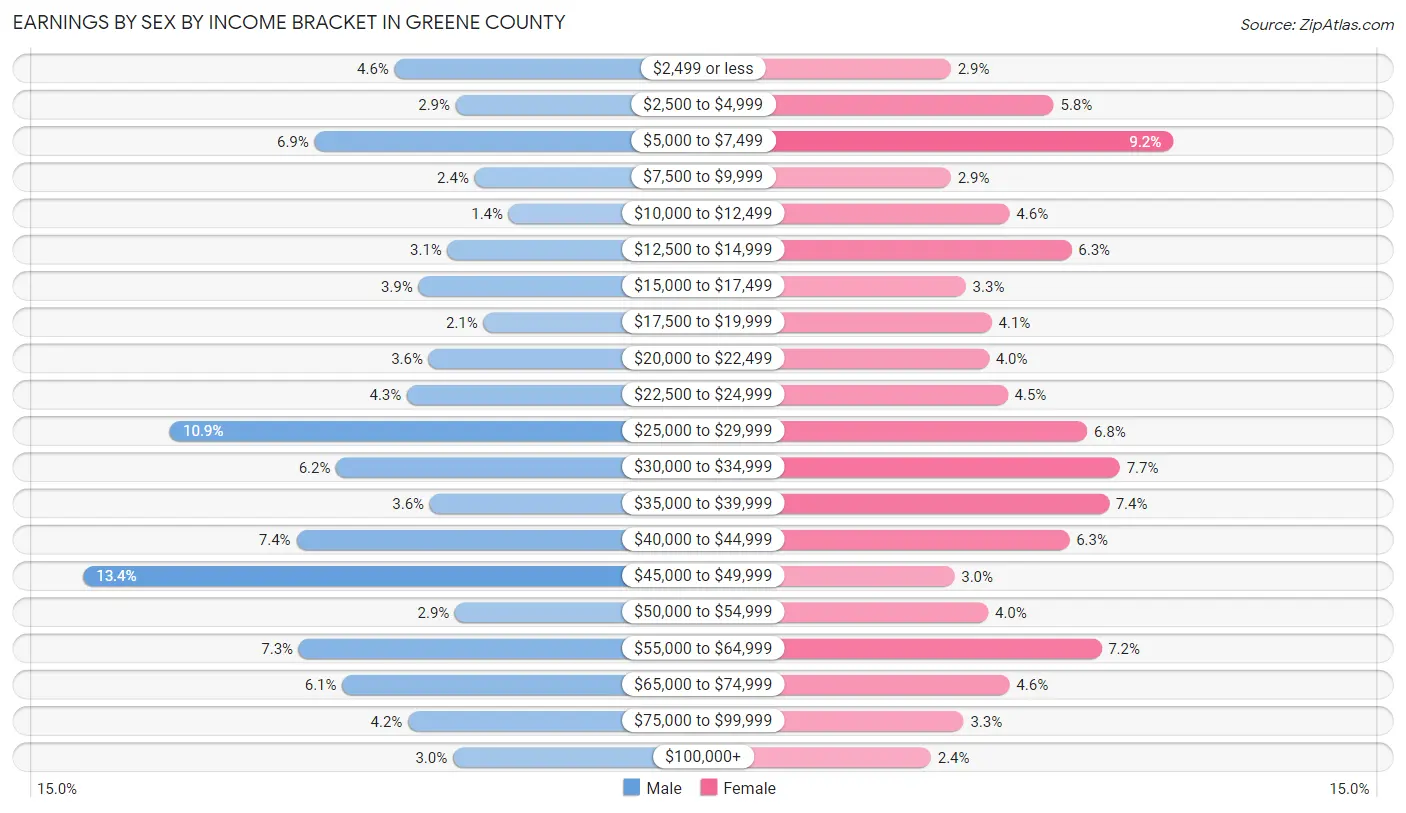
| Income | Male | Female |
| $2,499 or less | 241 (4.6%) | 111 (2.9%) |
| $2,500 to $4,999 | 151 (2.9%) | 221 (5.8%) |
| $5,000 to $7,499 | 359 (6.9%) | 349 (9.2%) |
| $7,500 to $9,999 | 123 (2.4%) | 111 (2.9%) |
| $10,000 to $12,499 | 73 (1.4%) | 174 (4.6%) |
| $12,500 to $14,999 | 163 (3.1%) | 240 (6.3%) |
| $15,000 to $17,499 | 206 (3.9%) | 127 (3.3%) |
| $17,500 to $19,999 | 110 (2.1%) | 155 (4.1%) |
| $20,000 to $22,499 | 191 (3.6%) | 152 (4.0%) |
| $22,500 to $24,999 | 223 (4.3%) | 172 (4.5%) |
| $25,000 to $29,999 | 572 (10.9%) | 257 (6.8%) |
| $30,000 to $34,999 | 327 (6.2%) | 292 (7.7%) |
| $35,000 to $39,999 | 189 (3.6%) | 280 (7.4%) |
| $40,000 to $44,999 | 386 (7.4%) | 238 (6.2%) |
| $45,000 to $49,999 | 700 (13.4%) | 115 (3.0%) |
| $50,000 to $54,999 | 152 (2.9%) | 151 (4.0%) |
| $55,000 to $64,999 | 382 (7.3%) | 272 (7.1%) |
| $65,000 to $74,999 | 318 (6.1%) | 174 (4.6%) |
| $75,000 to $99,999 | 221 (4.2%) | 125 (3.3%) |
| $100,000+ | 155 (3.0%) | 90 (2.4%) |
| Total | 5,242 (100.0%) | 3,806 (100.0%) |
Earnings by Sex by Educational Attainment in Greene County
Average earnings in Greene County are $41,399 for men and $31,635 for women, a difference of 23.6%. Men with an educational attainment of graduate degree enjoy the highest average annual earnings of $67,784, while those with less than high school education earn the least with $28,042. Women with an educational attainment of graduate degree earn the most with the average annual earnings of $51,533, while those with high school diploma education have the smallest earnings of $22,044.
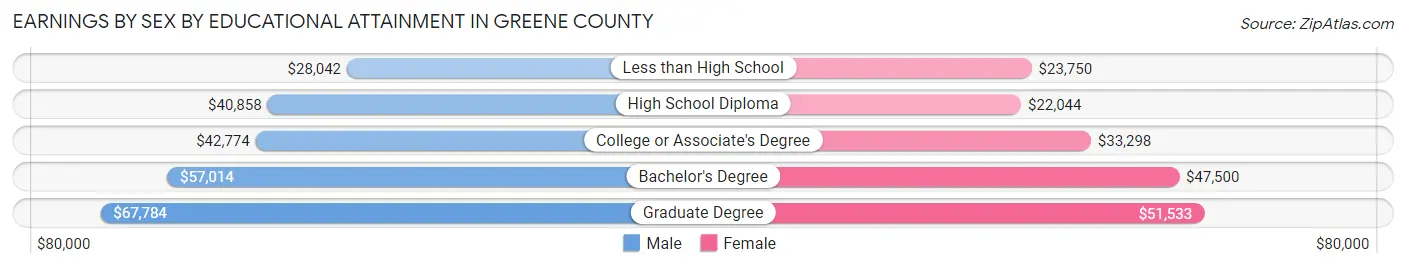
| Educational Attainment | Male Income | Female Income |
| Less than High School | $28,042 | $23,750 |
| High School Diploma | $40,858 | $22,044 |
| College or Associate's Degree | $42,774 | $33,298 |
| Bachelor's Degree | $57,014 | $47,500 |
| Graduate Degree | $67,784 | $51,533 |
| Total | $41,399 | $31,635 |
Family Income in Greene County
Family Income Brackets in Greene County
According to the Greene County family income data, there are 916 families falling into the $75,000 to $99,999 income range, which is the most common income bracket and makes up 21.5% of all families. Conversely, the $200,000+ income bracket is the least frequent group with only 77 families (1.8%) belonging to this category.
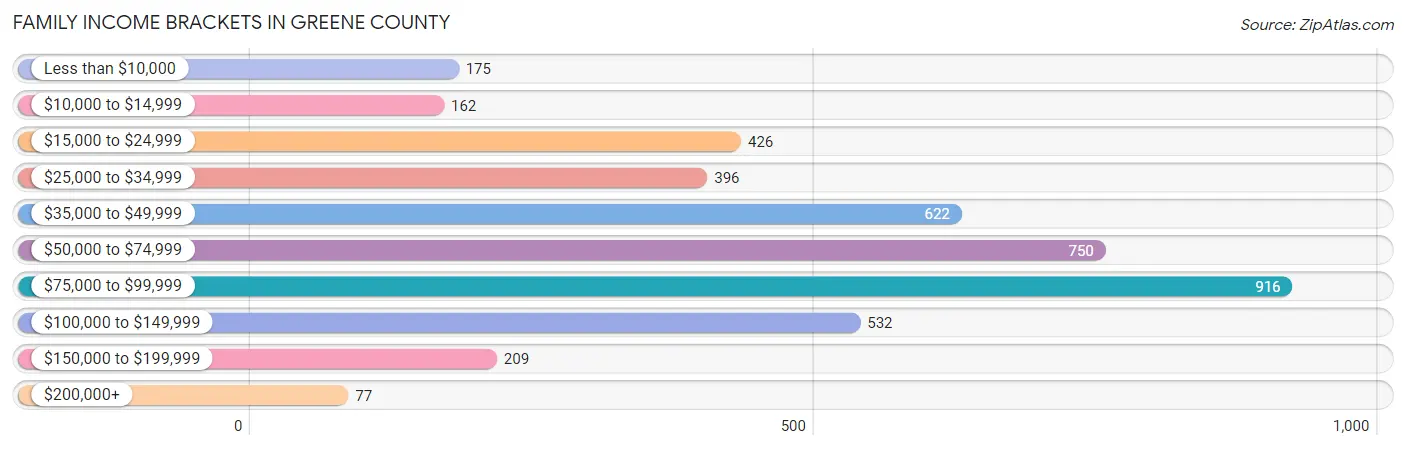
| Income Bracket | # Families | % Families |
| Less than $10,000 | 175 | 4.1% |
| $10,000 to $14,999 | 162 | 3.8% |
| $15,000 to $24,999 | 426 | 10.0% |
| $25,000 to $34,999 | 396 | 9.3% |
| $35,000 to $49,999 | 622 | 14.6% |
| $50,000 to $74,999 | 750 | 17.6% |
| $75,000 to $99,999 | 916 | 21.5% |
| $100,000 to $149,999 | 532 | 12.5% |
| $150,000 to $199,999 | 209 | 4.9% |
| $200,000+ | 77 | 1.8% |
Family Income by Famaliy Size in Greene County
6-person families (162 | 3.8%) account for the highest median family income in Greene County with $71,563 per family, while 2-person families (2,036 | 47.8%) have the highest median income of $29,802 per family member.
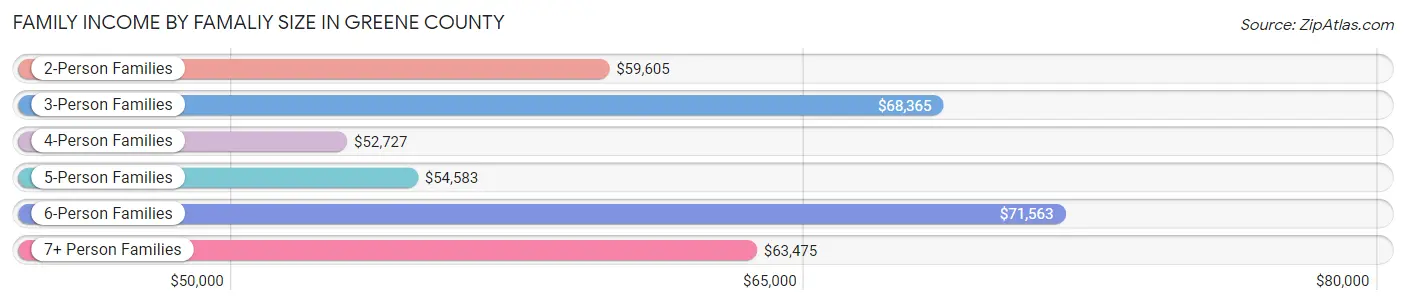
| Income Bracket | # Families | Median Income |
| 2-Person Families | 2,036 (47.8%) | $59,605 |
| 3-Person Families | 1,091 (25.6%) | $68,365 |
| 4-Person Families | 580 (13.6%) | $52,727 |
| 5-Person Families | 267 (6.3%) | $54,583 |
| 6-Person Families | 162 (3.8%) | $71,563 |
| 7+ Person Families | 124 (2.9%) | $63,475 |
| Total | 4,260 (100.0%) | $61,301 |
Family Income by Number of Earners in Greene County
The median family income in Greene County is $61,301, with families comprising 3+ earners (385) having the highest median family income of $109,263, while families with no earners (821) have the lowest median family income of $34,849, accounting for 9.0% and 19.3% of families, respectively.
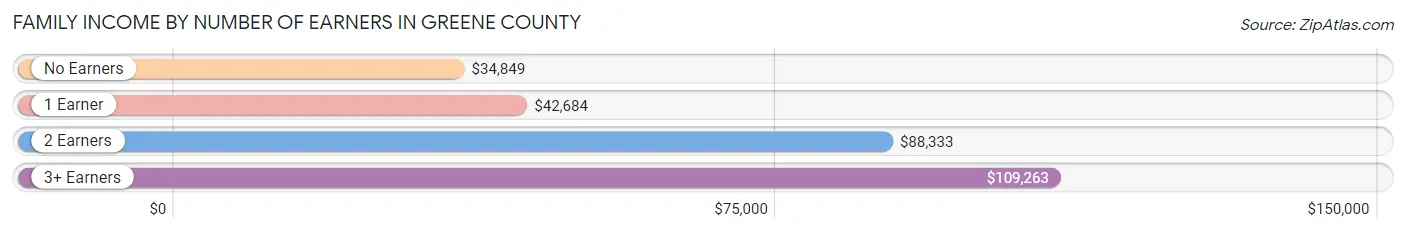
| Number of Earners | # Families | Median Income |
| No Earners | 821 (19.3%) | $34,849 |
| 1 Earner | 1,500 (35.2%) | $42,684 |
| 2 Earners | 1,554 (36.5%) | $88,333 |
| 3+ Earners | 385 (9.0%) | $109,263 |
| Total | 4,260 (100.0%) | $61,301 |
Household Income in Greene County
Household Income Brackets in Greene County
With 1,399 households falling in the category, the $50,000 to $74,999 income range is the most frequent in Greene County, accounting for 20.6% of all households. In contrast, only 82 households (1.2%) fall into the $200,000+ income bracket, making it the least populous group.
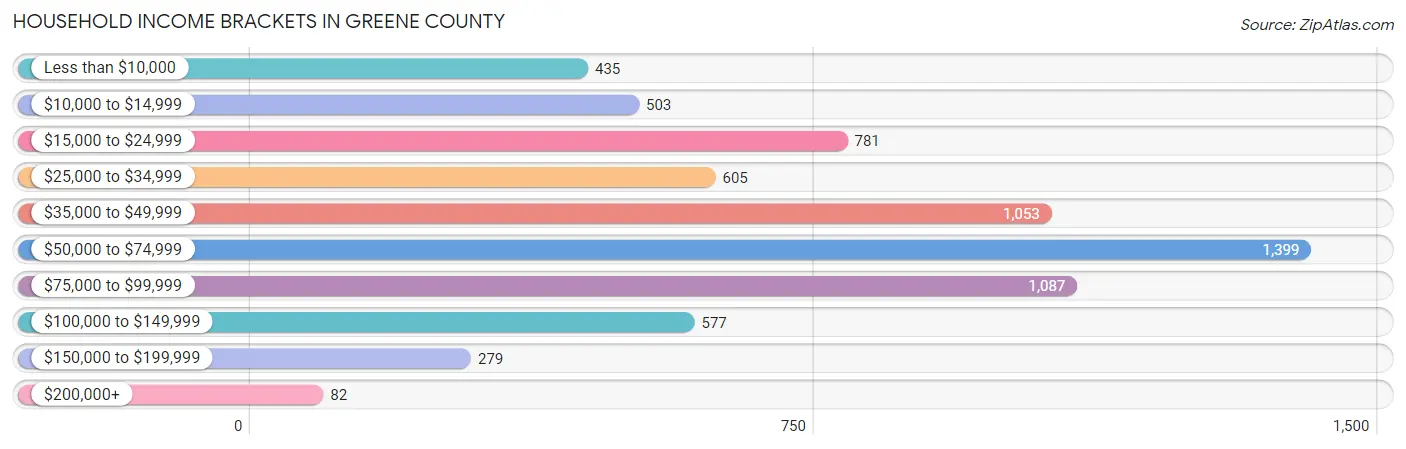
| Income Bracket | # Households | % Households |
| Less than $10,000 | 435 | 6.4% |
| $10,000 to $14,999 | 503 | 7.4% |
| $15,000 to $24,999 | 781 | 11.5% |
| $25,000 to $34,999 | 605 | 8.9% |
| $35,000 to $49,999 | 1,053 | 15.5% |
| $50,000 to $74,999 | 1,399 | 20.6% |
| $75,000 to $99,999 | 1,087 | 16.0% |
| $100,000 to $149,999 | 577 | 8.5% |
| $150,000 to $199,999 | 279 | 4.1% |
| $200,000+ | 82 | 1.2% |
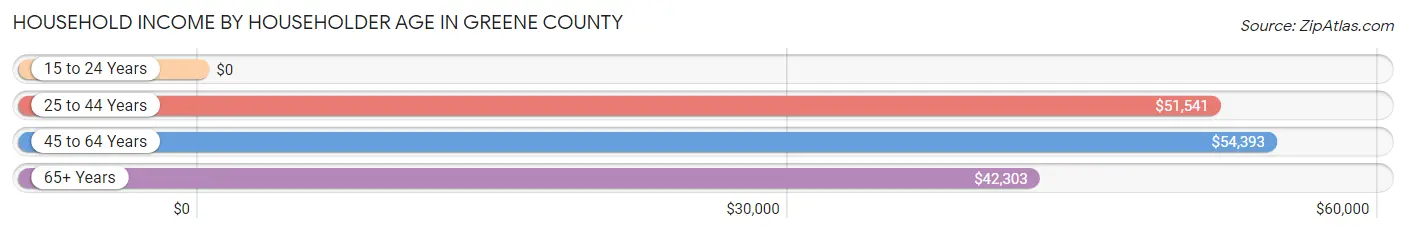
Household Income by Householder Age in Greene County
The median household income in Greene County is $50,320, with the highest median household income of $54,393 found in the 45 to 64 years age bracket for the primary householder. A total of 2,645 households (38.9%) fall into this category. Meanwhile, the 15 to 24 years age bracket for the primary householder has the lowest median household income of $0, with 90 households (1.3%) in this group.
| Income Bracket | # Households | Median Income |
| 15 to 24 Years | 90 (1.3%) | $0 |
| 25 to 44 Years | 1,842 (27.1%) | $51,541 |
| 45 to 64 Years | 2,645 (38.9%) | $54,393 |
| 65+ Years | 2,216 (32.6%) | $42,303 |
| Total | 6,793 (100.0%) | $50,320 |
Poverty in Greene County
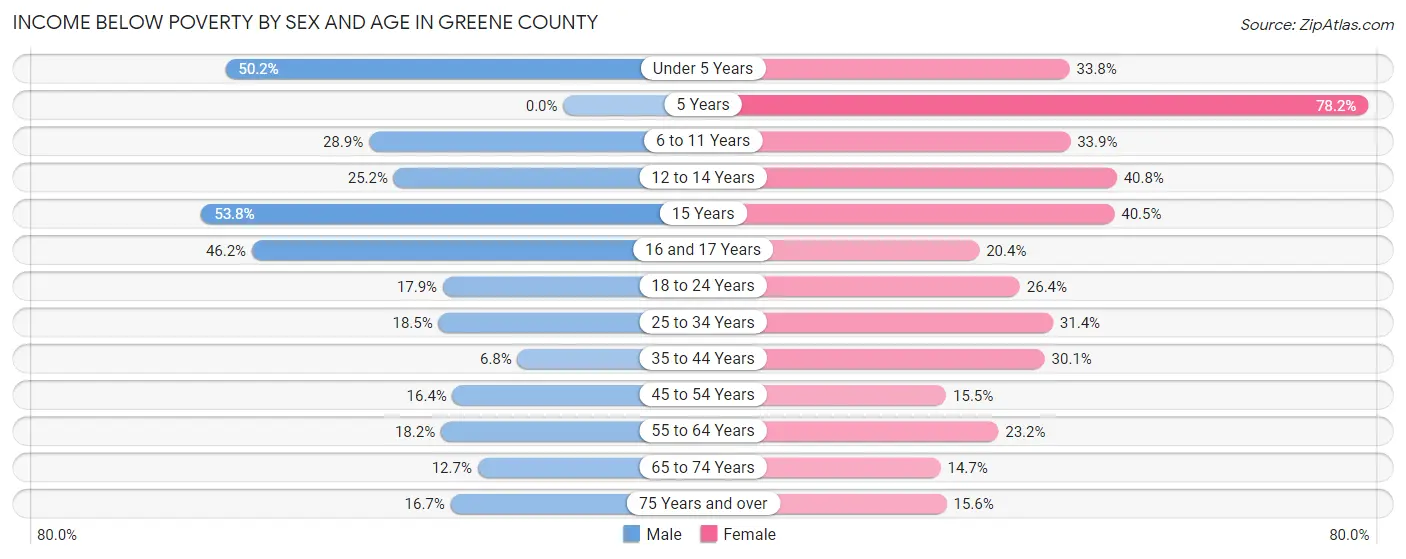
Income Below Poverty by Sex and Age in Greene County
With 20.0% poverty level for males and 25.4% for females among the residents of Greene County, 15 year old males and 5 year old females are the most vulnerable to poverty, with 50 males (53.8%) and 68 females (78.2%) in their respective age groups living below the poverty level.
| Age Bracket | Male | Female |
| Under 5 Years | 282 (50.2%) | 137 (33.8%) |
| 5 Years | 0 (0.0%) | 68 (78.2%) |
| 6 to 11 Years | 226 (28.9%) | 251 (33.9%) |
| 12 to 14 Years | 69 (25.2%) | 100 (40.8%) |
| 15 Years | 50 (53.8%) | 70 (40.5%) |
| 16 and 17 Years | 129 (46.2%) | 30 (20.4%) |
| 18 to 24 Years | 194 (17.9%) | 184 (26.4%) |
| 25 to 34 Years | 215 (18.5%) | 300 (31.4%) |
| 35 to 44 Years | 86 (6.8%) | 309 (30.1%) |
| 45 to 54 Years | 180 (16.4%) | 152 (15.5%) |
| 55 to 64 Years | 233 (18.2%) | 290 (23.2%) |
| 65 to 74 Years | 112 (12.7%) | 153 (14.7%) |
| 75 Years and over | 78 (16.7%) | 118 (15.5%) |
| Total | 1,854 (20.0%) | 2,162 (25.4%) |
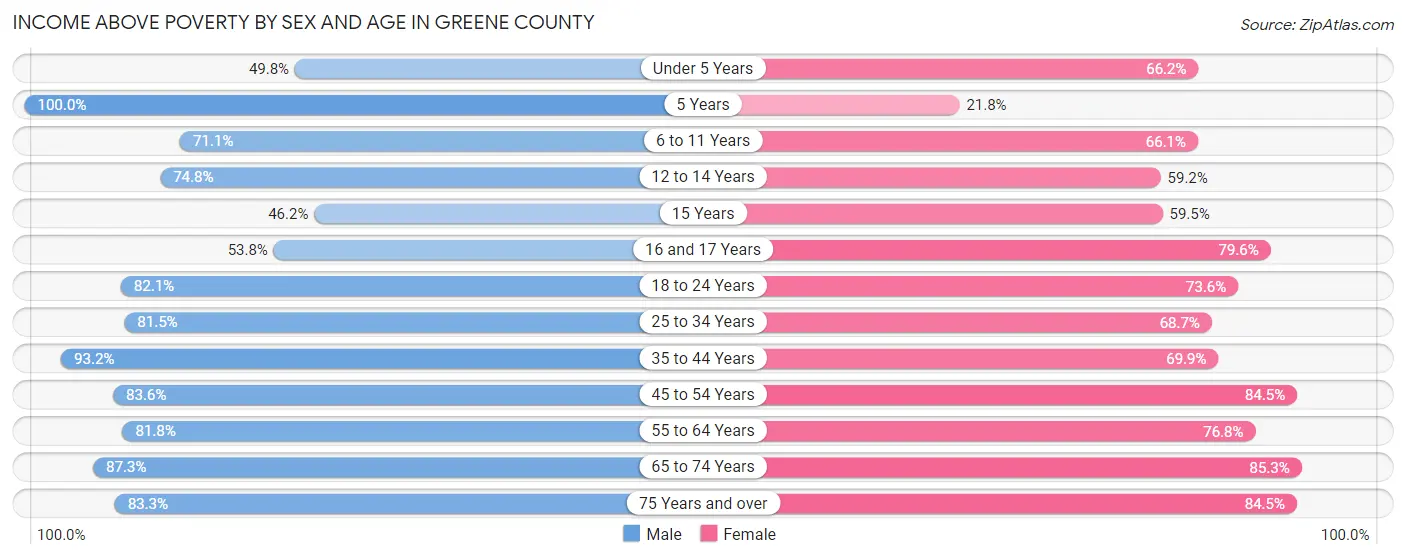
Income Above Poverty by Sex and Age in Greene County
According to the poverty statistics in Greene County, males aged 5 years and females aged 65 to 74 years are the age groups that are most secure financially, with 100.0% of males and 85.3% of females in these age groups living above the poverty line.
| Age Bracket | Male | Female |
| Under 5 Years | 280 (49.8%) | 268 (66.2%) |
| 5 Years | 56 (100.0%) | 19 (21.8%) |
| 6 to 11 Years | 557 (71.1%) | 489 (66.1%) |
| 12 to 14 Years | 205 (74.8%) | 145 (59.2%) |
| 15 Years | 43 (46.2%) | 103 (59.5%) |
| 16 and 17 Years | 150 (53.8%) | 117 (79.6%) |
| 18 to 24 Years | 891 (82.1%) | 512 (73.6%) |
| 25 to 34 Years | 945 (81.5%) | 657 (68.6%) |
| 35 to 44 Years | 1,180 (93.2%) | 717 (69.9%) |
| 45 to 54 Years | 915 (83.6%) | 829 (84.5%) |
| 55 to 64 Years | 1,049 (81.8%) | 958 (76.8%) |
| 65 to 74 Years | 769 (87.3%) | 891 (85.3%) |
| 75 Years and over | 388 (83.3%) | 641 (84.5%) |
| Total | 7,428 (80.0%) | 6,346 (74.6%) |
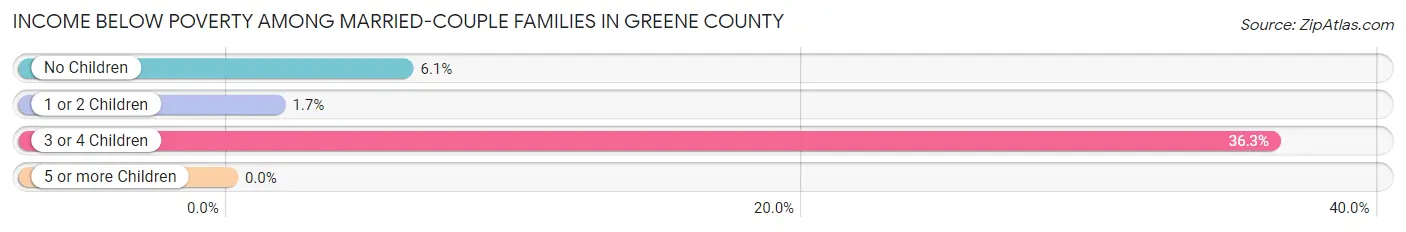
Income Below Poverty Among Married-Couple Families in Greene County
The poverty statistics for married-couple families in Greene County show that 8.4% or 229 of the total 2,744 families live below the poverty line. Families with 3 or 4 children have the highest poverty rate of 36.3%, comprising of 114 families. On the other hand, families with 5 or more children have the lowest poverty rate of 0.0%, which includes 0 families.
| Children | Above Poverty | Below Poverty |
| No Children | 1,583 (93.9%) | 103 (6.1%) |
| 1 or 2 Children | 715 (98.4%) | 12 (1.7%) |
| 3 or 4 Children | 200 (63.7%) | 114 (36.3%) |
| 5 or more Children | 17 (100.0%) | 0 (0.0%) |
| Total | 2,515 (91.6%) | 229 (8.4%) |
Income Below Poverty Among Single-Parent Households in Greene County
According to the poverty data in Greene County, 37.1% or 101 single-father households and 29.7% or 370 single-mother households are living below the poverty line. Among single-father households, those with 1 or 2 children have the highest poverty rate, with 67 households (61.5%) experiencing poverty. Likewise, among single-mother households, those with 3 or 4 children have the highest poverty rate, with 116 households (78.9%) falling below the poverty line.
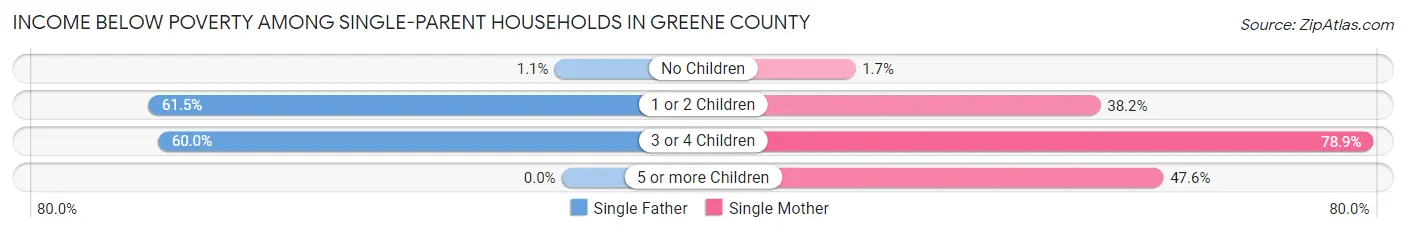
| Children | Single Father | Single Mother |
| No Children | 1 (1.1%) | 8 (1.7%) |
| 1 or 2 Children | 67 (61.5%) | 226 (38.2%) |
| 3 or 4 Children | 33 (60.0%) | 116 (78.9%) |
| 5 or more Children | 0 (0.0%) | 20 (47.6%) |
| Total | 101 (37.1%) | 370 (29.7%) |
Income Below Poverty Among Married-Couple vs Single-Parent Households in Greene County
The poverty data for Greene County shows that 229 of the married-couple family households (8.4%) and 471 of the single-parent households (31.1%) are living below the poverty level. Within the married-couple family households, those with 3 or 4 children have the highest poverty rate, with 114 households (36.3%) falling below the poverty line. Among the single-parent households, those with 3 or 4 children have the highest poverty rate, with 149 household (73.8%) living below poverty.
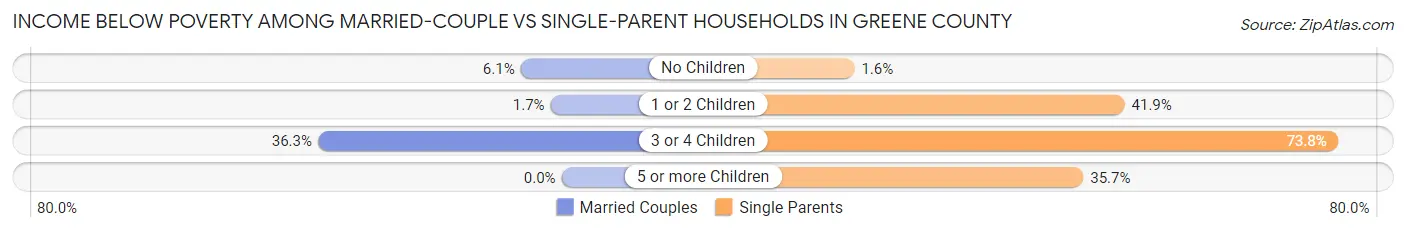
| Children | Married-Couple Families | Single-Parent Households |
| No Children | 103 (6.1%) | 9 (1.6%) |
| 1 or 2 Children | 12 (1.7%) | 293 (41.9%) |
| 3 or 4 Children | 114 (36.3%) | 149 (73.8%) |
| 5 or more Children | 0 (0.0%) | 20 (35.7%) |
| Total | 229 (8.4%) | 471 (31.1%) |
Race in Greene County
The most populous races in Greene County are White / Caucasian (10,428 | 51.1%), Black / African American (6,591 | 32.3%), and Hispanic or Latino (3,243 | 15.9%).
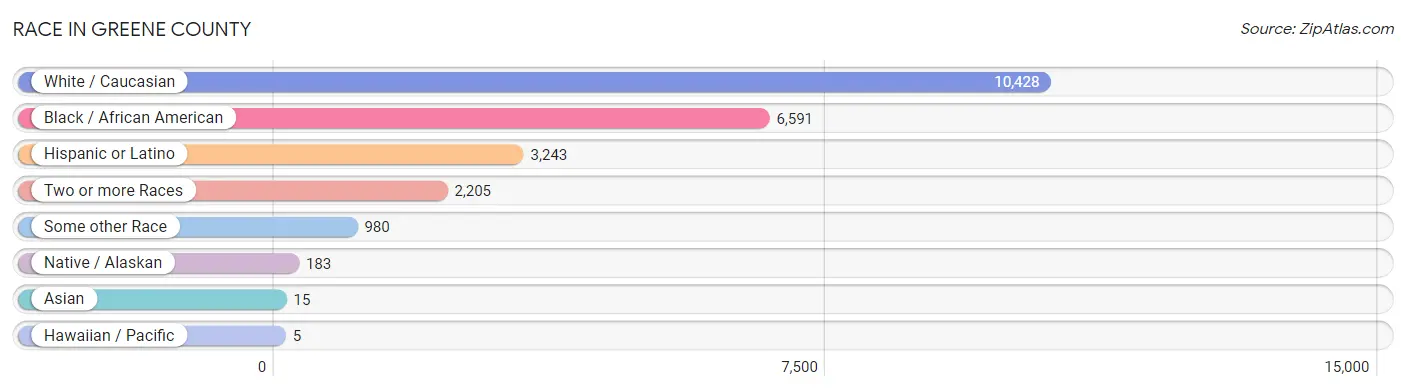
| Race | # Population | % Population |
| Asian | 15 | 0.1% |
| Black / African American | 6,591 | 32.3% |
| Hawaiian / Pacific | 5 | 0.0% |
| Hispanic or Latino | 3,243 | 15.9% |
| Native / Alaskan | 183 | 0.9% |
| White / Caucasian | 10,428 | 51.1% |
| Two or more Races | 2,205 | 10.8% |
| Some other Race | 980 | 4.8% |
| Total | 20,407 | 100.0% |
Ancestry in Greene County
The most populous ancestries reported in Greene County are Mexican (2,690 | 13.2%), English (2,227 | 10.9%), American (1,951 | 9.6%), Irish (1,001 | 4.9%), and Subsaharan African (811 | 4.0%), together accounting for 42.5% of all Greene County residents.
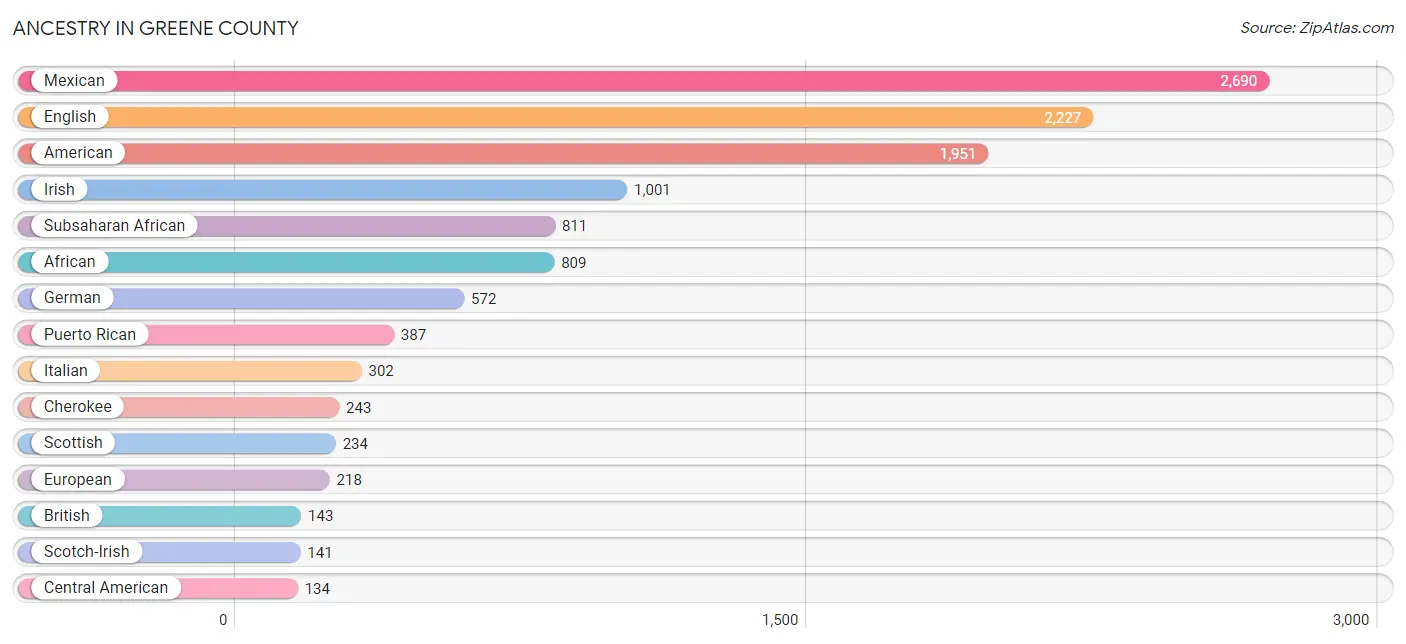
| Ancestry | # Population | % Population |
| African | 809 | 4.0% |
| American | 1,951 | 9.6% |
| Apache | 43 | 0.2% |
| Arab | 5 | 0.0% |
| Australian | 6 | 0.0% |
| Austrian | 50 | 0.3% |
| Bhutanese | 4 | 0.0% |
| Blackfeet | 129 | 0.6% |
| British | 143 | 0.7% |
| Burmese | 58 | 0.3% |
| Central American | 134 | 0.7% |
| Cherokee | 243 | 1.2% |
| Costa Rican | 41 | 0.2% |
| Cuban | 6 | 0.0% |
| Danish | 11 | 0.1% |
| Dominican | 1 | 0.0% |
| Dutch | 26 | 0.1% |
| English | 2,227 | 10.9% |
| European | 218 | 1.1% |
| Fijian | 5 | 0.0% |
| French | 115 | 0.6% |
| French Canadian | 42 | 0.2% |
| German | 572 | 2.8% |
| Greek | 27 | 0.1% |
| Guatemalan | 42 | 0.2% |
| Haitian | 18 | 0.1% |
| Honduran | 37 | 0.2% |
| Hungarian | 10 | 0.1% |
| Irish | 1,001 | 4.9% |
| Italian | 302 | 1.5% |
| Jamaican | 8 | 0.0% |
| Japanese | 5 | 0.0% |
| Korean | 76 | 0.4% |
| Lumbee | 20 | 0.1% |
| Mexican | 2,690 | 13.2% |
| Mexican American Indian | 32 | 0.2% |
| Moroccan | 5 | 0.0% |
| Northern European | 12 | 0.1% |
| Norwegian | 10 | 0.1% |
| Pakistani | 63 | 0.3% |
| Polish | 73 | 0.4% |
| Portuguese | 47 | 0.2% |
| Puerto Rican | 387 | 1.9% |
| Russian | 3 | 0.0% |
| Salvadoran | 14 | 0.1% |
| Scandinavian | 29 | 0.1% |
| Scotch-Irish | 141 | 0.7% |
| Scottish | 234 | 1.1% |
| Slavic | 99 | 0.5% |
| South African | 2 | 0.0% |
| South American | 11 | 0.1% |
| Subsaharan African | 811 | 4.0% |
| Swedish | 75 | 0.4% |
| Swiss | 31 | 0.2% |
| Trinidadian and Tobagonian | 5 | 0.0% |
| Ukrainian | 1 | 0.0% |
| Venezuelan | 11 | 0.1% |
| Welsh | 5 | 0.0% |
| West Indian | 6 | 0.0% | View All 59 Rows |
Immigrants in Greene County
The most numerous immigrant groups reported in Greene County came from Latin America (1,413 | 6.9%), Central America (1,393 | 6.8%), Mexico (1,317 | 6.5%), Guatemala (37 | 0.2%), and Europe (33 | 0.2%), together accounting for 20.5% of all Greene County residents.
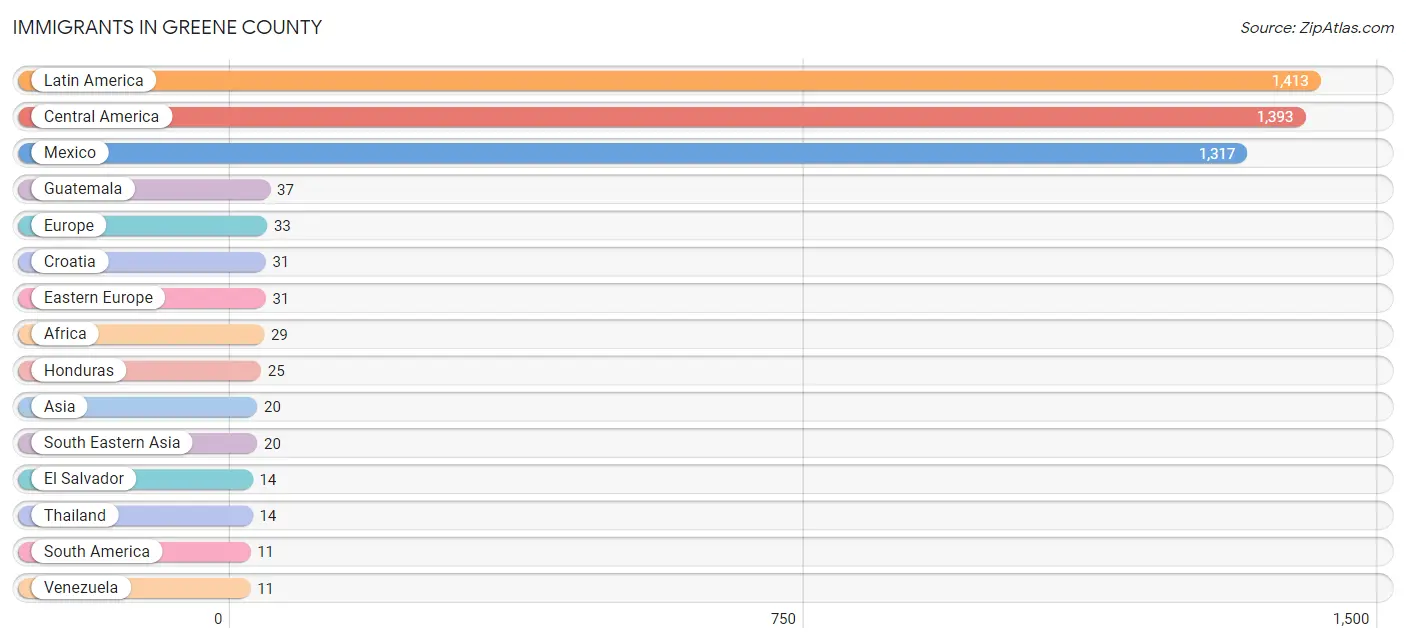
| Immigration Origin | # Population | % Population |
| Africa | 29 | 0.1% |
| Asia | 20 | 0.1% |
| Caribbean | 9 | 0.0% |
| Central America | 1,393 | 6.8% |
| Croatia | 31 | 0.2% |
| Dominican Republic | 1 | 0.0% |
| Eastern Europe | 31 | 0.2% |
| El Salvador | 14 | 0.1% |
| Europe | 33 | 0.2% |
| Germany | 2 | 0.0% |
| Guatemala | 37 | 0.2% |
| Honduras | 25 | 0.1% |
| Jamaica | 8 | 0.0% |
| Latin America | 1,413 | 6.9% |
| Malaysia | 1 | 0.0% |
| Mexico | 1,317 | 6.5% |
| Philippines | 5 | 0.0% |
| South Africa | 2 | 0.0% |
| South America | 11 | 0.1% |
| South Eastern Asia | 20 | 0.1% |
| Thailand | 14 | 0.1% |
| Venezuela | 11 | 0.1% |
| Western Europe | 2 | 0.0% | View All 23 Rows |
Sex and Age in Greene County
Sex and Age in Greene County
The most populous age groups in Greene County are 35 to 39 Years (1,055 | 9.0%) for men and 55 to 59 Years (693 | 8.0%) for women.
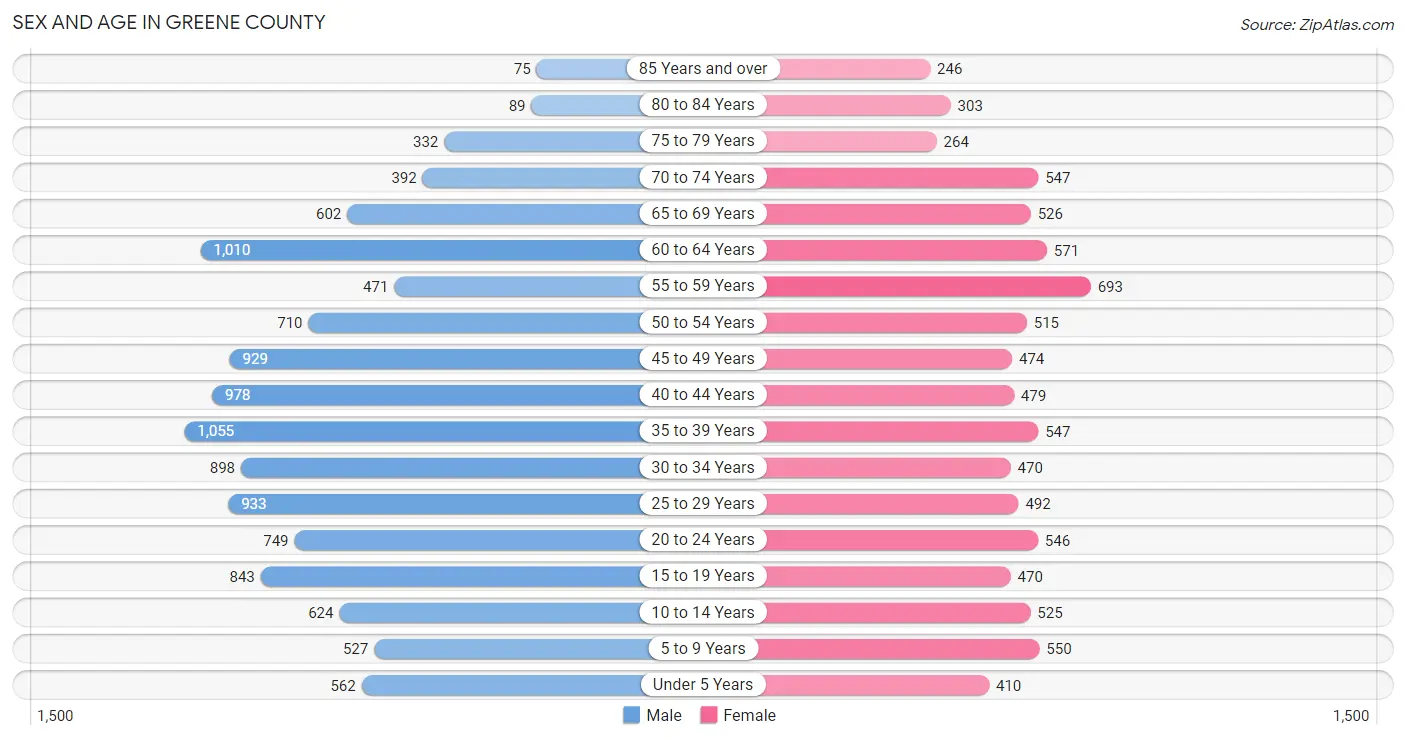
| Age Bracket | Male | Female |
| Under 5 Years | 562 (4.8%) | 410 (4.8%) |
| 5 to 9 Years | 527 (4.5%) | 550 (6.4%) |
| 10 to 14 Years | 624 (5.3%) | 525 (6.1%) |
| 15 to 19 Years | 843 (7.2%) | 470 (5.4%) |
| 20 to 24 Years | 749 (6.4%) | 546 (6.3%) |
| 25 to 29 Years | 933 (7.9%) | 492 (5.7%) |
| 30 to 34 Years | 898 (7.6%) | 470 (5.4%) |
| 35 to 39 Years | 1,055 (9.0%) | 547 (6.3%) |
| 40 to 44 Years | 978 (8.3%) | 479 (5.6%) |
| 45 to 49 Years | 929 (7.9%) | 474 (5.5%) |
| 50 to 54 Years | 710 (6.0%) | 515 (6.0%) |
| 55 to 59 Years | 471 (4.0%) | 693 (8.0%) |
| 60 to 64 Years | 1,010 (8.6%) | 571 (6.6%) |
| 65 to 69 Years | 602 (5.1%) | 526 (6.1%) |
| 70 to 74 Years | 392 (3.3%) | 547 (6.3%) |
| 75 to 79 Years | 332 (2.8%) | 264 (3.1%) |
| 80 to 84 Years | 89 (0.8%) | 303 (3.5%) |
| 85 Years and over | 75 (0.6%) | 246 (2.9%) |
| Total | 11,779 (100.0%) | 8,628 (100.0%) |
Families and Households in Greene County
Median Family Size in Greene County
The median family size in Greene County is 3.30 persons per family, with single female/mother families (1,244 | 29.2%) accounting for the largest median family size of 3.8 persons per family. On the other hand, married-couple families (2,744 | 64.4%) represent the smallest median family size with 3.09 persons per family.
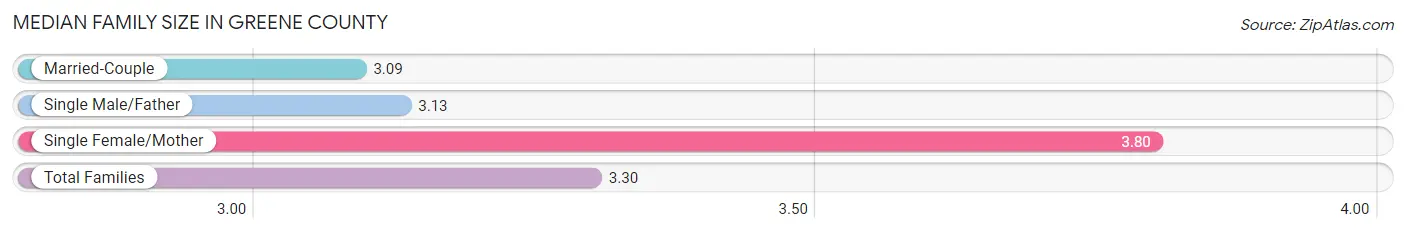
| Family Type | # Families | Family Size |
| Married-Couple | 2,744 (64.4%) | 3.09 |
| Single Male/Father | 272 (6.4%) | 3.13 |
| Single Female/Mother | 1,244 (29.2%) | 3.80 |
| Total Families | 4,260 (100.0%) | 3.30 |
Median Household Size in Greene County
The median household size in Greene County is 2.61 persons per household, with single female/mother households (1,244 | 18.3%) accounting for the largest median household size of 4.04 persons per household. non-family households (2,533 | 37.3%) represent the smallest median household size with 1.26 persons per household.
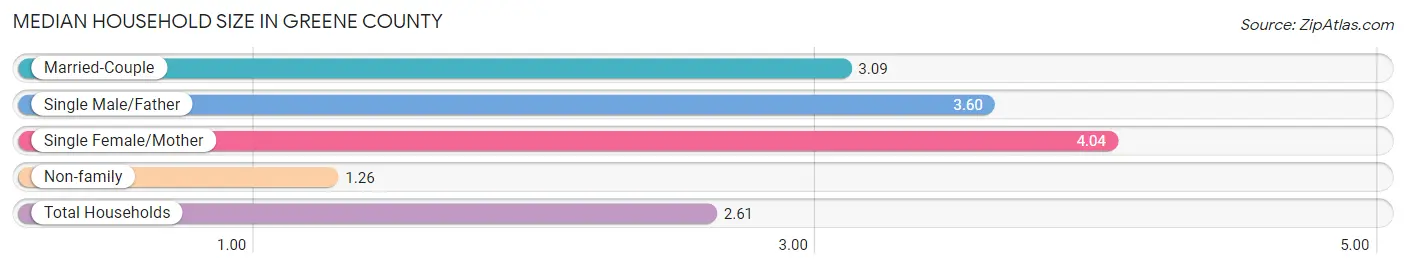
| Household Type | # Households | Household Size |
| Married-Couple | 2,744 (40.4%) | 3.09 |
| Single Male/Father | 272 (4.0%) | 3.60 |
| Single Female/Mother | 1,244 (18.3%) | 4.04 |
| Non-family | 2,533 (37.3%) | 1.26 |
| Total Households | 6,793 (100.0%) | 2.61 |
Household Size by Marriage Status in Greene County
Out of a total of 6,793 households in Greene County, 4,260 (62.7%) are family households, while 2,533 (37.3%) are nonfamily households. The most numerous type of family households are 2-person households, comprising 1,891, and the most common type of nonfamily households are 1-person households, comprising 2,190.
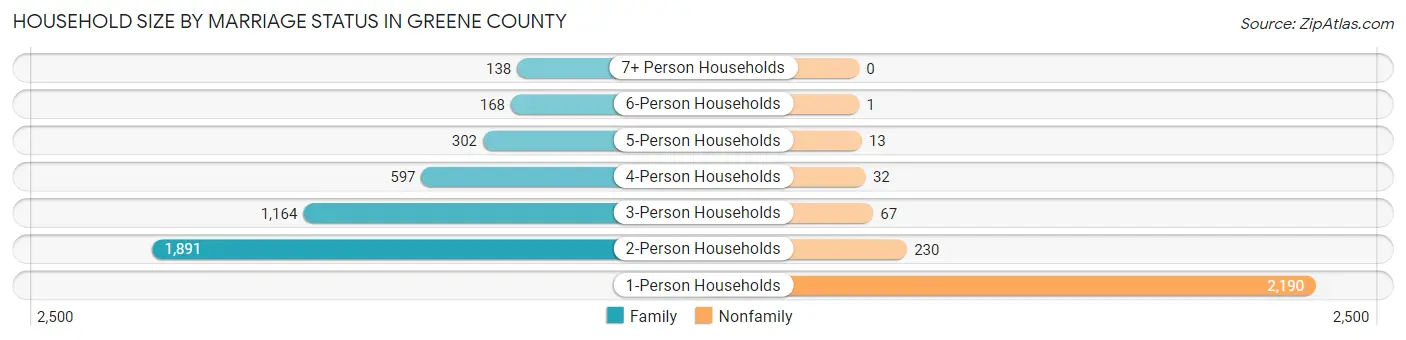
| Household Size | Family Households | Nonfamily Households |
| 1-Person Households | - | 2,190 (32.2%) |
| 2-Person Households | 1,891 (27.8%) | 230 (3.4%) |
| 3-Person Households | 1,164 (17.1%) | 67 (1.0%) |
| 4-Person Households | 597 (8.8%) | 32 (0.5%) |
| 5-Person Households | 302 (4.4%) | 13 (0.2%) |
| 6-Person Households | 168 (2.5%) | 1 (0.0%) |
| 7+ Person Households | 138 (2.0%) | 0 (0.0%) |
| Total | 4,260 (62.7%) | 2,533 (37.3%) |
Female Fertility in Greene County
Fertility by Age in Greene County
Average fertility rate in Greene County is 75.0 births per 1,000 women. Women in the age bracket of 20 to 34 years have the highest fertility rate with 166.0 births per 1,000 women. Women in the age bracket of 20 to 34 years acount for 95.8% of all women with births.
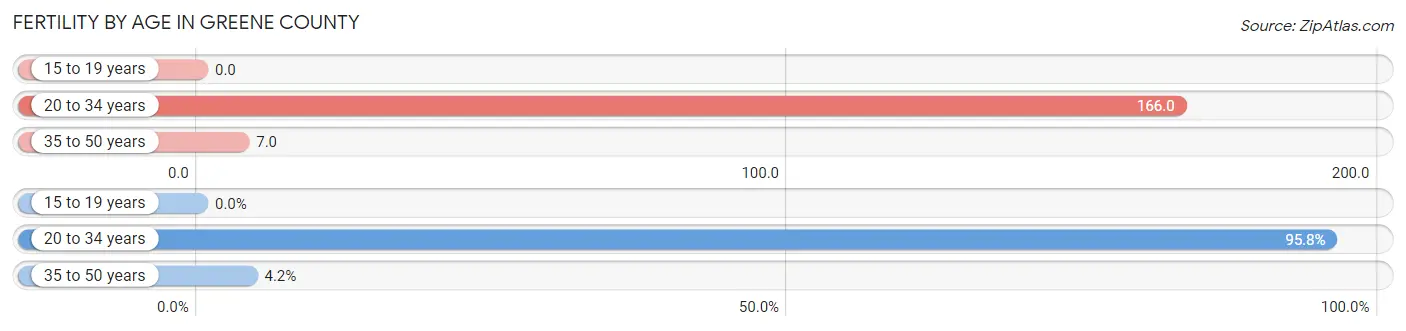
| Age Bracket | Women with Births | Births / 1,000 Women |
| 15 to 19 years | 0 (0.0%) | 0.0 |
| 20 to 34 years | 251 (95.8%) | 166.0 |
| 35 to 50 years | 11 (4.2%) | 7.0 |
| Total | 262 (100.0%) | 75.0 |
Fertility by Age by Marriage Status in Greene County
59.9% of women with births (262) in Greene County are married. The highest percentage of unmarried women with births falls into 20 to 34 years age bracket with 41.8% of them unmarried at the time of birth, while the lowest percentage of unmarried women with births belong to 35 to 50 years age bracket with 0.0% of them unmarried.
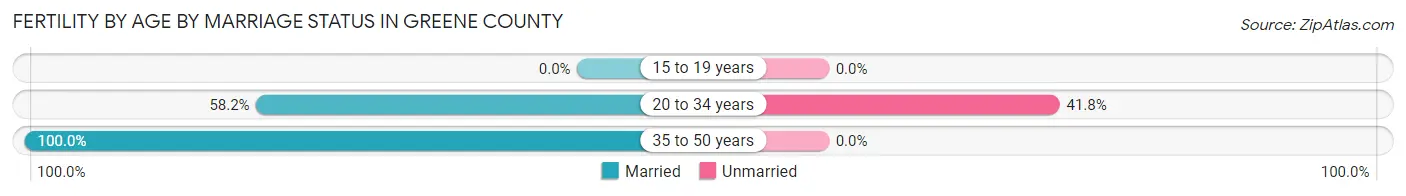
| Age Bracket | Married | Unmarried |
| 15 to 19 years | 0 (0.0%) | 0 (0.0%) |
| 20 to 34 years | 146 (58.2%) | 105 (41.8%) |
| 35 to 50 years | 11 (100.0%) | 0 (0.0%) |
| Total | 157 (59.9%) | 105 (40.1%) |
Fertility by Education in Greene County
Average fertility rate in Greene County is 75.0 births per 1,000 women. Women with the education attainment of high school diploma have the highest fertility rate of 117.0 births per 1,000 women, while women with the education attainment of less than high school have the lowest fertility at 3.0 births per 1,000 women. Women with the education attainment of high school diploma represent 47.7% of all women with births.
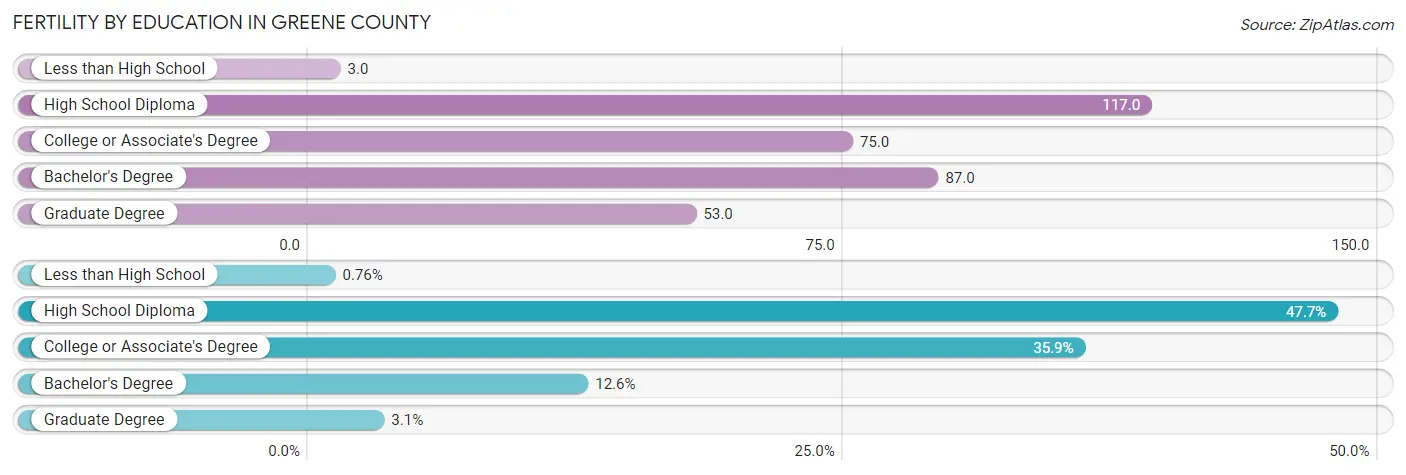
| Educational Attainment | Women with Births | Births / 1,000 Women |
| Less than High School | 2 (0.8%) | 3.0 |
| High School Diploma | 125 (47.7%) | 117.0 |
| College or Associate's Degree | 94 (35.9%) | 75.0 |
| Bachelor's Degree | 33 (12.6%) | 87.0 |
| Graduate Degree | 8 (3.0%) | 53.0 |
| Total | 262 (100.0%) | 75.0 |
Fertility by Education by Marriage Status in Greene County
40.1% of women with births in Greene County are unmarried. Women with the educational attainment of bachelor's degree are most likely to be married with 100.0% of them married at childbirth, while women with the educational attainment of less than high school are least likely to be married with 100.0% of them unmarried at childbirth.
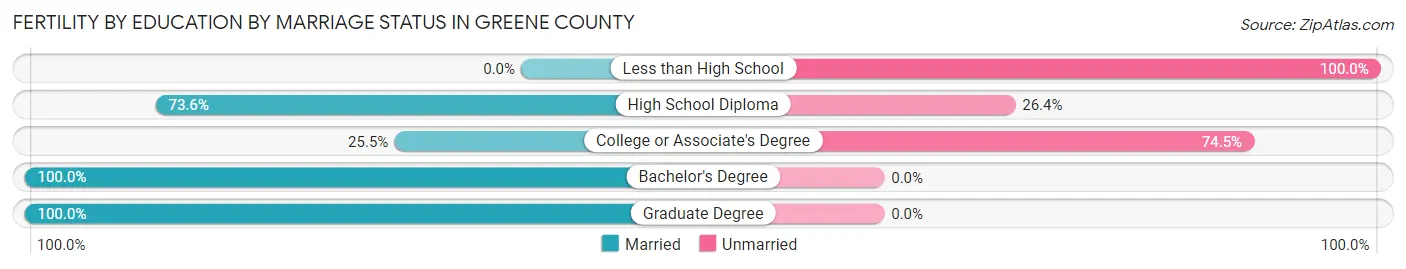
| Educational Attainment | Married | Unmarried |
| Less than High School | 0 (0.0%) | 2 (100.0%) |
| High School Diploma | 92 (73.6%) | 33 (26.4%) |
| College or Associate's Degree | 24 (25.5%) | 70 (74.5%) |
| Bachelor's Degree | 33 (100.0%) | 0 (0.0%) |
| Graduate Degree | 8 (100.0%) | 0 (0.0%) |
| Total | 157 (59.9%) | 105 (40.1%) |
Employment Characteristics in Greene County
Employment by Class of Employer in Greene County
Among the 8,021 employed individuals in Greene County, private company employees (5,406 | 67.4%), state government employees (859 | 10.7%), and local government employees (529 | 6.6%) make up the most common classes of employment.
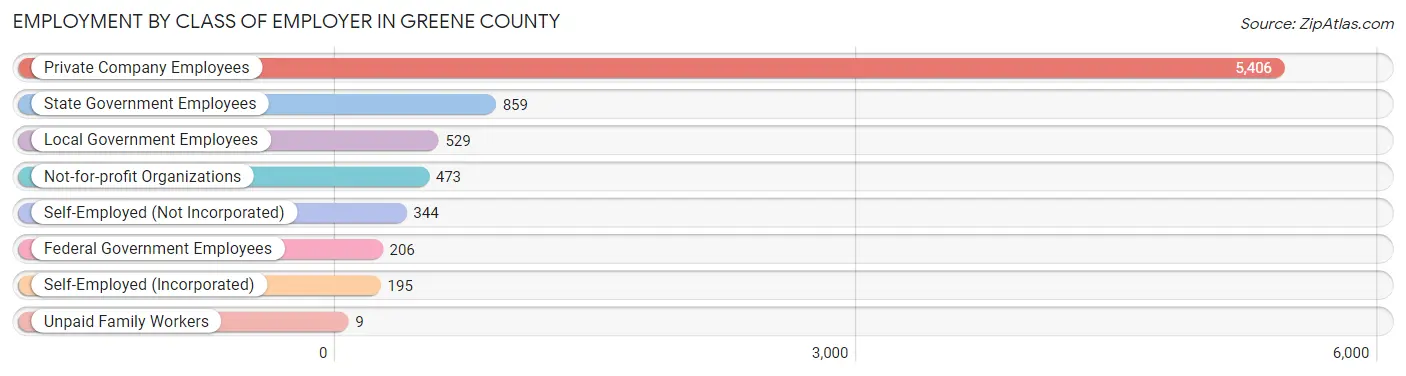
| Employer Class | # Employees | % Employees |
| Private Company Employees | 5,406 | 67.4% |
| Self-Employed (Incorporated) | 195 | 2.4% |
| Self-Employed (Not Incorporated) | 344 | 4.3% |
| Not-for-profit Organizations | 473 | 5.9% |
| Local Government Employees | 529 | 6.6% |
| State Government Employees | 859 | 10.7% |
| Federal Government Employees | 206 | 2.6% |
| Unpaid Family Workers | 9 | 0.1% |
| Total | 8,021 | 100.0% |
Employment Status by Age in Greene County
According to the labor force statistics for Greene County, out of the total population over 16 years of age (16,943), 50.6% or 8,573 individuals are in the labor force, with 5.5% or 472 of them unemployed. The age group with the highest labor force participation rate is 30 to 34 years, with 71.3% or 975 individuals in the labor force. Within the labor force, the 16 to 19 years age range has the highest percentage of unemployed individuals, with 21.3% or 124 of them being unemployed.
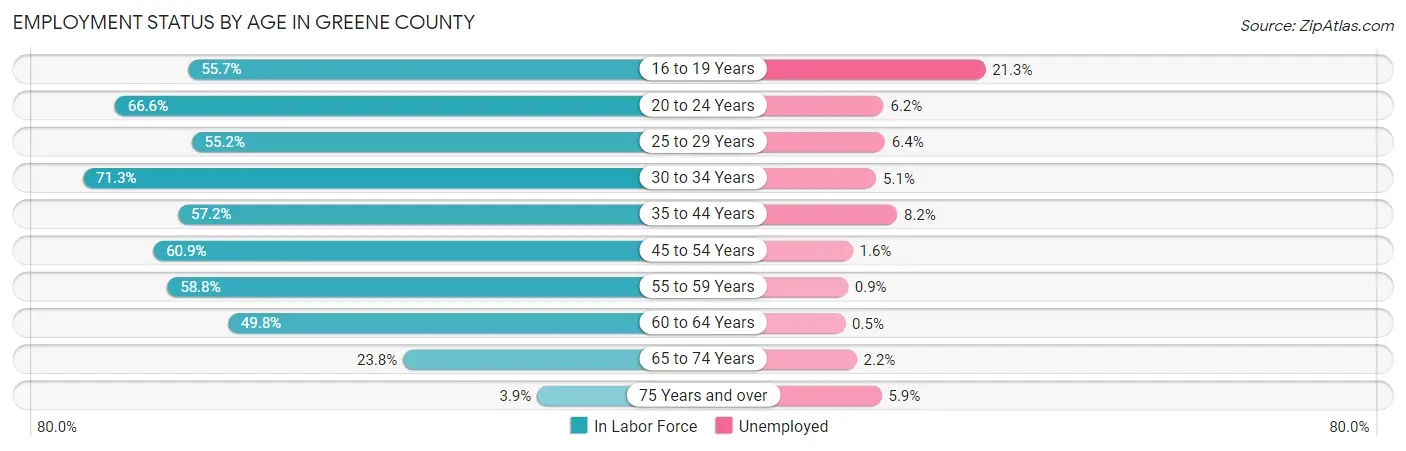
| Age Bracket | In Labor Force | Unemployed |
| 16 to 19 Years | 583 (55.7%) | 124 (21.3%) |
| 20 to 24 Years | 862 (66.6%) | 53 (6.2%) |
| 25 to 29 Years | 787 (55.2%) | 50 (6.4%) |
| 30 to 34 Years | 975 (71.3%) | 50 (5.1%) |
| 35 to 44 Years | 1,750 (57.2%) | 143 (8.2%) |
| 45 to 54 Years | 1,600 (60.9%) | 26 (1.6%) |
| 55 to 59 Years | 684 (58.8%) | 6 (0.9%) |
| 60 to 64 Years | 787 (49.8%) | 4 (0.5%) |
| 65 to 74 Years | 492 (23.8%) | 11 (2.2%) |
| 75 Years and over | 51 (3.9%) | 3 (5.9%) |
| Total | 8,573 (50.6%) | 472 (5.5%) |
Employment Status by Educational Attainment in Greene County
According to labor force statistics for Greene County, 58.7% of individuals (6,589) out of the total population between 25 and 64 years of age (11,225) are in the labor force, with 4.2% or 277 of them being unemployed. The group with the highest labor force participation rate are those with the educational attainment of college / associate degree, with 70.7% or 2,520 individuals in the labor force. Within the labor force, individuals with high school diploma education have the highest percentage of unemployment, with 7.5% or 159 of them being unemployed.
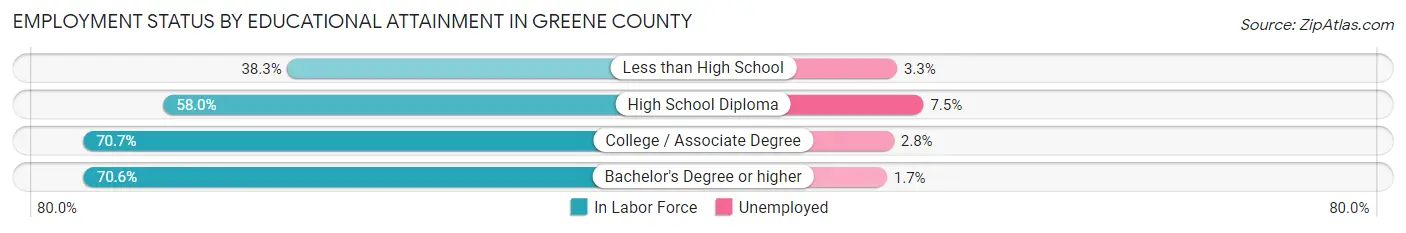
| Educational Attainment | In Labor Force | Unemployed |
| Less than High School | 1,046 (38.3%) | 90 (3.3%) |
| High School Diploma | 2,122 (58.0%) | 274 (7.5%) |
| College / Associate Degree | 2,520 (70.7%) | 100 (2.8%) |
| Bachelor's Degree or higher | 897 (70.6%) | 22 (1.7%) |
| Total | 6,589 (58.7%) | 471 (4.2%) |
Employment Occupations by Sex in Greene County
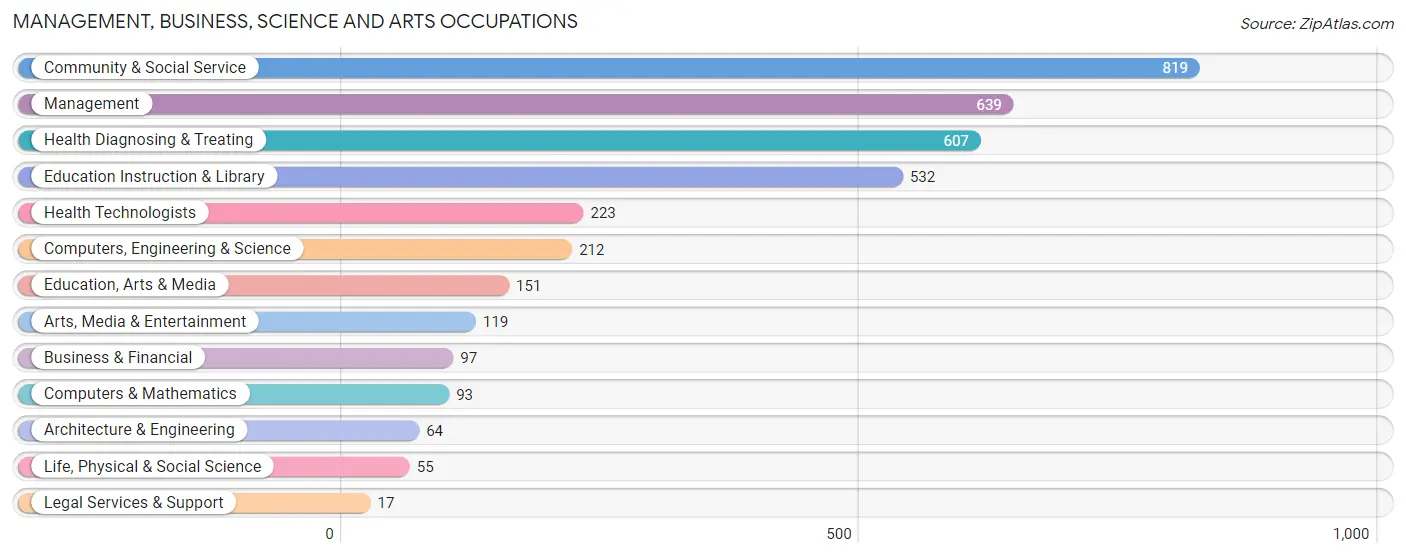
Management, Business, Science and Arts Occupations
The most common Management, Business, Science and Arts occupations in Greene County are Community & Social Service (819 | 10.1%), Management (639 | 7.9%), Health Diagnosing & Treating (607 | 7.5%), Education Instruction & Library (532 | 6.6%), and Health Technologists (223 | 2.8%).
Management, Business, Science and Arts Occupations by Sex
Within the Management, Business, Science and Arts occupations in Greene County, the most male-oriented occupations are Architecture & Engineering (100.0%), Computers & Mathematics (93.5%), and Computers, Engineering & Science (86.3%), while the most female-oriented occupations are Arts, Media & Entertainment (100.0%), Health Technologists (85.7%), and Education Instruction & Library (79.3%).
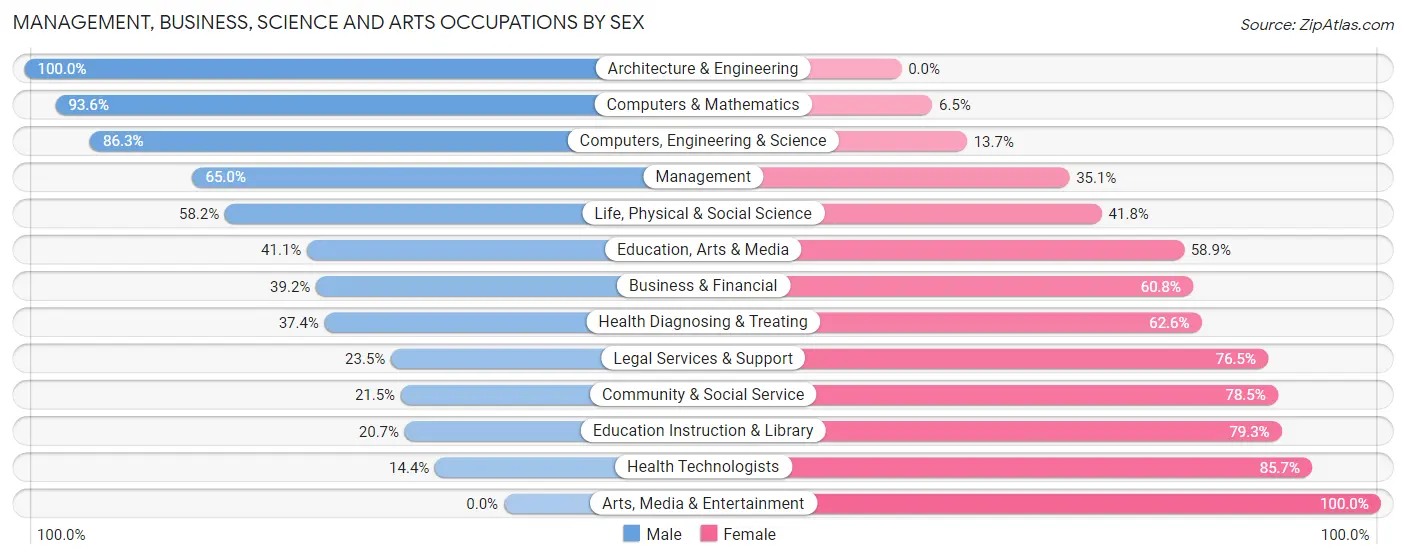
| Occupation | Male | Female |
| Management | 415 (64.9%) | 224 (35.0%) |
| Business & Financial | 38 (39.2%) | 59 (60.8%) |
| Computers, Engineering & Science | 183 (86.3%) | 29 (13.7%) |
| Computers & Mathematics | 87 (93.5%) | 6 (6.5%) |
| Architecture & Engineering | 64 (100.0%) | 0 (0.0%) |
| Life, Physical & Social Science | 32 (58.2%) | 23 (41.8%) |
| Community & Social Service | 176 (21.5%) | 643 (78.5%) |
| Education, Arts & Media | 62 (41.1%) | 89 (58.9%) |
| Legal Services & Support | 4 (23.5%) | 13 (76.5%) |
| Education Instruction & Library | 110 (20.7%) | 422 (79.3%) |
| Arts, Media & Entertainment | 0 (0.0%) | 119 (100.0%) |
| Health Diagnosing & Treating | 227 (37.4%) | 380 (62.6%) |
| Health Technologists | 32 (14.3%) | 191 (85.7%) |
| Total (Category) | 1,039 (43.8%) | 1,335 (56.2%) |
| Total (Overall) | 4,564 (56.4%) | 3,525 (43.6%) |
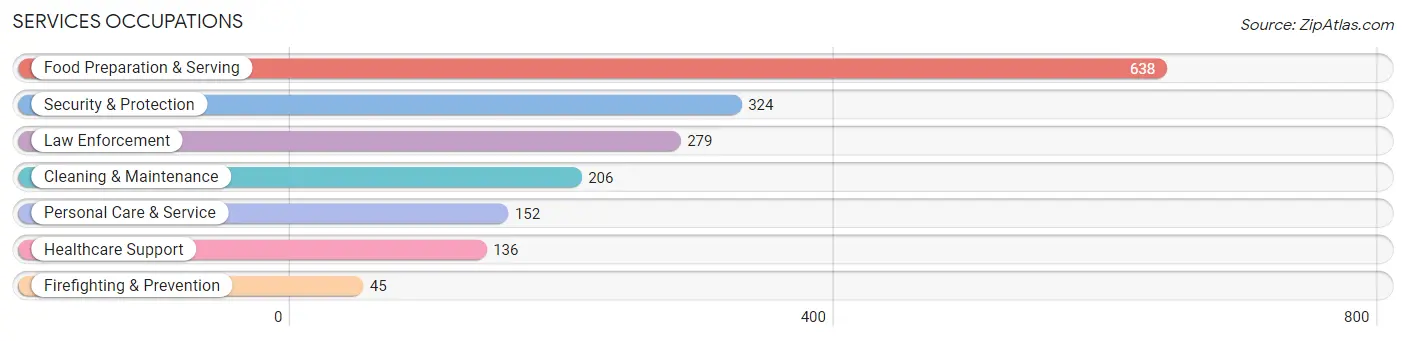
Services Occupations
The most common Services occupations in Greene County are Food Preparation & Serving (638 | 7.9%), Security & Protection (324 | 4.0%), Law Enforcement (279 | 3.5%), Cleaning & Maintenance (206 | 2.5%), and Personal Care & Service (152 | 1.9%).
Services Occupations by Sex
Within the Services occupations in Greene County, the most male-oriented occupations are Firefighting & Prevention (97.8%), Cleaning & Maintenance (68.9%), and Security & Protection (54.3%), while the most female-oriented occupations are Personal Care & Service (89.5%), Healthcare Support (81.6%), and Law Enforcement (52.7%).
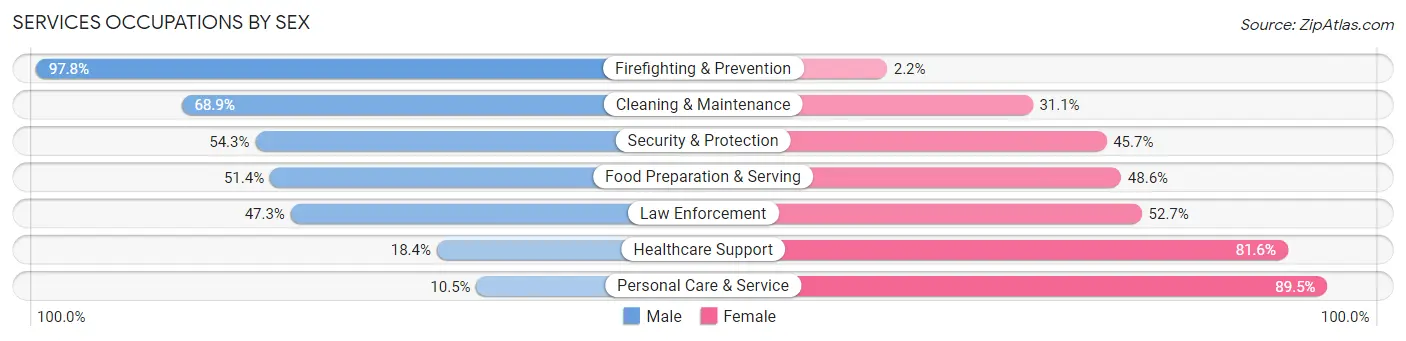
| Occupation | Male | Female |
| Healthcare Support | 25 (18.4%) | 111 (81.6%) |
| Security & Protection | 176 (54.3%) | 148 (45.7%) |
| Firefighting & Prevention | 44 (97.8%) | 1 (2.2%) |
| Law Enforcement | 132 (47.3%) | 147 (52.7%) |
| Food Preparation & Serving | 328 (51.4%) | 310 (48.6%) |
| Cleaning & Maintenance | 142 (68.9%) | 64 (31.1%) |
| Personal Care & Service | 16 (10.5%) | 136 (89.5%) |
| Total (Category) | 687 (47.2%) | 769 (52.8%) |
| Total (Overall) | 4,564 (56.4%) | 3,525 (43.6%) |
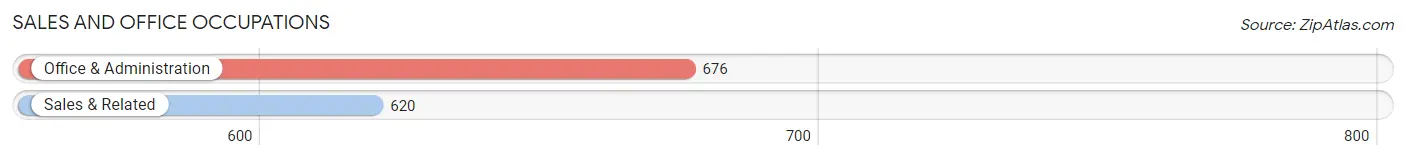
Sales and Office Occupations
The most common Sales and Office occupations in Greene County are Office & Administration (676 | 8.4%), and Sales & Related (620 | 7.7%).
Sales and Office Occupations by Sex
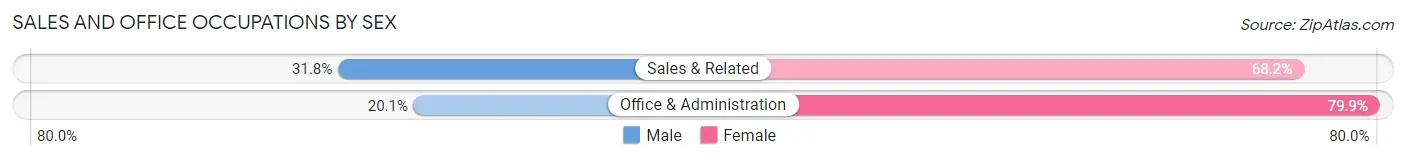
| Occupation | Male | Female |
| Sales & Related | 197 (31.8%) | 423 (68.2%) |
| Office & Administration | 136 (20.1%) | 540 (79.9%) |
| Total (Category) | 333 (25.7%) | 963 (74.3%) |
| Total (Overall) | 4,564 (56.4%) | 3,525 (43.6%) |
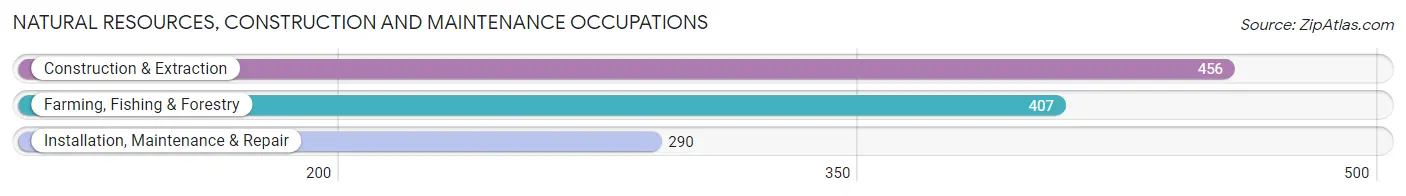
Natural Resources, Construction and Maintenance Occupations
The most common Natural Resources, Construction and Maintenance occupations in Greene County are Construction & Extraction (456 | 5.6%), Farming, Fishing & Forestry (407 | 5.0%), and Installation, Maintenance & Repair (290 | 3.6%).
Natural Resources, Construction and Maintenance Occupations by Sex
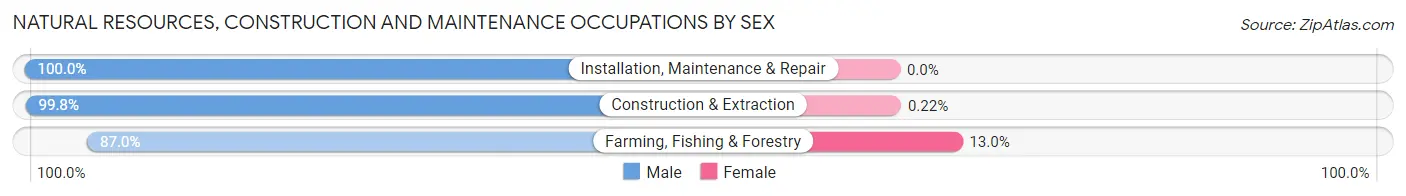
| Occupation | Male | Female |
| Farming, Fishing & Forestry | 354 (87.0%) | 53 (13.0%) |
| Construction & Extraction | 455 (99.8%) | 1 (0.2%) |
| Installation, Maintenance & Repair | 290 (100.0%) | 0 (0.0%) |
| Total (Category) | 1,099 (95.3%) | 54 (4.7%) |
| Total (Overall) | 4,564 (56.4%) | 3,525 (43.6%) |
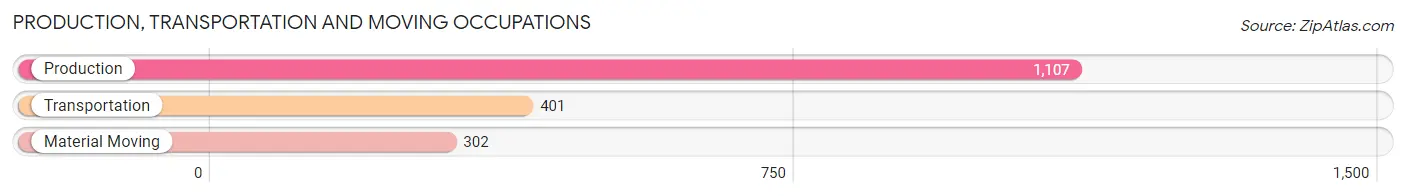
Production, Transportation and Moving Occupations
The most common Production, Transportation and Moving occupations in Greene County are Production (1,107 | 13.7%), Transportation (401 | 5.0%), and Material Moving (302 | 3.7%).
Production, Transportation and Moving Occupations by Sex
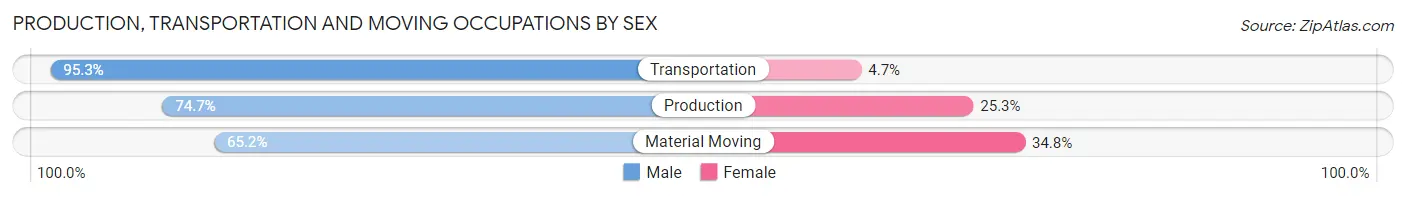
| Occupation | Male | Female |
| Production | 827 (74.7%) | 280 (25.3%) |
| Transportation | 382 (95.3%) | 19 (4.7%) |
| Material Moving | 197 (65.2%) | 105 (34.8%) |
| Total (Category) | 1,406 (77.7%) | 404 (22.3%) |
| Total (Overall) | 4,564 (56.4%) | 3,525 (43.6%) |
Employment Industries by Sex in Greene County
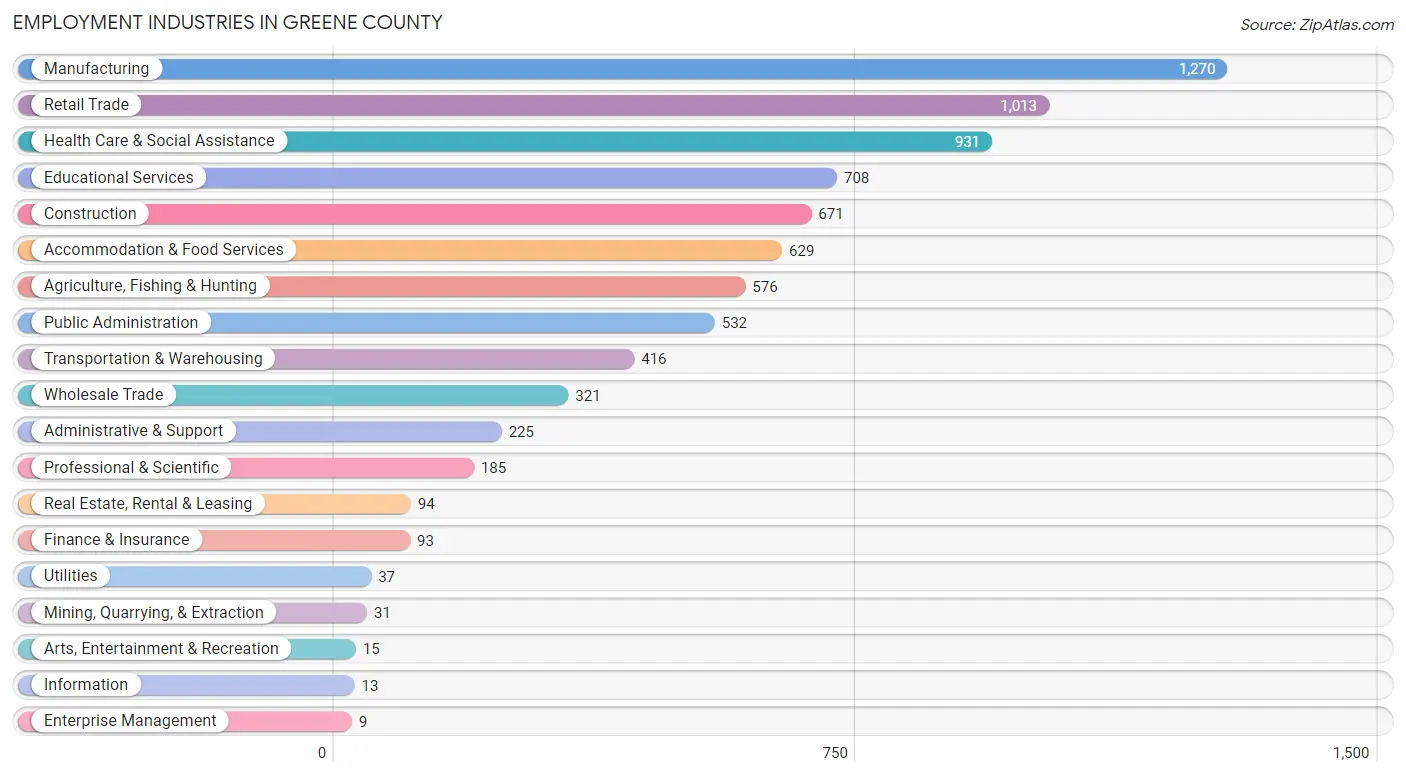
Employment Industries in Greene County
The major employment industries in Greene County include Manufacturing (1,270 | 15.7%), Retail Trade (1,013 | 12.5%), Health Care & Social Assistance (931 | 11.5%), Educational Services (708 | 8.7%), and Construction (671 | 8.3%).
Employment Industries by Sex in Greene County
The Greene County industries that see more men than women are Mining, Quarrying, & Extraction (100.0%), Arts, Entertainment & Recreation (100.0%), and Construction (89.9%), whereas the industries that tend to have a higher number of women are Information (100.0%), Enterprise Management (100.0%), and Health Care & Social Assistance (82.9%).
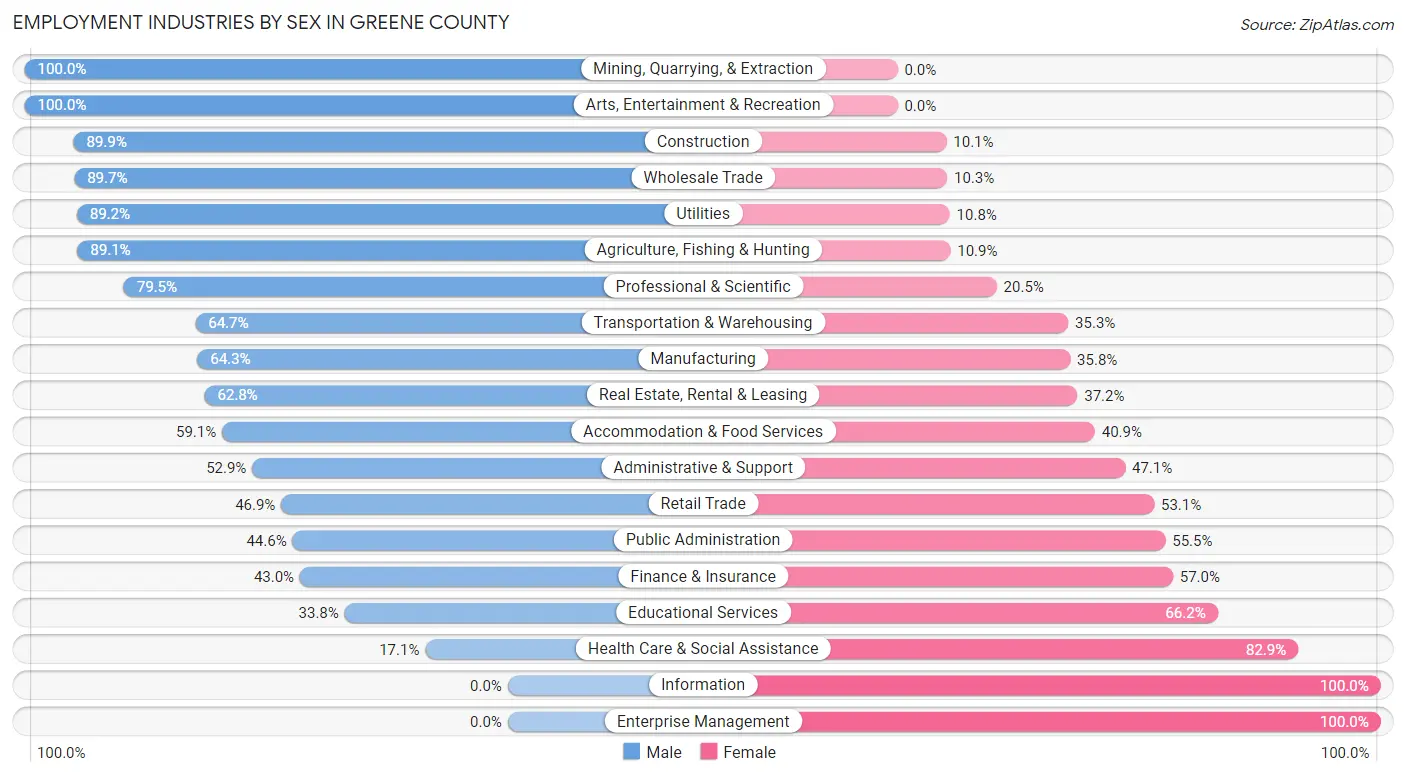
| Industry | Male | Female |
| Agriculture, Fishing & Hunting | 513 (89.1%) | 63 (10.9%) |
| Mining, Quarrying, & Extraction | 31 (100.0%) | 0 (0.0%) |
| Construction | 603 (89.9%) | 68 (10.1%) |
| Manufacturing | 816 (64.2%) | 454 (35.7%) |
| Wholesale Trade | 288 (89.7%) | 33 (10.3%) |
| Retail Trade | 475 (46.9%) | 538 (53.1%) |
| Transportation & Warehousing | 269 (64.7%) | 147 (35.3%) |
| Utilities | 33 (89.2%) | 4 (10.8%) |
| Information | 0 (0.0%) | 13 (100.0%) |
| Finance & Insurance | 40 (43.0%) | 53 (57.0%) |
| Real Estate, Rental & Leasing | 59 (62.8%) | 35 (37.2%) |
| Professional & Scientific | 147 (79.5%) | 38 (20.5%) |
| Enterprise Management | 0 (0.0%) | 9 (100.0%) |
| Administrative & Support | 119 (52.9%) | 106 (47.1%) |
| Educational Services | 239 (33.8%) | 469 (66.2%) |
| Health Care & Social Assistance | 159 (17.1%) | 772 (82.9%) |
| Arts, Entertainment & Recreation | 15 (100.0%) | 0 (0.0%) |
| Accommodation & Food Services | 372 (59.1%) | 257 (40.9%) |
| Public Administration | 237 (44.6%) | 295 (55.4%) |
| Total | 4,564 (56.4%) | 3,525 (43.6%) |
Education in Greene County
School Enrollment in Greene County
The most common levels of schooling among the 4,115 students in Greene County are high school (1,251 | 30.4%), middle school (905 | 22.0%), and elementary school (878 | 21.3%).
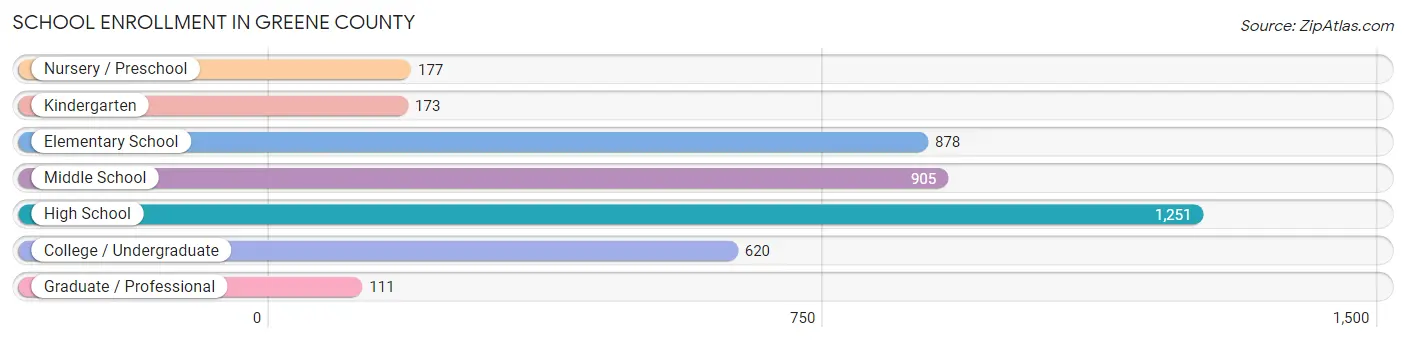
| School Level | # Students | % Students |
| Nursery / Preschool | 177 | 4.3% |
| Kindergarten | 173 | 4.2% |
| Elementary School | 878 | 21.3% |
| Middle School | 905 | 22.0% |
| High School | 1,251 | 30.4% |
| College / Undergraduate | 620 | 15.1% |
| Graduate / Professional | 111 | 2.7% |
| Total | 4,115 | 100.0% |
School Enrollment by Age by Funding Source in Greene County
Out of a total of 4,115 students who are enrolled in schools in Greene County, 374 (9.1%) attend a private institution, while the remaining 3,741 (90.9%) are enrolled in public schools. The age group of 35 years and over has the highest likelihood of being enrolled in private schools, with 98 (32.9% in the age bracket) enrolled. Conversely, the age group of 3 to 4 year olds has the lowest likelihood of being enrolled in a private school, with 125 (100.0% in the age bracket) attending a public institution.
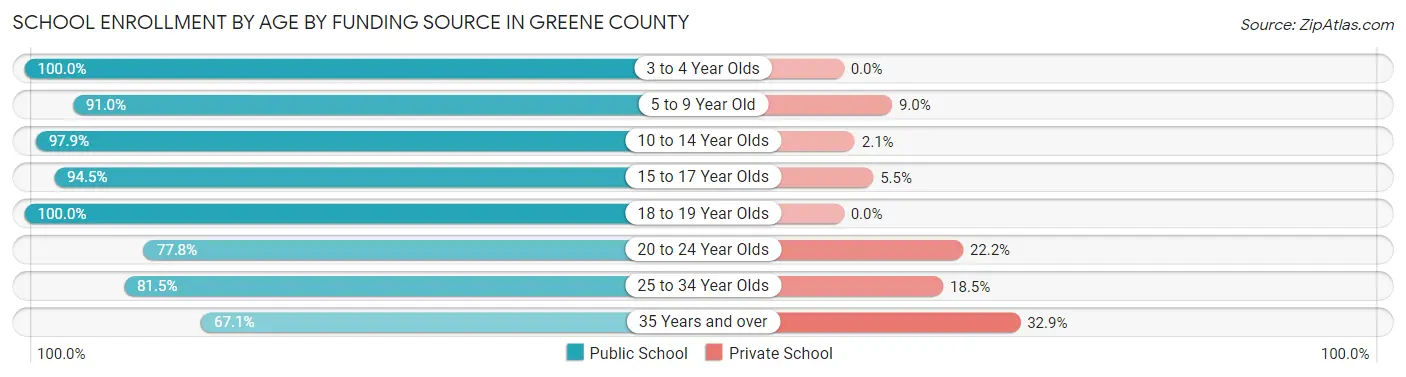
| Age Bracket | Public School | Private School |
| 3 to 4 Year Olds | 125 (100.0%) | 0 (0.0%) |
| 5 to 9 Year Old | 911 (91.0%) | 90 (9.0%) |
| 10 to 14 Year Olds | 1,083 (97.9%) | 23 (2.1%) |
| 15 to 17 Year Olds | 636 (94.5%) | 37 (5.5%) |
| 18 to 19 Year Olds | 300 (100.0%) | 0 (0.0%) |
| 20 to 24 Year Olds | 266 (77.8%) | 76 (22.2%) |
| 25 to 34 Year Olds | 220 (81.5%) | 50 (18.5%) |
| 35 Years and over | 200 (67.1%) | 98 (32.9%) |
| Total | 3,741 (90.9%) | 374 (9.1%) |
Educational Attainment by Field of Study in Greene County
Education (377 | 21.3%), arts & humanities (254 | 14.4%), business (235 | 13.3%), science & technology (188 | 10.6%), and bio, nature & agricultural (147 | 8.3%) are the most common fields of study among 1,768 individuals in Greene County who have obtained a bachelor's degree or higher.
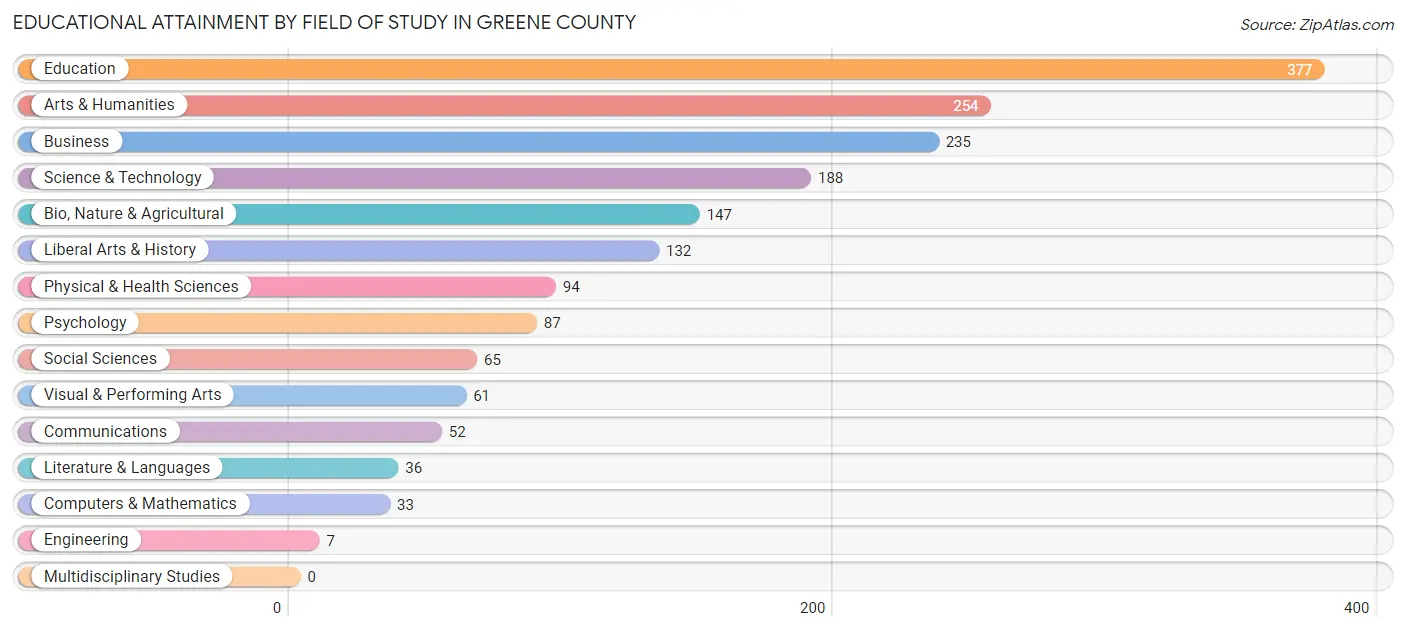
| Field of Study | # Graduates | % Graduates |
| Computers & Mathematics | 33 | 1.9% |
| Bio, Nature & Agricultural | 147 | 8.3% |
| Physical & Health Sciences | 94 | 5.3% |
| Psychology | 87 | 4.9% |
| Social Sciences | 65 | 3.7% |
| Engineering | 7 | 0.4% |
| Multidisciplinary Studies | 0 | 0.0% |
| Science & Technology | 188 | 10.6% |
| Business | 235 | 13.3% |
| Education | 377 | 21.3% |
| Literature & Languages | 36 | 2.0% |
| Liberal Arts & History | 132 | 7.5% |
| Visual & Performing Arts | 61 | 3.5% |
| Communications | 52 | 2.9% |
| Arts & Humanities | 254 | 14.4% |
| Total | 1,768 | 100.0% |
Transportation & Commute in Greene County
Vehicle Availability by Sex in Greene County
The most prevalent vehicle ownership categories in Greene County are males with 2 vehicles (1,764, accounting for 39.1%) and females with 2 vehicles (1,069, making up 51.0%).
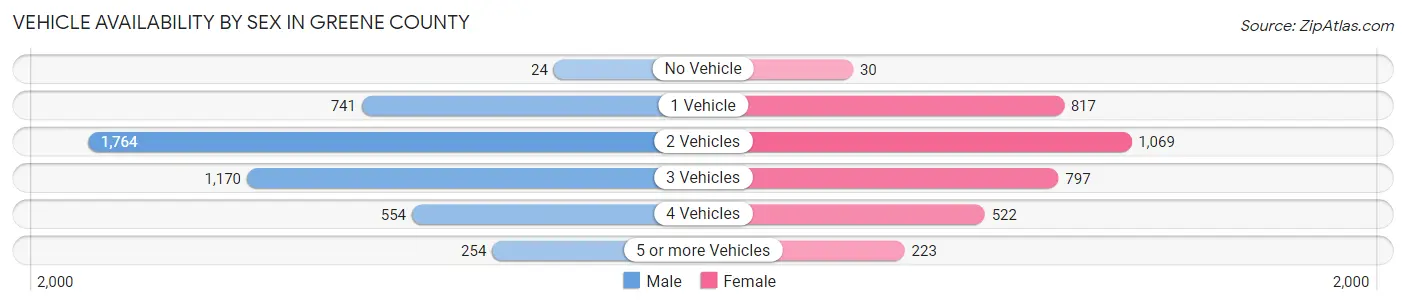
| Vehicles Available | Male | Female |
| No Vehicle | 24 (0.5%) | 30 (0.9%) |
| 1 Vehicle | 741 (16.4%) | 817 (23.6%) |
| 2 Vehicles | 1,764 (39.1%) | 1,069 (30.9%) |
| 3 Vehicles | 1,170 (26.0%) | 797 (23.1%) |
| 4 Vehicles | 554 (12.3%) | 522 (15.1%) |
| 5 or more Vehicles | 254 (5.6%) | 223 (6.5%) |
| Total | 4,507 (100.0%) | 3,458 (100.0%) |
Commute Time in Greene County
The most frequently occuring commute durations in Greene County are 30 to 34 minutes (1,219 commuters, 15.8%), 15 to 19 minutes (1,216 commuters, 15.8%), and 20 to 24 minutes (974 commuters, 12.7%).
| Commute Time | # Commuters | % Commuters |
| Less than 5 Minutes | 322 | 4.2% |
| 5 to 9 Minutes | 713 | 9.3% |
| 10 to 14 Minutes | 927 | 12.0% |
| 15 to 19 Minutes | 1,216 | 15.8% |
| 20 to 24 Minutes | 974 | 12.7% |
| 25 to 29 Minutes | 490 | 6.4% |
| 30 to 34 Minutes | 1,219 | 15.8% |
| 35 to 39 Minutes | 376 | 4.9% |
| 40 to 44 Minutes | 371 | 4.8% |
| 45 to 59 Minutes | 572 | 7.4% |
| 60 to 89 Minutes | 229 | 3.0% |
| 90 or more Minutes | 291 | 3.8% |
Commute Time by Sex in Greene County
The most common commute times in Greene County are 30 to 34 minutes (727 commuters, 16.7%) for males and 15 to 19 minutes (565 commuters, 16.9%) for females.
| Commute Time | Male | Female |
| Less than 5 Minutes | 136 (3.1%) | 186 (5.6%) |
| 5 to 9 Minutes | 430 (9.9%) | 283 (8.4%) |
| 10 to 14 Minutes | 500 (11.5%) | 427 (12.7%) |
| 15 to 19 Minutes | 651 (15.0%) | 565 (16.9%) |
| 20 to 24 Minutes | 505 (11.6%) | 469 (14.0%) |
| 25 to 29 Minutes | 305 (7.0%) | 185 (5.5%) |
| 30 to 34 Minutes | 727 (16.7%) | 492 (14.7%) |
| 35 to 39 Minutes | 174 (4.0%) | 202 (6.0%) |
| 40 to 44 Minutes | 212 (4.9%) | 159 (4.7%) |
| 45 to 59 Minutes | 430 (9.9%) | 142 (4.2%) |
| 60 to 89 Minutes | 184 (4.2%) | 45 (1.3%) |
| 90 or more Minutes | 92 (2.1%) | 199 (5.9%) |
Time of Departure to Work by Sex in Greene County
The most frequent times of departure to work in Greene County are 6:30 AM to 6:59 AM (625, 14.4%) for males and 7:00 AM to 7:29 AM (742, 22.1%) for females.
| Time of Departure | Male | Female |
| 12:00 AM to 4:59 AM | 273 (6.3%) | 69 (2.1%) |
| 5:00 AM to 5:29 AM | 159 (3.7%) | 102 (3.0%) |
| 5:30 AM to 5:59 AM | 238 (5.5%) | 172 (5.1%) |
| 6:00 AM to 6:29 AM | 557 (12.8%) | 229 (6.8%) |
| 6:30 AM to 6:59 AM | 625 (14.4%) | 415 (12.4%) |
| 7:00 AM to 7:29 AM | 583 (13.4%) | 742 (22.1%) |
| 7:30 AM to 7:59 AM | 343 (7.9%) | 447 (13.3%) |
| 8:00 AM to 8:29 AM | 610 (14.0%) | 381 (11.4%) |
| 8:30 AM to 8:59 AM | 204 (4.7%) | 51 (1.5%) |
| 9:00 AM to 9:59 AM | 36 (0.8%) | 234 (7.0%) |
| 10:00 AM to 10:59 AM | 6 (0.1%) | 46 (1.4%) |
| 11:00 AM to 11:59 AM | 0 (0.0%) | 52 (1.5%) |
| 12:00 PM to 3:59 PM | 499 (11.5%) | 185 (5.5%) |
| 4:00 PM to 11:59 PM | 213 (4.9%) | 229 (6.8%) |
| Total | 4,346 (100.0%) | 3,354 (100.0%) |
Housing Occupancy in Greene County
Occupancy by Ownership in Greene County
Of the total 6,793 dwellings in Greene County, owner-occupied units account for 4,555 (67.0%), while renter-occupied units make up 2,238 (33.0%).
| Occupancy | # Housing Units | % Housing Units |
| Owner Occupied Housing Units | 4,555 | 67.0% |
| Renter-Occupied Housing Units | 2,238 | 33.0% |
| Total Occupied Housing Units | 6,793 | 100.0% |
Occupancy by Household Size in Greene County
| Household Size | # Housing Units | % Housing Units |
| 1-Person Household | 2,190 | 32.2% |
| 2-Person Household | 2,121 | 31.2% |
| 3-Person Household | 1,231 | 18.1% |
| 4+ Person Household | 1,251 | 18.4% |
| Total Housing Units | 6,793 | 100.0% |
Occupancy by Ownership by Household Size in Greene County
| Household Size | Owner-occupied | Renter-occupied |
| 1-Person Household | 1,510 (69.0%) | 680 (31.0%) |
| 2-Person Household | 1,530 (72.1%) | 591 (27.9%) |
| 3-Person Household | 667 (54.2%) | 564 (45.8%) |
| 4+ Person Household | 848 (67.8%) | 403 (32.2%) |
| Total Housing Units | 4,555 (67.0%) | 2,238 (33.0%) |
Occupancy by Educational Attainment in Greene County
| Household Size | Owner-occupied | Renter-occupied |
| Less than High School | 739 (53.2%) | 649 (46.8%) |
| High School Diploma | 1,455 (67.6%) | 697 (32.4%) |
| College/Associate Degree | 1,602 (67.9%) | 758 (32.1%) |
| Bachelor's Degree or higher | 759 (85.0%) | 134 (15.0%) |
Occupancy by Age of Householder in Greene County
| Age Bracket | # Households | % Households |
| Under 35 Years | 1,035 | 15.2% |
| 35 to 44 Years | 897 | 13.2% |
| 45 to 54 Years | 1,094 | 16.1% |
| 55 to 64 Years | 1,551 | 22.8% |
| 65 to 74 Years | 1,301 | 19.2% |
| 75 to 84 Years | 662 | 9.8% |
| 85 Years and Over | 253 | 3.7% |
| Total | 6,793 | 100.0% |
Housing Finances in Greene County
Median Income by Occupancy in Greene County
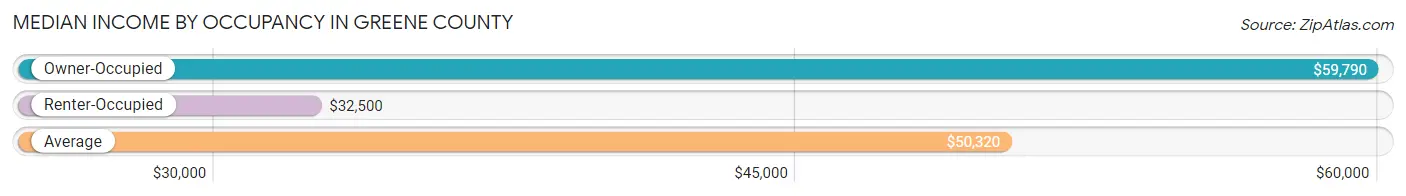
| Occupancy Type | # Households | Median Income |
| Owner-Occupied | 4,555 (67.0%) | $59,790 |
| Renter-Occupied | 2,238 (33.0%) | $32,500 |
| Average | 6,793 (100.0%) | $50,320 |
Occupancy by Householder Income Bracket in Greene County
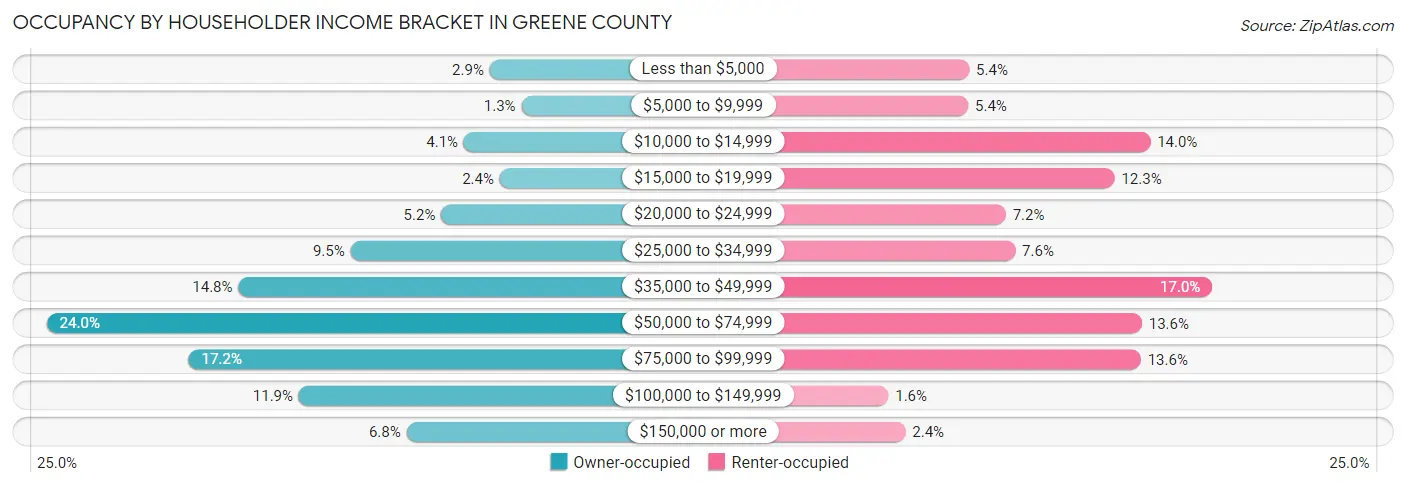
| Income Bracket | Owner-occupied | Renter-occupied |
| Less than $5,000 | 130 (2.9%) | 121 (5.4%) |
| $5,000 to $9,999 | 61 (1.3%) | 120 (5.4%) |
| $10,000 to $14,999 | 186 (4.1%) | 314 (14.0%) |
| $15,000 to $19,999 | 108 (2.4%) | 276 (12.3%) |
| $20,000 to $24,999 | 235 (5.2%) | 160 (7.1%) |
| $25,000 to $34,999 | 432 (9.5%) | 170 (7.6%) |
| $35,000 to $49,999 | 675 (14.8%) | 380 (17.0%) |
| $50,000 to $74,999 | 1,091 (23.9%) | 305 (13.6%) |
| $75,000 to $99,999 | 783 (17.2%) | 304 (13.6%) |
| $100,000 to $149,999 | 544 (11.9%) | 35 (1.6%) |
| $150,000 or more | 310 (6.8%) | 53 (2.4%) |
| Total | 4,555 (100.0%) | 2,238 (100.0%) |
Monthly Housing Cost Tiers in Greene County
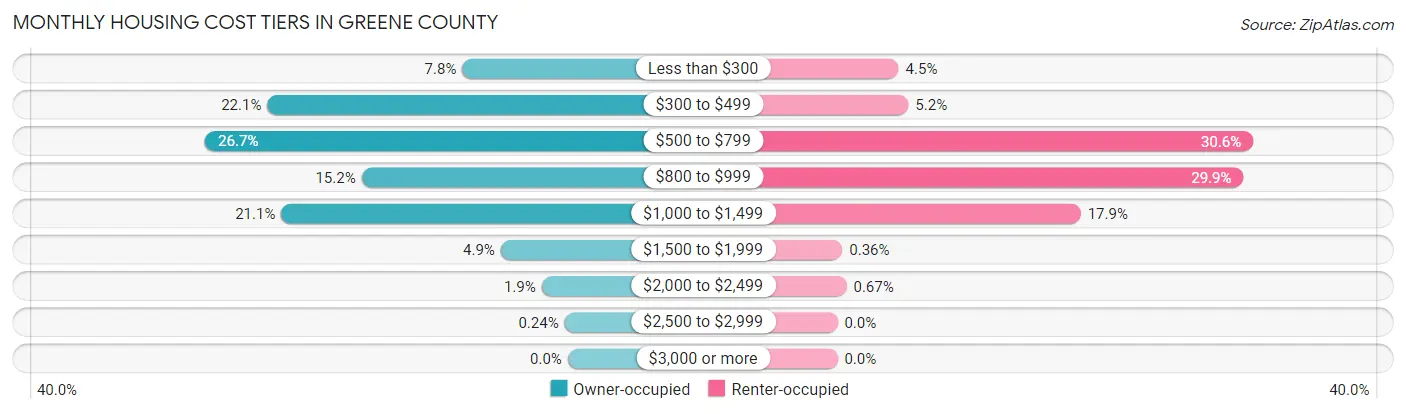
| Monthly Cost | Owner-occupied | Renter-occupied |
| Less than $300 | 354 (7.8%) | 101 (4.5%) |
| $300 to $499 | 1,008 (22.1%) | 117 (5.2%) |
| $500 to $799 | 1,216 (26.7%) | 685 (30.6%) |
| $800 to $999 | 692 (15.2%) | 669 (29.9%) |
| $1,000 to $1,499 | 961 (21.1%) | 401 (17.9%) |
| $1,500 to $1,999 | 225 (4.9%) | 8 (0.4%) |
| $2,000 to $2,499 | 88 (1.9%) | 15 (0.7%) |
| $2,500 to $2,999 | 11 (0.2%) | 0 (0.0%) |
| $3,000 or more | 0 (0.0%) | 0 (0.0%) |
| Total | 4,555 (100.0%) | 2,238 (100.0%) |
Physical Housing Characteristics in Greene County
Housing Structures in Greene County
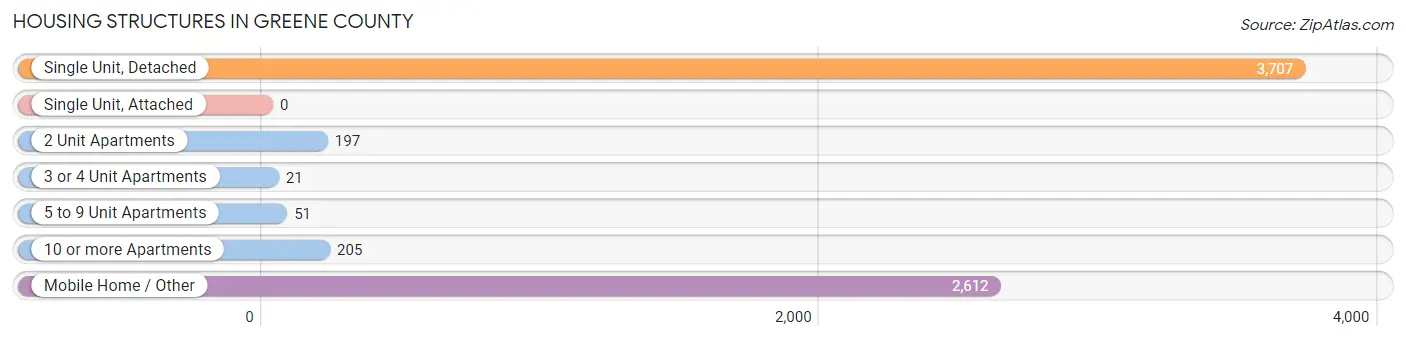
| Structure Type | # Housing Units | % Housing Units |
| Single Unit, Detached | 3,707 | 54.6% |
| Single Unit, Attached | 0 | 0.0% |
| 2 Unit Apartments | 197 | 2.9% |
| 3 or 4 Unit Apartments | 21 | 0.3% |
| 5 to 9 Unit Apartments | 51 | 0.7% |
| 10 or more Apartments | 205 | 3.0% |
| Mobile Home / Other | 2,612 | 38.5% |
| Total | 6,793 | 100.0% |
Housing Structures by Occupancy in Greene County
| Structure Type | Owner-occupied | Renter-occupied |
| Single Unit, Detached | 2,857 (77.1%) | 850 (22.9%) |
| Single Unit, Attached | 0 (0.0%) | 0 (0.0%) |
| 2 Unit Apartments | 0 (0.0%) | 197 (100.0%) |
| 3 or 4 Unit Apartments | 0 (0.0%) | 21 (100.0%) |
| 5 to 9 Unit Apartments | 0 (0.0%) | 51 (100.0%) |
| 10 or more Apartments | 0 (0.0%) | 205 (100.0%) |
| Mobile Home / Other | 1,698 (65.0%) | 914 (35.0%) |
| Total | 4,555 (67.0%) | 2,238 (33.0%) |
Housing Structures by Number of Rooms in Greene County
| Number of Rooms | Owner-occupied | Renter-occupied |
| 1 Room | 8 (0.2%) | 61 (2.7%) |
| 2 or 3 Rooms | 41 (0.9%) | 265 (11.8%) |
| 4 or 5 Rooms | 1,537 (33.7%) | 1,293 (57.8%) |
| 6 or 7 Rooms | 1,797 (39.5%) | 361 (16.1%) |
| 8 or more Rooms | 1,172 (25.7%) | 258 (11.5%) |
| Total | 4,555 (100.0%) | 2,238 (100.0%) |
Housing Structure by Heating Type in Greene County
| Heating Type | Owner-occupied | Renter-occupied |
| Utility Gas | 246 (5.4%) | 127 (5.7%) |
| Bottled, Tank, or LP Gas | 916 (20.1%) | 294 (13.1%) |
| Electricity | 3,290 (72.2%) | 1,698 (75.9%) |
| Fuel Oil or Kerosene | 66 (1.5%) | 45 (2.0%) |
| Coal or Coke | 0 (0.0%) | 0 (0.0%) |
| All other Fuels | 21 (0.5%) | 0 (0.0%) |
| No Fuel Used | 16 (0.4%) | 74 (3.3%) |
| Total | 4,555 (100.0%) | 2,238 (100.0%) |
Household Vehicle Usage in Greene County
| Vehicles per Household | Owner-occupied | Renter-occupied |
| No Vehicle | 130 (2.9%) | 242 (10.8%) |
| 1 Vehicle | 946 (20.8%) | 939 (42.0%) |
| 2 Vehicles | 1,775 (39.0%) | 730 (32.6%) |
| 3 or more Vehicles | 1,704 (37.4%) | 327 (14.6%) |
| Total | 4,555 (100.0%) | 2,238 (100.0%) |
Real Estate & Mortgages in Greene County
Real Estate and Mortgage Overview in Greene County
| Characteristic | Without Mortgage | With Mortgage |
| Housing Units | 2,381 | 2,174 |
| Median Property Value | $98,300 | $115,800 |
| Median Household Income | $53,997 | $151 |
| Monthly Housing Costs | $470 | $0 |
| Real Estate Taxes | $954 | $32 |
Property Value by Mortgage Status in Greene County
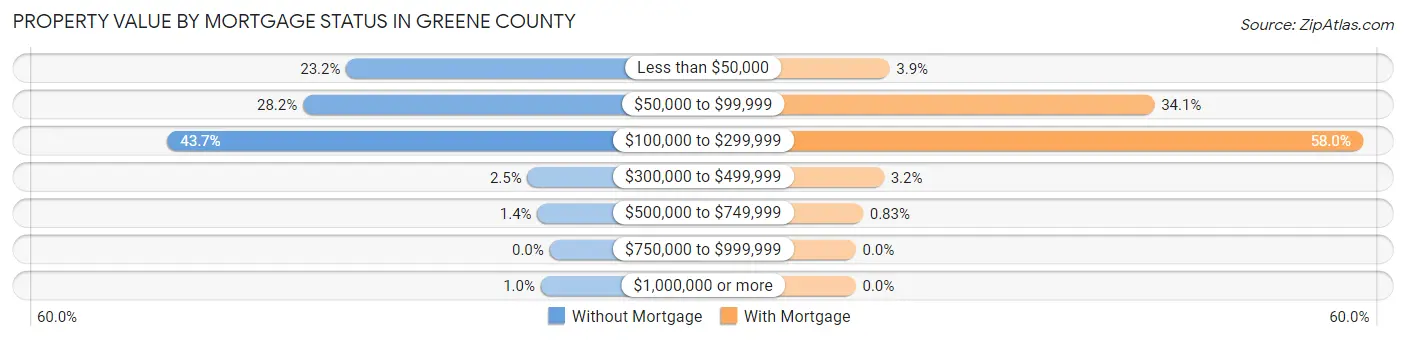
| Property Value | Without Mortgage | With Mortgage |
| Less than $50,000 | 553 (23.2%) | 84 (3.9%) |
| $50,000 to $99,999 | 671 (28.2%) | 742 (34.1%) |
| $100,000 to $299,999 | 1,040 (43.7%) | 1,260 (58.0%) |
| $300,000 to $499,999 | 60 (2.5%) | 70 (3.2%) |
| $500,000 to $749,999 | 33 (1.4%) | 18 (0.8%) |
| $750,000 to $999,999 | 0 (0.0%) | 0 (0.0%) |
| $1,000,000 or more | 24 (1.0%) | 0 (0.0%) |
| Total | 2,381 (100.0%) | 2,174 (100.0%) |
Household Income by Mortgage Status in Greene County
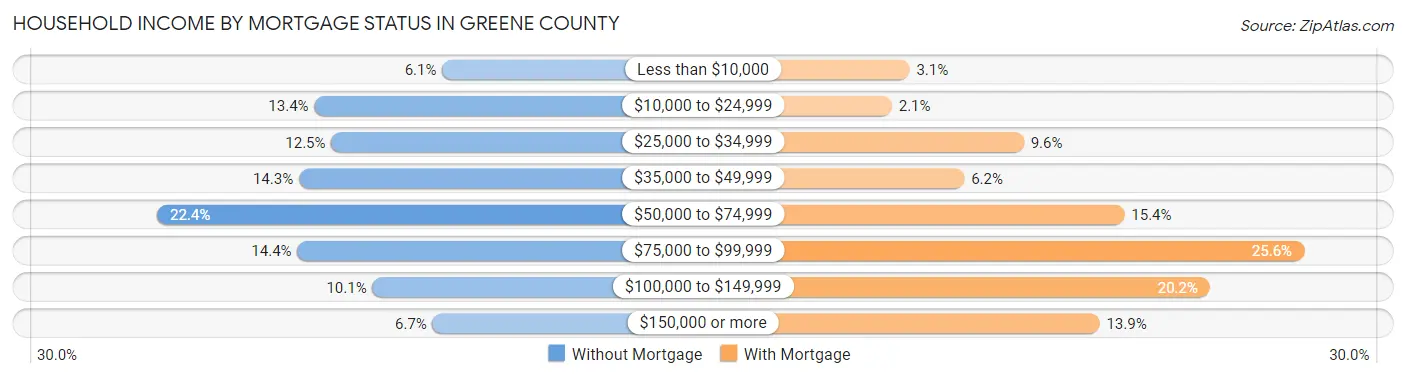
| Household Income | Without Mortgage | With Mortgage |
| Less than $10,000 | 146 (6.1%) | 67 (3.1%) |
| $10,000 to $24,999 | 320 (13.4%) | 45 (2.1%) |
| $25,000 to $34,999 | 297 (12.5%) | 209 (9.6%) |
| $35,000 to $49,999 | 341 (14.3%) | 135 (6.2%) |
| $50,000 to $74,999 | 534 (22.4%) | 334 (15.4%) |
| $75,000 to $99,999 | 343 (14.4%) | 557 (25.6%) |
| $100,000 to $149,999 | 241 (10.1%) | 440 (20.2%) |
| $150,000 or more | 159 (6.7%) | 303 (13.9%) |
| Total | 2,381 (100.0%) | 2,174 (100.0%) |
Property Value to Household Income Ratio in Greene County
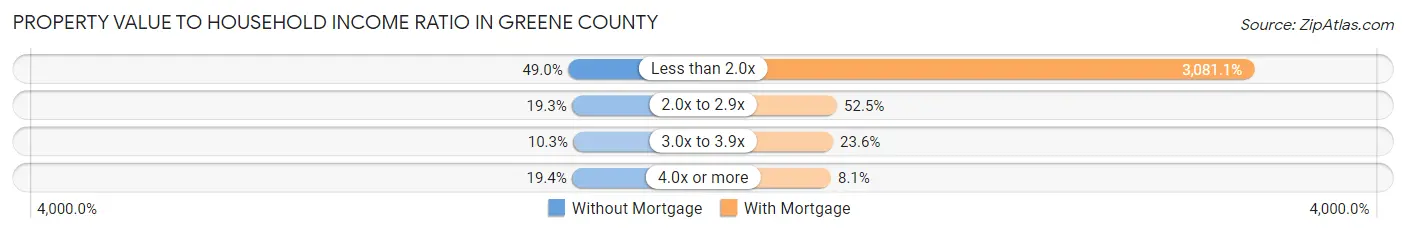
| Value-to-Income Ratio | Without Mortgage | With Mortgage |
| Less than 2.0x | 1,167 (49.0%) | 66,983 (3,081.1%) |
| 2.0x to 2.9x | 460 (19.3%) | 1,141 (52.5%) |
| 3.0x to 3.9x | 246 (10.3%) | 514 (23.6%) |
| 4.0x or more | 461 (19.4%) | 176 (8.1%) |
| Total | 2,381 (100.0%) | 2,174 (100.0%) |
Real Estate Taxes by Mortgage Status in Greene County
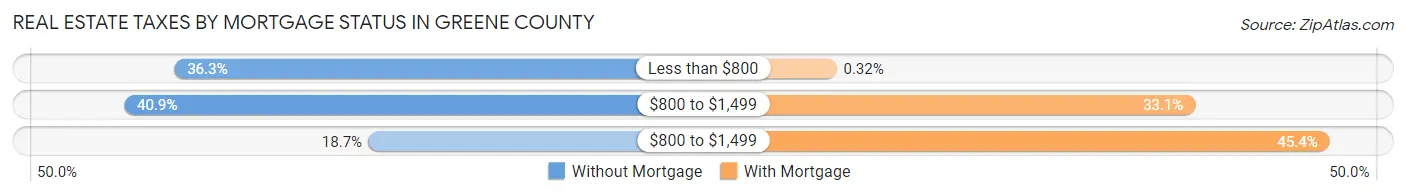
| Property Taxes | Without Mortgage | With Mortgage |
| Less than $800 | 865 (36.3%) | 7 (0.3%) |
| $800 to $1,499 | 974 (40.9%) | 719 (33.1%) |
| $800 to $1,499 | 444 (18.6%) | 986 (45.4%) |
| Total | 2,381 (100.0%) | 2,174 (100.0%) |
Health & Disability in Greene County
Health Insurance Coverage by Age in Greene County
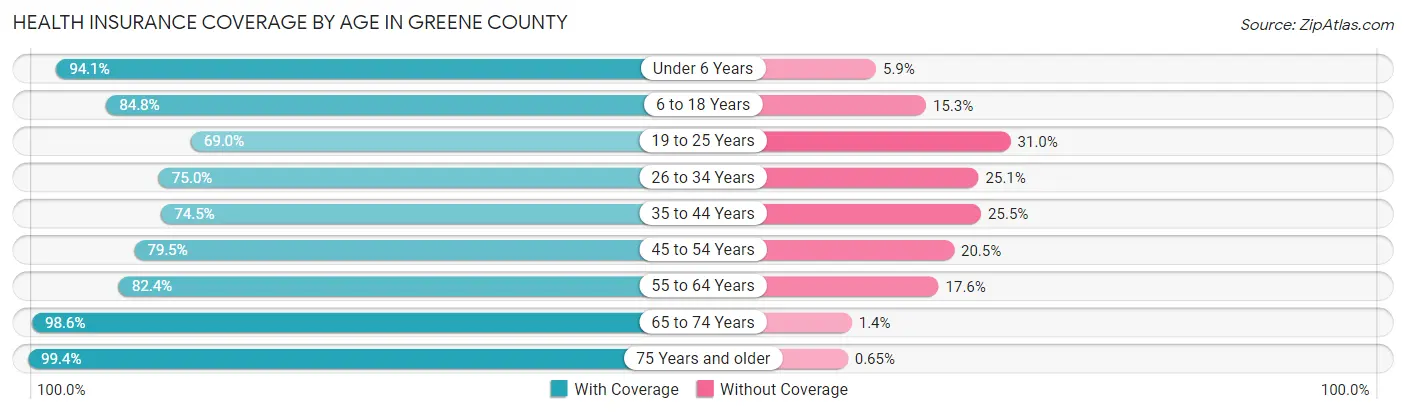
| Age Bracket | With Coverage | Without Coverage |
| Under 6 Years | 1,049 (94.1%) | 66 (5.9%) |
| 6 to 18 Years | 2,695 (84.8%) | 485 (15.2%) |
| 19 to 25 Years | 1,097 (69.0%) | 493 (31.0%) |
| 26 to 34 Years | 1,424 (75.0%) | 476 (25.1%) |
| 35 to 44 Years | 1,707 (74.5%) | 585 (25.5%) |
| 45 to 54 Years | 1,651 (79.5%) | 425 (20.5%) |
| 55 to 64 Years | 2,075 (82.4%) | 443 (17.6%) |
| 65 to 74 Years | 1,898 (98.6%) | 27 (1.4%) |
| 75 Years and older | 1,217 (99.4%) | 8 (0.6%) |
| Total | 14,813 (83.1%) | 3,008 (16.9%) |
Health Insurance Coverage by Citizenship Status in Greene County
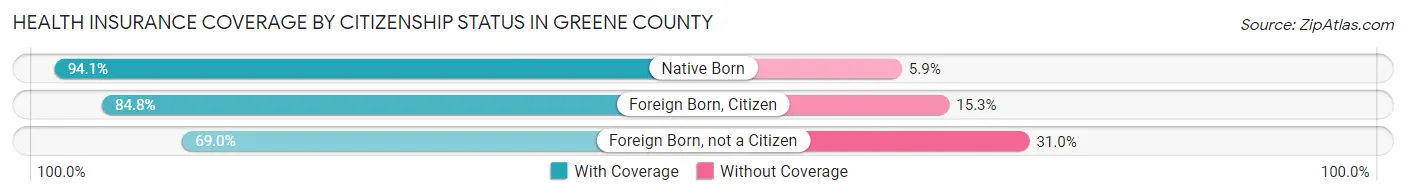
| Citizenship Status | With Coverage | Without Coverage |
| Native Born | 1,049 (94.1%) | 66 (5.9%) |
| Foreign Born, Citizen | 2,695 (84.8%) | 485 (15.2%) |
| Foreign Born, not a Citizen | 1,097 (69.0%) | 493 (31.0%) |
Health Insurance Coverage by Household Income in Greene County
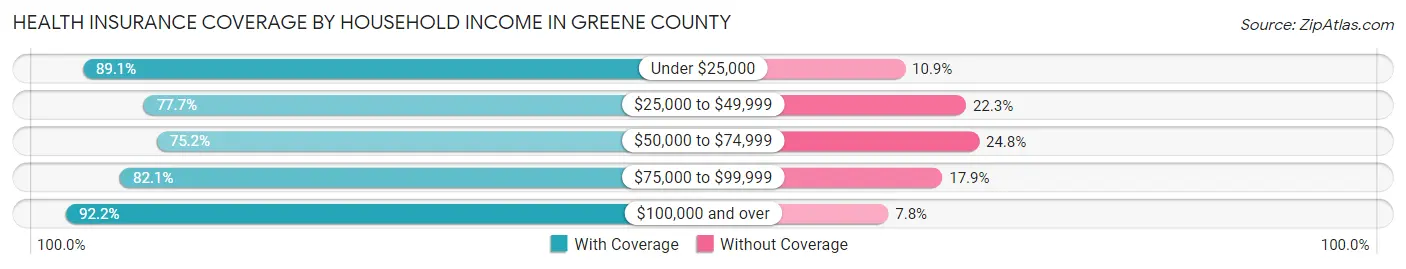
| Household Income | With Coverage | Without Coverage |
| Under $25,000 | 3,085 (89.1%) | 378 (10.9%) |
| $25,000 to $49,999 | 3,267 (77.7%) | 939 (22.3%) |
| $50,000 to $74,999 | 2,728 (75.2%) | 898 (24.8%) |
| $75,000 to $99,999 | 2,115 (82.1%) | 461 (17.9%) |
| $100,000 and over | 3,517 (92.2%) | 297 (7.8%) |
Public vs Private Health Insurance Coverage by Age in Greene County
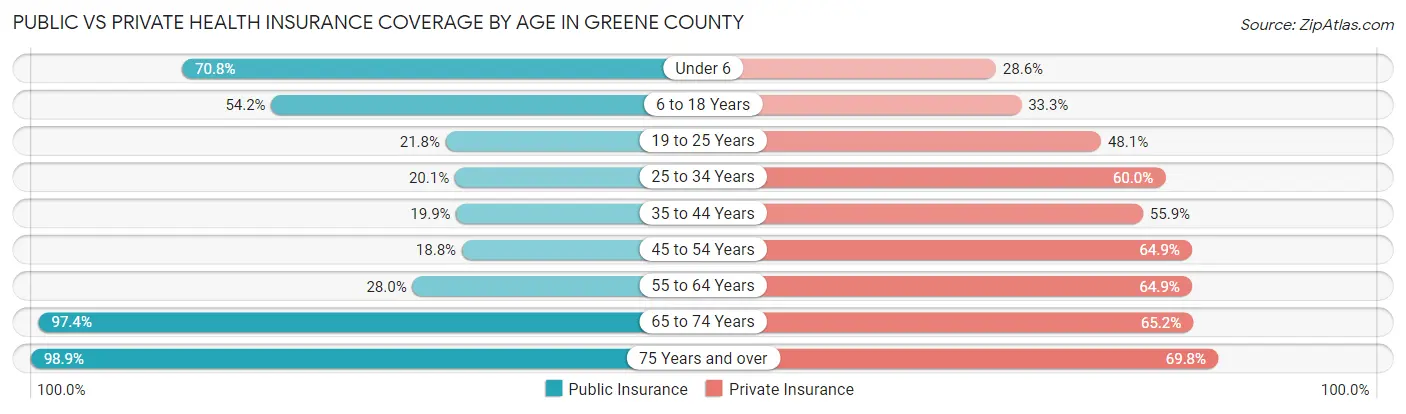
| Age Bracket | Public Insurance | Private Insurance |
| Under 6 | 789 (70.8%) | 319 (28.6%) |
| 6 to 18 Years | 1,723 (54.2%) | 1,059 (33.3%) |
| 19 to 25 Years | 347 (21.8%) | 765 (48.1%) |
| 25 to 34 Years | 382 (20.1%) | 1,140 (60.0%) |
| 35 to 44 Years | 455 (19.9%) | 1,281 (55.9%) |
| 45 to 54 Years | 391 (18.8%) | 1,348 (64.9%) |
| 55 to 64 Years | 705 (28.0%) | 1,635 (64.9%) |
| 65 to 74 Years | 1,875 (97.4%) | 1,255 (65.2%) |
| 75 Years and over | 1,211 (98.9%) | 855 (69.8%) |
| Total | 7,878 (44.2%) | 9,657 (54.2%) |
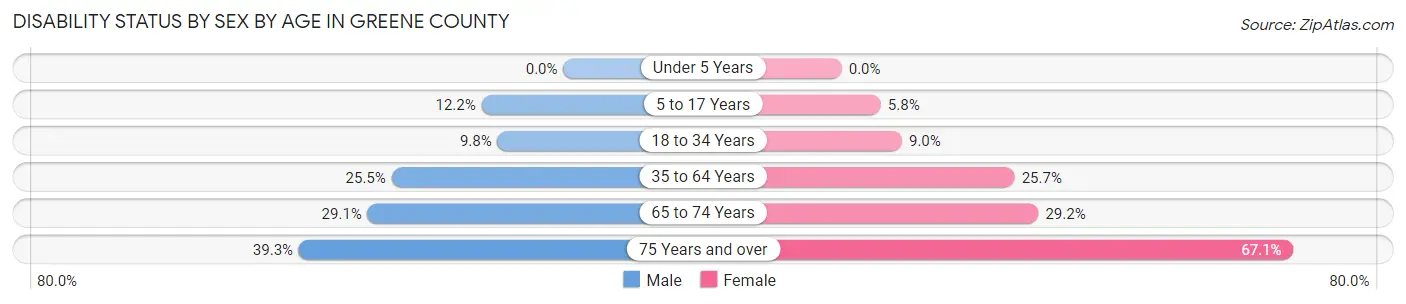
Disability Status by Sex by Age in Greene County
| Age Bracket | Male | Female |
| Under 5 Years | 0 (0.0%) | 0 (0.0%) |
| 5 to 17 Years | 185 (12.1%) | 81 (5.8%) |
| 18 to 34 Years | 219 (9.8%) | 148 (8.9%) |
| 35 to 64 Years | 926 (25.5%) | 836 (25.7%) |
| 65 to 74 Years | 256 (29.1%) | 305 (29.2%) |
| 75 Years and over | 183 (39.3%) | 509 (67.1%) |
Disability Class by Sex by Age in Greene County
Disability Class: Hearing Difficulty
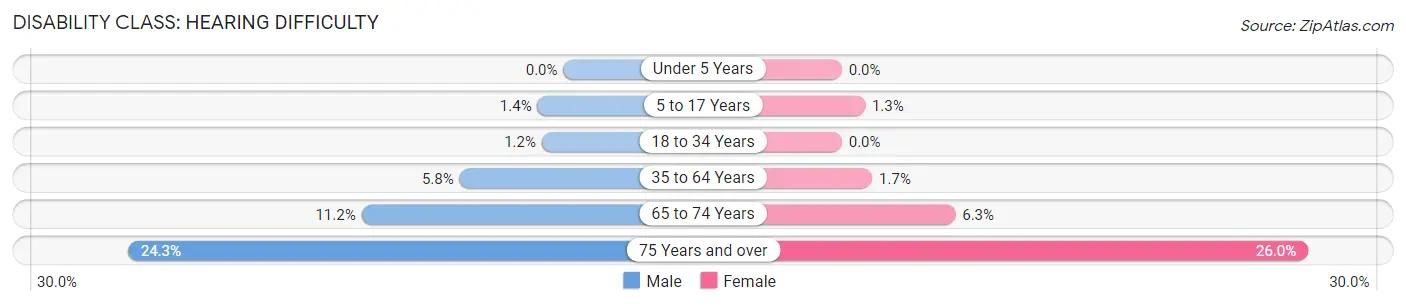
| Age Bracket | Male | Female |
| Under 5 Years | 0 (0.0%) | 0 (0.0%) |
| 5 to 17 Years | 22 (1.4%) | 18 (1.3%) |
| 18 to 34 Years | 27 (1.2%) | 0 (0.0%) |
| 35 to 64 Years | 210 (5.8%) | 55 (1.7%) |
| 65 to 74 Years | 99 (11.2%) | 66 (6.3%) |
| 75 Years and over | 113 (24.2%) | 197 (26.0%) |
Disability Class: Vision Difficulty
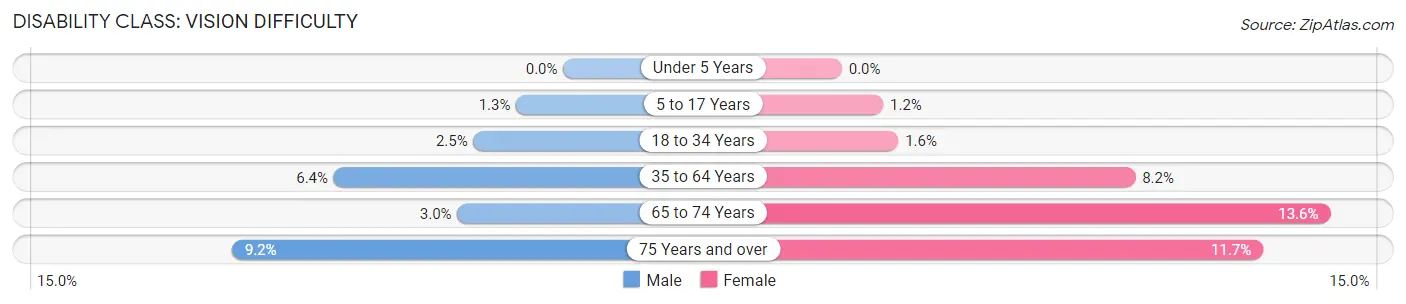
| Age Bracket | Male | Female |
| Under 5 Years | 0 (0.0%) | 0 (0.0%) |
| 5 to 17 Years | 20 (1.3%) | 16 (1.1%) |
| 18 to 34 Years | 56 (2.5%) | 26 (1.6%) |
| 35 to 64 Years | 232 (6.4%) | 266 (8.2%) |
| 65 to 74 Years | 26 (2.9%) | 142 (13.6%) |
| 75 Years and over | 43 (9.2%) | 89 (11.7%) |
Disability Class: Cognitive Difficulty
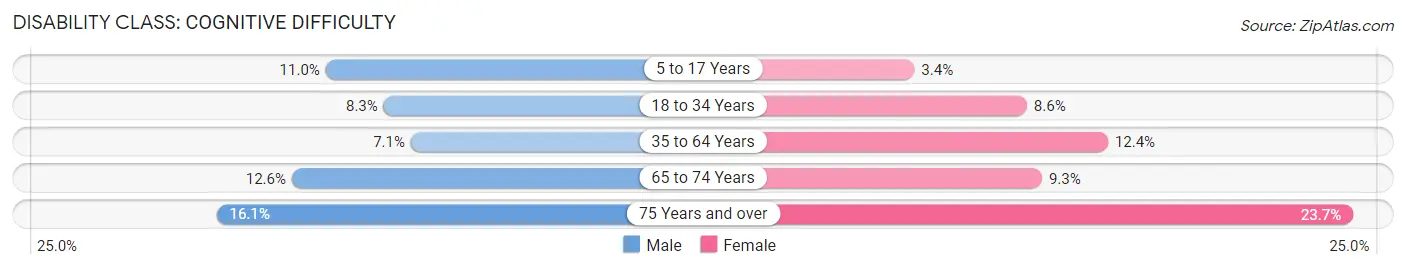
| Age Bracket | Male | Female |
| 5 to 17 Years | 168 (11.0%) | 47 (3.4%) |
| 18 to 34 Years | 187 (8.3%) | 142 (8.6%) |
| 35 to 64 Years | 257 (7.1%) | 402 (12.3%) |
| 65 to 74 Years | 111 (12.6%) | 97 (9.3%) |
| 75 Years and over | 75 (16.1%) | 180 (23.7%) |
Disability Class: Ambulatory Difficulty
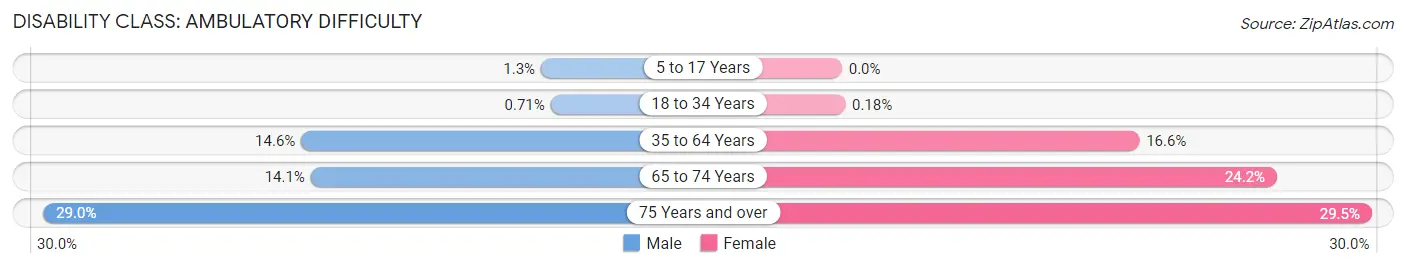
| Age Bracket | Male | Female |
| 5 to 17 Years | 19 (1.3%) | 0 (0.0%) |
| 18 to 34 Years | 16 (0.7%) | 3 (0.2%) |
| 35 to 64 Years | 530 (14.6%) | 539 (16.6%) |
| 65 to 74 Years | 124 (14.1%) | 253 (24.2%) |
| 75 Years and over | 135 (29.0%) | 224 (29.5%) |
Disability Class: Self-Care Difficulty
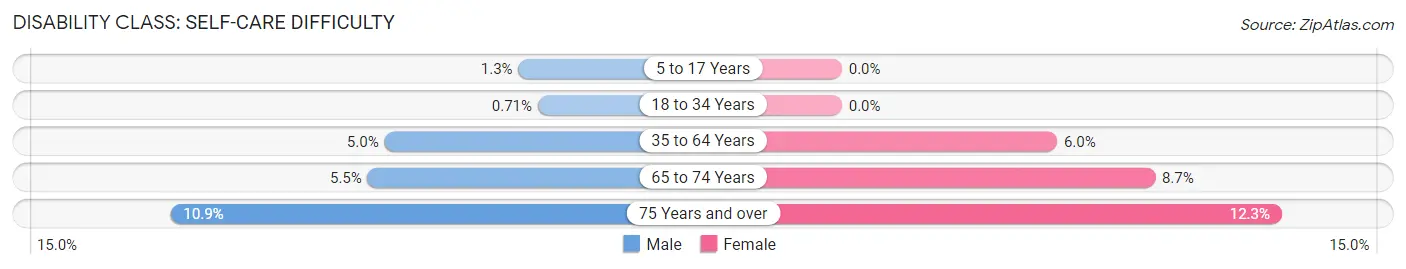
| Age Bracket | Male | Female |
| 5 to 17 Years | 19 (1.3%) | 0 (0.0%) |
| 18 to 34 Years | 16 (0.7%) | 0 (0.0%) |
| 35 to 64 Years | 181 (5.0%) | 195 (6.0%) |
| 65 to 74 Years | 48 (5.4%) | 91 (8.7%) |
| 75 Years and over | 51 (10.9%) | 93 (12.2%) |
Technology Access in Greene County
Computing Device Access in Greene County
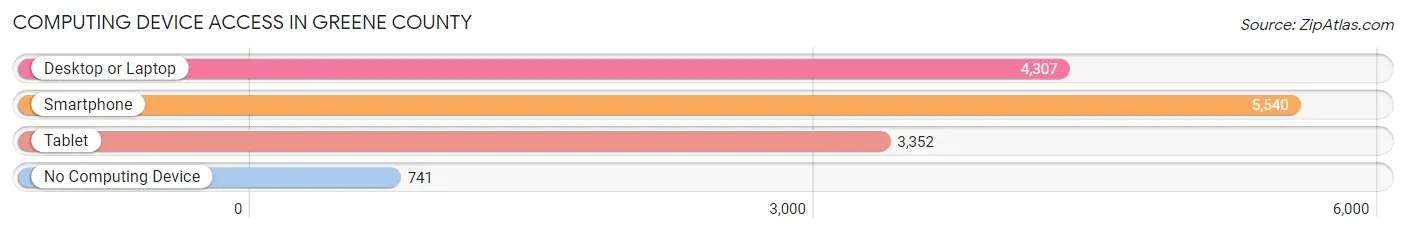
| Device Type | # Households | % Households |
| Desktop or Laptop | 4,307 | 63.4% |
| Smartphone | 5,540 | 81.6% |
| Tablet | 3,352 | 49.3% |
| No Computing Device | 741 | 10.9% |
| Total | 6,793 | 100.0% |
Internet Access in Greene County
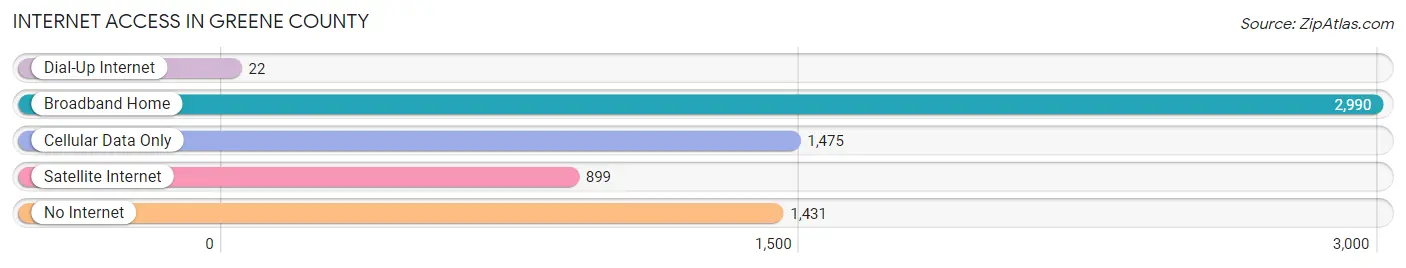
| Internet Type | # Households | % Households |
| Dial-Up Internet | 22 | 0.3% |
| Broadband Home | 2,990 | 44.0% |
| Cellular Data Only | 1,475 | 21.7% |
| Satellite Internet | 899 | 13.2% |
| No Internet | 1,431 | 21.1% |
| Total | 6,793 | 100.0% |
Greene County Summary
Greene County is a county located in the U.S. state of North Carolina. As of the 2010 census, the population was 21,362. Its county seat is Snow Hill. The county was formed in 1791 from the western part of Dobbs County. It was named for Nathanael Greene, a major general of the Continental Army in the American Revolutionary War.
History
Greene County was formed in 1791 from the western part of Dobbs County. It was named for Nathanael Greene, a major general of the Continental Army in the American Revolutionary War. The county was originally part of the Tuscarora Indian Nation, and the first European settlers were German and Swiss immigrants who arrived in the early 1700s.
The county was the site of several battles during the American Civil War, including the Battle of White Oak Road and the Battle of Bentonville. After the war, the county was divided into several small farms, and the economy was largely based on agriculture.
Geography
Greene County is located in the eastern part of North Carolina, in the Coastal Plain region. It is bordered by Pitt County to the north, Lenoir County to the east, Wayne County to the south, and Wilson County to the west. The county covers an area of 545 square miles, with a population density of 39 people per square mile.
The county is mostly flat, with some rolling hills in the northern part. The Neuse River forms the northern border of the county, and the Tar River forms the eastern border. The county is home to several state parks, including Cliffs of the Neuse State Park, Goose Creek State Park, and Pettigrew State Park.
Economy
Greene County's economy is largely based on agriculture. The county is home to several large farms, including tobacco, cotton, and soybean farms. The county is also home to several manufacturing companies, including a furniture factory, a paper mill, and a plastics plant.
The county is home to several small businesses, including restaurants, retail stores, and service providers. The county is also home to several tourist attractions, including the Cliffs of the Neuse State Park, the North Carolina Museum of History, and the North Carolina Museum of Natural Sciences.
Demographics
As of the 2010 census, the population of Greene County was 21,362. The racial makeup of the county was 68.3% White, 28.2% African American, 0.4% Native American, 0.7% Asian, 0.1% Pacific Islander, 0.7% from other races, and 1.6% from two or more races. Hispanic or Latino of any race were 2.2% of the population.
The median income for a household in the county was $35,945, and the median income for a family was $43,945. The per capita income for the county was $17,845. About 17.2% of families and 21.2% of the population were below the poverty line, including 28.2% of those under age 18 and 17.2% of those age 65 or over.
Common Questions
What is Per Capita Income in Greene County?
Per Capita income in Greene County is $21,972.
What is the Median Family Income in Greene County?
Median Family Income in Greene County is $61,301.
What is the Median Household income in Greene County?
Median Household Income in Greene County is $50,320.
What is Income or Wage Gap in Greene County?
Income or Wage Gap in Greene County is 20.8%.
Women in Greene County earn 79.2 cents for every dollar earned by a man.
What is Family Income Deficit in Greene County?
Family Income Deficit in Greene County is $10,677.
Families that are below poverty line in Greene County earn $10,677 less on average than the poverty threshold level.
What is Inequality or Gini Index in Greene County?
Inequality or Gini Index in Greene County is 0.40.
What is the Total Population of Greene County?
Total Population of Greene County is 20,407.
What is the Total Male Population of Greene County?
Total Male Population of Greene County is 11,779.
What is the Total Female Population of Greene County?
Total Female Population of Greene County is 8,628.
What is the Ratio of Males per 100 Females in Greene County?
There are 136.52 Males per 100 Females in Greene County.
What is the Ratio of Females per 100 Males in Greene County?
There are 73.25 Females per 100 Males in Greene County.
What is the Median Population Age in Greene County?
Median Population Age in Greene County is 40.0 Years.
What is the Average Family Size in Greene County
Average Family Size in Greene County is 3.3 People.
What is the Average Household Size in Greene County
Average Household Size in Greene County is 2.6 People.
How Large is the Labor Force in Greene County?
There are 8,573 People in the Labor Forcein in Greene County.
What is the Percentage of People in the Labor Force in Greene County?
50.6% of People are in the Labor Force in Greene County.
What is the Unemployment Rate in Greene County?
Unemployment Rate in Greene County is 5.5%.