Edgecombe County, NC Map & Demographics
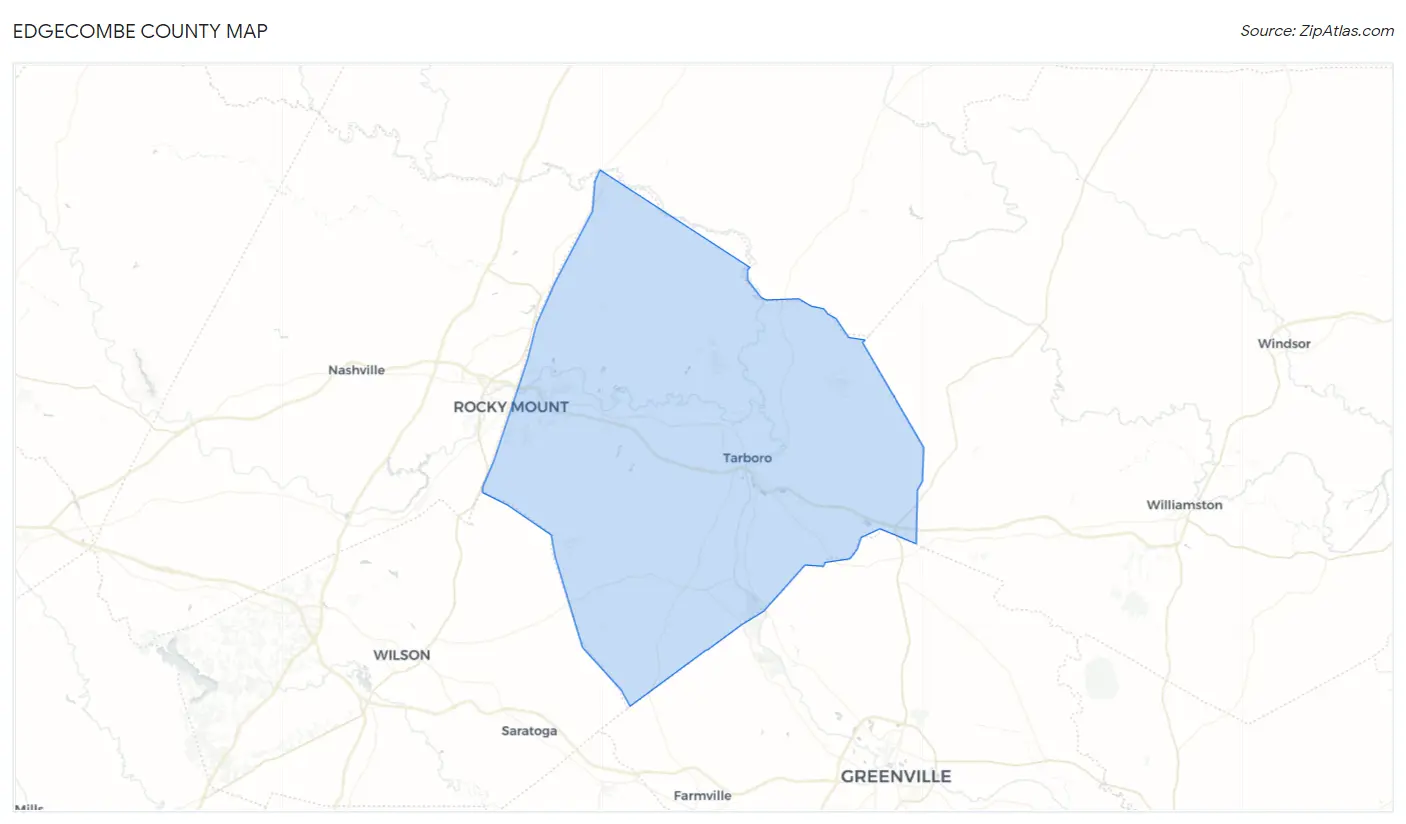
Edgecombe County Map
Edgecombe County Overview
$25,813
PER CAPITA INCOME
$54,948
AVG FAMILY INCOME
$46,370
AVG HOUSEHOLD INCOME
11.9%
WAGE / INCOME GAP [ % ]
88.1¢/ $1
WAGE / INCOME GAP [ $ ]
$11,566
FAMILY INCOME DEFICIT
0.46
INEQUALITY / GINI INDEX
49,067
TOTAL POPULATION
22,979
MALE POPULATION
26,088
FEMALE POPULATION
88.08
MALES / 100 FEMALES
113.53
FEMALES / 100 MALES
41.6
MEDIAN AGE
3.0
AVG FAMILY SIZE
2.5
AVG HOUSEHOLD SIZE
22,308
LABOR FORCE [ PEOPLE ]
56.6%
PERCENT IN LABOR FORCE
8.6%
UNEMPLOYMENT RATE
Edgecombe County Area Codes
Income in Edgecombe County
Income Overview in Edgecombe County
Per Capita Income in Edgecombe County is $25,813, while median incomes of families and households are $54,948 and $46,370 respectively.
| Characteristic | Number | Measure |
| Per Capita Income | 49,067 | $25,813 |
| Median Family Income | 13,168 | $54,948 |
| Mean Family Income | 13,168 | $71,661 |
| Median Household Income | 19,350 | $46,370 |
| Mean Household Income | 19,350 | $63,926 |
| Income Deficit | 13,168 | $11,566 |
| Wage / Income Gap (%) | 49,067 | 11.86% |
| Wage / Income Gap ($) | 49,067 | 88.14¢ per $1 |
| Gini / Inequality Index | 49,067 | 0.46 |
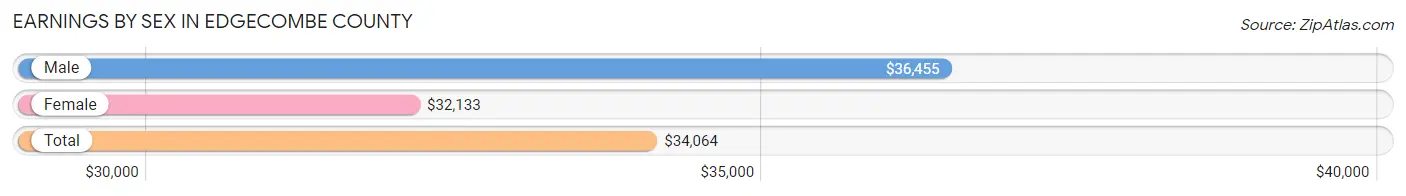
Earnings by Sex in Edgecombe County
Average Earnings in Edgecombe County are $34,064, $36,455 for men and $32,133 for women, a difference of 11.9%.
| Sex | Number | Average Earnings |
| Male | 10,484 (46.4%) | $36,455 |
| Female | 12,107 (53.6%) | $32,133 |
| Total | 22,591 (100.0%) | $34,064 |
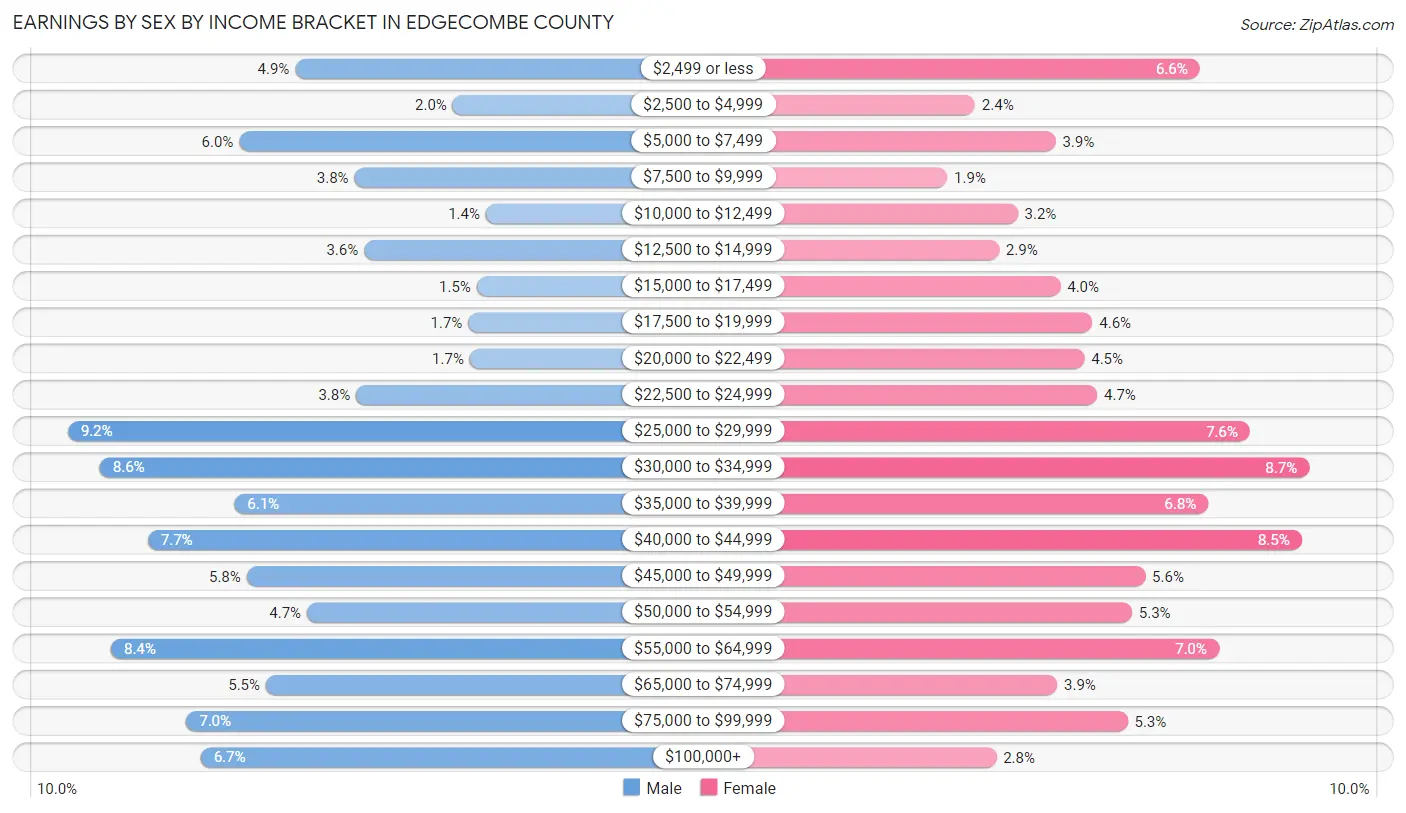
Earnings by Sex by Income Bracket in Edgecombe County
The most common earnings brackets in Edgecombe County are $25,000 to $29,999 for men (963 | 9.2%) and $30,000 to $34,999 for women (1,049 | 8.7%).
| Income | Male | Female |
| $2,499 or less | 517 (4.9%) | 800 (6.6%) |
| $2,500 to $4,999 | 208 (2.0%) | 291 (2.4%) |
| $5,000 to $7,499 | 627 (6.0%) | 473 (3.9%) |
| $7,500 to $9,999 | 401 (3.8%) | 228 (1.9%) |
| $10,000 to $12,499 | 143 (1.4%) | 387 (3.2%) |
| $12,500 to $14,999 | 382 (3.6%) | 345 (2.9%) |
| $15,000 to $17,499 | 160 (1.5%) | 484 (4.0%) |
| $17,500 to $19,999 | 177 (1.7%) | 557 (4.6%) |
| $20,000 to $22,499 | 174 (1.7%) | 539 (4.4%) |
| $22,500 to $24,999 | 397 (3.8%) | 568 (4.7%) |
| $25,000 to $29,999 | 963 (9.2%) | 914 (7.5%) |
| $30,000 to $34,999 | 901 (8.6%) | 1,049 (8.7%) |
| $35,000 to $39,999 | 636 (6.1%) | 820 (6.8%) |
| $40,000 to $44,999 | 806 (7.7%) | 1,032 (8.5%) |
| $45,000 to $49,999 | 612 (5.8%) | 677 (5.6%) |
| $50,000 to $54,999 | 494 (4.7%) | 646 (5.3%) |
| $55,000 to $64,999 | 879 (8.4%) | 844 (7.0%) |
| $65,000 to $74,999 | 574 (5.5%) | 477 (3.9%) |
| $75,000 to $99,999 | 731 (7.0%) | 637 (5.3%) |
| $100,000+ | 702 (6.7%) | 339 (2.8%) |
| Total | 10,484 (100.0%) | 12,107 (100.0%) |
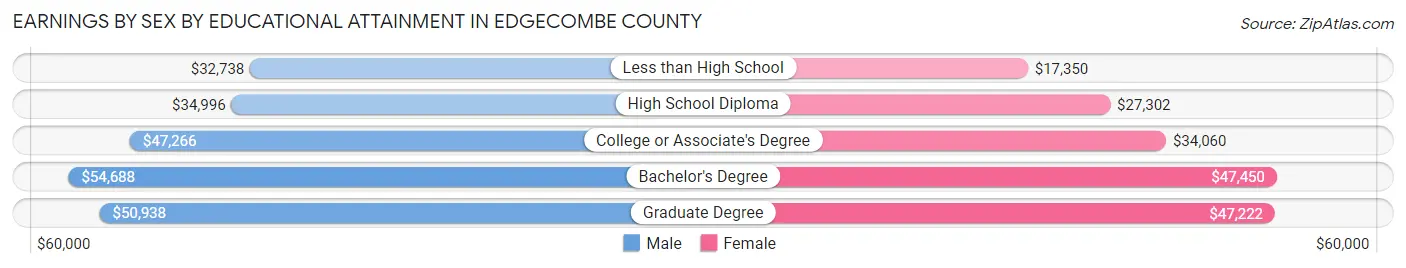
Earnings by Sex by Educational Attainment in Edgecombe County
Average earnings in Edgecombe County are $40,710 for men and $34,716 for women, a difference of 14.7%. Men with an educational attainment of bachelor's degree enjoy the highest average annual earnings of $54,688, while those with less than high school education earn the least with $32,738. Women with an educational attainment of bachelor's degree earn the most with the average annual earnings of $47,450, while those with less than high school education have the smallest earnings of $17,350.
| Educational Attainment | Male Income | Female Income |
| Less than High School | $32,738 | $17,350 |
| High School Diploma | $34,996 | $27,302 |
| College or Associate's Degree | $47,266 | $34,060 |
| Bachelor's Degree | $54,688 | $47,450 |
| Graduate Degree | $50,938 | $47,222 |
| Total | $40,710 | $34,716 |
Family Income in Edgecombe County
Family Income Brackets in Edgecombe County
According to the Edgecombe County family income data, there are 2,278 families falling into the $100,000 to $149,999 income range, which is the most common income bracket and makes up 17.3% of all families. Conversely, the $10,000 to $14,999 income bracket is the least frequent group with only 395 families (3.0%) belonging to this category.
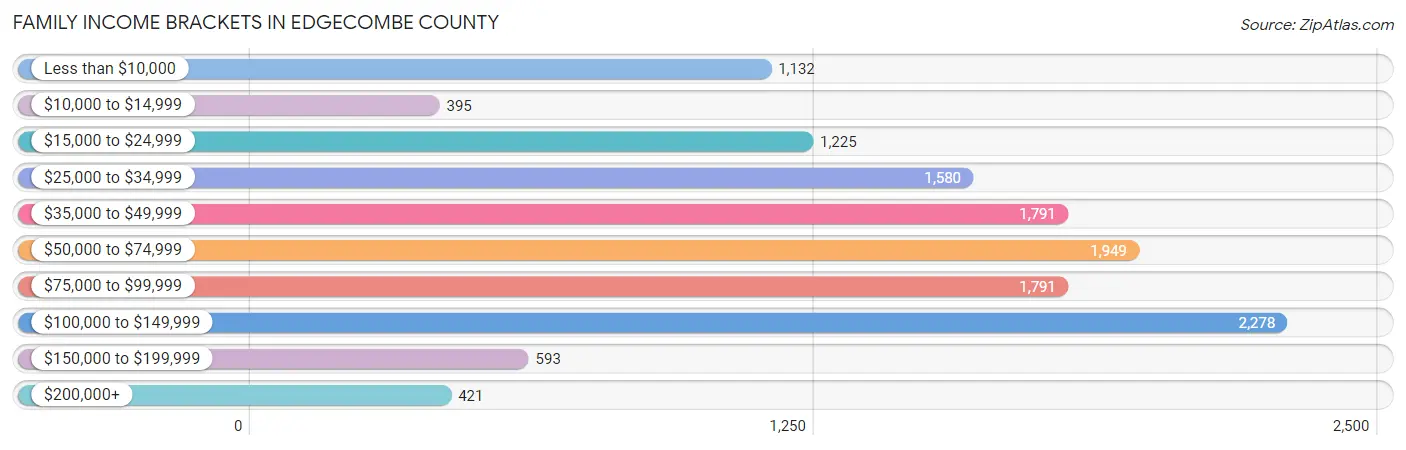
| Income Bracket | # Families | % Families |
| Less than $10,000 | 1,132 | 8.6% |
| $10,000 to $14,999 | 395 | 3.0% |
| $15,000 to $24,999 | 1,225 | 9.3% |
| $25,000 to $34,999 | 1,580 | 12.0% |
| $35,000 to $49,999 | 1,791 | 13.6% |
| $50,000 to $74,999 | 1,949 | 14.8% |
| $75,000 to $99,999 | 1,791 | 13.6% |
| $100,000 to $149,999 | 2,278 | 17.3% |
| $150,000 to $199,999 | 593 | 4.5% |
| $200,000+ | 421 | 3.2% |
Family Income by Famaliy Size in Edgecombe County
7+ person families (121 | 0.9%) account for the highest median family income in Edgecombe County with $118,208 per family, while 2-person families (6,677 | 50.7%) have the highest median income of $26,580 per family member.
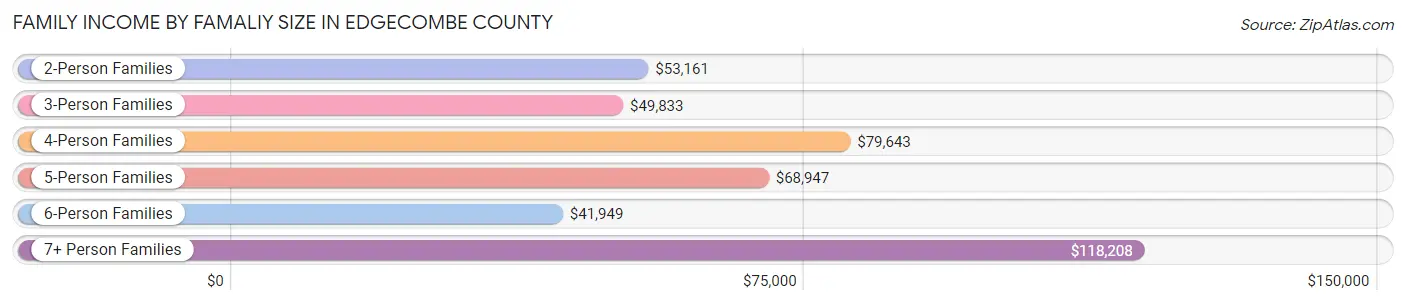
| Income Bracket | # Families | Median Income |
| 2-Person Families | 6,677 (50.7%) | $53,161 |
| 3-Person Families | 3,518 (26.7%) | $49,833 |
| 4-Person Families | 1,680 (12.8%) | $79,643 |
| 5-Person Families | 850 (6.5%) | $68,947 |
| 6-Person Families | 322 (2.5%) | $41,949 |
| 7+ Person Families | 121 (0.9%) | $118,208 |
| Total | 13,168 (100.0%) | $54,948 |
Family Income by Number of Earners in Edgecombe County
The median family income in Edgecombe County is $54,948, with families comprising 3+ earners (1,037) having the highest median family income of $113,661, while families with no earners (2,686) have the lowest median family income of $29,204, accounting for 7.9% and 20.4% of families, respectively.
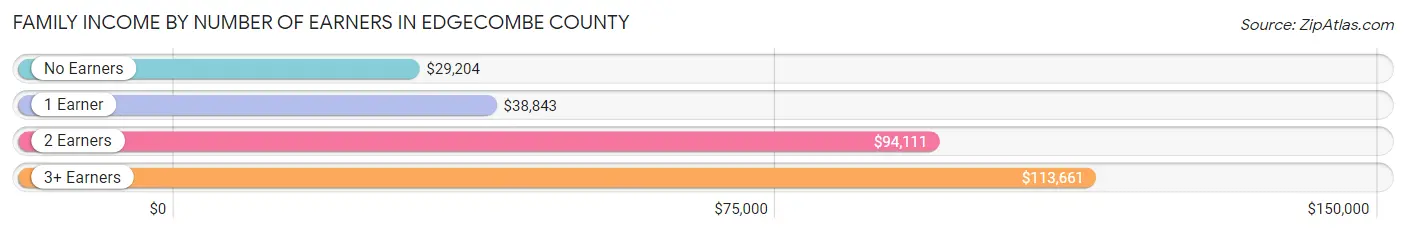
| Number of Earners | # Families | Median Income |
| No Earners | 2,686 (20.4%) | $29,204 |
| 1 Earner | 5,349 (40.6%) | $38,843 |
| 2 Earners | 4,096 (31.1%) | $94,111 |
| 3+ Earners | 1,037 (7.9%) | $113,661 |
| Total | 13,168 (100.0%) | $54,948 |
Household Income in Edgecombe County
Household Income Brackets in Edgecombe County
With 2,922 households falling in the category, the $35,000 to $49,999 income range is the most frequent in Edgecombe County, accounting for 15.1% of all households. In contrast, only 522 households (2.7%) fall into the $200,000+ income bracket, making it the least populous group.
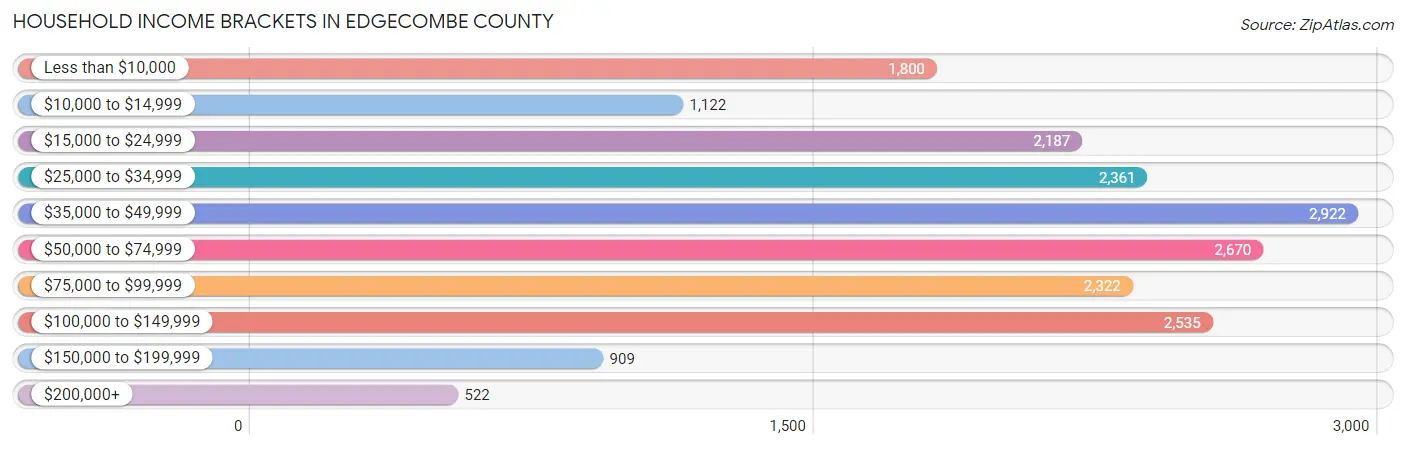
| Income Bracket | # Households | % Households |
| Less than $10,000 | 1,800 | 9.3% |
| $10,000 to $14,999 | 1,122 | 5.8% |
| $15,000 to $24,999 | 2,187 | 11.3% |
| $25,000 to $34,999 | 2,361 | 12.2% |
| $35,000 to $49,999 | 2,922 | 15.1% |
| $50,000 to $74,999 | 2,670 | 13.8% |
| $75,000 to $99,999 | 2,322 | 12.0% |
| $100,000 to $149,999 | 2,535 | 13.1% |
| $150,000 to $199,999 | 909 | 4.7% |
| $200,000+ | 522 | 2.7% |
Household Income by Householder Age in Edgecombe County
The median household income in Edgecombe County is $46,370, with the highest median household income of $55,214 found in the 45 to 64 years age bracket for the primary householder. A total of 7,106 households (36.7%) fall into this category. Meanwhile, the 15 to 24 years age bracket for the primary householder has the lowest median household income of $27,813, with 702 households (3.6%) in this group.
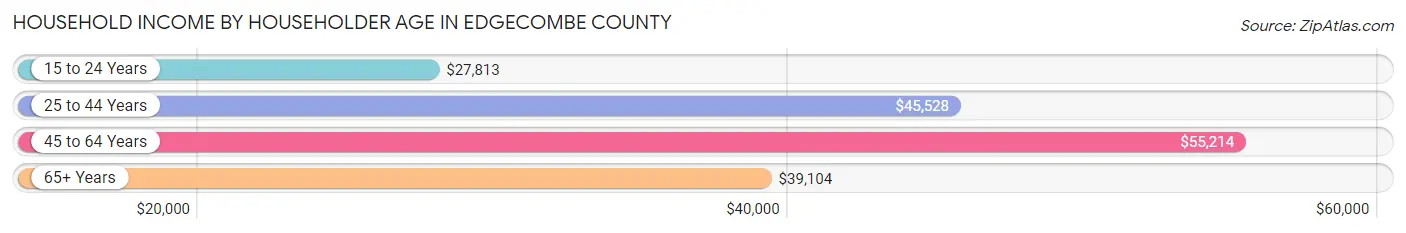
| Income Bracket | # Households | Median Income |
| 15 to 24 Years | 702 (3.6%) | $27,813 |
| 25 to 44 Years | 4,890 (25.3%) | $45,528 |
| 45 to 64 Years | 7,106 (36.7%) | $55,214 |
| 65+ Years | 6,652 (34.4%) | $39,104 |
| Total | 19,350 (100.0%) | $46,370 |
Poverty in Edgecombe County
Income Below Poverty by Sex and Age in Edgecombe County
With 20.0% poverty level for males and 23.8% for females among the residents of Edgecombe County, 5 year old males and 6 to 11 year old females are the most vulnerable to poverty, with 200 males (53.5%) and 961 females (45.3%) in their respective age groups living below the poverty level.
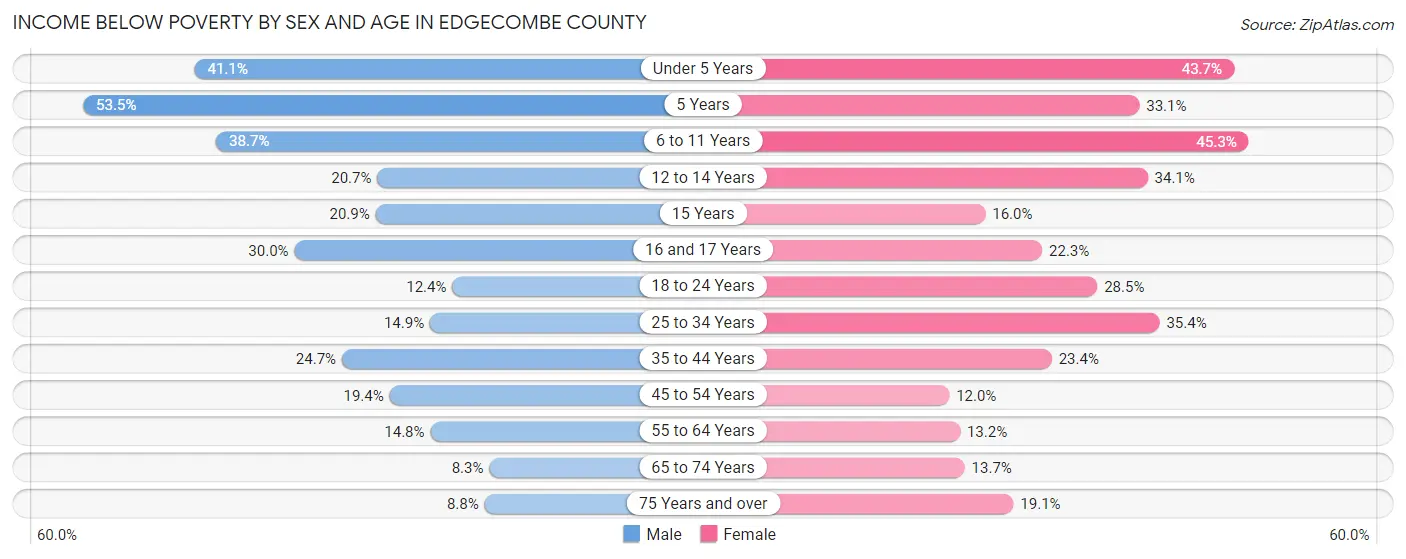
| Age Bracket | Male | Female |
| Under 5 Years | 586 (41.1%) | 574 (43.6%) |
| 5 Years | 200 (53.5%) | 55 (33.1%) |
| 6 to 11 Years | 718 (38.7%) | 961 (45.3%) |
| 12 to 14 Years | 206 (20.7%) | 233 (34.1%) |
| 15 Years | 68 (20.9%) | 35 (16.0%) |
| 16 and 17 Years | 218 (29.9%) | 164 (22.3%) |
| 18 to 24 Years | 243 (12.4%) | 521 (28.4%) |
| 25 to 34 Years | 418 (14.8%) | 1,139 (35.4%) |
| 35 to 44 Years | 590 (24.7%) | 663 (23.4%) |
| 45 to 54 Years | 475 (19.4%) | 363 (12.0%) |
| 55 to 64 Years | 486 (14.8%) | 516 (13.2%) |
| 65 to 74 Years | 217 (8.3%) | 454 (13.7%) |
| 75 Years and over | 132 (8.8%) | 417 (19.1%) |
| Total | 4,557 (20.0%) | 6,095 (23.8%) |
Income Above Poverty by Sex and Age in Edgecombe County
According to the poverty statistics in Edgecombe County, males aged 65 to 74 years and females aged 45 to 54 years are the age groups that are most secure financially, with 91.7% of males and 88.0% of females in these age groups living above the poverty line.
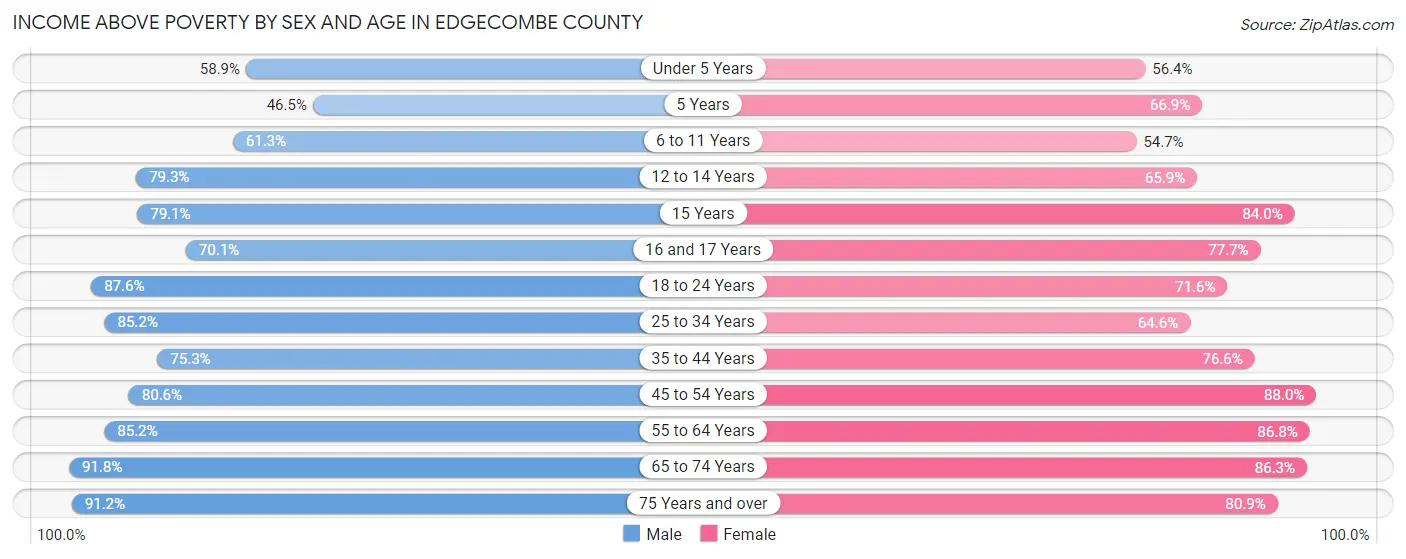
| Age Bracket | Male | Female |
| Under 5 Years | 841 (58.9%) | 741 (56.4%) |
| 5 Years | 174 (46.5%) | 111 (66.9%) |
| 6 to 11 Years | 1,139 (61.3%) | 1,160 (54.7%) |
| 12 to 14 Years | 788 (79.3%) | 451 (65.9%) |
| 15 Years | 257 (79.1%) | 184 (84.0%) |
| 16 and 17 Years | 510 (70.1%) | 571 (77.7%) |
| 18 to 24 Years | 1,722 (87.6%) | 1,310 (71.6%) |
| 25 to 34 Years | 2,397 (85.2%) | 2,080 (64.6%) |
| 35 to 44 Years | 1,803 (75.3%) | 2,173 (76.6%) |
| 45 to 54 Years | 1,978 (80.6%) | 2,673 (88.0%) |
| 55 to 64 Years | 2,795 (85.2%) | 3,405 (86.8%) |
| 65 to 74 Years | 2,414 (91.7%) | 2,865 (86.3%) |
| 75 Years and over | 1,372 (91.2%) | 1,765 (80.9%) |
| Total | 18,190 (80.0%) | 19,489 (76.2%) |
Income Below Poverty Among Married-Couple Families in Edgecombe County
The poverty statistics for married-couple families in Edgecombe County show that 7.1% or 518 of the total 7,334 families live below the poverty line. Families with 3 or 4 children have the highest poverty rate of 31.3%, comprising of 206 families. On the other hand, families with 1 or 2 children have the lowest poverty rate of 3.7%, which includes 56 families.
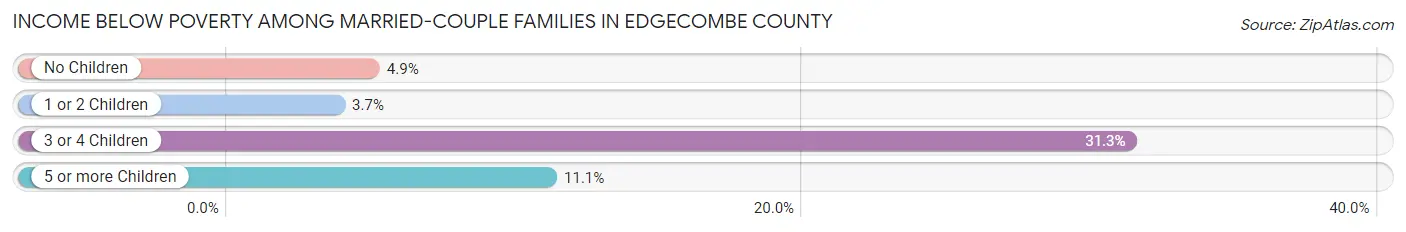
| Children | Above Poverty | Below Poverty |
| No Children | 4,910 (95.1%) | 255 (4.9%) |
| 1 or 2 Children | 1,446 (96.3%) | 56 (3.7%) |
| 3 or 4 Children | 452 (68.7%) | 206 (31.3%) |
| 5 or more Children | 8 (88.9%) | 1 (11.1%) |
| Total | 6,816 (92.9%) | 518 (7.1%) |
Income Below Poverty Among Single-Parent Households in Edgecombe County
According to the poverty data in Edgecombe County, 30.7% or 411 single-father households and 35.6% or 1,601 single-mother households are living below the poverty line. Among single-father households, those with 3 or 4 children have the highest poverty rate, with 20 households (46.5%) experiencing poverty. Likewise, among single-mother households, those with 5 or more children have the highest poverty rate, with 12 households (100.0%) falling below the poverty line.
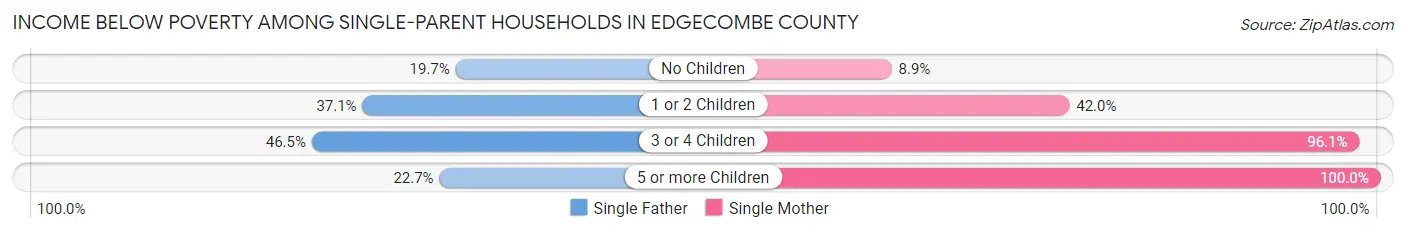
| Children | Single Father | Single Mother |
| No Children | 98 (19.7%) | 135 (8.9%) |
| 1 or 2 Children | 288 (37.1%) | 1,089 (42.0%) |
| 3 or 4 Children | 20 (46.5%) | 365 (96.1%) |
| 5 or more Children | 5 (22.7%) | 12 (100.0%) |
| Total | 411 (30.7%) | 1,601 (35.6%) |
Income Below Poverty Among Married-Couple vs Single-Parent Households in Edgecombe County
The poverty data for Edgecombe County shows that 518 of the married-couple family households (7.1%) and 2,012 of the single-parent households (34.5%) are living below the poverty level. Within the married-couple family households, those with 3 or 4 children have the highest poverty rate, with 206 households (31.3%) falling below the poverty line. Among the single-parent households, those with 3 or 4 children have the highest poverty rate, with 385 household (91.0%) living below poverty.
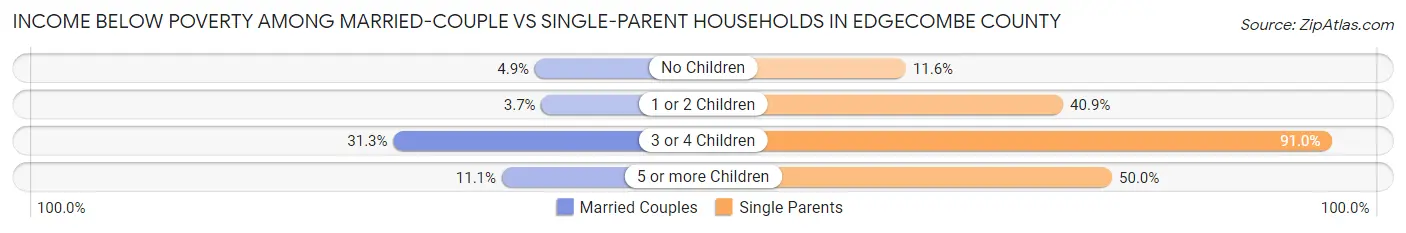
| Children | Married-Couple Families | Single-Parent Households |
| No Children | 255 (4.9%) | 233 (11.6%) |
| 1 or 2 Children | 56 (3.7%) | 1,377 (40.9%) |
| 3 or 4 Children | 206 (31.3%) | 385 (91.0%) |
| 5 or more Children | 1 (11.1%) | 17 (50.0%) |
| Total | 518 (7.1%) | 2,012 (34.5%) |
Race in Edgecombe County
The most populous races in Edgecombe County are Black / African American (27,597 | 56.2%), White / Caucasian (18,815 | 38.4%), and Hispanic or Latino (2,652 | 5.4%).
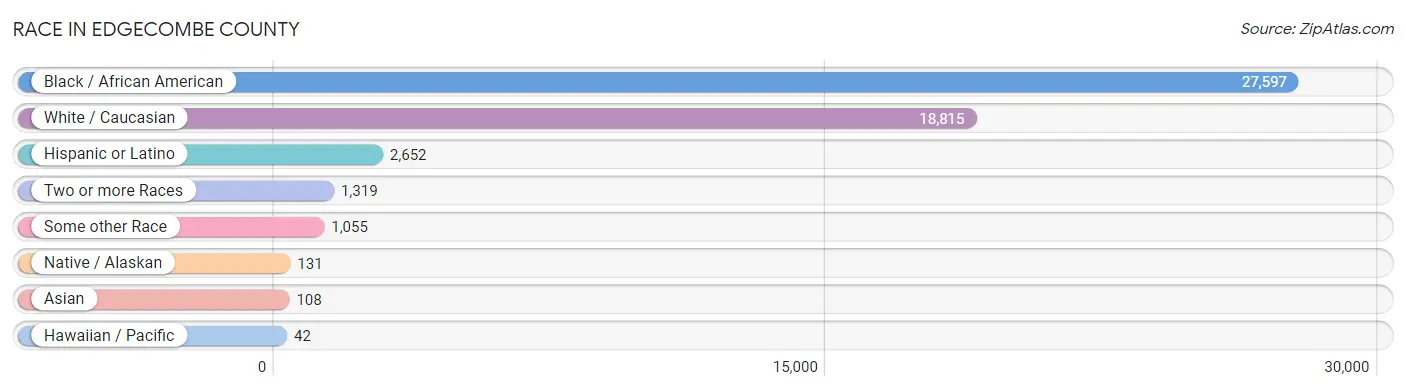
| Race | # Population | % Population |
| Asian | 108 | 0.2% |
| Black / African American | 27,597 | 56.2% |
| Hawaiian / Pacific | 42 | 0.1% |
| Hispanic or Latino | 2,652 | 5.4% |
| Native / Alaskan | 131 | 0.3% |
| White / Caucasian | 18,815 | 38.4% |
| Two or more Races | 1,319 | 2.7% |
| Some other Race | 1,055 | 2.1% |
| Total | 49,067 | 100.0% |
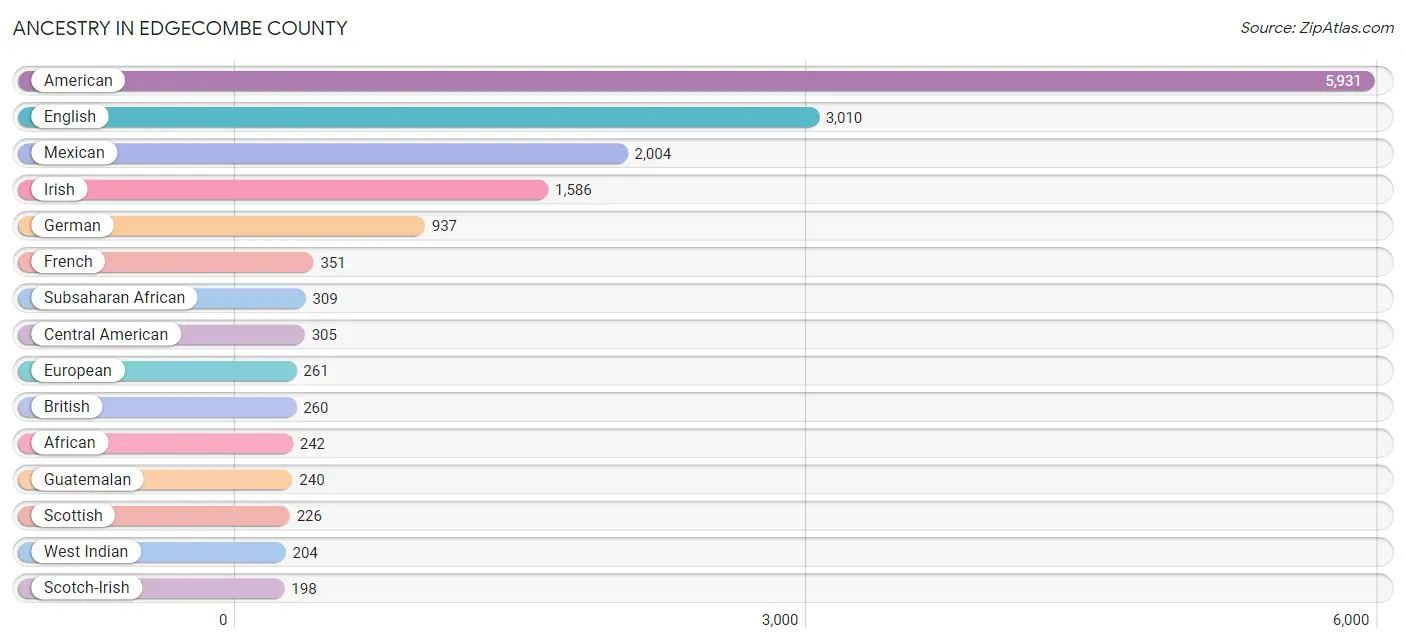
Ancestry in Edgecombe County
The most populous ancestries reported in Edgecombe County are American (5,931 | 12.1%), English (3,010 | 6.1%), Mexican (2,004 | 4.1%), Irish (1,586 | 3.2%), and German (937 | 1.9%), together accounting for 27.4% of all Edgecombe County residents.
| Ancestry | # Population | % Population |
| African | 242 | 0.5% |
| American | 5,931 | 12.1% |
| Arab | 39 | 0.1% |
| Bangladeshi | 43 | 0.1% |
| Bhutanese | 30 | 0.1% |
| Blackfeet | 8 | 0.0% |
| British | 260 | 0.5% |
| Burmese | 1 | 0.0% |
| Central American | 305 | 0.6% |
| Cherokee | 189 | 0.4% |
| Cheyenne | 18 | 0.0% |
| Colombian | 38 | 0.1% |
| Creek | 20 | 0.0% |
| Czech | 2 | 0.0% |
| Dominican | 134 | 0.3% |
| Dutch | 46 | 0.1% |
| Eastern European | 6 | 0.0% |
| English | 3,010 | 6.1% |
| European | 261 | 0.5% |
| Filipino | 11 | 0.0% |
| French | 351 | 0.7% |
| French Canadian | 46 | 0.1% |
| German | 937 | 1.9% |
| Ghanaian | 67 | 0.1% |
| Greek | 24 | 0.1% |
| Guatemalan | 240 | 0.5% |
| Guyanese | 28 | 0.1% |
| Haitian | 110 | 0.2% |
| Honduran | 50 | 0.1% |
| Indian (Asian) | 88 | 0.2% |
| Irish | 1,586 | 3.2% |
| Italian | 172 | 0.4% |
| Jamaican | 76 | 0.2% |
| Korean | 64 | 0.1% |
| Lebanese | 35 | 0.1% |
| Lumbee | 57 | 0.1% |
| Mexican | 2,004 | 4.1% |
| Mexican American Indian | 7 | 0.0% |
| Native Hawaiian | 6 | 0.0% |
| Northern European | 5 | 0.0% |
| Norwegian | 24 | 0.1% |
| Panamanian | 13 | 0.0% |
| Peruvian | 46 | 0.1% |
| Polish | 43 | 0.1% |
| Puerto Rican | 41 | 0.1% |
| Russian | 14 | 0.0% |
| Salvadoran | 2 | 0.0% |
| Samoan | 54 | 0.1% |
| Scotch-Irish | 198 | 0.4% |
| Scottish | 226 | 0.5% |
| South American | 84 | 0.2% |
| South American Indian | 10 | 0.0% |
| Sri Lankan | 52 | 0.1% |
| Subsaharan African | 309 | 0.6% |
| Swedish | 8 | 0.0% |
| Syrian | 4 | 0.0% |
| Thai | 58 | 0.1% |
| Ukrainian | 7 | 0.0% |
| Welsh | 52 | 0.1% |
| West Indian | 204 | 0.4% |
| Yugoslavian | 12 | 0.0% | View All 61 Rows |
Immigrants in Edgecombe County
The most numerous immigrant groups reported in Edgecombe County came from Latin America (1,126 | 2.3%), Central America (904 | 1.8%), Mexico (701 | 1.4%), Asia (154 | 0.3%), and Guatemala (152 | 0.3%), together accounting for 6.2% of all Edgecombe County residents.
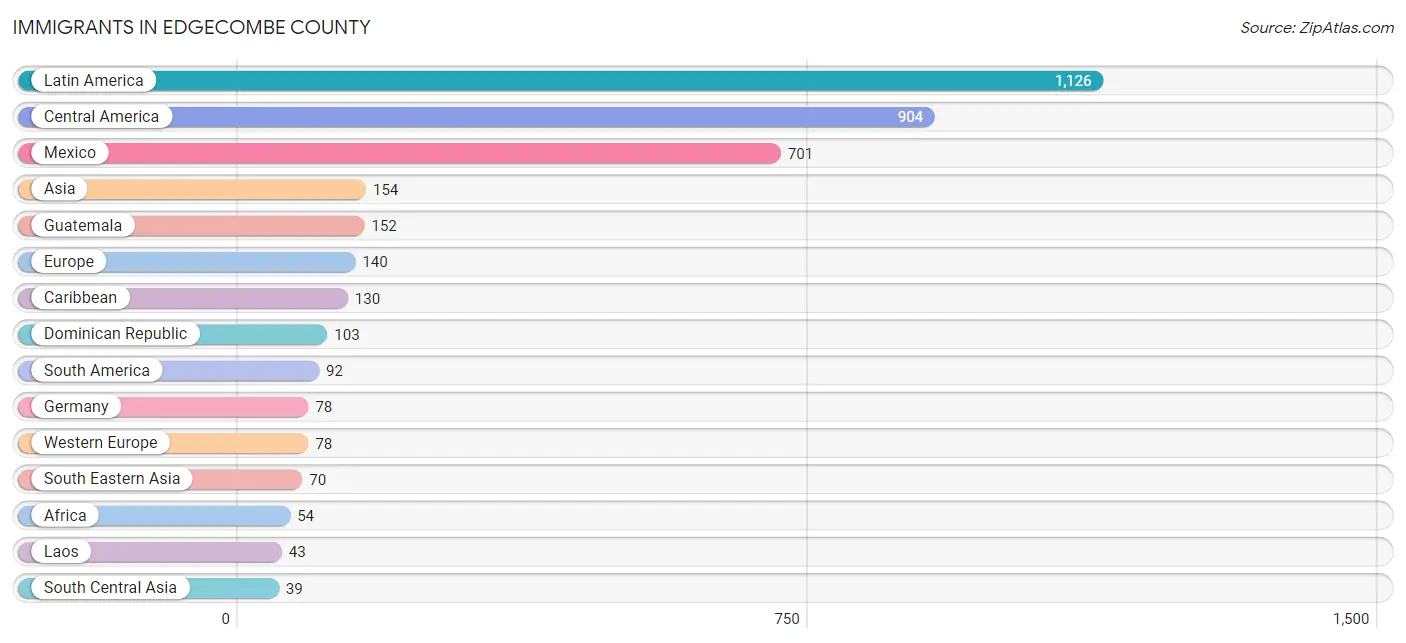
| Immigration Origin | # Population | % Population |
| Africa | 54 | 0.1% |
| Asia | 154 | 0.3% |
| Bangladesh | 2 | 0.0% |
| Canada | 15 | 0.0% |
| Caribbean | 130 | 0.3% |
| Central America | 904 | 1.8% |
| China | 32 | 0.1% |
| Colombia | 25 | 0.1% |
| Dominican Republic | 103 | 0.2% |
| Eastern Asia | 32 | 0.1% |
| Ecuador | 32 | 0.1% |
| England | 1 | 0.0% |
| Europe | 140 | 0.3% |
| Germany | 78 | 0.2% |
| Guatemala | 152 | 0.3% |
| Honduras | 38 | 0.1% |
| India | 22 | 0.0% |
| Italy | 6 | 0.0% |
| Laos | 43 | 0.1% |
| Latin America | 1,126 | 2.3% |
| Mexico | 701 | 1.4% |
| Northern Europe | 38 | 0.1% |
| Panama | 13 | 0.0% |
| Peru | 35 | 0.1% |
| Philippines | 16 | 0.0% |
| Scotland | 9 | 0.0% |
| South America | 92 | 0.2% |
| South Central Asia | 39 | 0.1% |
| South Eastern Asia | 70 | 0.1% |
| Southern Europe | 24 | 0.1% |
| Sri Lanka | 15 | 0.0% |
| Syria | 4 | 0.0% |
| Taiwan | 20 | 0.0% |
| Trinidad and Tobago | 27 | 0.1% |
| Turkey | 9 | 0.0% |
| Vietnam | 11 | 0.0% |
| Western Africa | 8 | 0.0% |
| Western Asia | 13 | 0.0% |
| Western Europe | 78 | 0.2% | View All 39 Rows |
Sex and Age in Edgecombe County
Sex and Age in Edgecombe County
The most populous age groups in Edgecombe County are 60 to 64 Years (1,744 | 7.6%) for men and 60 to 64 Years (2,137 | 8.2%) for women.
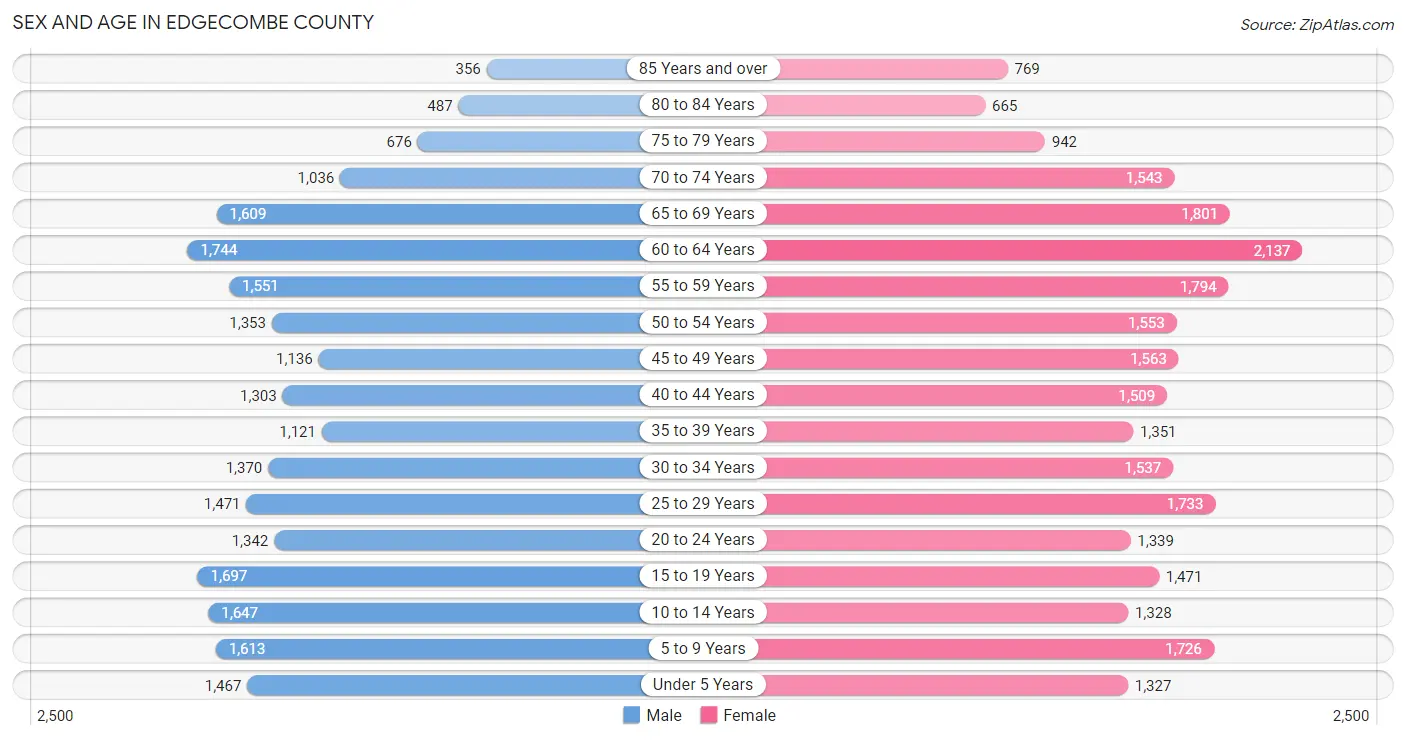
| Age Bracket | Male | Female |
| Under 5 Years | 1,467 (6.4%) | 1,327 (5.1%) |
| 5 to 9 Years | 1,613 (7.0%) | 1,726 (6.6%) |
| 10 to 14 Years | 1,647 (7.2%) | 1,328 (5.1%) |
| 15 to 19 Years | 1,697 (7.4%) | 1,471 (5.6%) |
| 20 to 24 Years | 1,342 (5.8%) | 1,339 (5.1%) |
| 25 to 29 Years | 1,471 (6.4%) | 1,733 (6.6%) |
| 30 to 34 Years | 1,370 (6.0%) | 1,537 (5.9%) |
| 35 to 39 Years | 1,121 (4.9%) | 1,351 (5.2%) |
| 40 to 44 Years | 1,303 (5.7%) | 1,509 (5.8%) |
| 45 to 49 Years | 1,136 (4.9%) | 1,563 (6.0%) |
| 50 to 54 Years | 1,353 (5.9%) | 1,553 (5.9%) |
| 55 to 59 Years | 1,551 (6.8%) | 1,794 (6.9%) |
| 60 to 64 Years | 1,744 (7.6%) | 2,137 (8.2%) |
| 65 to 69 Years | 1,609 (7.0%) | 1,801 (6.9%) |
| 70 to 74 Years | 1,036 (4.5%) | 1,543 (5.9%) |
| 75 to 79 Years | 676 (2.9%) | 942 (3.6%) |
| 80 to 84 Years | 487 (2.1%) | 665 (2.5%) |
| 85 Years and over | 356 (1.5%) | 769 (2.9%) |
| Total | 22,979 (100.0%) | 26,088 (100.0%) |
Families and Households in Edgecombe County
Median Family Size in Edgecombe County
The median family size in Edgecombe County is 3.01 persons per family, with married-couple families (7,334 | 55.7%) accounting for the largest median family size of 3.11 persons per family. On the other hand, single male/father families (1,339 | 10.2%) represent the smallest median family size with 2.71 persons per family.
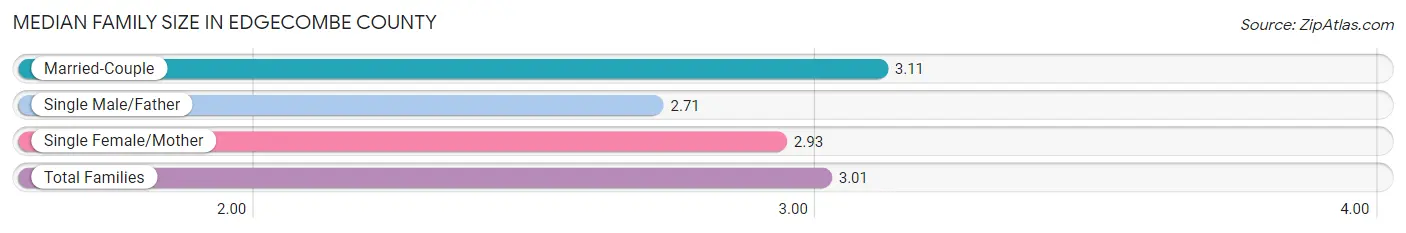
| Family Type | # Families | Family Size |
| Married-Couple | 7,334 (55.7%) | 3.11 |
| Single Male/Father | 1,339 (10.2%) | 2.71 |
| Single Female/Mother | 4,495 (34.1%) | 2.93 |
| Total Families | 13,168 (100.0%) | 3.01 |
Median Household Size in Edgecombe County
The median household size in Edgecombe County is 2.50 persons per household, with married-couple households (7,334 | 37.9%) accounting for the largest median household size of 3.14 persons per household. non-family households (6,182 | 32.0%) represent the smallest median household size with 1.15 persons per household.
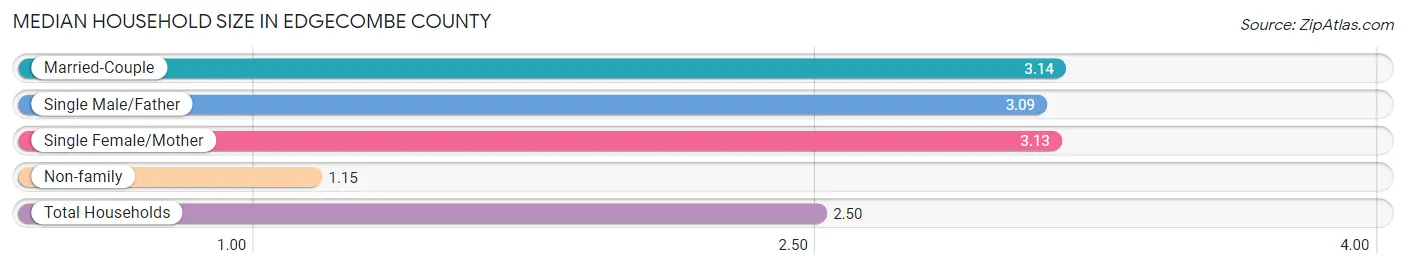
| Household Type | # Households | Household Size |
| Married-Couple | 7,334 (37.9%) | 3.14 |
| Single Male/Father | 1,339 (6.9%) | 3.09 |
| Single Female/Mother | 4,495 (23.2%) | 3.13 |
| Non-family | 6,182 (32.0%) | 1.15 |
| Total Households | 19,350 (100.0%) | 2.50 |
Household Size by Marriage Status in Edgecombe County
Out of a total of 19,350 households in Edgecombe County, 13,168 (68.0%) are family households, while 6,182 (32.0%) are nonfamily households. The most numerous type of family households are 2-person households, comprising 5,973, and the most common type of nonfamily households are 1-person households, comprising 5,418.
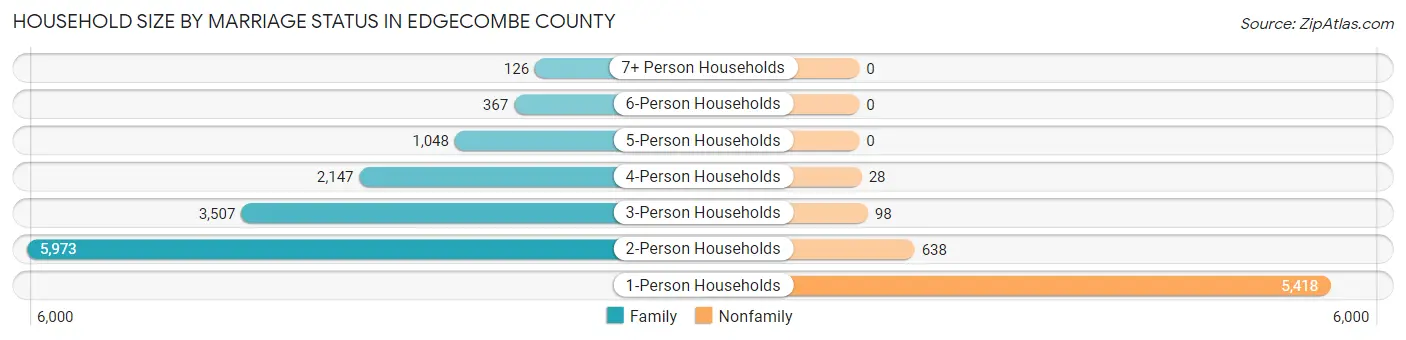
| Household Size | Family Households | Nonfamily Households |
| 1-Person Households | - | 5,418 (28.0%) |
| 2-Person Households | 5,973 (30.9%) | 638 (3.3%) |
| 3-Person Households | 3,507 (18.1%) | 98 (0.5%) |
| 4-Person Households | 2,147 (11.1%) | 28 (0.1%) |
| 5-Person Households | 1,048 (5.4%) | 0 (0.0%) |
| 6-Person Households | 367 (1.9%) | 0 (0.0%) |
| 7+ Person Households | 126 (0.6%) | 0 (0.0%) |
| Total | 13,168 (68.0%) | 6,182 (32.0%) |
Female Fertility in Edgecombe County
Fertility by Age in Edgecombe County
Average fertility rate in Edgecombe County is 48.0 births per 1,000 women. Women in the age bracket of 20 to 34 years have the highest fertility rate with 95.0 births per 1,000 women. Women in the age bracket of 20 to 34 years acount for 83.2% of all women with births.
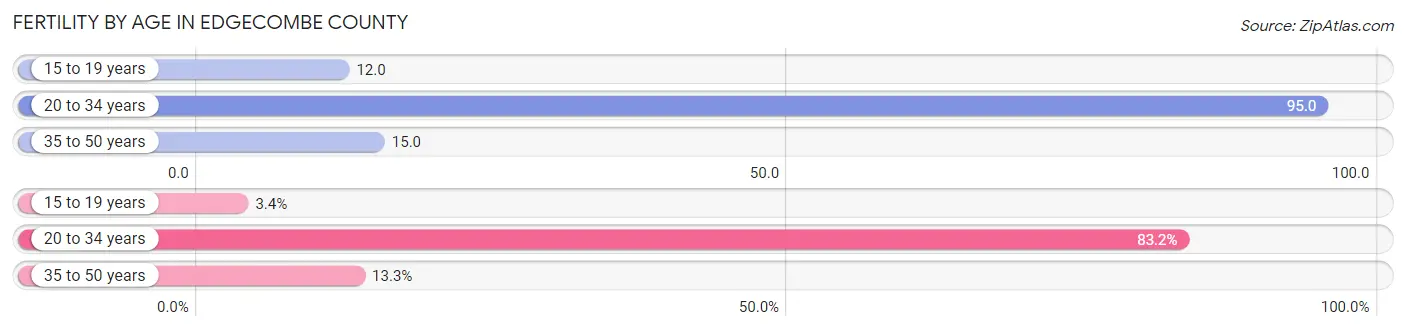
| Age Bracket | Women with Births | Births / 1,000 Women |
| 15 to 19 years | 18 (3.4%) | 12.0 |
| 20 to 34 years | 437 (83.2%) | 95.0 |
| 35 to 50 years | 70 (13.3%) | 15.0 |
| Total | 525 (100.0%) | 48.0 |
Fertility by Age by Marriage Status in Edgecombe County
29.0% of women with births (525) in Edgecombe County are married. The highest percentage of unmarried women with births falls into 15 to 19 years age bracket with 100.0% of them unmarried at the time of birth, while the lowest percentage of unmarried women with births belong to 20 to 34 years age bracket with 69.6% of them unmarried.
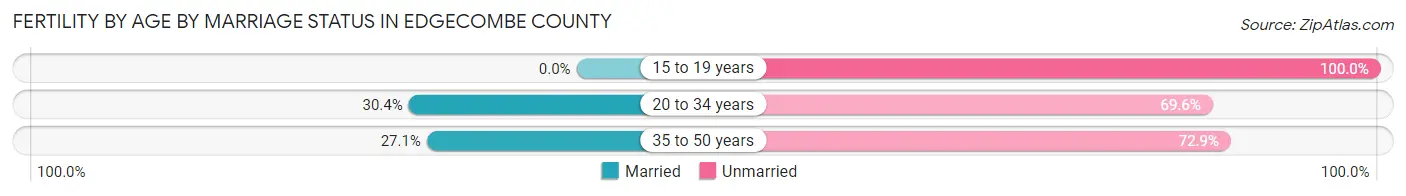
| Age Bracket | Married | Unmarried |
| 15 to 19 years | 0 (0.0%) | 18 (100.0%) |
| 20 to 34 years | 133 (30.4%) | 304 (69.6%) |
| 35 to 50 years | 19 (27.1%) | 51 (72.9%) |
| Total | 152 (28.9%) | 373 (71.1%) |
Fertility by Education in Edgecombe County
Average fertility rate in Edgecombe County is 48.0 births per 1,000 women. Women with the education attainment of high school diploma have the highest fertility rate of 84.0 births per 1,000 women, while women with the education attainment of graduate degree have the lowest fertility at 15.0 births per 1,000 women. Women with the education attainment of high school diploma represent 48.9% of all women with births.
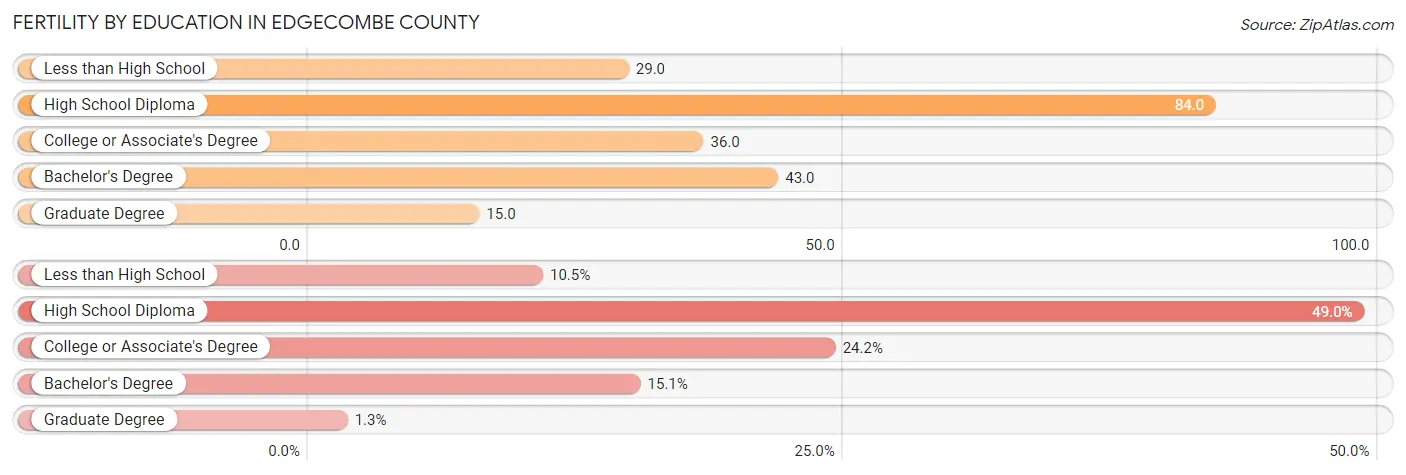
| Educational Attainment | Women with Births | Births / 1,000 Women |
| Less than High School | 55 (10.5%) | 29.0 |
| High School Diploma | 257 (48.9%) | 84.0 |
| College or Associate's Degree | 127 (24.2%) | 36.0 |
| Bachelor's Degree | 79 (15.0%) | 43.0 |
| Graduate Degree | 7 (1.3%) | 15.0 |
| Total | 525 (100.0%) | 48.0 |
Fertility by Education by Marriage Status in Edgecombe County
71.1% of women with births in Edgecombe County are unmarried. Women with the educational attainment of graduate degree are most likely to be married with 100.0% of them married at childbirth, while women with the educational attainment of high school diploma are least likely to be married with 89.5% of them unmarried at childbirth.
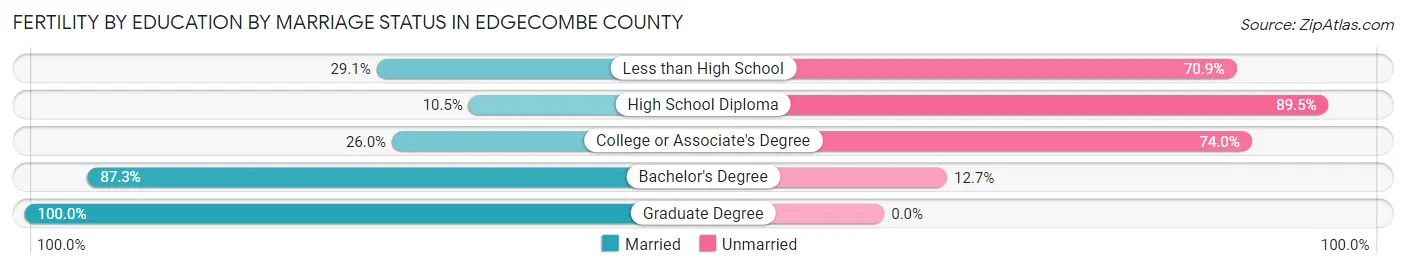
| Educational Attainment | Married | Unmarried |
| Less than High School | 16 (29.1%) | 39 (70.9%) |
| High School Diploma | 27 (10.5%) | 230 (89.5%) |
| College or Associate's Degree | 33 (26.0%) | 94 (74.0%) |
| Bachelor's Degree | 69 (87.3%) | 10 (12.7%) |
| Graduate Degree | 7 (100.0%) | 0 (0.0%) |
| Total | 152 (28.9%) | 373 (71.1%) |
Employment Characteristics in Edgecombe County
Employment by Class of Employer in Edgecombe County
Among the 20,021 employed individuals in Edgecombe County, private company employees (14,237 | 71.1%), local government employees (1,656 | 8.3%), and state government employees (1,104 | 5.5%) make up the most common classes of employment.
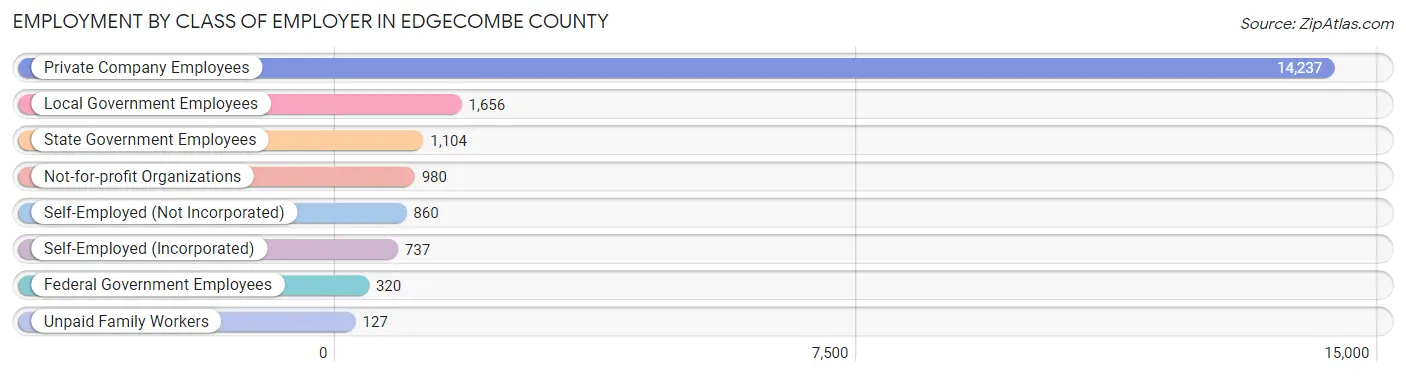
| Employer Class | # Employees | % Employees |
| Private Company Employees | 14,237 | 71.1% |
| Self-Employed (Incorporated) | 737 | 3.7% |
| Self-Employed (Not Incorporated) | 860 | 4.3% |
| Not-for-profit Organizations | 980 | 4.9% |
| Local Government Employees | 1,656 | 8.3% |
| State Government Employees | 1,104 | 5.5% |
| Federal Government Employees | 320 | 1.6% |
| Unpaid Family Workers | 127 | 0.6% |
| Total | 20,021 | 100.0% |
Employment Status by Age in Edgecombe County
According to the labor force statistics for Edgecombe County, out of the total population over 16 years of age (39,414), 56.6% or 22,308 individuals are in the labor force, with 8.6% or 1,918 of them unemployed. The age group with the highest labor force participation rate is 25 to 29 years, with 83.5% or 2,675 individuals in the labor force. Within the labor force, the 16 to 19 years age range has the highest percentage of unemployed individuals, with 29.8% or 263 of them being unemployed.
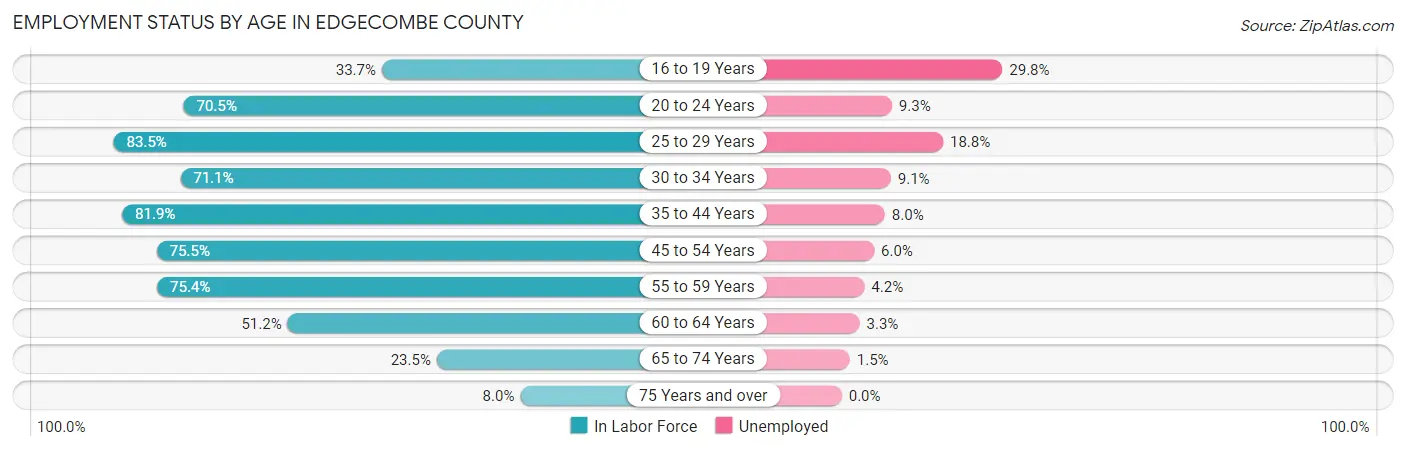
| Age Bracket | In Labor Force | Unemployed |
| 16 to 19 Years | 884 (33.7%) | 263 (29.8%) |
| 20 to 24 Years | 1,890 (70.5%) | 176 (9.3%) |
| 25 to 29 Years | 2,675 (83.5%) | 503 (18.8%) |
| 30 to 34 Years | 2,067 (71.1%) | 188 (9.1%) |
| 35 to 44 Years | 4,328 (81.9%) | 346 (8.0%) |
| 45 to 54 Years | 4,232 (75.5%) | 254 (6.0%) |
| 55 to 59 Years | 2,522 (75.4%) | 106 (4.2%) |
| 60 to 64 Years | 1,987 (51.2%) | 66 (3.3%) |
| 65 to 74 Years | 1,407 (23.5%) | 21 (1.5%) |
| 75 Years and over | 312 (8.0%) | 0 (0.0%) |
| Total | 22,308 (56.6%) | 1,918 (8.6%) |
Employment Status by Educational Attainment in Edgecombe County
According to labor force statistics for Edgecombe County, 73.5% of individuals (17,806) out of the total population between 25 and 64 years of age (24,226) are in the labor force, with 8.2% or 1,460 of them being unemployed. The group with the highest labor force participation rate are those with the educational attainment of bachelor's degree or higher, with 86.2% or 3,711 individuals in the labor force. Within the labor force, individuals with less than high school education have the highest percentage of unemployment, with 18.5% or 281 of them being unemployed.
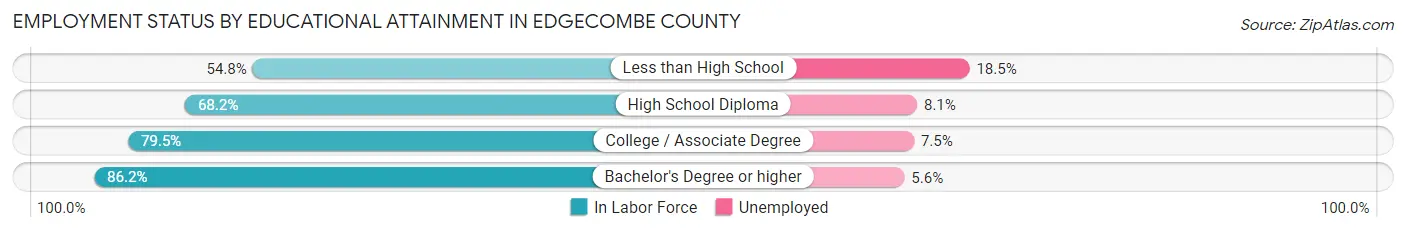
| Educational Attainment | In Labor Force | Unemployed |
| Less than High School | 1,519 (54.8%) | 513 (18.5%) |
| High School Diploma | 6,347 (68.2%) | 754 (8.1%) |
| College / Associate Degree | 6,235 (79.5%) | 588 (7.5%) |
| Bachelor's Degree or higher | 3,711 (86.2%) | 241 (5.6%) |
| Total | 17,806 (73.5%) | 1,987 (8.2%) |
Employment Occupations by Sex in Edgecombe County
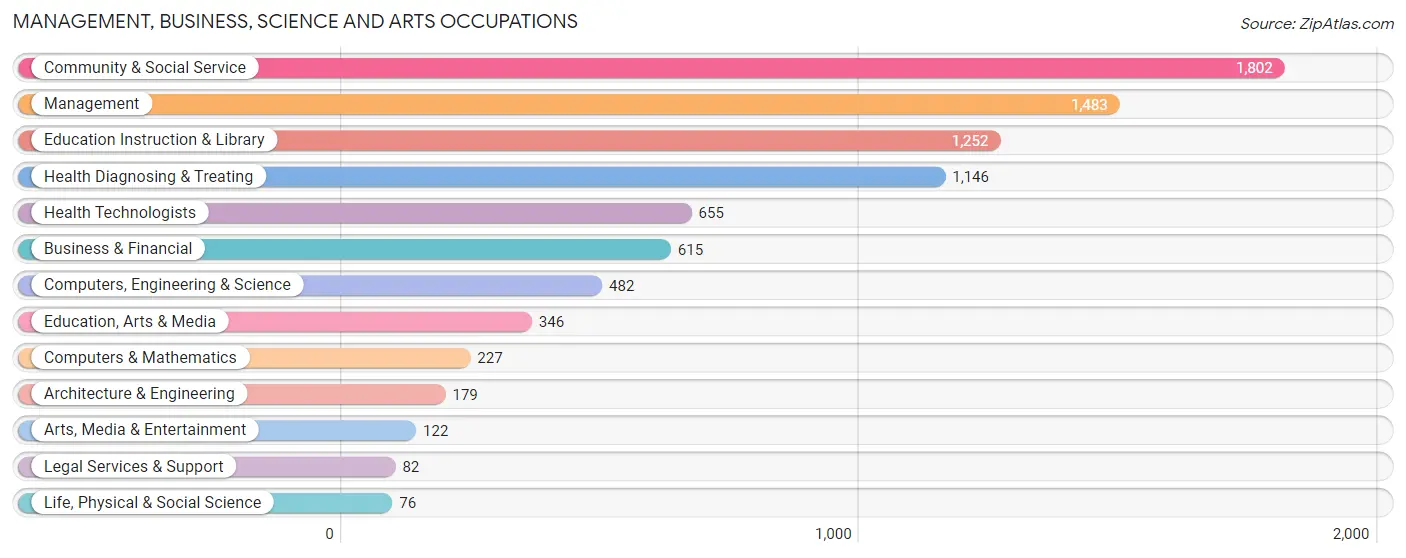
Management, Business, Science and Arts Occupations
The most common Management, Business, Science and Arts occupations in Edgecombe County are Community & Social Service (1,802 | 8.8%), Management (1,483 | 7.3%), Education Instruction & Library (1,252 | 6.1%), Health Diagnosing & Treating (1,146 | 5.6%), and Health Technologists (655 | 3.2%).
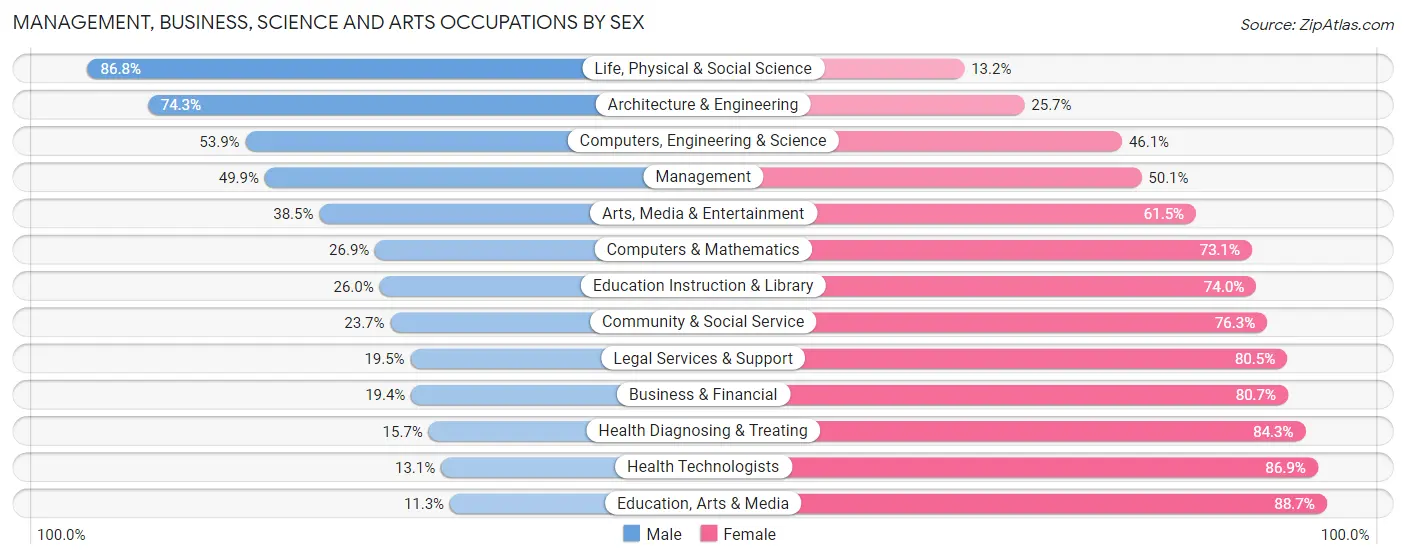
Management, Business, Science and Arts Occupations by Sex
Within the Management, Business, Science and Arts occupations in Edgecombe County, the most male-oriented occupations are Life, Physical & Social Science (86.8%), Architecture & Engineering (74.3%), and Computers, Engineering & Science (53.9%), while the most female-oriented occupations are Education, Arts & Media (88.7%), Health Technologists (86.9%), and Health Diagnosing & Treating (84.3%).
| Occupation | Male | Female |
| Management | 740 (49.9%) | 743 (50.1%) |
| Business & Financial | 119 (19.4%) | 496 (80.6%) |
| Computers, Engineering & Science | 260 (53.9%) | 222 (46.1%) |
| Computers & Mathematics | 61 (26.9%) | 166 (73.1%) |
| Architecture & Engineering | 133 (74.3%) | 46 (25.7%) |
| Life, Physical & Social Science | 66 (86.8%) | 10 (13.2%) |
| Community & Social Service | 427 (23.7%) | 1,375 (76.3%) |
| Education, Arts & Media | 39 (11.3%) | 307 (88.7%) |
| Legal Services & Support | 16 (19.5%) | 66 (80.5%) |
| Education Instruction & Library | 325 (26.0%) | 927 (74.0%) |
| Arts, Media & Entertainment | 47 (38.5%) | 75 (61.5%) |
| Health Diagnosing & Treating | 180 (15.7%) | 966 (84.3%) |
| Health Technologists | 86 (13.1%) | 569 (86.9%) |
| Total (Category) | 1,726 (31.2%) | 3,802 (68.8%) |
| Total (Overall) | 9,465 (46.5%) | 10,901 (53.5%) |
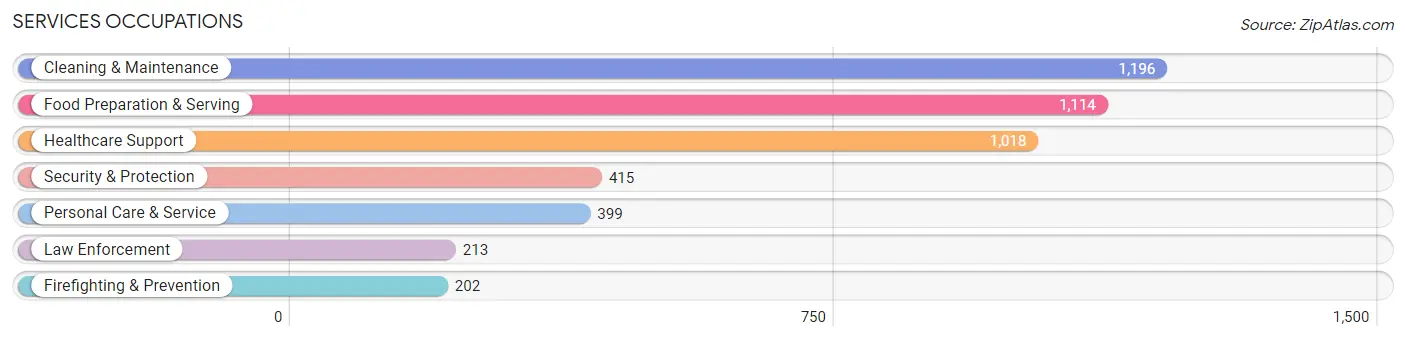
Services Occupations
The most common Services occupations in Edgecombe County are Cleaning & Maintenance (1,196 | 5.9%), Food Preparation & Serving (1,114 | 5.5%), Healthcare Support (1,018 | 5.0%), Security & Protection (415 | 2.0%), and Personal Care & Service (399 | 2.0%).
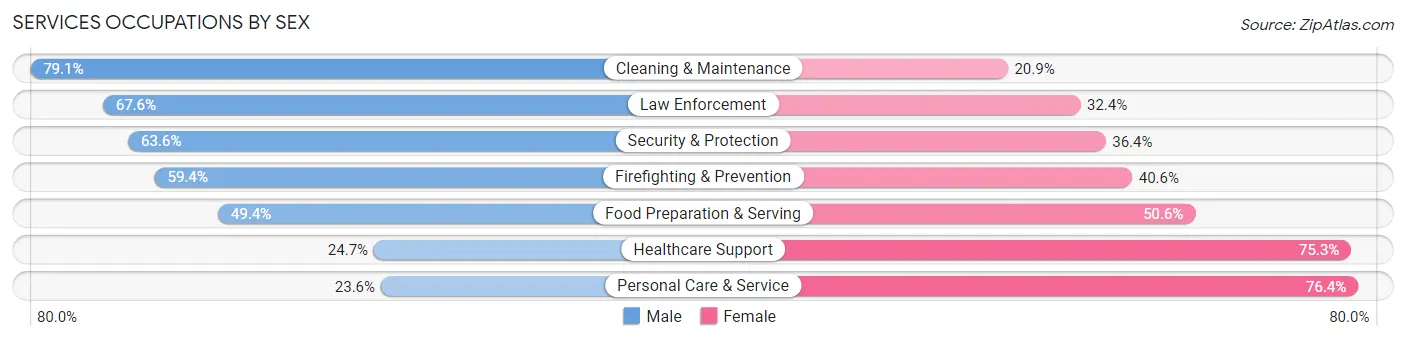
Services Occupations by Sex
Within the Services occupations in Edgecombe County, the most male-oriented occupations are Cleaning & Maintenance (79.1%), Law Enforcement (67.6%), and Security & Protection (63.6%), while the most female-oriented occupations are Personal Care & Service (76.4%), Healthcare Support (75.3%), and Food Preparation & Serving (50.6%).
| Occupation | Male | Female |
| Healthcare Support | 251 (24.7%) | 767 (75.3%) |
| Security & Protection | 264 (63.6%) | 151 (36.4%) |
| Firefighting & Prevention | 120 (59.4%) | 82 (40.6%) |
| Law Enforcement | 144 (67.6%) | 69 (32.4%) |
| Food Preparation & Serving | 550 (49.4%) | 564 (50.6%) |
| Cleaning & Maintenance | 946 (79.1%) | 250 (20.9%) |
| Personal Care & Service | 94 (23.6%) | 305 (76.4%) |
| Total (Category) | 2,105 (50.8%) | 2,037 (49.2%) |
| Total (Overall) | 9,465 (46.5%) | 10,901 (53.5%) |
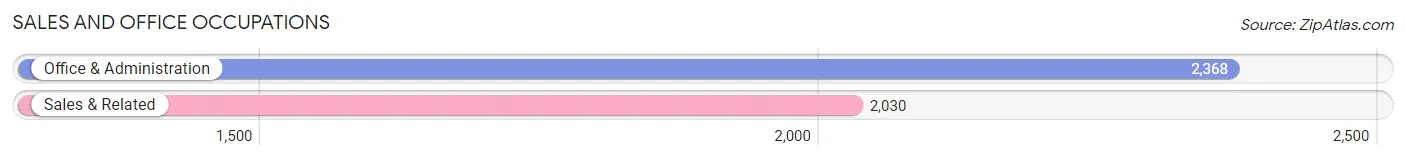
Sales and Office Occupations
The most common Sales and Office occupations in Edgecombe County are Office & Administration (2,368 | 11.6%), and Sales & Related (2,030 | 10.0%).
Sales and Office Occupations by Sex
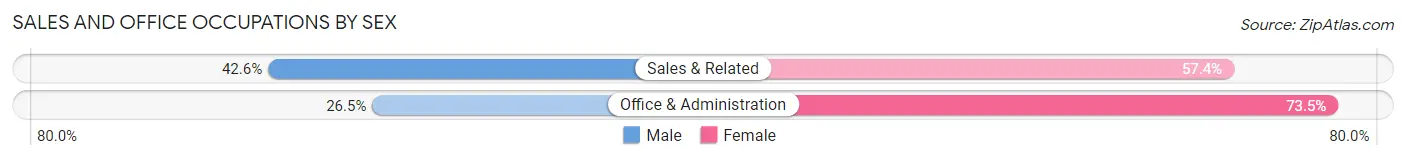
| Occupation | Male | Female |
| Sales & Related | 864 (42.6%) | 1,166 (57.4%) |
| Office & Administration | 628 (26.5%) | 1,740 (73.5%) |
| Total (Category) | 1,492 (33.9%) | 2,906 (66.1%) |
| Total (Overall) | 9,465 (46.5%) | 10,901 (53.5%) |
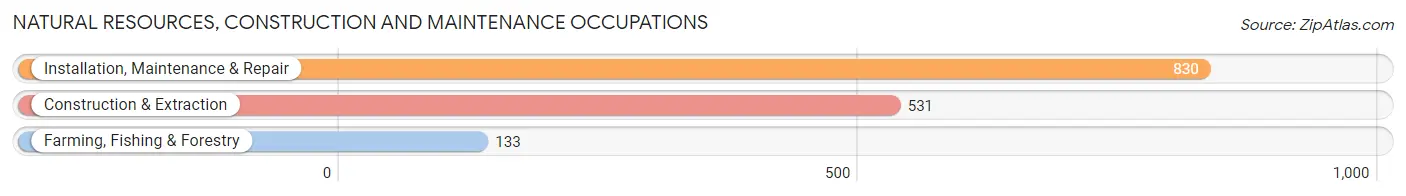
Natural Resources, Construction and Maintenance Occupations
The most common Natural Resources, Construction and Maintenance occupations in Edgecombe County are Installation, Maintenance & Repair (830 | 4.1%), Construction & Extraction (531 | 2.6%), and Farming, Fishing & Forestry (133 | 0.6%).
Natural Resources, Construction and Maintenance Occupations by Sex
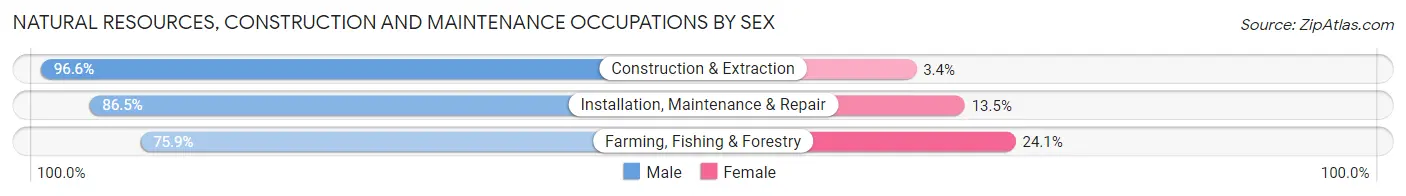
| Occupation | Male | Female |
| Farming, Fishing & Forestry | 101 (75.9%) | 32 (24.1%) |
| Construction & Extraction | 513 (96.6%) | 18 (3.4%) |
| Installation, Maintenance & Repair | 718 (86.5%) | 112 (13.5%) |
| Total (Category) | 1,332 (89.2%) | 162 (10.8%) |
| Total (Overall) | 9,465 (46.5%) | 10,901 (53.5%) |
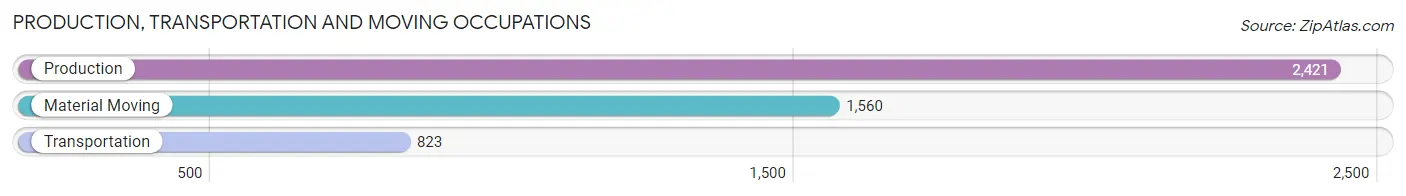
Production, Transportation and Moving Occupations
The most common Production, Transportation and Moving occupations in Edgecombe County are Production (2,421 | 11.9%), Material Moving (1,560 | 7.7%), and Transportation (823 | 4.0%).
Production, Transportation and Moving Occupations by Sex
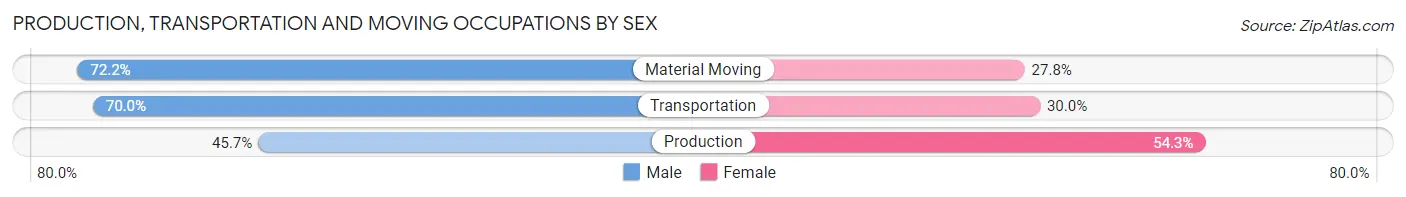
| Occupation | Male | Female |
| Production | 1,107 (45.7%) | 1,314 (54.3%) |
| Transportation | 576 (70.0%) | 247 (30.0%) |
| Material Moving | 1,127 (72.2%) | 433 (27.8%) |
| Total (Category) | 2,810 (58.5%) | 1,994 (41.5%) |
| Total (Overall) | 9,465 (46.5%) | 10,901 (53.5%) |
Employment Industries by Sex in Edgecombe County
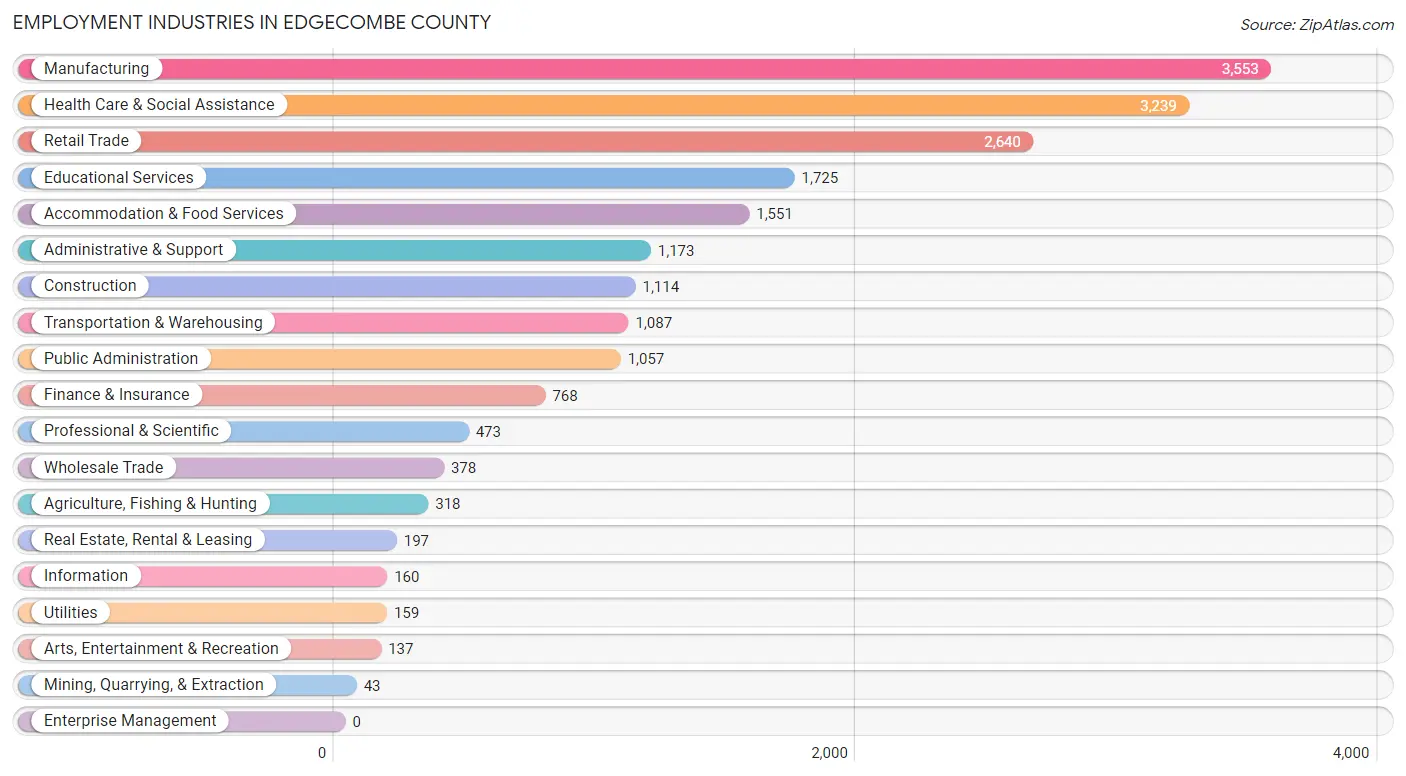
Employment Industries in Edgecombe County
The major employment industries in Edgecombe County include Manufacturing (3,553 | 17.4%), Health Care & Social Assistance (3,239 | 15.9%), Retail Trade (2,640 | 13.0%), Educational Services (1,725 | 8.5%), and Accommodation & Food Services (1,551 | 7.6%).
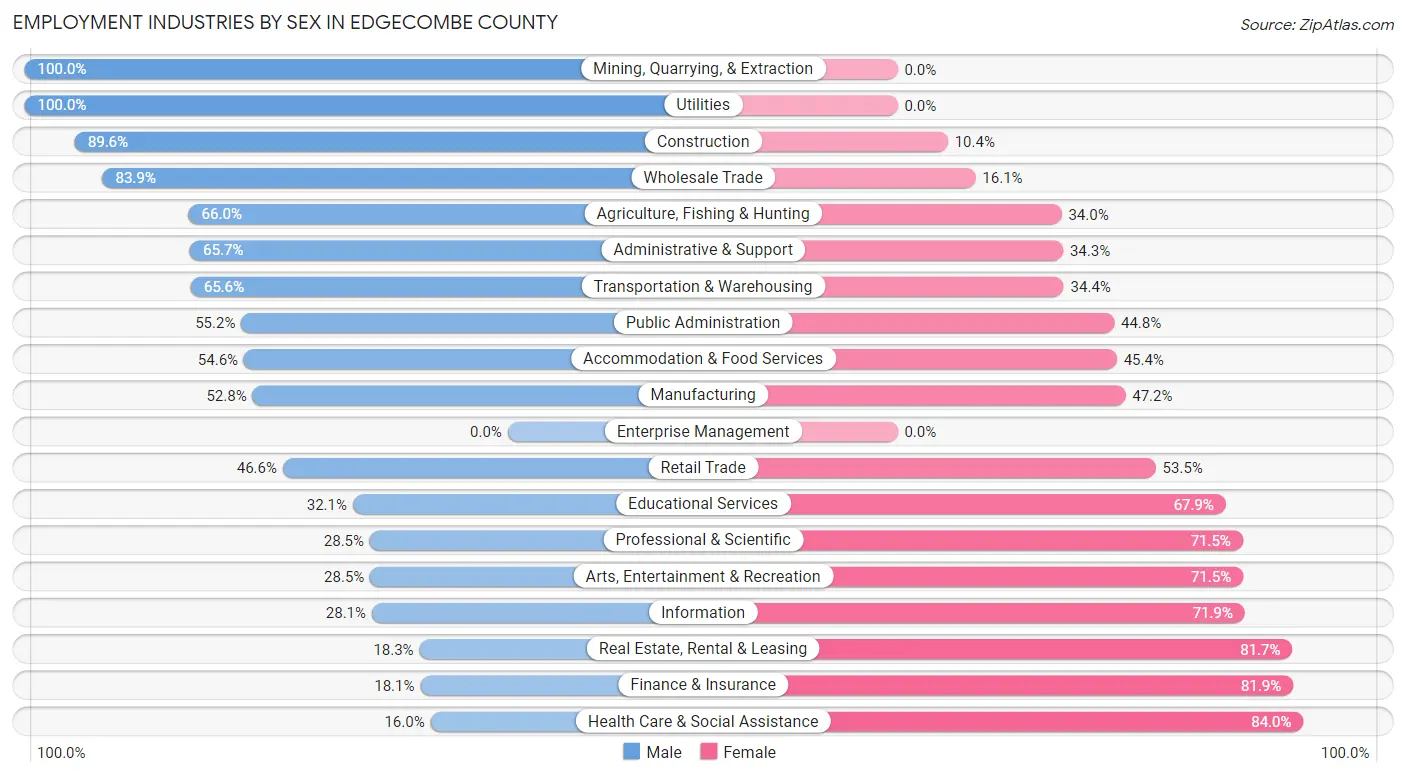
Employment Industries by Sex in Edgecombe County
The Edgecombe County industries that see more men than women are Mining, Quarrying, & Extraction (100.0%), Utilities (100.0%), and Construction (89.6%), whereas the industries that tend to have a higher number of women are Health Care & Social Assistance (84.0%), Finance & Insurance (81.9%), and Real Estate, Rental & Leasing (81.7%).
| Industry | Male | Female |
| Agriculture, Fishing & Hunting | 210 (66.0%) | 108 (34.0%) |
| Mining, Quarrying, & Extraction | 43 (100.0%) | 0 (0.0%) |
| Construction | 998 (89.6%) | 116 (10.4%) |
| Manufacturing | 1,877 (52.8%) | 1,676 (47.2%) |
| Wholesale Trade | 317 (83.9%) | 61 (16.1%) |
| Retail Trade | 1,229 (46.6%) | 1,411 (53.4%) |
| Transportation & Warehousing | 713 (65.6%) | 374 (34.4%) |
| Utilities | 159 (100.0%) | 0 (0.0%) |
| Information | 45 (28.1%) | 115 (71.9%) |
| Finance & Insurance | 139 (18.1%) | 629 (81.9%) |
| Real Estate, Rental & Leasing | 36 (18.3%) | 161 (81.7%) |
| Professional & Scientific | 135 (28.5%) | 338 (71.5%) |
| Enterprise Management | 0 (0.0%) | 0 (0.0%) |
| Administrative & Support | 771 (65.7%) | 402 (34.3%) |
| Educational Services | 553 (32.1%) | 1,172 (67.9%) |
| Health Care & Social Assistance | 518 (16.0%) | 2,721 (84.0%) |
| Arts, Entertainment & Recreation | 39 (28.5%) | 98 (71.5%) |
| Accommodation & Food Services | 847 (54.6%) | 704 (45.4%) |
| Public Administration | 583 (55.2%) | 474 (44.8%) |
| Total | 9,465 (46.5%) | 10,901 (53.5%) |
Education in Edgecombe County
School Enrollment in Edgecombe County
The most common levels of schooling among the 10,303 students in Edgecombe County are high school (2,560 | 24.8%), middle school (2,381 | 23.1%), and elementary school (2,288 | 22.2%).
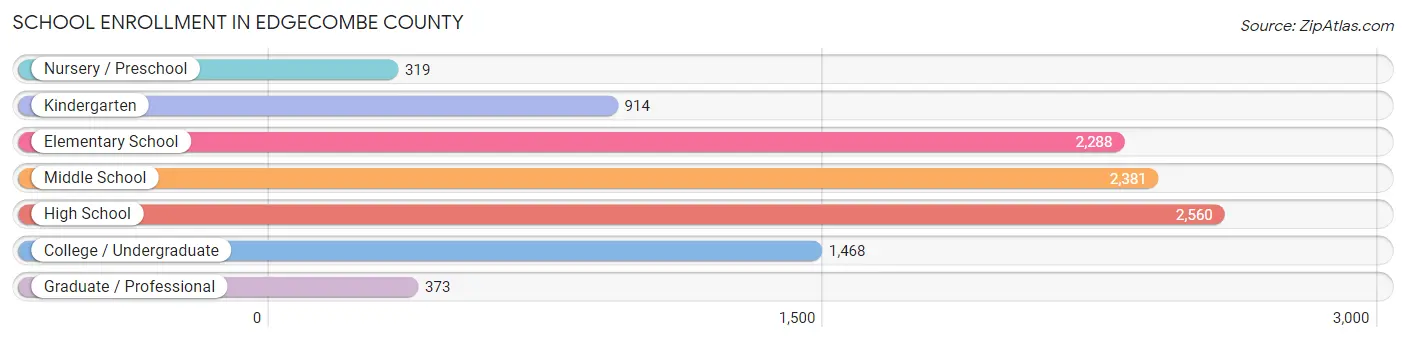
| School Level | # Students | % Students |
| Nursery / Preschool | 319 | 3.1% |
| Kindergarten | 914 | 8.9% |
| Elementary School | 2,288 | 22.2% |
| Middle School | 2,381 | 23.1% |
| High School | 2,560 | 24.8% |
| College / Undergraduate | 1,468 | 14.2% |
| Graduate / Professional | 373 | 3.6% |
| Total | 10,303 | 100.0% |
School Enrollment by Age by Funding Source in Edgecombe County
Out of a total of 10,303 students who are enrolled in schools in Edgecombe County, 927 (9.0%) attend a private institution, while the remaining 9,376 (91.0%) are enrolled in public schools. The age group of 35 years and over has the highest likelihood of being enrolled in private schools, with 217 (42.4% in the age bracket) enrolled. Conversely, the age group of 18 to 19 year olds has the lowest likelihood of being enrolled in a private school, with 549 (100.0% in the age bracket) attending a public institution.
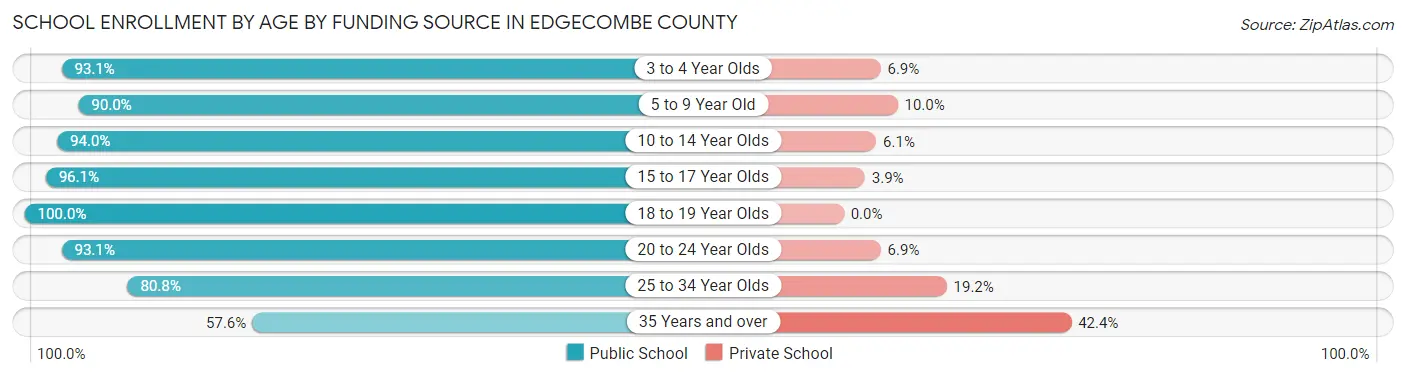
| Age Bracket | Public School | Private School |
| 3 to 4 Year Olds | 244 (93.1%) | 18 (6.9%) |
| 5 to 9 Year Old | 2,701 (90.0%) | 301 (10.0%) |
| 10 to 14 Year Olds | 2,686 (94.0%) | 173 (6.0%) |
| 15 to 17 Year Olds | 1,852 (96.1%) | 76 (3.9%) |
| 18 to 19 Year Olds | 549 (100.0%) | 0 (0.0%) |
| 20 to 24 Year Olds | 662 (93.1%) | 49 (6.9%) |
| 25 to 34 Year Olds | 388 (80.8%) | 92 (19.2%) |
| 35 Years and over | 295 (57.6%) | 217 (42.4%) |
| Total | 9,376 (91.0%) | 927 (9.0%) |
Educational Attainment by Field of Study in Edgecombe County
Education (1,402 | 22.1%), business (1,293 | 20.4%), science & technology (823 | 13.0%), arts & humanities (492 | 7.8%), and social sciences (388 | 6.1%) are the most common fields of study among 6,343 individuals in Edgecombe County who have obtained a bachelor's degree or higher.
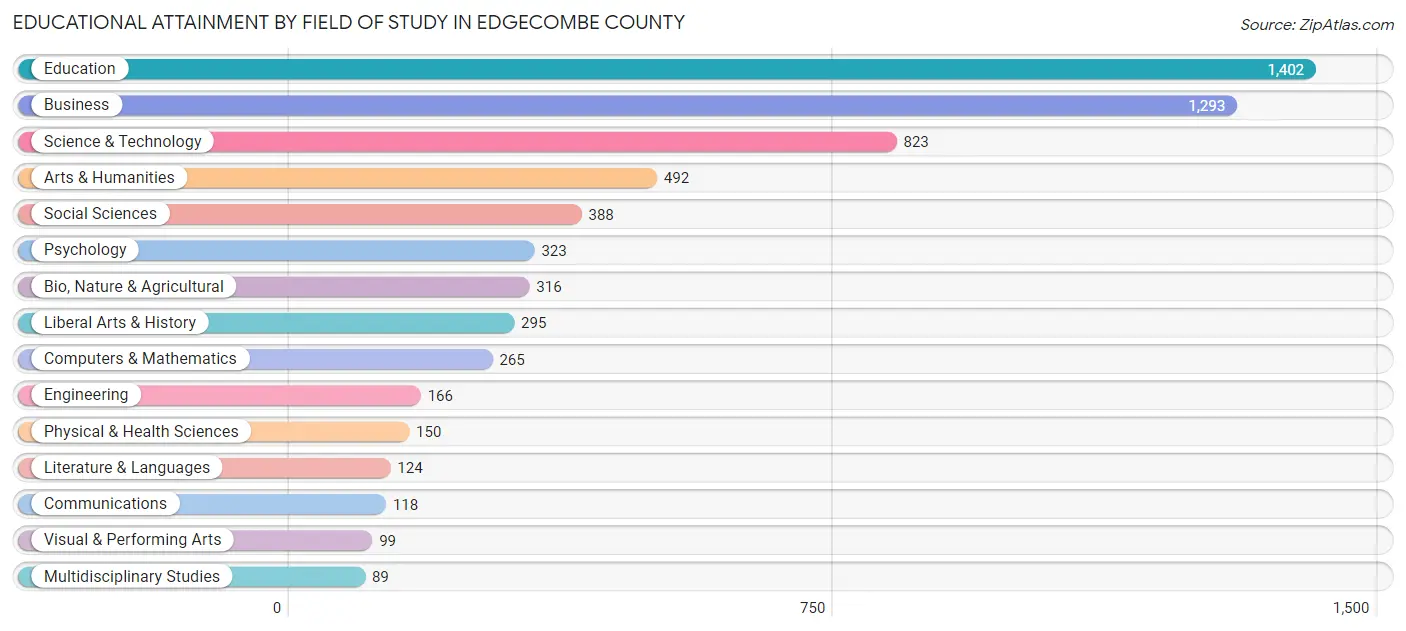
| Field of Study | # Graduates | % Graduates |
| Computers & Mathematics | 265 | 4.2% |
| Bio, Nature & Agricultural | 316 | 5.0% |
| Physical & Health Sciences | 150 | 2.4% |
| Psychology | 323 | 5.1% |
| Social Sciences | 388 | 6.1% |
| Engineering | 166 | 2.6% |
| Multidisciplinary Studies | 89 | 1.4% |
| Science & Technology | 823 | 13.0% |
| Business | 1,293 | 20.4% |
| Education | 1,402 | 22.1% |
| Literature & Languages | 124 | 1.9% |
| Liberal Arts & History | 295 | 4.6% |
| Visual & Performing Arts | 99 | 1.6% |
| Communications | 118 | 1.9% |
| Arts & Humanities | 492 | 7.8% |
| Total | 6,343 | 100.0% |
Transportation & Commute in Edgecombe County
Vehicle Availability by Sex in Edgecombe County
The most prevalent vehicle ownership categories in Edgecombe County are males with 2 vehicles (3,316, accounting for 35.7%) and females with 2 vehicles (3,799, making up 31.1%).
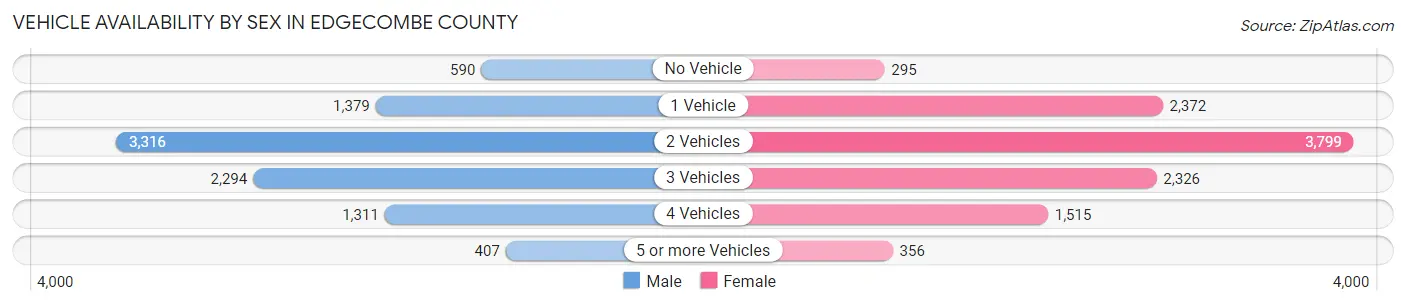
| Vehicles Available | Male | Female |
| No Vehicle | 590 (6.4%) | 295 (2.8%) |
| 1 Vehicle | 1,379 (14.8%) | 2,372 (22.3%) |
| 2 Vehicles | 3,316 (35.7%) | 3,799 (35.6%) |
| 3 Vehicles | 2,294 (24.7%) | 2,326 (21.8%) |
| 4 Vehicles | 1,311 (14.1%) | 1,515 (14.2%) |
| 5 or more Vehicles | 407 (4.4%) | 356 (3.3%) |
| Total | 9,297 (100.0%) | 10,663 (100.0%) |
Commute Time in Edgecombe County
The most frequently occuring commute durations in Edgecombe County are 10 to 14 minutes (3,440 commuters, 18.3%), 15 to 19 minutes (2,843 commuters, 15.1%), and 30 to 34 minutes (2,788 commuters, 14.8%).
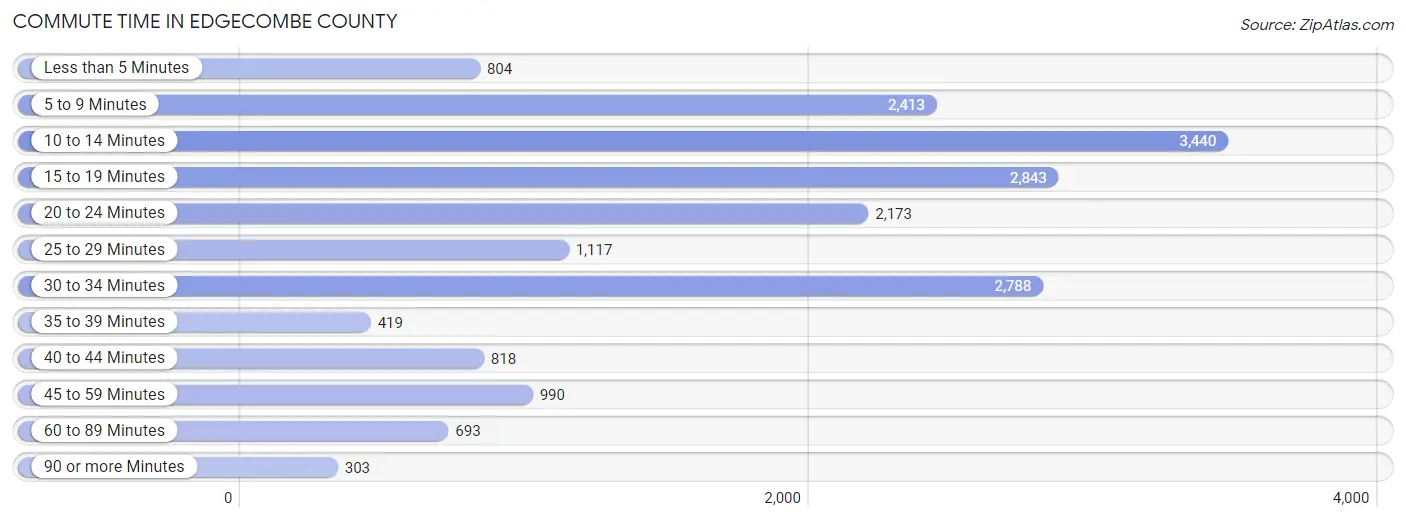
| Commute Time | # Commuters | % Commuters |
| Less than 5 Minutes | 804 | 4.3% |
| 5 to 9 Minutes | 2,413 | 12.8% |
| 10 to 14 Minutes | 3,440 | 18.3% |
| 15 to 19 Minutes | 2,843 | 15.1% |
| 20 to 24 Minutes | 2,173 | 11.6% |
| 25 to 29 Minutes | 1,117 | 5.9% |
| 30 to 34 Minutes | 2,788 | 14.8% |
| 35 to 39 Minutes | 419 | 2.2% |
| 40 to 44 Minutes | 818 | 4.3% |
| 45 to 59 Minutes | 990 | 5.3% |
| 60 to 89 Minutes | 693 | 3.7% |
| 90 or more Minutes | 303 | 1.6% |
Commute Time by Sex in Edgecombe County
The most common commute times in Edgecombe County are 10 to 14 minutes (1,698 commuters, 18.7%) for males and 10 to 14 minutes (1,742 commuters, 17.9%) for females.
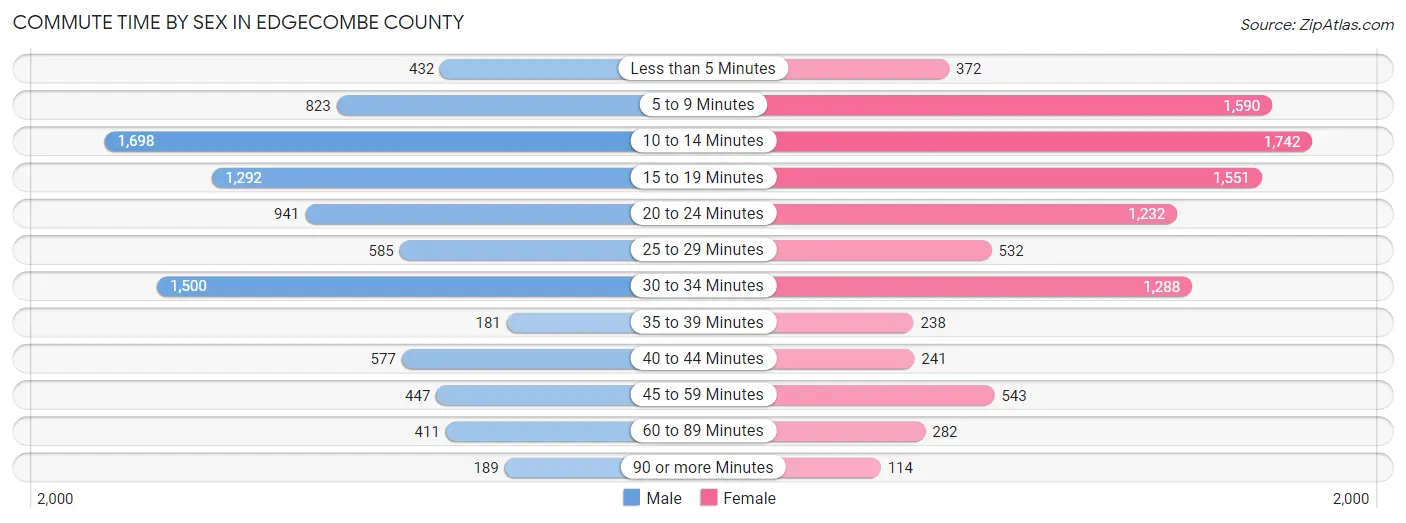
| Commute Time | Male | Female |
| Less than 5 Minutes | 432 (4.8%) | 372 (3.8%) |
| 5 to 9 Minutes | 823 (9.1%) | 1,590 (16.4%) |
| 10 to 14 Minutes | 1,698 (18.7%) | 1,742 (17.9%) |
| 15 to 19 Minutes | 1,292 (14.2%) | 1,551 (16.0%) |
| 20 to 24 Minutes | 941 (10.4%) | 1,232 (12.7%) |
| 25 to 29 Minutes | 585 (6.5%) | 532 (5.5%) |
| 30 to 34 Minutes | 1,500 (16.5%) | 1,288 (13.2%) |
| 35 to 39 Minutes | 181 (2.0%) | 238 (2.5%) |
| 40 to 44 Minutes | 577 (6.4%) | 241 (2.5%) |
| 45 to 59 Minutes | 447 (4.9%) | 543 (5.6%) |
| 60 to 89 Minutes | 411 (4.5%) | 282 (2.9%) |
| 90 or more Minutes | 189 (2.1%) | 114 (1.2%) |
Time of Departure to Work by Sex in Edgecombe County
The most frequent times of departure to work in Edgecombe County are 7:00 AM to 7:29 AM (1,366, 15.0%) for males and 7:00 AM to 7:29 AM (1,539, 15.8%) for females.
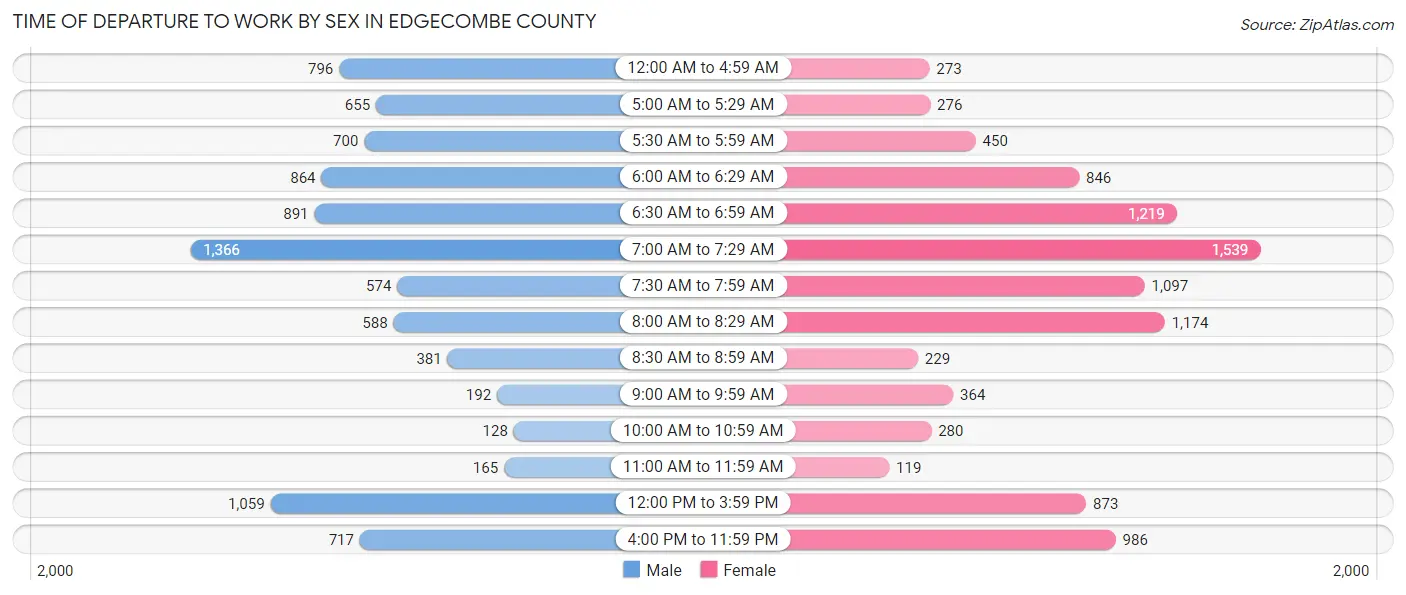
| Time of Departure | Male | Female |
| 12:00 AM to 4:59 AM | 796 (8.8%) | 273 (2.8%) |
| 5:00 AM to 5:29 AM | 655 (7.2%) | 276 (2.8%) |
| 5:30 AM to 5:59 AM | 700 (7.7%) | 450 (4.6%) |
| 6:00 AM to 6:29 AM | 864 (9.5%) | 846 (8.7%) |
| 6:30 AM to 6:59 AM | 891 (9.8%) | 1,219 (12.5%) |
| 7:00 AM to 7:29 AM | 1,366 (15.0%) | 1,539 (15.8%) |
| 7:30 AM to 7:59 AM | 574 (6.3%) | 1,097 (11.3%) |
| 8:00 AM to 8:29 AM | 588 (6.5%) | 1,174 (12.1%) |
| 8:30 AM to 8:59 AM | 381 (4.2%) | 229 (2.4%) |
| 9:00 AM to 9:59 AM | 192 (2.1%) | 364 (3.7%) |
| 10:00 AM to 10:59 AM | 128 (1.4%) | 280 (2.9%) |
| 11:00 AM to 11:59 AM | 165 (1.8%) | 119 (1.2%) |
| 12:00 PM to 3:59 PM | 1,059 (11.7%) | 873 (9.0%) |
| 4:00 PM to 11:59 PM | 717 (7.9%) | 986 (10.1%) |
| Total | 9,076 (100.0%) | 9,725 (100.0%) |
Housing Occupancy in Edgecombe County
Occupancy by Ownership in Edgecombe County
Of the total 19,350 dwellings in Edgecombe County, owner-occupied units account for 11,978 (61.9%), while renter-occupied units make up 7,372 (38.1%).
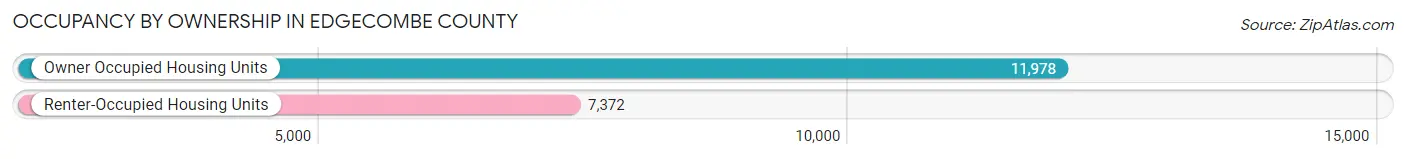
| Occupancy | # Housing Units | % Housing Units |
| Owner Occupied Housing Units | 11,978 | 61.9% |
| Renter-Occupied Housing Units | 7,372 | 38.1% |
| Total Occupied Housing Units | 19,350 | 100.0% |
Occupancy by Household Size in Edgecombe County
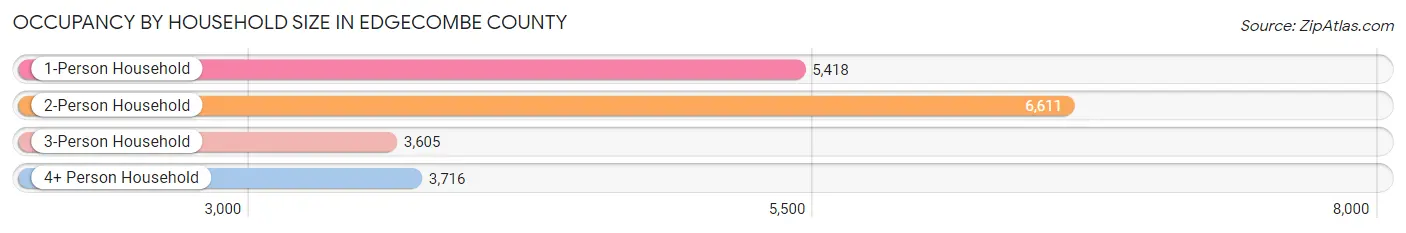
| Household Size | # Housing Units | % Housing Units |
| 1-Person Household | 5,418 | 28.0% |
| 2-Person Household | 6,611 | 34.2% |
| 3-Person Household | 3,605 | 18.6% |
| 4+ Person Household | 3,716 | 19.2% |
| Total Housing Units | 19,350 | 100.0% |
Occupancy by Ownership by Household Size in Edgecombe County
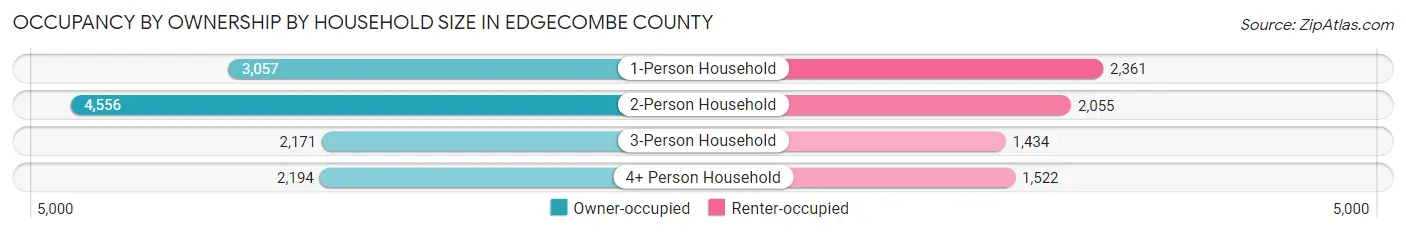
| Household Size | Owner-occupied | Renter-occupied |
| 1-Person Household | 3,057 (56.4%) | 2,361 (43.6%) |
| 2-Person Household | 4,556 (68.9%) | 2,055 (31.1%) |
| 3-Person Household | 2,171 (60.2%) | 1,434 (39.8%) |
| 4+ Person Household | 2,194 (59.0%) | 1,522 (41.0%) |
| Total Housing Units | 11,978 (61.9%) | 7,372 (38.1%) |
Occupancy by Educational Attainment in Edgecombe County

| Household Size | Owner-occupied | Renter-occupied |
| Less than High School | 1,341 (48.6%) | 1,420 (51.4%) |
| High School Diploma | 4,146 (60.2%) | 2,737 (39.8%) |
| College/Associate Degree | 3,998 (61.9%) | 2,466 (38.2%) |
| Bachelor's Degree or higher | 2,493 (76.9%) | 749 (23.1%) |
Occupancy by Age of Householder in Edgecombe County
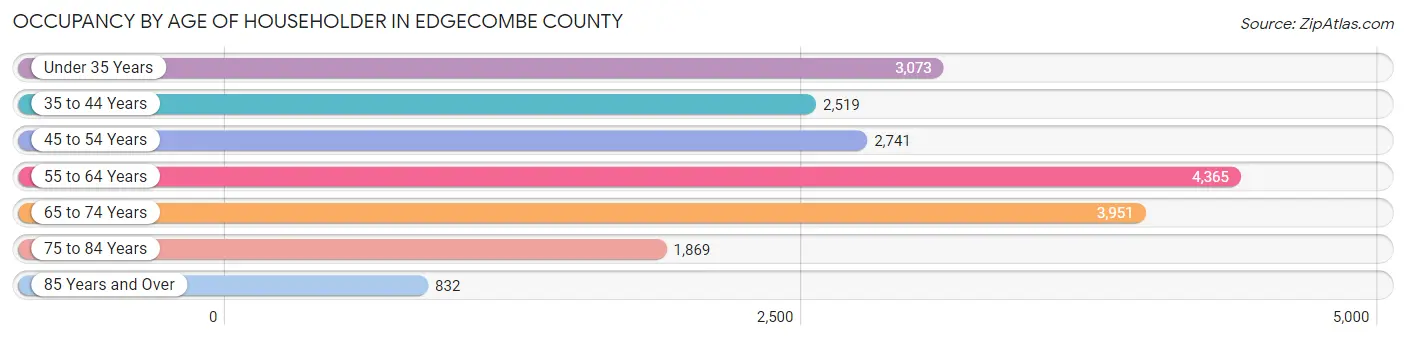
| Age Bracket | # Households | % Households |
| Under 35 Years | 3,073 | 15.9% |
| 35 to 44 Years | 2,519 | 13.0% |
| 45 to 54 Years | 2,741 | 14.2% |
| 55 to 64 Years | 4,365 | 22.6% |
| 65 to 74 Years | 3,951 | 20.4% |
| 75 to 84 Years | 1,869 | 9.7% |
| 85 Years and Over | 832 | 4.3% |
| Total | 19,350 | 100.0% |
Housing Finances in Edgecombe County
Median Income by Occupancy in Edgecombe County
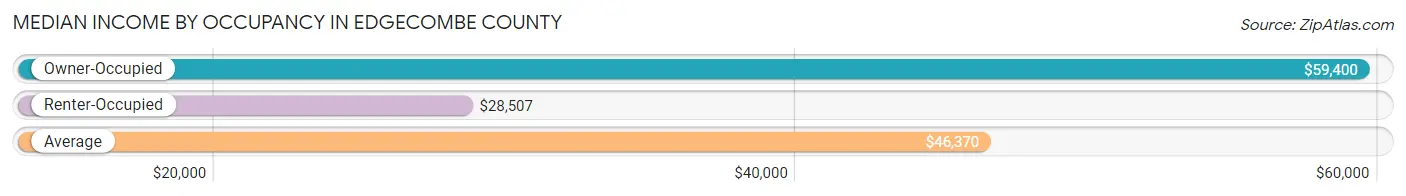
| Occupancy Type | # Households | Median Income |
| Owner-Occupied | 11,978 (61.9%) | $59,400 |
| Renter-Occupied | 7,372 (38.1%) | $28,507 |
| Average | 19,350 (100.0%) | $46,370 |
Occupancy by Householder Income Bracket in Edgecombe County
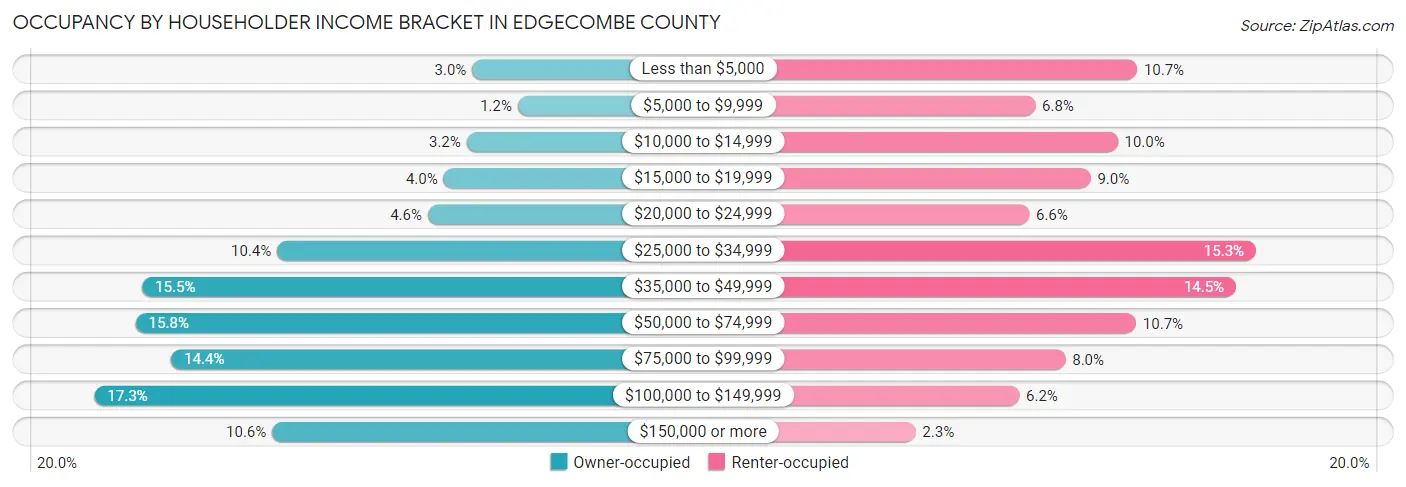
| Income Bracket | Owner-occupied | Renter-occupied |
| Less than $5,000 | 353 (2.9%) | 790 (10.7%) |
| $5,000 to $9,999 | 145 (1.2%) | 504 (6.8%) |
| $10,000 to $14,999 | 379 (3.2%) | 736 (10.0%) |
| $15,000 to $19,999 | 484 (4.0%) | 660 (8.9%) |
| $20,000 to $24,999 | 556 (4.6%) | 487 (6.6%) |
| $25,000 to $34,999 | 1,243 (10.4%) | 1,124 (15.2%) |
| $35,000 to $49,999 | 1,859 (15.5%) | 1,068 (14.5%) |
| $50,000 to $74,999 | 1,889 (15.8%) | 787 (10.7%) |
| $75,000 to $99,999 | 1,727 (14.4%) | 589 (8.0%) |
| $100,000 to $149,999 | 2,077 (17.3%) | 459 (6.2%) |
| $150,000 or more | 1,266 (10.6%) | 168 (2.3%) |
| Total | 11,978 (100.0%) | 7,372 (100.0%) |
Monthly Housing Cost Tiers in Edgecombe County
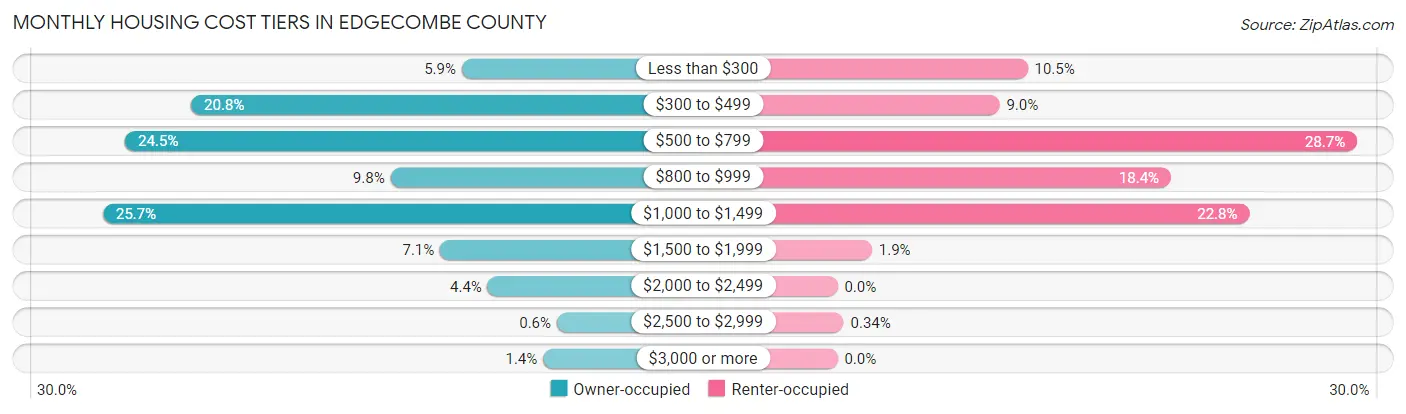
| Monthly Cost | Owner-occupied | Renter-occupied |
| Less than $300 | 701 (5.9%) | 774 (10.5%) |
| $300 to $499 | 2,491 (20.8%) | 660 (8.9%) |
| $500 to $799 | 2,929 (24.4%) | 2,116 (28.7%) |
| $800 to $999 | 1,173 (9.8%) | 1,358 (18.4%) |
| $1,000 to $1,499 | 3,076 (25.7%) | 1,677 (22.8%) |
| $1,500 to $1,999 | 844 (7.0%) | 140 (1.9%) |
| $2,000 to $2,499 | 529 (4.4%) | 0 (0.0%) |
| $2,500 to $2,999 | 72 (0.6%) | 25 (0.3%) |
| $3,000 or more | 163 (1.4%) | 0 (0.0%) |
| Total | 11,978 (100.0%) | 7,372 (100.0%) |
Physical Housing Characteristics in Edgecombe County
Housing Structures in Edgecombe County
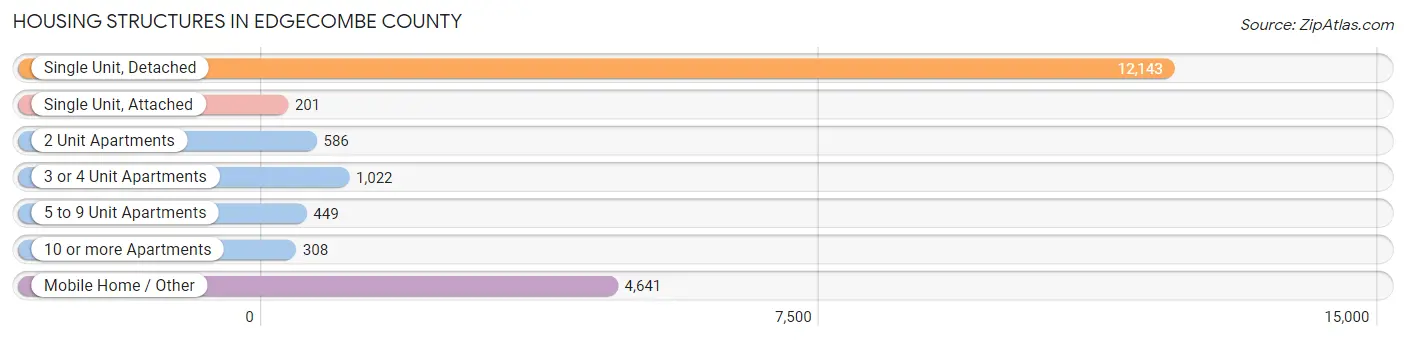
| Structure Type | # Housing Units | % Housing Units |
| Single Unit, Detached | 12,143 | 62.7% |
| Single Unit, Attached | 201 | 1.0% |
| 2 Unit Apartments | 586 | 3.0% |
| 3 or 4 Unit Apartments | 1,022 | 5.3% |
| 5 to 9 Unit Apartments | 449 | 2.3% |
| 10 or more Apartments | 308 | 1.6% |
| Mobile Home / Other | 4,641 | 24.0% |
| Total | 19,350 | 100.0% |
Housing Structures by Occupancy in Edgecombe County
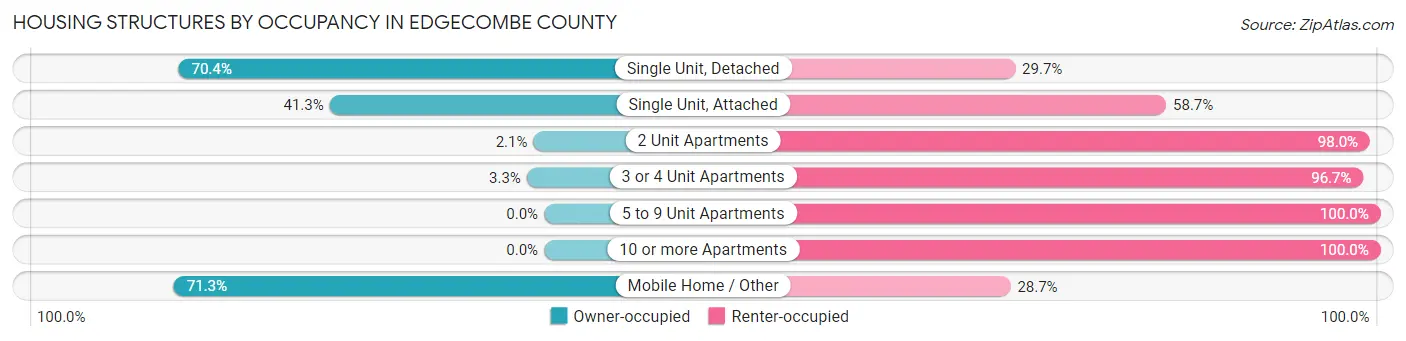
| Structure Type | Owner-occupied | Renter-occupied |
| Single Unit, Detached | 8,542 (70.4%) | 3,601 (29.6%) |
| Single Unit, Attached | 83 (41.3%) | 118 (58.7%) |
| 2 Unit Apartments | 12 (2.1%) | 574 (98.0%) |
| 3 or 4 Unit Apartments | 34 (3.3%) | 988 (96.7%) |
| 5 to 9 Unit Apartments | 0 (0.0%) | 449 (100.0%) |
| 10 or more Apartments | 0 (0.0%) | 308 (100.0%) |
| Mobile Home / Other | 3,307 (71.3%) | 1,334 (28.7%) |
| Total | 11,978 (61.9%) | 7,372 (38.1%) |
Housing Structures by Number of Rooms in Edgecombe County
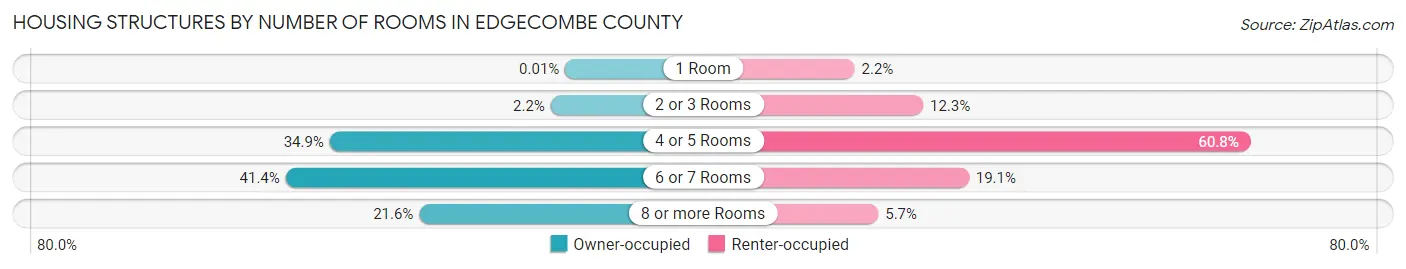
| Number of Rooms | Owner-occupied | Renter-occupied |
| 1 Room | 1 (0.0%) | 160 (2.2%) |
| 2 or 3 Rooms | 258 (2.1%) | 907 (12.3%) |
| 4 or 5 Rooms | 4,174 (34.8%) | 4,480 (60.8%) |
| 6 or 7 Rooms | 4,956 (41.4%) | 1,406 (19.1%) |
| 8 or more Rooms | 2,589 (21.6%) | 419 (5.7%) |
| Total | 11,978 (100.0%) | 7,372 (100.0%) |
Housing Structure by Heating Type in Edgecombe County
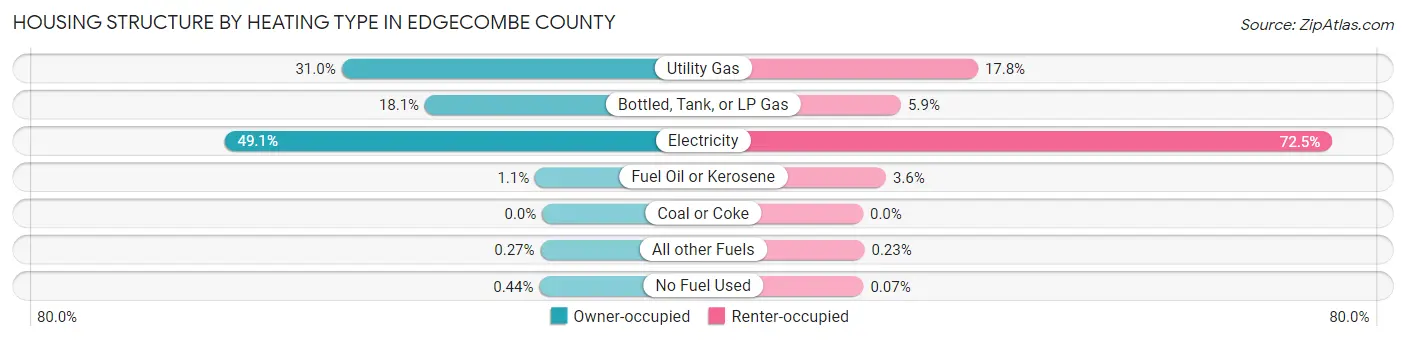
| Heating Type | Owner-occupied | Renter-occupied |
| Utility Gas | 3,714 (31.0%) | 1,309 (17.8%) |
| Bottled, Tank, or LP Gas | 2,169 (18.1%) | 434 (5.9%) |
| Electricity | 5,880 (49.1%) | 5,345 (72.5%) |
| Fuel Oil or Kerosene | 130 (1.1%) | 262 (3.5%) |
| Coal or Coke | 0 (0.0%) | 0 (0.0%) |
| All other Fuels | 32 (0.3%) | 17 (0.2%) |
| No Fuel Used | 53 (0.4%) | 5 (0.1%) |
| Total | 11,978 (100.0%) | 7,372 (100.0%) |
Household Vehicle Usage in Edgecombe County
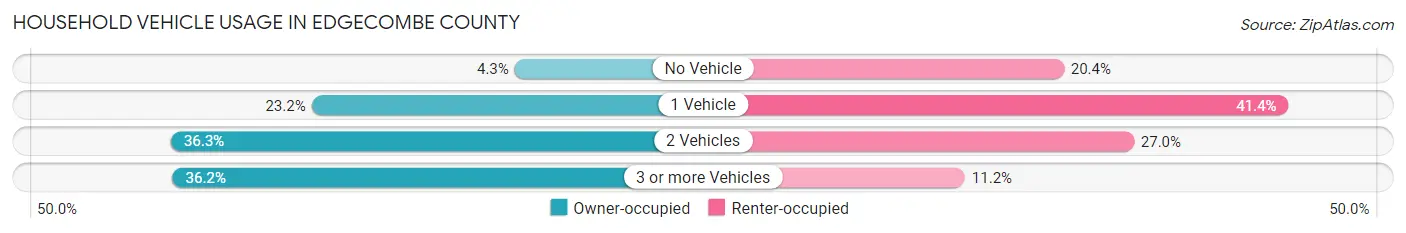
| Vehicles per Household | Owner-occupied | Renter-occupied |
| No Vehicle | 510 (4.3%) | 1,506 (20.4%) |
| 1 Vehicle | 2,781 (23.2%) | 3,052 (41.4%) |
| 2 Vehicles | 4,353 (36.3%) | 1,988 (27.0%) |
| 3 or more Vehicles | 4,334 (36.2%) | 826 (11.2%) |
| Total | 11,978 (100.0%) | 7,372 (100.0%) |
Real Estate & Mortgages in Edgecombe County
Real Estate and Mortgage Overview in Edgecombe County
| Characteristic | Without Mortgage | With Mortgage |
| Housing Units | 6,033 | 5,945 |
| Median Property Value | $96,000 | $119,000 |
| Median Household Income | $51,822 | $803 |
| Monthly Housing Costs | $492 | $84 |
| Real Estate Taxes | $1,134 | $238 |
Property Value by Mortgage Status in Edgecombe County
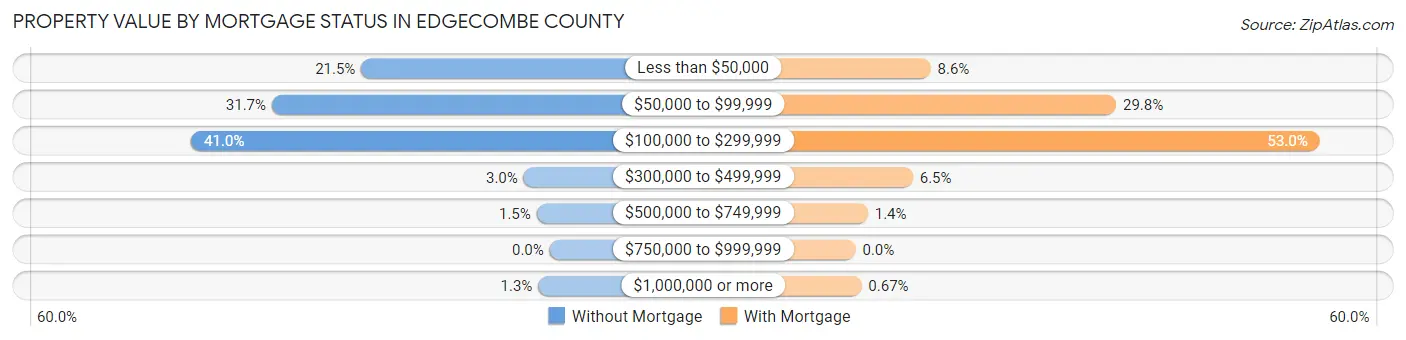
| Property Value | Without Mortgage | With Mortgage |
| Less than $50,000 | 1,299 (21.5%) | 510 (8.6%) |
| $50,000 to $99,999 | 1,915 (31.7%) | 1,770 (29.8%) |
| $100,000 to $299,999 | 2,472 (41.0%) | 3,153 (53.0%) |
| $300,000 to $499,999 | 179 (3.0%) | 389 (6.5%) |
| $500,000 to $749,999 | 89 (1.5%) | 83 (1.4%) |
| $750,000 to $999,999 | 0 (0.0%) | 0 (0.0%) |
| $1,000,000 or more | 79 (1.3%) | 40 (0.7%) |
| Total | 6,033 (100.0%) | 5,945 (100.0%) |
Household Income by Mortgage Status in Edgecombe County
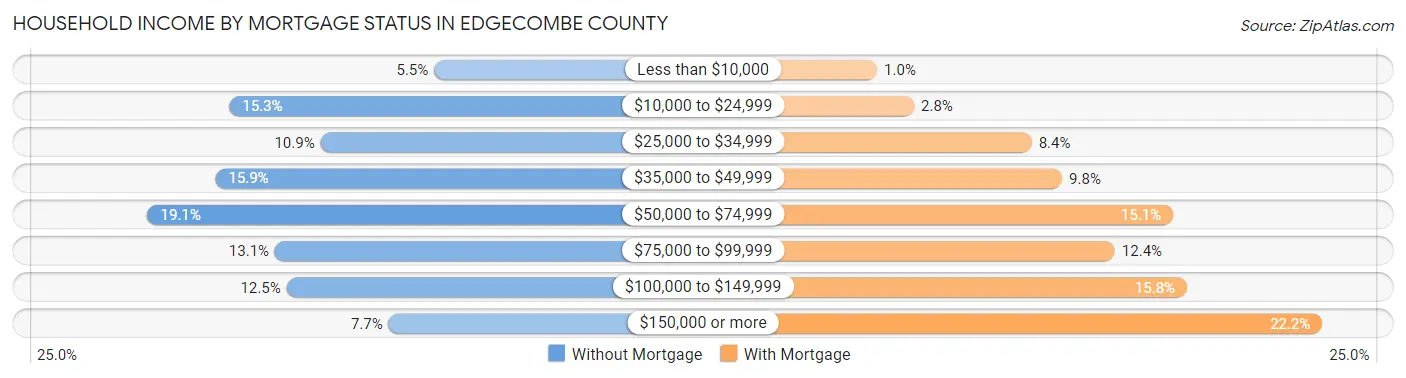
| Household Income | Without Mortgage | With Mortgage |
| Less than $10,000 | 332 (5.5%) | 61 (1.0%) |
| $10,000 to $24,999 | 920 (15.2%) | 166 (2.8%) |
| $25,000 to $34,999 | 658 (10.9%) | 499 (8.4%) |
| $35,000 to $49,999 | 960 (15.9%) | 585 (9.8%) |
| $50,000 to $74,999 | 1,155 (19.1%) | 899 (15.1%) |
| $75,000 to $99,999 | 789 (13.1%) | 734 (12.3%) |
| $100,000 to $149,999 | 756 (12.5%) | 938 (15.8%) |
| $150,000 or more | 463 (7.7%) | 1,321 (22.2%) |
| Total | 6,033 (100.0%) | 5,945 (100.0%) |
Property Value to Household Income Ratio in Edgecombe County
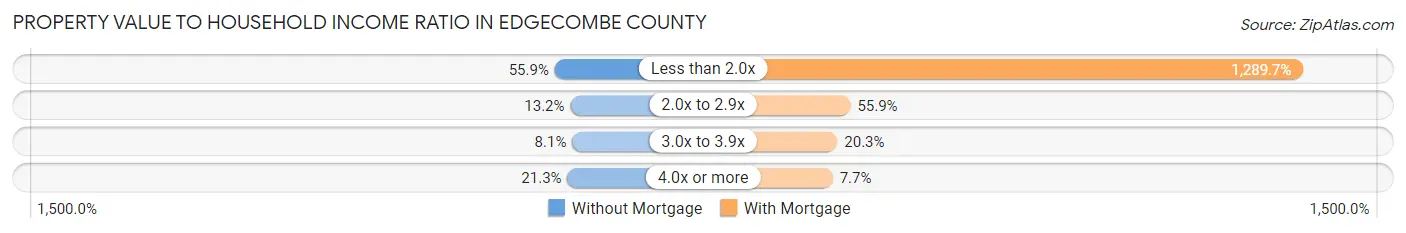
| Value-to-Income Ratio | Without Mortgage | With Mortgage |
| Less than 2.0x | 3,370 (55.9%) | 76,670 (1,289.7%) |
| 2.0x to 2.9x | 799 (13.2%) | 3,325 (55.9%) |
| 3.0x to 3.9x | 488 (8.1%) | 1,204 (20.3%) |
| 4.0x or more | 1,285 (21.3%) | 457 (7.7%) |
| Total | 6,033 (100.0%) | 5,945 (100.0%) |
Real Estate Taxes by Mortgage Status in Edgecombe County
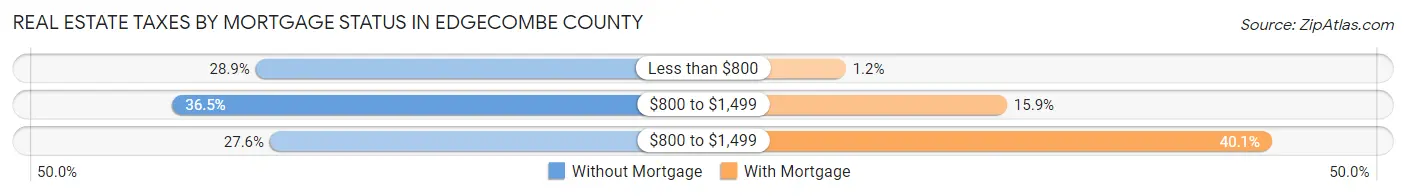
| Property Taxes | Without Mortgage | With Mortgage |
| Less than $800 | 1,744 (28.9%) | 69 (1.2%) |
| $800 to $1,499 | 2,202 (36.5%) | 944 (15.9%) |
| $800 to $1,499 | 1,665 (27.6%) | 2,382 (40.1%) |
| Total | 6,033 (100.0%) | 5,945 (100.0%) |
Health & Disability in Edgecombe County
Health Insurance Coverage by Age in Edgecombe County
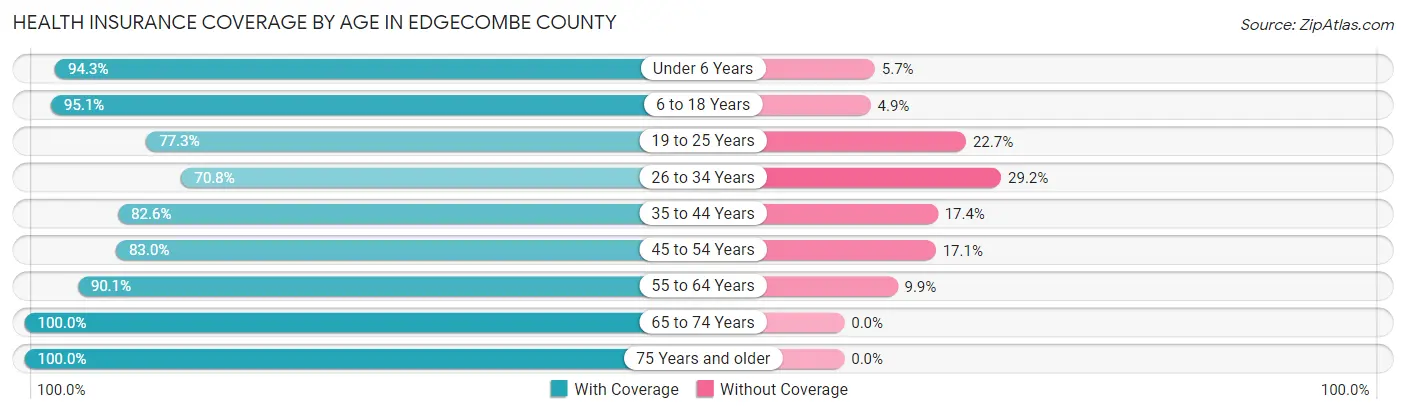
| Age Bracket | With Coverage | Without Coverage |
| Under 6 Years | 3,151 (94.3%) | 190 (5.7%) |
| 6 to 18 Years | 8,022 (95.1%) | 414 (4.9%) |
| 19 to 25 Years | 2,824 (77.3%) | 829 (22.7%) |
| 26 to 34 Years | 3,889 (70.8%) | 1,607 (29.2%) |
| 35 to 44 Years | 4,318 (82.6%) | 911 (17.4%) |
| 45 to 54 Years | 4,553 (83.0%) | 936 (17.1%) |
| 55 to 64 Years | 6,487 (90.1%) | 715 (9.9%) |
| 65 to 74 Years | 5,950 (100.0%) | 0 (0.0%) |
| 75 Years and older | 3,686 (100.0%) | 0 (0.0%) |
| Total | 42,880 (88.4%) | 5,602 (11.6%) |
Health Insurance Coverage by Citizenship Status in Edgecombe County
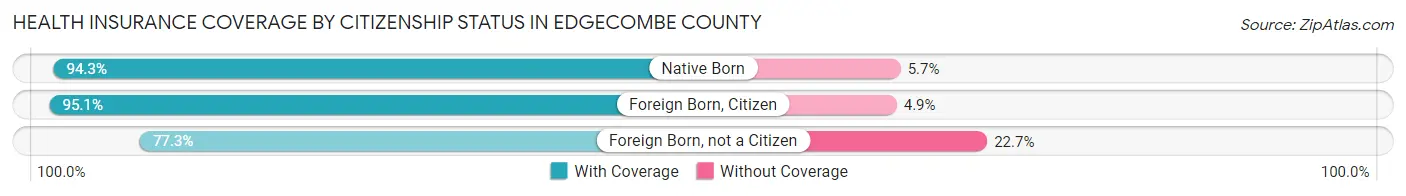
| Citizenship Status | With Coverage | Without Coverage |
| Native Born | 3,151 (94.3%) | 190 (5.7%) |
| Foreign Born, Citizen | 8,022 (95.1%) | 414 (4.9%) |
| Foreign Born, not a Citizen | 2,824 (77.3%) | 829 (22.7%) |
Health Insurance Coverage by Household Income in Edgecombe County
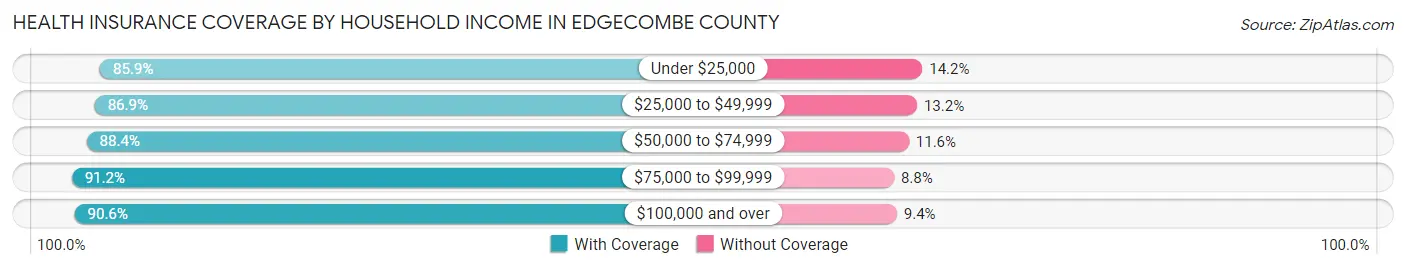
| Household Income | With Coverage | Without Coverage |
| Under $25,000 | 8,332 (85.9%) | 1,373 (14.1%) |
| $25,000 to $49,999 | 10,741 (86.9%) | 1,627 (13.2%) |
| $50,000 to $74,999 | 5,727 (88.4%) | 754 (11.6%) |
| $75,000 to $99,999 | 6,031 (91.2%) | 584 (8.8%) |
| $100,000 and over | 11,926 (90.6%) | 1,235 (9.4%) |
Public vs Private Health Insurance Coverage by Age in Edgecombe County
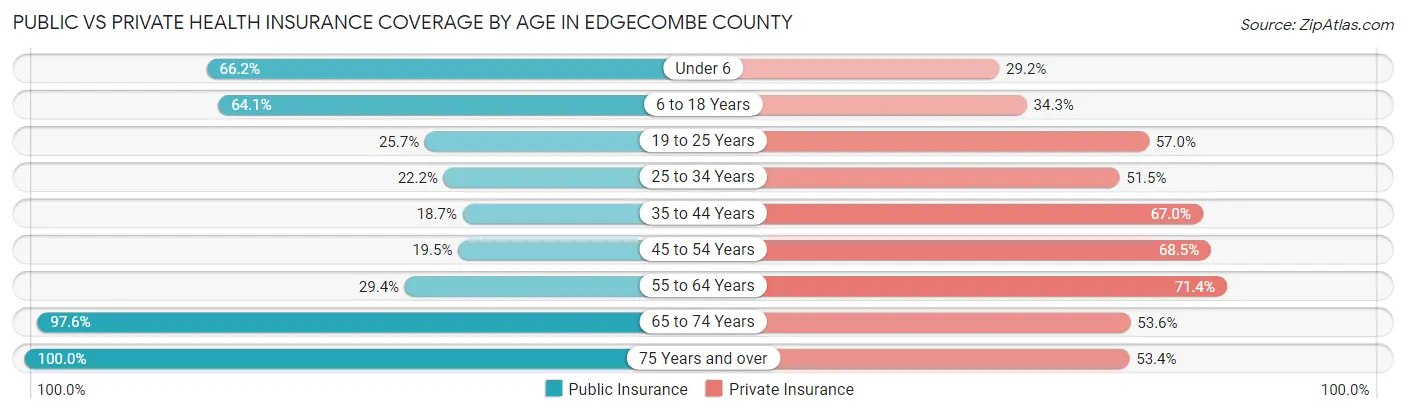
| Age Bracket | Public Insurance | Private Insurance |
| Under 6 | 2,212 (66.2%) | 976 (29.2%) |
| 6 to 18 Years | 5,403 (64.0%) | 2,894 (34.3%) |
| 19 to 25 Years | 938 (25.7%) | 2,081 (57.0%) |
| 25 to 34 Years | 1,220 (22.2%) | 2,831 (51.5%) |
| 35 to 44 Years | 977 (18.7%) | 3,503 (67.0%) |
| 45 to 54 Years | 1,071 (19.5%) | 3,762 (68.5%) |
| 55 to 64 Years | 2,118 (29.4%) | 5,145 (71.4%) |
| 65 to 74 Years | 5,809 (97.6%) | 3,187 (53.6%) |
| 75 Years and over | 3,686 (100.0%) | 1,967 (53.4%) |
| Total | 23,434 (48.3%) | 26,346 (54.3%) |
Disability Status by Sex by Age in Edgecombe County
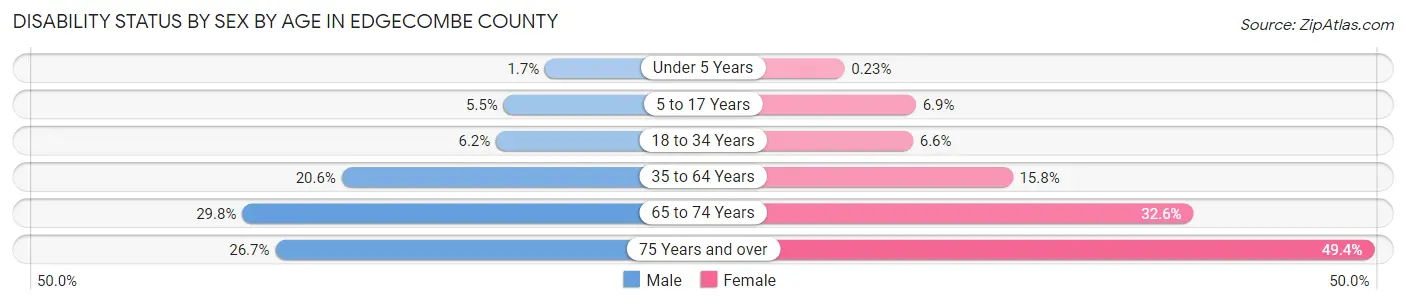
| Age Bracket | Male | Female |
| Under 5 Years | 25 (1.7%) | 3 (0.2%) |
| 5 to 17 Years | 239 (5.5%) | 275 (6.9%) |
| 18 to 34 Years | 298 (6.2%) | 332 (6.6%) |
| 35 to 64 Years | 1,672 (20.6%) | 1,551 (15.8%) |
| 65 to 74 Years | 784 (29.8%) | 1,083 (32.6%) |
| 75 Years and over | 402 (26.7%) | 1,078 (49.4%) |
Disability Class by Sex by Age in Edgecombe County
Disability Class: Hearing Difficulty
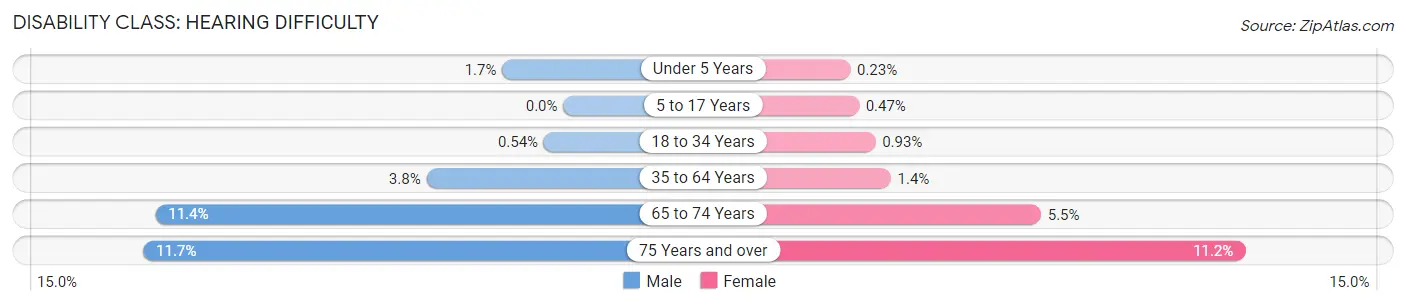
| Age Bracket | Male | Female |
| Under 5 Years | 25 (1.7%) | 3 (0.2%) |
| 5 to 17 Years | 0 (0.0%) | 19 (0.5%) |
| 18 to 34 Years | 26 (0.5%) | 47 (0.9%) |
| 35 to 64 Years | 310 (3.8%) | 133 (1.4%) |
| 65 to 74 Years | 299 (11.4%) | 184 (5.5%) |
| 75 Years and over | 176 (11.7%) | 245 (11.2%) |
Disability Class: Vision Difficulty
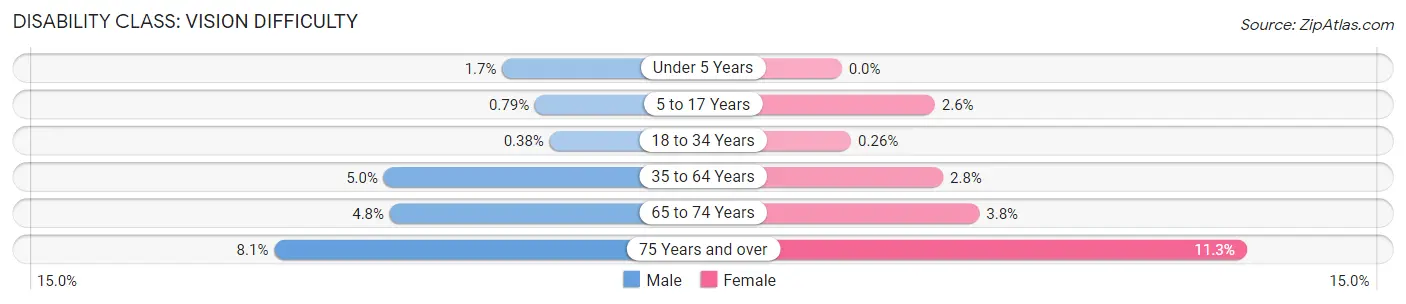
| Age Bracket | Male | Female |
| Under 5 Years | 25 (1.7%) | 0 (0.0%) |
| 5 to 17 Years | 34 (0.8%) | 104 (2.6%) |
| 18 to 34 Years | 18 (0.4%) | 13 (0.3%) |
| 35 to 64 Years | 406 (5.0%) | 276 (2.8%) |
| 65 to 74 Years | 127 (4.8%) | 127 (3.8%) |
| 75 Years and over | 121 (8.1%) | 246 (11.3%) |
Disability Class: Cognitive Difficulty
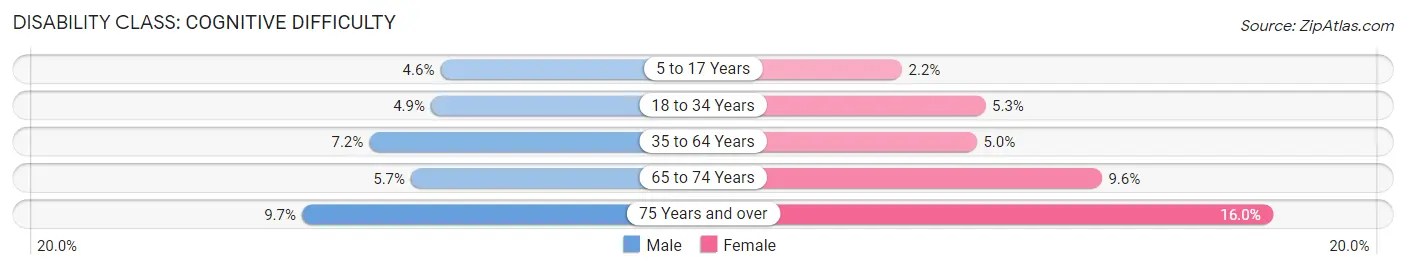
| Age Bracket | Male | Female |
| 5 to 17 Years | 197 (4.6%) | 89 (2.2%) |
| 18 to 34 Years | 235 (4.9%) | 268 (5.3%) |
| 35 to 64 Years | 586 (7.2%) | 490 (5.0%) |
| 65 to 74 Years | 149 (5.7%) | 320 (9.6%) |
| 75 Years and over | 146 (9.7%) | 349 (16.0%) |
Disability Class: Ambulatory Difficulty
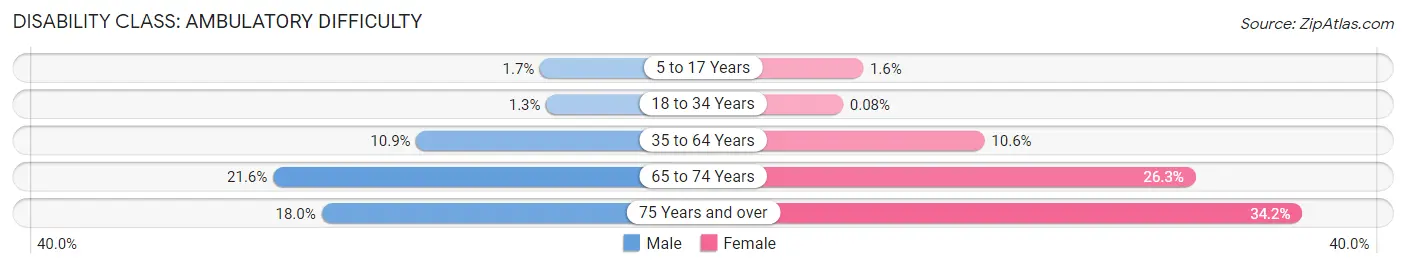
| Age Bracket | Male | Female |
| 5 to 17 Years | 74 (1.7%) | 63 (1.6%) |
| 18 to 34 Years | 60 (1.3%) | 4 (0.1%) |
| 35 to 64 Years | 887 (10.9%) | 1,037 (10.6%) |
| 65 to 74 Years | 567 (21.5%) | 872 (26.3%) |
| 75 Years and over | 270 (17.9%) | 746 (34.2%) |
Disability Class: Self-Care Difficulty
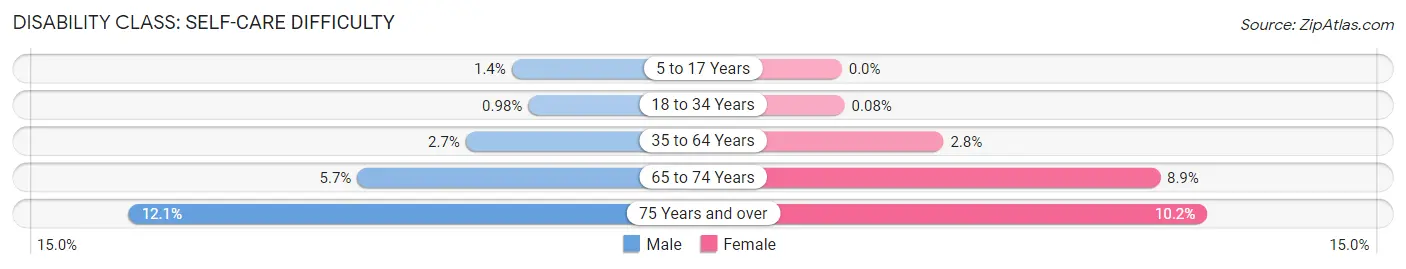
| Age Bracket | Male | Female |
| 5 to 17 Years | 62 (1.4%) | 0 (0.0%) |
| 18 to 34 Years | 47 (1.0%) | 4 (0.1%) |
| 35 to 64 Years | 221 (2.7%) | 277 (2.8%) |
| 65 to 74 Years | 151 (5.7%) | 294 (8.9%) |
| 75 Years and over | 182 (12.1%) | 222 (10.2%) |
Technology Access in Edgecombe County
Computing Device Access in Edgecombe County
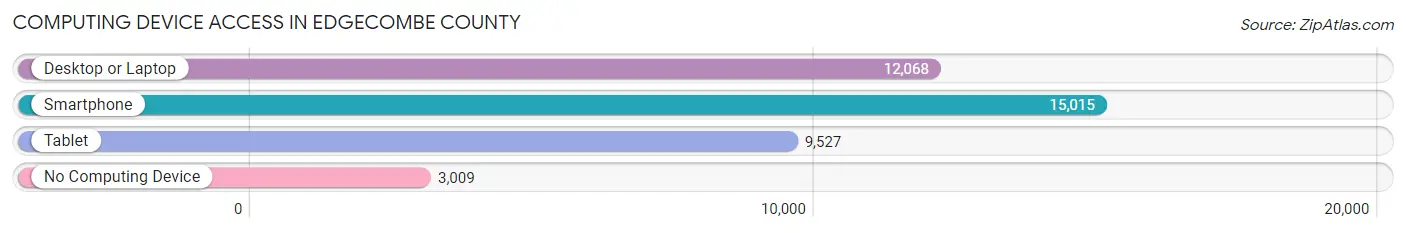
| Device Type | # Households | % Households |
| Desktop or Laptop | 12,068 | 62.4% |
| Smartphone | 15,015 | 77.6% |
| Tablet | 9,527 | 49.2% |
| No Computing Device | 3,009 | 15.5% |
| Total | 19,350 | 100.0% |
Internet Access in Edgecombe County
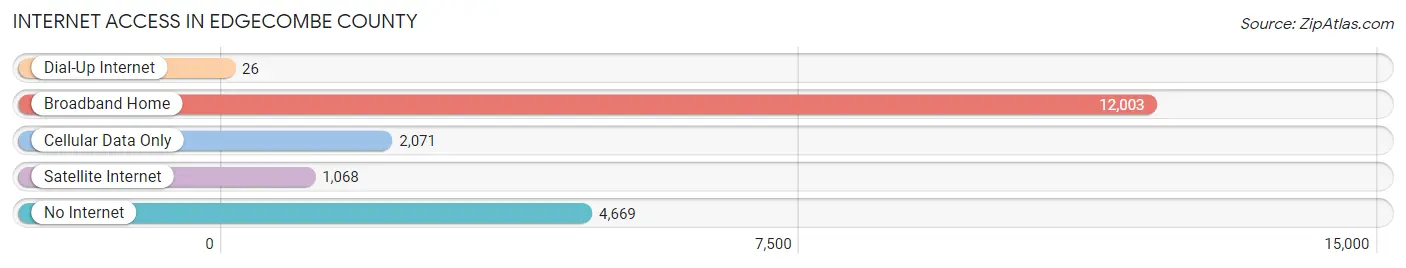
| Internet Type | # Households | % Households |
| Dial-Up Internet | 26 | 0.1% |
| Broadband Home | 12,003 | 62.0% |
| Cellular Data Only | 2,071 | 10.7% |
| Satellite Internet | 1,068 | 5.5% |
| No Internet | 4,669 | 24.1% |
| Total | 19,350 | 100.0% |
Edgecombe County Summary
Edgecombe County is located in the eastern part of North Carolina, and is part of the Inner Banks region. It is bordered by Nash County to the north, Wilson County to the west, Halifax County to the south, and Martin County to the east. The county seat is Tarboro, and the county is named after Richard Edgecombe, a member of the British House of Commons.
History
Edgecombe County was formed in 1741 from parts of Bertie and Northampton counties. It was named after Richard Edgecombe, a member of the British House of Commons. The county was originally part of the Tuscarora Indian Nation, and the first European settlers arrived in the area in the early 1700s. The county was an important center of the Revolutionary War, and Tarboro was the site of a major battle in 1781.
In the 19th century, Edgecombe County was an important center of the tobacco industry, and the county was home to several large plantations. The county was also an important center of the Civil War, and Tarboro was the site of a major battle in 1865.
Geography
Edgecombe County is located in the eastern part of North Carolina, and is part of the Inner Banks region. It is bordered by Nash County to the north, Wilson County to the west, Halifax County to the south, and Martin County to the east. The county has a total area of 545 square miles, of which 543 square miles is land and 2 square miles is water. The county is mostly flat, with some rolling hills in the northern part of the county. The Tar River runs through the county, and there are several small lakes and ponds.
Economy
Edgecombe County has a diverse economy, with a mix of agriculture, manufacturing, and services. The county is home to several large industrial parks, and the county is a major producer of tobacco, cotton, and soybeans. The county is also home to several large poultry farms, and the county is a major producer of eggs and poultry products. The county is also home to several large manufacturing companies, including a major furniture manufacturer and a major textile manufacturer.
The county is also home to several large retail stores, including a major department store and several large grocery stores. The county is also home to several large medical facilities, including a major hospital and several smaller clinics.
Demographics
As of the 2010 census, Edgecombe County had a population of 56,552. The population was 54.2% White, 39.7% African American, 0.4% Native American, 0.7% Asian, 0.1% Pacific Islander, 3.2% from other races, and 1.7% from two or more races. Hispanic or Latino of any race were 5.7% of the population.
The median income for a household in the county was $35,945, and the median income for a family was $43,945. The per capita income for the county was $17,845. About 19.2% of the population was below the poverty line.
Common Questions
What is Per Capita Income in Edgecombe County?
Per Capita income in Edgecombe County is $25,813.
What is the Median Family Income in Edgecombe County?
Median Family Income in Edgecombe County is $54,948.
What is the Median Household income in Edgecombe County?
Median Household Income in Edgecombe County is $46,370.
What is Income or Wage Gap in Edgecombe County?
Income or Wage Gap in Edgecombe County is 11.9%.
Women in Edgecombe County earn 88.1 cents for every dollar earned by a man.
What is Family Income Deficit in Edgecombe County?
Family Income Deficit in Edgecombe County is $11,566.
Families that are below poverty line in Edgecombe County earn $11,566 less on average than the poverty threshold level.
What is Inequality or Gini Index in Edgecombe County?
Inequality or Gini Index in Edgecombe County is 0.46.
What is the Total Population of Edgecombe County?
Total Population of Edgecombe County is 49,067.
What is the Total Male Population of Edgecombe County?
Total Male Population of Edgecombe County is 22,979.
What is the Total Female Population of Edgecombe County?
Total Female Population of Edgecombe County is 26,088.
What is the Ratio of Males per 100 Females in Edgecombe County?
There are 88.08 Males per 100 Females in Edgecombe County.
What is the Ratio of Females per 100 Males in Edgecombe County?
There are 113.53 Females per 100 Males in Edgecombe County.
What is the Median Population Age in Edgecombe County?
Median Population Age in Edgecombe County is 41.6 Years.
What is the Average Family Size in Edgecombe County
Average Family Size in Edgecombe County is 3.0 People.
What is the Average Household Size in Edgecombe County
Average Household Size in Edgecombe County is 2.5 People.
How Large is the Labor Force in Edgecombe County?
There are 22,308 People in the Labor Forcein in Edgecombe County.
What is the Percentage of People in the Labor Force in Edgecombe County?
56.6% of People are in the Labor Force in Edgecombe County.
What is the Unemployment Rate in Edgecombe County?
Unemployment Rate in Edgecombe County is 8.6%.