Davie County, NC Map & Demographics
Davie County Map
Davie County Overview
$36,570
PER CAPITA INCOME
$85,836
AVG FAMILY INCOME
$69,105
AVG HOUSEHOLD INCOME
27.4%
WAGE / INCOME GAP [ % ]
72.6¢/ $1
WAGE / INCOME GAP [ $ ]
$10,595
FAMILY INCOME DEFICIT
0.42
INEQUALITY / GINI INDEX
43,030
TOTAL POPULATION
21,018
MALE POPULATION
22,012
FEMALE POPULATION
95.48
MALES / 100 FEMALES
104.73
FEMALES / 100 MALES
45.2
MEDIAN AGE
3.2
AVG FAMILY SIZE
2.6
AVG HOUSEHOLD SIZE
20,831
LABOR FORCE [ PEOPLE ]
58.9%
PERCENT IN LABOR FORCE
4.6%
UNEMPLOYMENT RATE
Davie County Area Codes
Income in Davie County
Income Overview in Davie County
Per Capita Income in Davie County is $36,570, while median incomes of families and households are $85,836 and $69,105 respectively.
| Characteristic | Number | Measure |
| Per Capita Income | 43,030 | $36,570 |
| Median Family Income | 11,101 | $85,836 |
| Mean Family Income | 11,101 | $103,376 |
| Median Household Income | 16,468 | $69,105 |
| Mean Household Income | 16,468 | $88,895 |
| Income Deficit | 11,101 | $10,595 |
| Wage / Income Gap (%) | 43,030 | 27.35% |
| Wage / Income Gap ($) | 43,030 | 72.65¢ per $1 |
| Gini / Inequality Index | 43,030 | 0.42 |
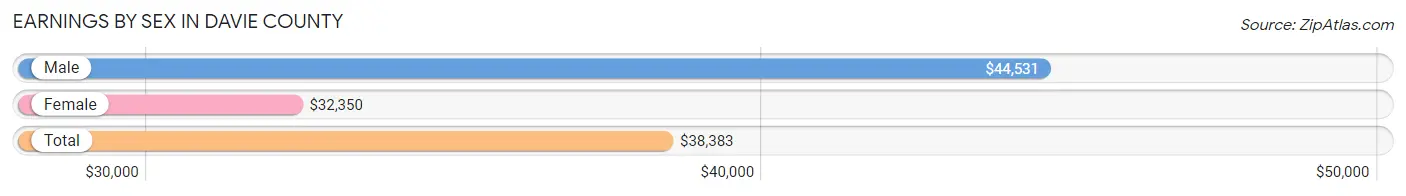
Earnings by Sex in Davie County
Average Earnings in Davie County are $38,383, $44,531 for men and $32,350 for women, a difference of 27.4%.
| Sex | Number | Average Earnings |
| Male | 11,397 (52.2%) | $44,531 |
| Female | 10,447 (47.8%) | $32,350 |
| Total | 21,844 (100.0%) | $38,383 |
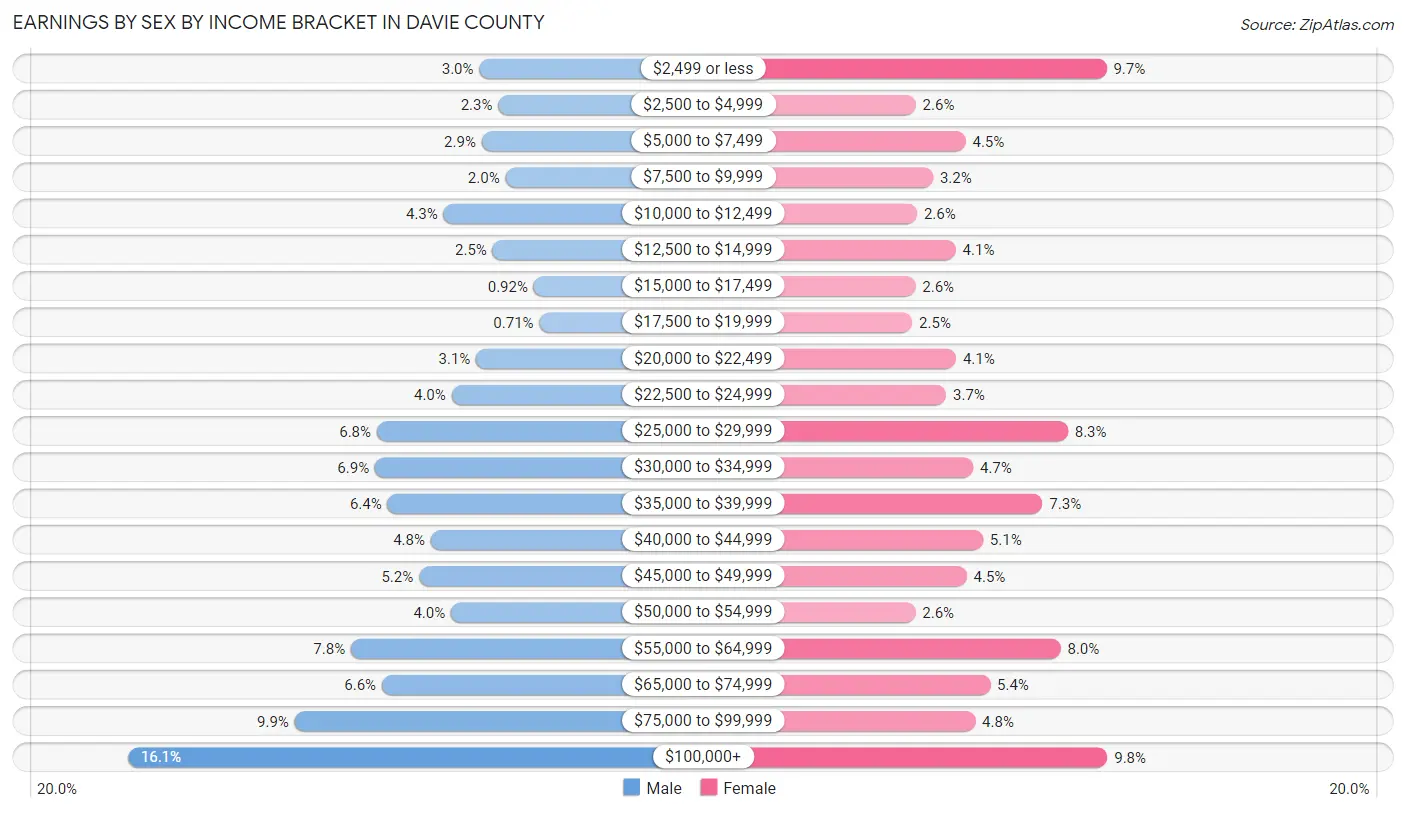
Earnings by Sex by Income Bracket in Davie County
The most common earnings brackets in Davie County are $100,000+ for men (1,838 | 16.1%) and $100,000+ for women (1,020 | 9.8%).
| Income | Male | Female |
| $2,499 or less | 337 (3.0%) | 1,017 (9.7%) |
| $2,500 to $4,999 | 257 (2.2%) | 270 (2.6%) |
| $5,000 to $7,499 | 327 (2.9%) | 465 (4.4%) |
| $7,500 to $9,999 | 226 (2.0%) | 337 (3.2%) |
| $10,000 to $12,499 | 490 (4.3%) | 275 (2.6%) |
| $12,500 to $14,999 | 280 (2.5%) | 426 (4.1%) |
| $15,000 to $17,499 | 105 (0.9%) | 269 (2.6%) |
| $17,500 to $19,999 | 81 (0.7%) | 256 (2.5%) |
| $20,000 to $22,499 | 351 (3.1%) | 427 (4.1%) |
| $22,500 to $24,999 | 456 (4.0%) | 389 (3.7%) |
| $25,000 to $29,999 | 775 (6.8%) | 865 (8.3%) |
| $30,000 to $34,999 | 783 (6.9%) | 494 (4.7%) |
| $35,000 to $39,999 | 729 (6.4%) | 766 (7.3%) |
| $40,000 to $44,999 | 545 (4.8%) | 533 (5.1%) |
| $45,000 to $49,999 | 595 (5.2%) | 469 (4.5%) |
| $50,000 to $54,999 | 458 (4.0%) | 268 (2.6%) |
| $55,000 to $64,999 | 885 (7.8%) | 837 (8.0%) |
| $65,000 to $74,999 | 753 (6.6%) | 561 (5.4%) |
| $75,000 to $99,999 | 1,126 (9.9%) | 503 (4.8%) |
| $100,000+ | 1,838 (16.1%) | 1,020 (9.8%) |
| Total | 11,397 (100.0%) | 10,447 (100.0%) |
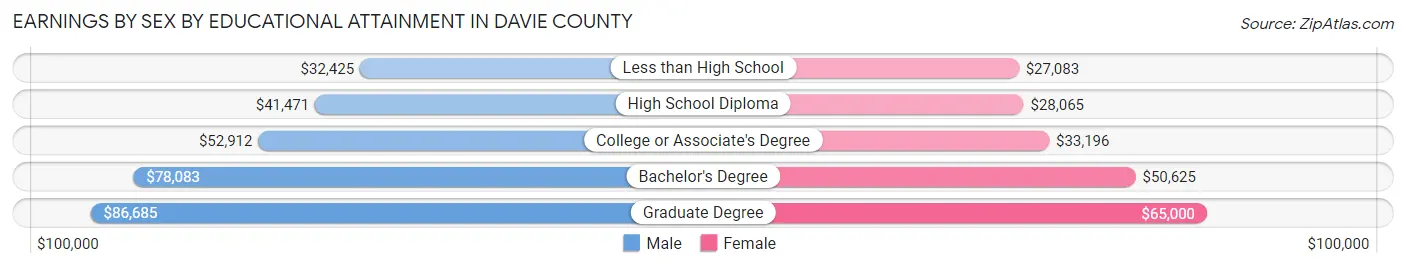
Earnings by Sex by Educational Attainment in Davie County
Average earnings in Davie County are $49,333 for men and $38,130 for women, a difference of 22.7%. Men with an educational attainment of graduate degree enjoy the highest average annual earnings of $86,685, while those with less than high school education earn the least with $32,425. Women with an educational attainment of graduate degree earn the most with the average annual earnings of $65,000, while those with less than high school education have the smallest earnings of $27,083.
| Educational Attainment | Male Income | Female Income |
| Less than High School | $32,425 | $27,083 |
| High School Diploma | $41,471 | $28,065 |
| College or Associate's Degree | $52,912 | $33,196 |
| Bachelor's Degree | $78,083 | $50,625 |
| Graduate Degree | $86,685 | $65,000 |
| Total | $49,333 | $38,130 |
Family Income in Davie County
Family Income Brackets in Davie County
According to the Davie County family income data, there are 2,587 families falling into the $100,000 to $149,999 income range, which is the most common income bracket and makes up 23.3% of all families. Conversely, the $10,000 to $14,999 income bracket is the least frequent group with only 167 families (1.5%) belonging to this category.
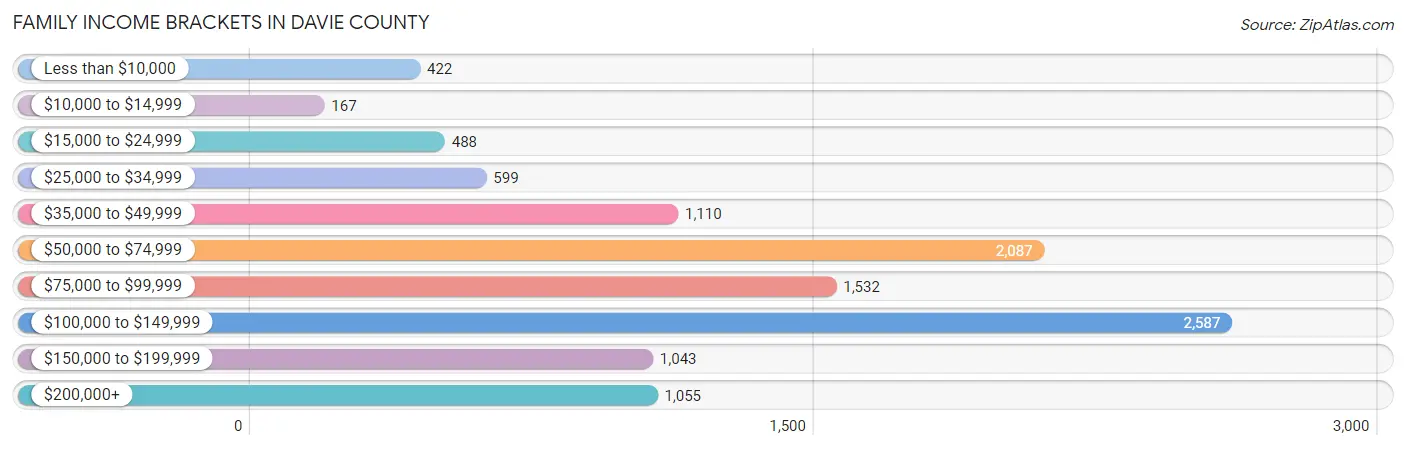
| Income Bracket | # Families | % Families |
| Less than $10,000 | 422 | 3.8% |
| $10,000 to $14,999 | 167 | 1.5% |
| $15,000 to $24,999 | 488 | 4.4% |
| $25,000 to $34,999 | 599 | 5.4% |
| $35,000 to $49,999 | 1,110 | 10.0% |
| $50,000 to $74,999 | 2,087 | 18.8% |
| $75,000 to $99,999 | 1,532 | 13.8% |
| $100,000 to $149,999 | 2,587 | 23.3% |
| $150,000 to $199,999 | 1,043 | 9.4% |
| $200,000+ | 1,055 | 9.5% |
Family Income by Famaliy Size in Davie County
4-person families (1,780 | 16.0%) account for the highest median family income in Davie County with $114,597 per family, while 2-person families (5,744 | 51.7%) have the highest median income of $39,577 per family member.
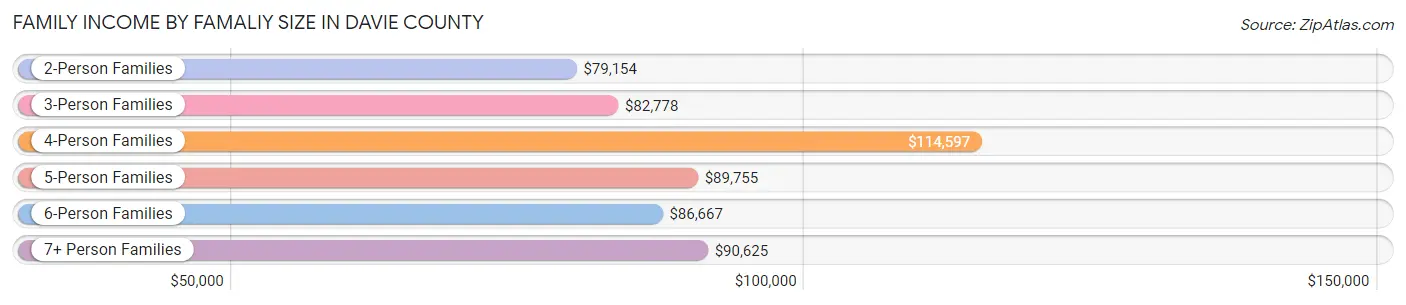
| Income Bracket | # Families | Median Income |
| 2-Person Families | 5,744 (51.7%) | $79,154 |
| 3-Person Families | 2,514 (22.7%) | $82,778 |
| 4-Person Families | 1,780 (16.0%) | $114,597 |
| 5-Person Families | 697 (6.3%) | $89,755 |
| 6-Person Families | 154 (1.4%) | $86,667 |
| 7+ Person Families | 212 (1.9%) | $90,625 |
| Total | 11,101 (100.0%) | $85,836 |
Family Income by Number of Earners in Davie County
The median family income in Davie County is $85,836, with families comprising 3+ earners (1,065) having the highest median family income of $125,250, while families with no earners (2,454) have the lowest median family income of $51,181, accounting for 9.6% and 22.1% of families, respectively.
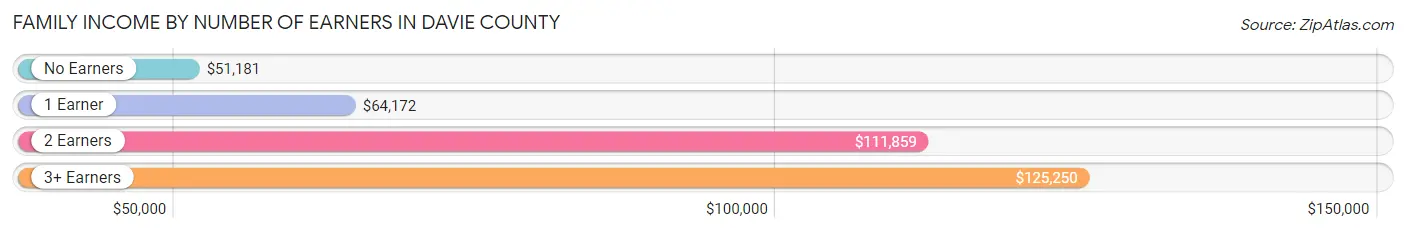
| Number of Earners | # Families | Median Income |
| No Earners | 2,454 (22.1%) | $51,181 |
| 1 Earner | 2,926 (26.4%) | $64,172 |
| 2 Earners | 4,656 (41.9%) | $111,859 |
| 3+ Earners | 1,065 (9.6%) | $125,250 |
| Total | 11,101 (100.0%) | $85,836 |
Household Income in Davie County
Household Income Brackets in Davie County
With 3,096 households falling in the category, the $50,000 to $74,999 income range is the most frequent in Davie County, accounting for 18.8% of all households. In contrast, only 494 households (3.0%) fall into the $10,000 to $14,999 income bracket, making it the least populous group.
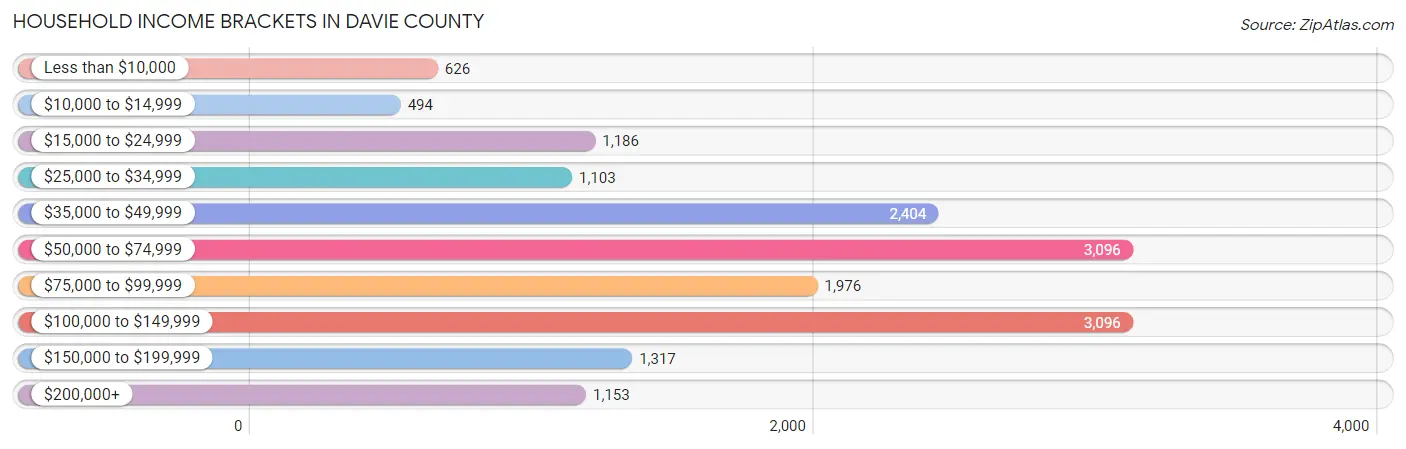
| Income Bracket | # Households | % Households |
| Less than $10,000 | 626 | 3.8% |
| $10,000 to $14,999 | 494 | 3.0% |
| $15,000 to $24,999 | 1,186 | 7.2% |
| $25,000 to $34,999 | 1,103 | 6.7% |
| $35,000 to $49,999 | 2,404 | 14.6% |
| $50,000 to $74,999 | 3,096 | 18.8% |
| $75,000 to $99,999 | 1,976 | 12.0% |
| $100,000 to $149,999 | 3,096 | 18.8% |
| $150,000 to $199,999 | 1,317 | 8.0% |
| $200,000+ | 1,153 | 7.0% |
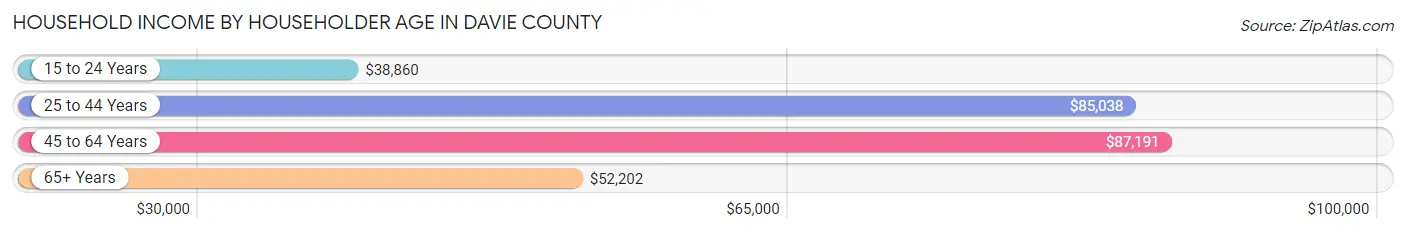
Household Income by Householder Age in Davie County
The median household income in Davie County is $69,105, with the highest median household income of $87,191 found in the 45 to 64 years age bracket for the primary householder. A total of 6,770 households (41.1%) fall into this category. Meanwhile, the 15 to 24 years age bracket for the primary householder has the lowest median household income of $38,860, with 383 households (2.3%) in this group.
| Income Bracket | # Households | Median Income |
| 15 to 24 Years | 383 (2.3%) | $38,860 |
| 25 to 44 Years | 3,463 (21.0%) | $85,038 |
| 45 to 64 Years | 6,770 (41.1%) | $87,191 |
| 65+ Years | 5,852 (35.5%) | $52,202 |
| Total | 16,468 (100.0%) | $69,105 |
Poverty in Davie County
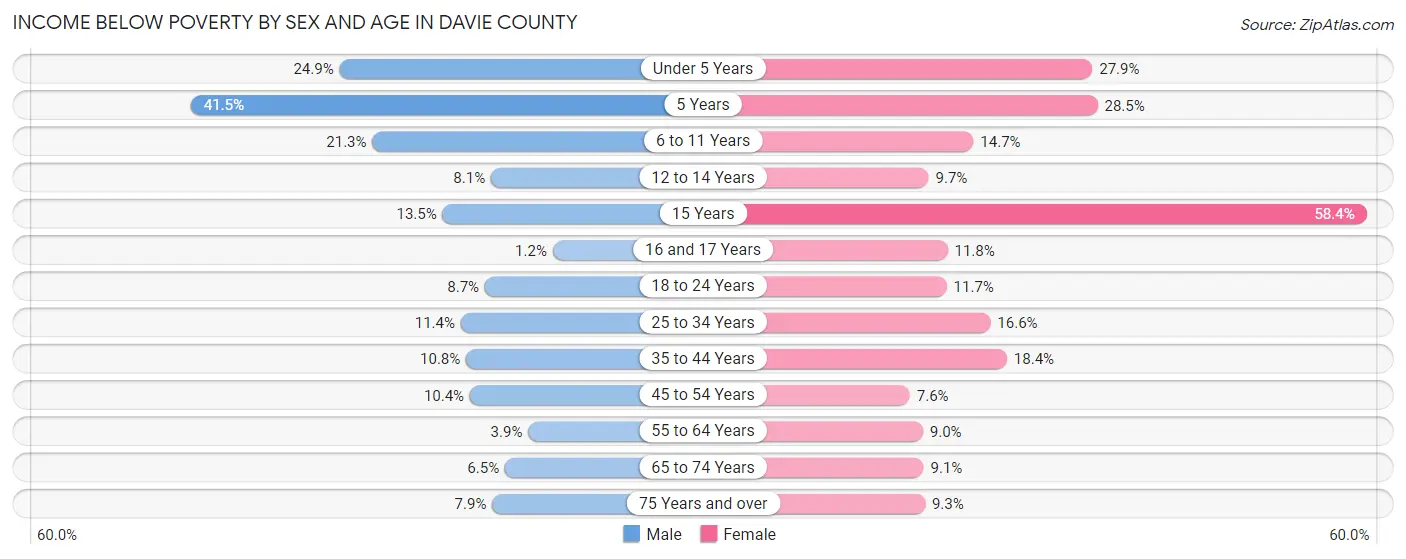
Income Below Poverty by Sex and Age in Davie County
With 10.3% poverty level for males and 12.9% for females among the residents of Davie County, 5 year old males and 15 year old females are the most vulnerable to poverty, with 100 males (41.5%) and 104 females (58.4%) in their respective age groups living below the poverty level.
| Age Bracket | Male | Female |
| Under 5 Years | 268 (24.9%) | 274 (27.9%) |
| 5 Years | 100 (41.5%) | 94 (28.5%) |
| 6 to 11 Years | 319 (21.3%) | 207 (14.7%) |
| 12 to 14 Years | 78 (8.1%) | 76 (9.7%) |
| 15 Years | 23 (13.5%) | 104 (58.4%) |
| 16 and 17 Years | 8 (1.2%) | 78 (11.8%) |
| 18 to 24 Years | 141 (8.7%) | 193 (11.7%) |
| 25 to 34 Years | 255 (11.4%) | 354 (16.6%) |
| 35 to 44 Years | 251 (10.8%) | 444 (18.4%) |
| 45 to 54 Years | 297 (10.4%) | 227 (7.6%) |
| 55 to 64 Years | 122 (3.9%) | 300 (9.0%) |
| 65 to 74 Years | 160 (6.5%) | 242 (9.1%) |
| 75 Years and over | 127 (7.9%) | 216 (9.3%) |
| Total | 2,149 (10.3%) | 2,809 (12.9%) |
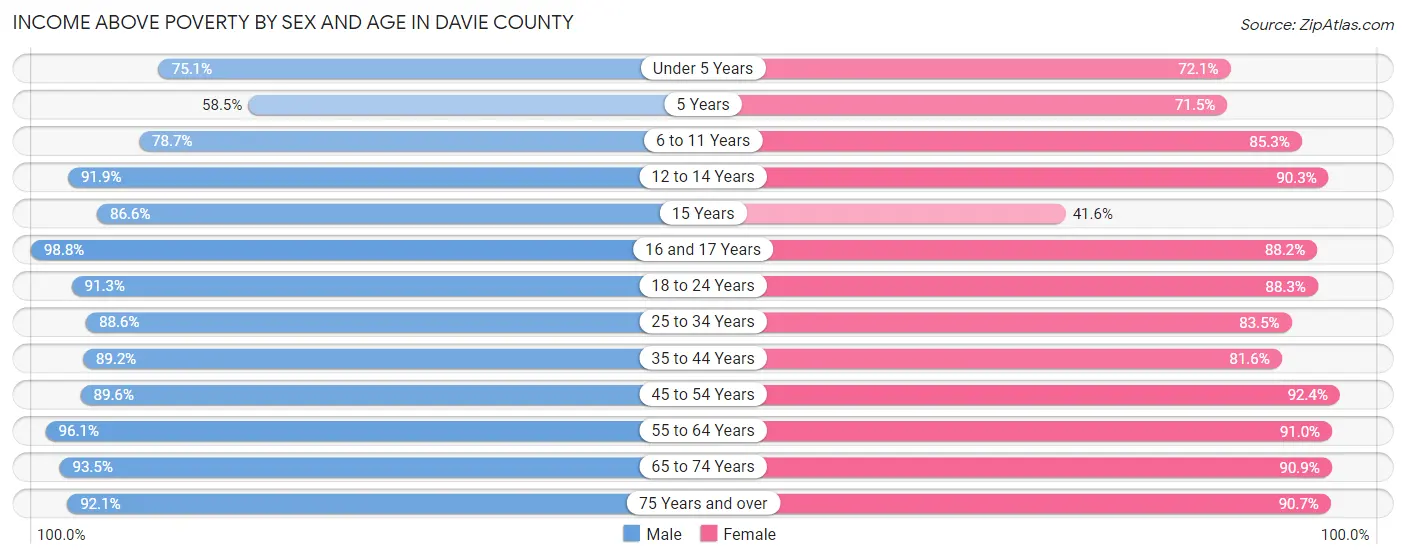
Income Above Poverty by Sex and Age in Davie County
According to the poverty statistics in Davie County, males aged 16 and 17 years and females aged 45 to 54 years are the age groups that are most secure financially, with 98.8% of males and 92.4% of females in these age groups living above the poverty line.
| Age Bracket | Male | Female |
| Under 5 Years | 807 (75.1%) | 708 (72.1%) |
| 5 Years | 141 (58.5%) | 236 (71.5%) |
| 6 to 11 Years | 1,181 (78.7%) | 1,205 (85.3%) |
| 12 to 14 Years | 890 (91.9%) | 710 (90.3%) |
| 15 Years | 148 (86.6%) | 74 (41.6%) |
| 16 and 17 Years | 671 (98.8%) | 584 (88.2%) |
| 18 to 24 Years | 1,474 (91.3%) | 1,460 (88.3%) |
| 25 to 34 Years | 1,977 (88.6%) | 1,785 (83.5%) |
| 35 to 44 Years | 2,066 (89.2%) | 1,970 (81.6%) |
| 45 to 54 Years | 2,560 (89.6%) | 2,767 (92.4%) |
| 55 to 64 Years | 3,001 (96.1%) | 3,022 (91.0%) |
| 65 to 74 Years | 2,300 (93.5%) | 2,413 (90.9%) |
| 75 Years and over | 1,477 (92.1%) | 2,116 (90.7%) |
| Total | 18,693 (89.7%) | 19,050 (87.2%) |
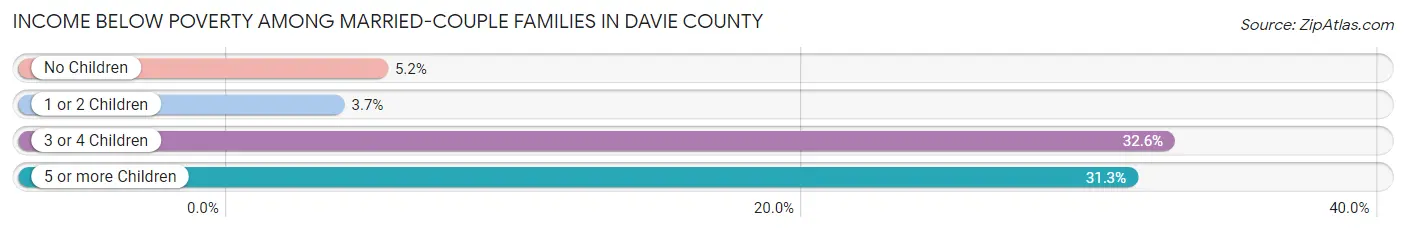
Income Below Poverty Among Married-Couple Families in Davie County
The poverty statistics for married-couple families in Davie County show that 6.6% or 585 of the total 8,896 families live below the poverty line. Families with 3 or 4 children have the highest poverty rate of 32.6%, comprising of 167 families. On the other hand, families with 1 or 2 children have the lowest poverty rate of 3.7%, which includes 102 families.
| Children | Above Poverty | Below Poverty |
| No Children | 5,264 (94.8%) | 290 (5.2%) |
| 1 or 2 Children | 2,645 (96.3%) | 102 (3.7%) |
| 3 or 4 Children | 345 (67.4%) | 167 (32.6%) |
| 5 or more Children | 57 (68.7%) | 26 (31.3%) |
| Total | 8,311 (93.4%) | 585 (6.6%) |
Income Below Poverty Among Single-Parent Households in Davie County
According to the poverty data in Davie County, 13.6% or 107 single-father households and 25.7% or 364 single-mother households are living below the poverty line. Among single-father households, those with no children have the highest poverty rate, with 50 households (15.8%) experiencing poverty. Likewise, among single-mother households, those with 5 or more children have the highest poverty rate, with 41 households (100.0%) falling below the poverty line.
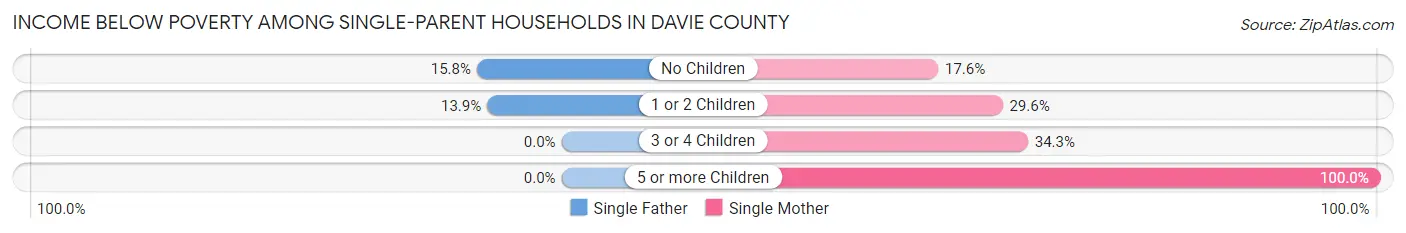
| Children | Single Father | Single Mother |
| No Children | 50 (15.8%) | 128 (17.6%) |
| 1 or 2 Children | 57 (13.9%) | 171 (29.6%) |
| 3 or 4 Children | 0 (0.0%) | 24 (34.3%) |
| 5 or more Children | 0 (0.0%) | 41 (100.0%) |
| Total | 107 (13.6%) | 364 (25.7%) |
Income Below Poverty Among Married-Couple vs Single-Parent Households in Davie County
The poverty data for Davie County shows that 585 of the married-couple family households (6.6%) and 471 of the single-parent households (21.4%) are living below the poverty level. Within the married-couple family households, those with 3 or 4 children have the highest poverty rate, with 167 households (32.6%) falling below the poverty line. Among the single-parent households, those with 5 or more children have the highest poverty rate, with 41 household (100.0%) living below poverty.
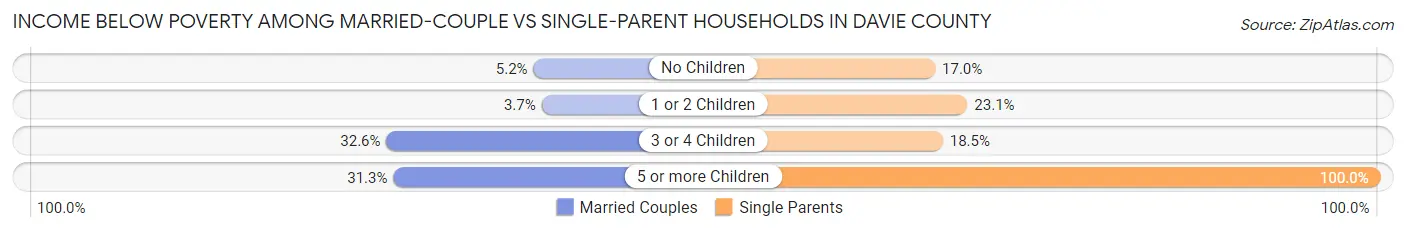
| Children | Married-Couple Families | Single-Parent Households |
| No Children | 290 (5.2%) | 178 (17.0%) |
| 1 or 2 Children | 102 (3.7%) | 228 (23.1%) |
| 3 or 4 Children | 167 (32.6%) | 24 (18.5%) |
| 5 or more Children | 26 (31.3%) | 41 (100.0%) |
| Total | 585 (6.6%) | 471 (21.4%) |
Race in Davie County
The most populous races in Davie County are White / Caucasian (36,814 | 85.6%), Hispanic or Latino (3,157 | 7.3%), and Two or more Races (2,707 | 6.3%).
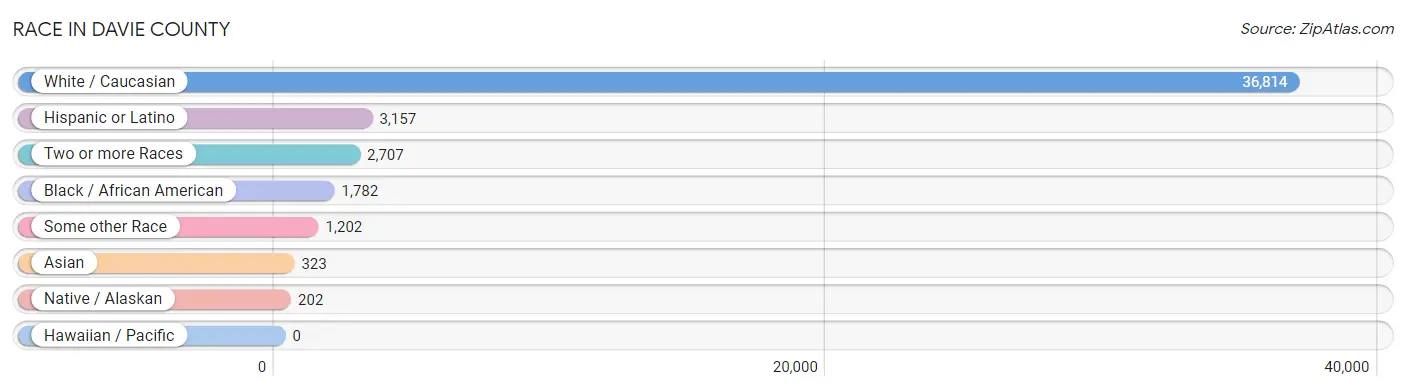
| Race | # Population | % Population |
| Asian | 323 | 0.7% |
| Black / African American | 1,782 | 4.1% |
| Hawaiian / Pacific | 0 | 0.0% |
| Hispanic or Latino | 3,157 | 7.3% |
| Native / Alaskan | 202 | 0.5% |
| White / Caucasian | 36,814 | 85.6% |
| Two or more Races | 2,707 | 6.3% |
| Some other Race | 1,202 | 2.8% |
| Total | 43,030 | 100.0% |
Ancestry in Davie County
The most populous ancestries reported in Davie County are English (6,127 | 14.2%), German (5,915 | 13.8%), Irish (4,114 | 9.6%), American (4,063 | 9.4%), and Mexican (2,555 | 5.9%), together accounting for 52.9% of all Davie County residents.
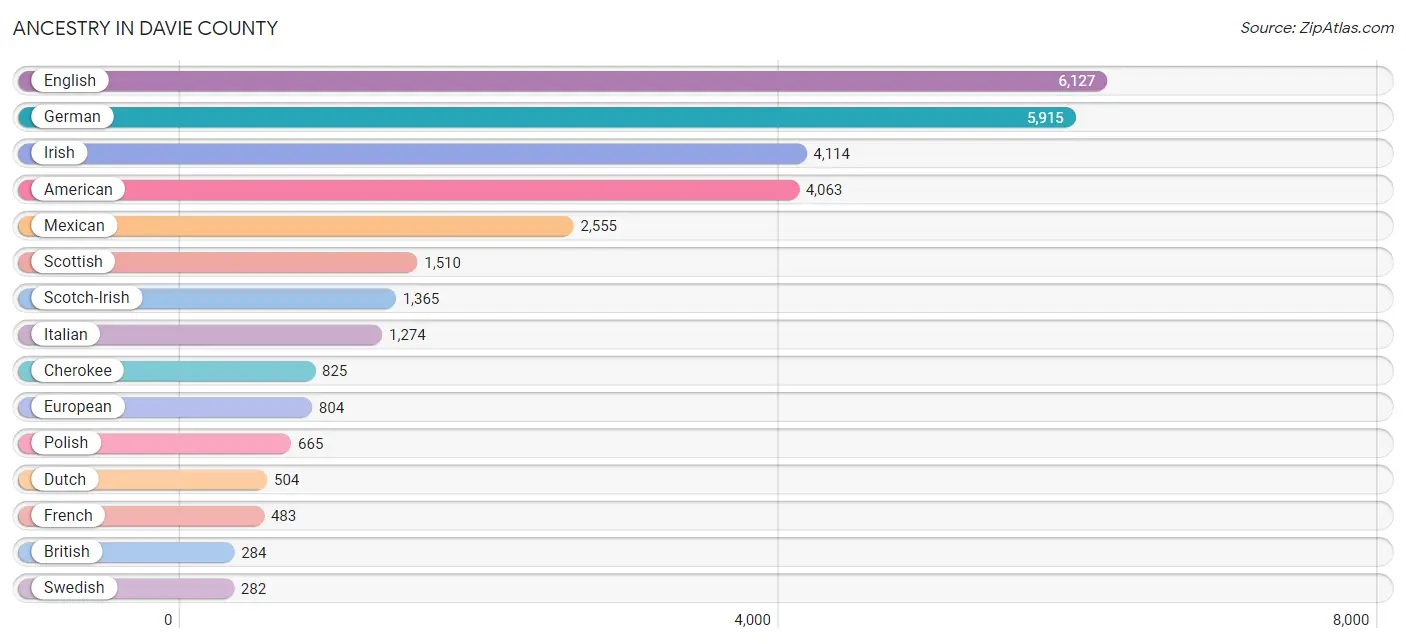
| Ancestry | # Population | % Population |
| African | 31 | 0.1% |
| American | 4,063 | 9.4% |
| Arab | 227 | 0.5% |
| Austrian | 32 | 0.1% |
| Belgian | 21 | 0.1% |
| Bhutanese | 24 | 0.1% |
| Blackfeet | 105 | 0.2% |
| British | 284 | 0.7% |
| Burmese | 33 | 0.1% |
| Canadian | 24 | 0.1% |
| Carpatho Rusyn | 8 | 0.0% |
| Central American | 153 | 0.4% |
| Central American Indian | 97 | 0.2% |
| Cherokee | 825 | 1.9% |
| Choctaw | 3 | 0.0% |
| Colombian | 82 | 0.2% |
| Creek | 8 | 0.0% |
| Czech | 90 | 0.2% |
| Danish | 33 | 0.1% |
| Dominican | 57 | 0.1% |
| Dutch | 504 | 1.2% |
| Eastern European | 89 | 0.2% |
| Ecuadorian | 17 | 0.0% |
| English | 6,127 | 14.2% |
| Estonian | 22 | 0.1% |
| European | 804 | 1.9% |
| French | 483 | 1.1% |
| French Canadian | 270 | 0.6% |
| German | 5,915 | 13.8% |
| Greek | 132 | 0.3% |
| Guatemalan | 40 | 0.1% |
| Haitian | 25 | 0.1% |
| Honduran | 36 | 0.1% |
| Hungarian | 33 | 0.1% |
| Icelander | 26 | 0.1% |
| Indian (Asian) | 125 | 0.3% |
| Irish | 4,114 | 9.6% |
| Iroquois | 18 | 0.0% |
| Israeli | 44 | 0.1% |
| Italian | 1,274 | 3.0% |
| Jamaican | 11 | 0.0% |
| Korean | 177 | 0.4% |
| Lebanese | 180 | 0.4% |
| Lithuanian | 18 | 0.0% |
| Lumbee | 81 | 0.2% |
| Maltese | 61 | 0.1% |
| Mexican | 2,555 | 5.9% |
| Mexican American Indian | 49 | 0.1% |
| Navajo | 12 | 0.0% |
| Northern European | 21 | 0.1% |
| Norwegian | 197 | 0.5% |
| Pennsylvania German | 12 | 0.0% |
| Polish | 665 | 1.5% |
| Portuguese | 156 | 0.4% |
| Puerto Rican | 275 | 0.6% |
| Romanian | 41 | 0.1% |
| Russian | 173 | 0.4% |
| Salvadoran | 77 | 0.2% |
| Scandinavian | 104 | 0.2% |
| Scotch-Irish | 1,365 | 3.2% |
| Scottish | 1,510 | 3.5% |
| Seminole | 20 | 0.1% |
| Serbian | 14 | 0.0% |
| Sioux | 5 | 0.0% |
| Slovak | 40 | 0.1% |
| South African | 29 | 0.1% |
| South American | 117 | 0.3% |
| Sri Lankan | 32 | 0.1% |
| Subsaharan African | 62 | 0.1% |
| Swedish | 282 | 0.7% |
| Swiss | 143 | 0.3% |
| Thai | 69 | 0.2% |
| Venezuelan | 18 | 0.0% |
| Welsh | 264 | 0.6% | View All 74 Rows |
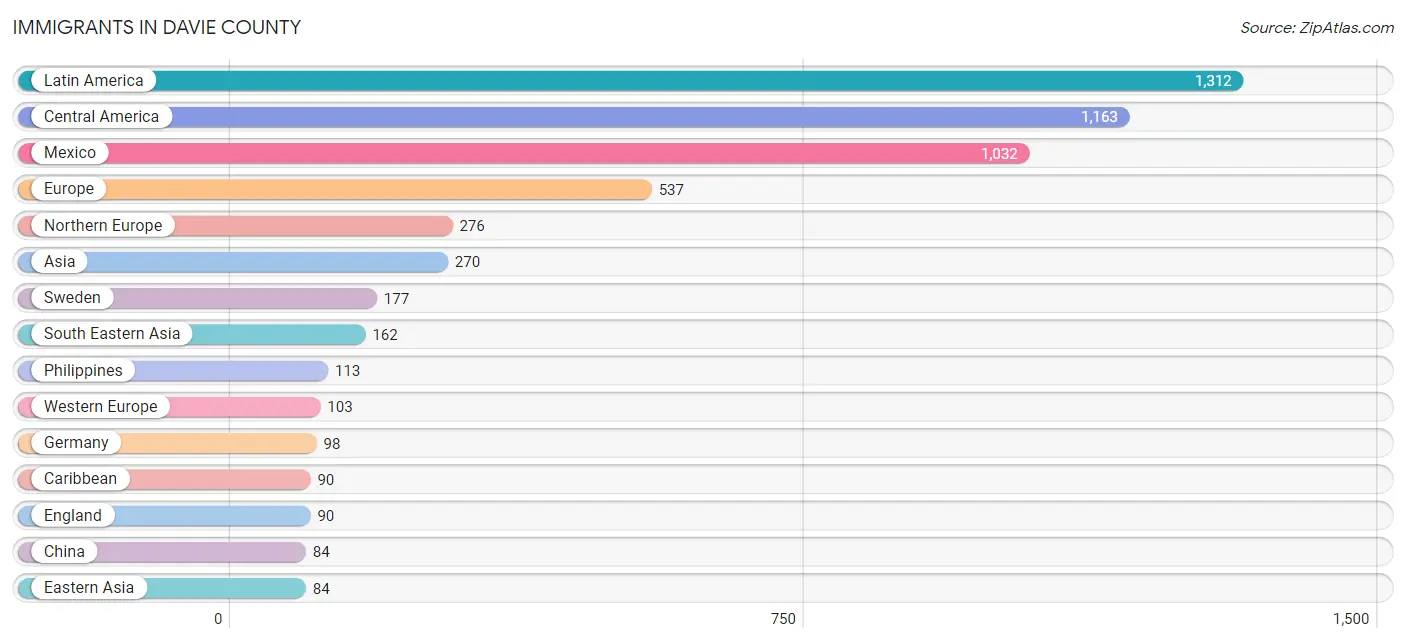
Immigrants in Davie County
The most numerous immigrant groups reported in Davie County came from Latin America (1,312 | 3.0%), Central America (1,163 | 2.7%), Mexico (1,032 | 2.4%), Europe (537 | 1.3%), and Northern Europe (276 | 0.6%), together accounting for 10.0% of all Davie County residents.
| Immigration Origin | # Population | % Population |
| Africa | 31 | 0.1% |
| Asia | 270 | 0.6% |
| Australia | 15 | 0.0% |
| Canada | 78 | 0.2% |
| Caribbean | 90 | 0.2% |
| Central America | 1,163 | 2.7% |
| China | 84 | 0.2% |
| Colombia | 50 | 0.1% |
| Czechoslovakia | 6 | 0.0% |
| Dominican Republic | 37 | 0.1% |
| Eastern Asia | 84 | 0.2% |
| Eastern Europe | 53 | 0.1% |
| Ecuador | 9 | 0.0% |
| El Salvador | 64 | 0.2% |
| England | 90 | 0.2% |
| Europe | 537 | 1.3% |
| France | 5 | 0.0% |
| Germany | 98 | 0.2% |
| Guatemala | 31 | 0.1% |
| Honduras | 36 | 0.1% |
| Iraq | 14 | 0.0% |
| Italy | 33 | 0.1% |
| Jamaica | 11 | 0.0% |
| Latin America | 1,312 | 3.0% |
| Mexico | 1,032 | 2.4% |
| Middle Africa | 2 | 0.0% |
| Northern Europe | 276 | 0.6% |
| Oceania | 15 | 0.0% |
| Philippines | 113 | 0.3% |
| Poland | 4 | 0.0% |
| Russia | 35 | 0.1% |
| Singapore | 17 | 0.0% |
| South Africa | 29 | 0.1% |
| South America | 59 | 0.1% |
| South Eastern Asia | 162 | 0.4% |
| Southern Europe | 52 | 0.1% |
| Sweden | 177 | 0.4% |
| Trinidad and Tobago | 42 | 0.1% |
| Ukraine | 8 | 0.0% |
| Vietnam | 32 | 0.1% |
| Western Asia | 24 | 0.1% |
| Western Europe | 103 | 0.2% |
| Zaire | 2 | 0.0% | View All 43 Rows |
Sex and Age in Davie County
Sex and Age in Davie County
The most populous age groups in Davie County are 60 to 64 Years (1,570 | 7.5%) for men and 60 to 64 Years (1,819 | 8.3%) for women.
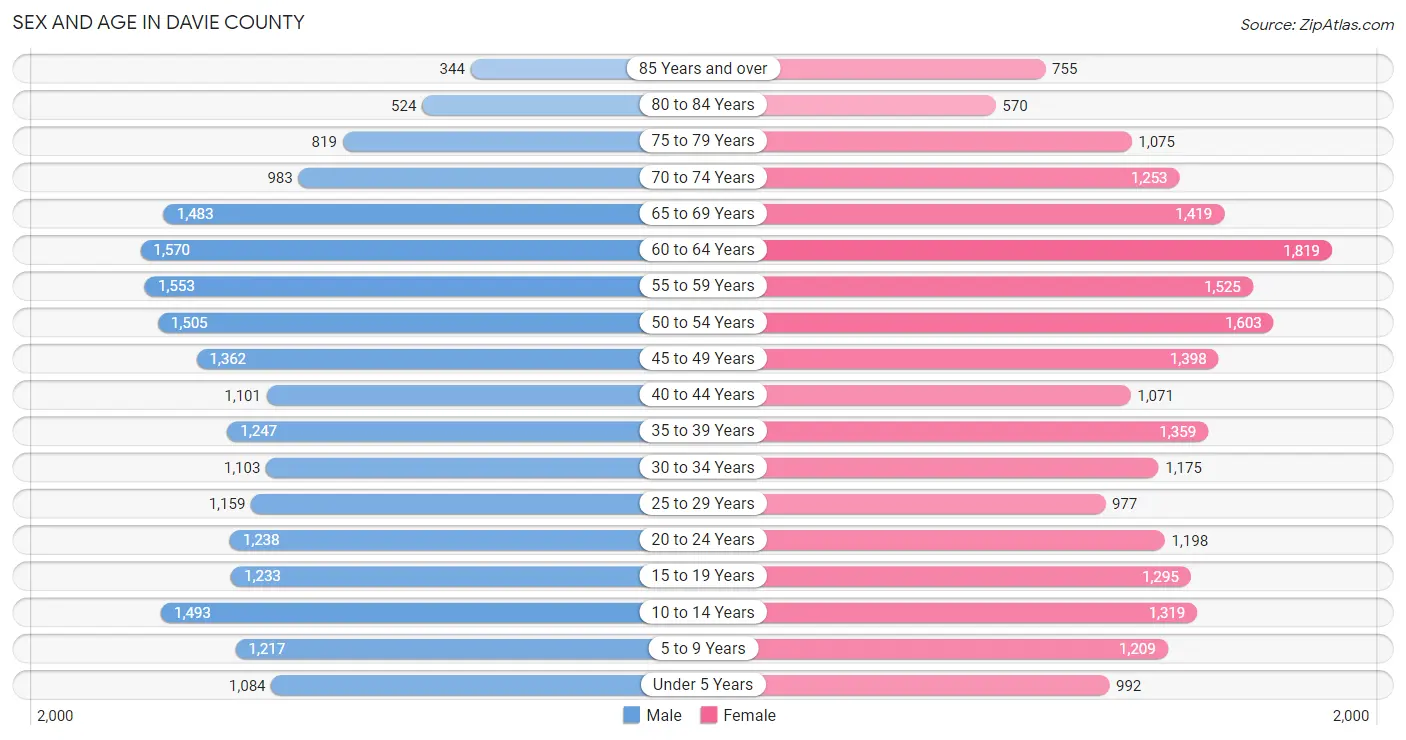
| Age Bracket | Male | Female |
| Under 5 Years | 1,084 (5.2%) | 992 (4.5%) |
| 5 to 9 Years | 1,217 (5.8%) | 1,209 (5.5%) |
| 10 to 14 Years | 1,493 (7.1%) | 1,319 (6.0%) |
| 15 to 19 Years | 1,233 (5.9%) | 1,295 (5.9%) |
| 20 to 24 Years | 1,238 (5.9%) | 1,198 (5.4%) |
| 25 to 29 Years | 1,159 (5.5%) | 977 (4.4%) |
| 30 to 34 Years | 1,103 (5.2%) | 1,175 (5.3%) |
| 35 to 39 Years | 1,247 (5.9%) | 1,359 (6.2%) |
| 40 to 44 Years | 1,101 (5.2%) | 1,071 (4.9%) |
| 45 to 49 Years | 1,362 (6.5%) | 1,398 (6.4%) |
| 50 to 54 Years | 1,505 (7.2%) | 1,603 (7.3%) |
| 55 to 59 Years | 1,553 (7.4%) | 1,525 (6.9%) |
| 60 to 64 Years | 1,570 (7.5%) | 1,819 (8.3%) |
| 65 to 69 Years | 1,483 (7.1%) | 1,419 (6.5%) |
| 70 to 74 Years | 983 (4.7%) | 1,253 (5.7%) |
| 75 to 79 Years | 819 (3.9%) | 1,075 (4.9%) |
| 80 to 84 Years | 524 (2.5%) | 570 (2.6%) |
| 85 Years and over | 344 (1.6%) | 755 (3.4%) |
| Total | 21,018 (100.0%) | 22,012 (100.0%) |
Families and Households in Davie County
Median Family Size in Davie County
The median family size in Davie County is 3.18 persons per family, with single female/mother families (1,417 | 12.8%) accounting for the largest median family size of 3.52 persons per family. On the other hand, single male/father families (788 | 7.1%) represent the smallest median family size with 2.94 persons per family.
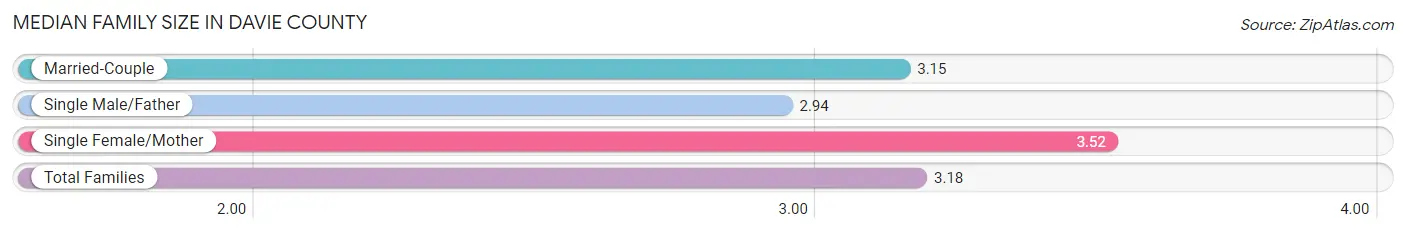
| Family Type | # Families | Family Size |
| Married-Couple | 8,896 (80.1%) | 3.15 |
| Single Male/Father | 788 (7.1%) | 2.94 |
| Single Female/Mother | 1,417 (12.8%) | 3.52 |
| Total Families | 11,101 (100.0%) | 3.18 |
Median Household Size in Davie County
The median household size in Davie County is 2.59 persons per household, with single female/mother households (1,417 | 8.6%) accounting for the largest median household size of 3.84 persons per household. non-family households (5,367 | 32.6%) represent the smallest median household size with 1.17 persons per household.
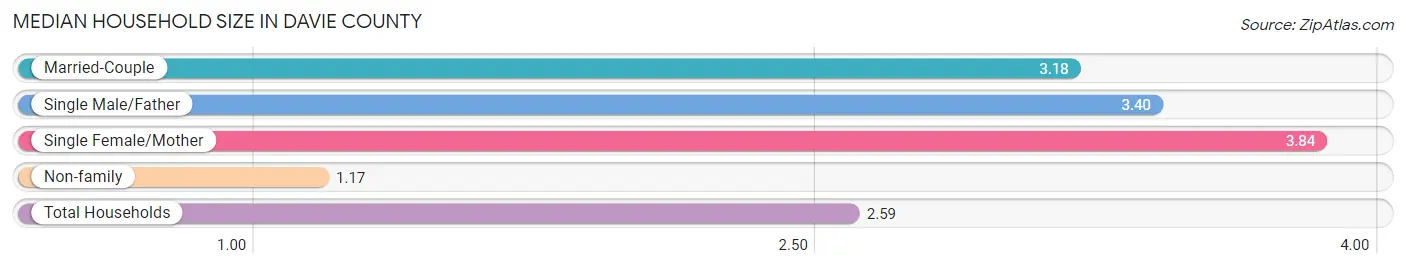
| Household Type | # Households | Household Size |
| Married-Couple | 8,896 (54.0%) | 3.18 |
| Single Male/Father | 788 (4.8%) | 3.40 |
| Single Female/Mother | 1,417 (8.6%) | 3.84 |
| Non-family | 5,367 (32.6%) | 1.17 |
| Total Households | 16,468 (100.0%) | 2.59 |
Household Size by Marriage Status in Davie County
Out of a total of 16,468 households in Davie County, 11,101 (67.4%) are family households, while 5,367 (32.6%) are nonfamily households. The most numerous type of family households are 2-person households, comprising 5,417, and the most common type of nonfamily households are 1-person households, comprising 4,695.
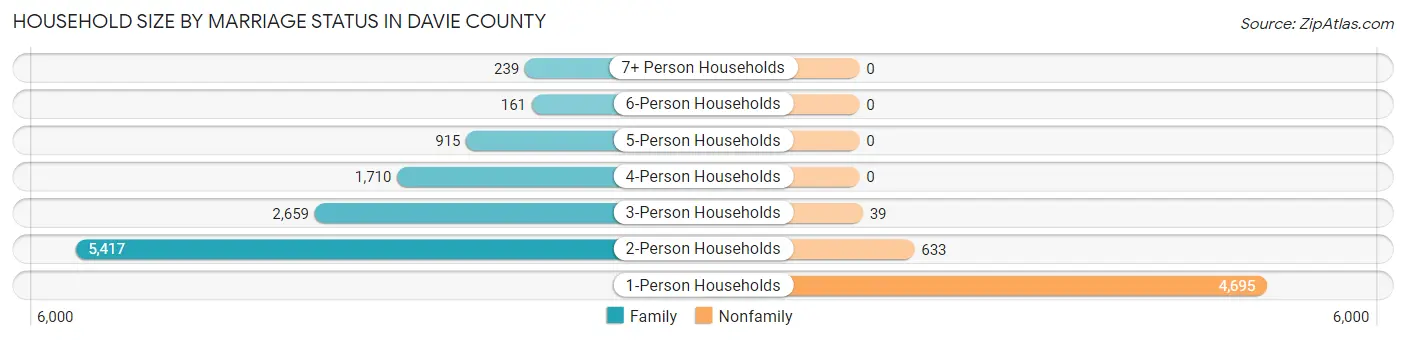
| Household Size | Family Households | Nonfamily Households |
| 1-Person Households | - | 4,695 (28.5%) |
| 2-Person Households | 5,417 (32.9%) | 633 (3.8%) |
| 3-Person Households | 2,659 (16.2%) | 39 (0.2%) |
| 4-Person Households | 1,710 (10.4%) | 0 (0.0%) |
| 5-Person Households | 915 (5.6%) | 0 (0.0%) |
| 6-Person Households | 161 (1.0%) | 0 (0.0%) |
| 7+ Person Households | 239 (1.5%) | 0 (0.0%) |
| Total | 11,101 (67.4%) | 5,367 (32.6%) |
Female Fertility in Davie County
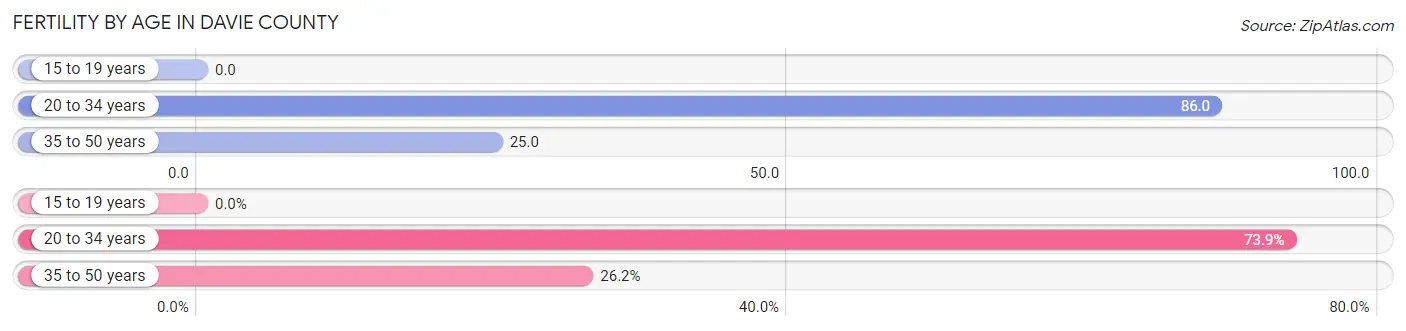
Fertility by Age in Davie County
Average fertility rate in Davie County is 45.0 births per 1,000 women. Women in the age bracket of 20 to 34 years have the highest fertility rate with 86.0 births per 1,000 women. Women in the age bracket of 20 to 34 years acount for 73.9% of all women with births.
| Age Bracket | Women with Births | Births / 1,000 Women |
| 15 to 19 years | 0 (0.0%) | 0.0 |
| 20 to 34 years | 288 (73.9%) | 86.0 |
| 35 to 50 years | 102 (26.2%) | 25.0 |
| Total | 390 (100.0%) | 45.0 |
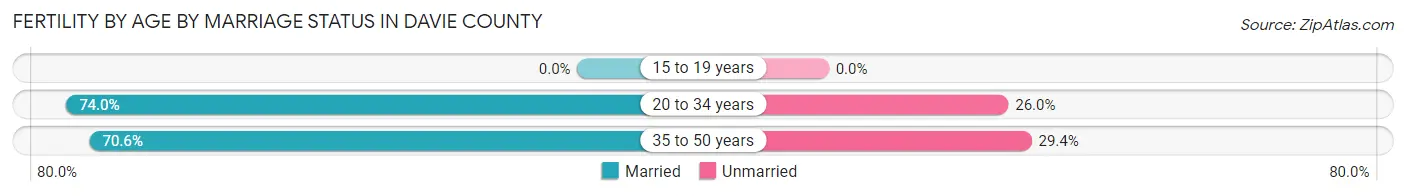
Fertility by Age by Marriage Status in Davie County
73.1% of women with births (390) in Davie County are married. The highest percentage of unmarried women with births falls into 35 to 50 years age bracket with 29.4% of them unmarried at the time of birth, while the lowest percentage of unmarried women with births belong to 20 to 34 years age bracket with 26.0% of them unmarried.
| Age Bracket | Married | Unmarried |
| 15 to 19 years | 0 (0.0%) | 0 (0.0%) |
| 20 to 34 years | 213 (74.0%) | 75 (26.0%) |
| 35 to 50 years | 72 (70.6%) | 30 (29.4%) |
| Total | 285 (73.1%) | 105 (26.9%) |
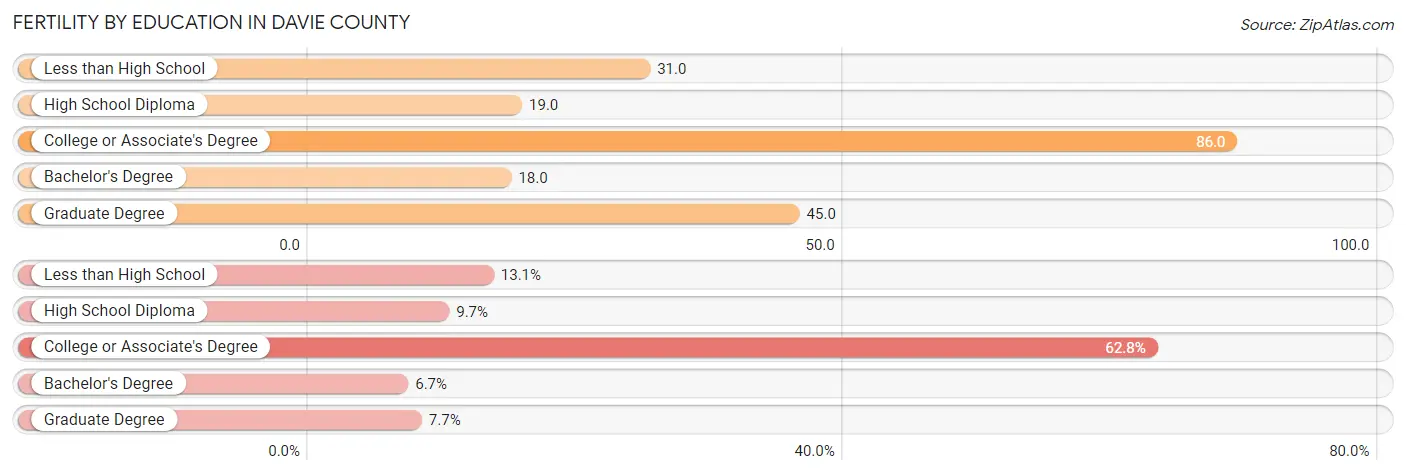
Fertility by Education in Davie County
Average fertility rate in Davie County is 45.0 births per 1,000 women. Women with the education attainment of college or associate's degree have the highest fertility rate of 86.0 births per 1,000 women, while women with the education attainment of bachelor's degree have the lowest fertility at 18.0 births per 1,000 women. Women with the education attainment of college or associate's degree represent 62.8% of all women with births.
| Educational Attainment | Women with Births | Births / 1,000 Women |
| Less than High School | 51 (13.1%) | 31.0 |
| High School Diploma | 38 (9.7%) | 19.0 |
| College or Associate's Degree | 245 (62.8%) | 86.0 |
| Bachelor's Degree | 26 (6.7%) | 18.0 |
| Graduate Degree | 30 (7.7%) | 45.0 |
| Total | 390 (100.0%) | 45.0 |
Fertility by Education by Marriage Status in Davie County
26.9% of women with births in Davie County are unmarried. Women with the educational attainment of bachelor's degree are most likely to be married with 100.0% of them married at childbirth, while women with the educational attainment of less than high school are least likely to be married with 68.6% of them unmarried at childbirth.
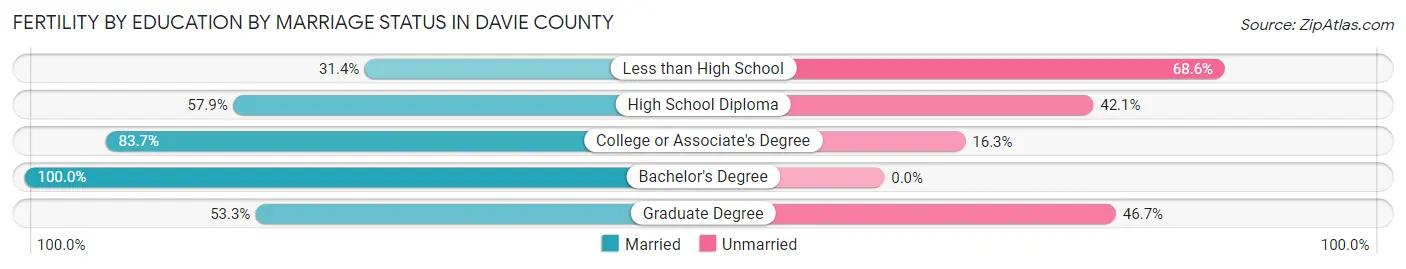
| Educational Attainment | Married | Unmarried |
| Less than High School | 16 (31.4%) | 35 (68.6%) |
| High School Diploma | 22 (57.9%) | 16 (42.1%) |
| College or Associate's Degree | 205 (83.7%) | 40 (16.3%) |
| Bachelor's Degree | 26 (100.0%) | 0 (0.0%) |
| Graduate Degree | 16 (53.3%) | 14 (46.7%) |
| Total | 285 (73.1%) | 105 (26.9%) |
Employment Characteristics in Davie County
Employment by Class of Employer in Davie County
Among the 19,362 employed individuals in Davie County, private company employees (13,589 | 70.2%), not-for-profit organizations (1,438 | 7.4%), and local government employees (1,381 | 7.1%) make up the most common classes of employment.
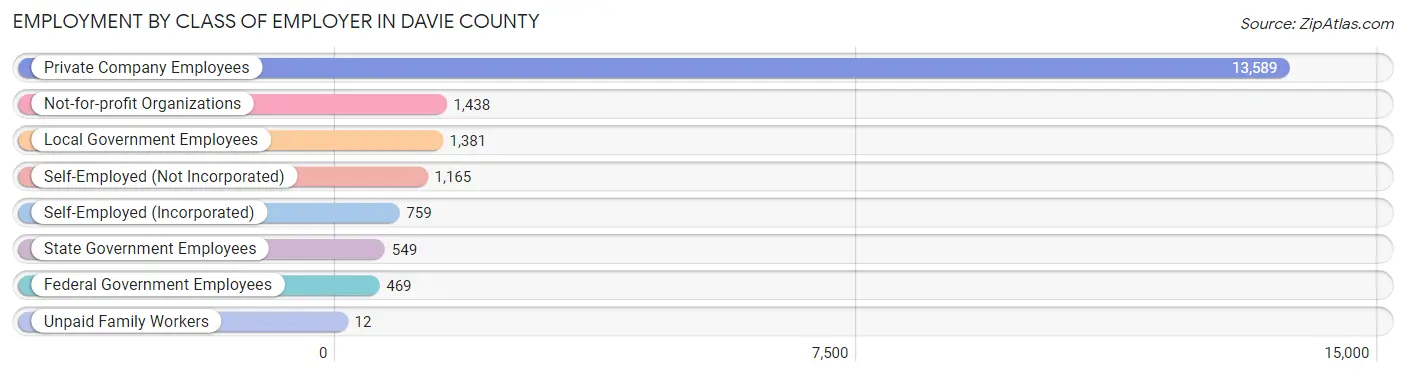
| Employer Class | # Employees | % Employees |
| Private Company Employees | 13,589 | 70.2% |
| Self-Employed (Incorporated) | 759 | 3.9% |
| Self-Employed (Not Incorporated) | 1,165 | 6.0% |
| Not-for-profit Organizations | 1,438 | 7.4% |
| Local Government Employees | 1,381 | 7.1% |
| State Government Employees | 549 | 2.8% |
| Federal Government Employees | 469 | 2.4% |
| Unpaid Family Workers | 12 | 0.1% |
| Total | 19,362 | 100.0% |
Employment Status by Age in Davie County
According to the labor force statistics for Davie County, out of the total population over 16 years of age (35,367), 58.9% or 20,831 individuals are in the labor force, with 4.6% or 958 of them unemployed. The age group with the highest labor force participation rate is 35 to 44 years, with 89.1% or 4,257 individuals in the labor force. Within the labor force, the 16 to 19 years age range has the highest percentage of unemployed individuals, with 16.4% or 147 of them being unemployed.
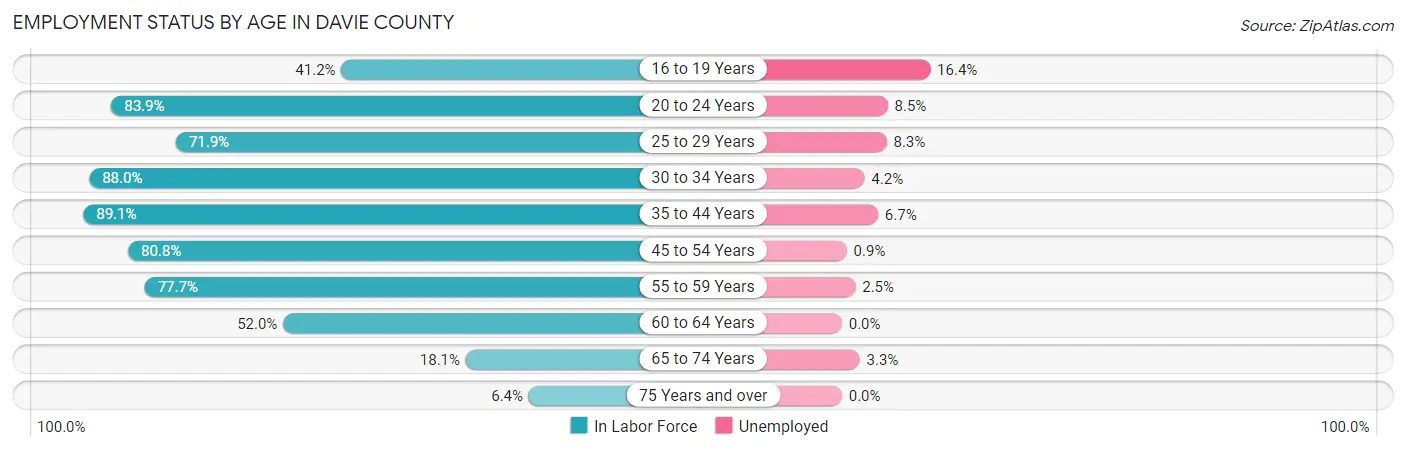
| Age Bracket | In Labor Force | Unemployed |
| 16 to 19 Years | 898 (41.2%) | 147 (16.4%) |
| 20 to 24 Years | 2,044 (83.9%) | 174 (8.5%) |
| 25 to 29 Years | 1,536 (71.9%) | 127 (8.3%) |
| 30 to 34 Years | 2,005 (88.0%) | 84 (4.2%) |
| 35 to 44 Years | 4,257 (89.1%) | 285 (6.7%) |
| 45 to 54 Years | 4,741 (80.8%) | 43 (0.9%) |
| 55 to 59 Years | 2,392 (77.7%) | 60 (2.5%) |
| 60 to 64 Years | 1,762 (52.0%) | 0 (0.0%) |
| 65 to 74 Years | 930 (18.1%) | 31 (3.3%) |
| 75 Years and over | 262 (6.4%) | 0 (0.0%) |
| Total | 20,831 (58.9%) | 958 (4.6%) |
Employment Status by Educational Attainment in Davie County
According to labor force statistics for Davie County, 77.5% of individuals (16,683) out of the total population between 25 and 64 years of age (21,527) are in the labor force, with 3.6% or 601 of them being unemployed. The group with the highest labor force participation rate are those with the educational attainment of bachelor's degree or higher, with 86.3% or 4,992 individuals in the labor force. Within the labor force, individuals with less than high school education have the highest percentage of unemployment, with 16.8% or 271 of them being unemployed.
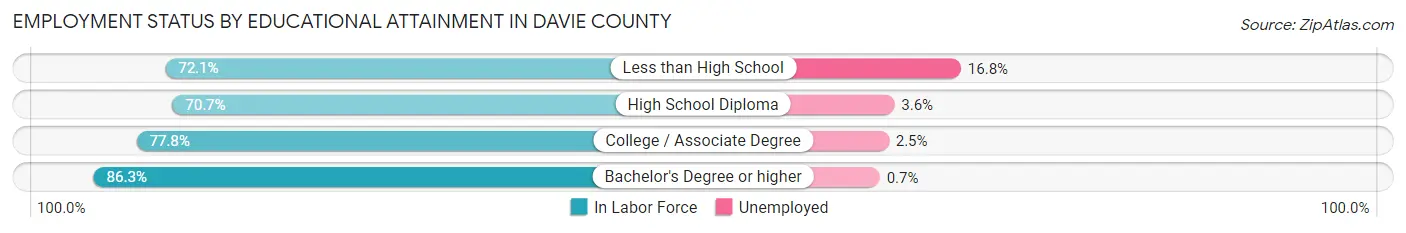
| Educational Attainment | In Labor Force | Unemployed |
| Less than High School | 1,611 (72.1%) | 375 (16.8%) |
| High School Diploma | 4,168 (70.7%) | 212 (3.6%) |
| College / Associate Degree | 5,922 (77.8%) | 190 (2.5%) |
| Bachelor's Degree or higher | 4,992 (86.3%) | 40 (0.7%) |
| Total | 16,683 (77.5%) | 775 (3.6%) |
Employment Occupations by Sex in Davie County
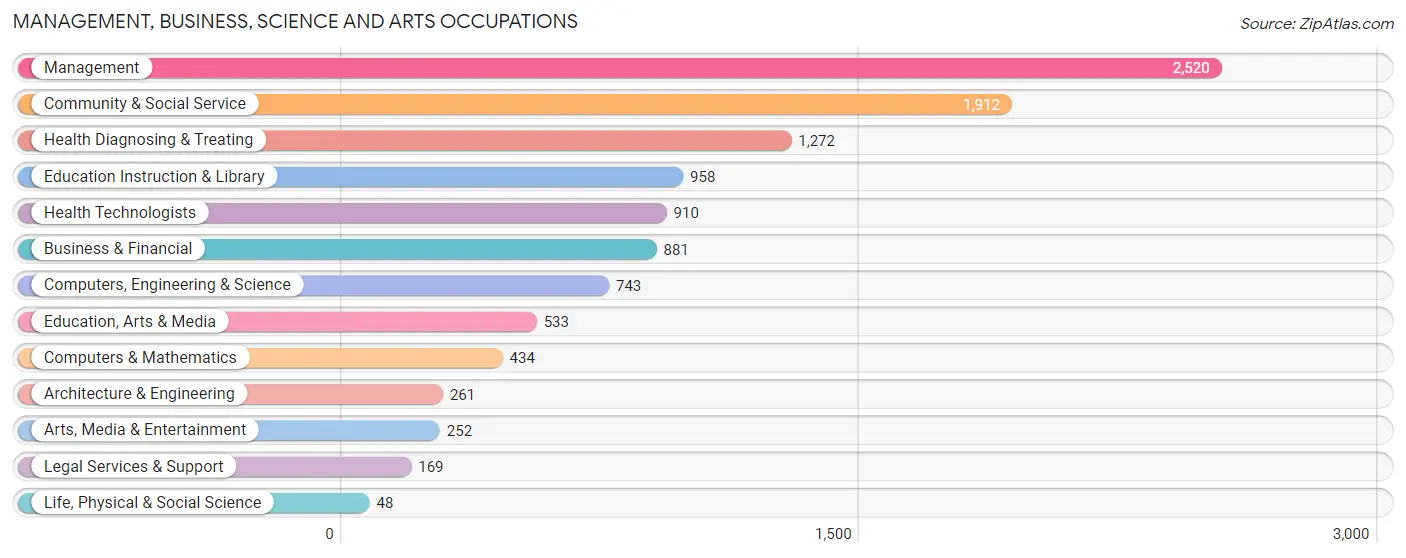
Management, Business, Science and Arts Occupations
The most common Management, Business, Science and Arts occupations in Davie County are Management (2,520 | 12.7%), Community & Social Service (1,912 | 9.7%), Health Diagnosing & Treating (1,272 | 6.4%), Education Instruction & Library (958 | 4.8%), and Health Technologists (910 | 4.6%).
Management, Business, Science and Arts Occupations by Sex
Within the Management, Business, Science and Arts occupations in Davie County, the most male-oriented occupations are Architecture & Engineering (86.2%), Life, Physical & Social Science (83.3%), and Computers, Engineering & Science (75.2%), while the most female-oriented occupations are Legal Services & Support (89.3%), Health Diagnosing & Treating (80.6%), and Health Technologists (80.3%).
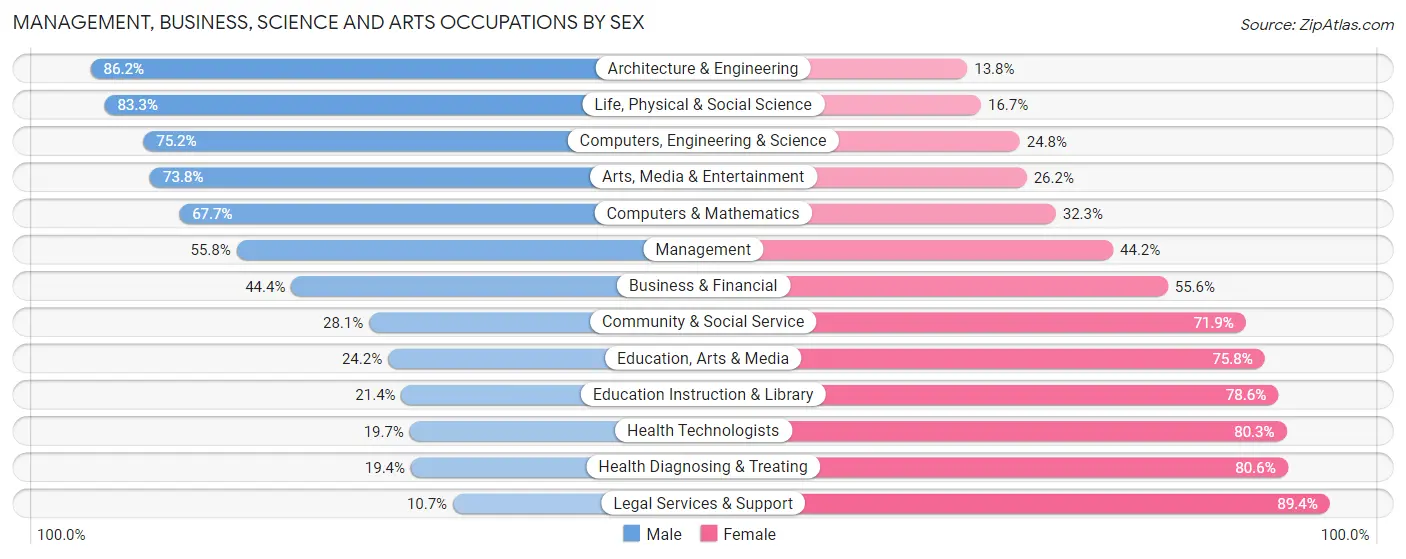
| Occupation | Male | Female |
| Management | 1,406 (55.8%) | 1,114 (44.2%) |
| Business & Financial | 391 (44.4%) | 490 (55.6%) |
| Computers, Engineering & Science | 559 (75.2%) | 184 (24.8%) |
| Computers & Mathematics | 294 (67.7%) | 140 (32.3%) |
| Architecture & Engineering | 225 (86.2%) | 36 (13.8%) |
| Life, Physical & Social Science | 40 (83.3%) | 8 (16.7%) |
| Community & Social Service | 538 (28.1%) | 1,374 (71.9%) |
| Education, Arts & Media | 129 (24.2%) | 404 (75.8%) |
| Legal Services & Support | 18 (10.6%) | 151 (89.3%) |
| Education Instruction & Library | 205 (21.4%) | 753 (78.6%) |
| Arts, Media & Entertainment | 186 (73.8%) | 66 (26.2%) |
| Health Diagnosing & Treating | 247 (19.4%) | 1,025 (80.6%) |
| Health Technologists | 179 (19.7%) | 731 (80.3%) |
| Total (Category) | 3,141 (42.9%) | 4,187 (57.1%) |
| Total (Overall) | 10,370 (52.4%) | 9,430 (47.6%) |
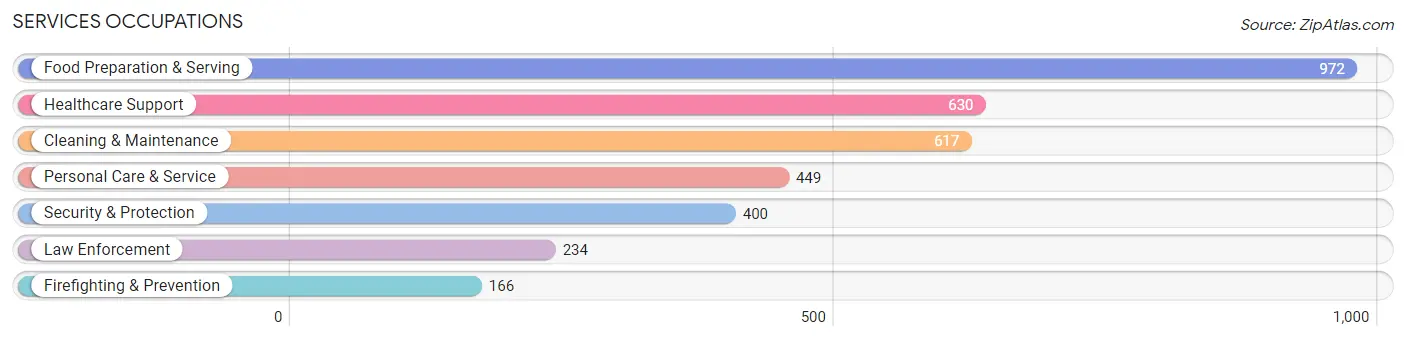
Services Occupations
The most common Services occupations in Davie County are Food Preparation & Serving (972 | 4.9%), Healthcare Support (630 | 3.2%), Cleaning & Maintenance (617 | 3.1%), Personal Care & Service (449 | 2.3%), and Security & Protection (400 | 2.0%).
Services Occupations by Sex
Within the Services occupations in Davie County, the most male-oriented occupations are Law Enforcement (100.0%), Security & Protection (93.0%), and Firefighting & Prevention (83.1%), while the most female-oriented occupations are Healthcare Support (98.1%), Personal Care & Service (91.8%), and Food Preparation & Serving (67.3%).
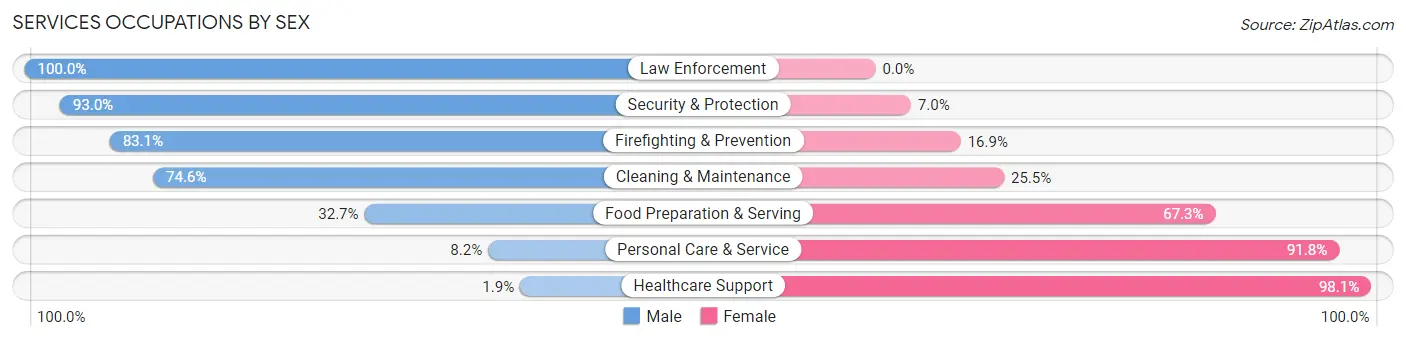
| Occupation | Male | Female |
| Healthcare Support | 12 (1.9%) | 618 (98.1%) |
| Security & Protection | 372 (93.0%) | 28 (7.0%) |
| Firefighting & Prevention | 138 (83.1%) | 28 (16.9%) |
| Law Enforcement | 234 (100.0%) | 0 (0.0%) |
| Food Preparation & Serving | 318 (32.7%) | 654 (67.3%) |
| Cleaning & Maintenance | 460 (74.6%) | 157 (25.5%) |
| Personal Care & Service | 37 (8.2%) | 412 (91.8%) |
| Total (Category) | 1,199 (39.1%) | 1,869 (60.9%) |
| Total (Overall) | 10,370 (52.4%) | 9,430 (47.6%) |
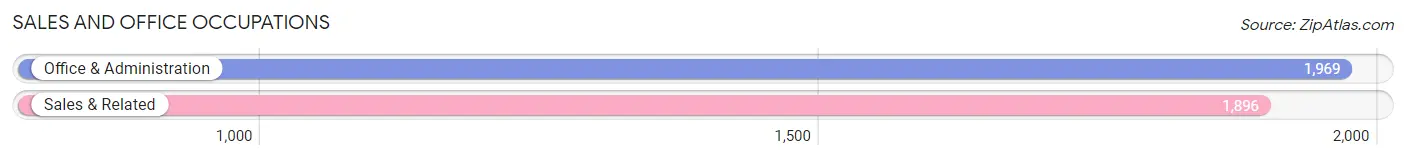
Sales and Office Occupations
The most common Sales and Office occupations in Davie County are Office & Administration (1,969 | 9.9%), and Sales & Related (1,896 | 9.6%).
Sales and Office Occupations by Sex
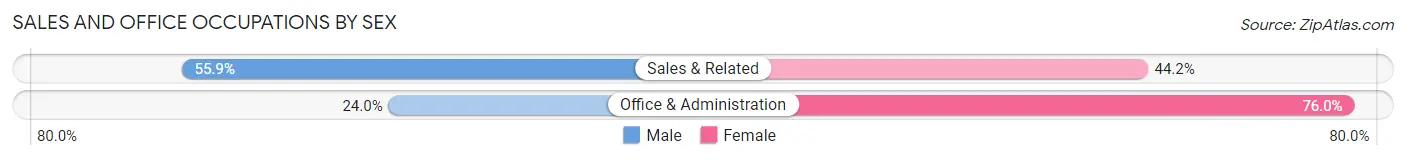
| Occupation | Male | Female |
| Sales & Related | 1,059 (55.8%) | 837 (44.2%) |
| Office & Administration | 473 (24.0%) | 1,496 (76.0%) |
| Total (Category) | 1,532 (39.6%) | 2,333 (60.4%) |
| Total (Overall) | 10,370 (52.4%) | 9,430 (47.6%) |
Natural Resources, Construction and Maintenance Occupations
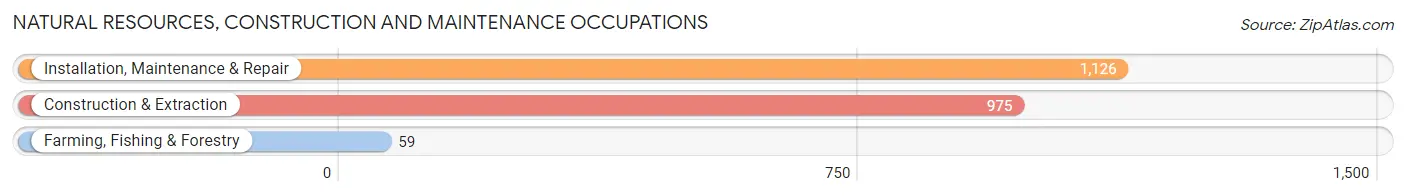
The most common Natural Resources, Construction and Maintenance occupations in Davie County are Installation, Maintenance & Repair (1,126 | 5.7%), Construction & Extraction (975 | 4.9%), and Farming, Fishing & Forestry (59 | 0.3%).
Natural Resources, Construction and Maintenance Occupations by Sex
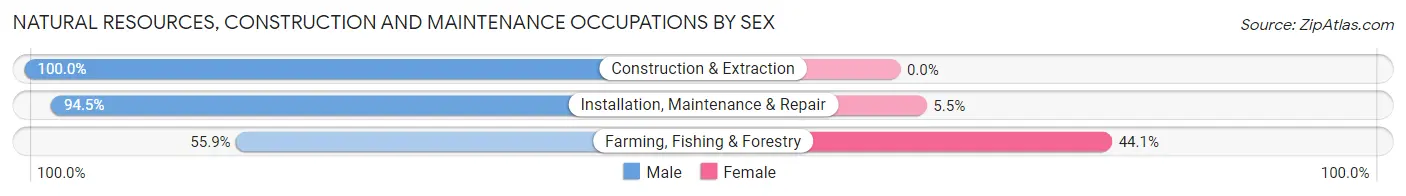
| Occupation | Male | Female |
| Farming, Fishing & Forestry | 33 (55.9%) | 26 (44.1%) |
| Construction & Extraction | 975 (100.0%) | 0 (0.0%) |
| Installation, Maintenance & Repair | 1,064 (94.5%) | 62 (5.5%) |
| Total (Category) | 2,072 (95.9%) | 88 (4.1%) |
| Total (Overall) | 10,370 (52.4%) | 9,430 (47.6%) |
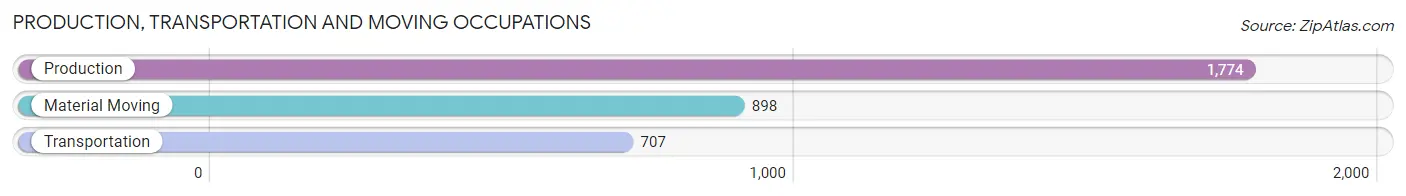
Production, Transportation and Moving Occupations
The most common Production, Transportation and Moving occupations in Davie County are Production (1,774 | 9.0%), Material Moving (898 | 4.5%), and Transportation (707 | 3.6%).
Production, Transportation and Moving Occupations by Sex
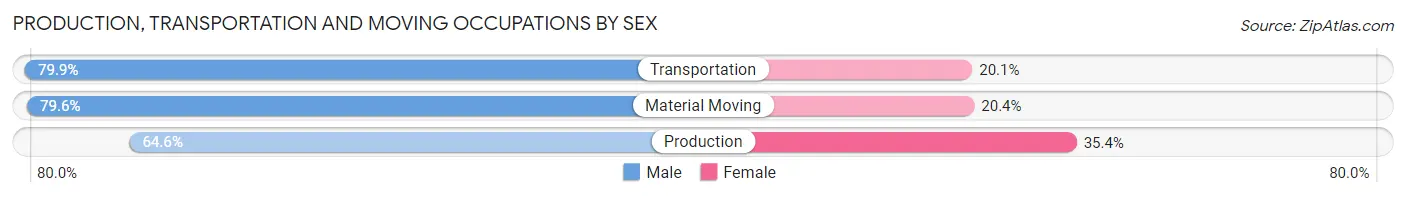
| Occupation | Male | Female |
| Production | 1,146 (64.6%) | 628 (35.4%) |
| Transportation | 565 (79.9%) | 142 (20.1%) |
| Material Moving | 715 (79.6%) | 183 (20.4%) |
| Total (Category) | 2,426 (71.8%) | 953 (28.2%) |
| Total (Overall) | 10,370 (52.4%) | 9,430 (47.6%) |
Employment Industries by Sex in Davie County
Employment Industries in Davie County
The major employment industries in Davie County include Manufacturing (3,643 | 18.4%), Health Care & Social Assistance (2,701 | 13.6%), Retail Trade (2,302 | 11.6%), Construction (1,476 | 7.4%), and Accommodation & Food Services (1,360 | 6.9%).
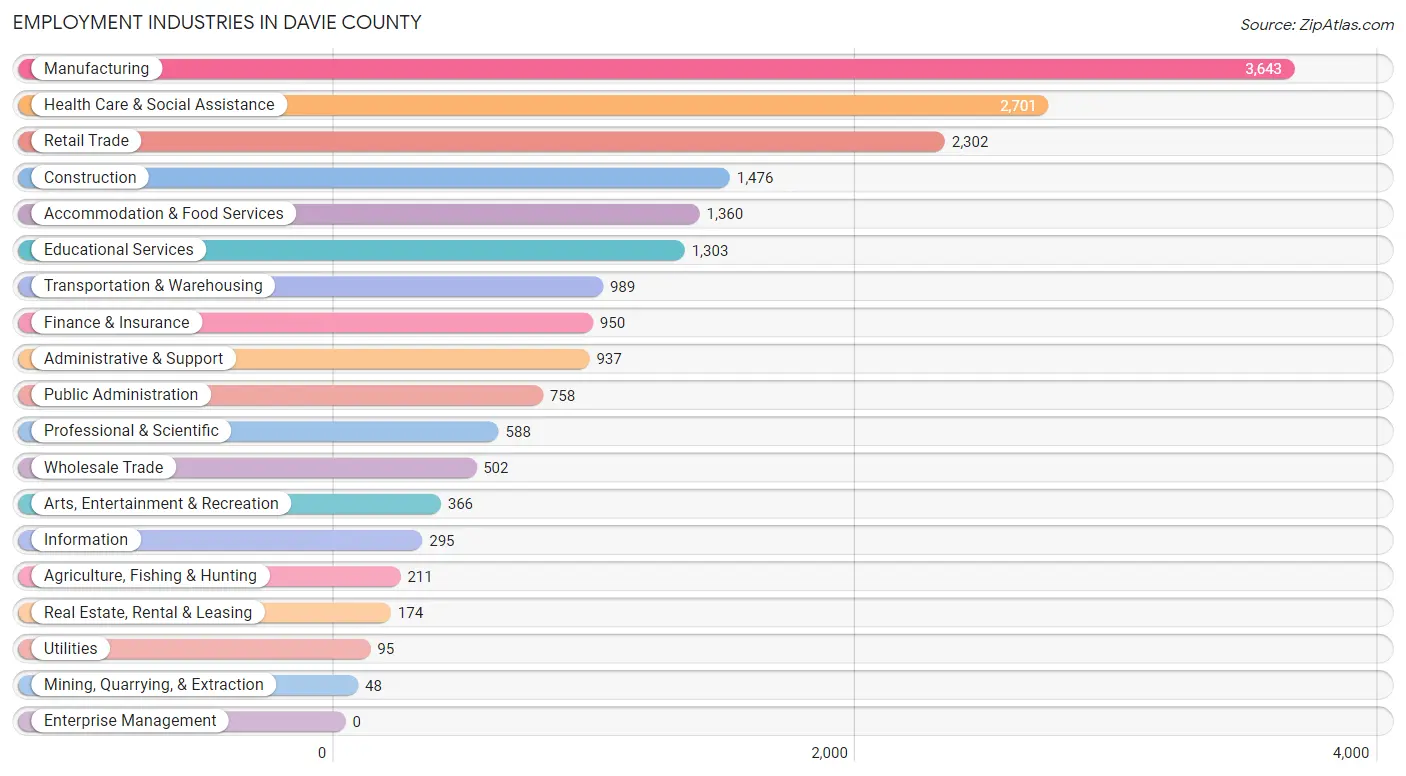
Employment Industries by Sex in Davie County
The Davie County industries that see more men than women are Mining, Quarrying, & Extraction (100.0%), Construction (89.6%), and Transportation & Warehousing (77.4%), whereas the industries that tend to have a higher number of women are Health Care & Social Assistance (81.5%), Educational Services (80.0%), and Finance & Insurance (69.1%).
| Industry | Male | Female |
| Agriculture, Fishing & Hunting | 105 (49.8%) | 106 (50.2%) |
| Mining, Quarrying, & Extraction | 48 (100.0%) | 0 (0.0%) |
| Construction | 1,322 (89.6%) | 154 (10.4%) |
| Manufacturing | 2,357 (64.7%) | 1,286 (35.3%) |
| Wholesale Trade | 268 (53.4%) | 234 (46.6%) |
| Retail Trade | 1,309 (56.9%) | 993 (43.1%) |
| Transportation & Warehousing | 766 (77.4%) | 223 (22.6%) |
| Utilities | 52 (54.7%) | 43 (45.3%) |
| Information | 226 (76.6%) | 69 (23.4%) |
| Finance & Insurance | 294 (30.9%) | 656 (69.1%) |
| Real Estate, Rental & Leasing | 115 (66.1%) | 59 (33.9%) |
| Professional & Scientific | 313 (53.2%) | 275 (46.8%) |
| Enterprise Management | 0 (0.0%) | 0 (0.0%) |
| Administrative & Support | 706 (75.3%) | 231 (24.6%) |
| Educational Services | 260 (20.0%) | 1,043 (80.0%) |
| Health Care & Social Assistance | 499 (18.5%) | 2,202 (81.5%) |
| Arts, Entertainment & Recreation | 234 (63.9%) | 132 (36.1%) |
| Accommodation & Food Services | 498 (36.6%) | 862 (63.4%) |
| Public Administration | 453 (59.8%) | 305 (40.2%) |
| Total | 10,370 (52.4%) | 9,430 (47.6%) |
Education in Davie County
School Enrollment in Davie County
The most common levels of schooling among the 9,030 students in Davie County are middle school (2,274 | 25.2%), high school (2,198 | 24.3%), and elementary school (1,919 | 21.2%).
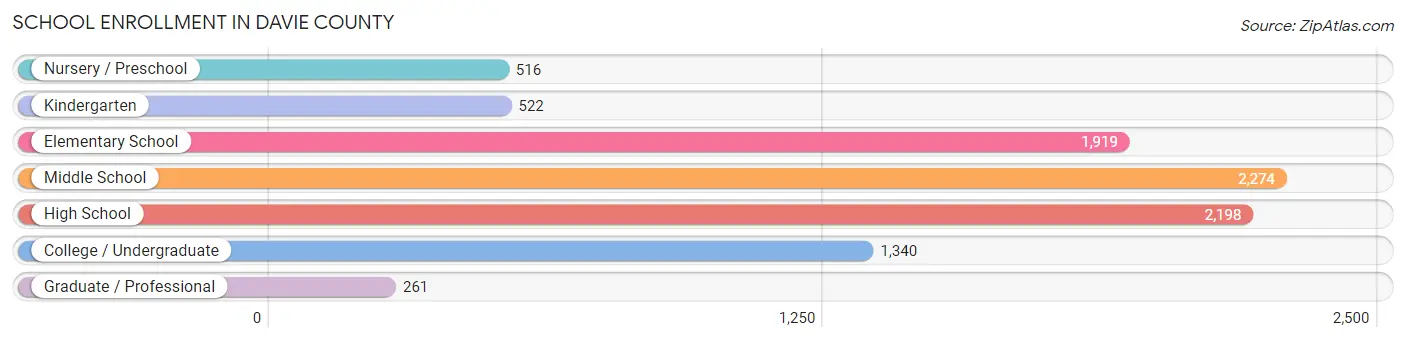
| School Level | # Students | % Students |
| Nursery / Preschool | 516 | 5.7% |
| Kindergarten | 522 | 5.8% |
| Elementary School | 1,919 | 21.2% |
| Middle School | 2,274 | 25.2% |
| High School | 2,198 | 24.3% |
| College / Undergraduate | 1,340 | 14.8% |
| Graduate / Professional | 261 | 2.9% |
| Total | 9,030 | 100.0% |
School Enrollment by Age by Funding Source in Davie County
Out of a total of 9,030 students who are enrolled in schools in Davie County, 1,345 (14.9%) attend a private institution, while the remaining 7,685 (85.1%) are enrolled in public schools. The age group of 3 to 4 year olds has the highest likelihood of being enrolled in private schools, with 227 (49.8% in the age bracket) enrolled. Conversely, the age group of 18 to 19 year olds has the lowest likelihood of being enrolled in a private school, with 402 (92.4% in the age bracket) attending a public institution.
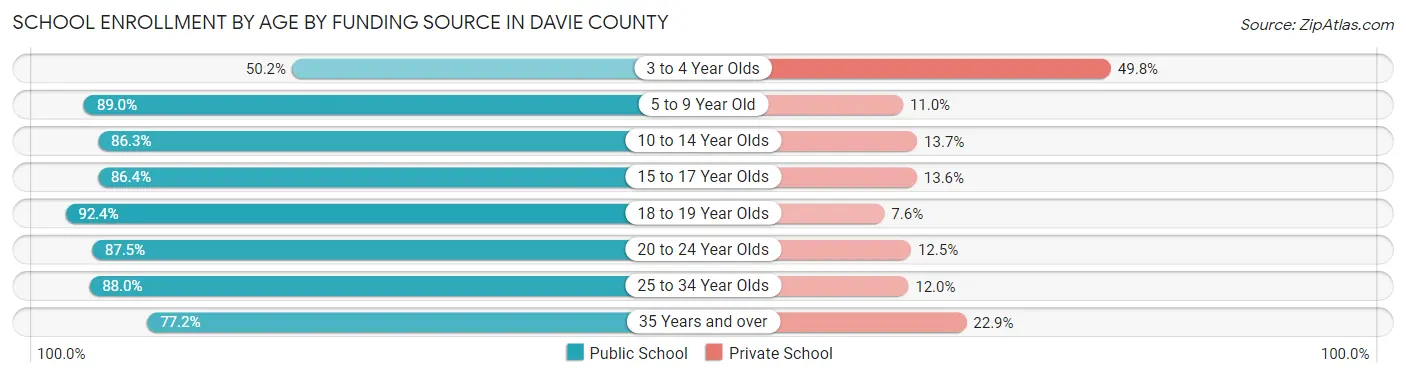
| Age Bracket | Public School | Private School |
| 3 to 4 Year Olds | 229 (50.2%) | 227 (49.8%) |
| 5 to 9 Year Old | 1,990 (89.0%) | 247 (11.0%) |
| 10 to 14 Year Olds | 2,415 (86.3%) | 383 (13.7%) |
| 15 to 17 Year Olds | 1,343 (86.4%) | 212 (13.6%) |
| 18 to 19 Year Olds | 402 (92.4%) | 33 (7.6%) |
| 20 to 24 Year Olds | 551 (87.5%) | 79 (12.5%) |
| 25 to 34 Year Olds | 358 (88.0%) | 49 (12.0%) |
| 35 Years and over | 395 (77.1%) | 117 (22.9%) |
| Total | 7,685 (85.1%) | 1,345 (14.9%) |
Educational Attainment by Field of Study in Davie County
Business (2,225 | 24.8%), science & technology (1,267 | 14.1%), education (1,094 | 12.2%), arts & humanities (818 | 9.1%), and social sciences (696 | 7.8%) are the most common fields of study among 8,963 individuals in Davie County who have obtained a bachelor's degree or higher.
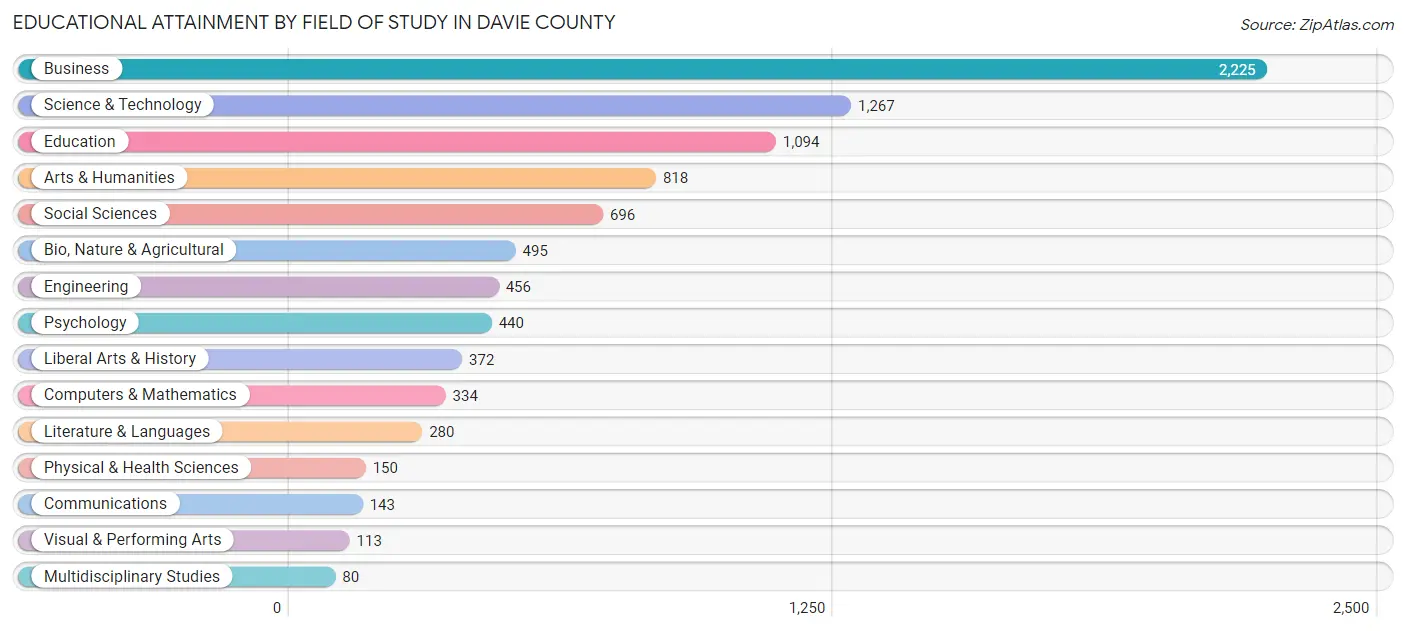
| Field of Study | # Graduates | % Graduates |
| Computers & Mathematics | 334 | 3.7% |
| Bio, Nature & Agricultural | 495 | 5.5% |
| Physical & Health Sciences | 150 | 1.7% |
| Psychology | 440 | 4.9% |
| Social Sciences | 696 | 7.8% |
| Engineering | 456 | 5.1% |
| Multidisciplinary Studies | 80 | 0.9% |
| Science & Technology | 1,267 | 14.1% |
| Business | 2,225 | 24.8% |
| Education | 1,094 | 12.2% |
| Literature & Languages | 280 | 3.1% |
| Liberal Arts & History | 372 | 4.2% |
| Visual & Performing Arts | 113 | 1.3% |
| Communications | 143 | 1.6% |
| Arts & Humanities | 818 | 9.1% |
| Total | 8,963 | 100.0% |
Transportation & Commute in Davie County
Vehicle Availability by Sex in Davie County
The most prevalent vehicle ownership categories in Davie County are males with 2 vehicles (3,690, accounting for 36.4%) and females with 2 vehicles (3,127, making up 40.1%).
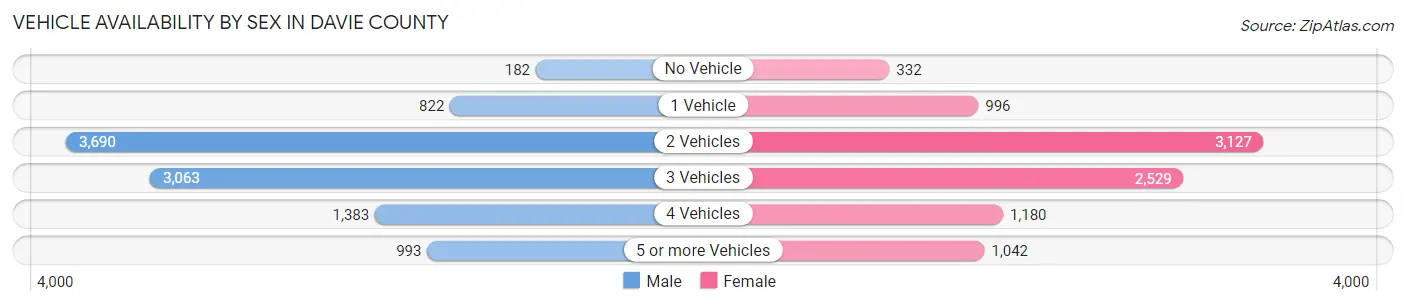
| Vehicles Available | Male | Female |
| No Vehicle | 182 (1.8%) | 332 (3.6%) |
| 1 Vehicle | 822 (8.1%) | 996 (10.8%) |
| 2 Vehicles | 3,690 (36.4%) | 3,127 (34.0%) |
| 3 Vehicles | 3,063 (30.2%) | 2,529 (27.5%) |
| 4 Vehicles | 1,383 (13.7%) | 1,180 (12.8%) |
| 5 or more Vehicles | 993 (9.8%) | 1,042 (11.3%) |
| Total | 10,133 (100.0%) | 9,206 (100.0%) |
Commute Time in Davie County
The most frequently occuring commute durations in Davie County are 30 to 34 minutes (3,194 commuters, 17.7%), 15 to 19 minutes (2,505 commuters, 13.9%), and 10 to 14 minutes (2,345 commuters, 13.0%).
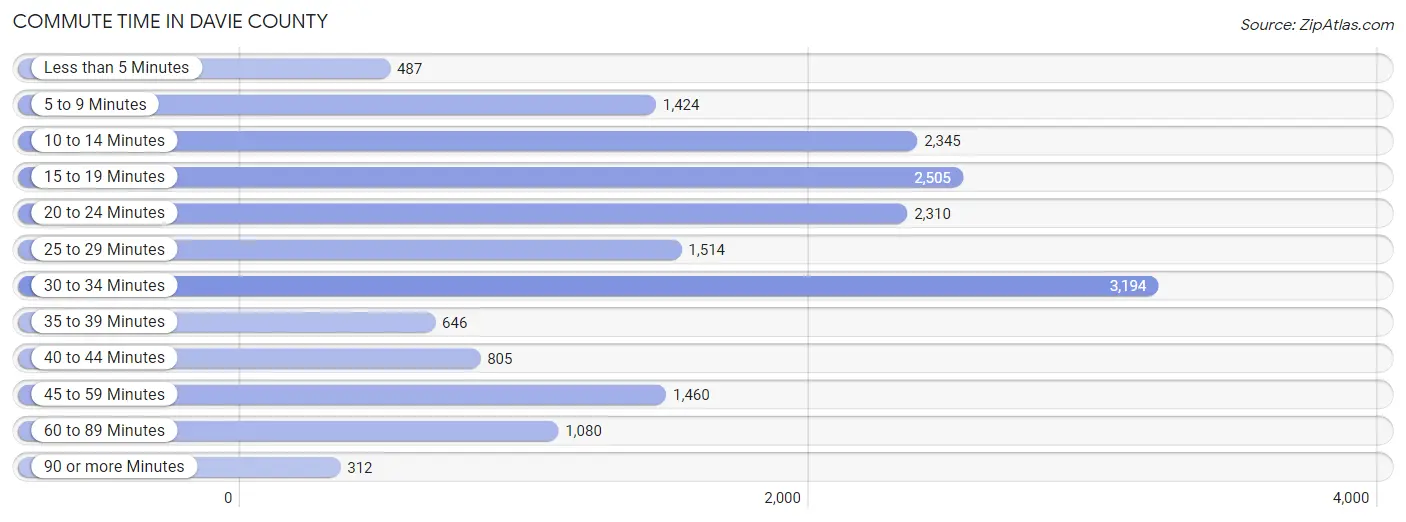
| Commute Time | # Commuters | % Commuters |
| Less than 5 Minutes | 487 | 2.7% |
| 5 to 9 Minutes | 1,424 | 7.9% |
| 10 to 14 Minutes | 2,345 | 13.0% |
| 15 to 19 Minutes | 2,505 | 13.9% |
| 20 to 24 Minutes | 2,310 | 12.8% |
| 25 to 29 Minutes | 1,514 | 8.4% |
| 30 to 34 Minutes | 3,194 | 17.7% |
| 35 to 39 Minutes | 646 | 3.6% |
| 40 to 44 Minutes | 805 | 4.4% |
| 45 to 59 Minutes | 1,460 | 8.1% |
| 60 to 89 Minutes | 1,080 | 6.0% |
| 90 or more Minutes | 312 | 1.7% |
Commute Time by Sex in Davie County
The most common commute times in Davie County are 30 to 34 minutes (1,534 commuters, 16.0%) for males and 30 to 34 minutes (1,660 commuters, 19.6%) for females.
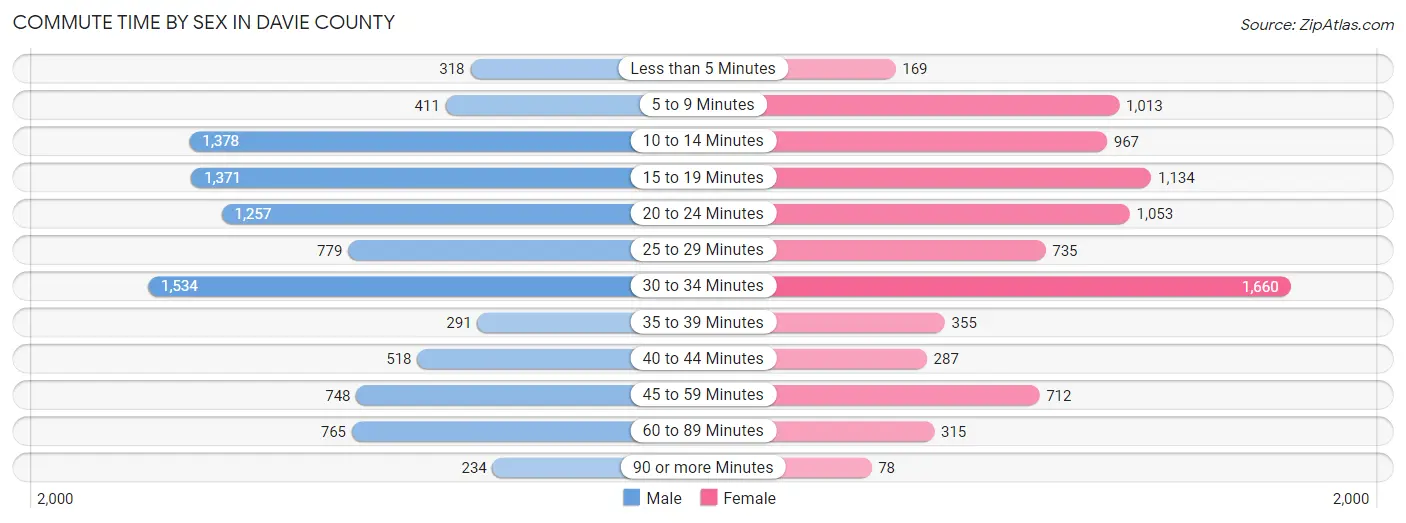
| Commute Time | Male | Female |
| Less than 5 Minutes | 318 (3.3%) | 169 (2.0%) |
| 5 to 9 Minutes | 411 (4.3%) | 1,013 (11.9%) |
| 10 to 14 Minutes | 1,378 (14.3%) | 967 (11.4%) |
| 15 to 19 Minutes | 1,371 (14.3%) | 1,134 (13.4%) |
| 20 to 24 Minutes | 1,257 (13.1%) | 1,053 (12.4%) |
| 25 to 29 Minutes | 779 (8.1%) | 735 (8.7%) |
| 30 to 34 Minutes | 1,534 (16.0%) | 1,660 (19.6%) |
| 35 to 39 Minutes | 291 (3.0%) | 355 (4.2%) |
| 40 to 44 Minutes | 518 (5.4%) | 287 (3.4%) |
| 45 to 59 Minutes | 748 (7.8%) | 712 (8.4%) |
| 60 to 89 Minutes | 765 (8.0%) | 315 (3.7%) |
| 90 or more Minutes | 234 (2.4%) | 78 (0.9%) |
Time of Departure to Work by Sex in Davie County
The most frequent times of departure to work in Davie County are 6:00 AM to 6:29 AM (1,255, 13.1%) for males and 7:00 AM to 7:29 AM (1,961, 23.1%) for females.
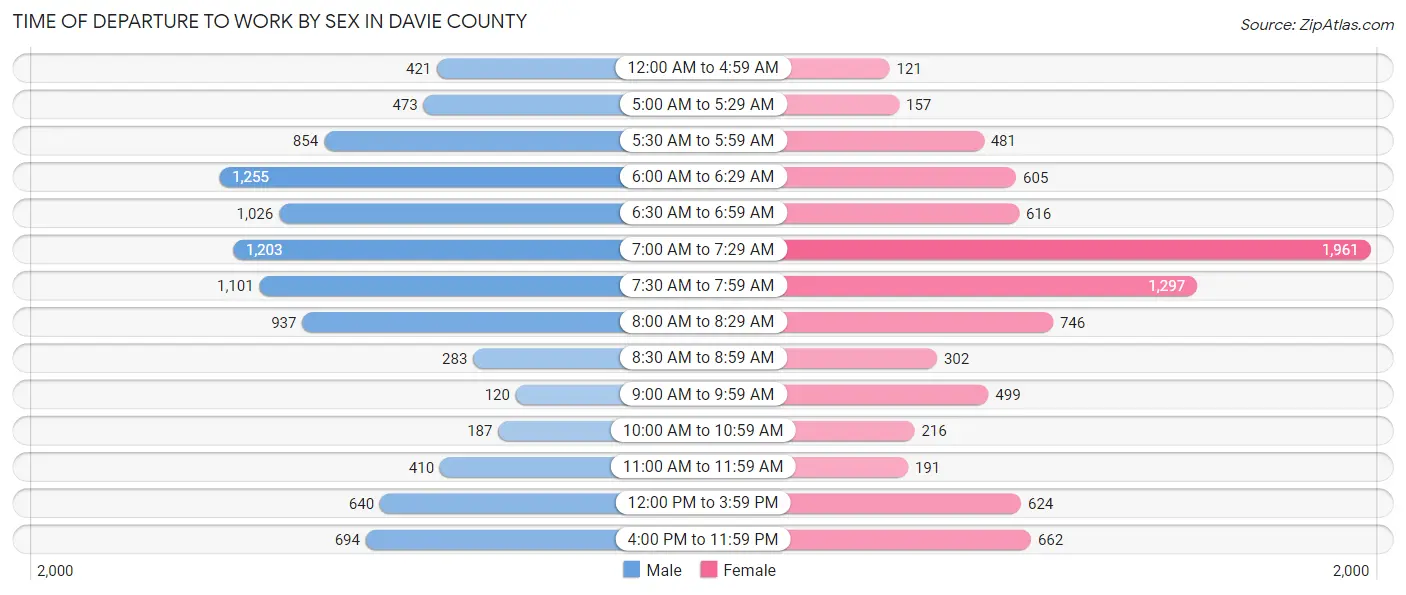
| Time of Departure | Male | Female |
| 12:00 AM to 4:59 AM | 421 (4.4%) | 121 (1.4%) |
| 5:00 AM to 5:29 AM | 473 (4.9%) | 157 (1.8%) |
| 5:30 AM to 5:59 AM | 854 (8.9%) | 481 (5.7%) |
| 6:00 AM to 6:29 AM | 1,255 (13.1%) | 605 (7.1%) |
| 6:30 AM to 6:59 AM | 1,026 (10.7%) | 616 (7.3%) |
| 7:00 AM to 7:29 AM | 1,203 (12.5%) | 1,961 (23.1%) |
| 7:30 AM to 7:59 AM | 1,101 (11.5%) | 1,297 (15.3%) |
| 8:00 AM to 8:29 AM | 937 (9.8%) | 746 (8.8%) |
| 8:30 AM to 8:59 AM | 283 (2.9%) | 302 (3.6%) |
| 9:00 AM to 9:59 AM | 120 (1.3%) | 499 (5.9%) |
| 10:00 AM to 10:59 AM | 187 (1.9%) | 216 (2.5%) |
| 11:00 AM to 11:59 AM | 410 (4.3%) | 191 (2.2%) |
| 12:00 PM to 3:59 PM | 640 (6.7%) | 624 (7.4%) |
| 4:00 PM to 11:59 PM | 694 (7.2%) | 662 (7.8%) |
| Total | 9,604 (100.0%) | 8,478 (100.0%) |
Housing Occupancy in Davie County
Occupancy by Ownership in Davie County
Of the total 16,468 dwellings in Davie County, owner-occupied units account for 13,556 (82.3%), while renter-occupied units make up 2,912 (17.7%).
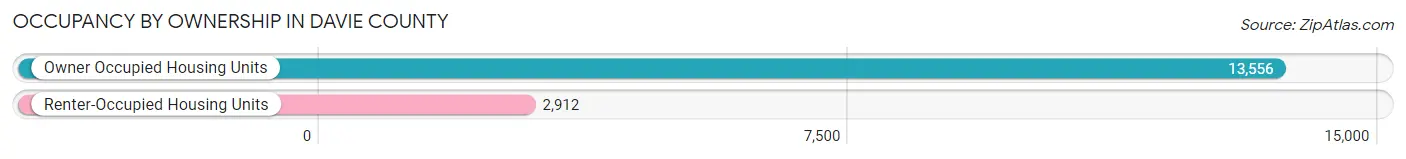
| Occupancy | # Housing Units | % Housing Units |
| Owner Occupied Housing Units | 13,556 | 82.3% |
| Renter-Occupied Housing Units | 2,912 | 17.7% |
| Total Occupied Housing Units | 16,468 | 100.0% |
Occupancy by Household Size in Davie County
| Household Size | # Housing Units | % Housing Units |
| 1-Person Household | 4,695 | 28.5% |
| 2-Person Household | 6,050 | 36.7% |
| 3-Person Household | 2,698 | 16.4% |
| 4+ Person Household | 3,025 | 18.4% |
| Total Housing Units | 16,468 | 100.0% |
Occupancy by Ownership by Household Size in Davie County
| Household Size | Owner-occupied | Renter-occupied |
| 1-Person Household | 3,660 (78.0%) | 1,035 (22.0%) |
| 2-Person Household | 5,272 (87.1%) | 778 (12.9%) |
| 3-Person Household | 2,262 (83.8%) | 436 (16.2%) |
| 4+ Person Household | 2,362 (78.1%) | 663 (21.9%) |
| Total Housing Units | 13,556 (82.3%) | 2,912 (17.7%) |
Occupancy by Educational Attainment in Davie County
| Household Size | Owner-occupied | Renter-occupied |
| Less than High School | 782 (60.3%) | 514 (39.7%) |
| High School Diploma | 3,399 (75.8%) | 1,087 (24.2%) |
| College/Associate Degree | 5,004 (88.3%) | 661 (11.7%) |
| Bachelor's Degree or higher | 4,371 (87.1%) | 650 (13.0%) |
Occupancy by Age of Householder in Davie County
| Age Bracket | # Households | % Households |
| Under 35 Years | 1,687 | 10.2% |
| 35 to 44 Years | 2,159 | 13.1% |
| 45 to 54 Years | 2,765 | 16.8% |
| 55 to 64 Years | 4,005 | 24.3% |
| 65 to 74 Years | 3,359 | 20.4% |
| 75 to 84 Years | 1,747 | 10.6% |
| 85 Years and Over | 746 | 4.5% |
| Total | 16,468 | 100.0% |
Housing Finances in Davie County
Median Income by Occupancy in Davie County
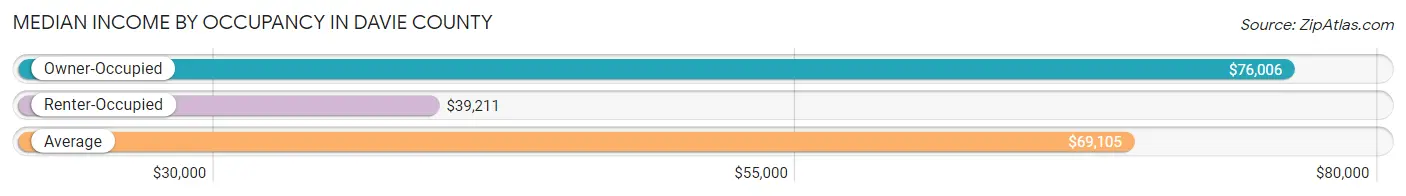
| Occupancy Type | # Households | Median Income |
| Owner-Occupied | 13,556 (82.3%) | $76,006 |
| Renter-Occupied | 2,912 (17.7%) | $39,211 |
| Average | 16,468 (100.0%) | $69,105 |
Occupancy by Householder Income Bracket in Davie County
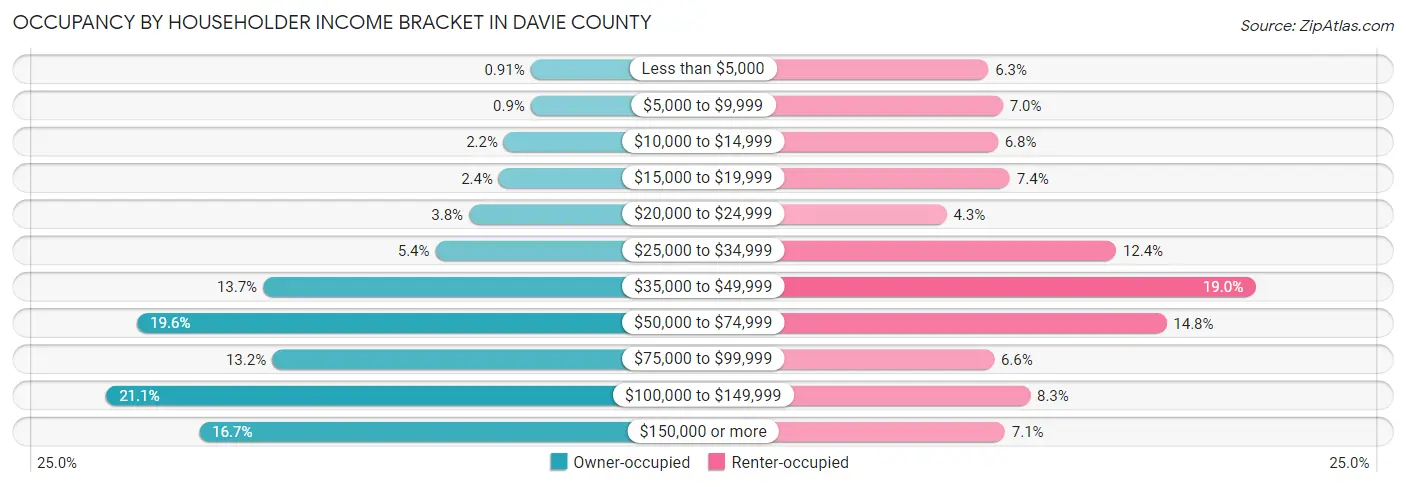
| Income Bracket | Owner-occupied | Renter-occupied |
| Less than $5,000 | 123 (0.9%) | 184 (6.3%) |
| $5,000 to $9,999 | 122 (0.9%) | 204 (7.0%) |
| $10,000 to $14,999 | 296 (2.2%) | 197 (6.8%) |
| $15,000 to $19,999 | 328 (2.4%) | 214 (7.3%) |
| $20,000 to $24,999 | 521 (3.8%) | 126 (4.3%) |
| $25,000 to $34,999 | 737 (5.4%) | 361 (12.4%) |
| $35,000 to $49,999 | 1,850 (13.7%) | 554 (19.0%) |
| $50,000 to $74,999 | 2,663 (19.6%) | 431 (14.8%) |
| $75,000 to $99,999 | 1,792 (13.2%) | 192 (6.6%) |
| $100,000 to $149,999 | 2,862 (21.1%) | 242 (8.3%) |
| $150,000 or more | 2,262 (16.7%) | 207 (7.1%) |
| Total | 13,556 (100.0%) | 2,912 (100.0%) |
Monthly Housing Cost Tiers in Davie County
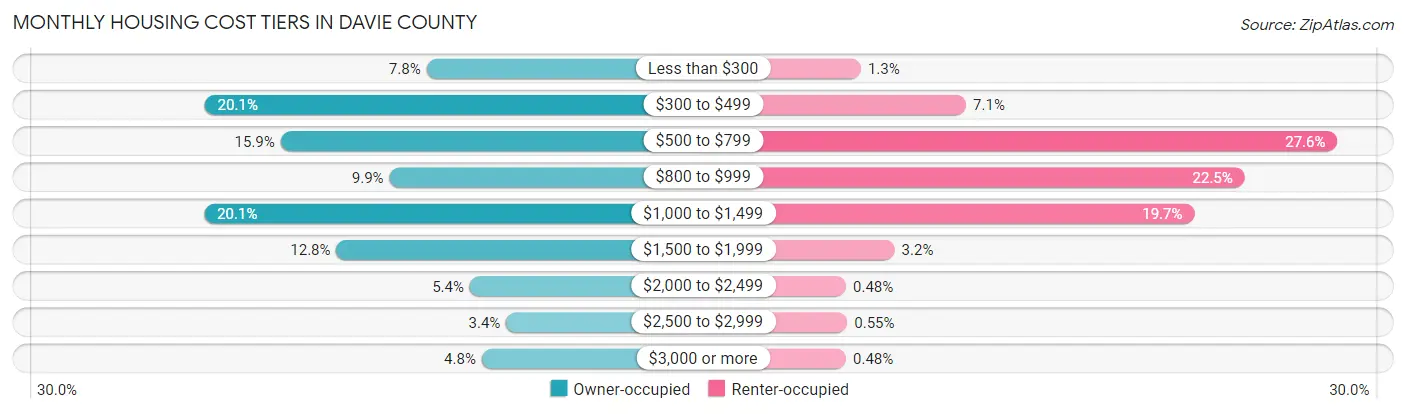
| Monthly Cost | Owner-occupied | Renter-occupied |
| Less than $300 | 1,057 (7.8%) | 38 (1.3%) |
| $300 to $499 | 2,719 (20.1%) | 207 (7.1%) |
| $500 to $799 | 2,150 (15.9%) | 804 (27.6%) |
| $800 to $999 | 1,335 (9.9%) | 655 (22.5%) |
| $1,000 to $1,499 | 2,724 (20.1%) | 574 (19.7%) |
| $1,500 to $1,999 | 1,732 (12.8%) | 92 (3.2%) |
| $2,000 to $2,499 | 734 (5.4%) | 14 (0.5%) |
| $2,500 to $2,999 | 461 (3.4%) | 16 (0.5%) |
| $3,000 or more | 644 (4.8%) | 14 (0.5%) |
| Total | 13,556 (100.0%) | 2,912 (100.0%) |
Physical Housing Characteristics in Davie County
Housing Structures in Davie County
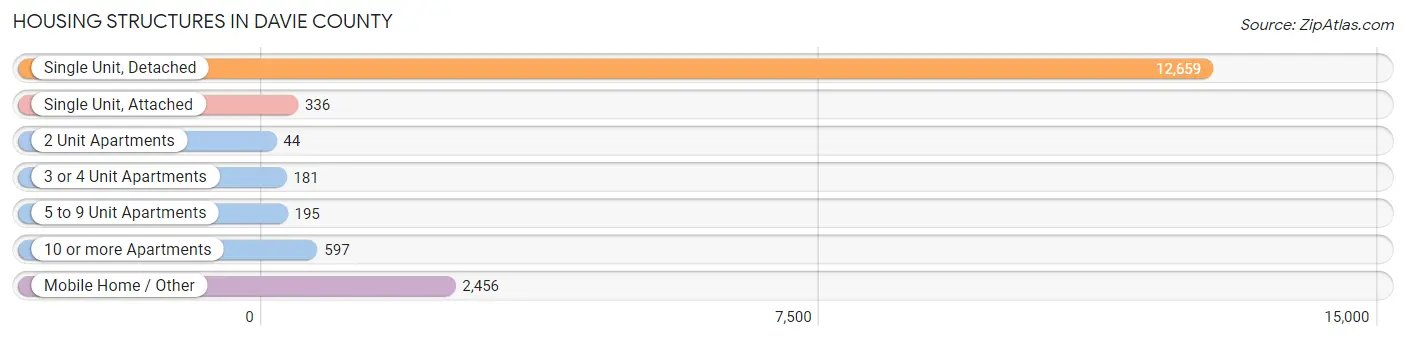
| Structure Type | # Housing Units | % Housing Units |
| Single Unit, Detached | 12,659 | 76.9% |
| Single Unit, Attached | 336 | 2.0% |
| 2 Unit Apartments | 44 | 0.3% |
| 3 or 4 Unit Apartments | 181 | 1.1% |
| 5 to 9 Unit Apartments | 195 | 1.2% |
| 10 or more Apartments | 597 | 3.6% |
| Mobile Home / Other | 2,456 | 14.9% |
| Total | 16,468 | 100.0% |
Housing Structures by Occupancy in Davie County
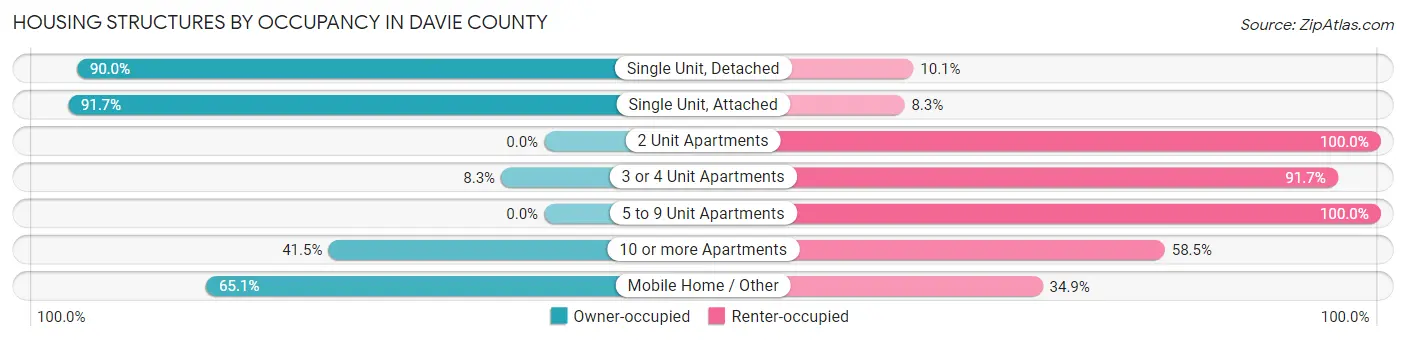
| Structure Type | Owner-occupied | Renter-occupied |
| Single Unit, Detached | 11,387 (89.9%) | 1,272 (10.1%) |
| Single Unit, Attached | 308 (91.7%) | 28 (8.3%) |
| 2 Unit Apartments | 0 (0.0%) | 44 (100.0%) |
| 3 or 4 Unit Apartments | 15 (8.3%) | 166 (91.7%) |
| 5 to 9 Unit Apartments | 0 (0.0%) | 195 (100.0%) |
| 10 or more Apartments | 248 (41.5%) | 349 (58.5%) |
| Mobile Home / Other | 1,598 (65.1%) | 858 (34.9%) |
| Total | 13,556 (82.3%) | 2,912 (17.7%) |
Housing Structures by Number of Rooms in Davie County
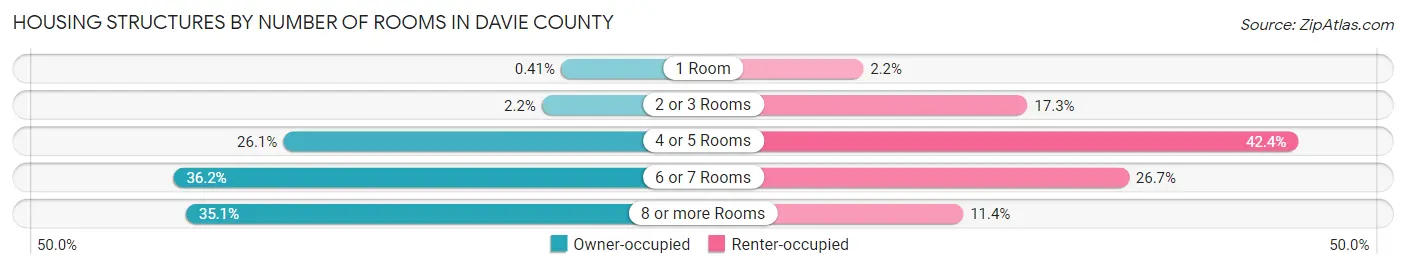
| Number of Rooms | Owner-occupied | Renter-occupied |
| 1 Room | 55 (0.4%) | 63 (2.2%) |
| 2 or 3 Rooms | 296 (2.2%) | 505 (17.3%) |
| 4 or 5 Rooms | 3,537 (26.1%) | 1,234 (42.4%) |
| 6 or 7 Rooms | 4,911 (36.2%) | 778 (26.7%) |
| 8 or more Rooms | 4,757 (35.1%) | 332 (11.4%) |
| Total | 13,556 (100.0%) | 2,912 (100.0%) |
Housing Structure by Heating Type in Davie County
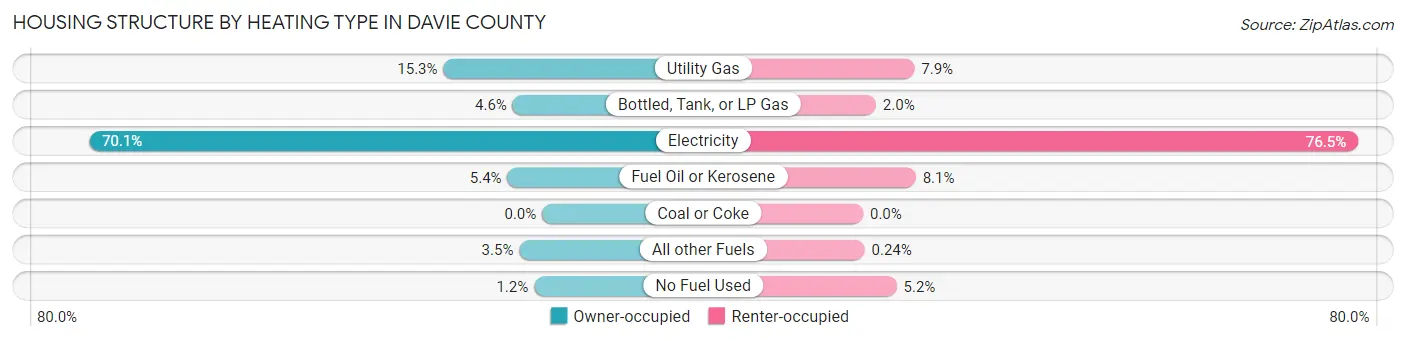
| Heating Type | Owner-occupied | Renter-occupied |
| Utility Gas | 2,069 (15.3%) | 231 (7.9%) |
| Bottled, Tank, or LP Gas | 617 (4.5%) | 58 (2.0%) |
| Electricity | 9,496 (70.1%) | 2,228 (76.5%) |
| Fuel Oil or Kerosene | 727 (5.4%) | 237 (8.1%) |
| Coal or Coke | 0 (0.0%) | 0 (0.0%) |
| All other Fuels | 479 (3.5%) | 7 (0.2%) |
| No Fuel Used | 168 (1.2%) | 151 (5.2%) |
| Total | 13,556 (100.0%) | 2,912 (100.0%) |
Household Vehicle Usage in Davie County
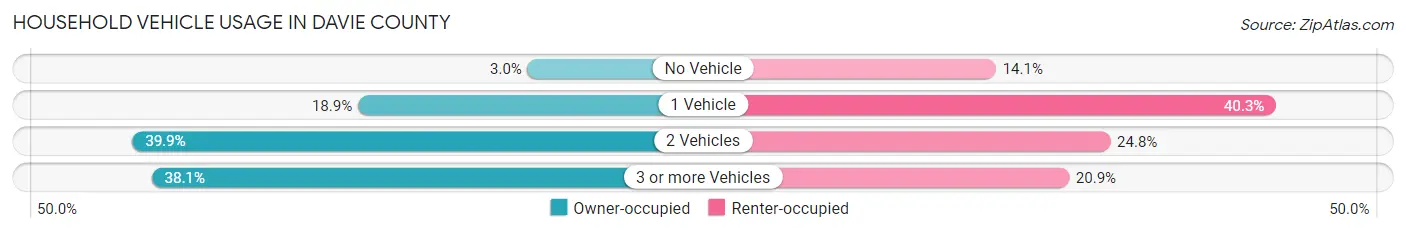
| Vehicles per Household | Owner-occupied | Renter-occupied |
| No Vehicle | 412 (3.0%) | 410 (14.1%) |
| 1 Vehicle | 2,560 (18.9%) | 1,172 (40.3%) |
| 2 Vehicles | 5,414 (39.9%) | 721 (24.8%) |
| 3 or more Vehicles | 5,170 (38.1%) | 609 (20.9%) |
| Total | 13,556 (100.0%) | 2,912 (100.0%) |
Real Estate & Mortgages in Davie County
Real Estate and Mortgage Overview in Davie County
| Characteristic | Without Mortgage | With Mortgage |
| Housing Units | 5,898 | 7,658 |
| Median Property Value | $195,200 | $235,600 |
| Median Household Income | $55,509 | $1,650 |
| Monthly Housing Costs | $432 | $474 |
| Real Estate Taxes | $1,508 | $13 |
Property Value by Mortgage Status in Davie County
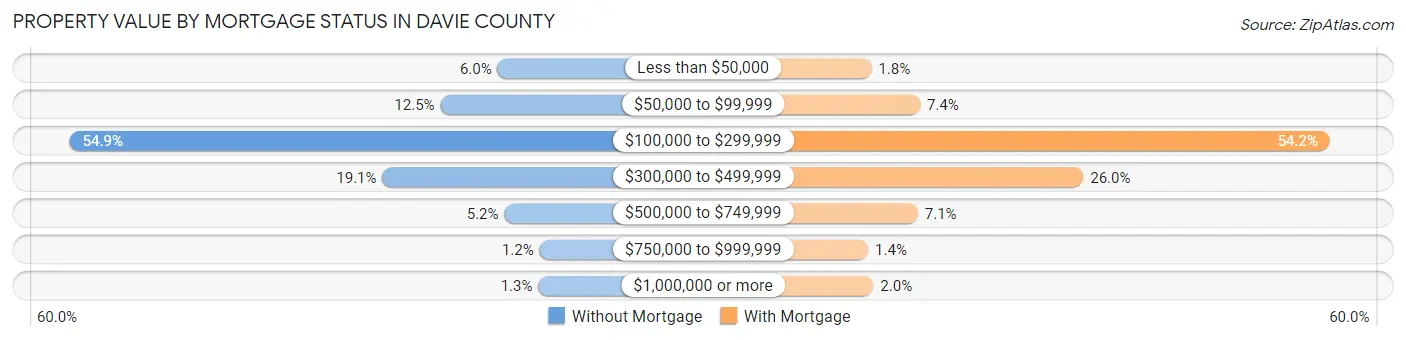
| Property Value | Without Mortgage | With Mortgage |
| Less than $50,000 | 351 (5.9%) | 140 (1.8%) |
| $50,000 to $99,999 | 736 (12.5%) | 564 (7.4%) |
| $100,000 to $299,999 | 3,235 (54.8%) | 4,150 (54.2%) |
| $300,000 to $499,999 | 1,127 (19.1%) | 1,993 (26.0%) |
| $500,000 to $749,999 | 305 (5.2%) | 545 (7.1%) |
| $750,000 to $999,999 | 68 (1.1%) | 110 (1.4%) |
| $1,000,000 or more | 76 (1.3%) | 156 (2.0%) |
| Total | 5,898 (100.0%) | 7,658 (100.0%) |
Household Income by Mortgage Status in Davie County
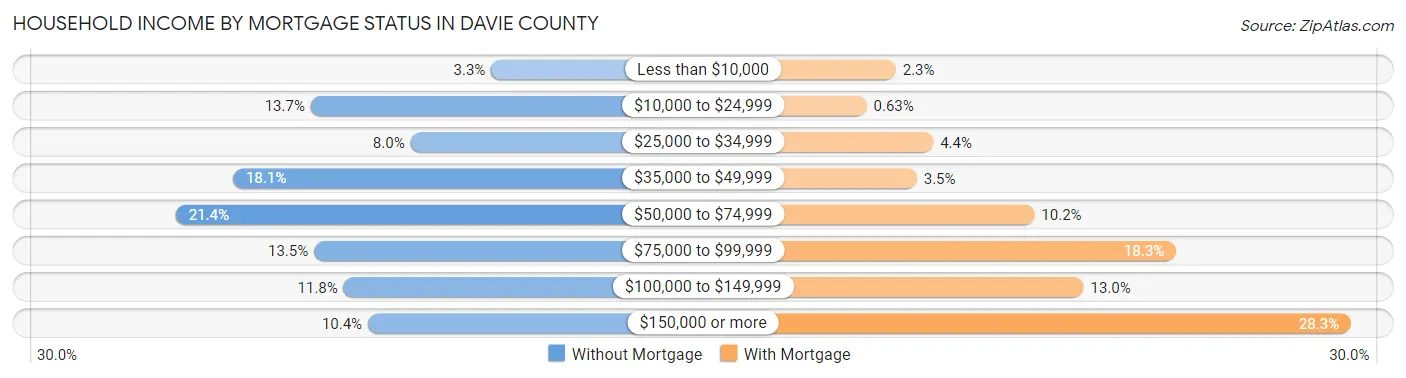
| Household Income | Without Mortgage | With Mortgage |
| Less than $10,000 | 197 (3.3%) | 176 (2.3%) |
| $10,000 to $24,999 | 805 (13.7%) | 48 (0.6%) |
| $25,000 to $34,999 | 469 (8.0%) | 340 (4.4%) |
| $35,000 to $49,999 | 1,067 (18.1%) | 268 (3.5%) |
| $50,000 to $74,999 | 1,260 (21.4%) | 783 (10.2%) |
| $75,000 to $99,999 | 794 (13.5%) | 1,403 (18.3%) |
| $100,000 to $149,999 | 694 (11.8%) | 998 (13.0%) |
| $150,000 or more | 612 (10.4%) | 2,168 (28.3%) |
| Total | 5,898 (100.0%) | 7,658 (100.0%) |
Property Value to Household Income Ratio in Davie County
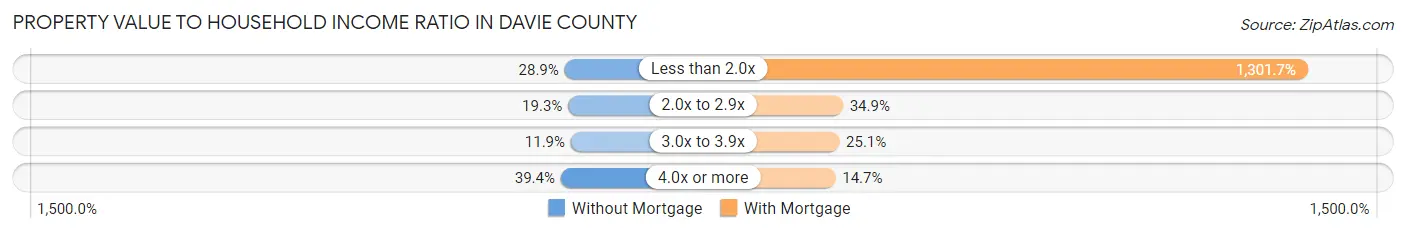
| Value-to-Income Ratio | Without Mortgage | With Mortgage |
| Less than 2.0x | 1,704 (28.9%) | 99,680 (1,301.7%) |
| 2.0x to 2.9x | 1,139 (19.3%) | 2,673 (34.9%) |
| 3.0x to 3.9x | 701 (11.9%) | 1,918 (25.1%) |
| 4.0x or more | 2,321 (39.4%) | 1,126 (14.7%) |
| Total | 5,898 (100.0%) | 7,658 (100.0%) |
Real Estate Taxes by Mortgage Status in Davie County
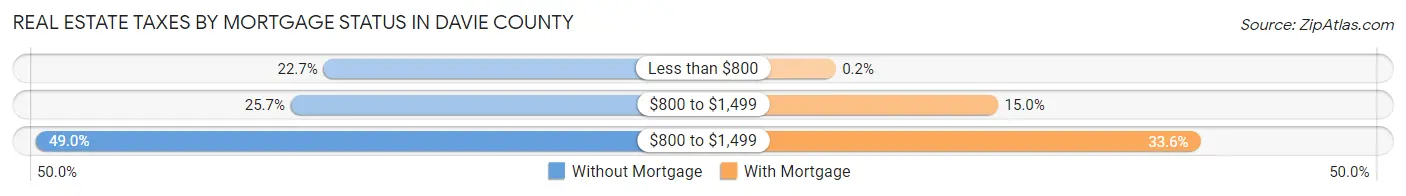
| Property Taxes | Without Mortgage | With Mortgage |
| Less than $800 | 1,339 (22.7%) | 15 (0.2%) |
| $800 to $1,499 | 1,515 (25.7%) | 1,151 (15.0%) |
| $800 to $1,499 | 2,887 (48.9%) | 2,569 (33.6%) |
| Total | 5,898 (100.0%) | 7,658 (100.0%) |
Health & Disability in Davie County
Health Insurance Coverage by Age in Davie County
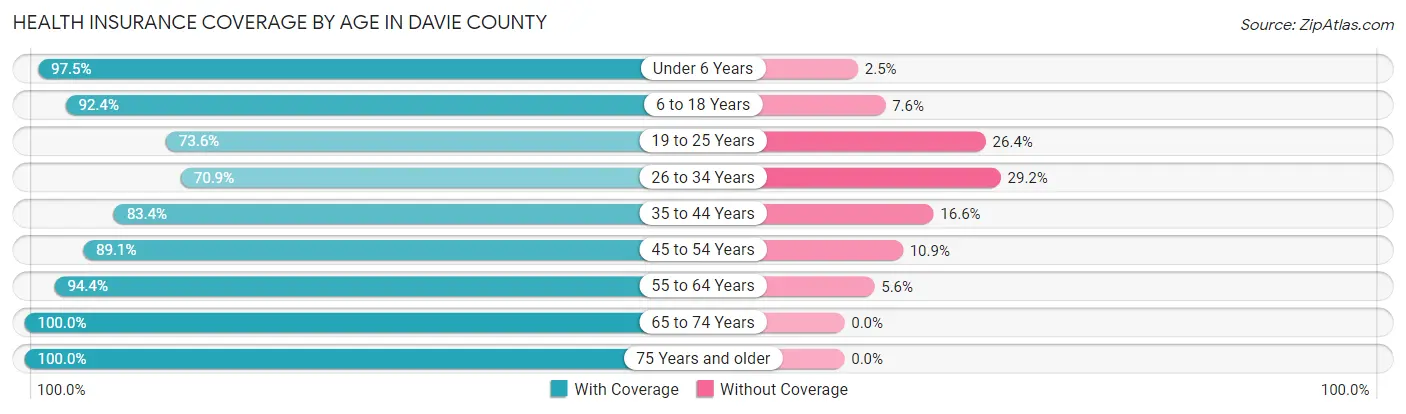
| Age Bracket | With Coverage | Without Coverage |
| Under 6 Years | 2,580 (97.5%) | 67 (2.5%) |
| 6 to 18 Years | 6,315 (92.4%) | 522 (7.6%) |
| 19 to 25 Years | 2,377 (73.6%) | 851 (26.4%) |
| 26 to 34 Years | 2,744 (70.9%) | 1,129 (29.1%) |
| 35 to 44 Years | 3,924 (83.4%) | 782 (16.6%) |
| 45 to 54 Years | 5,213 (89.1%) | 638 (10.9%) |
| 55 to 64 Years | 6,085 (94.4%) | 360 (5.6%) |
| 65 to 74 Years | 5,115 (100.0%) | 0 (0.0%) |
| 75 Years and older | 3,936 (100.0%) | 0 (0.0%) |
| Total | 38,289 (89.8%) | 4,349 (10.2%) |
Health Insurance Coverage by Citizenship Status in Davie County
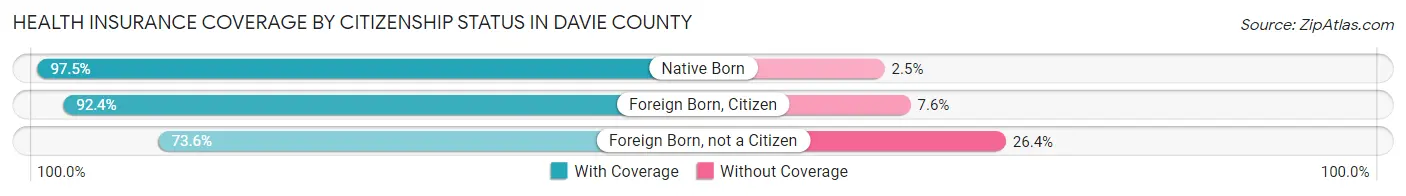
| Citizenship Status | With Coverage | Without Coverage |
| Native Born | 2,580 (97.5%) | 67 (2.5%) |
| Foreign Born, Citizen | 6,315 (92.4%) | 522 (7.6%) |
| Foreign Born, not a Citizen | 2,377 (73.6%) | 851 (26.4%) |
Health Insurance Coverage by Household Income in Davie County
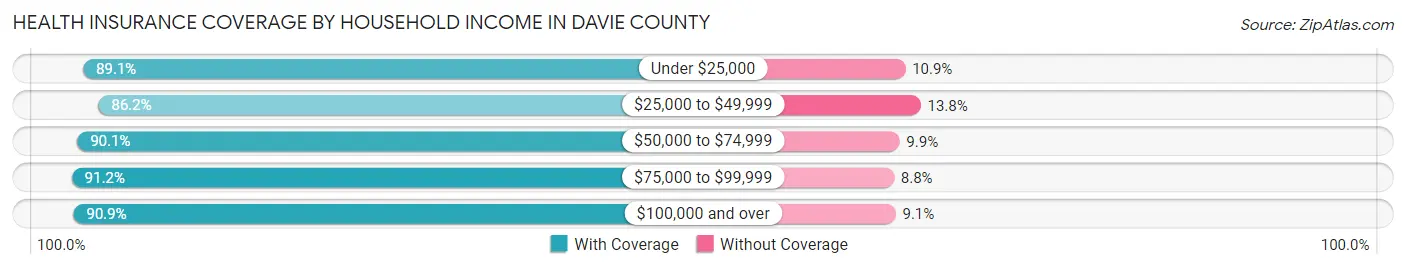
| Household Income | With Coverage | Without Coverage |
| Under $25,000 | 3,865 (89.1%) | 475 (10.9%) |
| $25,000 to $49,999 | 6,256 (86.2%) | 1,003 (13.8%) |
| $50,000 to $74,999 | 6,981 (90.1%) | 764 (9.9%) |
| $75,000 to $99,999 | 4,732 (91.2%) | 457 (8.8%) |
| $100,000 and over | 16,406 (90.9%) | 1,649 (9.1%) |
Public vs Private Health Insurance Coverage by Age in Davie County
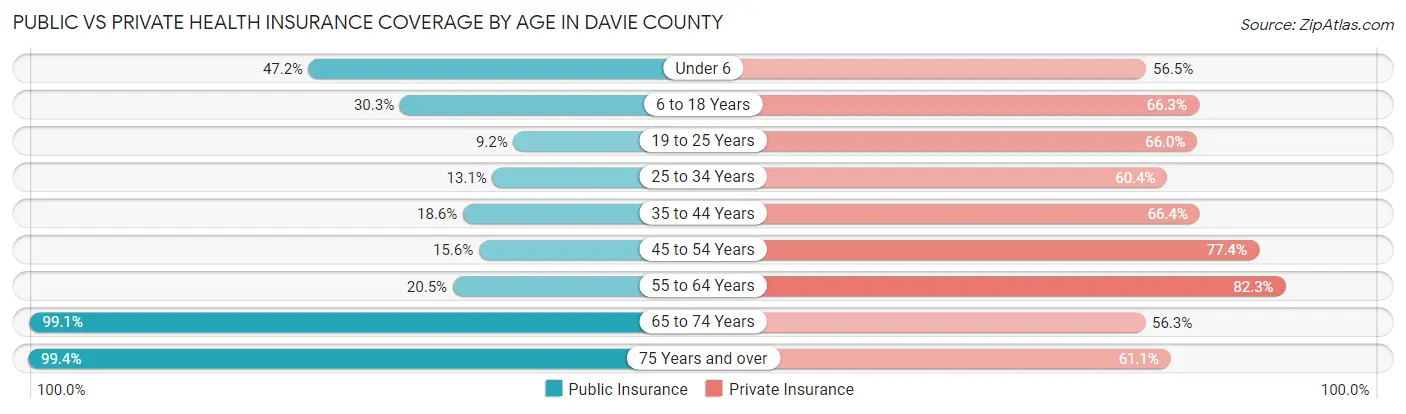
| Age Bracket | Public Insurance | Private Insurance |
| Under 6 | 1,250 (47.2%) | 1,495 (56.5%) |
| 6 to 18 Years | 2,073 (30.3%) | 4,531 (66.3%) |
| 19 to 25 Years | 298 (9.2%) | 2,130 (66.0%) |
| 25 to 34 Years | 508 (13.1%) | 2,341 (60.4%) |
| 35 to 44 Years | 876 (18.6%) | 3,126 (66.4%) |
| 45 to 54 Years | 915 (15.6%) | 4,529 (77.4%) |
| 55 to 64 Years | 1,321 (20.5%) | 5,307 (82.3%) |
| 65 to 74 Years | 5,067 (99.1%) | 2,879 (56.3%) |
| 75 Years and over | 3,911 (99.4%) | 2,403 (61.1%) |
| Total | 16,219 (38.0%) | 28,741 (67.4%) |
Disability Status by Sex by Age in Davie County
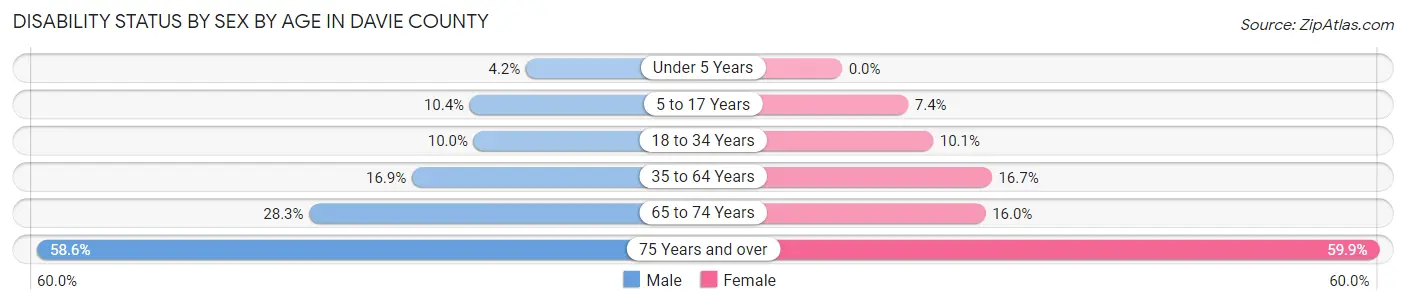
| Age Bracket | Male | Female |
| Under 5 Years | 45 (4.2%) | 0 (0.0%) |
| 5 to 17 Years | 370 (10.4%) | 248 (7.4%) |
| 18 to 34 Years | 378 (10.0%) | 384 (10.1%) |
| 35 to 64 Years | 1,394 (16.9%) | 1,455 (16.7%) |
| 65 to 74 Years | 696 (28.3%) | 424 (16.0%) |
| 75 Years and over | 940 (58.6%) | 1,396 (59.9%) |
Disability Class by Sex by Age in Davie County
Disability Class: Hearing Difficulty
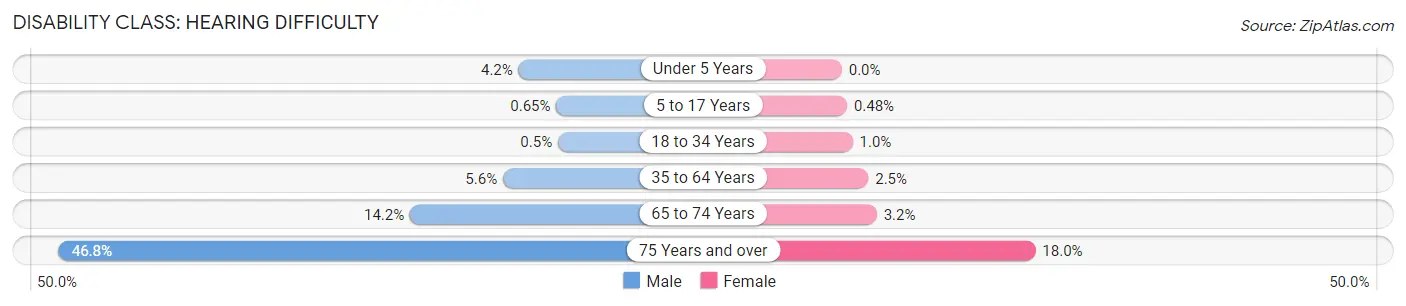
| Age Bracket | Male | Female |
| Under 5 Years | 45 (4.2%) | 0 (0.0%) |
| 5 to 17 Years | 23 (0.6%) | 16 (0.5%) |
| 18 to 34 Years | 19 (0.5%) | 38 (1.0%) |
| 35 to 64 Years | 463 (5.6%) | 215 (2.5%) |
| 65 to 74 Years | 350 (14.2%) | 86 (3.2%) |
| 75 Years and over | 751 (46.8%) | 419 (18.0%) |
Disability Class: Vision Difficulty
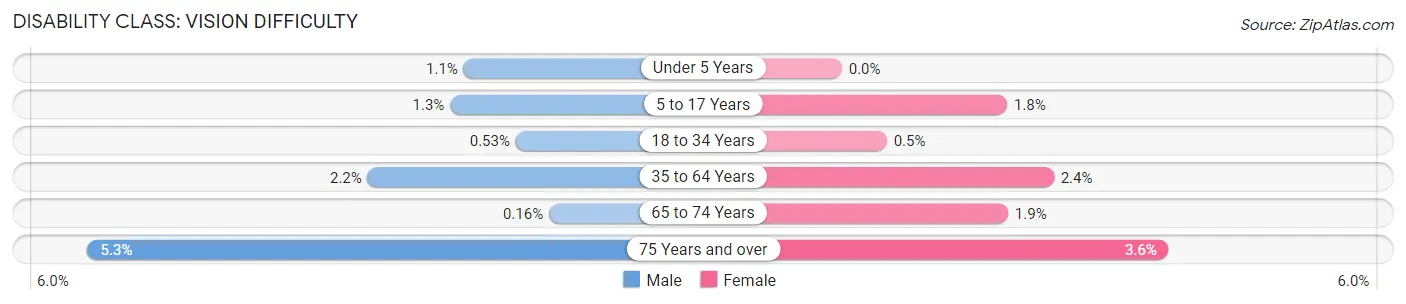
| Age Bracket | Male | Female |
| Under 5 Years | 12 (1.1%) | 0 (0.0%) |
| 5 to 17 Years | 45 (1.3%) | 62 (1.8%) |
| 18 to 34 Years | 20 (0.5%) | 19 (0.5%) |
| 35 to 64 Years | 180 (2.2%) | 206 (2.4%) |
| 65 to 74 Years | 4 (0.2%) | 49 (1.8%) |
| 75 Years and over | 85 (5.3%) | 85 (3.6%) |
Disability Class: Cognitive Difficulty
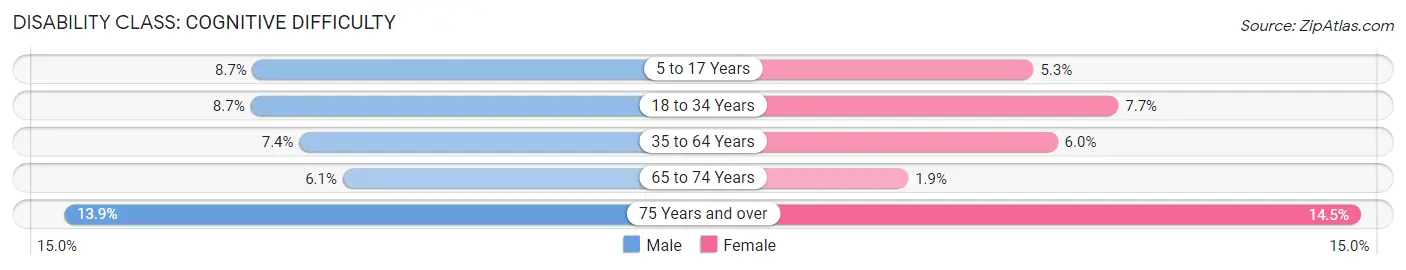
| Age Bracket | Male | Female |
| 5 to 17 Years | 308 (8.6%) | 180 (5.3%) |
| 18 to 34 Years | 330 (8.7%) | 292 (7.7%) |
| 35 to 64 Years | 608 (7.3%) | 525 (6.0%) |
| 65 to 74 Years | 151 (6.1%) | 49 (1.8%) |
| 75 Years and over | 223 (13.9%) | 337 (14.4%) |
Disability Class: Ambulatory Difficulty
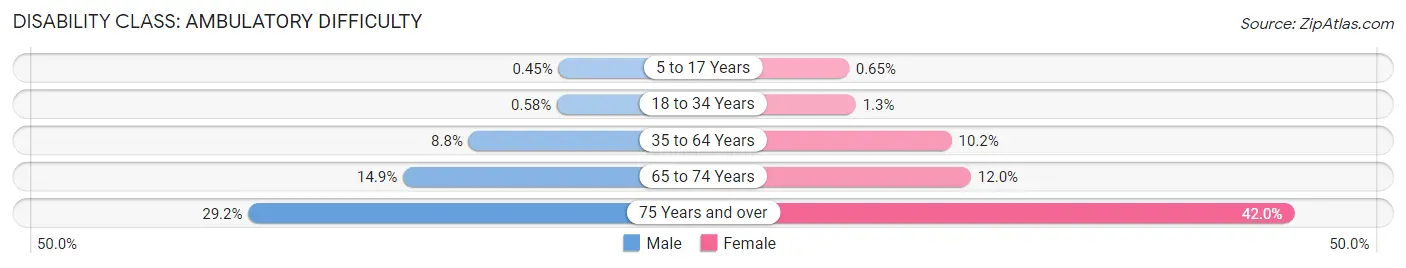
| Age Bracket | Male | Female |
| 5 to 17 Years | 16 (0.4%) | 22 (0.6%) |
| 18 to 34 Years | 22 (0.6%) | 49 (1.3%) |
| 35 to 64 Years | 726 (8.8%) | 890 (10.2%) |
| 65 to 74 Years | 366 (14.9%) | 318 (12.0%) |
| 75 Years and over | 469 (29.2%) | 979 (42.0%) |
Disability Class: Self-Care Difficulty
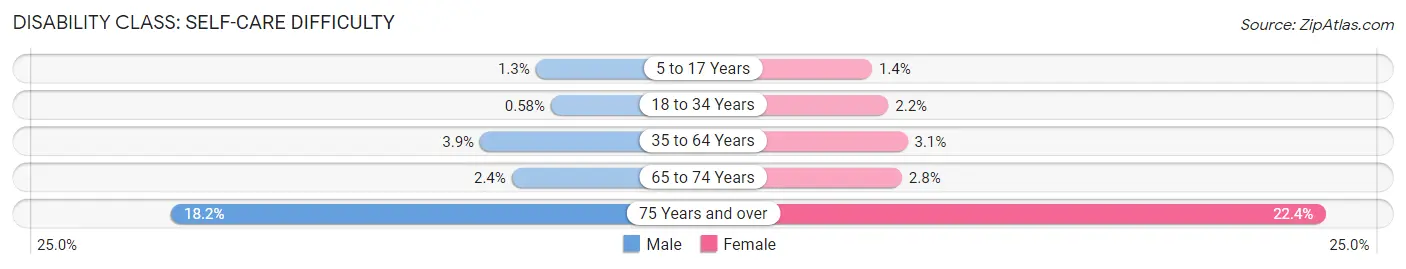
| Age Bracket | Male | Female |
| 5 to 17 Years | 46 (1.3%) | 47 (1.4%) |
| 18 to 34 Years | 22 (0.6%) | 82 (2.2%) |
| 35 to 64 Years | 320 (3.9%) | 266 (3.0%) |
| 65 to 74 Years | 59 (2.4%) | 74 (2.8%) |
| 75 Years and over | 292 (18.2%) | 523 (22.4%) |
Technology Access in Davie County
Computing Device Access in Davie County
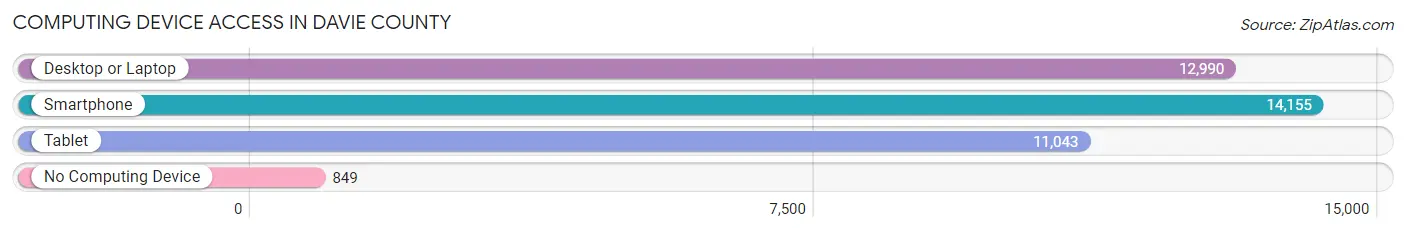
| Device Type | # Households | % Households |
| Desktop or Laptop | 12,990 | 78.9% |
| Smartphone | 14,155 | 86.0% |
| Tablet | 11,043 | 67.1% |
| No Computing Device | 849 | 5.2% |
| Total | 16,468 | 100.0% |
Internet Access in Davie County
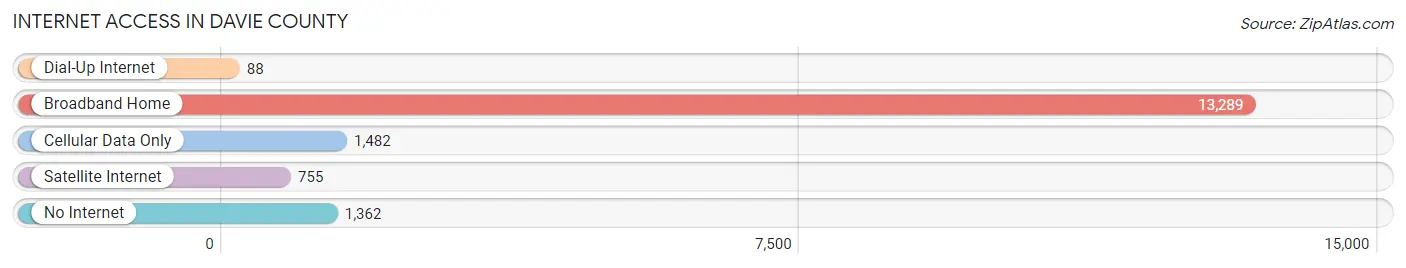
| Internet Type | # Households | % Households |
| Dial-Up Internet | 88 | 0.5% |
| Broadband Home | 13,289 | 80.7% |
| Cellular Data Only | 1,482 | 9.0% |
| Satellite Internet | 755 | 4.6% |
| No Internet | 1,362 | 8.3% |
| Total | 16,468 | 100.0% |
Davie County Summary
Davie County is located in the Piedmont region of North Carolina, and is part of the Winston-Salem metropolitan area. The county was formed in 1836 from Rowan County and is named for Revolutionary War General William R. Davie. The county seat is Mocksville.
Geography
Davie County is located in the Piedmont region of North Carolina, and is part of the Winston-Salem metropolitan area. The county is bordered by Yadkin County to the north, Forsyth County to the east, Davidson County to the south, and Iredell County to the west. The county covers an area of approximately 437 square miles, and is home to several small towns and villages, including Mocksville, Bermuda Run, Cooleemee, and Advance. The county is home to several lakes, including High Rock Lake, Lake Tillery, and Lake Hickory.
The terrain of Davie County is mostly rolling hills, with some flat areas in the eastern part of the county. The county is home to several creeks and rivers, including the Yadkin River, the South Yadkin River, and the Catawba River. The county is also home to several state parks, including Morrow Mountain State Park, Pilot Mountain State Park, and Uwharrie National Forest.
Demographics
As of the 2010 census, Davie County had a population of 41,240. The racial makeup of the county was 87.3% White, 8.7% African American, 0.5% Native American, 0.7% Asian, 0.1% Pacific Islander, 1.7% from other races, and 1.7% from two or more races. Hispanic or Latino of any race were 4.2% of the population.
The median income for a household in the county was $45,837, and the median income for a family was $54,837. The per capita income for the county was $22,837. About 10.3% of families and 13.2% of the population were below the poverty line, including 17.2% of those under age 18 and 11.2% of those age 65 or over.
Economy
Davie County’s economy is largely based on agriculture, manufacturing, and tourism. The county is home to several large agricultural operations, including poultry farms, dairy farms, and vegetable farms. The county is also home to several manufacturing companies, including furniture makers, textiles, and plastics.
The county is also home to several tourist attractions, including the North Carolina Zoo, the Uwharrie National Forest, and several state parks. The county is also home to several wineries, including the Davie County Winery and the Yadkin Valley Winery.
Conclusion
Davie County is a rural county located in the Piedmont region of North Carolina. The county is home to several small towns and villages, and is bordered by Yadkin County to the north, Forsyth County to the east, Davidson County to the south, and Iredell County to the west. The county’s economy is largely based on agriculture, manufacturing, and tourism. The county is home to several tourist attractions, including the North Carolina Zoo, the Uwharrie National Forest, and several state parks. The county is also home to several wineries, including the Davie County Winery and the Yadkin Valley Winery.
Common Questions
What is Per Capita Income in Davie County?
Per Capita income in Davie County is $36,570.
What is the Median Family Income in Davie County?
Median Family Income in Davie County is $85,836.
What is the Median Household income in Davie County?
Median Household Income in Davie County is $69,105.
What is Income or Wage Gap in Davie County?
Income or Wage Gap in Davie County is 27.4%.
Women in Davie County earn 72.6 cents for every dollar earned by a man.
What is Family Income Deficit in Davie County?
Family Income Deficit in Davie County is $10,595.
Families that are below poverty line in Davie County earn $10,595 less on average than the poverty threshold level.
What is Inequality or Gini Index in Davie County?
Inequality or Gini Index in Davie County is 0.42.
What is the Total Population of Davie County?
Total Population of Davie County is 43,030.
What is the Total Male Population of Davie County?
Total Male Population of Davie County is 21,018.
What is the Total Female Population of Davie County?
Total Female Population of Davie County is 22,012.
What is the Ratio of Males per 100 Females in Davie County?
There are 95.48 Males per 100 Females in Davie County.
What is the Ratio of Females per 100 Males in Davie County?
There are 104.73 Females per 100 Males in Davie County.
What is the Median Population Age in Davie County?
Median Population Age in Davie County is 45.2 Years.
What is the Average Family Size in Davie County
Average Family Size in Davie County is 3.2 People.
What is the Average Household Size in Davie County
Average Household Size in Davie County is 2.6 People.
How Large is the Labor Force in Davie County?
There are 20,831 People in the Labor Forcein in Davie County.
What is the Percentage of People in the Labor Force in Davie County?
58.9% of People are in the Labor Force in Davie County.
What is the Unemployment Rate in Davie County?
Unemployment Rate in Davie County is 4.6%.