Currituck County, NC Map & Demographics
Currituck County Map
Currituck County Overview
$40,352
PER CAPITA INCOME
$100,195
AVG FAMILY INCOME
$82,793
AVG HOUSEHOLD INCOME
33.0%
WAGE / INCOME GAP [ % ]
67.0¢/ $1
WAGE / INCOME GAP [ $ ]
$11,893
FAMILY INCOME DEFICIT
0.40
INEQUALITY / GINI INDEX
28,616
TOTAL POPULATION
14,503
MALE POPULATION
14,113
FEMALE POPULATION
102.76
MALES / 100 FEMALES
97.31
FEMALES / 100 MALES
42.5
MEDIAN AGE
2.9
AVG FAMILY SIZE
2.6
AVG HOUSEHOLD SIZE
14,952
LABOR FORCE [ PEOPLE ]
65.3%
PERCENT IN LABOR FORCE
3.2%
UNEMPLOYMENT RATE
Currituck County Area Codes
Income in Currituck County
Income Overview in Currituck County
Per Capita Income in Currituck County is $40,352, while median incomes of families and households are $100,195 and $82,793 respectively.
| Characteristic | Number | Measure |
| Per Capita Income | 28,616 | $40,352 |
| Median Family Income | 8,292 | $100,195 |
| Mean Family Income | 8,292 | $113,037 |
| Median Household Income | 11,108 | $82,793 |
| Mean Household Income | 11,108 | $101,733 |
| Income Deficit | 8,292 | $11,893 |
| Wage / Income Gap (%) | 28,616 | 32.99% |
| Wage / Income Gap ($) | 28,616 | 67.01¢ per $1 |
| Gini / Inequality Index | 28,616 | 0.40 |
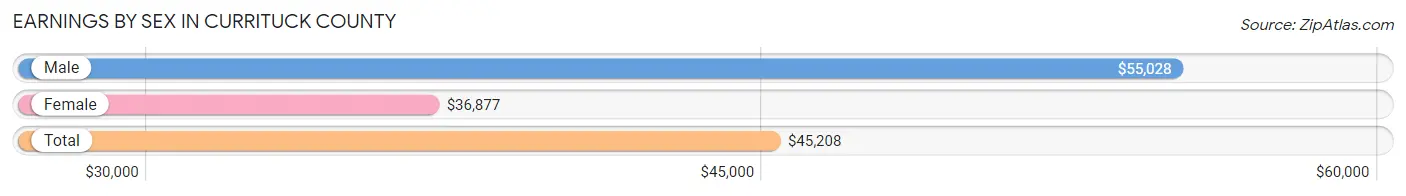
Earnings by Sex in Currituck County
Average Earnings in Currituck County are $45,208, $55,028 for men and $36,877 for women, a difference of 33.0%.
| Sex | Number | Average Earnings |
| Male | 8,359 (54.0%) | $55,028 |
| Female | 7,124 (46.0%) | $36,877 |
| Total | 15,483 (100.0%) | $45,208 |
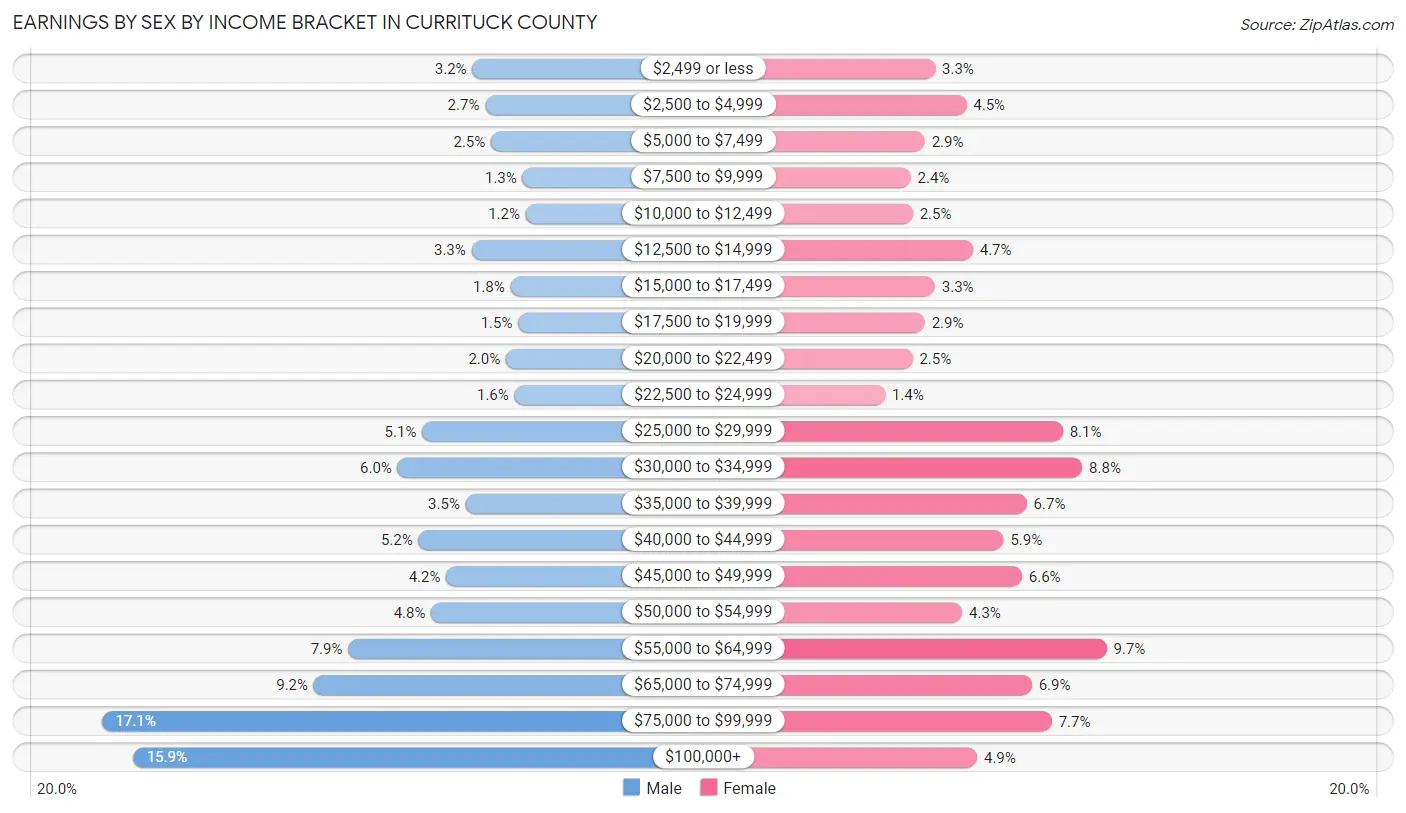
Earnings by Sex by Income Bracket in Currituck County
The most common earnings brackets in Currituck County are $75,000 to $99,999 for men (1,428 | 17.1%) and $55,000 to $64,999 for women (693 | 9.7%).
| Income | Male | Female |
| $2,499 or less | 269 (3.2%) | 236 (3.3%) |
| $2,500 to $4,999 | 229 (2.7%) | 319 (4.5%) |
| $5,000 to $7,499 | 211 (2.5%) | 208 (2.9%) |
| $7,500 to $9,999 | 112 (1.3%) | 170 (2.4%) |
| $10,000 to $12,499 | 102 (1.2%) | 176 (2.5%) |
| $12,500 to $14,999 | 272 (3.3%) | 336 (4.7%) |
| $15,000 to $17,499 | 150 (1.8%) | 235 (3.3%) |
| $17,500 to $19,999 | 125 (1.5%) | 208 (2.9%) |
| $20,000 to $22,499 | 164 (2.0%) | 175 (2.5%) |
| $22,500 to $24,999 | 137 (1.6%) | 102 (1.4%) |
| $25,000 to $29,999 | 426 (5.1%) | 576 (8.1%) |
| $30,000 to $34,999 | 503 (6.0%) | 628 (8.8%) |
| $35,000 to $39,999 | 290 (3.5%) | 480 (6.7%) |
| $40,000 to $44,999 | 438 (5.2%) | 418 (5.9%) |
| $45,000 to $49,999 | 351 (4.2%) | 467 (6.6%) |
| $50,000 to $54,999 | 398 (4.8%) | 308 (4.3%) |
| $55,000 to $64,999 | 658 (7.9%) | 693 (9.7%) |
| $65,000 to $74,999 | 766 (9.2%) | 494 (6.9%) |
| $75,000 to $99,999 | 1,428 (17.1%) | 547 (7.7%) |
| $100,000+ | 1,330 (15.9%) | 348 (4.9%) |
| Total | 8,359 (100.0%) | 7,124 (100.0%) |
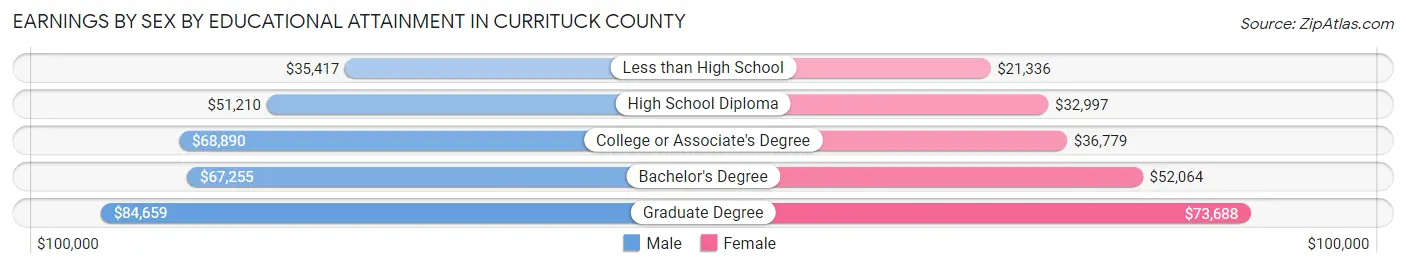
Earnings by Sex by Educational Attainment in Currituck County
Average earnings in Currituck County are $59,222 for men and $39,670 for women, a difference of 33.0%. Men with an educational attainment of graduate degree enjoy the highest average annual earnings of $84,659, while those with less than high school education earn the least with $35,417. Women with an educational attainment of graduate degree earn the most with the average annual earnings of $73,688, while those with less than high school education have the smallest earnings of $21,336.
| Educational Attainment | Male Income | Female Income |
| Less than High School | $35,417 | $21,336 |
| High School Diploma | $51,210 | $32,997 |
| College or Associate's Degree | $68,890 | $36,779 |
| Bachelor's Degree | $67,255 | $52,064 |
| Graduate Degree | $84,659 | $73,688 |
| Total | $59,222 | $39,670 |
Family Income in Currituck County
Family Income Brackets in Currituck County
According to the Currituck County family income data, there are 2,488 families falling into the $100,000 to $149,999 income range, which is the most common income bracket and makes up 30.0% of all families. Conversely, the $10,000 to $14,999 income bracket is the least frequent group with only 75 families (0.9%) belonging to this category.
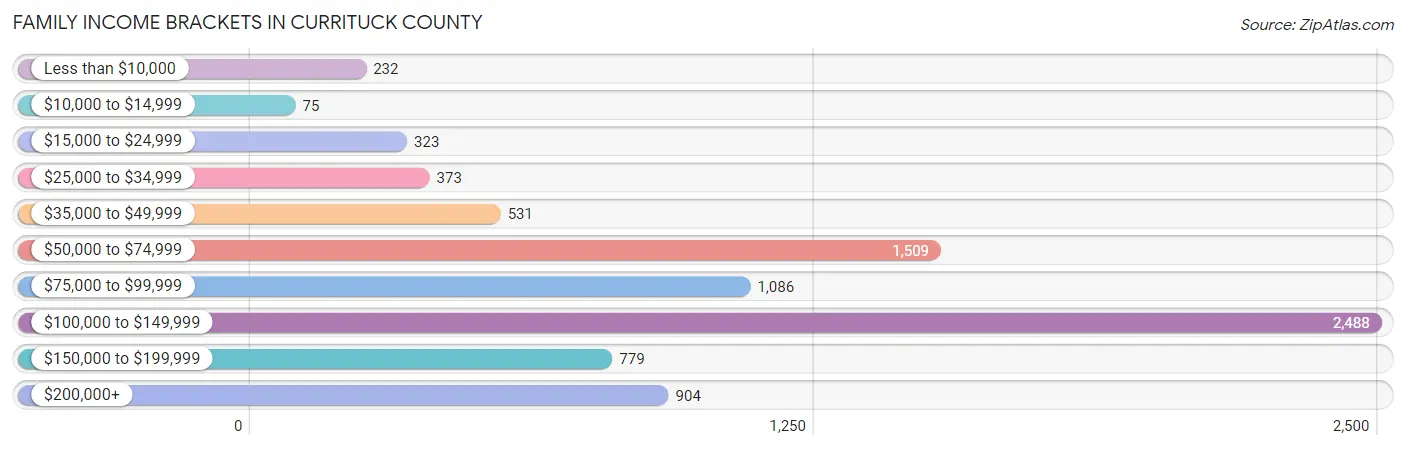
| Income Bracket | # Families | % Families |
| Less than $10,000 | 232 | 2.8% |
| $10,000 to $14,999 | 75 | 0.9% |
| $15,000 to $24,999 | 323 | 3.9% |
| $25,000 to $34,999 | 373 | 4.5% |
| $35,000 to $49,999 | 531 | 6.4% |
| $50,000 to $74,999 | 1,509 | 18.2% |
| $75,000 to $99,999 | 1,086 | 13.1% |
| $100,000 to $149,999 | 2,488 | 30.0% |
| $150,000 to $199,999 | 779 | 9.4% |
| $200,000+ | 904 | 10.9% |
Family Income by Famaliy Size in Currituck County
7+ person families (57 | 0.7%) account for the highest median family income in Currituck County with $176,563 per family, while 2-person families (4,435 | 53.5%) have the highest median income of $47,809 per family member.
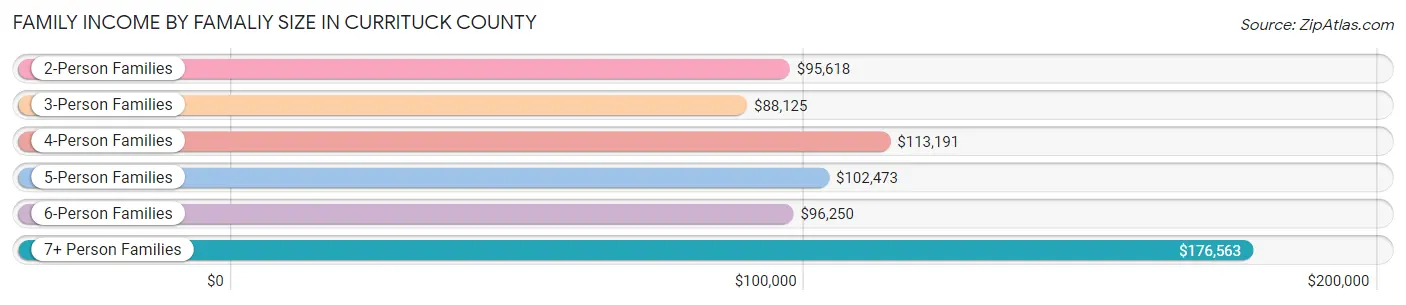
| Income Bracket | # Families | Median Income |
| 2-Person Families | 4,435 (53.5%) | $95,618 |
| 3-Person Families | 1,674 (20.2%) | $88,125 |
| 4-Person Families | 1,231 (14.8%) | $113,191 |
| 5-Person Families | 659 (8.0%) | $102,473 |
| 6-Person Families | 236 (2.9%) | $96,250 |
| 7+ Person Families | 57 (0.7%) | $176,563 |
| Total | 8,292 (100.0%) | $100,195 |
Family Income by Number of Earners in Currituck County
The median family income in Currituck County is $100,195, with families comprising 3+ earners (906) having the highest median family income of $135,000, while families with no earners (1,482) have the lowest median family income of $66,406, accounting for 10.9% and 17.9% of families, respectively.
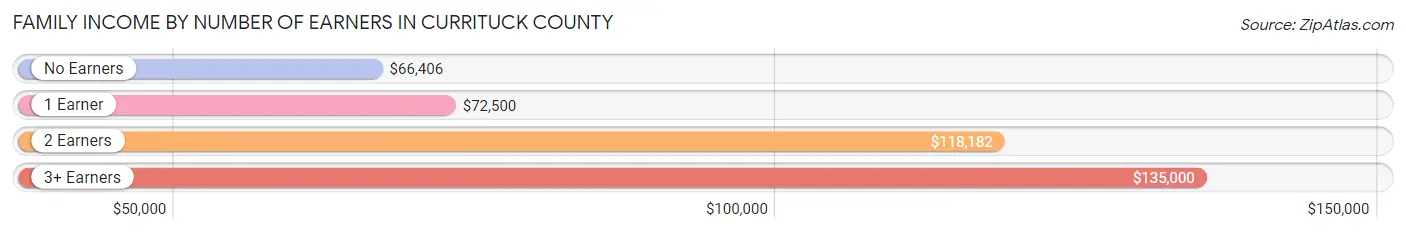
| Number of Earners | # Families | Median Income |
| No Earners | 1,482 (17.9%) | $66,406 |
| 1 Earner | 2,514 (30.3%) | $72,500 |
| 2 Earners | 3,390 (40.9%) | $118,182 |
| 3+ Earners | 906 (10.9%) | $135,000 |
| Total | 8,292 (100.0%) | $100,195 |
Household Income in Currituck County
Household Income Brackets in Currituck County
With 2,810 households falling in the category, the $100,000 to $149,999 income range is the most frequent in Currituck County, accounting for 25.3% of all households. In contrast, only 211 households (1.9%) fall into the $10,000 to $14,999 income bracket, making it the least populous group.
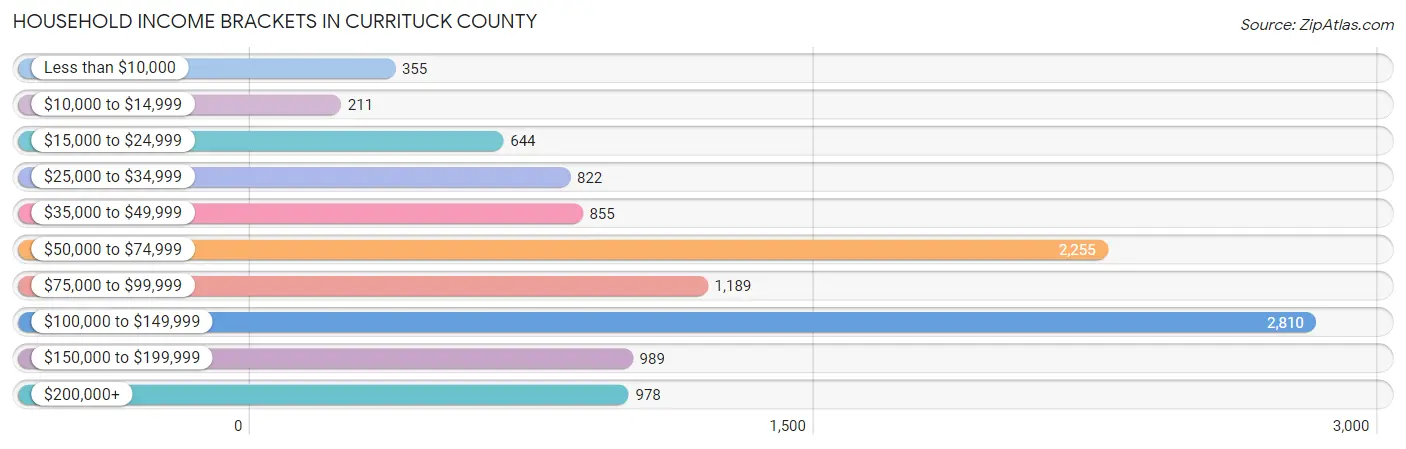
| Income Bracket | # Households | % Households |
| Less than $10,000 | 355 | 3.2% |
| $10,000 to $14,999 | 211 | 1.9% |
| $15,000 to $24,999 | 644 | 5.8% |
| $25,000 to $34,999 | 822 | 7.4% |
| $35,000 to $49,999 | 855 | 7.7% |
| $50,000 to $74,999 | 2,255 | 20.3% |
| $75,000 to $99,999 | 1,189 | 10.7% |
| $100,000 to $149,999 | 2,810 | 25.3% |
| $150,000 to $199,999 | 989 | 8.9% |
| $200,000+ | 978 | 8.8% |
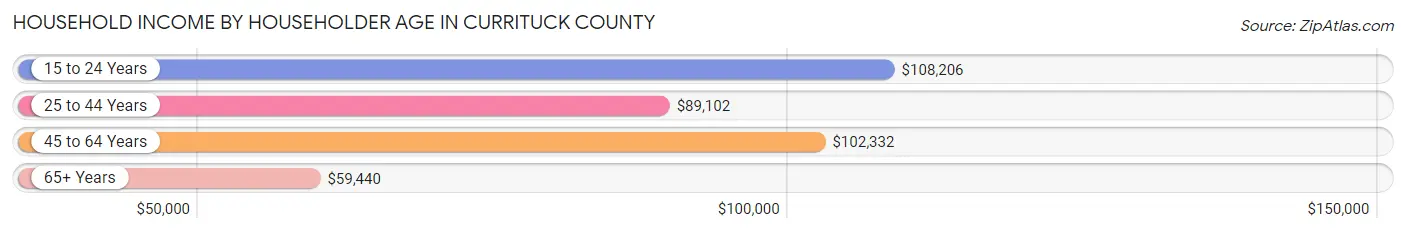
Household Income by Householder Age in Currituck County
The median household income in Currituck County is $82,793, with the highest median household income of $108,206 found in the 15 to 24 years age bracket for the primary householder. A total of 161 households (1.5%) fall into this category. Meanwhile, the 65+ years age bracket for the primary householder has the lowest median household income of $59,440, with 2,967 households (26.7%) in this group.
| Income Bracket | # Households | Median Income |
| 15 to 24 Years | 161 (1.5%) | $108,206 |
| 25 to 44 Years | 3,459 (31.1%) | $89,102 |
| 45 to 64 Years | 4,521 (40.7%) | $102,332 |
| 65+ Years | 2,967 (26.7%) | $59,440 |
| Total | 11,108 (100.0%) | $82,793 |
Poverty in Currituck County
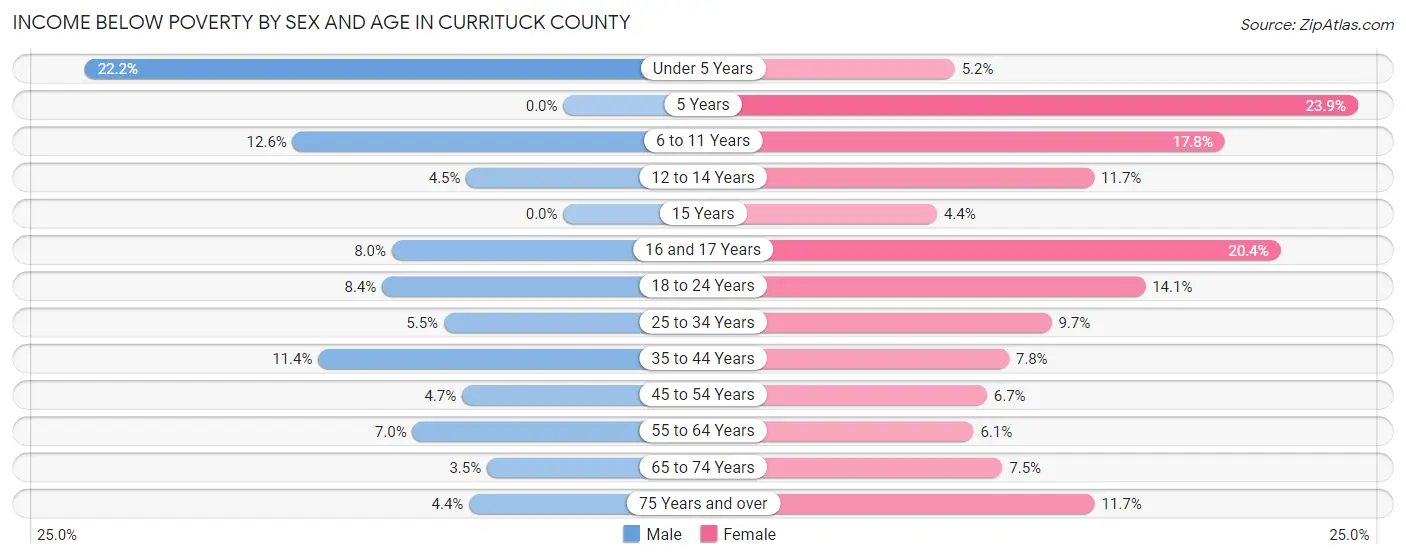
Income Below Poverty by Sex and Age in Currituck County
With 7.6% poverty level for males and 9.3% for females among the residents of Currituck County, under 5 year old males and 5 year old females are the most vulnerable to poverty, with 183 males (22.2%) and 45 females (23.9%) in their respective age groups living below the poverty level.
| Age Bracket | Male | Female |
| Under 5 Years | 183 (22.2%) | 36 (5.2%) |
| 5 Years | 0 (0.0%) | 45 (23.9%) |
| 6 to 11 Years | 130 (12.6%) | 198 (17.8%) |
| 12 to 14 Years | 29 (4.5%) | 37 (11.7%) |
| 15 Years | 0 (0.0%) | 14 (4.4%) |
| 16 and 17 Years | 27 (8.0%) | 57 (20.4%) |
| 18 to 24 Years | 83 (8.4%) | 118 (14.1%) |
| 25 to 34 Years | 87 (5.5%) | 165 (9.7%) |
| 35 to 44 Years | 217 (11.4%) | 141 (7.7%) |
| 45 to 54 Years | 97 (4.7%) | 130 (6.7%) |
| 55 to 64 Years | 166 (7.0%) | 139 (6.1%) |
| 65 to 74 Years | 53 (3.5%) | 120 (7.4%) |
| 75 Years and over | 32 (4.4%) | 105 (11.7%) |
| Total | 1,104 (7.6%) | 1,305 (9.3%) |
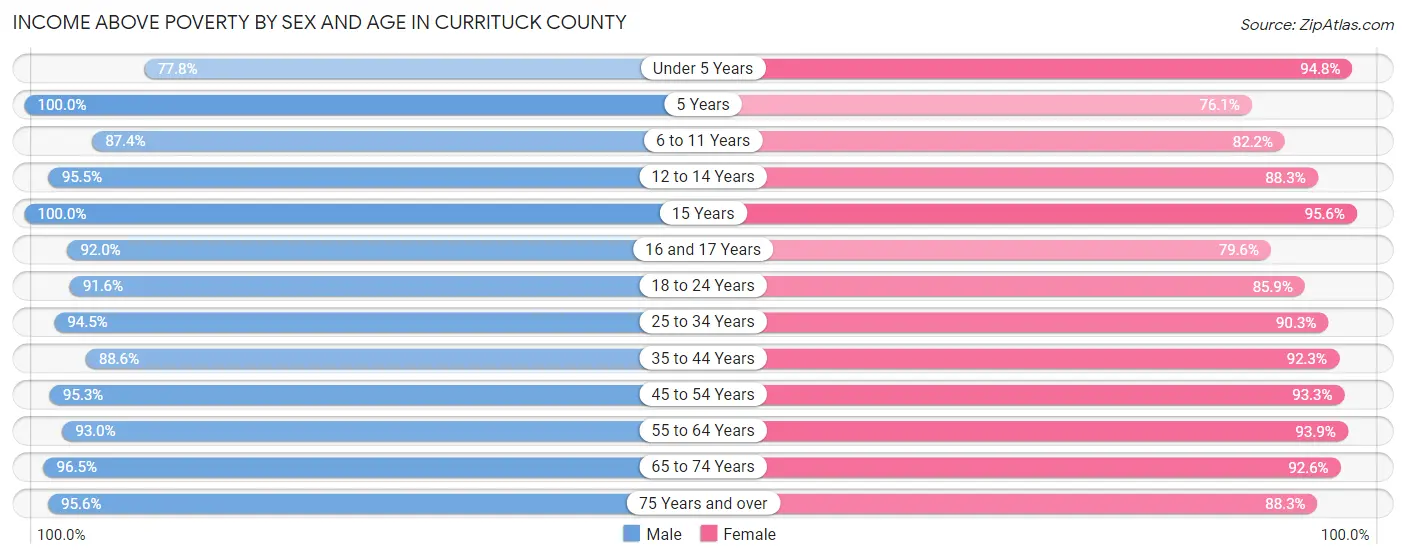
Income Above Poverty by Sex and Age in Currituck County
According to the poverty statistics in Currituck County, males aged 5 years and females aged 15 years are the age groups that are most secure financially, with 100.0% of males and 95.6% of females in these age groups living above the poverty line.
| Age Bracket | Male | Female |
| Under 5 Years | 641 (77.8%) | 651 (94.8%) |
| 5 Years | 279 (100.0%) | 143 (76.1%) |
| 6 to 11 Years | 905 (87.4%) | 916 (82.2%) |
| 12 to 14 Years | 616 (95.5%) | 279 (88.3%) |
| 15 Years | 216 (100.0%) | 303 (95.6%) |
| 16 and 17 Years | 312 (92.0%) | 223 (79.6%) |
| 18 to 24 Years | 904 (91.6%) | 720 (85.9%) |
| 25 to 34 Years | 1,482 (94.5%) | 1,530 (90.3%) |
| 35 to 44 Years | 1,691 (88.6%) | 1,678 (92.2%) |
| 45 to 54 Years | 1,965 (95.3%) | 1,801 (93.3%) |
| 55 to 64 Years | 2,206 (93.0%) | 2,136 (93.9%) |
| 65 to 74 Years | 1,446 (96.5%) | 1,491 (92.5%) |
| 75 Years and over | 700 (95.6%) | 790 (88.3%) |
| Total | 13,363 (92.4%) | 12,661 (90.7%) |
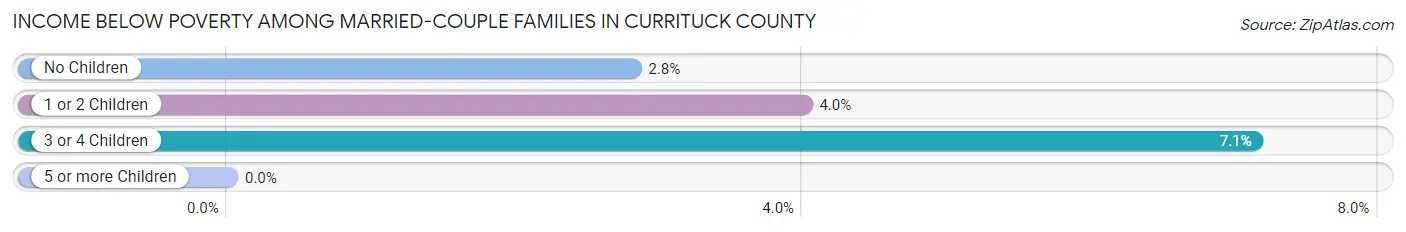
Income Below Poverty Among Married-Couple Families in Currituck County
The poverty statistics for married-couple families in Currituck County show that 3.5% or 234 of the total 6,726 families live below the poverty line. Families with 3 or 4 children have the highest poverty rate of 7.1%, comprising of 40 families. On the other hand, families with no children have the lowest poverty rate of 2.8%, which includes 125 families.
| Children | Above Poverty | Below Poverty |
| No Children | 4,318 (97.2%) | 125 (2.8%) |
| 1 or 2 Children | 1,654 (96.0%) | 69 (4.0%) |
| 3 or 4 Children | 520 (92.9%) | 40 (7.1%) |
| 5 or more Children | 0 (0.0%) | 0 (0.0%) |
| Total | 6,492 (96.5%) | 234 (3.5%) |
Income Below Poverty Among Single-Parent Households in Currituck County
According to the poverty data in Currituck County, 22.1% or 139 single-father households and 20.7% or 194 single-mother households are living below the poverty line. Among single-father households, those with 3 or 4 children have the highest poverty rate, with 28 households (32.9%) experiencing poverty. Likewise, among single-mother households, those with 3 or 4 children have the highest poverty rate, with 67 households (47.5%) falling below the poverty line.
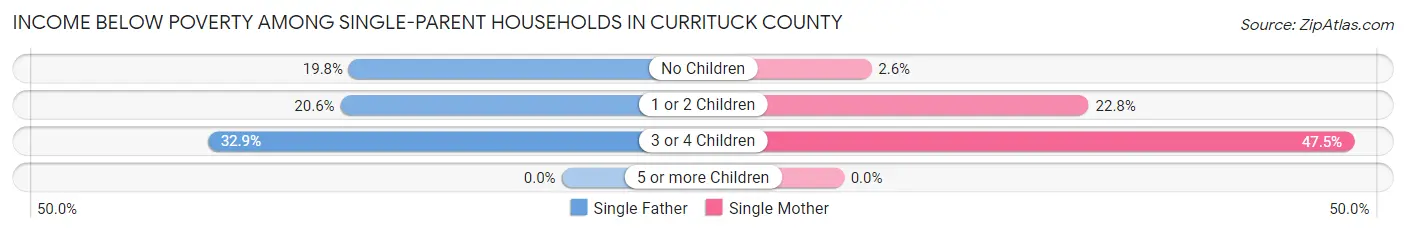
| Children | Single Father | Single Mother |
| No Children | 20 (19.8%) | 7 (2.6%) |
| 1 or 2 Children | 91 (20.6%) | 120 (22.8%) |
| 3 or 4 Children | 28 (32.9%) | 67 (47.5%) |
| 5 or more Children | 0 (0.0%) | 0 (0.0%) |
| Total | 139 (22.1%) | 194 (20.7%) |
Income Below Poverty Among Married-Couple vs Single-Parent Households in Currituck County
The poverty data for Currituck County shows that 234 of the married-couple family households (3.5%) and 333 of the single-parent households (21.3%) are living below the poverty level. Within the married-couple family households, those with 3 or 4 children have the highest poverty rate, with 40 households (7.1%) falling below the poverty line. Among the single-parent households, those with 3 or 4 children have the highest poverty rate, with 95 household (42.0%) living below poverty.
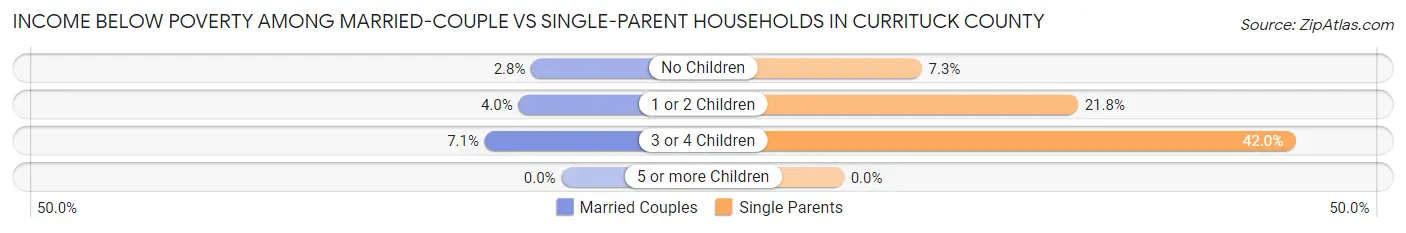
| Children | Married-Couple Families | Single-Parent Households |
| No Children | 125 (2.8%) | 27 (7.3%) |
| 1 or 2 Children | 69 (4.0%) | 211 (21.8%) |
| 3 or 4 Children | 40 (7.1%) | 95 (42.0%) |
| 5 or more Children | 0 (0.0%) | 0 (0.0%) |
| Total | 234 (3.5%) | 333 (21.3%) |
Race in Currituck County
The most populous races in Currituck County are White / Caucasian (24,837 | 86.8%), Black / African American (1,594 | 5.6%), and Hispanic or Latino (1,360 | 4.8%).
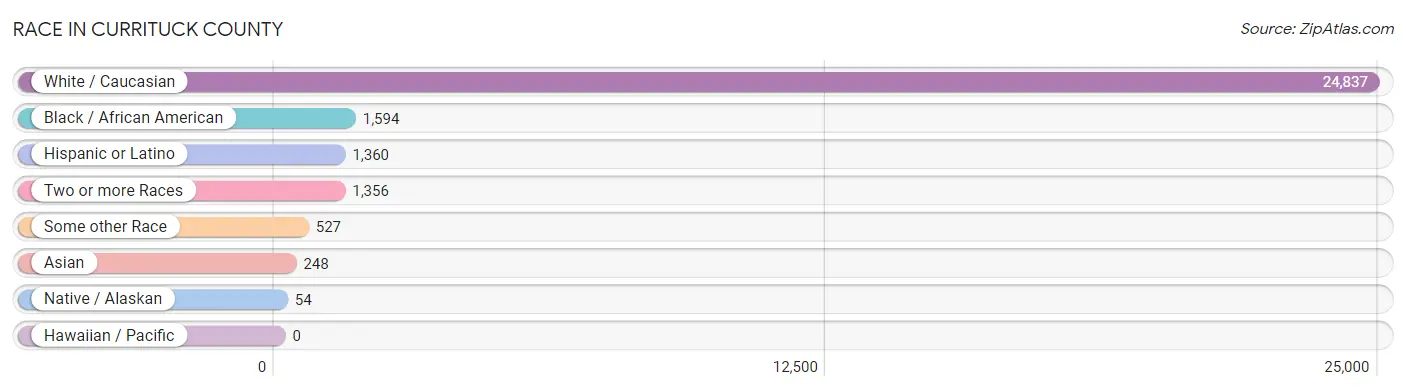
| Race | # Population | % Population |
| Asian | 248 | 0.9% |
| Black / African American | 1,594 | 5.6% |
| Hawaiian / Pacific | 0 | 0.0% |
| Hispanic or Latino | 1,360 | 4.8% |
| Native / Alaskan | 54 | 0.2% |
| White / Caucasian | 24,837 | 86.8% |
| Two or more Races | 1,356 | 4.7% |
| Some other Race | 527 | 1.8% |
| Total | 28,616 | 100.0% |
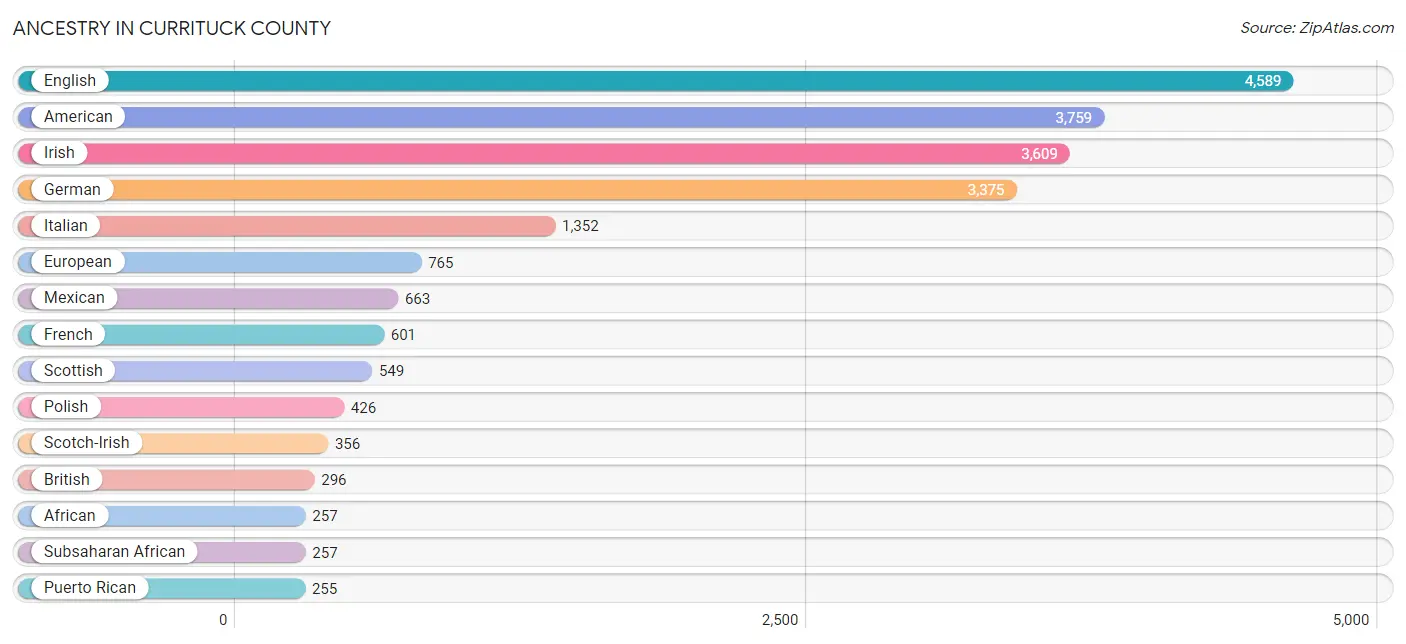
Ancestry in Currituck County
The most populous ancestries reported in Currituck County are English (4,589 | 16.0%), American (3,759 | 13.1%), Irish (3,609 | 12.6%), German (3,375 | 11.8%), and Italian (1,352 | 4.7%), together accounting for 58.3% of all Currituck County residents.
| Ancestry | # Population | % Population |
| African | 257 | 0.9% |
| American | 3,759 | 13.1% |
| Arab | 24 | 0.1% |
| Austrian | 56 | 0.2% |
| Belgian | 22 | 0.1% |
| Bhutanese | 133 | 0.5% |
| Blackfeet | 9 | 0.0% |
| Bolivian | 62 | 0.2% |
| British | 296 | 1.0% |
| Bulgarian | 8 | 0.0% |
| Burmese | 68 | 0.2% |
| Canadian | 89 | 0.3% |
| Central American | 42 | 0.2% |
| Cherokee | 126 | 0.4% |
| Chilean | 17 | 0.1% |
| Colombian | 51 | 0.2% |
| Croatian | 10 | 0.0% |
| Cuban | 22 | 0.1% |
| Czech | 18 | 0.1% |
| Czechoslovakian | 22 | 0.1% |
| Danish | 20 | 0.1% |
| Delaware | 2 | 0.0% |
| Dutch | 222 | 0.8% |
| Eastern European | 148 | 0.5% |
| English | 4,589 | 16.0% |
| European | 765 | 2.7% |
| Finnish | 35 | 0.1% |
| French | 601 | 2.1% |
| French Canadian | 203 | 0.7% |
| German | 3,375 | 11.8% |
| Greek | 134 | 0.5% |
| Honduran | 20 | 0.1% |
| Hungarian | 125 | 0.4% |
| Indian (Asian) | 69 | 0.2% |
| Inupiat | 8 | 0.0% |
| Irish | 3,609 | 12.6% |
| Iroquois | 12 | 0.0% |
| Italian | 1,352 | 4.7% |
| Jamaican | 14 | 0.1% |
| Korean | 54 | 0.2% |
| Latvian | 9 | 0.0% |
| Lebanese | 24 | 0.1% |
| Lithuanian | 19 | 0.1% |
| Lumbee | 133 | 0.5% |
| Mexican | 663 | 2.3% |
| Nepalese | 23 | 0.1% |
| Nicaraguan | 22 | 0.1% |
| Northern European | 28 | 0.1% |
| Norwegian | 158 | 0.5% |
| Ottawa | 8 | 0.0% |
| Pennsylvania German | 6 | 0.0% |
| Peruvian | 20 | 0.1% |
| Polish | 426 | 1.5% |
| Portuguese | 213 | 0.7% |
| Puerto Rican | 255 | 0.9% |
| Romanian | 8 | 0.0% |
| Russian | 94 | 0.3% |
| Scandinavian | 38 | 0.1% |
| Scotch-Irish | 356 | 1.2% |
| Scottish | 549 | 1.9% |
| Serbian | 8 | 0.0% |
| Slavic | 27 | 0.1% |
| Slovak | 7 | 0.0% |
| South American | 150 | 0.5% |
| South American Indian | 8 | 0.0% |
| Spaniard | 79 | 0.3% |
| Sri Lankan | 4 | 0.0% |
| Subsaharan African | 257 | 0.9% |
| Swedish | 223 | 0.8% |
| Swiss | 24 | 0.1% |
| Thai | 19 | 0.1% |
| Turkish | 140 | 0.5% |
| Ukrainian | 84 | 0.3% |
| Welsh | 184 | 0.6% |
| West Indian | 13 | 0.1% | View All 75 Rows |
Immigrants in Currituck County
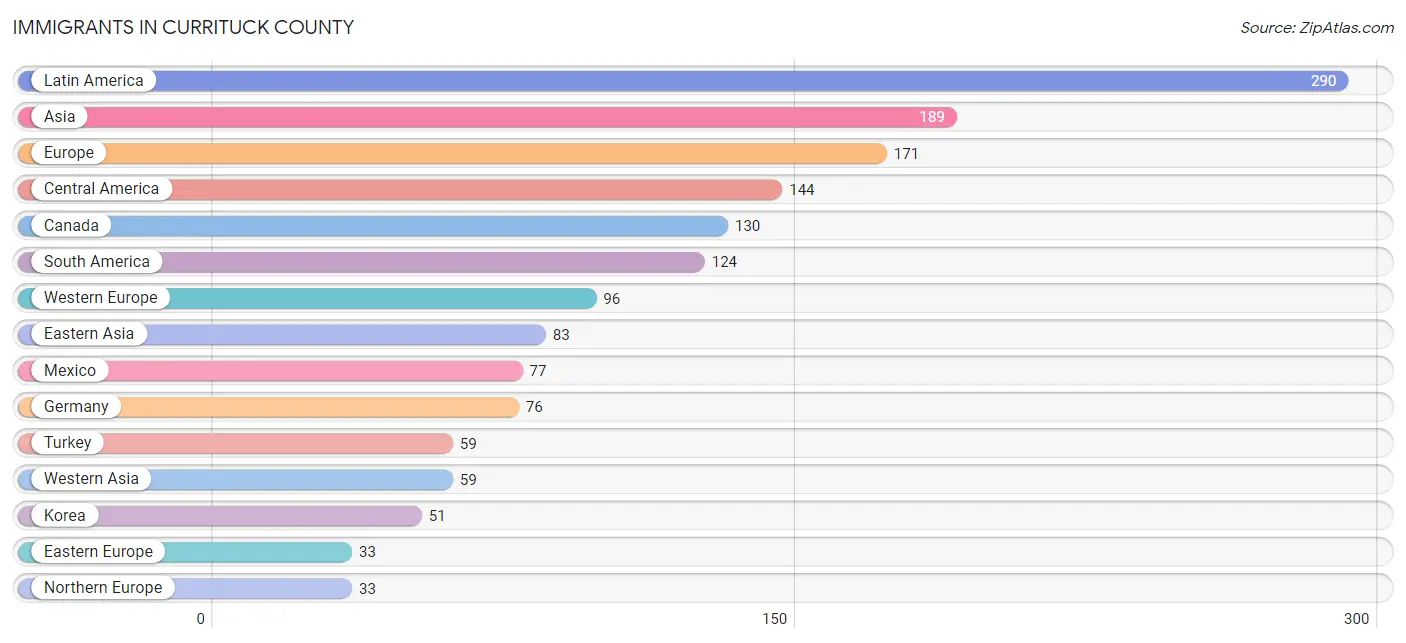
The most numerous immigrant groups reported in Currituck County came from Latin America (290 | 1.0%), Asia (189 | 0.7%), Europe (171 | 0.6%), Central America (144 | 0.5%), and Canada (130 | 0.4%), together accounting for 3.2% of all Currituck County residents.
| Immigration Origin | # Population | % Population |
| Asia | 189 | 0.7% |
| Bolivia | 31 | 0.1% |
| Canada | 130 | 0.4% |
| Caribbean | 22 | 0.1% |
| Central America | 144 | 0.5% |
| Chile | 32 | 0.1% |
| China | 22 | 0.1% |
| Colombia | 10 | 0.0% |
| Cuba | 8 | 0.0% |
| Eastern Asia | 83 | 0.3% |
| Eastern Europe | 33 | 0.1% |
| El Salvador | 1 | 0.0% |
| Europe | 171 | 0.6% |
| France | 14 | 0.1% |
| Germany | 76 | 0.3% |
| Honduras | 20 | 0.1% |
| Hungary | 10 | 0.0% |
| Italy | 9 | 0.0% |
| Jamaica | 14 | 0.1% |
| Japan | 10 | 0.0% |
| Korea | 51 | 0.2% |
| Latin America | 290 | 1.0% |
| Mexico | 77 | 0.3% |
| Netherlands | 6 | 0.0% |
| Nicaragua | 22 | 0.1% |
| Northern Europe | 33 | 0.1% |
| Pakistan | 29 | 0.1% |
| Panama | 24 | 0.1% |
| Peru | 30 | 0.1% |
| Philippines | 18 | 0.1% |
| Poland | 7 | 0.0% |
| Russia | 15 | 0.1% |
| South America | 124 | 0.4% |
| South Central Asia | 29 | 0.1% |
| South Eastern Asia | 18 | 0.1% |
| Southern Europe | 9 | 0.0% |
| Turkey | 59 | 0.2% |
| Ukraine | 1 | 0.0% |
| Uruguay | 21 | 0.1% |
| Western Asia | 59 | 0.2% |
| Western Europe | 96 | 0.3% | View All 41 Rows |
Sex and Age in Currituck County
Sex and Age in Currituck County
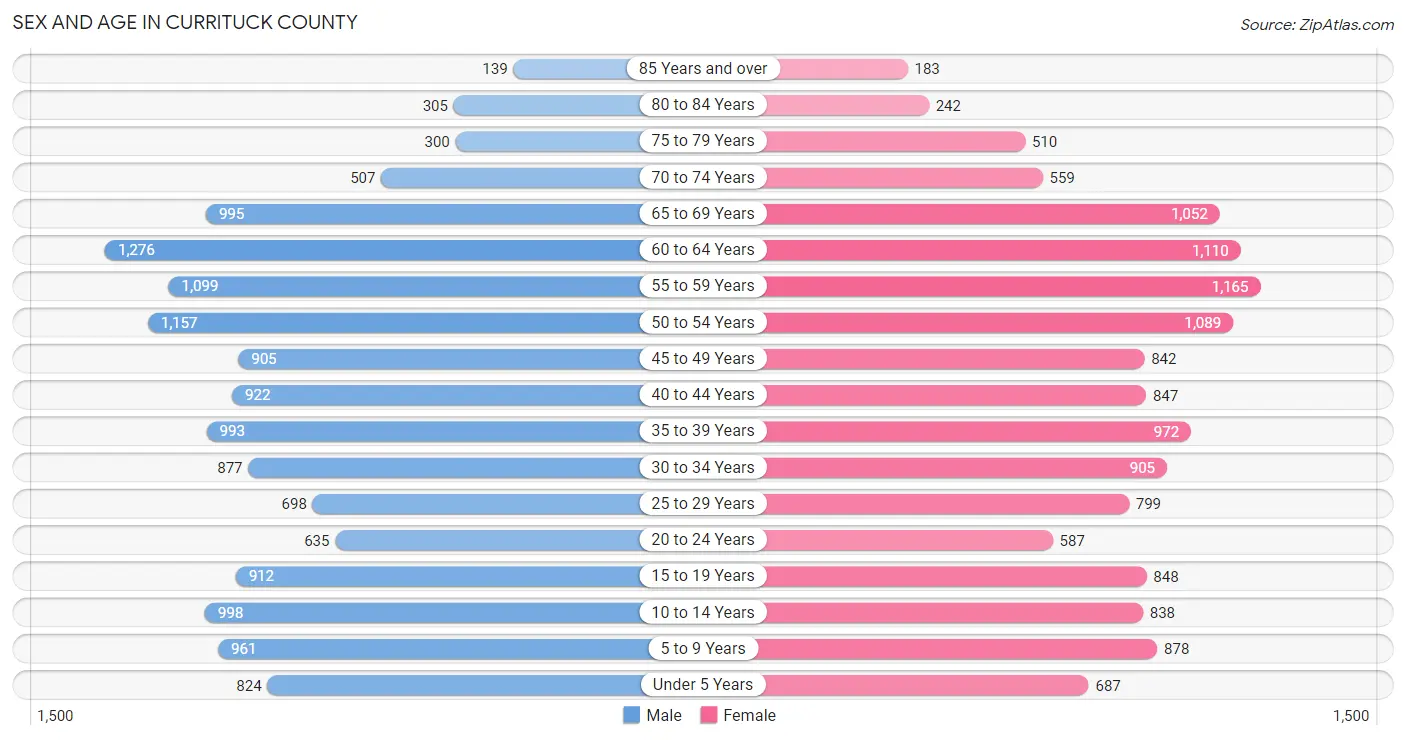
The most populous age groups in Currituck County are 60 to 64 Years (1,276 | 8.8%) for men and 55 to 59 Years (1,165 | 8.3%) for women.
| Age Bracket | Male | Female |
| Under 5 Years | 824 (5.7%) | 687 (4.9%) |
| 5 to 9 Years | 961 (6.6%) | 878 (6.2%) |
| 10 to 14 Years | 998 (6.9%) | 838 (5.9%) |
| 15 to 19 Years | 912 (6.3%) | 848 (6.0%) |
| 20 to 24 Years | 635 (4.4%) | 587 (4.2%) |
| 25 to 29 Years | 698 (4.8%) | 799 (5.7%) |
| 30 to 34 Years | 877 (6.0%) | 905 (6.4%) |
| 35 to 39 Years | 993 (6.9%) | 972 (6.9%) |
| 40 to 44 Years | 922 (6.4%) | 847 (6.0%) |
| 45 to 49 Years | 905 (6.2%) | 842 (6.0%) |
| 50 to 54 Years | 1,157 (8.0%) | 1,089 (7.7%) |
| 55 to 59 Years | 1,099 (7.6%) | 1,165 (8.3%) |
| 60 to 64 Years | 1,276 (8.8%) | 1,110 (7.9%) |
| 65 to 69 Years | 995 (6.9%) | 1,052 (7.4%) |
| 70 to 74 Years | 507 (3.5%) | 559 (4.0%) |
| 75 to 79 Years | 300 (2.1%) | 510 (3.6%) |
| 80 to 84 Years | 305 (2.1%) | 242 (1.7%) |
| 85 Years and over | 139 (1.0%) | 183 (1.3%) |
| Total | 14,503 (100.0%) | 14,113 (100.0%) |
Families and Households in Currituck County
Median Family Size in Currituck County
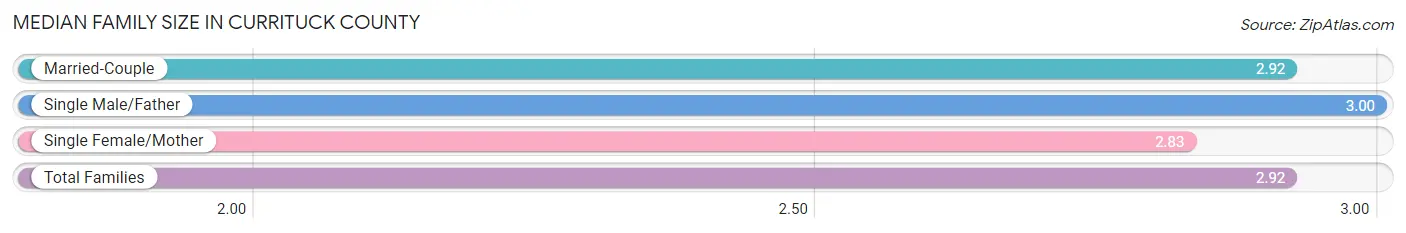
The median family size in Currituck County is 2.92 persons per family, with single male/father families (628 | 7.6%) accounting for the largest median family size of 3 persons per family. On the other hand, single female/mother families (938 | 11.3%) represent the smallest median family size with 2.83 persons per family.
| Family Type | # Families | Family Size |
| Married-Couple | 6,726 (81.1%) | 2.92 |
| Single Male/Father | 628 (7.6%) | 3.00 |
| Single Female/Mother | 938 (11.3%) | 2.83 |
| Total Families | 8,292 (100.0%) | 2.92 |
Median Household Size in Currituck County
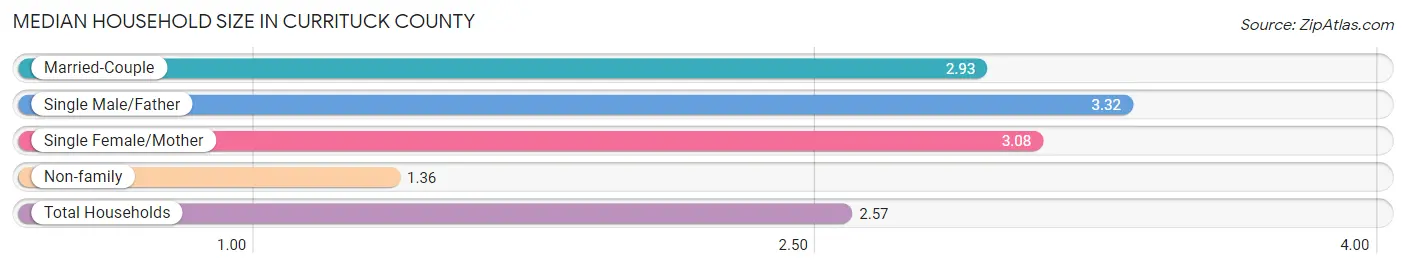
The median household size in Currituck County is 2.57 persons per household, with single male/father households (628 | 5.7%) accounting for the largest median household size of 3.32 persons per household. non-family households (2,816 | 25.4%) represent the smallest median household size with 1.36 persons per household.
| Household Type | # Households | Household Size |
| Married-Couple | 6,726 (60.6%) | 2.93 |
| Single Male/Father | 628 (5.7%) | 3.32 |
| Single Female/Mother | 938 (8.4%) | 3.08 |
| Non-family | 2,816 (25.4%) | 1.36 |
| Total Households | 11,108 (100.0%) | 2.57 |
Household Size by Marriage Status in Currituck County
Out of a total of 11,108 households in Currituck County, 8,292 (74.7%) are family households, while 2,816 (25.4%) are nonfamily households. The most numerous type of family households are 2-person households, comprising 4,309, and the most common type of nonfamily households are 1-person households, comprising 2,116.
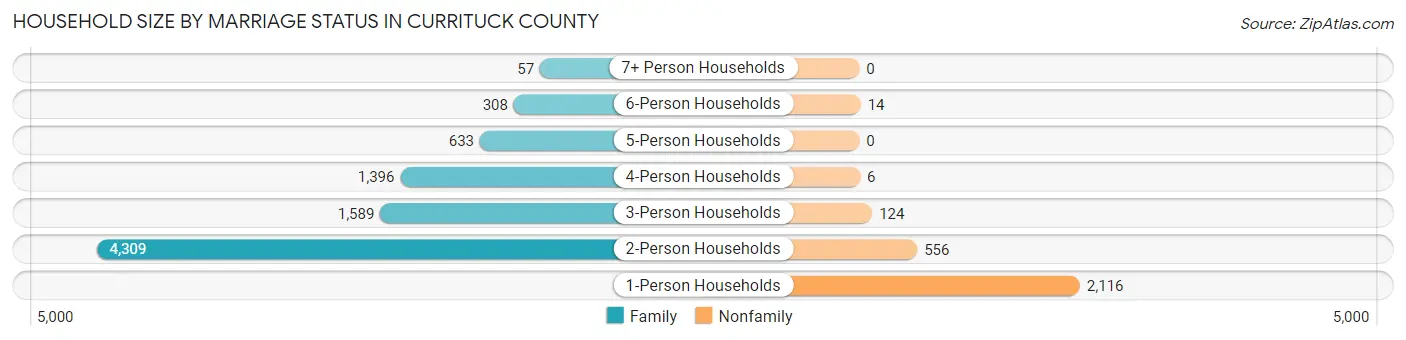
| Household Size | Family Households | Nonfamily Households |
| 1-Person Households | - | 2,116 (19.1%) |
| 2-Person Households | 4,309 (38.8%) | 556 (5.0%) |
| 3-Person Households | 1,589 (14.3%) | 124 (1.1%) |
| 4-Person Households | 1,396 (12.6%) | 6 (0.1%) |
| 5-Person Households | 633 (5.7%) | 0 (0.0%) |
| 6-Person Households | 308 (2.8%) | 14 (0.1%) |
| 7+ Person Households | 57 (0.5%) | 0 (0.0%) |
| Total | 8,292 (74.7%) | 2,816 (25.4%) |
Female Fertility in Currituck County
Fertility by Age in Currituck County
Average fertility rate in Currituck County is 60.0 births per 1,000 women. Women in the age bracket of 20 to 34 years have the highest fertility rate with 152.0 births per 1,000 women. Women in the age bracket of 20 to 34 years acount for 95.1% of all women with births.
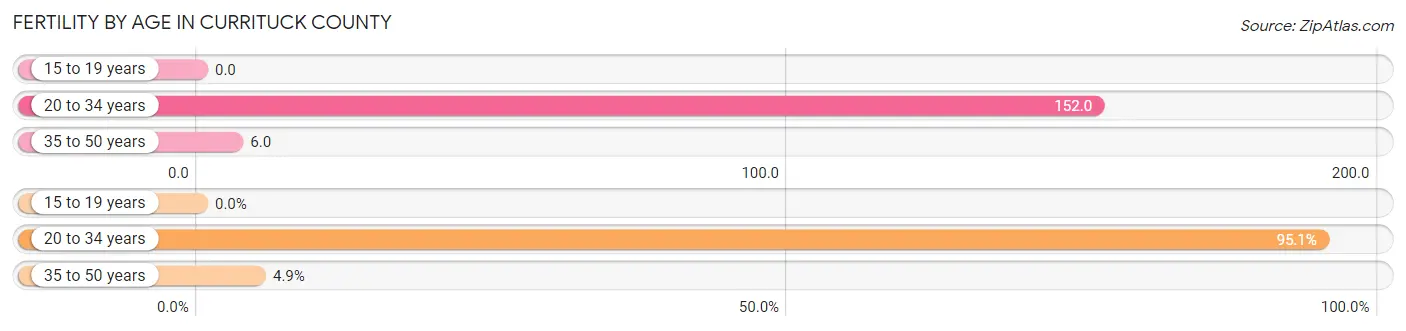
| Age Bracket | Women with Births | Births / 1,000 Women |
| 15 to 19 years | 0 (0.0%) | 0.0 |
| 20 to 34 years | 348 (95.1%) | 152.0 |
| 35 to 50 years | 18 (4.9%) | 6.0 |
| Total | 366 (100.0%) | 60.0 |
Fertility by Age by Marriage Status in Currituck County
70.2% of women with births (366) in Currituck County are married. The highest percentage of unmarried women with births falls into 20 to 34 years age bracket with 31.3% of them unmarried at the time of birth, while the lowest percentage of unmarried women with births belong to 35 to 50 years age bracket with 0.0% of them unmarried.
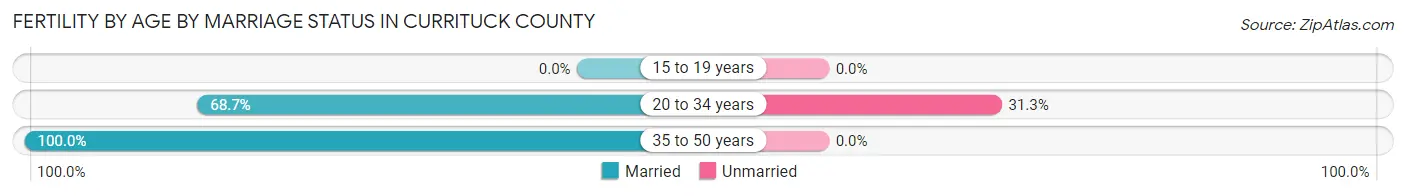
| Age Bracket | Married | Unmarried |
| 15 to 19 years | 0 (0.0%) | 0 (0.0%) |
| 20 to 34 years | 239 (68.7%) | 109 (31.3%) |
| 35 to 50 years | 18 (100.0%) | 0 (0.0%) |
| Total | 257 (70.2%) | 109 (29.8%) |
Fertility by Education in Currituck County
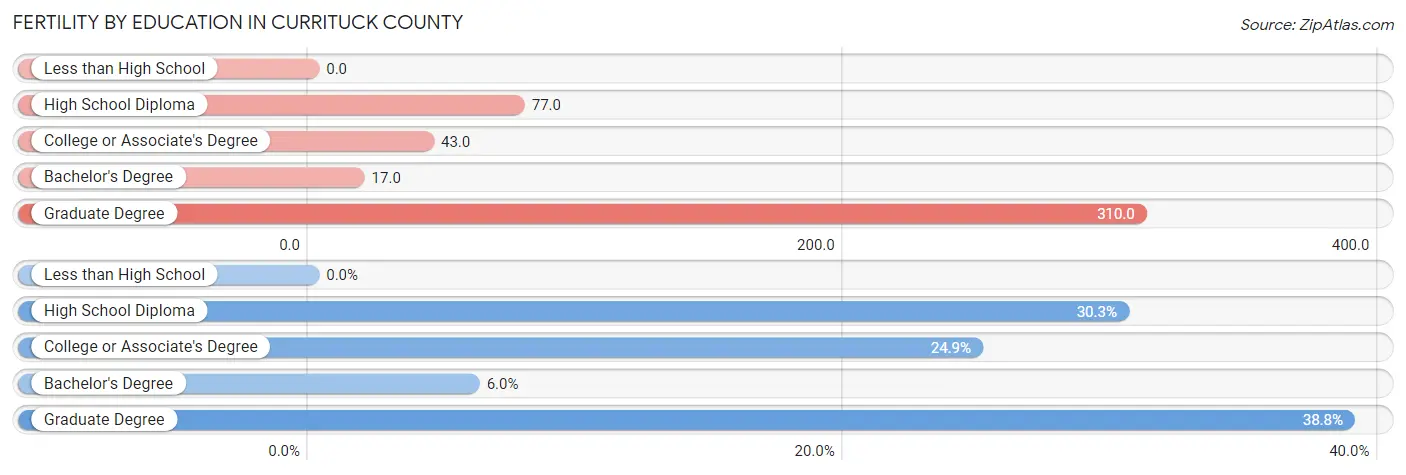
| Educational Attainment | Women with Births | Births / 1,000 Women |
| Less than High School | 0 (0.0%) | 0.0 |
| High School Diploma | 111 (30.3%) | 77.0 |
| College or Associate's Degree | 91 (24.9%) | 43.0 |
| Bachelor's Degree | 22 (6.0%) | 17.0 |
| Graduate Degree | 142 (38.8%) | 310.0 |
| Total | 366 (100.0%) | 60.0 |
Fertility by Education by Marriage Status in Currituck County
29.8% of women with births in Currituck County are unmarried. Women with the educational attainment of college or associate's degree are most likely to be married with 100.0% of them married at childbirth, while women with the educational attainment of high school diploma are least likely to be married with 91.0% of them unmarried at childbirth.
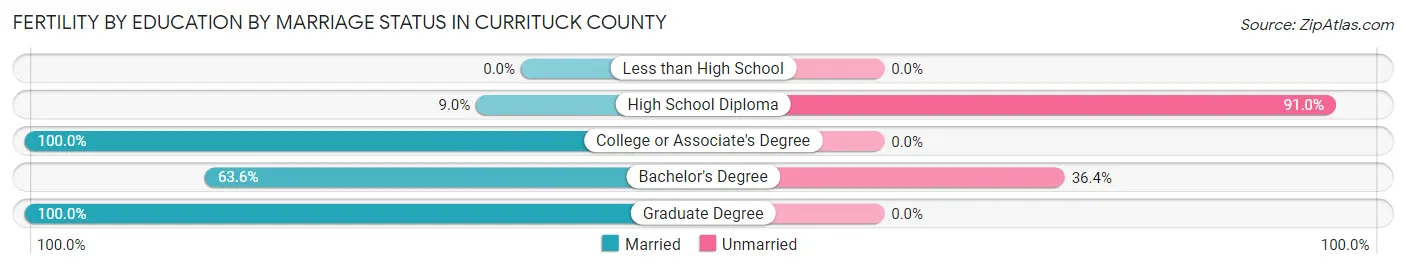
| Educational Attainment | Married | Unmarried |
| Less than High School | 0 (0.0%) | 0 (0.0%) |
| High School Diploma | 10 (9.0%) | 101 (91.0%) |
| College or Associate's Degree | 91 (100.0%) | 0 (0.0%) |
| Bachelor's Degree | 14 (63.6%) | 8 (36.4%) |
| Graduate Degree | 142 (100.0%) | 0 (0.0%) |
| Total | 257 (70.2%) | 109 (29.8%) |
Employment Characteristics in Currituck County
Employment by Class of Employer in Currituck County
Among the 14,296 employed individuals in Currituck County, private company employees (7,580 | 53.0%), local government employees (1,713 | 12.0%), and federal government employees (1,330 | 9.3%) make up the most common classes of employment.
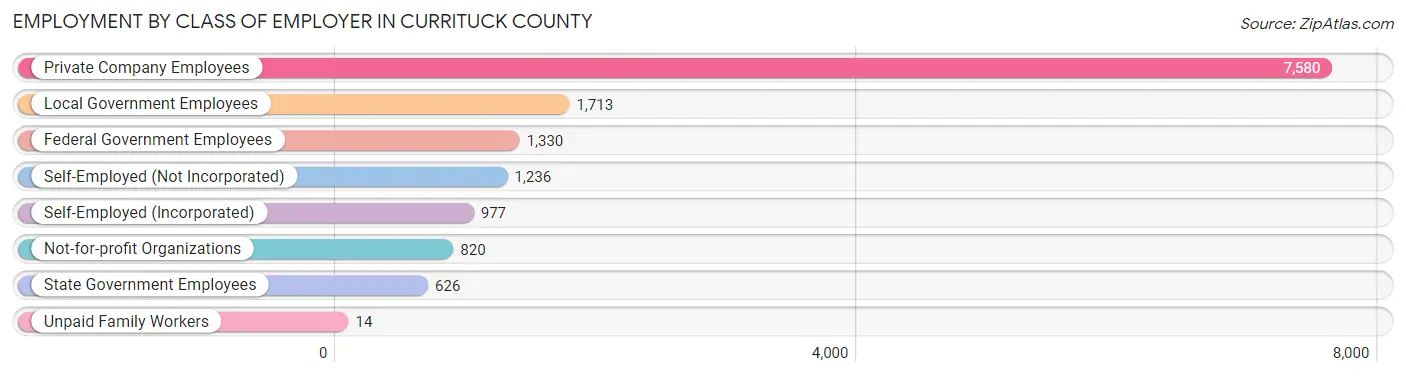
| Employer Class | # Employees | % Employees |
| Private Company Employees | 7,580 | 53.0% |
| Self-Employed (Incorporated) | 977 | 6.8% |
| Self-Employed (Not Incorporated) | 1,236 | 8.6% |
| Not-for-profit Organizations | 820 | 5.7% |
| Local Government Employees | 1,713 | 12.0% |
| State Government Employees | 626 | 4.4% |
| Federal Government Employees | 1,330 | 9.3% |
| Unpaid Family Workers | 14 | 0.1% |
| Total | 14,296 | 100.0% |
Employment Status by Age in Currituck County
According to the labor force statistics for Currituck County, out of the total population over 16 years of age (22,897), 65.3% or 14,952 individuals are in the labor force, with 3.2% or 478 of them unemployed. The age group with the highest labor force participation rate is 20 to 24 years, with 90.9% or 1,111 individuals in the labor force. Within the labor force, the 16 to 19 years age range has the highest percentage of unemployed individuals, with 20.6% or 78 of them being unemployed.
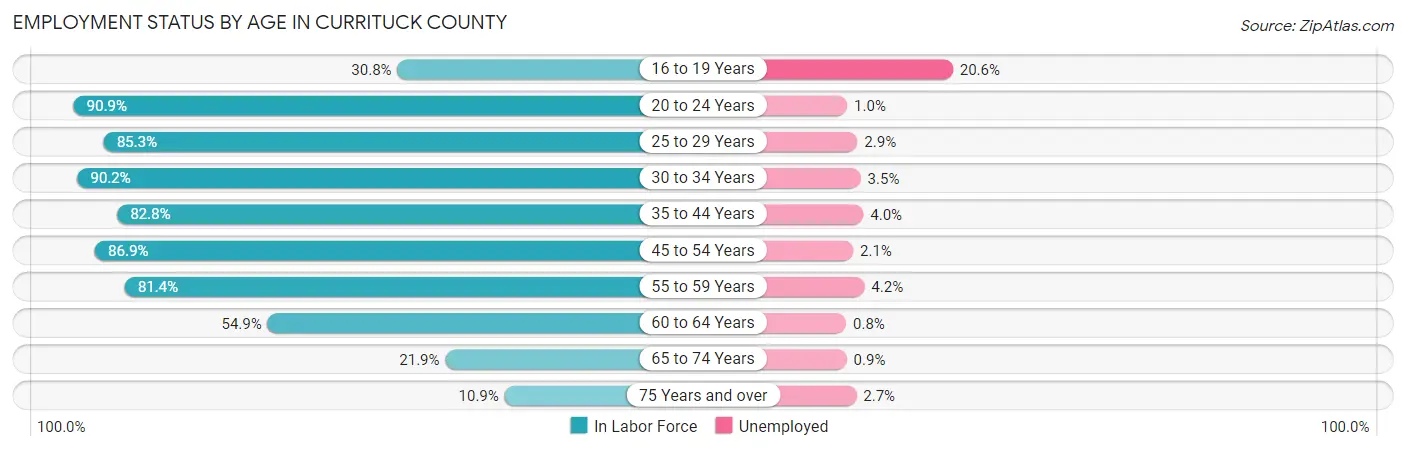
| Age Bracket | In Labor Force | Unemployed |
| 16 to 19 Years | 378 (30.8%) | 78 (20.6%) |
| 20 to 24 Years | 1,111 (90.9%) | 11 (1.0%) |
| 25 to 29 Years | 1,277 (85.3%) | 37 (2.9%) |
| 30 to 34 Years | 1,607 (90.2%) | 56 (3.5%) |
| 35 to 44 Years | 3,092 (82.8%) | 124 (4.0%) |
| 45 to 54 Years | 3,470 (86.9%) | 73 (2.1%) |
| 55 to 59 Years | 1,843 (81.4%) | 77 (4.2%) |
| 60 to 64 Years | 1,310 (54.9%) | 10 (0.8%) |
| 65 to 74 Years | 682 (21.9%) | 6 (0.9%) |
| 75 Years and over | 183 (10.9%) | 5 (2.7%) |
| Total | 14,952 (65.3%) | 478 (3.2%) |
Employment Status by Educational Attainment in Currituck County
According to labor force statistics for Currituck County, 80.5% of individuals (12,603) out of the total population between 25 and 64 years of age (15,656) are in the labor force, with 3.0% or 378 of them being unemployed. The group with the highest labor force participation rate are those with the educational attainment of bachelor's degree or higher, with 89.9% or 3,837 individuals in the labor force. Within the labor force, individuals with less than high school education have the highest percentage of unemployment, with 8.7% or 59 of them being unemployed.
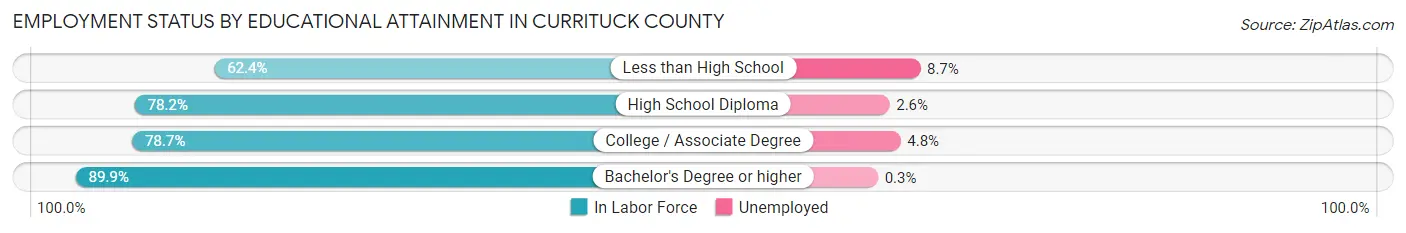
| Educational Attainment | In Labor Force | Unemployed |
| Less than High School | 677 (62.4%) | 94 (8.7%) |
| High School Diploma | 3,847 (78.2%) | 128 (2.6%) |
| College / Associate Degree | 4,236 (78.7%) | 258 (4.8%) |
| Bachelor's Degree or higher | 3,837 (89.9%) | 13 (0.3%) |
| Total | 12,603 (80.5%) | 470 (3.0%) |
Employment Occupations by Sex in Currituck County
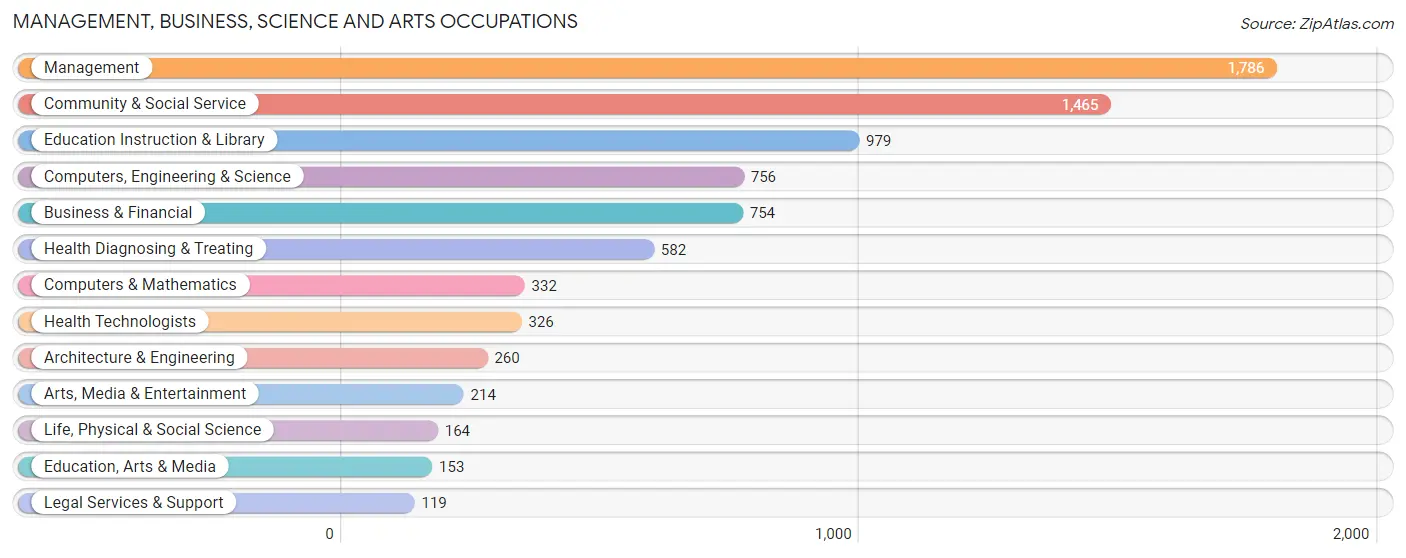
Management, Business, Science and Arts Occupations
The most common Management, Business, Science and Arts occupations in Currituck County are Management (1,786 | 12.7%), Community & Social Service (1,465 | 10.4%), Education Instruction & Library (979 | 6.9%), Computers, Engineering & Science (756 | 5.3%), and Business & Financial (754 | 5.3%).
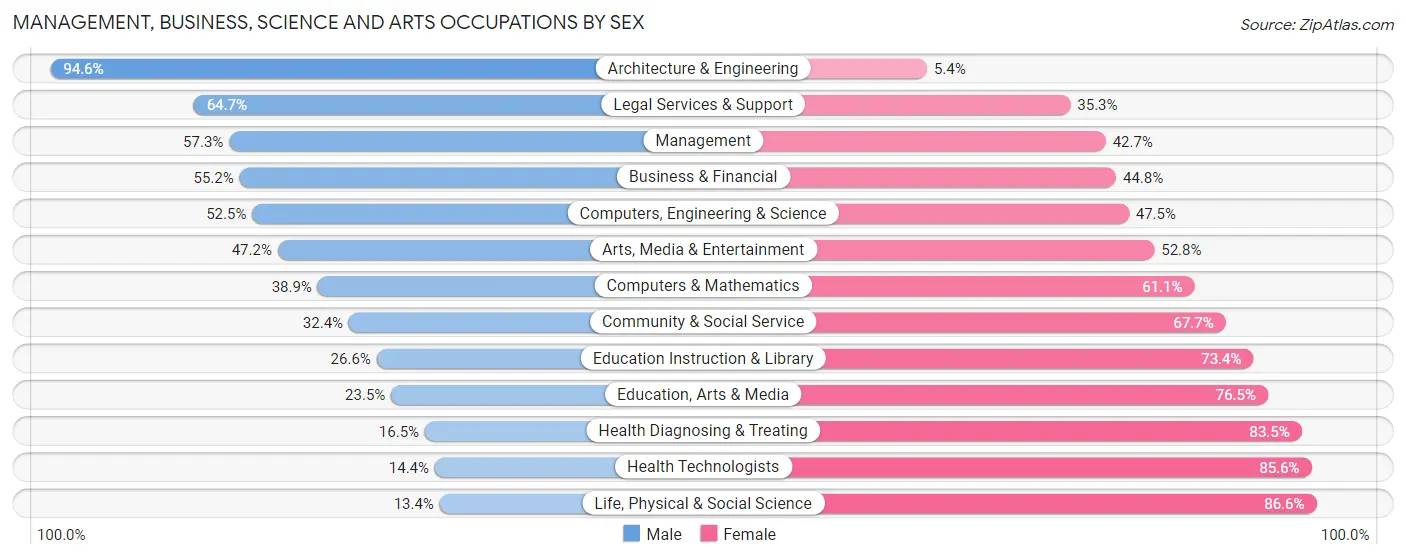
Management, Business, Science and Arts Occupations by Sex
Within the Management, Business, Science and Arts occupations in Currituck County, the most male-oriented occupations are Architecture & Engineering (94.6%), Legal Services & Support (64.7%), and Management (57.3%), while the most female-oriented occupations are Life, Physical & Social Science (86.6%), Health Technologists (85.6%), and Health Diagnosing & Treating (83.5%).
| Occupation | Male | Female |
| Management | 1,024 (57.3%) | 762 (42.7%) |
| Business & Financial | 416 (55.2%) | 338 (44.8%) |
| Computers, Engineering & Science | 397 (52.5%) | 359 (47.5%) |
| Computers & Mathematics | 129 (38.9%) | 203 (61.1%) |
| Architecture & Engineering | 246 (94.6%) | 14 (5.4%) |
| Life, Physical & Social Science | 22 (13.4%) | 142 (86.6%) |
| Community & Social Service | 474 (32.4%) | 991 (67.6%) |
| Education, Arts & Media | 36 (23.5%) | 117 (76.5%) |
| Legal Services & Support | 77 (64.7%) | 42 (35.3%) |
| Education Instruction & Library | 260 (26.6%) | 719 (73.4%) |
| Arts, Media & Entertainment | 101 (47.2%) | 113 (52.8%) |
| Health Diagnosing & Treating | 96 (16.5%) | 486 (83.5%) |
| Health Technologists | 47 (14.4%) | 279 (85.6%) |
| Total (Category) | 2,407 (45.1%) | 2,936 (54.9%) |
| Total (Overall) | 7,590 (53.7%) | 6,533 (46.3%) |
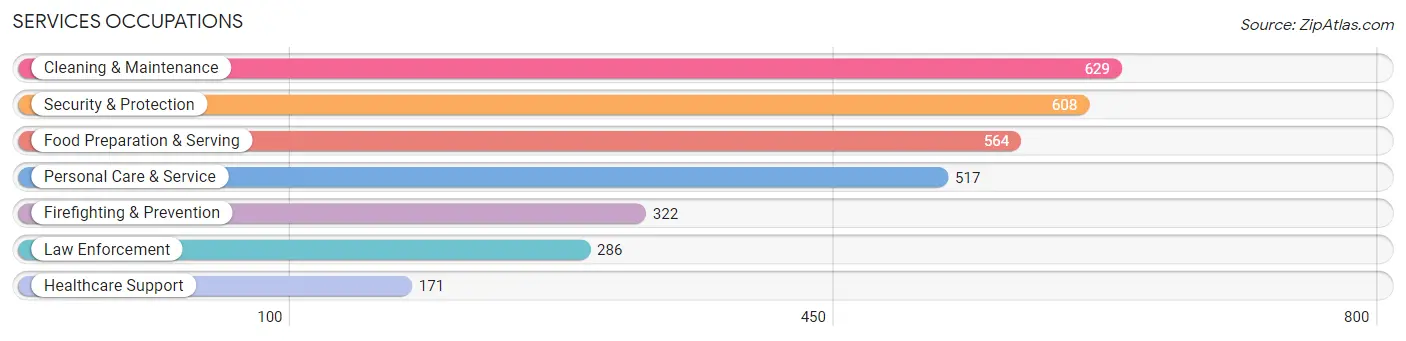
Services Occupations
The most common Services occupations in Currituck County are Cleaning & Maintenance (629 | 4.4%), Security & Protection (608 | 4.3%), Food Preparation & Serving (564 | 4.0%), Personal Care & Service (517 | 3.7%), and Firefighting & Prevention (322 | 2.3%).
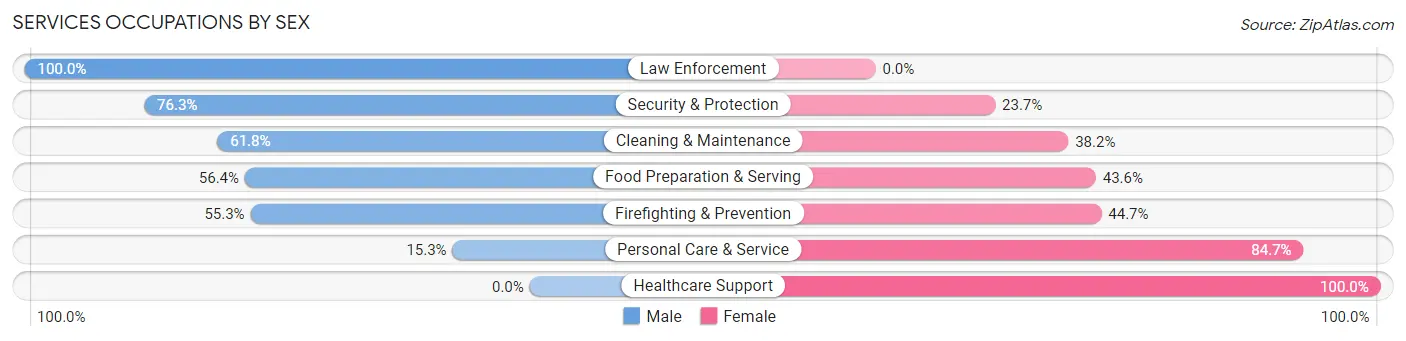
Services Occupations by Sex
Within the Services occupations in Currituck County, the most male-oriented occupations are Law Enforcement (100.0%), Security & Protection (76.3%), and Cleaning & Maintenance (61.8%), while the most female-oriented occupations are Healthcare Support (100.0%), Personal Care & Service (84.7%), and Firefighting & Prevention (44.7%).
| Occupation | Male | Female |
| Healthcare Support | 0 (0.0%) | 171 (100.0%) |
| Security & Protection | 464 (76.3%) | 144 (23.7%) |
| Firefighting & Prevention | 178 (55.3%) | 144 (44.7%) |
| Law Enforcement | 286 (100.0%) | 0 (0.0%) |
| Food Preparation & Serving | 318 (56.4%) | 246 (43.6%) |
| Cleaning & Maintenance | 389 (61.8%) | 240 (38.2%) |
| Personal Care & Service | 79 (15.3%) | 438 (84.7%) |
| Total (Category) | 1,250 (50.2%) | 1,239 (49.8%) |
| Total (Overall) | 7,590 (53.7%) | 6,533 (46.3%) |
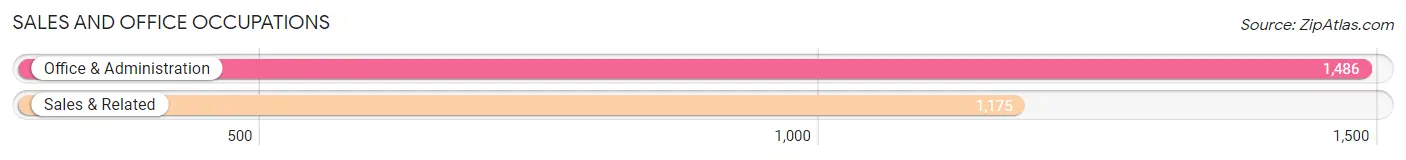
Sales and Office Occupations
The most common Sales and Office occupations in Currituck County are Office & Administration (1,486 | 10.5%), and Sales & Related (1,175 | 8.3%).
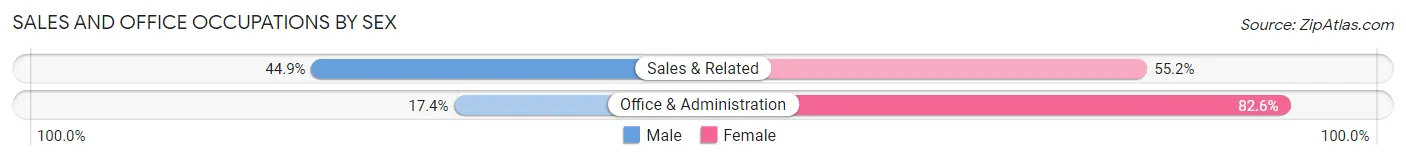
Sales and Office Occupations by Sex
| Occupation | Male | Female |
| Sales & Related | 527 (44.9%) | 648 (55.1%) |
| Office & Administration | 258 (17.4%) | 1,228 (82.6%) |
| Total (Category) | 785 (29.5%) | 1,876 (70.5%) |
| Total (Overall) | 7,590 (53.7%) | 6,533 (46.3%) |
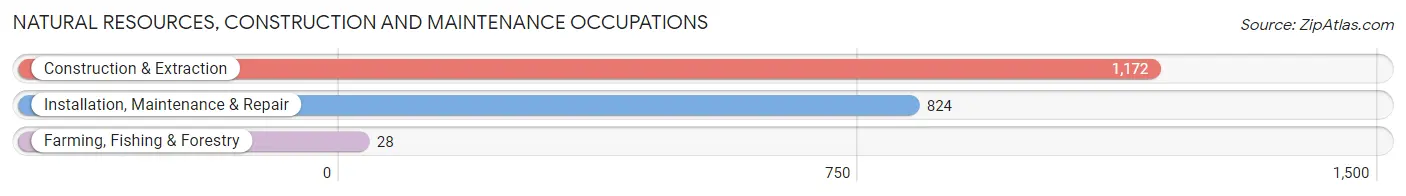
Natural Resources, Construction and Maintenance Occupations
The most common Natural Resources, Construction and Maintenance occupations in Currituck County are Construction & Extraction (1,172 | 8.3%), Installation, Maintenance & Repair (824 | 5.8%), and Farming, Fishing & Forestry (28 | 0.2%).
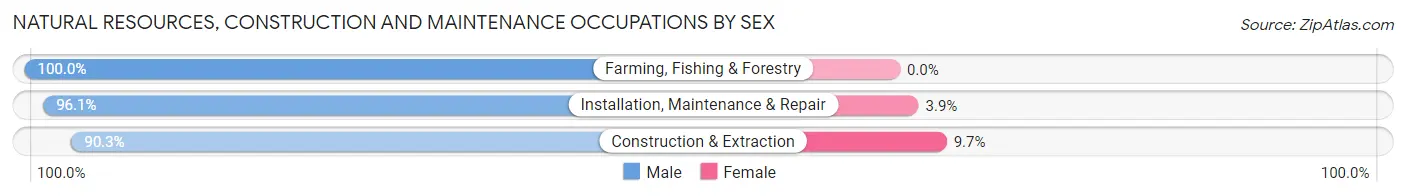
Natural Resources, Construction and Maintenance Occupations by Sex
| Occupation | Male | Female |
| Farming, Fishing & Forestry | 28 (100.0%) | 0 (0.0%) |
| Construction & Extraction | 1,058 (90.3%) | 114 (9.7%) |
| Installation, Maintenance & Repair | 792 (96.1%) | 32 (3.9%) |
| Total (Category) | 1,878 (92.8%) | 146 (7.2%) |
| Total (Overall) | 7,590 (53.7%) | 6,533 (46.3%) |
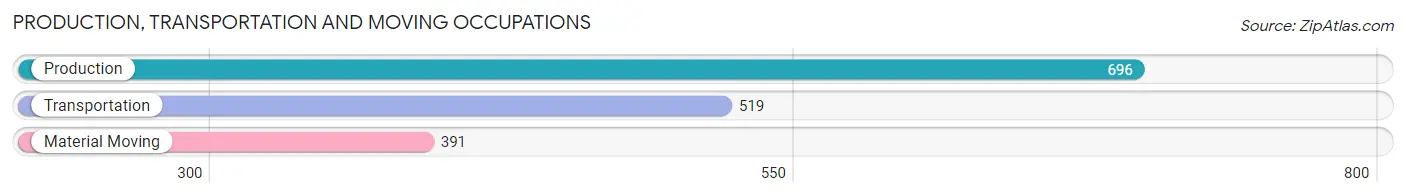
Production, Transportation and Moving Occupations
The most common Production, Transportation and Moving occupations in Currituck County are Production (696 | 4.9%), Transportation (519 | 3.7%), and Material Moving (391 | 2.8%).
Production, Transportation and Moving Occupations by Sex
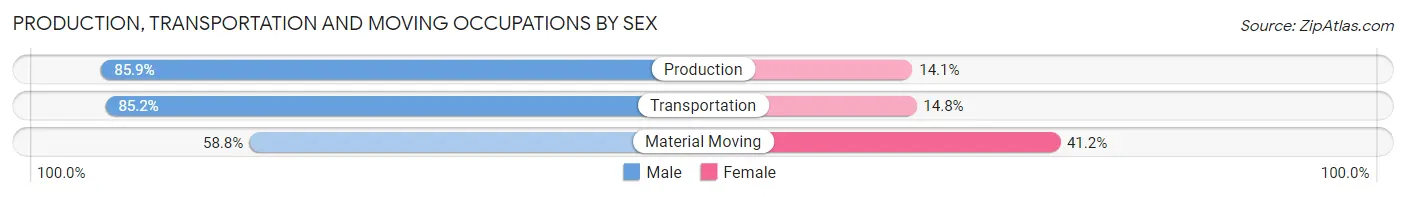
| Occupation | Male | Female |
| Production | 598 (85.9%) | 98 (14.1%) |
| Transportation | 442 (85.2%) | 77 (14.8%) |
| Material Moving | 230 (58.8%) | 161 (41.2%) |
| Total (Category) | 1,270 (79.1%) | 336 (20.9%) |
| Total (Overall) | 7,590 (53.7%) | 6,533 (46.3%) |
Employment Industries by Sex in Currituck County
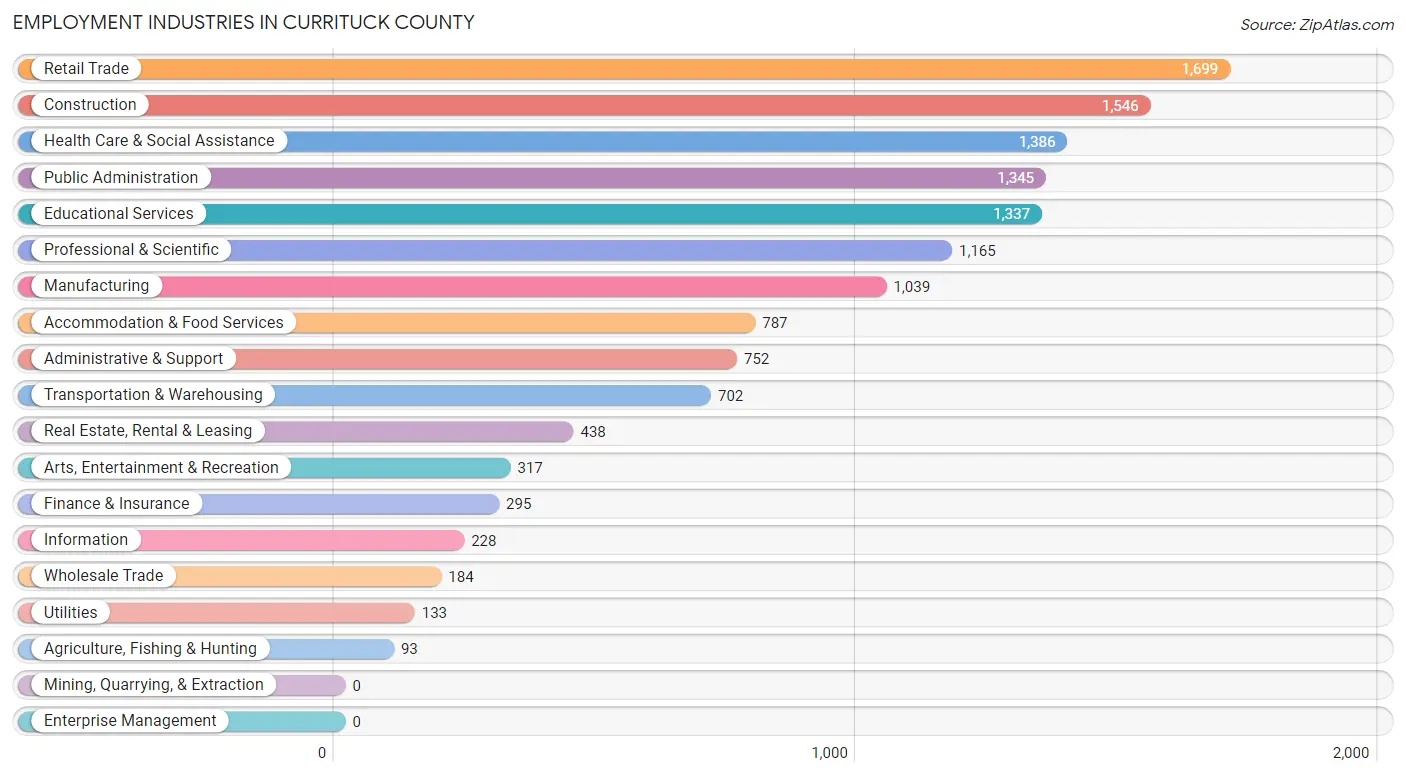
Employment Industries in Currituck County
The major employment industries in Currituck County include Retail Trade (1,699 | 12.0%), Construction (1,546 | 11.0%), Health Care & Social Assistance (1,386 | 9.8%), Public Administration (1,345 | 9.5%), and Educational Services (1,337 | 9.5%).
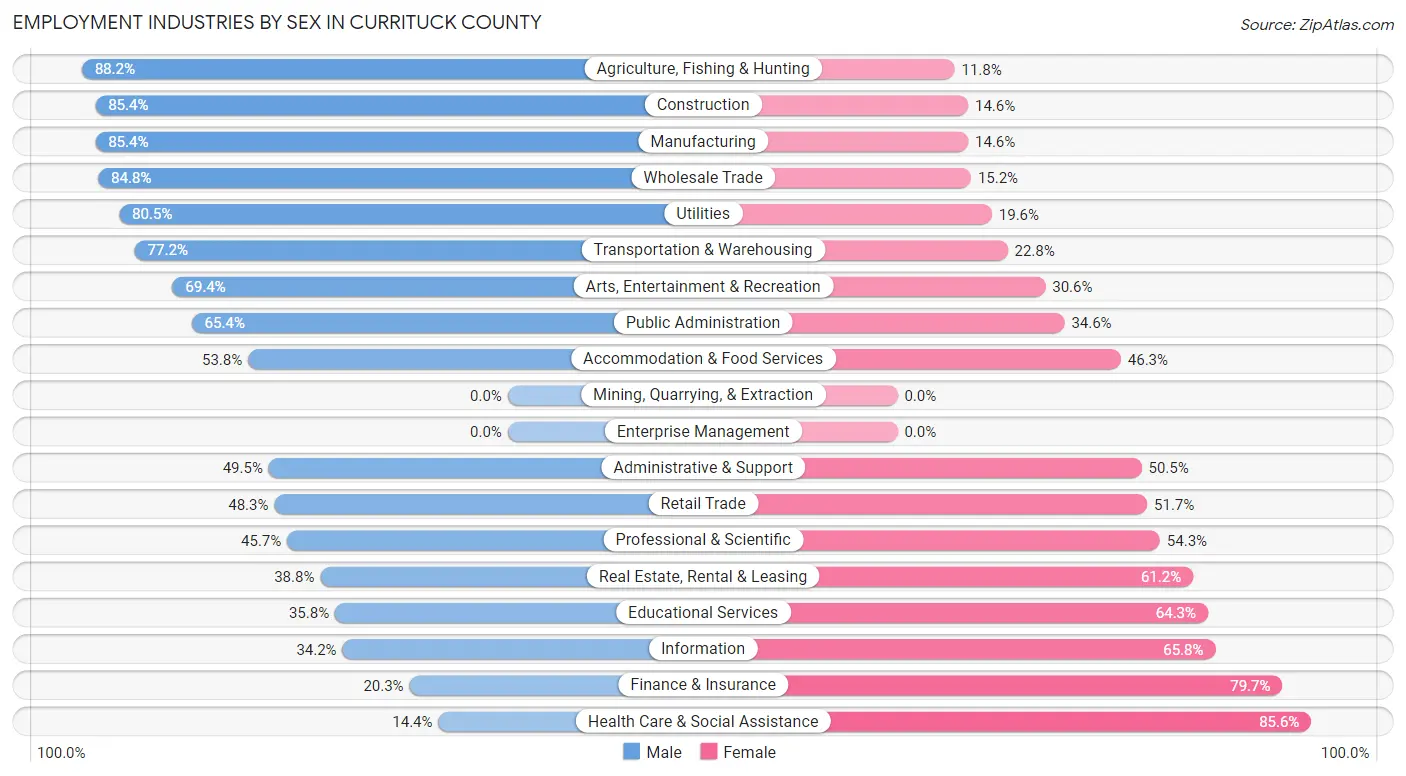
Employment Industries by Sex in Currituck County
The Currituck County industries that see more men than women are Agriculture, Fishing & Hunting (88.2%), Construction (85.4%), and Manufacturing (85.4%), whereas the industries that tend to have a higher number of women are Health Care & Social Assistance (85.6%), Finance & Insurance (79.7%), and Information (65.8%).
| Industry | Male | Female |
| Agriculture, Fishing & Hunting | 82 (88.2%) | 11 (11.8%) |
| Mining, Quarrying, & Extraction | 0 (0.0%) | 0 (0.0%) |
| Construction | 1,320 (85.4%) | 226 (14.6%) |
| Manufacturing | 887 (85.4%) | 152 (14.6%) |
| Wholesale Trade | 156 (84.8%) | 28 (15.2%) |
| Retail Trade | 821 (48.3%) | 878 (51.7%) |
| Transportation & Warehousing | 542 (77.2%) | 160 (22.8%) |
| Utilities | 107 (80.4%) | 26 (19.6%) |
| Information | 78 (34.2%) | 150 (65.8%) |
| Finance & Insurance | 60 (20.3%) | 235 (79.7%) |
| Real Estate, Rental & Leasing | 170 (38.8%) | 268 (61.2%) |
| Professional & Scientific | 532 (45.7%) | 633 (54.3%) |
| Enterprise Management | 0 (0.0%) | 0 (0.0%) |
| Administrative & Support | 372 (49.5%) | 380 (50.5%) |
| Educational Services | 478 (35.7%) | 859 (64.2%) |
| Health Care & Social Assistance | 199 (14.4%) | 1,187 (85.6%) |
| Arts, Entertainment & Recreation | 220 (69.4%) | 97 (30.6%) |
| Accommodation & Food Services | 423 (53.7%) | 364 (46.3%) |
| Public Administration | 880 (65.4%) | 465 (34.6%) |
| Total | 7,590 (53.7%) | 6,533 (46.3%) |
Education in Currituck County
School Enrollment in Currituck County
The most common levels of schooling among the 6,678 students in Currituck County are high school (1,500 | 22.5%), elementary school (1,378 | 20.6%), and middle school (1,339 | 20.1%).
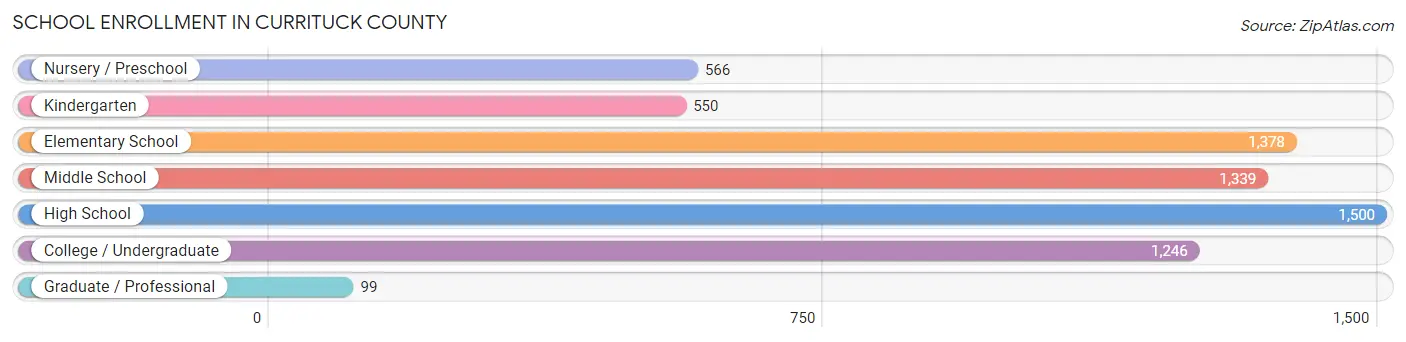
| School Level | # Students | % Students |
| Nursery / Preschool | 566 | 8.5% |
| Kindergarten | 550 | 8.2% |
| Elementary School | 1,378 | 20.6% |
| Middle School | 1,339 | 20.1% |
| High School | 1,500 | 22.5% |
| College / Undergraduate | 1,246 | 18.7% |
| Graduate / Professional | 99 | 1.5% |
| Total | 6,678 | 100.0% |
School Enrollment by Age by Funding Source in Currituck County
Out of a total of 6,678 students who are enrolled in schools in Currituck County, 875 (13.1%) attend a private institution, while the remaining 5,803 (86.9%) are enrolled in public schools. The age group of 25 to 34 year olds has the highest likelihood of being enrolled in private schools, with 87 (29.5% in the age bracket) enrolled. Conversely, the age group of 10 to 14 year olds has the lowest likelihood of being enrolled in a private school, with 1,666 (93.4% in the age bracket) attending a public institution.
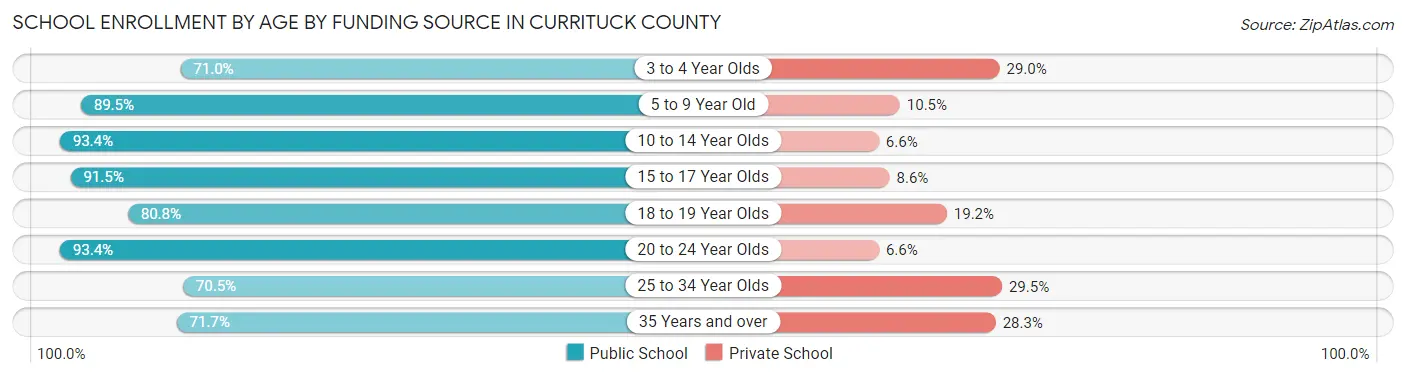
| Age Bracket | Public School | Private School |
| 3 to 4 Year Olds | 335 (71.0%) | 137 (29.0%) |
| 5 to 9 Year Old | 1,573 (89.5%) | 184 (10.5%) |
| 10 to 14 Year Olds | 1,666 (93.4%) | 117 (6.6%) |
| 15 to 17 Year Olds | 1,027 (91.4%) | 96 (8.6%) |
| 18 to 19 Year Olds | 416 (80.8%) | 99 (19.2%) |
| 20 to 24 Year Olds | 213 (93.4%) | 15 (6.6%) |
| 25 to 34 Year Olds | 208 (70.5%) | 87 (29.5%) |
| 35 Years and over | 362 (71.7%) | 143 (28.3%) |
| Total | 5,803 (86.9%) | 875 (13.1%) |
Educational Attainment by Field of Study in Currituck County
Business (1,250 | 21.4%), education (937 | 16.0%), science & technology (744 | 12.7%), social sciences (514 | 8.8%), and arts & humanities (435 | 7.4%) are the most common fields of study among 5,850 individuals in Currituck County who have obtained a bachelor's degree or higher.
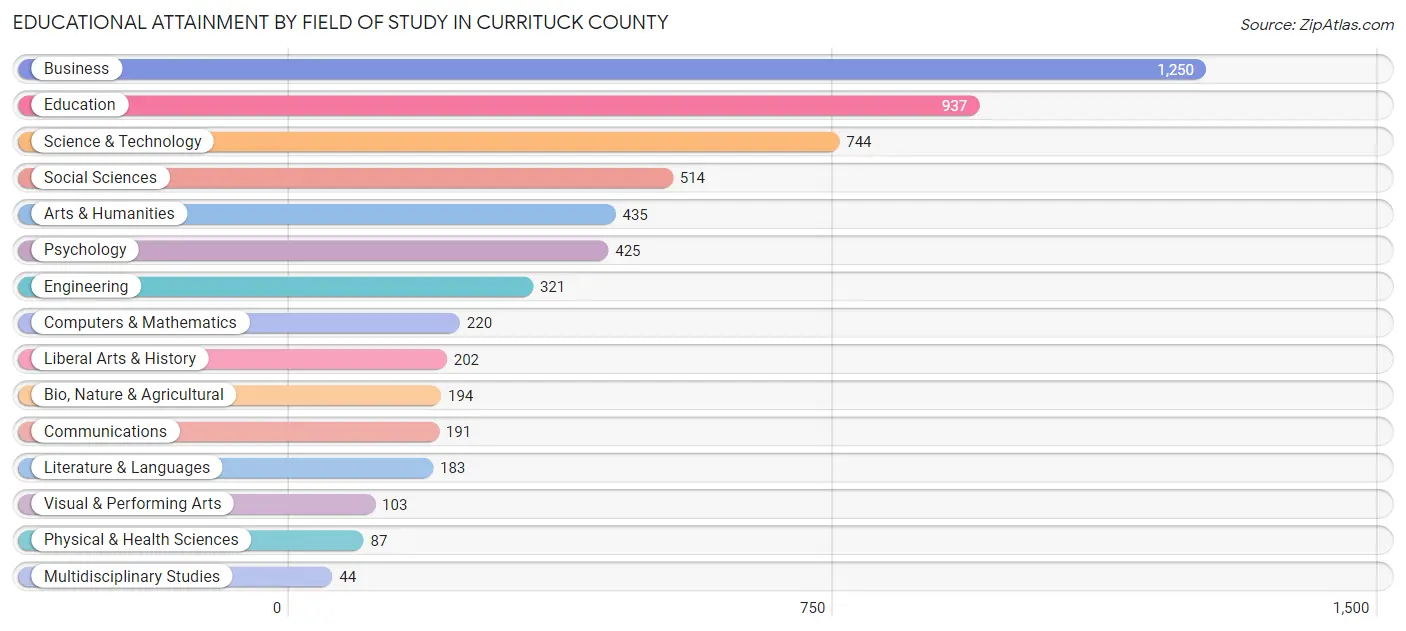
| Field of Study | # Graduates | % Graduates |
| Computers & Mathematics | 220 | 3.8% |
| Bio, Nature & Agricultural | 194 | 3.3% |
| Physical & Health Sciences | 87 | 1.5% |
| Psychology | 425 | 7.3% |
| Social Sciences | 514 | 8.8% |
| Engineering | 321 | 5.5% |
| Multidisciplinary Studies | 44 | 0.7% |
| Science & Technology | 744 | 12.7% |
| Business | 1,250 | 21.4% |
| Education | 937 | 16.0% |
| Literature & Languages | 183 | 3.1% |
| Liberal Arts & History | 202 | 3.5% |
| Visual & Performing Arts | 103 | 1.8% |
| Communications | 191 | 3.3% |
| Arts & Humanities | 435 | 7.4% |
| Total | 5,850 | 100.0% |
Transportation & Commute in Currituck County
Vehicle Availability by Sex in Currituck County
The most prevalent vehicle ownership categories in Currituck County are males with 2 vehicles (2,670, accounting for 34.0%) and females with 2 vehicles (1,943, making up 41.5%).
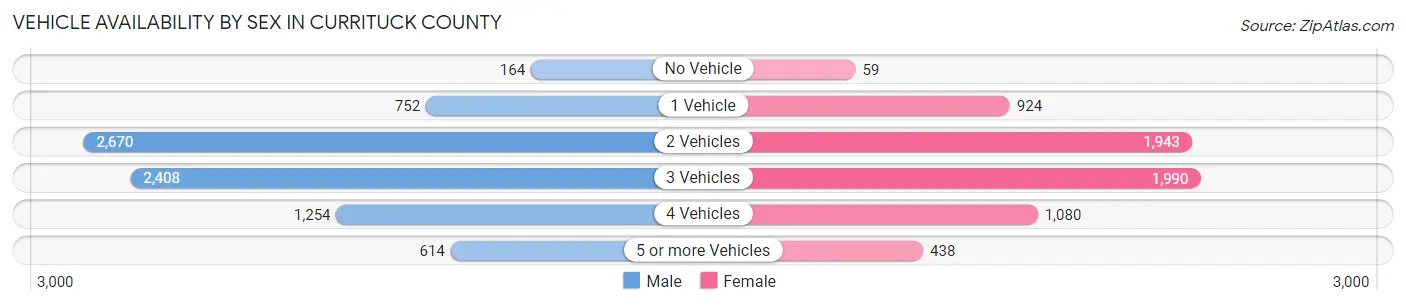
| Vehicles Available | Male | Female |
| No Vehicle | 164 (2.1%) | 59 (0.9%) |
| 1 Vehicle | 752 (9.6%) | 924 (14.4%) |
| 2 Vehicles | 2,670 (34.0%) | 1,943 (30.2%) |
| 3 Vehicles | 2,408 (30.6%) | 1,990 (30.9%) |
| 4 Vehicles | 1,254 (16.0%) | 1,080 (16.8%) |
| 5 or more Vehicles | 614 (7.8%) | 438 (6.8%) |
| Total | 7,862 (100.0%) | 6,434 (100.0%) |
Commute Time in Currituck County
The most frequently occuring commute durations in Currituck County are 45 to 59 minutes (2,649 commuters, 20.0%), 30 to 34 minutes (1,669 commuters, 12.6%), and 60 to 89 minutes (1,509 commuters, 11.4%).
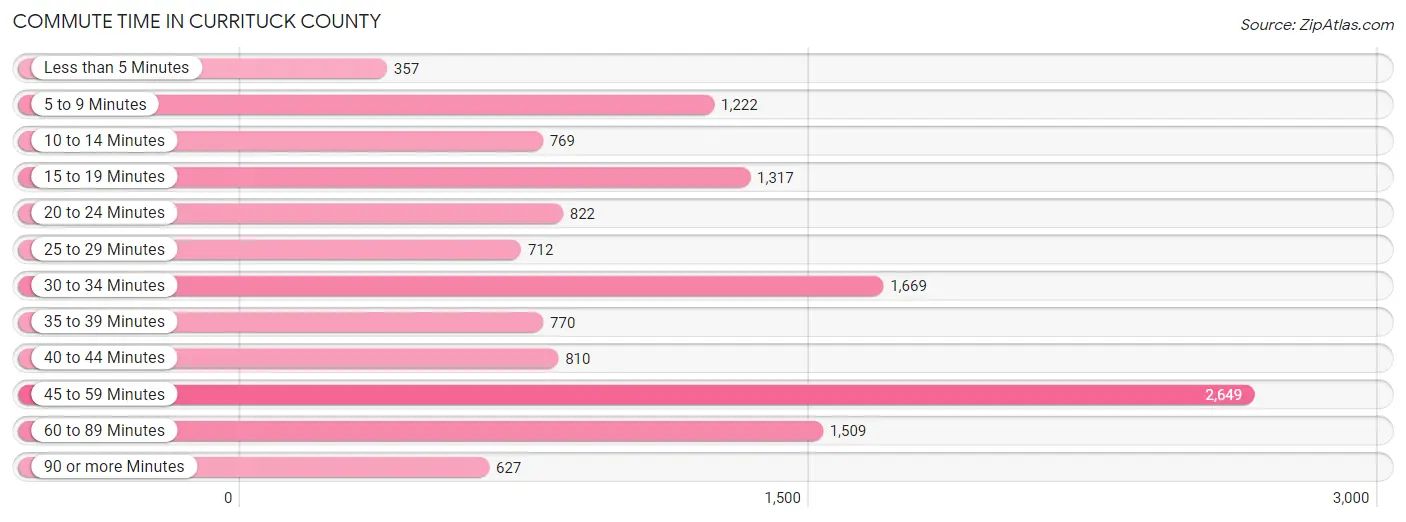
| Commute Time | # Commuters | % Commuters |
| Less than 5 Minutes | 357 | 2.7% |
| 5 to 9 Minutes | 1,222 | 9.2% |
| 10 to 14 Minutes | 769 | 5.8% |
| 15 to 19 Minutes | 1,317 | 10.0% |
| 20 to 24 Minutes | 822 | 6.2% |
| 25 to 29 Minutes | 712 | 5.4% |
| 30 to 34 Minutes | 1,669 | 12.6% |
| 35 to 39 Minutes | 770 | 5.8% |
| 40 to 44 Minutes | 810 | 6.1% |
| 45 to 59 Minutes | 2,649 | 20.0% |
| 60 to 89 Minutes | 1,509 | 11.4% |
| 90 or more Minutes | 627 | 4.7% |
Commute Time by Sex in Currituck County
The most common commute times in Currituck County are 45 to 59 minutes (1,573 commuters, 21.4%) for males and 45 to 59 minutes (1,076 commuters, 18.2%) for females.
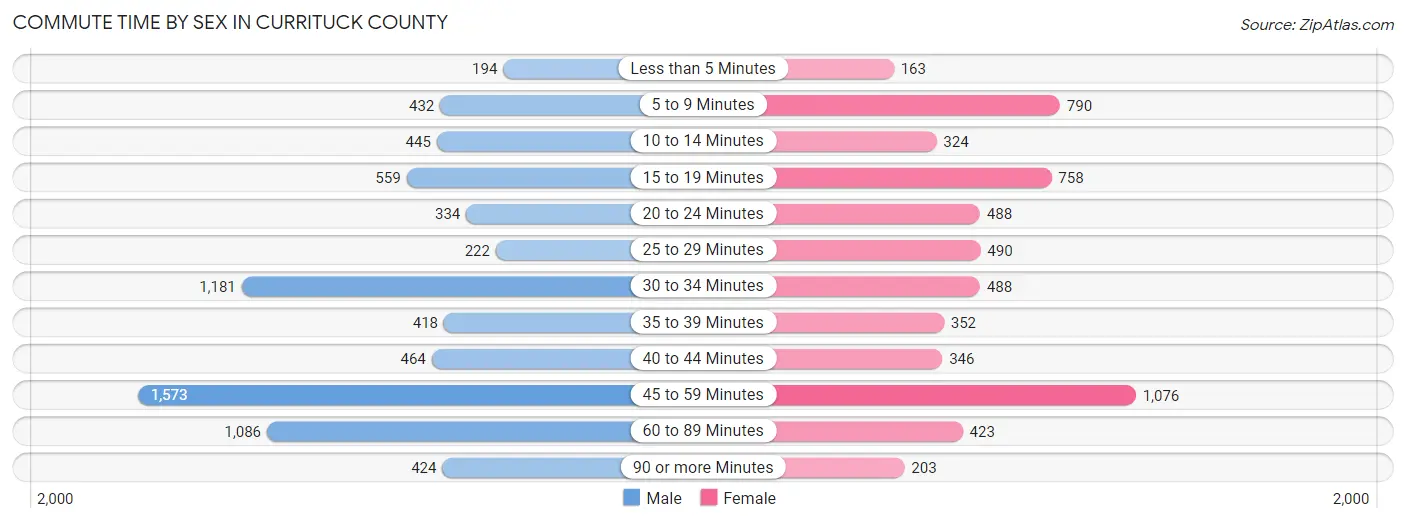
| Commute Time | Male | Female |
| Less than 5 Minutes | 194 (2.6%) | 163 (2.8%) |
| 5 to 9 Minutes | 432 (5.9%) | 790 (13.4%) |
| 10 to 14 Minutes | 445 (6.1%) | 324 (5.5%) |
| 15 to 19 Minutes | 559 (7.6%) | 758 (12.9%) |
| 20 to 24 Minutes | 334 (4.6%) | 488 (8.3%) |
| 25 to 29 Minutes | 222 (3.0%) | 490 (8.3%) |
| 30 to 34 Minutes | 1,181 (16.1%) | 488 (8.3%) |
| 35 to 39 Minutes | 418 (5.7%) | 352 (6.0%) |
| 40 to 44 Minutes | 464 (6.3%) | 346 (5.9%) |
| 45 to 59 Minutes | 1,573 (21.4%) | 1,076 (18.2%) |
| 60 to 89 Minutes | 1,086 (14.8%) | 423 (7.2%) |
| 90 or more Minutes | 424 (5.8%) | 203 (3.4%) |
Time of Departure to Work by Sex in Currituck County
The most frequent times of departure to work in Currituck County are 7:00 AM to 7:29 AM (1,216, 16.6%) for males and 7:30 AM to 7:59 AM (1,277, 21.6%) for females.
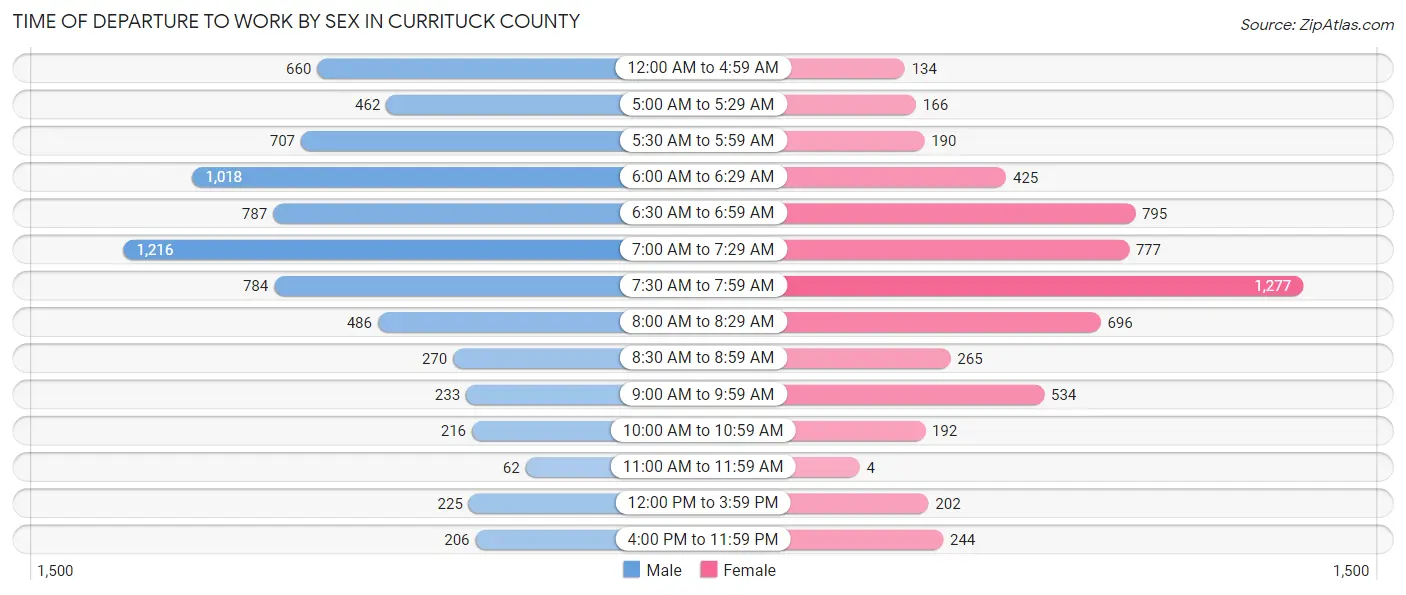
| Time of Departure | Male | Female |
| 12:00 AM to 4:59 AM | 660 (9.0%) | 134 (2.3%) |
| 5:00 AM to 5:29 AM | 462 (6.3%) | 166 (2.8%) |
| 5:30 AM to 5:59 AM | 707 (9.6%) | 190 (3.2%) |
| 6:00 AM to 6:29 AM | 1,018 (13.9%) | 425 (7.2%) |
| 6:30 AM to 6:59 AM | 787 (10.7%) | 795 (13.5%) |
| 7:00 AM to 7:29 AM | 1,216 (16.6%) | 777 (13.2%) |
| 7:30 AM to 7:59 AM | 784 (10.7%) | 1,277 (21.6%) |
| 8:00 AM to 8:29 AM | 486 (6.6%) | 696 (11.8%) |
| 8:30 AM to 8:59 AM | 270 (3.7%) | 265 (4.5%) |
| 9:00 AM to 9:59 AM | 233 (3.2%) | 534 (9.0%) |
| 10:00 AM to 10:59 AM | 216 (2.9%) | 192 (3.3%) |
| 11:00 AM to 11:59 AM | 62 (0.9%) | 4 (0.1%) |
| 12:00 PM to 3:59 PM | 225 (3.1%) | 202 (3.4%) |
| 4:00 PM to 11:59 PM | 206 (2.8%) | 244 (4.1%) |
| Total | 7,332 (100.0%) | 5,901 (100.0%) |
Housing Occupancy in Currituck County
Occupancy by Ownership in Currituck County
Of the total 11,108 dwellings in Currituck County, owner-occupied units account for 9,720 (87.5%), while renter-occupied units make up 1,388 (12.5%).
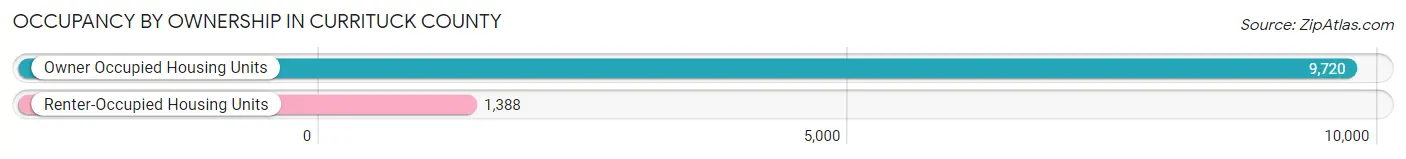
| Occupancy | # Housing Units | % Housing Units |
| Owner Occupied Housing Units | 9,720 | 87.5% |
| Renter-Occupied Housing Units | 1,388 | 12.5% |
| Total Occupied Housing Units | 11,108 | 100.0% |
Occupancy by Household Size in Currituck County
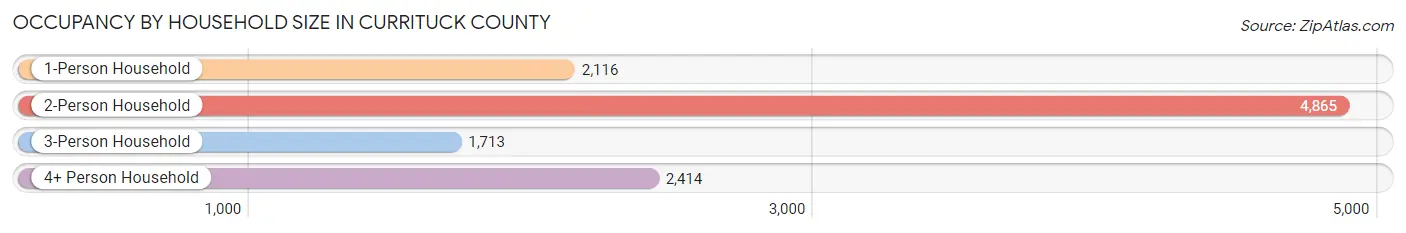
| Household Size | # Housing Units | % Housing Units |
| 1-Person Household | 2,116 | 19.1% |
| 2-Person Household | 4,865 | 43.8% |
| 3-Person Household | 1,713 | 15.4% |
| 4+ Person Household | 2,414 | 21.7% |
| Total Housing Units | 11,108 | 100.0% |
Occupancy by Ownership by Household Size in Currituck County
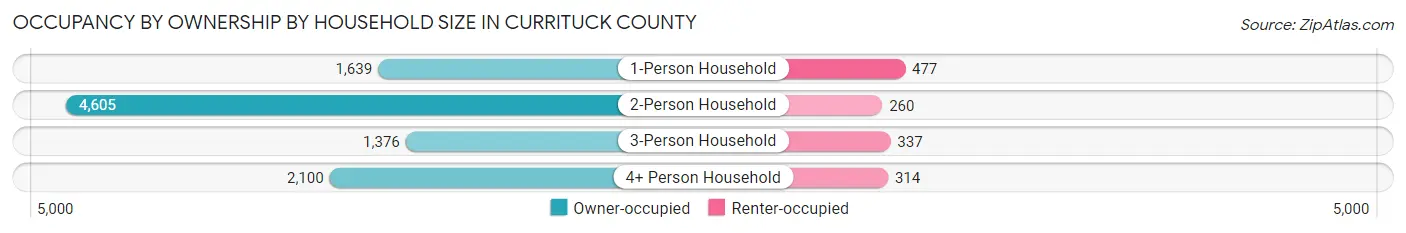
| Household Size | Owner-occupied | Renter-occupied |
| 1-Person Household | 1,639 (77.5%) | 477 (22.5%) |
| 2-Person Household | 4,605 (94.7%) | 260 (5.3%) |
| 3-Person Household | 1,376 (80.3%) | 337 (19.7%) |
| 4+ Person Household | 2,100 (87.0%) | 314 (13.0%) |
| Total Housing Units | 9,720 (87.5%) | 1,388 (12.5%) |
Occupancy by Educational Attainment in Currituck County
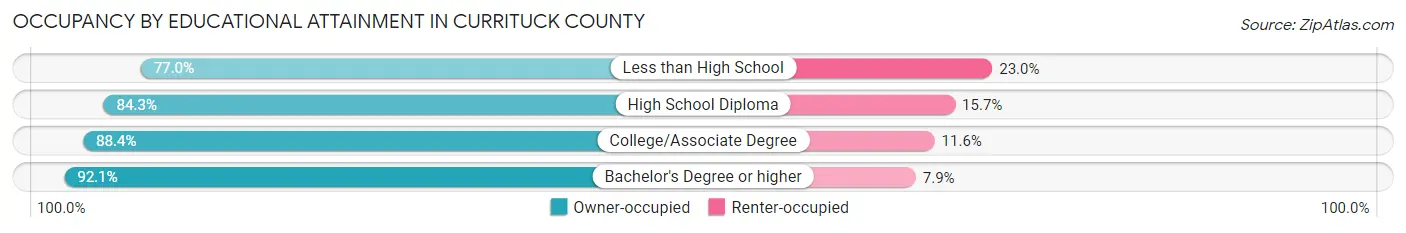
| Household Size | Owner-occupied | Renter-occupied |
| Less than High School | 538 (77.0%) | 161 (23.0%) |
| High School Diploma | 2,785 (84.3%) | 517 (15.7%) |
| College/Associate Degree | 3,574 (88.4%) | 469 (11.6%) |
| Bachelor's Degree or higher | 2,823 (92.1%) | 241 (7.9%) |
Occupancy by Age of Householder in Currituck County
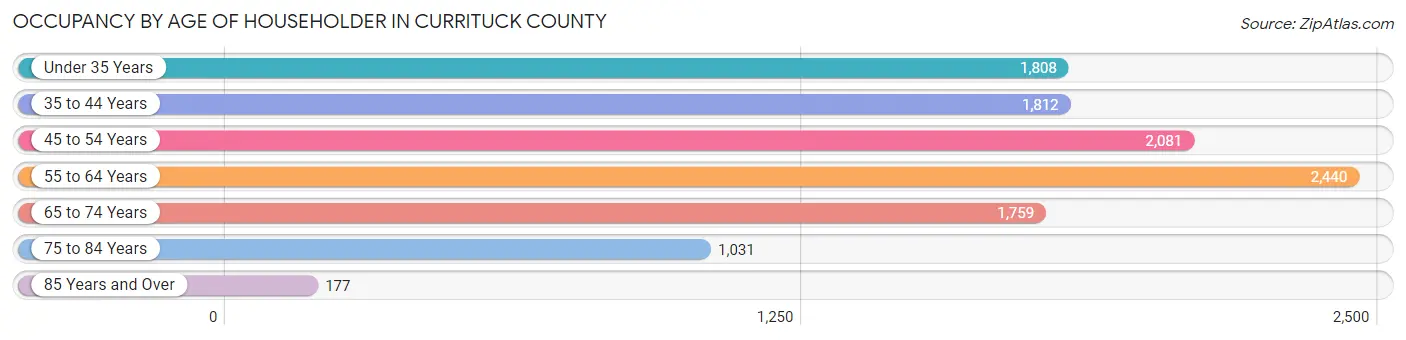
| Age Bracket | # Households | % Households |
| Under 35 Years | 1,808 | 16.3% |
| 35 to 44 Years | 1,812 | 16.3% |
| 45 to 54 Years | 2,081 | 18.7% |
| 55 to 64 Years | 2,440 | 22.0% |
| 65 to 74 Years | 1,759 | 15.8% |
| 75 to 84 Years | 1,031 | 9.3% |
| 85 Years and Over | 177 | 1.6% |
| Total | 11,108 | 100.0% |
Housing Finances in Currituck County
Median Income by Occupancy in Currituck County
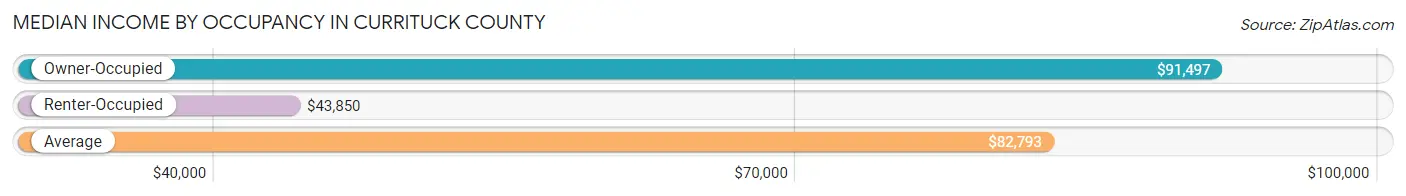
| Occupancy Type | # Households | Median Income |
| Owner-Occupied | 9,720 (87.5%) | $91,497 |
| Renter-Occupied | 1,388 (12.5%) | $43,850 |
| Average | 11,108 (100.0%) | $82,793 |
Occupancy by Householder Income Bracket in Currituck County
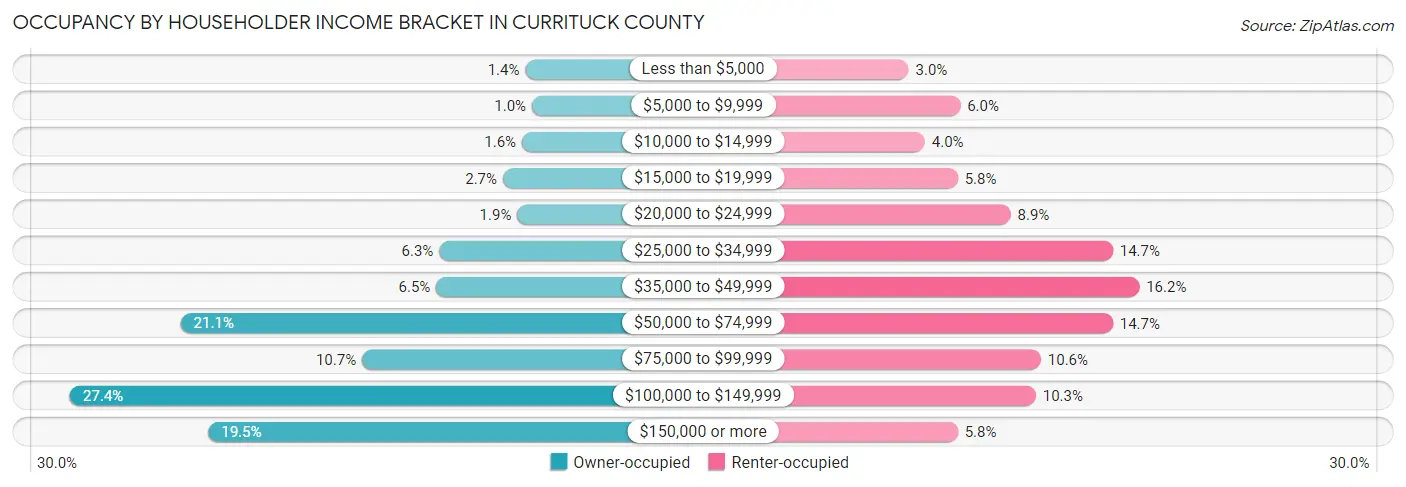
| Income Bracket | Owner-occupied | Renter-occupied |
| Less than $5,000 | 135 (1.4%) | 42 (3.0%) |
| $5,000 to $9,999 | 98 (1.0%) | 83 (6.0%) |
| $10,000 to $14,999 | 154 (1.6%) | 55 (4.0%) |
| $15,000 to $19,999 | 260 (2.7%) | 81 (5.8%) |
| $20,000 to $24,999 | 180 (1.8%) | 123 (8.9%) |
| $25,000 to $34,999 | 613 (6.3%) | 204 (14.7%) |
| $35,000 to $49,999 | 630 (6.5%) | 225 (16.2%) |
| $50,000 to $74,999 | 2,049 (21.1%) | 204 (14.7%) |
| $75,000 to $99,999 | 1,042 (10.7%) | 147 (10.6%) |
| $100,000 to $149,999 | 2,664 (27.4%) | 143 (10.3%) |
| $150,000 or more | 1,895 (19.5%) | 81 (5.8%) |
| Total | 9,720 (100.0%) | 1,388 (100.0%) |
Monthly Housing Cost Tiers in Currituck County
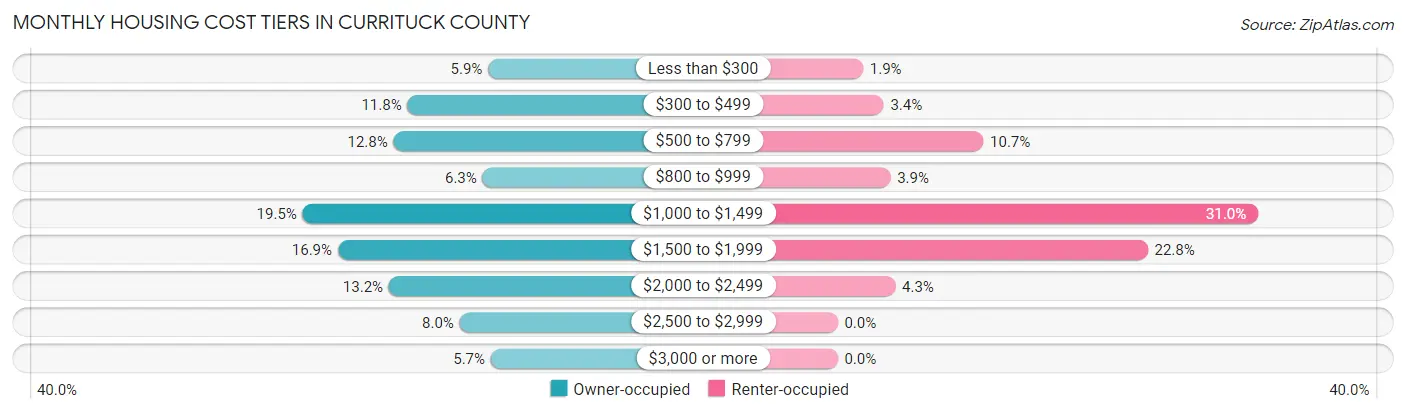
| Monthly Cost | Owner-occupied | Renter-occupied |
| Less than $300 | 570 (5.9%) | 26 (1.9%) |
| $300 to $499 | 1,147 (11.8%) | 47 (3.4%) |
| $500 to $799 | 1,247 (12.8%) | 149 (10.7%) |
| $800 to $999 | 609 (6.3%) | 54 (3.9%) |
| $1,000 to $1,499 | 1,897 (19.5%) | 430 (31.0%) |
| $1,500 to $1,999 | 1,646 (16.9%) | 317 (22.8%) |
| $2,000 to $2,499 | 1,280 (13.2%) | 59 (4.3%) |
| $2,500 to $2,999 | 774 (8.0%) | 0 (0.0%) |
| $3,000 or more | 550 (5.7%) | 0 (0.0%) |
| Total | 9,720 (100.0%) | 1,388 (100.0%) |
Physical Housing Characteristics in Currituck County
Housing Structures in Currituck County
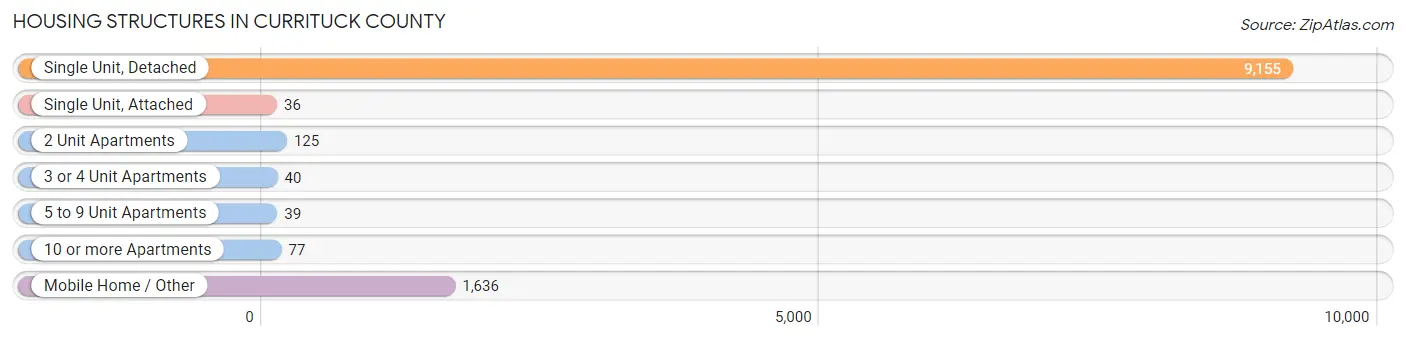
| Structure Type | # Housing Units | % Housing Units |
| Single Unit, Detached | 9,155 | 82.4% |
| Single Unit, Attached | 36 | 0.3% |
| 2 Unit Apartments | 125 | 1.1% |
| 3 or 4 Unit Apartments | 40 | 0.4% |
| 5 to 9 Unit Apartments | 39 | 0.4% |
| 10 or more Apartments | 77 | 0.7% |
| Mobile Home / Other | 1,636 | 14.7% |
| Total | 11,108 | 100.0% |
Housing Structures by Occupancy in Currituck County
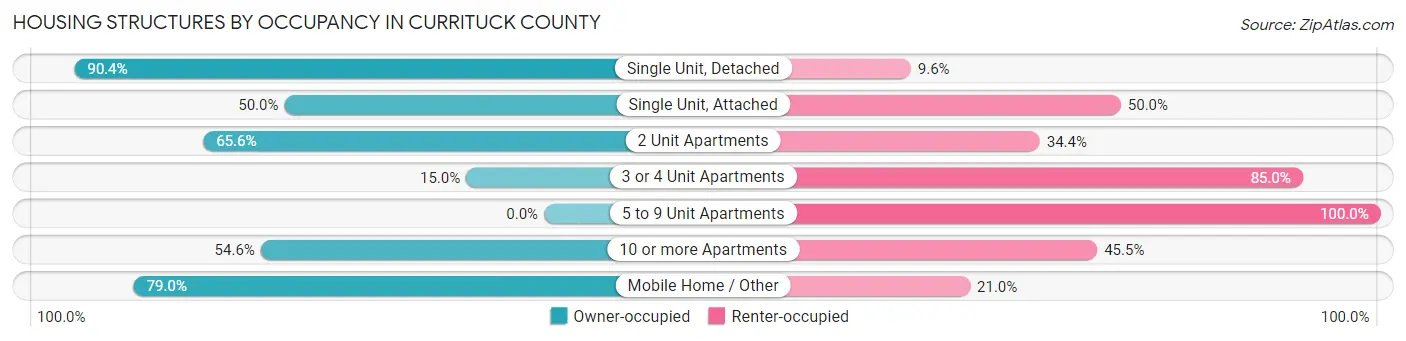
| Structure Type | Owner-occupied | Renter-occupied |
| Single Unit, Detached | 8,279 (90.4%) | 876 (9.6%) |
| Single Unit, Attached | 18 (50.0%) | 18 (50.0%) |
| 2 Unit Apartments | 82 (65.6%) | 43 (34.4%) |
| 3 or 4 Unit Apartments | 6 (15.0%) | 34 (85.0%) |
| 5 to 9 Unit Apartments | 0 (0.0%) | 39 (100.0%) |
| 10 or more Apartments | 42 (54.5%) | 35 (45.5%) |
| Mobile Home / Other | 1,293 (79.0%) | 343 (21.0%) |
| Total | 9,720 (87.5%) | 1,388 (12.5%) |
Housing Structures by Number of Rooms in Currituck County
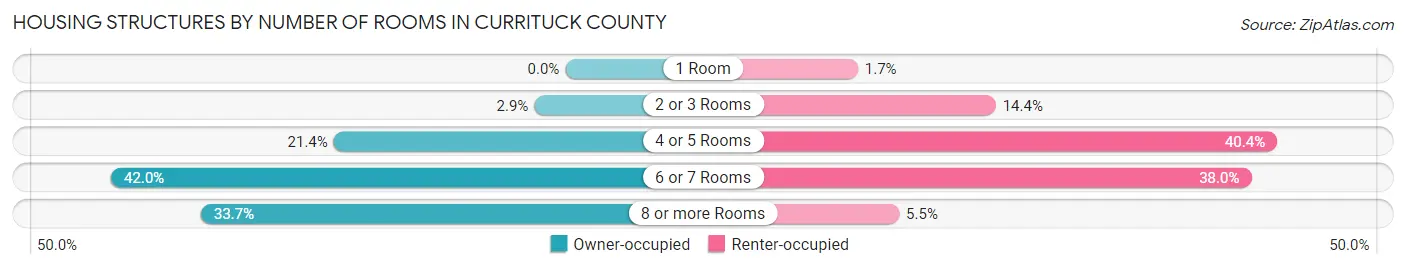
| Number of Rooms | Owner-occupied | Renter-occupied |
| 1 Room | 0 (0.0%) | 23 (1.7%) |
| 2 or 3 Rooms | 279 (2.9%) | 200 (14.4%) |
| 4 or 5 Rooms | 2,082 (21.4%) | 561 (40.4%) |
| 6 or 7 Rooms | 4,083 (42.0%) | 528 (38.0%) |
| 8 or more Rooms | 3,276 (33.7%) | 76 (5.5%) |
| Total | 9,720 (100.0%) | 1,388 (100.0%) |
Housing Structure by Heating Type in Currituck County
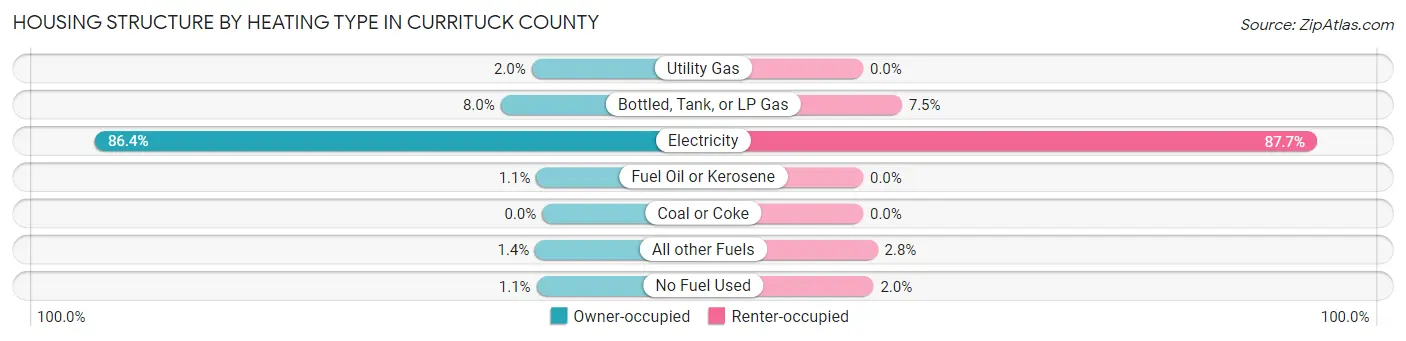
| Heating Type | Owner-occupied | Renter-occupied |
| Utility Gas | 196 (2.0%) | 0 (0.0%) |
| Bottled, Tank, or LP Gas | 781 (8.0%) | 104 (7.5%) |
| Electricity | 8,397 (86.4%) | 1,217 (87.7%) |
| Fuel Oil or Kerosene | 109 (1.1%) | 0 (0.0%) |
| Coal or Coke | 0 (0.0%) | 0 (0.0%) |
| All other Fuels | 131 (1.3%) | 39 (2.8%) |
| No Fuel Used | 106 (1.1%) | 28 (2.0%) |
| Total | 9,720 (100.0%) | 1,388 (100.0%) |
Household Vehicle Usage in Currituck County
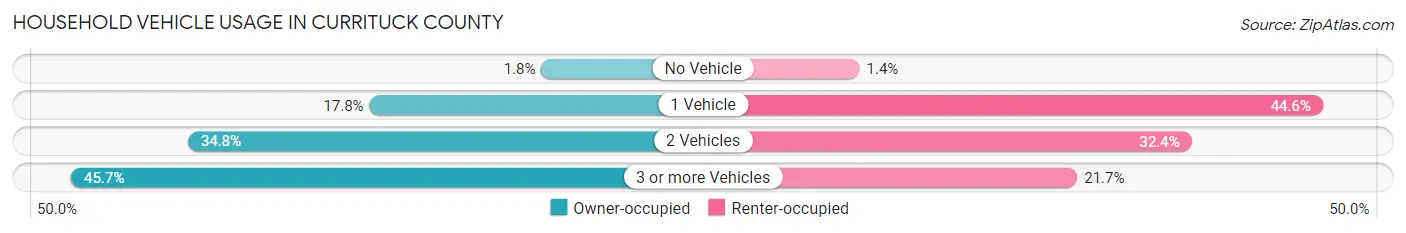
| Vehicles per Household | Owner-occupied | Renter-occupied |
| No Vehicle | 172 (1.8%) | 19 (1.4%) |
| 1 Vehicle | 1,731 (17.8%) | 619 (44.6%) |
| 2 Vehicles | 3,379 (34.8%) | 449 (32.4%) |
| 3 or more Vehicles | 4,438 (45.7%) | 301 (21.7%) |
| Total | 9,720 (100.0%) | 1,388 (100.0%) |
Real Estate & Mortgages in Currituck County
Real Estate and Mortgage Overview in Currituck County
| Characteristic | Without Mortgage | With Mortgage |
| Housing Units | 2,937 | 6,783 |
| Median Property Value | $267,900 | $328,300 |
| Median Household Income | $67,140 | $1,618 |
| Monthly Housing Costs | $467 | $550 |
| Real Estate Taxes | $1,241 | $72 |
Property Value by Mortgage Status in Currituck County
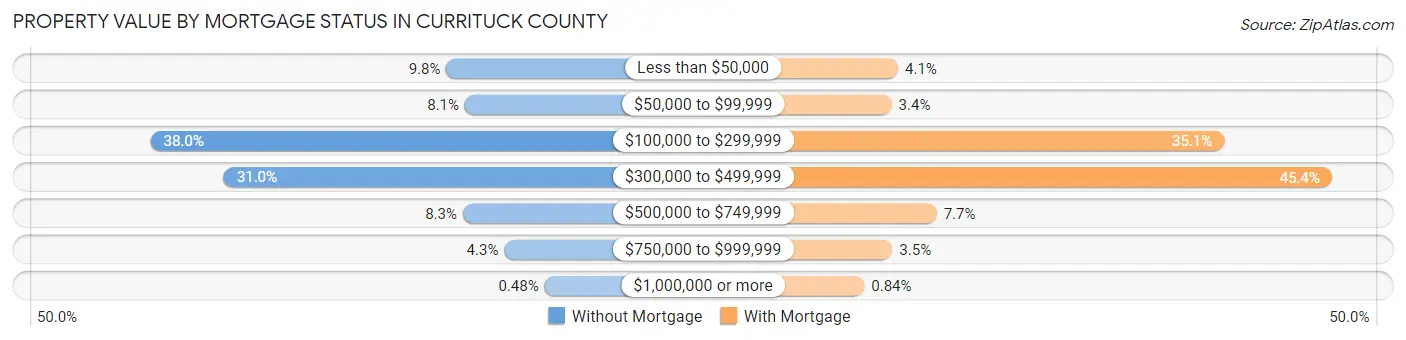
| Property Value | Without Mortgage | With Mortgage |
| Less than $50,000 | 289 (9.8%) | 275 (4.1%) |
| $50,000 to $99,999 | 237 (8.1%) | 233 (3.4%) |
| $100,000 to $299,999 | 1,116 (38.0%) | 2,380 (35.1%) |
| $300,000 to $499,999 | 911 (31.0%) | 3,076 (45.4%) |
| $500,000 to $749,999 | 243 (8.3%) | 524 (7.7%) |
| $750,000 to $999,999 | 127 (4.3%) | 238 (3.5%) |
| $1,000,000 or more | 14 (0.5%) | 57 (0.8%) |
| Total | 2,937 (100.0%) | 6,783 (100.0%) |
Household Income by Mortgage Status in Currituck County
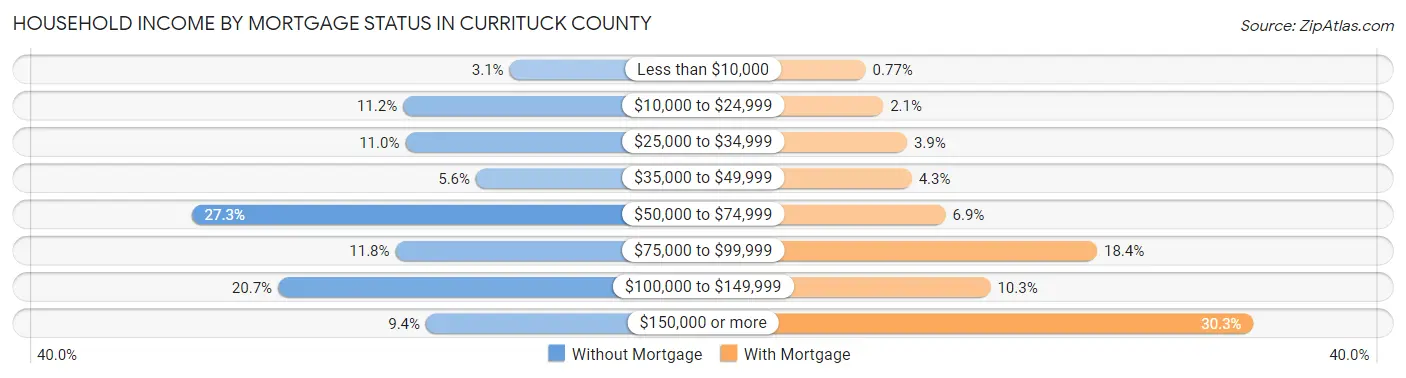
| Household Income | Without Mortgage | With Mortgage |
| Less than $10,000 | 90 (3.1%) | 52 (0.8%) |
| $10,000 to $24,999 | 328 (11.2%) | 143 (2.1%) |
| $25,000 to $34,999 | 323 (11.0%) | 266 (3.9%) |
| $35,000 to $49,999 | 165 (5.6%) | 290 (4.3%) |
| $50,000 to $74,999 | 801 (27.3%) | 465 (6.9%) |
| $75,000 to $99,999 | 345 (11.7%) | 1,248 (18.4%) |
| $100,000 to $149,999 | 608 (20.7%) | 697 (10.3%) |
| $150,000 or more | 277 (9.4%) | 2,056 (30.3%) |
| Total | 2,937 (100.0%) | 6,783 (100.0%) |
Property Value to Household Income Ratio in Currituck County
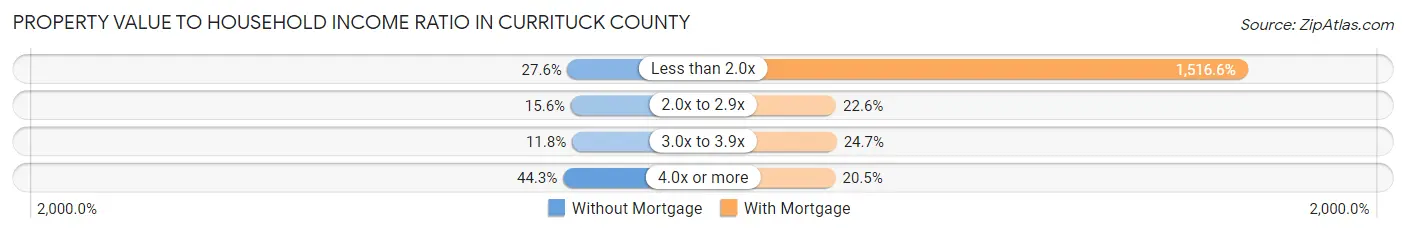
| Value-to-Income Ratio | Without Mortgage | With Mortgage |
| Less than 2.0x | 810 (27.6%) | 102,868 (1,516.6%) |
| 2.0x to 2.9x | 459 (15.6%) | 1,536 (22.6%) |
| 3.0x to 3.9x | 347 (11.8%) | 1,677 (24.7%) |
| 4.0x or more | 1,300 (44.3%) | 1,389 (20.5%) |
| Total | 2,937 (100.0%) | 6,783 (100.0%) |
Real Estate Taxes by Mortgage Status in Currituck County
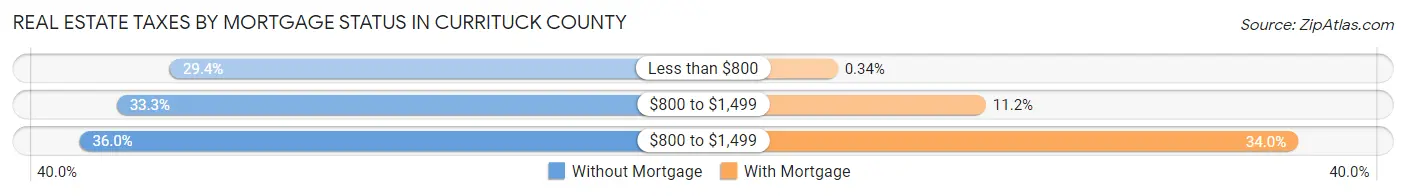
| Property Taxes | Without Mortgage | With Mortgage |
| Less than $800 | 863 (29.4%) | 23 (0.3%) |
| $800 to $1,499 | 977 (33.3%) | 758 (11.2%) |
| $800 to $1,499 | 1,057 (36.0%) | 2,304 (34.0%) |
| Total | 2,937 (100.0%) | 6,783 (100.0%) |
Health & Disability in Currituck County
Health Insurance Coverage by Age in Currituck County
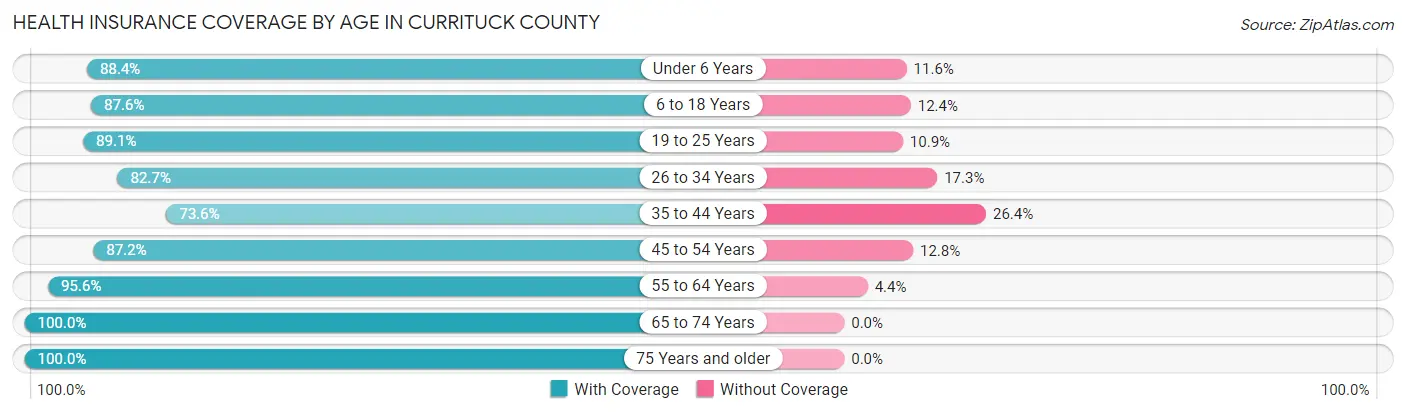
| Age Bracket | With Coverage | Without Coverage |
| Under 6 Years | 1,748 (88.4%) | 230 (11.6%) |
| 6 to 18 Years | 4,138 (87.6%) | 586 (12.4%) |
| 19 to 25 Years | 1,532 (89.1%) | 188 (10.9%) |
| 26 to 34 Years | 2,337 (82.7%) | 490 (17.3%) |
| 35 to 44 Years | 2,611 (73.6%) | 938 (26.4%) |
| 45 to 54 Years | 3,475 (87.2%) | 511 (12.8%) |
| 55 to 64 Years | 4,444 (95.6%) | 203 (4.4%) |
| 65 to 74 Years | 3,110 (100.0%) | 0 (0.0%) |
| 75 Years and older | 1,627 (100.0%) | 0 (0.0%) |
| Total | 25,022 (88.8%) | 3,146 (11.2%) |
Health Insurance Coverage by Citizenship Status in Currituck County
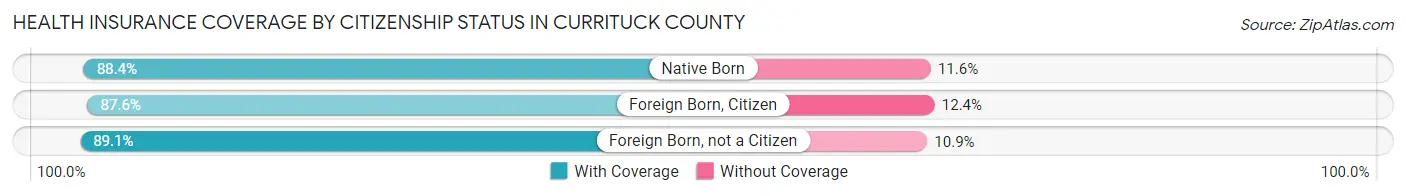
| Citizenship Status | With Coverage | Without Coverage |
| Native Born | 1,748 (88.4%) | 230 (11.6%) |
| Foreign Born, Citizen | 4,138 (87.6%) | 586 (12.4%) |
| Foreign Born, not a Citizen | 1,532 (89.1%) | 188 (10.9%) |
Health Insurance Coverage by Household Income in Currituck County
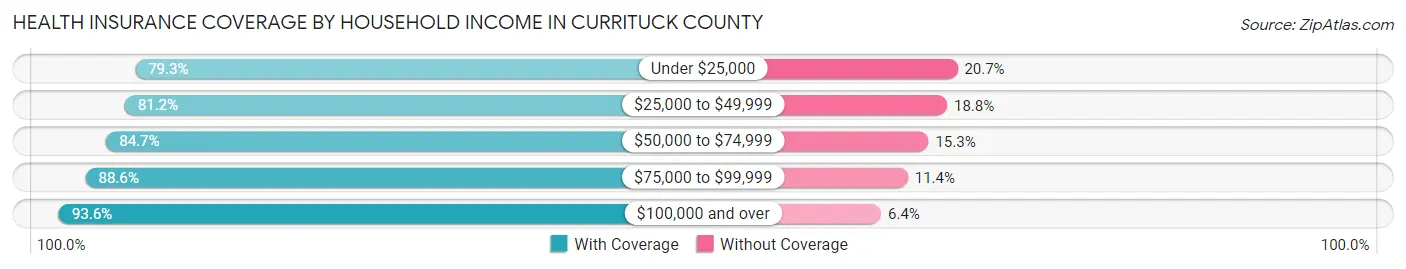
| Household Income | With Coverage | Without Coverage |
| Under $25,000 | 1,839 (79.3%) | 481 (20.7%) |
| $25,000 to $49,999 | 2,416 (81.2%) | 559 (18.8%) |
| $50,000 to $74,999 | 4,498 (84.7%) | 813 (15.3%) |
| $75,000 to $99,999 | 2,921 (88.6%) | 377 (11.4%) |
| $100,000 and over | 13,331 (93.6%) | 916 (6.4%) |
Public vs Private Health Insurance Coverage by Age in Currituck County
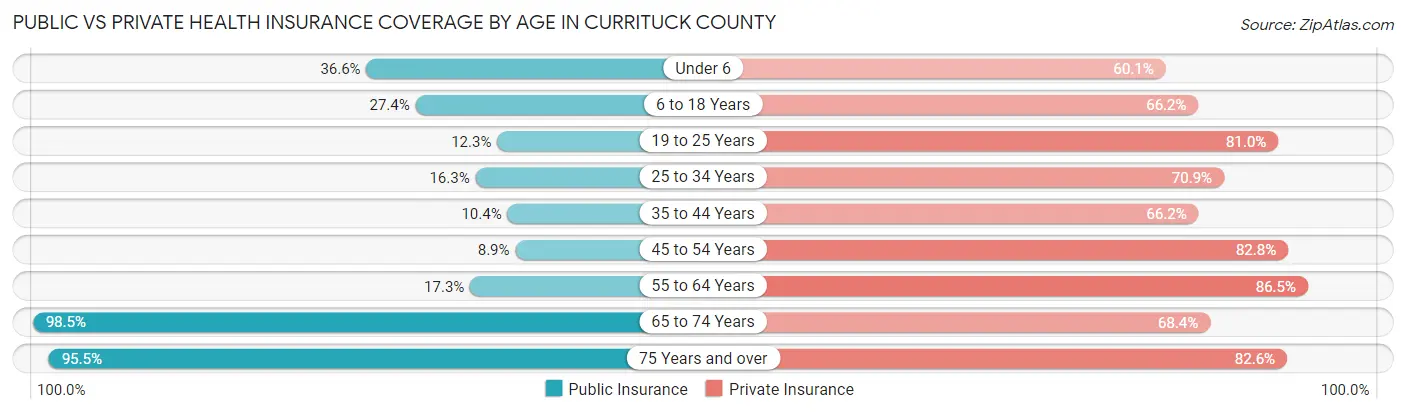
| Age Bracket | Public Insurance | Private Insurance |
| Under 6 | 723 (36.5%) | 1,189 (60.1%) |
| 6 to 18 Years | 1,296 (27.4%) | 3,126 (66.2%) |
| 19 to 25 Years | 211 (12.3%) | 1,393 (81.0%) |
| 25 to 34 Years | 461 (16.3%) | 2,005 (70.9%) |
| 35 to 44 Years | 368 (10.4%) | 2,350 (66.2%) |
| 45 to 54 Years | 355 (8.9%) | 3,301 (82.8%) |
| 55 to 64 Years | 804 (17.3%) | 4,019 (86.5%) |
| 65 to 74 Years | 3,063 (98.5%) | 2,126 (68.4%) |
| 75 Years and over | 1,554 (95.5%) | 1,344 (82.6%) |
| Total | 8,835 (31.4%) | 20,853 (74.0%) |
Disability Status by Sex by Age in Currituck County
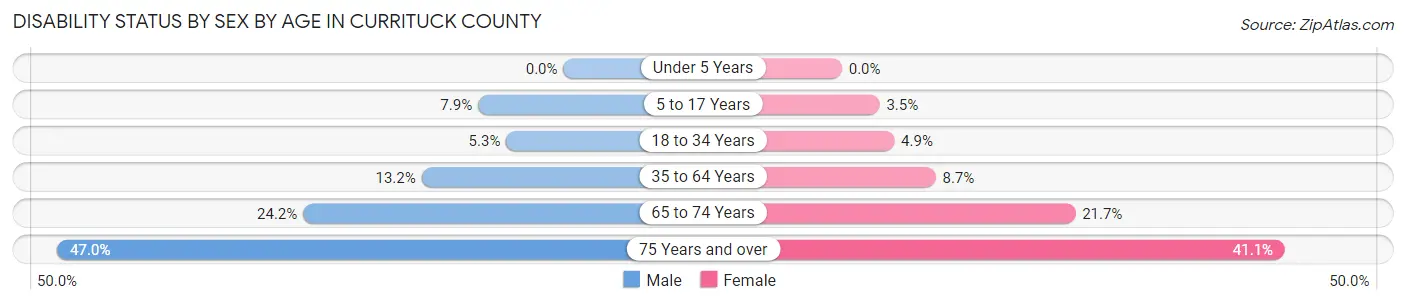
| Age Bracket | Male | Female |
| Under 5 Years | 0 (0.0%) | 0 (0.0%) |
| 5 to 17 Years | 199 (7.9%) | 81 (3.5%) |
| 18 to 34 Years | 126 (5.3%) | 123 (4.9%) |
| 35 to 64 Years | 810 (13.2%) | 524 (8.7%) |
| 65 to 74 Years | 362 (24.1%) | 349 (21.7%) |
| 75 Years and over | 344 (47.0%) | 368 (41.1%) |
Disability Class by Sex by Age in Currituck County
Disability Class: Hearing Difficulty

| Age Bracket | Male | Female |
| Under 5 Years | 0 (0.0%) | 0 (0.0%) |
| 5 to 17 Years | 0 (0.0%) | 28 (1.2%) |
| 18 to 34 Years | 0 (0.0%) | 0 (0.0%) |
| 35 to 64 Years | 378 (6.1%) | 157 (2.6%) |
| 65 to 74 Years | 233 (15.5%) | 105 (6.5%) |
| 75 Years and over | 180 (24.6%) | 175 (19.6%) |
Disability Class: Vision Difficulty
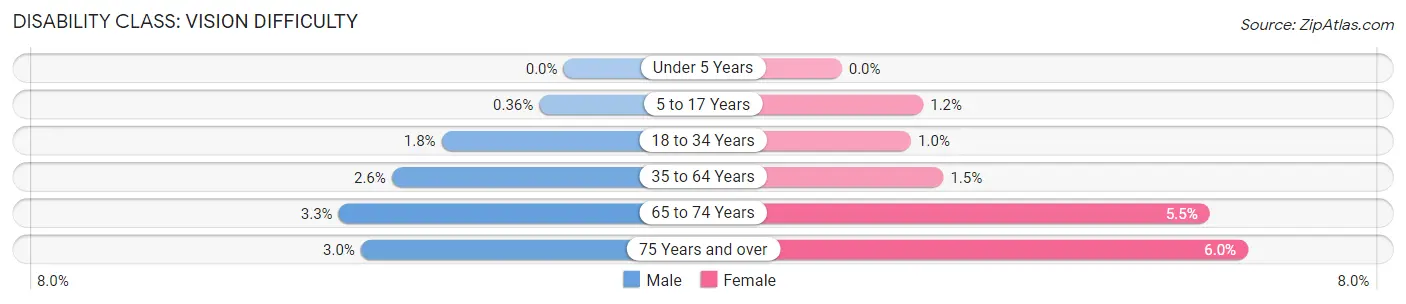
| Age Bracket | Male | Female |
| Under 5 Years | 0 (0.0%) | 0 (0.0%) |
| 5 to 17 Years | 9 (0.4%) | 28 (1.2%) |
| 18 to 34 Years | 43 (1.8%) | 26 (1.0%) |
| 35 to 64 Years | 157 (2.5%) | 91 (1.5%) |
| 65 to 74 Years | 50 (3.3%) | 88 (5.5%) |
| 75 Years and over | 22 (3.0%) | 54 (6.0%) |
Disability Class: Cognitive Difficulty
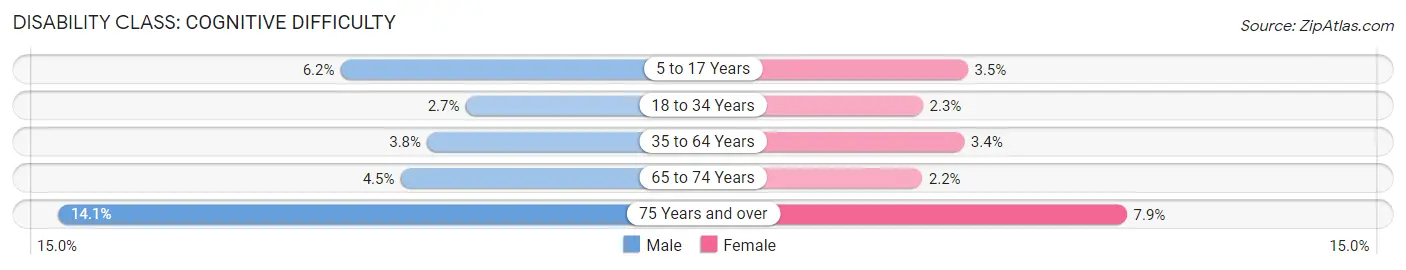
| Age Bracket | Male | Female |
| 5 to 17 Years | 156 (6.2%) | 81 (3.5%) |
| 18 to 34 Years | 65 (2.7%) | 57 (2.2%) |
| 35 to 64 Years | 234 (3.8%) | 205 (3.4%) |
| 65 to 74 Years | 68 (4.5%) | 36 (2.2%) |
| 75 Years and over | 103 (14.1%) | 71 (7.9%) |
Disability Class: Ambulatory Difficulty
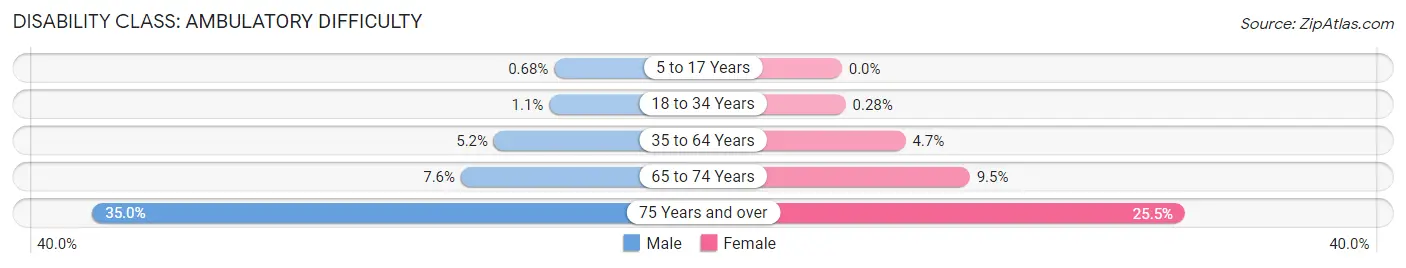
| Age Bracket | Male | Female |
| 5 to 17 Years | 17 (0.7%) | 0 (0.0%) |
| 18 to 34 Years | 25 (1.1%) | 7 (0.3%) |
| 35 to 64 Years | 318 (5.2%) | 285 (4.7%) |
| 65 to 74 Years | 114 (7.6%) | 153 (9.5%) |
| 75 Years and over | 256 (35.0%) | 228 (25.5%) |
Disability Class: Self-Care Difficulty
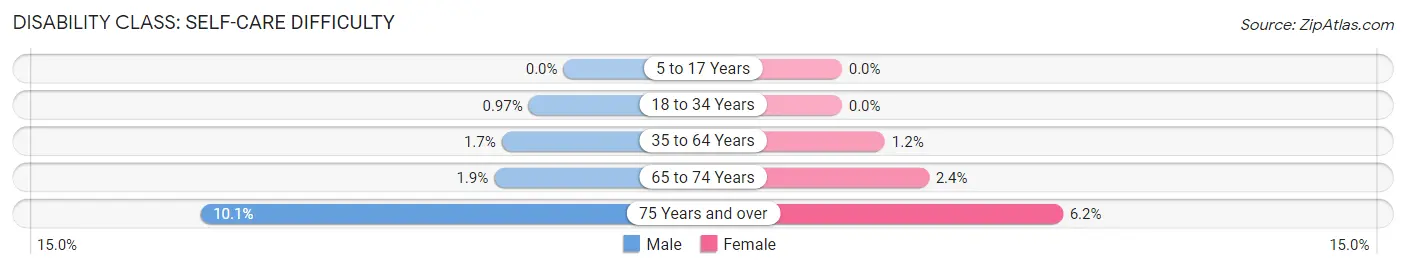
| Age Bracket | Male | Female |
| 5 to 17 Years | 0 (0.0%) | 0 (0.0%) |
| 18 to 34 Years | 23 (1.0%) | 0 (0.0%) |
| 35 to 64 Years | 106 (1.7%) | 72 (1.2%) |
| 65 to 74 Years | 29 (1.9%) | 39 (2.4%) |
| 75 Years and over | 74 (10.1%) | 55 (6.1%) |
Technology Access in Currituck County
Computing Device Access in Currituck County
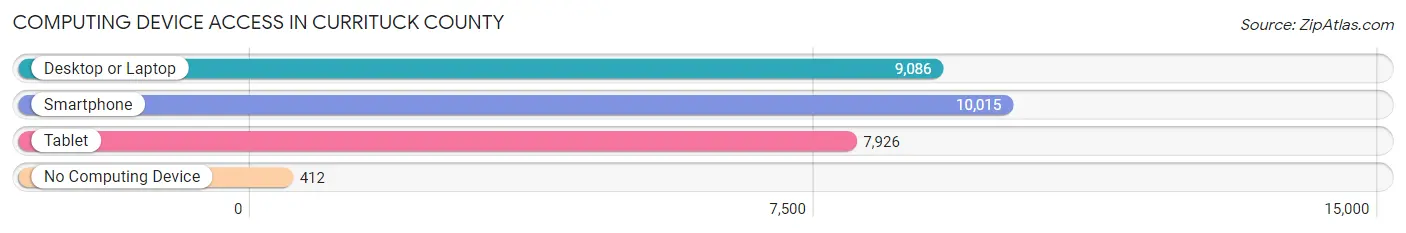
| Device Type | # Households | % Households |
| Desktop or Laptop | 9,086 | 81.8% |
| Smartphone | 10,015 | 90.2% |
| Tablet | 7,926 | 71.4% |
| No Computing Device | 412 | 3.7% |
| Total | 11,108 | 100.0% |
Internet Access in Currituck County
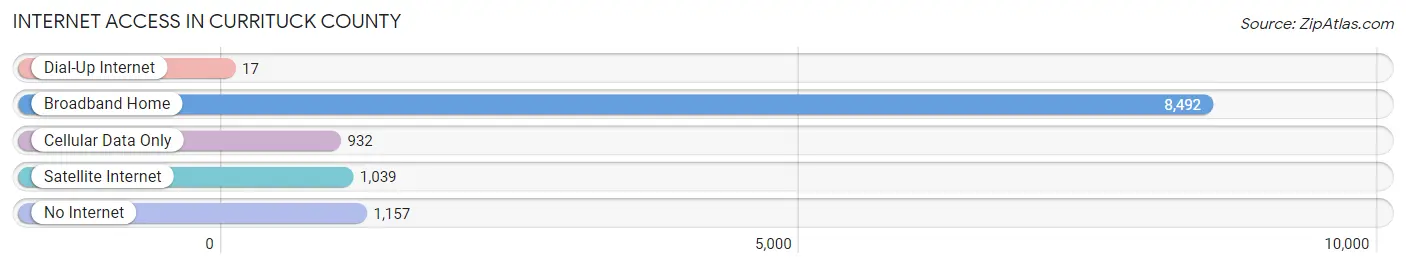
| Internet Type | # Households | % Households |
| Dial-Up Internet | 17 | 0.2% |
| Broadband Home | 8,492 | 76.4% |
| Cellular Data Only | 932 | 8.4% |
| Satellite Internet | 1,039 | 9.3% |
| No Internet | 1,157 | 10.4% |
| Total | 11,108 | 100.0% |
Currituck County Summary
Currituck County, North Carolina is located in the northeastern corner of the state, bordering Virginia to the north and the Atlantic Ocean to the east. It is part of the Outer Banks region, a string of barrier islands and peninsulas that stretch along the coast of North Carolina. The county is home to a variety of wildlife, including the endangered red wolf, and is a popular destination for tourists and outdoor enthusiasts.
History
The area that is now Currituck County was first inhabited by Native Americans, including the Chowanoke, Weapemeoc, and Secotan tribes. The first European settlers arrived in the area in the late 1600s, and the county was officially established in 1668. The county was named for the Currituck Sound, which was derived from the Native American word for “land of the wild geese.”
In the 1700s, the county was a major center of the slave trade, and many of the county’s plantations were worked by enslaved people. During the American Revolution, the county was the site of several battles, including the Battle of Great Bridge in 1775.
In the 1800s, the county’s economy was largely based on agriculture, with tobacco, cotton, and corn being the main crops. The county also had a thriving fishing industry, and the town of Corolla became a popular destination for wealthy vacationers.
Geography
Currituck County is located in the northeastern corner of North Carolina, bordering Virginia to the north and the Atlantic Ocean to the east. The county is part of the Outer Banks region, a string of barrier islands and peninsulas that stretch along the coast of North Carolina. The county is home to a variety of wildlife, including the endangered red wolf, and is a popular destination for tourists and outdoor enthusiasts.
The county is divided into two distinct regions: the mainland and the Outer Banks. The mainland is largely rural, with small towns and villages scattered throughout. The Outer Banks is a popular tourist destination, with a variety of beaches, lighthouses, and other attractions.
Economy
The economy of Currituck County is largely based on tourism and agriculture. The county is home to a variety of tourist attractions, including beaches, lighthouses, and wildlife preserves. The county also has a thriving agricultural industry, with corn, soybeans, and wheat being the main crops. The county also has a thriving fishing industry, with a variety of seafood being harvested from the waters of the Currituck Sound.
Demographics
As of the 2010 census, the population of Currituck County was 23,547. The population is largely white (87.3%), with African Americans making up 8.2% of the population and Hispanics making up 2.3%. The median household income is $50,845, and the median home value is $219,400. The county has a low unemployment rate of 4.2%.
Conclusion
Currituck County, North Carolina is a unique and beautiful part of the state, with a rich history and a vibrant economy. The county is home to a variety of wildlife, including the endangered red wolf, and is a popular destination for tourists and outdoor enthusiasts. The county’s economy is largely based on tourism and agriculture, and the county has a low unemployment rate and a median household income that is higher than the state average.
Common Questions
What is Per Capita Income in Currituck County?
Per Capita income in Currituck County is $40,352.
What is the Median Family Income in Currituck County?
Median Family Income in Currituck County is $100,195.
What is the Median Household income in Currituck County?
Median Household Income in Currituck County is $82,793.
What is Income or Wage Gap in Currituck County?
Income or Wage Gap in Currituck County is 33.0%.
Women in Currituck County earn 67.0 cents for every dollar earned by a man.
What is Family Income Deficit in Currituck County?
Family Income Deficit in Currituck County is $11,893.
Families that are below poverty line in Currituck County earn $11,893 less on average than the poverty threshold level.
What is Inequality or Gini Index in Currituck County?
Inequality or Gini Index in Currituck County is 0.40.
What is the Total Population of Currituck County?
Total Population of Currituck County is 28,616.
What is the Total Male Population of Currituck County?
Total Male Population of Currituck County is 14,503.
What is the Total Female Population of Currituck County?
Total Female Population of Currituck County is 14,113.
What is the Ratio of Males per 100 Females in Currituck County?
There are 102.76 Males per 100 Females in Currituck County.
What is the Ratio of Females per 100 Males in Currituck County?
There are 97.31 Females per 100 Males in Currituck County.
What is the Median Population Age in Currituck County?
Median Population Age in Currituck County is 42.5 Years.
What is the Average Family Size in Currituck County
Average Family Size in Currituck County is 2.9 People.
What is the Average Household Size in Currituck County
Average Household Size in Currituck County is 2.6 People.
How Large is the Labor Force in Currituck County?
There are 14,952 People in the Labor Forcein in Currituck County.
What is the Percentage of People in the Labor Force in Currituck County?
65.3% of People are in the Labor Force in Currituck County.
What is the Unemployment Rate in Currituck County?
Unemployment Rate in Currituck County is 3.2%.