Chowan County, NC Map & Demographics
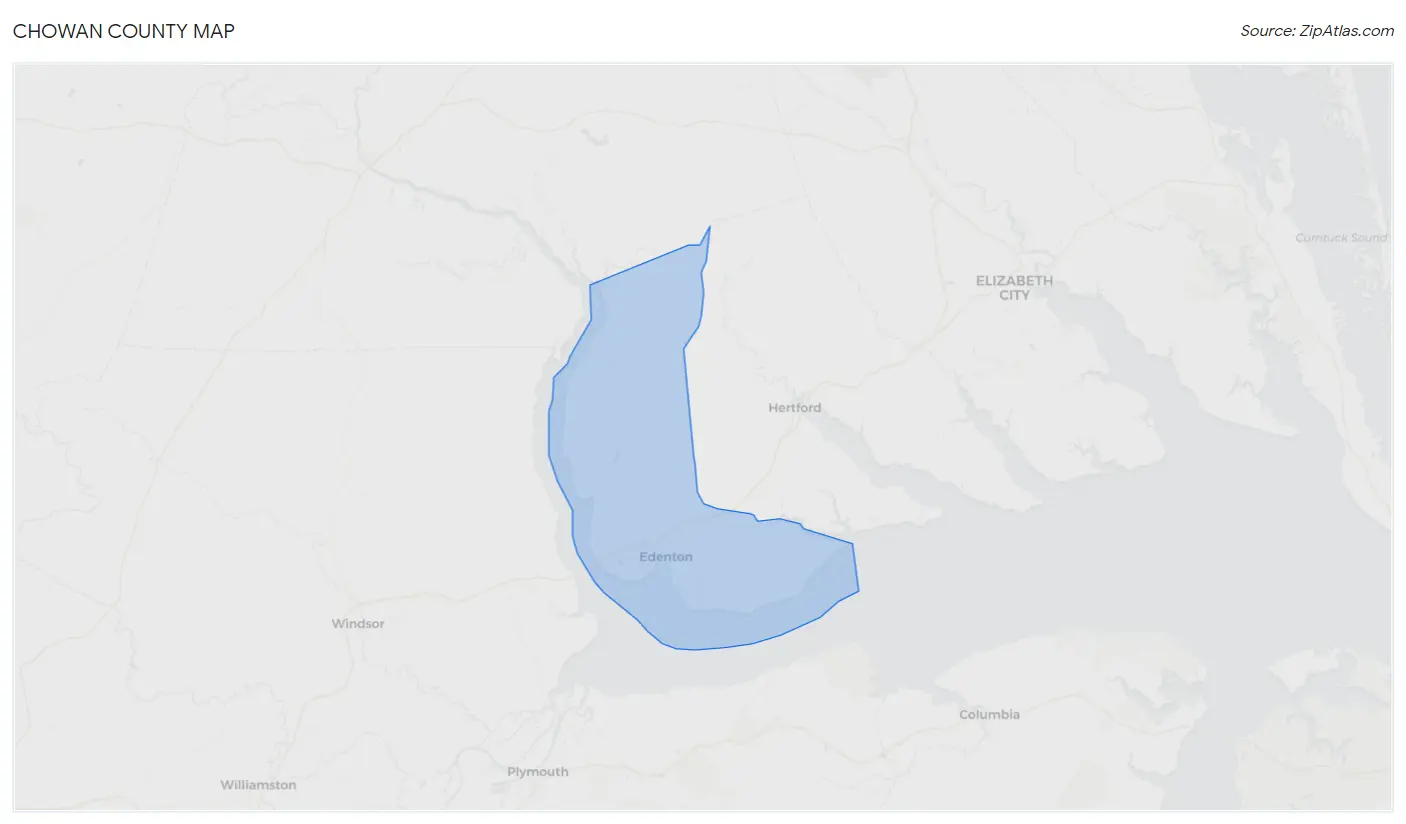
Chowan County Map
Chowan County Overview
$32,479
PER CAPITA INCOME
$68,042
AVG FAMILY INCOME
$51,188
AVG HOUSEHOLD INCOME
49.7%
WAGE / INCOME GAP [ % ]
50.3¢/ $1
WAGE / INCOME GAP [ $ ]
$9,411
FAMILY INCOME DEFICIT
0.46
INEQUALITY / GINI INDEX
13,835
TOTAL POPULATION
6,602
MALE POPULATION
7,233
FEMALE POPULATION
91.28
MALES / 100 FEMALES
109.56
FEMALES / 100 MALES
48.7
MEDIAN AGE
2.7
AVG FAMILY SIZE
2.2
AVG HOUSEHOLD SIZE
6,208
LABOR FORCE [ PEOPLE ]
54.2%
PERCENT IN LABOR FORCE
4.3%
UNEMPLOYMENT RATE
Chowan County Area Codes
Income in Chowan County
Income Overview in Chowan County
Per Capita Income in Chowan County is $32,479, while median incomes of families and households are $68,042 and $51,188 respectively.
| Characteristic | Number | Measure |
| Per Capita Income | 13,835 | $32,479 |
| Median Family Income | 4,043 | $68,042 |
| Mean Family Income | 4,043 | $83,739 |
| Median Household Income | 6,216 | $51,188 |
| Mean Household Income | 6,216 | $70,291 |
| Income Deficit | 4,043 | $9,411 |
| Wage / Income Gap (%) | 13,835 | 49.75% |
| Wage / Income Gap ($) | 13,835 | 50.25¢ per $1 |
| Gini / Inequality Index | 13,835 | 0.46 |
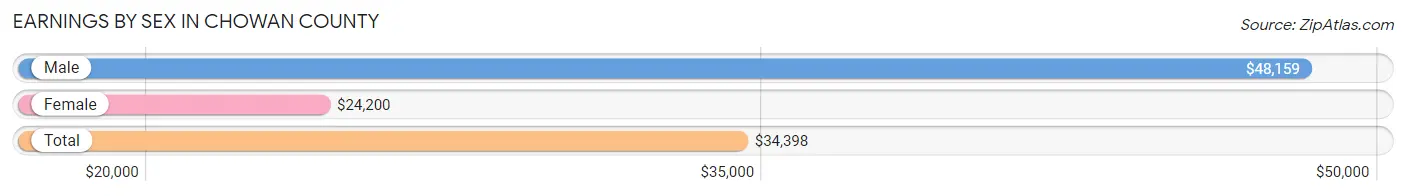
Earnings by Sex in Chowan County
Average Earnings in Chowan County are $34,398, $48,159 for men and $24,200 for women, a difference of 49.7%.
| Sex | Number | Average Earnings |
| Male | 3,270 (49.6%) | $48,159 |
| Female | 3,322 (50.4%) | $24,200 |
| Total | 6,592 (100.0%) | $34,398 |
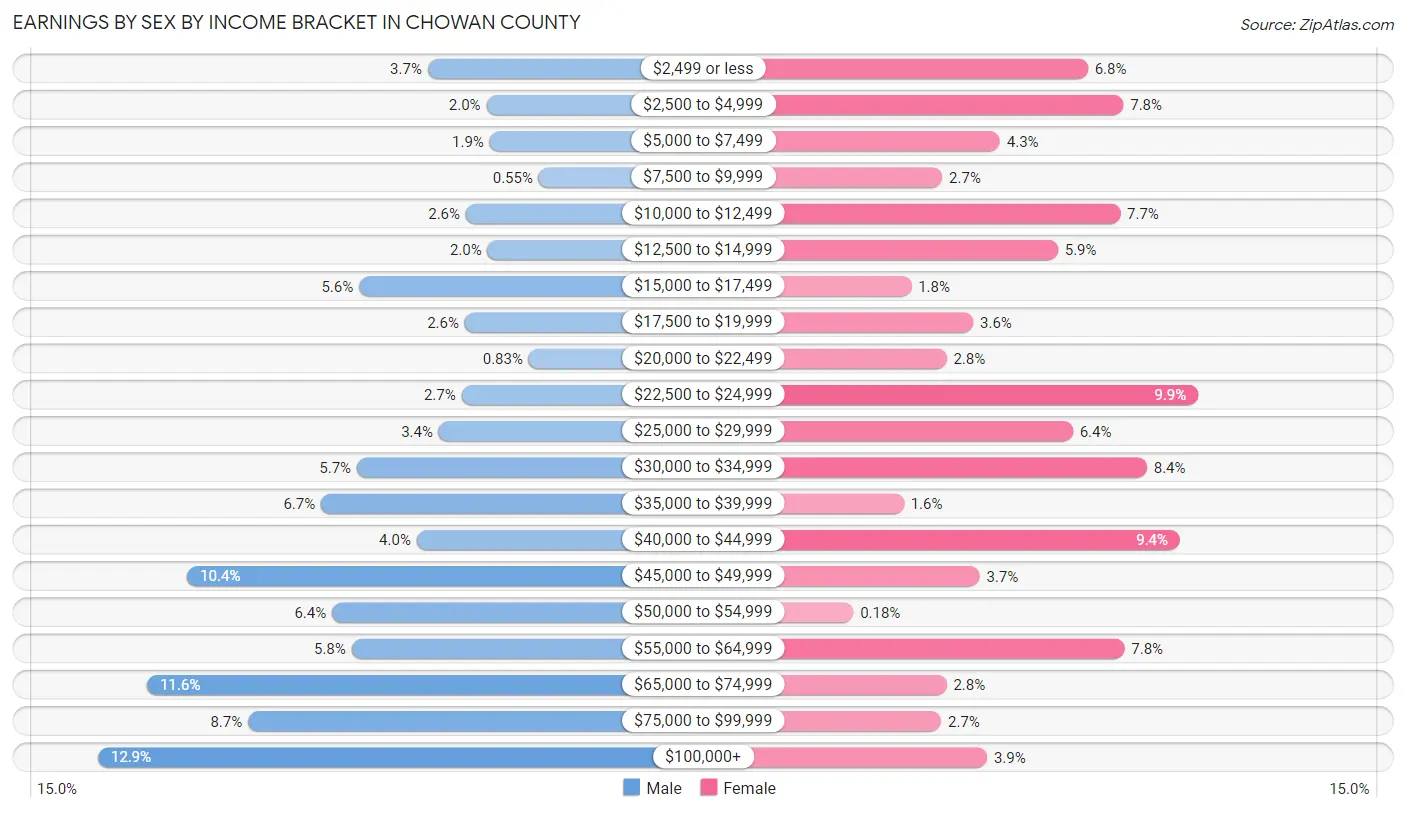
Earnings by Sex by Income Bracket in Chowan County
The most common earnings brackets in Chowan County are $100,000+ for men (423 | 12.9%) and $22,500 to $24,999 for women (328 | 9.9%).
| Income | Male | Female |
| $2,499 or less | 120 (3.7%) | 225 (6.8%) |
| $2,500 to $4,999 | 66 (2.0%) | 258 (7.8%) |
| $5,000 to $7,499 | 63 (1.9%) | 143 (4.3%) |
| $7,500 to $9,999 | 18 (0.5%) | 89 (2.7%) |
| $10,000 to $12,499 | 85 (2.6%) | 255 (7.7%) |
| $12,500 to $14,999 | 65 (2.0%) | 197 (5.9%) |
| $15,000 to $17,499 | 183 (5.6%) | 60 (1.8%) |
| $17,500 to $19,999 | 86 (2.6%) | 118 (3.5%) |
| $20,000 to $22,499 | 27 (0.8%) | 93 (2.8%) |
| $22,500 to $24,999 | 89 (2.7%) | 328 (9.9%) |
| $25,000 to $29,999 | 110 (3.4%) | 211 (6.4%) |
| $30,000 to $34,999 | 185 (5.7%) | 280 (8.4%) |
| $35,000 to $39,999 | 218 (6.7%) | 53 (1.6%) |
| $40,000 to $44,999 | 130 (4.0%) | 311 (9.4%) |
| $45,000 to $49,999 | 341 (10.4%) | 124 (3.7%) |
| $50,000 to $54,999 | 208 (6.4%) | 6 (0.2%) |
| $55,000 to $64,999 | 190 (5.8%) | 259 (7.8%) |
| $65,000 to $74,999 | 378 (11.6%) | 93 (2.8%) |
| $75,000 to $99,999 | 285 (8.7%) | 88 (2.6%) |
| $100,000+ | 423 (12.9%) | 131 (3.9%) |
| Total | 3,270 (100.0%) | 3,322 (100.0%) |
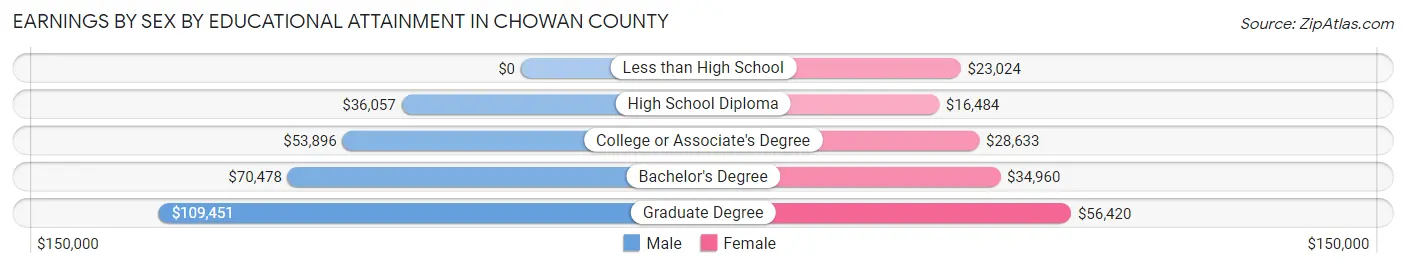
Earnings by Sex by Educational Attainment in Chowan County
Average earnings in Chowan County are $49,067 for men and $24,971 for women, a difference of 49.1%. Men with an educational attainment of graduate degree enjoy the highest average annual earnings of $109,451, while those with high school diploma education earn the least with $36,057. Women with an educational attainment of graduate degree earn the most with the average annual earnings of $56,420, while those with high school diploma education have the smallest earnings of $16,484.
| Educational Attainment | Male Income | Female Income |
| Less than High School | - | - |
| High School Diploma | $36,057 | $16,484 |
| College or Associate's Degree | $53,896 | $28,633 |
| Bachelor's Degree | $70,478 | $34,960 |
| Graduate Degree | $109,451 | $56,420 |
| Total | $49,067 | $24,971 |
Family Income in Chowan County
Family Income Brackets in Chowan County
According to the Chowan County family income data, there are 691 families falling into the $50,000 to $74,999 income range, which is the most common income bracket and makes up 17.1% of all families. Conversely, the $10,000 to $14,999 income bracket is the least frequent group with only 214 families (5.3%) belonging to this category.
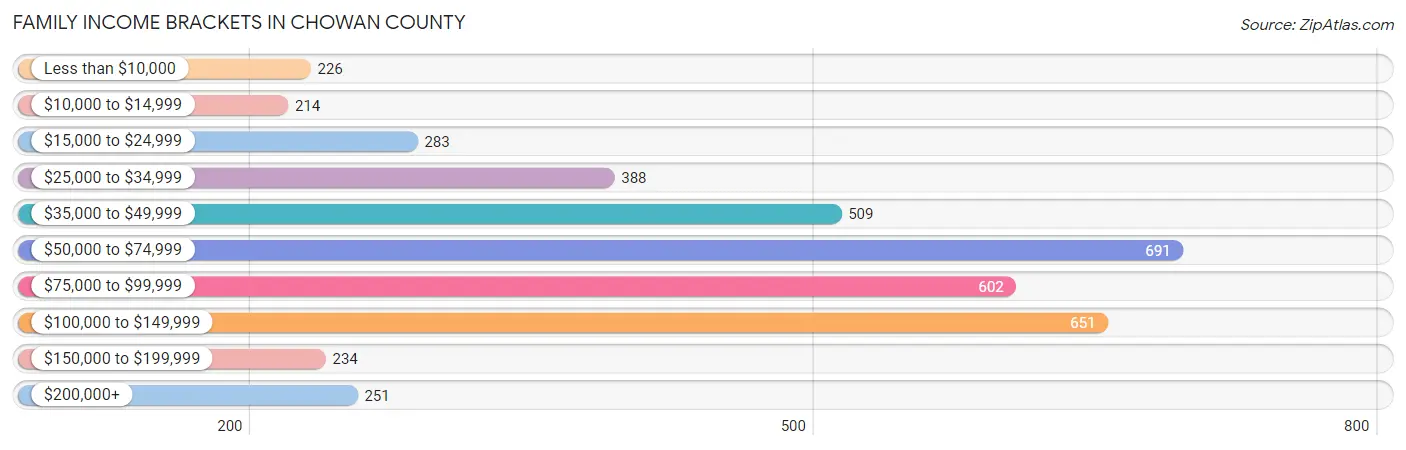
| Income Bracket | # Families | % Families |
| Less than $10,000 | 226 | 5.6% |
| $10,000 to $14,999 | 214 | 5.3% |
| $15,000 to $24,999 | 283 | 7.0% |
| $25,000 to $34,999 | 388 | 9.6% |
| $35,000 to $49,999 | 509 | 12.6% |
| $50,000 to $74,999 | 691 | 17.1% |
| $75,000 to $99,999 | 602 | 14.9% |
| $100,000 to $149,999 | 651 | 16.1% |
| $150,000 to $199,999 | 234 | 5.8% |
| $200,000+ | 251 | 6.2% |
Family Income by Famaliy Size in Chowan County
4-person families (371 | 9.2%) account for the highest median family income in Chowan County with $128,412 per family, while 4-person families (371 | 9.2%) have the highest median income of $32,103 per family member.
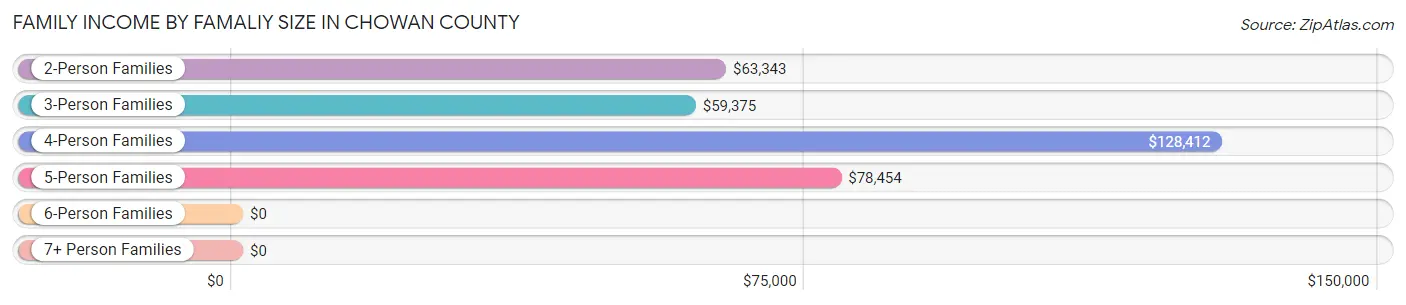
| Income Bracket | # Families | Median Income |
| 2-Person Families | 2,621 (64.8%) | $63,343 |
| 3-Person Families | 764 (18.9%) | $59,375 |
| 4-Person Families | 371 (9.2%) | $128,412 |
| 5-Person Families | 186 (4.6%) | $78,454 |
| 6-Person Families | 13 (0.3%) | $0 |
| 7+ Person Families | 88 (2.2%) | $0 |
| Total | 4,043 (100.0%) | $68,042 |
Family Income by Number of Earners in Chowan County
The median family income in Chowan County is $68,042, with families comprising 2 earners (1,483) having the highest median family income of $102,083, while families with 1 earner (1,497) have the lowest median family income of $40,732, accounting for 36.7% and 37.0% of families, respectively.
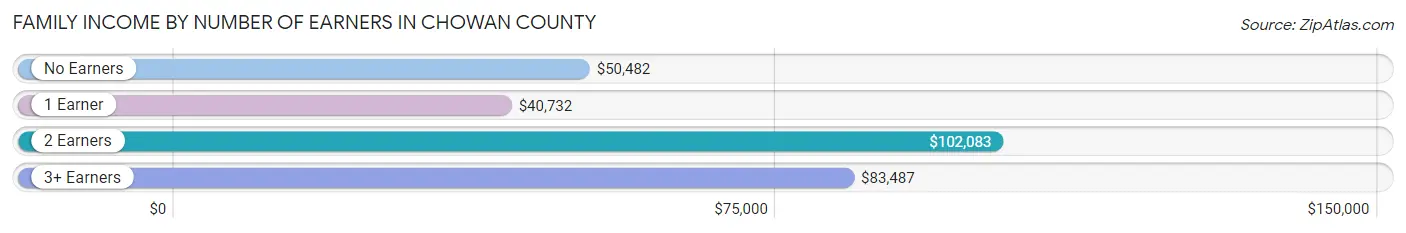
| Number of Earners | # Families | Median Income |
| No Earners | 920 (22.8%) | $50,482 |
| 1 Earner | 1,497 (37.0%) | $40,732 |
| 2 Earners | 1,483 (36.7%) | $102,083 |
| 3+ Earners | 143 (3.5%) | $83,487 |
| Total | 4,043 (100.0%) | $68,042 |
Household Income in Chowan County
Household Income Brackets in Chowan County
With 1,094 households falling in the category, the $50,000 to $74,999 income range is the most frequent in Chowan County, accounting for 17.6% of all households. In contrast, only 249 households (4.0%) fall into the $200,000+ income bracket, making it the least populous group.
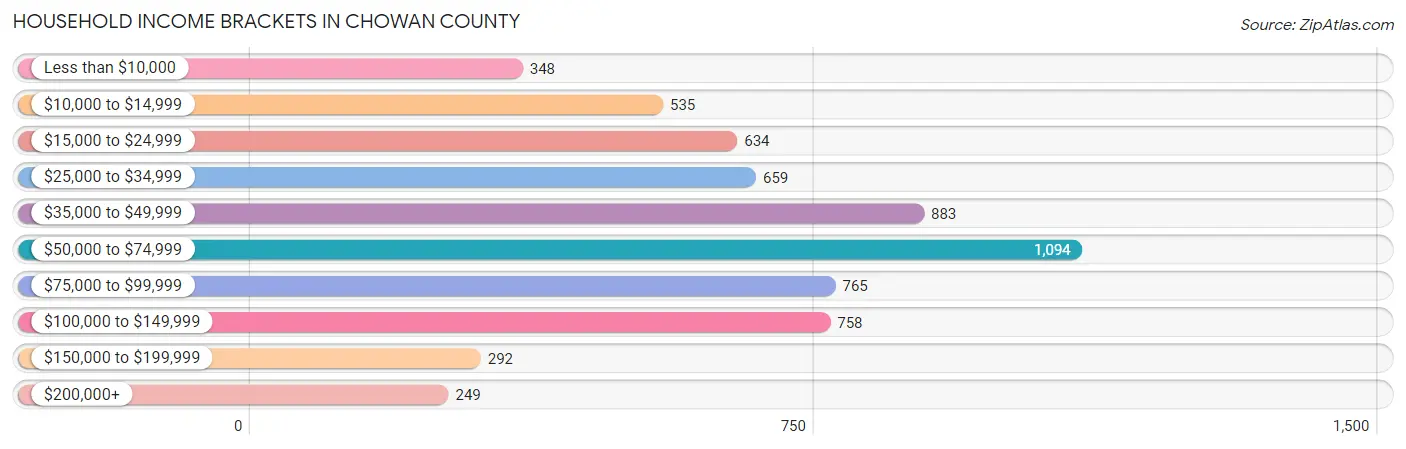
| Income Bracket | # Households | % Households |
| Less than $10,000 | 348 | 5.6% |
| $10,000 to $14,999 | 535 | 8.6% |
| $15,000 to $24,999 | 634 | 10.2% |
| $25,000 to $34,999 | 659 | 10.6% |
| $35,000 to $49,999 | 883 | 14.2% |
| $50,000 to $74,999 | 1,094 | 17.6% |
| $75,000 to $99,999 | 765 | 12.3% |
| $100,000 to $149,999 | 758 | 12.2% |
| $150,000 to $199,999 | 292 | 4.7% |
| $200,000+ | 249 | 4.0% |
Household Income by Householder Age in Chowan County
The median household income in Chowan County is $51,188, with the highest median household income of $57,458 found in the 45 to 64 years age bracket for the primary householder. A total of 2,218 households (35.7%) fall into this category. Meanwhile, the 15 to 24 years age bracket for the primary householder has the lowest median household income of $0, with 43 households (0.7%) in this group.
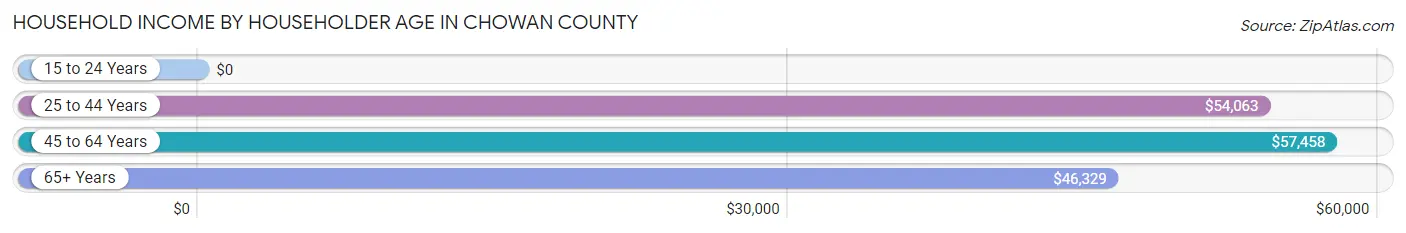
| Income Bracket | # Households | Median Income |
| 15 to 24 Years | 43 (0.7%) | $0 |
| 25 to 44 Years | 1,708 (27.5%) | $54,063 |
| 45 to 64 Years | 2,218 (35.7%) | $57,458 |
| 65+ Years | 2,247 (36.1%) | $46,329 |
| Total | 6,216 (100.0%) | $51,188 |
Poverty in Chowan County
Income Below Poverty by Sex and Age in Chowan County
With 16.8% poverty level for males and 24.7% for females among the residents of Chowan County, 15 year old males and 5 year old females are the most vulnerable to poverty, with 68 males (82.9%) and 106 females (100.0%) in their respective age groups living below the poverty level.
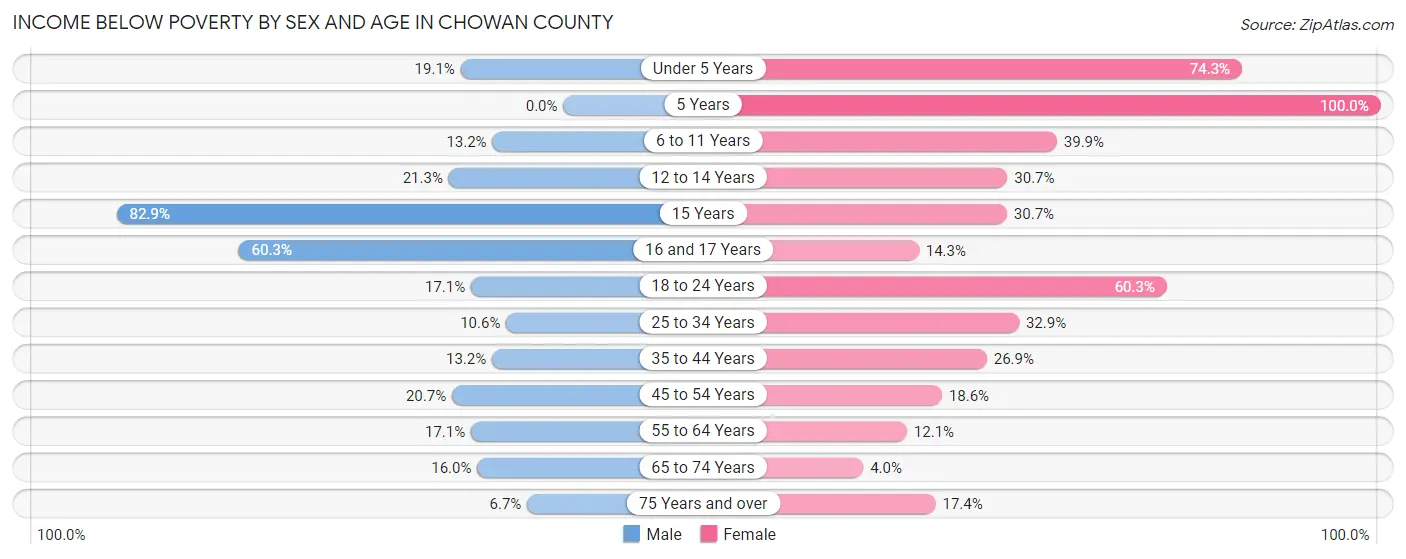
| Age Bracket | Male | Female |
| Under 5 Years | 57 (19.1%) | 225 (74.3%) |
| 5 Years | 0 (0.0%) | 106 (100.0%) |
| 6 to 11 Years | 65 (13.2%) | 204 (39.9%) |
| 12 to 14 Years | 47 (21.3%) | 63 (30.7%) |
| 15 Years | 68 (82.9%) | 19 (30.6%) |
| 16 and 17 Years | 88 (60.3%) | 26 (14.3%) |
| 18 to 24 Years | 43 (17.1%) | 158 (60.3%) |
| 25 to 34 Years | 87 (10.6%) | 272 (32.9%) |
| 35 to 44 Years | 103 (13.2%) | 200 (26.9%) |
| 45 to 54 Years | 172 (20.7%) | 155 (18.6%) |
| 55 to 64 Years | 174 (17.1%) | 143 (12.1%) |
| 65 to 74 Years | 152 (16.0%) | 44 (4.0%) |
| 75 Years and over | 36 (6.7%) | 130 (17.4%) |
| Total | 1,092 (16.8%) | 1,745 (24.7%) |
Income Above Poverty by Sex and Age in Chowan County
According to the poverty statistics in Chowan County, males aged 5 years and females aged 65 to 74 years are the age groups that are most secure financially, with 100.0% of males and 96.0% of females in these age groups living above the poverty line.
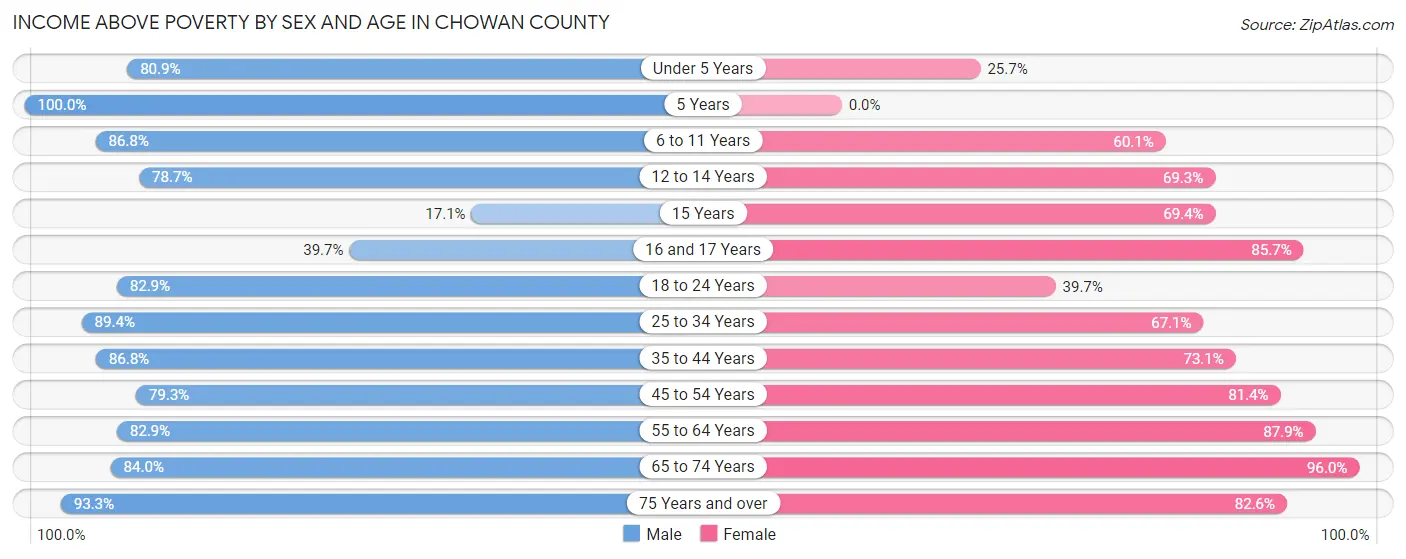
| Age Bracket | Male | Female |
| Under 5 Years | 242 (80.9%) | 78 (25.7%) |
| 5 Years | 93 (100.0%) | 0 (0.0%) |
| 6 to 11 Years | 429 (86.8%) | 307 (60.1%) |
| 12 to 14 Years | 174 (78.7%) | 142 (69.3%) |
| 15 Years | 14 (17.1%) | 43 (69.4%) |
| 16 and 17 Years | 58 (39.7%) | 156 (85.7%) |
| 18 to 24 Years | 208 (82.9%) | 104 (39.7%) |
| 25 to 34 Years | 734 (89.4%) | 555 (67.1%) |
| 35 to 44 Years | 675 (86.8%) | 543 (73.1%) |
| 45 to 54 Years | 660 (79.3%) | 679 (81.4%) |
| 55 to 64 Years | 842 (82.9%) | 1,040 (87.9%) |
| 65 to 74 Years | 799 (84.0%) | 1,062 (96.0%) |
| 75 Years and over | 500 (93.3%) | 617 (82.6%) |
| Total | 5,428 (83.3%) | 5,326 (75.3%) |
Income Below Poverty Among Married-Couple Families in Chowan County
The poverty statistics for married-couple families in Chowan County show that 8.5% or 248 of the total 2,927 families live below the poverty line. Families with 5 or more children have the highest poverty rate of 79.5%, comprising of 70 families. On the other hand, families with 3 or 4 children have the lowest poverty rate of 0.0%, which includes 0 families.
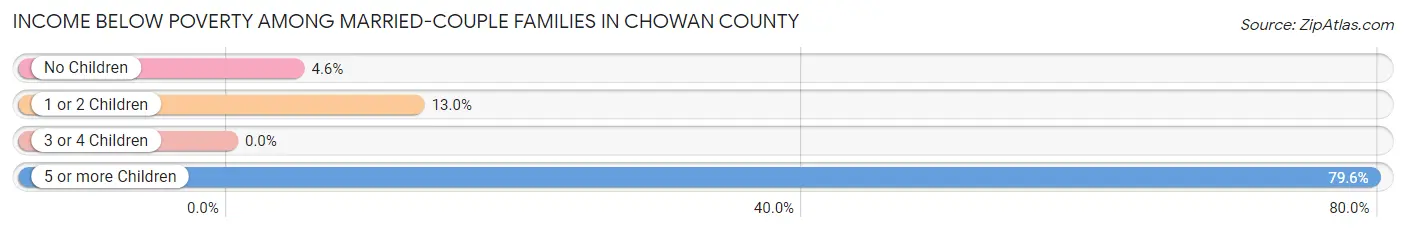
| Children | Above Poverty | Below Poverty |
| No Children | 1,997 (95.4%) | 97 (4.6%) |
| 1 or 2 Children | 542 (87.0%) | 81 (13.0%) |
| 3 or 4 Children | 122 (100.0%) | 0 (0.0%) |
| 5 or more Children | 18 (20.4%) | 70 (79.5%) |
| Total | 2,679 (91.5%) | 248 (8.5%) |
Income Below Poverty Among Single-Parent Households in Chowan County
According to the poverty data in Chowan County, 45.6% or 123 single-father households and 40.3% or 341 single-mother households are living below the poverty line. Among single-father households, those with no children have the highest poverty rate, with 108 households (67.5%) experiencing poverty. Likewise, among single-mother households, those with 3 or 4 children have the highest poverty rate, with 25 households (100.0%) falling below the poverty line.
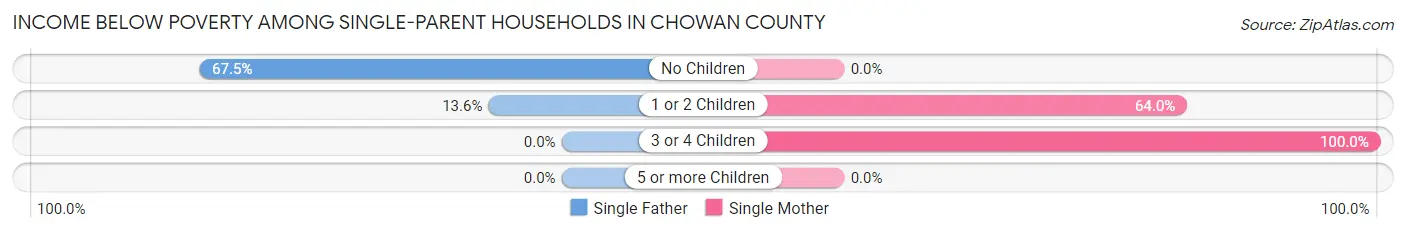
| Children | Single Father | Single Mother |
| No Children | 108 (67.5%) | 0 (0.0%) |
| 1 or 2 Children | 15 (13.6%) | 316 (64.0%) |
| 3 or 4 Children | 0 (0.0%) | 25 (100.0%) |
| 5 or more Children | 0 (0.0%) | 0 (0.0%) |
| Total | 123 (45.6%) | 341 (40.3%) |
Income Below Poverty Among Married-Couple vs Single-Parent Households in Chowan County
The poverty data for Chowan County shows that 248 of the married-couple family households (8.5%) and 464 of the single-parent households (41.6%) are living below the poverty level. Within the married-couple family households, those with 5 or more children have the highest poverty rate, with 70 households (79.5%) falling below the poverty line. Among the single-parent households, those with 3 or 4 children have the highest poverty rate, with 25 household (100.0%) living below poverty.
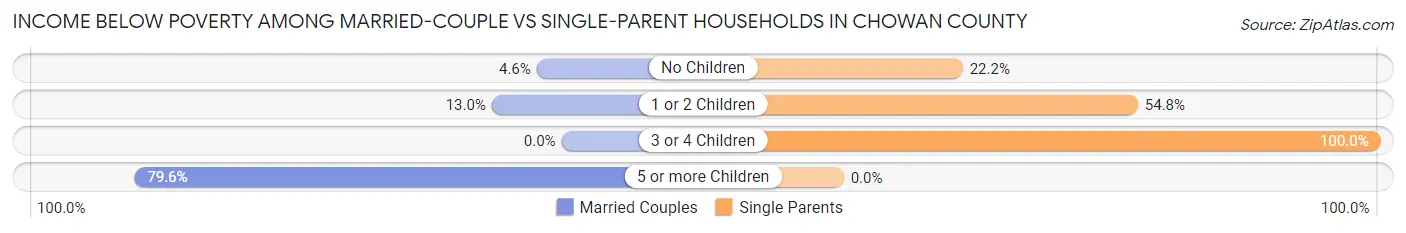
| Children | Married-Couple Families | Single-Parent Households |
| No Children | 97 (4.6%) | 108 (22.2%) |
| 1 or 2 Children | 81 (13.0%) | 331 (54.8%) |
| 3 or 4 Children | 0 (0.0%) | 25 (100.0%) |
| 5 or more Children | 70 (79.5%) | 0 (0.0%) |
| Total | 248 (8.5%) | 464 (41.6%) |
Race in Chowan County
The most populous races in Chowan County are White / Caucasian (8,358 | 60.4%), Black / African American (4,638 | 33.5%), and Hispanic or Latino (510 | 3.7%).
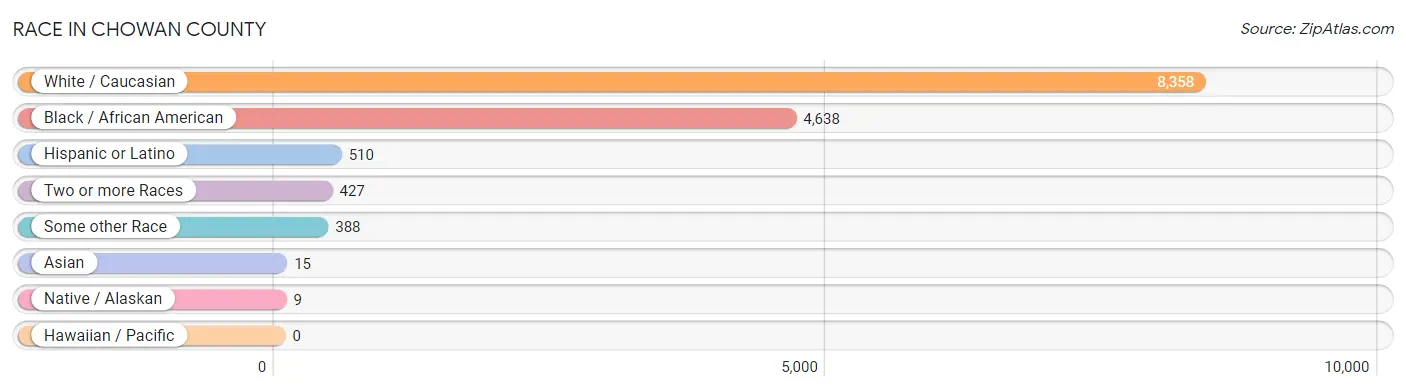
| Race | # Population | % Population |
| Asian | 15 | 0.1% |
| Black / African American | 4,638 | 33.5% |
| Hawaiian / Pacific | 0 | 0.0% |
| Hispanic or Latino | 510 | 3.7% |
| Native / Alaskan | 9 | 0.1% |
| White / Caucasian | 8,358 | 60.4% |
| Two or more Races | 427 | 3.1% |
| Some other Race | 388 | 2.8% |
| Total | 13,835 | 100.0% |
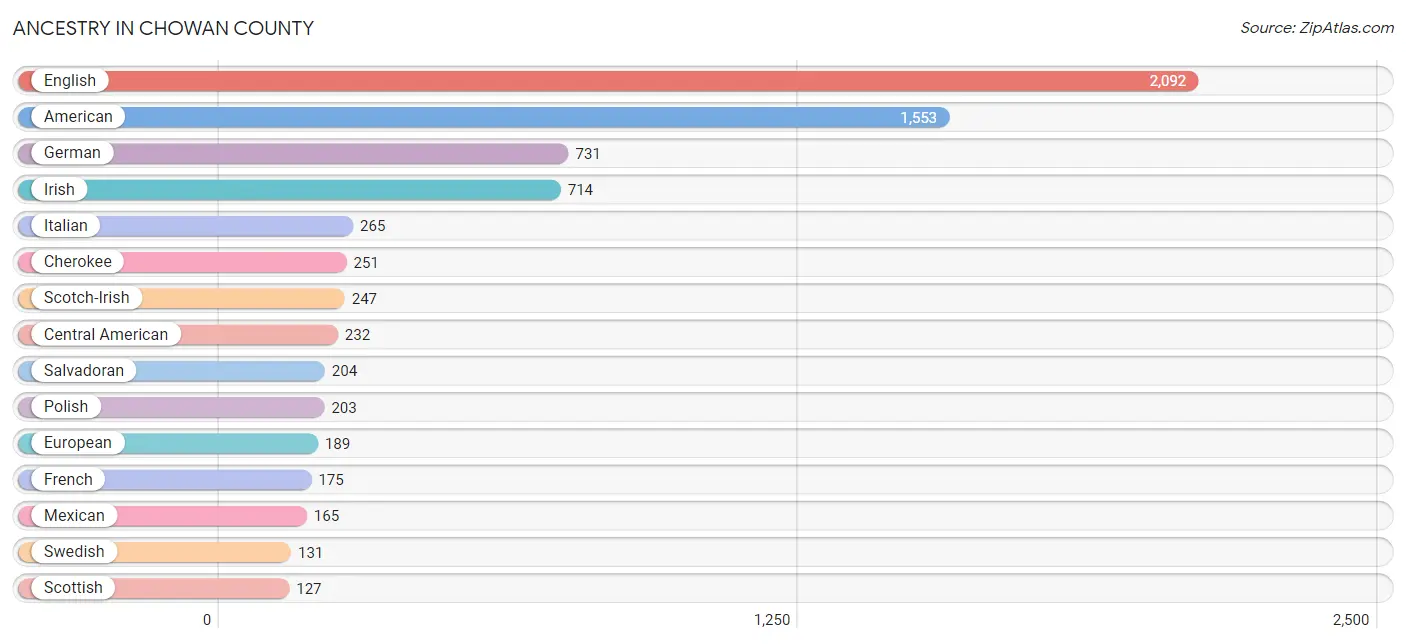
Ancestry in Chowan County
The most populous ancestries reported in Chowan County are English (2,092 | 15.1%), American (1,553 | 11.2%), German (731 | 5.3%), Irish (714 | 5.2%), and Italian (265 | 1.9%), together accounting for 38.7% of all Chowan County residents.
| Ancestry | # Population | % Population |
| African | 103 | 0.7% |
| American | 1,553 | 11.2% |
| Belgian | 5 | 0.0% |
| British | 65 | 0.5% |
| Burmese | 22 | 0.2% |
| Central American | 232 | 1.7% |
| Cherokee | 251 | 1.8% |
| Danish | 18 | 0.1% |
| Delaware | 9 | 0.1% |
| Dutch | 41 | 0.3% |
| English | 2,092 | 15.1% |
| Estonian | 11 | 0.1% |
| European | 189 | 1.4% |
| Finnish | 25 | 0.2% |
| French | 175 | 1.3% |
| German | 731 | 5.3% |
| Greek | 32 | 0.2% |
| Indian (Asian) | 12 | 0.1% |
| Irish | 714 | 5.2% |
| Italian | 265 | 1.9% |
| Mexican | 165 | 1.2% |
| Nigerian | 4 | 0.0% |
| Norwegian | 43 | 0.3% |
| Peruvian | 38 | 0.3% |
| Polish | 203 | 1.5% |
| Puerto Rican | 56 | 0.4% |
| Salvadoran | 204 | 1.5% |
| Scandinavian | 18 | 0.1% |
| Scotch-Irish | 247 | 1.8% |
| Scottish | 127 | 0.9% |
| South American | 38 | 0.3% |
| Subsaharan African | 119 | 0.9% |
| Swedish | 131 | 0.9% |
| Swiss | 7 | 0.1% |
| Ukrainian | 7 | 0.1% | View All 35 Rows |
Immigrants in Chowan County
The most numerous immigrant groups reported in Chowan County came from Latin America (207 | 1.5%), Central America (147 | 1.1%), Mexico (91 | 0.7%), Europe (52 | 0.4%), and Western Europe (45 | 0.3%), together accounting for 3.9% of all Chowan County residents.
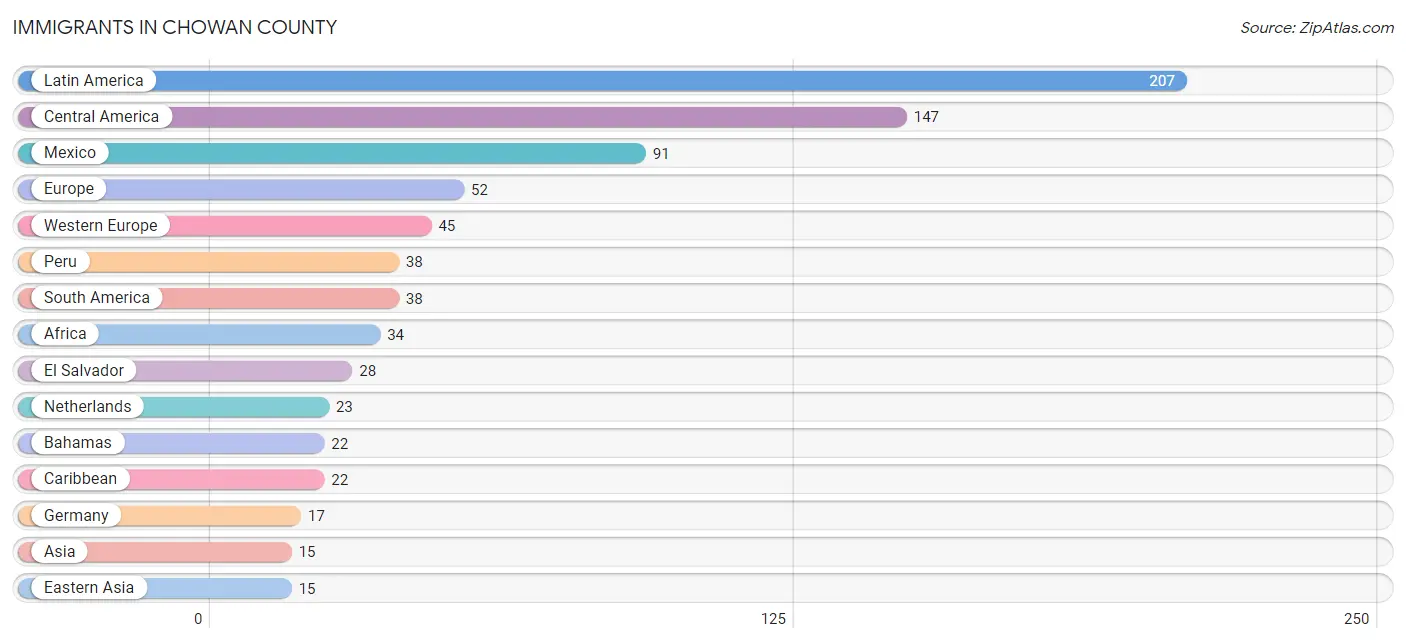
| Immigration Origin | # Population | % Population |
| Africa | 34 | 0.3% |
| Asia | 15 | 0.1% |
| Bahamas | 22 | 0.2% |
| Belgium | 5 | 0.0% |
| Caribbean | 22 | 0.2% |
| Central America | 147 | 1.1% |
| China | 12 | 0.1% |
| Eastern Asia | 15 | 0.1% |
| Eastern Europe | 7 | 0.1% |
| El Salvador | 28 | 0.2% |
| Europe | 52 | 0.4% |
| Germany | 17 | 0.1% |
| Hong Kong | 12 | 0.1% |
| Korea | 3 | 0.0% |
| Latin America | 207 | 1.5% |
| Mexico | 91 | 0.7% |
| Netherlands | 23 | 0.2% |
| Peru | 38 | 0.3% |
| South America | 38 | 0.3% |
| Ukraine | 7 | 0.1% |
| Western Europe | 45 | 0.3% | View All 21 Rows |
Sex and Age in Chowan County
Sex and Age in Chowan County
The most populous age groups in Chowan County are 70 to 74 Years (561 | 8.5%) for men and 55 to 59 Years (648 | 9.0%) for women.
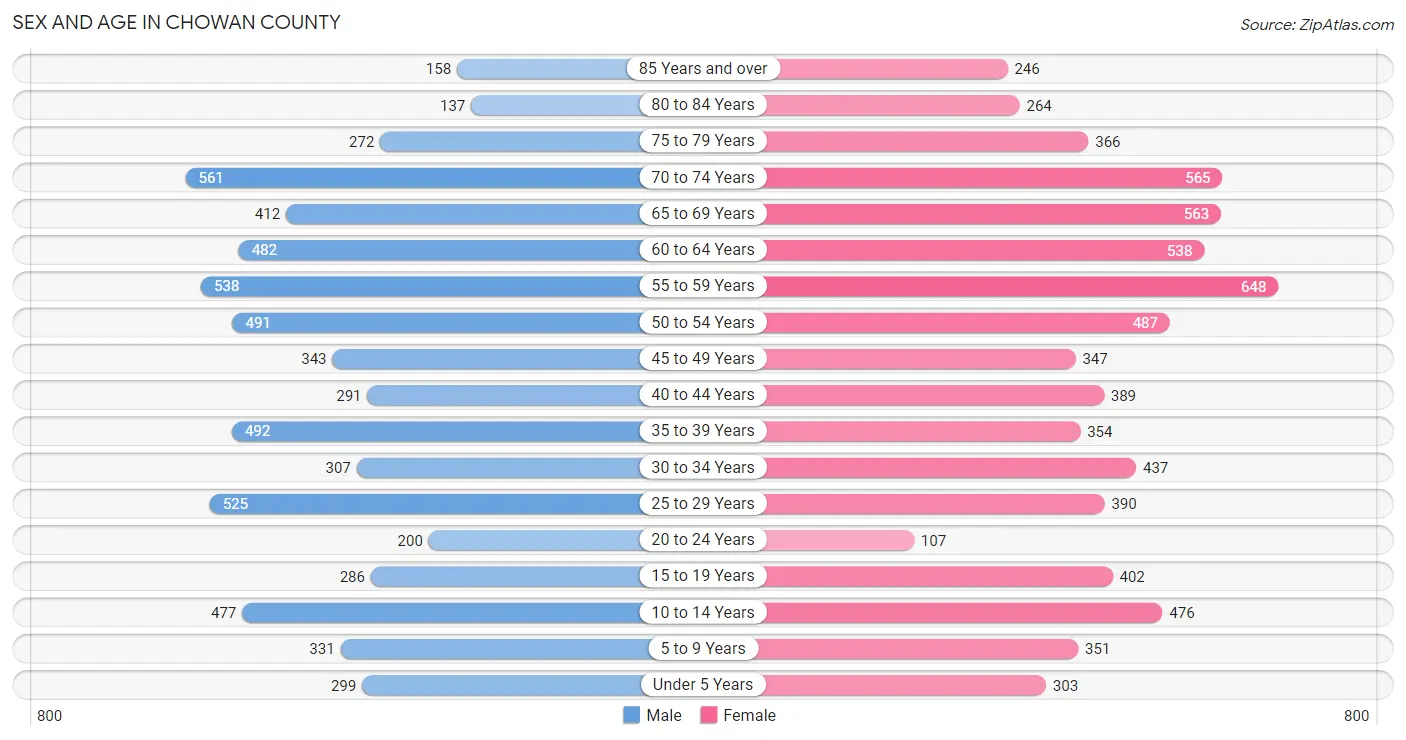
| Age Bracket | Male | Female |
| Under 5 Years | 299 (4.5%) | 303 (4.2%) |
| 5 to 9 Years | 331 (5.0%) | 351 (4.9%) |
| 10 to 14 Years | 477 (7.2%) | 476 (6.6%) |
| 15 to 19 Years | 286 (4.3%) | 402 (5.6%) |
| 20 to 24 Years | 200 (3.0%) | 107 (1.5%) |
| 25 to 29 Years | 525 (8.0%) | 390 (5.4%) |
| 30 to 34 Years | 307 (4.6%) | 437 (6.0%) |
| 35 to 39 Years | 492 (7.4%) | 354 (4.9%) |
| 40 to 44 Years | 291 (4.4%) | 389 (5.4%) |
| 45 to 49 Years | 343 (5.2%) | 347 (4.8%) |
| 50 to 54 Years | 491 (7.4%) | 487 (6.7%) |
| 55 to 59 Years | 538 (8.2%) | 648 (9.0%) |
| 60 to 64 Years | 482 (7.3%) | 538 (7.4%) |
| 65 to 69 Years | 412 (6.2%) | 563 (7.8%) |
| 70 to 74 Years | 561 (8.5%) | 565 (7.8%) |
| 75 to 79 Years | 272 (4.1%) | 366 (5.1%) |
| 80 to 84 Years | 137 (2.1%) | 264 (3.6%) |
| 85 Years and over | 158 (2.4%) | 246 (3.4%) |
| Total | 6,602 (100.0%) | 7,233 (100.0%) |
Families and Households in Chowan County
Median Family Size in Chowan County
The median family size in Chowan County is 2.72 persons per family, with married-couple families (2,927 | 72.4%) accounting for the largest median family size of 2.78 persons per family. On the other hand, single male/father families (270 | 6.7%) represent the smallest median family size with 2.27 persons per family.
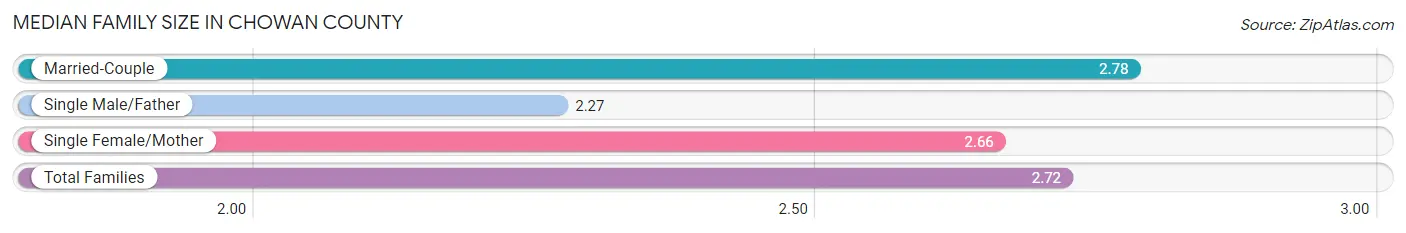
| Family Type | # Families | Family Size |
| Married-Couple | 2,927 (72.4%) | 2.78 |
| Single Male/Father | 270 (6.7%) | 2.27 |
| Single Female/Mother | 846 (20.9%) | 2.66 |
| Total Families | 4,043 (100.0%) | 2.72 |
Median Household Size in Chowan County
The median household size in Chowan County is 2.18 persons per household, with single female/mother households (846 | 13.6%) accounting for the largest median household size of 2.91 persons per household. non-family households (2,173 | 35.0%) represent the smallest median household size with 1.06 persons per household.
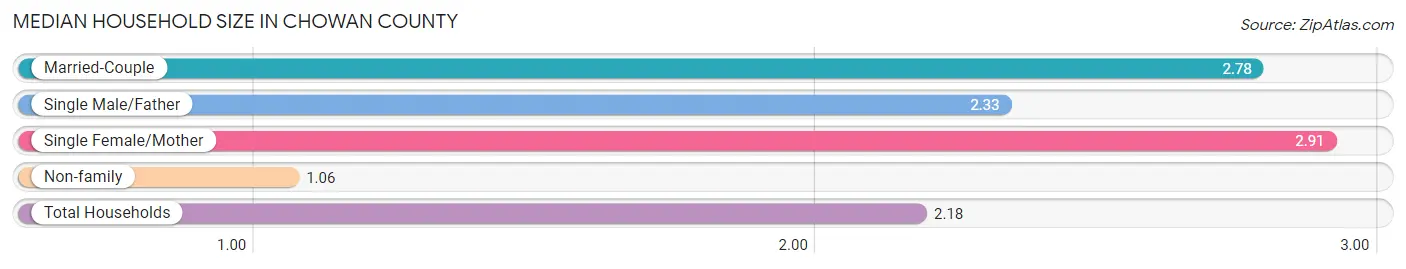
| Household Type | # Households | Household Size |
| Married-Couple | 2,927 (47.1%) | 2.78 |
| Single Male/Father | 270 (4.3%) | 2.33 |
| Single Female/Mother | 846 (13.6%) | 2.91 |
| Non-family | 2,173 (35.0%) | 1.06 |
| Total Households | 6,216 (100.0%) | 2.18 |
Household Size by Marriage Status in Chowan County
Out of a total of 6,216 households in Chowan County, 4,043 (65.0%) are family households, while 2,173 (35.0%) are nonfamily households. The most numerous type of family households are 2-person households, comprising 2,493, and the most common type of nonfamily households are 1-person households, comprising 1,994.
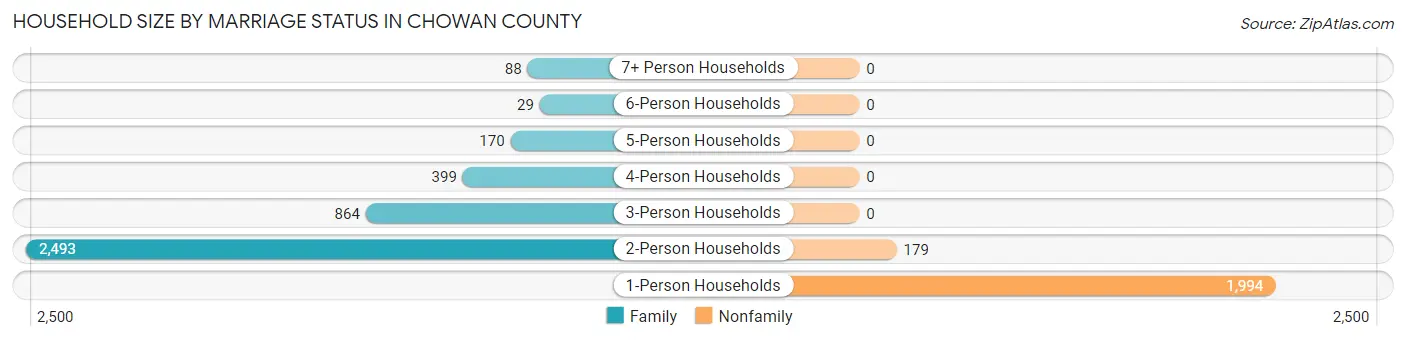
| Household Size | Family Households | Nonfamily Households |
| 1-Person Households | - | 1,994 (32.1%) |
| 2-Person Households | 2,493 (40.1%) | 179 (2.9%) |
| 3-Person Households | 864 (13.9%) | 0 (0.0%) |
| 4-Person Households | 399 (6.4%) | 0 (0.0%) |
| 5-Person Households | 170 (2.7%) | 0 (0.0%) |
| 6-Person Households | 29 (0.5%) | 0 (0.0%) |
| 7+ Person Households | 88 (1.4%) | 0 (0.0%) |
| Total | 4,043 (65.0%) | 2,173 (35.0%) |
Female Fertility in Chowan County
Fertility by Age in Chowan County
Average fertility rate in Chowan County is 74.0 births per 1,000 women. Women in the age bracket of 20 to 34 years have the highest fertility rate with 195.0 births per 1,000 women. Women in the age bracket of 20 to 34 years acount for 97.9% of all women with births.
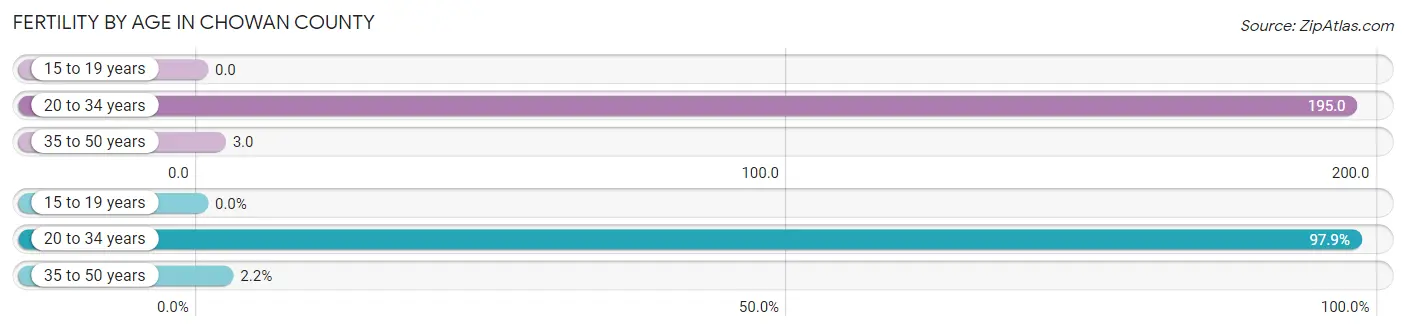
| Age Bracket | Women with Births | Births / 1,000 Women |
| 15 to 19 years | 0 (0.0%) | 0.0 |
| 20 to 34 years | 182 (97.9%) | 195.0 |
| 35 to 50 years | 4 (2.1%) | 3.0 |
| Total | 186 (100.0%) | 74.0 |
Fertility by Age by Marriage Status in Chowan County
21.5% of women with births (186) in Chowan County are married. The highest percentage of unmarried women with births falls into 20 to 34 years age bracket with 80.2% of them unmarried at the time of birth, while the lowest percentage of unmarried women with births belong to 35 to 50 years age bracket with 0.0% of them unmarried.
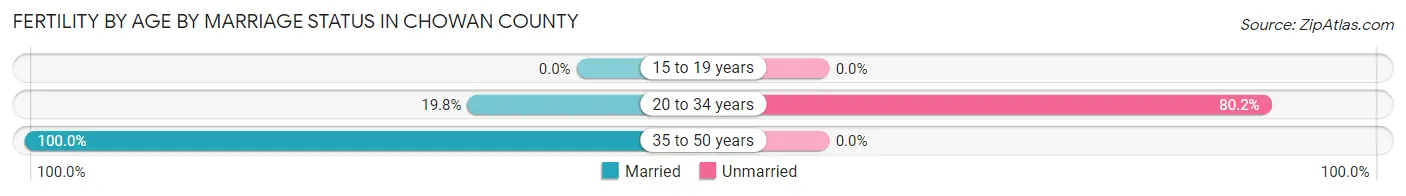
| Age Bracket | Married | Unmarried |
| 15 to 19 years | 0 (0.0%) | 0 (0.0%) |
| 20 to 34 years | 36 (19.8%) | 146 (80.2%) |
| 35 to 50 years | 4 (100.0%) | 0 (0.0%) |
| Total | 40 (21.5%) | 146 (78.5%) |
Fertility by Education in Chowan County
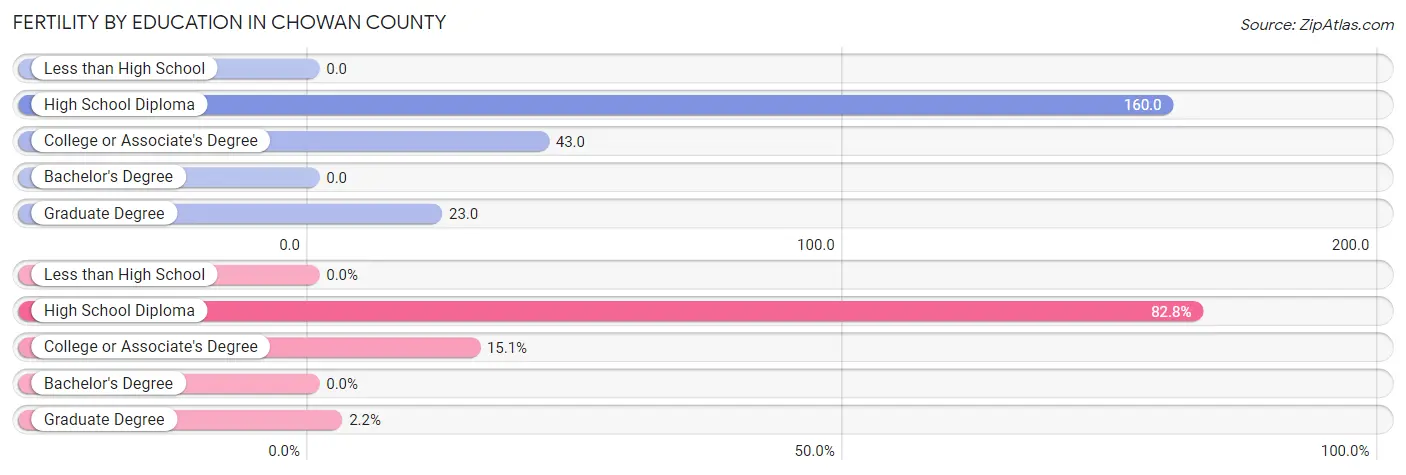
| Educational Attainment | Women with Births | Births / 1,000 Women |
| Less than High School | 0 (0.0%) | 0.0 |
| High School Diploma | 154 (82.8%) | 160.0 |
| College or Associate's Degree | 28 (15.0%) | 43.0 |
| Bachelor's Degree | 0 (0.0%) | 0.0 |
| Graduate Degree | 4 (2.1%) | 23.0 |
| Total | 186 (100.0%) | 74.0 |
Fertility by Education by Marriage Status in Chowan County
78.5% of women with births in Chowan County are unmarried. Women with the educational attainment of graduate degree are most likely to be married with 100.0% of them married at childbirth, while women with the educational attainment of high school diploma are least likely to be married with 87.7% of them unmarried at childbirth.
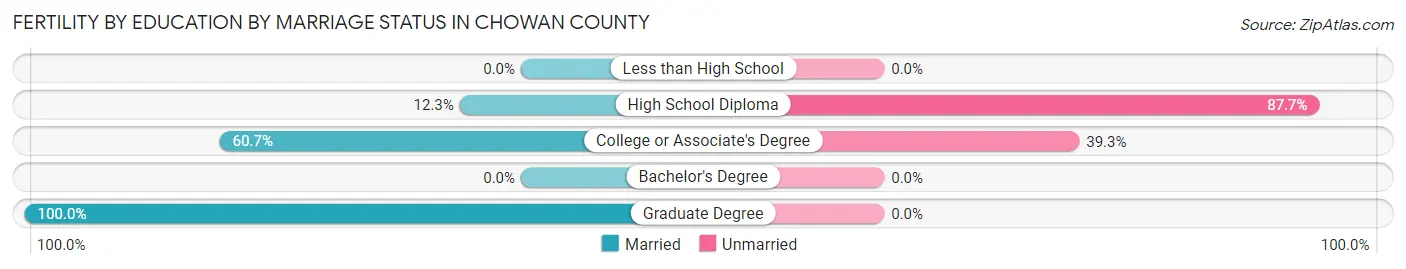
| Educational Attainment | Married | Unmarried |
| Less than High School | 0 (0.0%) | 0 (0.0%) |
| High School Diploma | 19 (12.3%) | 135 (87.7%) |
| College or Associate's Degree | 17 (60.7%) | 11 (39.3%) |
| Bachelor's Degree | 0 (0.0%) | 0 (0.0%) |
| Graduate Degree | 4 (100.0%) | 0 (0.0%) |
| Total | 40 (21.5%) | 146 (78.5%) |
Employment Characteristics in Chowan County
Employment by Class of Employer in Chowan County
Among the 5,623 employed individuals in Chowan County, private company employees (3,184 | 56.6%), not-for-profit organizations (535 | 9.5%), and local government employees (527 | 9.4%) make up the most common classes of employment.
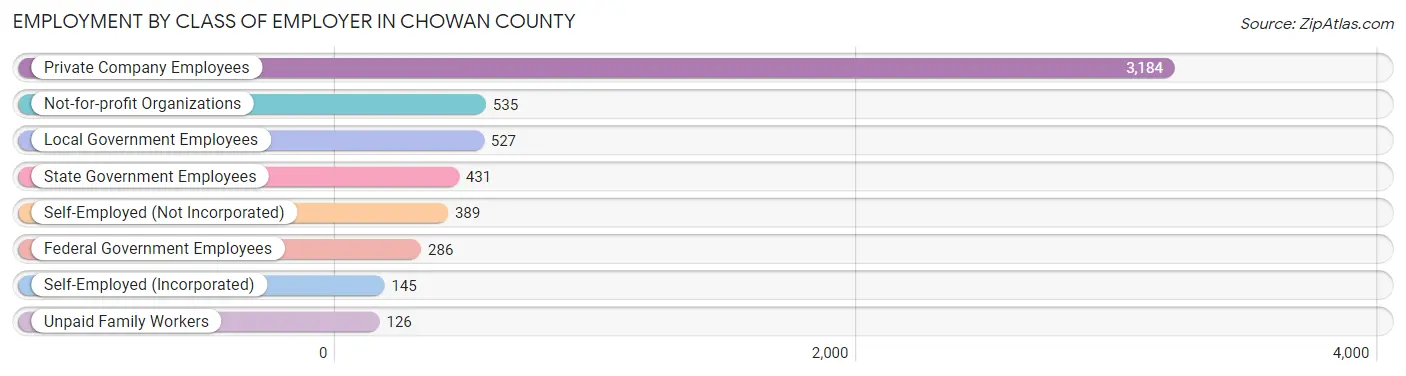
| Employer Class | # Employees | % Employees |
| Private Company Employees | 3,184 | 56.6% |
| Self-Employed (Incorporated) | 145 | 2.6% |
| Self-Employed (Not Incorporated) | 389 | 6.9% |
| Not-for-profit Organizations | 535 | 9.5% |
| Local Government Employees | 527 | 9.4% |
| State Government Employees | 431 | 7.7% |
| Federal Government Employees | 286 | 5.1% |
| Unpaid Family Workers | 126 | 2.2% |
| Total | 5,623 | 100.0% |
Employment Status by Age in Chowan County
According to the labor force statistics for Chowan County, out of the total population over 16 years of age (11,453), 54.2% or 6,208 individuals are in the labor force, with 4.3% or 267 of them unemployed. The age group with the highest labor force participation rate is 25 to 29 years, with 93.9% or 859 individuals in the labor force. Within the labor force, the 30 to 34 years age range has the highest percentage of unemployed individuals, with 12.9% or 87 of them being unemployed.
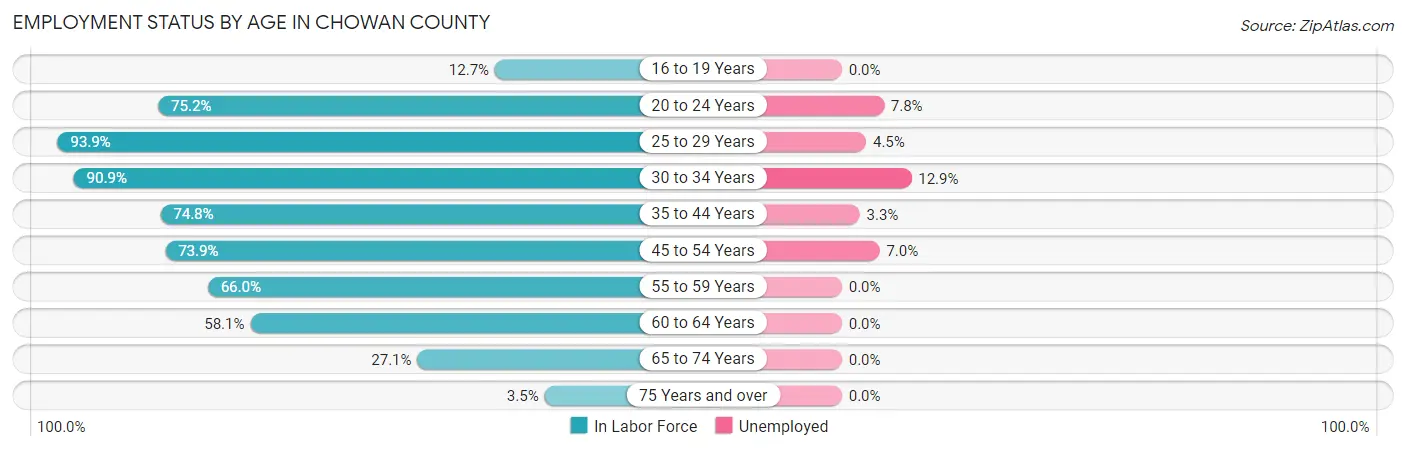
| Age Bracket | In Labor Force | Unemployed |
| 16 to 19 Years | 69 (12.7%) | 0 (0.0%) |
| 20 to 24 Years | 231 (75.2%) | 18 (7.8%) |
| 25 to 29 Years | 859 (93.9%) | 39 (4.5%) |
| 30 to 34 Years | 676 (90.9%) | 87 (12.9%) |
| 35 to 44 Years | 1,141 (74.8%) | 38 (3.3%) |
| 45 to 54 Years | 1,233 (73.9%) | 86 (7.0%) |
| 55 to 59 Years | 783 (66.0%) | 0 (0.0%) |
| 60 to 64 Years | 593 (58.1%) | 0 (0.0%) |
| 65 to 74 Years | 569 (27.1%) | 0 (0.0%) |
| 75 Years and over | 51 (3.5%) | 0 (0.0%) |
| Total | 6,208 (54.2%) | 267 (4.3%) |
Employment Status by Educational Attainment in Chowan County
According to labor force statistics for Chowan County, 74.9% of individuals (5,287) out of the total population between 25 and 64 years of age (7,059) are in the labor force, with 4.7% or 248 of them being unemployed. The group with the highest labor force participation rate are those with the educational attainment of college / associate degree, with 83.0% or 1,721 individuals in the labor force. Within the labor force, individuals with less than high school education have the highest percentage of unemployment, with 11.5% or 61 of them being unemployed.
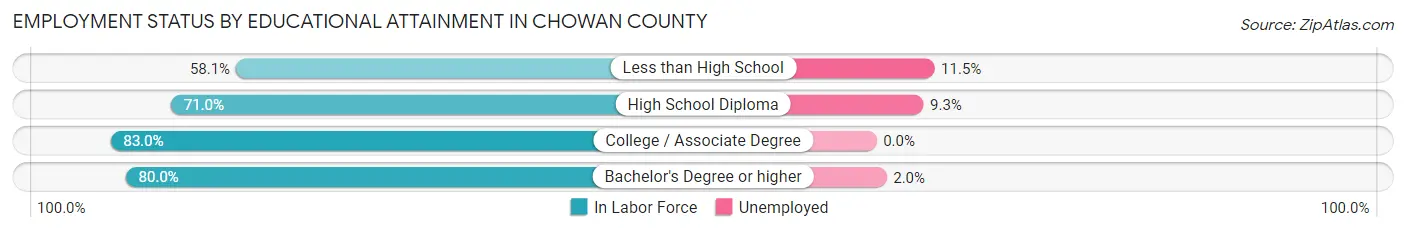
| Educational Attainment | In Labor Force | Unemployed |
| Less than High School | 530 (58.1%) | 105 (11.5%) |
| High School Diploma | 1,771 (71.0%) | 232 (9.3%) |
| College / Associate Degree | 1,721 (83.0%) | 0 (0.0%) |
| Bachelor's Degree or higher | 1,262 (80.0%) | 32 (2.0%) |
| Total | 5,287 (74.9%) | 332 (4.7%) |
Employment Occupations by Sex in Chowan County
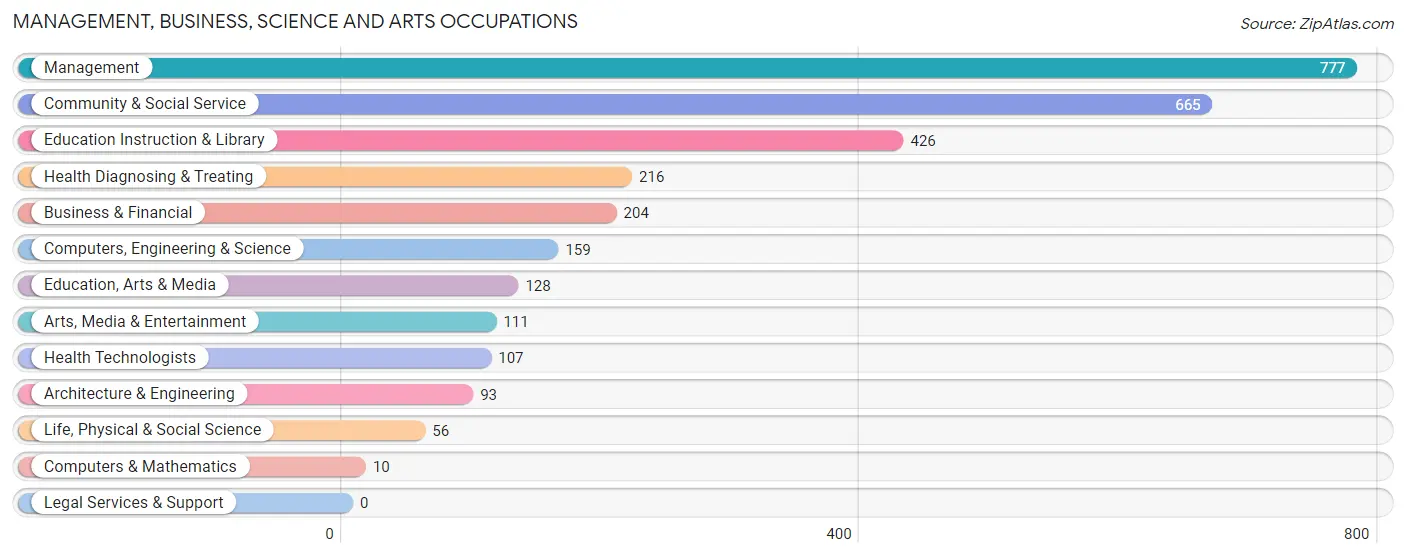
Management, Business, Science and Arts Occupations
The most common Management, Business, Science and Arts occupations in Chowan County are Management (777 | 13.1%), Community & Social Service (665 | 11.2%), Education Instruction & Library (426 | 7.2%), Health Diagnosing & Treating (216 | 3.6%), and Business & Financial (204 | 3.4%).
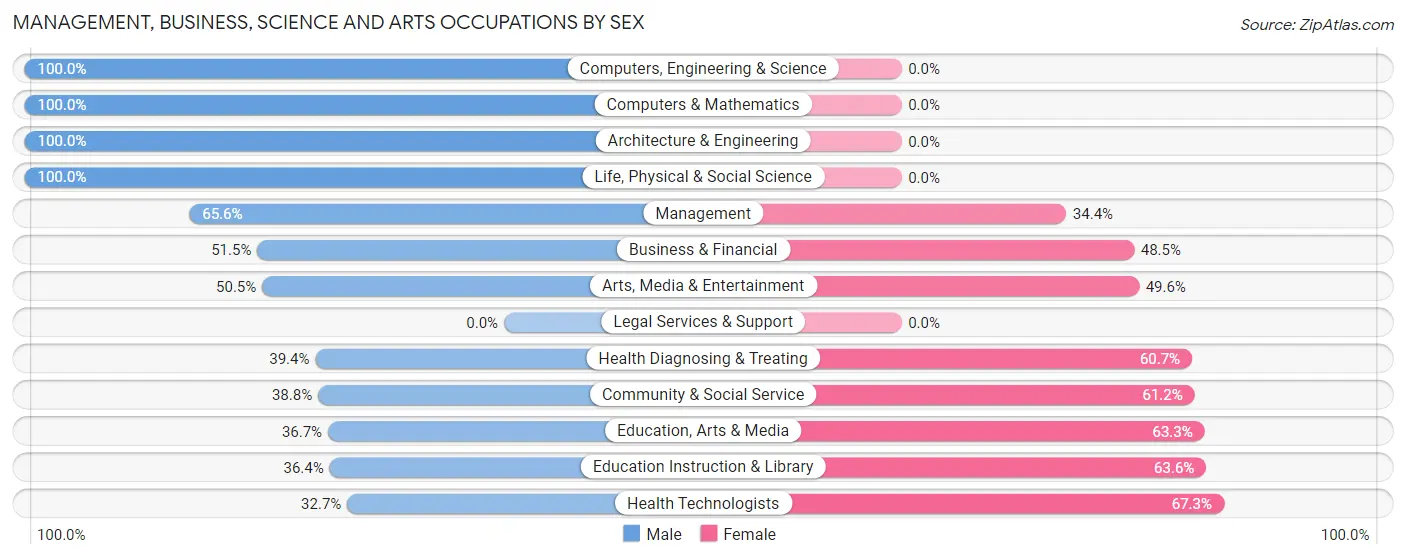
Management, Business, Science and Arts Occupations by Sex
Within the Management, Business, Science and Arts occupations in Chowan County, the most male-oriented occupations are Computers, Engineering & Science (100.0%), Computers & Mathematics (100.0%), and Architecture & Engineering (100.0%), while the most female-oriented occupations are Health Technologists (67.3%), Education Instruction & Library (63.6%), and Education, Arts & Media (63.3%).
| Occupation | Male | Female |
| Management | 510 (65.6%) | 267 (34.4%) |
| Business & Financial | 105 (51.5%) | 99 (48.5%) |
| Computers, Engineering & Science | 159 (100.0%) | 0 (0.0%) |
| Computers & Mathematics | 10 (100.0%) | 0 (0.0%) |
| Architecture & Engineering | 93 (100.0%) | 0 (0.0%) |
| Life, Physical & Social Science | 56 (100.0%) | 0 (0.0%) |
| Community & Social Service | 258 (38.8%) | 407 (61.2%) |
| Education, Arts & Media | 47 (36.7%) | 81 (63.3%) |
| Legal Services & Support | 0 (0.0%) | 0 (0.0%) |
| Education Instruction & Library | 155 (36.4%) | 271 (63.6%) |
| Arts, Media & Entertainment | 56 (50.4%) | 55 (49.5%) |
| Health Diagnosing & Treating | 85 (39.4%) | 131 (60.7%) |
| Health Technologists | 35 (32.7%) | 72 (67.3%) |
| Total (Category) | 1,117 (55.3%) | 904 (44.7%) |
| Total (Overall) | 3,096 (52.3%) | 2,826 (47.7%) |
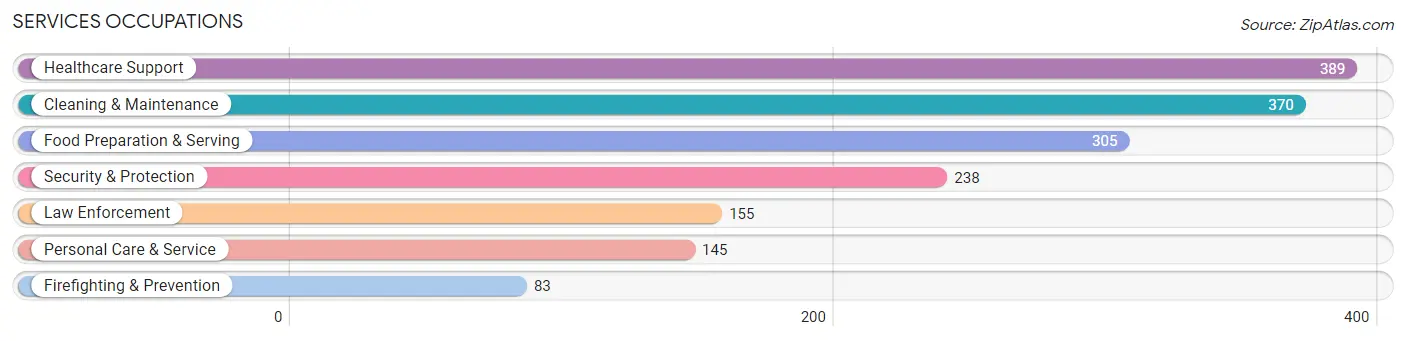
Services Occupations
The most common Services occupations in Chowan County are Healthcare Support (389 | 6.6%), Cleaning & Maintenance (370 | 6.2%), Food Preparation & Serving (305 | 5.1%), Security & Protection (238 | 4.0%), and Law Enforcement (155 | 2.6%).
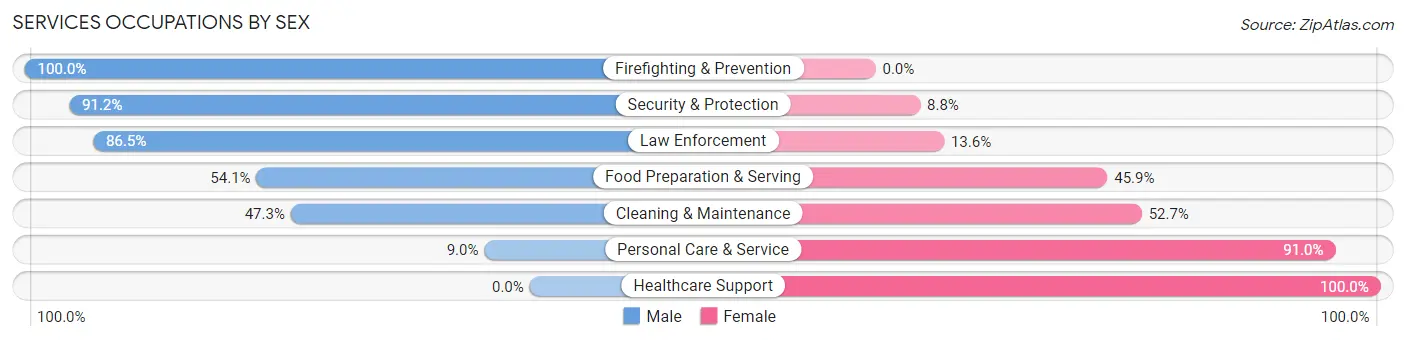
Services Occupations by Sex
Within the Services occupations in Chowan County, the most male-oriented occupations are Firefighting & Prevention (100.0%), Security & Protection (91.2%), and Law Enforcement (86.5%), while the most female-oriented occupations are Healthcare Support (100.0%), Personal Care & Service (91.0%), and Cleaning & Maintenance (52.7%).
| Occupation | Male | Female |
| Healthcare Support | 0 (0.0%) | 389 (100.0%) |
| Security & Protection | 217 (91.2%) | 21 (8.8%) |
| Firefighting & Prevention | 83 (100.0%) | 0 (0.0%) |
| Law Enforcement | 134 (86.5%) | 21 (13.6%) |
| Food Preparation & Serving | 165 (54.1%) | 140 (45.9%) |
| Cleaning & Maintenance | 175 (47.3%) | 195 (52.7%) |
| Personal Care & Service | 13 (9.0%) | 132 (91.0%) |
| Total (Category) | 570 (39.4%) | 877 (60.6%) |
| Total (Overall) | 3,096 (52.3%) | 2,826 (47.7%) |
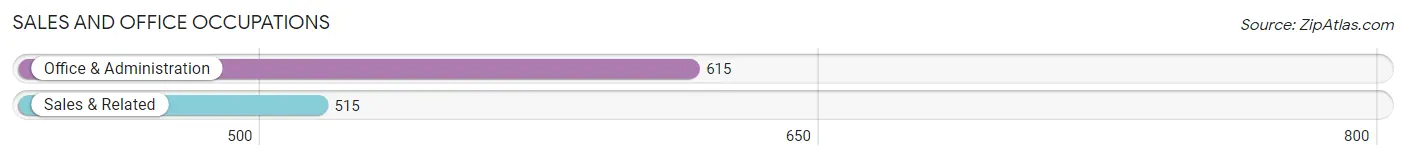
Sales and Office Occupations
The most common Sales and Office occupations in Chowan County are Office & Administration (615 | 10.4%), and Sales & Related (515 | 8.7%).
Sales and Office Occupations by Sex
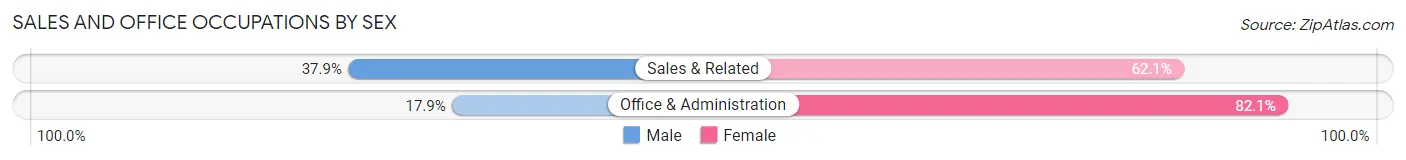
| Occupation | Male | Female |
| Sales & Related | 195 (37.9%) | 320 (62.1%) |
| Office & Administration | 110 (17.9%) | 505 (82.1%) |
| Total (Category) | 305 (27.0%) | 825 (73.0%) |
| Total (Overall) | 3,096 (52.3%) | 2,826 (47.7%) |
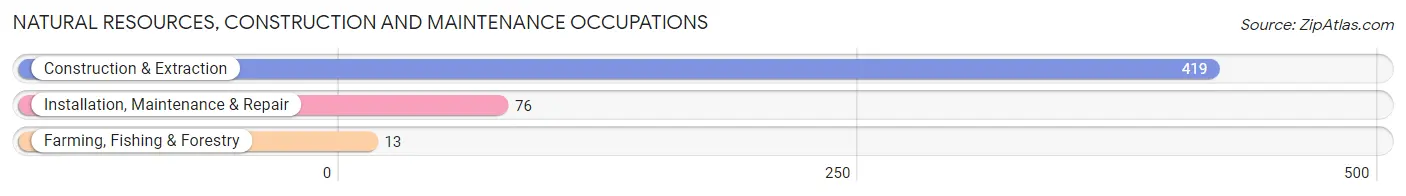
Natural Resources, Construction and Maintenance Occupations
The most common Natural Resources, Construction and Maintenance occupations in Chowan County are Construction & Extraction (419 | 7.1%), Installation, Maintenance & Repair (76 | 1.3%), and Farming, Fishing & Forestry (13 | 0.2%).
Natural Resources, Construction and Maintenance Occupations by Sex
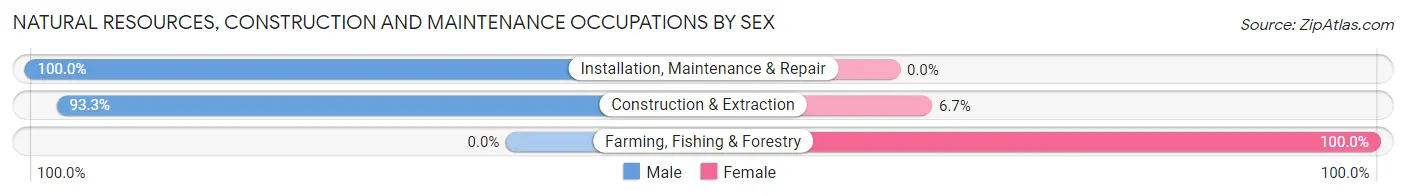
| Occupation | Male | Female |
| Farming, Fishing & Forestry | 0 (0.0%) | 13 (100.0%) |
| Construction & Extraction | 391 (93.3%) | 28 (6.7%) |
| Installation, Maintenance & Repair | 76 (100.0%) | 0 (0.0%) |
| Total (Category) | 467 (91.9%) | 41 (8.1%) |
| Total (Overall) | 3,096 (52.3%) | 2,826 (47.7%) |
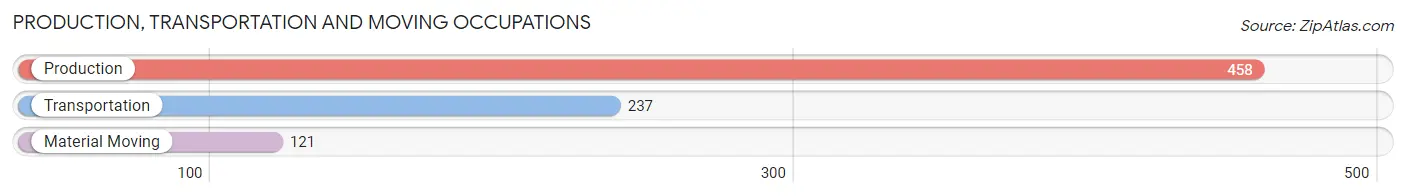
Production, Transportation and Moving Occupations
The most common Production, Transportation and Moving occupations in Chowan County are Production (458 | 7.7%), Transportation (237 | 4.0%), and Material Moving (121 | 2.0%).
Production, Transportation and Moving Occupations by Sex
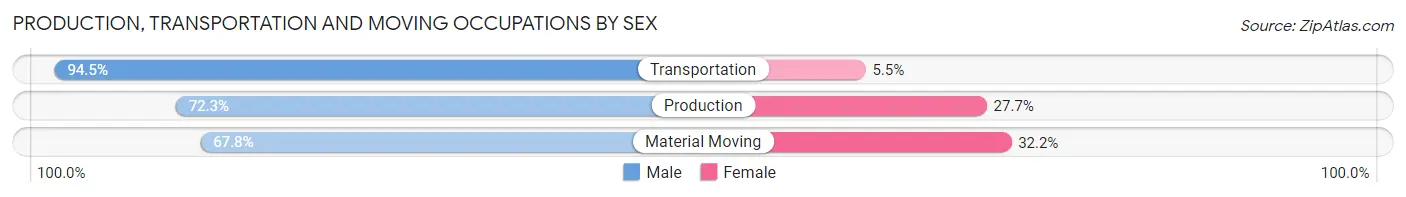
| Occupation | Male | Female |
| Production | 331 (72.3%) | 127 (27.7%) |
| Transportation | 224 (94.5%) | 13 (5.5%) |
| Material Moving | 82 (67.8%) | 39 (32.2%) |
| Total (Category) | 637 (78.1%) | 179 (21.9%) |
| Total (Overall) | 3,096 (52.3%) | 2,826 (47.7%) |
Employment Industries by Sex in Chowan County
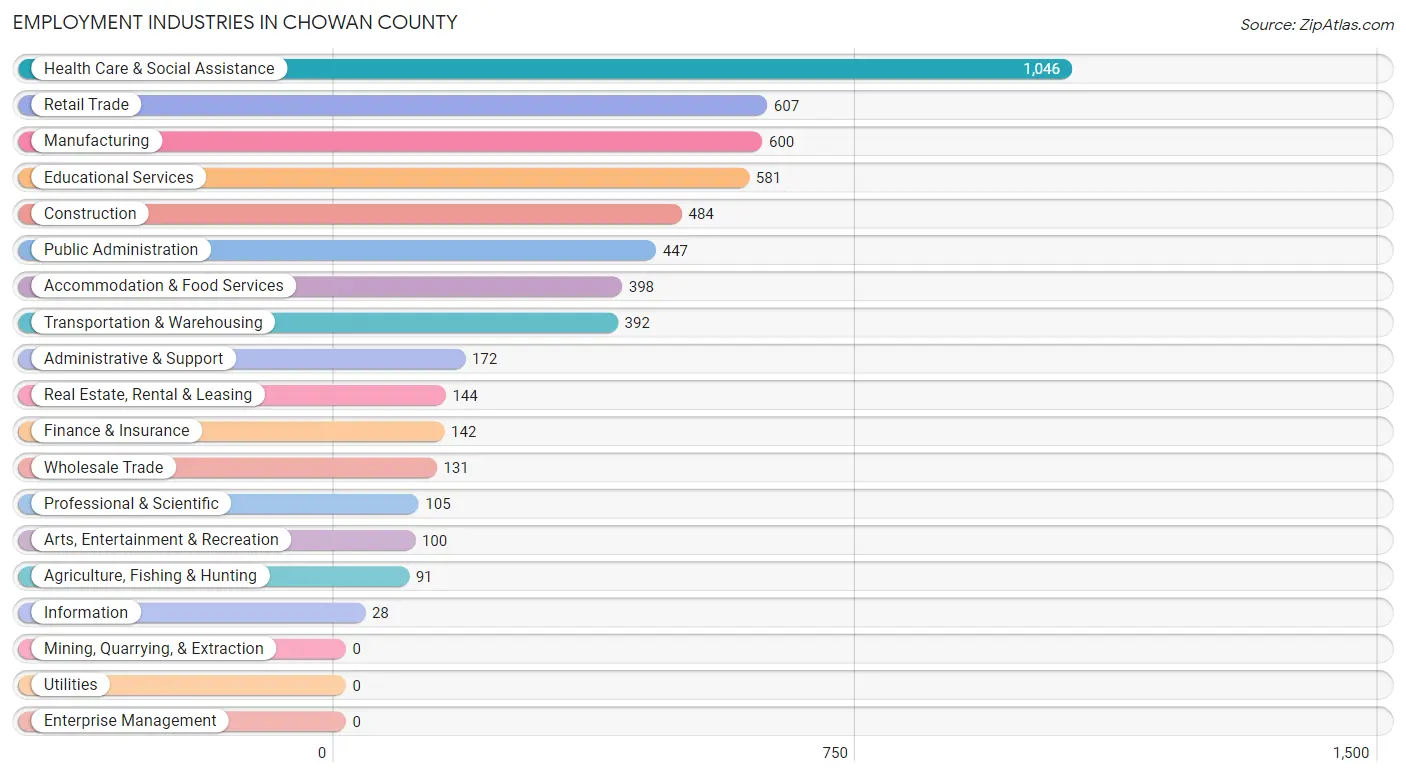
Employment Industries in Chowan County
The major employment industries in Chowan County include Health Care & Social Assistance (1,046 | 17.7%), Retail Trade (607 | 10.2%), Manufacturing (600 | 10.1%), Educational Services (581 | 9.8%), and Construction (484 | 8.2%).
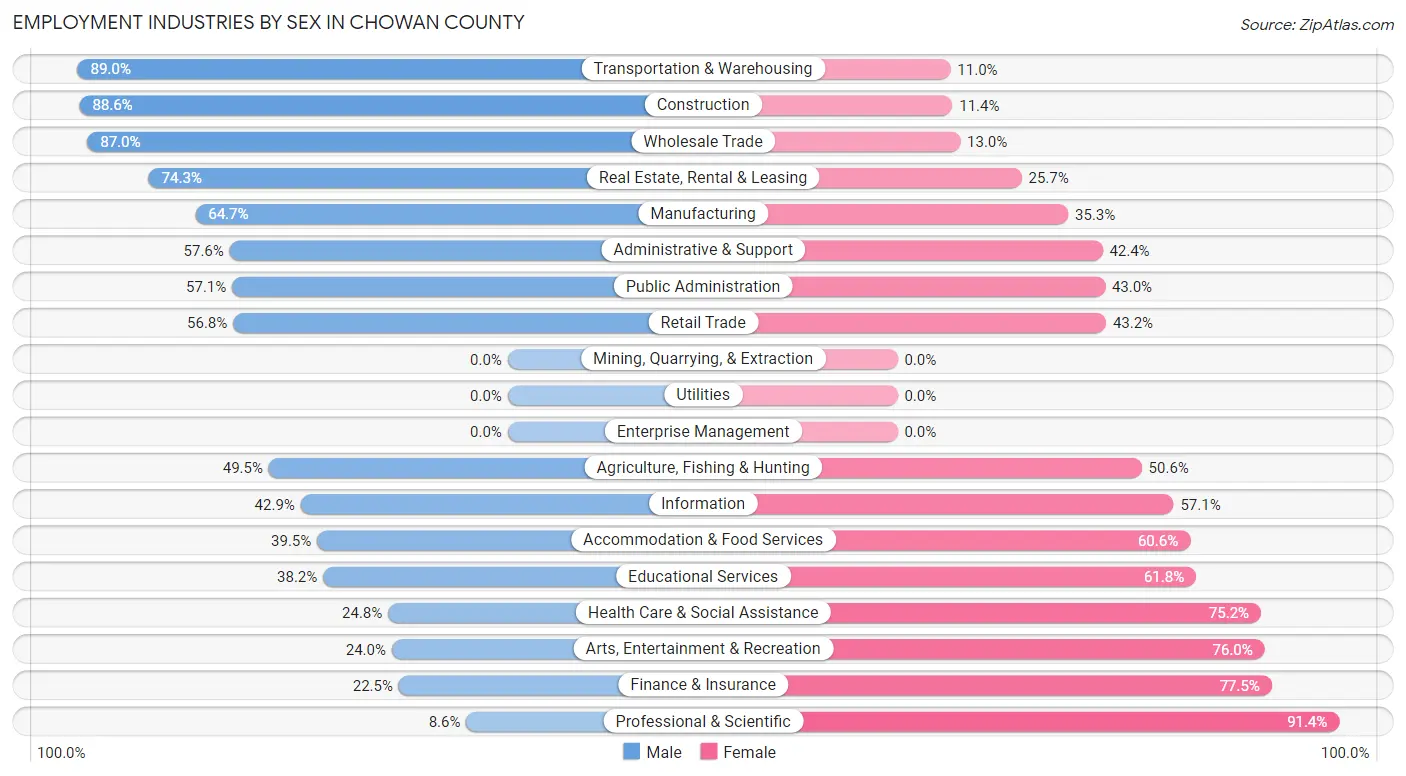
Employment Industries by Sex in Chowan County
The Chowan County industries that see more men than women are Transportation & Warehousing (89.0%), Construction (88.6%), and Wholesale Trade (87.0%), whereas the industries that tend to have a higher number of women are Professional & Scientific (91.4%), Finance & Insurance (77.5%), and Arts, Entertainment & Recreation (76.0%).
| Industry | Male | Female |
| Agriculture, Fishing & Hunting | 45 (49.4%) | 46 (50.5%) |
| Mining, Quarrying, & Extraction | 0 (0.0%) | 0 (0.0%) |
| Construction | 429 (88.6%) | 55 (11.4%) |
| Manufacturing | 388 (64.7%) | 212 (35.3%) |
| Wholesale Trade | 114 (87.0%) | 17 (13.0%) |
| Retail Trade | 345 (56.8%) | 262 (43.2%) |
| Transportation & Warehousing | 349 (89.0%) | 43 (11.0%) |
| Utilities | 0 (0.0%) | 0 (0.0%) |
| Information | 12 (42.9%) | 16 (57.1%) |
| Finance & Insurance | 32 (22.5%) | 110 (77.5%) |
| Real Estate, Rental & Leasing | 107 (74.3%) | 37 (25.7%) |
| Professional & Scientific | 9 (8.6%) | 96 (91.4%) |
| Enterprise Management | 0 (0.0%) | 0 (0.0%) |
| Administrative & Support | 99 (57.6%) | 73 (42.4%) |
| Educational Services | 222 (38.2%) | 359 (61.8%) |
| Health Care & Social Assistance | 259 (24.8%) | 787 (75.2%) |
| Arts, Entertainment & Recreation | 24 (24.0%) | 76 (76.0%) |
| Accommodation & Food Services | 157 (39.5%) | 241 (60.6%) |
| Public Administration | 255 (57.1%) | 192 (42.9%) |
| Total | 3,096 (52.3%) | 2,826 (47.7%) |
Education in Chowan County
School Enrollment in Chowan County
The most common levels of schooling among the 2,795 students in Chowan County are high school (837 | 29.9%), elementary school (628 | 22.5%), and middle school (487 | 17.4%).
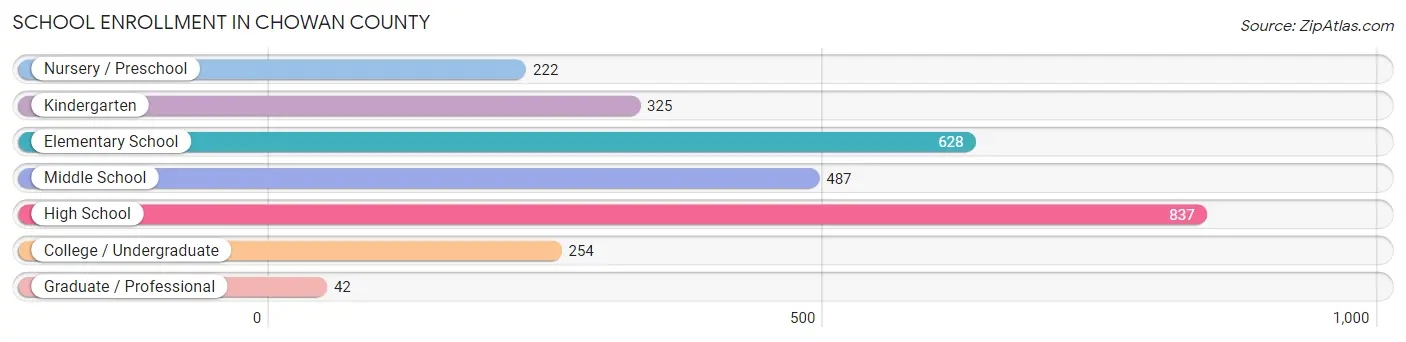
| School Level | # Students | % Students |
| Nursery / Preschool | 222 | 7.9% |
| Kindergarten | 325 | 11.6% |
| Elementary School | 628 | 22.5% |
| Middle School | 487 | 17.4% |
| High School | 837 | 29.9% |
| College / Undergraduate | 254 | 9.1% |
| Graduate / Professional | 42 | 1.5% |
| Total | 2,795 | 100.0% |
School Enrollment by Age by Funding Source in Chowan County
Out of a total of 2,795 students who are enrolled in schools in Chowan County, 693 (24.8%) attend a private institution, while the remaining 2,102 (75.2%) are enrolled in public schools. The age group of 3 to 4 year olds has the highest likelihood of being enrolled in private schools, with 131 (79.9% in the age bracket) enrolled. Conversely, the age group of 25 to 34 year olds has the lowest likelihood of being enrolled in a private school, with 69 (100.0% in the age bracket) attending a public institution.
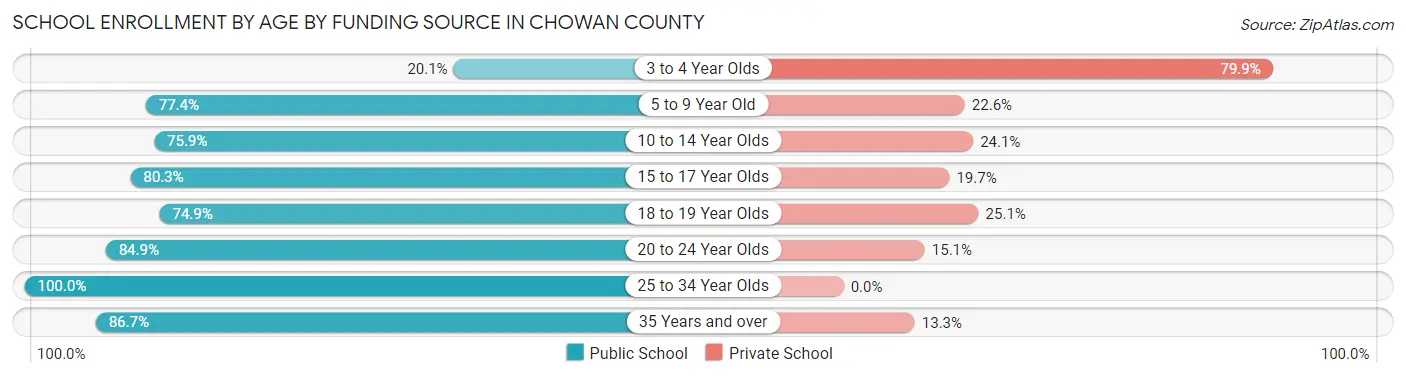
| Age Bracket | Public School | Private School |
| 3 to 4 Year Olds | 33 (20.1%) | 131 (79.9%) |
| 5 to 9 Year Old | 528 (77.4%) | 154 (22.6%) |
| 10 to 14 Year Olds | 723 (75.9%) | 230 (24.1%) |
| 15 to 17 Year Olds | 383 (80.3%) | 94 (19.7%) |
| 18 to 19 Year Olds | 137 (74.9%) | 46 (25.1%) |
| 20 to 24 Year Olds | 73 (84.9%) | 13 (15.1%) |
| 25 to 34 Year Olds | 69 (100.0%) | 0 (0.0%) |
| 35 Years and over | 157 (86.7%) | 24 (13.3%) |
| Total | 2,102 (75.2%) | 693 (24.8%) |
Educational Attainment by Field of Study in Chowan County
Education (495 | 17.5%), business (461 | 16.3%), bio, nature & agricultural (340 | 12.0%), liberal arts & history (273 | 9.6%), and science & technology (215 | 7.6%) are the most common fields of study among 2,834 individuals in Chowan County who have obtained a bachelor's degree or higher.
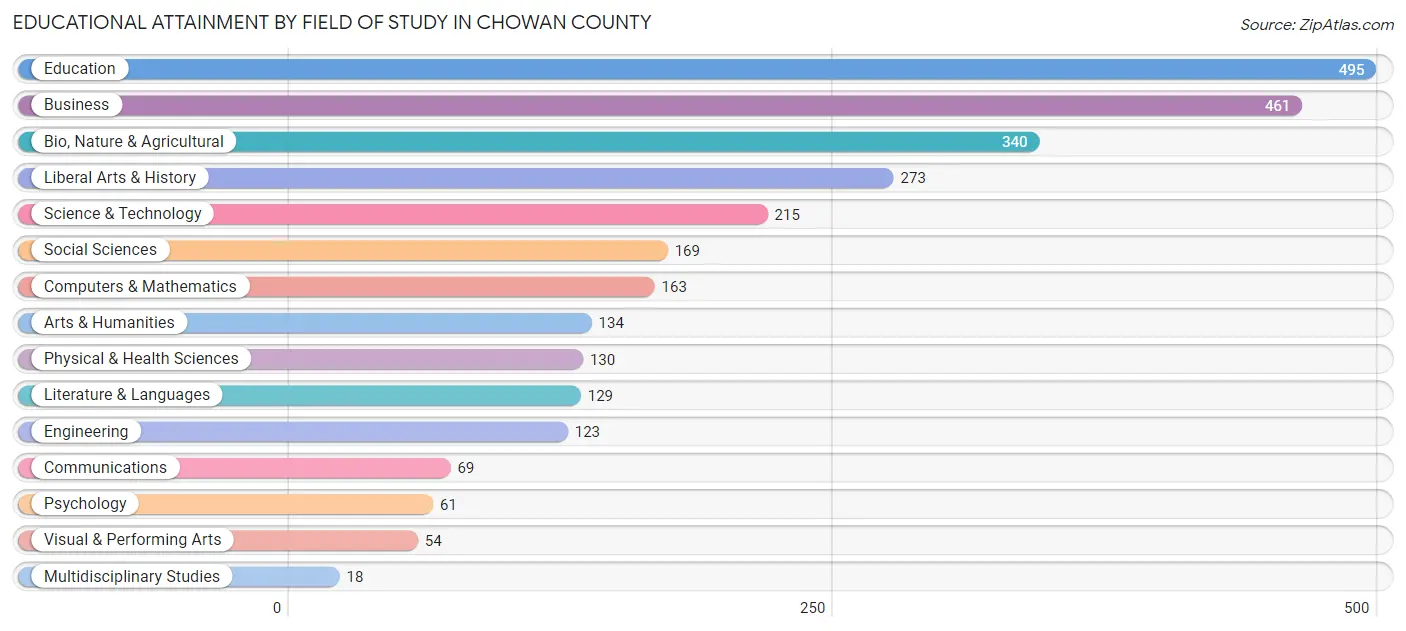
| Field of Study | # Graduates | % Graduates |
| Computers & Mathematics | 163 | 5.8% |
| Bio, Nature & Agricultural | 340 | 12.0% |
| Physical & Health Sciences | 130 | 4.6% |
| Psychology | 61 | 2.1% |
| Social Sciences | 169 | 6.0% |
| Engineering | 123 | 4.3% |
| Multidisciplinary Studies | 18 | 0.6% |
| Science & Technology | 215 | 7.6% |
| Business | 461 | 16.3% |
| Education | 495 | 17.5% |
| Literature & Languages | 129 | 4.5% |
| Liberal Arts & History | 273 | 9.6% |
| Visual & Performing Arts | 54 | 1.9% |
| Communications | 69 | 2.4% |
| Arts & Humanities | 134 | 4.7% |
| Total | 2,834 | 100.0% |
Transportation & Commute in Chowan County
Vehicle Availability by Sex in Chowan County
The most prevalent vehicle ownership categories in Chowan County are males with 2 vehicles (1,346, accounting for 44.4%) and females with 2 vehicles (1,023, making up 52.1%).
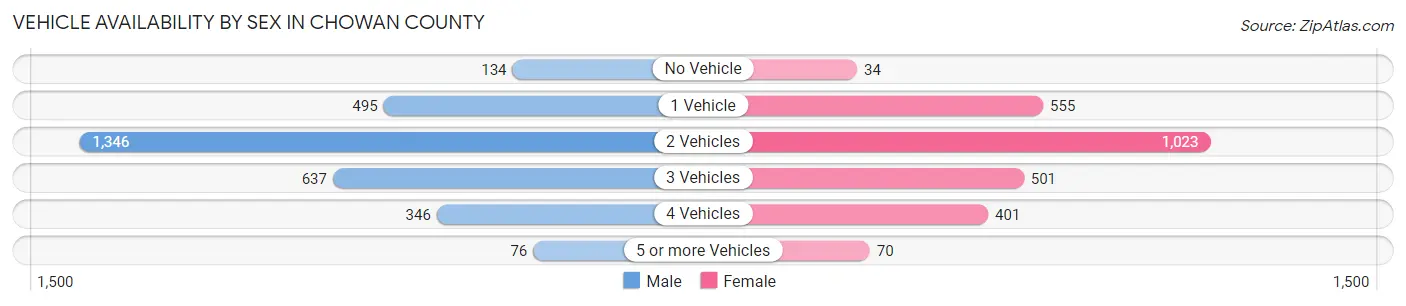
| Vehicles Available | Male | Female |
| No Vehicle | 134 (4.4%) | 34 (1.3%) |
| 1 Vehicle | 495 (16.3%) | 555 (21.5%) |
| 2 Vehicles | 1,346 (44.4%) | 1,023 (39.6%) |
| 3 Vehicles | 637 (21.0%) | 501 (19.4%) |
| 4 Vehicles | 346 (11.4%) | 401 (15.5%) |
| 5 or more Vehicles | 76 (2.5%) | 70 (2.7%) |
| Total | 3,034 (100.0%) | 2,584 (100.0%) |
Commute Time in Chowan County
The most frequently occuring commute durations in Chowan County are 5 to 9 minutes (1,014 commuters, 18.8%), 10 to 14 minutes (696 commuters, 12.9%), and 20 to 24 minutes (678 commuters, 12.6%).
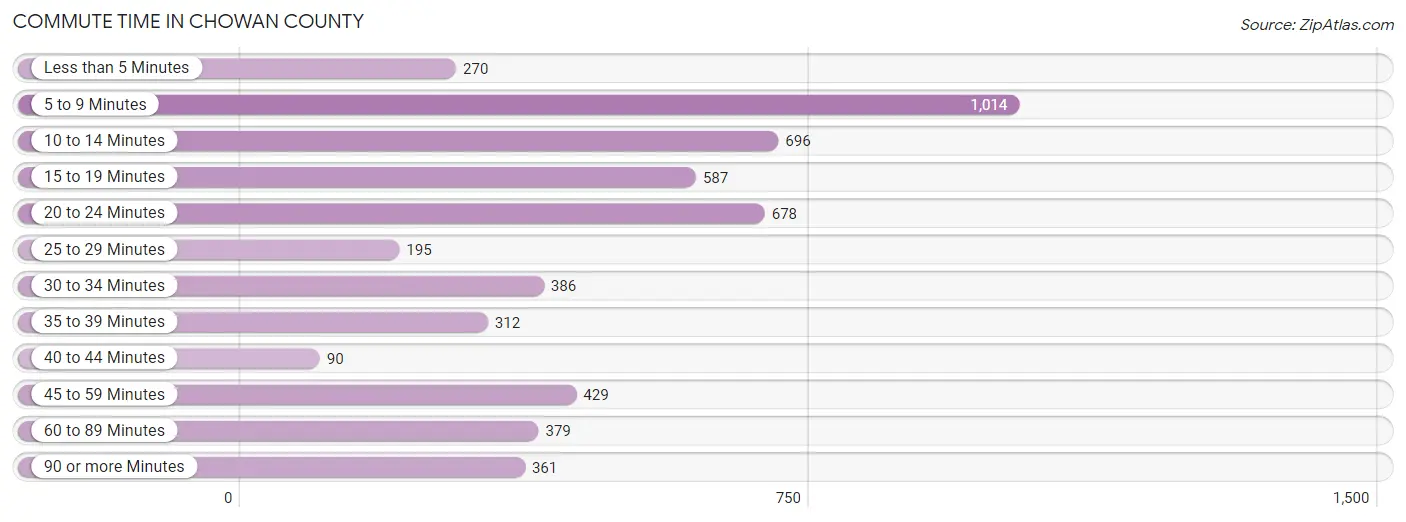
| Commute Time | # Commuters | % Commuters |
| Less than 5 Minutes | 270 | 5.0% |
| 5 to 9 Minutes | 1,014 | 18.8% |
| 10 to 14 Minutes | 696 | 12.9% |
| 15 to 19 Minutes | 587 | 10.9% |
| 20 to 24 Minutes | 678 | 12.6% |
| 25 to 29 Minutes | 195 | 3.6% |
| 30 to 34 Minutes | 386 | 7.1% |
| 35 to 39 Minutes | 312 | 5.8% |
| 40 to 44 Minutes | 90 | 1.7% |
| 45 to 59 Minutes | 429 | 8.0% |
| 60 to 89 Minutes | 379 | 7.0% |
| 90 or more Minutes | 361 | 6.7% |
Commute Time by Sex in Chowan County
The most common commute times in Chowan County are 5 to 9 minutes (572 commuters, 19.5%) for males and 5 to 9 minutes (442 commuters, 17.9%) for females.
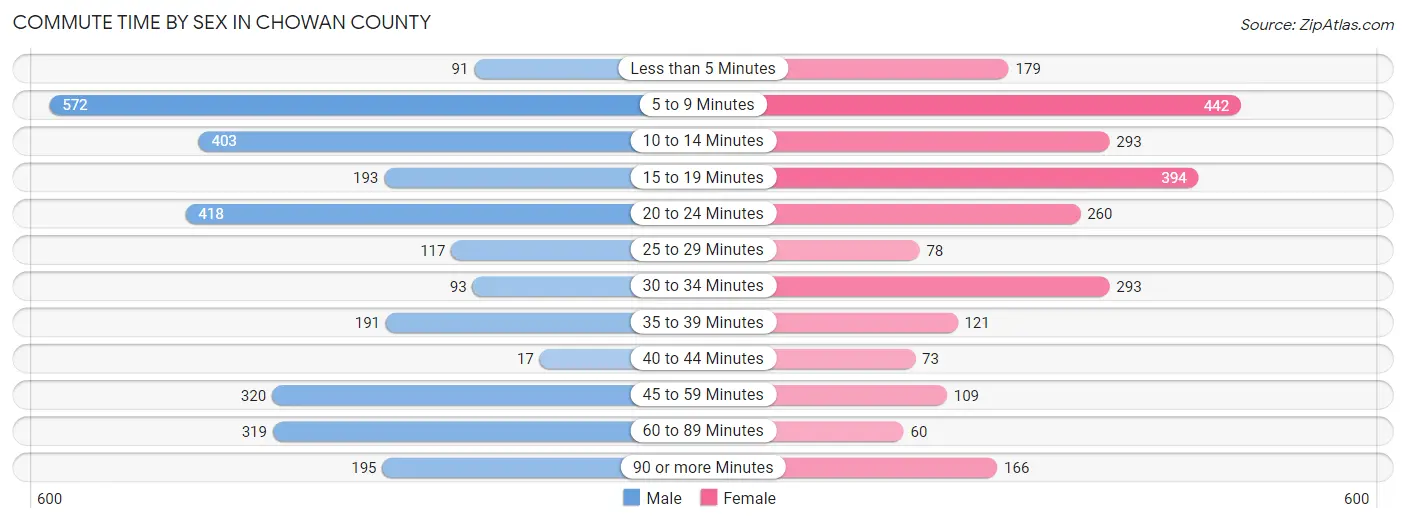
| Commute Time | Male | Female |
| Less than 5 Minutes | 91 (3.1%) | 179 (7.2%) |
| 5 to 9 Minutes | 572 (19.5%) | 442 (17.9%) |
| 10 to 14 Minutes | 403 (13.8%) | 293 (11.9%) |
| 15 to 19 Minutes | 193 (6.6%) | 394 (16.0%) |
| 20 to 24 Minutes | 418 (14.3%) | 260 (10.5%) |
| 25 to 29 Minutes | 117 (4.0%) | 78 (3.2%) |
| 30 to 34 Minutes | 93 (3.2%) | 293 (11.9%) |
| 35 to 39 Minutes | 191 (6.5%) | 121 (4.9%) |
| 40 to 44 Minutes | 17 (0.6%) | 73 (3.0%) |
| 45 to 59 Minutes | 320 (10.9%) | 109 (4.4%) |
| 60 to 89 Minutes | 319 (10.9%) | 60 (2.4%) |
| 90 or more Minutes | 195 (6.7%) | 166 (6.7%) |
Time of Departure to Work by Sex in Chowan County
The most frequent times of departure to work in Chowan County are 7:00 AM to 7:29 AM (486, 16.6%) for males and 7:30 AM to 7:59 AM (592, 24.0%) for females.
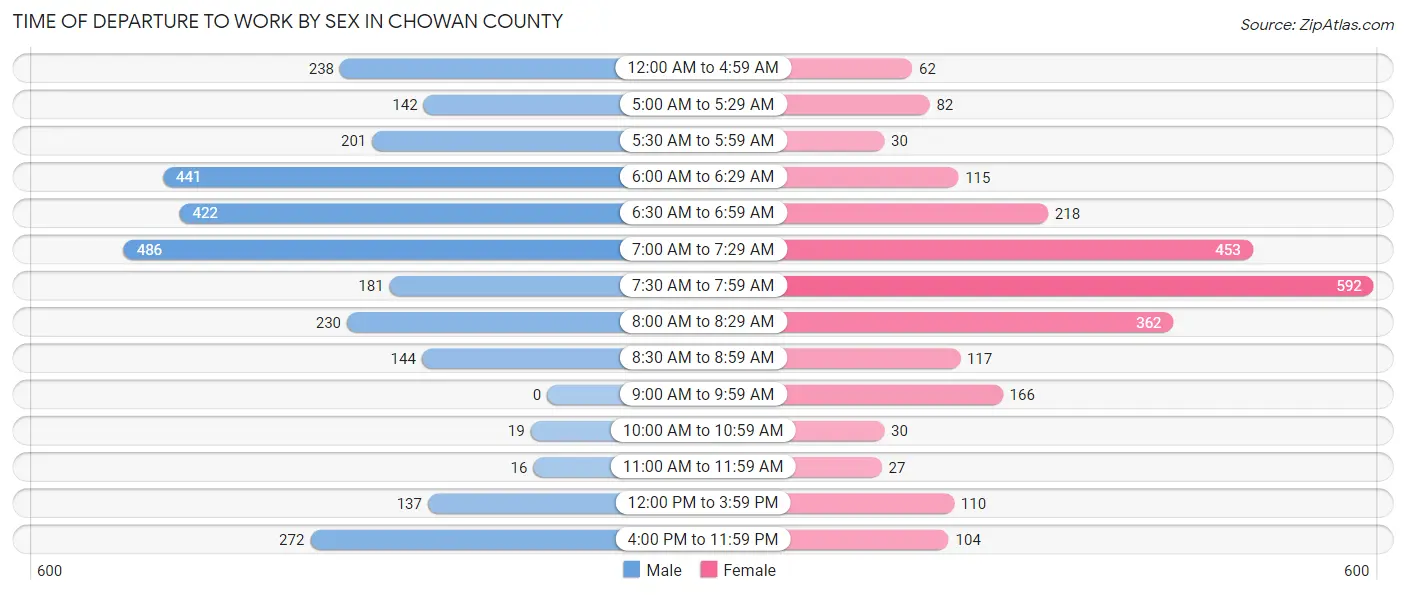
| Time of Departure | Male | Female |
| 12:00 AM to 4:59 AM | 238 (8.1%) | 62 (2.5%) |
| 5:00 AM to 5:29 AM | 142 (4.9%) | 82 (3.3%) |
| 5:30 AM to 5:59 AM | 201 (6.9%) | 30 (1.2%) |
| 6:00 AM to 6:29 AM | 441 (15.1%) | 115 (4.7%) |
| 6:30 AM to 6:59 AM | 422 (14.4%) | 218 (8.8%) |
| 7:00 AM to 7:29 AM | 486 (16.6%) | 453 (18.3%) |
| 7:30 AM to 7:59 AM | 181 (6.2%) | 592 (24.0%) |
| 8:00 AM to 8:29 AM | 230 (7.9%) | 362 (14.7%) |
| 8:30 AM to 8:59 AM | 144 (4.9%) | 117 (4.7%) |
| 9:00 AM to 9:59 AM | 0 (0.0%) | 166 (6.7%) |
| 10:00 AM to 10:59 AM | 19 (0.6%) | 30 (1.2%) |
| 11:00 AM to 11:59 AM | 16 (0.5%) | 27 (1.1%) |
| 12:00 PM to 3:59 PM | 137 (4.7%) | 110 (4.5%) |
| 4:00 PM to 11:59 PM | 272 (9.3%) | 104 (4.2%) |
| Total | 2,929 (100.0%) | 2,468 (100.0%) |
Housing Occupancy in Chowan County
Occupancy by Ownership in Chowan County
Of the total 6,216 dwellings in Chowan County, owner-occupied units account for 4,000 (64.3%), while renter-occupied units make up 2,216 (35.6%).
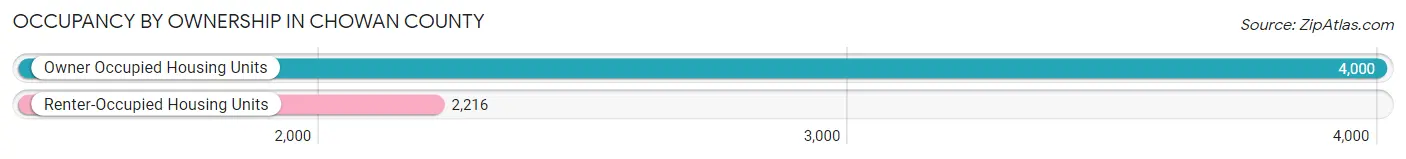
| Occupancy | # Housing Units | % Housing Units |
| Owner Occupied Housing Units | 4,000 | 64.3% |
| Renter-Occupied Housing Units | 2,216 | 35.6% |
| Total Occupied Housing Units | 6,216 | 100.0% |
Occupancy by Household Size in Chowan County
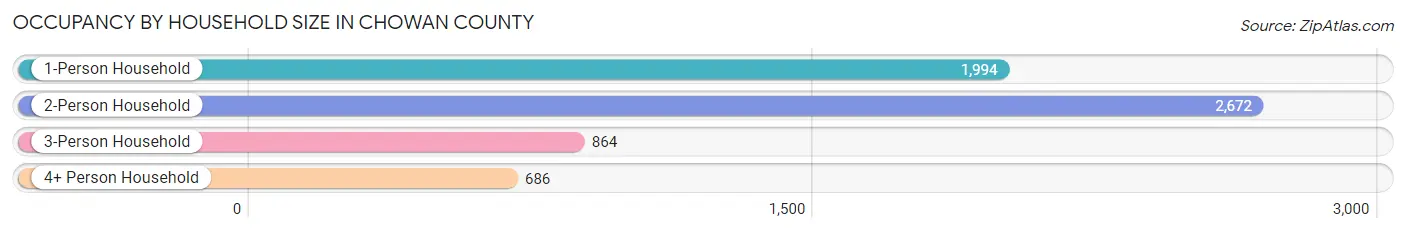
| Household Size | # Housing Units | % Housing Units |
| 1-Person Household | 1,994 | 32.1% |
| 2-Person Household | 2,672 | 43.0% |
| 3-Person Household | 864 | 13.9% |
| 4+ Person Household | 686 | 11.0% |
| Total Housing Units | 6,216 | 100.0% |
Occupancy by Ownership by Household Size in Chowan County
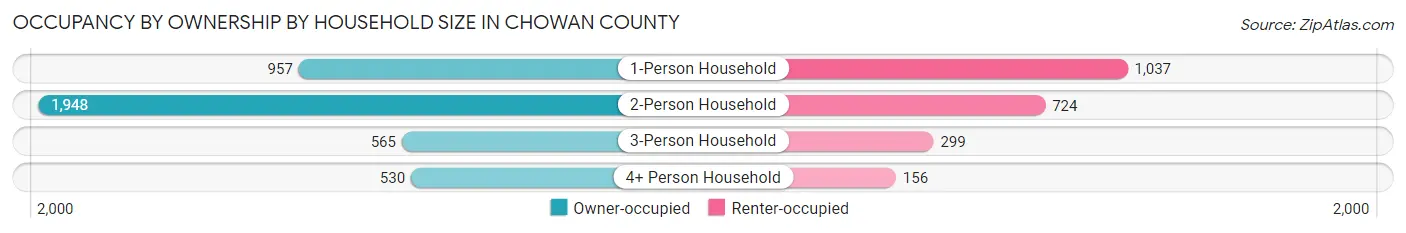
| Household Size | Owner-occupied | Renter-occupied |
| 1-Person Household | 957 (48.0%) | 1,037 (52.0%) |
| 2-Person Household | 1,948 (72.9%) | 724 (27.1%) |
| 3-Person Household | 565 (65.4%) | 299 (34.6%) |
| 4+ Person Household | 530 (77.3%) | 156 (22.7%) |
| Total Housing Units | 4,000 (64.3%) | 2,216 (35.6%) |
Occupancy by Educational Attainment in Chowan County
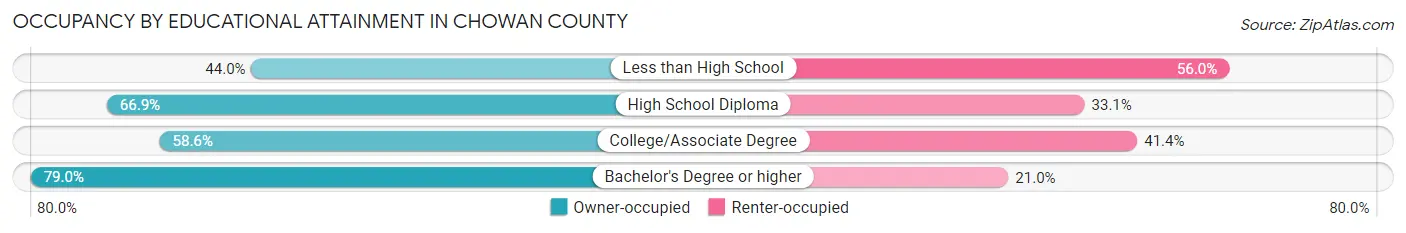
| Household Size | Owner-occupied | Renter-occupied |
| Less than High School | 365 (44.0%) | 464 (56.0%) |
| High School Diploma | 1,136 (66.9%) | 561 (33.1%) |
| College/Associate Degree | 1,195 (58.6%) | 845 (41.4%) |
| Bachelor's Degree or higher | 1,304 (79.0%) | 346 (21.0%) |
Occupancy by Age of Householder in Chowan County
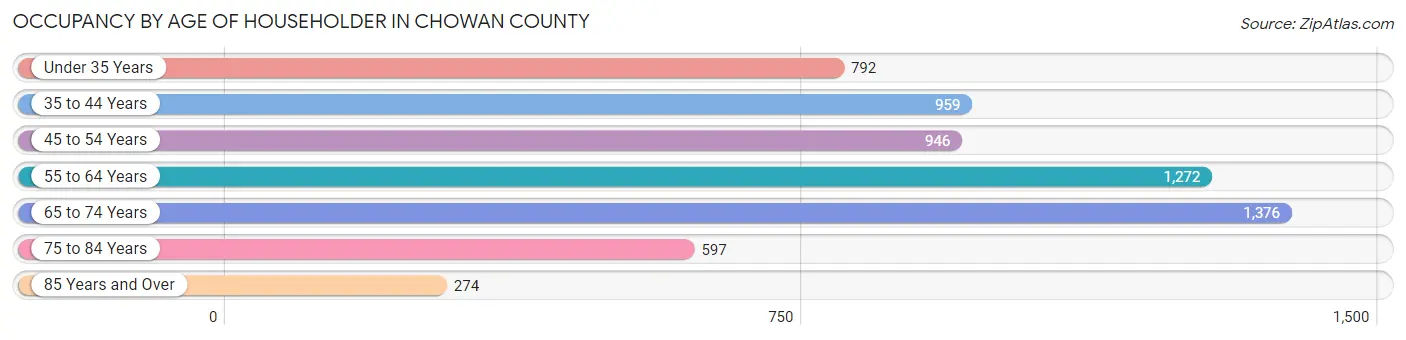
| Age Bracket | # Households | % Households |
| Under 35 Years | 792 | 12.7% |
| 35 to 44 Years | 959 | 15.4% |
| 45 to 54 Years | 946 | 15.2% |
| 55 to 64 Years | 1,272 | 20.5% |
| 65 to 74 Years | 1,376 | 22.1% |
| 75 to 84 Years | 597 | 9.6% |
| 85 Years and Over | 274 | 4.4% |
| Total | 6,216 | 100.0% |
Housing Finances in Chowan County
Median Income by Occupancy in Chowan County
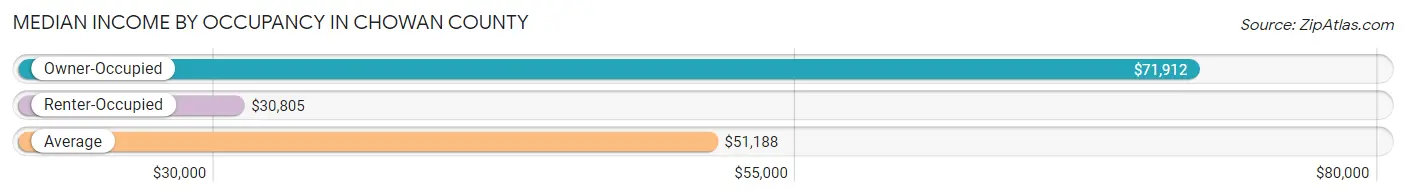
| Occupancy Type | # Households | Median Income |
| Owner-Occupied | 4,000 (64.3%) | $71,912 |
| Renter-Occupied | 2,216 (35.6%) | $30,805 |
| Average | 6,216 (100.0%) | $51,188 |
Occupancy by Householder Income Bracket in Chowan County
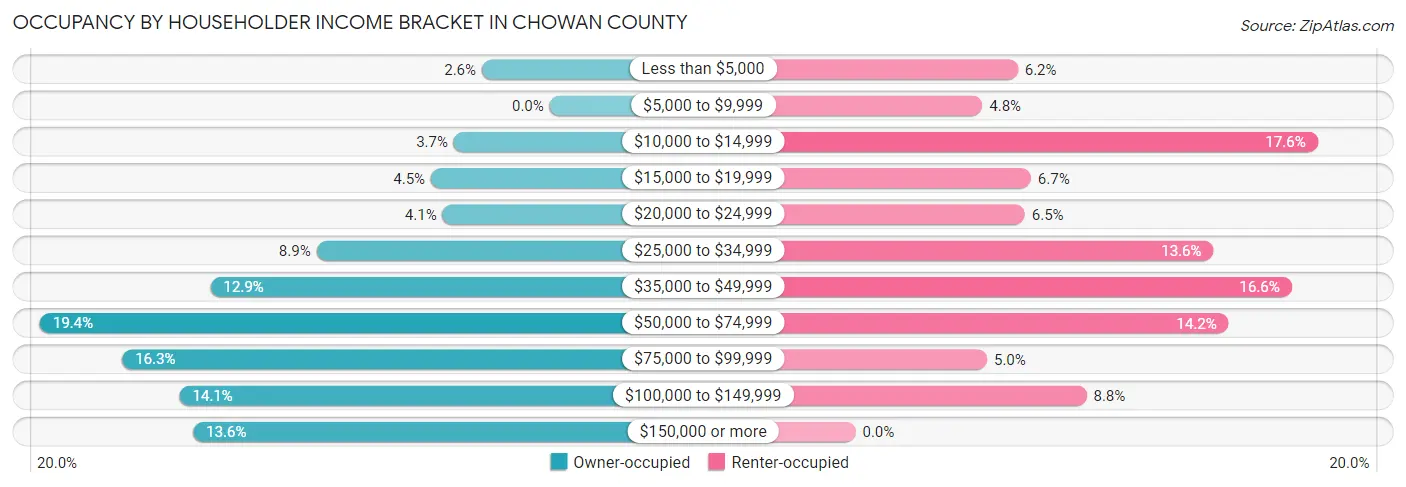
| Income Bracket | Owner-occupied | Renter-occupied |
| Less than $5,000 | 103 (2.6%) | 137 (6.2%) |
| $5,000 to $9,999 | 0 (0.0%) | 107 (4.8%) |
| $10,000 to $14,999 | 146 (3.6%) | 390 (17.6%) |
| $15,000 to $19,999 | 181 (4.5%) | 148 (6.7%) |
| $20,000 to $24,999 | 163 (4.1%) | 143 (6.5%) |
| $25,000 to $34,999 | 355 (8.9%) | 302 (13.6%) |
| $35,000 to $49,999 | 517 (12.9%) | 368 (16.6%) |
| $50,000 to $74,999 | 777 (19.4%) | 315 (14.2%) |
| $75,000 to $99,999 | 651 (16.3%) | 111 (5.0%) |
| $100,000 to $149,999 | 564 (14.1%) | 195 (8.8%) |
| $150,000 or more | 543 (13.6%) | 0 (0.0%) |
| Total | 4,000 (100.0%) | 2,216 (100.0%) |
Monthly Housing Cost Tiers in Chowan County
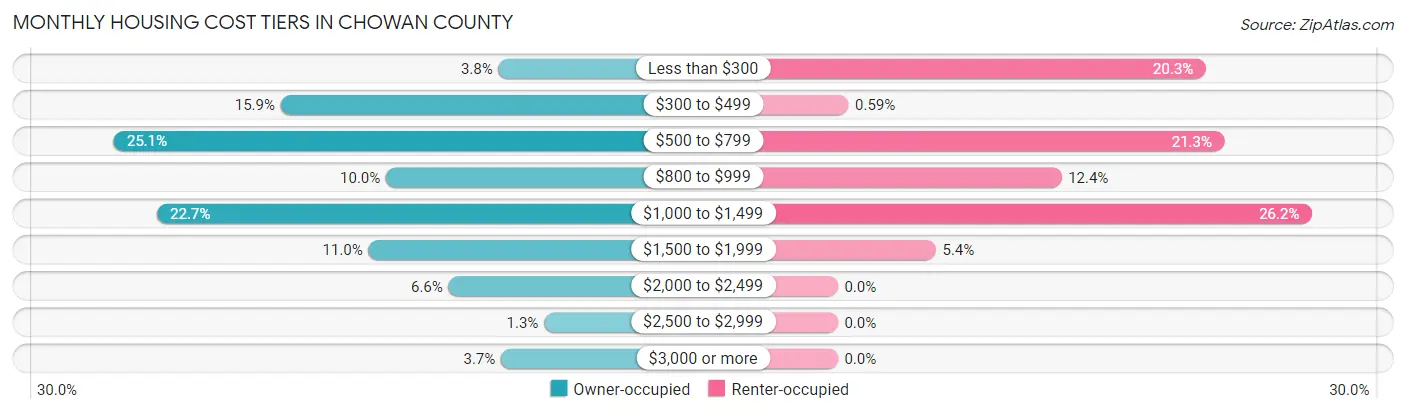
| Monthly Cost | Owner-occupied | Renter-occupied |
| Less than $300 | 153 (3.8%) | 450 (20.3%) |
| $300 to $499 | 634 (15.9%) | 13 (0.6%) |
| $500 to $799 | 1,003 (25.1%) | 473 (21.3%) |
| $800 to $999 | 401 (10.0%) | 274 (12.4%) |
| $1,000 to $1,499 | 907 (22.7%) | 580 (26.2%) |
| $1,500 to $1,999 | 440 (11.0%) | 120 (5.4%) |
| $2,000 to $2,499 | 263 (6.6%) | 0 (0.0%) |
| $2,500 to $2,999 | 52 (1.3%) | 0 (0.0%) |
| $3,000 or more | 147 (3.7%) | 0 (0.0%) |
| Total | 4,000 (100.0%) | 2,216 (100.0%) |
Physical Housing Characteristics in Chowan County
Housing Structures in Chowan County
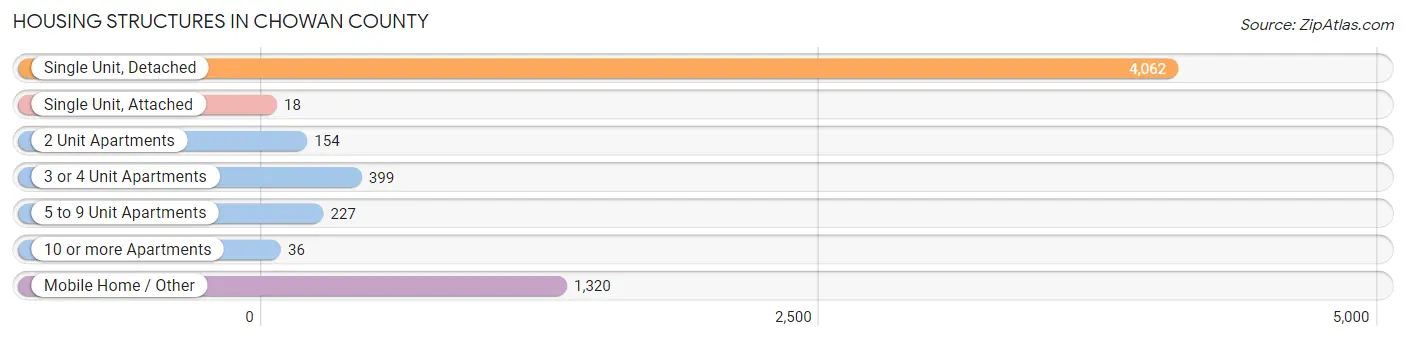
| Structure Type | # Housing Units | % Housing Units |
| Single Unit, Detached | 4,062 | 65.3% |
| Single Unit, Attached | 18 | 0.3% |
| 2 Unit Apartments | 154 | 2.5% |
| 3 or 4 Unit Apartments | 399 | 6.4% |
| 5 to 9 Unit Apartments | 227 | 3.6% |
| 10 or more Apartments | 36 | 0.6% |
| Mobile Home / Other | 1,320 | 21.2% |
| Total | 6,216 | 100.0% |
Housing Structures by Occupancy in Chowan County
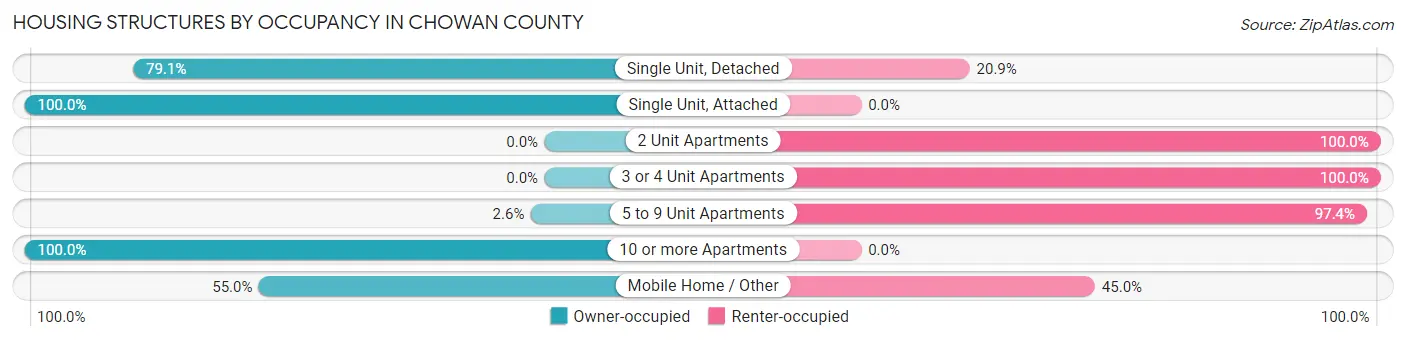
| Structure Type | Owner-occupied | Renter-occupied |
| Single Unit, Detached | 3,214 (79.1%) | 848 (20.9%) |
| Single Unit, Attached | 18 (100.0%) | 0 (0.0%) |
| 2 Unit Apartments | 0 (0.0%) | 154 (100.0%) |
| 3 or 4 Unit Apartments | 0 (0.0%) | 399 (100.0%) |
| 5 to 9 Unit Apartments | 6 (2.6%) | 221 (97.4%) |
| 10 or more Apartments | 36 (100.0%) | 0 (0.0%) |
| Mobile Home / Other | 726 (55.0%) | 594 (45.0%) |
| Total | 4,000 (64.3%) | 2,216 (35.6%) |
Housing Structures by Number of Rooms in Chowan County
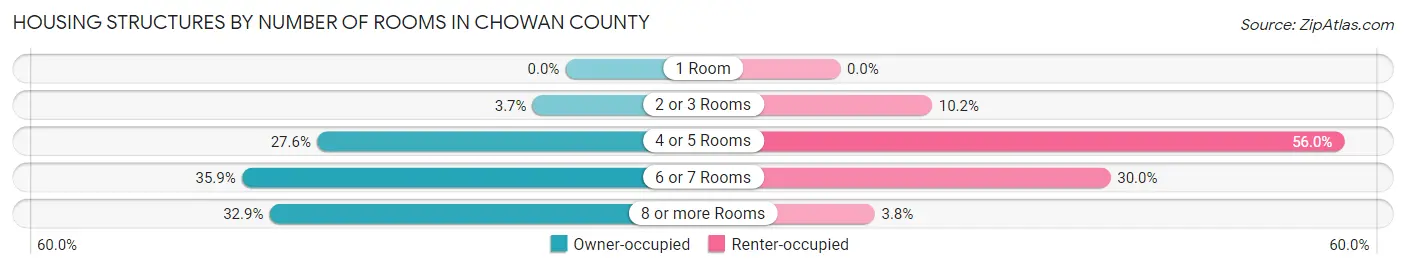
| Number of Rooms | Owner-occupied | Renter-occupied |
| 1 Room | 0 (0.0%) | 0 (0.0%) |
| 2 or 3 Rooms | 146 (3.6%) | 226 (10.2%) |
| 4 or 5 Rooms | 1,103 (27.6%) | 1,240 (56.0%) |
| 6 or 7 Rooms | 1,437 (35.9%) | 665 (30.0%) |
| 8 or more Rooms | 1,314 (32.9%) | 85 (3.8%) |
| Total | 4,000 (100.0%) | 2,216 (100.0%) |
Housing Structure by Heating Type in Chowan County
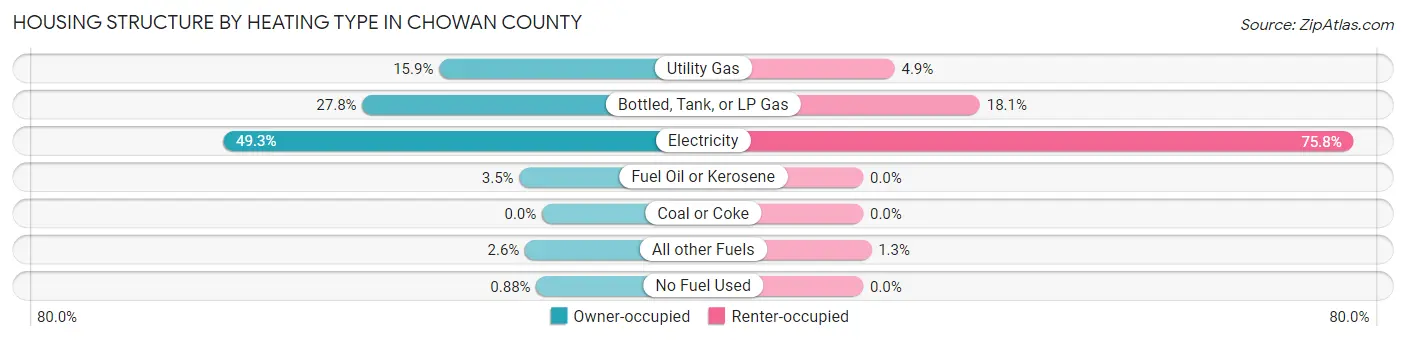
| Heating Type | Owner-occupied | Renter-occupied |
| Utility Gas | 636 (15.9%) | 108 (4.9%) |
| Bottled, Tank, or LP Gas | 1,111 (27.8%) | 400 (18.0%) |
| Electricity | 1,973 (49.3%) | 1,680 (75.8%) |
| Fuel Oil or Kerosene | 140 (3.5%) | 0 (0.0%) |
| Coal or Coke | 0 (0.0%) | 0 (0.0%) |
| All other Fuels | 105 (2.6%) | 28 (1.3%) |
| No Fuel Used | 35 (0.9%) | 0 (0.0%) |
| Total | 4,000 (100.0%) | 2,216 (100.0%) |
Household Vehicle Usage in Chowan County
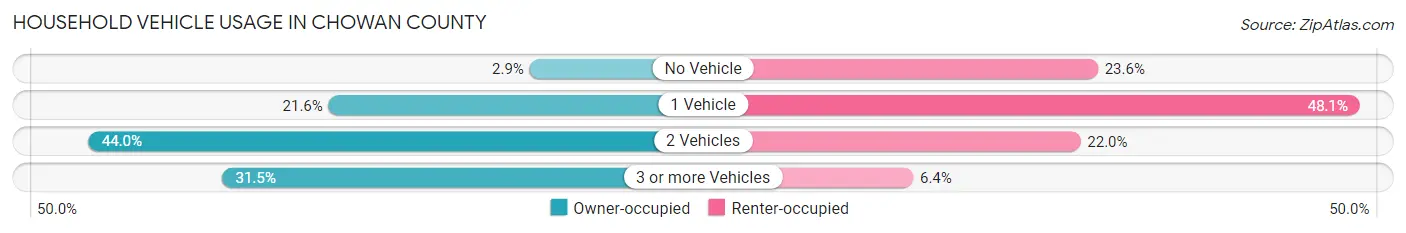
| Vehicles per Household | Owner-occupied | Renter-occupied |
| No Vehicle | 114 (2.9%) | 523 (23.6%) |
| 1 Vehicle | 865 (21.6%) | 1,065 (48.1%) |
| 2 Vehicles | 1,760 (44.0%) | 487 (22.0%) |
| 3 or more Vehicles | 1,261 (31.5%) | 141 (6.4%) |
| Total | 4,000 (100.0%) | 2,216 (100.0%) |
Real Estate & Mortgages in Chowan County
Real Estate and Mortgage Overview in Chowan County
| Characteristic | Without Mortgage | With Mortgage |
| Housing Units | 1,879 | 2,121 |
| Median Property Value | $158,200 | $209,600 |
| Median Household Income | $56,359 | $337 |
| Monthly Housing Costs | $565 | $147 |
| Real Estate Taxes | $994 | $37 |
Property Value by Mortgage Status in Chowan County
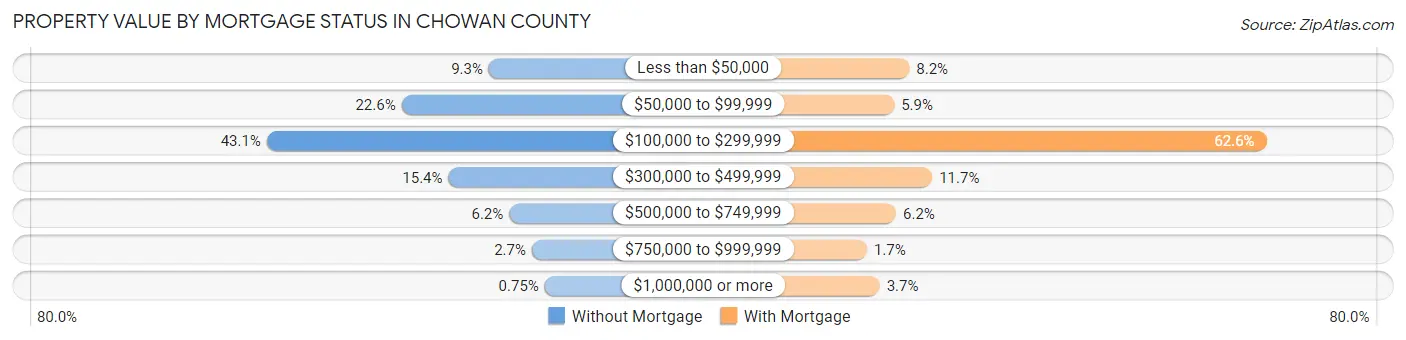
| Property Value | Without Mortgage | With Mortgage |
| Less than $50,000 | 174 (9.3%) | 174 (8.2%) |
| $50,000 to $99,999 | 424 (22.6%) | 125 (5.9%) |
| $100,000 to $299,999 | 810 (43.1%) | 1,328 (62.6%) |
| $300,000 to $499,999 | 290 (15.4%) | 248 (11.7%) |
| $500,000 to $749,999 | 116 (6.2%) | 131 (6.2%) |
| $750,000 to $999,999 | 51 (2.7%) | 37 (1.7%) |
| $1,000,000 or more | 14 (0.7%) | 78 (3.7%) |
| Total | 1,879 (100.0%) | 2,121 (100.0%) |
Household Income by Mortgage Status in Chowan County
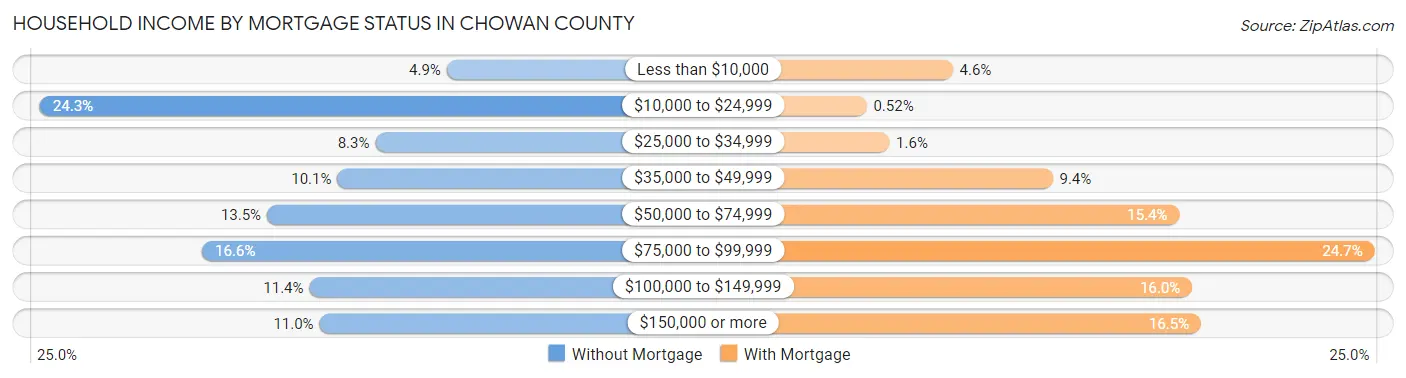
| Household Income | Without Mortgage | With Mortgage |
| Less than $10,000 | 92 (4.9%) | 98 (4.6%) |
| $10,000 to $24,999 | 456 (24.3%) | 11 (0.5%) |
| $25,000 to $34,999 | 156 (8.3%) | 34 (1.6%) |
| $35,000 to $49,999 | 190 (10.1%) | 199 (9.4%) |
| $50,000 to $74,999 | 253 (13.5%) | 327 (15.4%) |
| $75,000 to $99,999 | 311 (16.6%) | 524 (24.7%) |
| $100,000 to $149,999 | 215 (11.4%) | 340 (16.0%) |
| $150,000 or more | 206 (11.0%) | 349 (16.5%) |
| Total | 1,879 (100.0%) | 2,121 (100.0%) |
Property Value to Household Income Ratio in Chowan County
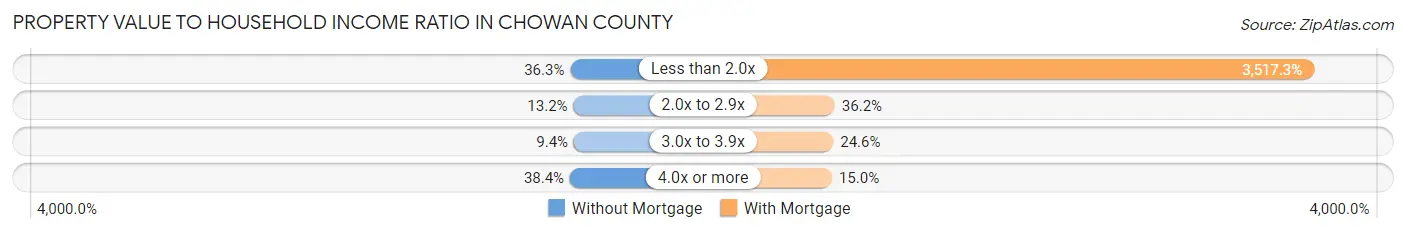
| Value-to-Income Ratio | Without Mortgage | With Mortgage |
| Less than 2.0x | 682 (36.3%) | 74,601 (3,517.3%) |
| 2.0x to 2.9x | 247 (13.2%) | 767 (36.2%) |
| 3.0x to 3.9x | 176 (9.4%) | 521 (24.6%) |
| 4.0x or more | 722 (38.4%) | 318 (15.0%) |
| Total | 1,879 (100.0%) | 2,121 (100.0%) |
Real Estate Taxes by Mortgage Status in Chowan County
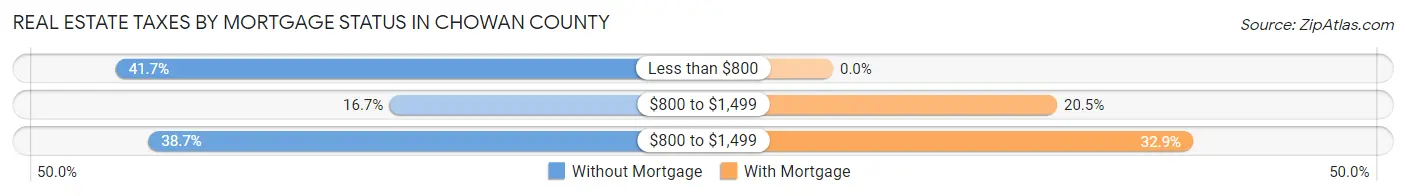
| Property Taxes | Without Mortgage | With Mortgage |
| Less than $800 | 783 (41.7%) | 0 (0.0%) |
| $800 to $1,499 | 314 (16.7%) | 434 (20.5%) |
| $800 to $1,499 | 727 (38.7%) | 697 (32.9%) |
| Total | 1,879 (100.0%) | 2,121 (100.0%) |
Health & Disability in Chowan County
Health Insurance Coverage by Age in Chowan County
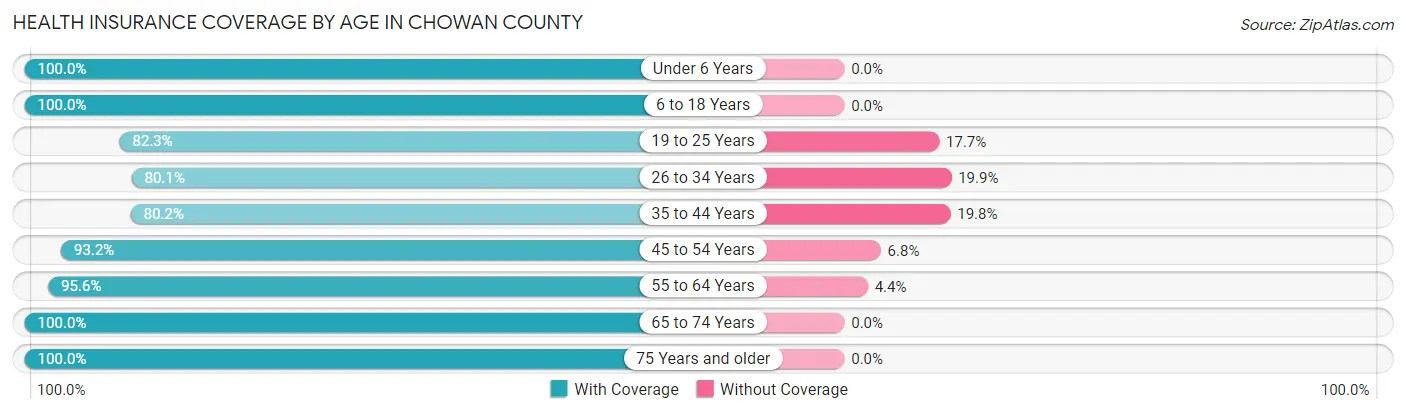
| Age Bracket | With Coverage | Without Coverage |
| Under 6 Years | 801 (100.0%) | 0 (0.0%) |
| 6 to 18 Years | 2,091 (100.0%) | 0 (0.0%) |
| 19 to 25 Years | 340 (82.3%) | 73 (17.7%) |
| 26 to 34 Years | 1,253 (80.1%) | 312 (19.9%) |
| 35 to 44 Years | 1,209 (80.2%) | 298 (19.8%) |
| 45 to 54 Years | 1,553 (93.2%) | 113 (6.8%) |
| 55 to 64 Years | 2,103 (95.6%) | 96 (4.4%) |
| 65 to 74 Years | 2,057 (100.0%) | 0 (0.0%) |
| 75 Years and older | 1,283 (100.0%) | 0 (0.0%) |
| Total | 12,690 (93.4%) | 892 (6.6%) |
Health Insurance Coverage by Citizenship Status in Chowan County
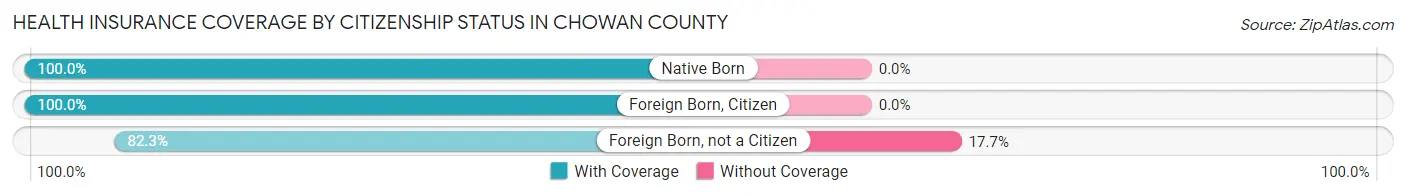
| Citizenship Status | With Coverage | Without Coverage |
| Native Born | 801 (100.0%) | 0 (0.0%) |
| Foreign Born, Citizen | 2,091 (100.0%) | 0 (0.0%) |
| Foreign Born, not a Citizen | 340 (82.3%) | 73 (17.7%) |
Health Insurance Coverage by Household Income in Chowan County
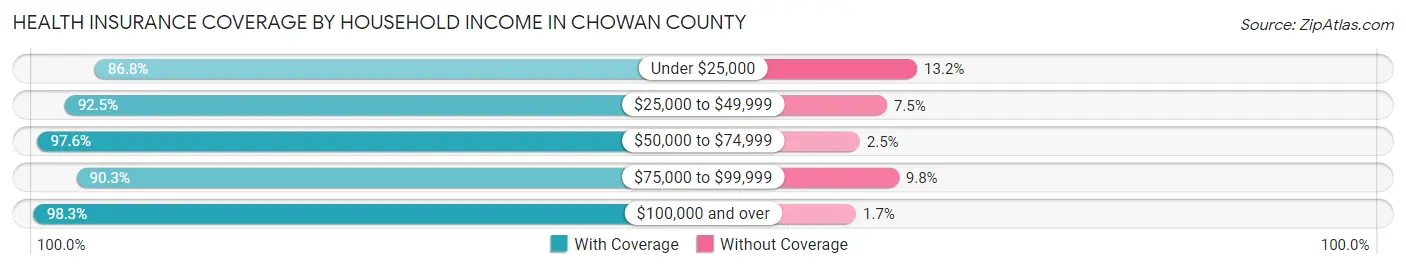
| Household Income | With Coverage | Without Coverage |
| Under $25,000 | 2,332 (86.8%) | 354 (13.2%) |
| $25,000 to $49,999 | 3,170 (92.5%) | 258 (7.5%) |
| $50,000 to $74,999 | 2,308 (97.6%) | 58 (2.5%) |
| $75,000 to $99,999 | 1,508 (90.2%) | 163 (9.8%) |
| $100,000 and over | 3,334 (98.3%) | 59 (1.7%) |
Public vs Private Health Insurance Coverage by Age in Chowan County
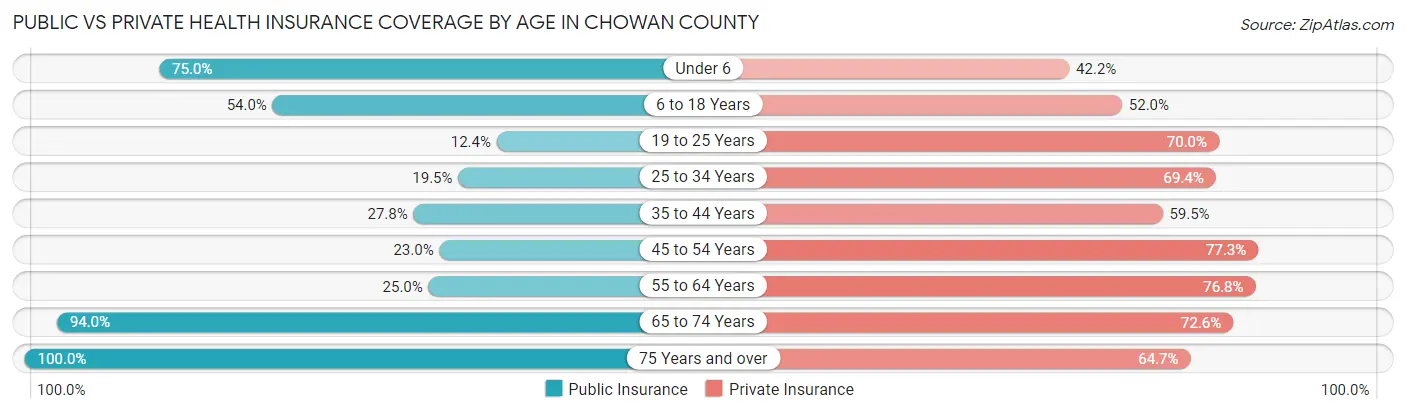
| Age Bracket | Public Insurance | Private Insurance |
| Under 6 | 601 (75.0%) | 338 (42.2%) |
| 6 to 18 Years | 1,128 (53.9%) | 1,087 (52.0%) |
| 19 to 25 Years | 51 (12.3%) | 289 (70.0%) |
| 25 to 34 Years | 305 (19.5%) | 1,086 (69.4%) |
| 35 to 44 Years | 419 (27.8%) | 897 (59.5%) |
| 45 to 54 Years | 383 (23.0%) | 1,287 (77.2%) |
| 55 to 64 Years | 550 (25.0%) | 1,688 (76.8%) |
| 65 to 74 Years | 1,934 (94.0%) | 1,494 (72.6%) |
| 75 Years and over | 1,283 (100.0%) | 830 (64.7%) |
| Total | 6,654 (49.0%) | 8,996 (66.2%) |
Disability Status by Sex by Age in Chowan County
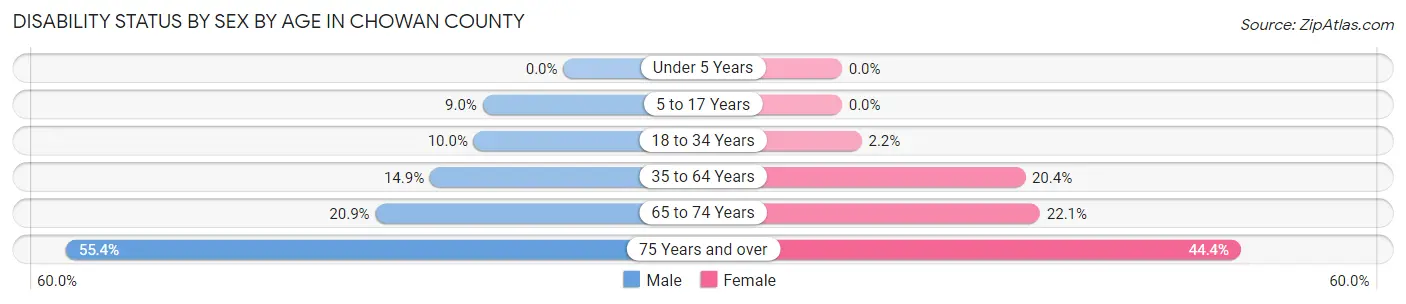
| Age Bracket | Male | Female |
| Under 5 Years | 0 (0.0%) | 0 (0.0%) |
| 5 to 17 Years | 93 (9.0%) | 0 (0.0%) |
| 18 to 34 Years | 107 (10.0%) | 24 (2.2%) |
| 35 to 64 Years | 388 (14.8%) | 563 (20.4%) |
| 65 to 74 Years | 199 (20.9%) | 244 (22.1%) |
| 75 Years and over | 297 (55.4%) | 332 (44.4%) |
Disability Class by Sex by Age in Chowan County
Disability Class: Hearing Difficulty
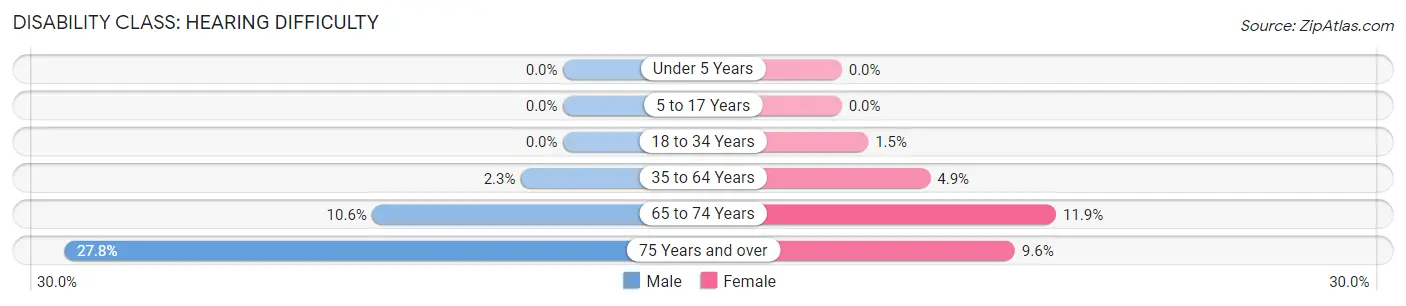
| Age Bracket | Male | Female |
| Under 5 Years | 0 (0.0%) | 0 (0.0%) |
| 5 to 17 Years | 0 (0.0%) | 0 (0.0%) |
| 18 to 34 Years | 0 (0.0%) | 16 (1.5%) |
| 35 to 64 Years | 61 (2.3%) | 136 (4.9%) |
| 65 to 74 Years | 101 (10.6%) | 132 (11.9%) |
| 75 Years and over | 149 (27.8%) | 72 (9.6%) |
Disability Class: Vision Difficulty
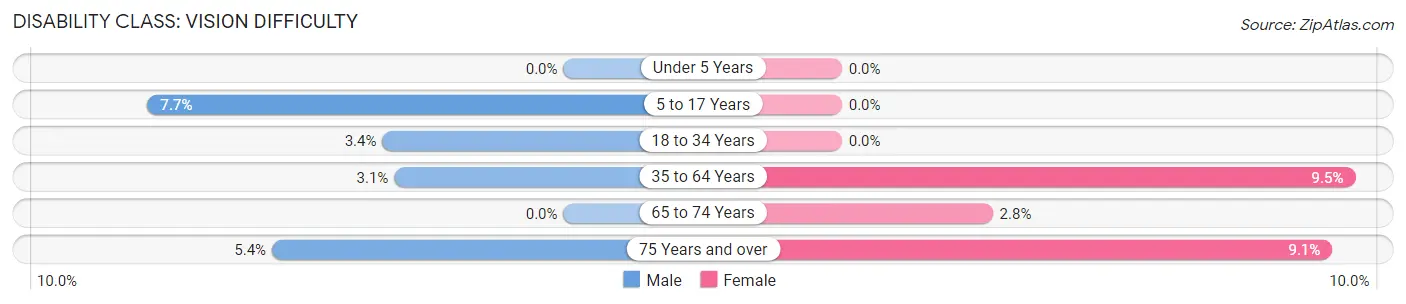
| Age Bracket | Male | Female |
| Under 5 Years | 0 (0.0%) | 0 (0.0%) |
| 5 to 17 Years | 80 (7.7%) | 0 (0.0%) |
| 18 to 34 Years | 36 (3.4%) | 0 (0.0%) |
| 35 to 64 Years | 82 (3.1%) | 263 (9.5%) |
| 65 to 74 Years | 0 (0.0%) | 31 (2.8%) |
| 75 Years and over | 29 (5.4%) | 68 (9.1%) |
Disability Class: Cognitive Difficulty
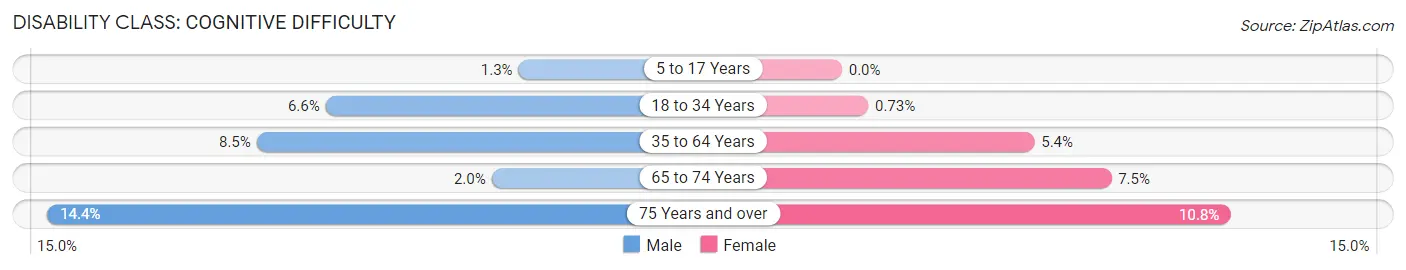
| Age Bracket | Male | Female |
| 5 to 17 Years | 13 (1.3%) | 0 (0.0%) |
| 18 to 34 Years | 71 (6.6%) | 8 (0.7%) |
| 35 to 64 Years | 223 (8.5%) | 148 (5.4%) |
| 65 to 74 Years | 19 (2.0%) | 83 (7.5%) |
| 75 Years and over | 77 (14.4%) | 81 (10.8%) |
Disability Class: Ambulatory Difficulty
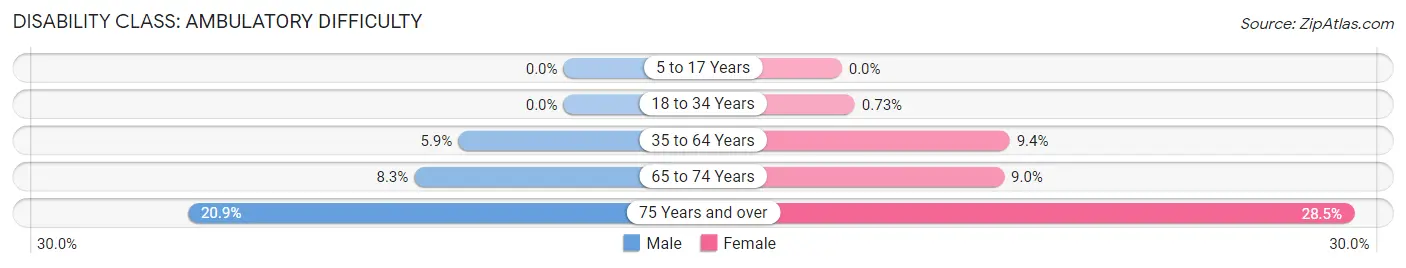
| Age Bracket | Male | Female |
| 5 to 17 Years | 0 (0.0%) | 0 (0.0%) |
| 18 to 34 Years | 0 (0.0%) | 8 (0.7%) |
| 35 to 64 Years | 153 (5.9%) | 258 (9.3%) |
| 65 to 74 Years | 79 (8.3%) | 100 (9.0%) |
| 75 Years and over | 112 (20.9%) | 213 (28.5%) |
Disability Class: Self-Care Difficulty
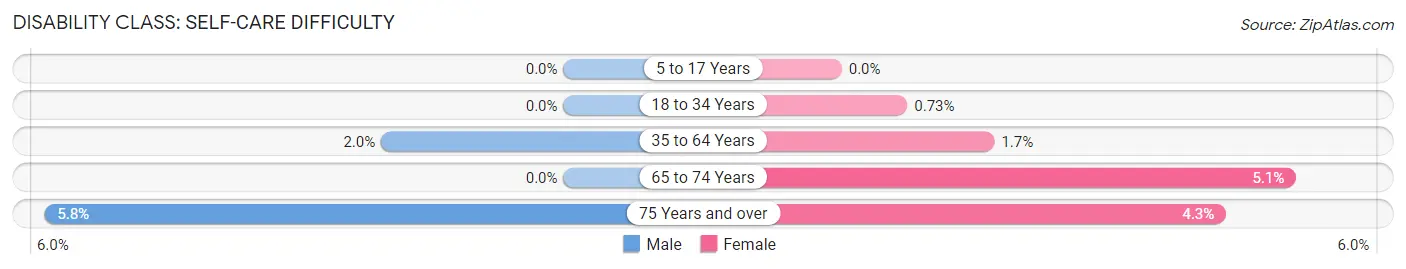
| Age Bracket | Male | Female |
| 5 to 17 Years | 0 (0.0%) | 0 (0.0%) |
| 18 to 34 Years | 0 (0.0%) | 8 (0.7%) |
| 35 to 64 Years | 53 (2.0%) | 47 (1.7%) |
| 65 to 74 Years | 0 (0.0%) | 56 (5.1%) |
| 75 Years and over | 31 (5.8%) | 32 (4.3%) |
Technology Access in Chowan County
Computing Device Access in Chowan County
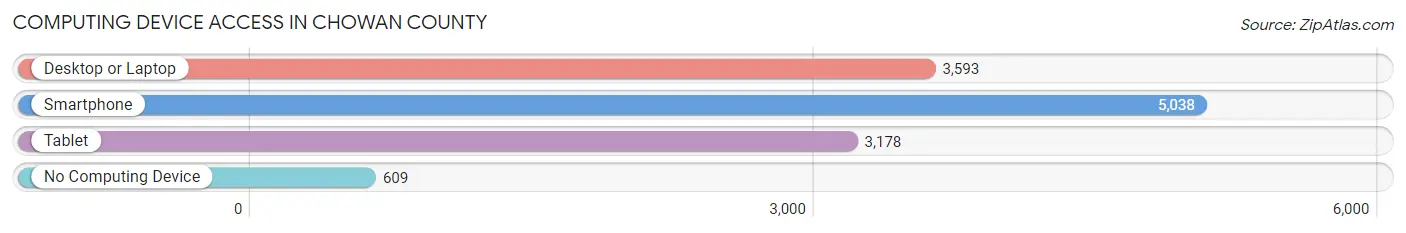
| Device Type | # Households | % Households |
| Desktop or Laptop | 3,593 | 57.8% |
| Smartphone | 5,038 | 81.0% |
| Tablet | 3,178 | 51.1% |
| No Computing Device | 609 | 9.8% |
| Total | 6,216 | 100.0% |
Internet Access in Chowan County
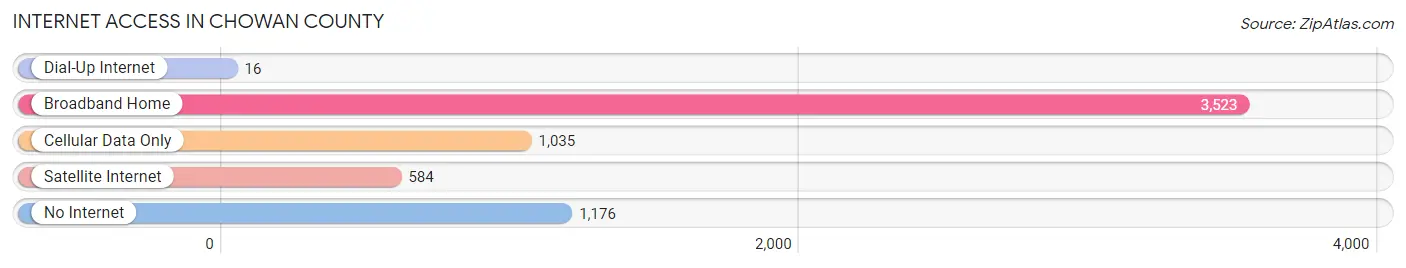
| Internet Type | # Households | % Households |
| Dial-Up Internet | 16 | 0.3% |
| Broadband Home | 3,523 | 56.7% |
| Cellular Data Only | 1,035 | 16.7% |
| Satellite Internet | 584 | 9.4% |
| No Internet | 1,176 | 18.9% |
| Total | 6,216 | 100.0% |
Chowan County Summary
Chowan County is located in the northeastern part of North Carolina, and is part of the Albemarle region. It is bordered by Perquimans County to the north, Gates County to the east, Hertford County to the south, and Bertie County to the west. The county seat is Edenton, and the county is named after the Chowanoke Native American tribe.
Geography
Chowan County covers an area of approximately 437 square miles, and is located in the Coastal Plain region of North Carolina. The terrain is mostly flat, with some rolling hills in the northern part of the county. The Chowan River runs through the county, and is a major source of recreation and economic activity. The county is also home to several lakes, including Lake Phelps, Lake Mattamuskeet, and Lake Cohoon.
Climate
Chowan County has a humid subtropical climate, with hot, humid summers and mild winters. The average annual temperature is around 70°F, and the average annual precipitation is around 45 inches.
Demographics
As of the 2010 census, the population of Chowan County was 14,793, with a population density of 33.7 people per square mile. The racial makeup of the county was 73.3% White, 22.2% African American, 0.5% Native American, 0.7% Asian, 0.1% Pacific Islander, 1.7% from other races, and 1.5% from two or more races. Hispanic or Latino of any race were 3.2% of the population.
Economy
The economy of Chowan County is largely based on agriculture, with the main crops being corn, soybeans, wheat, and cotton. The county is also home to several manufacturing companies, including a furniture factory, a boat manufacturing plant, and a paper mill. Tourism is also an important part of the economy, with Edenton being a popular destination for visitors.
History
Chowan County was formed in 1739 from parts of Bertie and Currituck counties. The county was named after the Chowanoke Native American tribe, who had inhabited the area for centuries before European settlement. The county seat of Edenton was established in 1722, and the town quickly became an important port and trading center. During the American Revolution, Edenton was the site of the Edenton Tea Party, a protest against British taxation.
In the 19th century, Chowan County was an important center of the slave trade, and the county was home to several large plantations. After the Civil War, the county's economy shifted to agriculture, and the county remained largely rural until the mid-20th century. In recent years, the county has seen an increase in tourism and manufacturing, and the county is now home to several large companies.
Common Questions
What is Per Capita Income in Chowan County?
Per Capita income in Chowan County is $32,479.
What is the Median Family Income in Chowan County?
Median Family Income in Chowan County is $68,042.
What is the Median Household income in Chowan County?
Median Household Income in Chowan County is $51,188.
What is Income or Wage Gap in Chowan County?
Income or Wage Gap in Chowan County is 49.7%.
Women in Chowan County earn 50.3 cents for every dollar earned by a man.
What is Family Income Deficit in Chowan County?
Family Income Deficit in Chowan County is $9,411.
Families that are below poverty line in Chowan County earn $9,411 less on average than the poverty threshold level.
What is Inequality or Gini Index in Chowan County?
Inequality or Gini Index in Chowan County is 0.46.
What is the Total Population of Chowan County?
Total Population of Chowan County is 13,835.
What is the Total Male Population of Chowan County?
Total Male Population of Chowan County is 6,602.
What is the Total Female Population of Chowan County?
Total Female Population of Chowan County is 7,233.
What is the Ratio of Males per 100 Females in Chowan County?
There are 91.28 Males per 100 Females in Chowan County.
What is the Ratio of Females per 100 Males in Chowan County?
There are 109.56 Females per 100 Males in Chowan County.
What is the Median Population Age in Chowan County?
Median Population Age in Chowan County is 48.7 Years.
What is the Average Family Size in Chowan County
Average Family Size in Chowan County is 2.7 People.
What is the Average Household Size in Chowan County
Average Household Size in Chowan County is 2.2 People.
How Large is the Labor Force in Chowan County?
There are 6,208 People in the Labor Forcein in Chowan County.
What is the Percentage of People in the Labor Force in Chowan County?
54.2% of People are in the Labor Force in Chowan County.
What is the Unemployment Rate in Chowan County?
Unemployment Rate in Chowan County is 4.3%.