Cherokee County, NC Map & Demographics
Cherokee County Map
Cherokee County Overview
$28,752
PER CAPITA INCOME
$60,917
AVG FAMILY INCOME
$49,254
AVG HOUSEHOLD INCOME
14.7%
WAGE / INCOME GAP [ % ]
85.3¢/ $1
WAGE / INCOME GAP [ $ ]
$8,653
FAMILY INCOME DEFICIT
0.42
INEQUALITY / GINI INDEX
28,868
TOTAL POPULATION
14,246
MALE POPULATION
14,622
FEMALE POPULATION
97.43
MALES / 100 FEMALES
102.64
FEMALES / 100 MALES
52.9
MEDIAN AGE
2.7
AVG FAMILY SIZE
2.2
AVG HOUSEHOLD SIZE
12,011
LABOR FORCE [ PEOPLE ]
48.4%
PERCENT IN LABOR FORCE
4.9%
UNEMPLOYMENT RATE
Cherokee County Area Codes
Income in Cherokee County
Income Overview in Cherokee County
Per Capita Income in Cherokee County is $28,752, while median incomes of families and households are $60,917 and $49,254 respectively.
| Characteristic | Number | Measure |
| Per Capita Income | 28,868 | $28,752 |
| Median Family Income | 8,039 | $60,917 |
| Mean Family Income | 8,039 | $75,190 |
| Median Household Income | 12,758 | $49,254 |
| Mean Household Income | 12,758 | $63,371 |
| Income Deficit | 8,039 | $8,653 |
| Wage / Income Gap (%) | 28,868 | 14.69% |
| Wage / Income Gap ($) | 28,868 | 85.31¢ per $1 |
| Gini / Inequality Index | 28,868 | 0.42 |
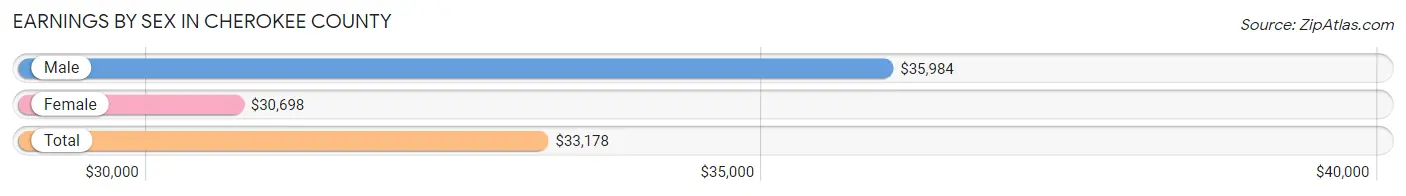
Earnings by Sex in Cherokee County
Average Earnings in Cherokee County are $33,178, $35,984 for men and $30,698 for women, a difference of 14.7%.
| Sex | Number | Average Earnings |
| Male | 6,376 (51.5%) | $35,984 |
| Female | 6,006 (48.5%) | $30,698 |
| Total | 12,382 (100.0%) | $33,178 |
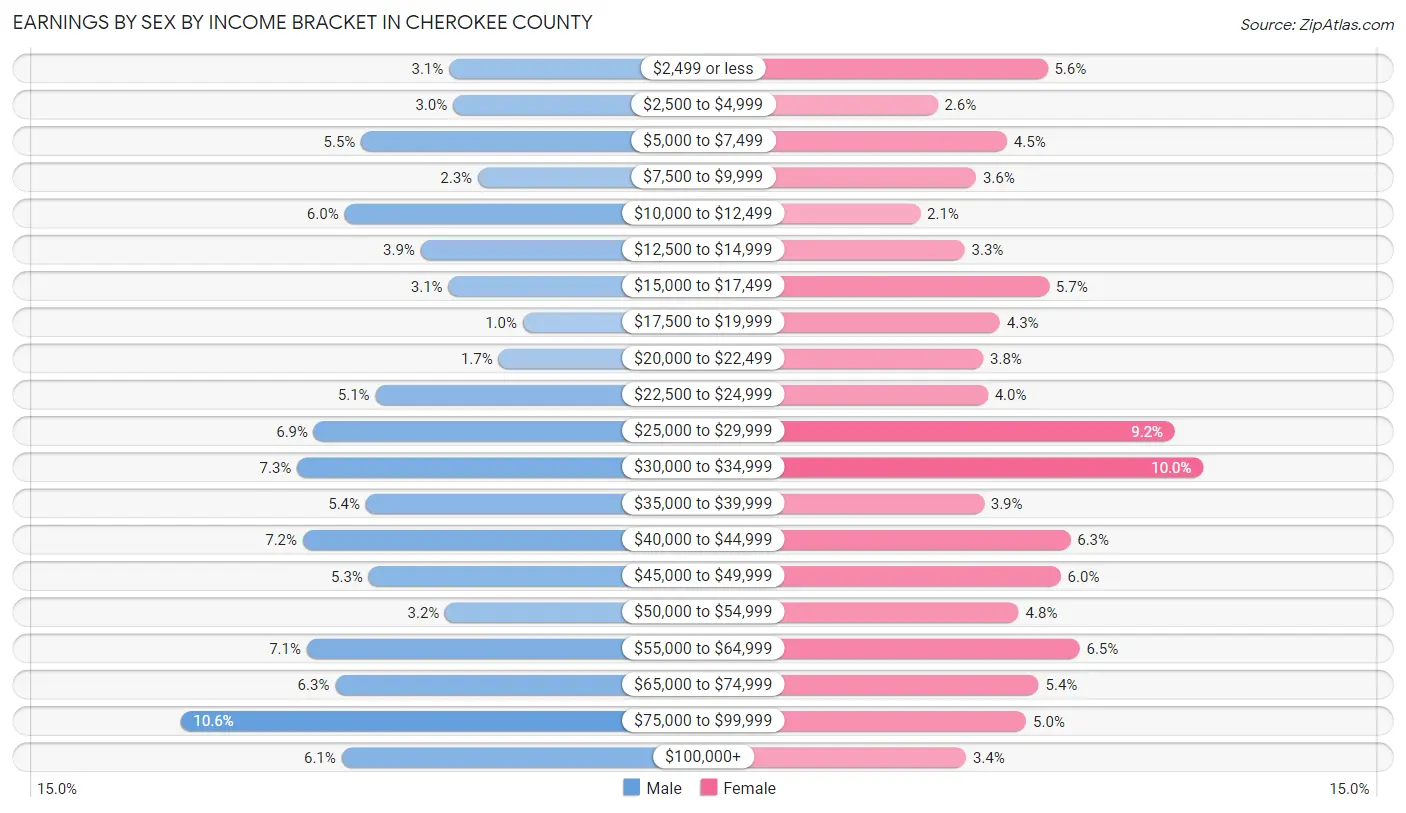
Earnings by Sex by Income Bracket in Cherokee County
The most common earnings brackets in Cherokee County are $75,000 to $99,999 for men (677 | 10.6%) and $30,000 to $34,999 for women (602 | 10.0%).
| Income | Male | Female |
| $2,499 or less | 196 (3.1%) | 339 (5.6%) |
| $2,500 to $4,999 | 189 (3.0%) | 153 (2.5%) |
| $5,000 to $7,499 | 353 (5.5%) | 270 (4.5%) |
| $7,500 to $9,999 | 144 (2.3%) | 218 (3.6%) |
| $10,000 to $12,499 | 383 (6.0%) | 124 (2.1%) |
| $12,500 to $14,999 | 247 (3.9%) | 199 (3.3%) |
| $15,000 to $17,499 | 197 (3.1%) | 341 (5.7%) |
| $17,500 to $19,999 | 64 (1.0%) | 258 (4.3%) |
| $20,000 to $22,499 | 107 (1.7%) | 230 (3.8%) |
| $22,500 to $24,999 | 328 (5.1%) | 238 (4.0%) |
| $25,000 to $29,999 | 438 (6.9%) | 554 (9.2%) |
| $30,000 to $34,999 | 468 (7.3%) | 602 (10.0%) |
| $35,000 to $39,999 | 345 (5.4%) | 231 (3.8%) |
| $40,000 to $44,999 | 458 (7.2%) | 377 (6.3%) |
| $45,000 to $49,999 | 340 (5.3%) | 361 (6.0%) |
| $50,000 to $54,999 | 203 (3.2%) | 290 (4.8%) |
| $55,000 to $64,999 | 451 (7.1%) | 393 (6.5%) |
| $65,000 to $74,999 | 400 (6.3%) | 324 (5.4%) |
| $75,000 to $99,999 | 677 (10.6%) | 303 (5.0%) |
| $100,000+ | 388 (6.1%) | 201 (3.4%) |
| Total | 6,376 (100.0%) | 6,006 (100.0%) |
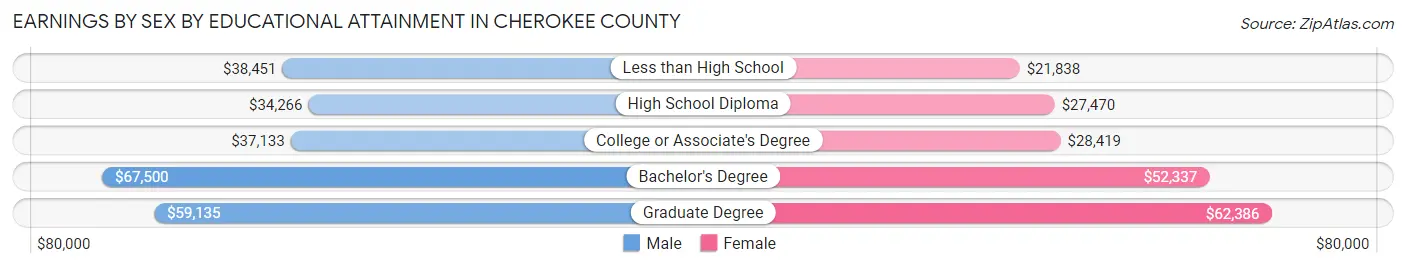
Earnings by Sex by Educational Attainment in Cherokee County
Average earnings in Cherokee County are $39,091 for men and $33,203 for women, a difference of 15.1%. Men with an educational attainment of bachelor's degree enjoy the highest average annual earnings of $67,500, while those with high school diploma education earn the least with $34,266. Women with an educational attainment of graduate degree earn the most with the average annual earnings of $62,386, while those with less than high school education have the smallest earnings of $21,838.
| Educational Attainment | Male Income | Female Income |
| Less than High School | $38,451 | $21,838 |
| High School Diploma | $34,266 | $27,470 |
| College or Associate's Degree | $37,133 | $28,419 |
| Bachelor's Degree | $67,500 | $52,337 |
| Graduate Degree | $59,135 | $62,386 |
| Total | $39,091 | $33,203 |
Family Income in Cherokee County
Family Income Brackets in Cherokee County
According to the Cherokee County family income data, there are 1,648 families falling into the $50,000 to $74,999 income range, which is the most common income bracket and makes up 20.5% of all families. Conversely, the $10,000 to $14,999 income bracket is the least frequent group with only 249 families (3.1%) belonging to this category.
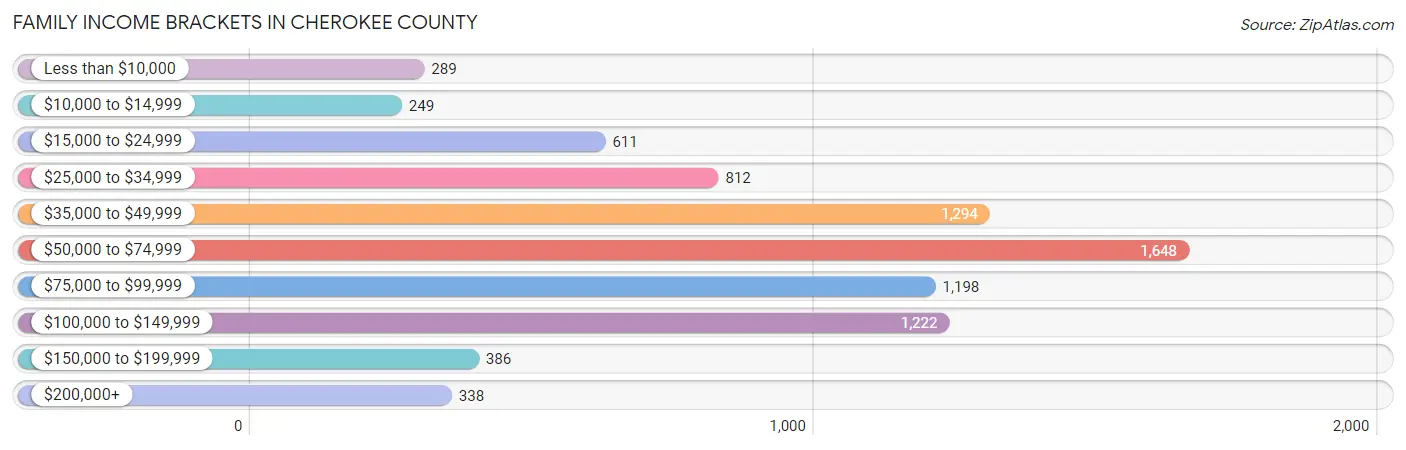
| Income Bracket | # Families | % Families |
| Less than $10,000 | 289 | 3.6% |
| $10,000 to $14,999 | 249 | 3.1% |
| $15,000 to $24,999 | 611 | 7.6% |
| $25,000 to $34,999 | 812 | 10.1% |
| $35,000 to $49,999 | 1,294 | 16.1% |
| $50,000 to $74,999 | 1,648 | 20.5% |
| $75,000 to $99,999 | 1,198 | 14.9% |
| $100,000 to $149,999 | 1,222 | 15.2% |
| $150,000 to $199,999 | 386 | 4.8% |
| $200,000+ | 338 | 4.2% |
Family Income by Famaliy Size in Cherokee County
6-person families (65 | 0.8%) account for the highest median family income in Cherokee County with $107,788 per family, while 2-person families (5,478 | 68.1%) have the highest median income of $27,482 per family member.
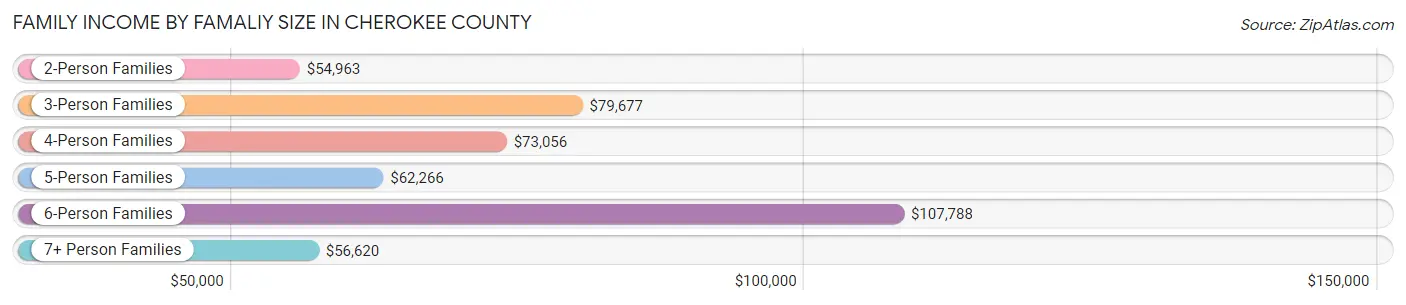
| Income Bracket | # Families | Median Income |
| 2-Person Families | 5,478 (68.1%) | $54,963 |
| 3-Person Families | 1,098 (13.7%) | $79,677 |
| 4-Person Families | 794 (9.9%) | $73,056 |
| 5-Person Families | 559 (7.0%) | $62,266 |
| 6-Person Families | 65 (0.8%) | $107,788 |
| 7+ Person Families | 45 (0.6%) | $56,620 |
| Total | 8,039 (100.0%) | $60,917 |
Family Income by Number of Earners in Cherokee County
The median family income in Cherokee County is $60,917, with families comprising 3+ earners (428) having the highest median family income of $99,338, while families with no earners (2,777) have the lowest median family income of $41,686, accounting for 5.3% and 34.5% of families, respectively.
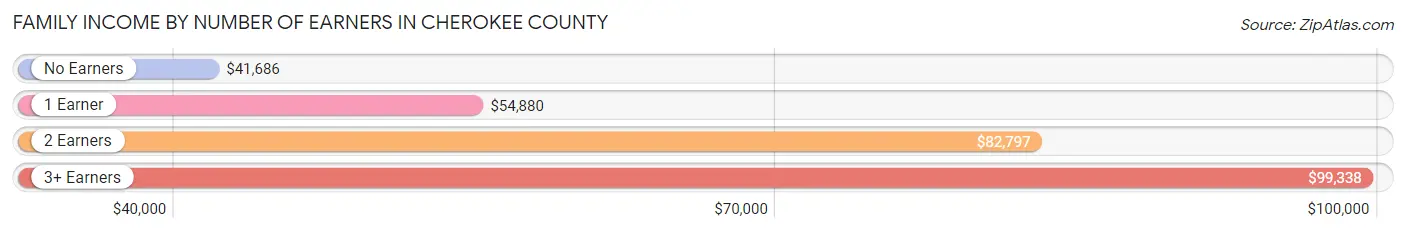
| Number of Earners | # Families | Median Income |
| No Earners | 2,777 (34.5%) | $41,686 |
| 1 Earner | 2,302 (28.6%) | $54,880 |
| 2 Earners | 2,532 (31.5%) | $82,797 |
| 3+ Earners | 428 (5.3%) | $99,338 |
| Total | 8,039 (100.0%) | $60,917 |
Household Income in Cherokee County
Household Income Brackets in Cherokee County
With 2,437 households falling in the category, the $50,000 to $74,999 income range is the most frequent in Cherokee County, accounting for 19.1% of all households. In contrast, only 370 households (2.9%) fall into the $200,000+ income bracket, making it the least populous group.
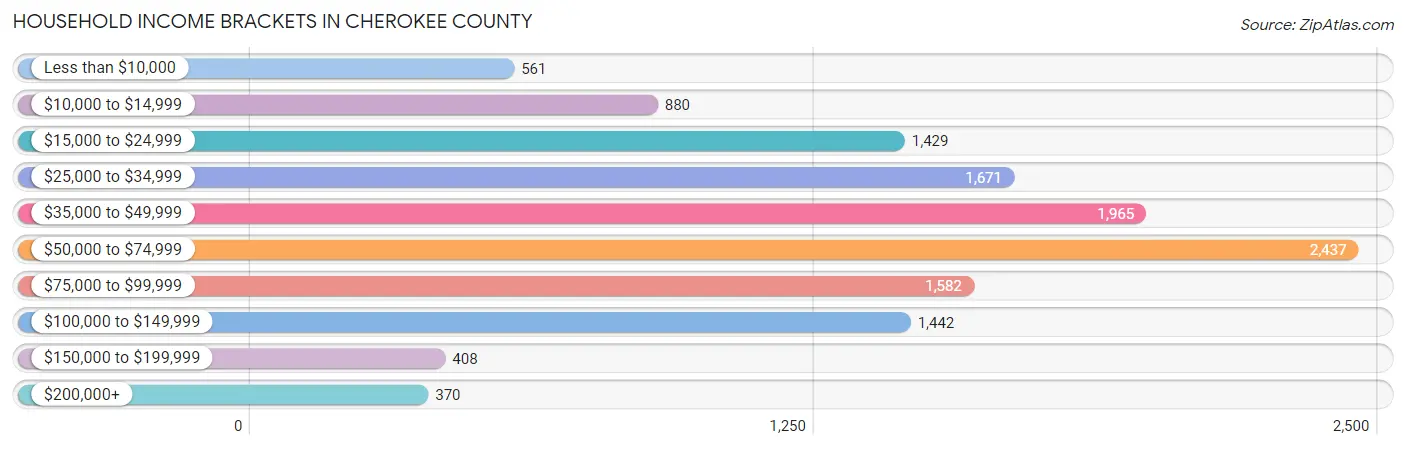
| Income Bracket | # Households | % Households |
| Less than $10,000 | 561 | 4.4% |
| $10,000 to $14,999 | 880 | 6.9% |
| $15,000 to $24,999 | 1,429 | 11.2% |
| $25,000 to $34,999 | 1,671 | 13.1% |
| $35,000 to $49,999 | 1,965 | 15.4% |
| $50,000 to $74,999 | 2,437 | 19.1% |
| $75,000 to $99,999 | 1,582 | 12.4% |
| $100,000 to $149,999 | 1,442 | 11.3% |
| $150,000 to $199,999 | 408 | 3.2% |
| $200,000+ | 370 | 2.9% |
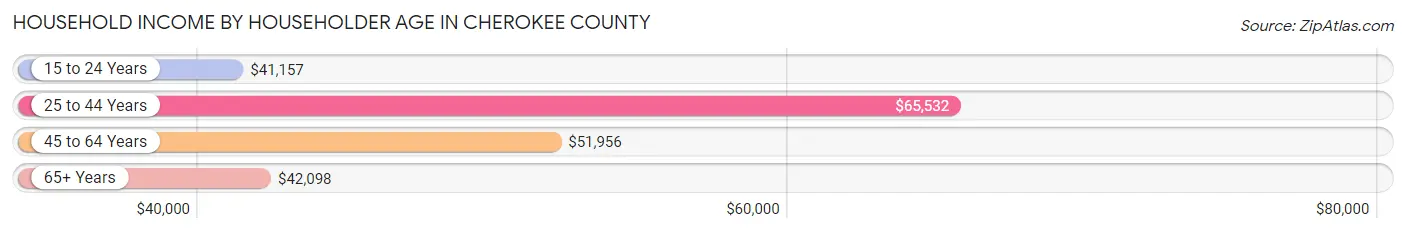
Household Income by Householder Age in Cherokee County
The median household income in Cherokee County is $49,254, with the highest median household income of $65,532 found in the 25 to 44 years age bracket for the primary householder. A total of 2,267 households (17.8%) fall into this category. Meanwhile, the 15 to 24 years age bracket for the primary householder has the lowest median household income of $41,157, with 458 households (3.6%) in this group.
| Income Bracket | # Households | Median Income |
| 15 to 24 Years | 458 (3.6%) | $41,157 |
| 25 to 44 Years | 2,267 (17.8%) | $65,532 |
| 45 to 64 Years | 4,596 (36.0%) | $51,956 |
| 65+ Years | 5,437 (42.6%) | $42,098 |
| Total | 12,758 (100.0%) | $49,254 |
Poverty in Cherokee County
Income Below Poverty by Sex and Age in Cherokee County
With 15.5% poverty level for males and 17.9% for females among the residents of Cherokee County, 15 year old males and 5 year old females are the most vulnerable to poverty, with 81 males (40.5%) and 79 females (44.9%) in their respective age groups living below the poverty level.
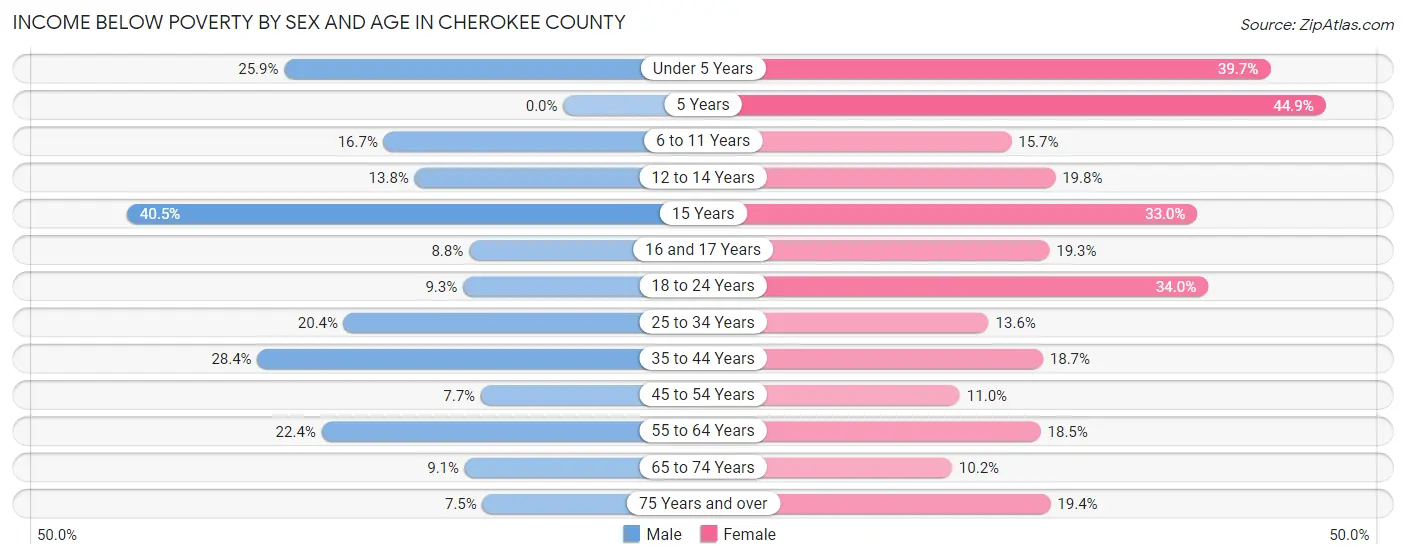
| Age Bracket | Male | Female |
| Under 5 Years | 130 (25.9%) | 211 (39.7%) |
| 5 Years | 0 (0.0%) | 79 (44.9%) |
| 6 to 11 Years | 168 (16.7%) | 76 (15.7%) |
| 12 to 14 Years | 49 (13.8%) | 107 (19.8%) |
| 15 Years | 81 (40.5%) | 65 (33.0%) |
| 16 and 17 Years | 26 (8.7%) | 57 (19.3%) |
| 18 to 24 Years | 79 (9.3%) | 313 (34.0%) |
| 25 to 34 Years | 265 (20.4%) | 160 (13.6%) |
| 35 to 44 Years | 383 (28.4%) | 246 (18.7%) |
| 45 to 54 Years | 135 (7.6%) | 199 (11.0%) |
| 55 to 64 Years | 512 (22.4%) | 448 (18.4%) |
| 65 to 74 Years | 238 (9.1%) | 284 (10.2%) |
| 75 Years and over | 116 (7.5%) | 343 (19.4%) |
| Total | 2,182 (15.5%) | 2,588 (17.9%) |
Income Above Poverty by Sex and Age in Cherokee County
According to the poverty statistics in Cherokee County, males aged 5 years and females aged 65 to 74 years are the age groups that are most secure financially, with 100.0% of males and 89.8% of females in these age groups living above the poverty line.
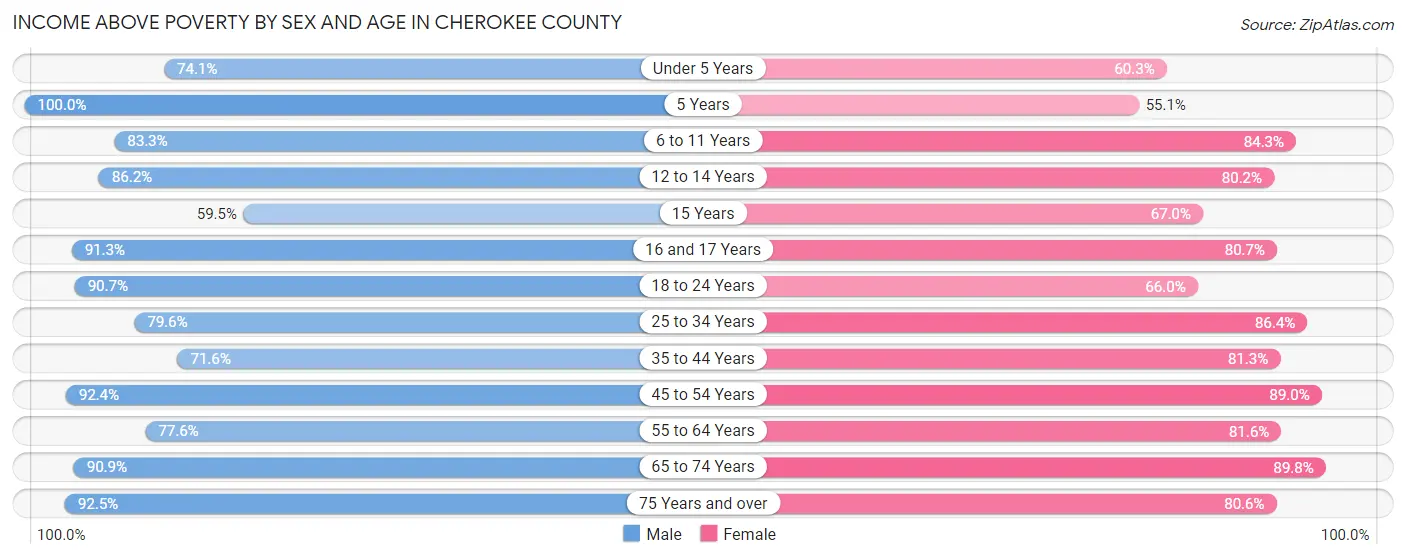
| Age Bracket | Male | Female |
| Under 5 Years | 372 (74.1%) | 320 (60.3%) |
| 5 Years | 11 (100.0%) | 97 (55.1%) |
| 6 to 11 Years | 840 (83.3%) | 407 (84.3%) |
| 12 to 14 Years | 306 (86.2%) | 433 (80.2%) |
| 15 Years | 119 (59.5%) | 132 (67.0%) |
| 16 and 17 Years | 271 (91.2%) | 239 (80.7%) |
| 18 to 24 Years | 770 (90.7%) | 608 (66.0%) |
| 25 to 34 Years | 1,036 (79.6%) | 1,014 (86.4%) |
| 35 to 44 Years | 966 (71.6%) | 1,072 (81.3%) |
| 45 to 54 Years | 1,629 (92.3%) | 1,616 (89.0%) |
| 55 to 64 Years | 1,771 (77.6%) | 1,980 (81.6%) |
| 65 to 74 Years | 2,367 (90.9%) | 2,495 (89.8%) |
| 75 Years and over | 1,432 (92.5%) | 1,429 (80.6%) |
| Total | 11,890 (84.5%) | 11,842 (82.1%) |
Income Below Poverty Among Married-Couple Families in Cherokee County
The poverty statistics for married-couple families in Cherokee County show that 7.6% or 496 of the total 6,553 families live below the poverty line. Families with 1 or 2 children have the highest poverty rate of 10.4%, comprising of 103 families. On the other hand, families with 3 or 4 children have the lowest poverty rate of 3.0%, which includes 11 families.
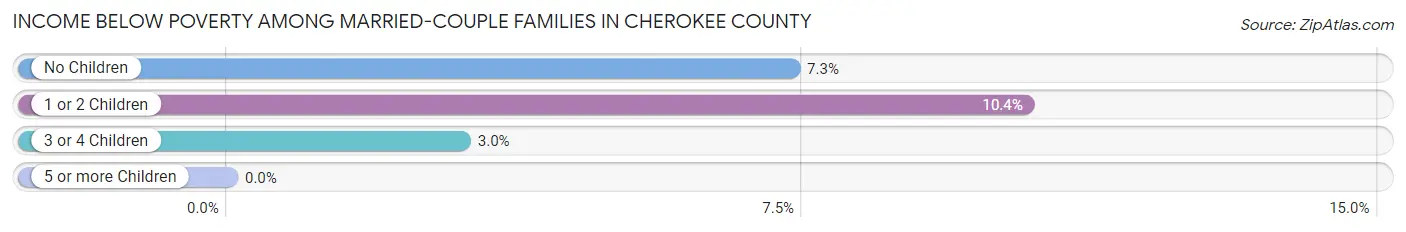
| Children | Above Poverty | Below Poverty |
| No Children | 4,819 (92.7%) | 382 (7.3%) |
| 1 or 2 Children | 887 (89.6%) | 103 (10.4%) |
| 3 or 4 Children | 351 (97.0%) | 11 (3.0%) |
| 5 or more Children | 0 (0.0%) | 0 (0.0%) |
| Total | 6,057 (92.4%) | 496 (7.6%) |
Income Below Poverty Among Single-Parent Households in Cherokee County
According to the poverty data in Cherokee County, 6.9% or 19 single-father households and 36.9% or 446 single-mother households are living below the poverty line. Among single-father households, those with 3 or 4 children have the highest poverty rate, with 9 households (100.0%) experiencing poverty. Likewise, among single-mother households, those with 3 or 4 children have the highest poverty rate, with 122 households (96.1%) falling below the poverty line.
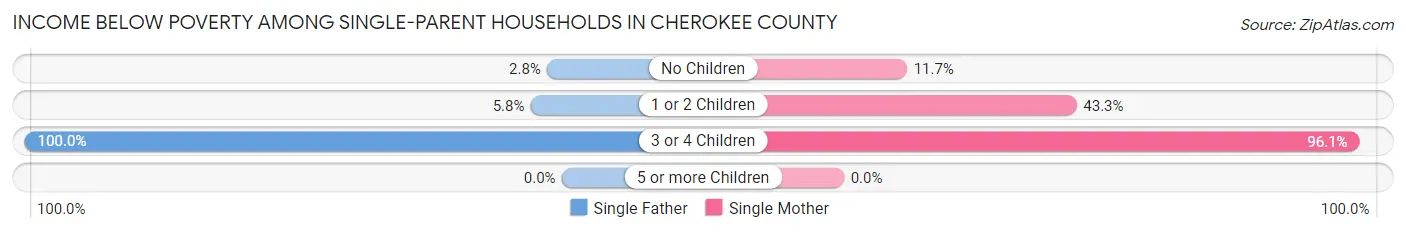
| Children | Single Father | Single Mother |
| No Children | 5 (2.8%) | 54 (11.7%) |
| 1 or 2 Children | 5 (5.8%) | 270 (43.3%) |
| 3 or 4 Children | 9 (100.0%) | 122 (96.1%) |
| 5 or more Children | 0 (0.0%) | 0 (0.0%) |
| Total | 19 (6.9%) | 446 (36.9%) |
Income Below Poverty Among Married-Couple vs Single-Parent Households in Cherokee County
The poverty data for Cherokee County shows that 496 of the married-couple family households (7.6%) and 465 of the single-parent households (31.3%) are living below the poverty level. Within the married-couple family households, those with 1 or 2 children have the highest poverty rate, with 103 households (10.4%) falling below the poverty line. Among the single-parent households, those with 3 or 4 children have the highest poverty rate, with 131 household (96.3%) living below poverty.
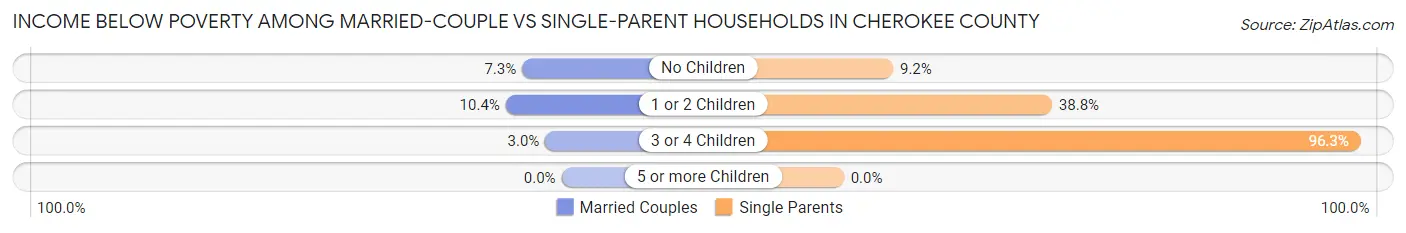
| Children | Married-Couple Families | Single-Parent Households |
| No Children | 382 (7.3%) | 59 (9.2%) |
| 1 or 2 Children | 103 (10.4%) | 275 (38.8%) |
| 3 or 4 Children | 11 (3.0%) | 131 (96.3%) |
| 5 or more Children | 0 (0.0%) | 0 (0.0%) |
| Total | 496 (7.6%) | 465 (31.3%) |
Race in Cherokee County
The most populous races in Cherokee County are White / Caucasian (26,502 | 91.8%), Hispanic or Latino (1,071 | 3.7%), and Two or more Races (1,048 | 3.6%).
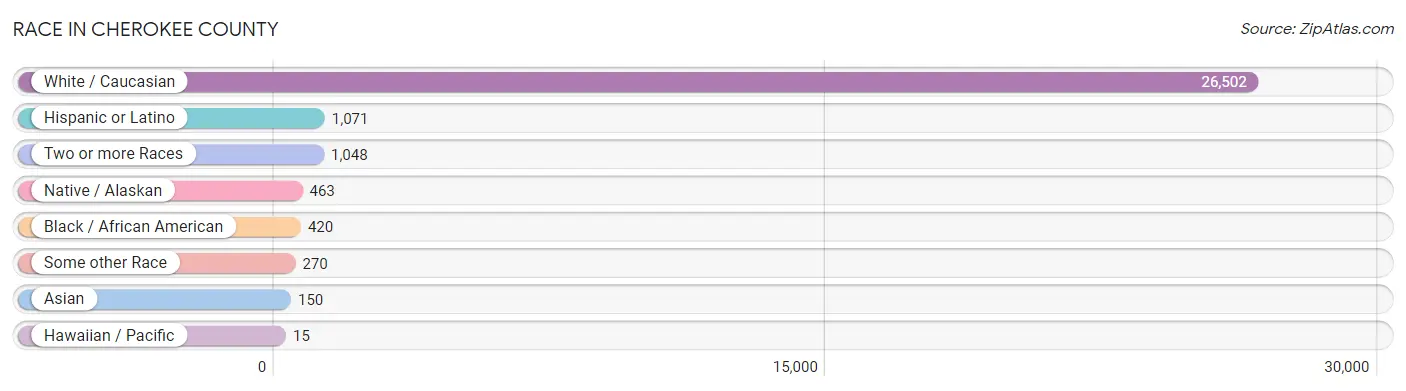
| Race | # Population | % Population |
| Asian | 150 | 0.5% |
| Black / African American | 420 | 1.5% |
| Hawaiian / Pacific | 15 | 0.1% |
| Hispanic or Latino | 1,071 | 3.7% |
| Native / Alaskan | 463 | 1.6% |
| White / Caucasian | 26,502 | 91.8% |
| Two or more Races | 1,048 | 3.6% |
| Some other Race | 270 | 0.9% |
| Total | 28,868 | 100.0% |
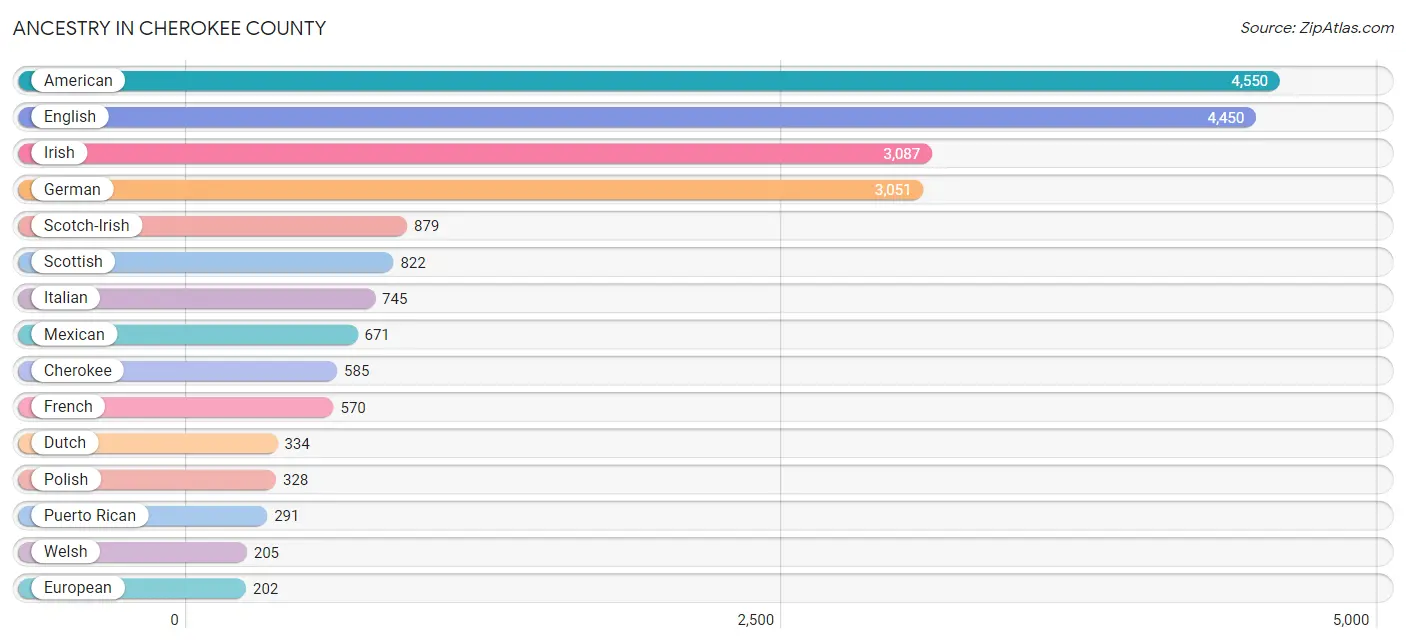
Ancestry in Cherokee County
The most populous ancestries reported in Cherokee County are American (4,550 | 15.8%), English (4,450 | 15.4%), Irish (3,087 | 10.7%), German (3,051 | 10.6%), and Scotch-Irish (879 | 3.0%), together accounting for 55.5% of all Cherokee County residents.
| Ancestry | # Population | % Population |
| African | 12 | 0.0% |
| Alaska Native | 2 | 0.0% |
| Alsatian | 55 | 0.2% |
| American | 4,550 | 15.8% |
| Arab | 2 | 0.0% |
| Austrian | 32 | 0.1% |
| Bangladeshi | 52 | 0.2% |
| Belgian | 83 | 0.3% |
| Bhutanese | 24 | 0.1% |
| Blackfeet | 27 | 0.1% |
| Brazilian | 67 | 0.2% |
| British | 113 | 0.4% |
| Cajun | 9 | 0.0% |
| Canadian | 8 | 0.0% |
| Celtic | 15 | 0.1% |
| Central American | 7 | 0.0% |
| Central American Indian | 7 | 0.0% |
| Cherokee | 585 | 2.0% |
| Cuban | 65 | 0.2% |
| Czech | 56 | 0.2% |
| Danish | 18 | 0.1% |
| Dutch | 334 | 1.2% |
| Eastern European | 37 | 0.1% |
| English | 4,450 | 15.4% |
| European | 202 | 0.7% |
| French | 570 | 2.0% |
| French Canadian | 85 | 0.3% |
| German | 3,051 | 10.6% |
| Greek | 62 | 0.2% |
| Guamanian / Chamorro | 28 | 0.1% |
| Guatemalan | 7 | 0.0% |
| Hungarian | 30 | 0.1% |
| Indian (Asian) | 6 | 0.0% |
| Indonesian | 2 | 0.0% |
| Inupiat | 3 | 0.0% |
| Irish | 3,087 | 10.7% |
| Italian | 745 | 2.6% |
| Korean | 128 | 0.4% |
| Lebanese | 2 | 0.0% |
| Lumbee | 73 | 0.3% |
| Mexican | 671 | 2.3% |
| Norwegian | 150 | 0.5% |
| Pakistani | 10 | 0.0% |
| Polish | 328 | 1.1% |
| Portuguese | 76 | 0.3% |
| Puerto Rican | 291 | 1.0% |
| Romanian | 5 | 0.0% |
| Russian | 76 | 0.3% |
| Scandinavian | 61 | 0.2% |
| Scotch-Irish | 879 | 3.0% |
| Scottish | 822 | 2.9% |
| Sioux | 9 | 0.0% |
| Slovak | 8 | 0.0% |
| South African | 5 | 0.0% |
| Sri Lankan | 19 | 0.1% |
| Subsaharan African | 17 | 0.1% |
| Swedish | 166 | 0.6% |
| Swiss | 116 | 0.4% |
| Tlingit-Haida | 4 | 0.0% |
| Ukrainian | 31 | 0.1% |
| Welsh | 205 | 0.7% |
| Yakama | 2 | 0.0% | View All 62 Rows |
Immigrants in Cherokee County
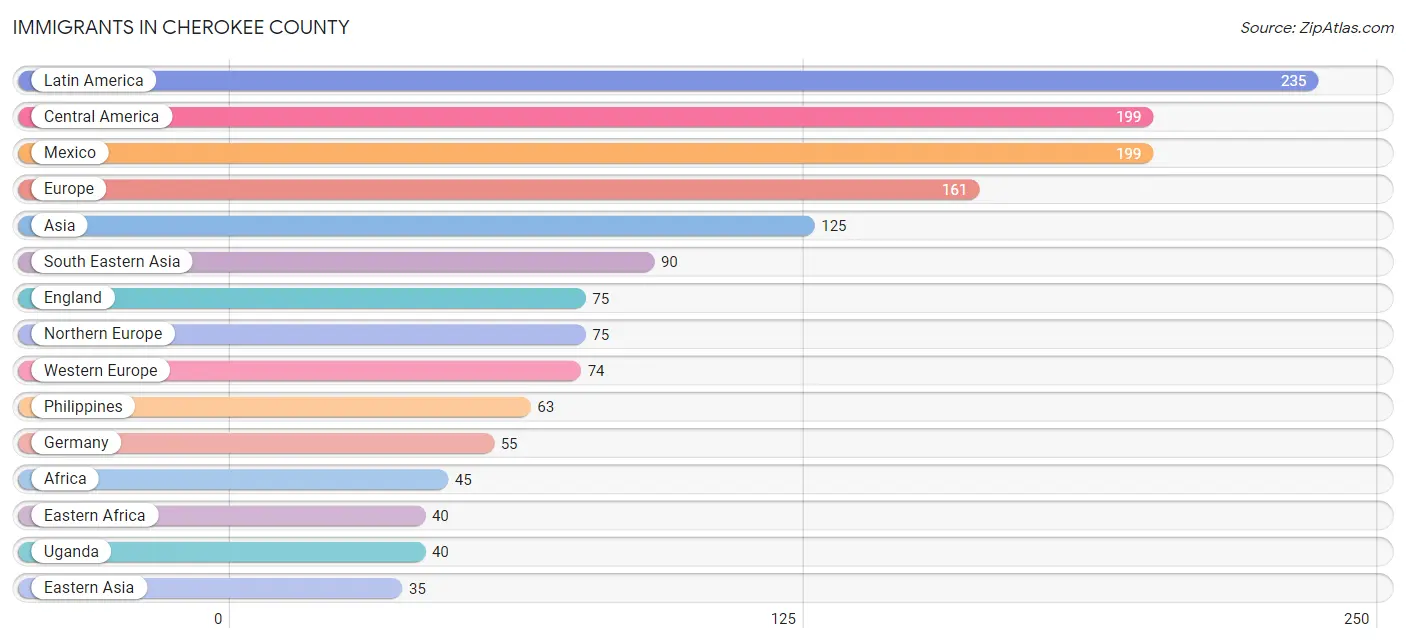
The most numerous immigrant groups reported in Cherokee County came from Latin America (235 | 0.8%), Central America (199 | 0.7%), Mexico (199 | 0.7%), Europe (161 | 0.6%), and Asia (125 | 0.4%), together accounting for 3.2% of all Cherokee County residents.
| Immigration Origin | # Population | % Population |
| Africa | 45 | 0.2% |
| Asia | 125 | 0.4% |
| Australia | 10 | 0.0% |
| Brazil | 32 | 0.1% |
| Canada | 12 | 0.0% |
| Caribbean | 4 | 0.0% |
| Central America | 199 | 0.7% |
| China | 5 | 0.0% |
| Eastern Africa | 40 | 0.1% |
| Eastern Asia | 35 | 0.1% |
| Eastern Europe | 5 | 0.0% |
| England | 75 | 0.3% |
| Europe | 161 | 0.6% |
| Germany | 55 | 0.2% |
| Hong Kong | 5 | 0.0% |
| Indonesia | 3 | 0.0% |
| Italy | 7 | 0.0% |
| Japan | 30 | 0.1% |
| Latin America | 235 | 0.8% |
| Malaysia | 3 | 0.0% |
| Mexico | 199 | 0.7% |
| Netherlands | 19 | 0.1% |
| Northern Europe | 75 | 0.3% |
| Oceania | 10 | 0.0% |
| Philippines | 63 | 0.2% |
| Romania | 5 | 0.0% |
| South Africa | 5 | 0.0% |
| South America | 32 | 0.1% |
| South Eastern Asia | 90 | 0.3% |
| Southern Europe | 7 | 0.0% |
| Trinidad and Tobago | 4 | 0.0% |
| Uganda | 40 | 0.1% |
| Vietnam | 19 | 0.1% |
| Western Europe | 74 | 0.3% | View All 34 Rows |
Sex and Age in Cherokee County
Sex and Age in Cherokee County
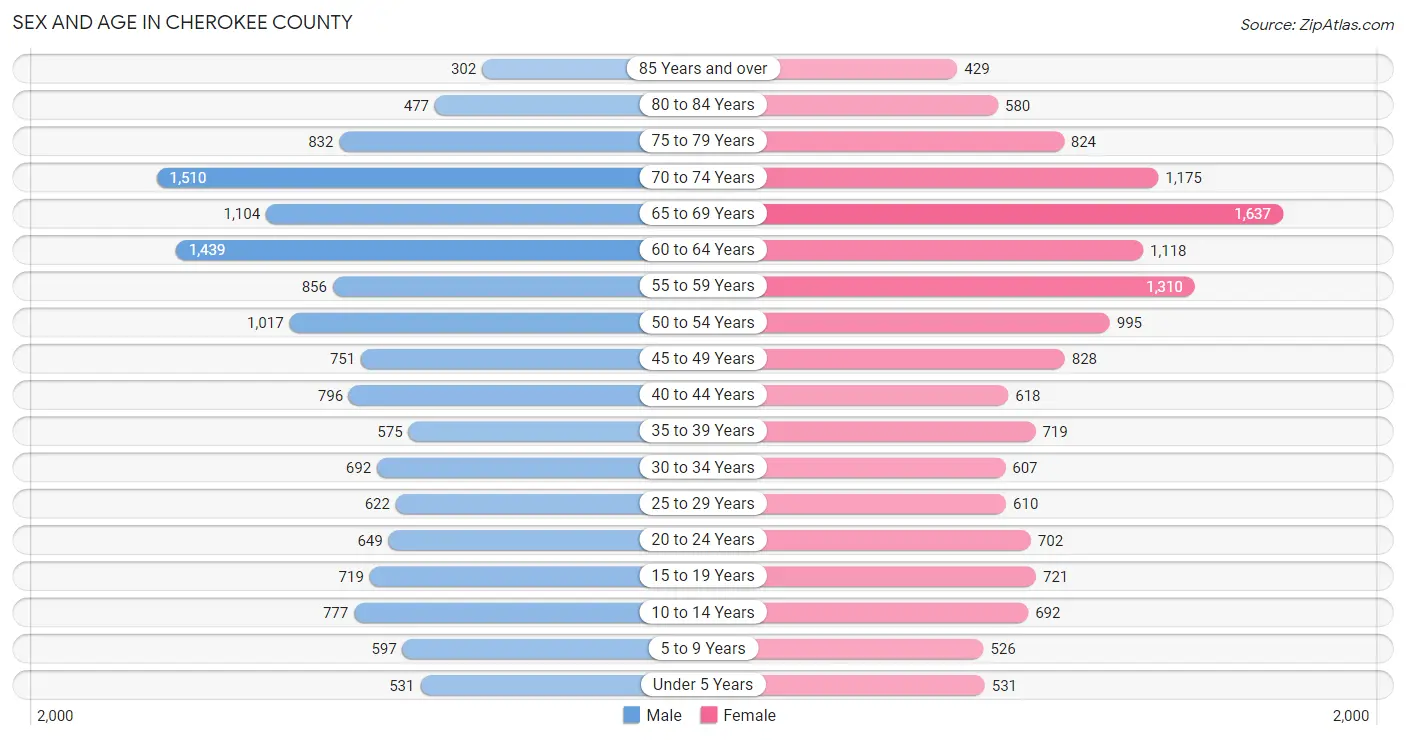
The most populous age groups in Cherokee County are 70 to 74 Years (1,510 | 10.6%) for men and 65 to 69 Years (1,637 | 11.2%) for women.
| Age Bracket | Male | Female |
| Under 5 Years | 531 (3.7%) | 531 (3.6%) |
| 5 to 9 Years | 597 (4.2%) | 526 (3.6%) |
| 10 to 14 Years | 777 (5.4%) | 692 (4.7%) |
| 15 to 19 Years | 719 (5.1%) | 721 (4.9%) |
| 20 to 24 Years | 649 (4.6%) | 702 (4.8%) |
| 25 to 29 Years | 622 (4.4%) | 610 (4.2%) |
| 30 to 34 Years | 692 (4.9%) | 607 (4.2%) |
| 35 to 39 Years | 575 (4.0%) | 719 (4.9%) |
| 40 to 44 Years | 796 (5.6%) | 618 (4.2%) |
| 45 to 49 Years | 751 (5.3%) | 828 (5.7%) |
| 50 to 54 Years | 1,017 (7.1%) | 995 (6.8%) |
| 55 to 59 Years | 856 (6.0%) | 1,310 (9.0%) |
| 60 to 64 Years | 1,439 (10.1%) | 1,118 (7.6%) |
| 65 to 69 Years | 1,104 (7.7%) | 1,637 (11.2%) |
| 70 to 74 Years | 1,510 (10.6%) | 1,175 (8.0%) |
| 75 to 79 Years | 832 (5.8%) | 824 (5.6%) |
| 80 to 84 Years | 477 (3.4%) | 580 (4.0%) |
| 85 Years and over | 302 (2.1%) | 429 (2.9%) |
| Total | 14,246 (100.0%) | 14,622 (100.0%) |
Families and Households in Cherokee County
Median Family Size in Cherokee County
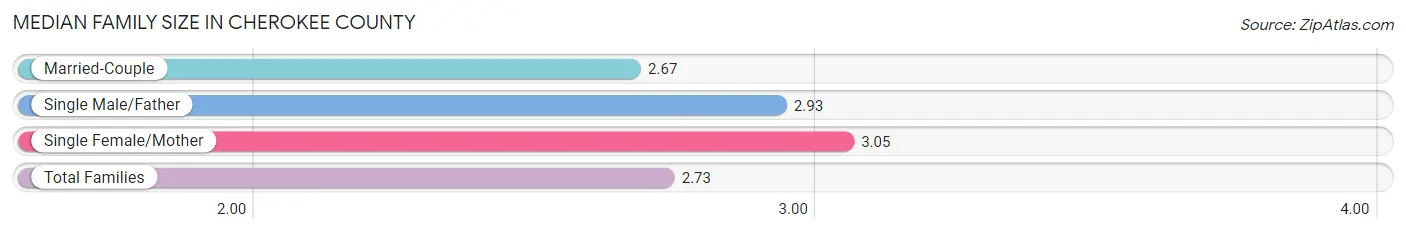
The median family size in Cherokee County is 2.73 persons per family, with single female/mother families (1,210 | 15.0%) accounting for the largest median family size of 3.05 persons per family. On the other hand, married-couple families (6,553 | 81.5%) represent the smallest median family size with 2.67 persons per family.
| Family Type | # Families | Family Size |
| Married-Couple | 6,553 (81.5%) | 2.67 |
| Single Male/Father | 276 (3.4%) | 2.93 |
| Single Female/Mother | 1,210 (15.0%) | 3.05 |
| Total Families | 8,039 (100.0%) | 2.73 |
Median Household Size in Cherokee County
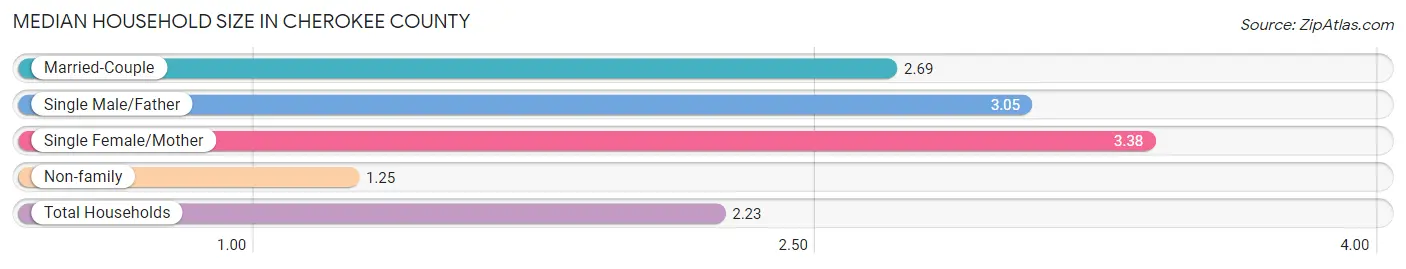
The median household size in Cherokee County is 2.23 persons per household, with single female/mother households (1,210 | 9.5%) accounting for the largest median household size of 3.38 persons per household. non-family households (4,719 | 37.0%) represent the smallest median household size with 1.25 persons per household.
| Household Type | # Households | Household Size |
| Married-Couple | 6,553 (51.4%) | 2.69 |
| Single Male/Father | 276 (2.2%) | 3.05 |
| Single Female/Mother | 1,210 (9.5%) | 3.38 |
| Non-family | 4,719 (37.0%) | 1.25 |
| Total Households | 12,758 (100.0%) | 2.23 |
Household Size by Marriage Status in Cherokee County
Out of a total of 12,758 households in Cherokee County, 8,039 (63.0%) are family households, while 4,719 (37.0%) are nonfamily households. The most numerous type of family households are 2-person households, comprising 5,252, and the most common type of nonfamily households are 1-person households, comprising 3,861.
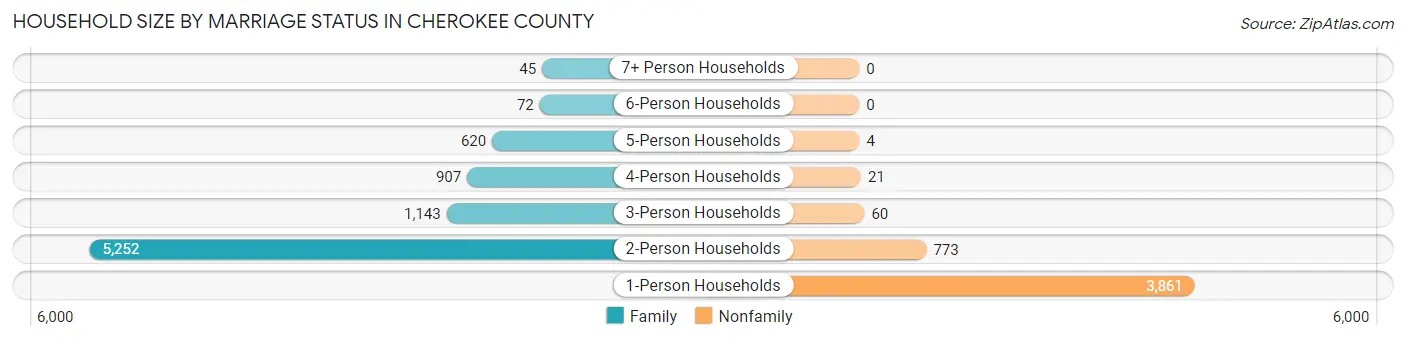
| Household Size | Family Households | Nonfamily Households |
| 1-Person Households | - | 3,861 (30.3%) |
| 2-Person Households | 5,252 (41.2%) | 773 (6.1%) |
| 3-Person Households | 1,143 (9.0%) | 60 (0.5%) |
| 4-Person Households | 907 (7.1%) | 21 (0.2%) |
| 5-Person Households | 620 (4.9%) | 4 (0.0%) |
| 6-Person Households | 72 (0.6%) | 0 (0.0%) |
| 7+ Person Households | 45 (0.4%) | 0 (0.0%) |
| Total | 8,039 (63.0%) | 4,719 (37.0%) |
Female Fertility in Cherokee County
Fertility by Age in Cherokee County
Average fertility rate in Cherokee County is 69.0 births per 1,000 women. Women in the age bracket of 20 to 34 years have the highest fertility rate with 145.0 births per 1,000 women. Women in the age bracket of 20 to 34 years acount for 81.3% of all women with births.
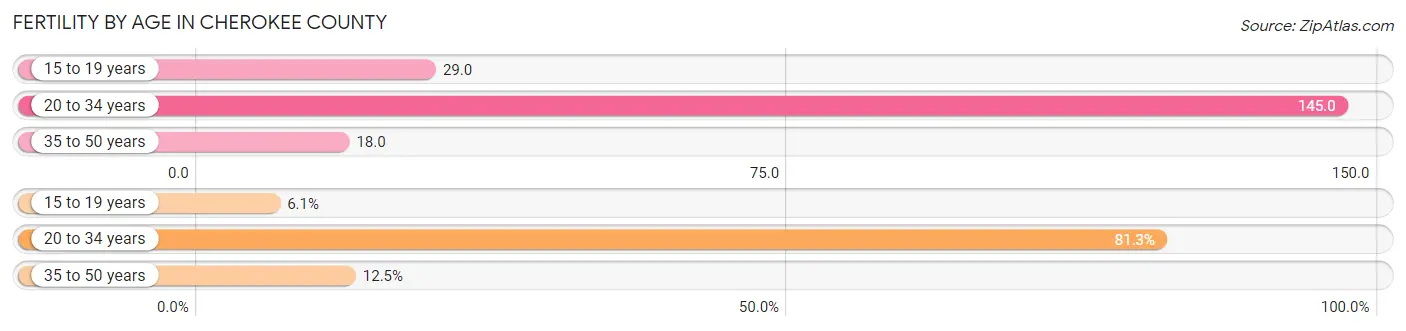
| Age Bracket | Women with Births | Births / 1,000 Women |
| 15 to 19 years | 21 (6.1%) | 29.0 |
| 20 to 34 years | 279 (81.3%) | 145.0 |
| 35 to 50 years | 43 (12.5%) | 18.0 |
| Total | 343 (100.0%) | 69.0 |
Fertility by Age by Marriage Status in Cherokee County
51.6% of women with births (343) in Cherokee County are married. The highest percentage of unmarried women with births falls into 20 to 34 years age bracket with 55.6% of them unmarried at the time of birth, while the lowest percentage of unmarried women with births belong to 35 to 50 years age bracket with 0.0% of them unmarried.
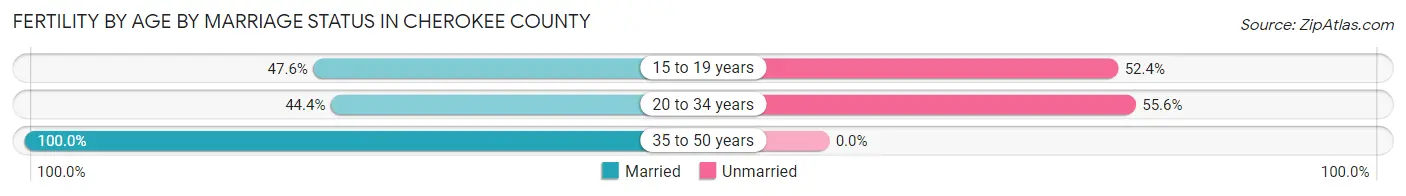
| Age Bracket | Married | Unmarried |
| 15 to 19 years | 10 (47.6%) | 11 (52.4%) |
| 20 to 34 years | 124 (44.4%) | 155 (55.6%) |
| 35 to 50 years | 43 (100.0%) | 0 (0.0%) |
| Total | 177 (51.6%) | 166 (48.4%) |
Fertility by Education in Cherokee County
Average fertility rate in Cherokee County is 69.0 births per 1,000 women. Women with the education attainment of bachelor's degree have the highest fertility rate of 194.0 births per 1,000 women, while women with the education attainment of less than high school have the lowest fertility at 7.0 births per 1,000 women. Women with the education attainment of bachelor's degree represent 49.6% of all women with births.
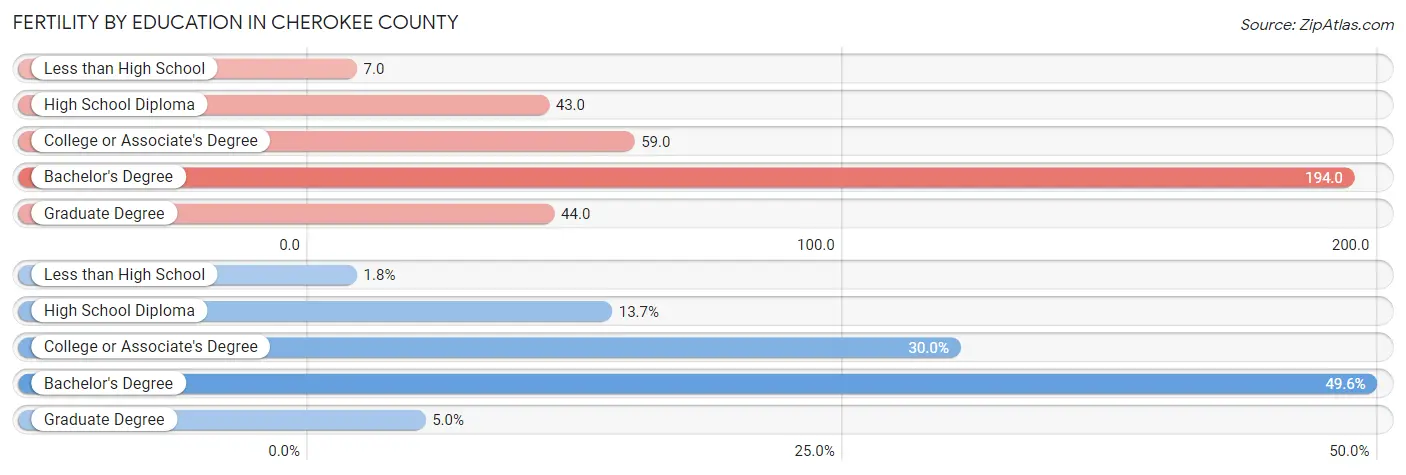
| Educational Attainment | Women with Births | Births / 1,000 Women |
| Less than High School | 6 (1.8%) | 7.0 |
| High School Diploma | 47 (13.7%) | 43.0 |
| College or Associate's Degree | 103 (30.0%) | 59.0 |
| Bachelor's Degree | 170 (49.6%) | 194.0 |
| Graduate Degree | 17 (5.0%) | 44.0 |
| Total | 343 (100.0%) | 69.0 |
Fertility by Education by Marriage Status in Cherokee County
48.4% of women with births in Cherokee County are unmarried. Women with the educational attainment of less than high school are most likely to be married with 100.0% of them married at childbirth, while women with the educational attainment of college or associate's degree are least likely to be married with 84.5% of them unmarried at childbirth.
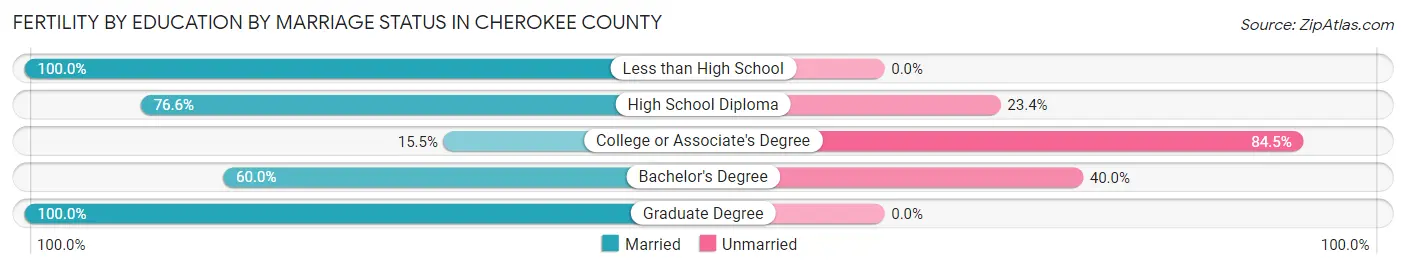
| Educational Attainment | Married | Unmarried |
| Less than High School | 6 (100.0%) | 0 (0.0%) |
| High School Diploma | 36 (76.6%) | 11 (23.4%) |
| College or Associate's Degree | 16 (15.5%) | 87 (84.5%) |
| Bachelor's Degree | 102 (60.0%) | 68 (40.0%) |
| Graduate Degree | 17 (100.0%) | 0 (0.0%) |
| Total | 177 (51.6%) | 166 (48.4%) |
Employment Characteristics in Cherokee County
Employment by Class of Employer in Cherokee County
Among the 11,047 employed individuals in Cherokee County, private company employees (7,560 | 68.4%), not-for-profit organizations (920 | 8.3%), and self-employed (not incorporated) (863 | 7.8%) make up the most common classes of employment.
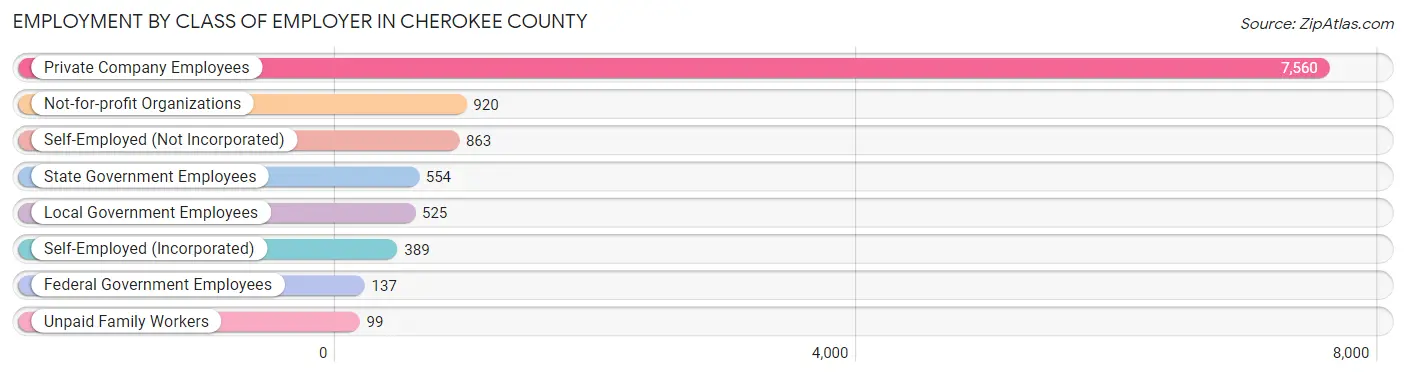
| Employer Class | # Employees | % Employees |
| Private Company Employees | 7,560 | 68.4% |
| Self-Employed (Incorporated) | 389 | 3.5% |
| Self-Employed (Not Incorporated) | 863 | 7.8% |
| Not-for-profit Organizations | 920 | 8.3% |
| Local Government Employees | 525 | 4.8% |
| State Government Employees | 554 | 5.0% |
| Federal Government Employees | 137 | 1.2% |
| Unpaid Family Workers | 99 | 0.9% |
| Total | 11,047 | 100.0% |
Employment Status by Age in Cherokee County
According to the labor force statistics for Cherokee County, out of the total population over 16 years of age (24,817), 48.4% or 12,011 individuals are in the labor force, with 4.9% or 589 of them unemployed. The age group with the highest labor force participation rate is 25 to 29 years, with 92.2% or 1,136 individuals in the labor force. Within the labor force, the 16 to 19 years age range has the highest percentage of unemployed individuals, with 22.5% or 98 of them being unemployed.
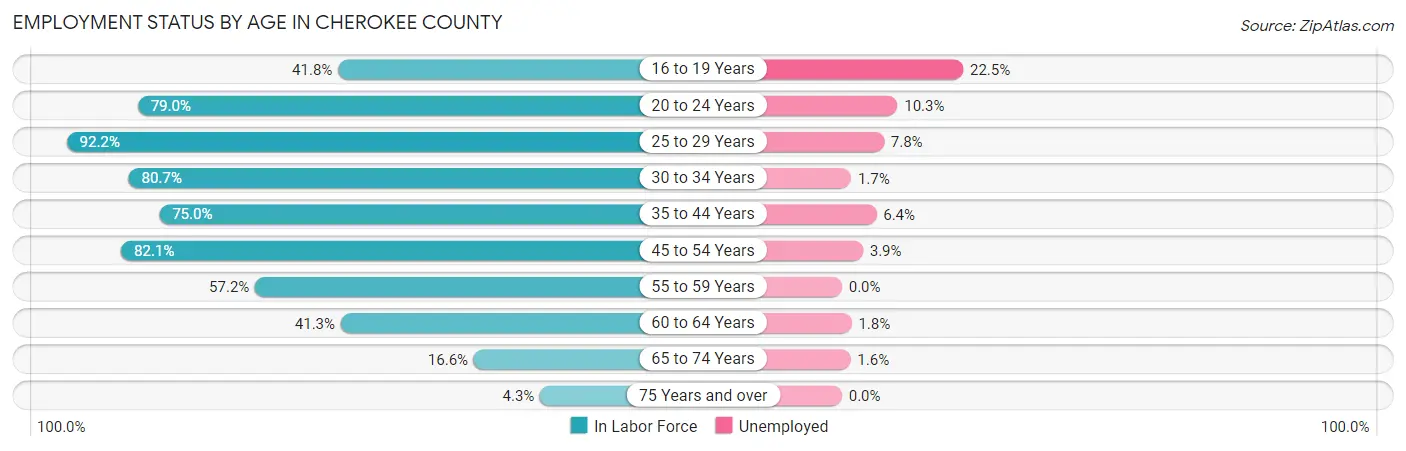
| Age Bracket | In Labor Force | Unemployed |
| 16 to 19 Years | 436 (41.8%) | 98 (22.5%) |
| 20 to 24 Years | 1,067 (79.0%) | 110 (10.3%) |
| 25 to 29 Years | 1,136 (92.2%) | 89 (7.8%) |
| 30 to 34 Years | 1,048 (80.7%) | 18 (1.7%) |
| 35 to 44 Years | 2,031 (75.0%) | 130 (6.4%) |
| 45 to 54 Years | 2,948 (82.1%) | 115 (3.9%) |
| 55 to 59 Years | 1,239 (57.2%) | 0 (0.0%) |
| 60 to 64 Years | 1,056 (41.3%) | 19 (1.8%) |
| 65 to 74 Years | 901 (16.6%) | 14 (1.6%) |
| 75 Years and over | 148 (4.3%) | 0 (0.0%) |
| Total | 12,011 (48.4%) | 589 (4.9%) |
Employment Status by Educational Attainment in Cherokee County
According to labor force statistics for Cherokee County, 69.8% of individuals (9,460) out of the total population between 25 and 64 years of age (13,553) are in the labor force, with 3.9% or 369 of them being unemployed. The group with the highest labor force participation rate are those with the educational attainment of bachelor's degree or higher, with 76.5% or 2,264 individuals in the labor force. Within the labor force, individuals with less than high school education have the highest percentage of unemployment, with 11.5% or 63 of them being unemployed.
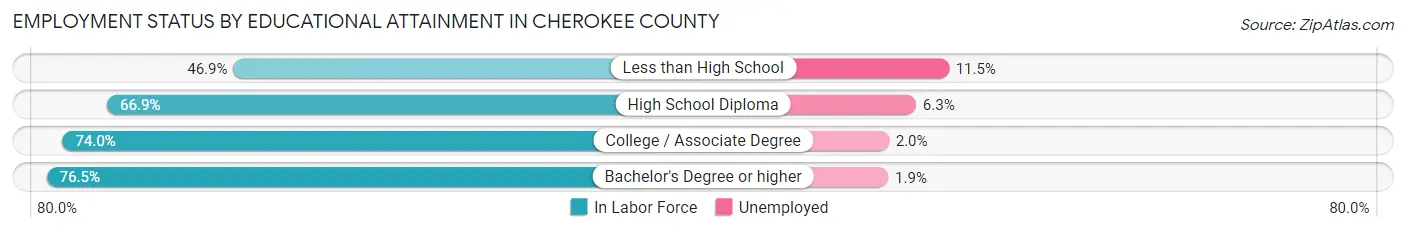
| Educational Attainment | In Labor Force | Unemployed |
| Less than High School | 548 (46.9%) | 134 (11.5%) |
| High School Diploma | 3,055 (66.9%) | 288 (6.3%) |
| College / Associate Degree | 3,595 (74.0%) | 97 (2.0%) |
| Bachelor's Degree or higher | 2,264 (76.5%) | 56 (1.9%) |
| Total | 9,460 (69.8%) | 529 (3.9%) |
Employment Occupations by Sex in Cherokee County
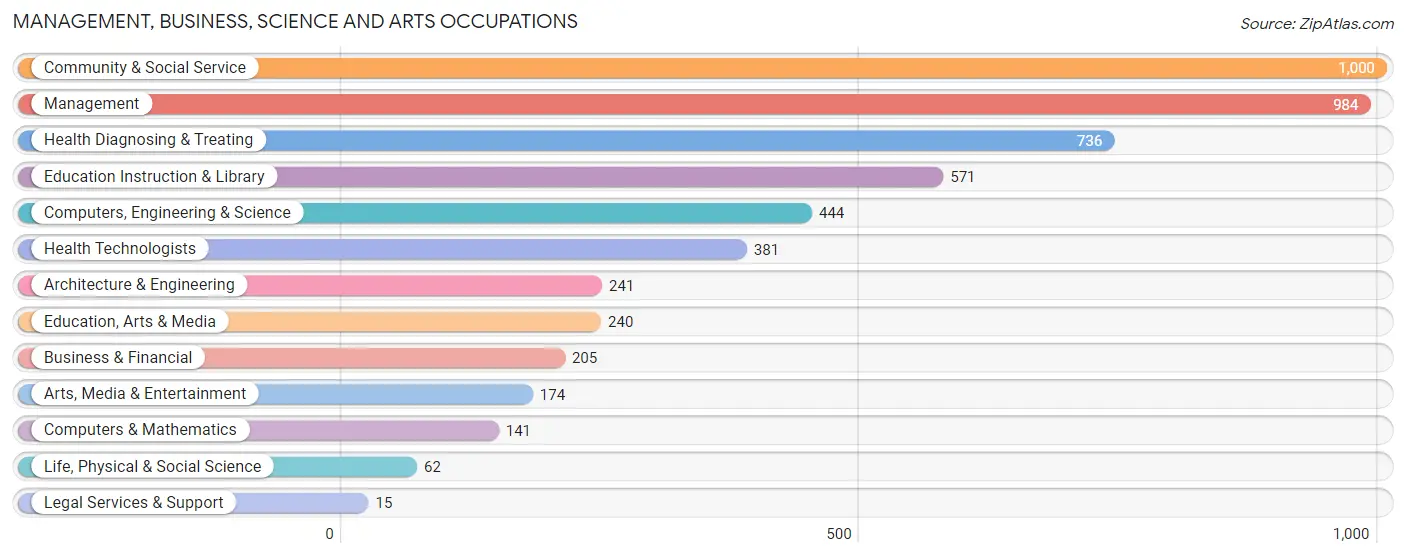
Management, Business, Science and Arts Occupations
The most common Management, Business, Science and Arts occupations in Cherokee County are Community & Social Service (1,000 | 8.8%), Management (984 | 8.6%), Health Diagnosing & Treating (736 | 6.5%), Education Instruction & Library (571 | 5.0%), and Computers, Engineering & Science (444 | 3.9%).
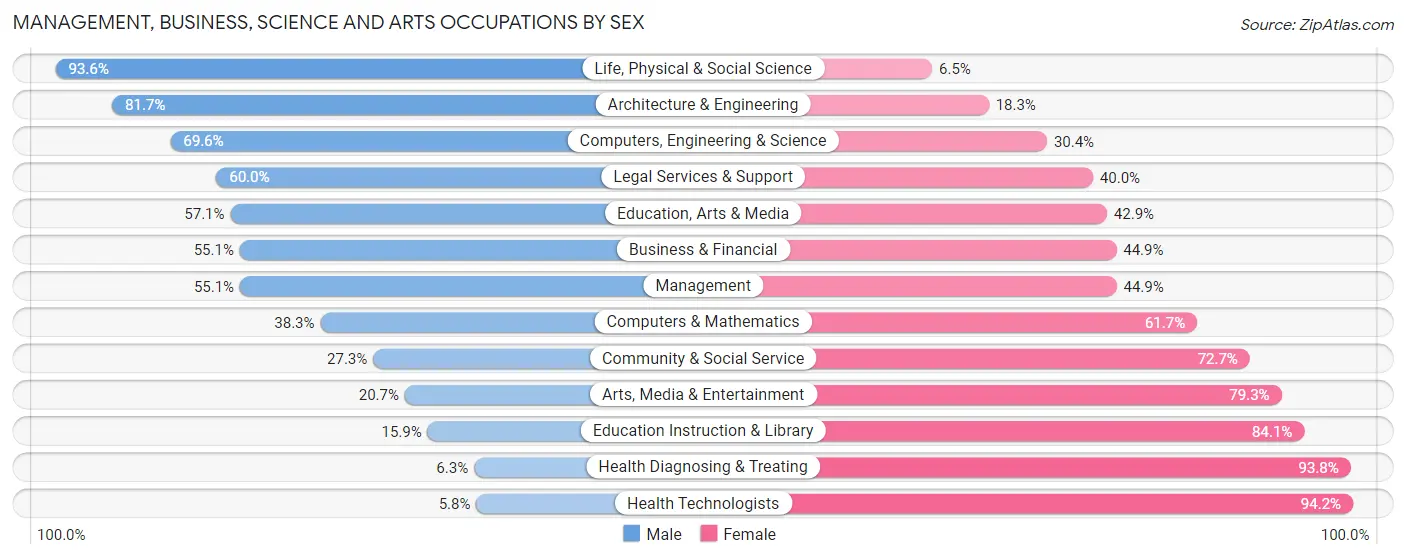
Management, Business, Science and Arts Occupations by Sex
Within the Management, Business, Science and Arts occupations in Cherokee County, the most male-oriented occupations are Life, Physical & Social Science (93.5%), Architecture & Engineering (81.7%), and Computers, Engineering & Science (69.6%), while the most female-oriented occupations are Health Technologists (94.2%), Health Diagnosing & Treating (93.8%), and Education Instruction & Library (84.1%).
| Occupation | Male | Female |
| Management | 542 (55.1%) | 442 (44.9%) |
| Business & Financial | 113 (55.1%) | 92 (44.9%) |
| Computers, Engineering & Science | 309 (69.6%) | 135 (30.4%) |
| Computers & Mathematics | 54 (38.3%) | 87 (61.7%) |
| Architecture & Engineering | 197 (81.7%) | 44 (18.3%) |
| Life, Physical & Social Science | 58 (93.5%) | 4 (6.5%) |
| Community & Social Service | 273 (27.3%) | 727 (72.7%) |
| Education, Arts & Media | 137 (57.1%) | 103 (42.9%) |
| Legal Services & Support | 9 (60.0%) | 6 (40.0%) |
| Education Instruction & Library | 91 (15.9%) | 480 (84.1%) |
| Arts, Media & Entertainment | 36 (20.7%) | 138 (79.3%) |
| Health Diagnosing & Treating | 46 (6.2%) | 690 (93.8%) |
| Health Technologists | 22 (5.8%) | 359 (94.2%) |
| Total (Category) | 1,283 (38.1%) | 2,086 (61.9%) |
| Total (Overall) | 5,898 (51.8%) | 5,493 (48.2%) |
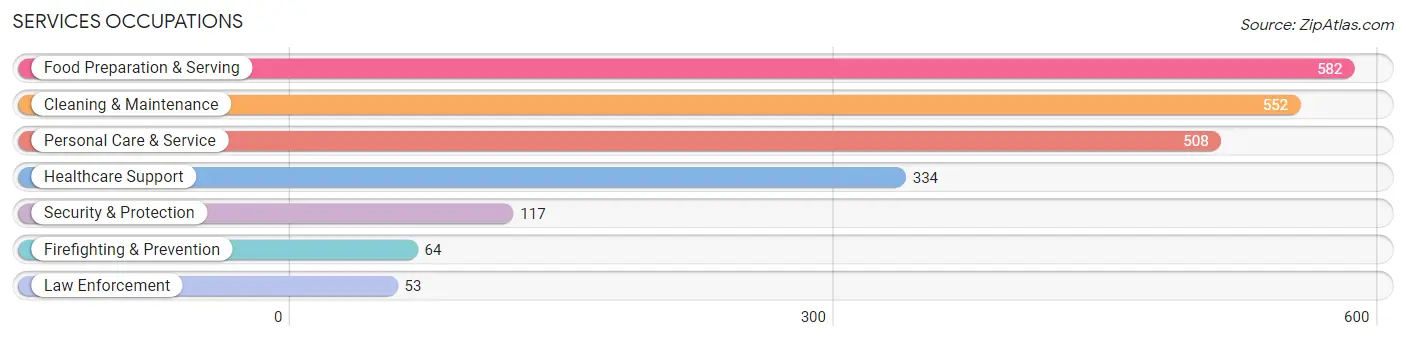
Services Occupations
The most common Services occupations in Cherokee County are Food Preparation & Serving (582 | 5.1%), Cleaning & Maintenance (552 | 4.9%), Personal Care & Service (508 | 4.5%), Healthcare Support (334 | 2.9%), and Security & Protection (117 | 1.0%).
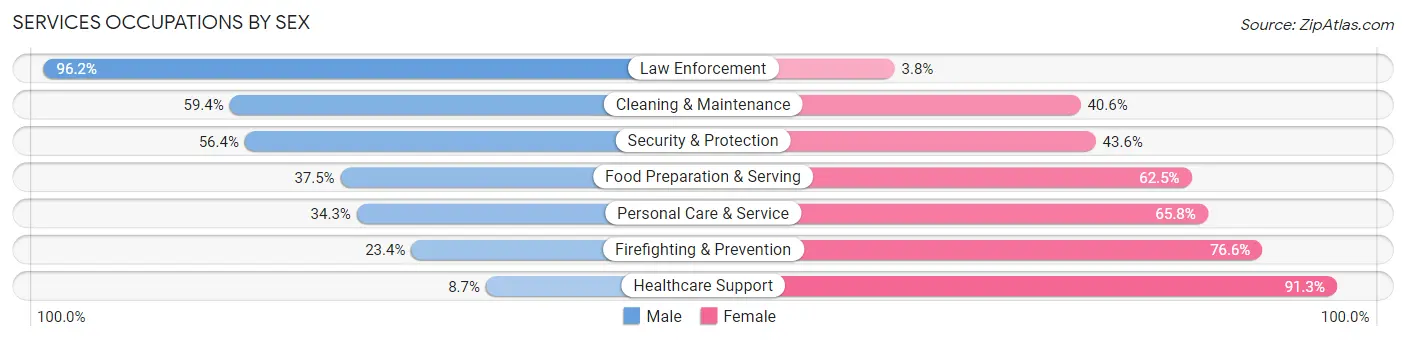
Services Occupations by Sex
Within the Services occupations in Cherokee County, the most male-oriented occupations are Law Enforcement (96.2%), Cleaning & Maintenance (59.4%), and Security & Protection (56.4%), while the most female-oriented occupations are Healthcare Support (91.3%), Firefighting & Prevention (76.6%), and Personal Care & Service (65.7%).
| Occupation | Male | Female |
| Healthcare Support | 29 (8.7%) | 305 (91.3%) |
| Security & Protection | 66 (56.4%) | 51 (43.6%) |
| Firefighting & Prevention | 15 (23.4%) | 49 (76.6%) |
| Law Enforcement | 51 (96.2%) | 2 (3.8%) |
| Food Preparation & Serving | 218 (37.5%) | 364 (62.5%) |
| Cleaning & Maintenance | 328 (59.4%) | 224 (40.6%) |
| Personal Care & Service | 174 (34.3%) | 334 (65.7%) |
| Total (Category) | 815 (38.9%) | 1,278 (61.1%) |
| Total (Overall) | 5,898 (51.8%) | 5,493 (48.2%) |
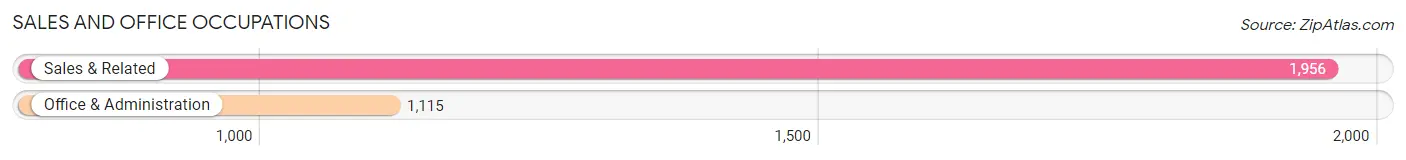
Sales and Office Occupations
The most common Sales and Office occupations in Cherokee County are Sales & Related (1,956 | 17.2%), and Office & Administration (1,115 | 9.8%).
Sales and Office Occupations by Sex
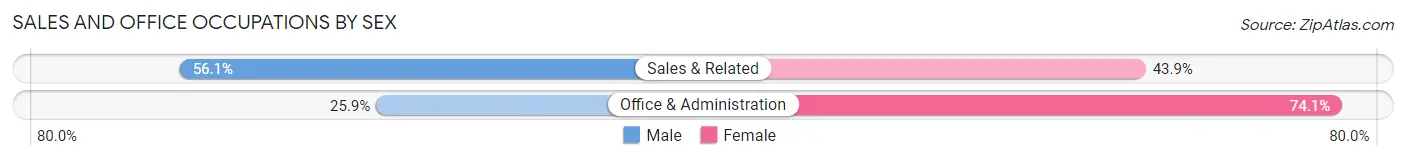
| Occupation | Male | Female |
| Sales & Related | 1,098 (56.1%) | 858 (43.9%) |
| Office & Administration | 289 (25.9%) | 826 (74.1%) |
| Total (Category) | 1,387 (45.2%) | 1,684 (54.8%) |
| Total (Overall) | 5,898 (51.8%) | 5,493 (48.2%) |
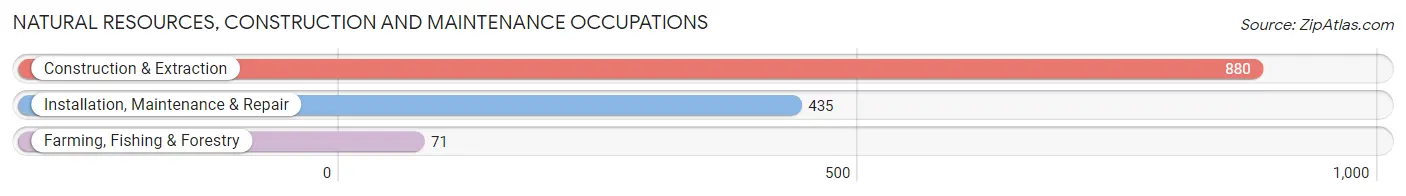
Natural Resources, Construction and Maintenance Occupations
The most common Natural Resources, Construction and Maintenance occupations in Cherokee County are Construction & Extraction (880 | 7.7%), Installation, Maintenance & Repair (435 | 3.8%), and Farming, Fishing & Forestry (71 | 0.6%).
Natural Resources, Construction and Maintenance Occupations by Sex
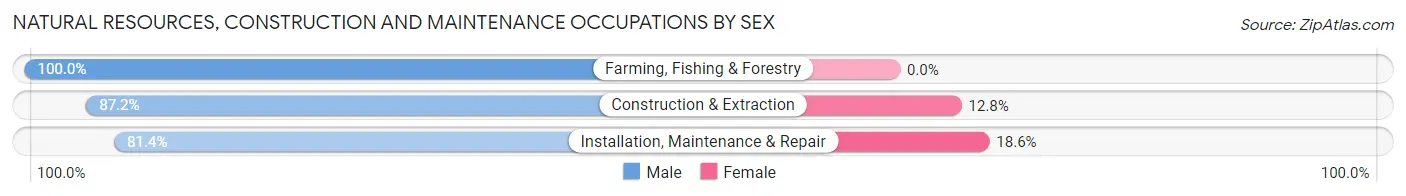
| Occupation | Male | Female |
| Farming, Fishing & Forestry | 71 (100.0%) | 0 (0.0%) |
| Construction & Extraction | 767 (87.2%) | 113 (12.8%) |
| Installation, Maintenance & Repair | 354 (81.4%) | 81 (18.6%) |
| Total (Category) | 1,192 (86.0%) | 194 (14.0%) |
| Total (Overall) | 5,898 (51.8%) | 5,493 (48.2%) |
Production, Transportation and Moving Occupations
The most common Production, Transportation and Moving occupations in Cherokee County are Production (837 | 7.3%), Transportation (324 | 2.8%), and Material Moving (311 | 2.7%).
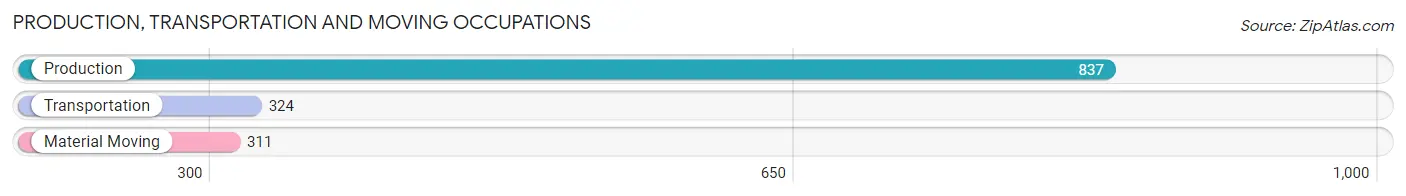
Production, Transportation and Moving Occupations by Sex
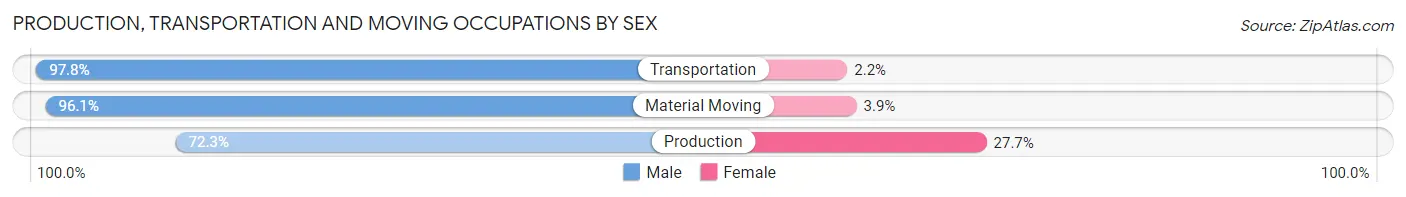
| Occupation | Male | Female |
| Production | 605 (72.3%) | 232 (27.7%) |
| Transportation | 317 (97.8%) | 7 (2.2%) |
| Material Moving | 299 (96.1%) | 12 (3.9%) |
| Total (Category) | 1,221 (83.0%) | 251 (17.1%) |
| Total (Overall) | 5,898 (51.8%) | 5,493 (48.2%) |
Employment Industries by Sex in Cherokee County
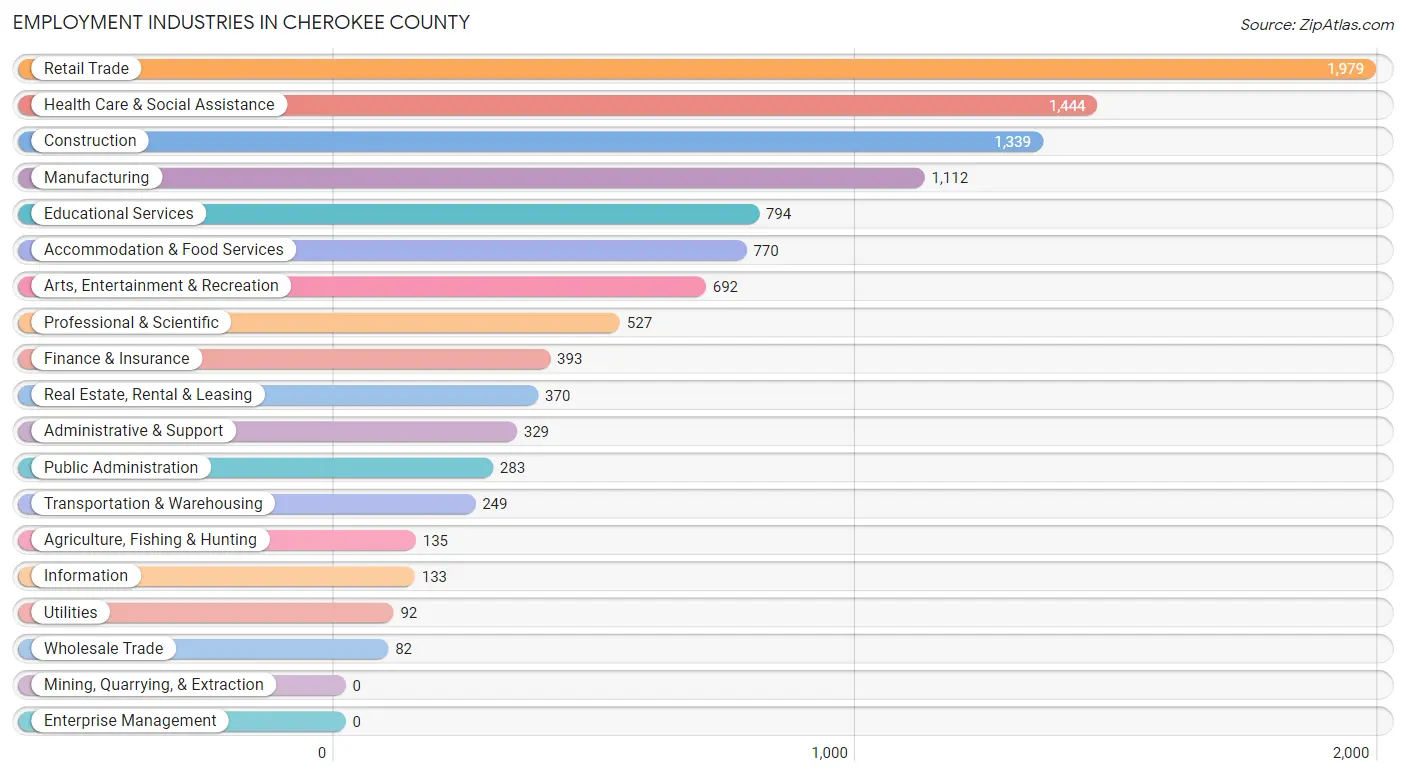
Employment Industries in Cherokee County
The major employment industries in Cherokee County include Retail Trade (1,979 | 17.4%), Health Care & Social Assistance (1,444 | 12.7%), Construction (1,339 | 11.7%), Manufacturing (1,112 | 9.8%), and Educational Services (794 | 7.0%).
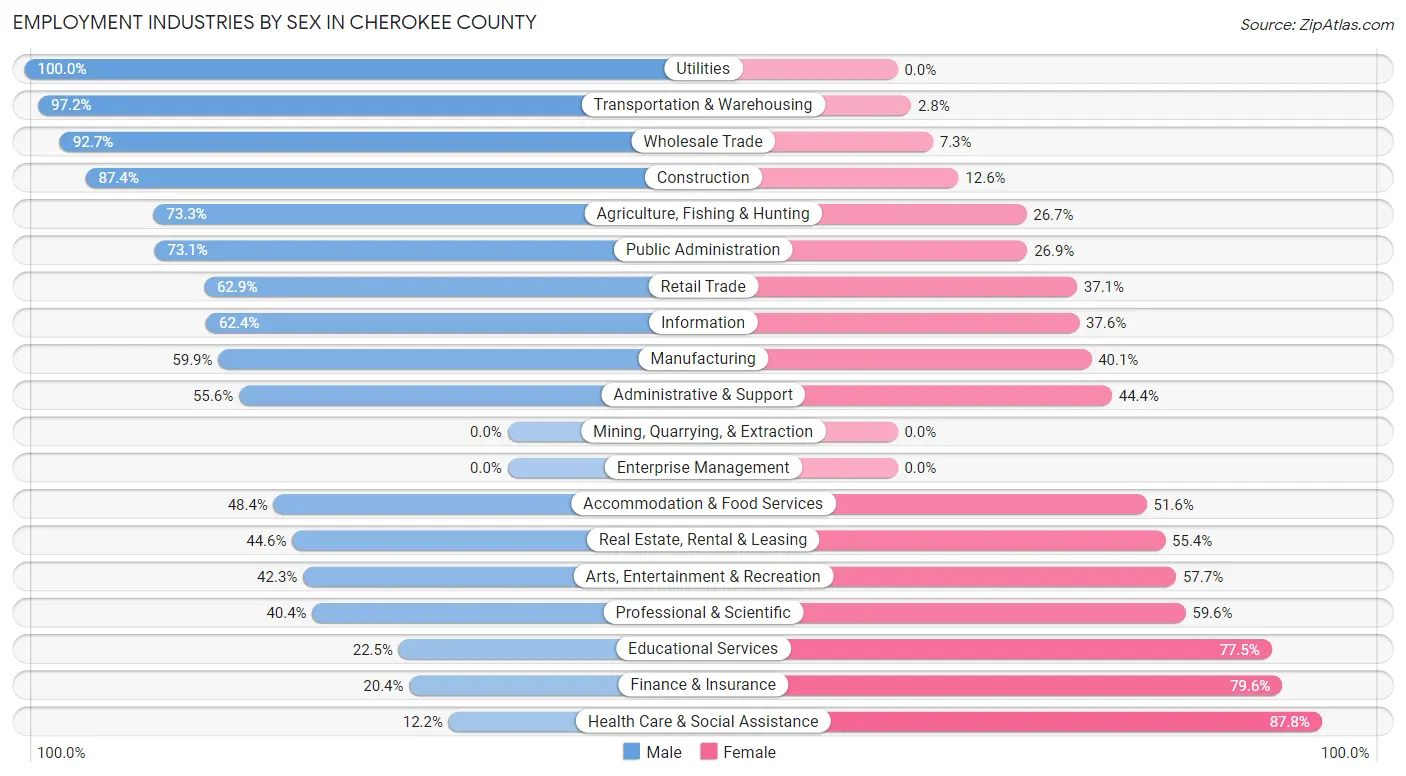
Employment Industries by Sex in Cherokee County
The Cherokee County industries that see more men than women are Utilities (100.0%), Transportation & Warehousing (97.2%), and Wholesale Trade (92.7%), whereas the industries that tend to have a higher number of women are Health Care & Social Assistance (87.8%), Finance & Insurance (79.6%), and Educational Services (77.5%).
| Industry | Male | Female |
| Agriculture, Fishing & Hunting | 99 (73.3%) | 36 (26.7%) |
| Mining, Quarrying, & Extraction | 0 (0.0%) | 0 (0.0%) |
| Construction | 1,170 (87.4%) | 169 (12.6%) |
| Manufacturing | 666 (59.9%) | 446 (40.1%) |
| Wholesale Trade | 76 (92.7%) | 6 (7.3%) |
| Retail Trade | 1,244 (62.9%) | 735 (37.1%) |
| Transportation & Warehousing | 242 (97.2%) | 7 (2.8%) |
| Utilities | 92 (100.0%) | 0 (0.0%) |
| Information | 83 (62.4%) | 50 (37.6%) |
| Finance & Insurance | 80 (20.4%) | 313 (79.6%) |
| Real Estate, Rental & Leasing | 165 (44.6%) | 205 (55.4%) |
| Professional & Scientific | 213 (40.4%) | 314 (59.6%) |
| Enterprise Management | 0 (0.0%) | 0 (0.0%) |
| Administrative & Support | 183 (55.6%) | 146 (44.4%) |
| Educational Services | 179 (22.5%) | 615 (77.5%) |
| Health Care & Social Assistance | 176 (12.2%) | 1,268 (87.8%) |
| Arts, Entertainment & Recreation | 293 (42.3%) | 399 (57.7%) |
| Accommodation & Food Services | 373 (48.4%) | 397 (51.6%) |
| Public Administration | 207 (73.1%) | 76 (26.9%) |
| Total | 5,898 (51.8%) | 5,493 (48.2%) |
Education in Cherokee County
School Enrollment in Cherokee County
The most common levels of schooling among the 4,607 students in Cherokee County are high school (1,330 | 28.9%), middle school (1,181 | 25.6%), and elementary school (827 | 17.9%).
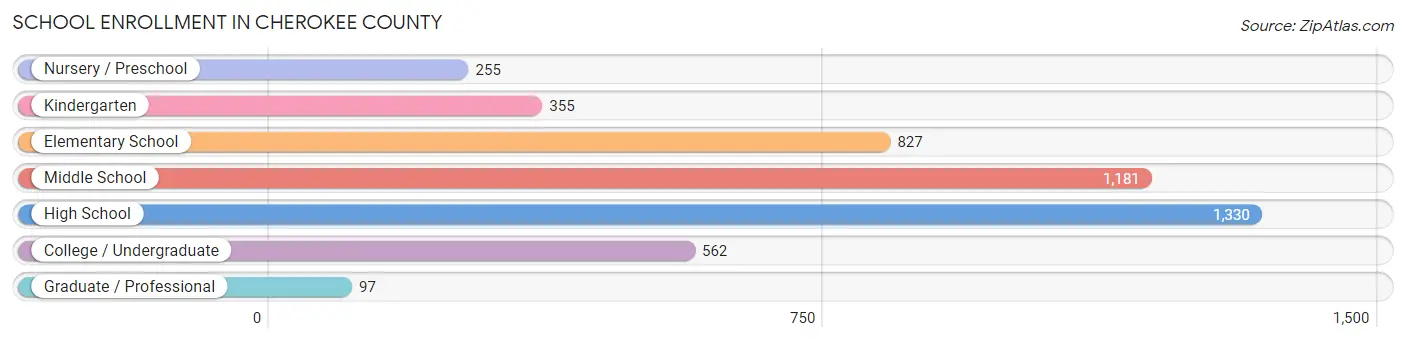
| School Level | # Students | % Students |
| Nursery / Preschool | 255 | 5.5% |
| Kindergarten | 355 | 7.7% |
| Elementary School | 827 | 17.9% |
| Middle School | 1,181 | 25.6% |
| High School | 1,330 | 28.9% |
| College / Undergraduate | 562 | 12.2% |
| Graduate / Professional | 97 | 2.1% |
| Total | 4,607 | 100.0% |
School Enrollment by Age by Funding Source in Cherokee County
Out of a total of 4,607 students who are enrolled in schools in Cherokee County, 714 (15.5%) attend a private institution, while the remaining 3,893 (84.5%) are enrolled in public schools. The age group of 35 years and over has the highest likelihood of being enrolled in private schools, with 105 (54.1% in the age bracket) enrolled. Conversely, the age group of 25 to 34 year olds has the lowest likelihood of being enrolled in a private school, with 82 (100.0% in the age bracket) attending a public institution.
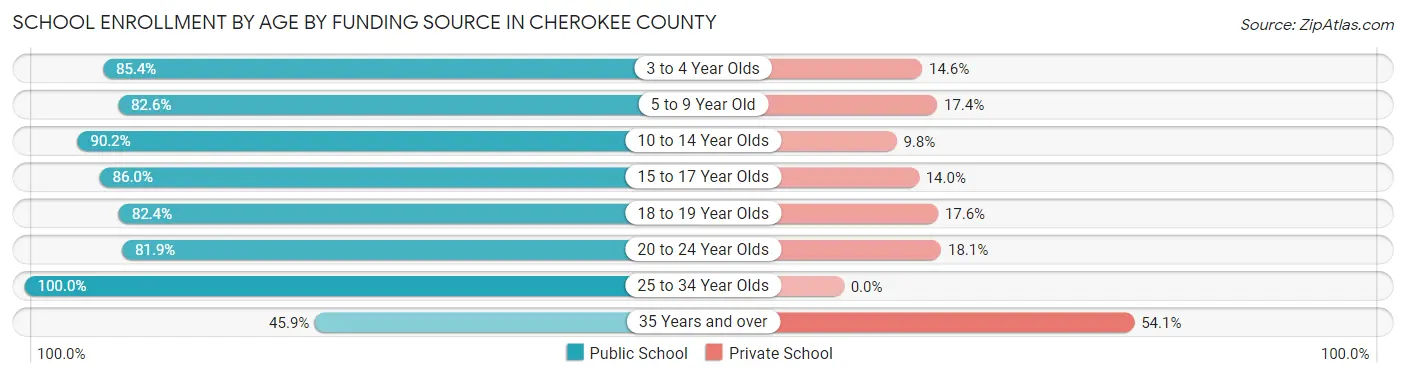
| Age Bracket | Public School | Private School |
| 3 to 4 Year Olds | 193 (85.4%) | 33 (14.6%) |
| 5 to 9 Year Old | 921 (82.6%) | 194 (17.4%) |
| 10 to 14 Year Olds | 1,302 (90.2%) | 142 (9.8%) |
| 15 to 17 Year Olds | 837 (86.0%) | 136 (14.0%) |
| 18 to 19 Year Olds | 277 (82.4%) | 59 (17.6%) |
| 20 to 24 Year Olds | 194 (81.9%) | 43 (18.1%) |
| 25 to 34 Year Olds | 82 (100.0%) | 0 (0.0%) |
| 35 Years and over | 89 (45.9%) | 105 (54.1%) |
| Total | 3,893 (84.5%) | 714 (15.5%) |
Educational Attainment by Field of Study in Cherokee County
Education (1,362 | 23.2%), business (1,216 | 20.7%), science & technology (622 | 10.6%), social sciences (503 | 8.6%), and liberal arts & history (362 | 6.2%) are the most common fields of study among 5,877 individuals in Cherokee County who have obtained a bachelor's degree or higher.
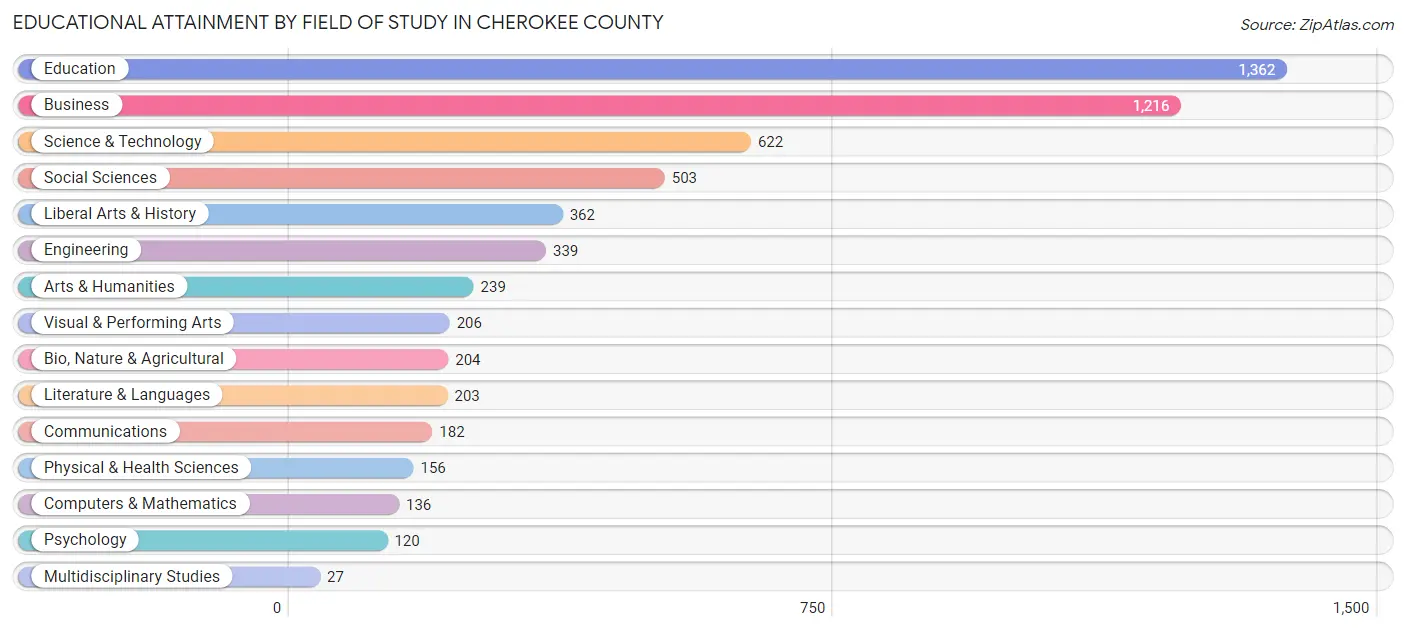
| Field of Study | # Graduates | % Graduates |
| Computers & Mathematics | 136 | 2.3% |
| Bio, Nature & Agricultural | 204 | 3.5% |
| Physical & Health Sciences | 156 | 2.6% |
| Psychology | 120 | 2.0% |
| Social Sciences | 503 | 8.6% |
| Engineering | 339 | 5.8% |
| Multidisciplinary Studies | 27 | 0.5% |
| Science & Technology | 622 | 10.6% |
| Business | 1,216 | 20.7% |
| Education | 1,362 | 23.2% |
| Literature & Languages | 203 | 3.5% |
| Liberal Arts & History | 362 | 6.2% |
| Visual & Performing Arts | 206 | 3.5% |
| Communications | 182 | 3.1% |
| Arts & Humanities | 239 | 4.1% |
| Total | 5,877 | 100.0% |
Transportation & Commute in Cherokee County
Vehicle Availability by Sex in Cherokee County
The most prevalent vehicle ownership categories in Cherokee County are males with 2 vehicles (1,992, accounting for 34.9%) and females with 2 vehicles (1,962, making up 37.4%).
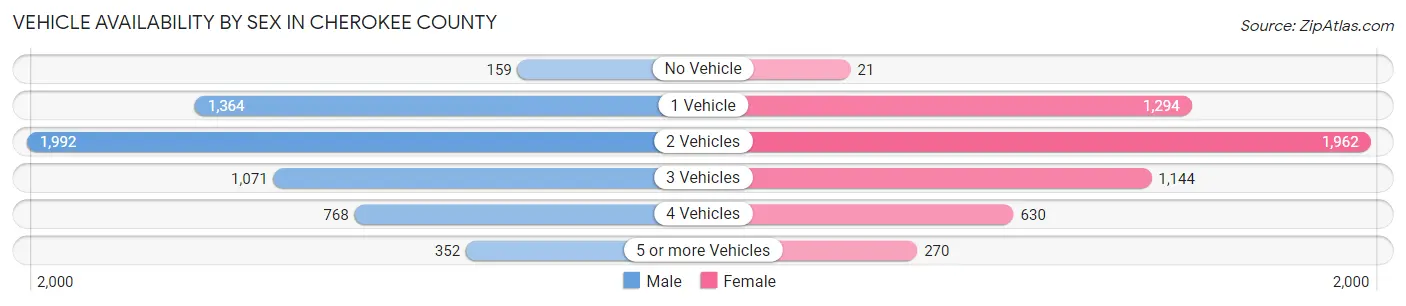
| Vehicles Available | Male | Female |
| No Vehicle | 159 (2.8%) | 21 (0.4%) |
| 1 Vehicle | 1,364 (23.9%) | 1,294 (24.3%) |
| 2 Vehicles | 1,992 (34.9%) | 1,962 (36.9%) |
| 3 Vehicles | 1,071 (18.8%) | 1,144 (21.5%) |
| 4 Vehicles | 768 (13.5%) | 630 (11.8%) |
| 5 or more Vehicles | 352 (6.2%) | 270 (5.1%) |
| Total | 5,706 (100.0%) | 5,321 (100.0%) |
Commute Time in Cherokee County
The most frequently occuring commute durations in Cherokee County are 20 to 24 minutes (1,961 commuters, 19.4%), 15 to 19 minutes (1,739 commuters, 17.2%), and 5 to 9 minutes (1,474 commuters, 14.6%).
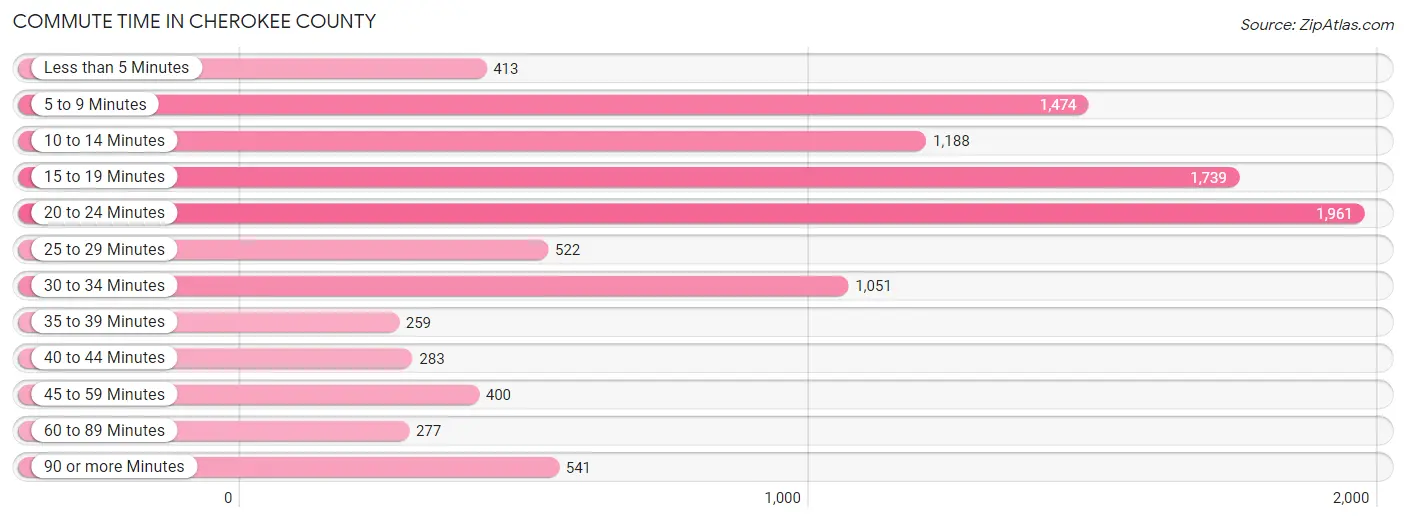
| Commute Time | # Commuters | % Commuters |
| Less than 5 Minutes | 413 | 4.1% |
| 5 to 9 Minutes | 1,474 | 14.6% |
| 10 to 14 Minutes | 1,188 | 11.7% |
| 15 to 19 Minutes | 1,739 | 17.2% |
| 20 to 24 Minutes | 1,961 | 19.4% |
| 25 to 29 Minutes | 522 | 5.2% |
| 30 to 34 Minutes | 1,051 | 10.4% |
| 35 to 39 Minutes | 259 | 2.6% |
| 40 to 44 Minutes | 283 | 2.8% |
| 45 to 59 Minutes | 400 | 4.0% |
| 60 to 89 Minutes | 277 | 2.7% |
| 90 or more Minutes | 541 | 5.3% |
Commute Time by Sex in Cherokee County
The most common commute times in Cherokee County are 20 to 24 minutes (977 commuters, 18.2%) for males and 20 to 24 minutes (984 commuters, 20.7%) for females.
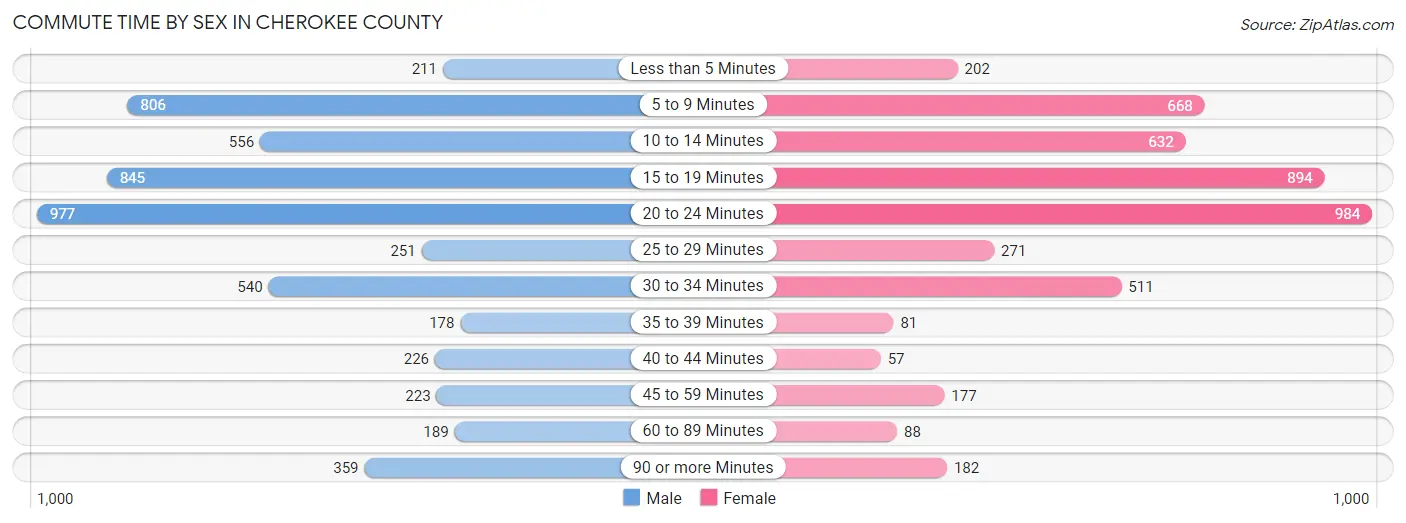
| Commute Time | Male | Female |
| Less than 5 Minutes | 211 (3.9%) | 202 (4.3%) |
| 5 to 9 Minutes | 806 (15.0%) | 668 (14.1%) |
| 10 to 14 Minutes | 556 (10.4%) | 632 (13.3%) |
| 15 to 19 Minutes | 845 (15.8%) | 894 (18.8%) |
| 20 to 24 Minutes | 977 (18.2%) | 984 (20.7%) |
| 25 to 29 Minutes | 251 (4.7%) | 271 (5.7%) |
| 30 to 34 Minutes | 540 (10.1%) | 511 (10.8%) |
| 35 to 39 Minutes | 178 (3.3%) | 81 (1.7%) |
| 40 to 44 Minutes | 226 (4.2%) | 57 (1.2%) |
| 45 to 59 Minutes | 223 (4.2%) | 177 (3.7%) |
| 60 to 89 Minutes | 189 (3.5%) | 88 (1.8%) |
| 90 or more Minutes | 359 (6.7%) | 182 (3.8%) |
Time of Departure to Work by Sex in Cherokee County
The most frequent times of departure to work in Cherokee County are 7:00 AM to 7:29 AM (1,154, 21.5%) for males and 7:30 AM to 7:59 AM (988, 20.8%) for females.
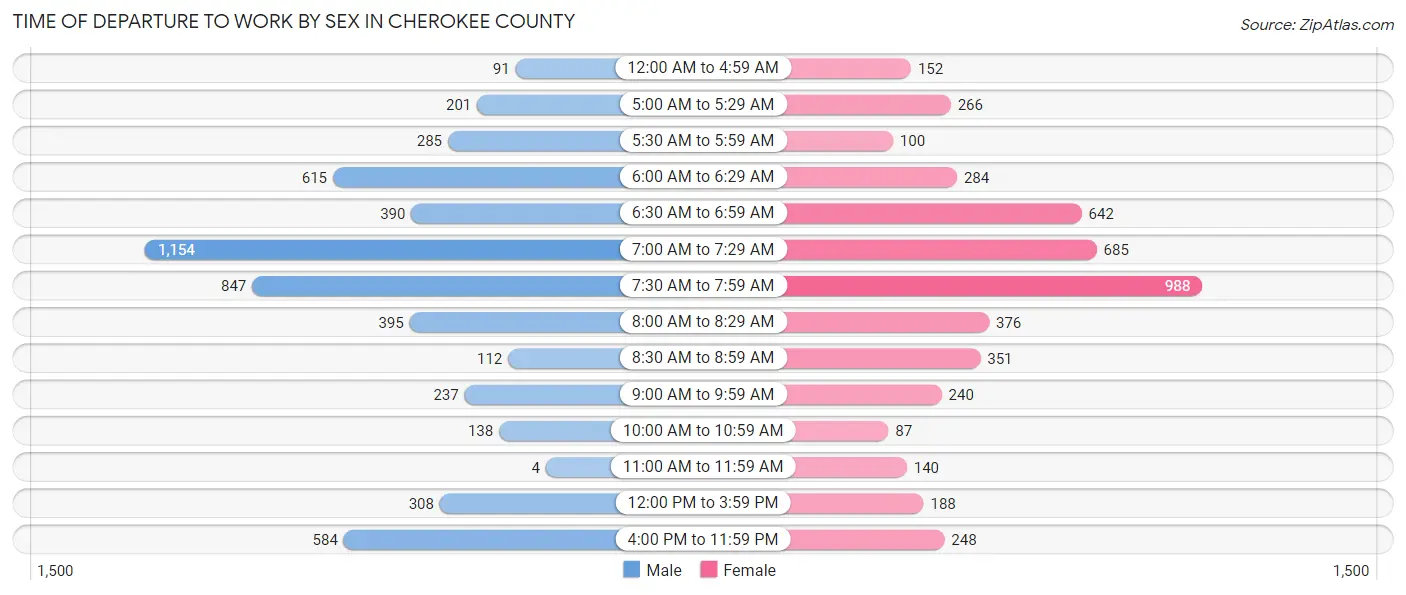
| Time of Departure | Male | Female |
| 12:00 AM to 4:59 AM | 91 (1.7%) | 152 (3.2%) |
| 5:00 AM to 5:29 AM | 201 (3.7%) | 266 (5.6%) |
| 5:30 AM to 5:59 AM | 285 (5.3%) | 100 (2.1%) |
| 6:00 AM to 6:29 AM | 615 (11.5%) | 284 (6.0%) |
| 6:30 AM to 6:59 AM | 390 (7.3%) | 642 (13.5%) |
| 7:00 AM to 7:29 AM | 1,154 (21.5%) | 685 (14.4%) |
| 7:30 AM to 7:59 AM | 847 (15.8%) | 988 (20.8%) |
| 8:00 AM to 8:29 AM | 395 (7.4%) | 376 (7.9%) |
| 8:30 AM to 8:59 AM | 112 (2.1%) | 351 (7.4%) |
| 9:00 AM to 9:59 AM | 237 (4.4%) | 240 (5.1%) |
| 10:00 AM to 10:59 AM | 138 (2.6%) | 87 (1.8%) |
| 11:00 AM to 11:59 AM | 4 (0.1%) | 140 (2.9%) |
| 12:00 PM to 3:59 PM | 308 (5.8%) | 188 (4.0%) |
| 4:00 PM to 11:59 PM | 584 (10.9%) | 248 (5.2%) |
| Total | 5,361 (100.0%) | 4,747 (100.0%) |
Housing Occupancy in Cherokee County
Occupancy by Ownership in Cherokee County
Of the total 12,758 dwellings in Cherokee County, owner-occupied units account for 10,369 (81.3%), while renter-occupied units make up 2,389 (18.7%).
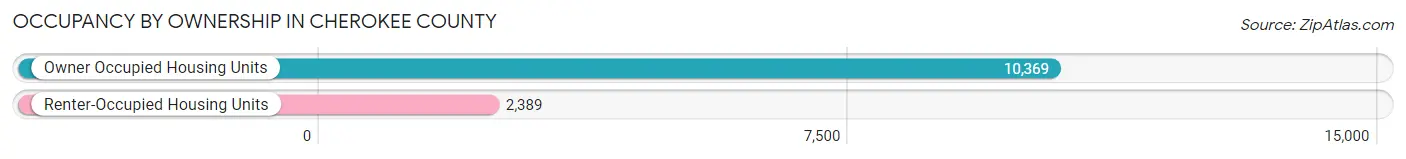
| Occupancy | # Housing Units | % Housing Units |
| Owner Occupied Housing Units | 10,369 | 81.3% |
| Renter-Occupied Housing Units | 2,389 | 18.7% |
| Total Occupied Housing Units | 12,758 | 100.0% |
Occupancy by Household Size in Cherokee County
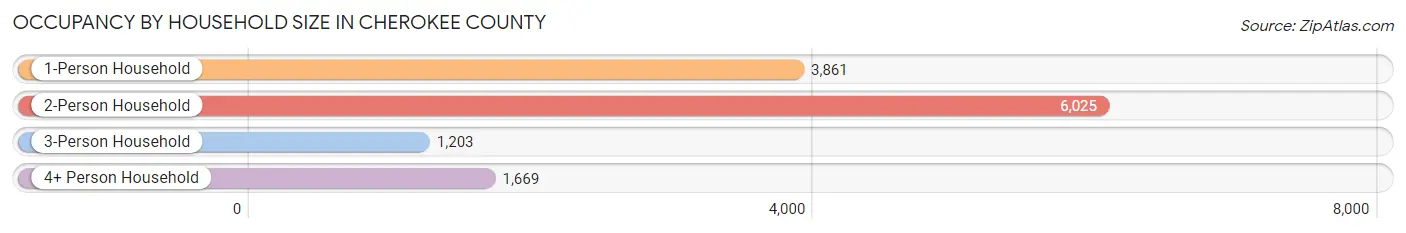
| Household Size | # Housing Units | % Housing Units |
| 1-Person Household | 3,861 | 30.3% |
| 2-Person Household | 6,025 | 47.2% |
| 3-Person Household | 1,203 | 9.4% |
| 4+ Person Household | 1,669 | 13.1% |
| Total Housing Units | 12,758 | 100.0% |
Occupancy by Ownership by Household Size in Cherokee County
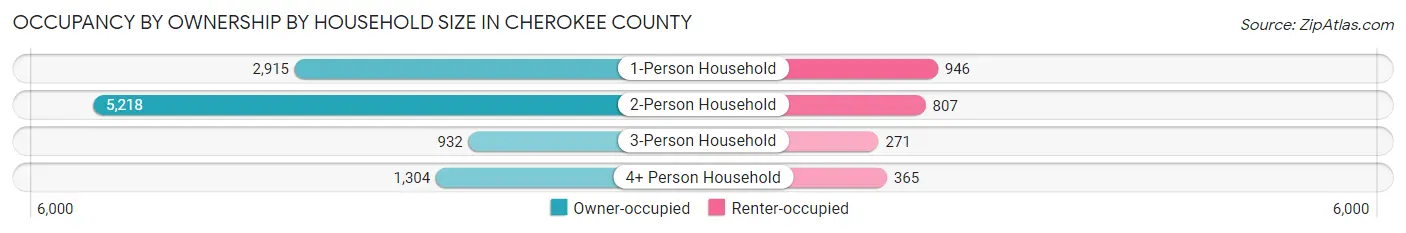
| Household Size | Owner-occupied | Renter-occupied |
| 1-Person Household | 2,915 (75.5%) | 946 (24.5%) |
| 2-Person Household | 5,218 (86.6%) | 807 (13.4%) |
| 3-Person Household | 932 (77.5%) | 271 (22.5%) |
| 4+ Person Household | 1,304 (78.1%) | 365 (21.9%) |
| Total Housing Units | 10,369 (81.3%) | 2,389 (18.7%) |
Occupancy by Educational Attainment in Cherokee County
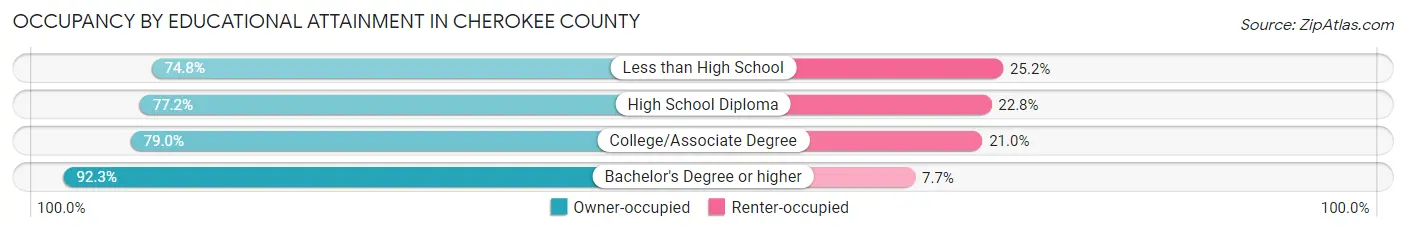
| Household Size | Owner-occupied | Renter-occupied |
| Less than High School | 633 (74.8%) | 213 (25.2%) |
| High School Diploma | 3,314 (77.2%) | 981 (22.8%) |
| College/Associate Degree | 3,601 (79.0%) | 959 (21.0%) |
| Bachelor's Degree or higher | 2,821 (92.3%) | 236 (7.7%) |
Occupancy by Age of Householder in Cherokee County
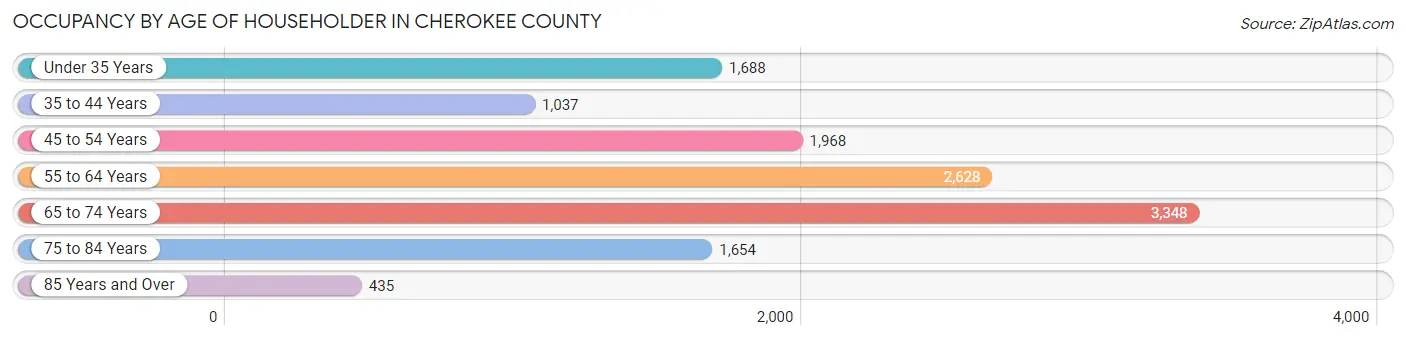
| Age Bracket | # Households | % Households |
| Under 35 Years | 1,688 | 13.2% |
| 35 to 44 Years | 1,037 | 8.1% |
| 45 to 54 Years | 1,968 | 15.4% |
| 55 to 64 Years | 2,628 | 20.6% |
| 65 to 74 Years | 3,348 | 26.2% |
| 75 to 84 Years | 1,654 | 13.0% |
| 85 Years and Over | 435 | 3.4% |
| Total | 12,758 | 100.0% |
Housing Finances in Cherokee County
Median Income by Occupancy in Cherokee County
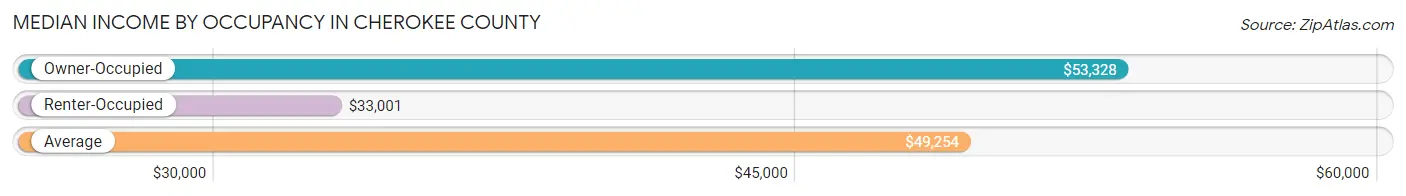
| Occupancy Type | # Households | Median Income |
| Owner-Occupied | 10,369 (81.3%) | $53,328 |
| Renter-Occupied | 2,389 (18.7%) | $33,001 |
| Average | 12,758 (100.0%) | $49,254 |
Occupancy by Householder Income Bracket in Cherokee County
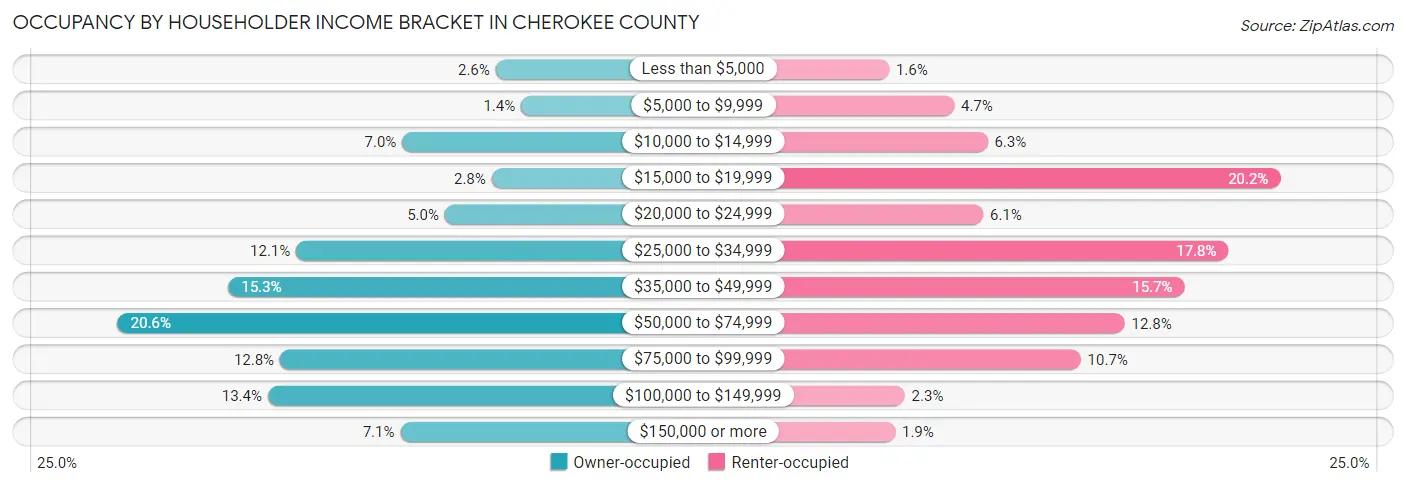
| Income Bracket | Owner-occupied | Renter-occupied |
| Less than $5,000 | 266 (2.6%) | 38 (1.6%) |
| $5,000 to $9,999 | 141 (1.4%) | 112 (4.7%) |
| $10,000 to $14,999 | 728 (7.0%) | 150 (6.3%) |
| $15,000 to $19,999 | 286 (2.8%) | 483 (20.2%) |
| $20,000 to $24,999 | 517 (5.0%) | 145 (6.1%) |
| $25,000 to $34,999 | 1,252 (12.1%) | 424 (17.7%) |
| $35,000 to $49,999 | 1,586 (15.3%) | 374 (15.7%) |
| $50,000 to $74,999 | 2,133 (20.6%) | 306 (12.8%) |
| $75,000 to $99,999 | 1,331 (12.8%) | 256 (10.7%) |
| $100,000 to $149,999 | 1,392 (13.4%) | 56 (2.3%) |
| $150,000 or more | 737 (7.1%) | 45 (1.9%) |
| Total | 10,369 (100.0%) | 2,389 (100.0%) |
Monthly Housing Cost Tiers in Cherokee County
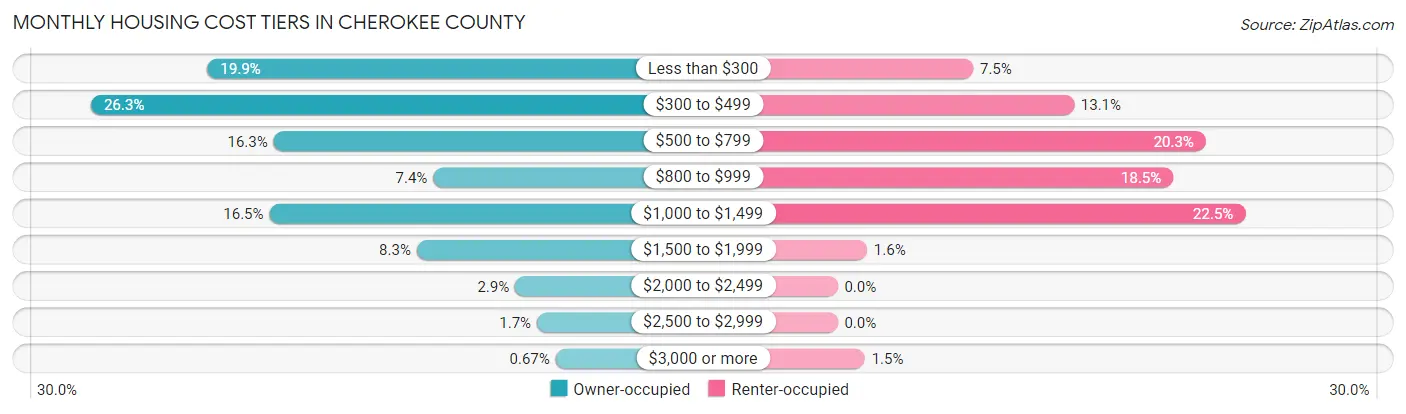
| Monthly Cost | Owner-occupied | Renter-occupied |
| Less than $300 | 2,063 (19.9%) | 179 (7.5%) |
| $300 to $499 | 2,730 (26.3%) | 312 (13.1%) |
| $500 to $799 | 1,685 (16.3%) | 486 (20.3%) |
| $800 to $999 | 770 (7.4%) | 443 (18.5%) |
| $1,000 to $1,499 | 1,709 (16.5%) | 538 (22.5%) |
| $1,500 to $1,999 | 865 (8.3%) | 39 (1.6%) |
| $2,000 to $2,499 | 302 (2.9%) | 0 (0.0%) |
| $2,500 to $2,999 | 176 (1.7%) | 0 (0.0%) |
| $3,000 or more | 69 (0.7%) | 36 (1.5%) |
| Total | 10,369 (100.0%) | 2,389 (100.0%) |
Physical Housing Characteristics in Cherokee County
Housing Structures in Cherokee County
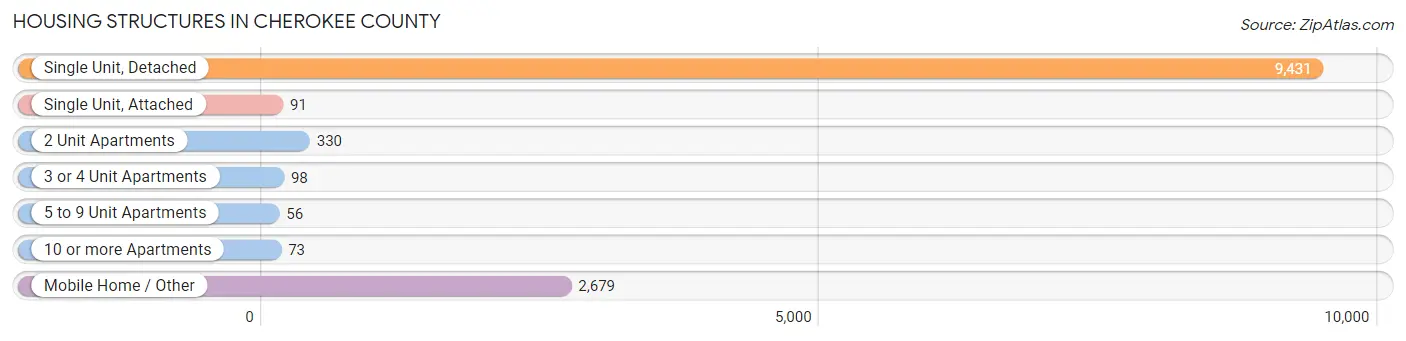
| Structure Type | # Housing Units | % Housing Units |
| Single Unit, Detached | 9,431 | 73.9% |
| Single Unit, Attached | 91 | 0.7% |
| 2 Unit Apartments | 330 | 2.6% |
| 3 or 4 Unit Apartments | 98 | 0.8% |
| 5 to 9 Unit Apartments | 56 | 0.4% |
| 10 or more Apartments | 73 | 0.6% |
| Mobile Home / Other | 2,679 | 21.0% |
| Total | 12,758 | 100.0% |
Housing Structures by Occupancy in Cherokee County
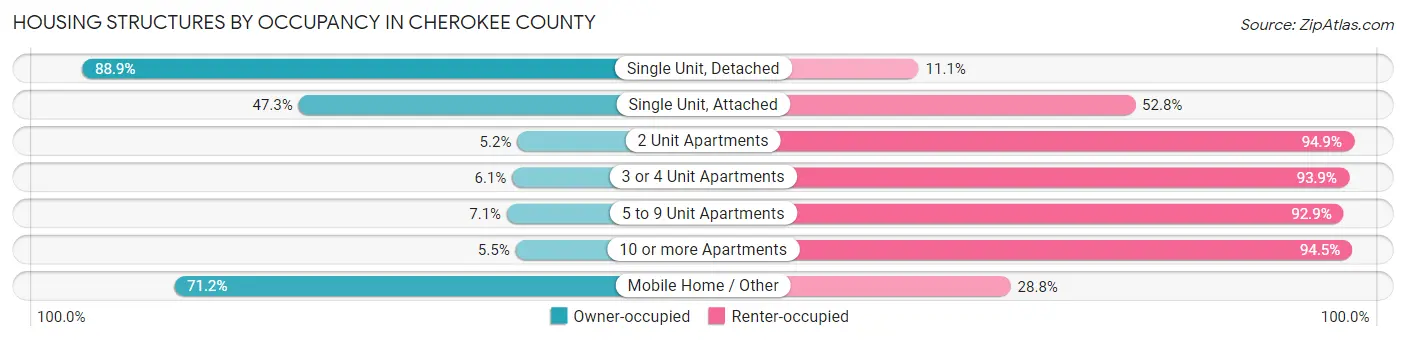
| Structure Type | Owner-occupied | Renter-occupied |
| Single Unit, Detached | 8,387 (88.9%) | 1,044 (11.1%) |
| Single Unit, Attached | 43 (47.2%) | 48 (52.7%) |
| 2 Unit Apartments | 17 (5.1%) | 313 (94.9%) |
| 3 or 4 Unit Apartments | 6 (6.1%) | 92 (93.9%) |
| 5 to 9 Unit Apartments | 4 (7.1%) | 52 (92.9%) |
| 10 or more Apartments | 4 (5.5%) | 69 (94.5%) |
| Mobile Home / Other | 1,908 (71.2%) | 771 (28.8%) |
| Total | 10,369 (81.3%) | 2,389 (18.7%) |
Housing Structures by Number of Rooms in Cherokee County
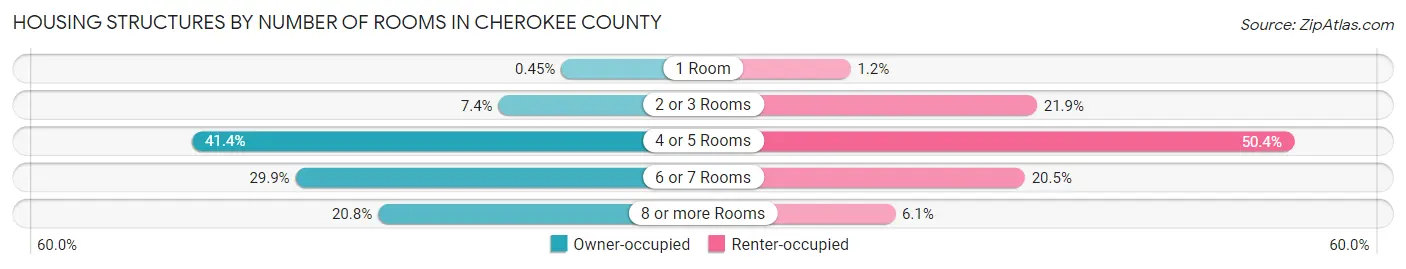
| Number of Rooms | Owner-occupied | Renter-occupied |
| 1 Room | 47 (0.4%) | 28 (1.2%) |
| 2 or 3 Rooms | 768 (7.4%) | 522 (21.8%) |
| 4 or 5 Rooms | 4,295 (41.4%) | 1,203 (50.4%) |
| 6 or 7 Rooms | 3,104 (29.9%) | 490 (20.5%) |
| 8 or more Rooms | 2,155 (20.8%) | 146 (6.1%) |
| Total | 10,369 (100.0%) | 2,389 (100.0%) |
Housing Structure by Heating Type in Cherokee County
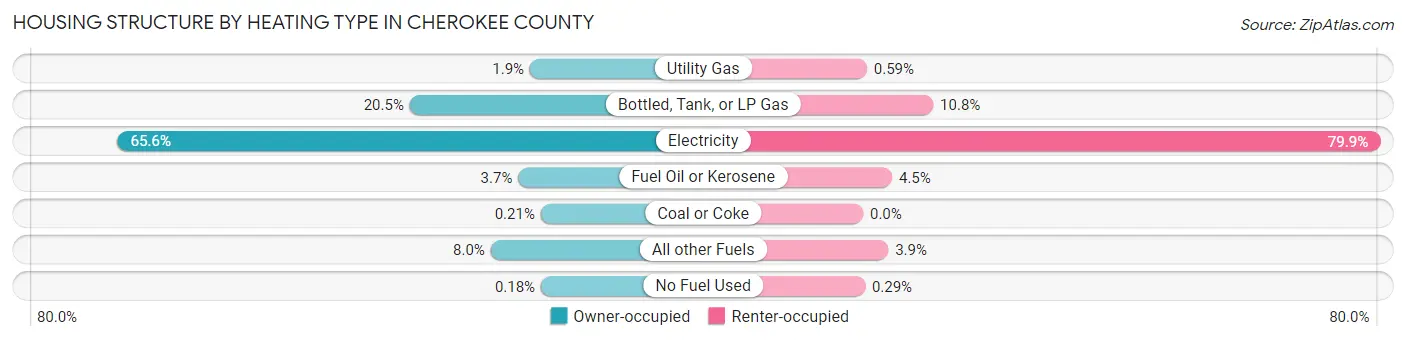
| Heating Type | Owner-occupied | Renter-occupied |
| Utility Gas | 195 (1.9%) | 14 (0.6%) |
| Bottled, Tank, or LP Gas | 2,121 (20.5%) | 259 (10.8%) |
| Electricity | 6,805 (65.6%) | 1,909 (79.9%) |
| Fuel Oil or Kerosene | 383 (3.7%) | 107 (4.5%) |
| Coal or Coke | 22 (0.2%) | 0 (0.0%) |
| All other Fuels | 824 (8.0%) | 93 (3.9%) |
| No Fuel Used | 19 (0.2%) | 7 (0.3%) |
| Total | 10,369 (100.0%) | 2,389 (100.0%) |
Household Vehicle Usage in Cherokee County
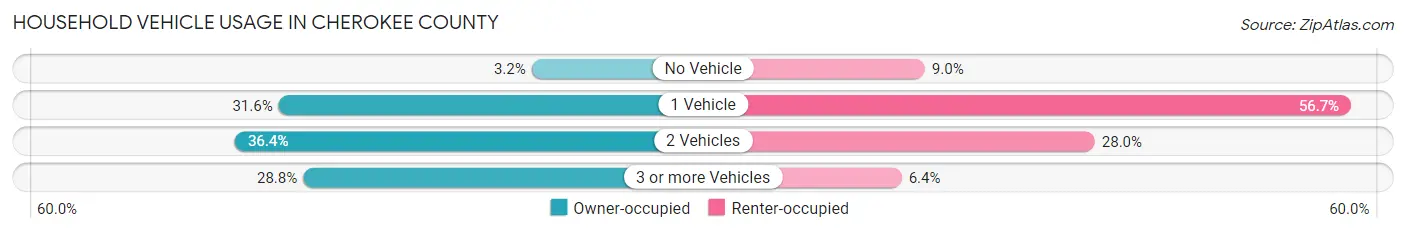
| Vehicles per Household | Owner-occupied | Renter-occupied |
| No Vehicle | 333 (3.2%) | 214 (9.0%) |
| 1 Vehicle | 3,272 (31.6%) | 1,354 (56.7%) |
| 2 Vehicles | 3,777 (36.4%) | 669 (28.0%) |
| 3 or more Vehicles | 2,987 (28.8%) | 152 (6.4%) |
| Total | 10,369 (100.0%) | 2,389 (100.0%) |
Real Estate & Mortgages in Cherokee County
Real Estate and Mortgage Overview in Cherokee County
| Characteristic | Without Mortgage | With Mortgage |
| Housing Units | 5,767 | 4,602 |
| Median Property Value | $173,300 | $211,300 |
| Median Household Income | $43,965 | $454 |
| Monthly Housing Costs | $357 | $65 |
| Real Estate Taxes | $950 | $42 |
Property Value by Mortgage Status in Cherokee County
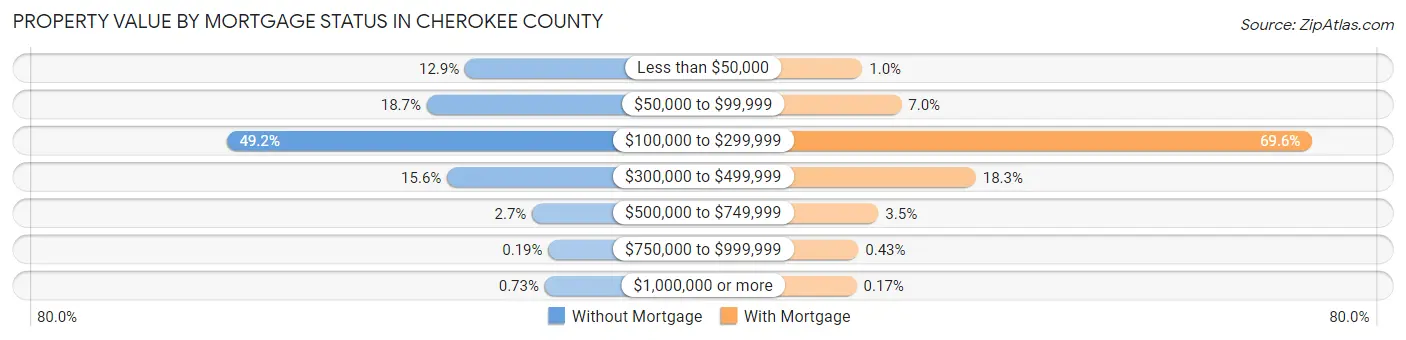
| Property Value | Without Mortgage | With Mortgage |
| Less than $50,000 | 743 (12.9%) | 48 (1.0%) |
| $50,000 to $99,999 | 1,079 (18.7%) | 321 (7.0%) |
| $100,000 to $299,999 | 2,839 (49.2%) | 3,202 (69.6%) |
| $300,000 to $499,999 | 900 (15.6%) | 843 (18.3%) |
| $500,000 to $749,999 | 153 (2.6%) | 160 (3.5%) |
| $750,000 to $999,999 | 11 (0.2%) | 20 (0.4%) |
| $1,000,000 or more | 42 (0.7%) | 8 (0.2%) |
| Total | 5,767 (100.0%) | 4,602 (100.0%) |
Household Income by Mortgage Status in Cherokee County
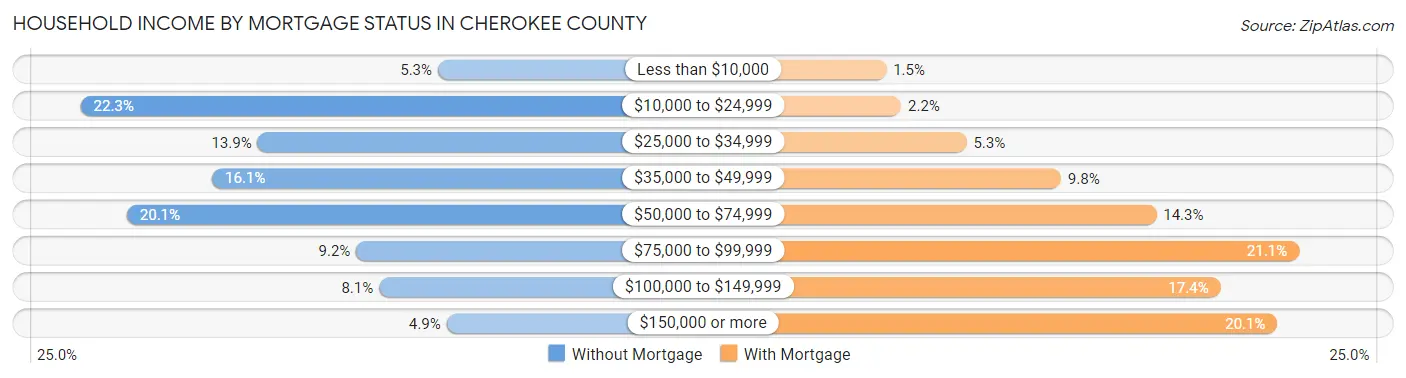
| Household Income | Without Mortgage | With Mortgage |
| Less than $10,000 | 307 (5.3%) | 67 (1.5%) |
| $10,000 to $24,999 | 1,288 (22.3%) | 100 (2.2%) |
| $25,000 to $34,999 | 802 (13.9%) | 243 (5.3%) |
| $35,000 to $49,999 | 927 (16.1%) | 450 (9.8%) |
| $50,000 to $74,999 | 1,161 (20.1%) | 659 (14.3%) |
| $75,000 to $99,999 | 531 (9.2%) | 972 (21.1%) |
| $100,000 to $149,999 | 468 (8.1%) | 800 (17.4%) |
| $150,000 or more | 283 (4.9%) | 924 (20.1%) |
| Total | 5,767 (100.0%) | 4,602 (100.0%) |
Property Value to Household Income Ratio in Cherokee County
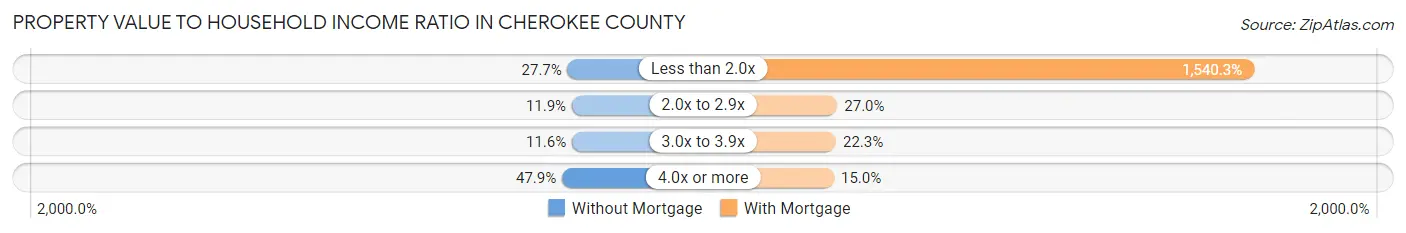
| Value-to-Income Ratio | Without Mortgage | With Mortgage |
| Less than 2.0x | 1,599 (27.7%) | 70,884 (1,540.3%) |
| 2.0x to 2.9x | 684 (11.9%) | 1,241 (27.0%) |
| 3.0x to 3.9x | 670 (11.6%) | 1,024 (22.3%) |
| 4.0x or more | 2,764 (47.9%) | 688 (14.9%) |
| Total | 5,767 (100.0%) | 4,602 (100.0%) |
Real Estate Taxes by Mortgage Status in Cherokee County
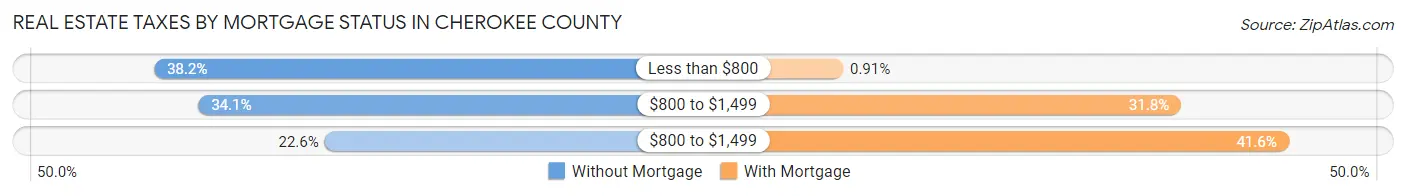
| Property Taxes | Without Mortgage | With Mortgage |
| Less than $800 | 2,202 (38.2%) | 42 (0.9%) |
| $800 to $1,499 | 1,969 (34.1%) | 1,463 (31.8%) |
| $800 to $1,499 | 1,304 (22.6%) | 1,915 (41.6%) |
| Total | 5,767 (100.0%) | 4,602 (100.0%) |
Health & Disability in Cherokee County
Health Insurance Coverage by Age in Cherokee County
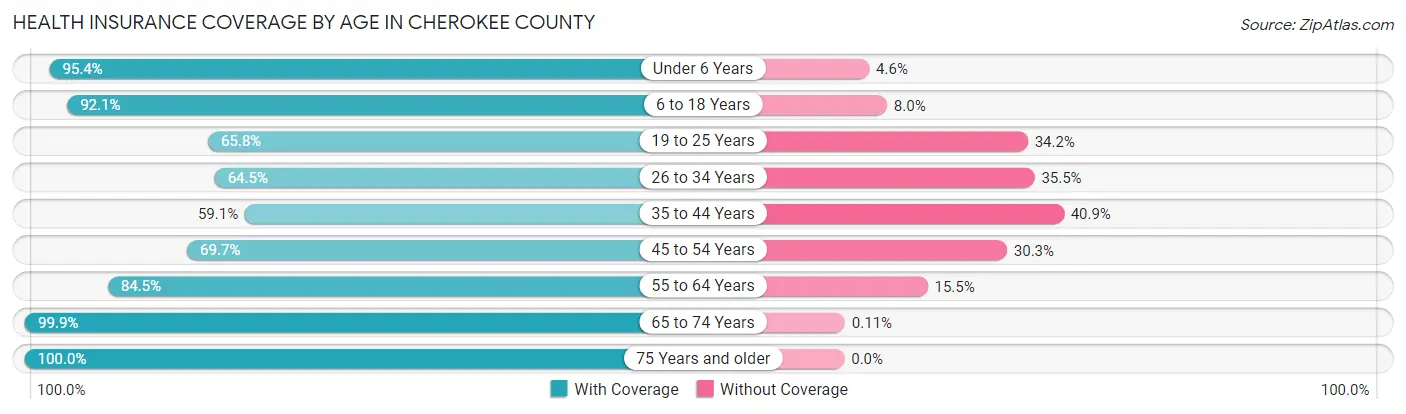
| Age Bracket | With Coverage | Without Coverage |
| Under 6 Years | 1,191 (95.4%) | 58 (4.6%) |
| 6 to 18 Years | 3,403 (92.0%) | 294 (8.0%) |
| 19 to 25 Years | 1,114 (65.8%) | 579 (34.2%) |
| 26 to 34 Years | 1,438 (64.5%) | 790 (35.5%) |
| 35 to 44 Years | 1,576 (59.1%) | 1,091 (40.9%) |
| 45 to 54 Years | 2,494 (69.7%) | 1,085 (30.3%) |
| 55 to 64 Years | 3,980 (84.5%) | 731 (15.5%) |
| 65 to 74 Years | 5,378 (99.9%) | 6 (0.1%) |
| 75 Years and older | 3,320 (100.0%) | 0 (0.0%) |
| Total | 23,894 (83.8%) | 4,634 (16.2%) |
Health Insurance Coverage by Citizenship Status in Cherokee County
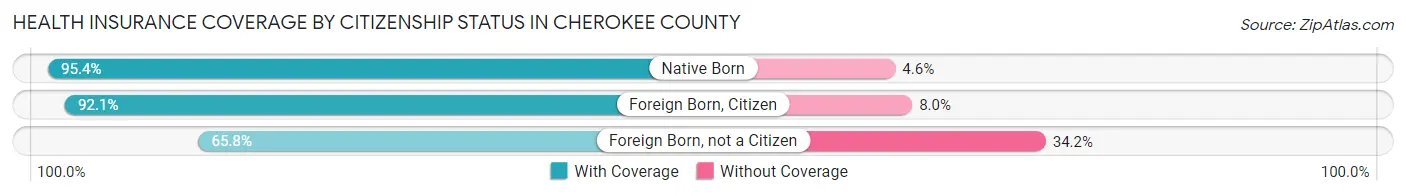
| Citizenship Status | With Coverage | Without Coverage |
| Native Born | 1,191 (95.4%) | 58 (4.6%) |
| Foreign Born, Citizen | 3,403 (92.0%) | 294 (8.0%) |
| Foreign Born, not a Citizen | 1,114 (65.8%) | 579 (34.2%) |
Health Insurance Coverage by Household Income in Cherokee County
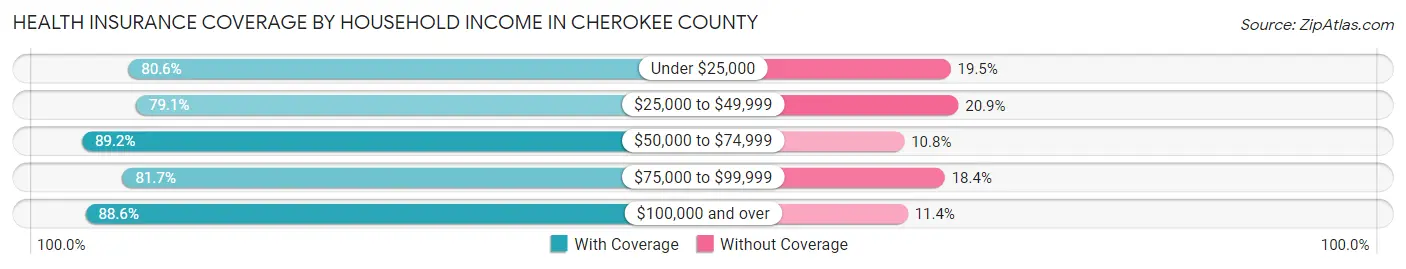
| Household Income | With Coverage | Without Coverage |
| Under $25,000 | 3,662 (80.5%) | 884 (19.5%) |
| $25,000 to $49,999 | 5,964 (79.1%) | 1,575 (20.9%) |
| $50,000 to $74,999 | 4,983 (89.2%) | 601 (10.8%) |
| $75,000 to $99,999 | 3,694 (81.7%) | 830 (18.3%) |
| $100,000 and over | 5,488 (88.6%) | 707 (11.4%) |
Public vs Private Health Insurance Coverage by Age in Cherokee County
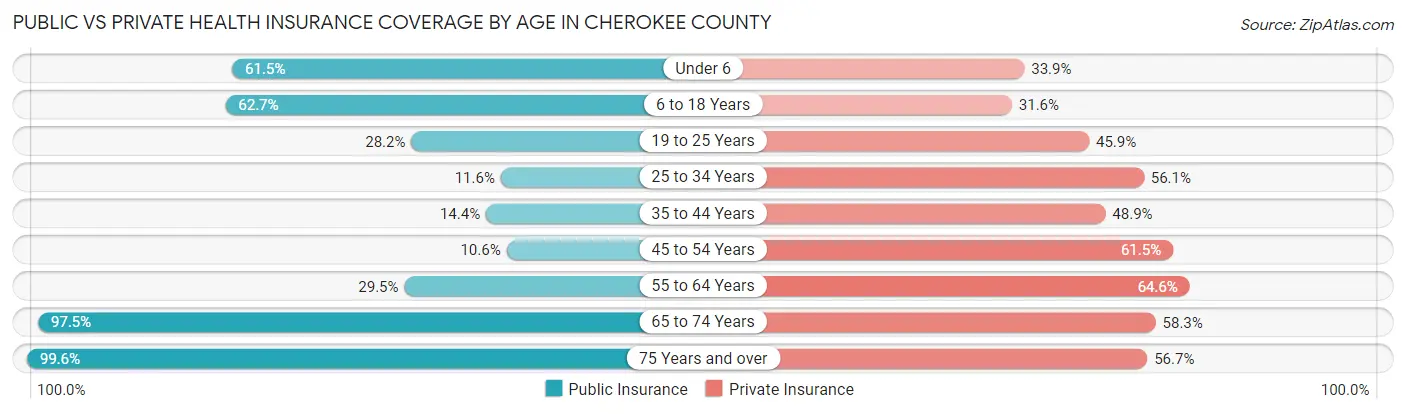
| Age Bracket | Public Insurance | Private Insurance |
| Under 6 | 768 (61.5%) | 423 (33.9%) |
| 6 to 18 Years | 2,319 (62.7%) | 1,167 (31.6%) |
| 19 to 25 Years | 478 (28.2%) | 777 (45.9%) |
| 25 to 34 Years | 259 (11.6%) | 1,249 (56.1%) |
| 35 to 44 Years | 383 (14.4%) | 1,305 (48.9%) |
| 45 to 54 Years | 378 (10.6%) | 2,200 (61.5%) |
| 55 to 64 Years | 1,390 (29.5%) | 3,042 (64.6%) |
| 65 to 74 Years | 5,251 (97.5%) | 3,136 (58.3%) |
| 75 Years and over | 3,306 (99.6%) | 1,882 (56.7%) |
| Total | 14,532 (50.9%) | 15,181 (53.2%) |
Disability Status by Sex by Age in Cherokee County
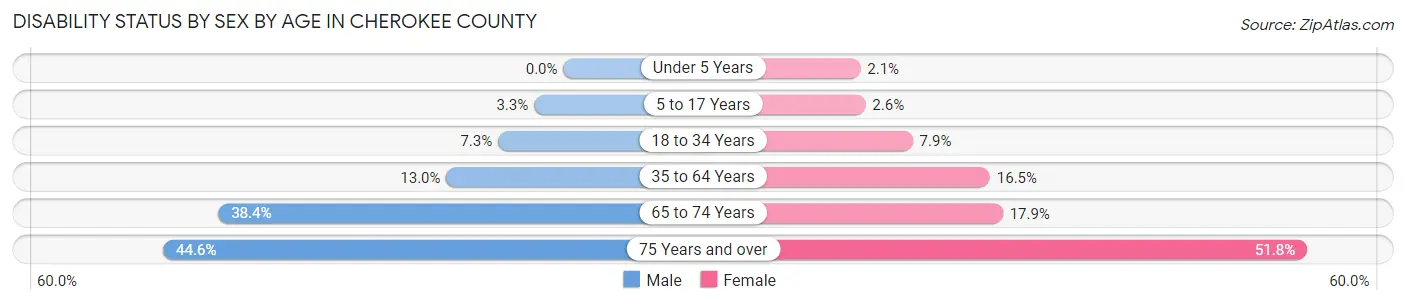
| Age Bracket | Male | Female |
| Under 5 Years | 0 (0.0%) | 11 (2.1%) |
| 5 to 17 Years | 61 (3.3%) | 45 (2.6%) |
| 18 to 34 Years | 157 (7.3%) | 163 (7.9%) |
| 35 to 64 Years | 703 (13.0%) | 917 (16.5%) |
| 65 to 74 Years | 1,001 (38.4%) | 498 (17.9%) |
| 75 Years and over | 690 (44.6%) | 918 (51.8%) |
Disability Class by Sex by Age in Cherokee County
Disability Class: Hearing Difficulty
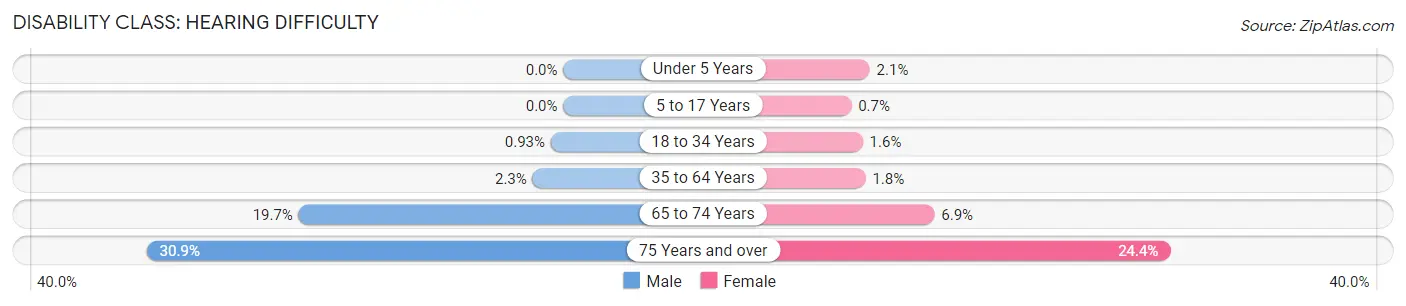
| Age Bracket | Male | Female |
| Under 5 Years | 0 (0.0%) | 11 (2.1%) |
| 5 to 17 Years | 0 (0.0%) | 12 (0.7%) |
| 18 to 34 Years | 20 (0.9%) | 32 (1.5%) |
| 35 to 64 Years | 123 (2.3%) | 98 (1.8%) |
| 65 to 74 Years | 512 (19.7%) | 191 (6.9%) |
| 75 Years and over | 479 (30.9%) | 432 (24.4%) |
Disability Class: Vision Difficulty
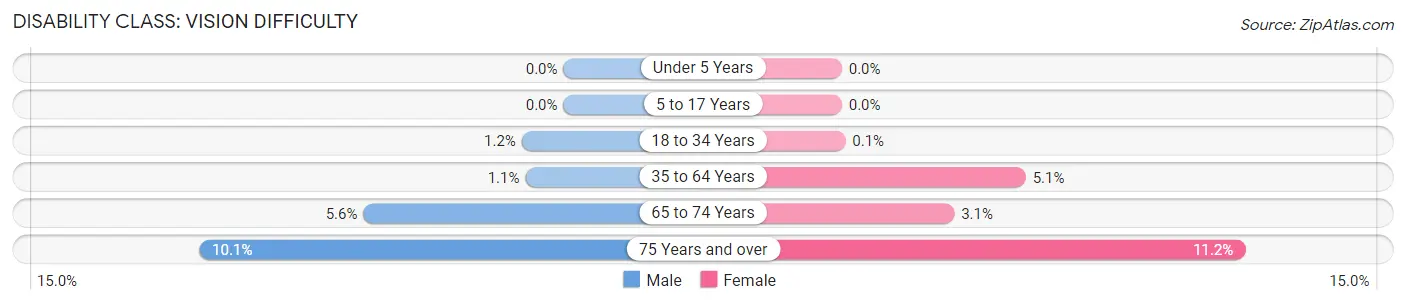
| Age Bracket | Male | Female |
| Under 5 Years | 0 (0.0%) | 0 (0.0%) |
| 5 to 17 Years | 0 (0.0%) | 0 (0.0%) |
| 18 to 34 Years | 25 (1.2%) | 2 (0.1%) |
| 35 to 64 Years | 57 (1.1%) | 285 (5.1%) |
| 65 to 74 Years | 145 (5.6%) | 87 (3.1%) |
| 75 Years and over | 157 (10.1%) | 199 (11.2%) |
Disability Class: Cognitive Difficulty
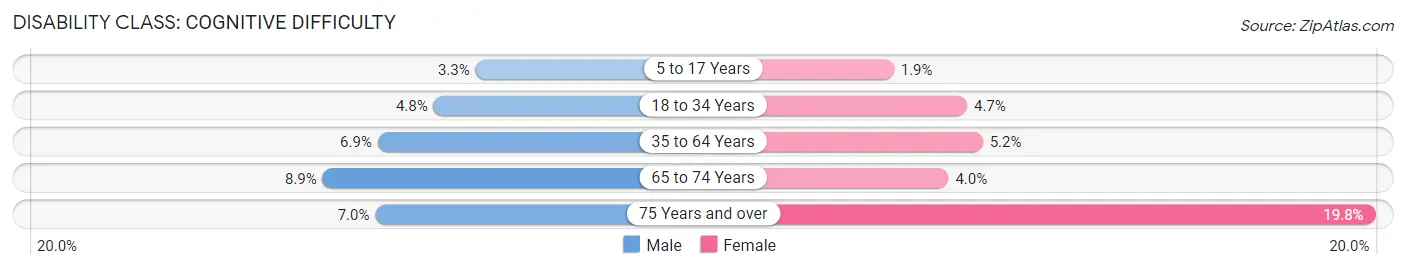
| Age Bracket | Male | Female |
| 5 to 17 Years | 61 (3.3%) | 33 (1.9%) |
| 18 to 34 Years | 104 (4.8%) | 96 (4.6%) |
| 35 to 64 Years | 372 (6.9%) | 291 (5.2%) |
| 65 to 74 Years | 233 (8.9%) | 110 (4.0%) |
| 75 Years and over | 108 (7.0%) | 351 (19.8%) |
Disability Class: Ambulatory Difficulty
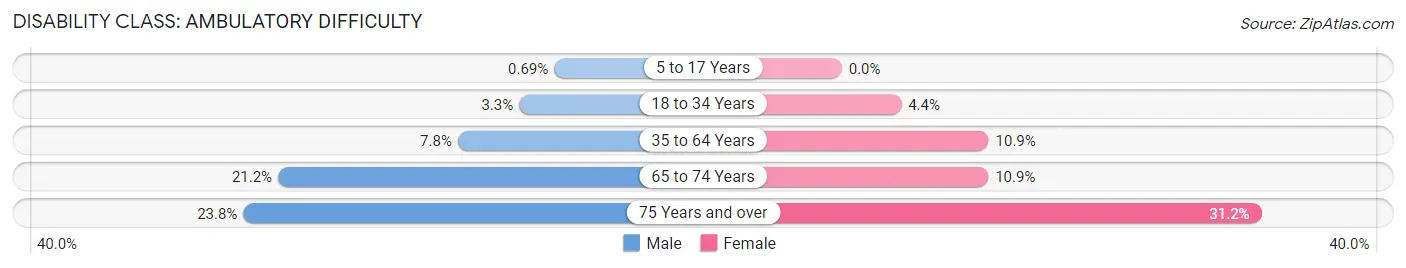
| Age Bracket | Male | Female |
| 5 to 17 Years | 13 (0.7%) | 0 (0.0%) |
| 18 to 34 Years | 71 (3.3%) | 91 (4.4%) |
| 35 to 64 Years | 423 (7.8%) | 606 (10.9%) |
| 65 to 74 Years | 552 (21.2%) | 302 (10.9%) |
| 75 Years and over | 368 (23.8%) | 552 (31.1%) |
Disability Class: Self-Care Difficulty
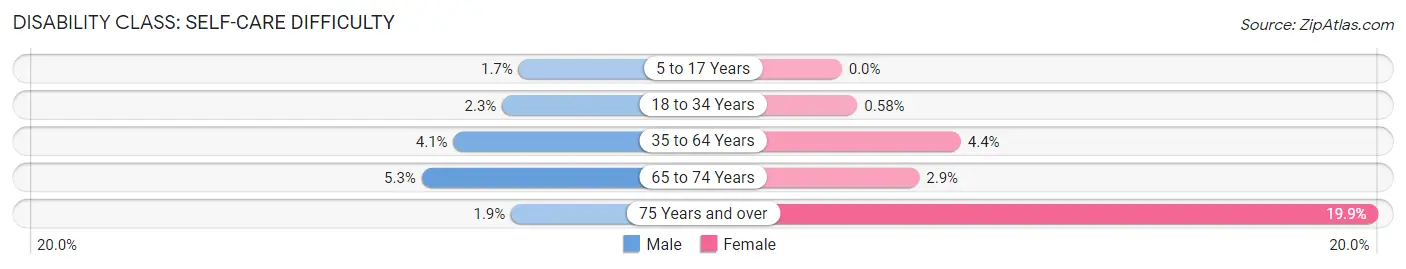
| Age Bracket | Male | Female |
| 5 to 17 Years | 31 (1.7%) | 0 (0.0%) |
| 18 to 34 Years | 49 (2.3%) | 12 (0.6%) |
| 35 to 64 Years | 220 (4.1%) | 246 (4.4%) |
| 65 to 74 Years | 137 (5.3%) | 80 (2.9%) |
| 75 Years and over | 30 (1.9%) | 353 (19.9%) |
Technology Access in Cherokee County
Computing Device Access in Cherokee County
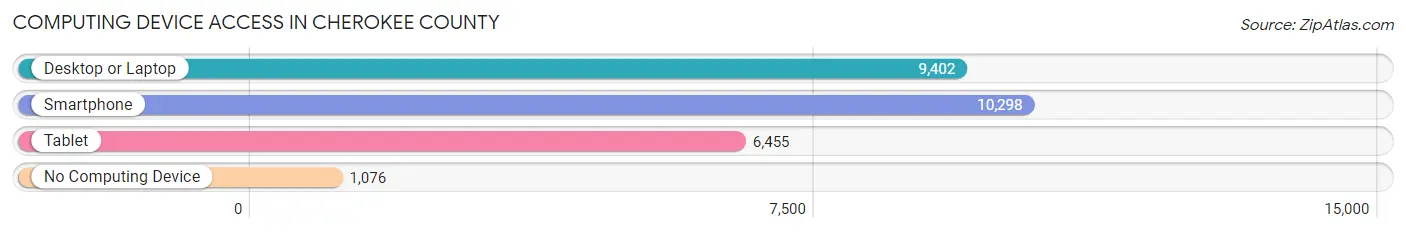
| Device Type | # Households | % Households |
| Desktop or Laptop | 9,402 | 73.7% |
| Smartphone | 10,298 | 80.7% |
| Tablet | 6,455 | 50.6% |
| No Computing Device | 1,076 | 8.4% |
| Total | 12,758 | 100.0% |
Internet Access in Cherokee County
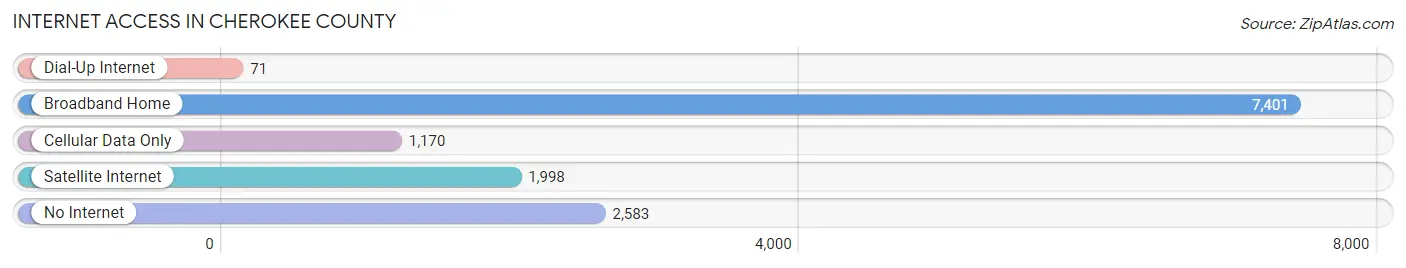
| Internet Type | # Households | % Households |
| Dial-Up Internet | 71 | 0.6% |
| Broadband Home | 7,401 | 58.0% |
| Cellular Data Only | 1,170 | 9.2% |
| Satellite Internet | 1,998 | 15.7% |
| No Internet | 2,583 | 20.3% |
| Total | 12,758 | 100.0% |
Cherokee County Summary
Cherokee County is located in the western part of North Carolina, and is part of the Appalachian Mountains region. It is bordered by Clay County to the north, Graham County to the east, Macon County to the south, and Swain County to the west. The county seat is Murphy, and the largest city is Andrews. The county was formed in 1839 from parts of Macon and Haywood counties, and was named for the Cherokee Indians who once lived in the area.
Geography
Cherokee County covers an area of 437 square miles, and is located in the Appalachian Mountains region of North Carolina. The terrain is mostly mountainous, with elevations ranging from 1,000 to 5,000 feet. The highest point in the county is Mount Guyot, which has an elevation of 5,827 feet. The county is drained by the Hiwassee River, which flows through the center of the county. The county is also home to several lakes, including Hiwassee Lake, Nottely Lake, and Chatuge Lake.
Climate
Cherokee County has a humid subtropical climate, with hot, humid summers and mild winters. The average annual temperature is 57°F, and the average annual precipitation is 51 inches.
Demographics
As of the 2010 census, there were 27,444 people, 11,072 households, and 7,845 families living in the county. The population density was 62 people per square mile. The racial makeup of the county was 92.3% White, 4.2% Black or African American, 0.5% Native American, 0.3% Asian, 0.1% Pacific Islander, 1.3% from other races, and 1.3% from two or more races. Hispanic or Latino of any race were 2.7% of the population.
The median income for a household in the county was $30,945, and the median income for a family was $37,945. The per capita income for the county was $17,845. About 17.3% of families and 21.2% of the population were below the poverty line, including 28.2% of those under age 18 and 16.2% of those age 65 or over.
Economy
The economy of Cherokee County is largely based on agriculture and tourism. The county is home to several farms, which produce a variety of crops, including corn, soybeans, hay, and tobacco. The county is also home to several wineries, which produce a variety of wines. Tourism is also an important part of the economy, with visitors coming to the county to enjoy the scenic beauty of the Appalachian Mountains.
The county is also home to several manufacturing companies, including a furniture factory, a textile mill, and a paper mill. The county is also home to several retail stores, restaurants, and other businesses.
Conclusion
Cherokee County is a rural county located in the western part of North Carolina. The county is home to a variety of industries, including agriculture, manufacturing, and tourism. The county is also home to several wineries, retail stores, restaurants, and other businesses. The county has a humid subtropical climate, with hot, humid summers and mild winters. The population of the county is 27,444, and the median income for a household is $30,945.
Common Questions
What is Per Capita Income in Cherokee County?
Per Capita income in Cherokee County is $28,752.
What is the Median Family Income in Cherokee County?
Median Family Income in Cherokee County is $60,917.
What is the Median Household income in Cherokee County?
Median Household Income in Cherokee County is $49,254.
What is Income or Wage Gap in Cherokee County?
Income or Wage Gap in Cherokee County is 14.7%.
Women in Cherokee County earn 85.3 cents for every dollar earned by a man.
What is Family Income Deficit in Cherokee County?
Family Income Deficit in Cherokee County is $8,653.
Families that are below poverty line in Cherokee County earn $8,653 less on average than the poverty threshold level.
What is Inequality or Gini Index in Cherokee County?
Inequality or Gini Index in Cherokee County is 0.42.
What is the Total Population of Cherokee County?
Total Population of Cherokee County is 28,868.
What is the Total Male Population of Cherokee County?
Total Male Population of Cherokee County is 14,246.
What is the Total Female Population of Cherokee County?
Total Female Population of Cherokee County is 14,622.
What is the Ratio of Males per 100 Females in Cherokee County?
There are 97.43 Males per 100 Females in Cherokee County.
What is the Ratio of Females per 100 Males in Cherokee County?
There are 102.64 Females per 100 Males in Cherokee County.
What is the Median Population Age in Cherokee County?
Median Population Age in Cherokee County is 52.9 Years.
What is the Average Family Size in Cherokee County
Average Family Size in Cherokee County is 2.7 People.
What is the Average Household Size in Cherokee County
Average Household Size in Cherokee County is 2.2 People.
How Large is the Labor Force in Cherokee County?
There are 12,011 People in the Labor Forcein in Cherokee County.
What is the Percentage of People in the Labor Force in Cherokee County?
48.4% of People are in the Labor Force in Cherokee County.
What is the Unemployment Rate in Cherokee County?
Unemployment Rate in Cherokee County is 4.9%.