Caswell County, NC Map & Demographics
Caswell County Map
Caswell County Overview
$27,503
PER CAPITA INCOME
$66,451
AVG FAMILY INCOME
$56,999
AVG HOUSEHOLD INCOME
35.0%
WAGE / INCOME GAP [ % ]
65.0¢/ $1
WAGE / INCOME GAP [ $ ]
$10,016
FAMILY INCOME DEFICIT
0.42
INEQUALITY / GINI INDEX
22,747
TOTAL POPULATION
11,831
MALE POPULATION
10,916
FEMALE POPULATION
108.38
MALES / 100 FEMALES
92.27
FEMALES / 100 MALES
46.4
MEDIAN AGE
3.0
AVG FAMILY SIZE
2.5
AVG HOUSEHOLD SIZE
10,193
LABOR FORCE [ PEOPLE ]
53.1%
PERCENT IN LABOR FORCE
6.0%
UNEMPLOYMENT RATE
Caswell County Area Codes
Income in Caswell County
Income Overview in Caswell County
Per Capita Income in Caswell County is $27,503, while median incomes of families and households are $66,451 and $56,999 respectively.
| Characteristic | Number | Measure |
| Per Capita Income | 22,747 | $27,503 |
| Median Family Income | 5,916 | $66,451 |
| Mean Family Income | 5,916 | $81,599 |
| Median Household Income | 8,507 | $56,999 |
| Mean Household Income | 8,507 | $69,538 |
| Income Deficit | 5,916 | $10,016 |
| Wage / Income Gap (%) | 22,747 | 34.98% |
| Wage / Income Gap ($) | 22,747 | 65.02¢ per $1 |
| Gini / Inequality Index | 22,747 | 0.42 |
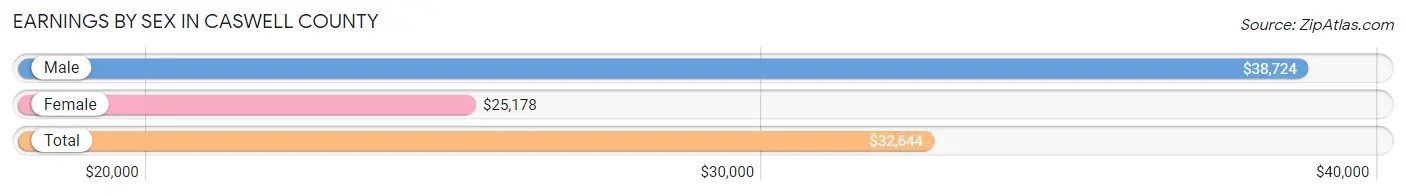
Earnings by Sex in Caswell County
Average Earnings in Caswell County are $32,644, $38,724 for men and $25,178 for women, a difference of 35.0%.
| Sex | Number | Average Earnings |
| Male | 5,921 (54.6%) | $38,724 |
| Female | 4,929 (45.4%) | $25,178 |
| Total | 10,850 (100.0%) | $32,644 |
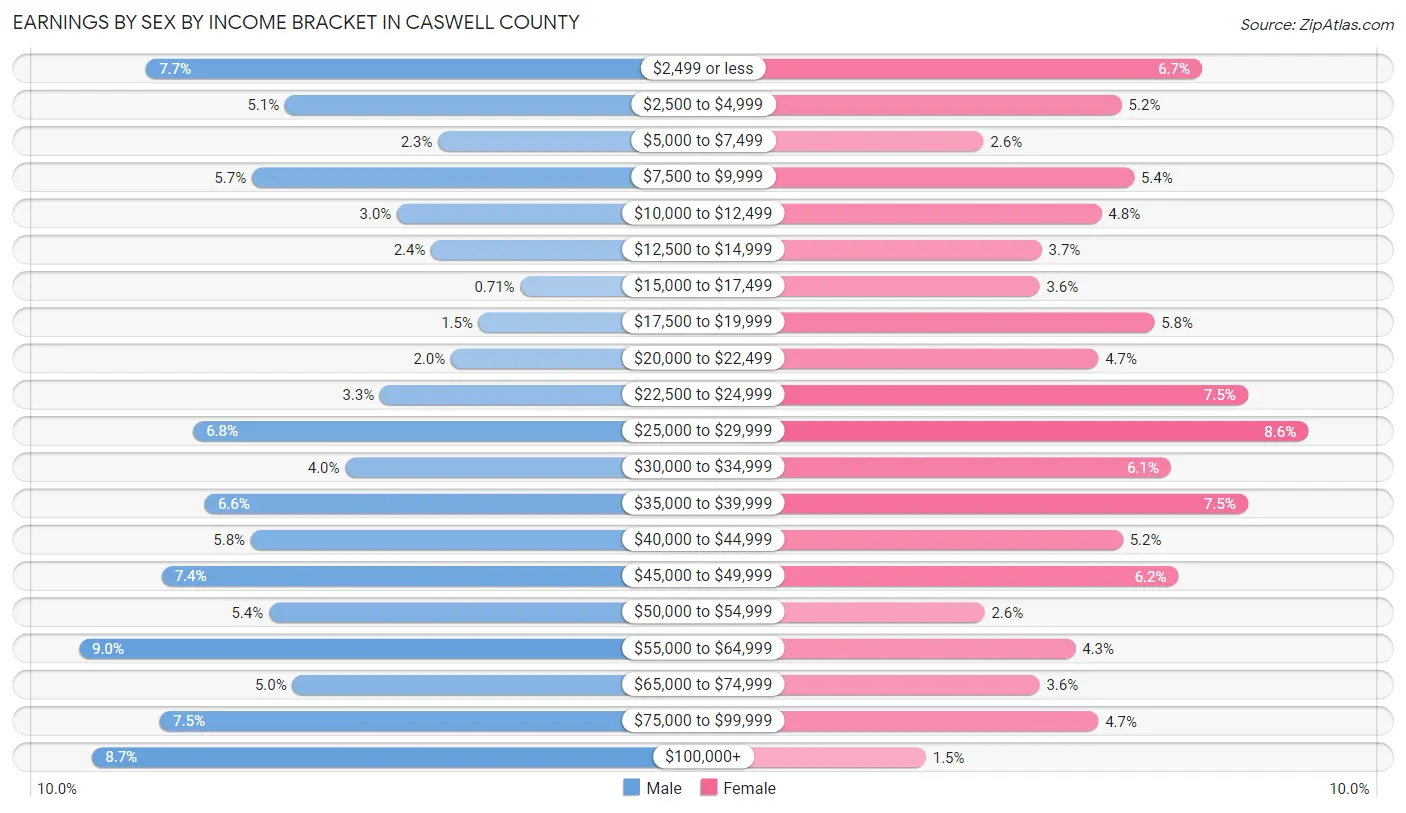
Earnings by Sex by Income Bracket in Caswell County
The most common earnings brackets in Caswell County are $55,000 to $64,999 for men (532 | 9.0%) and $25,000 to $29,999 for women (426 | 8.6%).
| Income | Male | Female |
| $2,499 or less | 457 (7.7%) | 328 (6.7%) |
| $2,500 to $4,999 | 303 (5.1%) | 254 (5.1%) |
| $5,000 to $7,499 | 133 (2.2%) | 126 (2.6%) |
| $7,500 to $9,999 | 340 (5.7%) | 265 (5.4%) |
| $10,000 to $12,499 | 179 (3.0%) | 235 (4.8%) |
| $12,500 to $14,999 | 141 (2.4%) | 180 (3.6%) |
| $15,000 to $17,499 | 42 (0.7%) | 178 (3.6%) |
| $17,500 to $19,999 | 88 (1.5%) | 284 (5.8%) |
| $20,000 to $22,499 | 119 (2.0%) | 232 (4.7%) |
| $22,500 to $24,999 | 198 (3.3%) | 370 (7.5%) |
| $25,000 to $29,999 | 405 (6.8%) | 426 (8.6%) |
| $30,000 to $34,999 | 236 (4.0%) | 299 (6.1%) |
| $35,000 to $39,999 | 392 (6.6%) | 370 (7.5%) |
| $40,000 to $44,999 | 341 (5.8%) | 255 (5.2%) |
| $45,000 to $49,999 | 440 (7.4%) | 306 (6.2%) |
| $50,000 to $54,999 | 321 (5.4%) | 127 (2.6%) |
| $55,000 to $64,999 | 532 (9.0%) | 211 (4.3%) |
| $65,000 to $74,999 | 295 (5.0%) | 178 (3.6%) |
| $75,000 to $99,999 | 442 (7.5%) | 232 (4.7%) |
| $100,000+ | 517 (8.7%) | 73 (1.5%) |
| Total | 5,921 (100.0%) | 4,929 (100.0%) |
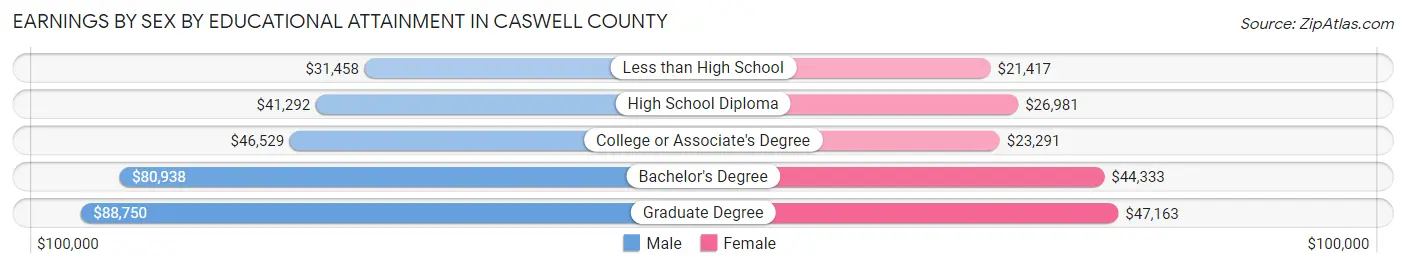
Earnings by Sex by Educational Attainment in Caswell County
Average earnings in Caswell County are $45,298 for men and $27,991 for women, a difference of 38.2%. Men with an educational attainment of graduate degree enjoy the highest average annual earnings of $88,750, while those with less than high school education earn the least with $31,458. Women with an educational attainment of graduate degree earn the most with the average annual earnings of $47,163, while those with less than high school education have the smallest earnings of $21,417.
| Educational Attainment | Male Income | Female Income |
| Less than High School | $31,458 | $21,417 |
| High School Diploma | $41,292 | $26,981 |
| College or Associate's Degree | $46,529 | $23,291 |
| Bachelor's Degree | $80,938 | $44,333 |
| Graduate Degree | $88,750 | $47,163 |
| Total | $45,298 | $27,991 |
Family Income in Caswell County
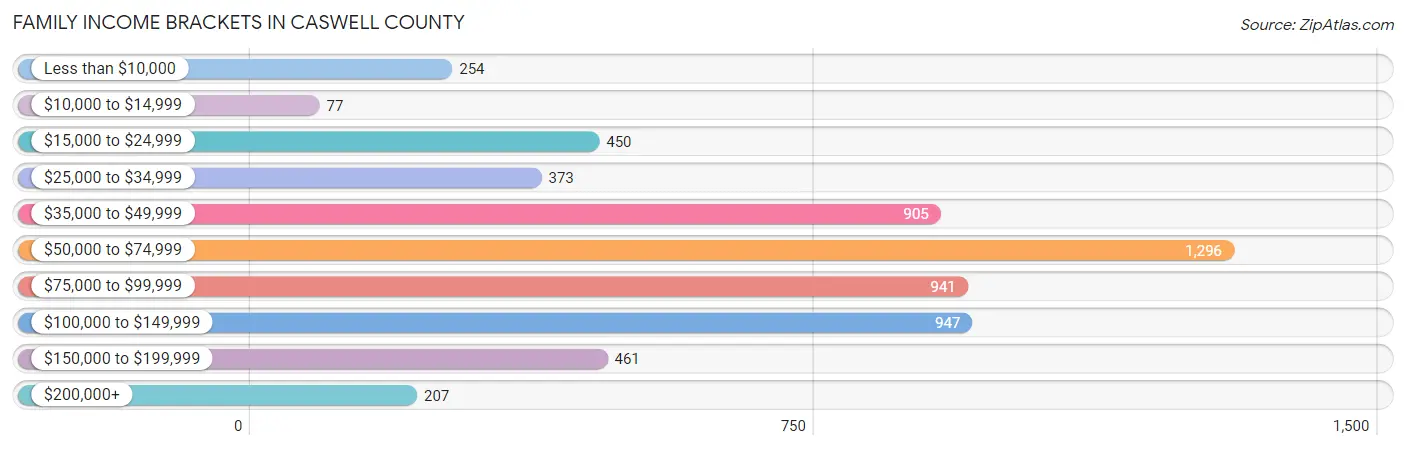
Family Income Brackets in Caswell County
According to the Caswell County family income data, there are 1,296 families falling into the $50,000 to $74,999 income range, which is the most common income bracket and makes up 21.9% of all families. Conversely, the $10,000 to $14,999 income bracket is the least frequent group with only 77 families (1.3%) belonging to this category.
| Income Bracket | # Families | % Families |
| Less than $10,000 | 254 | 4.3% |
| $10,000 to $14,999 | 77 | 1.3% |
| $15,000 to $24,999 | 450 | 7.6% |
| $25,000 to $34,999 | 373 | 6.3% |
| $35,000 to $49,999 | 905 | 15.3% |
| $50,000 to $74,999 | 1,296 | 21.9% |
| $75,000 to $99,999 | 941 | 15.9% |
| $100,000 to $149,999 | 947 | 16.0% |
| $150,000 to $199,999 | 461 | 7.8% |
| $200,000+ | 207 | 3.5% |
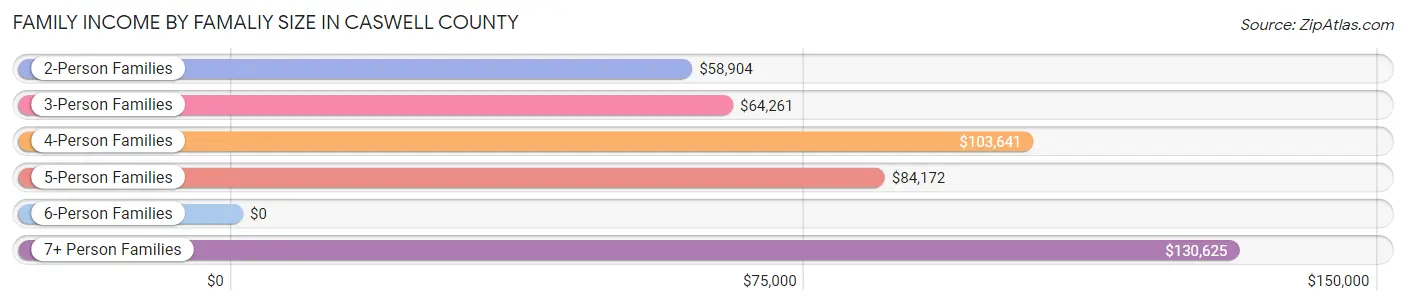
Family Income by Famaliy Size in Caswell County
7+ person families (32 | 0.5%) account for the highest median family income in Caswell County with $130,625 per family, while 2-person families (3,235 | 54.7%) have the highest median income of $29,452 per family member.
| Income Bracket | # Families | Median Income |
| 2-Person Families | 3,235 (54.7%) | $58,904 |
| 3-Person Families | 1,099 (18.6%) | $64,261 |
| 4-Person Families | 1,035 (17.5%) | $103,641 |
| 5-Person Families | 441 (7.4%) | $84,172 |
| 6-Person Families | 74 (1.3%) | $0 |
| 7+ Person Families | 32 (0.5%) | $130,625 |
| Total | 5,916 (100.0%) | $66,451 |
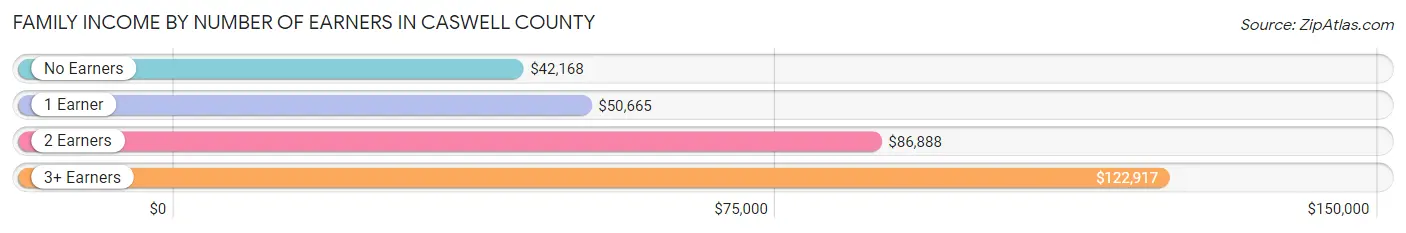
Family Income by Number of Earners in Caswell County
The median family income in Caswell County is $66,451, with families comprising 3+ earners (806) having the highest median family income of $122,917, while families with no earners (1,163) have the lowest median family income of $42,168, accounting for 13.6% and 19.7% of families, respectively.
| Number of Earners | # Families | Median Income |
| No Earners | 1,163 (19.7%) | $42,168 |
| 1 Earner | 2,163 (36.6%) | $50,665 |
| 2 Earners | 1,784 (30.2%) | $86,888 |
| 3+ Earners | 806 (13.6%) | $122,917 |
| Total | 5,916 (100.0%) | $66,451 |
Household Income in Caswell County
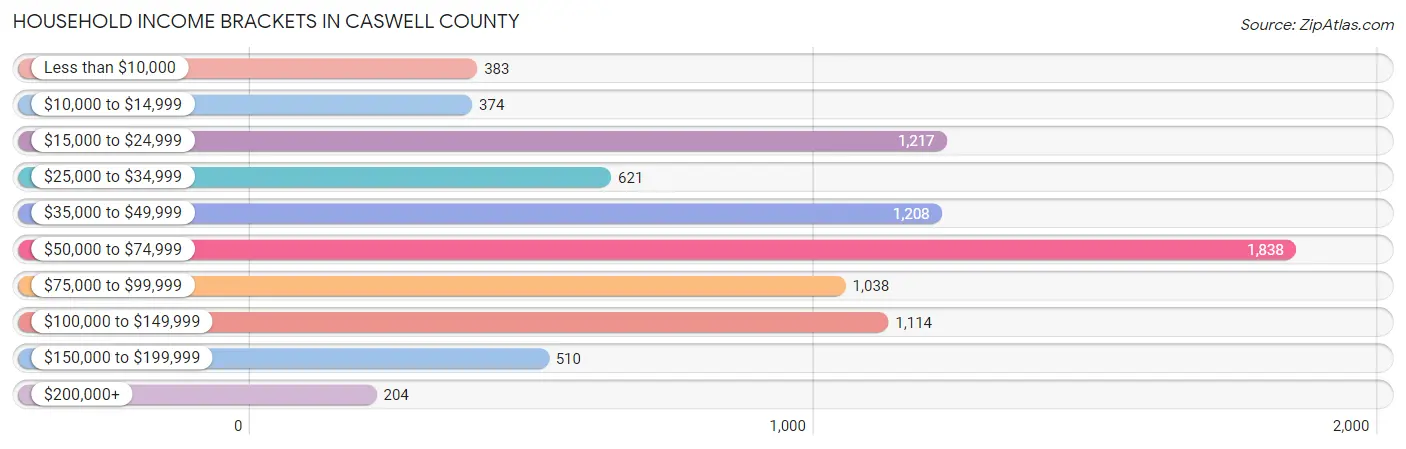
Household Income Brackets in Caswell County
With 1,838 households falling in the category, the $50,000 to $74,999 income range is the most frequent in Caswell County, accounting for 21.6% of all households. In contrast, only 204 households (2.4%) fall into the $200,000+ income bracket, making it the least populous group.
| Income Bracket | # Households | % Households |
| Less than $10,000 | 383 | 4.5% |
| $10,000 to $14,999 | 374 | 4.4% |
| $15,000 to $24,999 | 1,217 | 14.3% |
| $25,000 to $34,999 | 621 | 7.3% |
| $35,000 to $49,999 | 1,208 | 14.2% |
| $50,000 to $74,999 | 1,838 | 21.6% |
| $75,000 to $99,999 | 1,038 | 12.2% |
| $100,000 to $149,999 | 1,114 | 13.1% |
| $150,000 to $199,999 | 510 | 6.0% |
| $200,000+ | 204 | 2.4% |
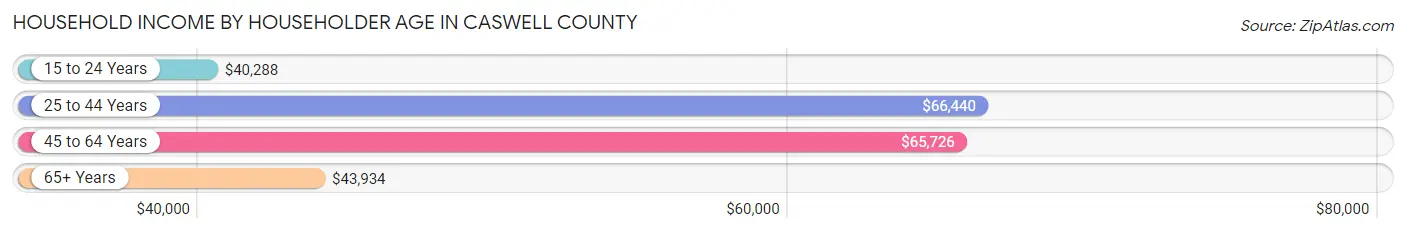
Household Income by Householder Age in Caswell County
The median household income in Caswell County is $56,999, with the highest median household income of $66,440 found in the 25 to 44 years age bracket for the primary householder. A total of 1,843 households (21.7%) fall into this category. Meanwhile, the 15 to 24 years age bracket for the primary householder has the lowest median household income of $40,288, with 179 households (2.1%) in this group.
| Income Bracket | # Households | Median Income |
| 15 to 24 Years | 179 (2.1%) | $40,288 |
| 25 to 44 Years | 1,843 (21.7%) | $66,440 |
| 45 to 64 Years | 3,438 (40.4%) | $65,726 |
| 65+ Years | 3,047 (35.8%) | $43,934 |
| Total | 8,507 (100.0%) | $56,999 |
Poverty in Caswell County
Income Below Poverty by Sex and Age in Caswell County
With 15.1% poverty level for males and 15.8% for females among the residents of Caswell County, 15 year old males and 25 to 34 year old females are the most vulnerable to poverty, with 21 males (40.4%) and 303 females (30.1%) in their respective age groups living below the poverty level.
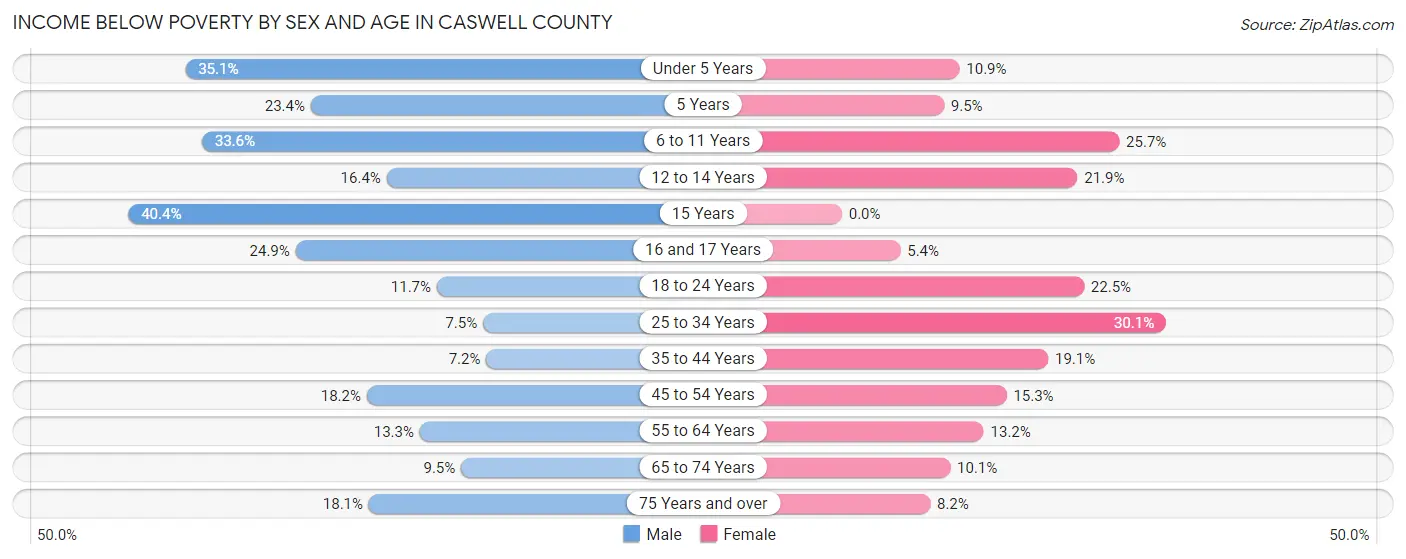
| Age Bracket | Male | Female |
| Under 5 Years | 186 (35.1%) | 49 (10.9%) |
| 5 Years | 15 (23.4%) | 9 (9.5%) |
| 6 to 11 Years | 155 (33.6%) | 131 (25.7%) |
| 12 to 14 Years | 83 (16.4%) | 80 (21.9%) |
| 15 Years | 21 (40.4%) | 0 (0.0%) |
| 16 and 17 Years | 85 (24.8%) | 12 (5.4%) |
| 18 to 24 Years | 120 (11.7%) | 189 (22.5%) |
| 25 to 34 Years | 77 (7.4%) | 303 (30.1%) |
| 35 to 44 Years | 92 (7.1%) | 210 (19.1%) |
| 45 to 54 Years | 278 (18.2%) | 222 (15.3%) |
| 55 to 64 Years | 225 (13.3%) | 226 (13.2%) |
| 65 to 74 Years | 131 (9.5%) | 161 (10.1%) |
| 75 Years and over | 135 (18.0%) | 93 (8.2%) |
| Total | 1,603 (15.1%) | 1,685 (15.8%) |
Income Above Poverty by Sex and Age in Caswell County
According to the poverty statistics in Caswell County, males aged 35 to 44 years and females aged 15 years are the age groups that are most secure financially, with 92.8% of males and 100.0% of females in these age groups living above the poverty line.
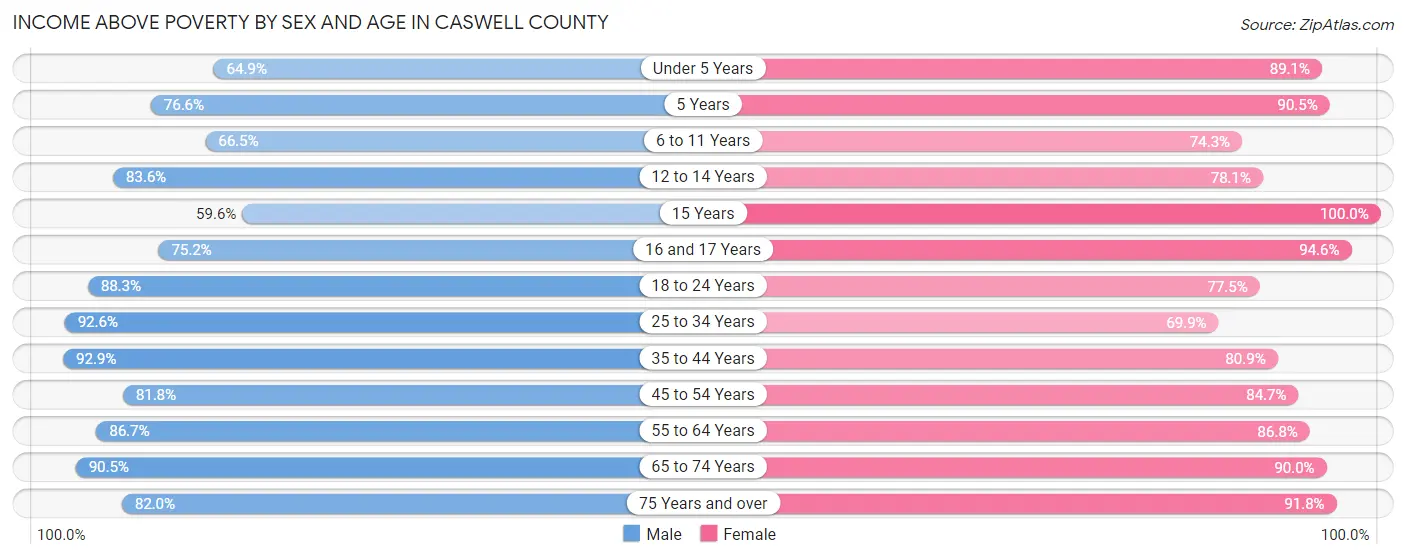
| Age Bracket | Male | Female |
| Under 5 Years | 344 (64.9%) | 400 (89.1%) |
| 5 Years | 49 (76.6%) | 86 (90.5%) |
| 6 to 11 Years | 307 (66.4%) | 378 (74.3%) |
| 12 to 14 Years | 423 (83.6%) | 286 (78.1%) |
| 15 Years | 31 (59.6%) | 167 (100.0%) |
| 16 and 17 Years | 257 (75.1%) | 209 (94.6%) |
| 18 to 24 Years | 902 (88.3%) | 652 (77.5%) |
| 25 to 34 Years | 956 (92.5%) | 704 (69.9%) |
| 35 to 44 Years | 1,194 (92.8%) | 887 (80.9%) |
| 45 to 54 Years | 1,246 (81.8%) | 1,231 (84.7%) |
| 55 to 64 Years | 1,464 (86.7%) | 1,491 (86.8%) |
| 65 to 74 Years | 1,249 (90.5%) | 1,441 (89.9%) |
| 75 Years and over | 613 (82.0%) | 1,042 (91.8%) |
| Total | 9,035 (84.9%) | 8,974 (84.2%) |
Income Below Poverty Among Married-Couple Families in Caswell County
The poverty statistics for married-couple families in Caswell County show that 6.3% or 280 of the total 4,471 families live below the poverty line. Families with 1 or 2 children have the highest poverty rate of 11.1%, comprising of 109 families. On the other hand, families with 5 or more children have the lowest poverty rate of 0.0%, which includes 0 families.
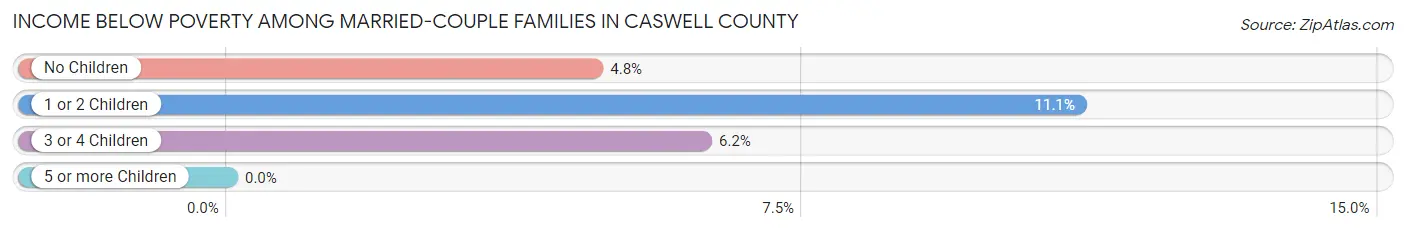
| Children | Above Poverty | Below Poverty |
| No Children | 2,993 (95.2%) | 150 (4.8%) |
| 1 or 2 Children | 875 (88.9%) | 109 (11.1%) |
| 3 or 4 Children | 318 (93.8%) | 21 (6.2%) |
| 5 or more Children | 5 (100.0%) | 0 (0.0%) |
| Total | 4,191 (93.7%) | 280 (6.3%) |
Income Below Poverty Among Single-Parent Households in Caswell County
According to the poverty data in Caswell County, 24.6% or 60 single-father households and 29.2% or 351 single-mother households are living below the poverty line. Among single-father households, those with no children have the highest poverty rate, with 47 households (54.0%) experiencing poverty. Likewise, among single-mother households, those with 5 or more children have the highest poverty rate, with 15 households (100.0%) falling below the poverty line.
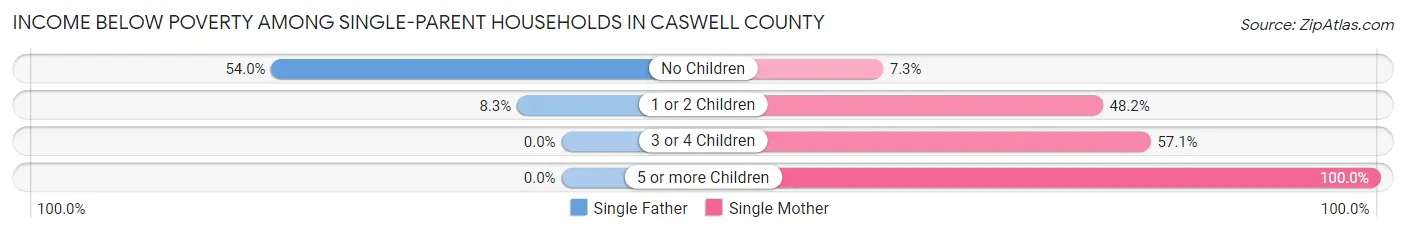
| Children | Single Father | Single Mother |
| No Children | 47 (54.0%) | 43 (7.3%) |
| 1 or 2 Children | 13 (8.3%) | 257 (48.2%) |
| 3 or 4 Children | 0 (0.0%) | 36 (57.1%) |
| 5 or more Children | 0 (0.0%) | 15 (100.0%) |
| Total | 60 (24.6%) | 351 (29.2%) |
Income Below Poverty Among Married-Couple vs Single-Parent Households in Caswell County
The poverty data for Caswell County shows that 280 of the married-couple family households (6.3%) and 411 of the single-parent households (28.4%) are living below the poverty level. Within the married-couple family households, those with 1 or 2 children have the highest poverty rate, with 109 households (11.1%) falling below the poverty line. Among the single-parent households, those with 5 or more children have the highest poverty rate, with 15 household (100.0%) living below poverty.
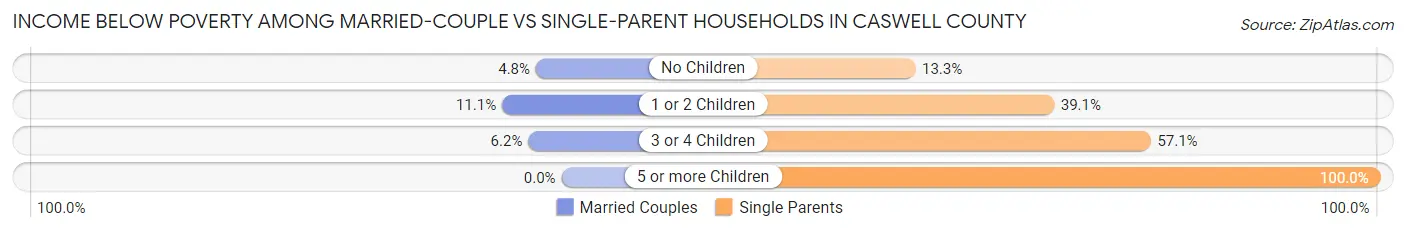
| Children | Married-Couple Families | Single-Parent Households |
| No Children | 150 (4.8%) | 90 (13.3%) |
| 1 or 2 Children | 109 (11.1%) | 270 (39.1%) |
| 3 or 4 Children | 21 (6.2%) | 36 (57.1%) |
| 5 or more Children | 0 (0.0%) | 15 (100.0%) |
| Total | 280 (6.3%) | 411 (28.4%) |
Race in Caswell County
The most populous races in Caswell County are White / Caucasian (13,719 | 60.3%), Black / African American (7,278 | 32.0%), and Hispanic or Latino (1,089 | 4.8%).
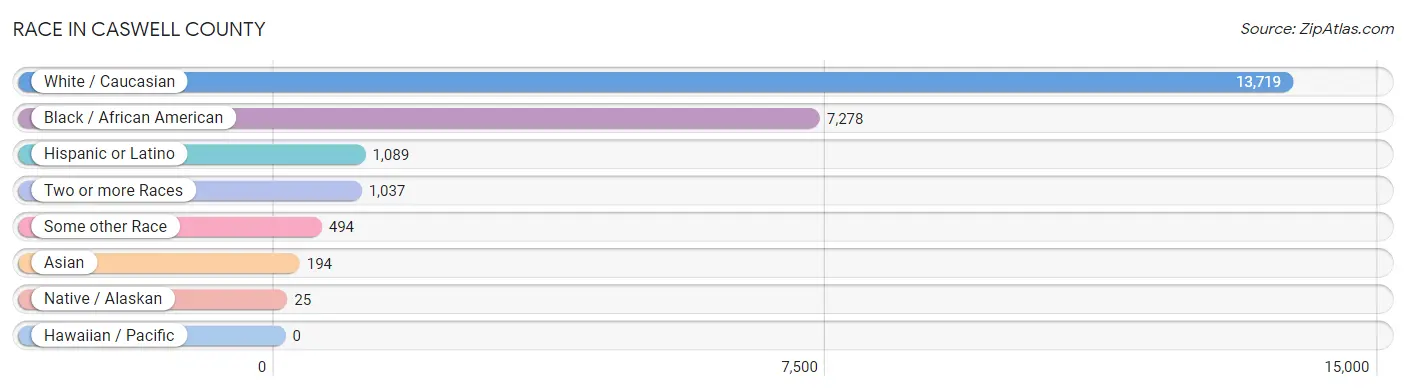
| Race | # Population | % Population |
| Asian | 194 | 0.9% |
| Black / African American | 7,278 | 32.0% |
| Hawaiian / Pacific | 0 | 0.0% |
| Hispanic or Latino | 1,089 | 4.8% |
| Native / Alaskan | 25 | 0.1% |
| White / Caucasian | 13,719 | 60.3% |
| Two or more Races | 1,037 | 4.6% |
| Some other Race | 494 | 2.2% |
| Total | 22,747 | 100.0% |
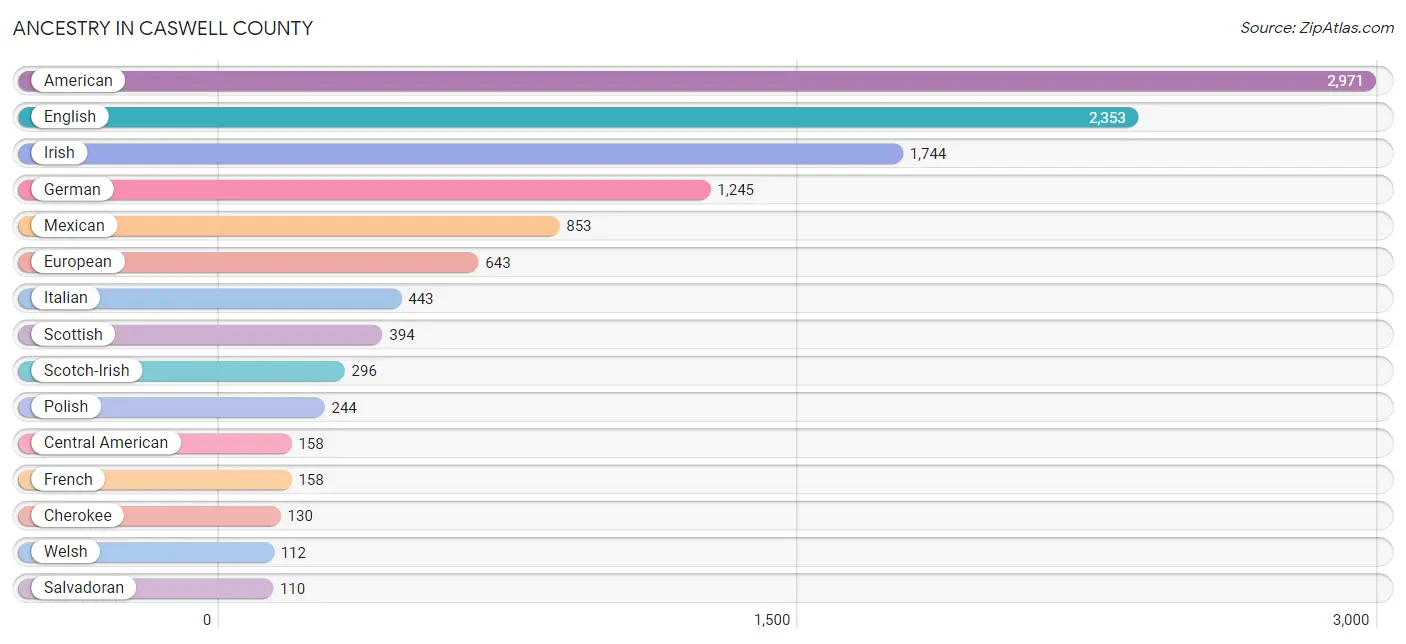
Ancestry in Caswell County
The most populous ancestries reported in Caswell County are American (2,971 | 13.1%), English (2,353 | 10.3%), Irish (1,744 | 7.7%), German (1,245 | 5.5%), and Mexican (853 | 3.7%), together accounting for 40.3% of all Caswell County residents.
| Ancestry | # Population | % Population |
| African | 29 | 0.1% |
| American | 2,971 | 13.1% |
| Austrian | 45 | 0.2% |
| British | 58 | 0.3% |
| Cambodian | 23 | 0.1% |
| Central American | 158 | 0.7% |
| Cherokee | 130 | 0.6% |
| Choctaw | 15 | 0.1% |
| Danish | 22 | 0.1% |
| Dutch | 82 | 0.4% |
| Eastern European | 8 | 0.0% |
| English | 2,353 | 10.3% |
| European | 643 | 2.8% |
| French | 158 | 0.7% |
| French Canadian | 11 | 0.1% |
| German | 1,245 | 5.5% |
| Greek | 24 | 0.1% |
| Irish | 1,744 | 7.7% |
| Italian | 443 | 1.9% |
| Jamaican | 2 | 0.0% |
| Japanese | 101 | 0.4% |
| Korean | 70 | 0.3% |
| Lumbee | 5 | 0.0% |
| Mexican | 853 | 3.7% |
| Native Hawaiian | 10 | 0.0% |
| Nicaraguan | 48 | 0.2% |
| Nigerian | 39 | 0.2% |
| Norwegian | 36 | 0.2% |
| Polish | 244 | 1.1% |
| Puerto Rican | 50 | 0.2% |
| Romanian | 2 | 0.0% |
| Russian | 64 | 0.3% |
| Salvadoran | 110 | 0.5% |
| Scandinavian | 22 | 0.1% |
| Scotch-Irish | 296 | 1.3% |
| Scottish | 394 | 1.7% |
| Spanish | 4 | 0.0% |
| Subsaharan African | 68 | 0.3% |
| Swedish | 6 | 0.0% |
| Welsh | 112 | 0.5% | View All 40 Rows |
Immigrants in Caswell County
The most numerous immigrant groups reported in Caswell County came from Latin America (375 | 1.7%), Central America (373 | 1.6%), Mexico (342 | 1.5%), Asia (174 | 0.8%), and South Eastern Asia (151 | 0.7%), together accounting for 6.2% of all Caswell County residents.
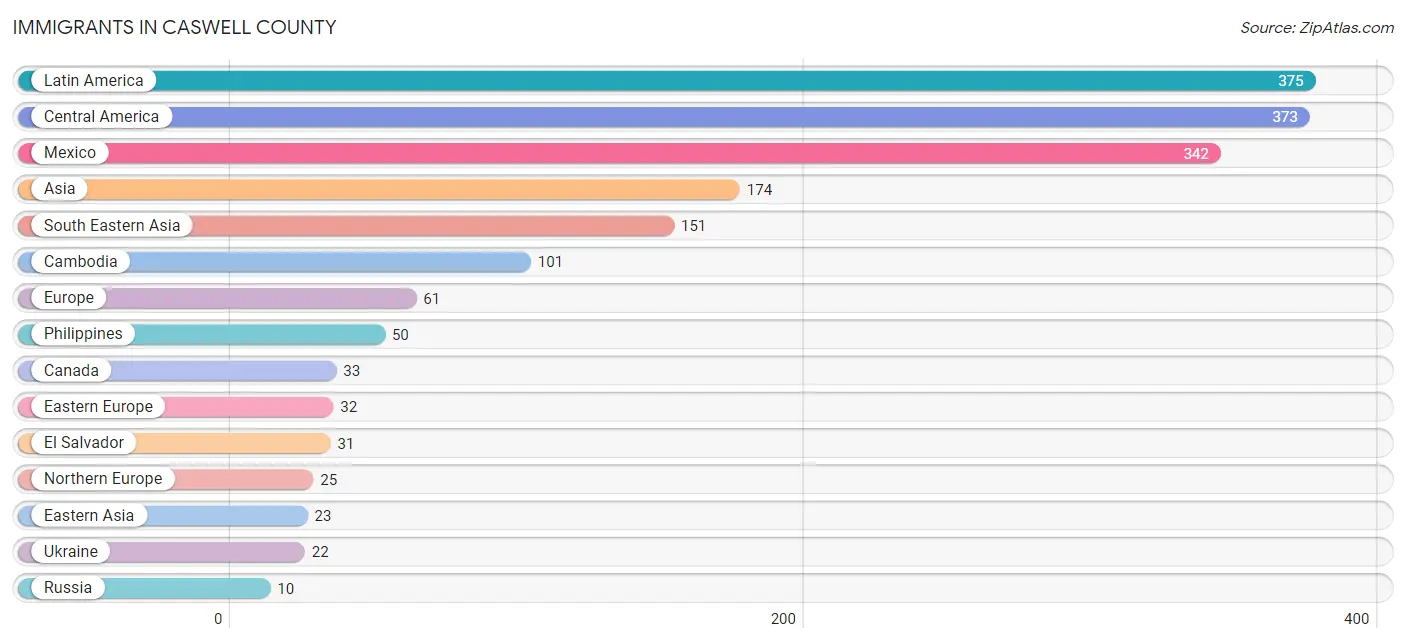
| Immigration Origin | # Population | % Population |
| Asia | 174 | 0.8% |
| Cambodia | 101 | 0.4% |
| Canada | 33 | 0.2% |
| Caribbean | 2 | 0.0% |
| Central America | 373 | 1.6% |
| Eastern Asia | 23 | 0.1% |
| Eastern Europe | 32 | 0.1% |
| El Salvador | 31 | 0.1% |
| Europe | 61 | 0.3% |
| Jamaica | 2 | 0.0% |
| Latin America | 375 | 1.7% |
| Mexico | 342 | 1.5% |
| Northern Europe | 25 | 0.1% |
| Philippines | 50 | 0.2% |
| Russia | 10 | 0.0% |
| South Eastern Asia | 151 | 0.7% |
| Southern Europe | 4 | 0.0% |
| Spain | 4 | 0.0% |
| Ukraine | 22 | 0.1% | View All 19 Rows |
Sex and Age in Caswell County
Sex and Age in Caswell County
The most populous age groups in Caswell County are 60 to 64 Years (939 | 7.9%) for men and 55 to 59 Years (896 | 8.2%) for women.
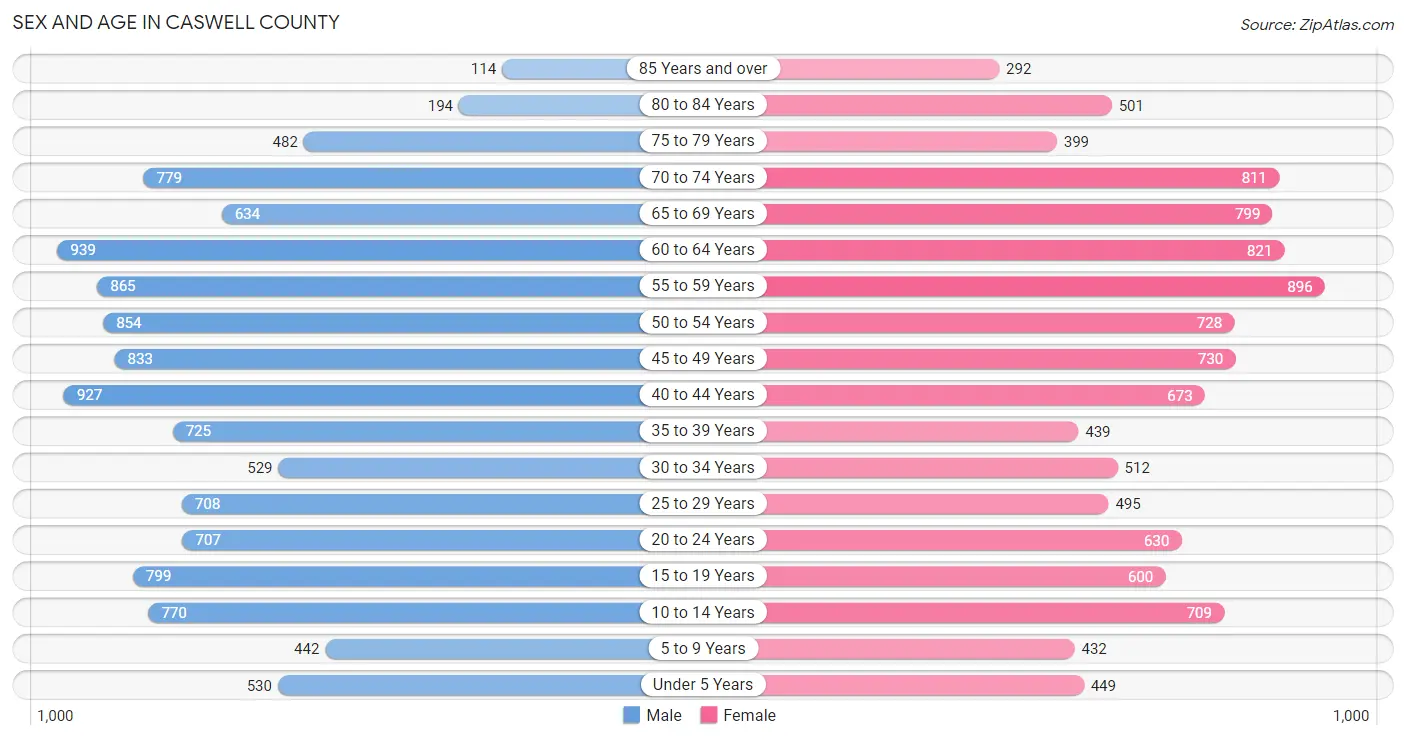
| Age Bracket | Male | Female |
| Under 5 Years | 530 (4.5%) | 449 (4.1%) |
| 5 to 9 Years | 442 (3.7%) | 432 (4.0%) |
| 10 to 14 Years | 770 (6.5%) | 709 (6.5%) |
| 15 to 19 Years | 799 (6.8%) | 600 (5.5%) |
| 20 to 24 Years | 707 (6.0%) | 630 (5.8%) |
| 25 to 29 Years | 708 (6.0%) | 495 (4.5%) |
| 30 to 34 Years | 529 (4.5%) | 512 (4.7%) |
| 35 to 39 Years | 725 (6.1%) | 439 (4.0%) |
| 40 to 44 Years | 927 (7.8%) | 673 (6.2%) |
| 45 to 49 Years | 833 (7.0%) | 730 (6.7%) |
| 50 to 54 Years | 854 (7.2%) | 728 (6.7%) |
| 55 to 59 Years | 865 (7.3%) | 896 (8.2%) |
| 60 to 64 Years | 939 (7.9%) | 821 (7.5%) |
| 65 to 69 Years | 634 (5.4%) | 799 (7.3%) |
| 70 to 74 Years | 779 (6.6%) | 811 (7.4%) |
| 75 to 79 Years | 482 (4.1%) | 399 (3.7%) |
| 80 to 84 Years | 194 (1.6%) | 501 (4.6%) |
| 85 Years and over | 114 (1.0%) | 292 (2.7%) |
| Total | 11,831 (100.0%) | 10,916 (100.0%) |
Families and Households in Caswell County
Median Family Size in Caswell County
The median family size in Caswell County is 2.99 persons per family, with married-couple families (4,471 | 75.6%) accounting for the largest median family size of 3.03 persons per family. On the other hand, single male/father families (244 | 4.1%) represent the smallest median family size with 2.30 persons per family.
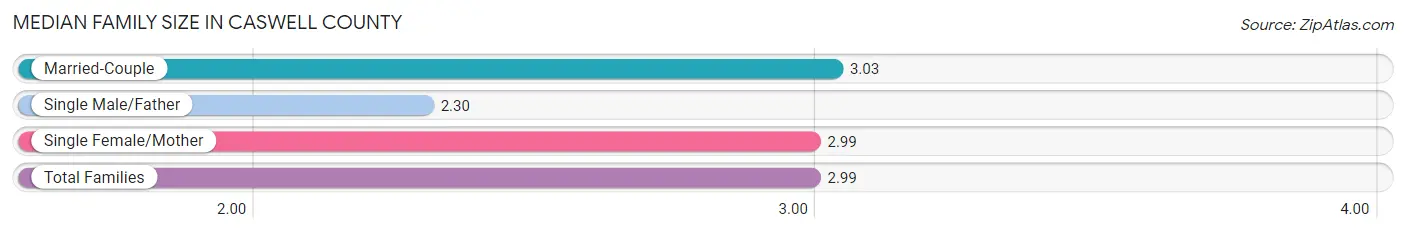
| Family Type | # Families | Family Size |
| Married-Couple | 4,471 (75.6%) | 3.03 |
| Single Male/Father | 244 (4.1%) | 2.30 |
| Single Female/Mother | 1,201 (20.3%) | 2.99 |
| Total Families | 5,916 (100.0%) | 2.99 |
Median Household Size in Caswell County
The median household size in Caswell County is 2.52 persons per household, with single female/mother households (1,201 | 14.1%) accounting for the largest median household size of 3.12 persons per household. non-family households (2,591 | 30.5%) represent the smallest median household size with 1.35 persons per household.
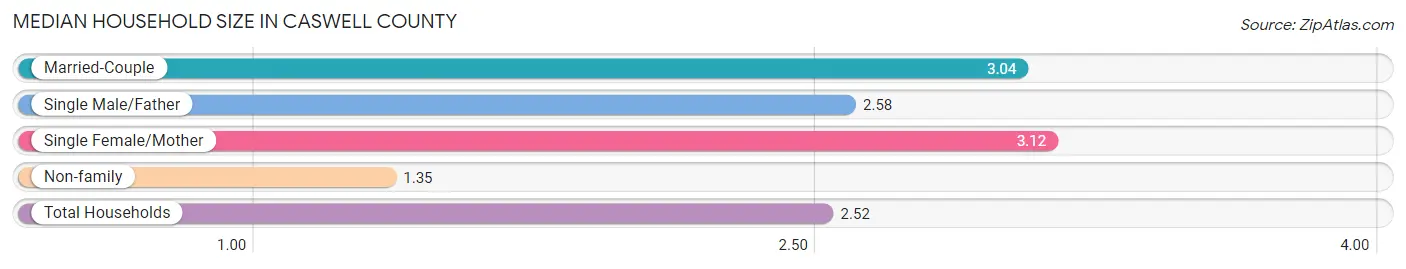
| Household Type | # Households | Household Size |
| Married-Couple | 4,471 (52.6%) | 3.04 |
| Single Male/Father | 244 (2.9%) | 2.58 |
| Single Female/Mother | 1,201 (14.1%) | 3.12 |
| Non-family | 2,591 (30.5%) | 1.35 |
| Total Households | 8,507 (100.0%) | 2.52 |
Household Size by Marriage Status in Caswell County
Out of a total of 8,507 households in Caswell County, 5,916 (69.5%) are family households, while 2,591 (30.5%) are nonfamily households. The most numerous type of family households are 2-person households, comprising 3,111, and the most common type of nonfamily households are 1-person households, comprising 2,168.
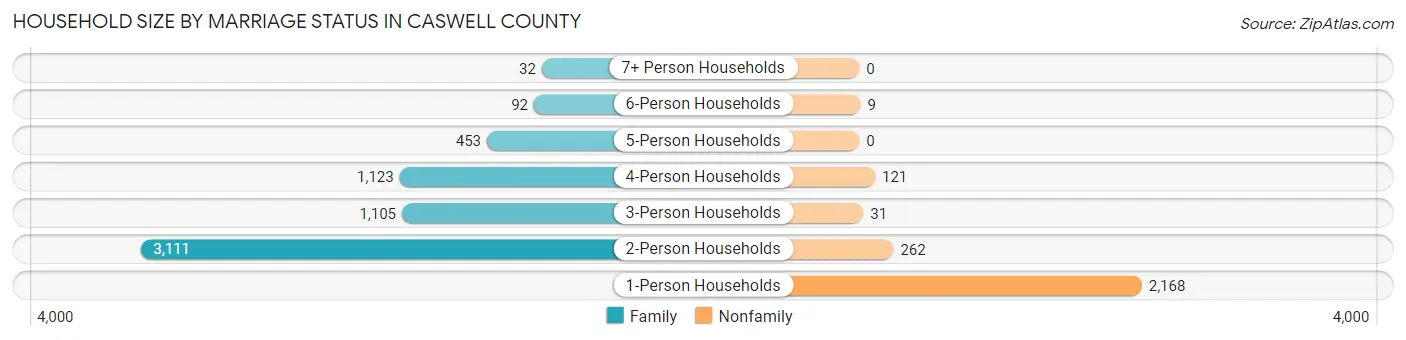
| Household Size | Family Households | Nonfamily Households |
| 1-Person Households | - | 2,168 (25.5%) |
| 2-Person Households | 3,111 (36.6%) | 262 (3.1%) |
| 3-Person Households | 1,105 (13.0%) | 31 (0.4%) |
| 4-Person Households | 1,123 (13.2%) | 121 (1.4%) |
| 5-Person Households | 453 (5.3%) | 0 (0.0%) |
| 6-Person Households | 92 (1.1%) | 9 (0.1%) |
| 7+ Person Households | 32 (0.4%) | 0 (0.0%) |
| Total | 5,916 (69.5%) | 2,591 (30.5%) |
Female Fertility in Caswell County
Fertility by Age in Caswell County
Average fertility rate in Caswell County is 42.0 births per 1,000 women. Women in the age bracket of 20 to 34 years have the highest fertility rate with 104.0 births per 1,000 women. Women in the age bracket of 20 to 34 years acount for 97.7% of all women with births.
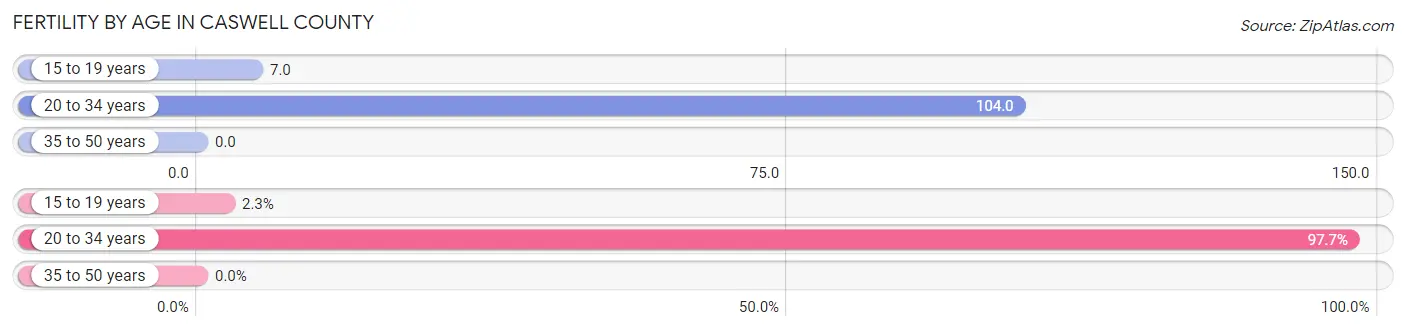
| Age Bracket | Women with Births | Births / 1,000 Women |
| 15 to 19 years | 4 (2.3%) | 7.0 |
| 20 to 34 years | 171 (97.7%) | 104.0 |
| 35 to 50 years | 0 (0.0%) | 0.0 |
| Total | 175 (100.0%) | 42.0 |
Fertility by Age by Marriage Status in Caswell County
57.7% of women with births (175) in Caswell County are married. The highest percentage of unmarried women with births falls into 15 to 19 years age bracket with 100.0% of them unmarried at the time of birth, while the lowest percentage of unmarried women with births belong to 20 to 34 years age bracket with 40.9% of them unmarried.
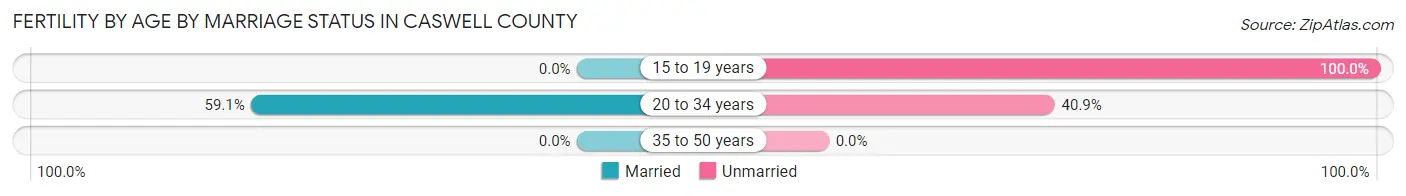
| Age Bracket | Married | Unmarried |
| 15 to 19 years | 0 (0.0%) | 4 (100.0%) |
| 20 to 34 years | 101 (59.1%) | 70 (40.9%) |
| 35 to 50 years | 0 (0.0%) | 0 (0.0%) |
| Total | 101 (57.7%) | 74 (42.3%) |
Fertility by Education in Caswell County
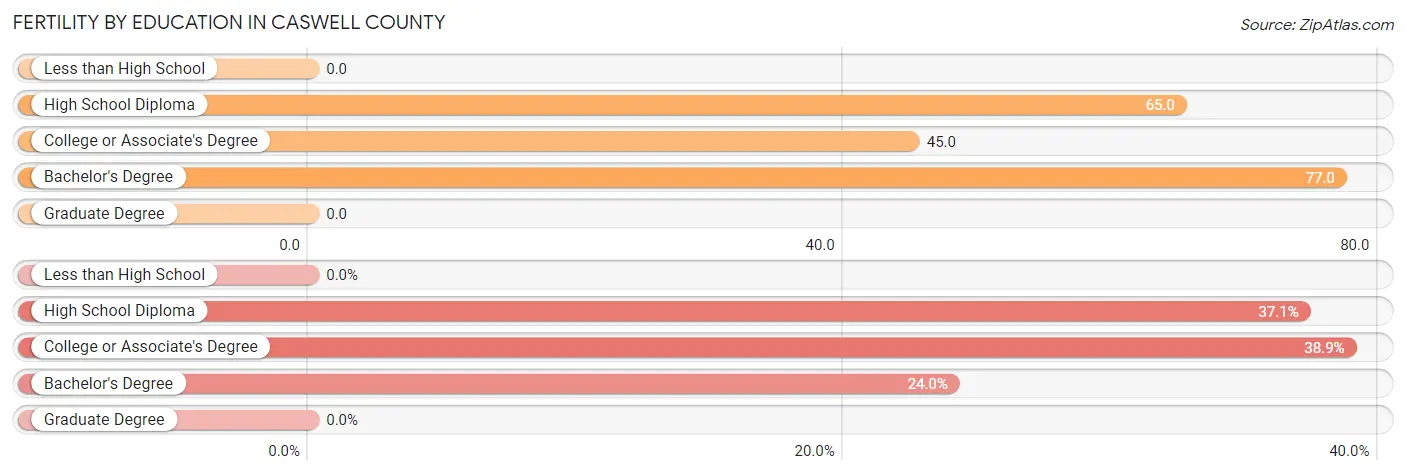
| Educational Attainment | Women with Births | Births / 1,000 Women |
| Less than High School | 0 (0.0%) | 0.0 |
| High School Diploma | 65 (37.1%) | 65.0 |
| College or Associate's Degree | 68 (38.9%) | 45.0 |
| Bachelor's Degree | 42 (24.0%) | 77.0 |
| Graduate Degree | 0 (0.0%) | 0.0 |
| Total | 175 (100.0%) | 42.0 |
Fertility by Education by Marriage Status in Caswell County
42.3% of women with births in Caswell County are unmarried. Women with the educational attainment of bachelor's degree are most likely to be married with 100.0% of them married at childbirth, while women with the educational attainment of high school diploma are least likely to be married with 100.0% of them unmarried at childbirth.
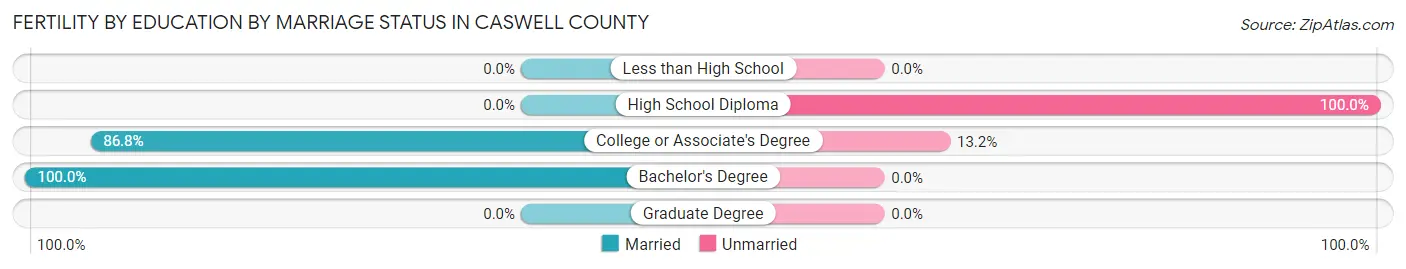
| Educational Attainment | Married | Unmarried |
| Less than High School | 0 (0.0%) | 0 (0.0%) |
| High School Diploma | 0 (0.0%) | 65 (100.0%) |
| College or Associate's Degree | 59 (86.8%) | 9 (13.2%) |
| Bachelor's Degree | 42 (100.0%) | 0 (0.0%) |
| Graduate Degree | 0 (0.0%) | 0 (0.0%) |
| Total | 101 (57.7%) | 74 (42.3%) |
Employment Characteristics in Caswell County
Employment by Class of Employer in Caswell County
Among the 9,225 employed individuals in Caswell County, private company employees (6,380 | 69.2%), local government employees (908 | 9.8%), and state government employees (601 | 6.5%) make up the most common classes of employment.
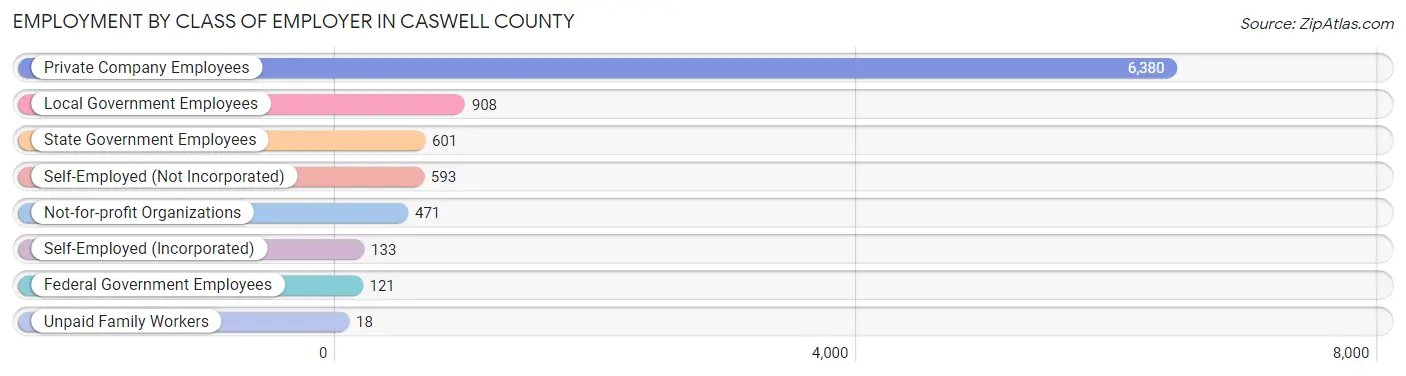
| Employer Class | # Employees | % Employees |
| Private Company Employees | 6,380 | 69.2% |
| Self-Employed (Incorporated) | 133 | 1.4% |
| Self-Employed (Not Incorporated) | 593 | 6.4% |
| Not-for-profit Organizations | 471 | 5.1% |
| Local Government Employees | 908 | 9.8% |
| State Government Employees | 601 | 6.5% |
| Federal Government Employees | 121 | 1.3% |
| Unpaid Family Workers | 18 | 0.2% |
| Total | 9,225 | 100.0% |
Employment Status by Age in Caswell County
According to the labor force statistics for Caswell County, out of the total population over 16 years of age (19,196), 53.1% or 10,193 individuals are in the labor force, with 6.0% or 612 of them unemployed. The age group with the highest labor force participation rate is 20 to 24 years, with 82.6% or 1,104 individuals in the labor force. Within the labor force, the 16 to 19 years age range has the highest percentage of unemployed individuals, with 22.1% or 81 of them being unemployed.
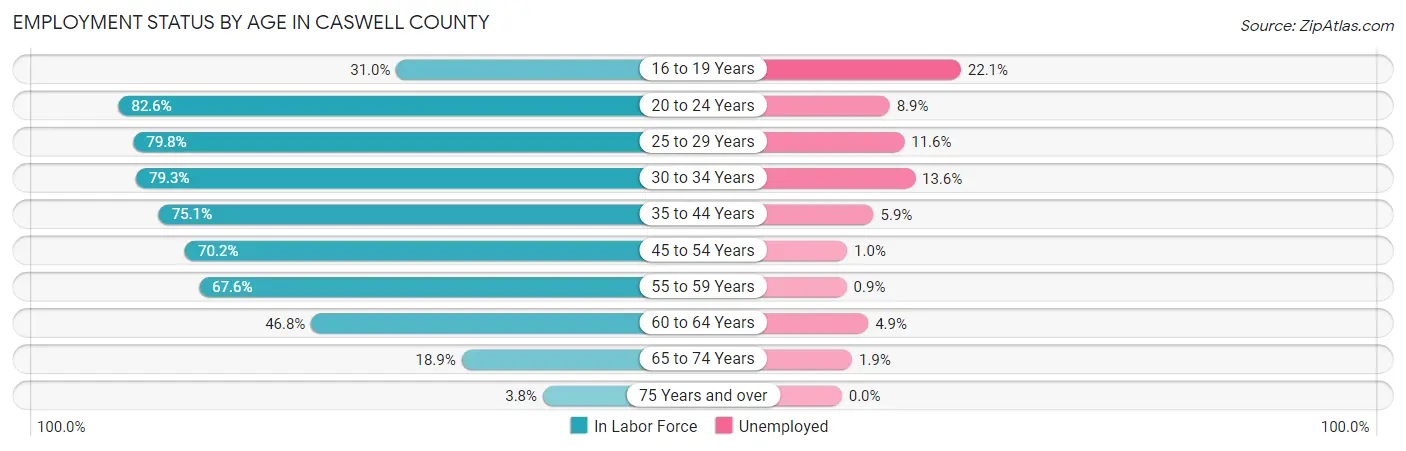
| Age Bracket | In Labor Force | Unemployed |
| 16 to 19 Years | 366 (31.0%) | 81 (22.1%) |
| 20 to 24 Years | 1,104 (82.6%) | 98 (8.9%) |
| 25 to 29 Years | 960 (79.8%) | 111 (11.6%) |
| 30 to 34 Years | 826 (79.3%) | 112 (13.6%) |
| 35 to 44 Years | 2,076 (75.1%) | 122 (5.9%) |
| 45 to 54 Years | 2,208 (70.2%) | 22 (1.0%) |
| 55 to 59 Years | 1,190 (67.6%) | 11 (0.9%) |
| 60 to 64 Years | 824 (46.8%) | 40 (4.9%) |
| 65 to 74 Years | 571 (18.9%) | 11 (1.9%) |
| 75 Years and over | 75 (3.8%) | 0 (0.0%) |
| Total | 10,193 (53.1%) | 612 (6.0%) |
Employment Status by Educational Attainment in Caswell County
According to labor force statistics for Caswell County, 69.2% of individuals (8,078) out of the total population between 25 and 64 years of age (11,674) are in the labor force, with 5.2% or 420 of them being unemployed. The group with the highest labor force participation rate are those with the educational attainment of bachelor's degree or higher, with 82.9% or 1,531 individuals in the labor force. Within the labor force, individuals with college / associate degree education have the highest percentage of unemployment, with 7.2% or 218 of them being unemployed.
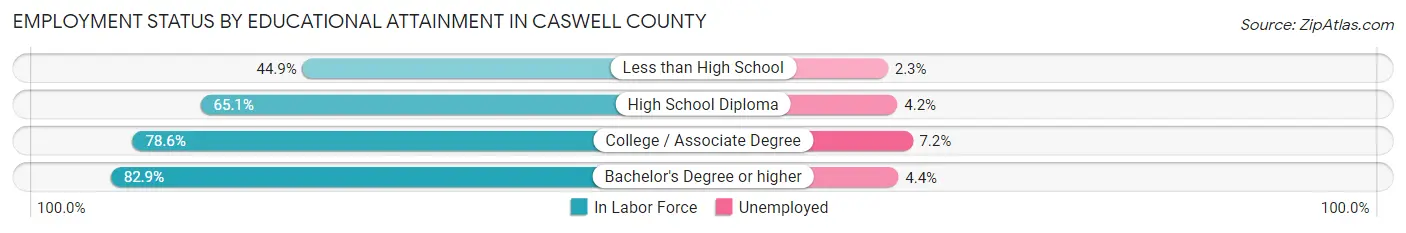
| Educational Attainment | In Labor Force | Unemployed |
| Less than High School | 817 (44.9%) | 42 (2.3%) |
| High School Diploma | 2,707 (65.1%) | 175 (4.2%) |
| College / Associate Degree | 3,025 (78.6%) | 277 (7.2%) |
| Bachelor's Degree or higher | 1,531 (82.9%) | 81 (4.4%) |
| Total | 8,078 (69.2%) | 607 (5.2%) |
Employment Occupations by Sex in Caswell County
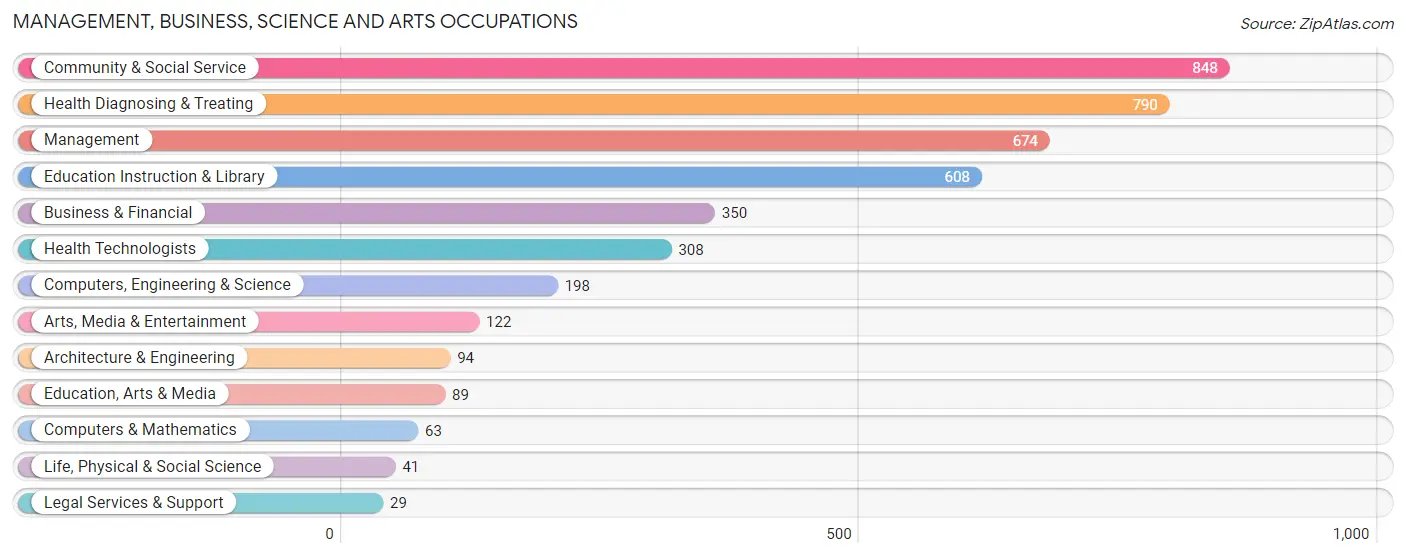
Management, Business, Science and Arts Occupations
The most common Management, Business, Science and Arts occupations in Caswell County are Community & Social Service (848 | 8.9%), Health Diagnosing & Treating (790 | 8.3%), Management (674 | 7.0%), Education Instruction & Library (608 | 6.4%), and Business & Financial (350 | 3.7%).
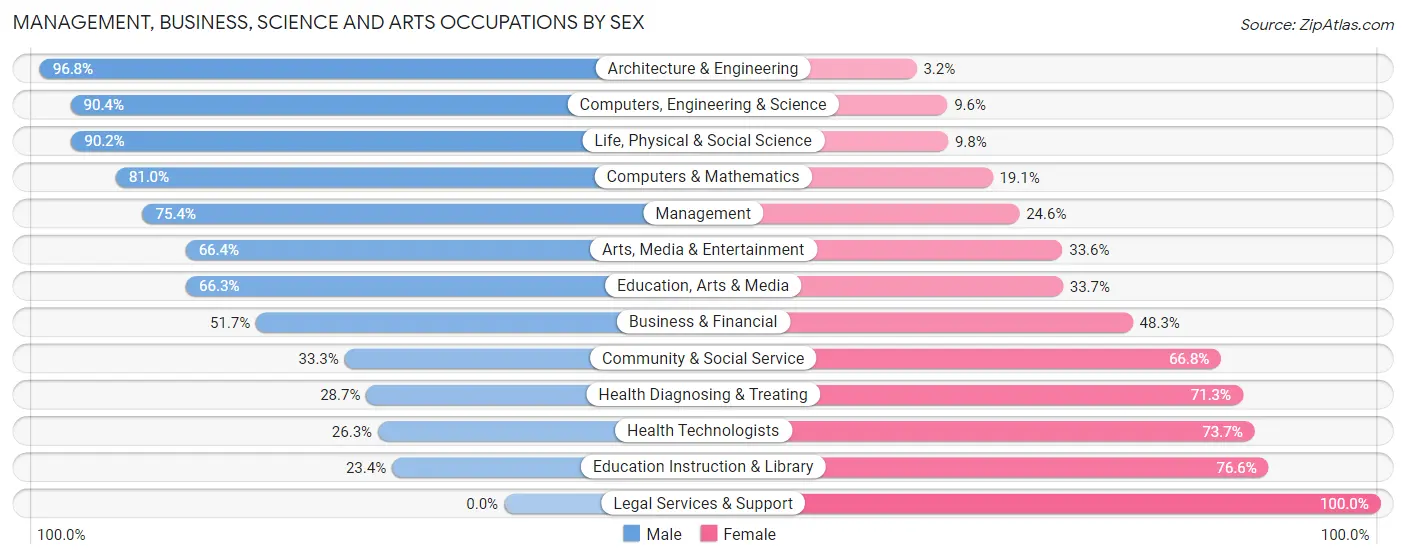
Management, Business, Science and Arts Occupations by Sex
Within the Management, Business, Science and Arts occupations in Caswell County, the most male-oriented occupations are Architecture & Engineering (96.8%), Computers, Engineering & Science (90.4%), and Life, Physical & Social Science (90.2%), while the most female-oriented occupations are Legal Services & Support (100.0%), Education Instruction & Library (76.6%), and Health Technologists (73.7%).
| Occupation | Male | Female |
| Management | 508 (75.4%) | 166 (24.6%) |
| Business & Financial | 181 (51.7%) | 169 (48.3%) |
| Computers, Engineering & Science | 179 (90.4%) | 19 (9.6%) |
| Computers & Mathematics | 51 (80.9%) | 12 (19.1%) |
| Architecture & Engineering | 91 (96.8%) | 3 (3.2%) |
| Life, Physical & Social Science | 37 (90.2%) | 4 (9.8%) |
| Community & Social Service | 282 (33.3%) | 566 (66.7%) |
| Education, Arts & Media | 59 (66.3%) | 30 (33.7%) |
| Legal Services & Support | 0 (0.0%) | 29 (100.0%) |
| Education Instruction & Library | 142 (23.4%) | 466 (76.6%) |
| Arts, Media & Entertainment | 81 (66.4%) | 41 (33.6%) |
| Health Diagnosing & Treating | 227 (28.7%) | 563 (71.3%) |
| Health Technologists | 81 (26.3%) | 227 (73.7%) |
| Total (Category) | 1,377 (48.1%) | 1,483 (51.8%) |
| Total (Overall) | 5,095 (53.3%) | 4,461 (46.7%) |
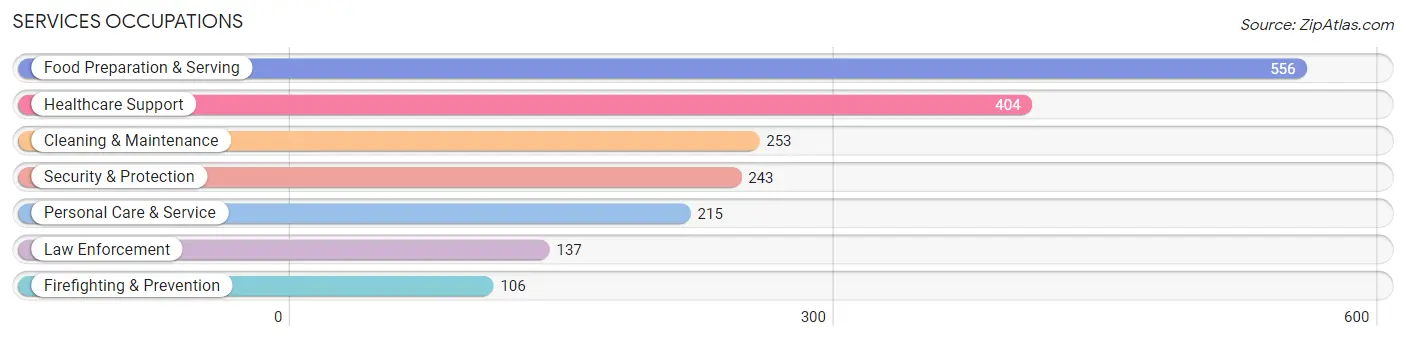
Services Occupations
The most common Services occupations in Caswell County are Food Preparation & Serving (556 | 5.8%), Healthcare Support (404 | 4.2%), Cleaning & Maintenance (253 | 2.6%), Security & Protection (243 | 2.5%), and Personal Care & Service (215 | 2.2%).
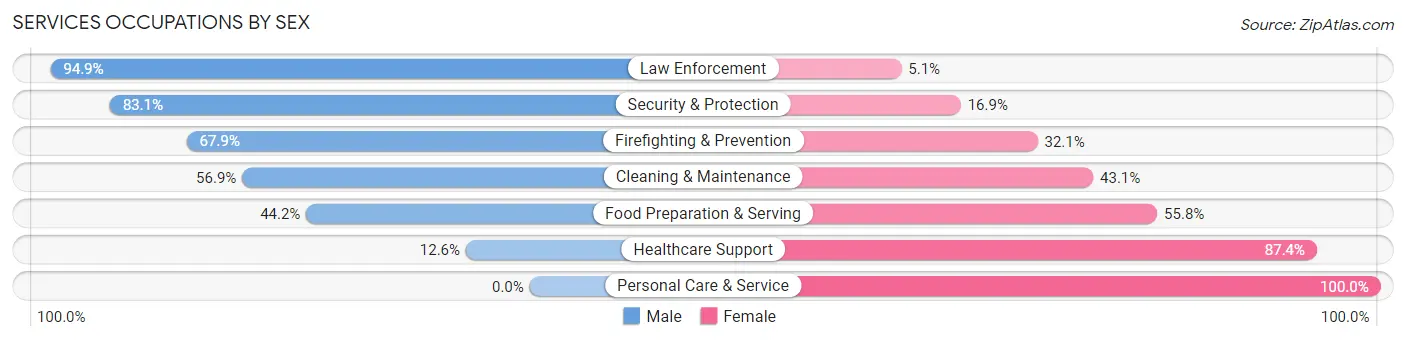
Services Occupations by Sex
Within the Services occupations in Caswell County, the most male-oriented occupations are Law Enforcement (94.9%), Security & Protection (83.1%), and Firefighting & Prevention (67.9%), while the most female-oriented occupations are Personal Care & Service (100.0%), Healthcare Support (87.4%), and Food Preparation & Serving (55.8%).
| Occupation | Male | Female |
| Healthcare Support | 51 (12.6%) | 353 (87.4%) |
| Security & Protection | 202 (83.1%) | 41 (16.9%) |
| Firefighting & Prevention | 72 (67.9%) | 34 (32.1%) |
| Law Enforcement | 130 (94.9%) | 7 (5.1%) |
| Food Preparation & Serving | 246 (44.2%) | 310 (55.8%) |
| Cleaning & Maintenance | 144 (56.9%) | 109 (43.1%) |
| Personal Care & Service | 0 (0.0%) | 215 (100.0%) |
| Total (Category) | 643 (38.5%) | 1,028 (61.5%) |
| Total (Overall) | 5,095 (53.3%) | 4,461 (46.7%) |
Sales and Office Occupations
The most common Sales and Office occupations in Caswell County are Office & Administration (1,018 | 10.6%), and Sales & Related (697 | 7.3%).

Sales and Office Occupations by Sex

| Occupation | Male | Female |
| Sales & Related | 182 (26.1%) | 515 (73.9%) |
| Office & Administration | 159 (15.6%) | 859 (84.4%) |
| Total (Category) | 341 (19.9%) | 1,374 (80.1%) |
| Total (Overall) | 5,095 (53.3%) | 4,461 (46.7%) |
Natural Resources, Construction and Maintenance Occupations
The most common Natural Resources, Construction and Maintenance occupations in Caswell County are Installation, Maintenance & Repair (647 | 6.8%), Construction & Extraction (621 | 6.5%), and Farming, Fishing & Forestry (30 | 0.3%).

Natural Resources, Construction and Maintenance Occupations by Sex
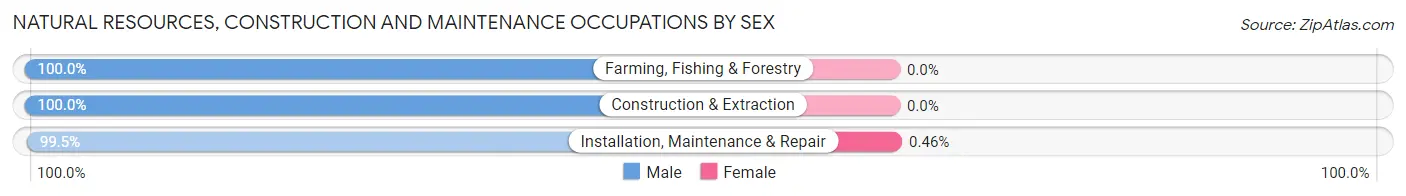
| Occupation | Male | Female |
| Farming, Fishing & Forestry | 30 (100.0%) | 0 (0.0%) |
| Construction & Extraction | 621 (100.0%) | 0 (0.0%) |
| Installation, Maintenance & Repair | 644 (99.5%) | 3 (0.5%) |
| Total (Category) | 1,295 (99.8%) | 3 (0.2%) |
| Total (Overall) | 5,095 (53.3%) | 4,461 (46.7%) |
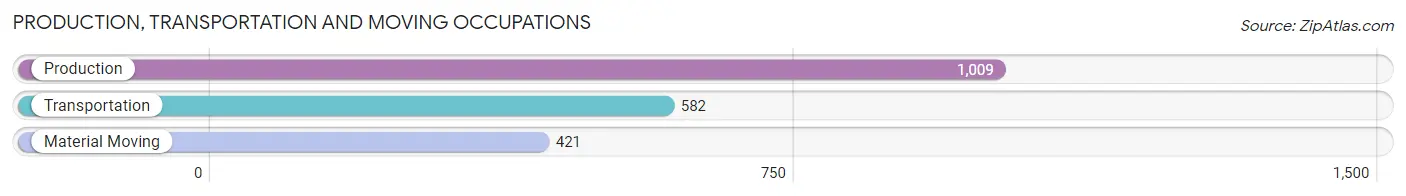
Production, Transportation and Moving Occupations
The most common Production, Transportation and Moving occupations in Caswell County are Production (1,009 | 10.6%), Transportation (582 | 6.1%), and Material Moving (421 | 4.4%).
Production, Transportation and Moving Occupations by Sex
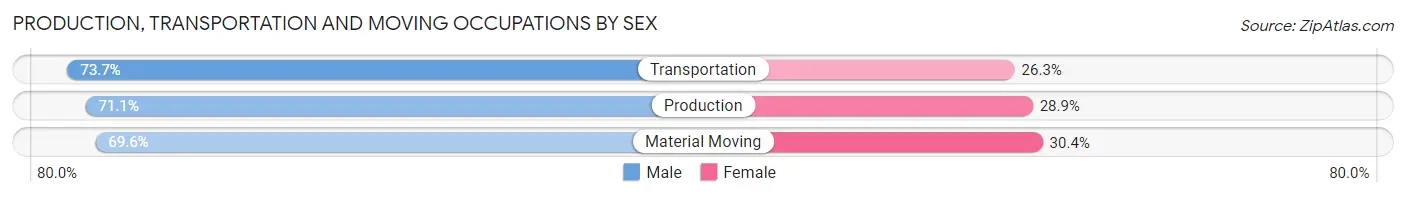
| Occupation | Male | Female |
| Production | 717 (71.1%) | 292 (28.9%) |
| Transportation | 429 (73.7%) | 153 (26.3%) |
| Material Moving | 293 (69.6%) | 128 (30.4%) |
| Total (Category) | 1,439 (71.5%) | 573 (28.5%) |
| Total (Overall) | 5,095 (53.3%) | 4,461 (46.7%) |
Employment Industries by Sex in Caswell County
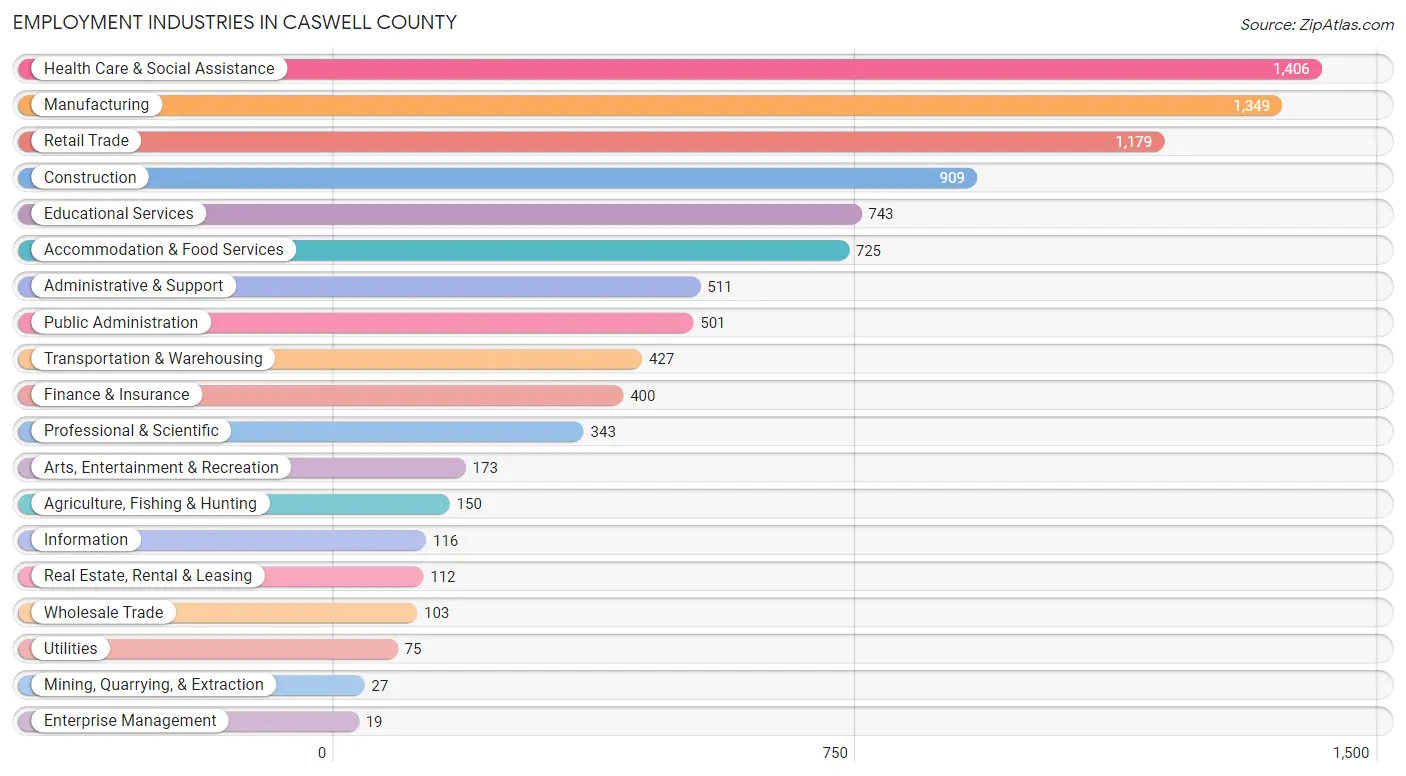
Employment Industries in Caswell County
The major employment industries in Caswell County include Health Care & Social Assistance (1,406 | 14.7%), Manufacturing (1,349 | 14.1%), Retail Trade (1,179 | 12.3%), Construction (909 | 9.5%), and Educational Services (743 | 7.8%).
Employment Industries by Sex in Caswell County
The Caswell County industries that see more men than women are Mining, Quarrying, & Extraction (100.0%), Utilities (100.0%), and Enterprise Management (100.0%), whereas the industries that tend to have a higher number of women are Health Care & Social Assistance (81.4%), Arts, Entertainment & Recreation (80.3%), and Educational Services (78.2%).
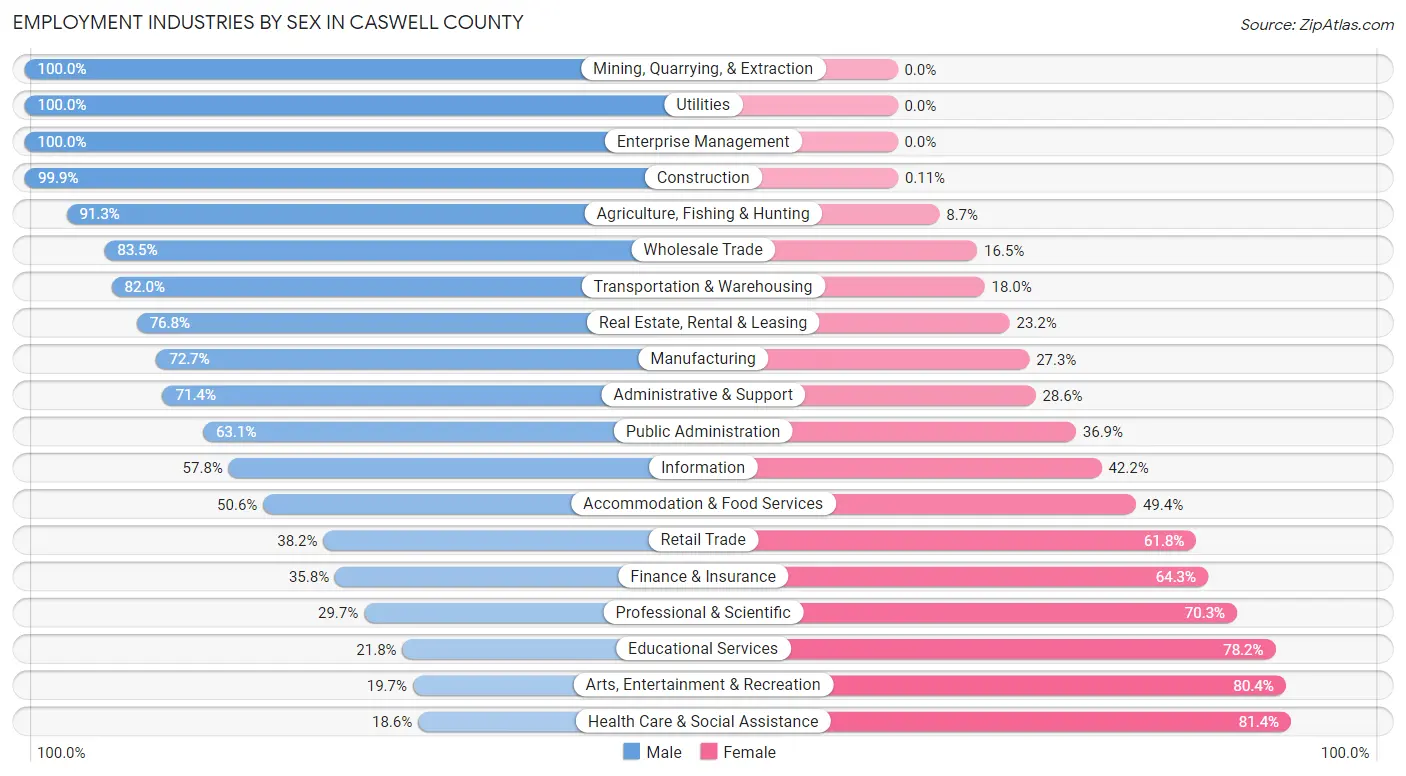
| Industry | Male | Female |
| Agriculture, Fishing & Hunting | 137 (91.3%) | 13 (8.7%) |
| Mining, Quarrying, & Extraction | 27 (100.0%) | 0 (0.0%) |
| Construction | 908 (99.9%) | 1 (0.1%) |
| Manufacturing | 981 (72.7%) | 368 (27.3%) |
| Wholesale Trade | 86 (83.5%) | 17 (16.5%) |
| Retail Trade | 450 (38.2%) | 729 (61.8%) |
| Transportation & Warehousing | 350 (82.0%) | 77 (18.0%) |
| Utilities | 75 (100.0%) | 0 (0.0%) |
| Information | 67 (57.8%) | 49 (42.2%) |
| Finance & Insurance | 143 (35.7%) | 257 (64.2%) |
| Real Estate, Rental & Leasing | 86 (76.8%) | 26 (23.2%) |
| Professional & Scientific | 102 (29.7%) | 241 (70.3%) |
| Enterprise Management | 19 (100.0%) | 0 (0.0%) |
| Administrative & Support | 365 (71.4%) | 146 (28.6%) |
| Educational Services | 162 (21.8%) | 581 (78.2%) |
| Health Care & Social Assistance | 261 (18.6%) | 1,145 (81.4%) |
| Arts, Entertainment & Recreation | 34 (19.7%) | 139 (80.3%) |
| Accommodation & Food Services | 367 (50.6%) | 358 (49.4%) |
| Public Administration | 316 (63.1%) | 185 (36.9%) |
| Total | 5,095 (53.3%) | 4,461 (46.7%) |
Education in Caswell County
School Enrollment in Caswell County
The most common levels of schooling among the 4,354 students in Caswell County are middle school (1,270 | 29.2%), high school (1,013 | 23.3%), and college / undergraduate (799 | 18.3%).
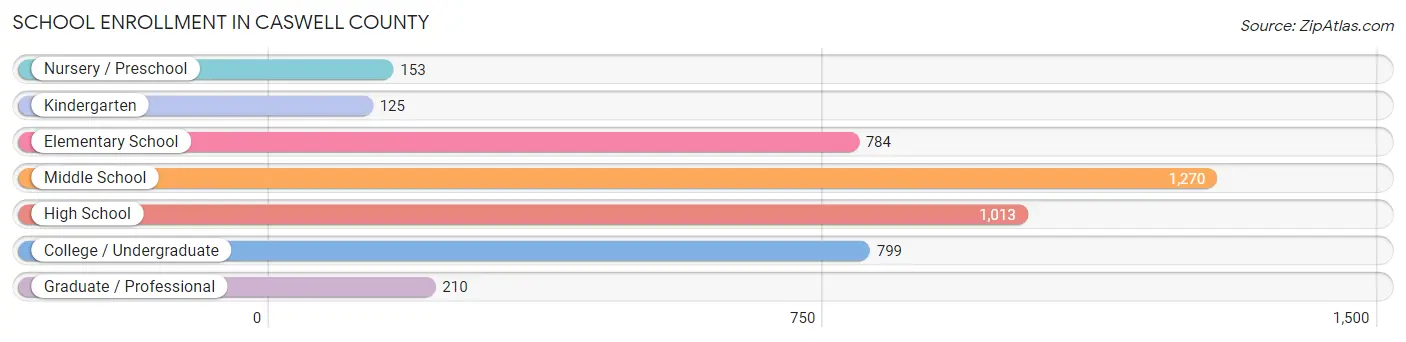
| School Level | # Students | % Students |
| Nursery / Preschool | 153 | 3.5% |
| Kindergarten | 125 | 2.9% |
| Elementary School | 784 | 18.0% |
| Middle School | 1,270 | 29.2% |
| High School | 1,013 | 23.3% |
| College / Undergraduate | 799 | 18.3% |
| Graduate / Professional | 210 | 4.8% |
| Total | 4,354 | 100.0% |
School Enrollment by Age by Funding Source in Caswell County
Out of a total of 4,354 students who are enrolled in schools in Caswell County, 775 (17.8%) attend a private institution, while the remaining 3,579 (82.2%) are enrolled in public schools. The age group of 3 to 4 year olds has the highest likelihood of being enrolled in private schools, with 69 (48.9% in the age bracket) enrolled. Conversely, the age group of 18 to 19 year olds has the lowest likelihood of being enrolled in a private school, with 380 (97.2% in the age bracket) attending a public institution.
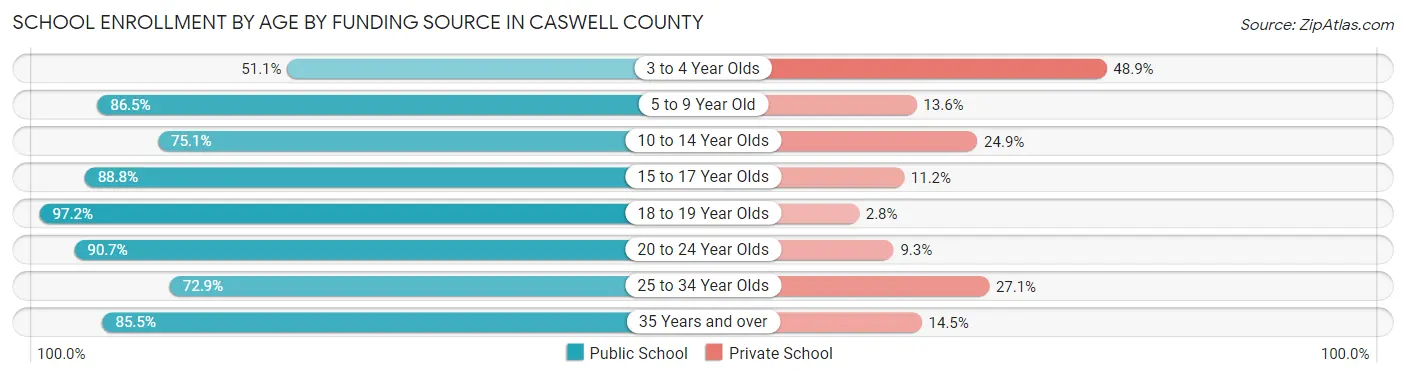
| Age Bracket | Public School | Private School |
| 3 to 4 Year Olds | 72 (51.1%) | 69 (48.9%) |
| 5 to 9 Year Old | 689 (86.5%) | 108 (13.6%) |
| 10 to 14 Year Olds | 1,085 (75.1%) | 359 (24.9%) |
| 15 to 17 Year Olds | 681 (88.8%) | 86 (11.2%) |
| 18 to 19 Year Olds | 380 (97.2%) | 11 (2.8%) |
| 20 to 24 Year Olds | 176 (90.7%) | 18 (9.3%) |
| 25 to 34 Year Olds | 186 (72.9%) | 69 (27.1%) |
| 35 Years and over | 312 (85.5%) | 53 (14.5%) |
| Total | 3,579 (82.2%) | 775 (17.8%) |
Educational Attainment by Field of Study in Caswell County
Education (594 | 22.5%), business (496 | 18.8%), science & technology (342 | 12.9%), bio, nature & agricultural (339 | 12.8%), and computers & mathematics (159 | 6.0%) are the most common fields of study among 2,644 individuals in Caswell County who have obtained a bachelor's degree or higher.
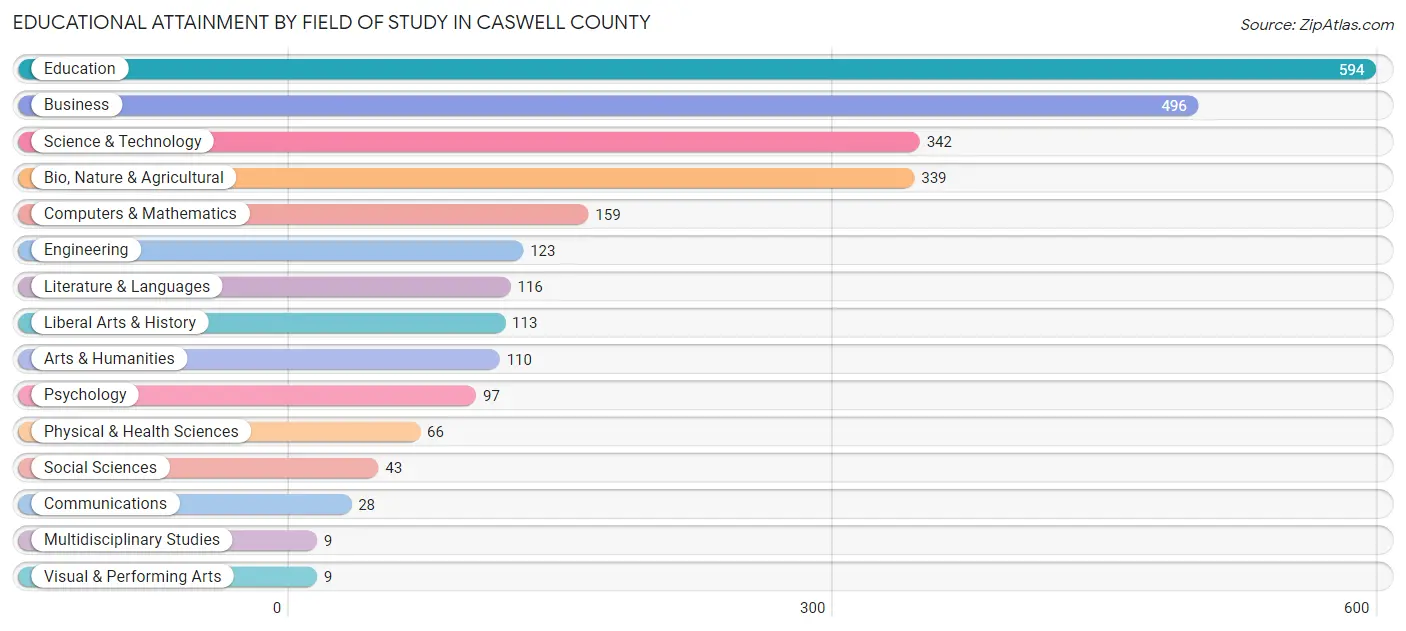
| Field of Study | # Graduates | % Graduates |
| Computers & Mathematics | 159 | 6.0% |
| Bio, Nature & Agricultural | 339 | 12.8% |
| Physical & Health Sciences | 66 | 2.5% |
| Psychology | 97 | 3.7% |
| Social Sciences | 43 | 1.6% |
| Engineering | 123 | 4.6% |
| Multidisciplinary Studies | 9 | 0.3% |
| Science & Technology | 342 | 12.9% |
| Business | 496 | 18.8% |
| Education | 594 | 22.5% |
| Literature & Languages | 116 | 4.4% |
| Liberal Arts & History | 113 | 4.3% |
| Visual & Performing Arts | 9 | 0.3% |
| Communications | 28 | 1.1% |
| Arts & Humanities | 110 | 4.2% |
| Total | 2,644 | 100.0% |
Transportation & Commute in Caswell County
Vehicle Availability by Sex in Caswell County
The most prevalent vehicle ownership categories in Caswell County are males with 3 vehicles (1,345, accounting for 27.8%) and females with 3 vehicles (878, making up 30.8%).
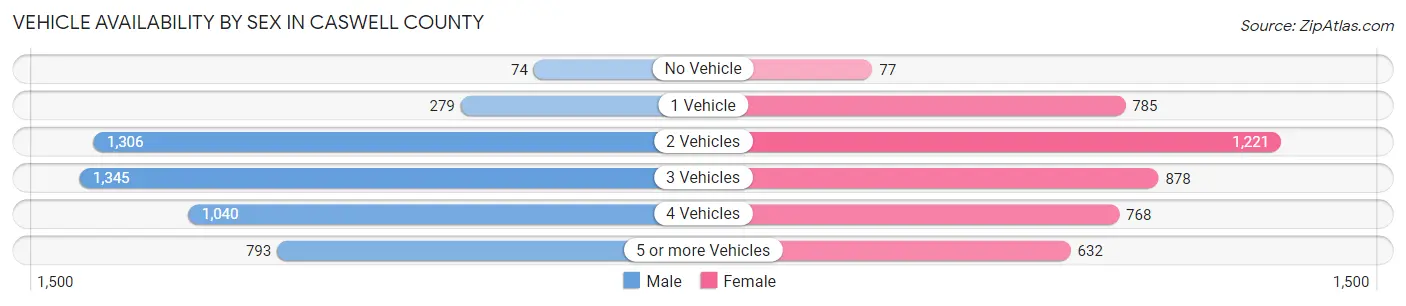
| Vehicles Available | Male | Female |
| No Vehicle | 74 (1.5%) | 77 (1.8%) |
| 1 Vehicle | 279 (5.8%) | 785 (18.0%) |
| 2 Vehicles | 1,306 (27.0%) | 1,221 (28.0%) |
| 3 Vehicles | 1,345 (27.8%) | 878 (20.1%) |
| 4 Vehicles | 1,040 (21.5%) | 768 (17.6%) |
| 5 or more Vehicles | 793 (16.4%) | 632 (14.5%) |
| Total | 4,837 (100.0%) | 4,361 (100.0%) |
Commute Time in Caswell County
The most frequently occuring commute durations in Caswell County are 30 to 34 minutes (1,761 commuters, 20.0%), 20 to 24 minutes (1,247 commuters, 14.2%), and 25 to 29 minutes (1,115 commuters, 12.7%).
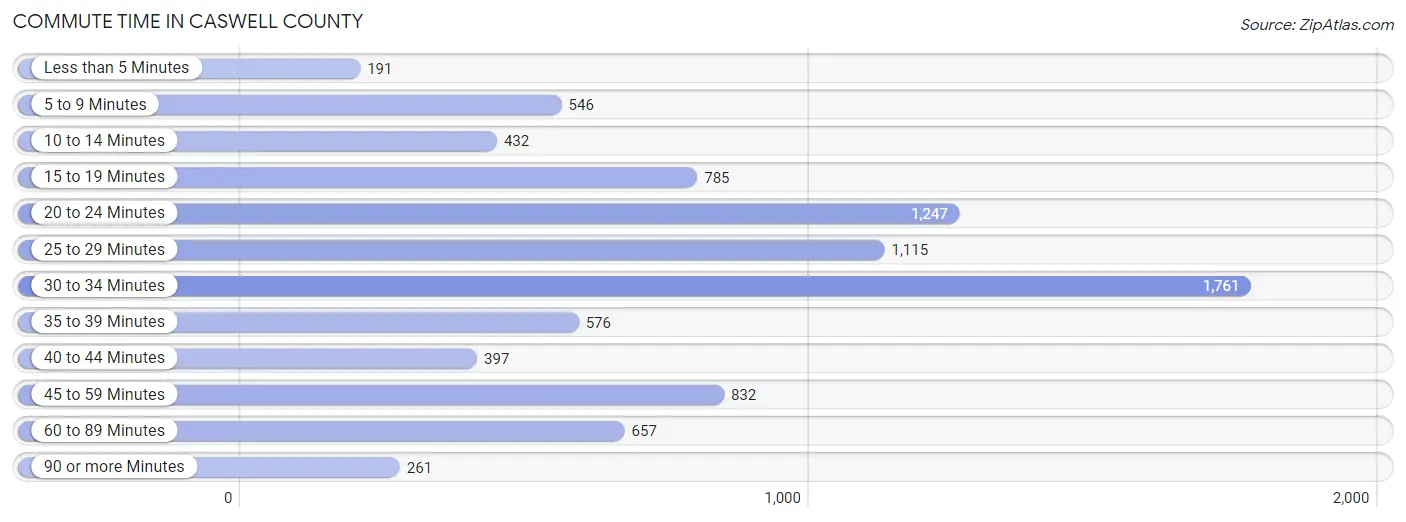
| Commute Time | # Commuters | % Commuters |
| Less than 5 Minutes | 191 | 2.2% |
| 5 to 9 Minutes | 546 | 6.2% |
| 10 to 14 Minutes | 432 | 4.9% |
| 15 to 19 Minutes | 785 | 8.9% |
| 20 to 24 Minutes | 1,247 | 14.2% |
| 25 to 29 Minutes | 1,115 | 12.7% |
| 30 to 34 Minutes | 1,761 | 20.0% |
| 35 to 39 Minutes | 576 | 6.6% |
| 40 to 44 Minutes | 397 | 4.5% |
| 45 to 59 Minutes | 832 | 9.5% |
| 60 to 89 Minutes | 657 | 7.5% |
| 90 or more Minutes | 261 | 3.0% |
Commute Time by Sex in Caswell County
The most common commute times in Caswell County are 30 to 34 minutes (901 commuters, 19.6%) for males and 30 to 34 minutes (860 commuters, 20.5%) for females.
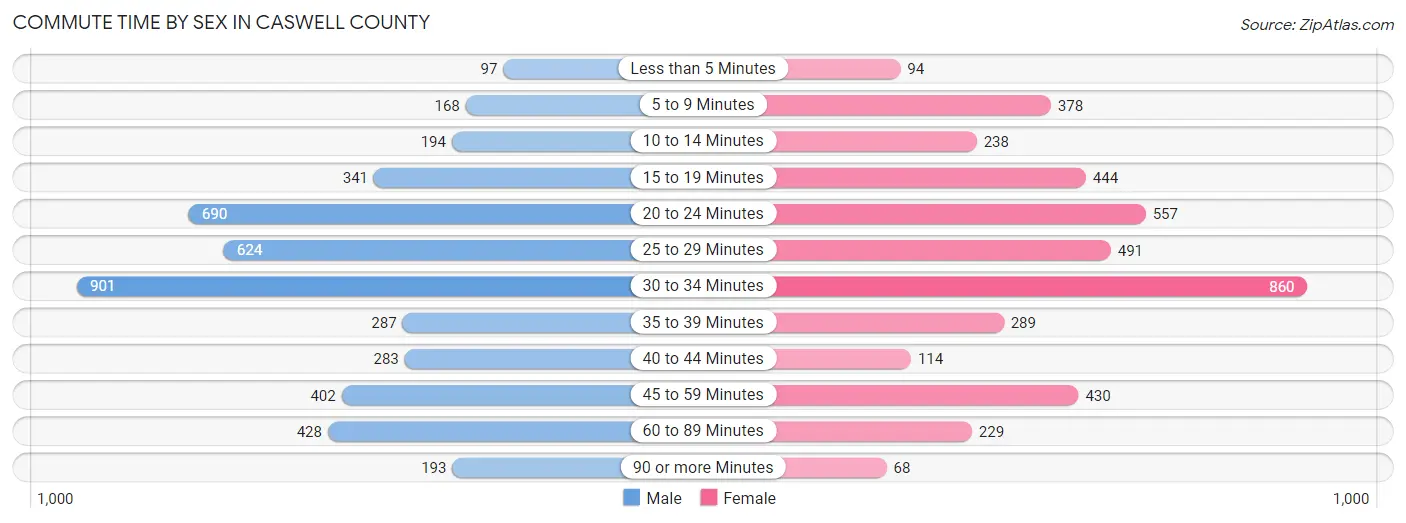
| Commute Time | Male | Female |
| Less than 5 Minutes | 97 (2.1%) | 94 (2.2%) |
| 5 to 9 Minutes | 168 (3.6%) | 378 (9.0%) |
| 10 to 14 Minutes | 194 (4.2%) | 238 (5.7%) |
| 15 to 19 Minutes | 341 (7.4%) | 444 (10.6%) |
| 20 to 24 Minutes | 690 (15.0%) | 557 (13.3%) |
| 25 to 29 Minutes | 624 (13.5%) | 491 (11.7%) |
| 30 to 34 Minutes | 901 (19.6%) | 860 (20.5%) |
| 35 to 39 Minutes | 287 (6.2%) | 289 (6.9%) |
| 40 to 44 Minutes | 283 (6.1%) | 114 (2.7%) |
| 45 to 59 Minutes | 402 (8.7%) | 430 (10.3%) |
| 60 to 89 Minutes | 428 (9.3%) | 229 (5.5%) |
| 90 or more Minutes | 193 (4.2%) | 68 (1.6%) |
Time of Departure to Work by Sex in Caswell County
The most frequent times of departure to work in Caswell County are 6:00 AM to 6:29 AM (777, 16.9%) for males and 7:30 AM to 7:59 AM (759, 18.1%) for females.
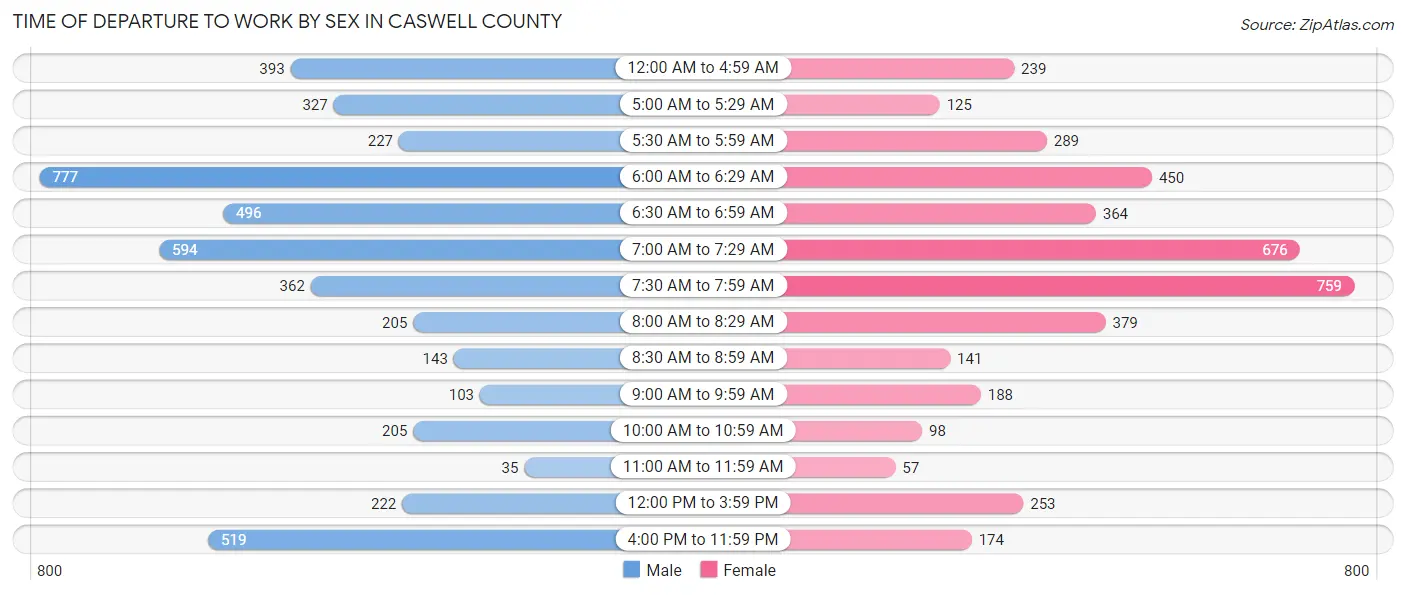
| Time of Departure | Male | Female |
| 12:00 AM to 4:59 AM | 393 (8.5%) | 239 (5.7%) |
| 5:00 AM to 5:29 AM | 327 (7.1%) | 125 (3.0%) |
| 5:30 AM to 5:59 AM | 227 (4.9%) | 289 (6.9%) |
| 6:00 AM to 6:29 AM | 777 (16.9%) | 450 (10.7%) |
| 6:30 AM to 6:59 AM | 496 (10.8%) | 364 (8.7%) |
| 7:00 AM to 7:29 AM | 594 (12.9%) | 676 (16.1%) |
| 7:30 AM to 7:59 AM | 362 (7.9%) | 759 (18.1%) |
| 8:00 AM to 8:29 AM | 205 (4.4%) | 379 (9.0%) |
| 8:30 AM to 8:59 AM | 143 (3.1%) | 141 (3.4%) |
| 9:00 AM to 9:59 AM | 103 (2.2%) | 188 (4.5%) |
| 10:00 AM to 10:59 AM | 205 (4.4%) | 98 (2.3%) |
| 11:00 AM to 11:59 AM | 35 (0.8%) | 57 (1.4%) |
| 12:00 PM to 3:59 PM | 222 (4.8%) | 253 (6.0%) |
| 4:00 PM to 11:59 PM | 519 (11.3%) | 174 (4.2%) |
| Total | 4,608 (100.0%) | 4,192 (100.0%) |
Housing Occupancy in Caswell County
Occupancy by Ownership in Caswell County
Of the total 8,507 dwellings in Caswell County, owner-occupied units account for 6,426 (75.5%), while renter-occupied units make up 2,081 (24.5%).
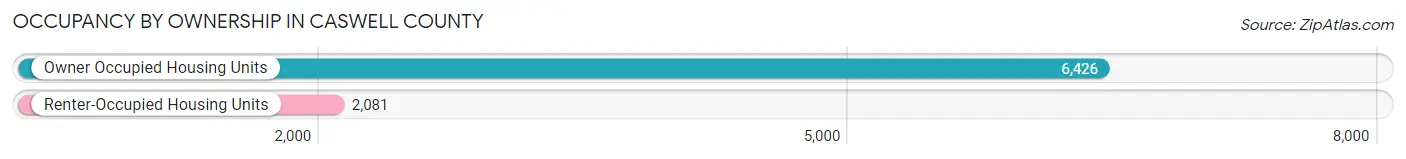
| Occupancy | # Housing Units | % Housing Units |
| Owner Occupied Housing Units | 6,426 | 75.5% |
| Renter-Occupied Housing Units | 2,081 | 24.5% |
| Total Occupied Housing Units | 8,507 | 100.0% |
Occupancy by Household Size in Caswell County
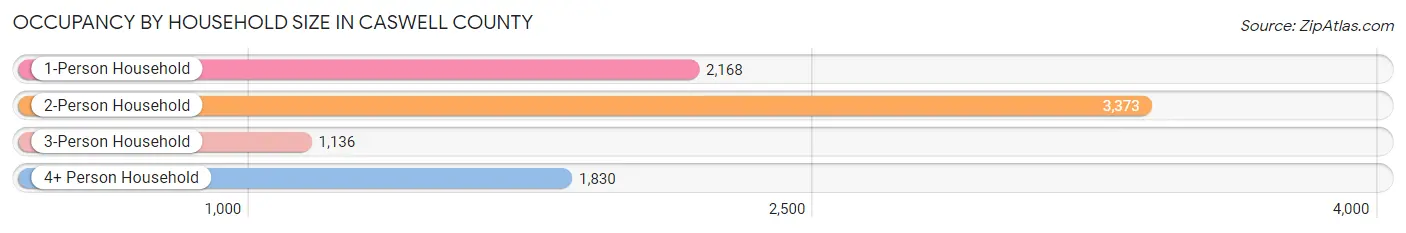
| Household Size | # Housing Units | % Housing Units |
| 1-Person Household | 2,168 | 25.5% |
| 2-Person Household | 3,373 | 39.7% |
| 3-Person Household | 1,136 | 13.4% |
| 4+ Person Household | 1,830 | 21.5% |
| Total Housing Units | 8,507 | 100.0% |
Occupancy by Ownership by Household Size in Caswell County
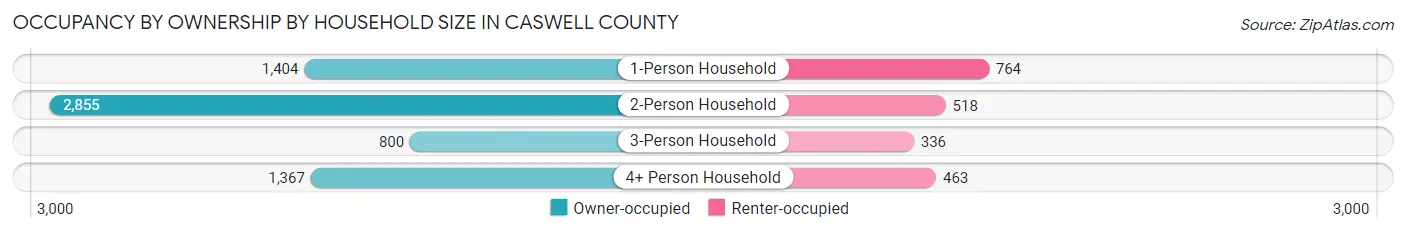
| Household Size | Owner-occupied | Renter-occupied |
| 1-Person Household | 1,404 (64.8%) | 764 (35.2%) |
| 2-Person Household | 2,855 (84.6%) | 518 (15.4%) |
| 3-Person Household | 800 (70.4%) | 336 (29.6%) |
| 4+ Person Household | 1,367 (74.7%) | 463 (25.3%) |
| Total Housing Units | 6,426 (75.5%) | 2,081 (24.5%) |
Occupancy by Educational Attainment in Caswell County
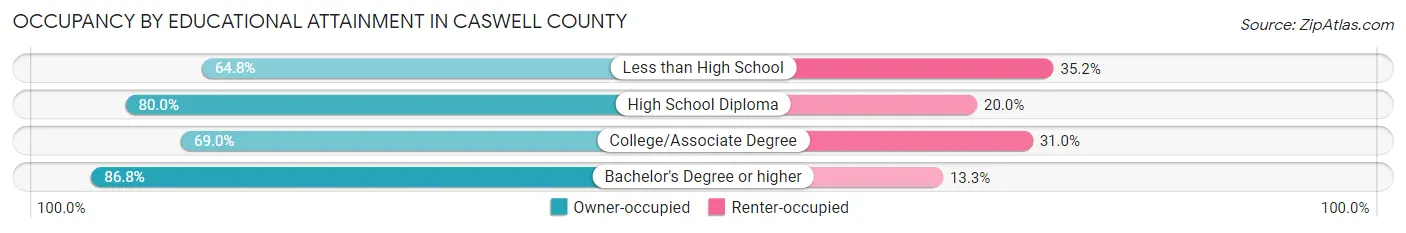
| Household Size | Owner-occupied | Renter-occupied |
| Less than High School | 741 (64.8%) | 402 (35.2%) |
| High School Diploma | 2,326 (80.0%) | 582 (20.0%) |
| College/Associate Degree | 1,964 (69.0%) | 884 (31.0%) |
| Bachelor's Degree or higher | 1,395 (86.8%) | 213 (13.3%) |
Occupancy by Age of Householder in Caswell County
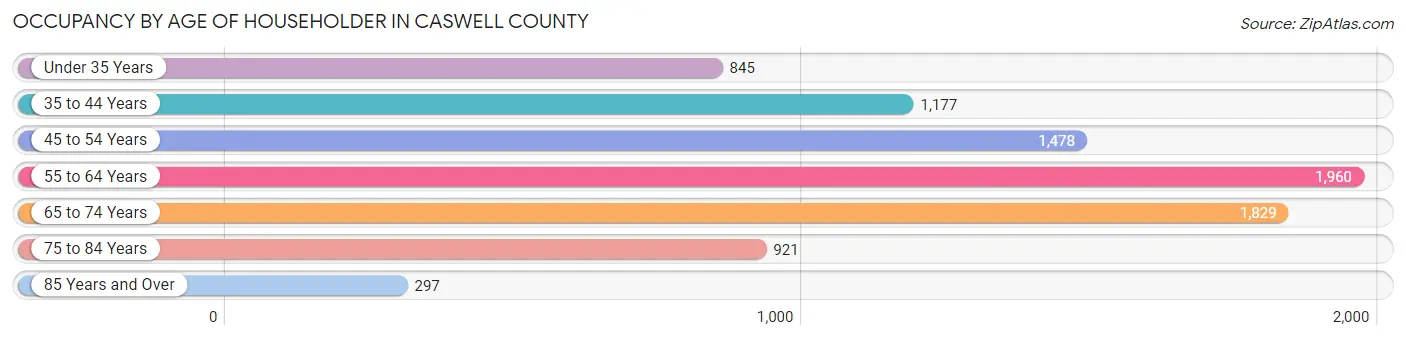
| Age Bracket | # Households | % Households |
| Under 35 Years | 845 | 9.9% |
| 35 to 44 Years | 1,177 | 13.8% |
| 45 to 54 Years | 1,478 | 17.4% |
| 55 to 64 Years | 1,960 | 23.0% |
| 65 to 74 Years | 1,829 | 21.5% |
| 75 to 84 Years | 921 | 10.8% |
| 85 Years and Over | 297 | 3.5% |
| Total | 8,507 | 100.0% |
Housing Finances in Caswell County
Median Income by Occupancy in Caswell County
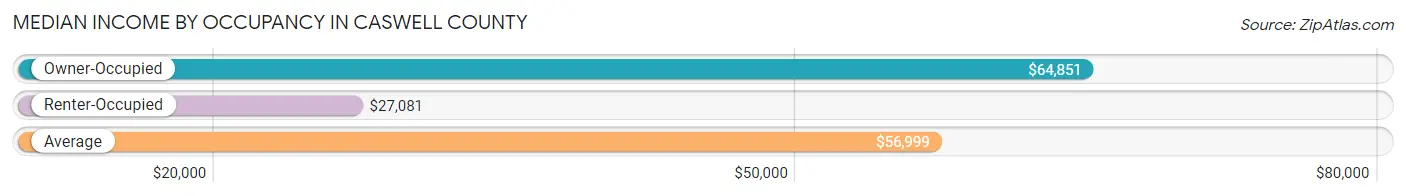
| Occupancy Type | # Households | Median Income |
| Owner-Occupied | 6,426 (75.5%) | $64,851 |
| Renter-Occupied | 2,081 (24.5%) | $27,081 |
| Average | 8,507 (100.0%) | $56,999 |
Occupancy by Householder Income Bracket in Caswell County
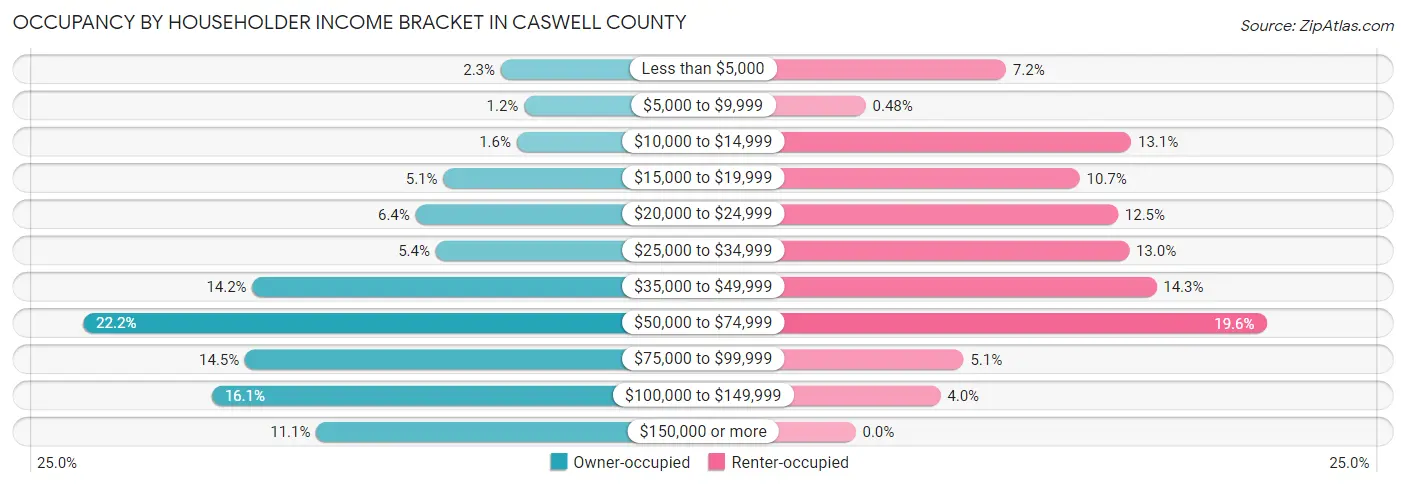
| Income Bracket | Owner-occupied | Renter-occupied |
| Less than $5,000 | 149 (2.3%) | 149 (7.2%) |
| $5,000 to $9,999 | 78 (1.2%) | 10 (0.5%) |
| $10,000 to $14,999 | 100 (1.6%) | 273 (13.1%) |
| $15,000 to $19,999 | 325 (5.1%) | 222 (10.7%) |
| $20,000 to $24,999 | 410 (6.4%) | 260 (12.5%) |
| $25,000 to $34,999 | 348 (5.4%) | 271 (13.0%) |
| $35,000 to $49,999 | 909 (14.1%) | 298 (14.3%) |
| $50,000 to $74,999 | 1,427 (22.2%) | 407 (19.6%) |
| $75,000 to $99,999 | 932 (14.5%) | 107 (5.1%) |
| $100,000 to $149,999 | 1,034 (16.1%) | 84 (4.0%) |
| $150,000 or more | 714 (11.1%) | 0 (0.0%) |
| Total | 6,426 (100.0%) | 2,081 (100.0%) |
Monthly Housing Cost Tiers in Caswell County
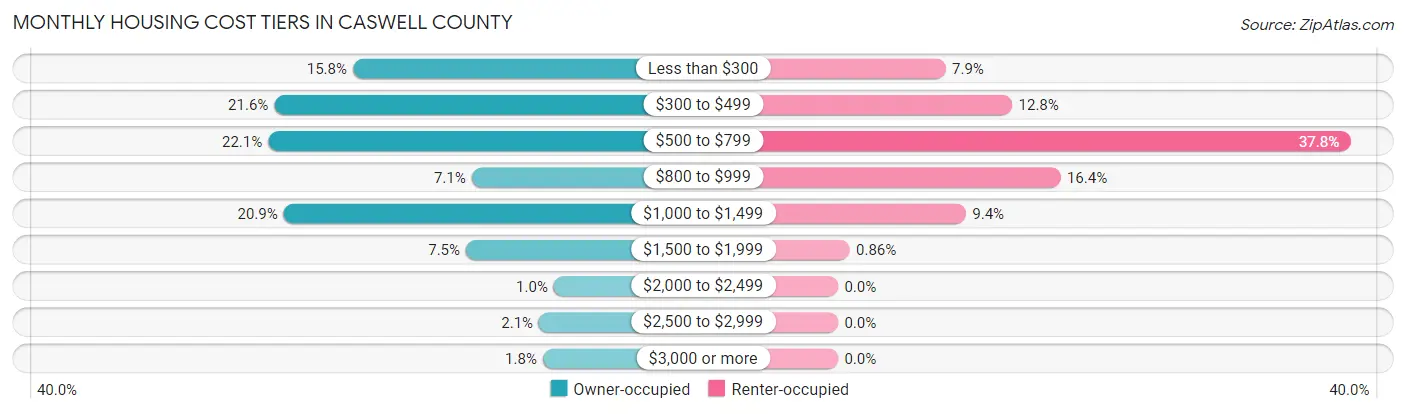
| Monthly Cost | Owner-occupied | Renter-occupied |
| Less than $300 | 1,017 (15.8%) | 165 (7.9%) |
| $300 to $499 | 1,389 (21.6%) | 267 (12.8%) |
| $500 to $799 | 1,418 (22.1%) | 787 (37.8%) |
| $800 to $999 | 455 (7.1%) | 341 (16.4%) |
| $1,000 to $1,499 | 1,345 (20.9%) | 196 (9.4%) |
| $1,500 to $1,999 | 482 (7.5%) | 18 (0.9%) |
| $2,000 to $2,499 | 66 (1.0%) | 0 (0.0%) |
| $2,500 to $2,999 | 136 (2.1%) | 0 (0.0%) |
| $3,000 or more | 118 (1.8%) | 0 (0.0%) |
| Total | 6,426 (100.0%) | 2,081 (100.0%) |
Physical Housing Characteristics in Caswell County
Housing Structures in Caswell County
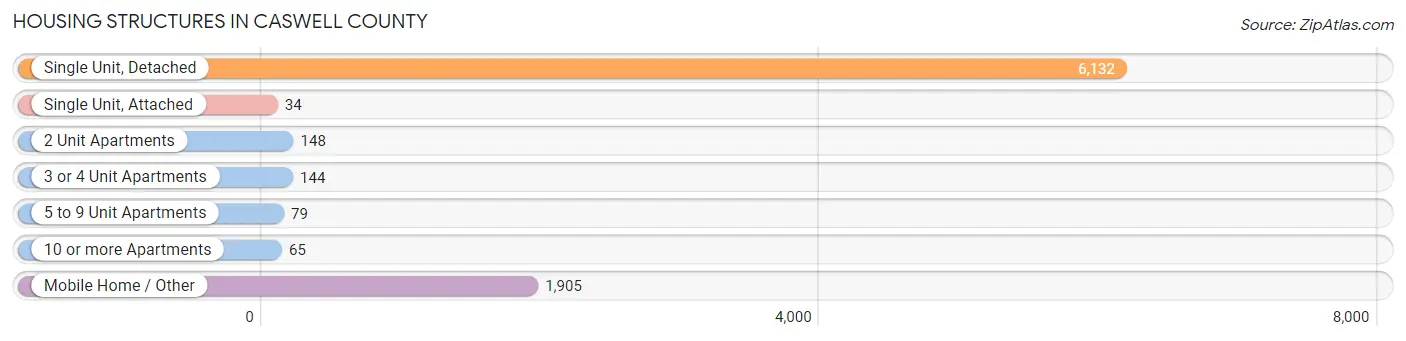
| Structure Type | # Housing Units | % Housing Units |
| Single Unit, Detached | 6,132 | 72.1% |
| Single Unit, Attached | 34 | 0.4% |
| 2 Unit Apartments | 148 | 1.7% |
| 3 or 4 Unit Apartments | 144 | 1.7% |
| 5 to 9 Unit Apartments | 79 | 0.9% |
| 10 or more Apartments | 65 | 0.8% |
| Mobile Home / Other | 1,905 | 22.4% |
| Total | 8,507 | 100.0% |
Housing Structures by Occupancy in Caswell County
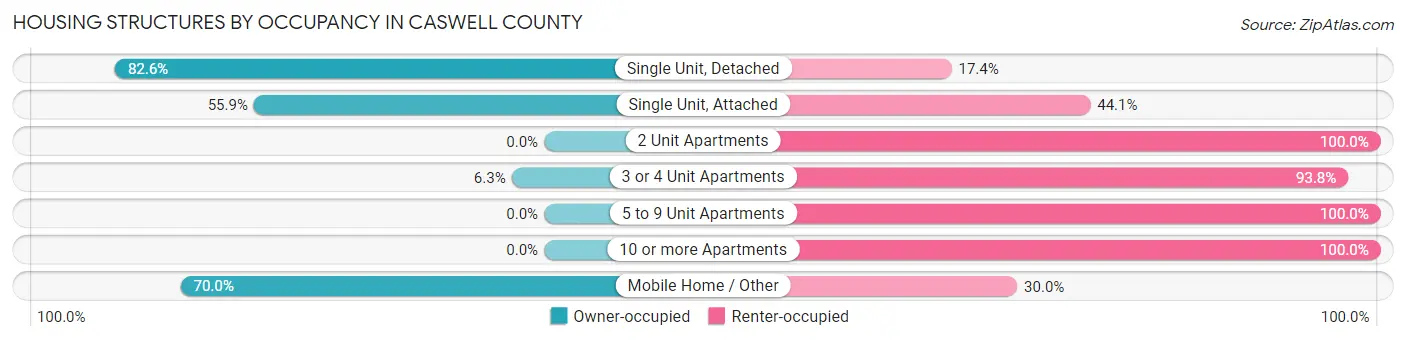
| Structure Type | Owner-occupied | Renter-occupied |
| Single Unit, Detached | 5,065 (82.6%) | 1,067 (17.4%) |
| Single Unit, Attached | 19 (55.9%) | 15 (44.1%) |
| 2 Unit Apartments | 0 (0.0%) | 148 (100.0%) |
| 3 or 4 Unit Apartments | 9 (6.2%) | 135 (93.8%) |
| 5 to 9 Unit Apartments | 0 (0.0%) | 79 (100.0%) |
| 10 or more Apartments | 0 (0.0%) | 65 (100.0%) |
| Mobile Home / Other | 1,333 (70.0%) | 572 (30.0%) |
| Total | 6,426 (75.5%) | 2,081 (24.5%) |
Housing Structures by Number of Rooms in Caswell County
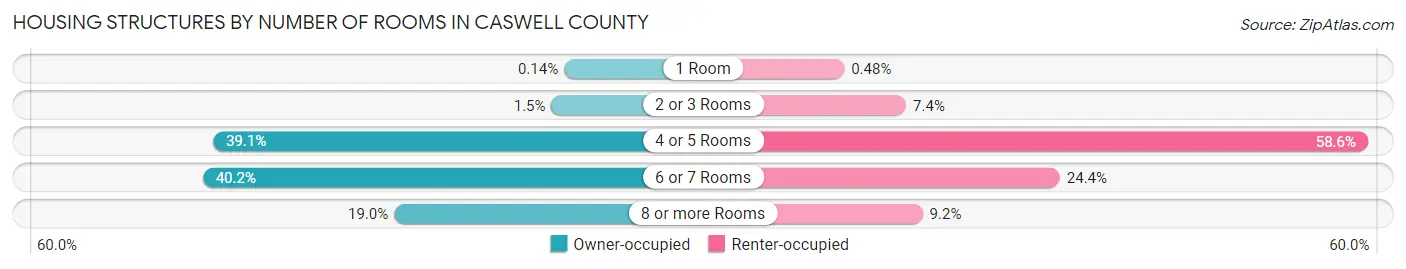
| Number of Rooms | Owner-occupied | Renter-occupied |
| 1 Room | 9 (0.1%) | 10 (0.5%) |
| 2 or 3 Rooms | 99 (1.5%) | 153 (7.3%) |
| 4 or 5 Rooms | 2,512 (39.1%) | 1,219 (58.6%) |
| 6 or 7 Rooms | 2,585 (40.2%) | 508 (24.4%) |
| 8 or more Rooms | 1,221 (19.0%) | 191 (9.2%) |
| Total | 6,426 (100.0%) | 2,081 (100.0%) |
Housing Structure by Heating Type in Caswell County
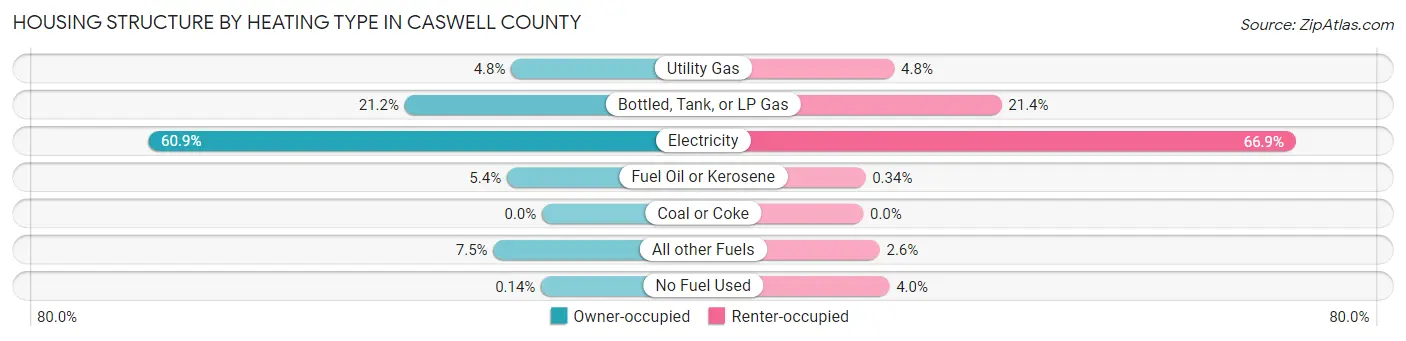
| Heating Type | Owner-occupied | Renter-occupied |
| Utility Gas | 306 (4.8%) | 100 (4.8%) |
| Bottled, Tank, or LP Gas | 1,364 (21.2%) | 445 (21.4%) |
| Electricity | 3,914 (60.9%) | 1,392 (66.9%) |
| Fuel Oil or Kerosene | 349 (5.4%) | 7 (0.3%) |
| Coal or Coke | 0 (0.0%) | 0 (0.0%) |
| All other Fuels | 484 (7.5%) | 53 (2.5%) |
| No Fuel Used | 9 (0.1%) | 84 (4.0%) |
| Total | 6,426 (100.0%) | 2,081 (100.0%) |
Household Vehicle Usage in Caswell County
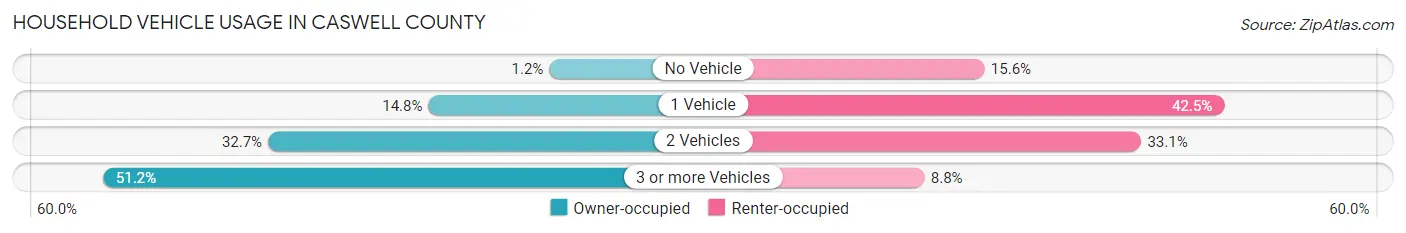
| Vehicles per Household | Owner-occupied | Renter-occupied |
| No Vehicle | 80 (1.2%) | 324 (15.6%) |
| 1 Vehicle | 950 (14.8%) | 884 (42.5%) |
| 2 Vehicles | 2,104 (32.7%) | 689 (33.1%) |
| 3 or more Vehicles | 3,292 (51.2%) | 184 (8.8%) |
| Total | 6,426 (100.0%) | 2,081 (100.0%) |
Real Estate & Mortgages in Caswell County
Real Estate and Mortgage Overview in Caswell County
| Characteristic | Without Mortgage | With Mortgage |
| Housing Units | 3,335 | 3,091 |
| Median Property Value | $123,900 | $152,500 |
| Median Household Income | $52,853 | $472 |
| Monthly Housing Costs | $384 | $108 |
| Real Estate Taxes | $931 | $48 |
Property Value by Mortgage Status in Caswell County
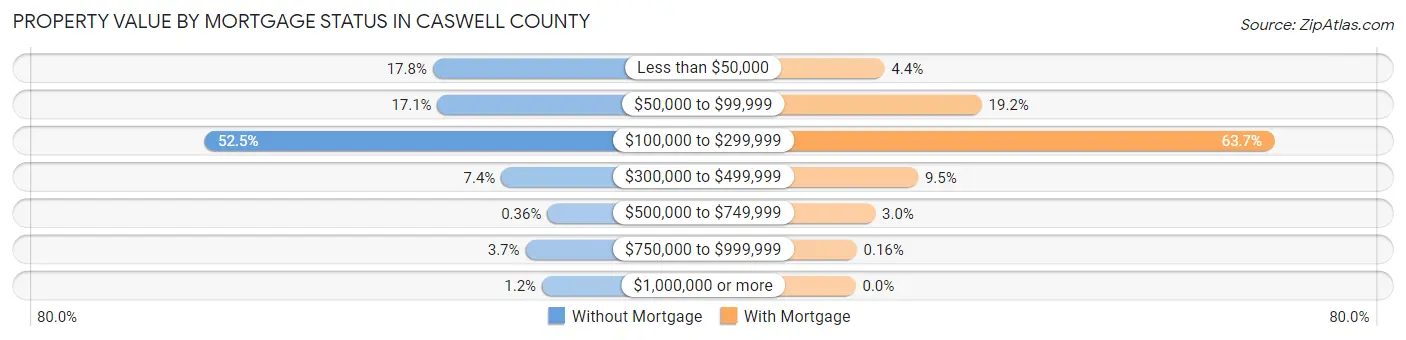
| Property Value | Without Mortgage | With Mortgage |
| Less than $50,000 | 594 (17.8%) | 136 (4.4%) |
| $50,000 to $99,999 | 570 (17.1%) | 594 (19.2%) |
| $100,000 to $299,999 | 1,751 (52.5%) | 1,970 (63.7%) |
| $300,000 to $499,999 | 246 (7.4%) | 294 (9.5%) |
| $500,000 to $749,999 | 12 (0.4%) | 92 (3.0%) |
| $750,000 to $999,999 | 123 (3.7%) | 5 (0.2%) |
| $1,000,000 or more | 39 (1.2%) | 0 (0.0%) |
| Total | 3,335 (100.0%) | 3,091 (100.0%) |
Household Income by Mortgage Status in Caswell County
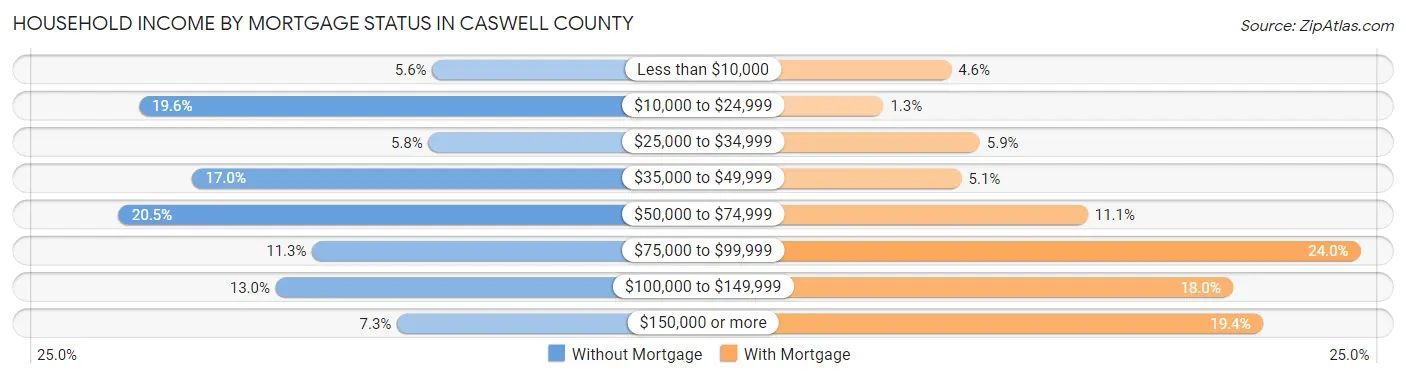
| Household Income | Without Mortgage | With Mortgage |
| Less than $10,000 | 186 (5.6%) | 141 (4.6%) |
| $10,000 to $24,999 | 652 (19.6%) | 41 (1.3%) |
| $25,000 to $34,999 | 192 (5.8%) | 183 (5.9%) |
| $35,000 to $49,999 | 567 (17.0%) | 156 (5.1%) |
| $50,000 to $74,999 | 684 (20.5%) | 342 (11.1%) |
| $75,000 to $99,999 | 377 (11.3%) | 743 (24.0%) |
| $100,000 to $149,999 | 435 (13.0%) | 555 (18.0%) |
| $150,000 or more | 242 (7.3%) | 599 (19.4%) |
| Total | 3,335 (100.0%) | 3,091 (100.0%) |
Property Value to Household Income Ratio in Caswell County
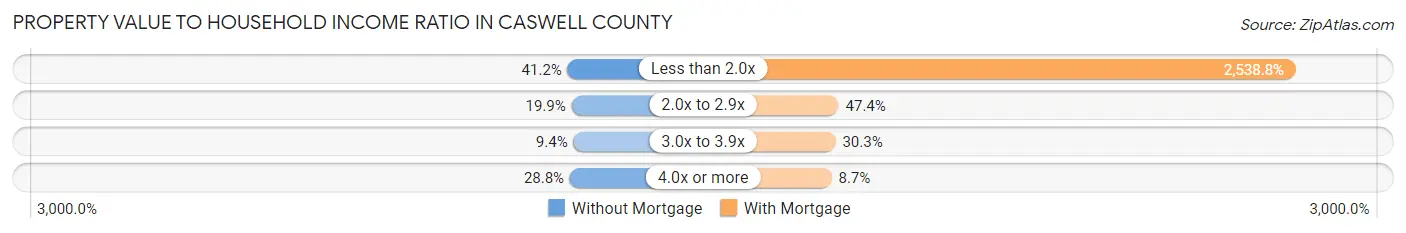
| Value-to-Income Ratio | Without Mortgage | With Mortgage |
| Less than 2.0x | 1,375 (41.2%) | 78,475 (2,538.8%) |
| 2.0x to 2.9x | 663 (19.9%) | 1,465 (47.4%) |
| 3.0x to 3.9x | 313 (9.4%) | 936 (30.3%) |
| 4.0x or more | 960 (28.8%) | 268 (8.7%) |
| Total | 3,335 (100.0%) | 3,091 (100.0%) |
Real Estate Taxes by Mortgage Status in Caswell County
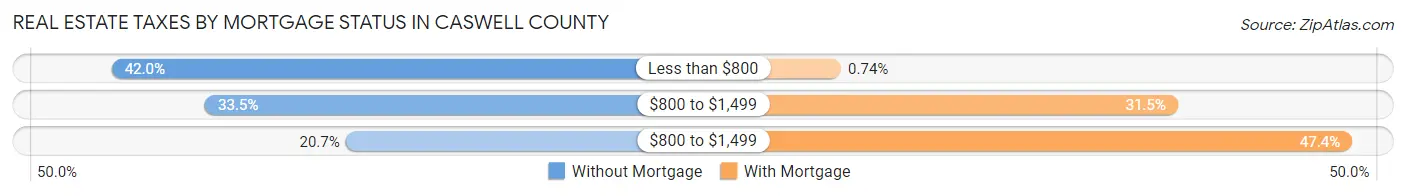
| Property Taxes | Without Mortgage | With Mortgage |
| Less than $800 | 1,402 (42.0%) | 23 (0.7%) |
| $800 to $1,499 | 1,118 (33.5%) | 973 (31.5%) |
| $800 to $1,499 | 690 (20.7%) | 1,465 (47.4%) |
| Total | 3,335 (100.0%) | 3,091 (100.0%) |
Health & Disability in Caswell County
Health Insurance Coverage by Age in Caswell County
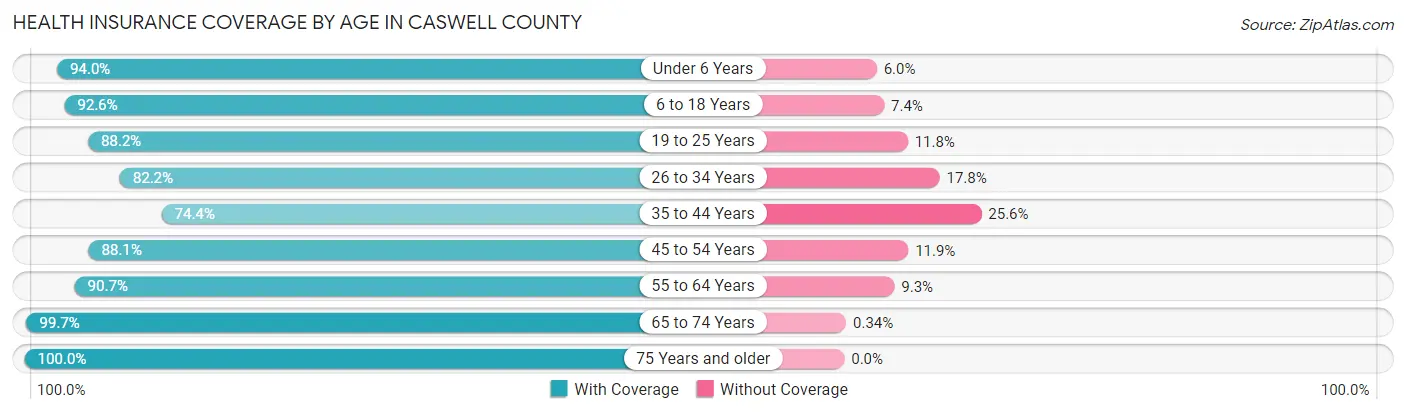
| Age Bracket | With Coverage | Without Coverage |
| Under 6 Years | 1,104 (94.0%) | 71 (6.0%) |
| 6 to 18 Years | 2,906 (92.6%) | 233 (7.4%) |
| 19 to 25 Years | 1,656 (88.2%) | 222 (11.8%) |
| 26 to 34 Years | 1,467 (82.2%) | 317 (17.8%) |
| 35 to 44 Years | 1,774 (74.4%) | 609 (25.6%) |
| 45 to 54 Years | 2,622 (88.1%) | 355 (11.9%) |
| 55 to 64 Years | 3,088 (90.7%) | 318 (9.3%) |
| 65 to 74 Years | 2,972 (99.7%) | 10 (0.3%) |
| 75 Years and older | 1,883 (100.0%) | 0 (0.0%) |
| Total | 19,472 (90.1%) | 2,135 (9.9%) |
Health Insurance Coverage by Citizenship Status in Caswell County
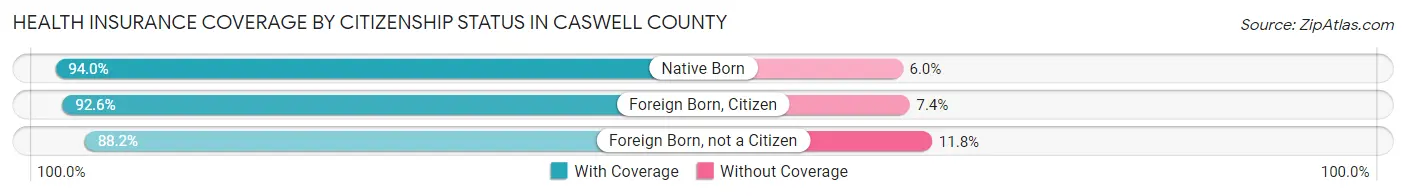
| Citizenship Status | With Coverage | Without Coverage |
| Native Born | 1,104 (94.0%) | 71 (6.0%) |
| Foreign Born, Citizen | 2,906 (92.6%) | 233 (7.4%) |
| Foreign Born, not a Citizen | 1,656 (88.2%) | 222 (11.8%) |
Health Insurance Coverage by Household Income in Caswell County
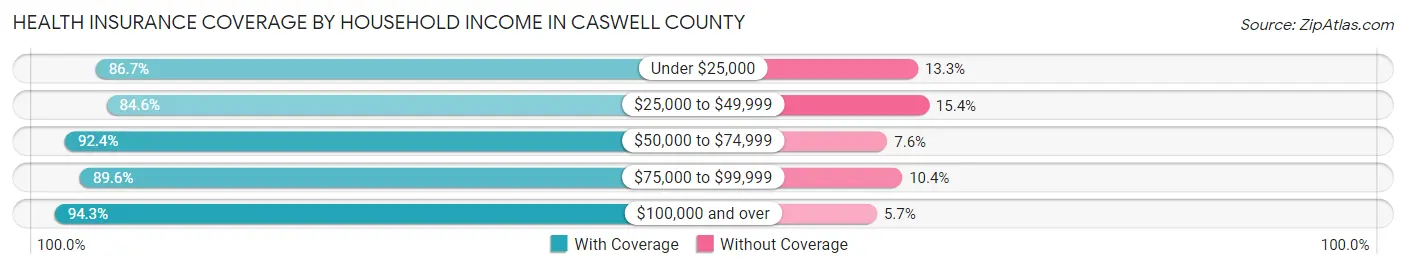
| Household Income | With Coverage | Without Coverage |
| Under $25,000 | 3,296 (86.7%) | 507 (13.3%) |
| $25,000 to $49,999 | 3,234 (84.6%) | 588 (15.4%) |
| $50,000 to $74,999 | 3,689 (92.4%) | 303 (7.6%) |
| $75,000 to $99,999 | 3,039 (89.6%) | 352 (10.4%) |
| $100,000 and over | 6,065 (94.3%) | 364 (5.7%) |
Public vs Private Health Insurance Coverage by Age in Caswell County
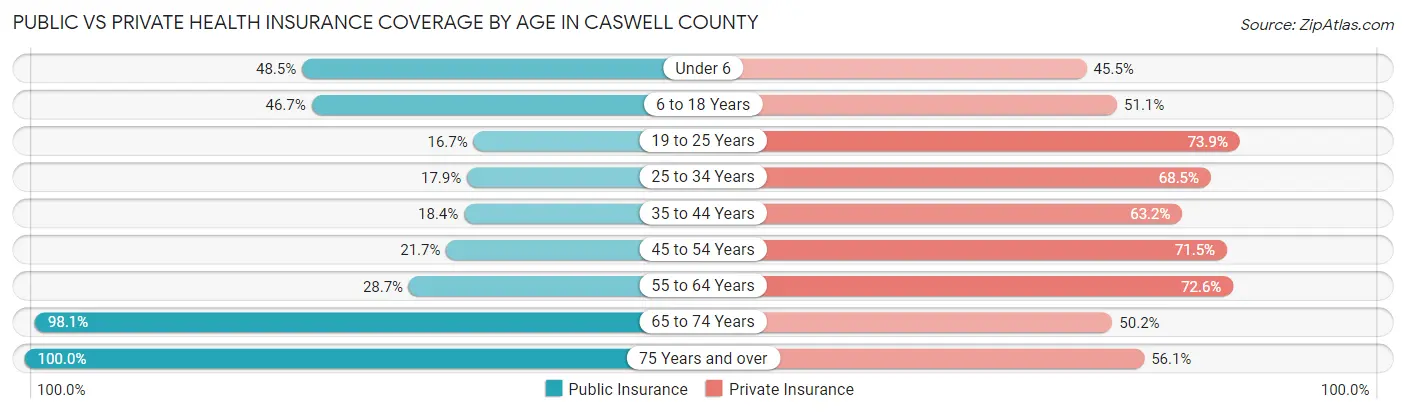
| Age Bracket | Public Insurance | Private Insurance |
| Under 6 | 570 (48.5%) | 534 (45.5%) |
| 6 to 18 Years | 1,467 (46.7%) | 1,604 (51.1%) |
| 19 to 25 Years | 313 (16.7%) | 1,387 (73.9%) |
| 25 to 34 Years | 319 (17.9%) | 1,222 (68.5%) |
| 35 to 44 Years | 439 (18.4%) | 1,506 (63.2%) |
| 45 to 54 Years | 647 (21.7%) | 2,128 (71.5%) |
| 55 to 64 Years | 976 (28.7%) | 2,474 (72.6%) |
| 65 to 74 Years | 2,925 (98.1%) | 1,498 (50.2%) |
| 75 Years and over | 1,883 (100.0%) | 1,057 (56.1%) |
| Total | 9,539 (44.2%) | 13,410 (62.1%) |
Disability Status by Sex by Age in Caswell County
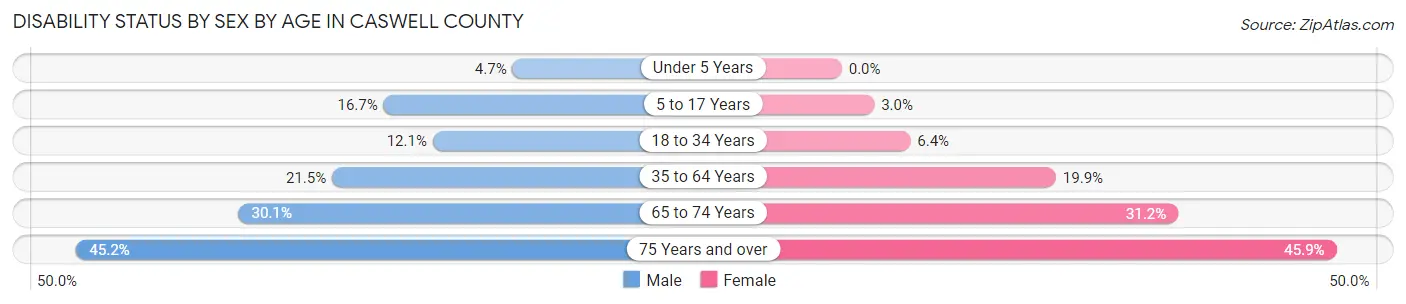
| Age Bracket | Male | Female |
| Under 5 Years | 25 (4.7%) | 0 (0.0%) |
| 5 to 17 Years | 268 (16.7%) | 46 (3.0%) |
| 18 to 34 Years | 249 (12.1%) | 115 (6.4%) |
| 35 to 64 Years | 966 (21.5%) | 848 (19.9%) |
| 65 to 74 Years | 416 (30.1%) | 500 (31.2%) |
| 75 Years and over | 338 (45.2%) | 521 (45.9%) |
Disability Class by Sex by Age in Caswell County
Disability Class: Hearing Difficulty
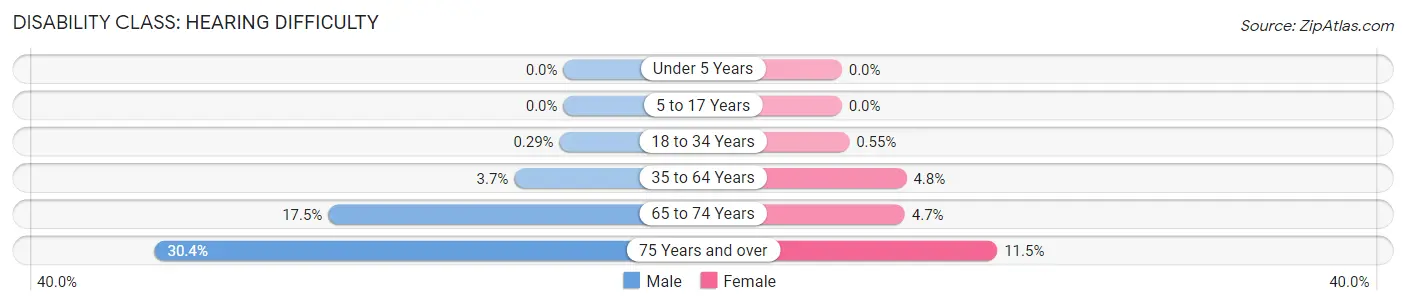
| Age Bracket | Male | Female |
| Under 5 Years | 0 (0.0%) | 0 (0.0%) |
| 5 to 17 Years | 0 (0.0%) | 0 (0.0%) |
| 18 to 34 Years | 6 (0.3%) | 10 (0.5%) |
| 35 to 64 Years | 164 (3.6%) | 205 (4.8%) |
| 65 to 74 Years | 241 (17.5%) | 75 (4.7%) |
| 75 Years and over | 227 (30.3%) | 131 (11.5%) |
Disability Class: Vision Difficulty
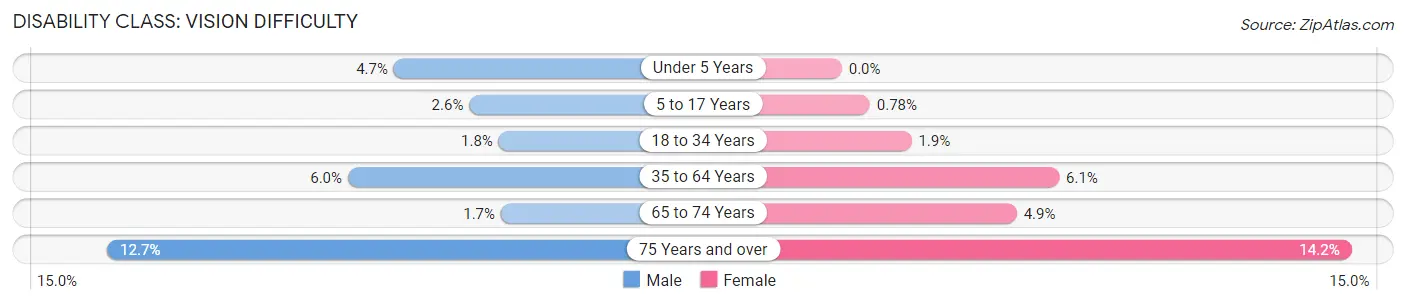
| Age Bracket | Male | Female |
| Under 5 Years | 25 (4.7%) | 0 (0.0%) |
| 5 to 17 Years | 42 (2.6%) | 12 (0.8%) |
| 18 to 34 Years | 37 (1.8%) | 35 (1.9%) |
| 35 to 64 Years | 270 (6.0%) | 258 (6.0%) |
| 65 to 74 Years | 24 (1.7%) | 78 (4.9%) |
| 75 Years and over | 95 (12.7%) | 161 (14.2%) |
Disability Class: Cognitive Difficulty
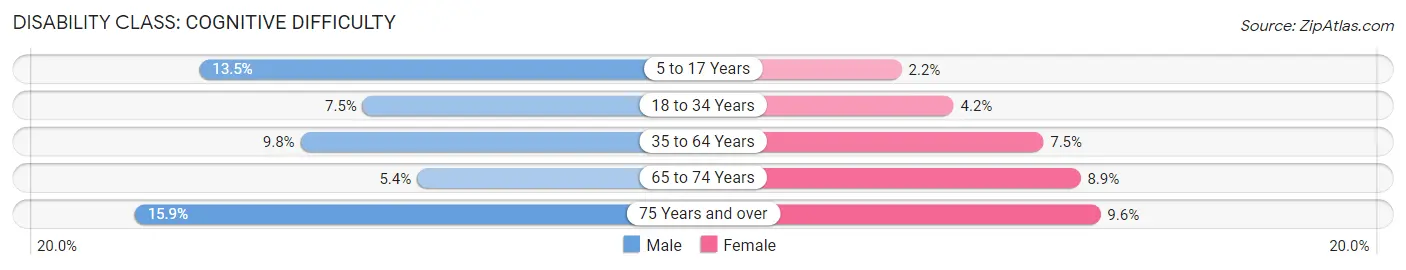
| Age Bracket | Male | Female |
| 5 to 17 Years | 217 (13.5%) | 34 (2.2%) |
| 18 to 34 Years | 153 (7.4%) | 75 (4.2%) |
| 35 to 64 Years | 439 (9.8%) | 319 (7.5%) |
| 65 to 74 Years | 75 (5.4%) | 142 (8.9%) |
| 75 Years and over | 119 (15.9%) | 109 (9.6%) |
Disability Class: Ambulatory Difficulty
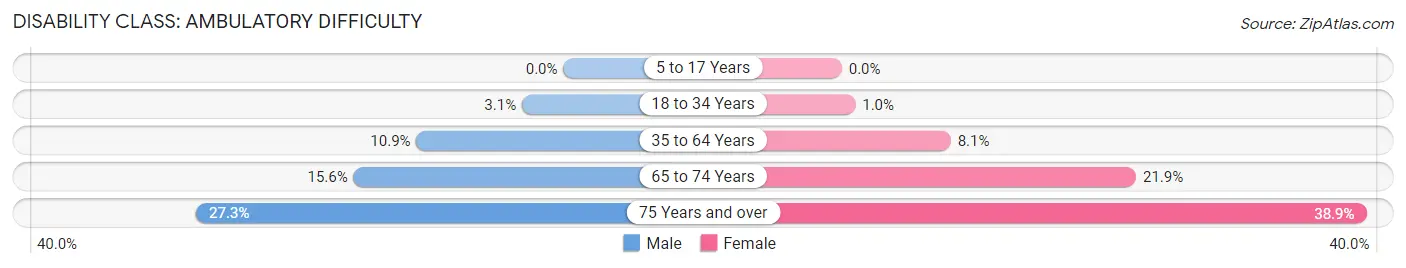
| Age Bracket | Male | Female |
| 5 to 17 Years | 0 (0.0%) | 0 (0.0%) |
| 18 to 34 Years | 63 (3.1%) | 18 (1.0%) |
| 35 to 64 Years | 491 (10.9%) | 345 (8.1%) |
| 65 to 74 Years | 215 (15.6%) | 350 (21.8%) |
| 75 Years and over | 204 (27.3%) | 442 (38.9%) |
Disability Class: Self-Care Difficulty
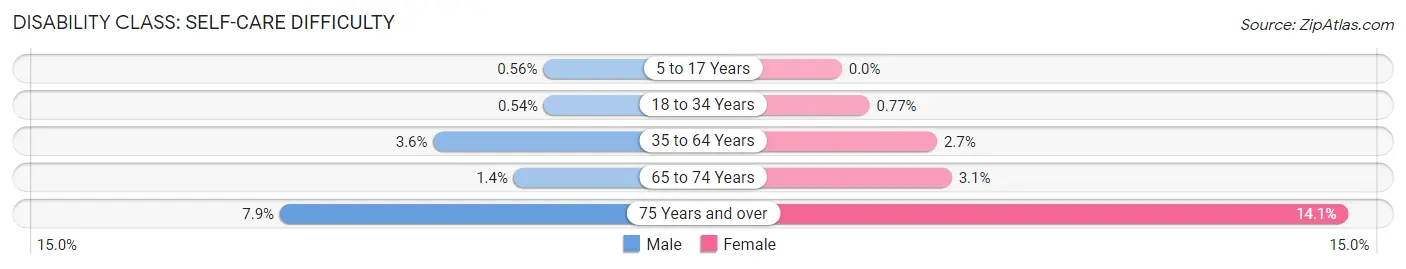
| Age Bracket | Male | Female |
| 5 to 17 Years | 9 (0.6%) | 0 (0.0%) |
| 18 to 34 Years | 11 (0.5%) | 14 (0.8%) |
| 35 to 64 Years | 163 (3.6%) | 113 (2.6%) |
| 65 to 74 Years | 19 (1.4%) | 49 (3.1%) |
| 75 Years and over | 59 (7.9%) | 160 (14.1%) |
Technology Access in Caswell County
Computing Device Access in Caswell County
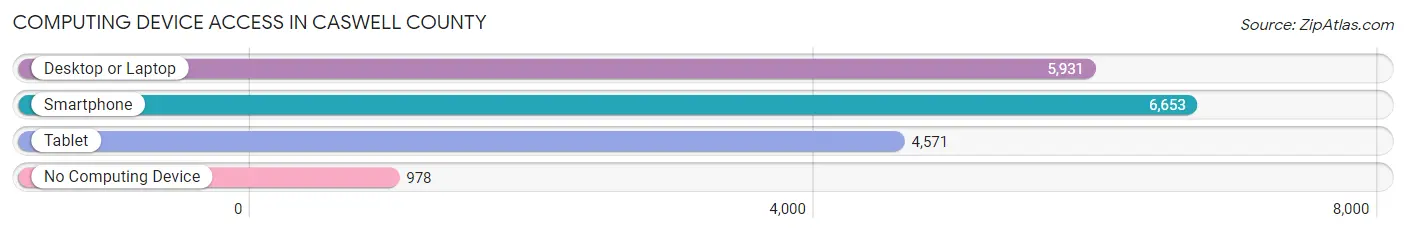
| Device Type | # Households | % Households |
| Desktop or Laptop | 5,931 | 69.7% |
| Smartphone | 6,653 | 78.2% |
| Tablet | 4,571 | 53.7% |
| No Computing Device | 978 | 11.5% |
| Total | 8,507 | 100.0% |
Internet Access in Caswell County
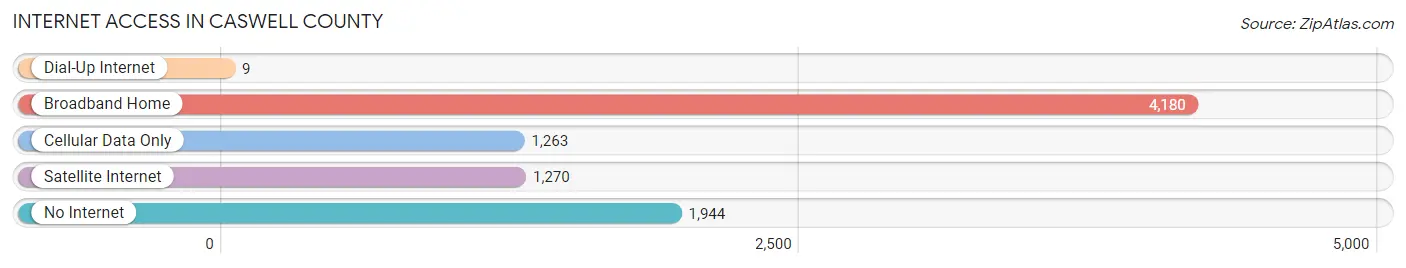
| Internet Type | # Households | % Households |
| Dial-Up Internet | 9 | 0.1% |
| Broadband Home | 4,180 | 49.1% |
| Cellular Data Only | 1,263 | 14.8% |
| Satellite Internet | 1,270 | 14.9% |
| No Internet | 1,944 | 22.9% |
| Total | 8,507 | 100.0% |
Caswell County Summary
Caswell County is located in the Piedmont region of North Carolina, and is bordered by Person County to the north, Alamance County to the east, Rockingham County to the south, and Person County to the west. The county seat is Yanceyville, and the county is named after Richard Caswell, the first governor of North Carolina.
Geography
Caswell County covers an area of 437 square miles, and is located in the Piedmont region of North Carolina. The terrain is mostly rolling hills, with some flat areas in the northern part of the county. The county is drained by the Haw River, which flows through the center of the county. The county is also home to several small lakes, including Lake Reidsville, Lake Cane, and Lake Yancey.
The climate of Caswell County is generally mild, with hot summers and cool winters. The average annual temperature is around 60 degrees Fahrenheit, and the average annual precipitation is around 45 inches.
Demographics
As of the 2010 census, Caswell County had a population of 23,719. The racial makeup of the county was 79.3% White, 17.2% African American, 0.4% Native American, 0.7% Asian, 0.1% Pacific Islander, 1.2% from other races, and 1.1% from two or more races. Hispanic or Latino of any race were 2.7% of the population.
The median household income in Caswell County was $37,945, and the median family income was $45,945. The per capita income was $19,945. About 17.2% of the population was below the poverty line.
Economy
The economy of Caswell County is largely based on agriculture, with tobacco, corn, and soybeans being the main crops. The county is also home to several manufacturing companies, including a furniture factory, a textile mill, and a paper mill.
The county is also home to several tourist attractions, including the historic Yanceyville Courthouse, the Caswell County Historical Museum, and the Caswell County Fairgrounds.
History
Caswell County was formed in 1777 from Orange County. The county was named after Richard Caswell, the first governor of North Carolina. The county seat was originally located in Leasburg, but was moved to Yanceyville in 1792.
During the Civil War, Caswell County was the site of several battles, including the Battle of Yanceyville in 1864. After the war, the county experienced a period of economic growth, with the development of the tobacco and textile industries.
In the late 19th and early 20th centuries, Caswell County was home to several prominent African American leaders, including John Merrick, who founded the North Carolina Mutual Life Insurance Company, and James E. Shepard, who founded the North Carolina College for Negroes (now North Carolina Central University).
Today, Caswell County is a rural county with a population of around 24,000. The county is home to several historic sites, including the Yanceyville Courthouse, the Caswell County Historical Museum, and the Caswell County Fairgrounds. The county is also home to several manufacturing companies, and is a popular tourist destination.
Common Questions
What is Per Capita Income in Caswell County?
Per Capita income in Caswell County is $27,503.
What is the Median Family Income in Caswell County?
Median Family Income in Caswell County is $66,451.
What is the Median Household income in Caswell County?
Median Household Income in Caswell County is $56,999.
What is Income or Wage Gap in Caswell County?
Income or Wage Gap in Caswell County is 35.0%.
Women in Caswell County earn 65.0 cents for every dollar earned by a man.
What is Family Income Deficit in Caswell County?
Family Income Deficit in Caswell County is $10,016.
Families that are below poverty line in Caswell County earn $10,016 less on average than the poverty threshold level.
What is Inequality or Gini Index in Caswell County?
Inequality or Gini Index in Caswell County is 0.42.
What is the Total Population of Caswell County?
Total Population of Caswell County is 22,747.
What is the Total Male Population of Caswell County?
Total Male Population of Caswell County is 11,831.
What is the Total Female Population of Caswell County?
Total Female Population of Caswell County is 10,916.
What is the Ratio of Males per 100 Females in Caswell County?
There are 108.38 Males per 100 Females in Caswell County.
What is the Ratio of Females per 100 Males in Caswell County?
There are 92.27 Females per 100 Males in Caswell County.
What is the Median Population Age in Caswell County?
Median Population Age in Caswell County is 46.4 Years.
What is the Average Family Size in Caswell County
Average Family Size in Caswell County is 3.0 People.
What is the Average Household Size in Caswell County
Average Household Size in Caswell County is 2.5 People.
How Large is the Labor Force in Caswell County?
There are 10,193 People in the Labor Forcein in Caswell County.
What is the Percentage of People in the Labor Force in Caswell County?
53.1% of People are in the Labor Force in Caswell County.
What is the Unemployment Rate in Caswell County?
Unemployment Rate in Caswell County is 6.0%.