Camden County, NC Map & Demographics
Camden County Map
Camden County Overview
$34,117
PER CAPITA INCOME
$88,953
AVG FAMILY INCOME
$79,120
AVG HOUSEHOLD INCOME
26.0%
WAGE / INCOME GAP [ % ]
74.0¢/ $1
WAGE / INCOME GAP [ $ ]
0.35
INEQUALITY / GINI INDEX
10,547
TOTAL POPULATION
5,494
MALE POPULATION
5,053
FEMALE POPULATION
108.73
MALES / 100 FEMALES
91.97
FEMALES / 100 MALES
41.1
MEDIAN AGE
3.1
AVG FAMILY SIZE
2.7
AVG HOUSEHOLD SIZE
5,163
LABOR FORCE [ PEOPLE ]
62.8%
PERCENT IN LABOR FORCE
5.7%
UNEMPLOYMENT RATE
Camden County Area Codes
Income in Camden County
Income Overview in Camden County
Per Capita Income in Camden County is $34,117, while median incomes of families and households are $88,953 and $79,120 respectively.
| Characteristic | Number | Measure |
| Per Capita Income | 10,547 | $34,117 |
| Median Family Income | 3,074 | $88,953 |
| Mean Family Income | 3,074 | $98,800 |
| Median Household Income | 3,871 | $79,120 |
| Mean Household Income | 3,871 | $88,224 |
| Income Deficit | 3,074 | $0 |
| Wage / Income Gap (%) | 10,547 | 26.01% |
| Wage / Income Gap ($) | 10,547 | 73.99¢ per $1 |
| Gini / Inequality Index | 10,547 | 0.35 |
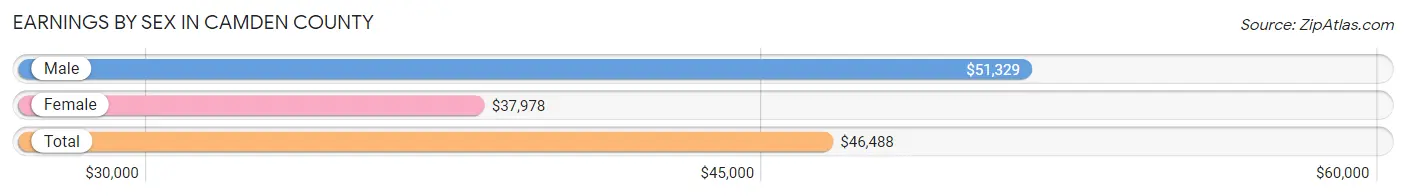
Earnings by Sex in Camden County
Average Earnings in Camden County are $46,488, $51,329 for men and $37,978 for women, a difference of 26.0%.
| Sex | Number | Average Earnings |
| Male | 2,750 (51.8%) | $51,329 |
| Female | 2,559 (48.2%) | $37,978 |
| Total | 5,309 (100.0%) | $46,488 |
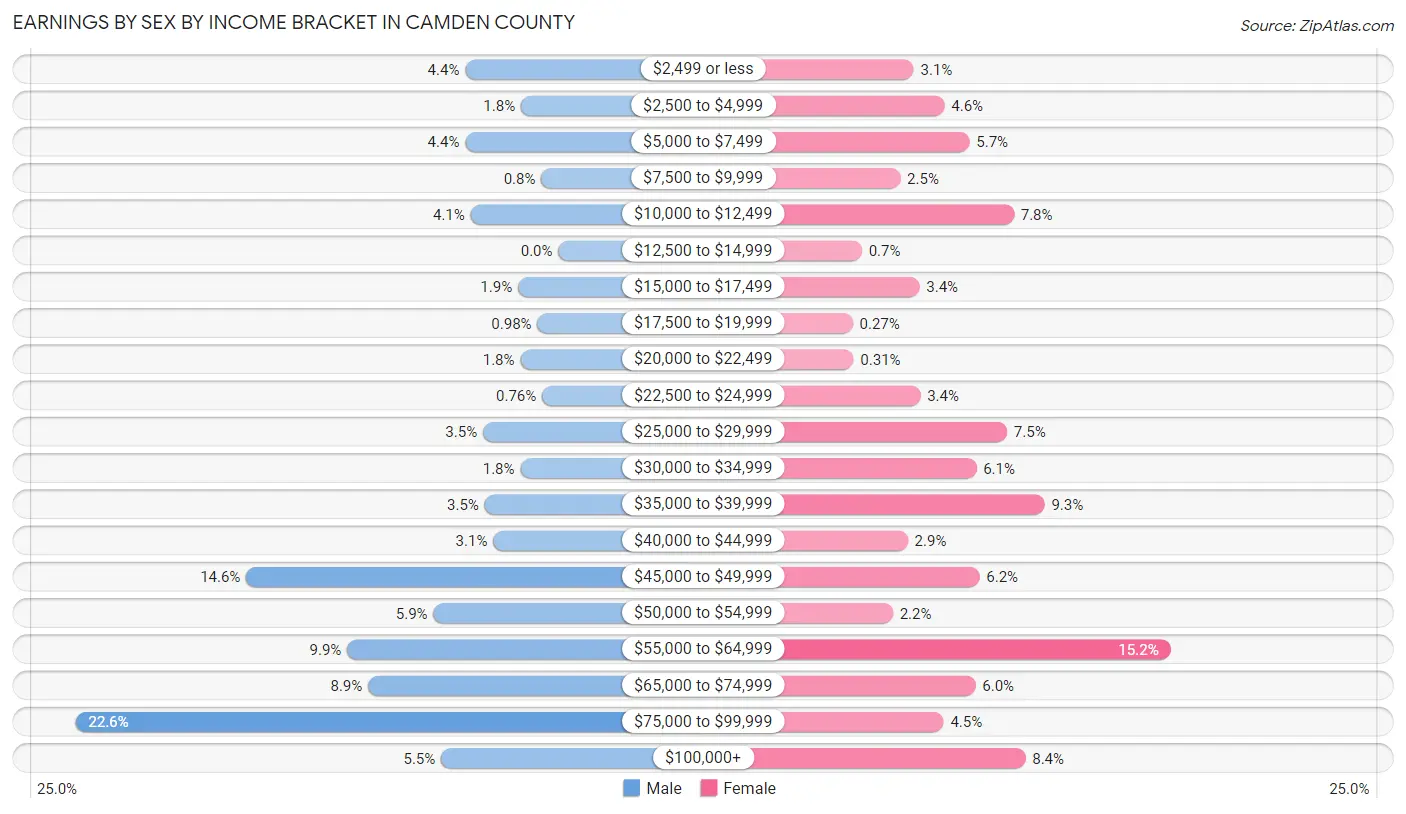
Earnings by Sex by Income Bracket in Camden County
The most common earnings brackets in Camden County are $75,000 to $99,999 for men (622 | 22.6%) and $55,000 to $64,999 for women (388 | 15.2%).
| Income | Male | Female |
| $2,499 or less | 120 (4.4%) | 80 (3.1%) |
| $2,500 to $4,999 | 48 (1.8%) | 117 (4.6%) |
| $5,000 to $7,499 | 120 (4.4%) | 147 (5.7%) |
| $7,500 to $9,999 | 22 (0.8%) | 64 (2.5%) |
| $10,000 to $12,499 | 113 (4.1%) | 200 (7.8%) |
| $12,500 to $14,999 | 0 (0.0%) | 18 (0.7%) |
| $15,000 to $17,499 | 52 (1.9%) | 87 (3.4%) |
| $17,500 to $19,999 | 27 (1.0%) | 7 (0.3%) |
| $20,000 to $22,499 | 49 (1.8%) | 8 (0.3%) |
| $22,500 to $24,999 | 21 (0.8%) | 88 (3.4%) |
| $25,000 to $29,999 | 97 (3.5%) | 192 (7.5%) |
| $30,000 to $34,999 | 49 (1.8%) | 155 (6.1%) |
| $35,000 to $39,999 | 95 (3.5%) | 237 (9.3%) |
| $40,000 to $44,999 | 84 (3.0%) | 73 (2.9%) |
| $45,000 to $49,999 | 402 (14.6%) | 159 (6.2%) |
| $50,000 to $54,999 | 161 (5.9%) | 55 (2.1%) |
| $55,000 to $64,999 | 272 (9.9%) | 388 (15.2%) |
| $65,000 to $74,999 | 245 (8.9%) | 154 (6.0%) |
| $75,000 to $99,999 | 622 (22.6%) | 116 (4.5%) |
| $100,000+ | 151 (5.5%) | 214 (8.4%) |
| Total | 2,750 (100.0%) | 2,559 (100.0%) |
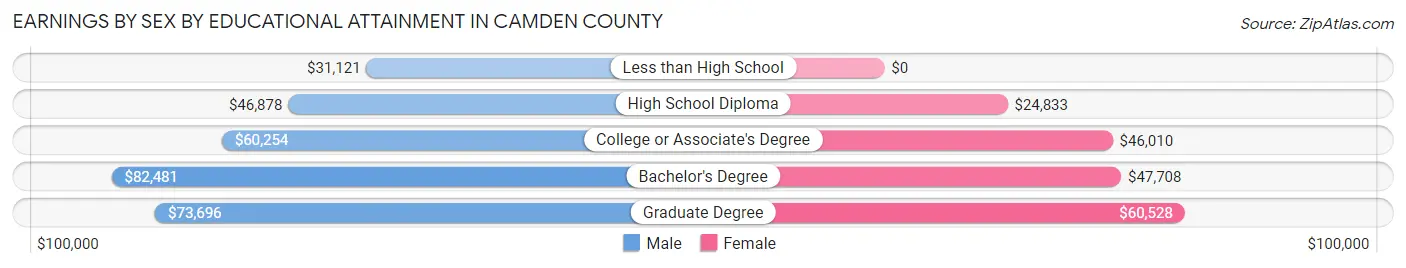
Earnings by Sex by Educational Attainment in Camden County
Average earnings in Camden County are $57,058 for men and $42,270 for women, a difference of 25.9%. Men with an educational attainment of bachelor's degree enjoy the highest average annual earnings of $82,481, while those with less than high school education earn the least with $31,121. Women with an educational attainment of graduate degree earn the most with the average annual earnings of $60,528, while those with high school diploma education have the smallest earnings of $24,833.
| Educational Attainment | Male Income | Female Income |
| Less than High School | $31,121 | $0 |
| High School Diploma | $46,878 | $24,833 |
| College or Associate's Degree | $60,254 | $46,010 |
| Bachelor's Degree | $82,481 | $47,708 |
| Graduate Degree | $73,696 | $60,528 |
| Total | $57,058 | $42,270 |
Family Income in Camden County
Family Income Brackets in Camden County
According to the Camden County family income data, there are 910 families falling into the $100,000 to $149,999 income range, which is the most common income bracket and makes up 29.6% of all families. Conversely, the $15,000 to $24,999 income bracket is the least frequent group with only 31 families (1.0%) belonging to this category.
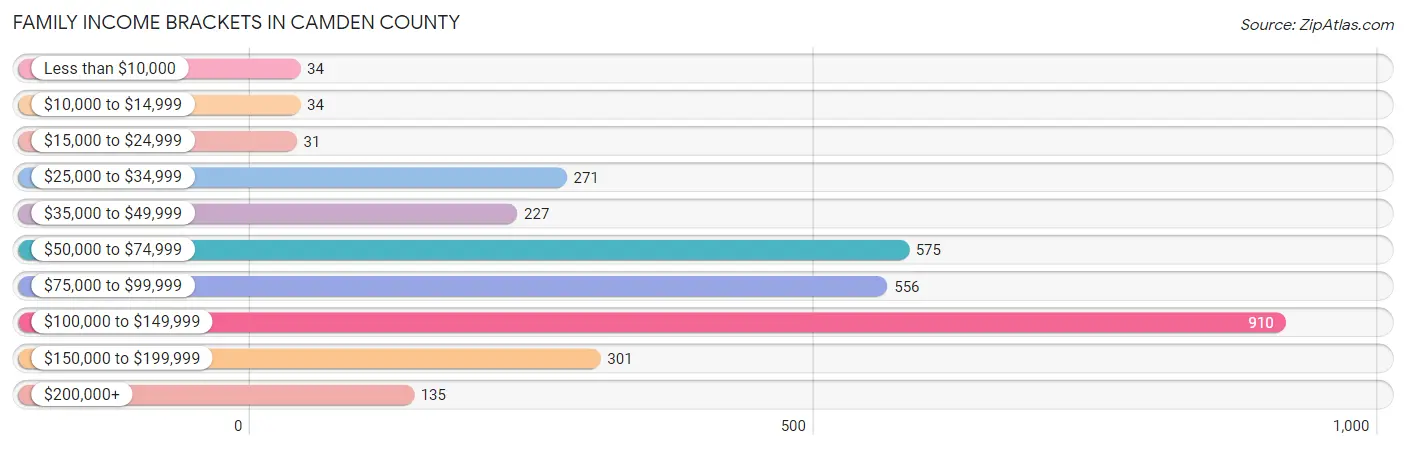
| Income Bracket | # Families | % Families |
| Less than $10,000 | 34 | 1.1% |
| $10,000 to $14,999 | 34 | 1.1% |
| $15,000 to $24,999 | 31 | 1.0% |
| $25,000 to $34,999 | 271 | 8.8% |
| $35,000 to $49,999 | 227 | 7.4% |
| $50,000 to $74,999 | 575 | 18.7% |
| $75,000 to $99,999 | 556 | 18.1% |
| $100,000 to $149,999 | 910 | 29.6% |
| $150,000 to $199,999 | 301 | 9.8% |
| $200,000+ | 135 | 4.4% |
Family Income by Famaliy Size in Camden County
4-person families (676 | 22.0%) account for the highest median family income in Camden County with $113,523 per family, while 2-person families (1,171 | 38.1%) have the highest median income of $44,232 per family member.
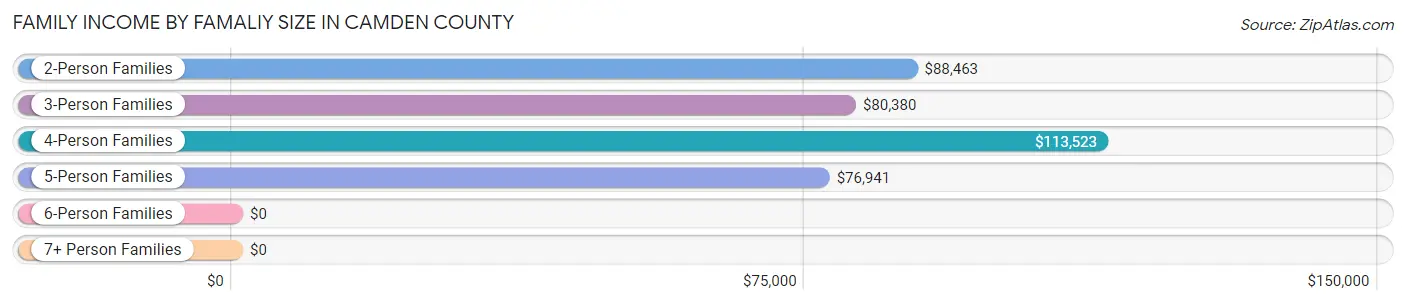
| Income Bracket | # Families | Median Income |
| 2-Person Families | 1,171 (38.1%) | $88,463 |
| 3-Person Families | 811 (26.4%) | $80,380 |
| 4-Person Families | 676 (22.0%) | $113,523 |
| 5-Person Families | 321 (10.4%) | $76,941 |
| 6-Person Families | 72 (2.3%) | $0 |
| 7+ Person Families | 23 (0.7%) | $0 |
| Total | 3,074 (100.0%) | $88,953 |
Family Income by Number of Earners in Camden County
The median family income in Camden County is $88,953, with families comprising 2 earners (1,393) having the highest median family income of $113,302, while families with no earners (455) have the lowest median family income of $56,161, accounting for 45.3% and 14.8% of families, respectively.
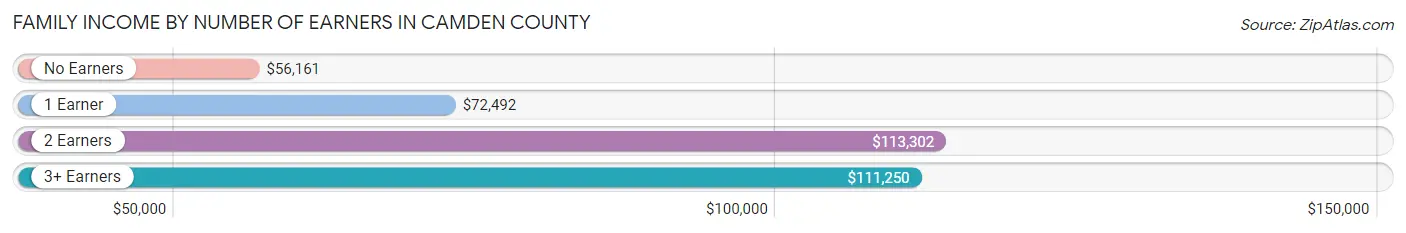
| Number of Earners | # Families | Median Income |
| No Earners | 455 (14.8%) | $56,161 |
| 1 Earner | 1,019 (33.2%) | $72,492 |
| 2 Earners | 1,393 (45.3%) | $113,302 |
| 3+ Earners | 207 (6.7%) | $111,250 |
| Total | 3,074 (100.0%) | $88,953 |
Household Income in Camden County
Household Income Brackets in Camden County
With 979 households falling in the category, the $100,000 to $149,999 income range is the most frequent in Camden County, accounting for 25.3% of all households. In contrast, only 54 households (1.4%) fall into the less than $10,000 income bracket, making it the least populous group.
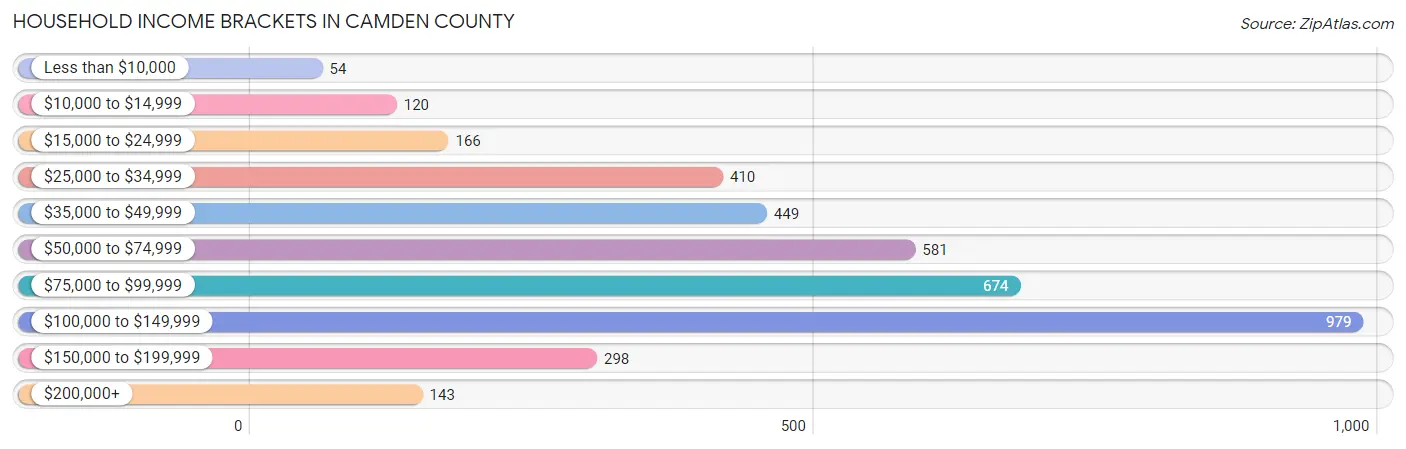
| Income Bracket | # Households | % Households |
| Less than $10,000 | 54 | 1.4% |
| $10,000 to $14,999 | 120 | 3.1% |
| $15,000 to $24,999 | 166 | 4.3% |
| $25,000 to $34,999 | 410 | 10.6% |
| $35,000 to $49,999 | 449 | 11.6% |
| $50,000 to $74,999 | 581 | 15.0% |
| $75,000 to $99,999 | 674 | 17.4% |
| $100,000 to $149,999 | 979 | 25.3% |
| $150,000 to $199,999 | 298 | 7.7% |
| $200,000+ | 143 | 3.7% |
Household Income by Householder Age in Camden County
The median household income in Camden County is $79,120, with the highest median household income of $101,917 found in the 45 to 64 years age bracket for the primary householder. A total of 1,493 households (38.6%) fall into this category. Meanwhile, the 15 to 24 years age bracket for the primary householder has the lowest median household income of $0, with 67 households (1.7%) in this group.
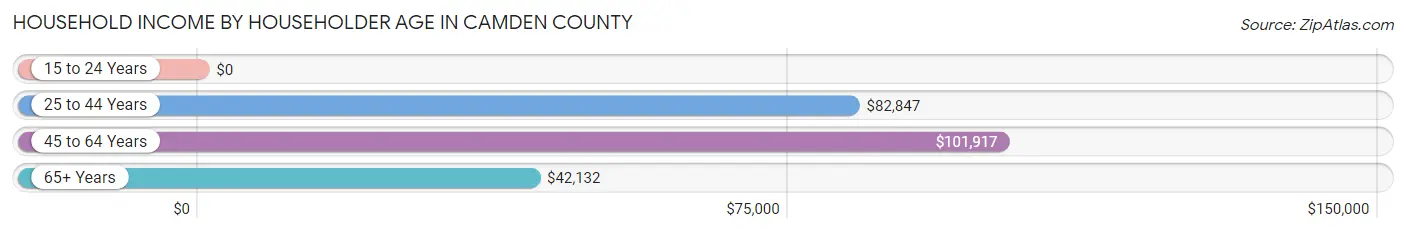
| Income Bracket | # Households | Median Income |
| 15 to 24 Years | 67 (1.7%) | $0 |
| 25 to 44 Years | 1,305 (33.7%) | $82,847 |
| 45 to 64 Years | 1,493 (38.6%) | $101,917 |
| 65+ Years | 1,006 (26.0%) | $42,132 |
| Total | 3,871 (100.0%) | $79,120 |
Poverty in Camden County
Income Below Poverty by Sex and Age in Camden County
With 6.2% poverty level for males and 5.5% for females among the residents of Camden County, 6 to 11 year old males and 18 to 24 year old females are the most vulnerable to poverty, with 108 males (23.2%) and 38 females (11.2%) in their respective age groups living below the poverty level.
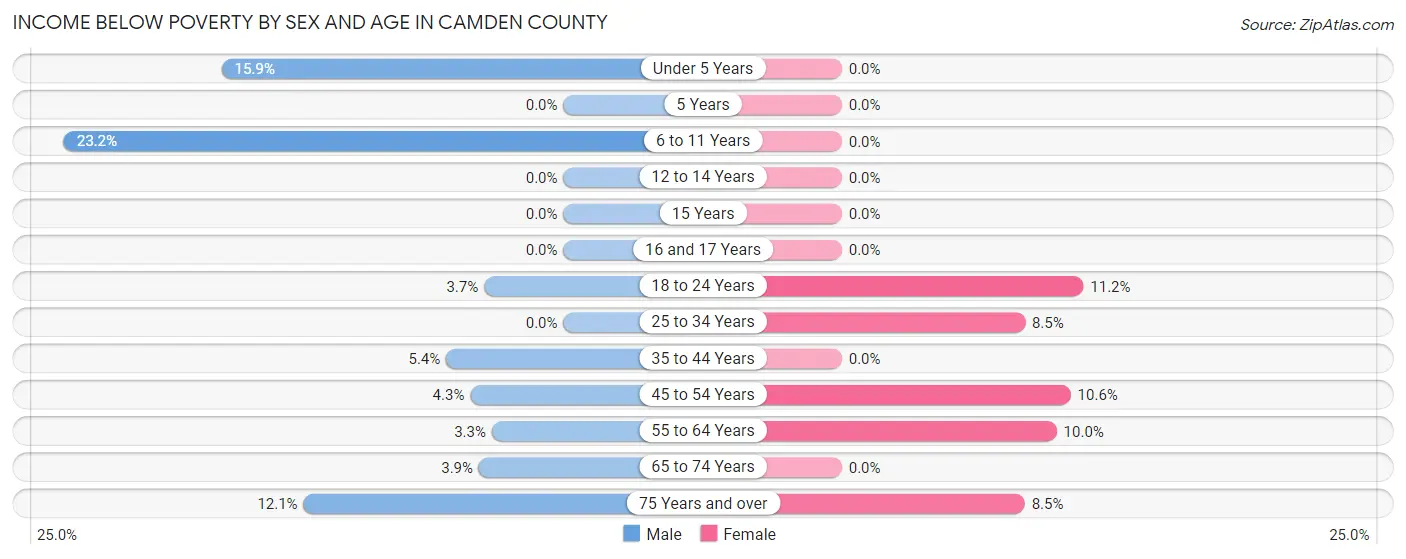
| Age Bracket | Male | Female |
| Under 5 Years | 69 (15.9%) | 0 (0.0%) |
| 5 Years | 0 (0.0%) | 0 (0.0%) |
| 6 to 11 Years | 108 (23.2%) | 0 (0.0%) |
| 12 to 14 Years | 0 (0.0%) | 0 (0.0%) |
| 15 Years | 0 (0.0%) | 0 (0.0%) |
| 16 and 17 Years | 0 (0.0%) | 0 (0.0%) |
| 18 to 24 Years | 15 (3.7%) | 38 (11.2%) |
| 25 to 34 Years | 0 (0.0%) | 50 (8.5%) |
| 35 to 44 Years | 38 (5.4%) | 0 (0.0%) |
| 45 to 54 Years | 30 (4.3%) | 82 (10.6%) |
| 55 to 64 Years | 28 (3.3%) | 76 (10.0%) |
| 65 to 74 Years | 19 (3.9%) | 0 (0.0%) |
| 75 Years and over | 34 (12.1%) | 32 (8.5%) |
| Total | 341 (6.2%) | 278 (5.5%) |
Income Above Poverty by Sex and Age in Camden County
According to the poverty statistics in Camden County, males aged 5 years and females aged under 5 years are the age groups that are most secure financially, with 100.0% of males and 100.0% of females in these age groups living above the poverty line.
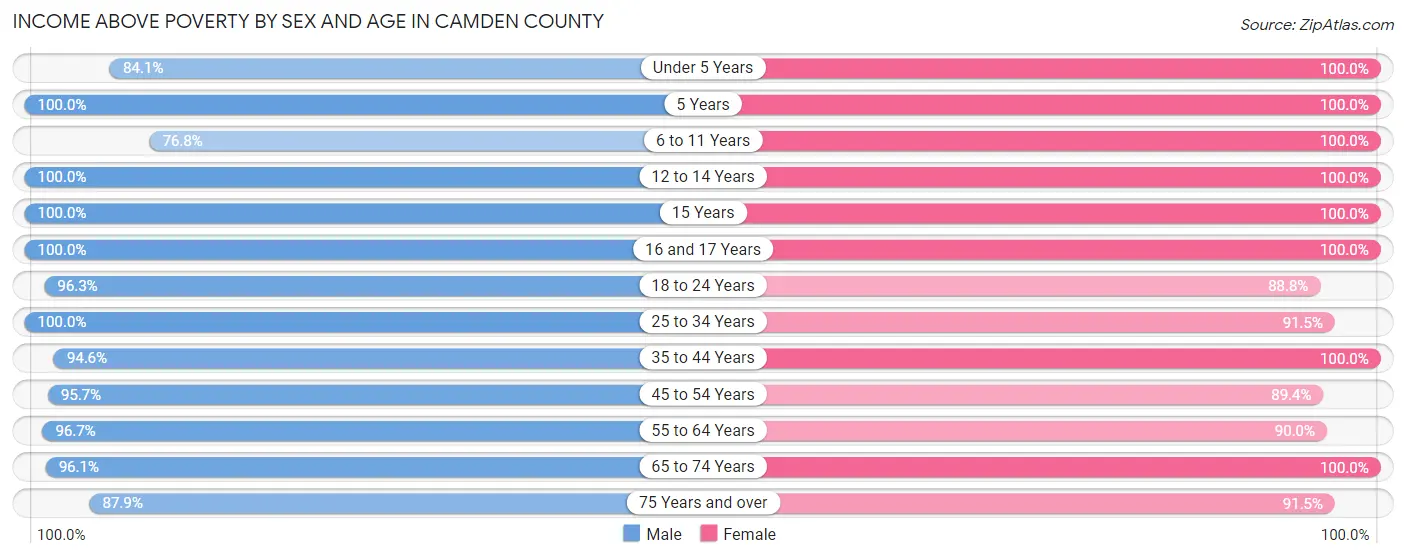
| Age Bracket | Male | Female |
| Under 5 Years | 366 (84.1%) | 142 (100.0%) |
| 5 Years | 66 (100.0%) | 101 (100.0%) |
| 6 to 11 Years | 358 (76.8%) | 355 (100.0%) |
| 12 to 14 Years | 188 (100.0%) | 267 (100.0%) |
| 15 Years | 235 (100.0%) | 61 (100.0%) |
| 16 and 17 Years | 88 (100.0%) | 96 (100.0%) |
| 18 to 24 Years | 393 (96.3%) | 301 (88.8%) |
| 25 to 34 Years | 594 (100.0%) | 538 (91.5%) |
| 35 to 44 Years | 661 (94.6%) | 675 (100.0%) |
| 45 to 54 Years | 664 (95.7%) | 690 (89.4%) |
| 55 to 64 Years | 816 (96.7%) | 686 (90.0%) |
| 65 to 74 Years | 466 (96.1%) | 518 (100.0%) |
| 75 Years and over | 248 (87.9%) | 345 (91.5%) |
| Total | 5,143 (93.8%) | 4,775 (94.5%) |
Income Below Poverty Among Married-Couple Families in Camden County
The poverty statistics for married-couple families in Camden County show that 1.6% or 39 of the total 2,477 families live below the poverty line. Families with 1 or 2 children have the highest poverty rate of 2.9%, comprising of 26 families. On the other hand, families with 3 or 4 children have the lowest poverty rate of 0.0%, which includes 0 families.
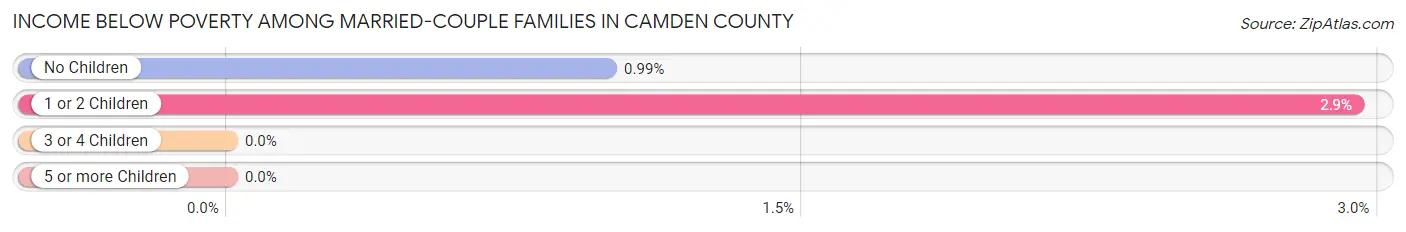
| Children | Above Poverty | Below Poverty |
| No Children | 1,298 (99.0%) | 13 (1.0%) |
| 1 or 2 Children | 857 (97.1%) | 26 (2.9%) |
| 3 or 4 Children | 260 (100.0%) | 0 (0.0%) |
| 5 or more Children | 23 (100.0%) | 0 (0.0%) |
| Total | 2,438 (98.4%) | 39 (1.6%) |
Income Below Poverty Among Single-Parent Households in Camden County
According to the poverty data in Camden County, 9.7% or 21 single-father households and 30.8% or 117 single-mother households are living below the poverty line. Among single-father households, those with no children have the highest poverty rate, with 21 households (35.6%) experiencing poverty. Likewise, among single-mother households, those with 3 or 4 children have the highest poverty rate, with 82 households (100.0%) falling below the poverty line.
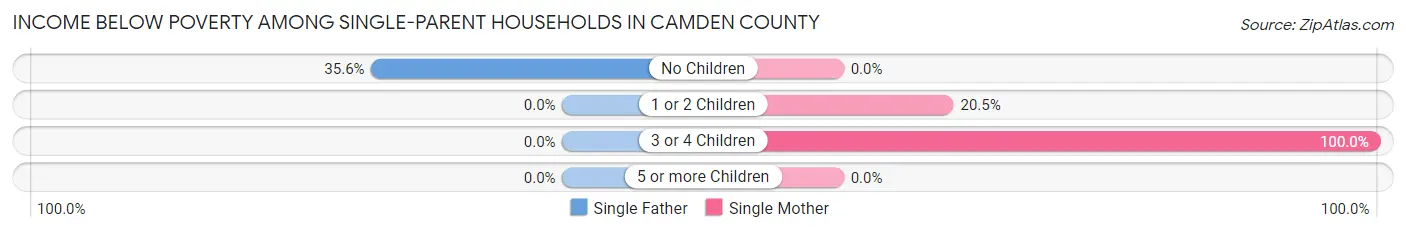
| Children | Single Father | Single Mother |
| No Children | 21 (35.6%) | 0 (0.0%) |
| 1 or 2 Children | 0 (0.0%) | 35 (20.5%) |
| 3 or 4 Children | 0 (0.0%) | 82 (100.0%) |
| 5 or more Children | 0 (0.0%) | 0 (0.0%) |
| Total | 21 (9.7%) | 117 (30.8%) |
Income Below Poverty Among Married-Couple vs Single-Parent Households in Camden County
The poverty data for Camden County shows that 39 of the married-couple family households (1.6%) and 138 of the single-parent households (23.1%) are living below the poverty level. Within the married-couple family households, those with 1 or 2 children have the highest poverty rate, with 26 households (2.9%) falling below the poverty line. Among the single-parent households, those with 3 or 4 children have the highest poverty rate, with 82 household (82.0%) living below poverty.
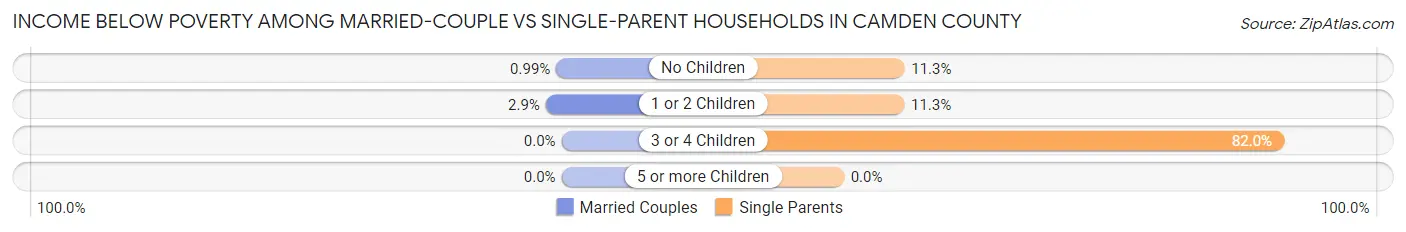
| Children | Married-Couple Families | Single-Parent Households |
| No Children | 13 (1.0%) | 21 (11.3%) |
| 1 or 2 Children | 26 (2.9%) | 35 (11.3%) |
| 3 or 4 Children | 0 (0.0%) | 82 (82.0%) |
| 5 or more Children | 0 (0.0%) | 0 (0.0%) |
| Total | 39 (1.6%) | 138 (23.1%) |
Race in Camden County
The most populous races in Camden County are White / Caucasian (8,558 | 81.1%), Black / African American (851 | 8.1%), and Two or more Races (848 | 8.0%).
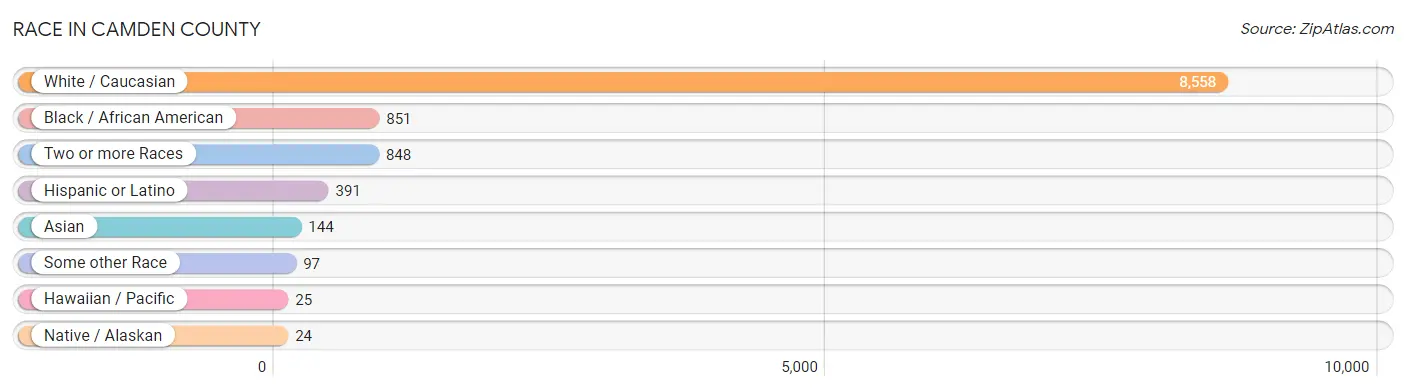
| Race | # Population | % Population |
| Asian | 144 | 1.4% |
| Black / African American | 851 | 8.1% |
| Hawaiian / Pacific | 25 | 0.2% |
| Hispanic or Latino | 391 | 3.7% |
| Native / Alaskan | 24 | 0.2% |
| White / Caucasian | 8,558 | 81.1% |
| Two or more Races | 848 | 8.0% |
| Some other Race | 97 | 0.9% |
| Total | 10,547 | 100.0% |
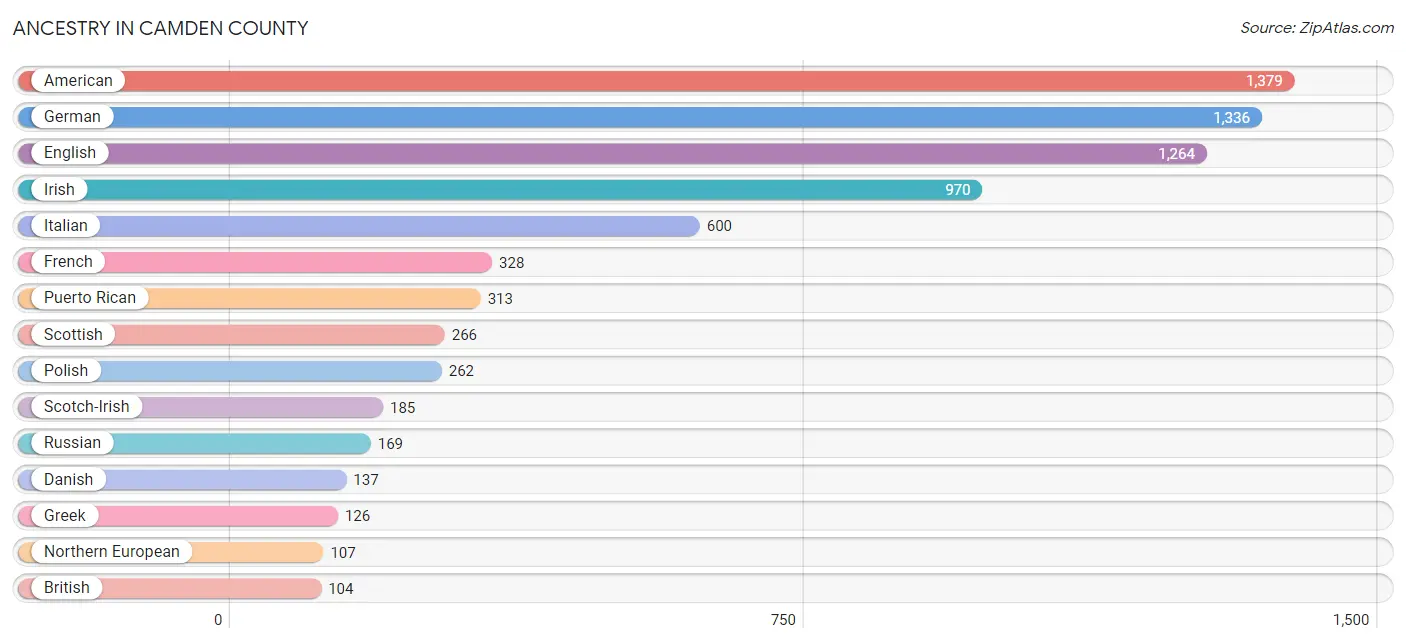
Ancestry in Camden County
The most populous ancestries reported in Camden County are American (1,379 | 13.1%), German (1,336 | 12.7%), English (1,264 | 12.0%), Irish (970 | 9.2%), and Italian (600 | 5.7%), together accounting for 52.6% of all Camden County residents.
| Ancestry | # Population | % Population |
| American | 1,379 | 13.1% |
| Arab | 29 | 0.3% |
| Bhutanese | 51 | 0.5% |
| British | 104 | 1.0% |
| Burmese | 31 | 0.3% |
| Canadian | 27 | 0.3% |
| Cherokee | 100 | 0.9% |
| Chippewa | 44 | 0.4% |
| Czechoslovakian | 31 | 0.3% |
| Danish | 137 | 1.3% |
| Dutch | 34 | 0.3% |
| Eastern European | 45 | 0.4% |
| English | 1,264 | 12.0% |
| European | 41 | 0.4% |
| French | 328 | 3.1% |
| French Canadian | 23 | 0.2% |
| German | 1,336 | 12.7% |
| Greek | 126 | 1.2% |
| Indian (Asian) | 73 | 0.7% |
| Irish | 970 | 9.2% |
| Italian | 600 | 5.7% |
| Jamaican | 47 | 0.4% |
| Jordanian | 29 | 0.3% |
| Korean | 47 | 0.4% |
| Lithuanian | 14 | 0.1% |
| Mexican | 2 | 0.0% |
| Mexican American Indian | 5 | 0.1% |
| Native Hawaiian | 40 | 0.4% |
| Northern European | 107 | 1.0% |
| Norwegian | 80 | 0.8% |
| Polish | 262 | 2.5% |
| Portuguese | 11 | 0.1% |
| Pueblo | 2 | 0.0% |
| Puerto Rican | 313 | 3.0% |
| Romanian | 19 | 0.2% |
| Russian | 169 | 1.6% |
| Samoan | 29 | 0.3% |
| Scandinavian | 3 | 0.0% |
| Scotch-Irish | 185 | 1.8% |
| Scottish | 266 | 2.5% |
| Serbian | 18 | 0.2% |
| Slovak | 12 | 0.1% |
| Spaniard | 76 | 0.7% |
| Sri Lankan | 14 | 0.1% |
| Swedish | 53 | 0.5% |
| Swiss | 20 | 0.2% |
| Ukrainian | 30 | 0.3% |
| Welsh | 32 | 0.3% | View All 48 Rows |
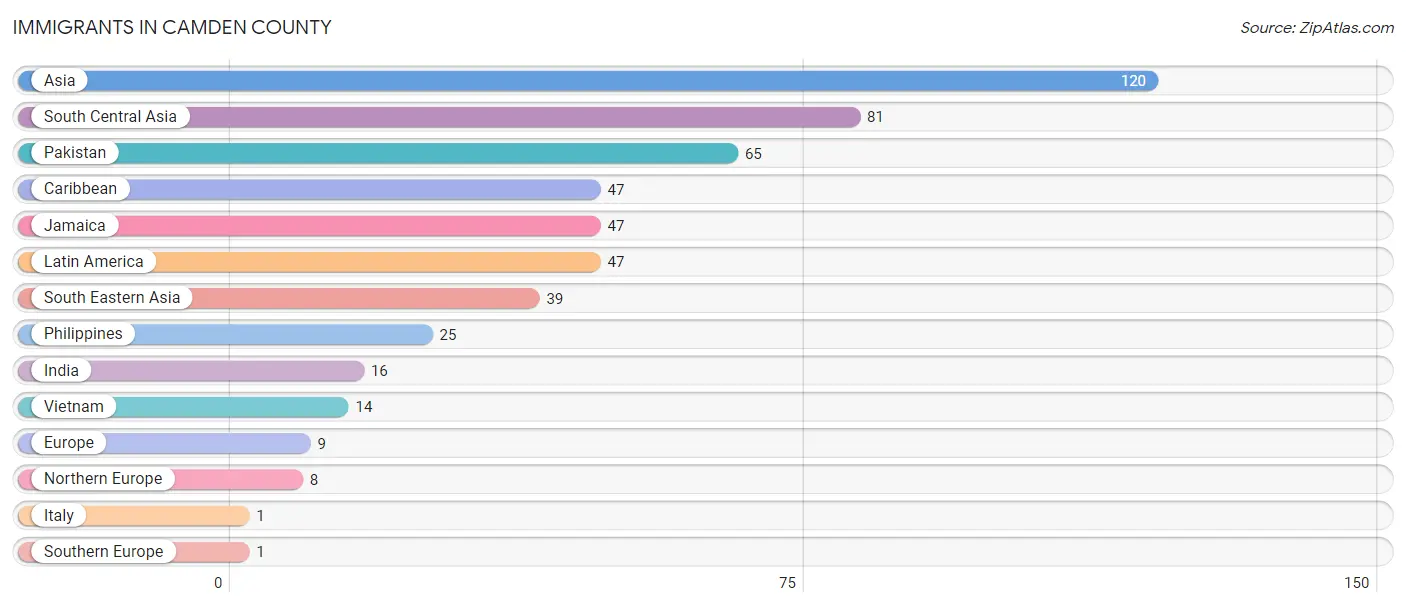
Immigrants in Camden County
The most numerous immigrant groups reported in Camden County came from Asia (120 | 1.1%), South Central Asia (81 | 0.8%), Pakistan (65 | 0.6%), Caribbean (47 | 0.4%), and Jamaica (47 | 0.4%), together accounting for 3.4% of all Camden County residents.
| Immigration Origin | # Population | % Population |
| Asia | 120 | 1.1% |
| Caribbean | 47 | 0.4% |
| Europe | 9 | 0.1% |
| India | 16 | 0.2% |
| Italy | 1 | 0.0% |
| Jamaica | 47 | 0.4% |
| Latin America | 47 | 0.4% |
| Northern Europe | 8 | 0.1% |
| Pakistan | 65 | 0.6% |
| Philippines | 25 | 0.2% |
| South Central Asia | 81 | 0.8% |
| South Eastern Asia | 39 | 0.4% |
| Southern Europe | 1 | 0.0% |
| Vietnam | 14 | 0.1% | View All 14 Rows |
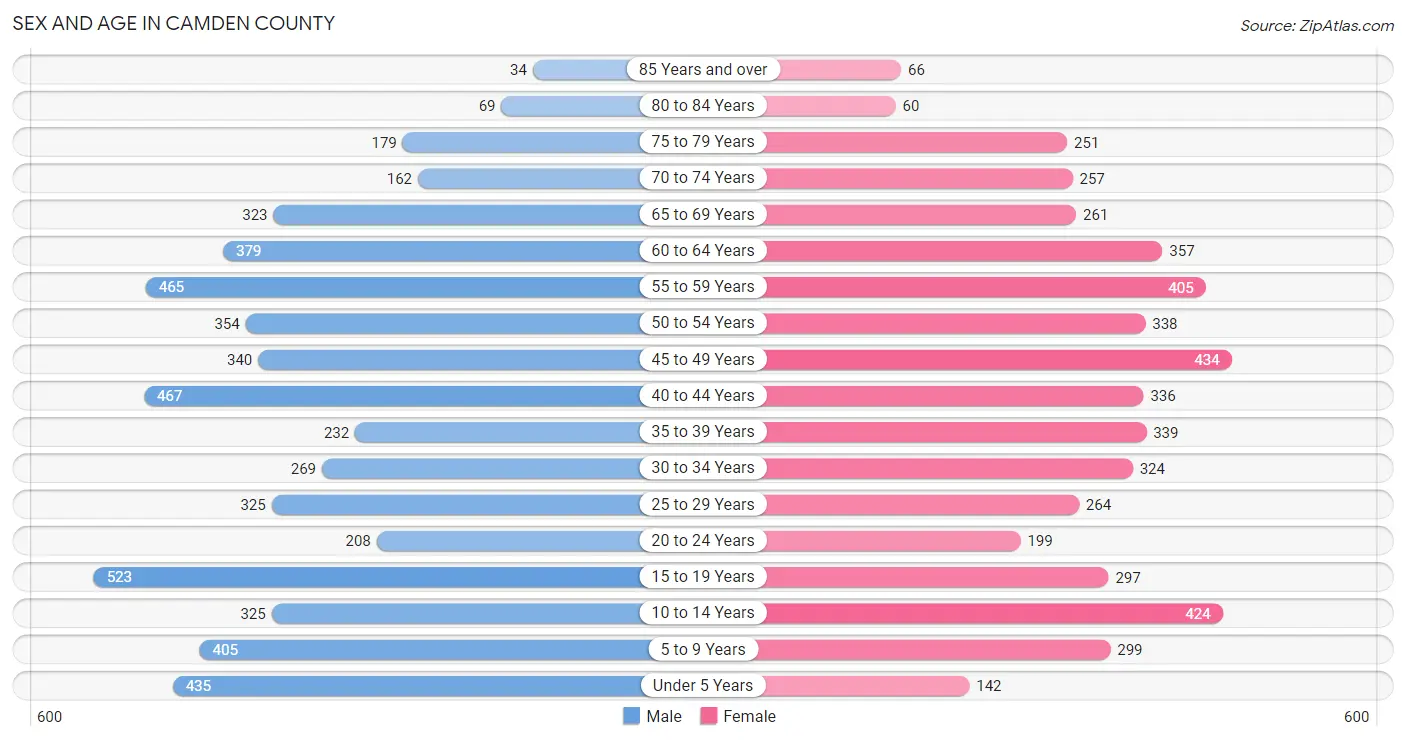
Sex and Age in Camden County
Sex and Age in Camden County
The most populous age groups in Camden County are 15 to 19 Years (523 | 9.5%) for men and 45 to 49 Years (434 | 8.6%) for women.
| Age Bracket | Male | Female |
| Under 5 Years | 435 (7.9%) | 142 (2.8%) |
| 5 to 9 Years | 405 (7.4%) | 299 (5.9%) |
| 10 to 14 Years | 325 (5.9%) | 424 (8.4%) |
| 15 to 19 Years | 523 (9.5%) | 297 (5.9%) |
| 20 to 24 Years | 208 (3.8%) | 199 (3.9%) |
| 25 to 29 Years | 325 (5.9%) | 264 (5.2%) |
| 30 to 34 Years | 269 (4.9%) | 324 (6.4%) |
| 35 to 39 Years | 232 (4.2%) | 339 (6.7%) |
| 40 to 44 Years | 467 (8.5%) | 336 (6.7%) |
| 45 to 49 Years | 340 (6.2%) | 434 (8.6%) |
| 50 to 54 Years | 354 (6.4%) | 338 (6.7%) |
| 55 to 59 Years | 465 (8.5%) | 405 (8.0%) |
| 60 to 64 Years | 379 (6.9%) | 357 (7.1%) |
| 65 to 69 Years | 323 (5.9%) | 261 (5.2%) |
| 70 to 74 Years | 162 (2.9%) | 257 (5.1%) |
| 75 to 79 Years | 179 (3.3%) | 251 (5.0%) |
| 80 to 84 Years | 69 (1.3%) | 60 (1.2%) |
| 85 Years and over | 34 (0.6%) | 66 (1.3%) |
| Total | 5,494 (100.0%) | 5,053 (100.0%) |
Families and Households in Camden County
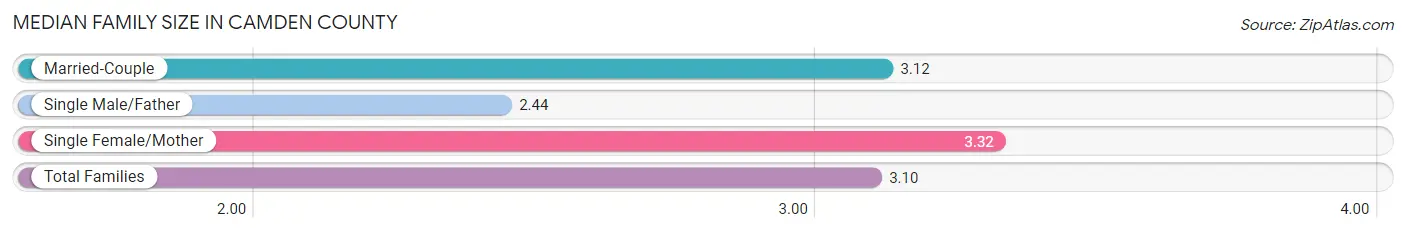
Median Family Size in Camden County
The median family size in Camden County is 3.10 persons per family, with single female/mother families (380 | 12.4%) accounting for the largest median family size of 3.32 persons per family. On the other hand, single male/father families (217 | 7.1%) represent the smallest median family size with 2.44 persons per family.
| Family Type | # Families | Family Size |
| Married-Couple | 2,477 (80.6%) | 3.12 |
| Single Male/Father | 217 (7.1%) | 2.44 |
| Single Female/Mother | 380 (12.4%) | 3.32 |
| Total Families | 3,074 (100.0%) | 3.10 |
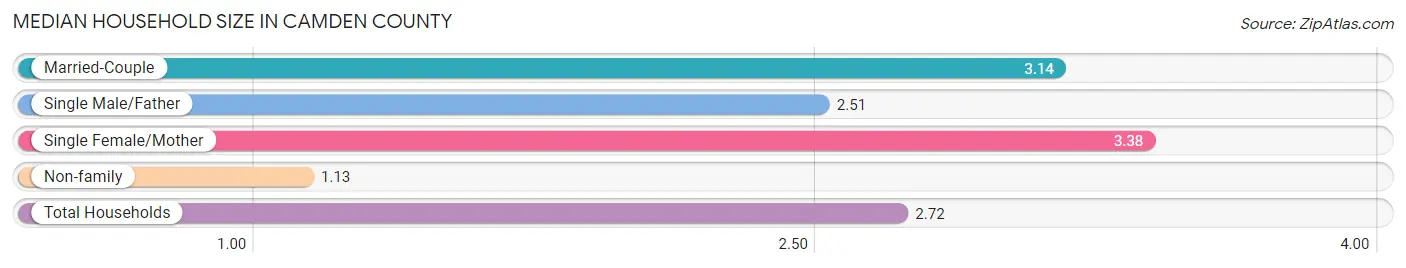
Median Household Size in Camden County
The median household size in Camden County is 2.72 persons per household, with single female/mother households (380 | 9.8%) accounting for the largest median household size of 3.38 persons per household. non-family households (797 | 20.6%) represent the smallest median household size with 1.13 persons per household.
| Household Type | # Households | Household Size |
| Married-Couple | 2,477 (64.0%) | 3.14 |
| Single Male/Father | 217 (5.6%) | 2.51 |
| Single Female/Mother | 380 (9.8%) | 3.38 |
| Non-family | 797 (20.6%) | 1.13 |
| Total Households | 3,871 (100.0%) | 2.72 |
Household Size by Marriage Status in Camden County
Out of a total of 3,871 households in Camden County, 3,074 (79.4%) are family households, while 797 (20.6%) are nonfamily households. The most numerous type of family households are 2-person households, comprising 1,156, and the most common type of nonfamily households are 1-person households, comprising 698.
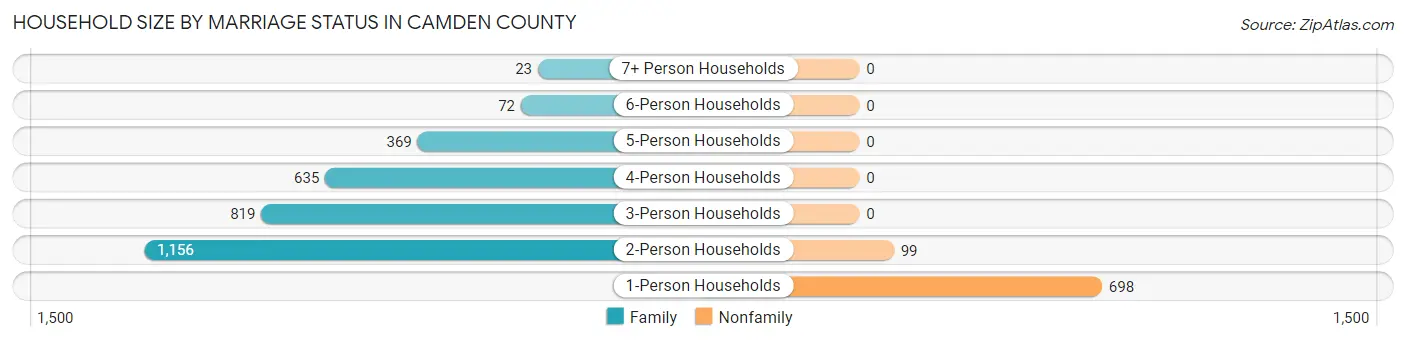
| Household Size | Family Households | Nonfamily Households |
| 1-Person Households | - | 698 (18.0%) |
| 2-Person Households | 1,156 (29.9%) | 99 (2.6%) |
| 3-Person Households | 819 (21.2%) | 0 (0.0%) |
| 4-Person Households | 635 (16.4%) | 0 (0.0%) |
| 5-Person Households | 369 (9.5%) | 0 (0.0%) |
| 6-Person Households | 72 (1.9%) | 0 (0.0%) |
| 7+ Person Households | 23 (0.6%) | 0 (0.0%) |
| Total | 3,074 (79.4%) | 797 (20.6%) |
Female Fertility in Camden County
Fertility by Age in Camden County
Average fertility rate in Camden County is 80.0 births per 1,000 women. Women in the age bracket of 20 to 34 years have the highest fertility rate with 132.0 births per 1,000 women. Women in the age bracket of 20 to 34 years acount for 57.5% of all women with births.
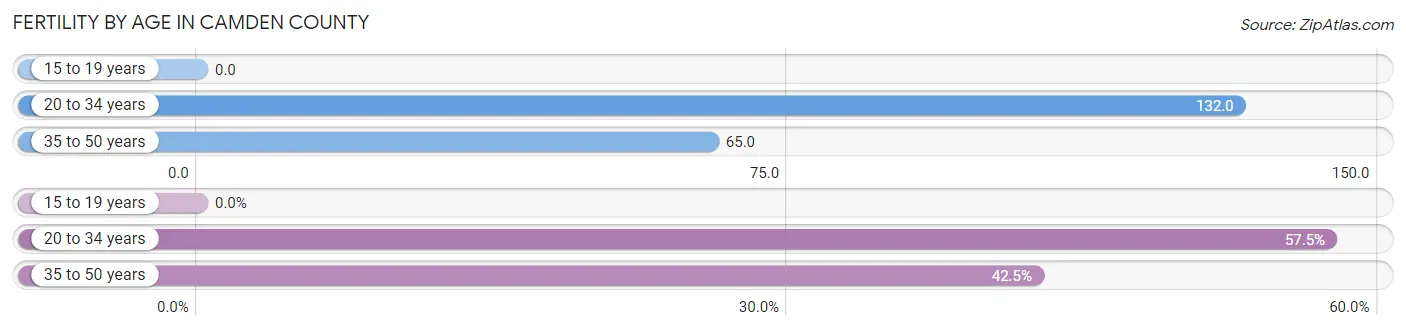
| Age Bracket | Women with Births | Births / 1,000 Women |
| 15 to 19 years | 0 (0.0%) | 0.0 |
| 20 to 34 years | 104 (57.5%) | 132.0 |
| 35 to 50 years | 77 (42.5%) | 65.0 |
| Total | 181 (100.0%) | 80.0 |
Fertility by Age by Marriage Status in Camden County
65.7% of women with births (181) in Camden County are married. The highest percentage of unmarried women with births falls into 35 to 50 years age bracket with 37.7% of them unmarried at the time of birth, while the lowest percentage of unmarried women with births belong to 20 to 34 years age bracket with 31.7% of them unmarried.
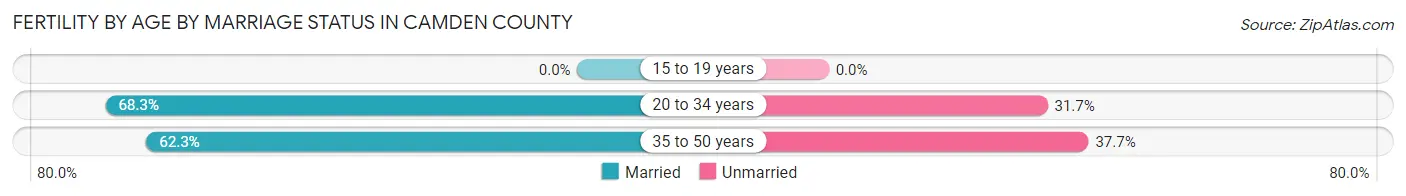
| Age Bracket | Married | Unmarried |
| 15 to 19 years | 0 (0.0%) | 0 (0.0%) |
| 20 to 34 years | 71 (68.3%) | 33 (31.7%) |
| 35 to 50 years | 48 (62.3%) | 29 (37.7%) |
| Total | 119 (65.7%) | 62 (34.3%) |
Fertility by Education in Camden County
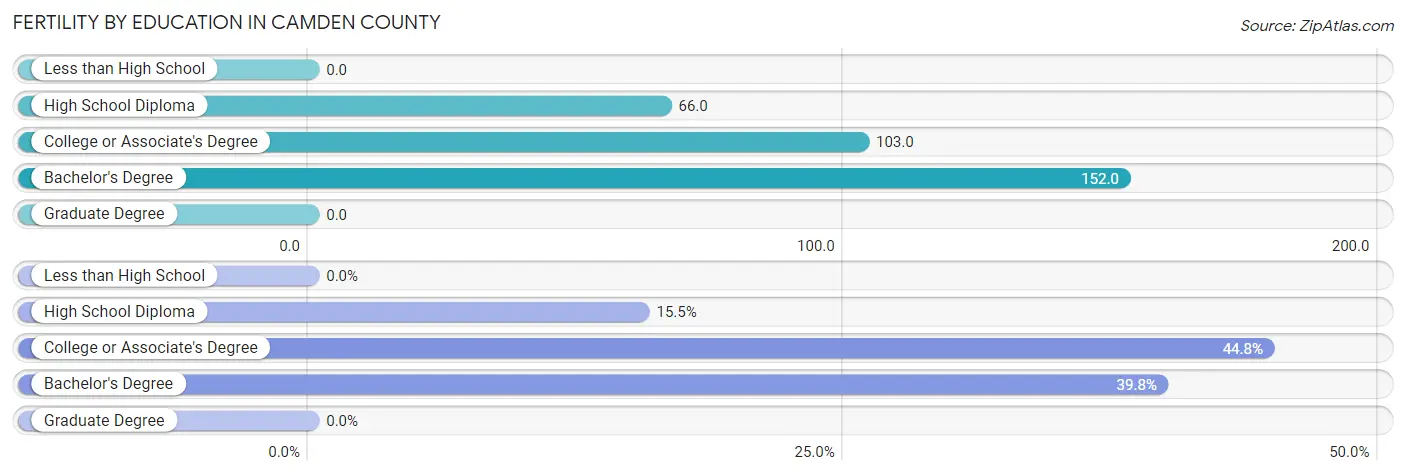
| Educational Attainment | Women with Births | Births / 1,000 Women |
| Less than High School | 0 (0.0%) | 0.0 |
| High School Diploma | 28 (15.5%) | 66.0 |
| College or Associate's Degree | 81 (44.8%) | 103.0 |
| Bachelor's Degree | 72 (39.8%) | 152.0 |
| Graduate Degree | 0 (0.0%) | 0.0 |
| Total | 181 (100.0%) | 80.0 |
Fertility by Education by Marriage Status in Camden County
34.3% of women with births in Camden County are unmarried. Women with the educational attainment of bachelor's degree are most likely to be married with 100.0% of them married at childbirth, while women with the educational attainment of college or associate's degree are least likely to be married with 58.0% of them unmarried at childbirth.
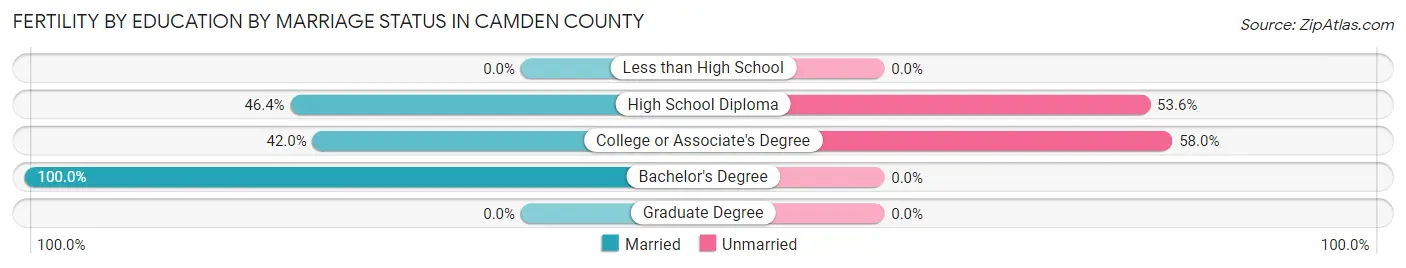
| Educational Attainment | Married | Unmarried |
| Less than High School | 0 (0.0%) | 0 (0.0%) |
| High School Diploma | 13 (46.4%) | 15 (53.6%) |
| College or Associate's Degree | 34 (42.0%) | 47 (58.0%) |
| Bachelor's Degree | 72 (100.0%) | 0 (0.0%) |
| Graduate Degree | 0 (0.0%) | 0 (0.0%) |
| Total | 119 (65.7%) | 62 (34.3%) |
Employment Characteristics in Camden County
Employment by Class of Employer in Camden County
Among the 4,860 employed individuals in Camden County, private company employees (2,750 | 56.6%), federal government employees (542 | 11.2%), and state government employees (468 | 9.6%) make up the most common classes of employment.
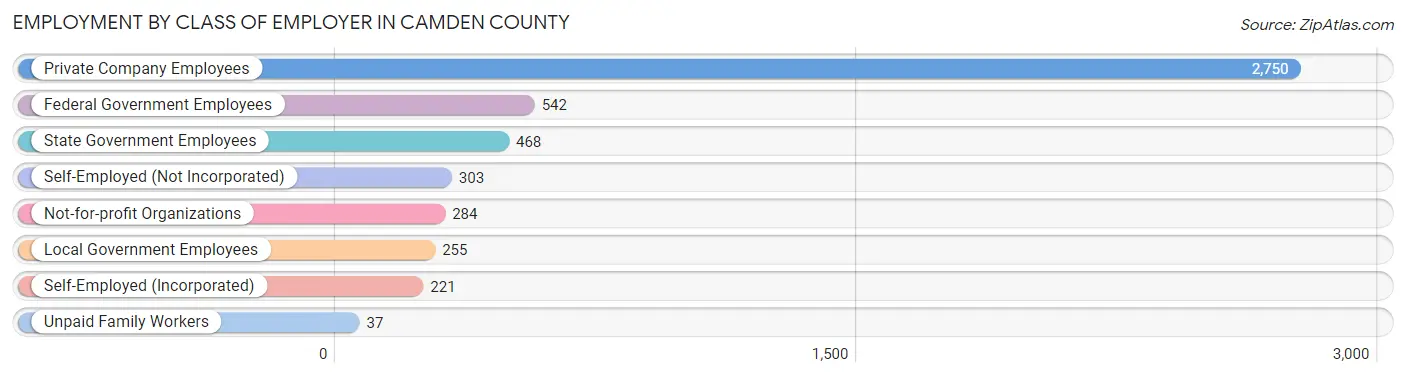
| Employer Class | # Employees | % Employees |
| Private Company Employees | 2,750 | 56.6% |
| Self-Employed (Incorporated) | 221 | 4.5% |
| Self-Employed (Not Incorporated) | 303 | 6.2% |
| Not-for-profit Organizations | 284 | 5.8% |
| Local Government Employees | 255 | 5.2% |
| State Government Employees | 468 | 9.6% |
| Federal Government Employees | 542 | 11.2% |
| Unpaid Family Workers | 37 | 0.8% |
| Total | 4,860 | 100.0% |
Employment Status by Age in Camden County
According to the labor force statistics for Camden County, out of the total population over 16 years of age (8,221), 62.8% or 5,163 individuals are in the labor force, with 5.7% or 294 of them unemployed. The age group with the highest labor force participation rate is 30 to 34 years, with 95.4% or 566 individuals in the labor force. Within the labor force, the 20 to 24 years age range has the highest percentage of unemployed individuals, with 25.5% or 93 of them being unemployed.
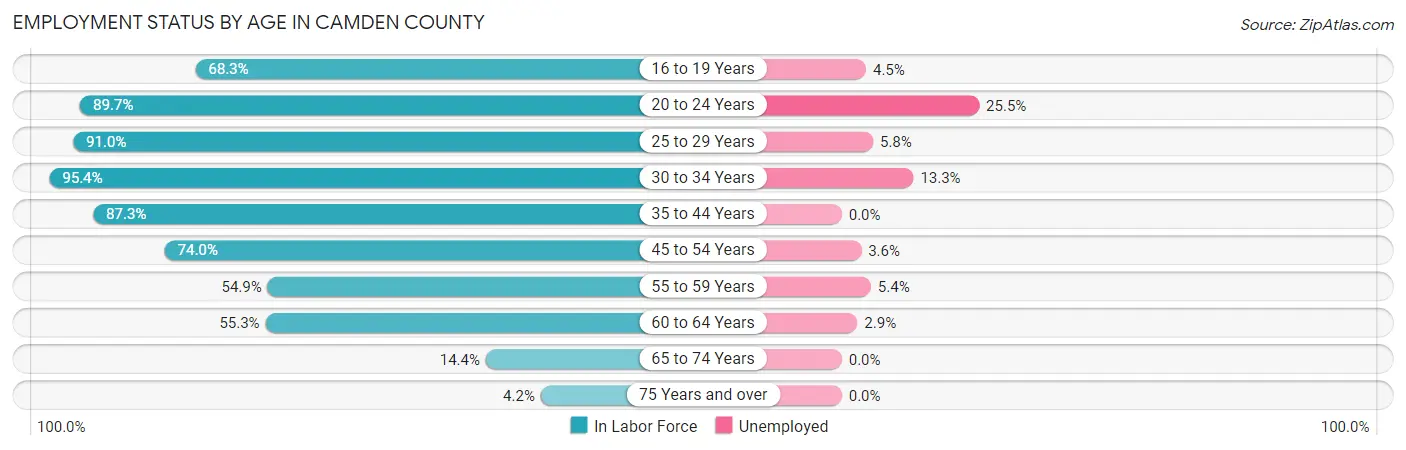
| Age Bracket | In Labor Force | Unemployed |
| 16 to 19 Years | 358 (68.3%) | 16 (4.5%) |
| 20 to 24 Years | 365 (89.7%) | 93 (25.5%) |
| 25 to 29 Years | 536 (91.0%) | 31 (5.8%) |
| 30 to 34 Years | 566 (95.4%) | 75 (13.3%) |
| 35 to 44 Years | 1,200 (87.3%) | 0 (0.0%) |
| 45 to 54 Years | 1,085 (74.0%) | 39 (3.6%) |
| 55 to 59 Years | 478 (54.9%) | 26 (5.4%) |
| 60 to 64 Years | 407 (55.3%) | 12 (2.9%) |
| 65 to 74 Years | 144 (14.4%) | 0 (0.0%) |
| 75 Years and over | 28 (4.2%) | 0 (0.0%) |
| Total | 5,163 (62.8%) | 294 (5.7%) |
Employment Status by Educational Attainment in Camden County
According to labor force statistics for Camden County, 75.9% of individuals (4,272) out of the total population between 25 and 64 years of age (5,628) are in the labor force, with 4.3% or 184 of them being unemployed. The group with the highest labor force participation rate are those with the educational attainment of bachelor's degree or higher, with 91.9% or 1,379 individuals in the labor force. Within the labor force, individuals with college / associate degree education have the highest percentage of unemployment, with 7.5% or 123 of them being unemployed.
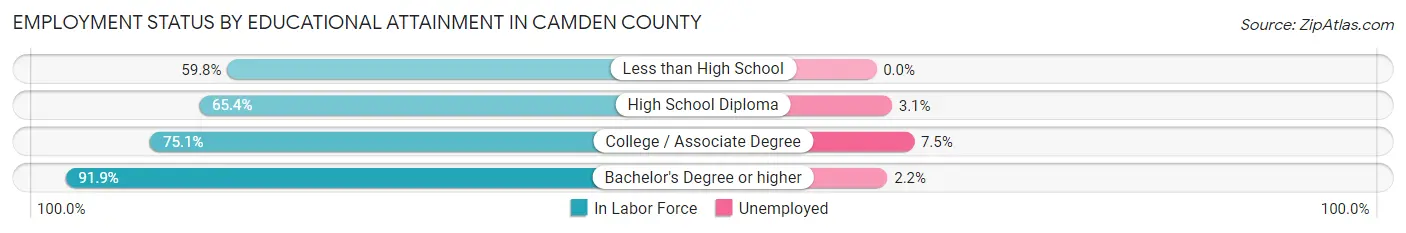
| Educational Attainment | In Labor Force | Unemployed |
| Less than High School | 219 (59.8%) | 0 (0.0%) |
| High School Diploma | 1,034 (65.4%) | 49 (3.1%) |
| College / Associate Degree | 1,637 (75.1%) | 164 (7.5%) |
| Bachelor's Degree or higher | 1,379 (91.9%) | 33 (2.2%) |
| Total | 4,272 (75.9%) | 242 (4.3%) |
Employment Occupations by Sex in Camden County
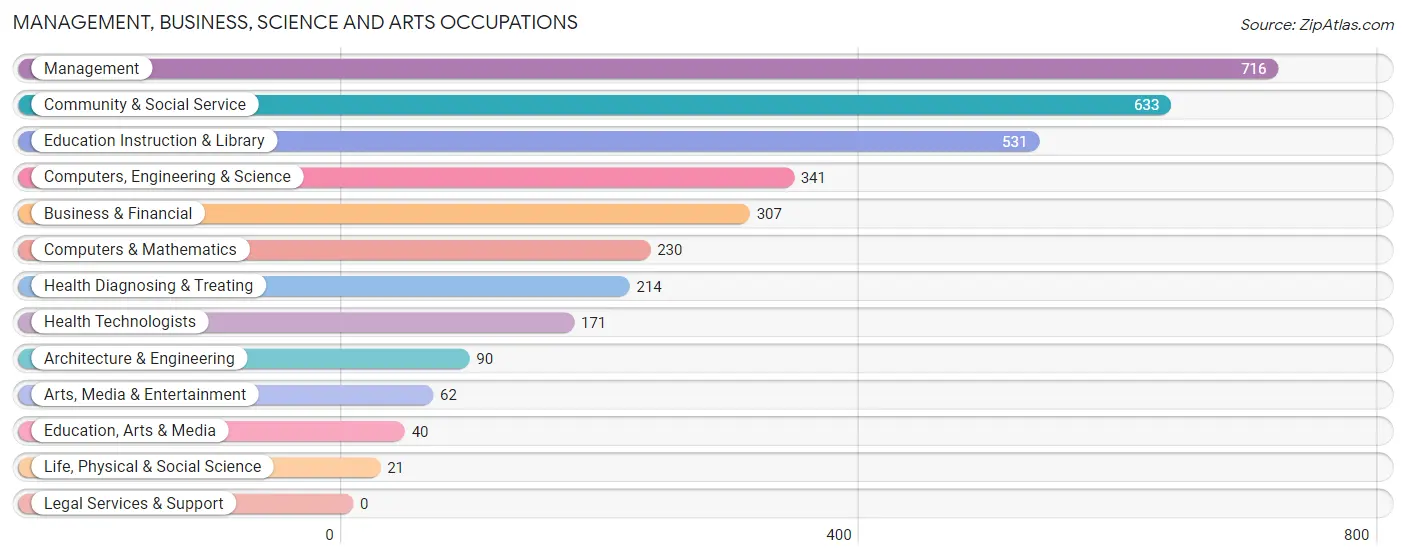
Management, Business, Science and Arts Occupations
The most common Management, Business, Science and Arts occupations in Camden County are Management (716 | 14.9%), Community & Social Service (633 | 13.2%), Education Instruction & Library (531 | 11.1%), Computers, Engineering & Science (341 | 7.1%), and Business & Financial (307 | 6.4%).
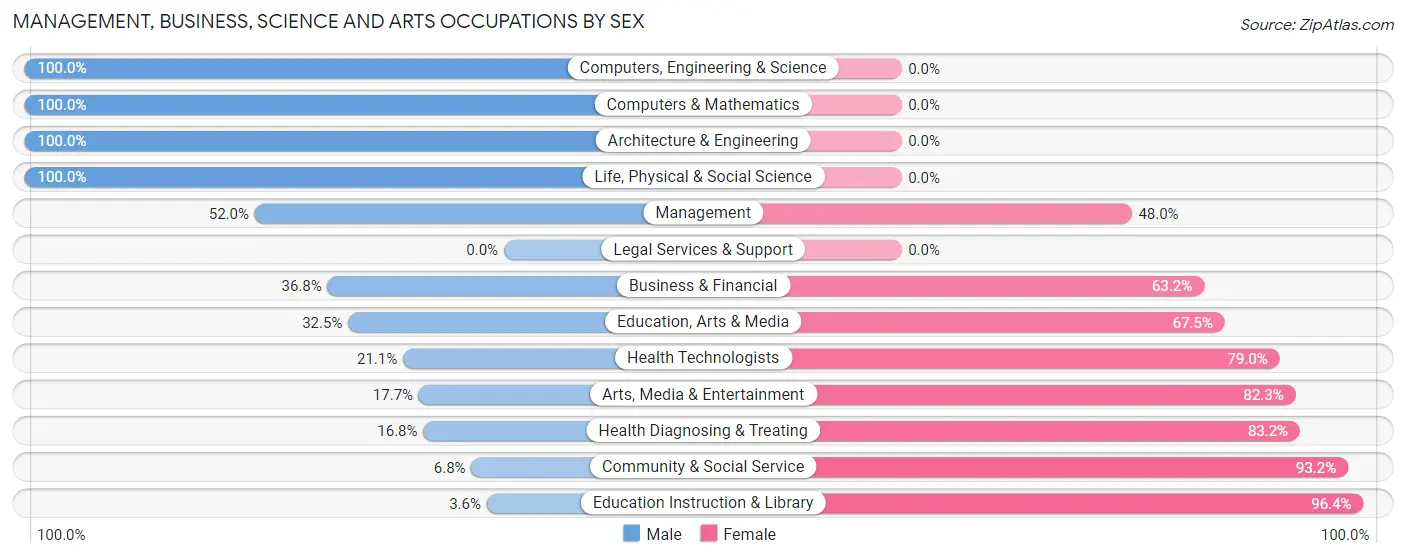
Management, Business, Science and Arts Occupations by Sex
Within the Management, Business, Science and Arts occupations in Camden County, the most male-oriented occupations are Computers, Engineering & Science (100.0%), Computers & Mathematics (100.0%), and Architecture & Engineering (100.0%), while the most female-oriented occupations are Education Instruction & Library (96.4%), Community & Social Service (93.2%), and Health Diagnosing & Treating (83.2%).
| Occupation | Male | Female |
| Management | 372 (52.0%) | 344 (48.0%) |
| Business & Financial | 113 (36.8%) | 194 (63.2%) |
| Computers, Engineering & Science | 341 (100.0%) | 0 (0.0%) |
| Computers & Mathematics | 230 (100.0%) | 0 (0.0%) |
| Architecture & Engineering | 90 (100.0%) | 0 (0.0%) |
| Life, Physical & Social Science | 21 (100.0%) | 0 (0.0%) |
| Community & Social Service | 43 (6.8%) | 590 (93.2%) |
| Education, Arts & Media | 13 (32.5%) | 27 (67.5%) |
| Legal Services & Support | 0 (0.0%) | 0 (0.0%) |
| Education Instruction & Library | 19 (3.6%) | 512 (96.4%) |
| Arts, Media & Entertainment | 11 (17.7%) | 51 (82.3%) |
| Health Diagnosing & Treating | 36 (16.8%) | 178 (83.2%) |
| Health Technologists | 36 (21.0%) | 135 (78.9%) |
| Total (Category) | 905 (40.9%) | 1,306 (59.1%) |
| Total (Overall) | 2,374 (49.5%) | 2,419 (50.5%) |
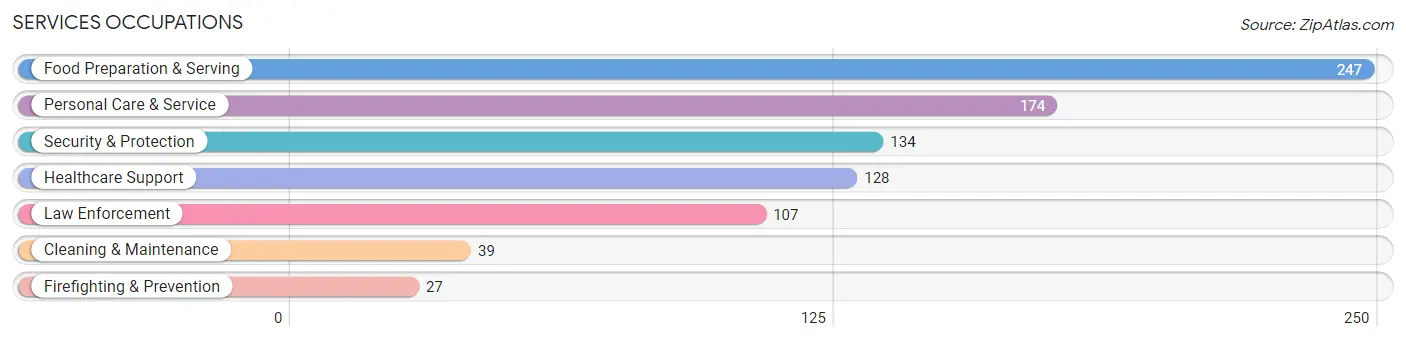
Services Occupations
The most common Services occupations in Camden County are Food Preparation & Serving (247 | 5.1%), Personal Care & Service (174 | 3.6%), Security & Protection (134 | 2.8%), Healthcare Support (128 | 2.7%), and Law Enforcement (107 | 2.2%).
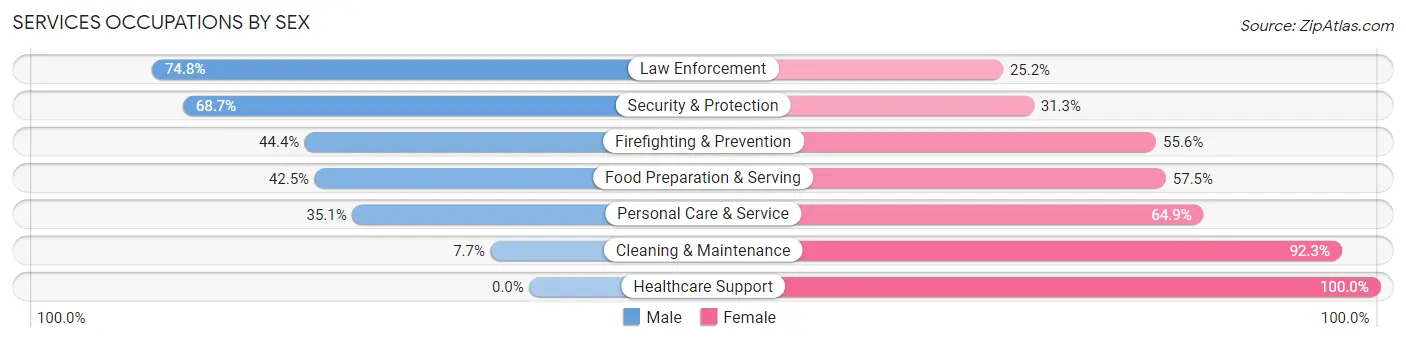
Services Occupations by Sex
Within the Services occupations in Camden County, the most male-oriented occupations are Law Enforcement (74.8%), Security & Protection (68.7%), and Firefighting & Prevention (44.4%), while the most female-oriented occupations are Healthcare Support (100.0%), Cleaning & Maintenance (92.3%), and Personal Care & Service (64.9%).
| Occupation | Male | Female |
| Healthcare Support | 0 (0.0%) | 128 (100.0%) |
| Security & Protection | 92 (68.7%) | 42 (31.3%) |
| Firefighting & Prevention | 12 (44.4%) | 15 (55.6%) |
| Law Enforcement | 80 (74.8%) | 27 (25.2%) |
| Food Preparation & Serving | 105 (42.5%) | 142 (57.5%) |
| Cleaning & Maintenance | 3 (7.7%) | 36 (92.3%) |
| Personal Care & Service | 61 (35.1%) | 113 (64.9%) |
| Total (Category) | 261 (36.1%) | 461 (63.8%) |
| Total (Overall) | 2,374 (49.5%) | 2,419 (50.5%) |
Sales and Office Occupations
The most common Sales and Office occupations in Camden County are Office & Administration (472 | 9.9%), and Sales & Related (463 | 9.7%).
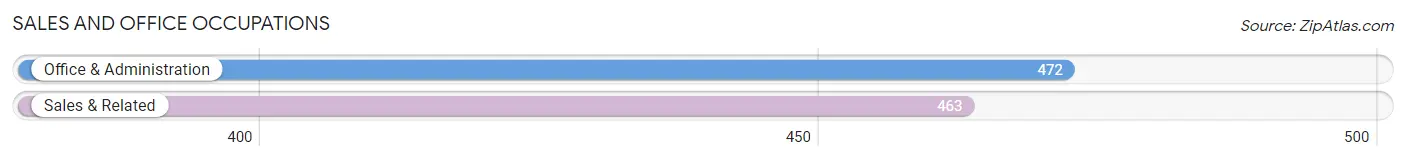
Sales and Office Occupations by Sex

| Occupation | Male | Female |
| Sales & Related | 251 (54.2%) | 212 (45.8%) |
| Office & Administration | 66 (14.0%) | 406 (86.0%) |
| Total (Category) | 317 (33.9%) | 618 (66.1%) |
| Total (Overall) | 2,374 (49.5%) | 2,419 (50.5%) |
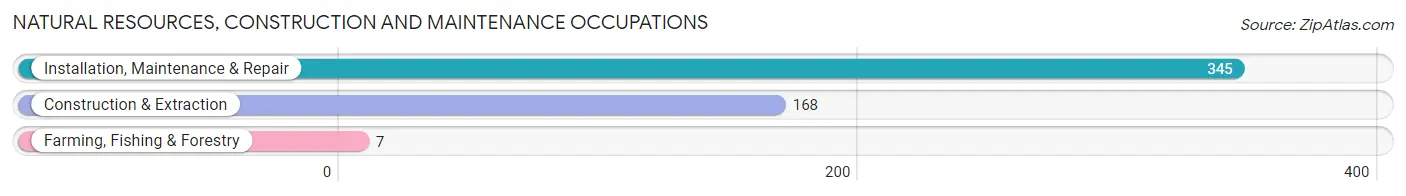
Natural Resources, Construction and Maintenance Occupations
The most common Natural Resources, Construction and Maintenance occupations in Camden County are Installation, Maintenance & Repair (345 | 7.2%), Construction & Extraction (168 | 3.5%), and Farming, Fishing & Forestry (7 | 0.2%).
Natural Resources, Construction and Maintenance Occupations by Sex
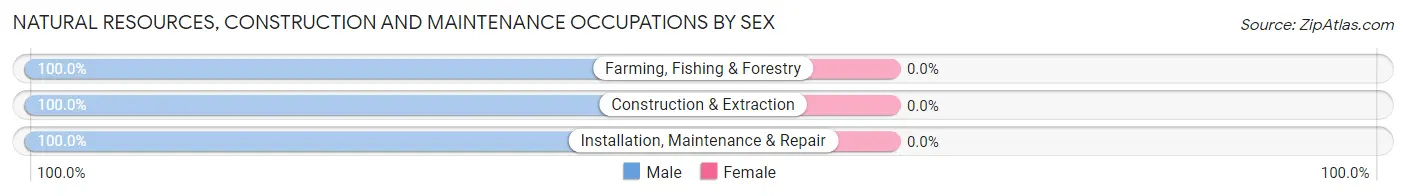
| Occupation | Male | Female |
| Farming, Fishing & Forestry | 7 (100.0%) | 0 (0.0%) |
| Construction & Extraction | 168 (100.0%) | 0 (0.0%) |
| Installation, Maintenance & Repair | 345 (100.0%) | 0 (0.0%) |
| Total (Category) | 520 (100.0%) | 0 (0.0%) |
| Total (Overall) | 2,374 (49.5%) | 2,419 (50.5%) |
Production, Transportation and Moving Occupations
The most common Production, Transportation and Moving occupations in Camden County are Production (186 | 3.9%), Material Moving (110 | 2.3%), and Transportation (109 | 2.3%).
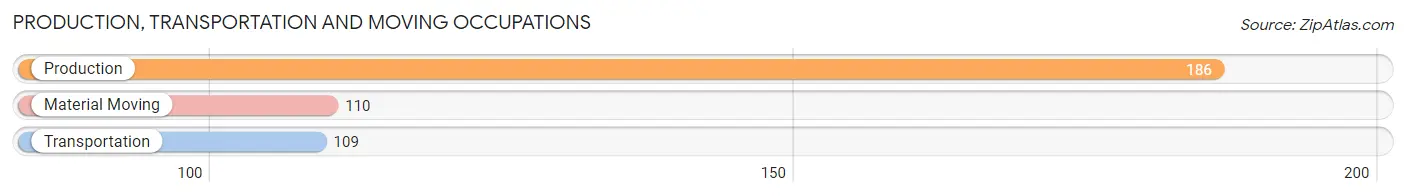
Production, Transportation and Moving Occupations by Sex
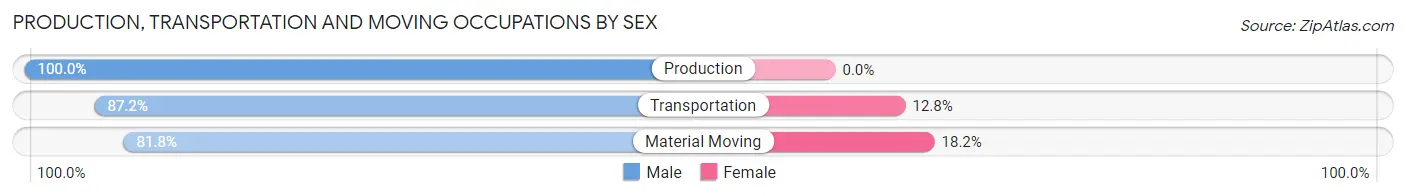
| Occupation | Male | Female |
| Production | 186 (100.0%) | 0 (0.0%) |
| Transportation | 95 (87.2%) | 14 (12.8%) |
| Material Moving | 90 (81.8%) | 20 (18.2%) |
| Total (Category) | 371 (91.6%) | 34 (8.4%) |
| Total (Overall) | 2,374 (49.5%) | 2,419 (50.5%) |
Employment Industries by Sex in Camden County
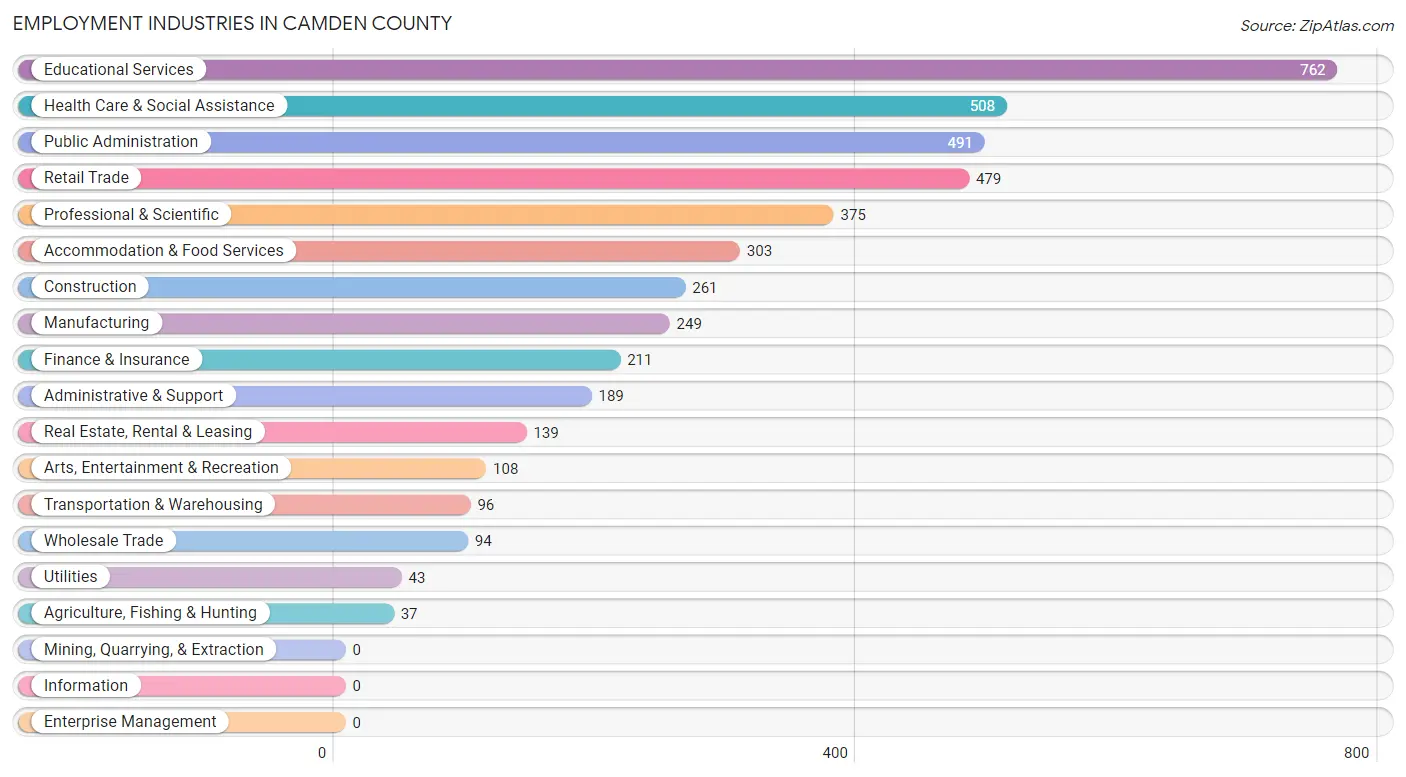
Employment Industries in Camden County
The major employment industries in Camden County include Educational Services (762 | 15.9%), Health Care & Social Assistance (508 | 10.6%), Public Administration (491 | 10.2%), Retail Trade (479 | 10.0%), and Professional & Scientific (375 | 7.8%).
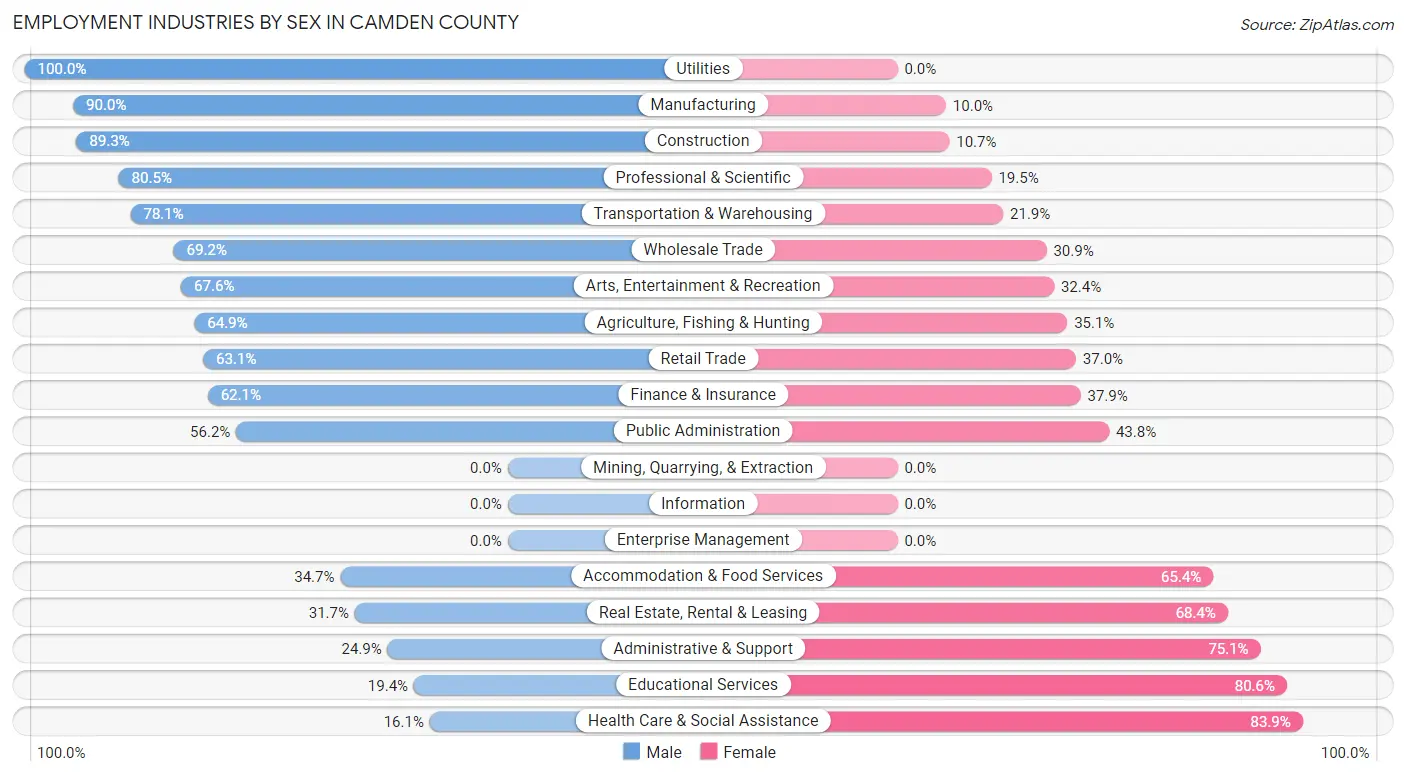
Employment Industries by Sex in Camden County
The Camden County industries that see more men than women are Utilities (100.0%), Manufacturing (90.0%), and Construction (89.3%), whereas the industries that tend to have a higher number of women are Health Care & Social Assistance (83.9%), Educational Services (80.6%), and Administrative & Support (75.1%).
| Industry | Male | Female |
| Agriculture, Fishing & Hunting | 24 (64.9%) | 13 (35.1%) |
| Mining, Quarrying, & Extraction | 0 (0.0%) | 0 (0.0%) |
| Construction | 233 (89.3%) | 28 (10.7%) |
| Manufacturing | 224 (90.0%) | 25 (10.0%) |
| Wholesale Trade | 65 (69.2%) | 29 (30.8%) |
| Retail Trade | 302 (63.0%) | 177 (36.9%) |
| Transportation & Warehousing | 75 (78.1%) | 21 (21.9%) |
| Utilities | 43 (100.0%) | 0 (0.0%) |
| Information | 0 (0.0%) | 0 (0.0%) |
| Finance & Insurance | 131 (62.1%) | 80 (37.9%) |
| Real Estate, Rental & Leasing | 44 (31.7%) | 95 (68.3%) |
| Professional & Scientific | 302 (80.5%) | 73 (19.5%) |
| Enterprise Management | 0 (0.0%) | 0 (0.0%) |
| Administrative & Support | 47 (24.9%) | 142 (75.1%) |
| Educational Services | 148 (19.4%) | 614 (80.6%) |
| Health Care & Social Assistance | 82 (16.1%) | 426 (83.9%) |
| Arts, Entertainment & Recreation | 73 (67.6%) | 35 (32.4%) |
| Accommodation & Food Services | 105 (34.6%) | 198 (65.3%) |
| Public Administration | 276 (56.2%) | 215 (43.8%) |
| Total | 2,374 (49.5%) | 2,419 (50.5%) |
Education in Camden County
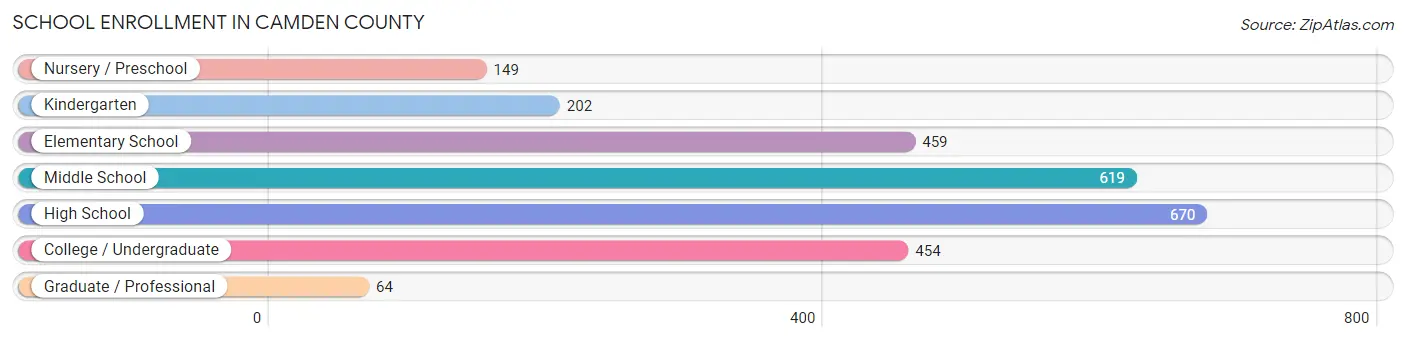
School Enrollment in Camden County
The most common levels of schooling among the 2,617 students in Camden County are high school (670 | 25.6%), middle school (619 | 23.6%), and elementary school (459 | 17.5%).
| School Level | # Students | % Students |
| Nursery / Preschool | 149 | 5.7% |
| Kindergarten | 202 | 7.7% |
| Elementary School | 459 | 17.5% |
| Middle School | 619 | 23.6% |
| High School | 670 | 25.6% |
| College / Undergraduate | 454 | 17.3% |
| Graduate / Professional | 64 | 2.5% |
| Total | 2,617 | 100.0% |
School Enrollment by Age by Funding Source in Camden County
Out of a total of 2,617 students who are enrolled in schools in Camden County, 217 (8.3%) attend a private institution, while the remaining 2,400 (91.7%) are enrolled in public schools. The age group of 25 to 34 year olds has the highest likelihood of being enrolled in private schools, with 36 (31.3% in the age bracket) enrolled. Conversely, the age group of 15 to 17 year olds has the lowest likelihood of being enrolled in a private school, with 480 (100.0% in the age bracket) attending a public institution.
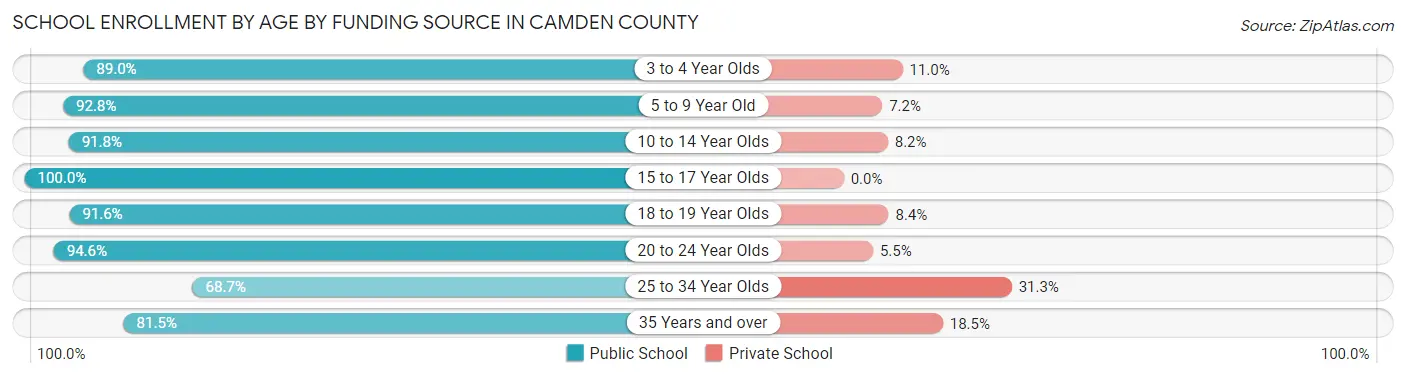
| Age Bracket | Public School | Private School |
| 3 to 4 Year Olds | 65 (89.0%) | 8 (11.0%) |
| 5 to 9 Year Old | 633 (92.8%) | 49 (7.2%) |
| 10 to 14 Year Olds | 681 (91.8%) | 61 (8.2%) |
| 15 to 17 Year Olds | 480 (100.0%) | 0 (0.0%) |
| 18 to 19 Year Olds | 252 (91.6%) | 23 (8.4%) |
| 20 to 24 Year Olds | 52 (94.6%) | 3 (5.4%) |
| 25 to 34 Year Olds | 79 (68.7%) | 36 (31.3%) |
| 35 Years and over | 159 (81.5%) | 36 (18.5%) |
| Total | 2,400 (91.7%) | 217 (8.3%) |
Educational Attainment by Field of Study in Camden County
Education (577 | 29.8%), science & technology (321 | 16.6%), business (213 | 11.0%), arts & humanities (198 | 10.2%), and engineering (125 | 6.5%) are the most common fields of study among 1,937 individuals in Camden County who have obtained a bachelor's degree or higher.
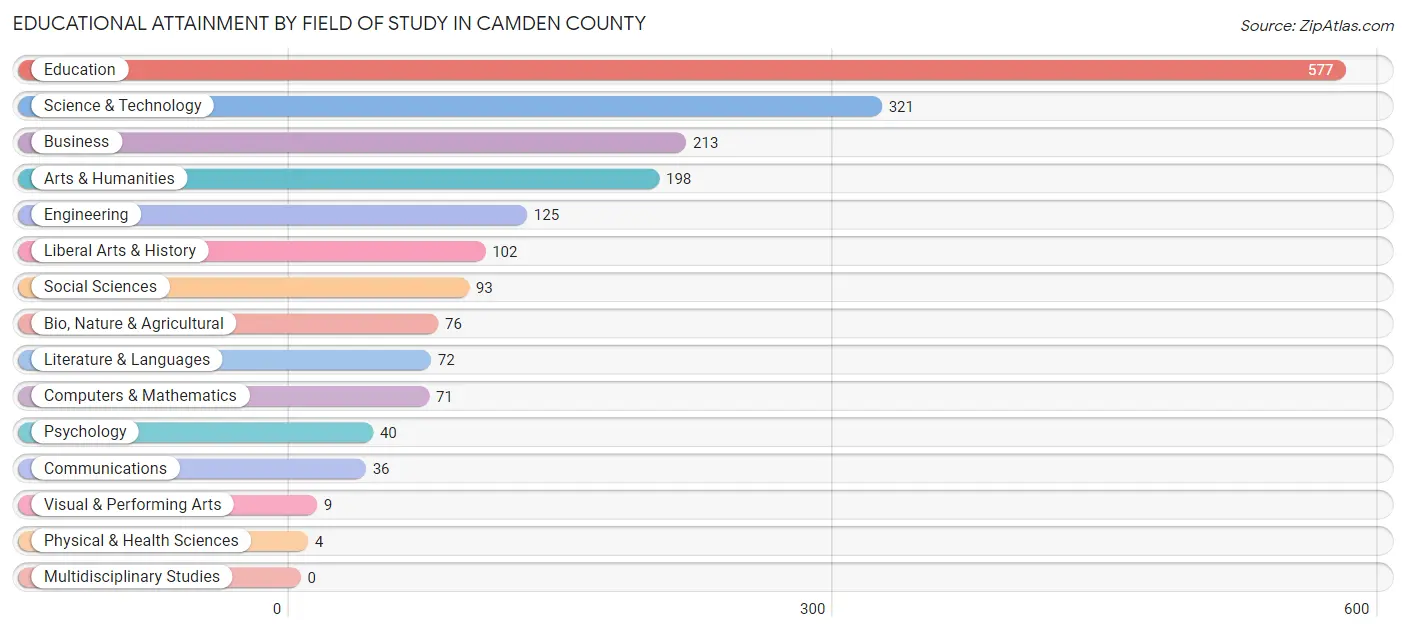
| Field of Study | # Graduates | % Graduates |
| Computers & Mathematics | 71 | 3.7% |
| Bio, Nature & Agricultural | 76 | 3.9% |
| Physical & Health Sciences | 4 | 0.2% |
| Psychology | 40 | 2.1% |
| Social Sciences | 93 | 4.8% |
| Engineering | 125 | 6.5% |
| Multidisciplinary Studies | 0 | 0.0% |
| Science & Technology | 321 | 16.6% |
| Business | 213 | 11.0% |
| Education | 577 | 29.8% |
| Literature & Languages | 72 | 3.7% |
| Liberal Arts & History | 102 | 5.3% |
| Visual & Performing Arts | 9 | 0.5% |
| Communications | 36 | 1.9% |
| Arts & Humanities | 198 | 10.2% |
| Total | 1,937 | 100.0% |
Transportation & Commute in Camden County
Vehicle Availability by Sex in Camden County
The most prevalent vehicle ownership categories in Camden County are males with 2 vehicles (1,146, accounting for 46.9%) and females with 2 vehicles (1,079, making up 47.7%).
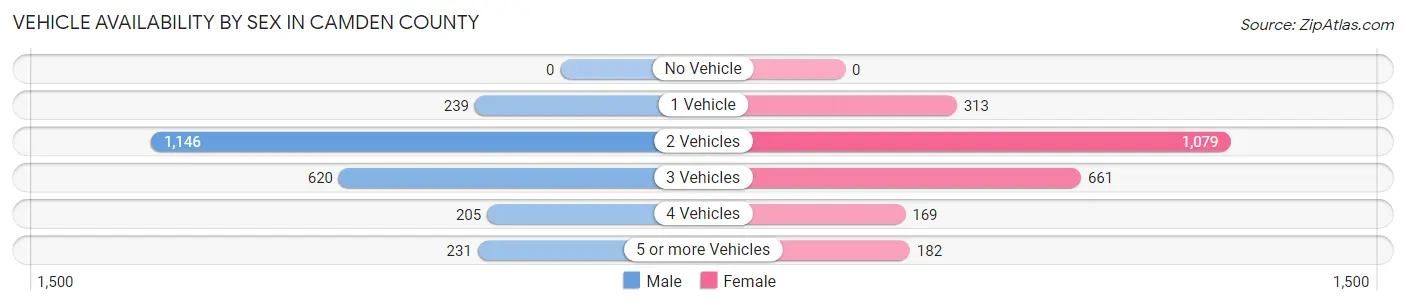
| Vehicles Available | Male | Female |
| No Vehicle | 0 (0.0%) | 0 (0.0%) |
| 1 Vehicle | 239 (9.8%) | 313 (13.0%) |
| 2 Vehicles | 1,146 (46.9%) | 1,079 (44.9%) |
| 3 Vehicles | 620 (25.4%) | 661 (27.5%) |
| 4 Vehicles | 205 (8.4%) | 169 (7.0%) |
| 5 or more Vehicles | 231 (9.5%) | 182 (7.6%) |
| Total | 2,441 (100.0%) | 2,404 (100.0%) |
Commute Time in Camden County
The most frequently occuring commute durations in Camden County are 20 to 24 minutes (734 commuters, 17.2%), 30 to 34 minutes (667 commuters, 15.6%), and 15 to 19 minutes (514 commuters, 12.0%).
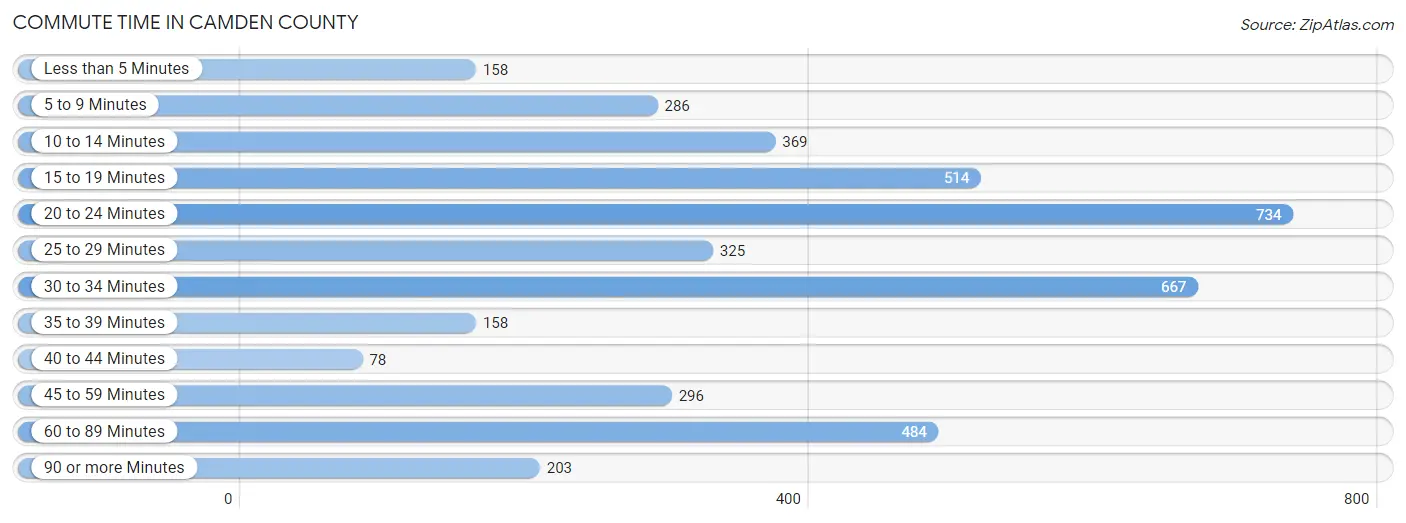
| Commute Time | # Commuters | % Commuters |
| Less than 5 Minutes | 158 | 3.7% |
| 5 to 9 Minutes | 286 | 6.7% |
| 10 to 14 Minutes | 369 | 8.6% |
| 15 to 19 Minutes | 514 | 12.0% |
| 20 to 24 Minutes | 734 | 17.2% |
| 25 to 29 Minutes | 325 | 7.6% |
| 30 to 34 Minutes | 667 | 15.6% |
| 35 to 39 Minutes | 158 | 3.7% |
| 40 to 44 Minutes | 78 | 1.8% |
| 45 to 59 Minutes | 296 | 6.9% |
| 60 to 89 Minutes | 484 | 11.3% |
| 90 or more Minutes | 203 | 4.8% |
Commute Time by Sex in Camden County
The most common commute times in Camden County are 20 to 24 minutes (420 commuters, 19.8%) for males and 30 to 34 minutes (401 commuters, 18.6%) for females.
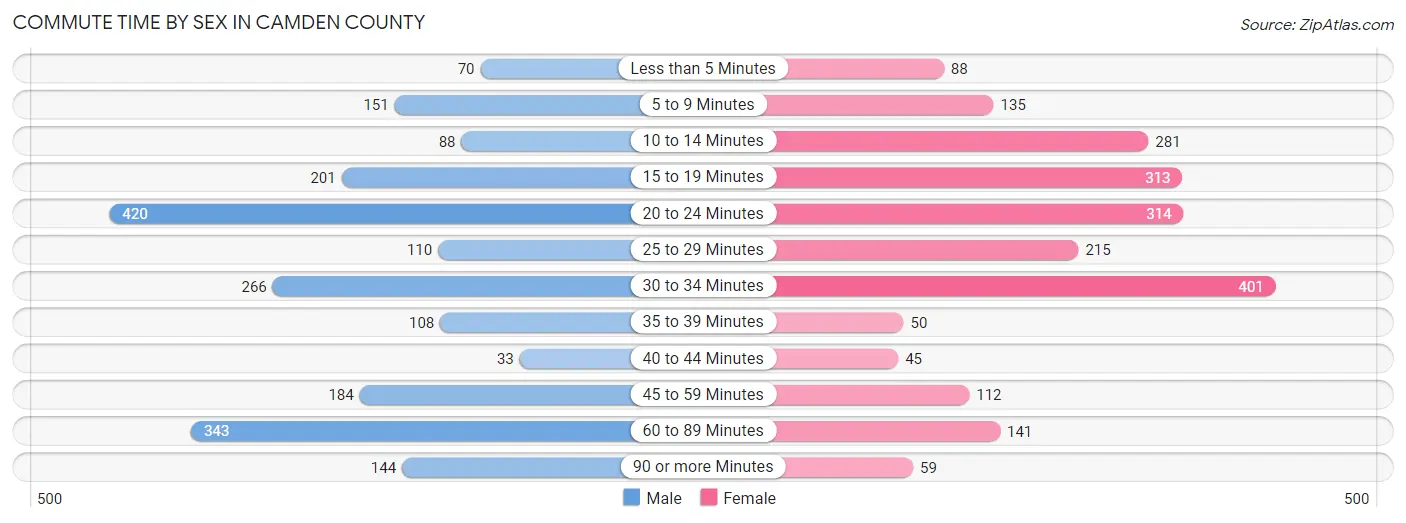
| Commute Time | Male | Female |
| Less than 5 Minutes | 70 (3.3%) | 88 (4.1%) |
| 5 to 9 Minutes | 151 (7.1%) | 135 (6.3%) |
| 10 to 14 Minutes | 88 (4.2%) | 281 (13.1%) |
| 15 to 19 Minutes | 201 (9.5%) | 313 (14.5%) |
| 20 to 24 Minutes | 420 (19.8%) | 314 (14.6%) |
| 25 to 29 Minutes | 110 (5.2%) | 215 (10.0%) |
| 30 to 34 Minutes | 266 (12.6%) | 401 (18.6%) |
| 35 to 39 Minutes | 108 (5.1%) | 50 (2.3%) |
| 40 to 44 Minutes | 33 (1.6%) | 45 (2.1%) |
| 45 to 59 Minutes | 184 (8.7%) | 112 (5.2%) |
| 60 to 89 Minutes | 343 (16.2%) | 141 (6.6%) |
| 90 or more Minutes | 144 (6.8%) | 59 (2.7%) |
Time of Departure to Work by Sex in Camden County
The most frequent times of departure to work in Camden County are 7:00 AM to 7:29 AM (366, 17.3%) for males and 8:00 AM to 8:29 AM (599, 27.8%) for females.
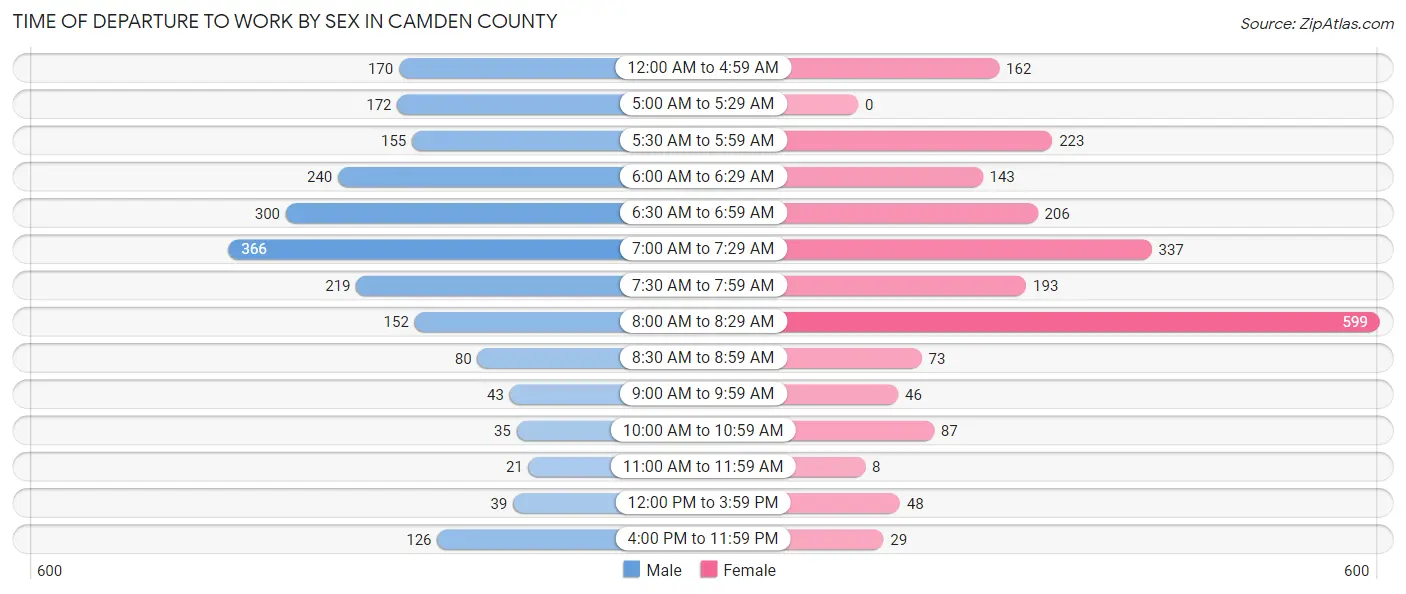
| Time of Departure | Male | Female |
| 12:00 AM to 4:59 AM | 170 (8.0%) | 162 (7.5%) |
| 5:00 AM to 5:29 AM | 172 (8.1%) | 0 (0.0%) |
| 5:30 AM to 5:59 AM | 155 (7.3%) | 223 (10.3%) |
| 6:00 AM to 6:29 AM | 240 (11.3%) | 143 (6.6%) |
| 6:30 AM to 6:59 AM | 300 (14.2%) | 206 (9.6%) |
| 7:00 AM to 7:29 AM | 366 (17.3%) | 337 (15.7%) |
| 7:30 AM to 7:59 AM | 219 (10.3%) | 193 (9.0%) |
| 8:00 AM to 8:29 AM | 152 (7.2%) | 599 (27.8%) |
| 8:30 AM to 8:59 AM | 80 (3.8%) | 73 (3.4%) |
| 9:00 AM to 9:59 AM | 43 (2.0%) | 46 (2.1%) |
| 10:00 AM to 10:59 AM | 35 (1.7%) | 87 (4.0%) |
| 11:00 AM to 11:59 AM | 21 (1.0%) | 8 (0.4%) |
| 12:00 PM to 3:59 PM | 39 (1.8%) | 48 (2.2%) |
| 4:00 PM to 11:59 PM | 126 (5.9%) | 29 (1.3%) |
| Total | 2,118 (100.0%) | 2,154 (100.0%) |
Housing Occupancy in Camden County
Occupancy by Ownership in Camden County
Of the total 3,871 dwellings in Camden County, owner-occupied units account for 3,254 (84.1%), while renter-occupied units make up 617 (15.9%).
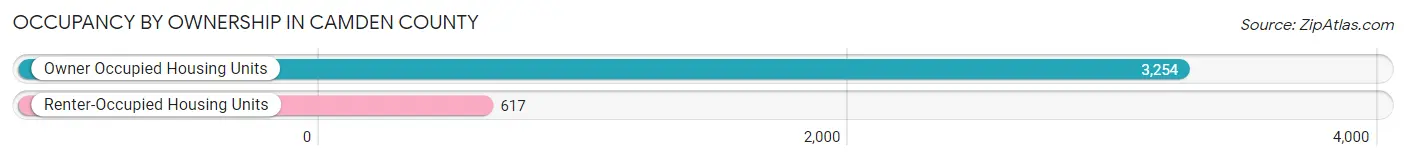
| Occupancy | # Housing Units | % Housing Units |
| Owner Occupied Housing Units | 3,254 | 84.1% |
| Renter-Occupied Housing Units | 617 | 15.9% |
| Total Occupied Housing Units | 3,871 | 100.0% |
Occupancy by Household Size in Camden County
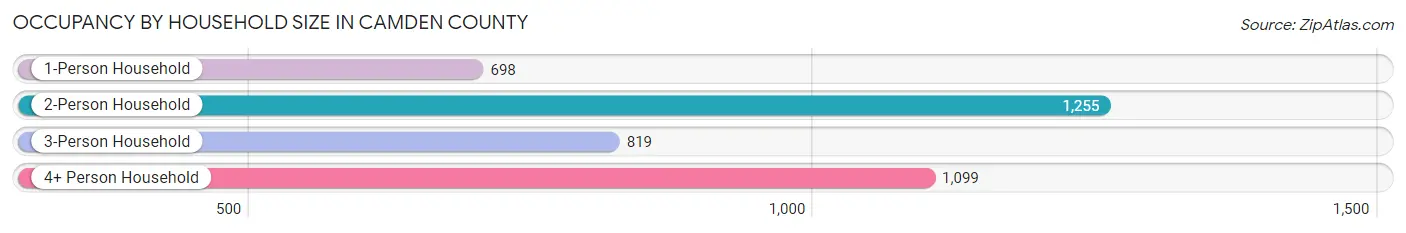
| Household Size | # Housing Units | % Housing Units |
| 1-Person Household | 698 | 18.0% |
| 2-Person Household | 1,255 | 32.4% |
| 3-Person Household | 819 | 21.2% |
| 4+ Person Household | 1,099 | 28.4% |
| Total Housing Units | 3,871 | 100.0% |
Occupancy by Ownership by Household Size in Camden County
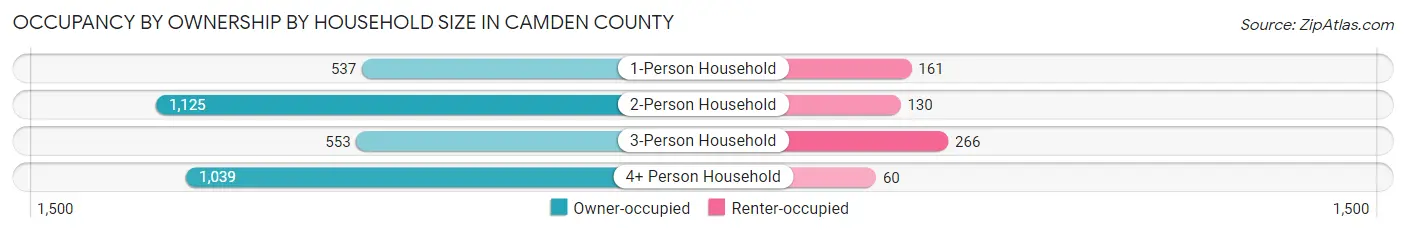
| Household Size | Owner-occupied | Renter-occupied |
| 1-Person Household | 537 (76.9%) | 161 (23.1%) |
| 2-Person Household | 1,125 (89.6%) | 130 (10.4%) |
| 3-Person Household | 553 (67.5%) | 266 (32.5%) |
| 4+ Person Household | 1,039 (94.5%) | 60 (5.5%) |
| Total Housing Units | 3,254 (84.1%) | 617 (15.9%) |
Occupancy by Educational Attainment in Camden County
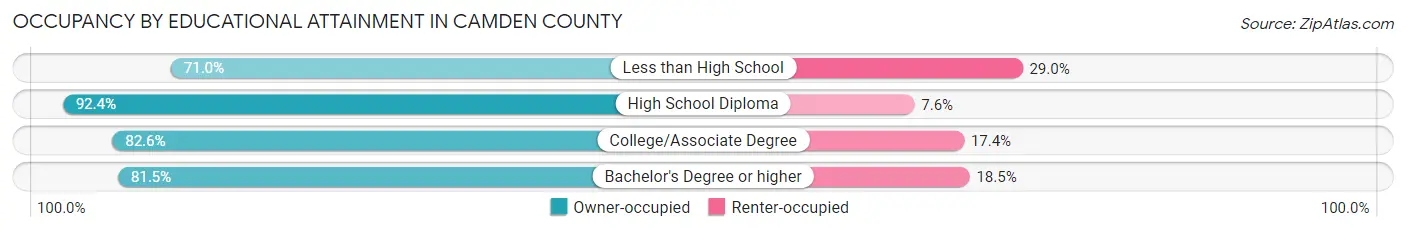
| Household Size | Owner-occupied | Renter-occupied |
| Less than High School | 186 (71.0%) | 76 (29.0%) |
| High School Diploma | 928 (92.4%) | 76 (7.6%) |
| College/Associate Degree | 1,272 (82.6%) | 268 (17.4%) |
| Bachelor's Degree or higher | 868 (81.5%) | 197 (18.5%) |
Occupancy by Age of Householder in Camden County
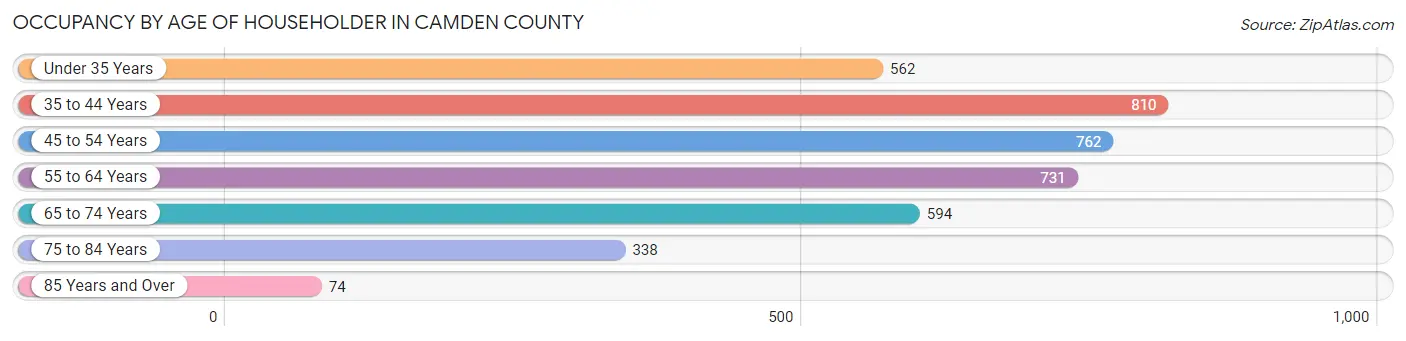
| Age Bracket | # Households | % Households |
| Under 35 Years | 562 | 14.5% |
| 35 to 44 Years | 810 | 20.9% |
| 45 to 54 Years | 762 | 19.7% |
| 55 to 64 Years | 731 | 18.9% |
| 65 to 74 Years | 594 | 15.3% |
| 75 to 84 Years | 338 | 8.7% |
| 85 Years and Over | 74 | 1.9% |
| Total | 3,871 | 100.0% |
Housing Finances in Camden County
Median Income by Occupancy in Camden County
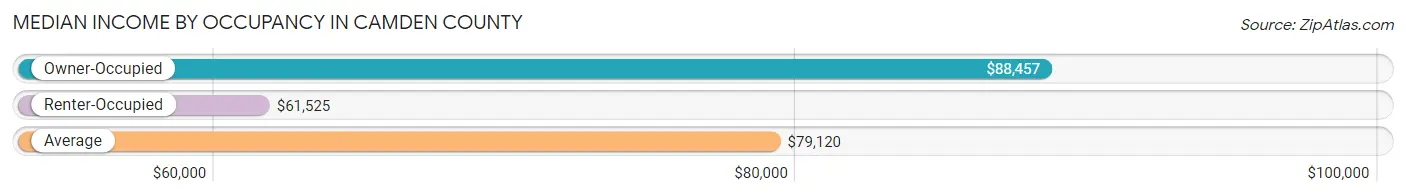
| Occupancy Type | # Households | Median Income |
| Owner-Occupied | 3,254 (84.1%) | $88,457 |
| Renter-Occupied | 617 (15.9%) | $61,525 |
| Average | 3,871 (100.0%) | $79,120 |
Occupancy by Householder Income Bracket in Camden County
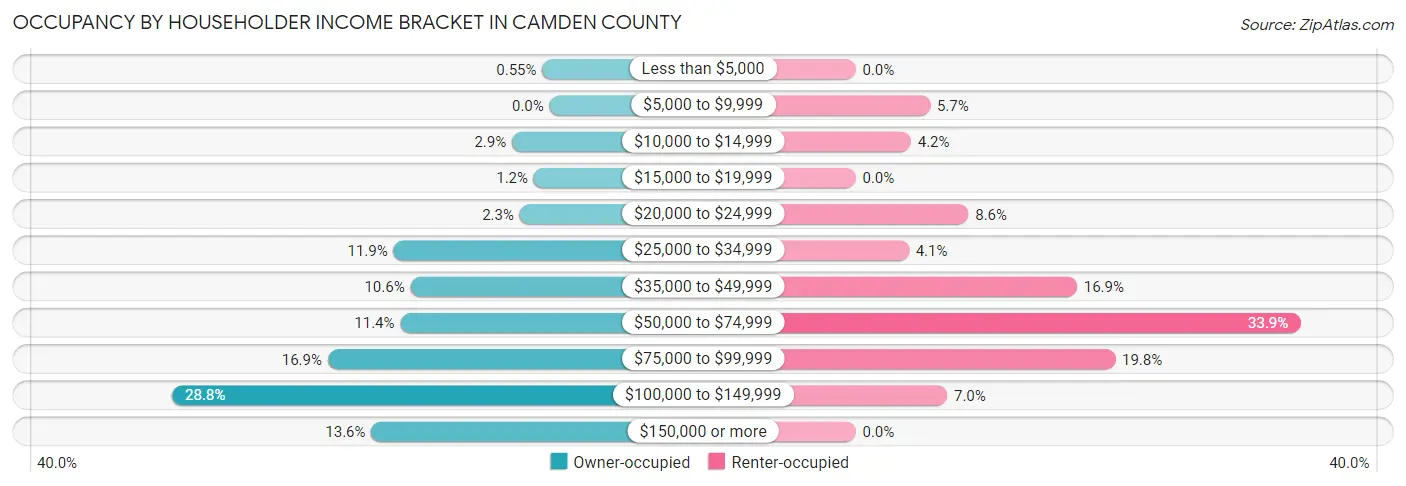
| Income Bracket | Owner-occupied | Renter-occupied |
| Less than $5,000 | 18 (0.5%) | 0 (0.0%) |
| $5,000 to $9,999 | 0 (0.0%) | 35 (5.7%) |
| $10,000 to $14,999 | 93 (2.9%) | 26 (4.2%) |
| $15,000 to $19,999 | 39 (1.2%) | 0 (0.0%) |
| $20,000 to $24,999 | 74 (2.3%) | 53 (8.6%) |
| $25,000 to $34,999 | 387 (11.9%) | 25 (4.1%) |
| $35,000 to $49,999 | 345 (10.6%) | 104 (16.9%) |
| $50,000 to $74,999 | 370 (11.4%) | 209 (33.9%) |
| $75,000 to $99,999 | 550 (16.9%) | 122 (19.8%) |
| $100,000 to $149,999 | 936 (28.8%) | 43 (7.0%) |
| $150,000 or more | 442 (13.6%) | 0 (0.0%) |
| Total | 3,254 (100.0%) | 617 (100.0%) |
Monthly Housing Cost Tiers in Camden County
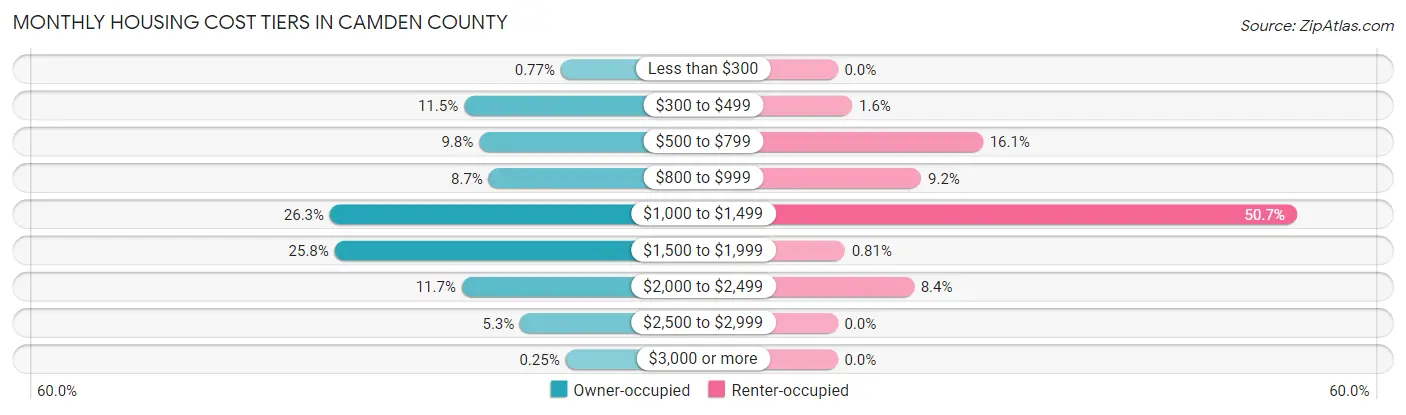
| Monthly Cost | Owner-occupied | Renter-occupied |
| Less than $300 | 25 (0.8%) | 0 (0.0%) |
| $300 to $499 | 373 (11.5%) | 10 (1.6%) |
| $500 to $799 | 319 (9.8%) | 99 (16.1%) |
| $800 to $999 | 284 (8.7%) | 57 (9.2%) |
| $1,000 to $1,499 | 855 (26.3%) | 313 (50.7%) |
| $1,500 to $1,999 | 838 (25.8%) | 5 (0.8%) |
| $2,000 to $2,499 | 381 (11.7%) | 52 (8.4%) |
| $2,500 to $2,999 | 171 (5.3%) | 0 (0.0%) |
| $3,000 or more | 8 (0.3%) | 0 (0.0%) |
| Total | 3,254 (100.0%) | 617 (100.0%) |
Physical Housing Characteristics in Camden County
Housing Structures in Camden County
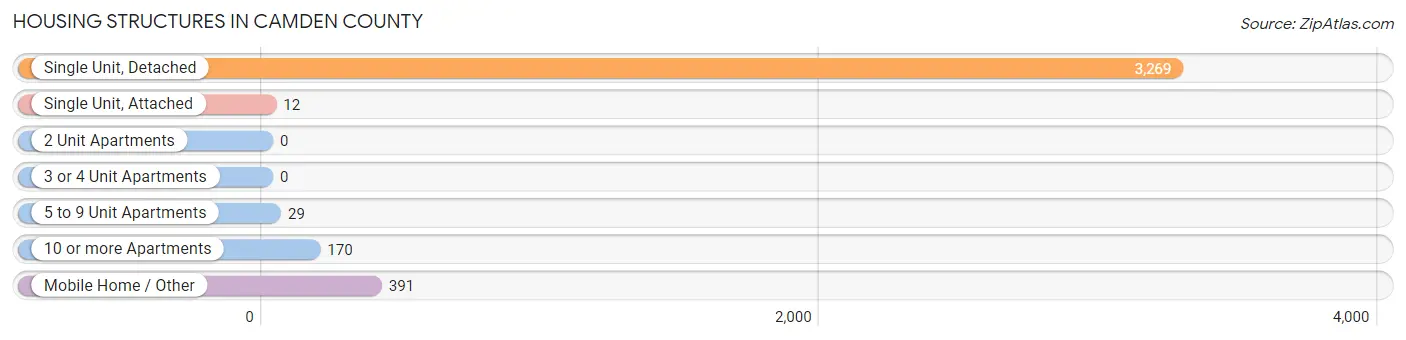
| Structure Type | # Housing Units | % Housing Units |
| Single Unit, Detached | 3,269 | 84.5% |
| Single Unit, Attached | 12 | 0.3% |
| 2 Unit Apartments | 0 | 0.0% |
| 3 or 4 Unit Apartments | 0 | 0.0% |
| 5 to 9 Unit Apartments | 29 | 0.7% |
| 10 or more Apartments | 170 | 4.4% |
| Mobile Home / Other | 391 | 10.1% |
| Total | 3,871 | 100.0% |
Housing Structures by Occupancy in Camden County
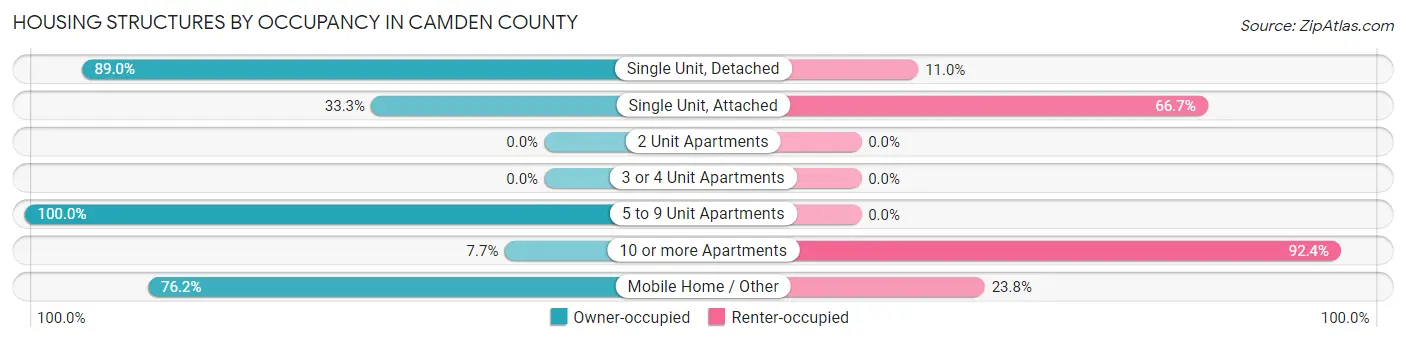
| Structure Type | Owner-occupied | Renter-occupied |
| Single Unit, Detached | 2,910 (89.0%) | 359 (11.0%) |
| Single Unit, Attached | 4 (33.3%) | 8 (66.7%) |
| 2 Unit Apartments | 0 (0.0%) | 0 (0.0%) |
| 3 or 4 Unit Apartments | 0 (0.0%) | 0 (0.0%) |
| 5 to 9 Unit Apartments | 29 (100.0%) | 0 (0.0%) |
| 10 or more Apartments | 13 (7.6%) | 157 (92.3%) |
| Mobile Home / Other | 298 (76.2%) | 93 (23.8%) |
| Total | 3,254 (84.1%) | 617 (15.9%) |
Housing Structures by Number of Rooms in Camden County
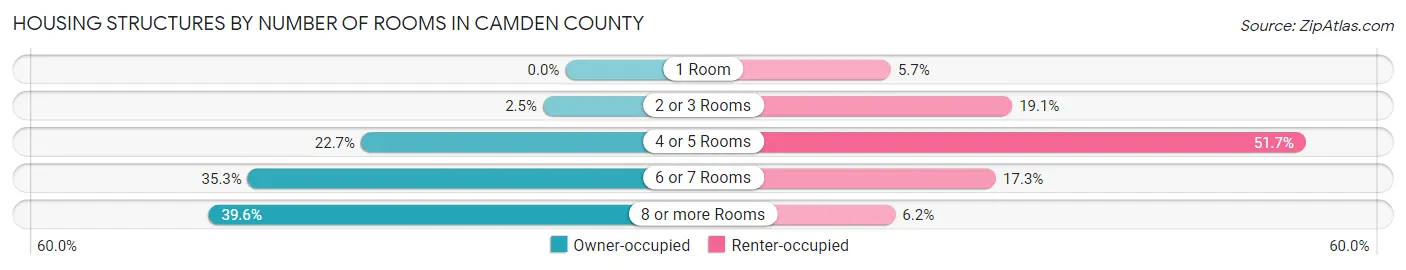
| Number of Rooms | Owner-occupied | Renter-occupied |
| 1 Room | 0 (0.0%) | 35 (5.7%) |
| 2 or 3 Rooms | 81 (2.5%) | 118 (19.1%) |
| 4 or 5 Rooms | 738 (22.7%) | 319 (51.7%) |
| 6 or 7 Rooms | 1,147 (35.2%) | 107 (17.3%) |
| 8 or more Rooms | 1,288 (39.6%) | 38 (6.2%) |
| Total | 3,254 (100.0%) | 617 (100.0%) |
Housing Structure by Heating Type in Camden County
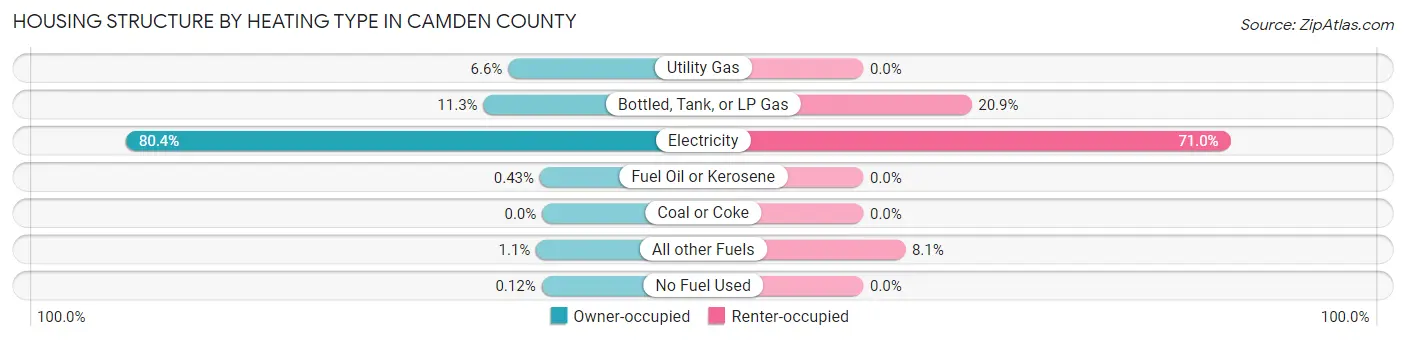
| Heating Type | Owner-occupied | Renter-occupied |
| Utility Gas | 213 (6.6%) | 0 (0.0%) |
| Bottled, Tank, or LP Gas | 369 (11.3%) | 129 (20.9%) |
| Electricity | 2,617 (80.4%) | 438 (71.0%) |
| Fuel Oil or Kerosene | 14 (0.4%) | 0 (0.0%) |
| Coal or Coke | 0 (0.0%) | 0 (0.0%) |
| All other Fuels | 37 (1.1%) | 50 (8.1%) |
| No Fuel Used | 4 (0.1%) | 0 (0.0%) |
| Total | 3,254 (100.0%) | 617 (100.0%) |
Household Vehicle Usage in Camden County
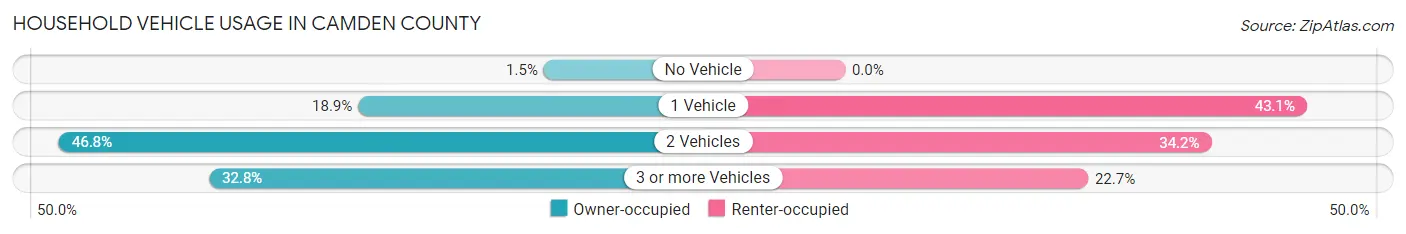
| Vehicles per Household | Owner-occupied | Renter-occupied |
| No Vehicle | 50 (1.5%) | 0 (0.0%) |
| 1 Vehicle | 614 (18.9%) | 266 (43.1%) |
| 2 Vehicles | 1,523 (46.8%) | 211 (34.2%) |
| 3 or more Vehicles | 1,067 (32.8%) | 140 (22.7%) |
| Total | 3,254 (100.0%) | 617 (100.0%) |
Real Estate & Mortgages in Camden County
Real Estate and Mortgage Overview in Camden County
| Characteristic | Without Mortgage | With Mortgage |
| Housing Units | 727 | 2,527 |
| Median Property Value | $230,600 | $270,800 |
| Median Household Income | $63,355 | $390 |
| Monthly Housing Costs | $496 | $8 |
| Real Estate Taxes | $1,729 | $43 |
Property Value by Mortgage Status in Camden County
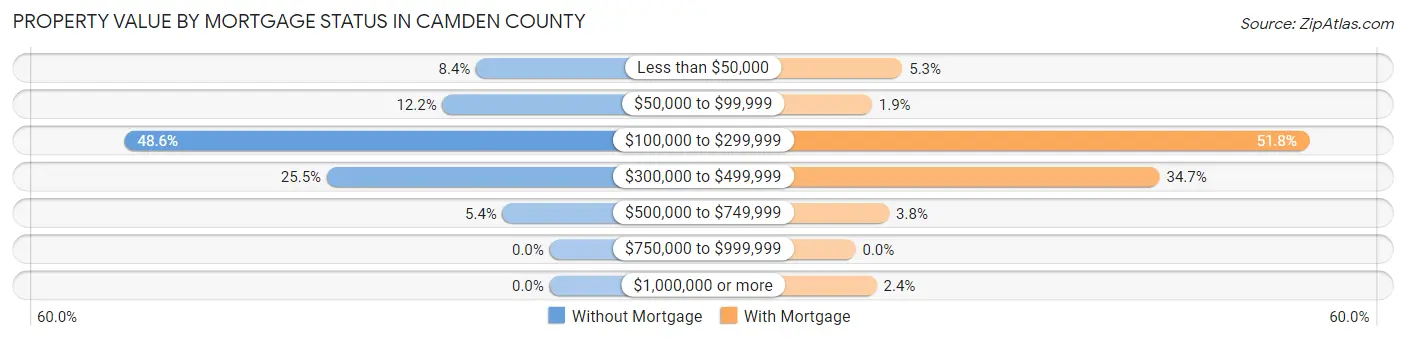
| Property Value | Without Mortgage | With Mortgage |
| Less than $50,000 | 61 (8.4%) | 135 (5.3%) |
| $50,000 to $99,999 | 89 (12.2%) | 47 (1.9%) |
| $100,000 to $299,999 | 353 (48.6%) | 1,309 (51.8%) |
| $300,000 to $499,999 | 185 (25.5%) | 878 (34.7%) |
| $500,000 to $749,999 | 39 (5.4%) | 97 (3.8%) |
| $750,000 to $999,999 | 0 (0.0%) | 0 (0.0%) |
| $1,000,000 or more | 0 (0.0%) | 61 (2.4%) |
| Total | 727 (100.0%) | 2,527 (100.0%) |
Household Income by Mortgage Status in Camden County
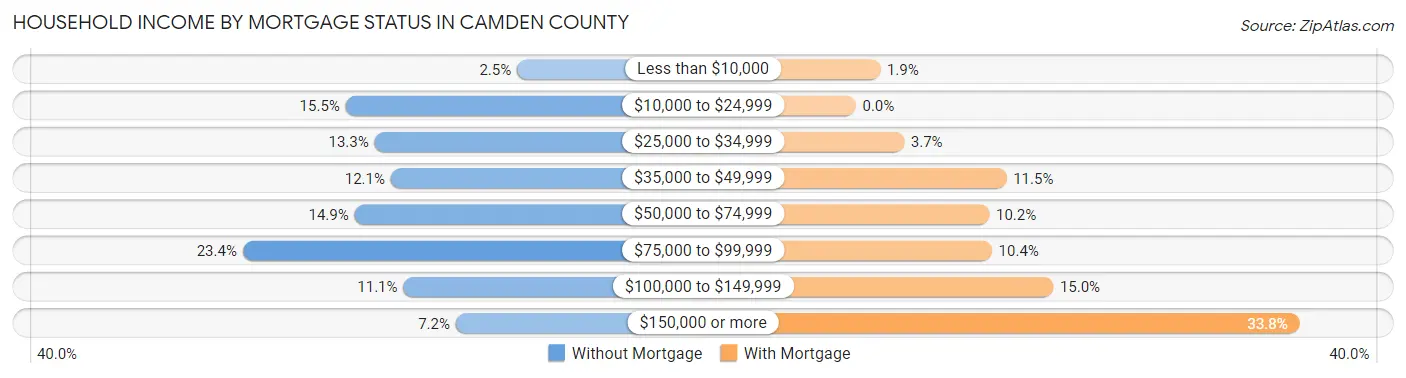
| Household Income | Without Mortgage | With Mortgage |
| Less than $10,000 | 18 (2.5%) | 47 (1.9%) |
| $10,000 to $24,999 | 113 (15.5%) | 0 (0.0%) |
| $25,000 to $34,999 | 97 (13.3%) | 93 (3.7%) |
| $35,000 to $49,999 | 88 (12.1%) | 290 (11.5%) |
| $50,000 to $74,999 | 108 (14.9%) | 257 (10.2%) |
| $75,000 to $99,999 | 170 (23.4%) | 262 (10.4%) |
| $100,000 to $149,999 | 81 (11.1%) | 380 (15.0%) |
| $150,000 or more | 52 (7.1%) | 855 (33.8%) |
| Total | 727 (100.0%) | 2,527 (100.0%) |
Property Value to Household Income Ratio in Camden County
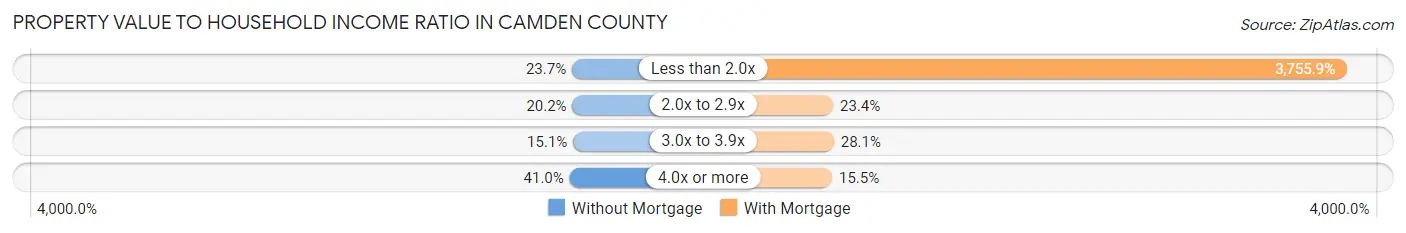
| Value-to-Income Ratio | Without Mortgage | With Mortgage |
| Less than 2.0x | 172 (23.7%) | 94,912 (3,755.9%) |
| 2.0x to 2.9x | 147 (20.2%) | 590 (23.4%) |
| 3.0x to 3.9x | 110 (15.1%) | 711 (28.1%) |
| 4.0x or more | 298 (41.0%) | 392 (15.5%) |
| Total | 727 (100.0%) | 2,527 (100.0%) |
Real Estate Taxes by Mortgage Status in Camden County
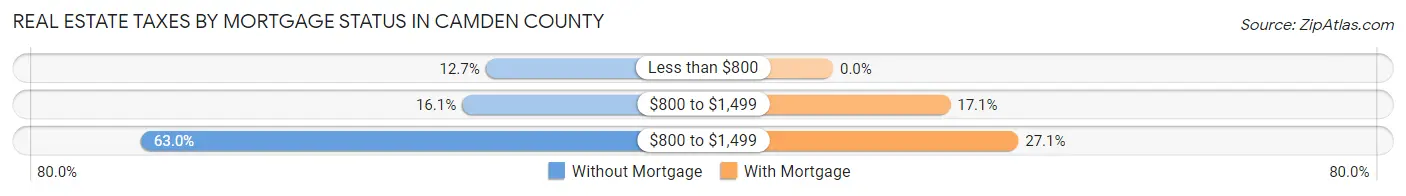
| Property Taxes | Without Mortgage | With Mortgage |
| Less than $800 | 92 (12.7%) | 0 (0.0%) |
| $800 to $1,499 | 117 (16.1%) | 433 (17.1%) |
| $800 to $1,499 | 458 (63.0%) | 684 (27.1%) |
| Total | 727 (100.0%) | 2,527 (100.0%) |
Health & Disability in Camden County
Health Insurance Coverage by Age in Camden County
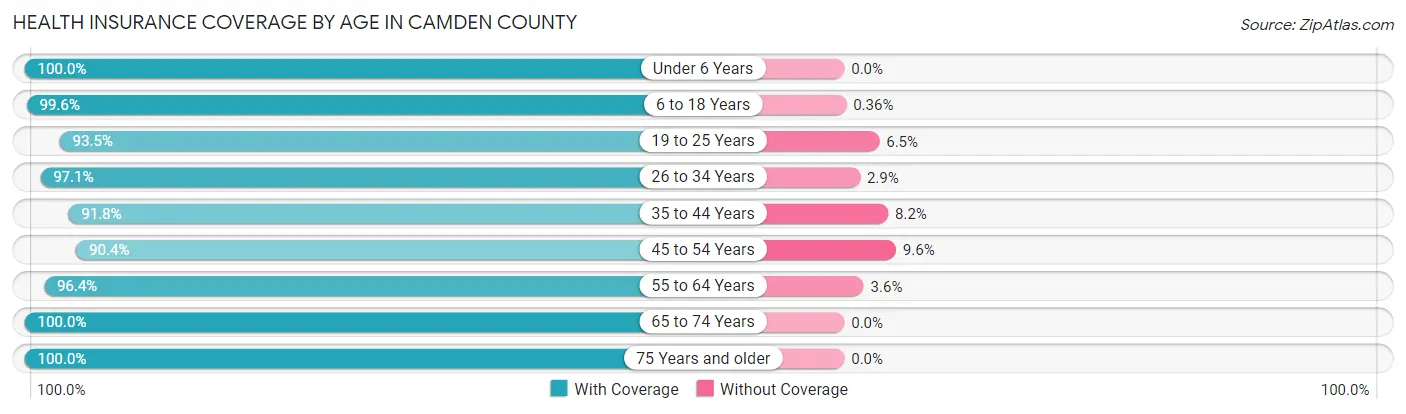
| Age Bracket | With Coverage | Without Coverage |
| Under 6 Years | 744 (100.0%) | 0 (0.0%) |
| 6 to 18 Years | 1,958 (99.6%) | 7 (0.4%) |
| 19 to 25 Years | 545 (93.5%) | 38 (6.5%) |
| 26 to 34 Years | 1,096 (97.1%) | 33 (2.9%) |
| 35 to 44 Years | 1,203 (91.8%) | 107 (8.2%) |
| 45 to 54 Years | 1,325 (90.4%) | 141 (9.6%) |
| 55 to 64 Years | 1,548 (96.4%) | 58 (3.6%) |
| 65 to 74 Years | 1,003 (100.0%) | 0 (0.0%) |
| 75 Years and older | 659 (100.0%) | 0 (0.0%) |
| Total | 10,081 (96.3%) | 384 (3.7%) |
Health Insurance Coverage by Citizenship Status in Camden County
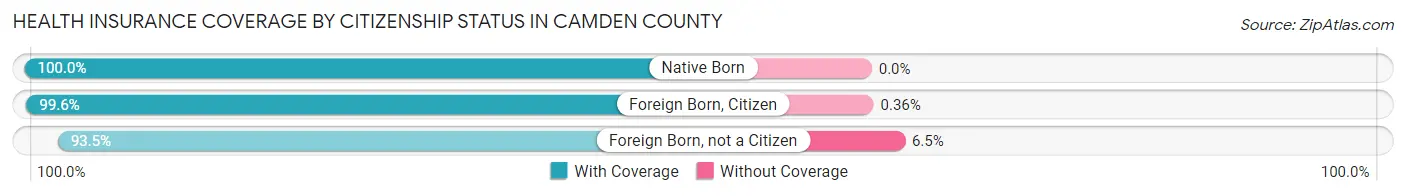
| Citizenship Status | With Coverage | Without Coverage |
| Native Born | 744 (100.0%) | 0 (0.0%) |
| Foreign Born, Citizen | 1,958 (99.6%) | 7 (0.4%) |
| Foreign Born, not a Citizen | 545 (93.5%) | 38 (6.5%) |
Health Insurance Coverage by Household Income in Camden County
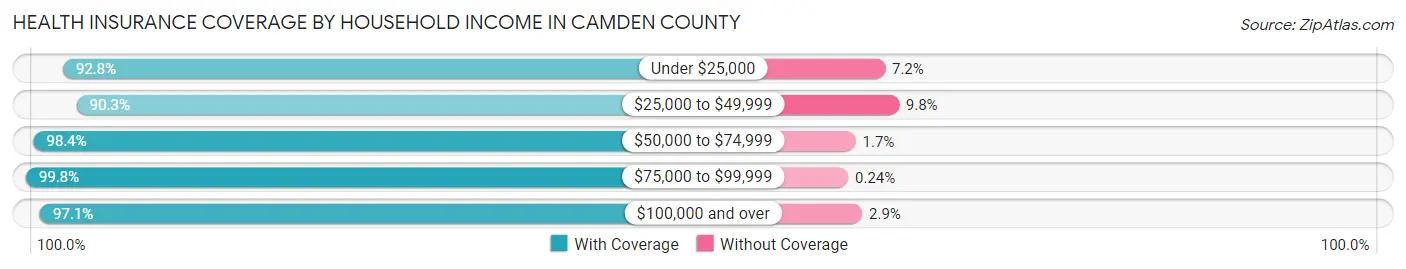
| Household Income | With Coverage | Without Coverage |
| Under $25,000 | 454 (92.8%) | 35 (7.2%) |
| $25,000 to $49,999 | 1,435 (90.2%) | 155 (9.8%) |
| $50,000 to $74,999 | 1,545 (98.4%) | 26 (1.7%) |
| $75,000 to $99,999 | 1,690 (99.8%) | 4 (0.2%) |
| $100,000 and over | 4,941 (97.1%) | 146 (2.9%) |
Public vs Private Health Insurance Coverage by Age in Camden County
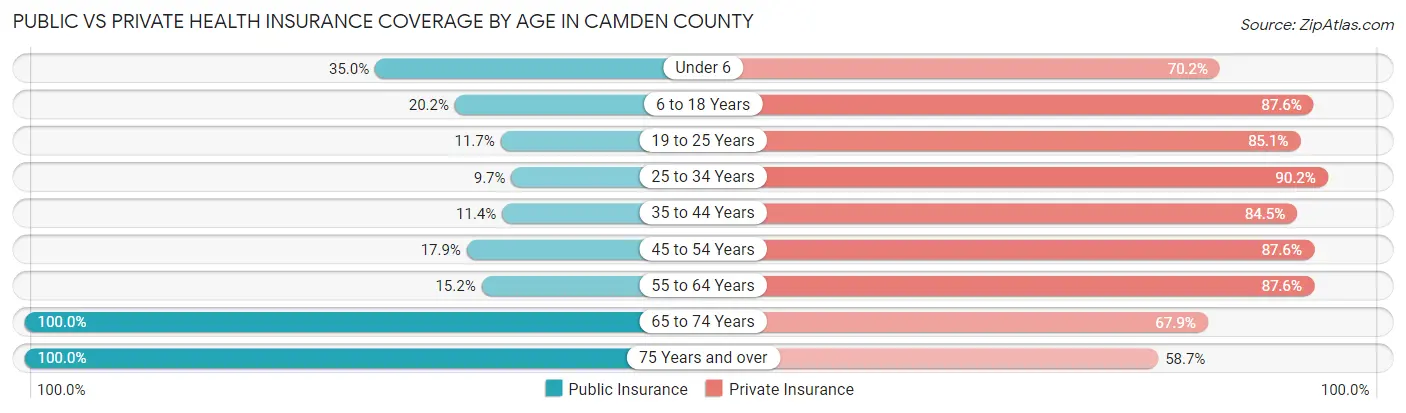
| Age Bracket | Public Insurance | Private Insurance |
| Under 6 | 260 (34.9%) | 522 (70.2%) |
| 6 to 18 Years | 396 (20.2%) | 1,721 (87.6%) |
| 19 to 25 Years | 68 (11.7%) | 496 (85.1%) |
| 25 to 34 Years | 109 (9.7%) | 1,018 (90.2%) |
| 35 to 44 Years | 149 (11.4%) | 1,107 (84.5%) |
| 45 to 54 Years | 263 (17.9%) | 1,284 (87.6%) |
| 55 to 64 Years | 244 (15.2%) | 1,407 (87.6%) |
| 65 to 74 Years | 1,003 (100.0%) | 681 (67.9%) |
| 75 Years and over | 659 (100.0%) | 387 (58.7%) |
| Total | 3,151 (30.1%) | 8,623 (82.4%) |
Disability Status by Sex by Age in Camden County
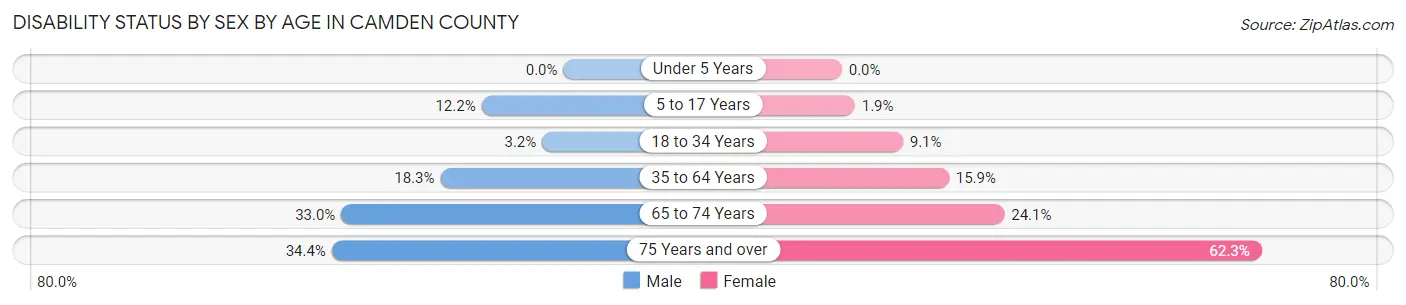
| Age Bracket | Male | Female |
| Under 5 Years | 0 (0.0%) | 0 (0.0%) |
| 5 to 17 Years | 128 (12.2%) | 17 (1.9%) |
| 18 to 34 Years | 31 (3.2%) | 84 (9.1%) |
| 35 to 64 Years | 397 (18.3%) | 351 (15.9%) |
| 65 to 74 Years | 160 (33.0%) | 125 (24.1%) |
| 75 Years and over | 97 (34.4%) | 235 (62.3%) |
Disability Class by Sex by Age in Camden County
Disability Class: Hearing Difficulty
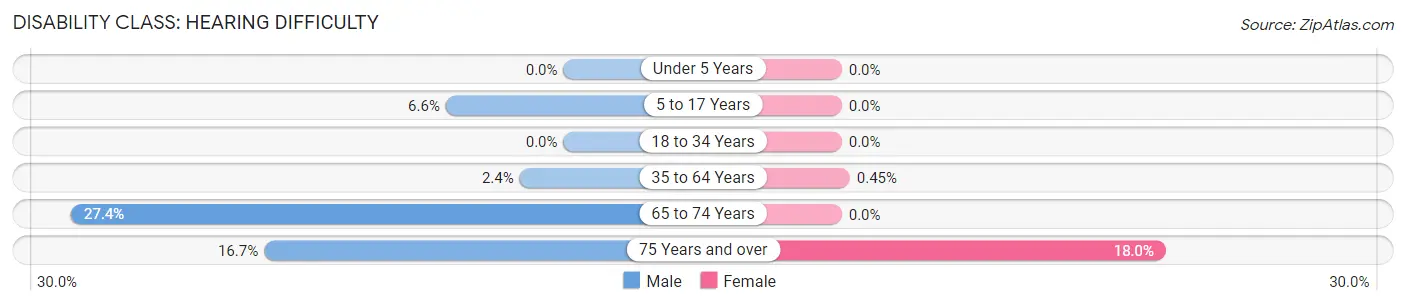
| Age Bracket | Male | Female |
| Under 5 Years | 0 (0.0%) | 0 (0.0%) |
| 5 to 17 Years | 69 (6.6%) | 0 (0.0%) |
| 18 to 34 Years | 0 (0.0%) | 0 (0.0%) |
| 35 to 64 Years | 53 (2.4%) | 10 (0.4%) |
| 65 to 74 Years | 133 (27.4%) | 0 (0.0%) |
| 75 Years and over | 47 (16.7%) | 68 (18.0%) |
Disability Class: Vision Difficulty
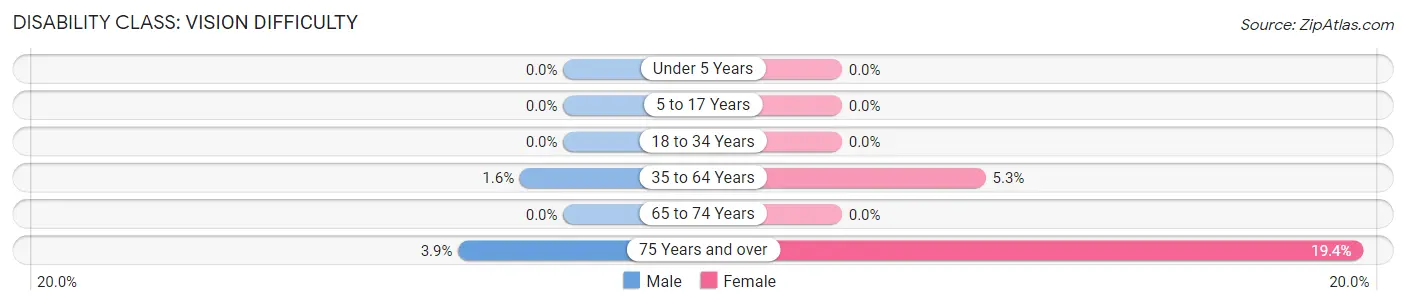
| Age Bracket | Male | Female |
| Under 5 Years | 0 (0.0%) | 0 (0.0%) |
| 5 to 17 Years | 0 (0.0%) | 0 (0.0%) |
| 18 to 34 Years | 0 (0.0%) | 0 (0.0%) |
| 35 to 64 Years | 35 (1.6%) | 118 (5.3%) |
| 65 to 74 Years | 0 (0.0%) | 0 (0.0%) |
| 75 Years and over | 11 (3.9%) | 73 (19.4%) |
Disability Class: Cognitive Difficulty
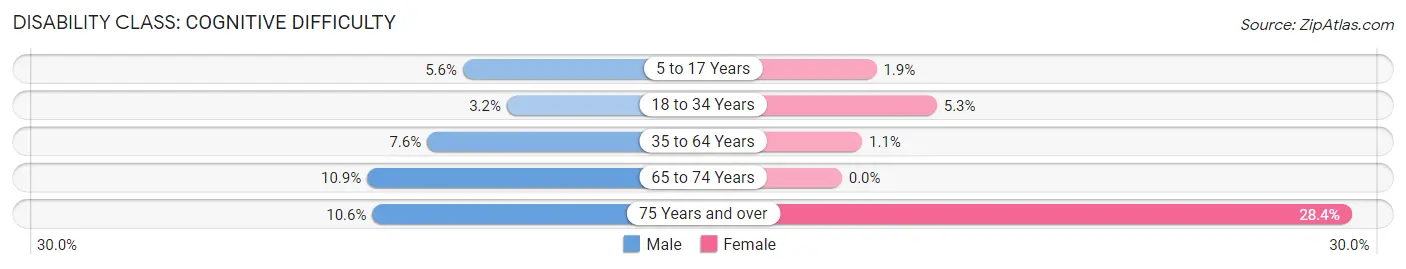
| Age Bracket | Male | Female |
| 5 to 17 Years | 59 (5.6%) | 17 (1.9%) |
| 18 to 34 Years | 31 (3.2%) | 49 (5.3%) |
| 35 to 64 Years | 165 (7.6%) | 25 (1.1%) |
| 65 to 74 Years | 53 (10.9%) | 0 (0.0%) |
| 75 Years and over | 30 (10.6%) | 107 (28.4%) |
Disability Class: Ambulatory Difficulty
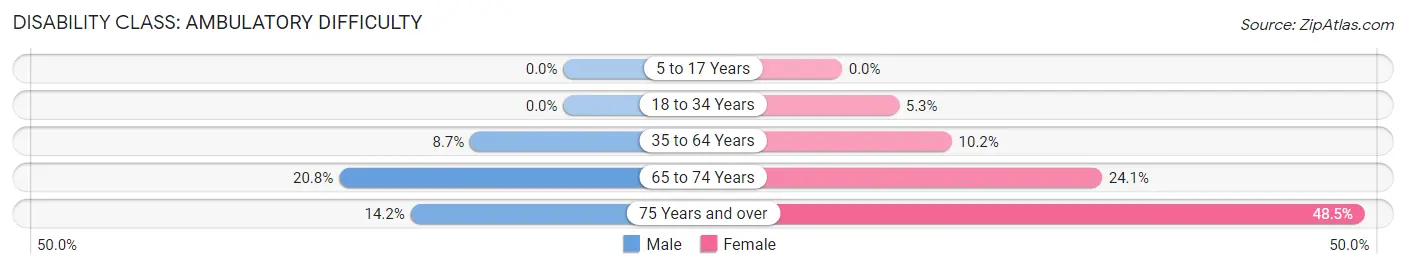
| Age Bracket | Male | Female |
| 5 to 17 Years | 0 (0.0%) | 0 (0.0%) |
| 18 to 34 Years | 0 (0.0%) | 49 (5.3%) |
| 35 to 64 Years | 188 (8.6%) | 225 (10.2%) |
| 65 to 74 Years | 101 (20.8%) | 125 (24.1%) |
| 75 Years and over | 40 (14.2%) | 183 (48.5%) |
Disability Class: Self-Care Difficulty
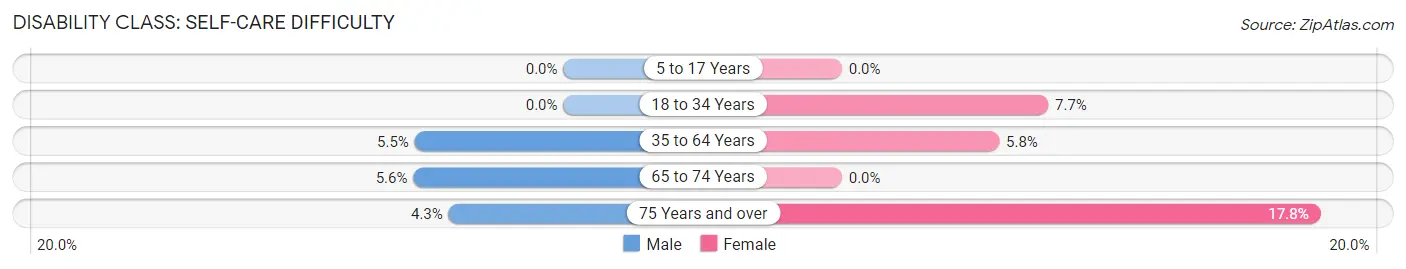
| Age Bracket | Male | Female |
| 5 to 17 Years | 0 (0.0%) | 0 (0.0%) |
| 18 to 34 Years | 0 (0.0%) | 71 (7.7%) |
| 35 to 64 Years | 120 (5.5%) | 129 (5.8%) |
| 65 to 74 Years | 27 (5.6%) | 0 (0.0%) |
| 75 Years and over | 12 (4.3%) | 67 (17.8%) |
Technology Access in Camden County
Computing Device Access in Camden County
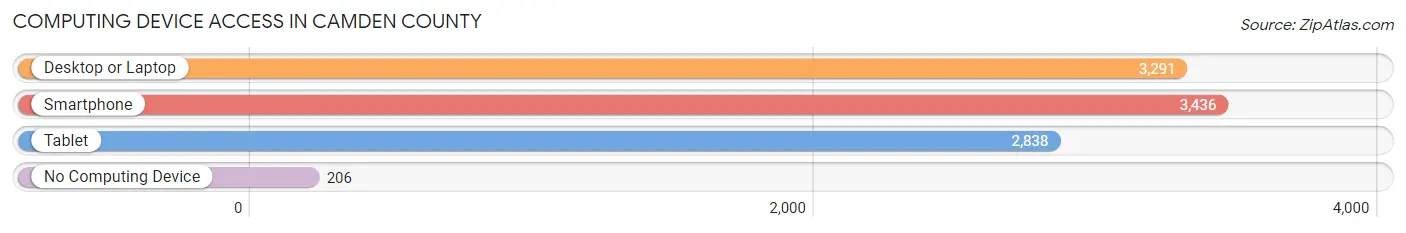
| Device Type | # Households | % Households |
| Desktop or Laptop | 3,291 | 85.0% |
| Smartphone | 3,436 | 88.8% |
| Tablet | 2,838 | 73.3% |
| No Computing Device | 206 | 5.3% |
| Total | 3,871 | 100.0% |
Internet Access in Camden County
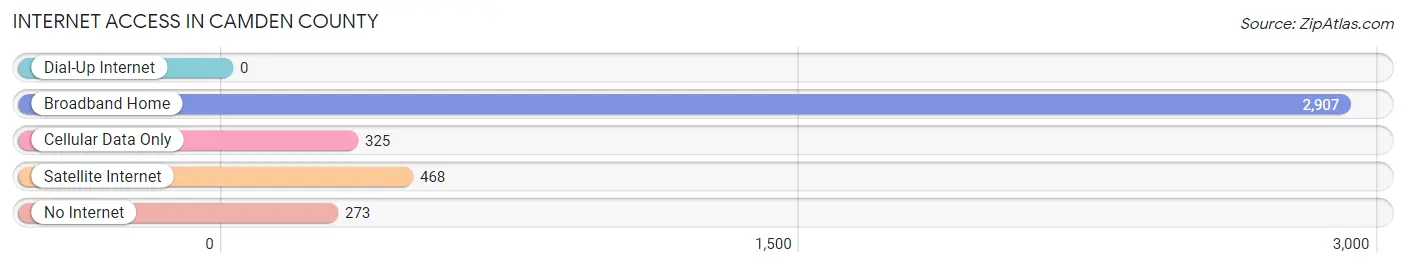
| Internet Type | # Households | % Households |
| Dial-Up Internet | 0 | 0.0% |
| Broadband Home | 2,907 | 75.1% |
| Cellular Data Only | 325 | 8.4% |
| Satellite Internet | 468 | 12.1% |
| No Internet | 273 | 7.0% |
| Total | 3,871 | 100.0% |
Camden County Summary
Camden County is located in the northeastern corner of North Carolina, and is part of the Outer Banks region. It is bordered by Currituck County to the north, Pasquotank County to the west, and Dare County to the south. The county seat is Camden, and the county is home to a population of approximately 5,000 people.
History
The area that is now Camden County was originally inhabited by the Algonquian-speaking tribes of the Croatan and Coree. The first European settlers arrived in the area in the late 17th century, and the county was officially established in 1777. The county was named after Charles Pratt, 1st Earl of Camden, who was a British politician and lawyer.
During the American Revolution, Camden County was the site of several battles, including the Battle of Camden, which was fought in 1780. The county was also the site of the Battle of Elizabeth City, which was fought in 1781.
In the 19th century, Camden County was home to several prominent families, including the Moore, Sawyer, and Sawyer-Cox families. The county was also home to several prominent African-American families, including the Bell, Davis, and White families.
Geography
Camden County is located in the northeastern corner of North Carolina, and is part of the Outer Banks region. It is bordered by Currituck County to the north, Pasquotank County to the west, and Dare County to the south. The county is approximately 545 square miles in size, and is divided into four townships: Camden, Currituck, Pasquotank, and Dare.
The county is home to several bodies of water, including the Albemarle Sound, the Pasquotank River, and the Currituck Sound. The county is also home to several islands, including the Outer Banks islands of Roanoke, Hatteras, and Ocracoke.
Economy
The economy of Camden County is largely based on tourism, fishing, and agriculture. The county is home to several tourist attractions, including the Outer Banks National Seashore, the Wright Brothers National Memorial, and the Elizabeth City State University.
The county is also home to several fishing villages, including the villages of Wanchese, Hatteras, and Ocracoke. The county is also home to several farms, which produce a variety of crops, including corn, soybeans, and wheat.
Demographics
As of the 2010 census, Camden County had a population of 5,000 people. The racial makeup of the county was 79.2% White, 15.2% African American, 0.7% Native American, 0.3% Asian, 0.1% Pacific Islander, and 4.5% from other races. The median household income was $37,941, and the median family income was $45,941.
The county is home to several religious denominations, including Baptist, Methodist, and Episcopal. The county is also home to several educational institutions, including Elizabeth City State University, the College of the Albemarle, and the Camden County Schools.
Common Questions
What is Per Capita Income in Camden County?
Per Capita income in Camden County is $34,117.
What is the Median Family Income in Camden County?
Median Family Income in Camden County is $88,953.
What is the Median Household income in Camden County?
Median Household Income in Camden County is $79,120.
What is Income or Wage Gap in Camden County?
Income or Wage Gap in Camden County is 26.0%.
Women in Camden County earn 74.0 cents for every dollar earned by a man.
What is Inequality or Gini Index in Camden County?
Inequality or Gini Index in Camden County is 0.35.
What is the Total Population of Camden County?
Total Population of Camden County is 10,547.
What is the Total Male Population of Camden County?
Total Male Population of Camden County is 5,494.
What is the Total Female Population of Camden County?
Total Female Population of Camden County is 5,053.
What is the Ratio of Males per 100 Females in Camden County?
There are 108.73 Males per 100 Females in Camden County.
What is the Ratio of Females per 100 Males in Camden County?
There are 91.97 Females per 100 Males in Camden County.
What is the Median Population Age in Camden County?
Median Population Age in Camden County is 41.1 Years.
What is the Average Family Size in Camden County
Average Family Size in Camden County is 3.1 People.
What is the Average Household Size in Camden County
Average Household Size in Camden County is 2.7 People.
How Large is the Labor Force in Camden County?
There are 5,163 People in the Labor Forcein in Camden County.
What is the Percentage of People in the Labor Force in Camden County?
62.8% of People are in the Labor Force in Camden County.
What is the Unemployment Rate in Camden County?
Unemployment Rate in Camden County is 5.7%.