Burke County, NC Map & Demographics
Burke County Map
Burke County Overview
$30,633
PER CAPITA INCOME
$66,702
AVG FAMILY INCOME
$53,732
AVG HOUSEHOLD INCOME
23.7%
WAGE / INCOME GAP [ % ]
76.3¢/ $1
WAGE / INCOME GAP [ $ ]
$10,012
FAMILY INCOME DEFICIT
0.45
INEQUALITY / GINI INDEX
87,799
TOTAL POPULATION
44,022
MALE POPULATION
43,777
FEMALE POPULATION
100.56
MALES / 100 FEMALES
99.44
FEMALES / 100 MALES
45.1
MEDIAN AGE
2.9
AVG FAMILY SIZE
2.4
AVG HOUSEHOLD SIZE
42,140
LABOR FORCE [ PEOPLE ]
57.1%
PERCENT IN LABOR FORCE
6.0%
UNEMPLOYMENT RATE
Income in Burke County
Income Overview in Burke County
Per Capita Income in Burke County is $30,633, while median incomes of families and households are $66,702 and $53,732 respectively.
| Characteristic | Number | Measure |
| Per Capita Income | 87,799 | $30,633 |
| Median Family Income | 23,945 | $66,702 |
| Mean Family Income | 23,945 | $85,564 |
| Median Household Income | 35,195 | $53,732 |
| Mean Household Income | 35,195 | $73,190 |
| Income Deficit | 23,945 | $10,012 |
| Wage / Income Gap (%) | 87,799 | 23.71% |
| Wage / Income Gap ($) | 87,799 | 76.29¢ per $1 |
| Gini / Inequality Index | 87,799 | 0.45 |
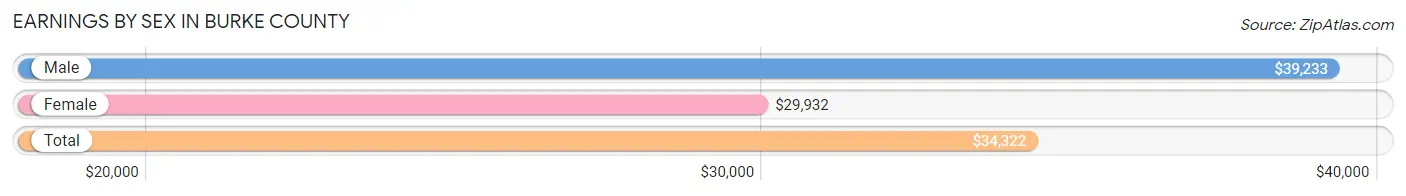
Earnings by Sex in Burke County
Average Earnings in Burke County are $34,322, $39,233 for men and $29,932 for women, a difference of 23.7%.
| Sex | Number | Average Earnings |
| Male | 23,196 (53.6%) | $39,233 |
| Female | 20,100 (46.4%) | $29,932 |
| Total | 43,296 (100.0%) | $34,322 |
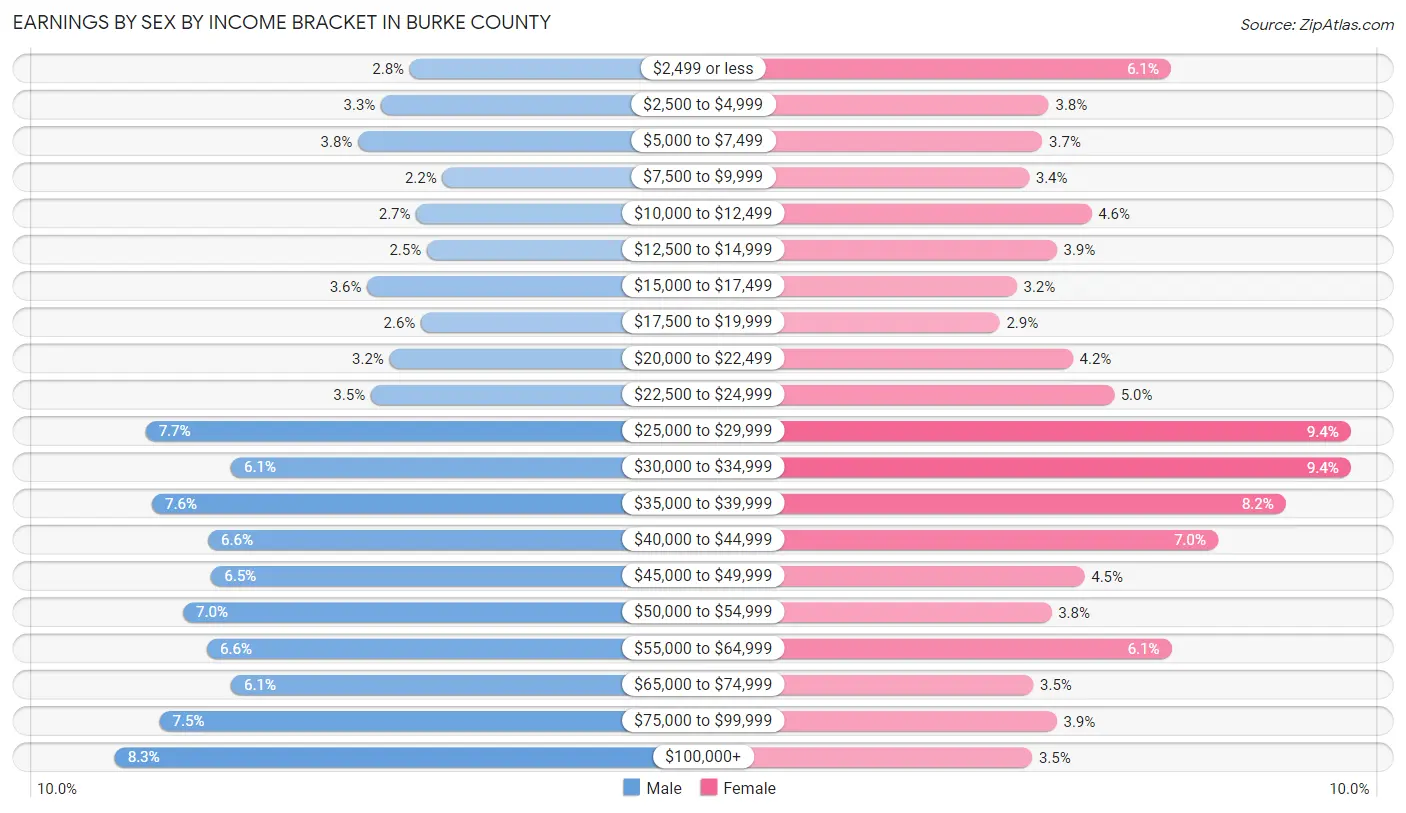
Earnings by Sex by Income Bracket in Burke County
The most common earnings brackets in Burke County are $100,000+ for men (1,928 | 8.3%) and $30,000 to $34,999 for women (1,898 | 9.4%).
| Income | Male | Female |
| $2,499 or less | 645 (2.8%) | 1,220 (6.1%) |
| $2,500 to $4,999 | 769 (3.3%) | 760 (3.8%) |
| $5,000 to $7,499 | 871 (3.7%) | 736 (3.7%) |
| $7,500 to $9,999 | 504 (2.2%) | 686 (3.4%) |
| $10,000 to $12,499 | 616 (2.7%) | 921 (4.6%) |
| $12,500 to $14,999 | 570 (2.5%) | 790 (3.9%) |
| $15,000 to $17,499 | 830 (3.6%) | 640 (3.2%) |
| $17,500 to $19,999 | 596 (2.6%) | 574 (2.9%) |
| $20,000 to $22,499 | 734 (3.2%) | 850 (4.2%) |
| $22,500 to $24,999 | 814 (3.5%) | 1,006 (5.0%) |
| $25,000 to $29,999 | 1,792 (7.7%) | 1,897 (9.4%) |
| $30,000 to $34,999 | 1,423 (6.1%) | 1,898 (9.4%) |
| $35,000 to $39,999 | 1,765 (7.6%) | 1,652 (8.2%) |
| $40,000 to $44,999 | 1,522 (6.6%) | 1,396 (7.0%) |
| $45,000 to $49,999 | 1,507 (6.5%) | 894 (4.4%) |
| $50,000 to $54,999 | 1,630 (7.0%) | 769 (3.8%) |
| $55,000 to $64,999 | 1,527 (6.6%) | 1,222 (6.1%) |
| $65,000 to $74,999 | 1,421 (6.1%) | 702 (3.5%) |
| $75,000 to $99,999 | 1,732 (7.5%) | 789 (3.9%) |
| $100,000+ | 1,928 (8.3%) | 698 (3.5%) |
| Total | 23,196 (100.0%) | 20,100 (100.0%) |
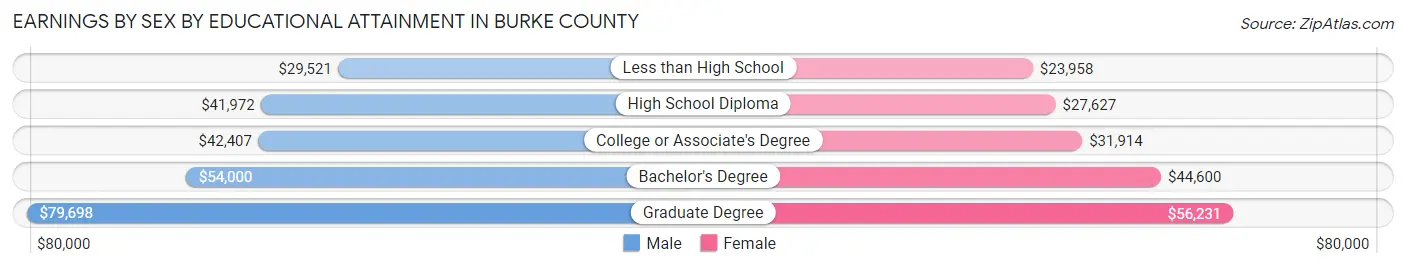
Earnings by Sex by Educational Attainment in Burke County
Average earnings in Burke County are $42,913 for men and $32,468 for women, a difference of 24.3%. Men with an educational attainment of graduate degree enjoy the highest average annual earnings of $79,698, while those with less than high school education earn the least with $29,521. Women with an educational attainment of graduate degree earn the most with the average annual earnings of $56,231, while those with less than high school education have the smallest earnings of $23,958.
| Educational Attainment | Male Income | Female Income |
| Less than High School | $29,521 | $23,958 |
| High School Diploma | $41,972 | $27,627 |
| College or Associate's Degree | $42,407 | $31,914 |
| Bachelor's Degree | $54,000 | $44,600 |
| Graduate Degree | $79,698 | $56,231 |
| Total | $42,913 | $32,468 |
Family Income in Burke County
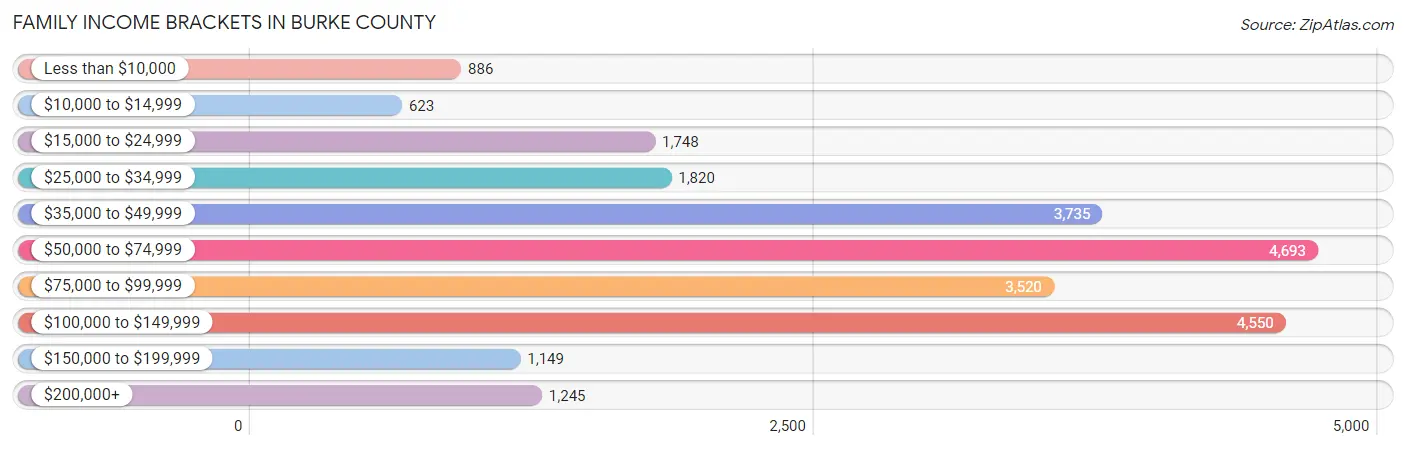
Family Income Brackets in Burke County
According to the Burke County family income data, there are 4,693 families falling into the $50,000 to $74,999 income range, which is the most common income bracket and makes up 19.6% of all families. Conversely, the $10,000 to $14,999 income bracket is the least frequent group with only 623 families (2.6%) belonging to this category.
| Income Bracket | # Families | % Families |
| Less than $10,000 | 886 | 3.7% |
| $10,000 to $14,999 | 623 | 2.6% |
| $15,000 to $24,999 | 1,748 | 7.3% |
| $25,000 to $34,999 | 1,820 | 7.6% |
| $35,000 to $49,999 | 3,735 | 15.6% |
| $50,000 to $74,999 | 4,693 | 19.6% |
| $75,000 to $99,999 | 3,520 | 14.7% |
| $100,000 to $149,999 | 4,550 | 19.0% |
| $150,000 to $199,999 | 1,149 | 4.8% |
| $200,000+ | 1,245 | 5.2% |
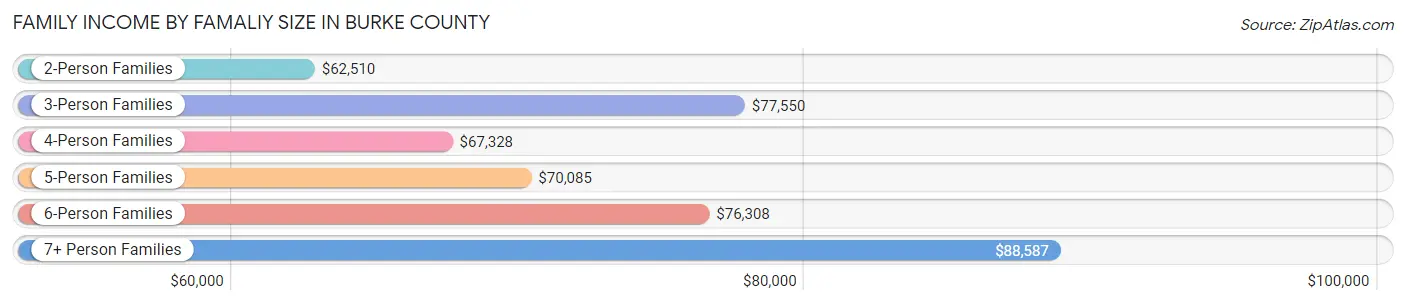
Family Income by Famaliy Size in Burke County
7+ person families (236 | 1.0%) account for the highest median family income in Burke County with $88,587 per family, while 2-person families (12,673 | 52.9%) have the highest median income of $31,255 per family member.
| Income Bracket | # Families | Median Income |
| 2-Person Families | 12,673 (52.9%) | $62,510 |
| 3-Person Families | 5,322 (22.2%) | $77,550 |
| 4-Person Families | 3,498 (14.6%) | $67,328 |
| 5-Person Families | 1,702 (7.1%) | $70,085 |
| 6-Person Families | 514 (2.1%) | $76,308 |
| 7+ Person Families | 236 (1.0%) | $88,587 |
| Total | 23,945 (100.0%) | $66,702 |
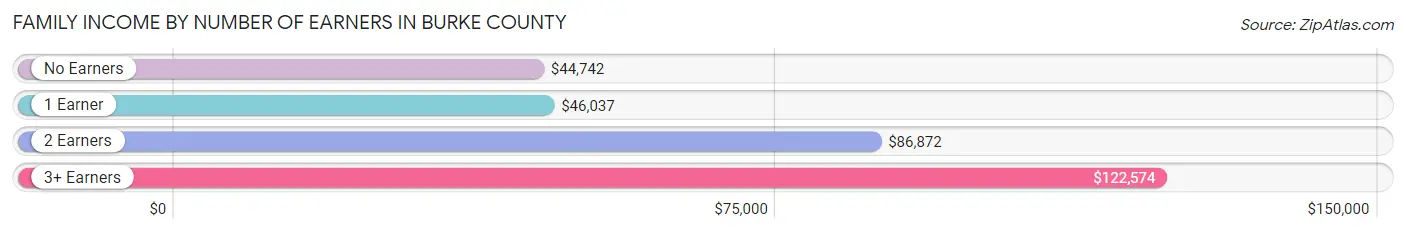
Family Income by Number of Earners in Burke County
The median family income in Burke County is $66,702, with families comprising 3+ earners (1,925) having the highest median family income of $122,574, while families with no earners (4,925) have the lowest median family income of $44,742, accounting for 8.0% and 20.6% of families, respectively.
| Number of Earners | # Families | Median Income |
| No Earners | 4,925 (20.6%) | $44,742 |
| 1 Earner | 7,781 (32.5%) | $46,037 |
| 2 Earners | 9,314 (38.9%) | $86,872 |
| 3+ Earners | 1,925 (8.0%) | $122,574 |
| Total | 23,945 (100.0%) | $66,702 |
Household Income in Burke County
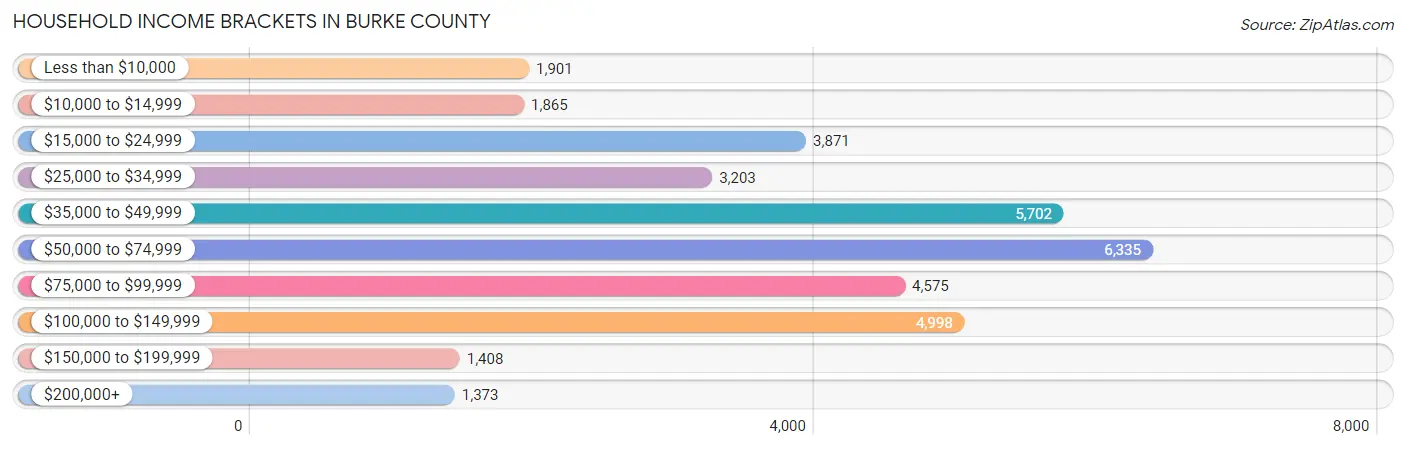
Household Income Brackets in Burke County
With 6,335 households falling in the category, the $50,000 to $74,999 income range is the most frequent in Burke County, accounting for 18.0% of all households. In contrast, only 1,373 households (3.9%) fall into the $200,000+ income bracket, making it the least populous group.
| Income Bracket | # Households | % Households |
| Less than $10,000 | 1,901 | 5.4% |
| $10,000 to $14,999 | 1,865 | 5.3% |
| $15,000 to $24,999 | 3,871 | 11.0% |
| $25,000 to $34,999 | 3,203 | 9.1% |
| $35,000 to $49,999 | 5,702 | 16.2% |
| $50,000 to $74,999 | 6,335 | 18.0% |
| $75,000 to $99,999 | 4,575 | 13.0% |
| $100,000 to $149,999 | 4,998 | 14.2% |
| $150,000 to $199,999 | 1,408 | 4.0% |
| $200,000+ | 1,373 | 3.9% |
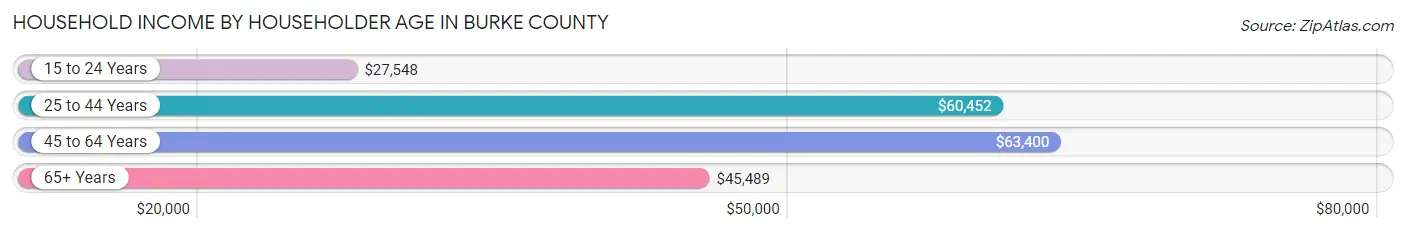
Household Income by Householder Age in Burke County
The median household income in Burke County is $53,732, with the highest median household income of $63,400 found in the 45 to 64 years age bracket for the primary householder. A total of 13,711 households (39.0%) fall into this category. Meanwhile, the 15 to 24 years age bracket for the primary householder has the lowest median household income of $27,548, with 1,166 households (3.3%) in this group.
| Income Bracket | # Households | Median Income |
| 15 to 24 Years | 1,166 (3.3%) | $27,548 |
| 25 to 44 Years | 8,592 (24.4%) | $60,452 |
| 45 to 64 Years | 13,711 (39.0%) | $63,400 |
| 65+ Years | 11,726 (33.3%) | $45,489 |
| Total | 35,195 (100.0%) | $53,732 |
Poverty in Burke County
Income Below Poverty by Sex and Age in Burke County
With 16.3% poverty level for males and 17.6% for females among the residents of Burke County, 5 year old males and 5 year old females are the most vulnerable to poverty, with 74 males (37.8%) and 160 females (42.8%) in their respective age groups living below the poverty level.
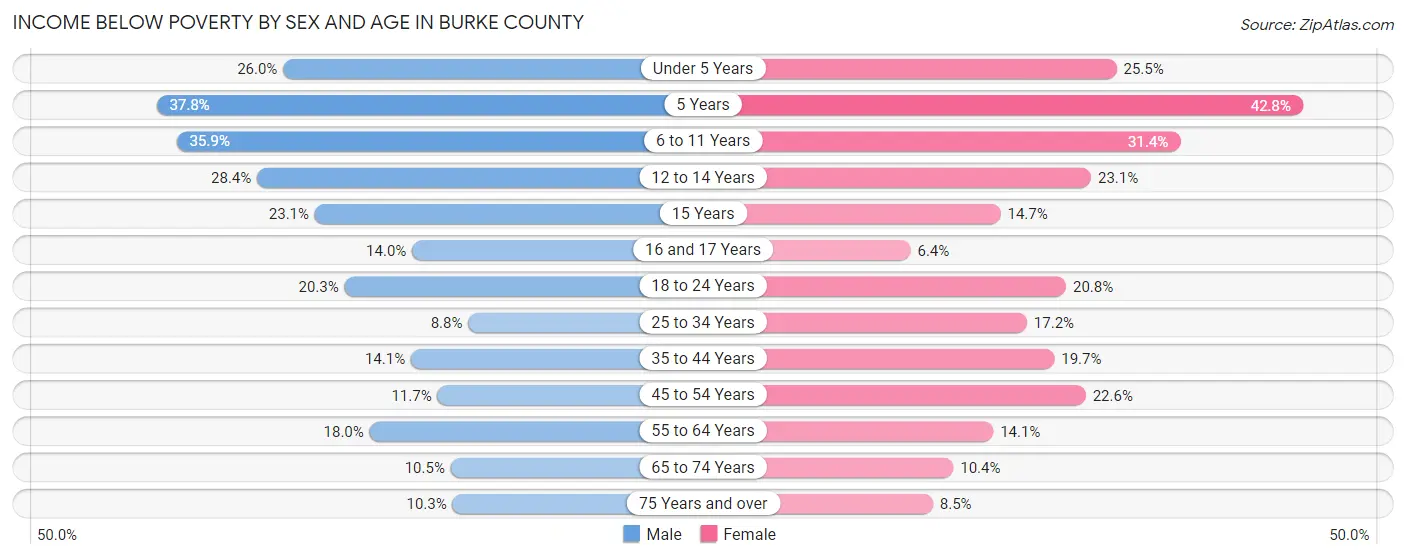
| Age Bracket | Male | Female |
| Under 5 Years | 522 (26.0%) | 495 (25.5%) |
| 5 Years | 74 (37.8%) | 160 (42.8%) |
| 6 to 11 Years | 993 (35.9%) | 812 (31.4%) |
| 12 to 14 Years | 426 (28.4%) | 307 (23.1%) |
| 15 Years | 83 (23.1%) | 86 (14.7%) |
| 16 and 17 Years | 149 (14.0%) | 51 (6.4%) |
| 18 to 24 Years | 795 (20.3%) | 602 (20.8%) |
| 25 to 34 Years | 447 (8.8%) | 897 (17.2%) |
| 35 to 44 Years | 677 (14.1%) | 971 (19.7%) |
| 45 to 54 Years | 696 (11.7%) | 1,313 (22.6%) |
| 55 to 64 Years | 1,181 (18.0%) | 947 (14.1%) |
| 65 to 74 Years | 506 (10.4%) | 565 (10.3%) |
| 75 Years and over | 325 (10.3%) | 373 (8.5%) |
| Total | 6,874 (16.3%) | 7,579 (17.6%) |
Income Above Poverty by Sex and Age in Burke County
According to the poverty statistics in Burke County, males aged 25 to 34 years and females aged 16 and 17 years are the age groups that are most secure financially, with 91.2% of males and 93.6% of females in these age groups living above the poverty line.
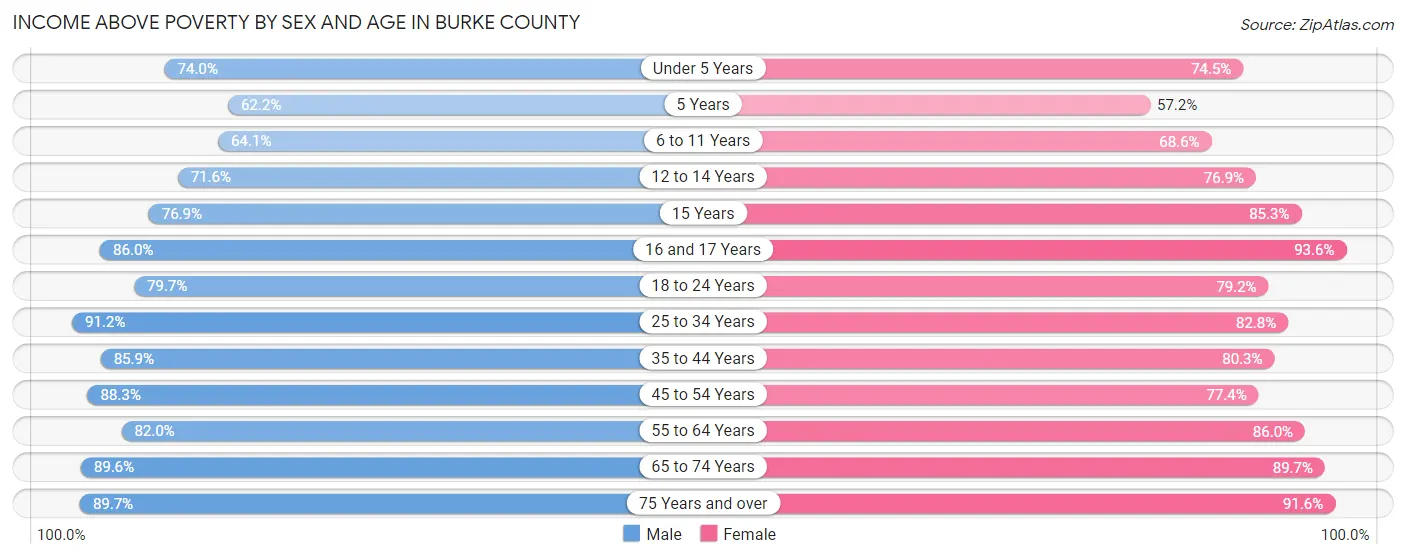
| Age Bracket | Male | Female |
| Under 5 Years | 1,486 (74.0%) | 1,446 (74.5%) |
| 5 Years | 122 (62.2%) | 214 (57.2%) |
| 6 to 11 Years | 1,773 (64.1%) | 1,774 (68.6%) |
| 12 to 14 Years | 1,073 (71.6%) | 1,020 (76.9%) |
| 15 Years | 277 (76.9%) | 498 (85.3%) |
| 16 and 17 Years | 913 (86.0%) | 749 (93.6%) |
| 18 to 24 Years | 3,120 (79.7%) | 2,291 (79.2%) |
| 25 to 34 Years | 4,620 (91.2%) | 4,325 (82.8%) |
| 35 to 44 Years | 4,111 (85.9%) | 3,952 (80.3%) |
| 45 to 54 Years | 5,265 (88.3%) | 4,487 (77.4%) |
| 55 to 64 Years | 5,389 (82.0%) | 5,792 (86.0%) |
| 65 to 74 Years | 4,337 (89.5%) | 4,893 (89.6%) |
| 75 Years and over | 2,838 (89.7%) | 4,043 (91.5%) |
| Total | 35,324 (83.7%) | 35,484 (82.4%) |
Income Below Poverty Among Married-Couple Families in Burke County
The poverty statistics for married-couple families in Burke County show that 7.3% or 1,296 of the total 17,751 families live below the poverty line. Families with 5 or more children have the highest poverty rate of 22.6%, comprising of 23 families. On the other hand, families with no children have the lowest poverty rate of 6.3%, which includes 718 families.
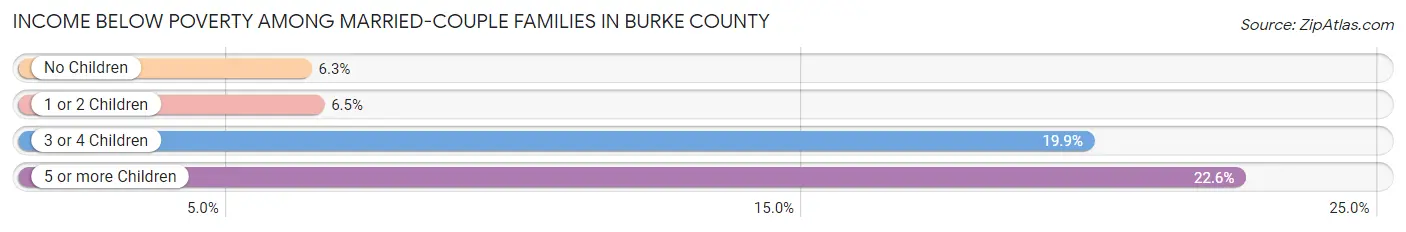
| Children | Above Poverty | Below Poverty |
| No Children | 10,712 (93.7%) | 718 (6.3%) |
| 1 or 2 Children | 4,763 (93.5%) | 331 (6.5%) |
| 3 or 4 Children | 901 (80.1%) | 224 (19.9%) |
| 5 or more Children | 79 (77.4%) | 23 (22.6%) |
| Total | 16,455 (92.7%) | 1,296 (7.3%) |
Income Below Poverty Among Single-Parent Households in Burke County
According to the poverty data in Burke County, 22.8% or 435 single-father households and 29.4% or 1,263 single-mother households are living below the poverty line. Among single-father households, those with 3 or 4 children have the highest poverty rate, with 109 households (82.0%) experiencing poverty. Likewise, among single-mother households, those with 5 or more children have the highest poverty rate, with 55 households (84.6%) falling below the poverty line.
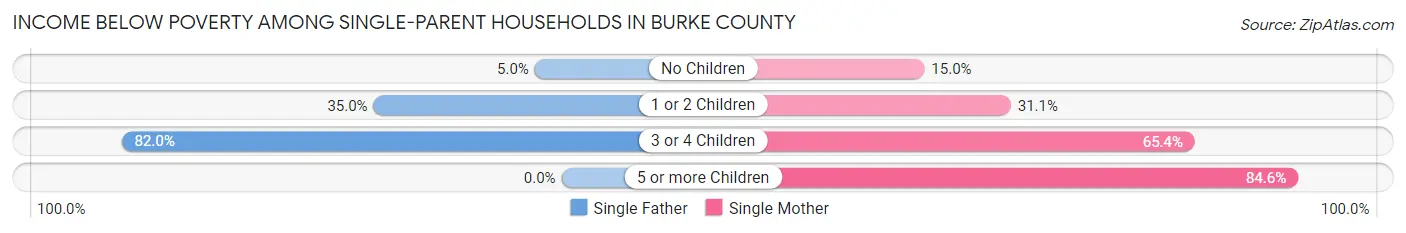
| Children | Single Father | Single Mother |
| No Children | 49 (5.0%) | 294 (15.0%) |
| 1 or 2 Children | 277 (35.0%) | 517 (31.1%) |
| 3 or 4 Children | 109 (82.0%) | 397 (65.4%) |
| 5 or more Children | 0 (0.0%) | 55 (84.6%) |
| Total | 435 (22.8%) | 1,263 (29.4%) |
Income Below Poverty Among Married-Couple vs Single-Parent Households in Burke County
The poverty data for Burke County shows that 1,296 of the married-couple family households (7.3%) and 1,698 of the single-parent households (27.4%) are living below the poverty level. Within the married-couple family households, those with 5 or more children have the highest poverty rate, with 23 households (22.6%) falling below the poverty line. Among the single-parent households, those with 5 or more children have the highest poverty rate, with 55 household (84.6%) living below poverty.
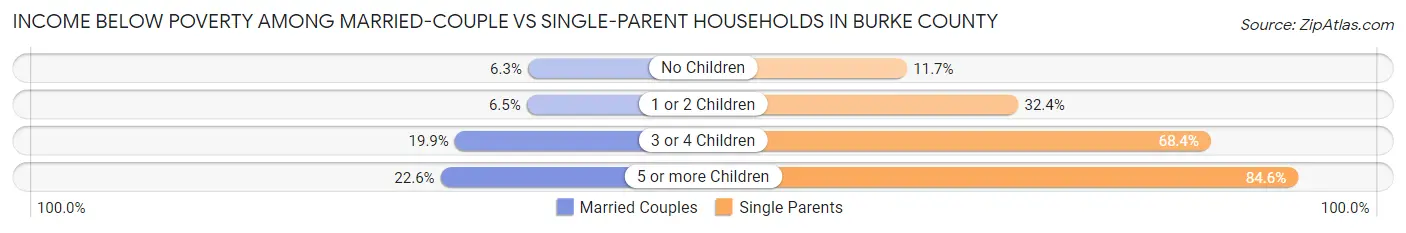
| Children | Married-Couple Families | Single-Parent Households |
| No Children | 718 (6.3%) | 343 (11.7%) |
| 1 or 2 Children | 331 (6.5%) | 794 (32.4%) |
| 3 or 4 Children | 224 (19.9%) | 506 (68.4%) |
| 5 or more Children | 23 (22.6%) | 55 (84.6%) |
| Total | 1,296 (7.3%) | 1,698 (27.4%) |
Race in Burke County
The most populous races in Burke County are White / Caucasian (72,967 | 83.1%), Hispanic or Latino (5,858 | 6.7%), and Black / African American (5,181 | 5.9%).
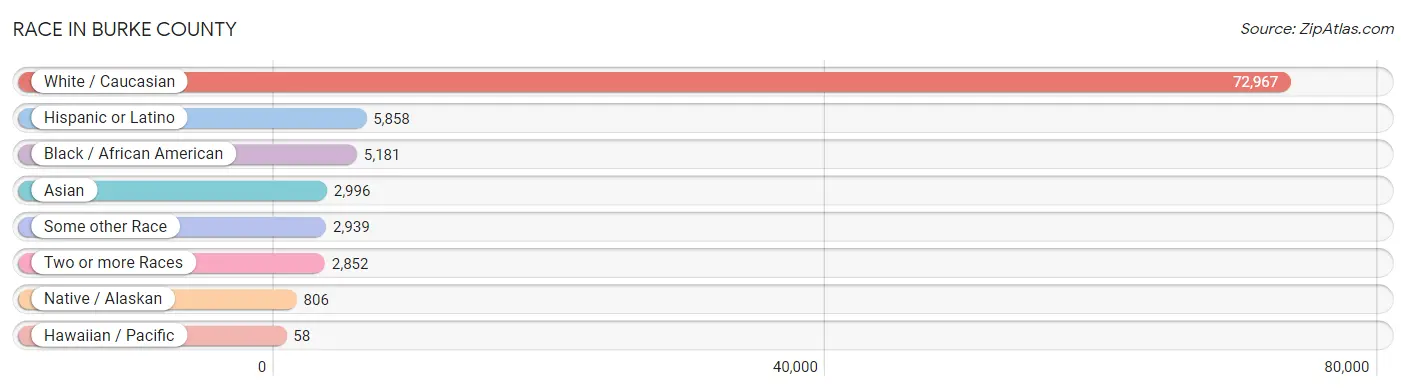
| Race | # Population | % Population |
| Asian | 2,996 | 3.4% |
| Black / African American | 5,181 | 5.9% |
| Hawaiian / Pacific | 58 | 0.1% |
| Hispanic or Latino | 5,858 | 6.7% |
| Native / Alaskan | 806 | 0.9% |
| White / Caucasian | 72,967 | 83.1% |
| Two or more Races | 2,852 | 3.3% |
| Some other Race | 2,939 | 3.4% |
| Total | 87,799 | 100.0% |
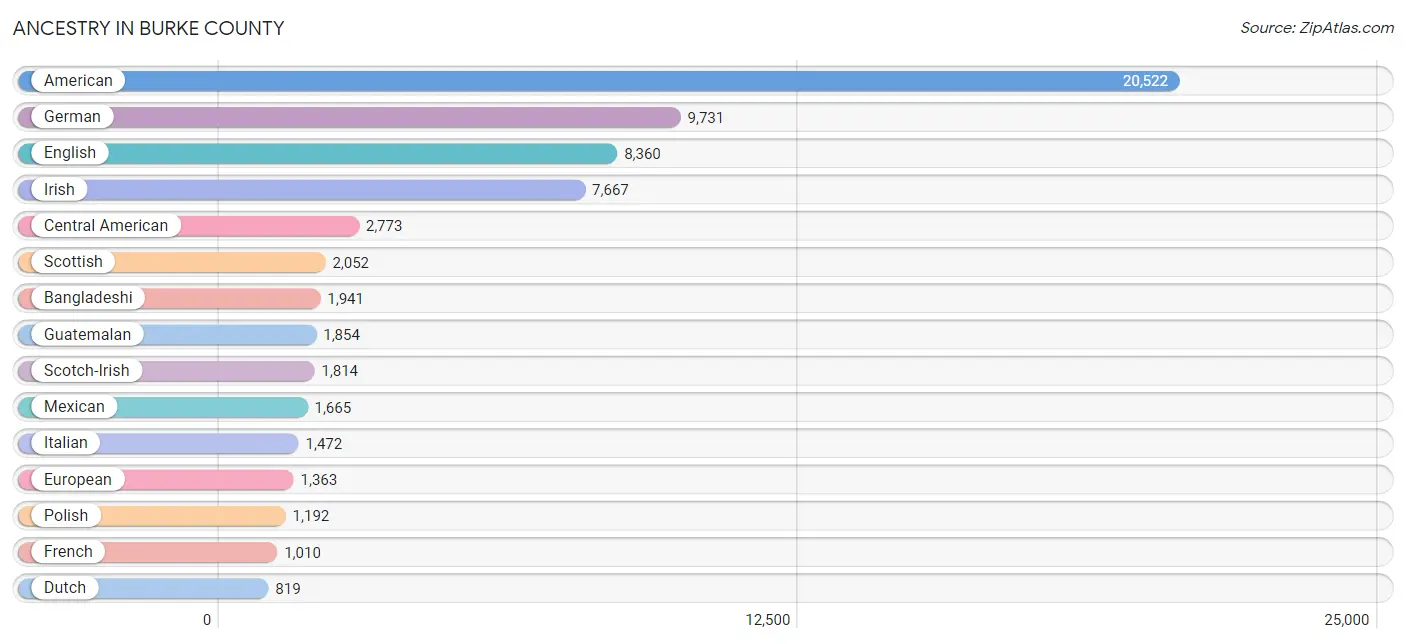
Ancestry in Burke County
The most populous ancestries reported in Burke County are American (20,522 | 23.4%), German (9,731 | 11.1%), English (8,360 | 9.5%), Irish (7,667 | 8.7%), and Central American (2,773 | 3.2%), together accounting for 55.9% of all Burke County residents.
| Ancestry | # Population | % Population |
| African | 186 | 0.2% |
| American | 20,522 | 23.4% |
| Apache | 2 | 0.0% |
| Arab | 533 | 0.6% |
| Austrian | 65 | 0.1% |
| Bangladeshi | 1,941 | 2.2% |
| Barbadian | 35 | 0.0% |
| Belgian | 18 | 0.0% |
| Bhutanese | 21 | 0.0% |
| Blackfeet | 18 | 0.0% |
| British | 461 | 0.5% |
| Burmese | 56 | 0.1% |
| Canadian | 119 | 0.1% |
| Celtic | 26 | 0.0% |
| Central American | 2,773 | 3.2% |
| Central American Indian | 494 | 0.6% |
| Cherokee | 470 | 0.5% |
| Chilean | 49 | 0.1% |
| Chippewa | 14 | 0.0% |
| Colombian | 12 | 0.0% |
| Cuban | 152 | 0.2% |
| Czech | 79 | 0.1% |
| Czechoslovakian | 10 | 0.0% |
| Danish | 63 | 0.1% |
| Dominican | 15 | 0.0% |
| Dutch | 819 | 0.9% |
| Dutch West Indian | 3 | 0.0% |
| Eastern European | 38 | 0.0% |
| Egyptian | 35 | 0.0% |
| English | 8,360 | 9.5% |
| Ethiopian | 6 | 0.0% |
| European | 1,363 | 1.5% |
| Filipino | 65 | 0.1% |
| Finnish | 12 | 0.0% |
| French | 1,010 | 1.1% |
| French American Indian | 23 | 0.0% |
| French Canadian | 249 | 0.3% |
| German | 9,731 | 11.1% |
| Greek | 70 | 0.1% |
| Guamanian / Chamorro | 13 | 0.0% |
| Guatemalan | 1,854 | 2.1% |
| Guyanese | 6 | 0.0% |
| Haitian | 52 | 0.1% |
| Honduran | 564 | 0.6% |
| Hungarian | 137 | 0.2% |
| Indian (Asian) | 257 | 0.3% |
| Irish | 7,667 | 8.7% |
| Israeli | 18 | 0.0% |
| Italian | 1,472 | 1.7% |
| Jamaican | 4 | 0.0% |
| Korean | 481 | 0.5% |
| Latvian | 5 | 0.0% |
| Lebanese | 6 | 0.0% |
| Lithuanian | 8 | 0.0% |
| Lumbee | 159 | 0.2% |
| Luxembourger | 5 | 0.0% |
| Malaysian | 314 | 0.4% |
| Maltese | 26 | 0.0% |
| Mexican | 1,665 | 1.9% |
| Native Hawaiian | 61 | 0.1% |
| Nicaraguan | 20 | 0.0% |
| Nigerian | 20 | 0.0% |
| Northern European | 125 | 0.1% |
| Norwegian | 476 | 0.5% |
| Pakistani | 82 | 0.1% |
| Palestinian | 492 | 0.6% |
| Panamanian | 5 | 0.0% |
| Pennsylvania German | 37 | 0.0% |
| Peruvian | 34 | 0.0% |
| Polish | 1,192 | 1.4% |
| Portuguese | 60 | 0.1% |
| Puerto Rican | 494 | 0.6% |
| Romanian | 39 | 0.0% |
| Russian | 75 | 0.1% |
| Salvadoran | 276 | 0.3% |
| Scandinavian | 103 | 0.1% |
| Scotch-Irish | 1,814 | 2.1% |
| Scottish | 2,052 | 2.3% |
| Sioux | 2 | 0.0% |
| Slavic | 62 | 0.1% |
| Slovak | 17 | 0.0% |
| Slovene | 15 | 0.0% |
| South American | 95 | 0.1% |
| Spaniard | 30 | 0.0% |
| Spanish | 11 | 0.0% |
| Sri Lankan | 66 | 0.1% |
| Subsaharan African | 212 | 0.2% |
| Swedish | 242 | 0.3% |
| Swiss | 125 | 0.1% |
| Thai | 81 | 0.1% |
| Trinidadian and Tobagonian | 28 | 0.0% |
| Welsh | 217 | 0.3% | View All 92 Rows |
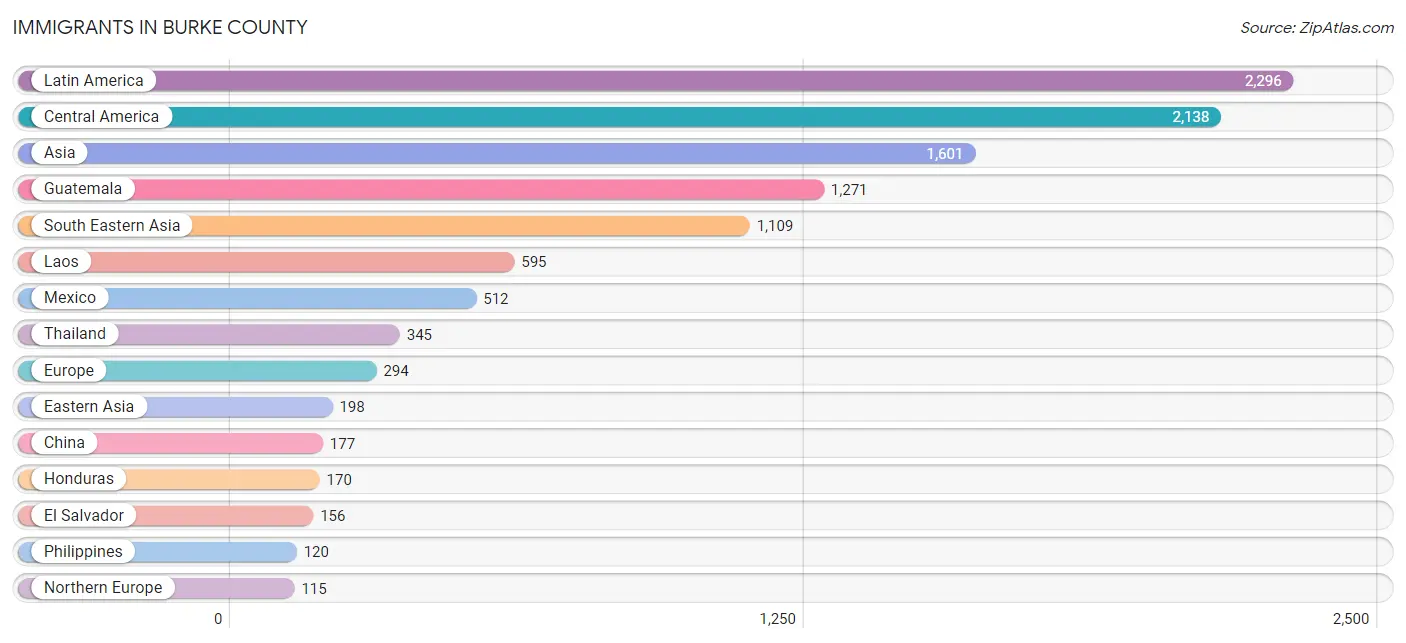
Immigrants in Burke County
The most numerous immigrant groups reported in Burke County came from Latin America (2,296 | 2.6%), Central America (2,138 | 2.4%), Asia (1,601 | 1.8%), Guatemala (1,271 | 1.5%), and South Eastern Asia (1,109 | 1.3%), together accounting for 9.6% of all Burke County residents.
| Immigration Origin | # Population | % Population |
| Africa | 3 | 0.0% |
| Asia | 1,601 | 1.8% |
| Australia | 9 | 0.0% |
| Belarus | 5 | 0.0% |
| Bolivia | 14 | 0.0% |
| Brazil | 7 | 0.0% |
| Canada | 96 | 0.1% |
| Caribbean | 84 | 0.1% |
| Central America | 2,138 | 2.4% |
| Chile | 18 | 0.0% |
| China | 177 | 0.2% |
| Colombia | 14 | 0.0% |
| Cuba | 31 | 0.0% |
| Dominican Republic | 21 | 0.0% |
| Eastern Africa | 3 | 0.0% |
| Eastern Asia | 198 | 0.2% |
| Eastern Europe | 105 | 0.1% |
| El Salvador | 156 | 0.2% |
| England | 46 | 0.1% |
| Ethiopia | 3 | 0.0% |
| Europe | 294 | 0.3% |
| Germany | 54 | 0.1% |
| Greece | 12 | 0.0% |
| Guatemala | 1,271 | 1.5% |
| Guyana | 6 | 0.0% |
| Honduras | 170 | 0.2% |
| Hong Kong | 55 | 0.1% |
| India | 61 | 0.1% |
| Ireland | 13 | 0.0% |
| Jamaica | 4 | 0.0% |
| Japan | 21 | 0.0% |
| Laos | 595 | 0.7% |
| Latin America | 2,296 | 2.6% |
| Mexico | 512 | 0.6% |
| Nicaragua | 20 | 0.0% |
| Northern Europe | 115 | 0.1% |
| Oceania | 9 | 0.0% |
| Panama | 9 | 0.0% |
| Peru | 15 | 0.0% |
| Philippines | 120 | 0.1% |
| Poland | 87 | 0.1% |
| Russia | 13 | 0.0% |
| Scotland | 20 | 0.0% |
| South America | 74 | 0.1% |
| South Central Asia | 61 | 0.1% |
| South Eastern Asia | 1,109 | 1.3% |
| Southern Europe | 12 | 0.0% |
| Switzerland | 8 | 0.0% |
| Thailand | 345 | 0.4% |
| Trinidad and Tobago | 28 | 0.0% |
| Vietnam | 49 | 0.1% |
| Western Europe | 62 | 0.1% | View All 52 Rows |
Sex and Age in Burke County
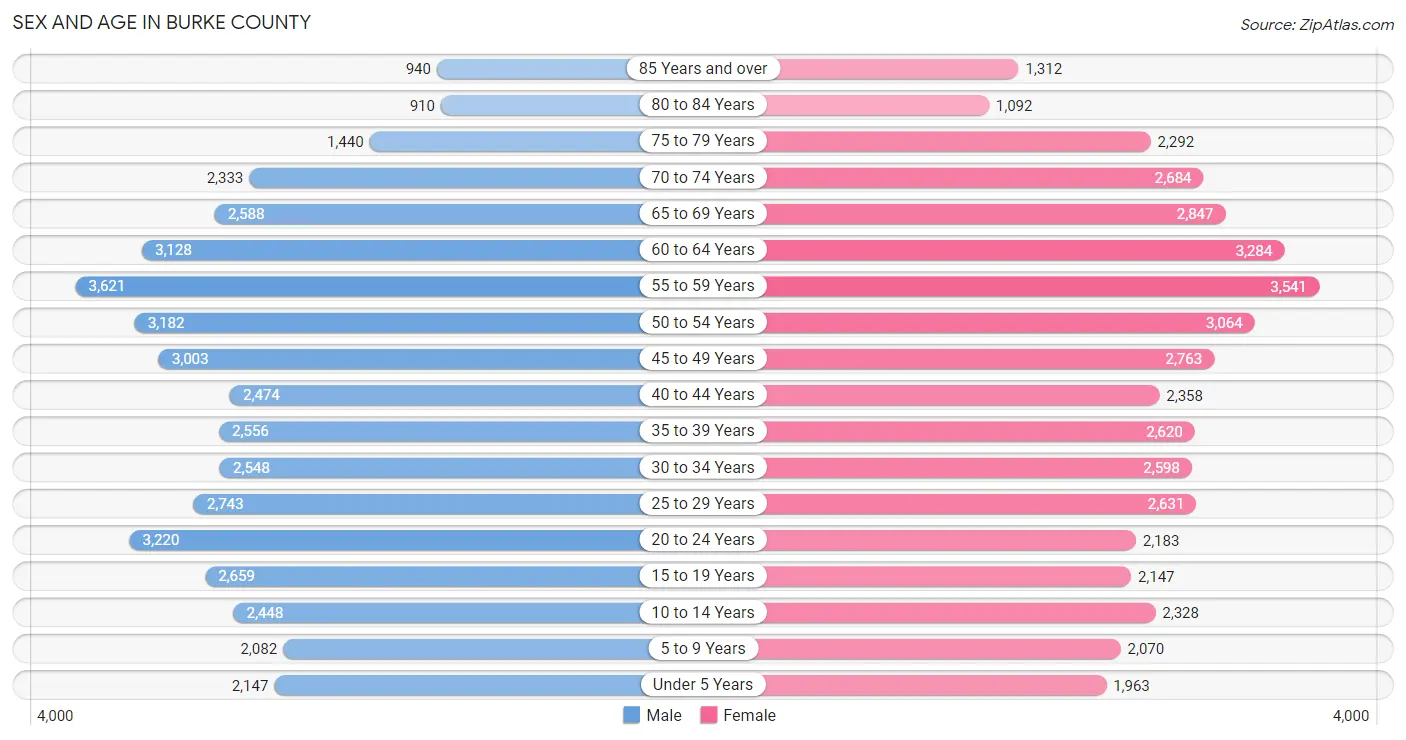
Sex and Age in Burke County
The most populous age groups in Burke County are 55 to 59 Years (3,621 | 8.2%) for men and 55 to 59 Years (3,541 | 8.1%) for women.
| Age Bracket | Male | Female |
| Under 5 Years | 2,147 (4.9%) | 1,963 (4.5%) |
| 5 to 9 Years | 2,082 (4.7%) | 2,070 (4.7%) |
| 10 to 14 Years | 2,448 (5.6%) | 2,328 (5.3%) |
| 15 to 19 Years | 2,659 (6.0%) | 2,147 (4.9%) |
| 20 to 24 Years | 3,220 (7.3%) | 2,183 (5.0%) |
| 25 to 29 Years | 2,743 (6.2%) | 2,631 (6.0%) |
| 30 to 34 Years | 2,548 (5.8%) | 2,598 (5.9%) |
| 35 to 39 Years | 2,556 (5.8%) | 2,620 (6.0%) |
| 40 to 44 Years | 2,474 (5.6%) | 2,358 (5.4%) |
| 45 to 49 Years | 3,003 (6.8%) | 2,763 (6.3%) |
| 50 to 54 Years | 3,182 (7.2%) | 3,064 (7.0%) |
| 55 to 59 Years | 3,621 (8.2%) | 3,541 (8.1%) |
| 60 to 64 Years | 3,128 (7.1%) | 3,284 (7.5%) |
| 65 to 69 Years | 2,588 (5.9%) | 2,847 (6.5%) |
| 70 to 74 Years | 2,333 (5.3%) | 2,684 (6.1%) |
| 75 to 79 Years | 1,440 (3.3%) | 2,292 (5.2%) |
| 80 to 84 Years | 910 (2.1%) | 1,092 (2.5%) |
| 85 Years and over | 940 (2.1%) | 1,312 (3.0%) |
| Total | 44,022 (100.0%) | 43,777 (100.0%) |
Families and Households in Burke County
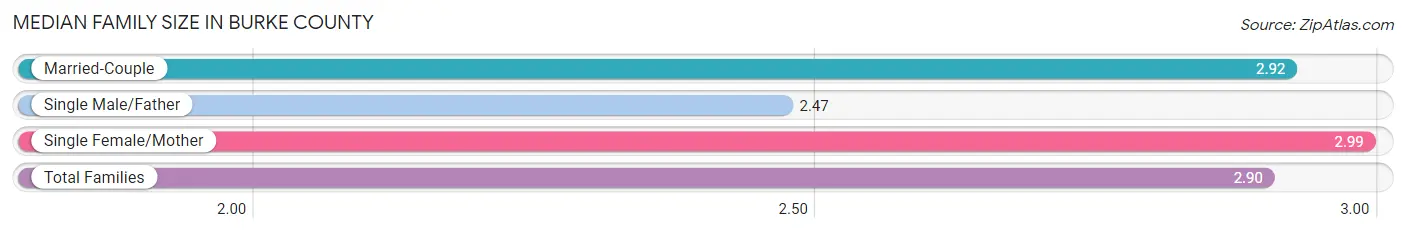
Median Family Size in Burke County
The median family size in Burke County is 2.90 persons per family, with single female/mother families (4,288 | 17.9%) accounting for the largest median family size of 2.99 persons per family. On the other hand, single male/father families (1,906 | 8.0%) represent the smallest median family size with 2.47 persons per family.
| Family Type | # Families | Family Size |
| Married-Couple | 17,751 (74.1%) | 2.92 |
| Single Male/Father | 1,906 (8.0%) | 2.47 |
| Single Female/Mother | 4,288 (17.9%) | 2.99 |
| Total Families | 23,945 (100.0%) | 2.90 |
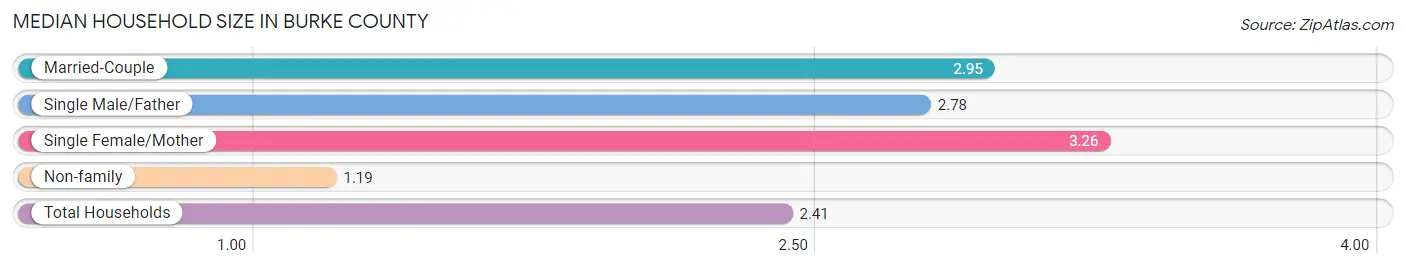
Median Household Size in Burke County
The median household size in Burke County is 2.41 persons per household, with single female/mother households (4,288 | 12.2%) accounting for the largest median household size of 3.26 persons per household. non-family households (11,250 | 32.0%) represent the smallest median household size with 1.19 persons per household.
| Household Type | # Households | Household Size |
| Married-Couple | 17,751 (50.4%) | 2.95 |
| Single Male/Father | 1,906 (5.4%) | 2.78 |
| Single Female/Mother | 4,288 (12.2%) | 3.26 |
| Non-family | 11,250 (32.0%) | 1.19 |
| Total Households | 35,195 (100.0%) | 2.41 |
Household Size by Marriage Status in Burke County
Out of a total of 35,195 households in Burke County, 23,945 (68.0%) are family households, while 11,250 (32.0%) are nonfamily households. The most numerous type of family households are 2-person households, comprising 11,962, and the most common type of nonfamily households are 1-person households, comprising 9,808.
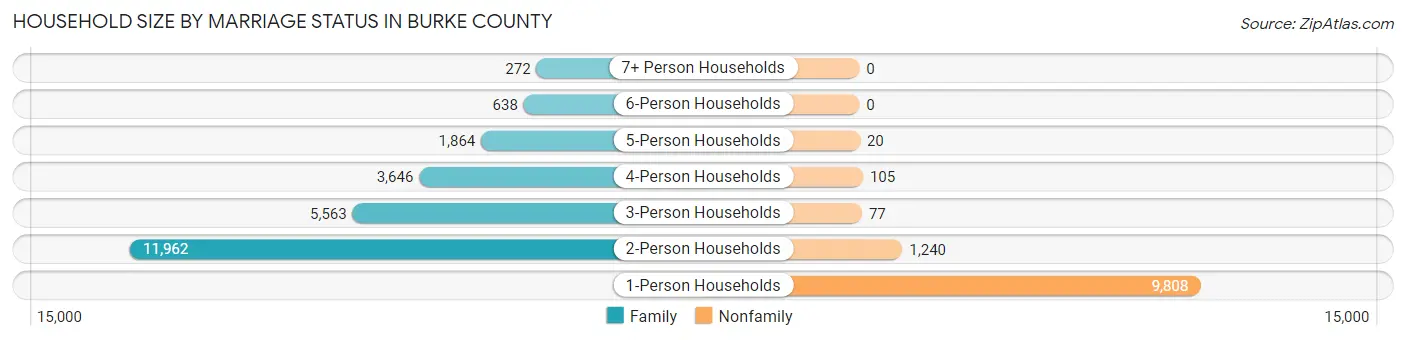
| Household Size | Family Households | Nonfamily Households |
| 1-Person Households | - | 9,808 (27.9%) |
| 2-Person Households | 11,962 (34.0%) | 1,240 (3.5%) |
| 3-Person Households | 5,563 (15.8%) | 77 (0.2%) |
| 4-Person Households | 3,646 (10.4%) | 105 (0.3%) |
| 5-Person Households | 1,864 (5.3%) | 20 (0.1%) |
| 6-Person Households | 638 (1.8%) | 0 (0.0%) |
| 7+ Person Households | 272 (0.8%) | 0 (0.0%) |
| Total | 23,945 (68.0%) | 11,250 (32.0%) |
Female Fertility in Burke County
Fertility by Age in Burke County
Average fertility rate in Burke County is 50.0 births per 1,000 women. Women in the age bracket of 20 to 34 years have the highest fertility rate with 87.0 births per 1,000 women. Women in the age bracket of 20 to 34 years acount for 71.1% of all women with births.
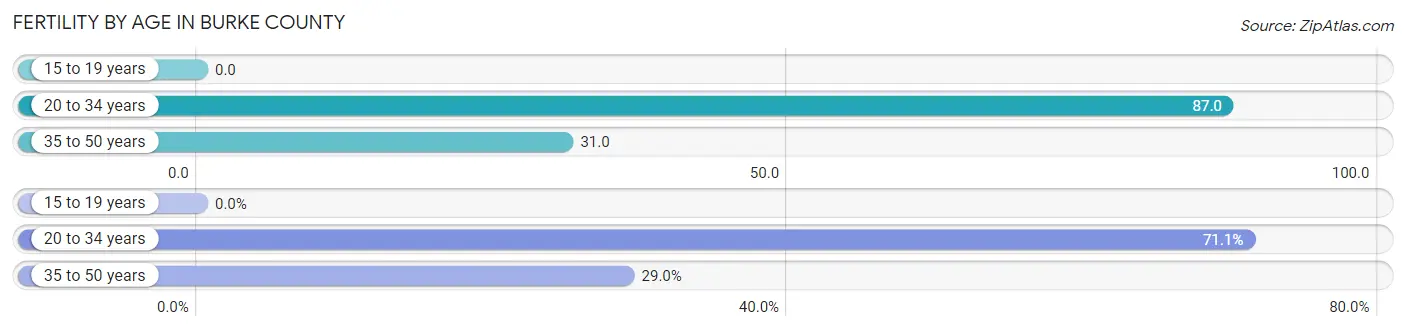
| Age Bracket | Women with Births | Births / 1,000 Women |
| 15 to 19 years | 0 (0.0%) | 0.0 |
| 20 to 34 years | 643 (71.1%) | 87.0 |
| 35 to 50 years | 262 (28.9%) | 31.0 |
| Total | 905 (100.0%) | 50.0 |
Fertility by Age by Marriage Status in Burke County
57.9% of women with births (905) in Burke County are married. The highest percentage of unmarried women with births falls into 35 to 50 years age bracket with 48.8% of them unmarried at the time of birth, while the lowest percentage of unmarried women with births belong to 20 to 34 years age bracket with 39.3% of them unmarried.
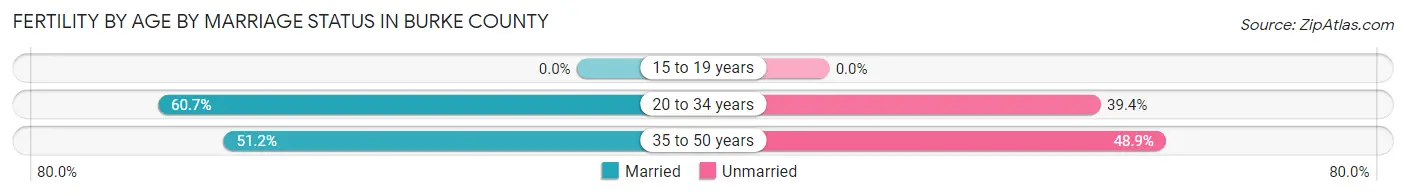
| Age Bracket | Married | Unmarried |
| 15 to 19 years | 0 (0.0%) | 0 (0.0%) |
| 20 to 34 years | 390 (60.7%) | 253 (39.4%) |
| 35 to 50 years | 134 (51.1%) | 128 (48.8%) |
| Total | 524 (57.9%) | 381 (42.1%) |
Fertility by Education in Burke County
Average fertility rate in Burke County is 50.0 births per 1,000 women. Women with the education attainment of college or associate's degree have the highest fertility rate of 81.0 births per 1,000 women, while women with the education attainment of graduate degree have the lowest fertility at 11.0 births per 1,000 women. Women with the education attainment of college or associate's degree represent 62.3% of all women with births.
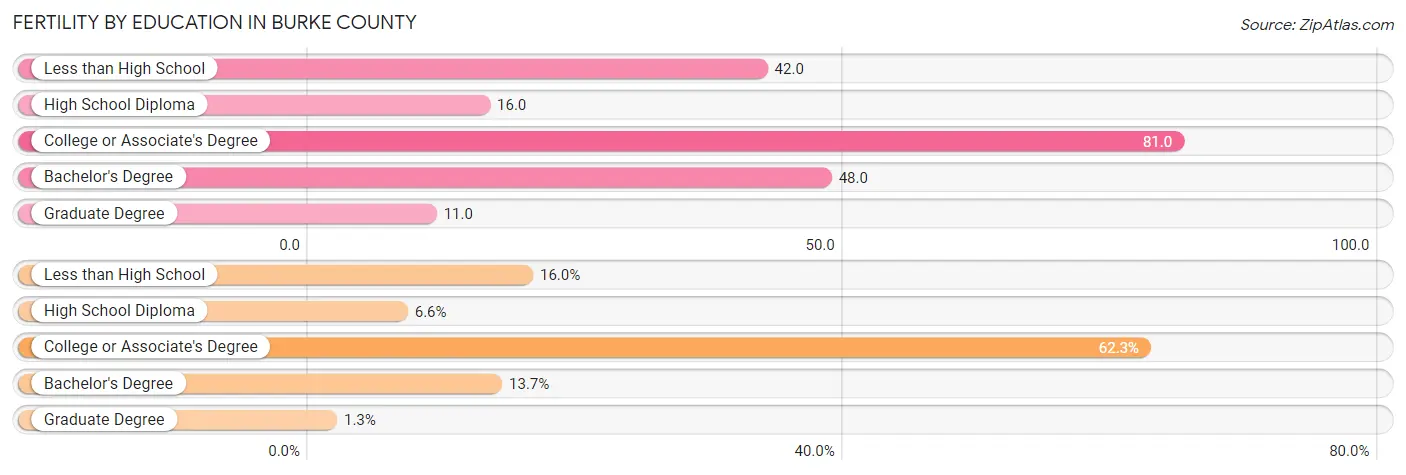
| Educational Attainment | Women with Births | Births / 1,000 Women |
| Less than High School | 145 (16.0%) | 42.0 |
| High School Diploma | 60 (6.6%) | 16.0 |
| College or Associate's Degree | 564 (62.3%) | 81.0 |
| Bachelor's Degree | 124 (13.7%) | 48.0 |
| Graduate Degree | 12 (1.3%) | 11.0 |
| Total | 905 (100.0%) | 50.0 |
Fertility by Education by Marriage Status in Burke County
42.1% of women with births in Burke County are unmarried. Women with the educational attainment of graduate degree are most likely to be married with 100.0% of them married at childbirth, while women with the educational attainment of less than high school are least likely to be married with 91.7% of them unmarried at childbirth.
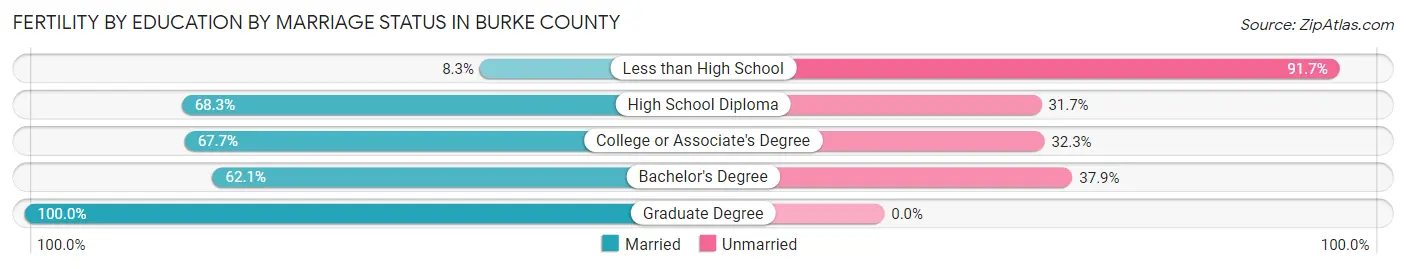
| Educational Attainment | Married | Unmarried |
| Less than High School | 12 (8.3%) | 133 (91.7%) |
| High School Diploma | 41 (68.3%) | 19 (31.7%) |
| College or Associate's Degree | 382 (67.7%) | 182 (32.3%) |
| Bachelor's Degree | 77 (62.1%) | 47 (37.9%) |
| Graduate Degree | 12 (100.0%) | 0 (0.0%) |
| Total | 524 (57.9%) | 381 (42.1%) |
Employment Characteristics in Burke County
Employment by Class of Employer in Burke County
Among the 38,812 employed individuals in Burke County, private company employees (26,266 | 67.7%), state government employees (3,456 | 8.9%), and local government employees (3,347 | 8.6%) make up the most common classes of employment.
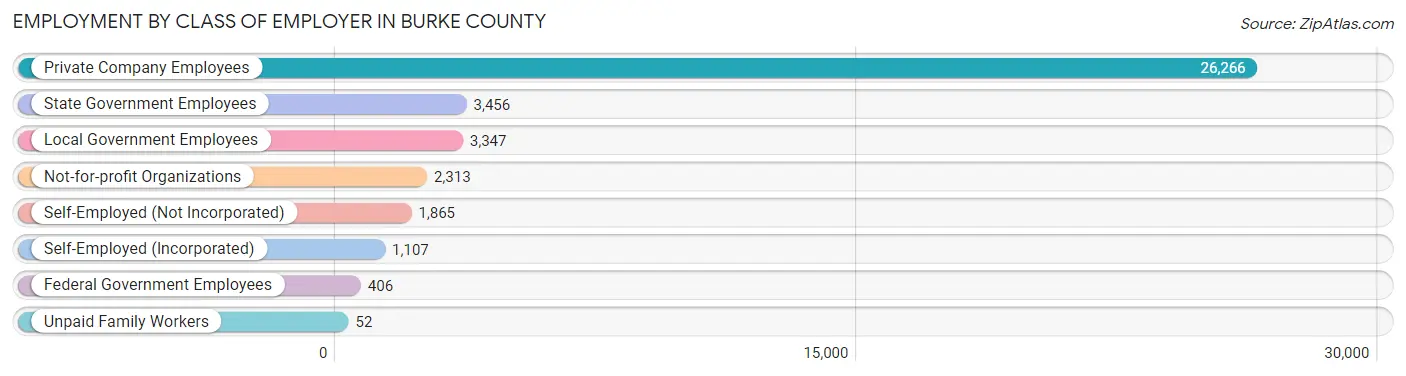
| Employer Class | # Employees | % Employees |
| Private Company Employees | 26,266 | 67.7% |
| Self-Employed (Incorporated) | 1,107 | 2.9% |
| Self-Employed (Not Incorporated) | 1,865 | 4.8% |
| Not-for-profit Organizations | 2,313 | 6.0% |
| Local Government Employees | 3,347 | 8.6% |
| State Government Employees | 3,456 | 8.9% |
| Federal Government Employees | 406 | 1.1% |
| Unpaid Family Workers | 52 | 0.1% |
| Total | 38,812 | 100.0% |
Employment Status by Age in Burke County
According to the labor force statistics for Burke County, out of the total population over 16 years of age (73,800), 57.1% or 42,140 individuals are in the labor force, with 6.0% or 2,528 of them unemployed. The age group with the highest labor force participation rate is 30 to 34 years, with 86.8% or 4,467 individuals in the labor force. Within the labor force, the 20 to 24 years age range has the highest percentage of unemployed individuals, with 16.1% or 682 of them being unemployed.
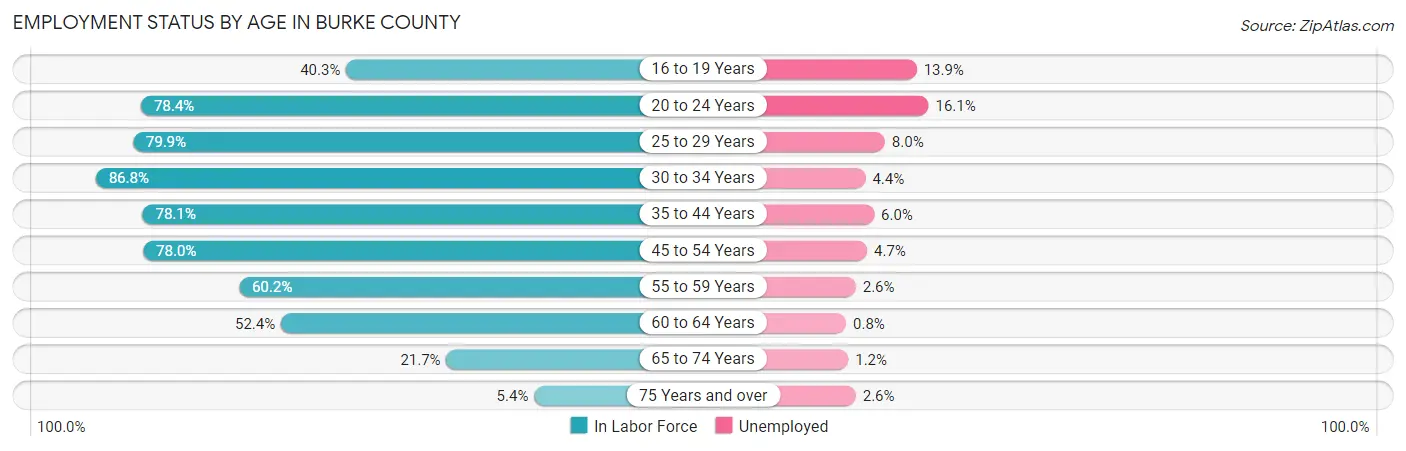
| Age Bracket | In Labor Force | Unemployed |
| 16 to 19 Years | 1,550 (40.3%) | 215 (13.9%) |
| 20 to 24 Years | 4,236 (78.4%) | 682 (16.1%) |
| 25 to 29 Years | 4,294 (79.9%) | 344 (8.0%) |
| 30 to 34 Years | 4,467 (86.8%) | 197 (4.4%) |
| 35 to 44 Years | 7,816 (78.1%) | 469 (6.0%) |
| 45 to 54 Years | 9,369 (78.0%) | 440 (4.7%) |
| 55 to 59 Years | 4,312 (60.2%) | 112 (2.6%) |
| 60 to 64 Years | 3,360 (52.4%) | 27 (0.8%) |
| 65 to 74 Years | 2,268 (21.7%) | 27 (1.2%) |
| 75 Years and over | 431 (5.4%) | 11 (2.6%) |
| Total | 42,140 (57.1%) | 2,528 (6.0%) |
Employment Status by Educational Attainment in Burke County
According to labor force statistics for Burke County, 72.9% of individuals (33,617) out of the total population between 25 and 64 years of age (46,114) are in the labor force, with 4.7% or 1,580 of them being unemployed. The group with the highest labor force participation rate are those with the educational attainment of bachelor's degree or higher, with 82.5% or 7,410 individuals in the labor force. Within the labor force, individuals with less than high school education have the highest percentage of unemployment, with 11.2% or 395 of them being unemployed.
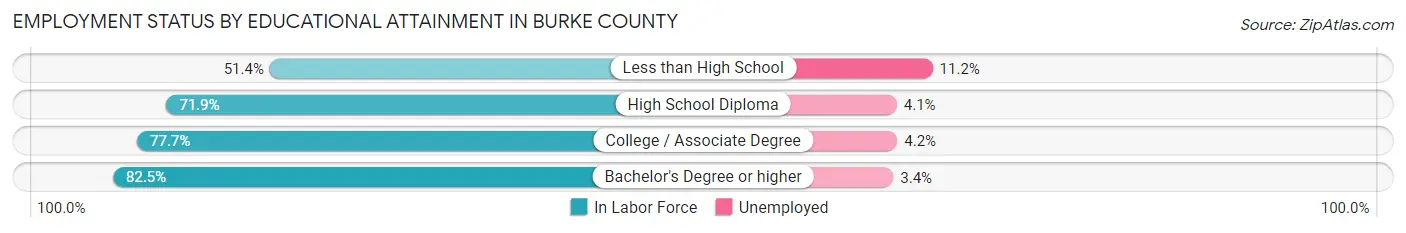
| Educational Attainment | In Labor Force | Unemployed |
| Less than High School | 3,527 (51.4%) | 769 (11.2%) |
| High School Diploma | 10,396 (71.9%) | 593 (4.1%) |
| College / Associate Degree | 12,285 (77.7%) | 664 (4.2%) |
| Bachelor's Degree or higher | 7,410 (82.5%) | 305 (3.4%) |
| Total | 33,617 (72.9%) | 2,167 (4.7%) |
Employment Occupations by Sex in Burke County
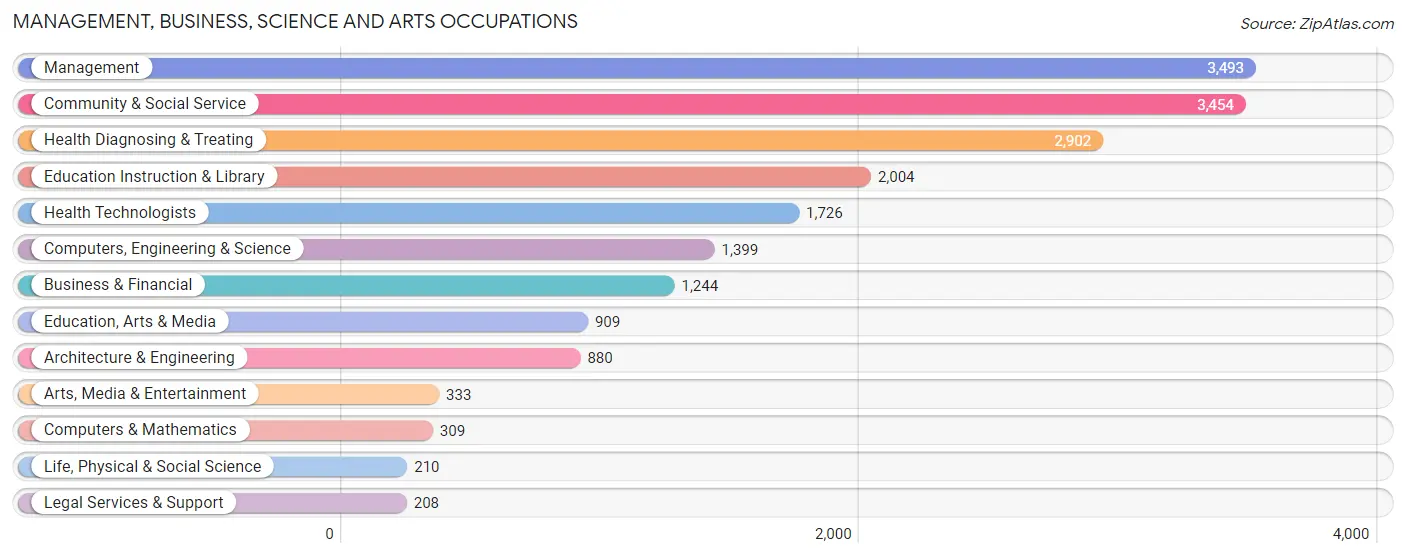
Management, Business, Science and Arts Occupations
The most common Management, Business, Science and Arts occupations in Burke County are Management (3,493 | 8.8%), Community & Social Service (3,454 | 8.7%), Health Diagnosing & Treating (2,902 | 7.3%), Education Instruction & Library (2,004 | 5.1%), and Health Technologists (1,726 | 4.4%).
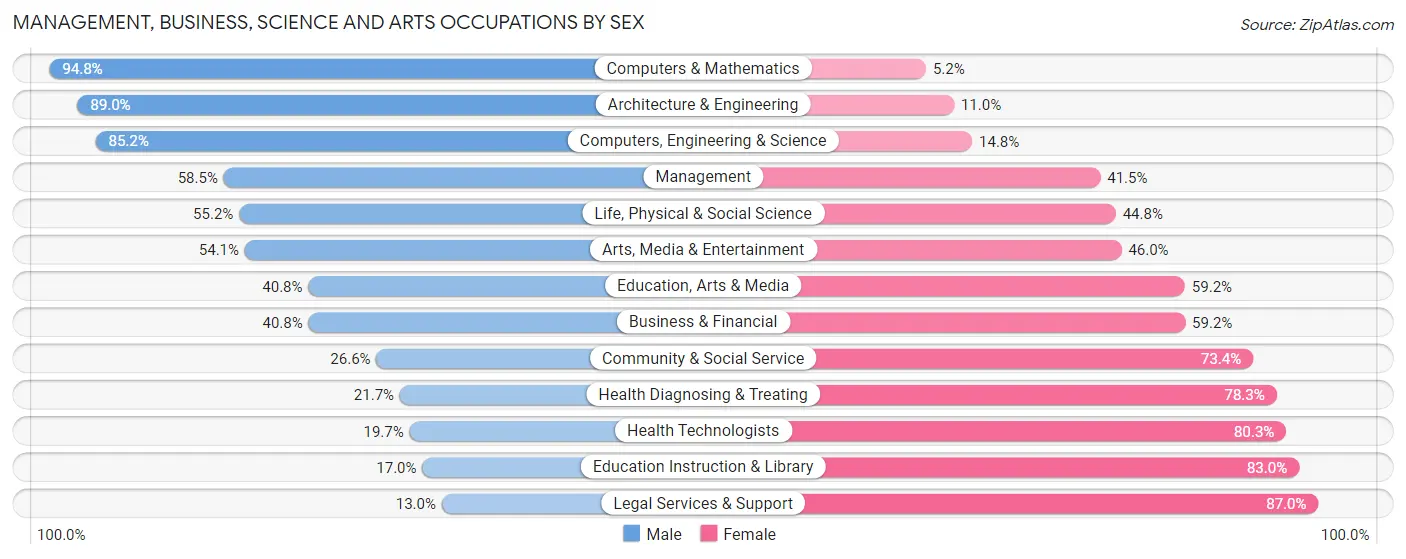
Management, Business, Science and Arts Occupations by Sex
Within the Management, Business, Science and Arts occupations in Burke County, the most male-oriented occupations are Computers & Mathematics (94.8%), Architecture & Engineering (89.0%), and Computers, Engineering & Science (85.2%), while the most female-oriented occupations are Legal Services & Support (87.0%), Education Instruction & Library (83.0%), and Health Technologists (80.3%).
| Occupation | Male | Female |
| Management | 2,042 (58.5%) | 1,451 (41.5%) |
| Business & Financial | 507 (40.8%) | 737 (59.2%) |
| Computers, Engineering & Science | 1,192 (85.2%) | 207 (14.8%) |
| Computers & Mathematics | 293 (94.8%) | 16 (5.2%) |
| Architecture & Engineering | 783 (89.0%) | 97 (11.0%) |
| Life, Physical & Social Science | 116 (55.2%) | 94 (44.8%) |
| Community & Social Service | 919 (26.6%) | 2,535 (73.4%) |
| Education, Arts & Media | 371 (40.8%) | 538 (59.2%) |
| Legal Services & Support | 27 (13.0%) | 181 (87.0%) |
| Education Instruction & Library | 341 (17.0%) | 1,663 (83.0%) |
| Arts, Media & Entertainment | 180 (54.0%) | 153 (46.0%) |
| Health Diagnosing & Treating | 630 (21.7%) | 2,272 (78.3%) |
| Health Technologists | 340 (19.7%) | 1,386 (80.3%) |
| Total (Category) | 5,290 (42.3%) | 7,202 (57.7%) |
| Total (Overall) | 21,225 (53.7%) | 18,314 (46.3%) |
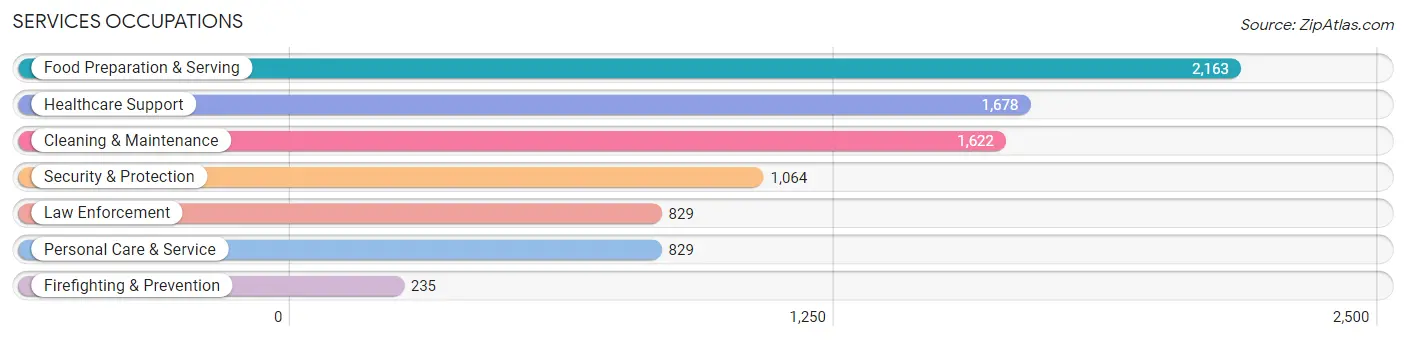
Services Occupations
The most common Services occupations in Burke County are Food Preparation & Serving (2,163 | 5.5%), Healthcare Support (1,678 | 4.2%), Cleaning & Maintenance (1,622 | 4.1%), Security & Protection (1,064 | 2.7%), and Law Enforcement (829 | 2.1%).
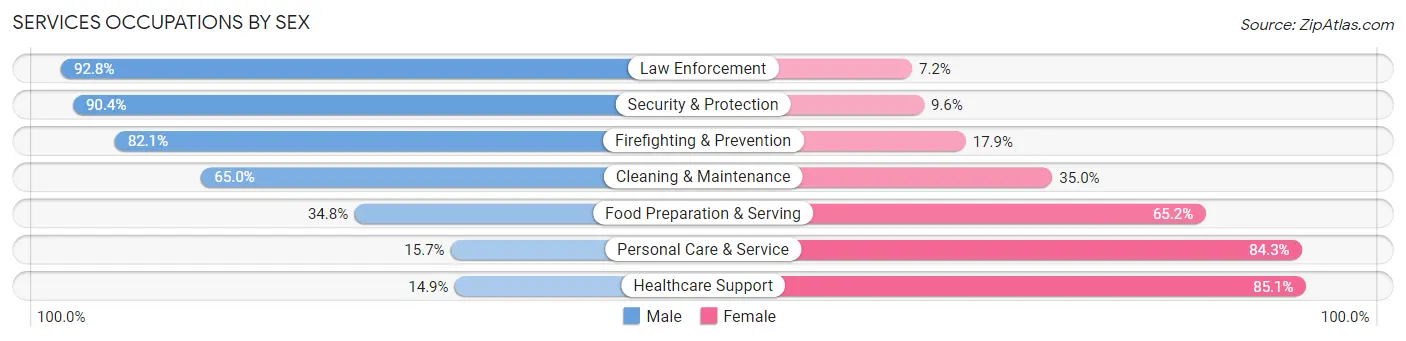
Services Occupations by Sex
Within the Services occupations in Burke County, the most male-oriented occupations are Law Enforcement (92.8%), Security & Protection (90.4%), and Firefighting & Prevention (82.1%), while the most female-oriented occupations are Healthcare Support (85.1%), Personal Care & Service (84.3%), and Food Preparation & Serving (65.2%).
| Occupation | Male | Female |
| Healthcare Support | 250 (14.9%) | 1,428 (85.1%) |
| Security & Protection | 962 (90.4%) | 102 (9.6%) |
| Firefighting & Prevention | 193 (82.1%) | 42 (17.9%) |
| Law Enforcement | 769 (92.8%) | 60 (7.2%) |
| Food Preparation & Serving | 752 (34.8%) | 1,411 (65.2%) |
| Cleaning & Maintenance | 1,054 (65.0%) | 568 (35.0%) |
| Personal Care & Service | 130 (15.7%) | 699 (84.3%) |
| Total (Category) | 3,148 (42.8%) | 4,208 (57.2%) |
| Total (Overall) | 21,225 (53.7%) | 18,314 (46.3%) |
Sales and Office Occupations
The most common Sales and Office occupations in Burke County are Sales & Related (3,609 | 9.1%), and Office & Administration (3,343 | 8.5%).

Sales and Office Occupations by Sex
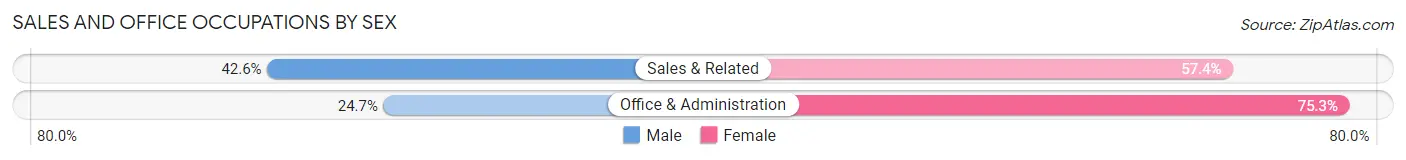
| Occupation | Male | Female |
| Sales & Related | 1,539 (42.6%) | 2,070 (57.4%) |
| Office & Administration | 827 (24.7%) | 2,516 (75.3%) |
| Total (Category) | 2,366 (34.0%) | 4,586 (66.0%) |
| Total (Overall) | 21,225 (53.7%) | 18,314 (46.3%) |
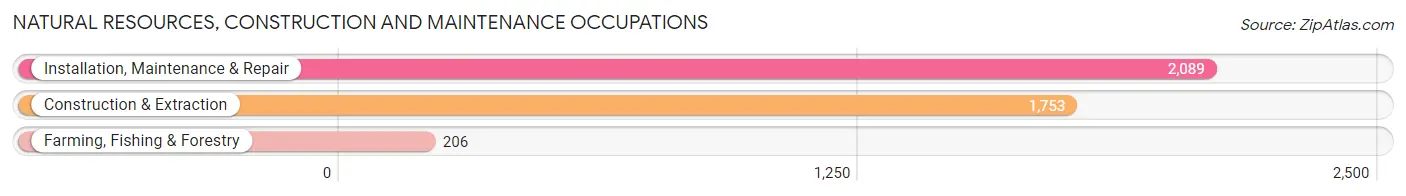
Natural Resources, Construction and Maintenance Occupations
The most common Natural Resources, Construction and Maintenance occupations in Burke County are Installation, Maintenance & Repair (2,089 | 5.3%), Construction & Extraction (1,753 | 4.4%), and Farming, Fishing & Forestry (206 | 0.5%).
Natural Resources, Construction and Maintenance Occupations by Sex
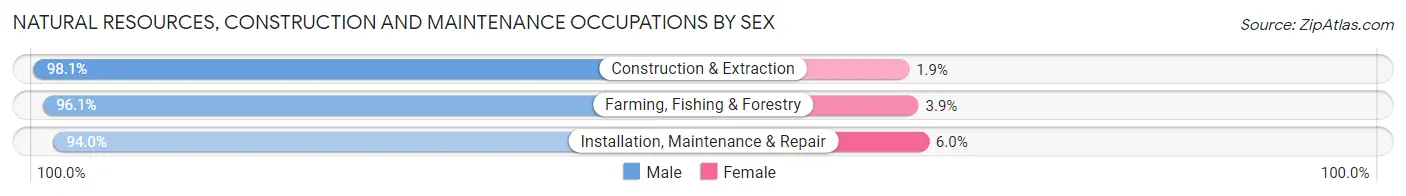
| Occupation | Male | Female |
| Farming, Fishing & Forestry | 198 (96.1%) | 8 (3.9%) |
| Construction & Extraction | 1,719 (98.1%) | 34 (1.9%) |
| Installation, Maintenance & Repair | 1,963 (94.0%) | 126 (6.0%) |
| Total (Category) | 3,880 (95.9%) | 168 (4.2%) |
| Total (Overall) | 21,225 (53.7%) | 18,314 (46.3%) |
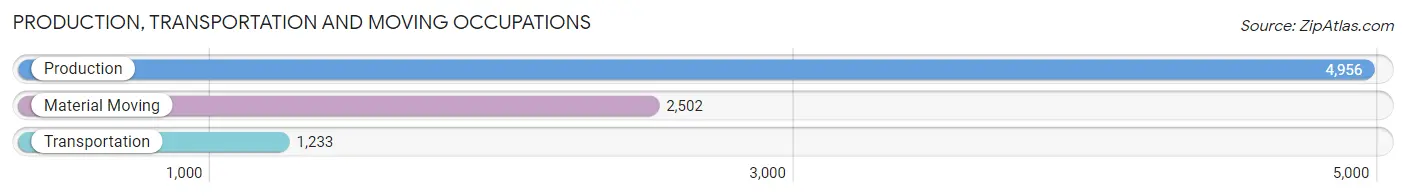
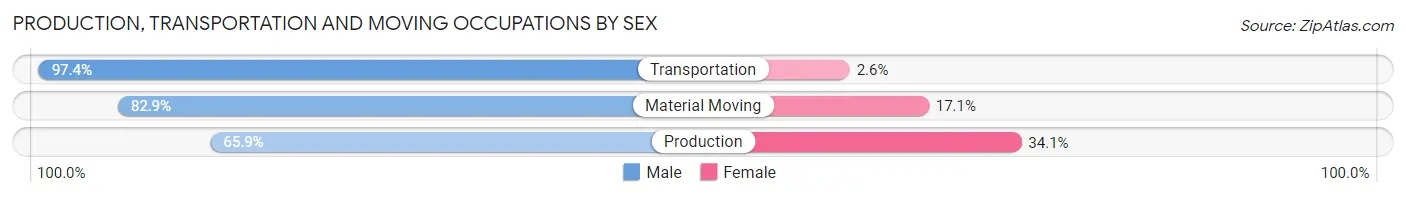
Production, Transportation and Moving Occupations
The most common Production, Transportation and Moving occupations in Burke County are Production (4,956 | 12.5%), Material Moving (2,502 | 6.3%), and Transportation (1,233 | 3.1%).
Production, Transportation and Moving Occupations by Sex
| Occupation | Male | Female |
| Production | 3,266 (65.9%) | 1,690 (34.1%) |
| Transportation | 1,201 (97.4%) | 32 (2.6%) |
| Material Moving | 2,074 (82.9%) | 428 (17.1%) |
| Total (Category) | 6,541 (75.3%) | 2,150 (24.7%) |
| Total (Overall) | 21,225 (53.7%) | 18,314 (46.3%) |
Employment Industries by Sex in Burke County
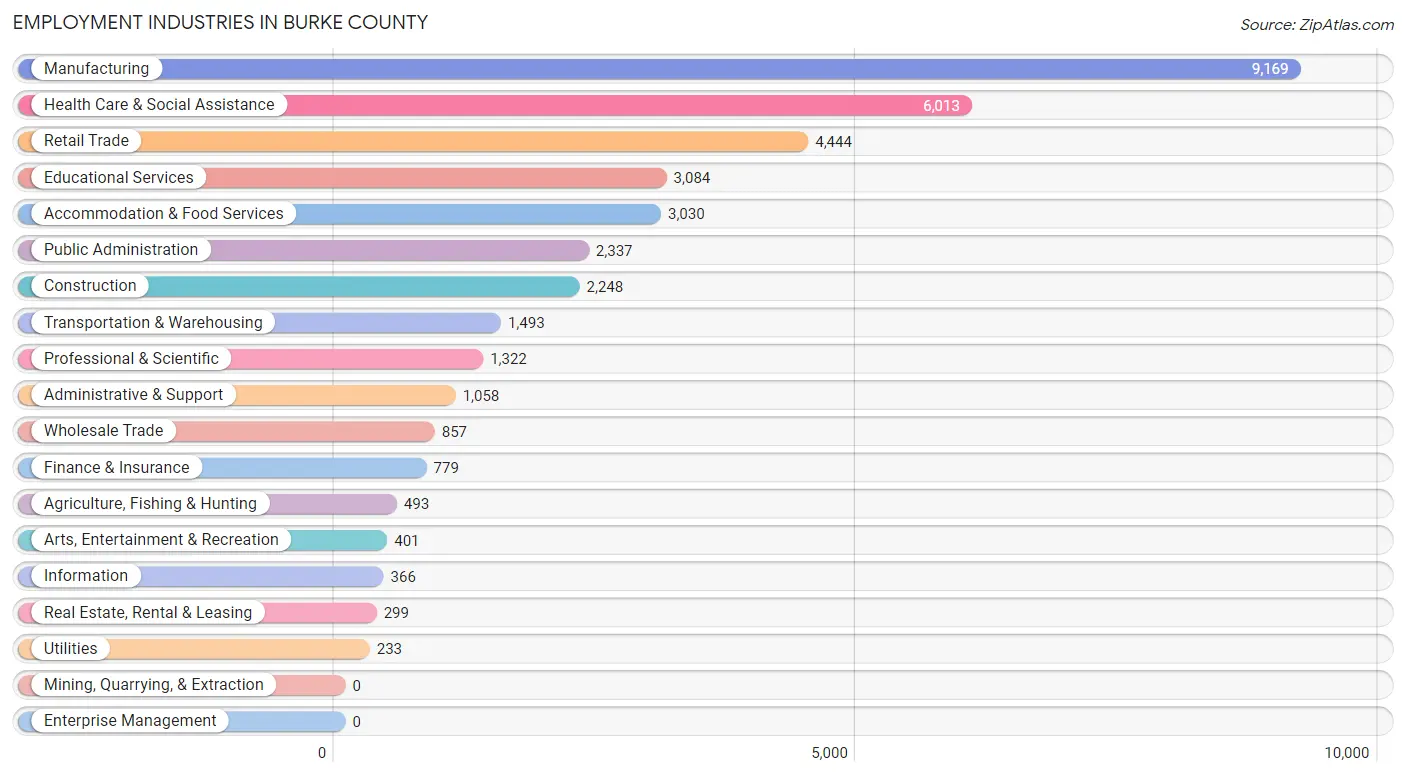
Employment Industries in Burke County
The major employment industries in Burke County include Manufacturing (9,169 | 23.2%), Health Care & Social Assistance (6,013 | 15.2%), Retail Trade (4,444 | 11.2%), Educational Services (3,084 | 7.8%), and Accommodation & Food Services (3,030 | 7.7%).
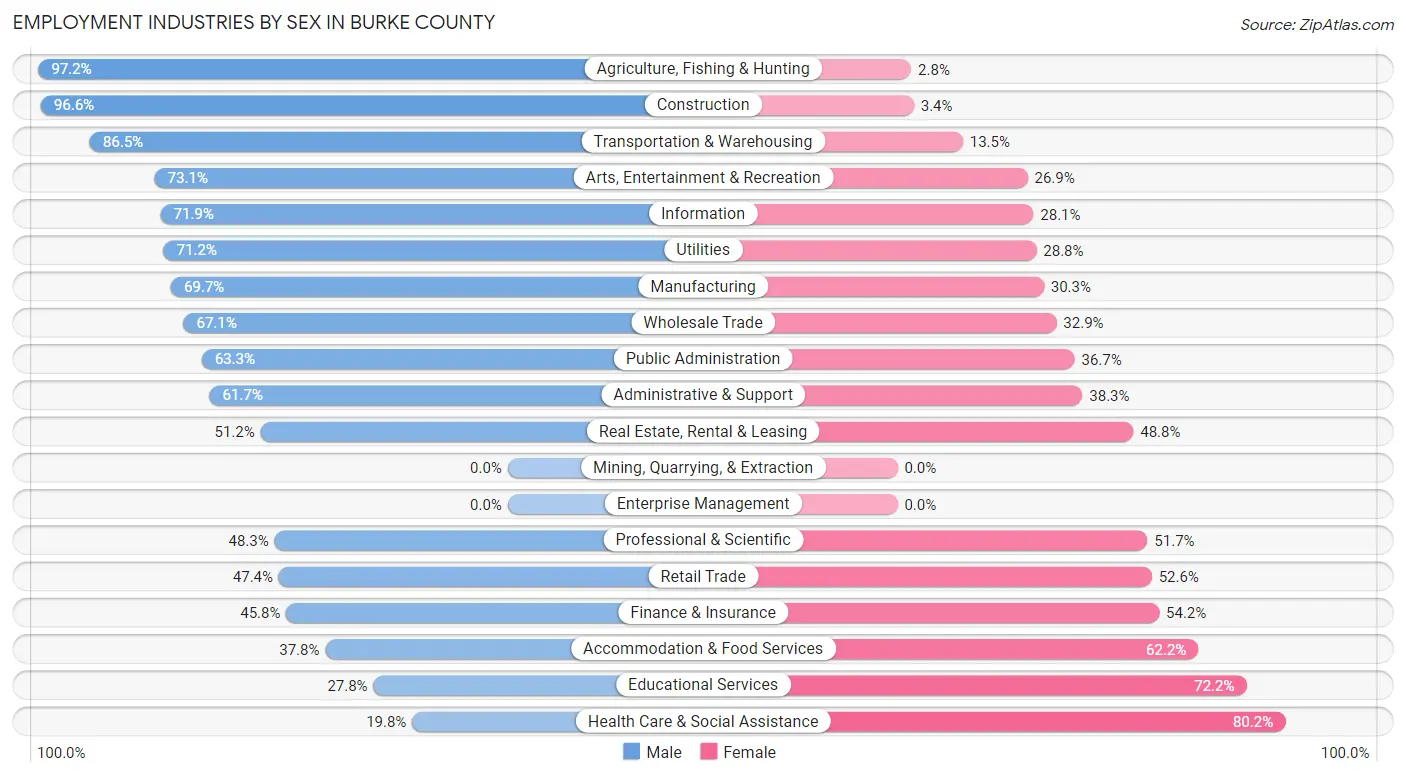
Employment Industries by Sex in Burke County
The Burke County industries that see more men than women are Agriculture, Fishing & Hunting (97.2%), Construction (96.6%), and Transportation & Warehousing (86.5%), whereas the industries that tend to have a higher number of women are Health Care & Social Assistance (80.2%), Educational Services (72.2%), and Accommodation & Food Services (62.2%).
| Industry | Male | Female |
| Agriculture, Fishing & Hunting | 479 (97.2%) | 14 (2.8%) |
| Mining, Quarrying, & Extraction | 0 (0.0%) | 0 (0.0%) |
| Construction | 2,172 (96.6%) | 76 (3.4%) |
| Manufacturing | 6,391 (69.7%) | 2,778 (30.3%) |
| Wholesale Trade | 575 (67.1%) | 282 (32.9%) |
| Retail Trade | 2,105 (47.4%) | 2,339 (52.6%) |
| Transportation & Warehousing | 1,291 (86.5%) | 202 (13.5%) |
| Utilities | 166 (71.2%) | 67 (28.8%) |
| Information | 263 (71.9%) | 103 (28.1%) |
| Finance & Insurance | 357 (45.8%) | 422 (54.2%) |
| Real Estate, Rental & Leasing | 153 (51.2%) | 146 (48.8%) |
| Professional & Scientific | 638 (48.3%) | 684 (51.7%) |
| Enterprise Management | 0 (0.0%) | 0 (0.0%) |
| Administrative & Support | 653 (61.7%) | 405 (38.3%) |
| Educational Services | 857 (27.8%) | 2,227 (72.2%) |
| Health Care & Social Assistance | 1,189 (19.8%) | 4,824 (80.2%) |
| Arts, Entertainment & Recreation | 293 (73.1%) | 108 (26.9%) |
| Accommodation & Food Services | 1,144 (37.8%) | 1,886 (62.2%) |
| Public Administration | 1,480 (63.3%) | 857 (36.7%) |
| Total | 21,225 (53.7%) | 18,314 (46.3%) |
Education in Burke County
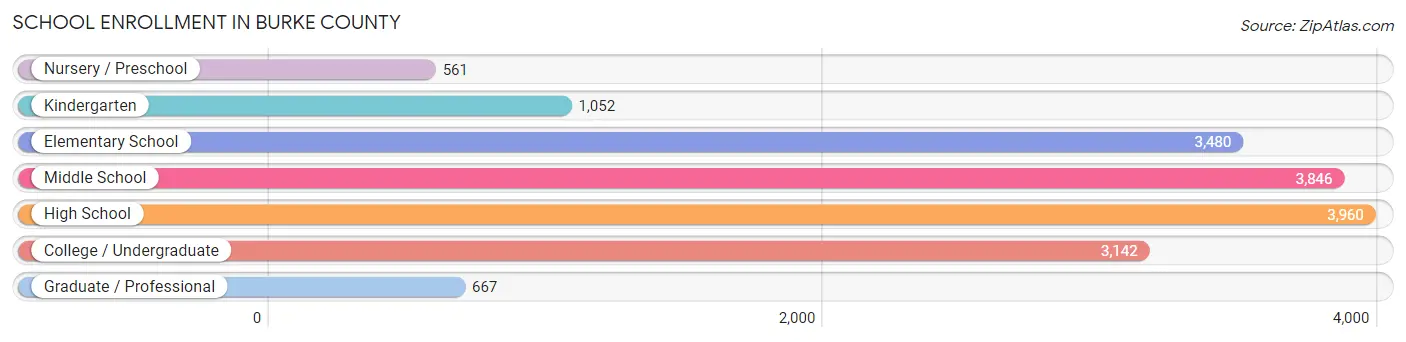
School Enrollment in Burke County
The most common levels of schooling among the 16,708 students in Burke County are high school (3,960 | 23.7%), middle school (3,846 | 23.0%), and elementary school (3,480 | 20.8%).
| School Level | # Students | % Students |
| Nursery / Preschool | 561 | 3.4% |
| Kindergarten | 1,052 | 6.3% |
| Elementary School | 3,480 | 20.8% |
| Middle School | 3,846 | 23.0% |
| High School | 3,960 | 23.7% |
| College / Undergraduate | 3,142 | 18.8% |
| Graduate / Professional | 667 | 4.0% |
| Total | 16,708 | 100.0% |
School Enrollment by Age by Funding Source in Burke County
Out of a total of 16,708 students who are enrolled in schools in Burke County, 1,821 (10.9%) attend a private institution, while the remaining 14,887 (89.1%) are enrolled in public schools. The age group of 3 to 4 year olds has the highest likelihood of being enrolled in private schools, with 256 (52.0% in the age bracket) enrolled. Conversely, the age group of 18 to 19 year olds has the lowest likelihood of being enrolled in a private school, with 933 (93.4% in the age bracket) attending a public institution.
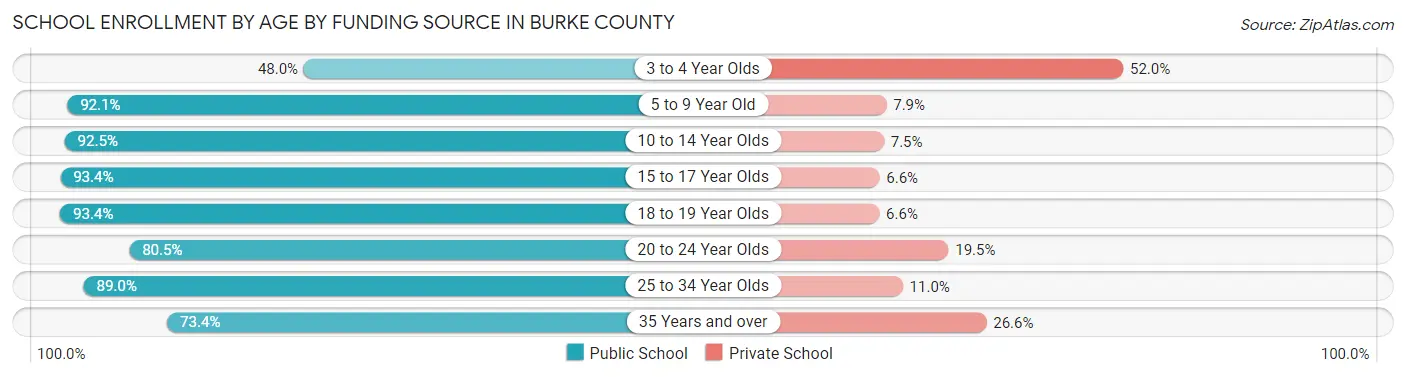
| Age Bracket | Public School | Private School |
| 3 to 4 Year Olds | 236 (48.0%) | 256 (52.0%) |
| 5 to 9 Year Old | 3,781 (92.1%) | 326 (7.9%) |
| 10 to 14 Year Olds | 4,395 (92.5%) | 355 (7.5%) |
| 15 to 17 Year Olds | 2,726 (93.4%) | 194 (6.6%) |
| 18 to 19 Year Olds | 933 (93.4%) | 66 (6.6%) |
| 20 to 24 Year Olds | 1,177 (80.5%) | 285 (19.5%) |
| 25 to 34 Year Olds | 1,020 (89.0%) | 126 (11.0%) |
| 35 Years and over | 611 (73.4%) | 221 (26.6%) |
| Total | 14,887 (89.1%) | 1,821 (10.9%) |
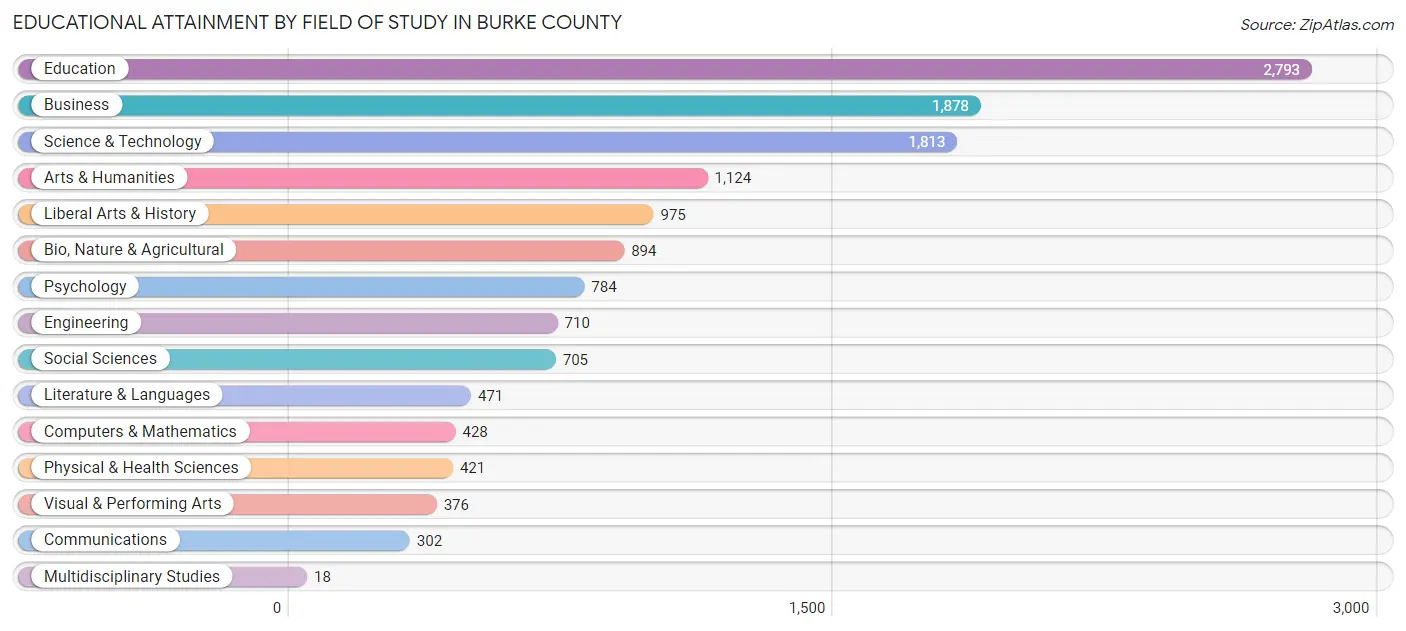
Educational Attainment by Field of Study in Burke County
Education (2,793 | 20.4%), business (1,878 | 13.7%), science & technology (1,813 | 13.2%), arts & humanities (1,124 | 8.2%), and liberal arts & history (975 | 7.1%) are the most common fields of study among 13,692 individuals in Burke County who have obtained a bachelor's degree or higher.
| Field of Study | # Graduates | % Graduates |
| Computers & Mathematics | 428 | 3.1% |
| Bio, Nature & Agricultural | 894 | 6.5% |
| Physical & Health Sciences | 421 | 3.1% |
| Psychology | 784 | 5.7% |
| Social Sciences | 705 | 5.1% |
| Engineering | 710 | 5.2% |
| Multidisciplinary Studies | 18 | 0.1% |
| Science & Technology | 1,813 | 13.2% |
| Business | 1,878 | 13.7% |
| Education | 2,793 | 20.4% |
| Literature & Languages | 471 | 3.4% |
| Liberal Arts & History | 975 | 7.1% |
| Visual & Performing Arts | 376 | 2.8% |
| Communications | 302 | 2.2% |
| Arts & Humanities | 1,124 | 8.2% |
| Total | 13,692 | 100.0% |
Transportation & Commute in Burke County
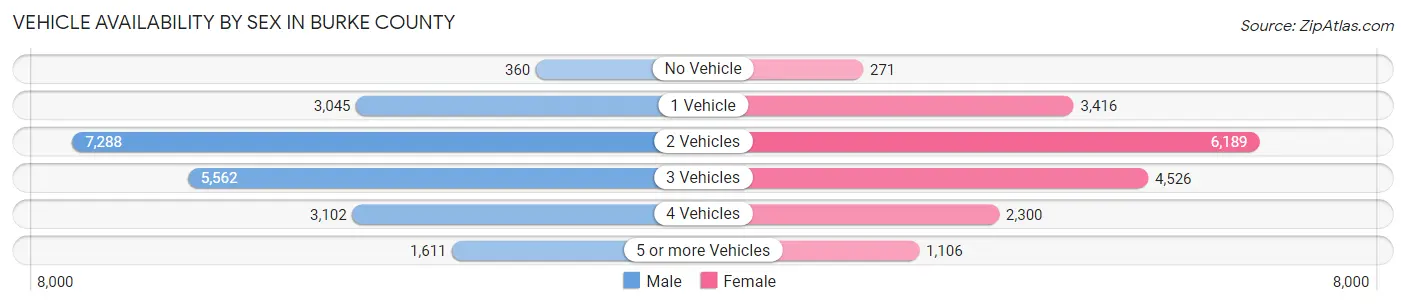
Vehicle Availability by Sex in Burke County
The most prevalent vehicle ownership categories in Burke County are males with 2 vehicles (7,288, accounting for 34.8%) and females with 2 vehicles (6,189, making up 40.9%).
| Vehicles Available | Male | Female |
| No Vehicle | 360 (1.7%) | 271 (1.5%) |
| 1 Vehicle | 3,045 (14.5%) | 3,416 (19.2%) |
| 2 Vehicles | 7,288 (34.8%) | 6,189 (34.7%) |
| 3 Vehicles | 5,562 (26.5%) | 4,526 (25.4%) |
| 4 Vehicles | 3,102 (14.8%) | 2,300 (12.9%) |
| 5 or more Vehicles | 1,611 (7.7%) | 1,106 (6.2%) |
| Total | 20,968 (100.0%) | 17,808 (100.0%) |
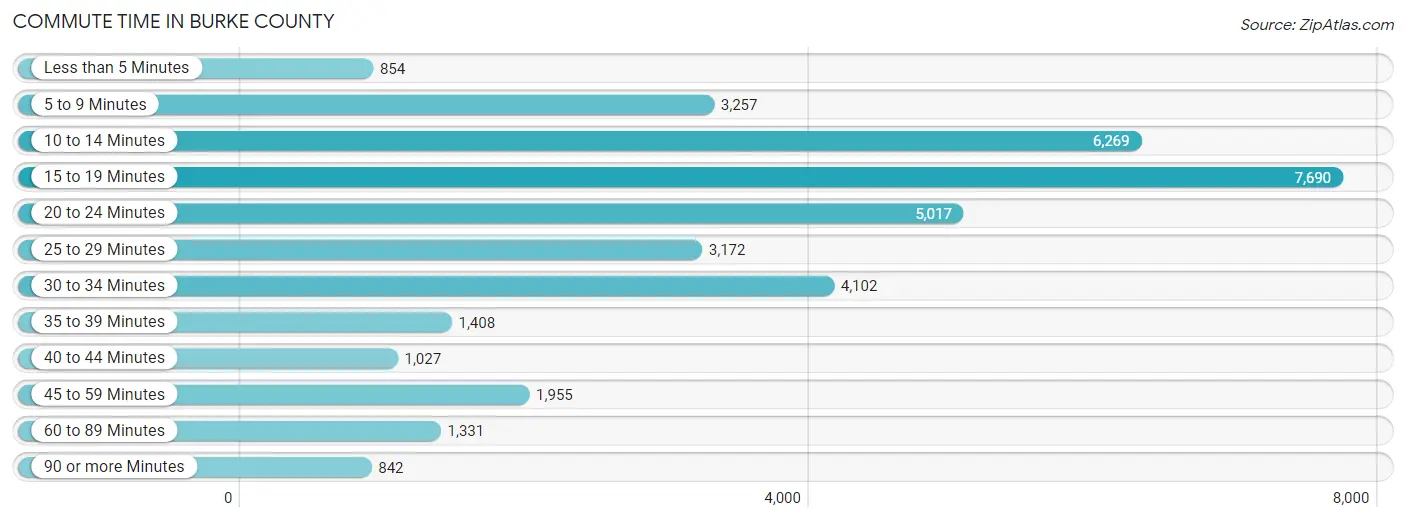
Commute Time in Burke County
The most frequently occuring commute durations in Burke County are 15 to 19 minutes (7,690 commuters, 20.8%), 10 to 14 minutes (6,269 commuters, 17.0%), and 20 to 24 minutes (5,017 commuters, 13.6%).
| Commute Time | # Commuters | % Commuters |
| Less than 5 Minutes | 854 | 2.3% |
| 5 to 9 Minutes | 3,257 | 8.8% |
| 10 to 14 Minutes | 6,269 | 17.0% |
| 15 to 19 Minutes | 7,690 | 20.8% |
| 20 to 24 Minutes | 5,017 | 13.6% |
| 25 to 29 Minutes | 3,172 | 8.6% |
| 30 to 34 Minutes | 4,102 | 11.1% |
| 35 to 39 Minutes | 1,408 | 3.8% |
| 40 to 44 Minutes | 1,027 | 2.8% |
| 45 to 59 Minutes | 1,955 | 5.3% |
| 60 to 89 Minutes | 1,331 | 3.6% |
| 90 or more Minutes | 842 | 2.3% |
Commute Time by Sex in Burke County
The most common commute times in Burke County are 15 to 19 minutes (3,846 commuters, 19.1%) for males and 15 to 19 minutes (3,844 commuters, 23.0%) for females.
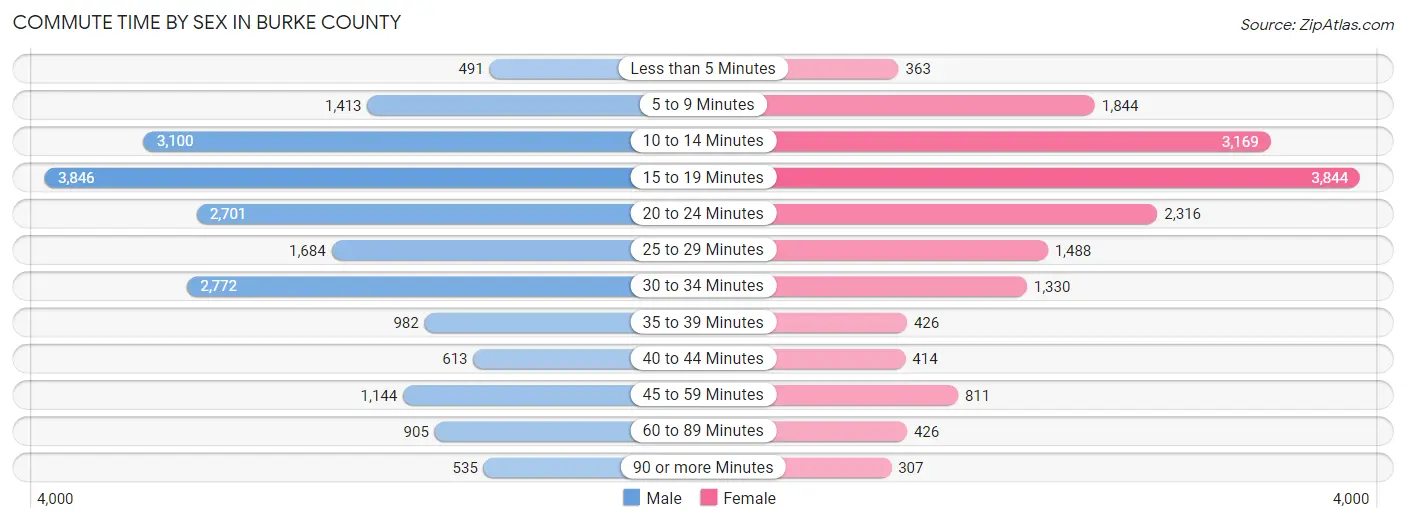
| Commute Time | Male | Female |
| Less than 5 Minutes | 491 (2.4%) | 363 (2.2%) |
| 5 to 9 Minutes | 1,413 (7.0%) | 1,844 (11.0%) |
| 10 to 14 Minutes | 3,100 (15.4%) | 3,169 (18.9%) |
| 15 to 19 Minutes | 3,846 (19.1%) | 3,844 (23.0%) |
| 20 to 24 Minutes | 2,701 (13.4%) | 2,316 (13.8%) |
| 25 to 29 Minutes | 1,684 (8.3%) | 1,488 (8.9%) |
| 30 to 34 Minutes | 2,772 (13.7%) | 1,330 (8.0%) |
| 35 to 39 Minutes | 982 (4.9%) | 426 (2.5%) |
| 40 to 44 Minutes | 613 (3.0%) | 414 (2.5%) |
| 45 to 59 Minutes | 1,144 (5.7%) | 811 (4.9%) |
| 60 to 89 Minutes | 905 (4.5%) | 426 (2.5%) |
| 90 or more Minutes | 535 (2.6%) | 307 (1.8%) |
Time of Departure to Work by Sex in Burke County
The most frequent times of departure to work in Burke County are 7:00 AM to 7:29 AM (3,053, 15.1%) for males and 7:00 AM to 7:29 AM (2,850, 17.0%) for females.
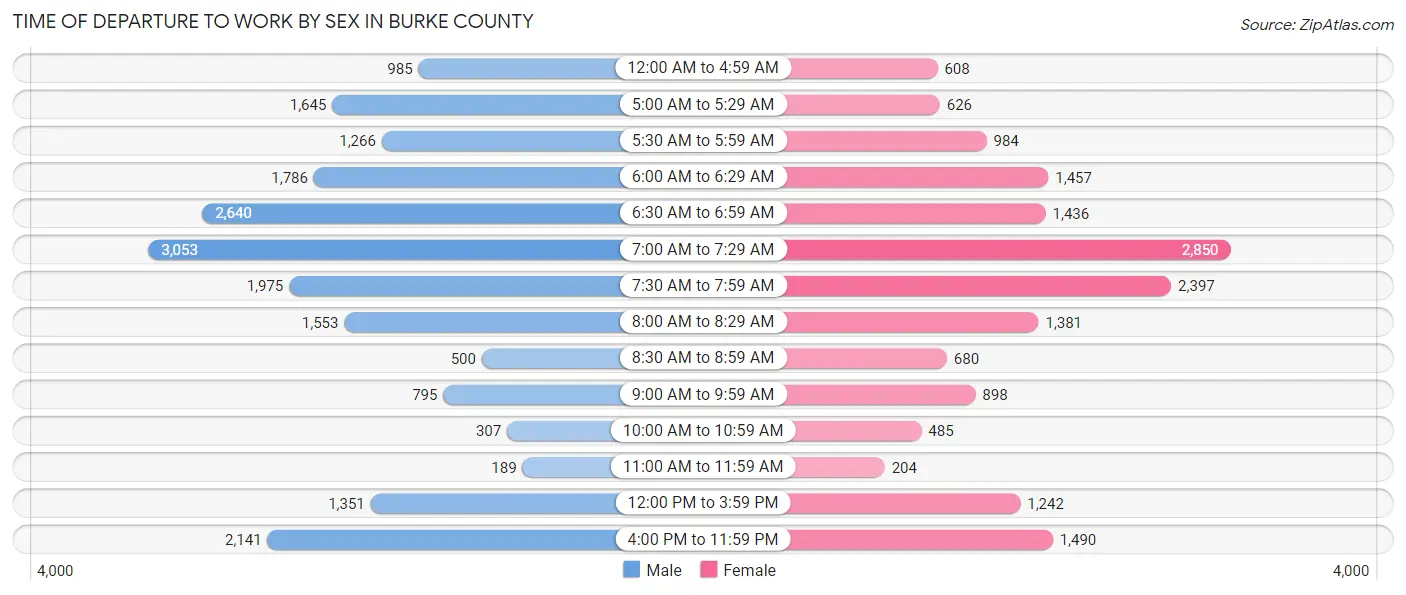
| Time of Departure | Male | Female |
| 12:00 AM to 4:59 AM | 985 (4.9%) | 608 (3.6%) |
| 5:00 AM to 5:29 AM | 1,645 (8.2%) | 626 (3.7%) |
| 5:30 AM to 5:59 AM | 1,266 (6.3%) | 984 (5.9%) |
| 6:00 AM to 6:29 AM | 1,786 (8.8%) | 1,457 (8.7%) |
| 6:30 AM to 6:59 AM | 2,640 (13.1%) | 1,436 (8.6%) |
| 7:00 AM to 7:29 AM | 3,053 (15.1%) | 2,850 (17.0%) |
| 7:30 AM to 7:59 AM | 1,975 (9.8%) | 2,397 (14.3%) |
| 8:00 AM to 8:29 AM | 1,553 (7.7%) | 1,381 (8.3%) |
| 8:30 AM to 8:59 AM | 500 (2.5%) | 680 (4.1%) |
| 9:00 AM to 9:59 AM | 795 (3.9%) | 898 (5.4%) |
| 10:00 AM to 10:59 AM | 307 (1.5%) | 485 (2.9%) |
| 11:00 AM to 11:59 AM | 189 (0.9%) | 204 (1.2%) |
| 12:00 PM to 3:59 PM | 1,351 (6.7%) | 1,242 (7.4%) |
| 4:00 PM to 11:59 PM | 2,141 (10.6%) | 1,490 (8.9%) |
| Total | 20,186 (100.0%) | 16,738 (100.0%) |
Housing Occupancy in Burke County
Occupancy by Ownership in Burke County
Of the total 35,195 dwellings in Burke County, owner-occupied units account for 26,786 (76.1%), while renter-occupied units make up 8,409 (23.9%).
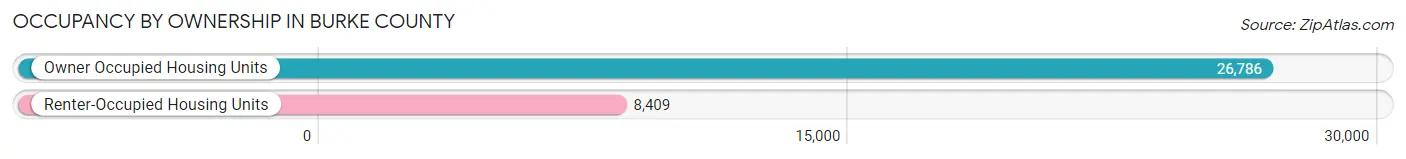
| Occupancy | # Housing Units | % Housing Units |
| Owner Occupied Housing Units | 26,786 | 76.1% |
| Renter-Occupied Housing Units | 8,409 | 23.9% |
| Total Occupied Housing Units | 35,195 | 100.0% |
Occupancy by Household Size in Burke County
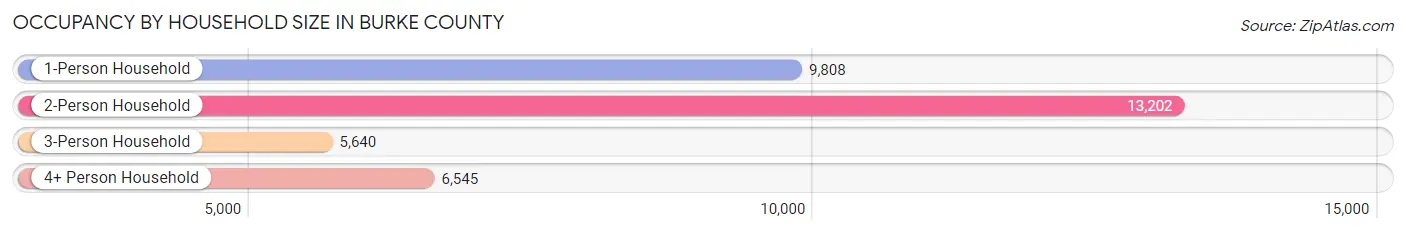
| Household Size | # Housing Units | % Housing Units |
| 1-Person Household | 9,808 | 27.9% |
| 2-Person Household | 13,202 | 37.5% |
| 3-Person Household | 5,640 | 16.0% |
| 4+ Person Household | 6,545 | 18.6% |
| Total Housing Units | 35,195 | 100.0% |
Occupancy by Ownership by Household Size in Burke County
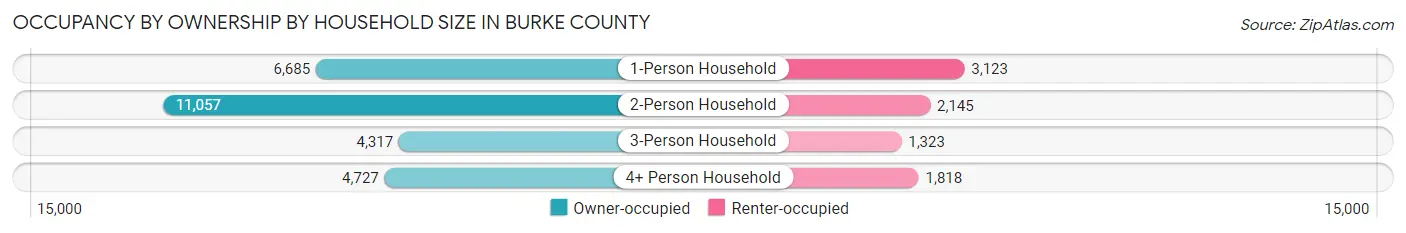
| Household Size | Owner-occupied | Renter-occupied |
| 1-Person Household | 6,685 (68.2%) | 3,123 (31.8%) |
| 2-Person Household | 11,057 (83.8%) | 2,145 (16.3%) |
| 3-Person Household | 4,317 (76.5%) | 1,323 (23.5%) |
| 4+ Person Household | 4,727 (72.2%) | 1,818 (27.8%) |
| Total Housing Units | 26,786 (76.1%) | 8,409 (23.9%) |
Occupancy by Educational Attainment in Burke County
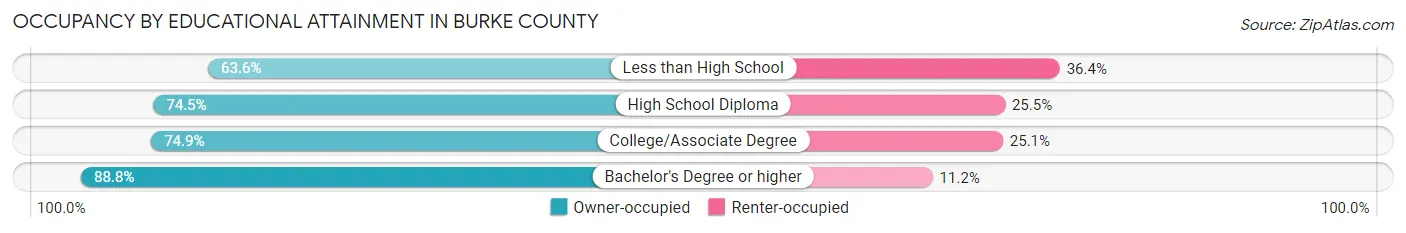
| Household Size | Owner-occupied | Renter-occupied |
| Less than High School | 3,015 (63.6%) | 1,725 (36.4%) |
| High School Diploma | 7,609 (74.5%) | 2,610 (25.5%) |
| College/Associate Degree | 9,723 (74.9%) | 3,262 (25.1%) |
| Bachelor's Degree or higher | 6,439 (88.8%) | 812 (11.2%) |
Occupancy by Age of Householder in Burke County
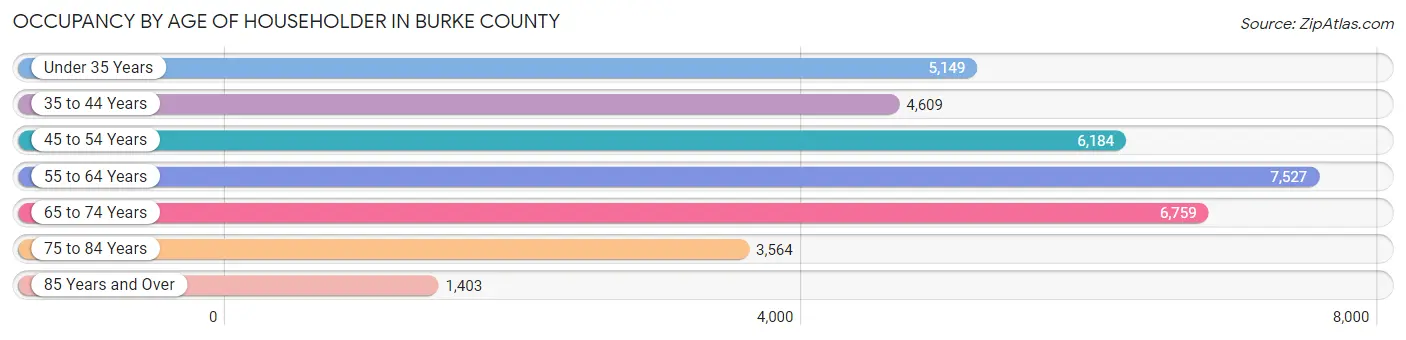
| Age Bracket | # Households | % Households |
| Under 35 Years | 5,149 | 14.6% |
| 35 to 44 Years | 4,609 | 13.1% |
| 45 to 54 Years | 6,184 | 17.6% |
| 55 to 64 Years | 7,527 | 21.4% |
| 65 to 74 Years | 6,759 | 19.2% |
| 75 to 84 Years | 3,564 | 10.1% |
| 85 Years and Over | 1,403 | 4.0% |
| Total | 35,195 | 100.0% |
Housing Finances in Burke County
Median Income by Occupancy in Burke County
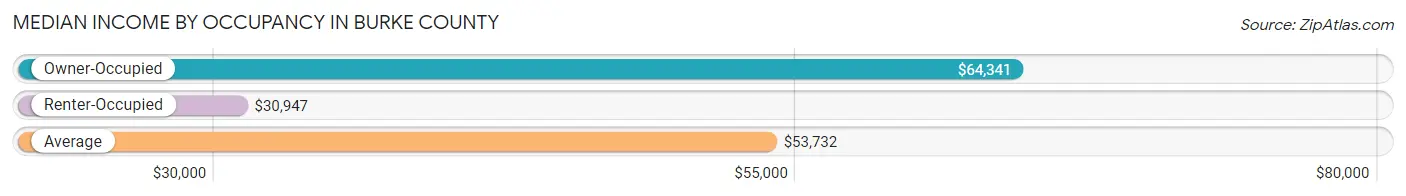
| Occupancy Type | # Households | Median Income |
| Owner-Occupied | 26,786 (76.1%) | $64,341 |
| Renter-Occupied | 8,409 (23.9%) | $30,947 |
| Average | 35,195 (100.0%) | $53,732 |
Occupancy by Householder Income Bracket in Burke County
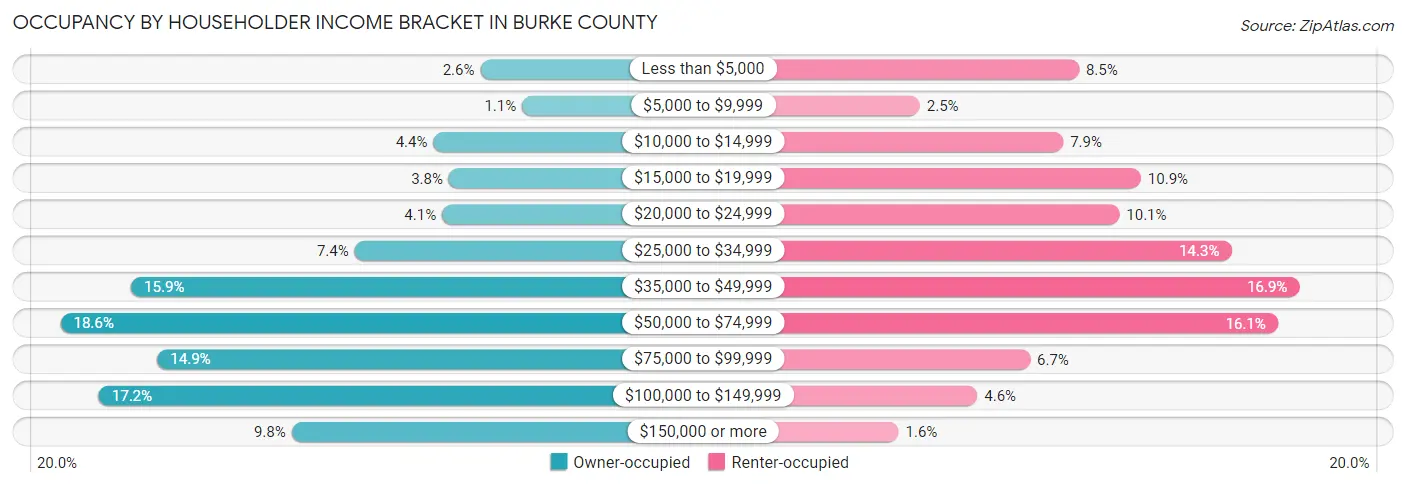
| Income Bracket | Owner-occupied | Renter-occupied |
| Less than $5,000 | 706 (2.6%) | 716 (8.5%) |
| $5,000 to $9,999 | 282 (1.1%) | 206 (2.5%) |
| $10,000 to $14,999 | 1,187 (4.4%) | 665 (7.9%) |
| $15,000 to $19,999 | 1,028 (3.8%) | 914 (10.9%) |
| $20,000 to $24,999 | 1,099 (4.1%) | 845 (10.1%) |
| $25,000 to $34,999 | 1,989 (7.4%) | 1,203 (14.3%) |
| $35,000 to $49,999 | 4,271 (15.9%) | 1,421 (16.9%) |
| $50,000 to $74,999 | 4,990 (18.6%) | 1,352 (16.1%) |
| $75,000 to $99,999 | 4,002 (14.9%) | 559 (6.7%) |
| $100,000 to $149,999 | 4,600 (17.2%) | 390 (4.6%) |
| $150,000 or more | 2,632 (9.8%) | 138 (1.6%) |
| Total | 26,786 (100.0%) | 8,409 (100.0%) |
Monthly Housing Cost Tiers in Burke County
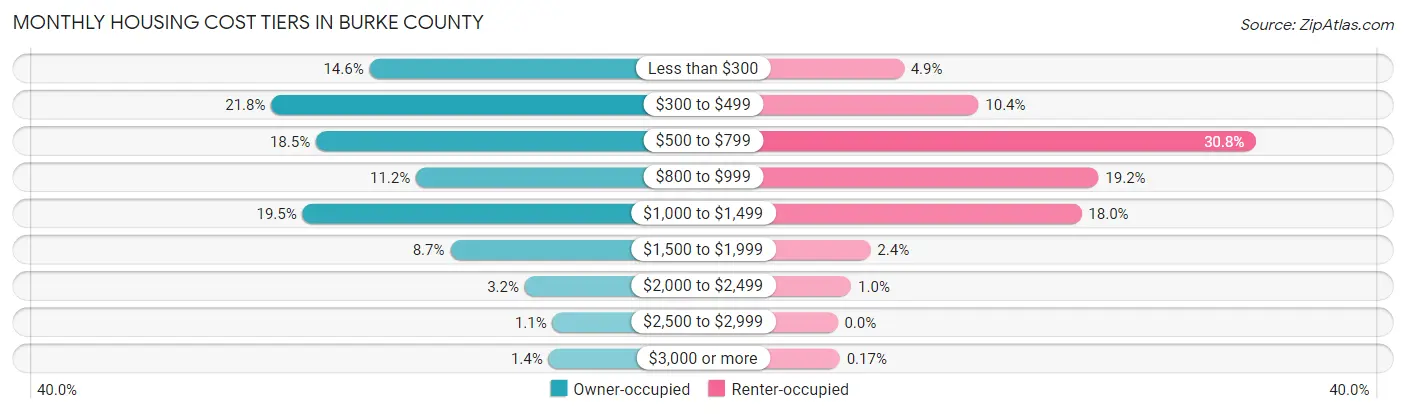
| Monthly Cost | Owner-occupied | Renter-occupied |
| Less than $300 | 3,910 (14.6%) | 410 (4.9%) |
| $300 to $499 | 5,847 (21.8%) | 873 (10.4%) |
| $500 to $799 | 4,966 (18.5%) | 2,593 (30.8%) |
| $800 to $999 | 2,991 (11.2%) | 1,616 (19.2%) |
| $1,000 to $1,499 | 5,230 (19.5%) | 1,511 (18.0%) |
| $1,500 to $1,999 | 2,317 (8.6%) | 204 (2.4%) |
| $2,000 to $2,499 | 847 (3.2%) | 85 (1.0%) |
| $2,500 to $2,999 | 300 (1.1%) | 0 (0.0%) |
| $3,000 or more | 378 (1.4%) | 14 (0.2%) |
| Total | 26,786 (100.0%) | 8,409 (100.0%) |
Physical Housing Characteristics in Burke County
Housing Structures in Burke County
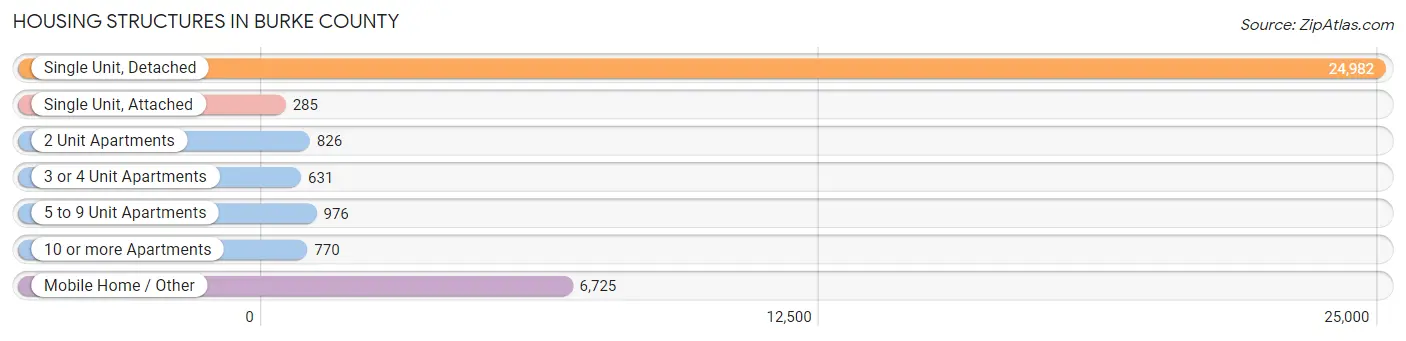
| Structure Type | # Housing Units | % Housing Units |
| Single Unit, Detached | 24,982 | 71.0% |
| Single Unit, Attached | 285 | 0.8% |
| 2 Unit Apartments | 826 | 2.4% |
| 3 or 4 Unit Apartments | 631 | 1.8% |
| 5 to 9 Unit Apartments | 976 | 2.8% |
| 10 or more Apartments | 770 | 2.2% |
| Mobile Home / Other | 6,725 | 19.1% |
| Total | 35,195 | 100.0% |
Housing Structures by Occupancy in Burke County
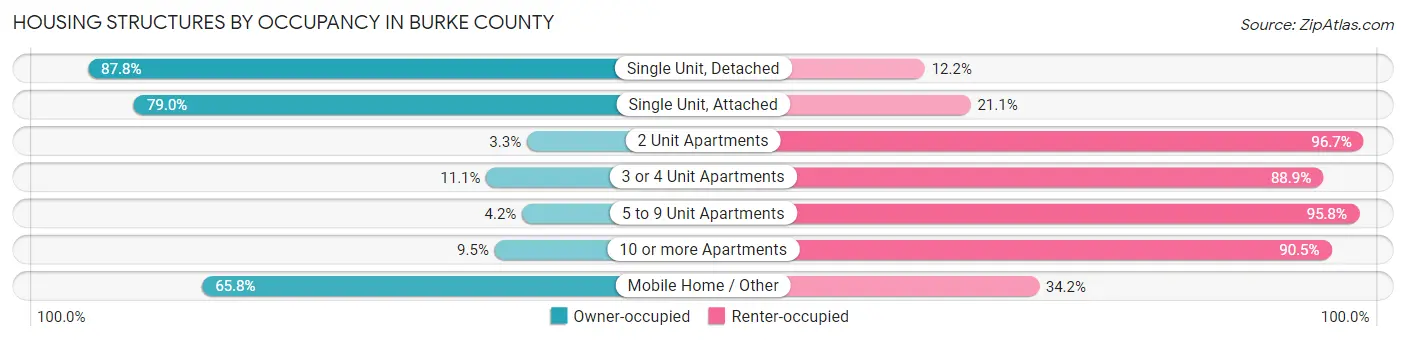
| Structure Type | Owner-occupied | Renter-occupied |
| Single Unit, Detached | 21,925 (87.8%) | 3,057 (12.2%) |
| Single Unit, Attached | 225 (78.9%) | 60 (21.0%) |
| 2 Unit Apartments | 27 (3.3%) | 799 (96.7%) |
| 3 or 4 Unit Apartments | 70 (11.1%) | 561 (88.9%) |
| 5 to 9 Unit Apartments | 41 (4.2%) | 935 (95.8%) |
| 10 or more Apartments | 73 (9.5%) | 697 (90.5%) |
| Mobile Home / Other | 4,425 (65.8%) | 2,300 (34.2%) |
| Total | 26,786 (76.1%) | 8,409 (23.9%) |
Housing Structures by Number of Rooms in Burke County
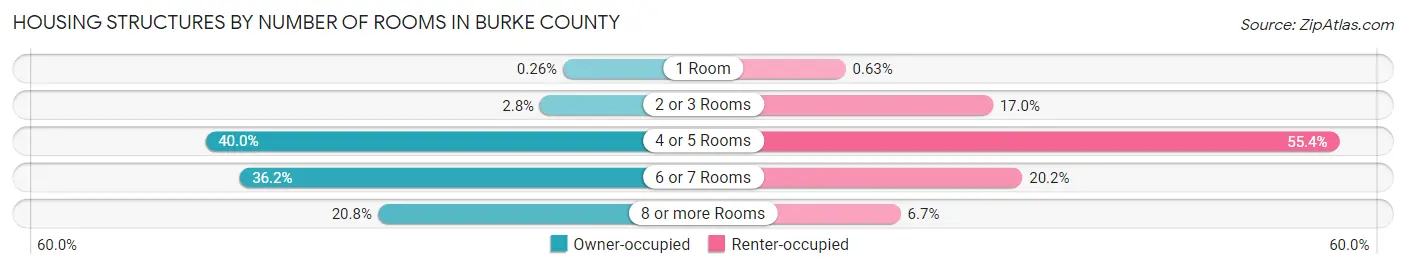
| Number of Rooms | Owner-occupied | Renter-occupied |
| 1 Room | 69 (0.3%) | 53 (0.6%) |
| 2 or 3 Rooms | 754 (2.8%) | 1,426 (17.0%) |
| 4 or 5 Rooms | 10,700 (40.0%) | 4,661 (55.4%) |
| 6 or 7 Rooms | 9,690 (36.2%) | 1,702 (20.2%) |
| 8 or more Rooms | 5,573 (20.8%) | 567 (6.7%) |
| Total | 26,786 (100.0%) | 8,409 (100.0%) |
Housing Structure by Heating Type in Burke County
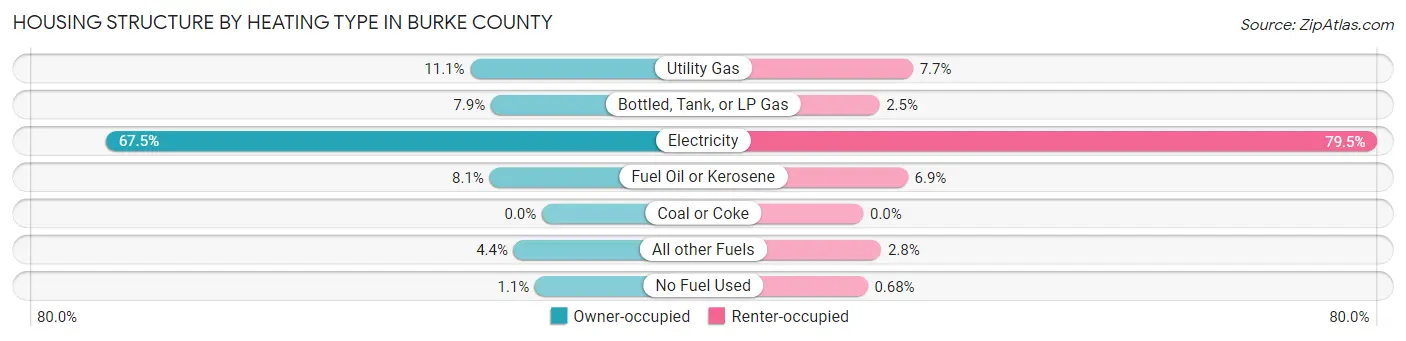
| Heating Type | Owner-occupied | Renter-occupied |
| Utility Gas | 2,971 (11.1%) | 646 (7.7%) |
| Bottled, Tank, or LP Gas | 2,114 (7.9%) | 210 (2.5%) |
| Electricity | 18,067 (67.4%) | 6,684 (79.5%) |
| Fuel Oil or Kerosene | 2,170 (8.1%) | 579 (6.9%) |
| Coal or Coke | 0 (0.0%) | 0 (0.0%) |
| All other Fuels | 1,174 (4.4%) | 233 (2.8%) |
| No Fuel Used | 290 (1.1%) | 57 (0.7%) |
| Total | 26,786 (100.0%) | 8,409 (100.0%) |
Household Vehicle Usage in Burke County
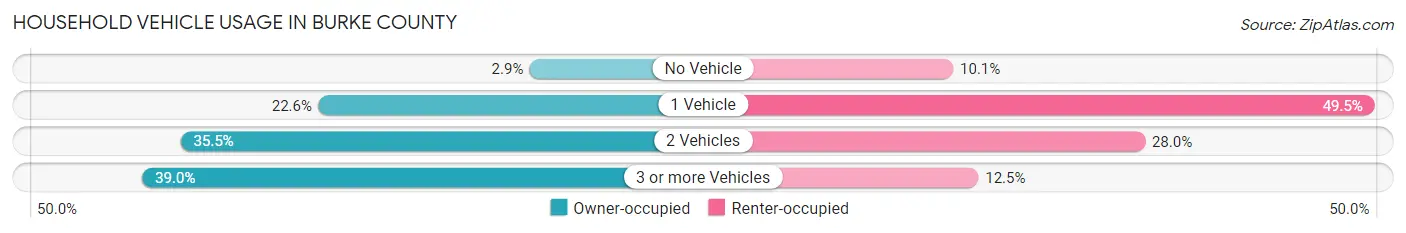
| Vehicles per Household | Owner-occupied | Renter-occupied |
| No Vehicle | 774 (2.9%) | 849 (10.1%) |
| 1 Vehicle | 6,062 (22.6%) | 4,158 (49.4%) |
| 2 Vehicles | 9,495 (35.4%) | 2,355 (28.0%) |
| 3 or more Vehicles | 10,455 (39.0%) | 1,047 (12.4%) |
| Total | 26,786 (100.0%) | 8,409 (100.0%) |
Real Estate & Mortgages in Burke County
Real Estate and Mortgage Overview in Burke County
| Characteristic | Without Mortgage | With Mortgage |
| Housing Units | 12,582 | 14,204 |
| Median Property Value | $124,300 | $174,000 |
| Median Household Income | $46,834 | $2,000 |
| Monthly Housing Costs | $371 | $378 |
| Real Estate Taxes | $969 | $129 |
Property Value by Mortgage Status in Burke County
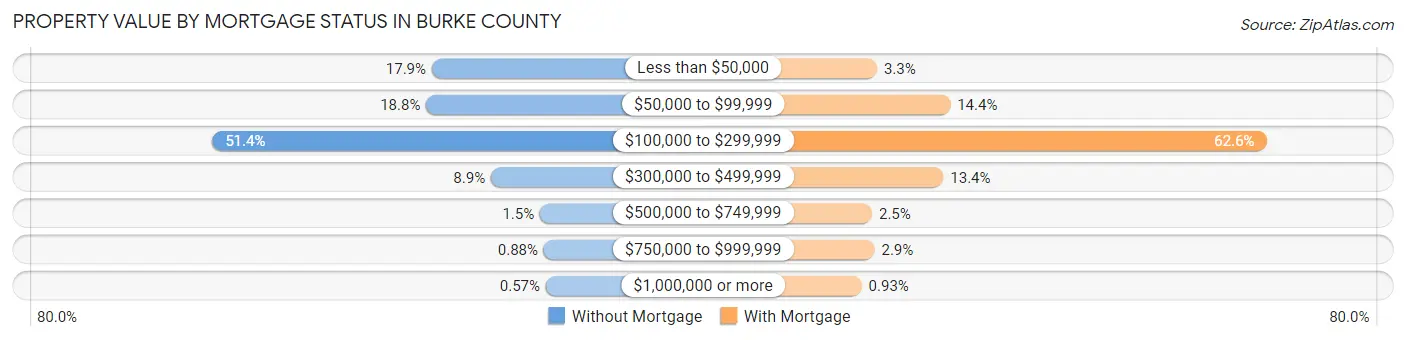
| Property Value | Without Mortgage | With Mortgage |
| Less than $50,000 | 2,257 (17.9%) | 465 (3.3%) |
| $50,000 to $99,999 | 2,366 (18.8%) | 2,049 (14.4%) |
| $100,000 to $299,999 | 6,469 (51.4%) | 8,892 (62.6%) |
| $300,000 to $499,999 | 1,124 (8.9%) | 1,900 (13.4%) |
| $500,000 to $749,999 | 183 (1.5%) | 356 (2.5%) |
| $750,000 to $999,999 | 111 (0.9%) | 410 (2.9%) |
| $1,000,000 or more | 72 (0.6%) | 132 (0.9%) |
| Total | 12,582 (100.0%) | 14,204 (100.0%) |
Household Income by Mortgage Status in Burke County
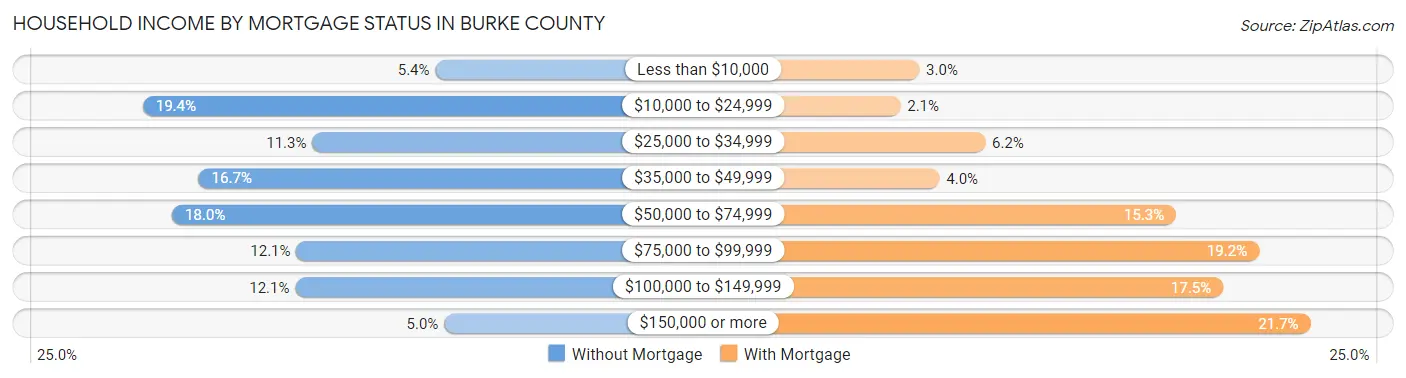
| Household Income | Without Mortgage | With Mortgage |
| Less than $10,000 | 685 (5.4%) | 431 (3.0%) |
| $10,000 to $24,999 | 2,437 (19.4%) | 303 (2.1%) |
| $25,000 to $34,999 | 1,422 (11.3%) | 877 (6.2%) |
| $35,000 to $49,999 | 2,103 (16.7%) | 567 (4.0%) |
| $50,000 to $74,999 | 2,262 (18.0%) | 2,168 (15.3%) |
| $75,000 to $99,999 | 1,517 (12.1%) | 2,728 (19.2%) |
| $100,000 to $149,999 | 1,524 (12.1%) | 2,485 (17.5%) |
| $150,000 or more | 632 (5.0%) | 3,076 (21.7%) |
| Total | 12,582 (100.0%) | 14,204 (100.0%) |
Property Value to Household Income Ratio in Burke County
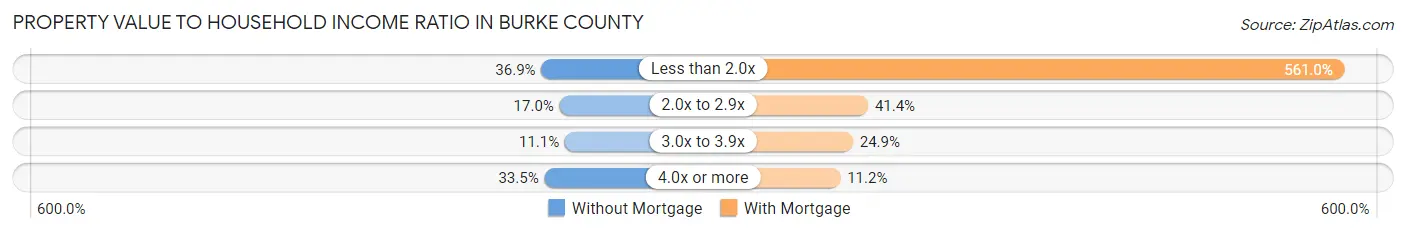
| Value-to-Income Ratio | Without Mortgage | With Mortgage |
| Less than 2.0x | 4,638 (36.9%) | 79,684 (561.0%) |
| 2.0x to 2.9x | 2,136 (17.0%) | 5,884 (41.4%) |
| 3.0x to 3.9x | 1,392 (11.1%) | 3,534 (24.9%) |
| 4.0x or more | 4,214 (33.5%) | 1,595 (11.2%) |
| Total | 12,582 (100.0%) | 14,204 (100.0%) |
Real Estate Taxes by Mortgage Status in Burke County
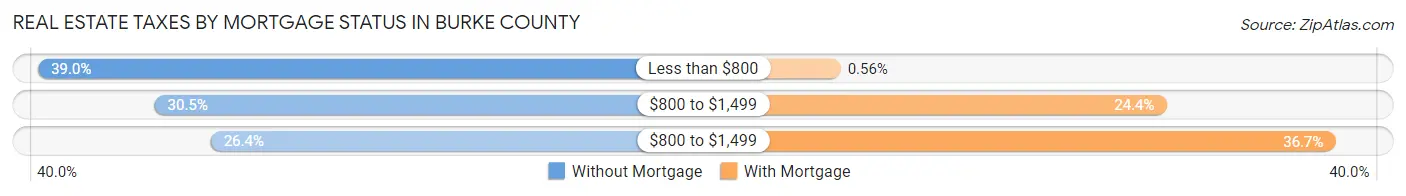
| Property Taxes | Without Mortgage | With Mortgage |
| Less than $800 | 4,909 (39.0%) | 80 (0.6%) |
| $800 to $1,499 | 3,838 (30.5%) | 3,458 (24.3%) |
| $800 to $1,499 | 3,322 (26.4%) | 5,212 (36.7%) |
| Total | 12,582 (100.0%) | 14,204 (100.0%) |
Health & Disability in Burke County
Health Insurance Coverage by Age in Burke County
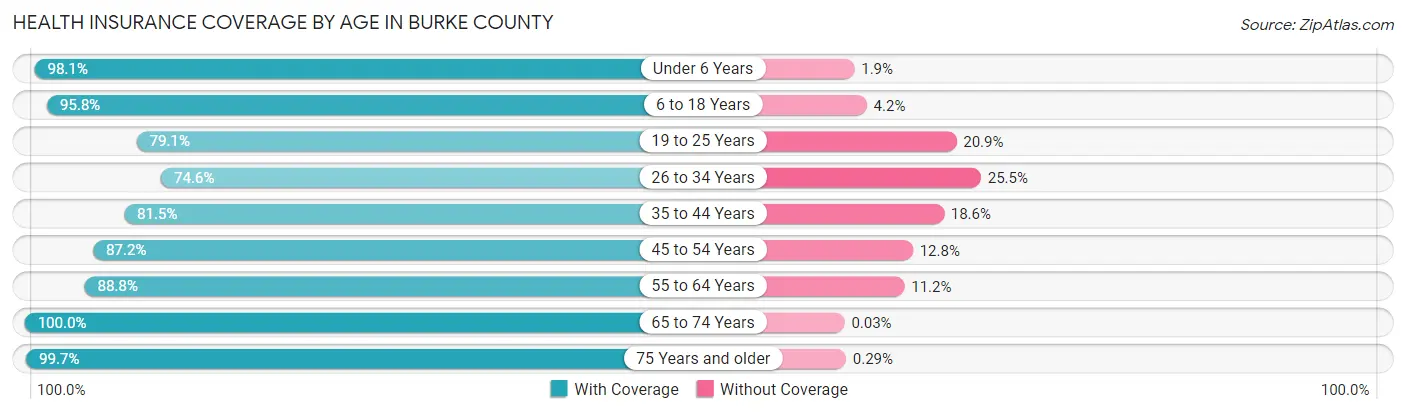
| Age Bracket | With Coverage | Without Coverage |
| Under 6 Years | 4,597 (98.1%) | 87 (1.9%) |
| 6 to 18 Years | 11,600 (95.8%) | 505 (4.2%) |
| 19 to 25 Years | 5,132 (79.1%) | 1,354 (20.9%) |
| 26 to 34 Years | 7,146 (74.6%) | 2,440 (25.5%) |
| 35 to 44 Years | 7,910 (81.5%) | 1,801 (18.5%) |
| 45 to 54 Years | 10,260 (87.2%) | 1,501 (12.8%) |
| 55 to 64 Years | 11,820 (88.8%) | 1,489 (11.2%) |
| 65 to 74 Years | 10,298 (100.0%) | 3 (0.0%) |
| 75 Years and older | 7,557 (99.7%) | 22 (0.3%) |
| Total | 76,320 (89.2%) | 9,202 (10.8%) |
Health Insurance Coverage by Citizenship Status in Burke County
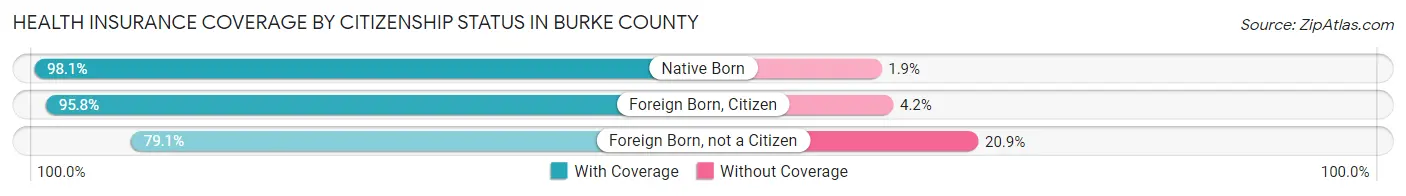
| Citizenship Status | With Coverage | Without Coverage |
| Native Born | 4,597 (98.1%) | 87 (1.9%) |
| Foreign Born, Citizen | 11,600 (95.8%) | 505 (4.2%) |
| Foreign Born, not a Citizen | 5,132 (79.1%) | 1,354 (20.9%) |
Health Insurance Coverage by Household Income in Burke County
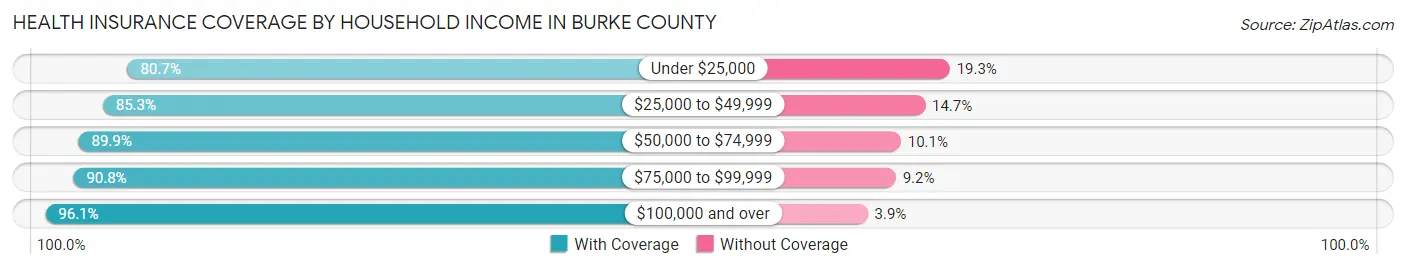
| Household Income | With Coverage | Without Coverage |
| Under $25,000 | 11,028 (80.7%) | 2,634 (19.3%) |
| $25,000 to $49,999 | 16,784 (85.3%) | 2,884 (14.7%) |
| $50,000 to $74,999 | 14,104 (89.9%) | 1,588 (10.1%) |
| $75,000 to $99,999 | 11,202 (90.8%) | 1,130 (9.2%) |
| $100,000 and over | 22,668 (96.1%) | 917 (3.9%) |
Public vs Private Health Insurance Coverage by Age in Burke County
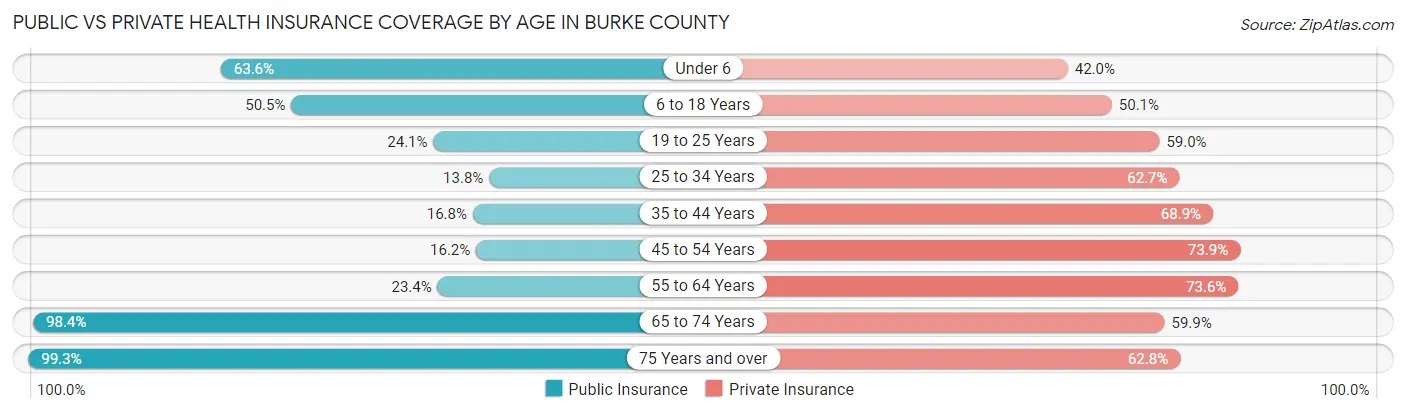
| Age Bracket | Public Insurance | Private Insurance |
| Under 6 | 2,977 (63.6%) | 1,965 (41.9%) |
| 6 to 18 Years | 6,113 (50.5%) | 6,068 (50.1%) |
| 19 to 25 Years | 1,565 (24.1%) | 3,824 (59.0%) |
| 25 to 34 Years | 1,320 (13.8%) | 6,006 (62.6%) |
| 35 to 44 Years | 1,632 (16.8%) | 6,689 (68.9%) |
| 45 to 54 Years | 1,904 (16.2%) | 8,693 (73.9%) |
| 55 to 64 Years | 3,108 (23.4%) | 9,792 (73.6%) |
| 65 to 74 Years | 10,137 (98.4%) | 6,171 (59.9%) |
| 75 Years and over | 7,527 (99.3%) | 4,757 (62.8%) |
| Total | 36,283 (42.4%) | 53,965 (63.1%) |
Disability Status by Sex by Age in Burke County
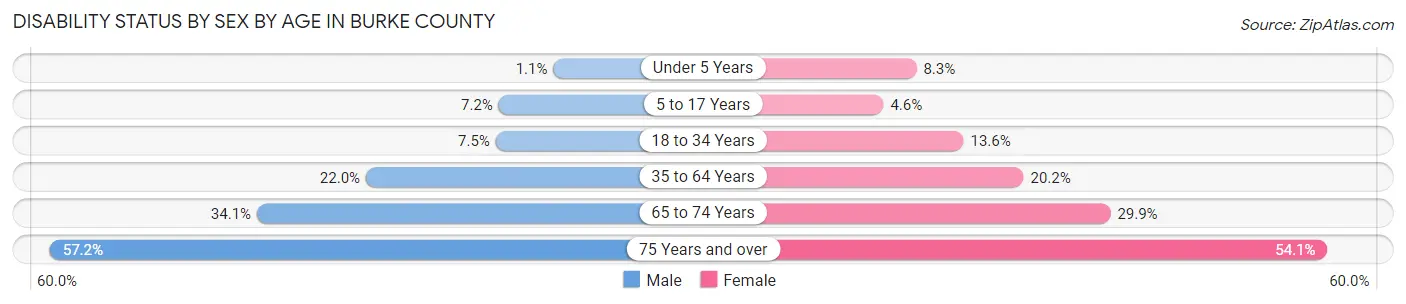
| Age Bracket | Male | Female |
| Under 5 Years | 24 (1.1%) | 163 (8.3%) |
| 5 to 17 Years | 427 (7.2%) | 268 (4.6%) |
| 18 to 34 Years | 674 (7.5%) | 1,100 (13.6%) |
| 35 to 64 Years | 3,808 (22.0%) | 3,534 (20.2%) |
| 65 to 74 Years | 1,653 (34.1%) | 1,633 (29.9%) |
| 75 Years and over | 1,809 (57.2%) | 2,388 (54.1%) |
Disability Class by Sex by Age in Burke County
Disability Class: Hearing Difficulty
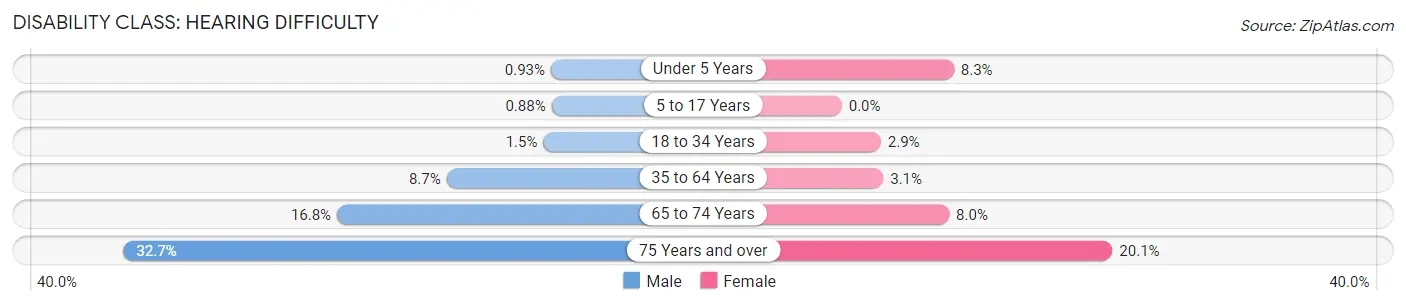
| Age Bracket | Male | Female |
| Under 5 Years | 20 (0.9%) | 163 (8.3%) |
| 5 to 17 Years | 52 (0.9%) | 0 (0.0%) |
| 18 to 34 Years | 133 (1.5%) | 235 (2.9%) |
| 35 to 64 Years | 1,502 (8.7%) | 537 (3.1%) |
| 65 to 74 Years | 814 (16.8%) | 435 (8.0%) |
| 75 Years and over | 1,033 (32.7%) | 887 (20.1%) |
Disability Class: Vision Difficulty
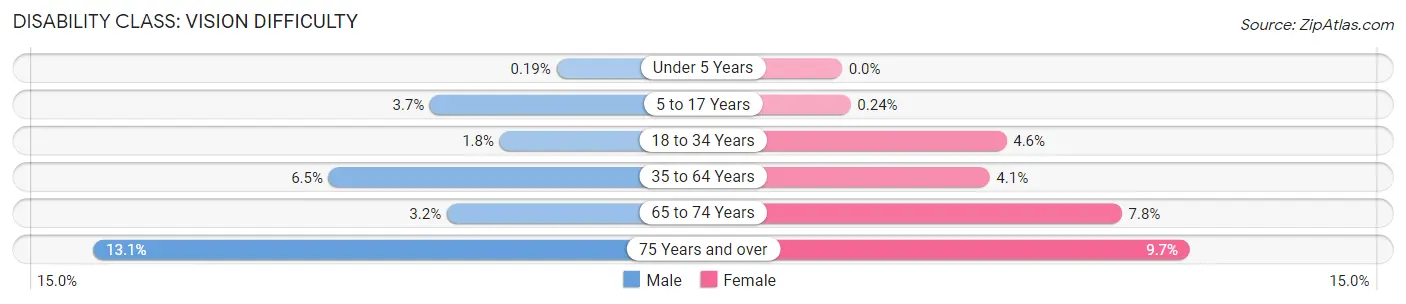
| Age Bracket | Male | Female |
| Under 5 Years | 4 (0.2%) | 0 (0.0%) |
| 5 to 17 Years | 220 (3.7%) | 14 (0.2%) |
| 18 to 34 Years | 158 (1.8%) | 372 (4.6%) |
| 35 to 64 Years | 1,131 (6.5%) | 718 (4.1%) |
| 65 to 74 Years | 157 (3.2%) | 425 (7.8%) |
| 75 Years and over | 414 (13.1%) | 428 (9.7%) |
Disability Class: Cognitive Difficulty
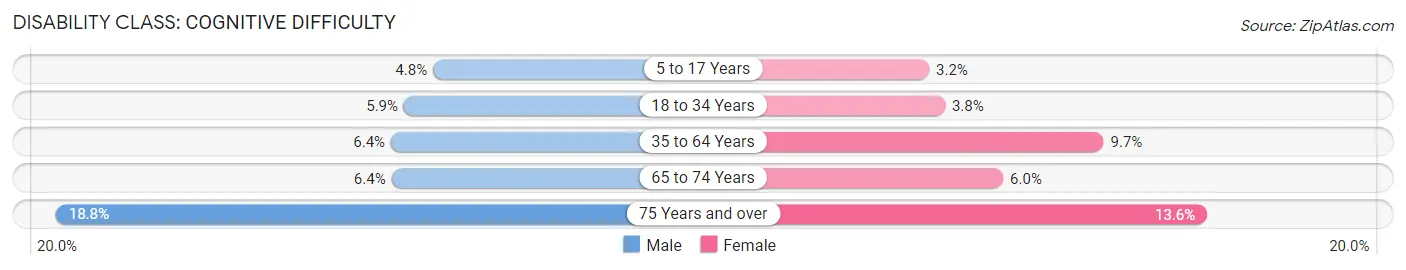
| Age Bracket | Male | Female |
| 5 to 17 Years | 287 (4.8%) | 187 (3.2%) |
| 18 to 34 Years | 529 (5.9%) | 311 (3.8%) |
| 35 to 64 Years | 1,109 (6.4%) | 1,697 (9.7%) |
| 65 to 74 Years | 309 (6.4%) | 327 (6.0%) |
| 75 Years and over | 596 (18.8%) | 599 (13.6%) |
Disability Class: Ambulatory Difficulty
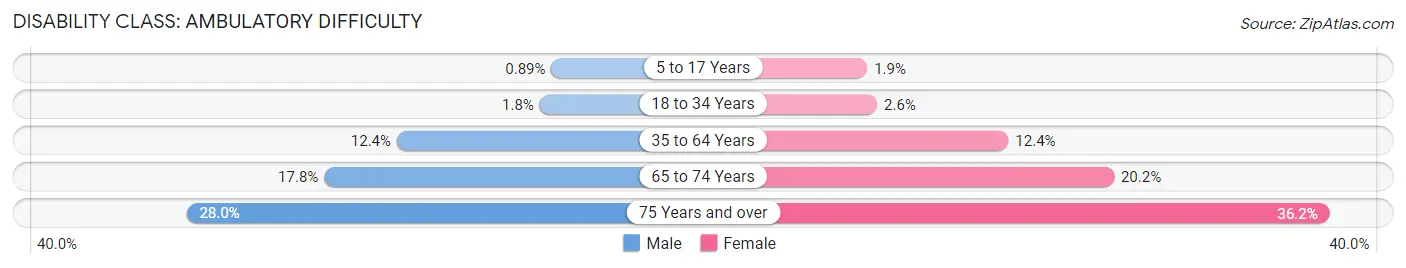
| Age Bracket | Male | Female |
| 5 to 17 Years | 53 (0.9%) | 109 (1.9%) |
| 18 to 34 Years | 157 (1.8%) | 213 (2.6%) |
| 35 to 64 Years | 2,141 (12.4%) | 2,160 (12.4%) |
| 65 to 74 Years | 860 (17.8%) | 1,103 (20.2%) |
| 75 Years and over | 885 (28.0%) | 1,599 (36.2%) |
Disability Class: Self-Care Difficulty
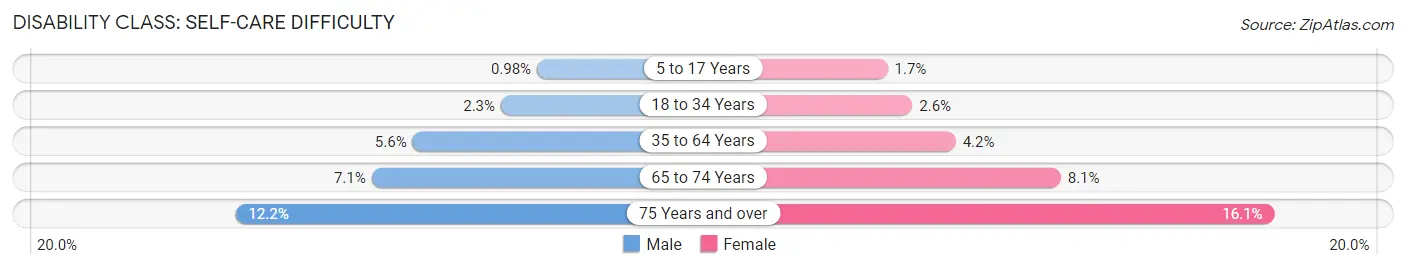
| Age Bracket | Male | Female |
| 5 to 17 Years | 58 (1.0%) | 98 (1.7%) |
| 18 to 34 Years | 207 (2.3%) | 213 (2.6%) |
| 35 to 64 Years | 970 (5.6%) | 738 (4.2%) |
| 65 to 74 Years | 345 (7.1%) | 444 (8.1%) |
| 75 Years and over | 385 (12.2%) | 709 (16.1%) |
Technology Access in Burke County
Computing Device Access in Burke County
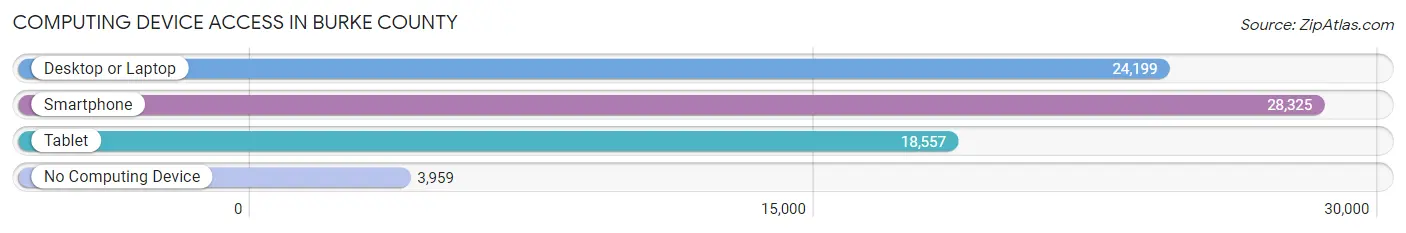
| Device Type | # Households | % Households |
| Desktop or Laptop | 24,199 | 68.8% |
| Smartphone | 28,325 | 80.5% |
| Tablet | 18,557 | 52.7% |
| No Computing Device | 3,959 | 11.3% |
| Total | 35,195 | 100.0% |
Internet Access in Burke County
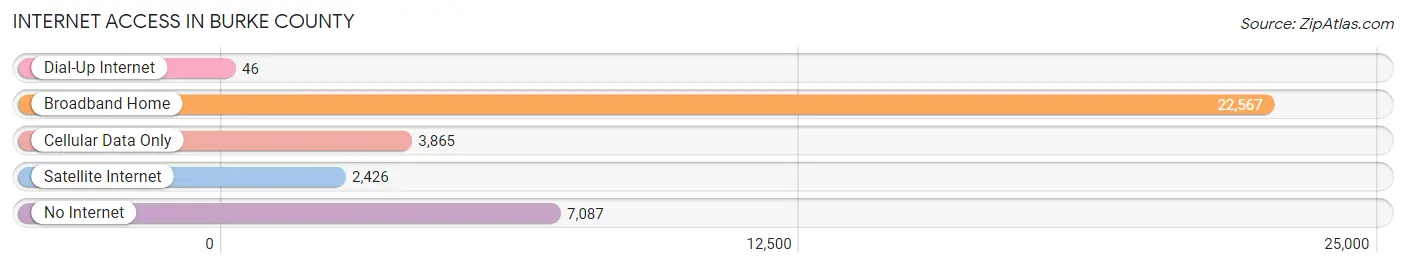
| Internet Type | # Households | % Households |
| Dial-Up Internet | 46 | 0.1% |
| Broadband Home | 22,567 | 64.1% |
| Cellular Data Only | 3,865 | 11.0% |
| Satellite Internet | 2,426 | 6.9% |
| No Internet | 7,087 | 20.1% |
| Total | 35,195 | 100.0% |
Burke County Summary
Burke County is located in the western part of North Carolina, in the foothills of the Appalachian Mountains. It is bordered by McDowell County to the north, Caldwell County to the east, Catawba County to the south, and Cleveland County to the west. The county seat is Morganton, and the largest city is Hickory. Burke County was formed in 1777 from Rowan County and is named for Thomas Burke, a delegate to the Continental Congress from North Carolina.
Geography
Burke County covers an area of 545 square miles, with a population of 90,912 as of the 2020 census. The terrain is mostly mountainous, with the highest point being the summit of Table Rock Mountain at 3,848 feet. The county is drained by the Catawba River and its tributaries, including the South Fork Catawba River, the Linville River, and the Jacob Fork River. The county is home to several state parks, including South Mountains State Park, Lake James State Park, and Lake Rhodhiss State Park.
Economy
Burke County has a diverse economy, with the largest employers being healthcare, manufacturing, and retail. The county is home to several major employers, including Frye Regional Medical Center, Catawba Valley Medical Center, and Hickory Furniture Mart. The county is also home to several large manufacturing companies, including Continental Automotive Systems, Corning Cable Systems, and Hickory Springs Manufacturing. Retail is also a major industry in the county, with several large shopping centers and outlets located in the area.
Demographics
As of the 2020 census, Burke County had a population of 90,912, with a median age of 41.7 years. The racial makeup of the county was 87.2% White, 8.2% Black or African American, 0.7% Native American, 1.2% Asian, 0.1% Pacific Islander, 1.3% from other races, and 1.5% from two or more races. Hispanic or Latino of any race were 3.7% of the population.
The median household income in Burke County was $45,845, and the median family income was $54,845. The per capita income was $24,845. About 11.2% of the population was below the poverty line.
Education
Burke County is served by the Burke County Public Schools system, which consists of 24 elementary schools, 8 middle schools, and 5 high schools. The county is also home to several private schools, including Freedom Christian Academy, Morganton Christian Academy, and St. Charles Borromeo Catholic School. The county is also home to several higher education institutions, including Western Piedmont Community College, Appalachian State University, and Lenoir-Rhyne University.
Common Questions
What is Per Capita Income in Burke County?
Per Capita income in Burke County is $30,633.
What is the Median Family Income in Burke County?
Median Family Income in Burke County is $66,702.
What is the Median Household income in Burke County?
Median Household Income in Burke County is $53,732.
What is Income or Wage Gap in Burke County?
Income or Wage Gap in Burke County is 23.7%.
Women in Burke County earn 76.3 cents for every dollar earned by a man.
What is Family Income Deficit in Burke County?
Family Income Deficit in Burke County is $10,012.
Families that are below poverty line in Burke County earn $10,012 less on average than the poverty threshold level.
What is Inequality or Gini Index in Burke County?
Inequality or Gini Index in Burke County is 0.45.
What is the Total Population of Burke County?
Total Population of Burke County is 87,799.
What is the Total Male Population of Burke County?
Total Male Population of Burke County is 44,022.
What is the Total Female Population of Burke County?
Total Female Population of Burke County is 43,777.
What is the Ratio of Males per 100 Females in Burke County?
There are 100.56 Males per 100 Females in Burke County.
What is the Ratio of Females per 100 Males in Burke County?
There are 99.44 Females per 100 Males in Burke County.
What is the Median Population Age in Burke County?
Median Population Age in Burke County is 45.1 Years.
What is the Average Family Size in Burke County
Average Family Size in Burke County is 2.9 People.
What is the Average Household Size in Burke County
Average Household Size in Burke County is 2.4 People.
How Large is the Labor Force in Burke County?
There are 42,140 People in the Labor Forcein in Burke County.
What is the Percentage of People in the Labor Force in Burke County?
57.1% of People are in the Labor Force in Burke County.
What is the Unemployment Rate in Burke County?
Unemployment Rate in Burke County is 6.0%.